boletÍn estadÍstico mensual de notificaciones de ... · trabajo, incidentes peligrosos y...
TRANSCRIPT
Ministerio de Trabajo y Promoción del Empleo
BOLETÍN ESTADÍSTICO MENSUAL DE NOTIFICACIONES DE ACCIDENTES DE TRABAJO, INCIDENTES PELIGROSOS Y
ENFERMEDADES OCUPACIONALES
Ministerio de Trabajoy Promoción del Empleo
w w w . t r a b a j o . g o b . p e
O f i c i n a G e n e r a l d e E s t a d í s t i c a y Te c n o l o g í a s d e l a I n f o r m a c i ó n y C o m u n i c a c i o n e sO f i c i n a d e E s t a d í s t i c a
N ° 0 8 - A ñ o 0 2 - E d i c i ó n A g o s t o 2 0 1 2

Documento Elaborado por: Ministerio de Trabajo y Promoción del Empleo. Sistematización, Edición, Diseño, Impresión y Encuadernación: Oficina de Estadística - OGETIC en coordinación con la Dirección General de Derechos Fundamentales, Seguridad y Salud en el Trabajo. Teléfono: (511) 6306000 Anexos: 4017 - 4022

fbvfddf
fw
fwe
f
ew
f
wef
f
fewfwe

fbvfddf
fw
fwe
f
ew
f
wef
f
fewfwe
PRESENTACIÓN
El Ministerio de Trabajo y Promoción del Empleo, a través de su Oficina de Estadística
y de la Dirección General de Derechos Fundamentales y Seguridad y Salud en el
Trabajo, presenta y difunde el octavo número del presente año 2012 del “Boletín Estadístico de Notificaciones de Accidentes de Trabajo, Incidentes Peligrosos y Enfermedades Ocupacionales”, correspondiente al mes de agosto.
Los boletines publicados son un instrumento técnico de divulgación de la estadística
nacional de notificaciones efectuadas por los empleadores y centros médicos
asistenciales a través del Sistema Informático de Notificación de Accidentes de
Trabajo, Incidentes Peligrosos y Enfermedades Ocupacionales – SAT, alojado en el
portal institucional www.trabajo.gob.pe. Consecuentemente, la revisión de la
información sistematizada por parte de los interesados, contribuirá a una mejor gestión
de la problemática de la seguridad y salud en el trabajo en el país, facilitando la
adopción de oportunas medidas preventivas y correctivas.
En los datos estadísticos del mes de agosto de 2012, se pueden apreciar 1572
notificaciones, de las cuales, el 93,96% corresponde a accidentes de trabajo, el 4,39%
a incidentes peligrosos, el 1,53% a accidentes de trabajo mortales y el 0,13% a
enfermedades ocupacionales. Por actividad económica, el mayor número de
notificaciones corresponde a Industrias Manufactureras, con el 31,68%, siguiendo en
importancia Actividades Inmobiliarias, Empresariales y de Alquiler con el 14,76% y
Transporte, Almacenamiento y Comunicaciones con el 12,53%, entre otras.
Asimismo, según la información reportada en dicho período, las formas más comunes
en que se han ocasionado los accidentes de trabajo han sido debidas a golpes por
objetos (excepto caídas), esfuerzos físicos o falsos movimientos, aprisionamiento o
atrapamiento y caída de objetos. Cabe precisar que en relación con el mes precedente
se advierte un ascenso en la cantidad de notificaciones de accidentes de trabajo en las
cuales los usuarios del SAT han seleccionado la opción genérica "Otras Formas",
siendo del caso reiterar la invocación para que se marque la forma del accidente
según las diversas opciones contenidas en el formato respectivo, utilizando la opción
genérica únicamente cuando sea el caso.
¡Prevención: Una herramienta para la mejora continua!
EDGARDO BALBÍN TORRES Director General de Derechos Fundamentales y Seguridad y Salud en el Trabajo

fbvfddf
fw
fwe
f
ew
f
wef
f
fewfwe
ÍNDICE
Cuadro Nº 01 Perú: Tipo de Notificaciones, según Regiones.
Agosto 2012.
09
Cuadro Nº 02 Perú: Tipo de Notificaciones, según Actividad Económica.
Agosto 2012.
10
Cuadro Nº 03
Gráfico N° 01
Perú: Tipo de Notificaciones, según Categoría Ocupacional.
Agosto 2012.
Perú: Tipo de Notificaciones, según Regiones.
Agosto 2012.
11
12
Cuadro Nº 04 Perú: Notificaciones de Accidentes de Trabajo por Sexo, según Meses.
2012.
13
Cuadro Nº 05 Perú: Notificaciones de Accidentes de Trabajo por Actividad Económica,
según Forma del Accidente.
Agosto 2012.
14
Cuadro Nº 06 Perú: Notificaciones de Accidentes de Trabajo por Actividad Económica,
según Agente Causante.
Agosto 2012.
15
Cuadro Nº 07 Perú: Notificaciones de Accidentes de Trabajo por Sexo, según Parte del
Cuerpo Lesionada.
Agosto 2012.
16
Gráfico N° 02 Perú: Notificaciones de Accidentes de Trabajo, según Parte del Cuerpo
Lesionada.
Agosto 2012.
17
Cuadro Nº 08
Cuadro Nº 09
Cuadro Nº 10
Perú: Notificaciones de Accidentes de Trabajo por Sexo, según Naturaleza
de la Lesión.
Agosto 2012.
Perú: Notificaciones de Accidentes de Trabajo por Sexo, según
Consecuencias del Accidente.
Agosto 2012.
Perú: Notificaciones de Accidentes de Trabajo por Actividad Económica,
según Regiones.
Agosto 2012.
18
19
20
Cuadro Nº 11
Cuadro Nº 12
Perú: Notificaciones de Accidentes Mortales por Sexo, según Meses.
2012
Perú: Notificaciones de Accidentes Mortales por Actividad Económica,
según Forma del Accidente.
Agosto 2012.
21
22
Cuadro Nº 13 Perú: Notificaciones de Accidentes Mortales por Actividad Económica,
según Agente Causante.
Agosto 2012.
23
Cuadro Nº 14 Perú: Notificaciones de Accidentes Mortales por Actividad Económica,
según Regiones.
Agosto 2012.
24
Cuadro Nº 15 Perú: Notificaciones de Incidentes Peligrosos, según Meses.
2012.
25
Cuadro Nº 16 Perú: Notificaciones de Incidentes Peligrosos, según Forma del Incidente.
Agosto 2012.
26
Cuadro Nº 17 Perú: Notificaciones de Enfermedades Ocupacionales por Meses de
Certificación Médica Reportada, Según Sexo.
2012.
27
Cuadro Nº 18 Perú: Notificaciones de Enfermedades Ocupacionales por Sexo, según
Tipo de Enfermedad.
Agosto 2012.
28
PERÚ
ACCIDENTES MORTALESACCIDENTES DE
TRABAJO
INCIDENTES
PELIGROSOS
ENFERMEDADES
OCUPACIONALES
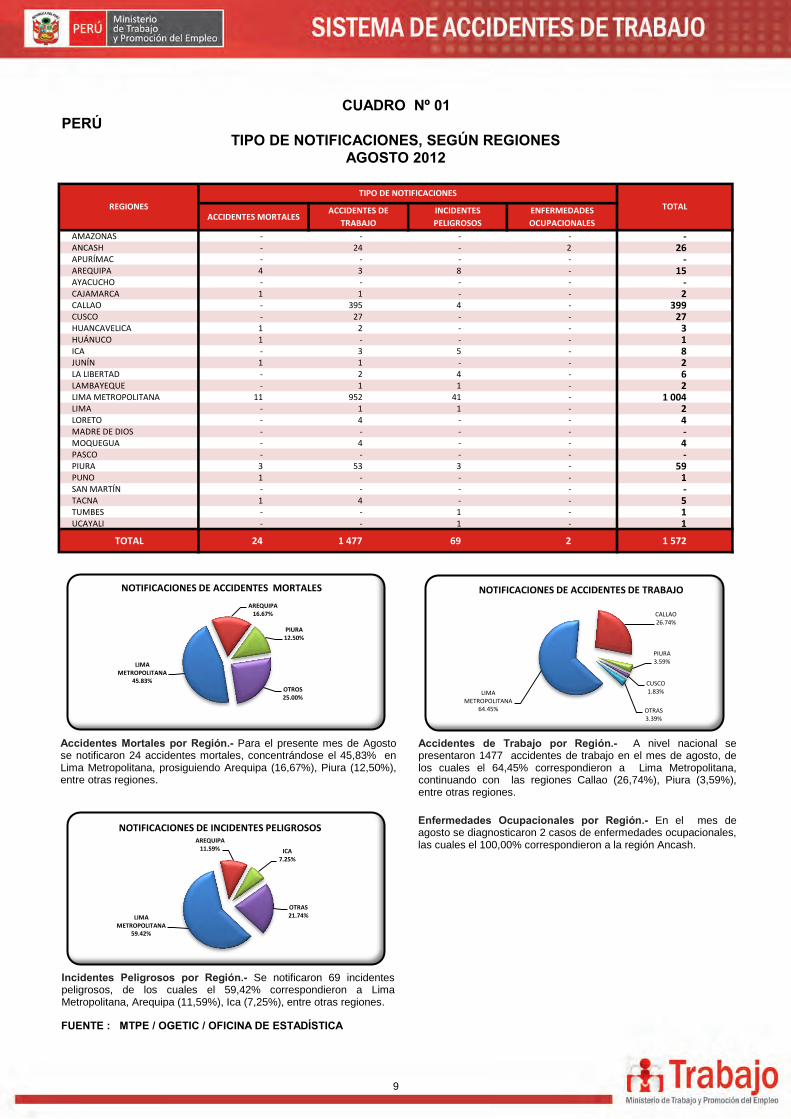
AMAZONAS - - - - - ANCASH - 24 - 2 26 APURÍMAC - - - - - AREQUIPA 4 3 8 - 15 AYACUCHO - - - - - CAJAMARCA 1 1 - - 2 CALLAO - 395 4 - 399 CUSCO - 27 - - 27 HUANCAVELICA 1 2 - - 3 HUÁNUCO 1 - - - 1 ICA - 3 5 - 8 JUNÍN 1 1 - - 2 LA LIBERTAD - 2 4 - 6 LAMBAYEQUE - 1 1 - 2 LIMA METROPOLITANA 11 952 41 - 1 004 LIMA - 1 1 - 2 LORETO - 4 - - 4 MADRE DE DIOS - - - - - MOQUEGUA - 4 - - 4 PASCO - - - - - PIURA 3 53 3 - 59 PUNO 1 - - - 1 SAN MARTÍN - - - - - TACNA 1 4 - - 5 TUMBES - - 1 - 1 UCAYALI - - 1 - 1
TOTAL 24 1 477 69 2 1 572
FUENTE : MTPE / OGETIC / OFICINA DE ESTADÍSTICA
CUADRO Nº 01
TIPO DE NOTIFICACIONES, SEGÚN REGIONESAGOSTO 2012
TIPO DE NOTIFICACIONES
REGIONES TOTAL
LIMA METROPOLITANA
64.45%
CALLAO 26.74%
PIURA 3.59%
CUSCO 1.83%
OTRAS 3.39%
NOTIFICACIONES DE ACCIDENTES DE TRABAJO
LIMA METROPOLITANA
45.83%
AREQUIPA 16.67%
PIURA 12.50%
OTROS 25.00%
NOTIFICACIONES DE ACCIDENTES MORTALES
LIMA METROPOLITANA
59.42%
AREQUIPA 11.59% ICA
7.25%
OTRAS 21.74%
NOTIFICACIONES DE INCIDENTES PELIGROSOS
Accidentes Mortales por Región.- Para el presente mes de Agosto se notificaron 24 accidentes mortales, concentrándose el 45,83% en Lima Metropolitana, prosiguiendo Arequipa (16,67%), Piura (12,50%), entre otras regiones.
Accidentes de Trabajo por Región.- A nivel nacional se presentaron 1477 accidentes de trabajo en el mes de agosto, de los cuales el 64,45% correspondieron a Lima Metropolitana, continuando con las regiones Callao (26,74%), Piura (3,59%), entre otras regiones.
Incidentes Peligrosos por Región.- Se notificaron 69 incidentes peligrosos, de los cuales el 59,42% correspondieron a Lima Metropolitana, Arequipa (11,59%), Ica (7,25%), entre otras regiones.
Enfermedades Ocupacionales por Región.- En el mes de agosto se diagnosticaron 2 casos de enfermedades ocupacionales, las cuales el 100,00% correspondieron a la región Ancash.
9
PERÚ
ACCIDENTES
MORTALES
ACCIDENTES DE
TRABAJO
INCIDENTES
PELIGROSOS
ENFERMEDADES
OCUPACIONALES
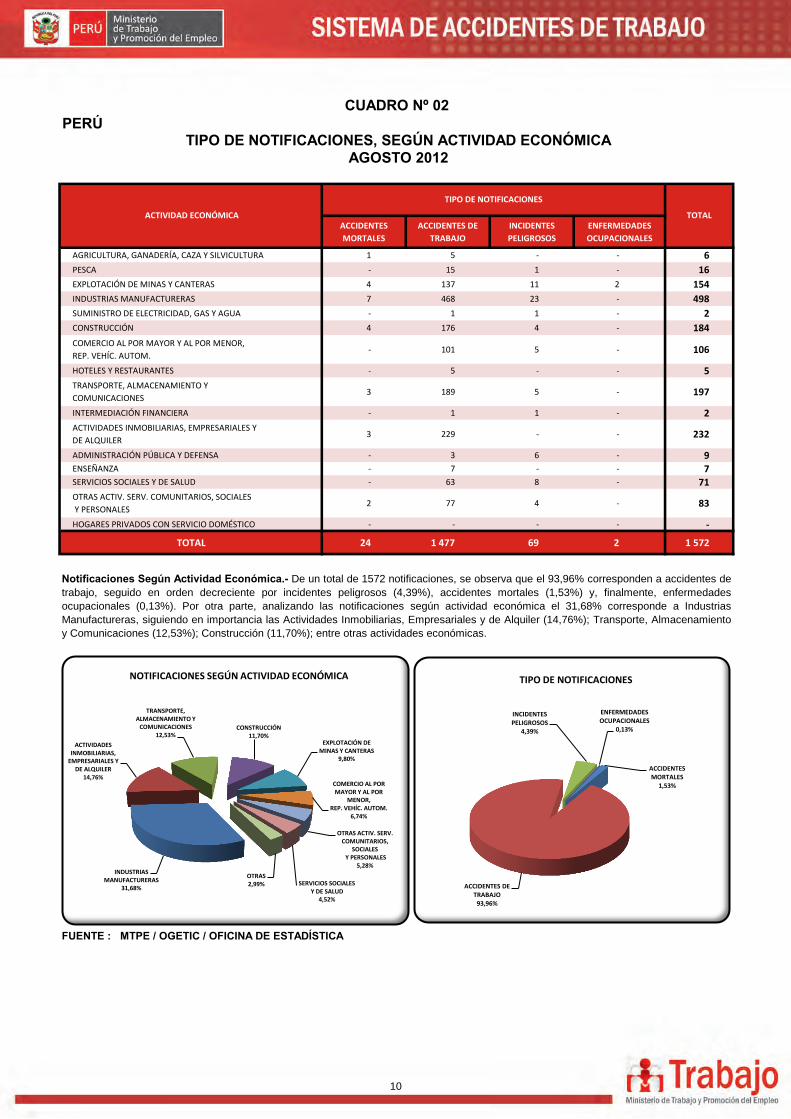
AGRICULTURA, GANADERÍA, CAZA Y SILVICULTURA 1 5 - - 6
PESCA - 15 1 - 16
EXPLOTACIÓN DE MINAS Y CANTERAS 4 137 11 2 154
INDUSTRIAS MANUFACTURERAS 7 468 23 - 498
SUMINISTRO DE ELECTRICIDAD, GAS Y AGUA - 1 1 - 2
CONSTRUCCIÓN 4 176 4 - 184
COMERCIO AL POR MAYOR Y AL POR MENOR,
REP. VEHÍC. AUTOM. - 101 5 - 106
HOTELES Y RESTAURANTES - 5 - - 5
TRANSPORTE, ALMACENAMIENTO Y
COMUNICACIONES 3 189 5 - 197
INTERMEDIACIÓN FINANCIERA - 1 1 - 2
ACTIVIDADES INMOBILIARIAS, EMPRESARIALES Y
DE ALQUILER 3 229 - - 232
ADMINISTRACIÓN PÚBLICA Y DEFENSA - 3 6 - 9 ENSEÑANZA - 7 - - 7 SERVICIOS SOCIALES Y DE SALUD - 63 8 - 71
OTRAS ACTIV. SERV. COMUNITARIOS, SOCIALES
Y PERSONALES 2 77 4 - 83
HOGARES PRIVADOS CON SERVICIO DOMÉSTICO - - - - -
TOTAL 24 1 477 69 2 1 572
FUENTE : MTPE / OGETIC / OFICINA DE ESTADÍSTICA
Notificaciones Según Actividad Económica.- De un total de 1572 notificaciones, se observa que el 93,96% corresponden a accidentes de
trabajo, seguido en orden decreciente por incidentes peligrosos (4,39%), accidentes mortales (1,53%) y, finalmente, enfermedades
ocupacionales (0,13%). Por otra parte, analizando las notificaciones según actividad económica el 31,68% corresponde a Industrias
Manufactureras, siguiendo en importancia las Actividades Inmobiliarias, Empresariales y de Alquiler (14,76%); Transporte, Almacenamiento
y Comunicaciones (12,53%); Construcción (11,70%); entre otras actividades económicas.
CUADRO Nº 02
ACTIVIDAD ECONÓMICA
TIPO DE NOTIFICACIONES, SEGÚN ACTIVIDAD ECONÓMICA
TIPO DE NOTIFICACIONES
TOTAL
AGOSTO 2012
ACCIDENTES MORTALES
1,53%
ACCIDENTES DE TRABAJO
93,96%
INCIDENTES PELIGROSOS
4,39%
ENFERMEDADES OCUPACIONALES
0,13%
TIPO DE NOTIFICACIONES
INDUSTRIAS MANUFACTURERAS
31,68%
ACTIVIDADES INMOBILIARIAS,
EMPRESARIALES Y DE ALQUILER
14,76%
TRANSPORTE, ALMACENAMIENTO Y
COMUNICACIONES 12,53%
CONSTRUCCIÓN 11,70%
EXPLOTACIÓN DE MINAS Y CANTERAS
9,80%
COMERCIO AL POR MAYOR Y AL POR
MENOR, REP. VEHÍC. AUTOM.
6,74%
OTRAS ACTIV. SERV. COMUNITARIOS,
SOCIALES Y PERSONALES
5,28%
SERVICIOS SOCIALES Y DE SALUD
4,52%
OTRAS 2,99%
NOTIFICACIONES SEGÚN ACTIVIDAD ECONÓMICA
10
PERÚ
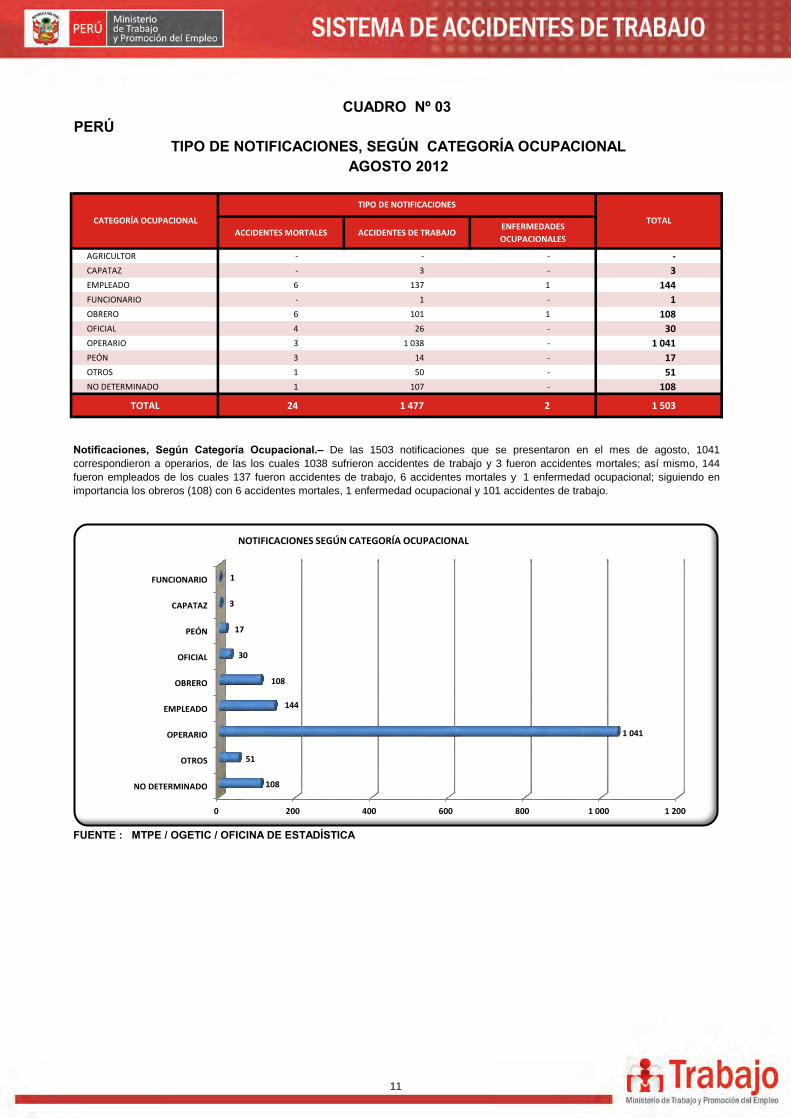
ACCIDENTES MORTALES ACCIDENTES DE TRABAJOENFERMEDADES
OCUPACIONALES
AGRICULTOR - - - -
CAPATAZ - 3 - 3
EMPLEADO 6 137 1 144
FUNCIONARIO - 1 - 1
OBRERO 6 101 1 108
OFICIAL 4 26 - 30
OPERARIO 3 1 038 - 1 041
PEÓN 3 14 - 17
OTROS 1 50 - 51
NO DETERMINADO 1 107 - 108
TOTAL 24 1 477 2 1 503
FUENTE : MTPE / OGETIC / OFICINA DE ESTADÍSTICA
Notificaciones, Según Categoría Ocupacional.– De las 1503 notificaciones que se presentaron en el mes de agosto, 1041
correspondieron a operarios, de las los cuales 1038 sufrieron accidentes de trabajo y 3 fueron accidentes mortales; así mismo, 144
fueron empleados de los cuales 137 fueron accidentes de trabajo, 6 accidentes mortales y 1 enfermedad ocupacional; siguiendo en
importancia los obreros (108) con 6 accidentes mortales, 1 enfermedad ocupacional y 101 accidentes de trabajo.
CUADRO Nº 03
TIPO DE NOTIFICACIONES
CATEGORÍA OCUPACIONAL
TIPO DE NOTIFICACIONES, SEGÚN CATEGORÍA OCUPACIONAL
TOTAL
AGOSTO 2012
0 200 400 600 800 1 000 1 200
NO DETERMINADO
OTROS
OPERARIO
EMPLEADO
OBRERO
OFICIAL
PEÓN
CAPATAZ
FUNCIONARIO
108
51
1 041
144
108
30
17
3
1
NOTIFICACIONES SEGÚN CATEGORÍA OCUPACIONAL
11
FUENTE : MTPE / OGETIC / OFICINA DE ESTADÍSTICA
SISTEMA DE ACCIDENTES DE TRABAJO
Ministerio de Trabajo y Promoción del Empleo
GRAFICO N°01 PERÚ
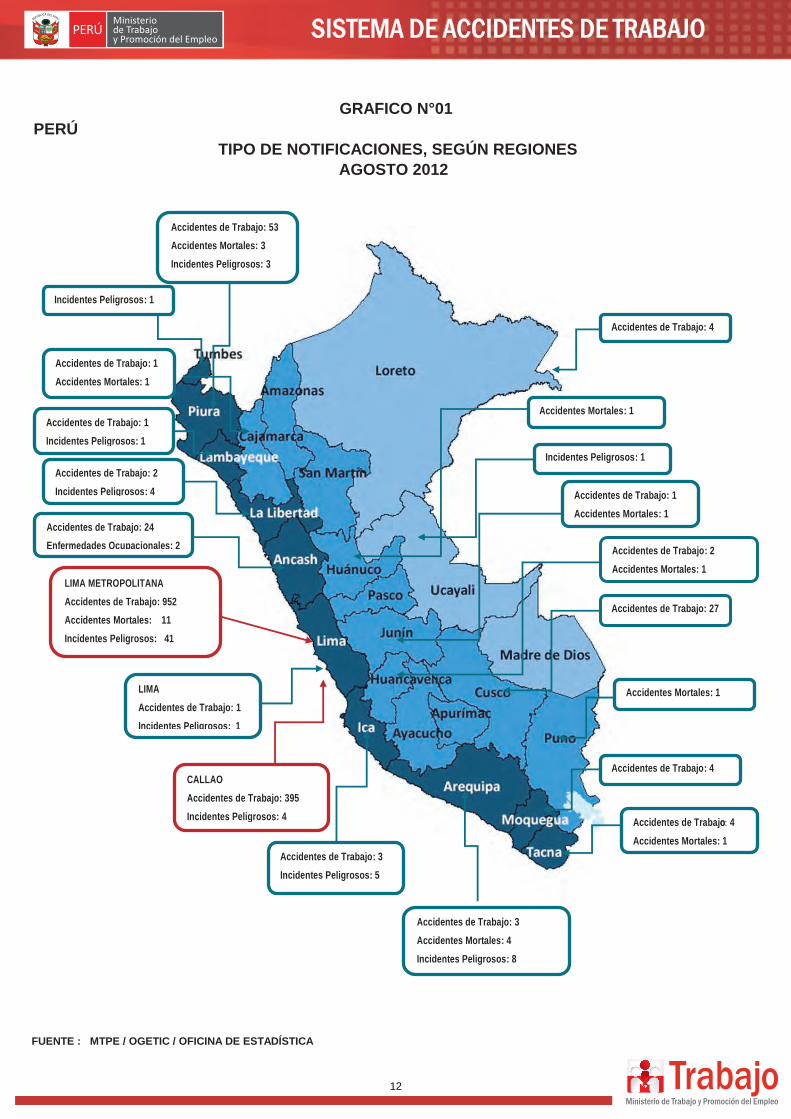
TIPO DE NOTIFICACIONES, SEGÚN REGIONES AGOSTO 2012
LIMA METROPOLITANA Accidentes de Trabajo: 952 Accidentes Mortales: 11 Incidentes Peligrosos: 41
LIMA Accidentes de Trabajo: 1 Incidentes Peligrosos: 1
Accidentes de Trabajo: 24 Enfermedades Ocupacionales: 2
CALLAO Accidentes de Trabajo: 395 Incidentes Peligrosos: 4
Accidentes de Trabajo: 3 Accidentes Mortales: 4 Incidentes Peligrosos: 8
Accidentes de Trabajo 4o:
1
Accidentes Mortales: 1
Accidentes de Trabajo: 27
Accidentes de Trabajo: 3 Incidentes Peligrosos: 5
Accidentes de Trabajo: 4
Accidentes de Trabajo: 4
Accidentes de Trabajo: 2 Incidentes Peligrosos: 4
Accidentes de Trabajo: 53 Accidentes Mortales: 3 Incidentes Peligrosos: 3
Accidentes de Trabajo: 1 Accidentes Mortales: 1
Accidentes de Trabajo: 1 Accidentes Mortales: 1
Accidentes de Trabajo: 2 Accidentes Mortales: 1
Accidentes Mortales: 1
Incidentes Peligrosos: 1
Accidentes Mortales: 1
Incidentes Peligrosos: 1
Accidentes de Trabajo: 1 Incidentes Peligrosos: 1
12
PERÚ
MASCULINO FEMENINO
ENERO 489 37 526
FEBRERO 912 102 1 014
MARZO 1 441 129 1 570
ABRIL 1 339 119 1 458
MAYO 1 528 117 1 645
JUNIO 992 80 1 072
JULIO 781 65 846
AGOSTO 1 396 81 1 477
SETIEMBRE - - -
OCTUBRE - - -
NOVIEMBRE - - -
DICIEMBRE - - -
TOTAL 8 878 730 9 608
FUENTE : MTPE / OGETIC / OFICINA DE ESTADÍSTICA
CUADRO Nº 04
NOTA: No incluye Accidentes Mortales
MESES SEXO
TOTAL
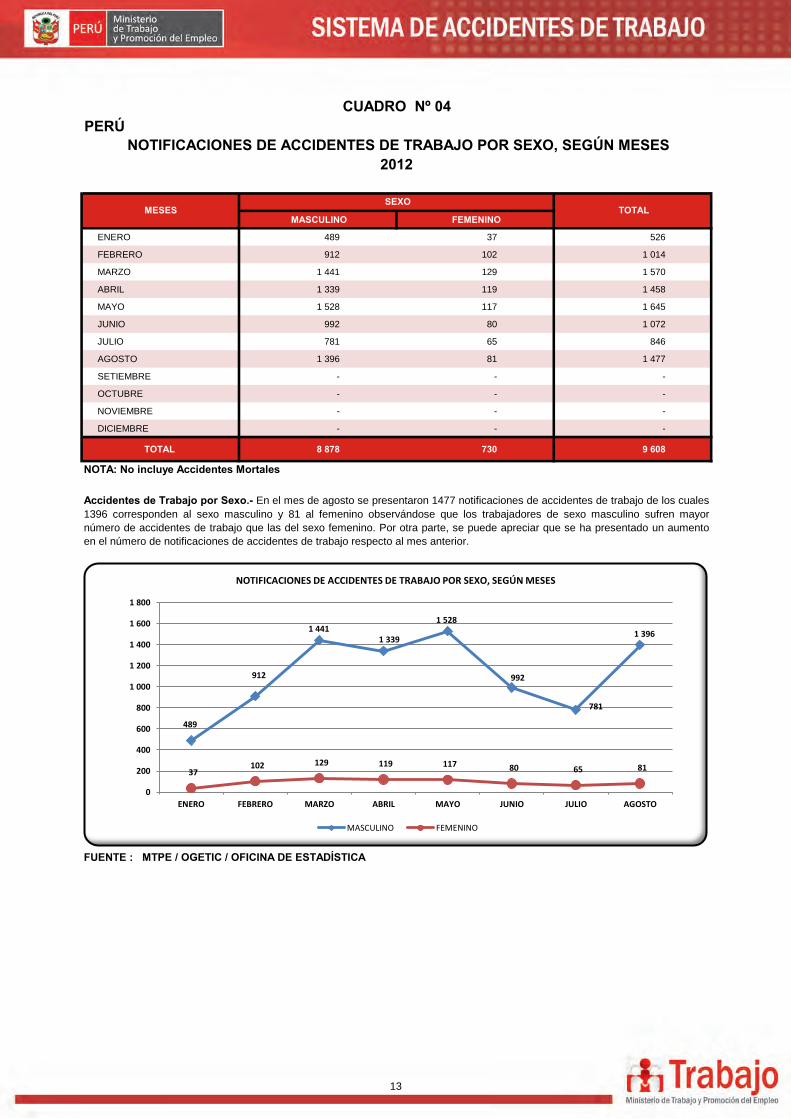
Accidentes de Trabajo por Sexo.- En el mes de agosto se presentaron 1477 notificaciones de accidentes de trabajo de los cuales
1396 corresponden al sexo masculino y 81 al femenino observándose que los trabajadores de sexo masculino sufren mayor
número de accidentes de trabajo que las del sexo femenino. Por otra parte, se puede apreciar que se ha presentado un aumento
en el número de notificaciones de accidentes de trabajo respecto al mes anterior.
2012 NOTIFICACIONES DE ACCIDENTES DE TRABAJO POR SEXO, SEGÚN MESES
489
912
1 441 1 339
1 528
992
781
1 396
37 102 129 119 117 80 65 81
0
200
400
600
800
1 000
1 200
1 400
1 600
1 800
ENERO FEBRERO MARZO ABRIL MAYO JUNIO JULIO AGOSTO
NOTIFICACIONES DE ACCIDENTES DE TRABAJO POR SEXO, SEGÚN MESES
MASCULINO FEMENINO
13
PERÚ
A B C D E F G H I J K L M N O
AGRESIÓN CON ARMAS - - 1 1 - - - - - - 1 - - - - 3 APRISIONAMIENTO O ATRAPAMIENTO - - 22 40 - 3 8 - 9 - 14 - - 2 3 101 ATROPELLAMIENTO POR VEHÍCULOS - - - 1 - - - - 4 - 1 1 - - - 7 CAÍDA DE OBJETOS 1 1 5 17 - 27 8 - 16 - 19 - 1 2 4 101 CAÍDA DE PERSONAL DE ALTURA - - 9 10 - 4 5 - 9 - 7 - - 1 1 46 CAÍDA DE PERSONAS A NIVEL - 2 15 18 - 12 3 1 14 - 19 1 1 7 3 96 CAÍDA DE PERSONAS AL AGUA - - 1 - - - - - - - - - - - - 1 CHOQUE CONTRA OBJETO 1 - 5 10 - 4 1 - 1 - 3 - 3 1 3 32 CHOQUE DE VEHÍCULOS - - 1 - - - - - - - - - - - 1 CONTACTO CON CALOR - - 1 - - - - - - 1 - - - - 2 CONTACTO CON FUEGO - - 2 1 - - - - - - 1 - - - - 4 CONTACTO CON MATERIAS CALIENTES O
INCANDESCENTES - - 3 7 - - 1 - 2 - - - 1 3 17
CONTACTO CON PRODUCTOS QUÍMICOS - - 1 1 - - - - - - 1 - 1 1 - 5 DERRUMBES O DESPLOMES DE INSTALACIONES - - 1 - - - - - - 1 - - - - 2 ESFUERZOS FÍSICOS O FALSOS MOVIMIENTOS - 1 2 33 - 20 10 - 21 1 32 - - 3 5 128 EXPLOSIÓN O IMPLOSIÓN - - 1 - - 1 - - - - - - - - 2 EXPOSICIÓN A PRODUCTOS QUÍMICOS - - 2 2 - - - 1 - - - - - - 5 EXPOSICIÓN A RADIACIONES NO IONIZANTES - - 5 - - - - - - - - - - - 5 EXPOSICIÓN AL CALOR - - 1 1 - - - - 1 - - - - - - 3 GOLPES POR OBJETOS (EXCEPTO CAÍDAS) - - 32 56 - 18 7 2 18 - 17 - 1 1 9 161 INCENDIO - - - - - - - - - - 1 - - - - 1 MORDEDURA DE ANIMALES - - - - - 1 - - - - - - - - - 1 PISADAS SOBRE OBJETO - - 4 - - 4 - - 2 - 1 - - - 5 16 OTRAS FORMAS 3 11 30 263 1 83 57 2 91 - 110 1 - 44 41 737
TOTAL 5 15 137 468 1 176 101 5 189 1 229 3 7 63 77 1 477
FUENTE : MTPE / OGETIC / OFICINA DE ESTADÍSTICA
Q ORG.Y ORGANOS EXTRATERRITORIA.
L ADM.PÚBLICA, PLANES DE SEG.,SOC.
M ENSEÑANZA
N SERVICIOS SOCIALES Y DE SALUD
O OTRAS ACT.,SERV.COM.,SOC.Y PER.
P HOGAR.PRIVAD.CON SERV.DOMESTIC.
CUADRO N° 05
NOTIFICACIONES DE ACCIDENTES DE TRABAJO POR ACTIVIDAD ECONÓMICA, SEGÚN FORMA DEL ACCIDENTE
FORMA DEL ACCIDENTEACTIVIDAD ECONÓMICA
TOTAL
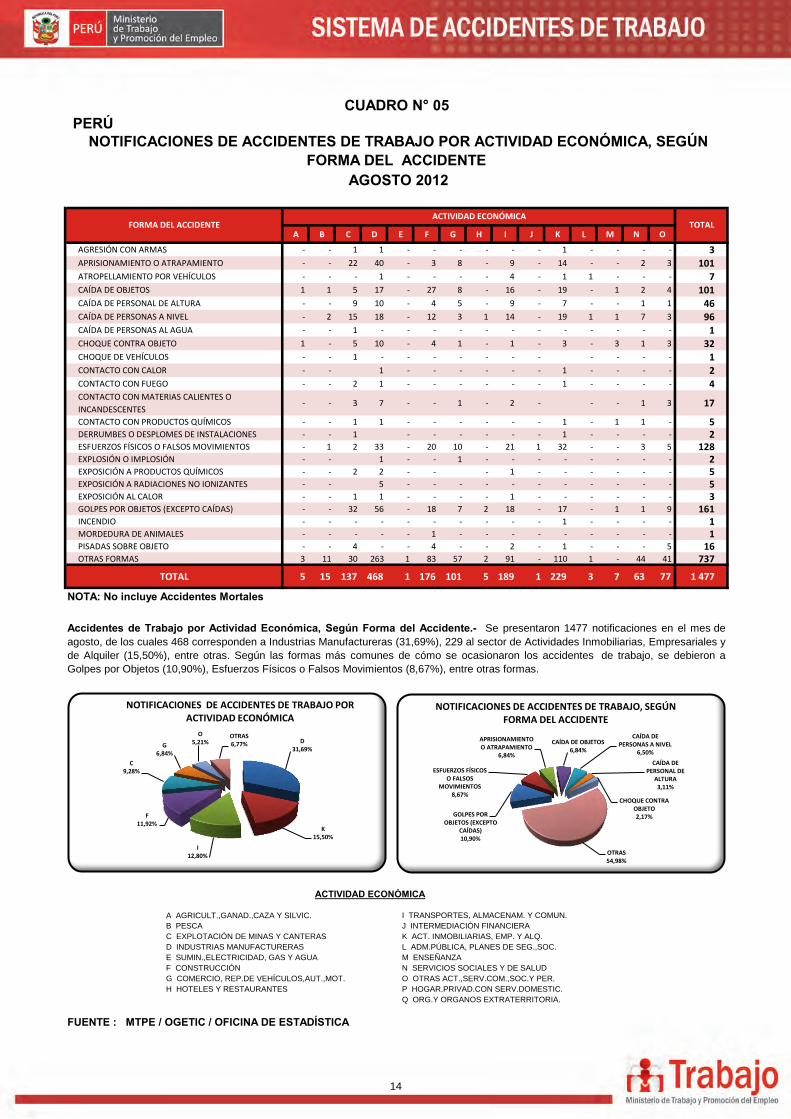
Accidentes de Trabajo por Actividad Económica, Según Forma del Accidente.- Se presentaron 1477 notificaciones en el mes de
agosto, de los cuales 468 corresponden a Industrias Manufactureras (31,69%), 229 al sector de Actividades Inmobiliarias, Empresariales y
de Alquiler (15,50%), entre otras. Según las formas más comunes de cómo se ocasionaron los accidentes de trabajo, se debieron a
Golpes por Objetos (10,90%), Esfuerzos Físicos o Falsos Movimientos (8,67%), entre otras formas.
ACTIVIDAD ECONÓMICA
AGOSTO 2012
NOTA: No incluye Accidentes Mortales
F CONSTRUCCIÓN
A AGRICULT.,GANAD.,CAZA Y SILVIC.
B PESCA
I TRANSPORTES, ALMACENAM. Y COMUN.
J INTERMEDIACIÓN FINANCIERA
K ACT. INMOBILIARIAS, EMP. Y ALQ.
G COMERCIO, REP.DE VEHÍCULOS,AUT.,MOT.
H HOTELES Y RESTAURANTES
C EXPLOTACIÓN DE MINAS Y CANTERAS
D INDUSTRIAS MANUFACTURERAS
E SUMIN.,ELECTRICIDAD, GAS Y AGUA
D 31,69%
K 15,50%
I 12,80%
F 11,92%
C 9,28%
G 6,84%
O 5,21%
OTRAS 6,77%
NOTIFICACIONES DE ACCIDENTES DE TRABAJO POR ACTIVIDAD ECONÓMICA
GOLPES POR OBJETOS (EXCEPTO
CAÍDAS) 10,90%
ESFUERZOS FÍSICOS O FALSOS
MOVIMIENTOS 8,67%
APRISIONAMIENTO O ATRAPAMIENTO
6,84%
CAÍDA DE OBJETOS 6,84%
CAÍDA DE PERSONAS A NIVEL
6,50%
CAÍDA DE PERSONAL DE
ALTURA 3,11%
CHOQUE CONTRA OBJETO 2,17%
OTRAS 54,98%
NOTIFICACIONES DE ACCIDENTES DE TRABAJO, SEGÚN FORMA DEL ACCIDENTE
14
PERÚ
A B C D E F G H I J K L M N O
ABERTURAS, PUERTAS,PORTONES, PERSIANAS - - 4 3 - - 1 - 1 - 2 - - - 1 12 ANDAMIOS - - 2 1 - - - - - - 2 - - - - 5 ANIMALES - - - - - 1 - - - - - - - - - 1 APARATOS PARA IZAR O MEDIOS DE ELEVACIÓN 1 - 2 - - - - - - - - - - - - 3 ARCHIVOS - - - - - - - - - - - - - 1 - 1 ARMA BLANCA - - - 6 - - - - - - 1 - - - - 7 BANCOS DE TRABAJO - 1 - - - - - - - - - - - - - 1 CABLEADO DE ELECTRICIDAD - - 4 - - 1 - - - - - - - - - 5 ELECTRICIDAD - - - - 1 - - - - - - - - - 1 ESCALERA - - 2 4 - 4 3 1 6 - 6 1 - 2 - 29 ESCRITORIOS - - 1 - - - - - - - - - - - - 1 FACTORES CLIMÁTICOS - - 2 - - - - - - - - - - - - 2 HERRAMIENTAS (PORTÁTILES, MANUALES,
MECÁNICOS, ELÉCTRICAS, NEUMÁTICAS, ETC.) - - 19 12 - 8 5 - 6 - 11 - 1 - 4 66
LÍNEAS O CAÑERÍAS DE MATERIAS PRIMAS O
PRODUCTOS - - - - - - - - 1 - - - 1 - 2
MÁQUINAS Y EQUIPOS EN GENERAL 1 1 12 34 - 7 8 - 9 - 8 - - 1 5 86 MATERIAS PRIMAS 1 - - 1 - 4 - - 1 - 1 - - 1 - 9 MUEBLES EN GENERAL - - 1 10 - 2 2 - 2 - 4 - 1 1 1 24 ONDA EXPANSIVA - - - 6 - 1 3 - - - - - - 1 11 PAREDES - - - - - 1 - - - - - - - 1 2 PISO 1 - 16 4 - 2 - - 3 - 3 - 1 2 1 33 PRODUCTOS ELABORADOS - - - 2 - 2 - - 2 - 1 - - 1 - 8 RAMPAS - - - - - - - - - - 1 - - - - 1 RECIPIENTES - - - 4 - - 1 - - - - - - - - 5 REJILLAS - - - - - - - - - - 1 - - - - 1 SUSTANCIAS QUÍMICAS - PLAGUICIDAS - - - 3 - 1 2 - - - - - 1 - 1 8 TUBOS DE VENTILACIÓN - - - 3 - 1 - - - - - - - - 4 VEGETALES - - - - - - - - - 1 - - - - 1 VEHÍCULOS O MEDIOS DE TRANSPORTE EN
GENERAL - - 6 5 - - - - 7 - 5 1 - - - 24
VENTANAS - - 1 1 - - - 1 - - - - - - - 3 OTROS 1 13 65 369 1 140 75 3 151 - 182 1 3 52 62 1 118 NO DETERMINADO - - - - - 1 - - 1 - - - - 1 - 3
TOTAL 5 15 137 468 1 176 101 5 189 1 229 3 7 63 77 1 477
NOTA: No incluye Accidentes Mortales
* Incluye agentes causantes con menos de 8 casos FUENTE : MTPE / OGETIC / OFICINA DE ESTADÍSTICA
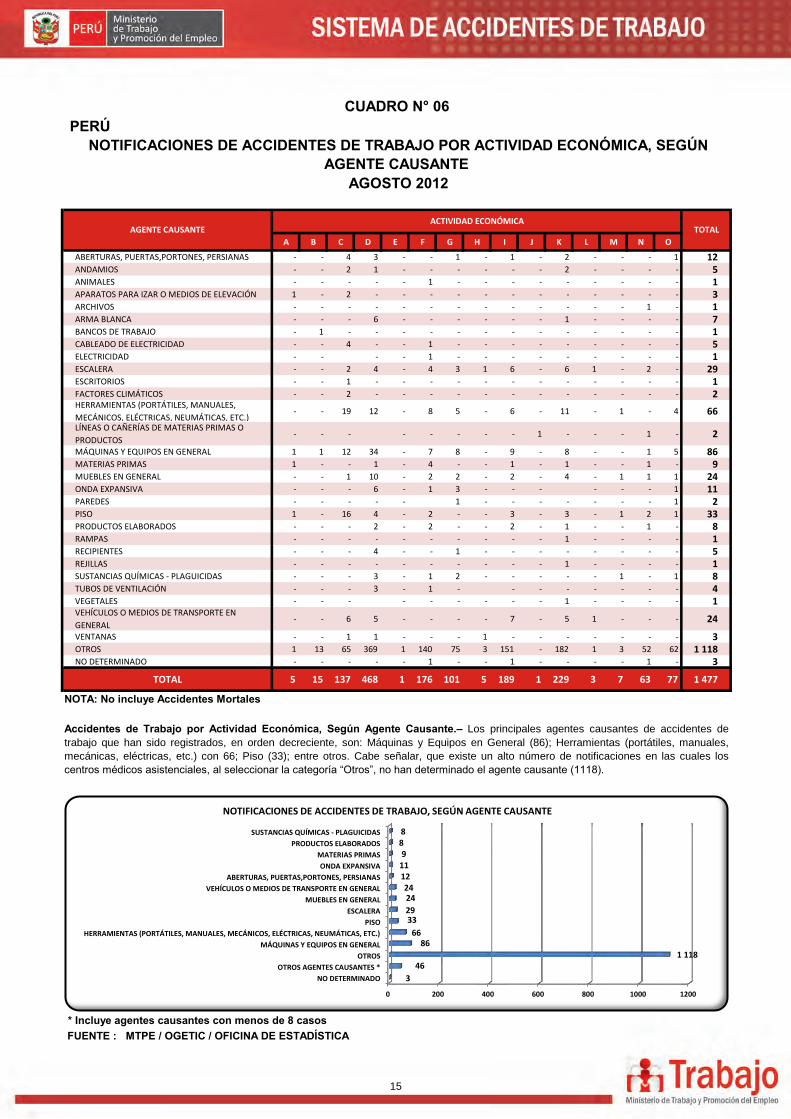
Accidentes de Trabajo por Actividad Económica, Según Agente Causante.– Los principales agentes causantes de accidentes de
trabajo que han sido registrados, en orden decreciente, son: Máquinas y Equipos en General (86); Herramientas (portátiles, manuales,
mecánicas, eléctricas, etc.) con 66; Piso (33); entre otros. Cabe señalar, que existe un alto número de notificaciones en las cuales los
centros médicos asistenciales, al seleccionar la categoría “Otros”, no han determinado el agente causante (1118).
CUADRO N° 06
NOTIFICACIONES DE ACCIDENTES DE TRABAJO POR ACTIVIDAD ECONÓMICA, SEGÚN AGENTE CAUSANTE
AGENTE CAUSANTEACTIVIDAD ECONÓMICA
TOTAL
AGOSTO 2012
0 200 400 600 800 1000 1200
NO DETERMINADO
OTROS AGENTES CAUSANTES *
OTROS
MÁQUINAS Y EQUIPOS EN GENERAL
HERRAMIENTAS (PORTÁTILES, MANUALES, MECÁNICOS, ELÉCTRICAS, NEUMÁTICAS, ETC.)
PISO
ESCALERA
MUEBLES EN GENERAL
VEHÍCULOS O MEDIOS DE TRANSPORTE EN GENERAL
ABERTURAS, PUERTAS,PORTONES, PERSIANAS
ONDA EXPANSIVA
MATERIAS PRIMAS
PRODUCTOS ELABORADOS
SUSTANCIAS QUÍMICAS - PLAGUICIDAS
3
46 1 118
86 66
33 29
24 24
12 11 9
8 8
NOTIFICACIONES DE ACCIDENTES DE TRABAJO, SEGÚN AGENTE CAUSANTE
15
PERÚ
MASCULINO FEMENINO
ABDOMEN (PARED ABDOMINAL) 7 - 7 ANTEBRAZO 15 2 17 APARATO AUDITIVO 3 - 3 APARATO GENITAL EN GENERAL 3 - 3 BOCA (CON INCLUSIÓN DE LABIOS, DIENTES Y LENGUA) 9 1 10 BRAZO 15 2 17 CABEZA, UBICACIONES MÚLTIPLES 38 1 39 CADERA 6 - 6 CARA (UBICACIÓN NO CLASIFICADA EN OTRO EPÍGRAFE) 20 - 20 CODO 18 1 19 CUELLO 5 - 5 DEDOS DE LA MANO 245 28 273 DEDOS DE LOS PIES 16 - 16 HOMBRO (INCLUSIÓN DE CLAVÍCULAS, OMÓPLATO Y AXILA) 49 - 49 MAMAS 9 - 9 MANO (CON EXCEPCIÓN DE LOS DEDOS SOLOS) 75 4 79 MIEMBRO INFERIOR, UBICACIONES MÚLTIPLES 10 1 11 MIEMBRO SUPERIOR, UBICACIONES MÚLTIPLES 21 - 21 MUÑECA 50 2 52 MUSLO 16 1 17 NARIZ Y SENOS PARANASALES 11 - 11 OJOS (CON INCLUSIÓN DE LOS PÁRPADOS, LA ÓRBITA Y EL NERVIO ÓPTICO) 223 8 231 ÓRGANO, APARATO O SISTEMA AFECTADO POR SUSTANCIAS QUÍMICAS - PLAGUICIDAS 3 1 4 PELVIS 3 1 4 PIE (CON EXCEPCIÓN DE LOS DEDOS) 52 2 54 PIERNA 44 1 45 REGIÓN CERVICAL 8 - 8 REGIÓN CRANEANA (CRÁNEO, CUERO CABELLUDO) 24 - 24 REGIÓN DORSAL 22 - 22 REGION LUMBOSACRA (COLUMNA VERTEBRAL Y MUSCULAR ADYACENTES) 110 3 113 RODILLA 59 7 66 SISTEMA NERVIOSO EN GENERAL 2 - 2 TOBILLO 67 3 70 TÓRAX (COSTILLAS, ESTERNÓN) 35 1 36 TRONCO, UBICACIONES MÚLTIPLES 1 - 1 UBICACIONES MÚLTIPLES, COMPROMISO DE DOS O MAS ZONAS AFECTADAS ESPECIFICADAS EN LA TABLA 59 6 65 OTRAS PARTES 43 5 48
TOTAL 1 396 81 1 477
NOTA: No incluye Accidentes Mortales
FUENTE : MTPE / OGETIC / OFICINA DE ESTADÍSTICA
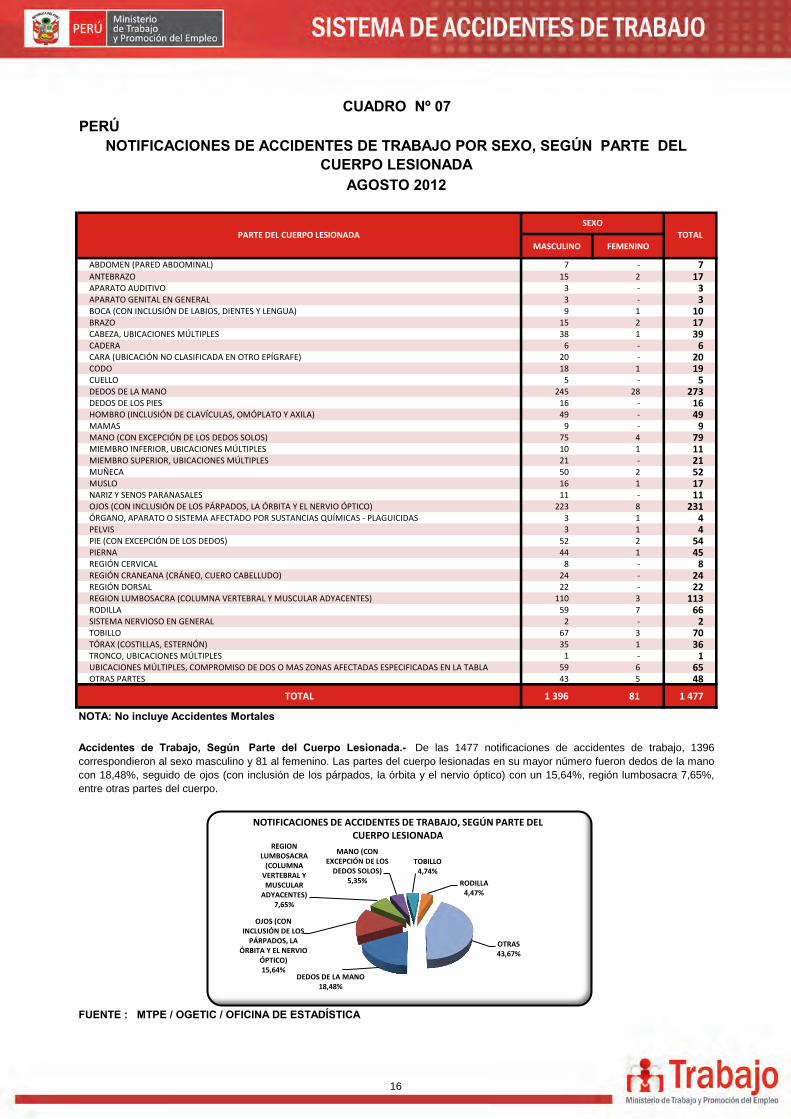
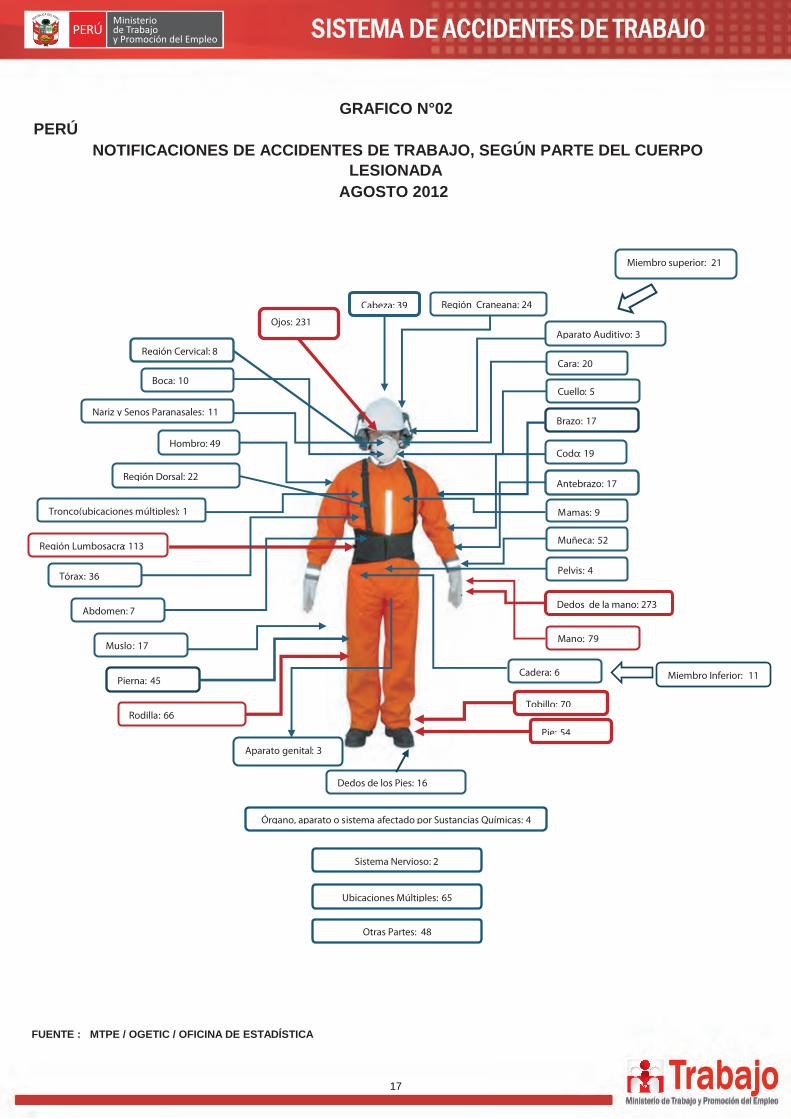
Accidentes de Trabajo, Según Parte del Cuerpo Lesionada.- De las 1477 notificaciones de accidentes de trabajo, 1396
correspondieron al sexo masculino y 81 al femenino. Las partes del cuerpo lesionadas en su mayor número fueron dedos de la mano
con 18,48%, seguido de ojos (con inclusión de los párpados, la órbita y el nervio óptico) con un 15,64%, región lumbosacra 7,65%,
entre otras partes del cuerpo.
CUADRO Nº 07
NOTIFICACIONES DE ACCIDENTES DE TRABAJO POR SEXO, SEGÚN PARTE DEL CUERPO LESIONADA
AGOSTO 2012
PARTE DEL CUERPO LESIONADA
SEXO
TOTAL
DEDOS DE LA MANO 18,48%
OJOS (CON INCLUSIÓN DE LOS
PÁRPADOS, LA ÓRBITA Y EL NERVIO
ÓPTICO) 15,64%
REGION LUMBOSACRA
(COLUMNA VERTEBRAL Y MUSCULAR
ADYACENTES) 7,65%
MANO (CON EXCEPCIÓN DE LOS
DEDOS SOLOS) 5,35%
TOBILLO 4,74%
RODILLA 4,47%
OTRAS 43,67%
NOTIFICACIONES DE ACCIDENTES DE TRABAJO, SEGÚN PARTE DEL CUERPO LESIONADA
16
FUENTE : MTPE / OGETIC / OFICINA DE ESTADÍSTICA
SISTEMA DE ACCIDENTES DE TRABAJO
Ministerio de Trabajo y Promoción del Empleo
GRAFICO N°02 PERÚ
NOTIFICACIONES DE ACCIDENTES DE TRABAJO, SEGÚN PARTE DEL CUERPOLESIONADA
AGOSTO 2012
Cabeza: 39
Región Lumbosacra: 113
Ojos: 231
Nariz y Senos Paranasales: 11
Región Dorsal: 22
Brazo: 17
Pierna: 45
Mano: 79
Dedos de los Pies: 16
Muslo: 17
Rodilla: 66
Pie: 54
Dedos de la mano: 273
mano mammmanomano
man
Boca: 10 Cuello: 5
Antebrazo: 17
Abdomen: 7
Tobillo: 70
Codo: 19
Cara: 20
Muñeca: 52
Hombro: 49
Región Craneana: 24
Tórax: 36
Aparato Auditivo: 3
Región Cervical: 8
Miembro superior: 21
Miembro Inferior: 11
Otras Partes: 48
Cadera: 6
Órgano, aparato o sistema afectado por Sustancias Químicas: 4
Aparato genital: 3
Mamas: 9
Ubicaciones Múltiples: 65
Tronco(ubicaciones múltiples): 1
Sistema Nervioso: 2
Pelvis: 4
17
PERÚ
MASCULINO FEMENINO
AMPUTACIONES 3 - 3 ASFIXIA 1 - 1 CONTUSIONES 255 18 273 CUERPO EXTRAÑO EN OJOS 174 3 177 ESCORIACIONES 8 - 8 FRACTURAS 62 - 62 HERIDA DE TEJIDOS 5 - 5 HERIDAS CONTUSAS (POR GOLPES O DE BORDES IRREGULARES) 98 1 99 HERIDAS CORTANTES 158 13 171 HERIDAS PUNZANTES 18 7 25 INTOXICACIONES POR OTRAS SUSTANCIAS QUÍMICAS 1 1 2 LUXACIONES 30 2 32 QUEMADURAS 46 - 46 TORCEDURAS Y ESQUINCES 122 9 131 TRAUMATISMOS INTERNOS 184 6 190 OTRAS 231 21 252
TOTAL 1 396 81 1 477
NOTA: No incluye Accidentes Mortales
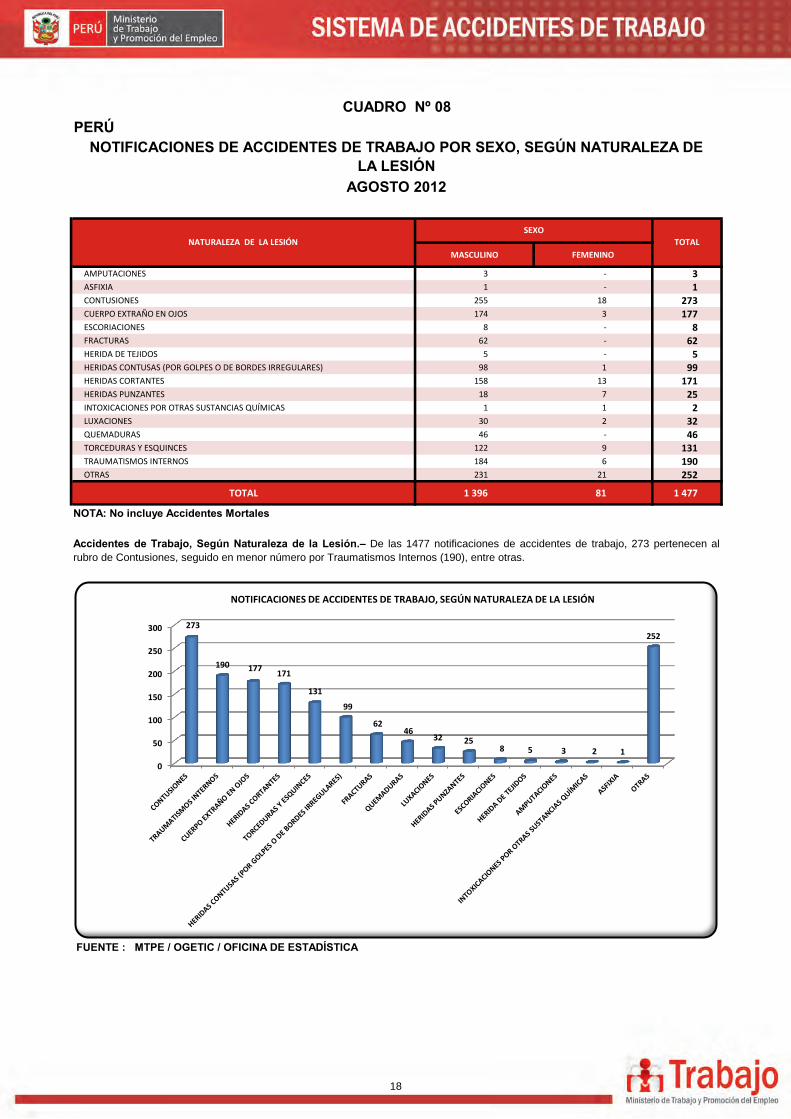
Accidentes de Trabajo, Según Naturaleza de la Lesión.– De las 1477 notificaciones de accidentes de trabajo, 273 pertenecen al
rubro de Contusiones, seguido en menor número por Traumatismos Internos (190), entre otras.
FUENTE : MTPE / OGETIC / OFICINA DE ESTADÍSTICA
NOTIFICACIONES DE ACCIDENTES DE TRABAJO POR SEXO, SEGÚN NATURALEZA DE LA LESIÓN
CUADRO Nº 08
NATURALEZA DE LA LESIÓN
SEXO
TOTAL
AGOSTO 2012
0
50
100
150
200
250
300 273
190 177 171
131
99
62 46
32 25 8 5 3 2 1
252
NOTIFICACIONES DE ACCIDENTES DE TRABAJO, SEGÚN NATURALEZA DE LA LESIÓN
18
PERÚ
MASCULINO FEMENINO ABSOLUTO %
A) ACCIDENTE LEVE 1 129 64 1 193 79,48
B) ACCIDENTE INCAPACITANTE 267 17 284 18,92
- PARCIAL PERMANENTE 5 - 5 0,33
- TOTAL TEMPORAL 261 17 278 18,52
- TOTAL PERMANENTE - - - -
- NO DETERMINADO 1 - 1 0,07
C) ACCIDENTE MORTAL 24 - 24 1,60
TOTAL 1 420 81 1 501 100,00
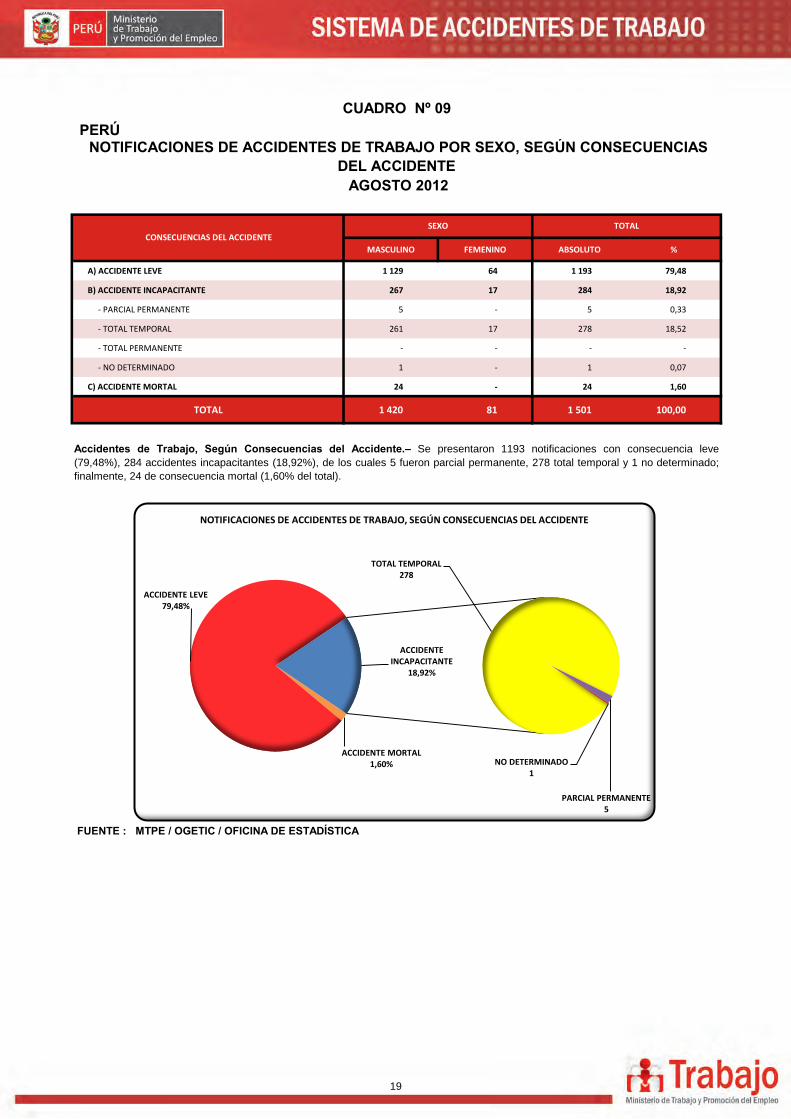
Accidentes de Trabajo, Según Consecuencias del Accidente.– Se presentaron 1193 notificaciones con consecuencia leve
(79,48%), 284 accidentes incapacitantes (18,92%), de los cuales 5 fueron parcial permanente, 278 total temporal y 1 no determinado;
finalmente, 24 de consecuencia mortal (1,60% del total).
FUENTE : MTPE / OGETIC / OFICINA DE ESTADÍSTICA
CONSECUENCIAS DEL ACCIDENTE
CUADRO Nº 09
NOTIFICACIONES DE ACCIDENTES DE TRABAJO POR SEXO, SEGÚN CONSECUENCIAS DEL ACCIDENTE
SEXO TOTAL
AGOSTO 2012
ACCIDENTE MORTAL 1,60%
ACCIDENTE LEVE 79,48%
TOTAL TEMPORAL 278
PARCIAL PERMANENTE 5
NO DETERMINADO 1
ACCIDENTE INCAPACITANTE
18,92%
NOTIFICACIONES DE ACCIDENTES DE TRABAJO, SEGÚN CONSECUENCIAS DEL ACCIDENTE
19
PERÚ
A B C D E F G H I J K L M N O
AMAZONAS - - - - - - - - - - - - - - - - ANCASH 2 20 - - - - - - - 2 - - - - 24
APURÍMAC - - - - - - - - - - - - - - - -
AREQUIPA - 1 2 - - - - - - - - - - - 3 AYACUCHO - - - - - - - - - - - - - - - - CAJAMARCA - - - - - - - - 1 - - - - - - 1 CALLAO - 3 - 187 - 2 37 3 100 - 40 1 - 4 18 395 CUSCO - - 20 2 - - - - 1 - - - - - 4 27 HUANCAVELICA - - 2 - - - - - - - - - - - - 2 HUÁNUCO - - - - - - - - - - - - - - - - ICA - - 2 - - - - - - - - - - - 1 3 JUNÍN - - - - - - - - - - - - - - 1 1 LA LIBERTAD - 1 - - - - - - - - 1 - - - - 2 LAMBAYEQUE - - - - - 1 - - - - - - - - - 1 LIMA
METROPOLITANA - 9 70 268 1 171 61 2 77 1 176 - 5 59 52 952
LIMA - - - - - - - - - - - - - - 1 1 LORETO - 4 - - - - - - - - - - - - 4 MADRE DE DIOS - - - - - - - - - - - - - - - - MOQUEGUA - 4 - - - - - - - - - - - - 4 PASCO - - - - - - - - - - - - - - - - PIURA 5 - 10 9 - 2 3 - 10 - 10 2 2 - - 53 PUNO - - - - - - - - - - - - - - - - SAN MARTÍN - - - - - - - - - - - - - - - - TACNA - - 4 - - - - - - - - - - - - 4 TUMBES - - - - - - - - - - - - - - - - UCAYALI - - - - - - - - - - - - - - - -
TOTAL 5 15 137 468 1 176 101 5 189 1 229 3 7 63 77 1 477
A AGRICULT.,GANAD.,CAZA Y SILVIC. I TRANSPORTES, ALMACENAM. Y COMUN.
B PESCA J INTERMEDIACIÓN FINANCIERA
C EXPLOTACIÓN DE MINAS Y CANTERAS K ACT. INMOBILIARIAS, EMP. Y ALQ.
D INDUSTRIAS MANUFACTURERAS L ADM.PÚBLICA, PLANES DE SEG.,SOC.
E SUMIN.,ELECTRICIDAD, GAS Y AGUA M ENSEÑANZA
F CONSTRUCCIÓN N SERVICIOS SOCIALES Y DE SALUD
G COMERCIO, REP.DE VEHÍCULOS,AUT.,MOT. O OTRAS ACT.,SERV.COM.,SOC.Y PER.
H HOTELES Y RESTAURANTES P HOGAR.PRIVAD.CON SERV.DOMESTIC.
Q ORG.Y ORGANOS EXTRATERRITORIA.
FUENTE : MTPE / OGETIC / OFICINA DE ESTADÍSTICA
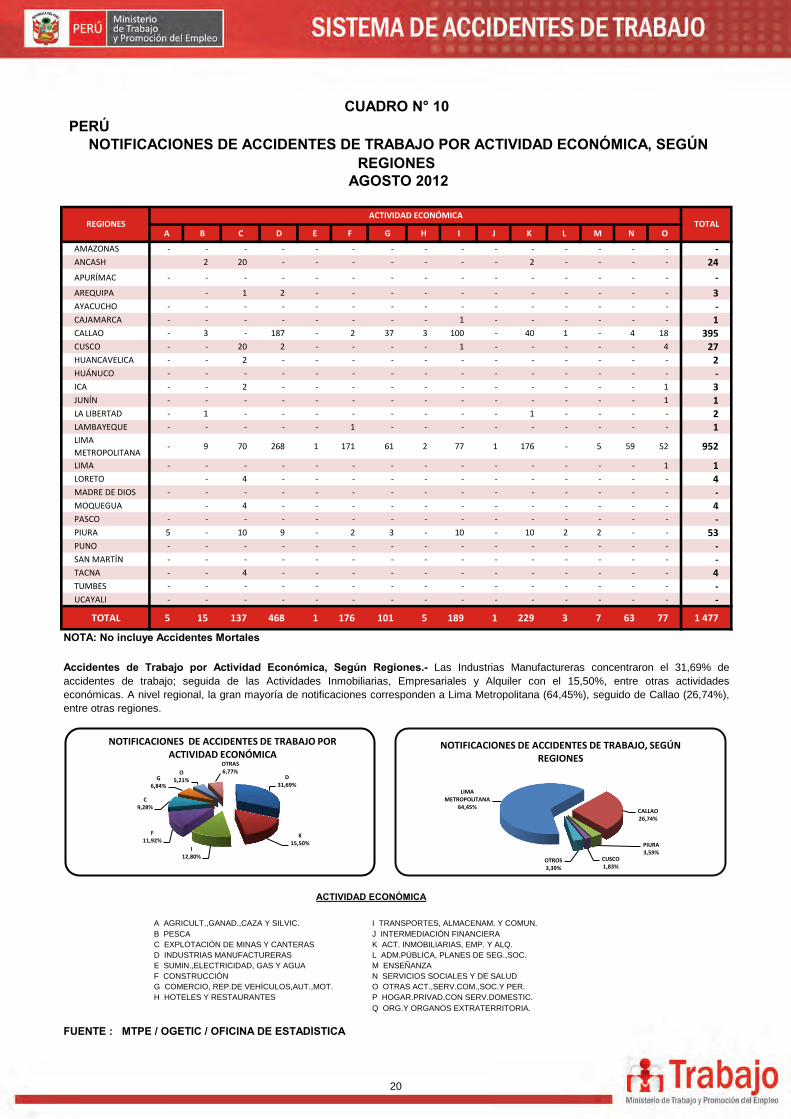
Accidentes de Trabajo por Actividad Económica, Según Regiones.- Las Industrias Manufactureras concentraron el 31,69% de
accidentes de trabajo; seguida de las Actividades Inmobiliarias, Empresariales y Alquiler con el 15,50%, entre otras actividades
económicas. A nivel regional, la gran mayoría de notificaciones corresponden a Lima Metropolitana (64,45%), seguido de Callao (26,74%),
entre otras regiones.
ACTIVIDAD ECONÓMICA
AGOSTO 2012
CUADRO N° 10
NOTIFICACIONES DE ACCIDENTES DE TRABAJO POR ACTIVIDAD ECONÓMICA, SEGÚN REGIONES
REGIONESACTIVIDAD ECONÓMICA
TOTAL
NOTA: No incluye Accidentes Mortales
D 31,69%
K 15,50%
I 12,80%
F 11,92%
C 9,28%
G 6,84%
O 5,21%
OTRAS 6,77%
NOTIFICACIONES DE ACCIDENTES DE TRABAJO POR ACTIVIDAD ECONÓMICA
LIMA METROPOLITANA
64,45% CALLAO 26,74%
PIURA 3,59%
CUSCO 1,83%
OTROS 3,39%
NOTIFICACIONES DE ACCIDENTES DE TRABAJO, SEGÚN REGIONES
20
PERÚ
MASCULINO FEMENINO
ENERO 6 - 6
FEBRERO 20 - 20
MARZO 18 - 18
ABRIL 23 - 23
MAYO 6 - 6
JUNIO 5 1 6
JULIO 14 3 17
AGOSTO 24 - 24
SETIEMBRE - - -
OCTUBRE - - -
NOVIEMBRE - - -
DICIEMBRE - - -
TOTAL 116 4 120
FUENTE : MTPE / OGETIC / OFICINA DE ESTADÍSTICA
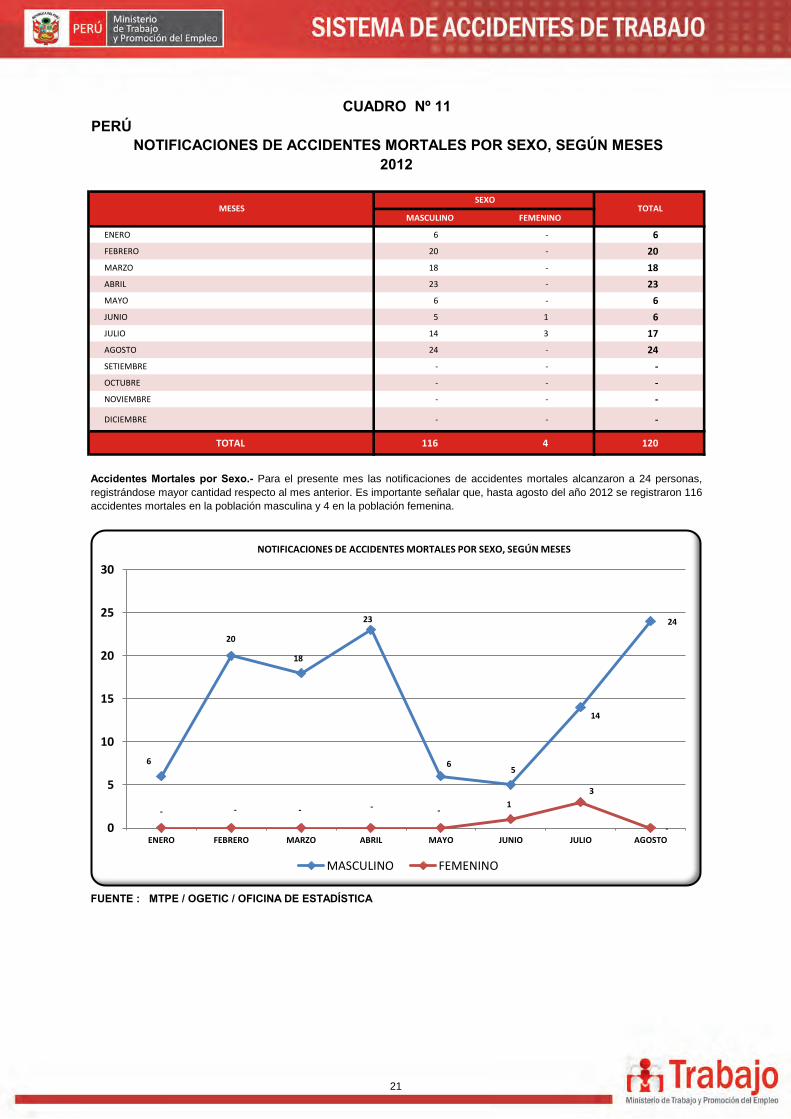
Accidentes Mortales por Sexo.- Para el presente mes las notificaciones de accidentes mortales alcanzaron a 24 personas,
registrándose mayor cantidad respecto al mes anterior. Es importante señalar que, hasta agosto del año 2012 se registraron 116
accidentes mortales en la población masculina y 4 en la población femenina.
CUADRO Nº 11
NOTIFICACIONES DE ACCIDENTES MORTALES POR SEXO, SEGÚN MESES
MESES SEXO
TOTAL
2012
6
20
18
23
6 5
14
24
- - - - - 1
3
- 0
5
10
15
20
25
30
ENERO FEBRERO MARZO ABRIL MAYO JUNIO JULIO AGOSTO
NOTIFICACIONES DE ACCIDENTES MORTALES POR SEXO, SEGÚN MESES
MASCULINO FEMENINO
21
PERÚ
A C D F I K O
APRISIONAMIENTO O ATRAPAMIENTO - - 1 - - - - 1
ATROPELLAMIENTO POR VEHíCULOS - - - 1 - - - 1
CAíDA DE OBJETOS - - 1 - 1 - 1 3
CAíDA DE PERSONAL DE ALTURA - 1 1 1 - 1 1 5
CAíDA DE PERSONAS A NIVEL - - - - 1 - - 1
CHOQUE CONTRA OBJETO - - - - - 1 - 1
CHOQUE DE VEHíCULOS - - 1 - 1 - - 2
DERRUMBES O DESPLOMES DE INSTALACIONES - - - 1 - - - 1
GOLPES POR OBJETOS (EXCEPTO CAíDAS) - 1 1 1 - - - 3
OTRAS FORMAS 1 2 2 - - 1 - 6
TOTAL 1 4 7 4 3 3 2 24
FUENTE : MTPE / OGETIC / OFICINA DE ESTADÍSTICA
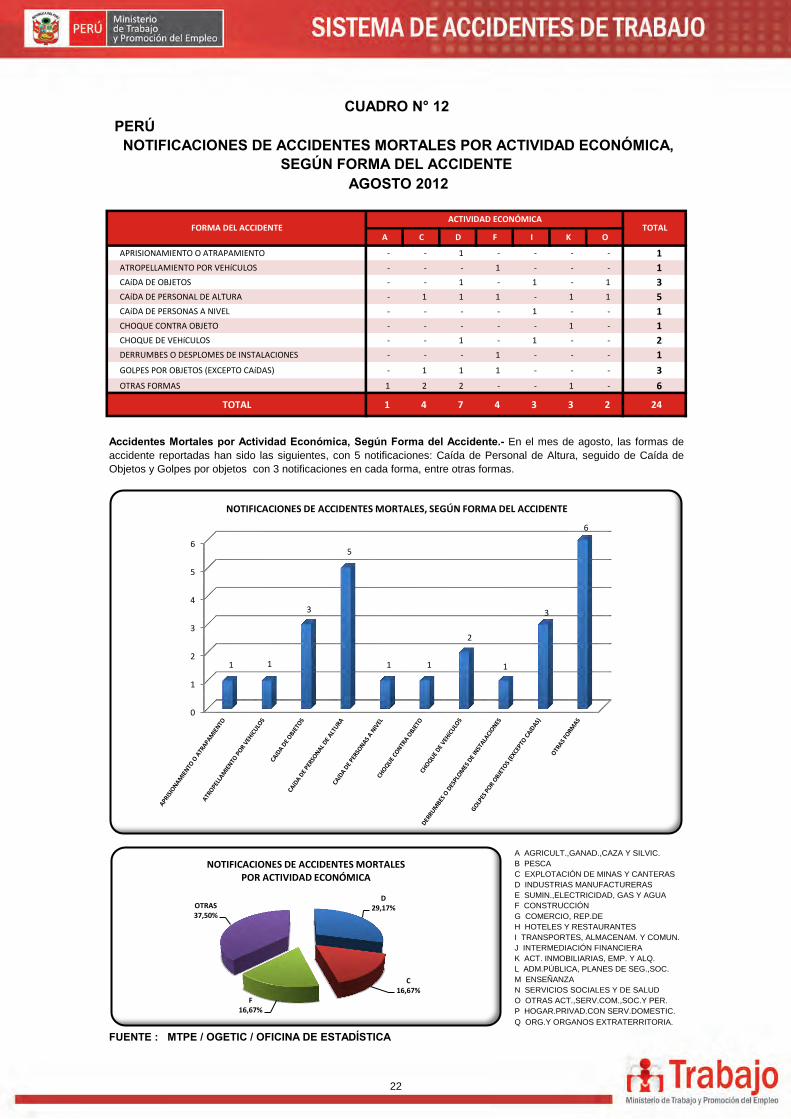
Accidentes Mortales por Actividad Económica, Según Forma del Accidente.- En el mes de agosto, las formas de
accidente reportadas han sido las siguientes, con 5 notificaciones: Caída de Personal de Altura, seguido de Caída de
Objetos y Golpes por objetos con 3 notificaciones en cada forma, entre otras formas.
B PESCA
C EXPLOTACIÓN DE MINAS Y CANTERAS
D INDUSTRIAS MANUFACTURERAS
E SUMIN.,ELECTRICIDAD, GAS Y AGUA
A AGRICULT.,GANAD.,CAZA Y SILVIC.
AGOSTO 2012
CUADRO N° 12
NOTIFICACIONES DE ACCIDENTES MORTALES POR ACTIVIDAD ECONÓMICA, SEGÚN FORMA DEL ACCIDENTE
FORMA DEL ACCIDENTEACTIVIDAD ECONÓMICA
TOTAL
P HOGAR.PRIVAD.CON SERV.DOMESTIC.
Q ORG.Y ORGANOS EXTRATERRITORIA.
F CONSTRUCCIÓN
G COMERCIO, REP.DE
H HOTELES Y RESTAURANTES
I TRANSPORTES, ALMACENAM. Y COMUN.
J INTERMEDIACIÓN FINANCIERA
K ACT. INMOBILIARIAS, EMP. Y ALQ.
L ADM.PÚBLICA, PLANES DE SEG.,SOC.
M ENSEÑANZA
N SERVICIOS SOCIALES Y DE SALUD
O OTRAS ACT.,SERV.COM.,SOC.Y PER.
0
1
2
3
4
5
6
1 1
3
5
1 1
2
1
3
6
NOTIFICACIONES DE ACCIDENTES MORTALES, SEGÚN FORMA DEL ACCIDENTE
D 29,17%
C 16,67%
F 16,67%
OTRAS 37,50%
NOTIFICACIONES DE ACCIDENTES MORTALES POR ACTIVIDAD ECONÓMICA
22
PERÚ
A C D F I K O
APARATOS PARA IZAR O MEDIOS DE ELEVACIÓN - - - - 1 - - 1
ESCALERA - 1 - - - - - 1
MÁQUINAS Y EQUIPOS EN GENERAL - - 2 1 - - - 3
MATERIAS PRIMAS - - 1 - - - - 1
PISO - - 1 - - - - 1
PRODUCTOS ELABORADOS 1 - - - - - - 1
VEHÍCULOS O MEDIOS DE TRANSPORTE EN GENERAL - 1 3 - 1 1 - 6
VENTANAS - 1 - - - - - 1
OTROS - 1 - 3 1 2 2 9
TOTAL 1 4 7 4 3 3 2 24
A AGRICULT.,GANAD.,CAZA Y SILVIC.
B PESCA
C EXPLOTACIÓN DE MINAS Y CANTERAS
D INDUSTRIAS MANUFACTURERAS
E SUMIN.,ELECTRICIDAD, GAS Y AGUA
F CONSTRUCCIÓN
G COMERCIO, REP.DE VEHÍCULOS,AUT.,MOT.
H HOTELES Y RESTAURANTES
FUENTE : MTPE / OGETIC / OFICINA DE ESTADÍSTICA
ACTIVIDAD ECONÓMICA
CUADRO N° 13
NOTIFICACIONES DE ACCIDENTES MORTALES POR ACTIVIDAD ECONÓMICA, SEGÚN AGENTE CAUSANTE
AGENTE CAUSANTEACTIVIDAD ECONÓMICA
TOTAL
AGOSTO 2012
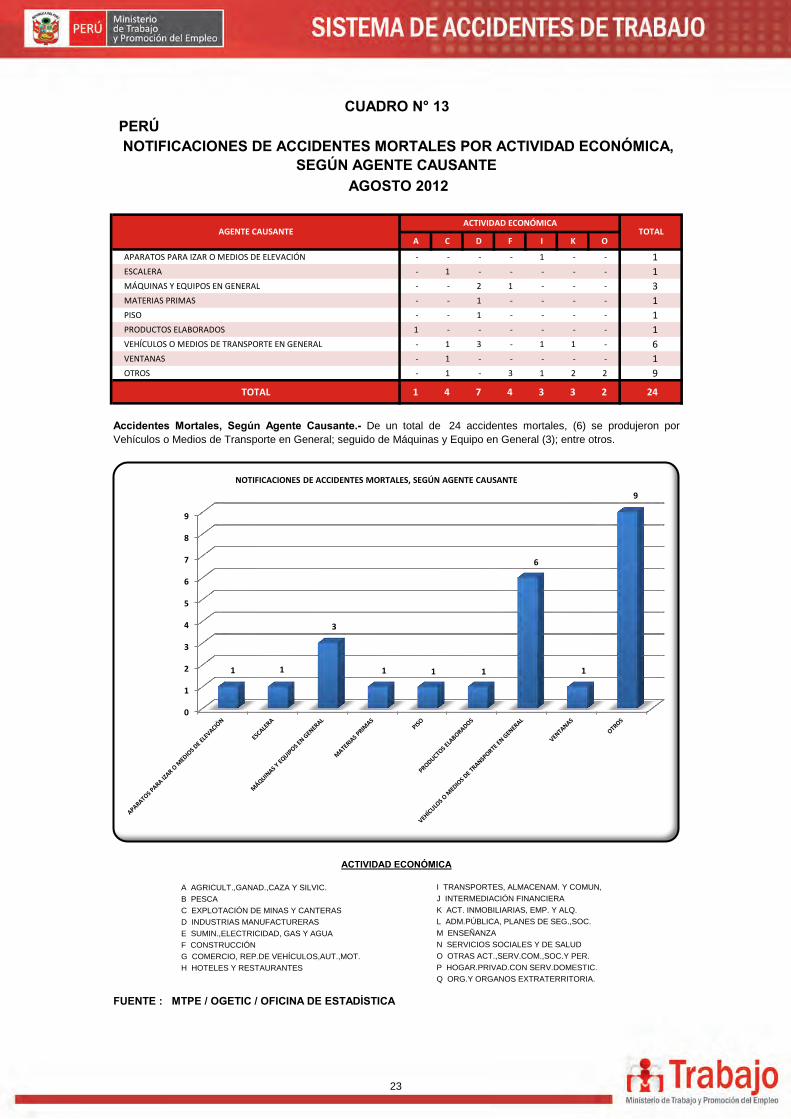
Accidentes Mortales, Según Agente Causante.- De un total de 24 accidentes mortales, (6) se produjeron por
Vehículos o Medios de Transporte en General; seguido de Máquinas y Equipo en General (3); entre otros.
N SERVICIOS SOCIALES Y DE SALUD
O OTRAS ACT.,SERV.COM.,SOC.Y PER.
P HOGAR.PRIVAD.CON SERV.DOMESTIC.
Q ORG.Y ORGANOS EXTRATERRITORIA.
I TRANSPORTES, ALMACENAM. Y COMUN,
J INTERMEDIACIÓN FINANCIERA
K ACT. INMOBILIARIAS, EMP. Y ALQ.
L ADM.PÚBLICA, PLANES DE SEG.,SOC.
M ENSEÑANZA
0
1
2
3
4
5
6
7
8
9
1 1
3
1 1 1
6
1
9
NOTIFICACIONES DE ACCIDENTES MORTALES, SEGÚN AGENTE CAUSANTE
23
PERÚ
A B C D E F G
AMAZONAS - - - - - - - - ANCASH - - - - - - - - APURÍMAC - - - - - - - - AREQUIPA 1 1 1 - 1 - - 4 AYACUCHO - - - - - - - - CAJAMARCA - - - - - 1 - 1 CALLAO - - - - - - - - CUSCO - - - - - - - - HUANCAVELICA - 1 - - - - - 1 HUÁNUCO - - - 1 - - - 1 ICA - - - - - - - - JUNÍN - - - - - 1 - 1 LA LIBERTAD - - - - - - - - LAMBAYEQUE - - - - - - - - LIMA METROPOLITANA - - 4 2 2 1 2 11 LIMA - - - - - - - - LORETO - - - - - - - - MADRE DE DIOS - - - - - - - - MOQUEGUA - - - - - - - - PASCO - - - - - - - - PIURA - 1 1 1 - - - 3 PUNO - - 1 - - - - 1 SAN MARTÍN - - - - - - - - TACNA - 1 - - - - - 1 TUMBES - - - - - - - - UCAYALI - - - - - - - -
TOTAL 1 4 7 4 3 3 2 24
FUENTE : MTPE / OGETIC / OFICINA DE ESTADÍSTICA
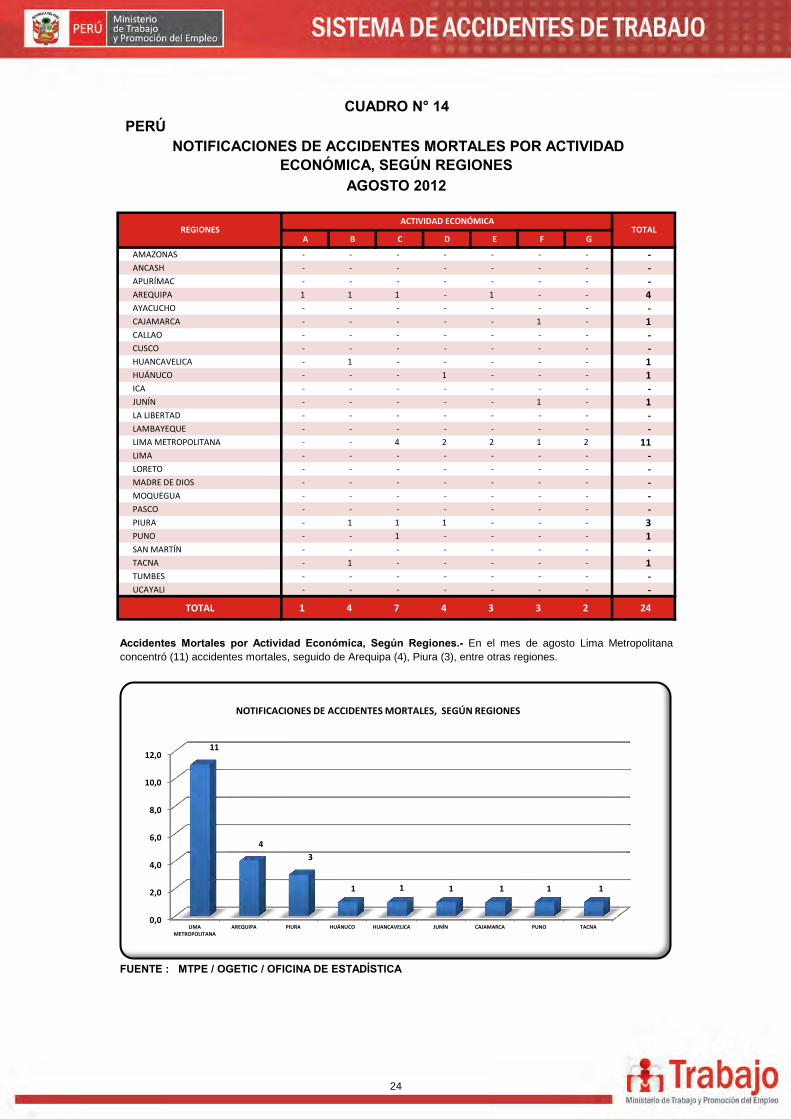
Accidentes Mortales por Actividad Económica, Según Regiones.- En el mes de agosto Lima Metropolitana
concentró (11) accidentes mortales, seguido de Arequipa (4), Piura (3), entre otras regiones.
CUADRO N° 14
NOTIFICACIONES DE ACCIDENTES MORTALES POR ACTIVIDAD ECONÓMICA, SEGÚN REGIONES
AGOSTO 2012
REGIONESACTIVIDAD ECONÓMICA
TOTAL
0,0
2,0
4,0
6,0
8,0
10,0
12,0
LIMAMETROPOLITANA
AREQUIPA PIURA HUÁNUCO HUANCAVELICA JUNÍN CAJAMARCA PUNO TACNA
11
4
3
1 1 1 1 1 1
NOTIFICACIONES DE ACCIDENTES MORTALES, SEGÚN REGIONES
24
PERÚ
MESES NOTIFICACIONES DE
INCIDENTES PELIGROSOS
ENERO 53
FEBRERO 47
MARZO 73
ABRIL 41
MAYO 77
JUNIO 66
JULIO 90
AGOSTO 69
SETIEMBRE -
OCTUBRE -
NOVIEMBRE -
DICIEMBRE -
TOTAL 516
FUENTE : MTPE / OGETIC / OFICINA DE ESTADÍSTICA
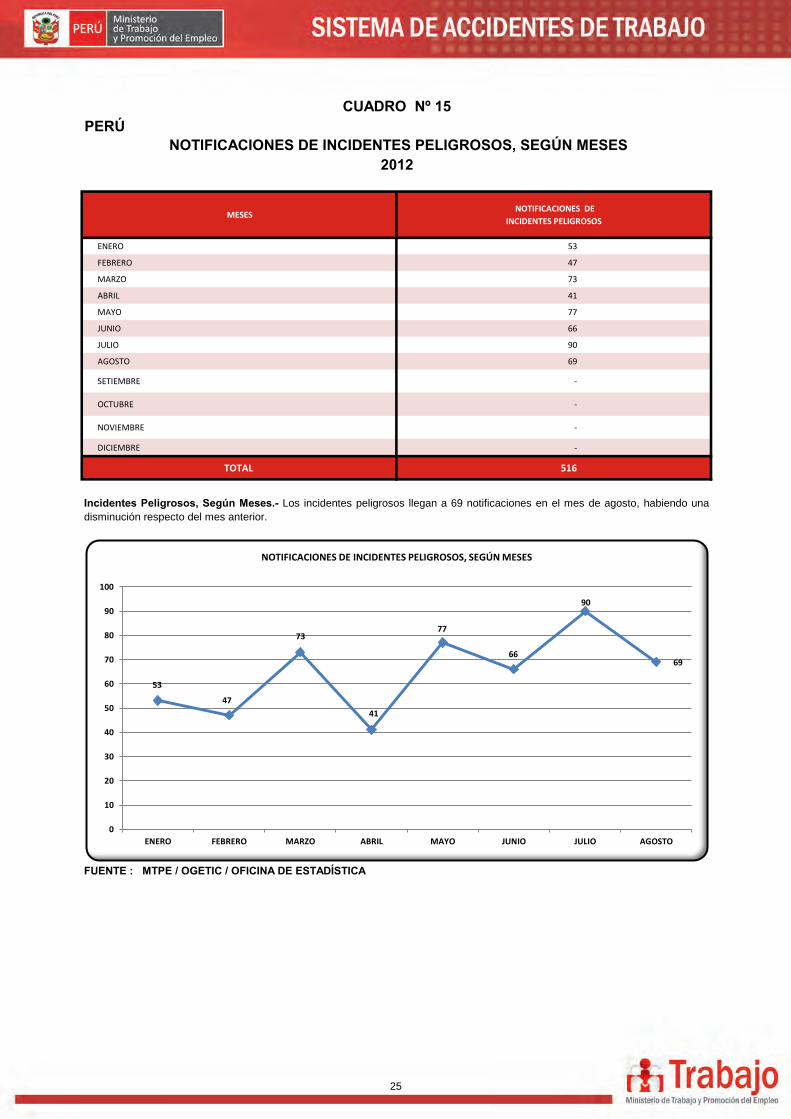
Incidentes Peligrosos, Según Meses.- Los incidentes peligrosos llegan a 69 notificaciones en el mes de agosto, habiendo una
disminución respecto del mes anterior.
CUADRO Nº 15
NOTIFICACIONES DE INCIDENTES PELIGROSOS, SEGÚN MESES 2012
53
47
73
41
77
66
90
69
0
10
20
30
40
50
60
70
80
90
100
ENERO FEBRERO MARZO ABRIL MAYO JUNIO JULIO AGOSTO
NOTIFICACIONES DE INCIDENTES PELIGROSOS, SEGÚN MESES
25
PERÚ
FORMA DEL INCIDENTE
NOTIFICACIONES
DE INCIDENTES
PELIGROSOS
CAÍDA DE CARGAS IZADAS(CONTENEDORES, PAQUETES, DESCARGAS, ETC) 4
DESPRENDIMIENTO DE ROCAS 1
EXPOSICIÓN A LÍNEAS DE ENERGÍA ELÉCTRICA DE ALTA TENSIÓN CON O SIN INSTALACIÓN A TIERRA 2
FUGA, DERRAME DE MATERIALES Y QUÍMICOS PELIGROSOS 1
ATRAPAMIENTO SIN DAÑO (DENTRO, FUERA, ENTRE, DEBAJO) 1
CHOQUE DE VEHÍCULOS DE TRABAJO 2
EXPOSICIÓN EN EXCESO A TEMPERATURAS EXTREMAS 1
INCENDIO DE UN CENTRO DE TRABAJO 1
OPERAR EQUIPOS, MÁQUINAS SIN AUTORIZACIÓN Y/O LICENCIA 1
USAR EQUIPOS, MÁQUINAS INADECUADAS 1
OTRAS 54
TOTAL 69
FUENTE : MTPE / OGETIC / OFICINA DE ESTADÍSTICA
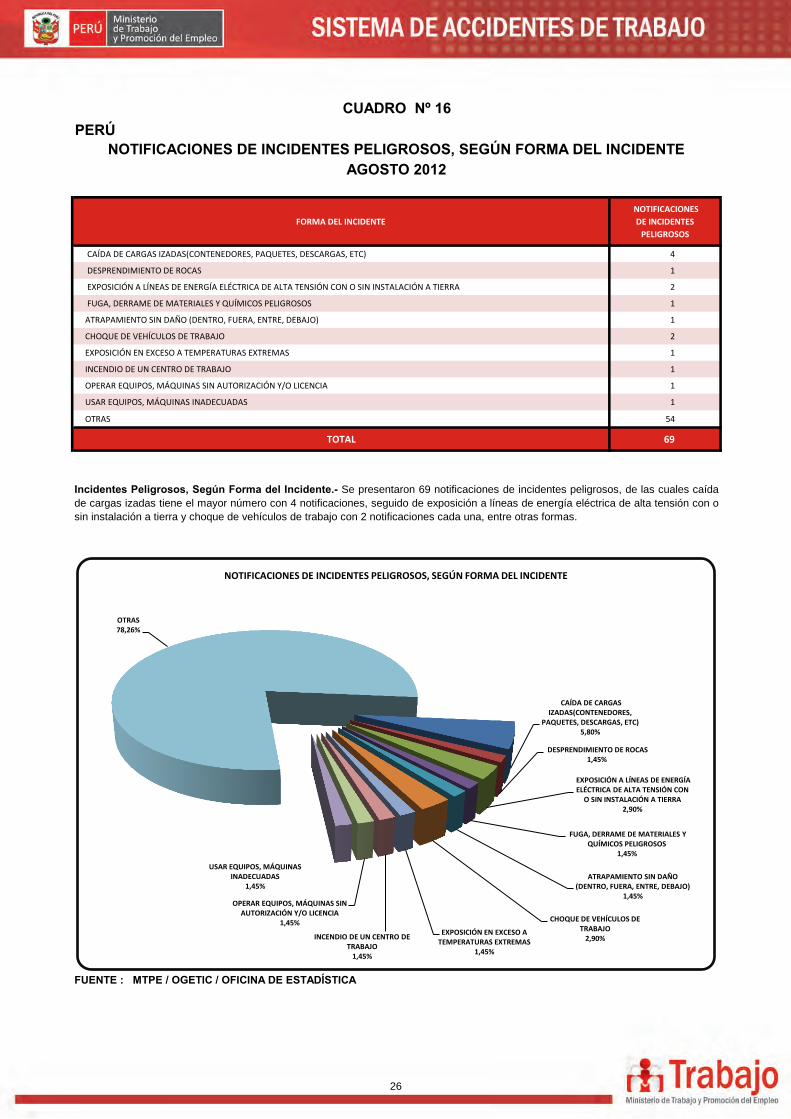
Incidentes Peligrosos, Según Forma del Incidente.- Se presentaron 69 notificaciones de incidentes peligrosos, de las cuales caída
de cargas izadas tiene el mayor número con 4 notificaciones, seguido de exposición a líneas de energía eléctrica de alta tensión con o
sin instalación a tierra y choque de vehículos de trabajo con 2 notificaciones cada una, entre otras formas.
CUADRO Nº 16
NOTIFICACIONES DE INCIDENTES PELIGROSOS, SEGÚN FORMA DEL INCIDENTEAGOSTO 2012
CAÍDA DE CARGAS IZADAS(CONTENEDORES,
PAQUETES, DESCARGAS, ETC) 5,80%
DESPRENDIMIENTO DE ROCAS 1,45%
EXPOSICIÓN A LÍNEAS DE ENERGÍA ELÉCTRICA DE ALTA TENSIÓN CON
O SIN INSTALACIÓN A TIERRA 2,90%
FUGA, DERRAME DE MATERIALES Y QUÍMICOS PELIGROSOS
1,45%
ATRAPAMIENTO SIN DAÑO (DENTRO, FUERA, ENTRE, DEBAJO)
1,45%
CHOQUE DE VEHÍCULOS DE TRABAJO
2,90% EXPOSICIÓN EN EXCESO A
TEMPERATURAS EXTREMAS 1,45%
INCENDIO DE UN CENTRO DE TRABAJO
1,45%
OPERAR EQUIPOS, MÁQUINAS SIN AUTORIZACIÓN Y/O LICENCIA
1,45%
USAR EQUIPOS, MÁQUINAS INADECUADAS
1,45%
OTRAS 78,26%
NOTIFICACIONES DE INCIDENTES PELIGROSOS, SEGÚN FORMA DEL INCIDENTE
26

PERÚ
ENERO FEBRERO MARZO ABRIL MAYO JUNIO JULIO AGOSTO SETIEMBRE OCTUBRE NOVIEMBRE DICIEMBRE
MASCULINO 7 6 10 5 12 5 5 6 - - - - 56 FEMENINO 1 - 2 1 4 1 - - - - - - 9
TOTAL 8 6 12 6 16 6 5 6 - - - - 65
FUENTE : MTPE / OGETIC / OFICINA DE ESTADÍSTICA
Enfermedades Ocupacionales por Meses de Certificación Médica Reportada.- Las certificaciones médicas reportadas en el mes de
agosto fueron 6, presentándose un aumento respecto al mes anterior. Por otra parte, hasta agosto del presente año 2012 se han
notificado un total de 65 certificaciones médicas de enfermedades ocupacionales.
CUADRO Nº 17
NOTIFICACIONES DE ENFERMEDADES OCUPACIONALES POR MESES DE CERTIFICACIÓN MÉDICA REPORTADA, SEGÚN SEXO
2012
SEXO MESES DE CERTIFICACIÓN MÉDICA
TOTAL
7
6
10
5
12
5 5
6
1
-
2
1
4
1 - -
-
2
4
6
8
10
12
14
ENERO FEBRERO MARZO ABRIL MAYO JUNIO JULIO AGOSTO
NOTIFICACIONES DE ENFERMEDADES OCUPACIONALES POR MESES DE CERTIFICACIÓN MÉDICA REPORTADA, SEGUN SEXO
MASCULINO FEMENINO
27
PERÚ
MASCULINO FEMENINO
HIPOACUSIA O SORDERA PROVOCADA POR EL RUIDO 2 - 2
TOTAL 2 - 2
FUENTE : MTPE / OGETIC / OFICINA DE ESTADÍSTICA
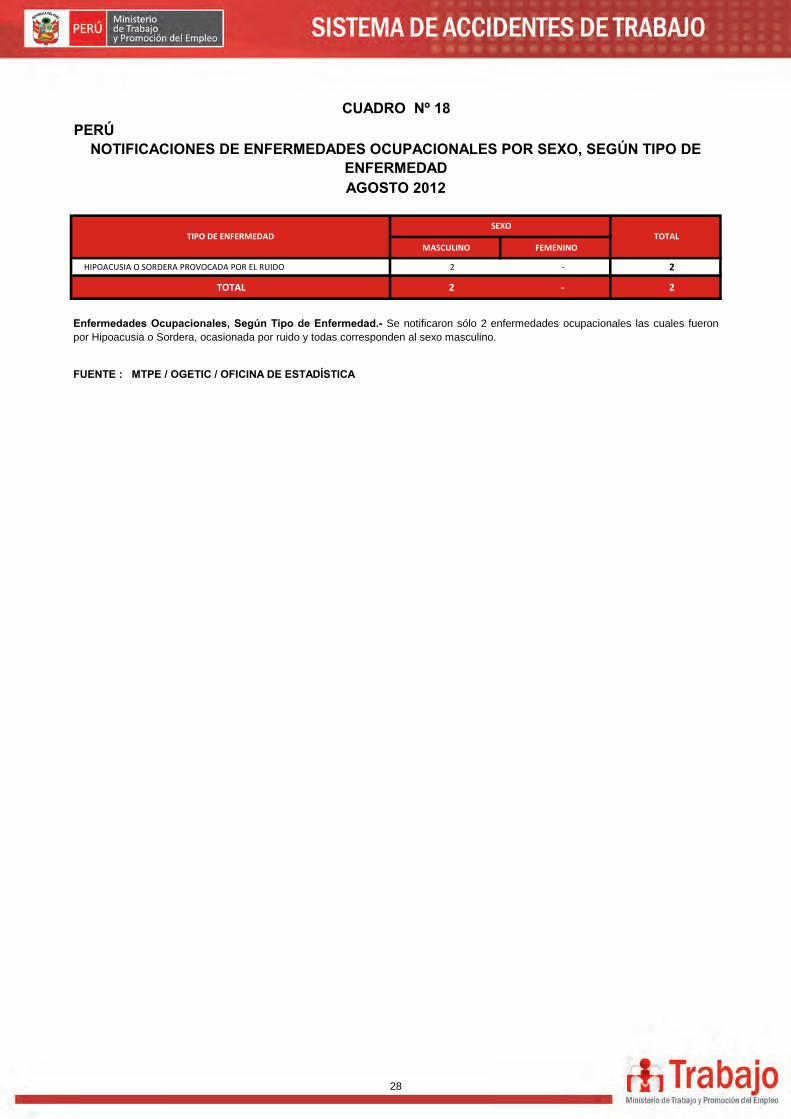
Enfermedades Ocupacionales, Según Tipo de Enfermedad.- Se notificaron sólo 2 enfermedades ocupacionales las cuales fueron
por Hipoacusia o Sordera, ocasionada por ruido y todas corresponden al sexo masculino.
CUADRO Nº 18
NOTIFICACIONES DE ENFERMEDADES OCUPACIONALES POR SEXO, SEGÚN TIPO DE ENFERMEDADAGOSTO 2012
TIPO DE ENFERMEDAD SEXO
TOTAL
28

fbvfddf
fw
fwe
f
ew
f
wef
f
fewfwe
OFICINA DE ESTADÍSTICAAv. Salaverry 655, Jesús María - 9no Piso Oficina 901
Lima - PerúTeléfono: 630-6000 - Anexo 4017 - 4022