con el contenido de almidón y digestión ruminal … · 245 proporción de endospermo duro y...
TRANSCRIPT
243
Rev Mex Cienc Pecu 2015;6(3):243-261
Características fisicoquímicas de nueve híbridos desorgo (Sorghum bicolor L. Moench) y su relacióncon el contenido de almidón y digestión ruminal
Physicochemical characteristics of nine sorghum(Sorghum bicolor L. Moench) hybrids and their
relationship to starch content and ruminal digestion
Mariana Villarreal-Silvaa, Francisco Castrejón Pinedaa, Alejandro Plascenciab, LourdesCarolina Pujolb, Alfredo Estrada-Anguloc, Francisco Gerardo Ríos-Rincónc, Jesús Manuel
Cortez Sáncheza, Manuel Cuca-Garcíad, Luis Coronaa
RESUMEN
Nueve híbridos de sorgo (Sorghum bicolor L. Moench) se analizaron para determinar la relación de suscaracterísticas físicas [materia seca (MS), peso de mil granos (PMG), tamaño de partícula (TP), densidad relativa(DR), superficie de área (SA), partículas por gramo (PPG), endospermo duro (END-DU), endospermo blando (END-BL)]; y químicas [nitrógeno total (NT), fibra detergente ácido (FDA), fibra detergente neutro (FDN), contenidode almidón (ALM), almidón soluble (AlmS), almidón insoluble (AlmNS). La digestión ruminal esperada (DRUM)se estimó con las fracciones de AlmS y AlmNS in vitro. El promedio de PMG, TP, DR, SA, PPG y END-DU fuede 24.61 g, 3.17 mm, 1.30 g/cm3, 17.44 cm2/g, 30.33 y 46.68 %, respectivamente El promedio (%) de MS, PC,FDN, FDA, ALM, AlmS y AlmNS fue de 92.47, 8.19, 19.17 y 8.30, 69.58, 6.00 y 47.74 respectivamente. Laconcentración de taninos fue baja (<0.003 eqCat). La DRUM promedió 66 % (rango 64.6 a 68.4 %). No se detectóninguna relación (P>0.05) entre las variables físicas o químicas con el contenido total de almidón en el grano;sin embargo las variables densidad relativa y superficie de área, permiten incrementar el poder de predicciónde la digestibilidad ruminal del almidón (DRUM,%= 74.058 - 0.108END-DU + 0.027SA – 5.887DR, R2= 0.77,P<0.05). De acuerdo a los resultados obtenidos, las variedades estudiadas son de dureza intermedia, libres detaninos y con un potencial de digestibilidad ruminal del almidón del 66 %.
PALABRAS CLAVE: Sorgo bicolor, Almidón, Digestión, Composición fisicoquímica.
ABSTRACT
Nine grain sorghum hybrids (bicolor Sorghum L. Moench) were analyzed to evaluate the relationship between thephysical [dry matter (DM), thousand grains weigh (TGW), particle size (PS), relative density (RD), area surface (AS)and particles for gram (PG), hard endosperm (HE) and soft endosperm (SE)]; and chemical characteristics [totalnitrogen (N), acid detergent fiber (ADF), neutral detergent fiber (NDF), total starch (S), soluble starch (S-S), insolublestarch (I-S)]. The predicted ruminal starch digestion (PRSD) was determined enzymatically from the S-S and I-Sfractions. The average of TGW, PS, RD, AS, PG and HE were 24.61 g, 3.17 mm, 1.30 g/cm3, 17.44 cm2/g, 30.33 and46.68 % respectively. The average (%) of DM, CP, FDN, FDA, S, S-S and I-S were 92.47, 8.19, 19.17, 8.30 69.58, 6.00and 47.74 respectively. The concentration of tannins was very low (<0.003 eqCat). The PRSD averaged 66.04 ±1.24 % (range 64.61 to 68.42). No relationship was detected (P>0.05) among the physical or chemical variables withthe total content of starch in the grain; however, the variables relative density and area surface, significantly increasesprediction (PRSD,% = 74.058 - 0.108HE + 0.027AS – 5.887RD, R2= 0.77, P<0.05). According to the study, the sorghumhybrids are of intermediate hardness, free of tannins and with a potential of ruminal starch digestion of 66 %.
KEY WORDS: Sorghum bicolor, Starch, Digestion, Physicochemical composition.
Recibido el 18 de agosto de 2014. Aceptado el 22 de septiembre de 2014.a Facultad de Medicina Veterinaria y Zootecnia, Universidad Nacional Autónoma de México. Departamento de Nutrición Animal y Bioquímica. Cd. Universitaria,
México, D.F. 04510. [email protected]. Correspondencia al último autor.b Instituto de Ciencias Veterinarias, Universidad Autónoma de Baja California. México.c Facultad de Medicina Veterinaria y Zootecnia, Universidad Autónoma de Sinaloa. México.d Colegio de Posgraduados. Recursos Genéticos y Productividad. Montecillo, Estado de México. México.
244
INTRODUCCIÓN
Como resultado de su aporte energético, elsorgo en grano (Sorghum bicolor L. Moench)es uno de los cereales más utilizados en Méxicoen la engorda de bovinos en confinamiento. Ladensidad energética del grano de sorgo obedecea su alto contenido de almidón (68 a 72 %)(1);sin embargo, la estructura y composición de losalmidones y su interacción con las proteínasdeterminan la digestibilidad del almidóncontenido en el grano y en el valor energéticodisponible del mismo(2) . El desarrollo de híbridosen el sorgo se ha dirigido principalmente aobtener mayores rendimientos de grano, menoruso de agua, incremento en la resistencia aplagas, así como el aumento o disminución enla concentración de ciertos compuestos deimportancia para la industria(3). La concentraciónde almidón es la menos afectada durante eldesarrollo de los híbridos(4), pero como resultadode las condiciones donde los híbridos sonproducidos (altas temperaturas y poca agua),comparado con el maíz, las digestibilidades invitro e in vivo del almidón de los híbridos delgrano de sorgo han demostrado ser másvariables(5,6) . Lo anterior se refleja en lasdiferencias observadas en el comportamientoproductivo del ganado alimentado con diferenteshíbridos de sorgo(7). Está demostrado que eldesarrollo de nuevos híbridos afecta en formadiferente las relaciones de las principalescaracterísticas fisicoquímicas (principalmenteproteína y proporción de endospermoduro:blando) y por lo tanto, esto puede modificarla digestibilidad de sus componentes (8,9).Aunque recientemente se ha sugerido que laproporción de endospermo duro:blando es unode los factores más importantes que limita ladigestión del almidón del grano de maíz enrumiantes(10), existe información limitada sobrelas relaciones de los componentes fisicoquímicosde híbridos de sorgo con la proporción deendospermo y con la digestibilidad ruminal delalmidón(11).
El objetivo del presente estudio fue describirlas principales características fisicoquímicas, la
INTRODUCTION
Due to its high energy content, sorghum(Sorghum bicolor L. Moench) is one of the mostwidely used cereals in Mexico for feedlot cattle.This grain’s energy density comes largely fromits high starch content (68 to 72 %)(1) . Grainstarch content digestibility and its availableenergy value are influenced by starch structureand composition, and its interaction withproteins(2). Development of sorghum hybridshas focused mainly on increasing grain yields;lowering water use; augmenting pest resistance;and increasing or decreasing the concentrationsof specific compounds important in industrialapplications. Starch concentration is affected onlyminimally during hybrid development(4).However, the conditions under which hybridsare grown (e.g. high temperatures, low wateravailability) can cause notable variability in thein vitro and in vivo digestibilities of starch fromhybrid sorghum grain (5,6). Differences indigestibilities can cause differences in theproductive performance of cattle fed differenttypes of hybrid sorghum(7). New sorghumhybrids have different ratios between theprincipal grain physicochemical characteristics(mainly protein and the hard:soft endospermratio), and these can modify componentdigestibility(8,9). Recent research using corngrain suggests the hard:soft endosperm ratio isone of the most important factors limitingdigestion of starch in ruminants(10) . Despite itsimportance, little data has been generated onthe relationships between the physicochemicalcomponents of hybr id sorghum gra in,endosperm proportions and ruminal starchdigestion(11).
The objectives of the present study were todescribe the main physicochemical characteristicsand the hard:soft endosperm ratio of ninesorghum hybrids grown in Mexico, and toanalyze the relationship of these parameters tostarch digestibility.
Mariana Villarreal-Silva, et al. / Rev Mex Cienc Pecu 2015;6(3):243-261

245
proporción de endospermo duro y blando y surelación con la digestibilidad del almidón denueve híbridos de sorgo cultivados en México.
MATERIALES Y MÉTODOS
Híbridos utilizados
Nueve muestras de híbridos comerciales degrano de sorgo fueron cultivadas y cosechadasen el año 2004 en el estado de Morelos paraevaluar sus características fisicoquímicas y susrelaciones con la digestibilidad del almidón. Loshíbridos utilizados fueron: 1) Pioneer 8282 (P-8282), 2) Pioneer 8418 (P-8418), 3) DeKalb2000 (DK-2000), 4) Asgrow Kilate (Kilate), 5)Asgrow Ámbar (Ámbar), 6) Asgrow Marfil(Marfil), 7) WAC-685, 8) Sorghum Partners Inc.KS955 (KS955) y 9) Dekalb D-65 (D-65).
Procesamiento de muestras y análisis delaboratorio
Las muestras se procesaron en el Laboratoriode Bromatología del Departamento de NutriciónAnimal y Bioquímica de la Facultad de MedicinaVeterinaria y Zootecnia de la UniversidadNacional Autónoma de México (UNAM). A lasmuestras se les retiró manualmente losmateriales extraños y se conservaron enrefrigeración (4 ºC) hasta su procesamiento yanálisis.
De cada híbrido se obtuvo una muestracontractual utilizando el método de cuarteo, ypara los análisis físicos, una parte de ésta sedejó como grano entero, el resto se moliópara someterla a análisis químicos.
Análisis físicos. Se realizaron por duplicado lassiguientes determinaciones para el grano entero:1) materia seca (MS)12; 2) tamaño de partícula(TP, expresada como diámetro mediogeométrico), para lo cual se utilizaron seisdiferentes cribas: USBS #4 (4,760 µm), USBS#5 (4,000 µm), USBS #6 (3,360 µm), USBS #7(2,830 µm), USBS #8 (2,380 µm) y USBS #10(2,000 µm); que fueron sobrepuestas, de mayora menor abertura en un agitador de cribas (W.S.
MATERIALS AND METHODS
Sorghum hybrids
Analyses of physicochemical characteristics andtheir relationship to starch digestibility were doneusing nine commercial sorghum hybridsharvested in 2004 in the state of Morelos,Mexico: Pioneer 8282 (P-8282); Pioneer 8418(P-8418); DeKalb 2000 (DK-2000); Asgrow Kilate(Kilate); Asgrow Ámbar (Ámbar); Asgrow Marfil(Marfil); WAC-685; Sorghum Partners Inc. KS955(KS955); and Dekalb D-65 (D-65).
Sample processing and laboratory analyses
Samples were processed at the Food ScienceLaboratory of the Animal Nutrition and BiochemistryDepartment of the Faculty of Veterinary Scienceand Zootechny, National Autonomous Universityof Mexico (Universidad Nacional Autónoma deMéxico - UNAM). Samples were cleaned of allforeign material and stored in refrigeration(4 ºC) until processing and analysis.
The quarter method was used to take arepresentative sample of each hybrid. Oneportion was left as whole grain for the physicalanalyses, while the rest was ground for chemicalanalyses.
Physical analyses. Duplicate analyses were doneof the whole grain to quantify four parameters:1) Dry matter content (DM)(12); 2) Particle size(PS)(13); 3) Thousand-grain weight (TGW); and4) Relative density (RD). Following Baker andHermann(13), particle size was expressed asgeometric mean diameter, and the grainsseparated using a screen shaker (W.S. Tyler,Model RX-812; Mentor, OH, USA) equipped withsix US standard (National Institute of Standardsand Technology - NIST) mesh sizes: #4 (4,750µm); #5 (4,000 µm); #6 (3,350 µm); #7(2,800 µm); #8 (2,360 µm); and #10 (2,000µm). Relative density was quantified based onwater displacement and measured with avolumetric pycnometer.
Chemical analyses. Samples were ground andthen screened through #10 (2,000 µm) mesh.
HÍBRIDOS DE SORGO Y SU RELACIÓN CON EL CONTENIDO DE ALMIDÓN Y DIGESTIÓN RUMINAL

246
Tyler Modelo RX-812; Mentor, OH, USA)siguiendo el procedimiento descrito por Baker yHermann (13); 3) peso de 1,000 granos (PMG);4) densidad relativa (DR), determinada pordesplazamiento de agua utilizando picnómetrovolumétrico.
Análisis químicos. Las muestras se molieron ytamizaron con criba United States Bureau ofStandard (USBS) #10 (1,680 micrones) pararealizar los siguientes análisis: materia seca(MS), nitrógeno total (N)12 , fibra detergenteneutro (FDN) y fibra detergente ácido (FDA)14.Una segunda submuestra de cada híbrido fuemolida y tamizada con criba USBS #40 (420micrones) para la determinación de taninos(TAN)(15) y almidón(16).
La solubilidad del almidón se determinómediante una prueba enzimática in vitroincubándose las muestras a 39 °C durante 4 hpara determinar la fracción de almidón soluble(AlmS) y durante 6 h para el almidón insoluble(AlmNS) siguiendo la técnica descrita porRodríguez et al(17). Para preparar la soluciónbuffer se utilizaron las enzimas amiloglucosidasade Aspergillus niger (Sigma A-7420), -amilasade páncreas porcino (Sigma 10080), pancreatinaporcina (Sigma P-1625), achromopeptidasa deAchromobacter lyticus (Sigma A-3547), yproteasa de páncreas bovino (Sigma P-4630).
Cálculos
Para la estimación de superficie de área (SA)y número de partículas por grano (PPG) seutilizaron las fórmulas informadas por Baker yHerrman (13) utilizando para ello los datos dedistribución de partícula. Para calcular el valorde la digestibilidad ruminal de almidón esperada(DRUM) se calcularon primero los valores dealmidón reactivo a la amiloglucosidasa (AGR),almidón reactivo (RS), almidón reactivo insoluble(IRS) y almidón digerible insoluble (ISD)mediante los valores observados para elcontenido de almidón del grano, así como losvalores AlmS y AlmNS determinados en laprueba de digestión in vitro mediante las
Analyses were done to measure dry matter(DM), total nitrogen (TN)(12), neutral detergentfiber (NDF), and acid detergent fiber (ADF)(14).A subsample from each hybrid was ground andscreened through US standard mesh #40 (425µm) mesh to allow measurement of tannins(TAN)(15) and starch (ST) content(16).
Starch solubility was measured by an in vitroenzymatic test(17). Starch solutions were heatedto 39 °C for 4 h to quantify the soluble starch(SST) fraction and for 6 h to quantify theinsoluble starch (IST) fraction. The buffersolution was prepared using amyloglucosidaseenzymes from Aspergillus niger (Sigma A-7420),-amylase from pig pancreas (Sigma 10080),pig pancreatin (Sigma P-1625), achromopeptidasefrom Achromobacter lyticus (Sigma A-3547), andprotease from bovine pancreas (Sigma P-4630).
Calculations
Surface area (SA) and number of particles pergrain (PPG) were calculated with formulas basedon Baker and Herrman(13) , and using particledistribution data. Predicted ruminal starchdigestion (RSD) was determined by firstcalculating the values for starch reactive toamyloglucosidase (SRA), reactive starch (RS),insoluble reactive starch (IRS) and insolubledigestible starch (IDS). These were calculatedusing grain starch content (ST), SST and ISTvalues with these formulas:
SRA= (SST/ST)*100; RS= (lST/ST) * 100; IRS=(RS - SRA)/6; IDS= (100-SRA)*(IRS/(IRS + 0.05))
Where 0.5 is the grain rumen transit rate. TheRSD was then calculated as follows(17):
RSD, %= (1.32 * SRA) + (0.93 * IDS), R2=0.78
Hemicellulose (HEMI) concentration wascalculated by the arithmetic mean of NDF –ADF for each hybrid. Proportions of hard (HE)and soft endosperm (SE) were estimated byquantifying and differentiating their areas in thegrain. For this purpose, 20 whole grains per
Mariana Villarreal-Silva, et al. / Rev Mex Cienc Pecu 2015;6(3):243-261

247
siguientes fórmulas:
AGR= (AlmS/ALM)*100; RS= (AlmNS/ALM) *100; IRS= (RS - AGR)/6; ISD= (100-AGR)*(IRS/(IRS + 0.05))
Donde el 0.05 representa la tasa de pasaje degrano en el rumen. La DRUM se calculóutilizando la siguiente ecuación(17):
DRUM, % = (1.32 * AGR) + (0.93 * ISD),R2= 0.78
La concentración de la hemicelulosa (HEMICEL)se determinó mediante la diferencia aritméticade la media de FND – FDA de cada híbrido. Laestimación de las proporciones de endospermoduro (END-DU) y endospermo blando (END-BL) se realizó mediante cuantificación ydiferenciación de sus áreas en el grano. Paraello, de 50 granos limpios y procesados seseleccionaron a conveniencia 20 granos enterosde cada híbrido y la estimación se realizómediante una modificación de la técnica deKirleis et al (18) que se describe a continuación:se prepararon portaobjetos cubriendo lasuperficie con resina epóxica conocida comopoliéster (Fusión Polymers S.A de C.V., México),inmediatamente se colocaron sobre ésta 10granos de sorgo de un mismo híbrido porportaobjetos, dejando suficiente espacio entreellos hasta montar 50 granos, de tal formaque la mitad de cada grano sobresalía delpoliéster y el resto se encontraba sumergidoen éste. Los portaobjetos se dejaron polimerizardurante 24 h a temperatura ambiente (~25 ºC).Posteriormente, cada grano se seccionó a lamitad con un bisturí (mango Totmedical No. 3,hoja No. 22) retirando la parte que sobresalíadel poliéster, exponiendo así el germen y lasáreas de END-DU y END-BL. Considerando laintegridad de la superficie de corte, la regularidadde los bordes del grano, la exposición completadel centro del germen y el estado sano decada grano se seleccionaron los 20 granos decada híbrido, sin tomar en consideración lasdiferencias de color, tamaño o forma. Los cortesse conservaron en sus portaobjetos enrefrigeración (4 ºC) hasta la toma de fotografíasdigitales.
hybrid were randomly chosen from a lot of 50clean, processed grains. Estimation was doneusing a modification of the technique of Kirleiset al(18). Briefly, slides were covered with epoxyresin (polyester, Fusión Polymers S.A de C.V.,Mexico), and ten grains of the same hybrid placedon each slide, ensuring that half the grain remainedabove the polyester. Fifty grains per hybrid weremounted (i.e. five slides per hybrid). Afterpolymerization for 24 h at ~25 ºC, a scalpel(Totmedical, No. 3 blade, No. 22 blade) wasused to cut off the half of each grain above thepolyester. This exposed the germ, the HE andthe SE. Based on cut surface integrity, grainedge regularity, complete exposure of graincenter and grain health, 20 grains per hybridwere chosen; grain color, size and shape werenot taken into consideration. Cut grains werekept in the slides, under refrigeration (4 ºC)until digital images were taken.
Each of the 20 grains from each hybrid werephotographed at 7.1 MP resolution using a digitalcamera (PowerShot S70, Canon, Lake Success,NY) and a stereoscopic microscope (Leica Z125)with a camera adapter (Leica DS150). Imageswere focused manually, no flash was used andcontrast was set at “exterior”. Images wereedited using Adobe Photoshop Elements(19). Thearea of the germ HE, the pericarp and area ofthe germ SE, and the HE were marked with ablack line (0% color saturation; blue, green andred tones at 0 %; 0 % brightness, #:000000;Hard round 5 pixels). The lines must exhibit nointerruptions or flaws since this can effect laterselection and measuring of areas in pixels. Theareas of the HE and SE were calculated withthe “Magic Wand Tool”, and the number of pixelsin this area was treated as total endospermarea. The number of pixels accounting for HEwas calculated by substraction, and thepercentages of HE and SE within the totalendosperm area were calculated.
Statistical analysis
To calculate differences between hybrids in termsof the hard:soft endosperm percentages, eachimage was established as an experimental unit.
HÍBRIDOS DE SORGO Y SU RELACIÓN CON EL CONTENIDO DE ALMIDÓN Y DIGESTIÓN RUMINAL
248
De cada uno de los 20 granos seleccionadospor cada híbrido se tomaron fotografías conuna cámara Canon PowerShot S70 (7.1 MP,Lake Success , NY) y un microscopioestereoscópico Leica Z125 con adaptador decámara Leica DS150, enfocando manualmentecada toma, sin flash y ajustando el contrastede blancos al modo “exterior”. Cada fotografíase editó utilizando el software Adobe PhotoshopElements(19) . Se delimitó con color negro(saturación de color 0 %, tonos: azul verde yrojo al 0 %, brillo 0 %, #:000000) y grosor delínea de 5 píxeles (Hard round 5 pixels) el áreade END-DU del germen, el pericarpio y el áreade END-BL del germen y el END-DU con el usode la función “Pencil tool” seleccionada en labarra de “Tools”; las líneas trazadas no debíanpresentar ninguna interrupción o corte, ya queesto afecta la selección de las áreas y sumedición posterior en píxeles. Se determinó elárea de END-DR y END-BL utilizando la función“Magic Wand Tool”. Se revisó de nuevo elnúmero de píxeles que se encontraron dentrode esta área, y así se obtuvo el número depíxeles dentro del endospermo total. Por mediode sustracción aritmética se obtuvo el númerode píxeles del END-DR y se calculó la proporciónporcentual de END-DR y END-BL respecto altotal de endospermo.
Análisis estadístico
Para calcular la diferencia entre los híbridos enla proporción de endospermo duro:blando seestableció como unidad experimental cadafotografía que cumpliera con las característicasmencionadas. Los datos obtenidos de laproporción de endospermo duro:blando seanalizaron mediante el Procedimiento deModelos General Linear (GLM, SAS)(20) y lasdiferencias entre medias se evaluaron mediantela Prueba de Tukey con valor de significanciade P<0.05(21) . Se realizaron correlacionessimples (r de Pearson) entre todas lascaracterísticas físicoquímicas y se utilizó el Modelode Regresión Lineal Simple para las correlacionesde: END-DR y END-BL, FAD y CEL, FAD y N,PMG y TP, SA y DRA y DRA y END-DR y se
The hard:soft endosperm percentage data wereanalyzed using the General Linear Models (GLM)procedure in the SAS program (20). Differencesbetween the means were evaluated with a Tukeytest (significance P<0.05) (21). Simple (Pearson r)correlations were run between all thephysicochemical characteristics, and a simplelinear regression model used for the correlationsbetween HE and SE; ADF and CEL; ADF andTN; TGW and PS; SA and RSD; and RSD andHE. A multiple regression equation was run topredict RSD using the HE, SA and RD variableswith the Stepwise Linear Regression function inthe Statistix program(22).
RESULTS
Physical characteristics
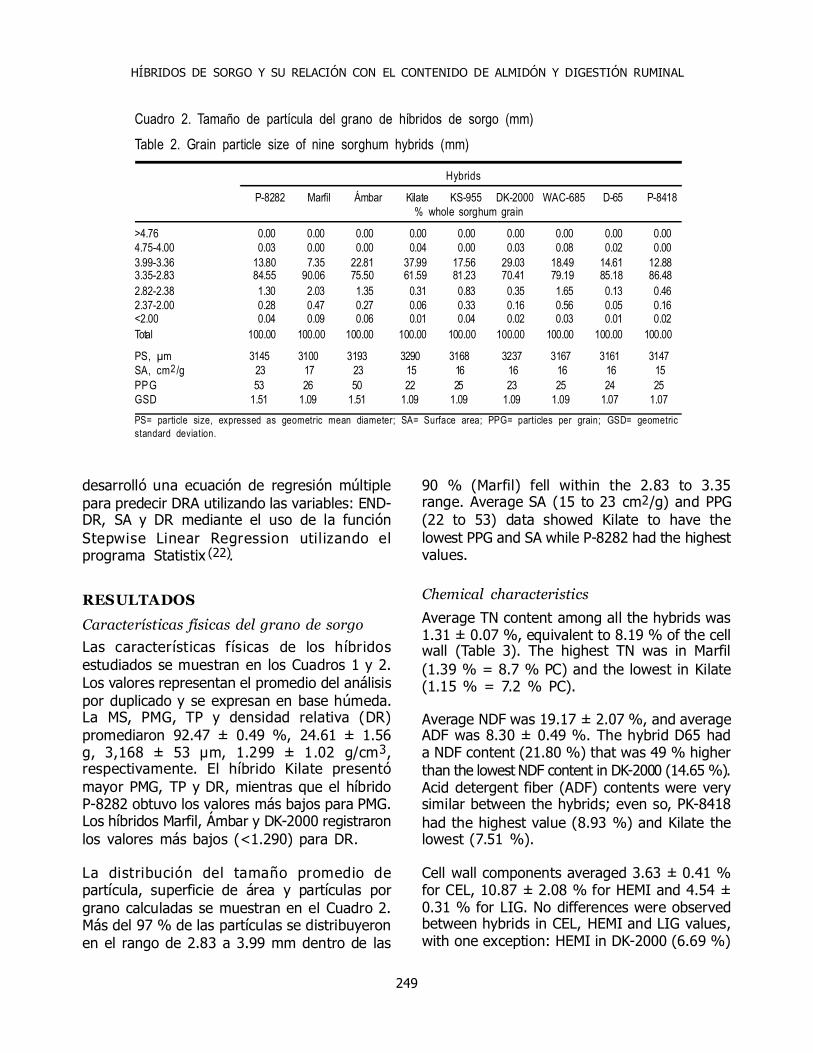
Particle size (PS), TGW and DR were highest inthe Kilate hybrid. The lowest TGW was recordedin the P-8282 hybrid, and the lowest RD values(<1.290) were in the Marfil, Ambar and DK-2000 hybrids (Table 1). Data for average PS,SA and PPG showed that more than 97 % ofparticles were within the 2.83 to 3.99 mm range(Table 2). Within this range, 62 % (Kilate) to
Cuadro 1. Características físicas del grano de nuevehíbridos de sorgo
Table 1. Grain physical characteristics of nine sorghumhybrids
TGWa DM a PSa RD aHybrid (g) (% ) (µm) g/cm3
P-8282 22.37 92.43 3145 1.298DK-2000 24.05 92.09 3137 1.263Kilate 27.75 93.16 3290 1.309D-65 24.20 92.45 3161 1.308WAC-685 24.38 92.81 3167 1.317Ambar 25.98 91.65 3193 1.275P-8418 23.88 92.31 3147 1.323KS-955 25.29 92.21 3168 1.307Marfil 23.55 93.13 3100 1.286Average 24.61 92.47 3168 1.299Standard deviation 1.56 0.49 52.53 0.02aAverage by duplicate; TGW= thousand-grain weight; DM= dry matter,PS= particle size (geometric mean diameter); RD= relative density.
Mariana Villarreal-Silva, et al. / Rev Mex Cienc Pecu 2015;6(3):243-261
249
desarrolló una ecuación de regresión múltiplepara predecir DRA utilizando las variables: END-DR, SA y DR mediante el uso de la funciónStepwise Linear Regression util izando elprograma Statistix (22).
RESULTADOS
Características físicas del grano de sorgo
Las características físicas de los híbridosestudiados se muestran en los Cuadros 1 y 2.Los valores representan el promedio del análisispor duplicado y se expresan en base húmeda.La MS, PMG, TP y densidad relativa (DR)promediaron 92.47 ± 0.49 %, 24.61 ± 1.56g, 3,168 ± 53 µm, 1.299 ± 1.02 g/cm3,respectivamente. El híbrido Kilate presentómayor PMG, TP y DR, mientras que el híbridoP-8282 obtuvo los valores más bajos para PMG.Los híbridos Marfil, Ámbar y DK-2000 registraronlos valores más bajos (<1.290) para DR.
La distribución del tamaño promedio departícula, superficie de área y partículas porgrano calculadas se muestran en el Cuadro 2.Más del 97 % de las partículas se distribuyeronen el rango de 2.83 a 3.99 mm dentro de las
90 % (Marfil) fell within the 2.83 to 3.35range. Average SA (15 to 23 cm2/g) and PPG(22 to 53) data showed Kilate to have thelowest PPG and SA while P-8282 had the highestvalues.
Chemical characteristics
Average TN content among all the hybrids was1.31 ± 0.07 %, equivalent to 8.19 % of the cellwall (Table 3). The highest TN was in Marfil(1.39 % = 8.7 % PC) and the lowest in Kilate(1.15 % = 7.2 % PC).
Average NDF was 19.17 ± 2.07 %, and averageADF was 8.30 ± 0.49 %. The hybrid D65 hada NDF content (21.80 %) that was 49 % higherthan the lowest NDF content in DK-2000 (14.65 %).Acid detergent fiber (ADF) contents were verysimilar between the hybrids; even so, PK-8418had the highest value (8.93 %) and Kilate thelowest (7.51 %).
Cell wall components averaged 3.63 ± 0.41 %for CEL, 10.87 ± 2.08 % for HEMI and 4.54 ±0.31 % for LIG. No differences were observedbetween hybrids in CEL, HEMI and LIG values,with one exception: HEMI in DK-2000 (6.69 %)
Cuadro 2. Tamaño de partícula del grano de híbridos de sorgo (mm)Table 2. Grain particle size of nine sorghum hybrids (mm)
Hybrids
P-8282 Marfil Ámbar Kilate KS-955 DK-2000 WAC-685 D-65 P-8418% whole sorghum grain
>4.76 0.00 0.00 0.00 0.00 0.00 0.00 0.00 0.00 0.004.75-4.00 0.03 0.00 0.00 0.04 0.00 0.03 0.08 0.02 0.003.99-3.36 13.80 7.35 22.81 37.99 17.56 29.03 18.49 14.61 12.883.35-2.83 84.55 90.06 75.50 61.59 81.23 70.41 79.19 85.18 86.482.82-2.38 1.30 2.03 1.35 0.31 0.83 0.35 1.65 0.13 0.462.37-2.00 0.28 0.47 0.27 0.06 0.33 0.16 0.56 0.05 0.16<2.00 0.04 0.09 0.06 0.01 0.04 0.02 0.03 0.01 0.02Total 100.00 100.00 100.00 100.00 100.00 100.00 100.00 100.00 100.00
PS, µm 3145 3100 3193 3290 3168 3237 3167 3161 3147SA, cm2 /g 23 17 23 15 16 16 16 16 15PPG 53 26 50 22 25 23 25 24 25GSD 1.51 1.09 1.51 1.09 1.09 1.09 1.09 1.07 1.07PS= particle size, expressed as geometric mean diameter; SA= Surface area; PPG= particles per grain; GSD= geometricstandard deviation.
HÍBRIDOS DE SORGO Y SU RELACIÓN CON EL CONTENIDO DE ALMIDÓN Y DIGESTIÓN RUMINAL
250
cuales del 62 al 90 % fueron partículas en elrango de 2.83 a 3.35 mm, siendo el menor(61.59 %) para el híbrido Kilate y mayor(90.06 %) para el híbrido Marfil. Los valorescalculados de superficie de área (SA) y númerode partículas por grano (PPG) promediaron22-53 y 15-23 cm2 /g, respectivamente. Elhíbrido Kilate presentó una menor PPG y SAmientras que el híbrido P-8282 obtuvo losvalores más altos para PPG y SA.
Características químicas del grano de sorgo
El contenido de nitrógeno (NT), composiciónde paredes celulares y concentración de taninosse muestra en el Cuadro 3. El promedio decontenido de NT fue 1.31 ± 0.07 % el cualequivale a 8.19 % de PC. El mayor contenidode NT fue para el híbrido Marfil (1.39 % =8.7 % PC) y el menor fue para Kilate (1.15 %= 7.2 % PC). El promedio de FDN y FDA fuede 19.17 ± 2.07 y 8.30 ± 0.49 %,respectivamente. El híbrido D65 presentó 49 %más de FDN que DK-2000 (21.80 vs 14.65 %);por otra parte, el contenido de FDA fue muysimilar entre los híbridos, aún así PK-8418mostró el valor más alto (8.93 %) y Kilate el
was notably lower than the 13.36 % averageamong the remaining hybrids.
Tannins (TAN) were detected in only four ofthe nine hybrids, and at very low levels(0.0005 - 0.001 %, expressed in catechinequivalents). These levels are so low thatall nine hybrids can be considered to beessentially tannin-free.
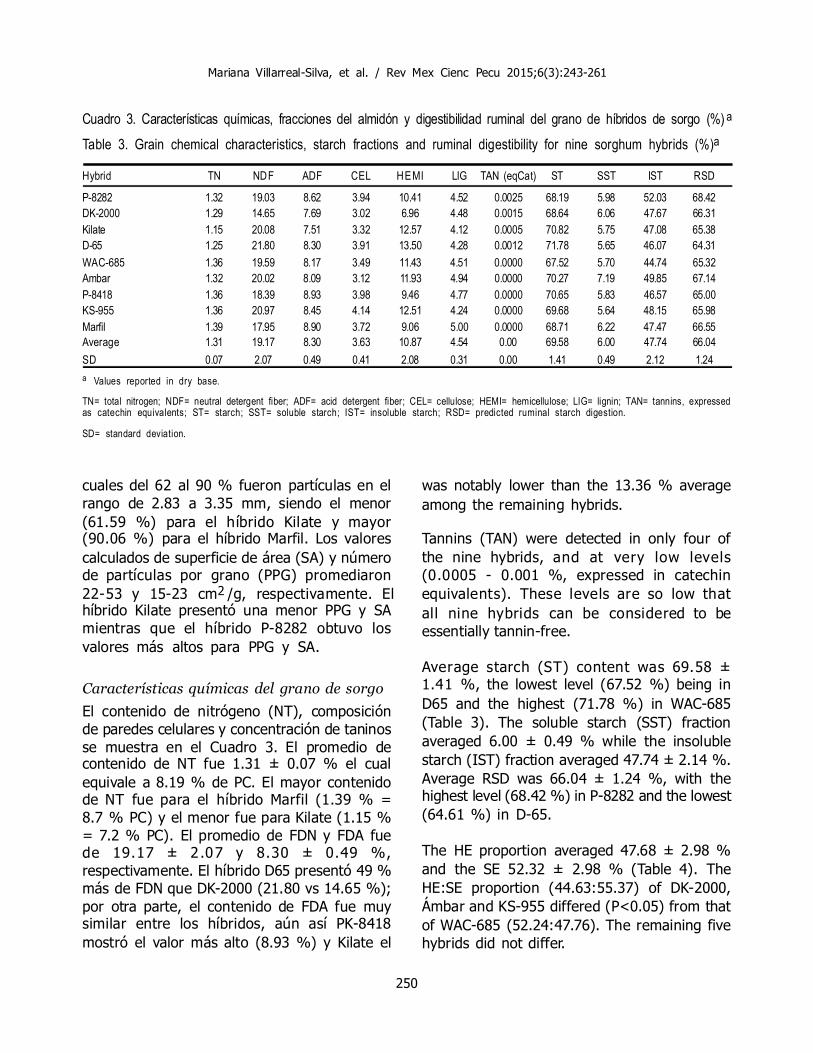
Average starch (ST) content was 69.58 ±1.41 %, the lowest level (67.52 %) being inD65 and the highest (71.78 %) in WAC-685(Table 3). The soluble starch (SST) fractionaveraged 6.00 ± 0.49 % while the insolublestarch (IST) fraction averaged 47.74 ± 2.14 %.Average RSD was 66.04 ± 1.24 %, with thehighest level (68.42 %) in P-8282 and the lowest(64.61 %) in D-65.
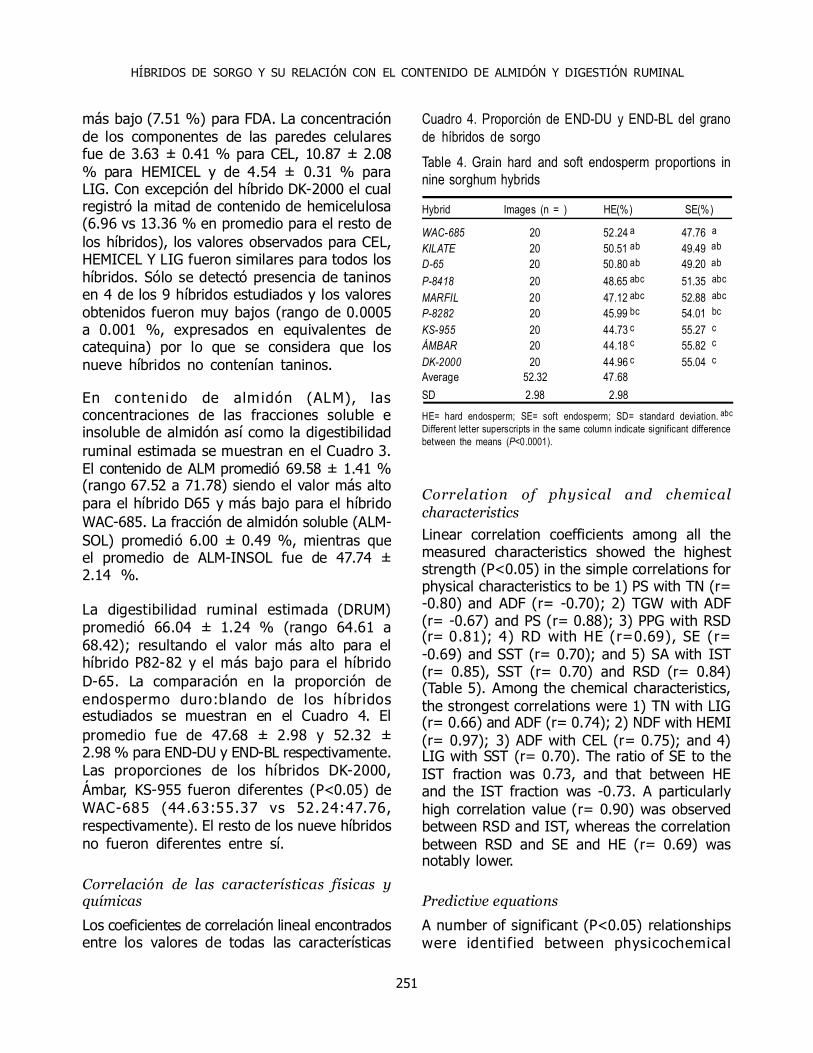
The HE proportion averaged 47.68 ± 2.98 %and the SE 52.32 ± 2.98 % (Table 4). TheHE:SE proportion (44.63:55.37) of DK-2000,Ámbar and KS-955 differed (P<0.05) from thatof WAC-685 (52.24:47.76). The remaining fivehybrids did not differ.
Cuadro 3. Características químicas, fracciones del almidón y digestibilidad ruminal del grano de híbridos de sorgo (%) a
Table 3. Grain chemical characteristics, starch fractions and ruminal digestibility for nine sorghum hybrids (%)a
Hybrid TN NDF ADF CEL HEMI LIG TAN (eqCat) ST SST IST RSD
P-8282 1.32 19.03 8.62 3.94 10.41 4.52 0.0025 68.19 5.98 52.03 68.42DK-2000 1.29 14.65 7.69 3.02 6.96 4.48 0.0015 68.64 6.06 47.67 66.31Kilate 1.15 20.08 7.51 3.32 12.57 4.12 0.0005 70.82 5.75 47.08 65.38D-65 1.25 21.80 8.30 3.91 13.50 4.28 0.0012 71.78 5.65 46.07 64.31WAC-685 1.36 19.59 8.17 3.49 11.43 4.51 0.0000 67.52 5.70 44.74 65.32Ambar 1.32 20.02 8.09 3.12 11.93 4.94 0.0000 70.27 7.19 49.85 67.14P-8418 1.36 18.39 8.93 3.98 9.46 4.77 0.0000 70.65 5.83 46.57 65.00KS-955 1.36 20.97 8.45 4.14 12.51 4.24 0.0000 69.68 5.64 48.15 65.98Marfil 1.39 17.95 8.90 3.72 9.06 5.00 0.0000 68.71 6.22 47.47 66.55Average 1.31 19.17 8.30 3.63 10.87 4.54 0.00 69.58 6.00 47.74 66.04SD 0.07 2.07 0.49 0.41 2.08 0.31 0.00 1.41 0.49 2.12 1.24a Values reported in dry base.
TN= total nitrogen; NDF= neutral detergent fiber; ADF= acid detergent fiber; CEL= cellulose; HEMI= hemicellulose; LIG= lignin; TAN= tannins, expressedas catechin equivalents; ST= starch; SST= soluble starch; IST= insoluble starch; RSD= predicted ruminal starch digestion.
SD= standard deviation.
Mariana Villarreal-Silva, et al. / Rev Mex Cienc Pecu 2015;6(3):243-261
251
más bajo (7.51 %) para FDA. La concentraciónde los componentes de las paredes celularesfue de 3.63 ± 0.41 % para CEL, 10.87 ± 2.08% para HEMICEL y de 4.54 ± 0.31 % paraLIG. Con excepción del híbrido DK-2000 el cualregistró la mitad de contenido de hemicelulosa(6.96 vs 13.36 % en promedio para el resto delos híbridos), los valores observados para CEL,HEMICEL Y LIG fueron similares para todos loshíbridos. Sólo se detectó presencia de taninosen 4 de los 9 híbridos estudiados y los valoresobtenidos fueron muy bajos (rango de 0.0005a 0.001 %, expresados en equivalentes decatequina) por lo que se considera que losnueve híbridos no contenían taninos.
En contenido de almidón (ALM), lasconcentraciones de las fracciones soluble einsoluble de almidón así como la digestibilidadruminal estimada se muestran en el Cuadro 3.El contenido de ALM promedió 69.58 ± 1.41 %(rango 67.52 a 71.78) siendo el valor más altopara el híbrido D65 y más bajo para el híbridoWAC-685. La fracción de almidón soluble (ALM-SOL) promedió 6.00 ± 0.49 %, mientras queel promedio de ALM-INSOL fue de 47.74 ±2.14 %.
La digestibilidad ruminal estimada (DRUM)promedió 66.04 ± 1.24 % (rango 64.61 a68.42); resultando el valor más alto para elhíbrido P82-82 y el más bajo para el híbridoD-65. La comparación en la proporción deendospermo duro:blando de los híbridosestudiados se muestran en el Cuadro 4. Elpromedio fue de 47.68 ± 2.98 y 52.32 ±2.98 % para END-DU y END-BL respectivamente.Las proporciones de los híbridos DK-2000,Ámbar, KS-955 fueron diferentes (P<0.05) deWAC-685 (44.63:55.37 vs 52.24:47.76,respectivamente). El resto de los nueve híbridosno fueron diferentes entre sí.
Correlación de las características físicas yquímicas
Los coeficientes de correlación lineal encontradosentre los valores de todas las características
Correlation of physical and chemicalcharacteristics
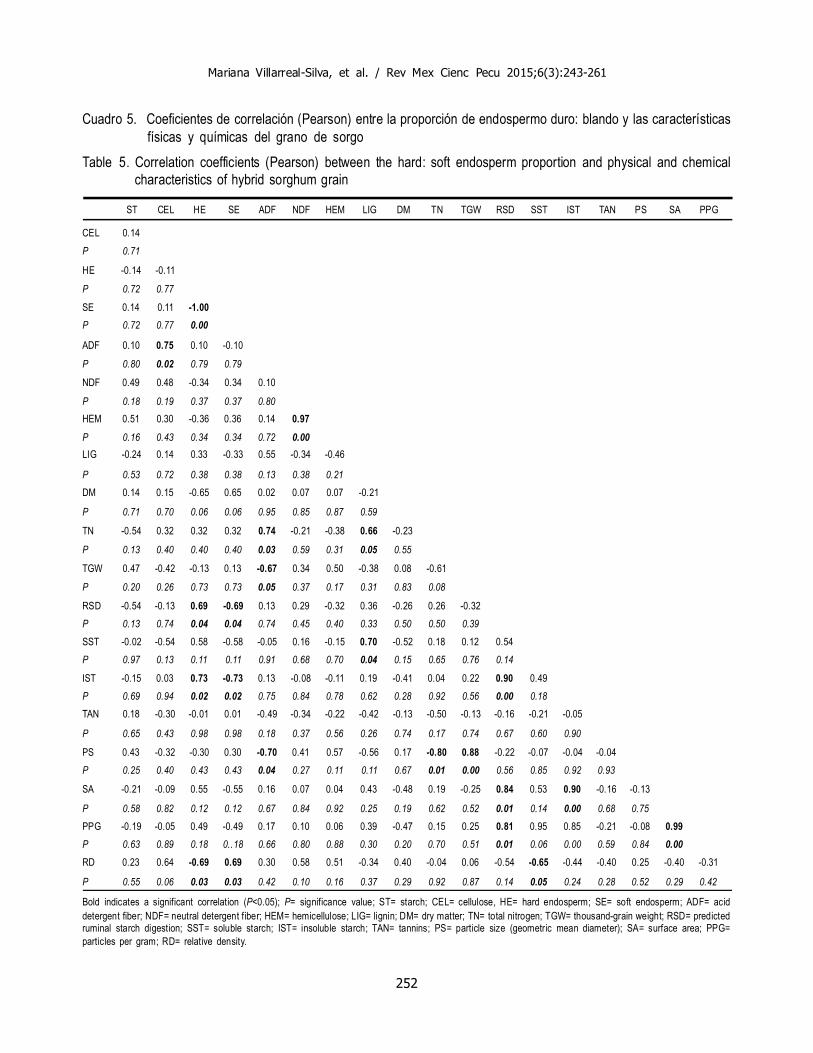
Linear correlation coefficients among all themeasured characteristics showed the higheststrength (P<0.05) in the simple correlations forphysical characteristics to be 1) PS with TN (r=-0.80) and ADF (r= -0.70); 2) TGW with ADF(r= -0.67) and PS (r= 0.88); 3) PPG with RSD(r= 0.81); 4) RD with HE (r=0.69), SE (r=-0.69) and SST (r= 0.70); and 5) SA with IST(r= 0.85), SST (r= 0.70) and RSD (r= 0.84)(Table 5). Among the chemical characteristics,the strongest correlations were 1) TN with LIG(r= 0.66) and ADF (r= 0.74); 2) NDF with HEMI(r= 0.97); 3) ADF with CEL (r= 0.75); and 4)LIG with SST (r= 0.70). The ratio of SE to theIST fraction was 0.73, and that between HEand the IST fraction was -0.73. A particularlyhigh correlation value (r= 0.90) was observedbetween RSD and IST, whereas the correlationbetween RSD and SE and HE (r= 0.69) wasnotably lower.
Predictive equations
A number of significant (P<0.05) relationshipswere identified between physicochemical
Cuadro 4. Proporción de END-DU y END-BL del granode híbridos de sorgoTable 4. Grain hard and soft endosperm proportions innine sorghum hybrids
Hybrid Images (n = ) HE(%) SE(%)
WAC-685 20 52.24 a 47.76 a
KILATE 20 50.51 ab 49.49 ab
D-65 20 50.80 ab 49.20 ab
P-8418 20 48.65 abc 51.35 abc
MARFIL 20 47.12 abc 52.88 abcP-8282 20 45.99 bc 54.01 bc
KS-955 20 44.73 c 55.27 cÁMBAR 20 44.18 c 55.82 c
DK-2000 20 44.96 c 55.04 cAverage 52.32 47.68SD 2.98 2.98
HE= hard endosperm; SE= soft endosperm; SD= standard deviation. abc
Different letter superscripts in the same column indicate significant differencebetween the means (P<0.0001).
HÍBRIDOS DE SORGO Y SU RELACIÓN CON EL CONTENIDO DE ALMIDÓN Y DIGESTIÓN RUMINAL
252
Cuadro 5. Coeficientes de correlación (Pearson) entre la proporción de endospermo duro: blando y las característicasfísicas y químicas del grano de sorgo
Table 5. Correlation coefficients (Pearson) between the hard: soft endosperm proportion and physical and chemicalcharacteristics of hybrid sorghum grain
ST CEL HE SE ADF NDF HEM LIG DM TN TGW RSD SST IST TAN PS SA PPG
CEL 0.14P 0.71
HE -0.14 -0.11
P 0.72 0.77
SE 0.14 0.11 -1.00P 0.72 0.77 0.00
ADF 0.10 0.75 0.10 -0.10
P 0.80 0.02 0.79 0.79
NDF 0.49 0.48 -0.34 0.34 0.10
P 0.18 0.19 0.37 0.37 0.80HEM 0.51 0.30 -0.36 0.36 0.14 0.97
P 0.16 0.43 0.34 0.34 0.72 0.00LIG -0.24 0.14 0.33 -0.33 0.55 -0.34 -0.46
P 0.53 0.72 0.38 0.38 0.13 0.38 0.21DM 0.14 0.15 -0.65 0.65 0.02 0.07 0.07 -0.21
P 0.71 0.70 0.06 0.06 0.95 0.85 0.87 0.59
TN -0.54 0.32 0.32 0.32 0.74 -0.21 -0.38 0.66 -0.23
P 0.13 0.40 0.40 0.40 0.03 0.59 0.31 0.05 0.55
TGW 0.47 -0.42 -0.13 0.13 -0.67 0.34 0.50 -0.38 0.08 -0.61
P 0.20 0.26 0.73 0.73 0.05 0.37 0.17 0.31 0.83 0.08
RSD -0.54 -0.13 0.69 -0.69 0.13 0.29 -0.32 0.36 -0.26 0.26 -0.32P 0.13 0.74 0.04 0.04 0.74 0.45 0.40 0.33 0.50 0.50 0.39
SST -0.02 -0.54 0.58 -0.58 -0.05 0.16 -0.15 0.70 -0.52 0.18 0.12 0.54P 0.97 0.13 0.11 0.11 0.91 0.68 0.70 0.04 0.15 0.65 0.76 0.14
IST -0.15 0.03 0.73 -0.73 0.13 -0.08 -0.11 0.19 -0.41 0.04 0.22 0.90 0.49P 0.69 0.94 0.02 0.02 0.75 0.84 0.78 0.62 0.28 0.92 0.56 0.00 0.18TAN 0.18 -0.30 -0.01 0.01 -0.49 -0.34 -0.22 -0.42 -0.13 -0.50 -0.13 -0.16 -0.21 -0.05
P 0.65 0.43 0.98 0.98 0.18 0.37 0.56 0.26 0.74 0.17 0.74 0.67 0.60 0.90
PS 0.43 -0.32 -0.30 0.30 -0.70 0.41 0.57 -0.56 0.17 -0.80 0.88 -0.22 -0.07 -0.04 -0.04P 0.25 0.40 0.43 0.43 0.04 0.27 0.11 0.11 0.67 0.01 0.00 0.56 0.85 0.92 0.93
SA -0.21 -0.09 0.55 -0.55 0.16 0.07 0.04 0.43 -0.48 0.19 -0.25 0.84 0.53 0.90 -0.16 -0.13
P 0.58 0.82 0.12 0.12 0.67 0.84 0.92 0.25 0.19 0.62 0.52 0.01 0.14 0.00 0.68 0.75PPG -0.19 -0.05 0.49 -0.49 0.17 0.10 0.06 0.39 -0.47 0.15 0.25 0.81 0.95 0.85 -0.21 -0.08 0.99P 0.63 0.89 0.18 0..18 0.66 0.80 0.88 0.30 0.20 0.70 0.51 0.01 0.06 0.00 0.59 0.84 0.00RD 0.23 0.64 -0.69 0.69 0.30 0.58 0.51 -0.34 0.40 -0.04 0.06 -0.54 -0.65 -0.44 -0.40 0.25 -0.40 -0.31
P 0.55 0.06 0.03 0.03 0.42 0.10 0.16 0.37 0.29 0.92 0.87 0.14 0.05 0.24 0.28 0.52 0.29 0.42
Bold indicates a significant correlation (P<0.05); P= significance value; ST= starch; CEL= cellulose, HE= hard endosperm; SE= soft endosperm; ADF= aciddetergent fiber; NDF= neutral detergent fiber; HEM= hemicellulose; LIG= lignin; DM= dry matter; TN= total nitrogen; TGW= thousand-grain weight; RSD= predictedruminal starch digestion; SST= soluble starch; IST= insoluble starch; TAN= tannins; PS= particle size (geometric mean diameter); SA= surface area; PPG=particles per gram; RD= relative density.
Mariana Villarreal-Silva, et al. / Rev Mex Cienc Pecu 2015;6(3):243-261
253
medidas en los híbridos se muestran en elCuadro 5. Las características que obtuvieronuna mayor intensidad de correlación simple(P<0.05) fueron, para las físicas: 1) TP con N(r= -0.80) y con FDA (r= -0.70); 2) PGM conFDA (r= -0.67) y con TP (r= 0.88); 3) PPGcon DRUM (r= 0.81); 4) DR con END-DU (r=0.69) con END-BL (r= -0.69) y con ALM-SOL(r= 0.70) y 5) SA con ALM-INSOL (r= 0.85)con ALM-SOL (r= 0.70) y con DRUM (r=0.84), mientras que las relaciones para lascaracterísticas químicas fueron: 1) N con LIG(r= 0.66) y con FDA (r= 0.74); 2) FDN conHEMICEL (r= 0.97); 3) FDA con CEL (r=0.75); 4) LIG con ALM-SOL (r= 0.70). Larelación de endospermos blando y duro con lafracción de almidón insoluble fue de 0.73 y -0.73, respectivamente. Se detectó una altarelación (r= 0.90) de la DRUM y ALM-INSOL,mientras que la relación de endospermos blandoy duro con la DRUM fue de 0.69.
Ecuaciones de predicción
Las gráficas de las relaciones detectadas enalgunas caracterí sticas fis icoquímicas
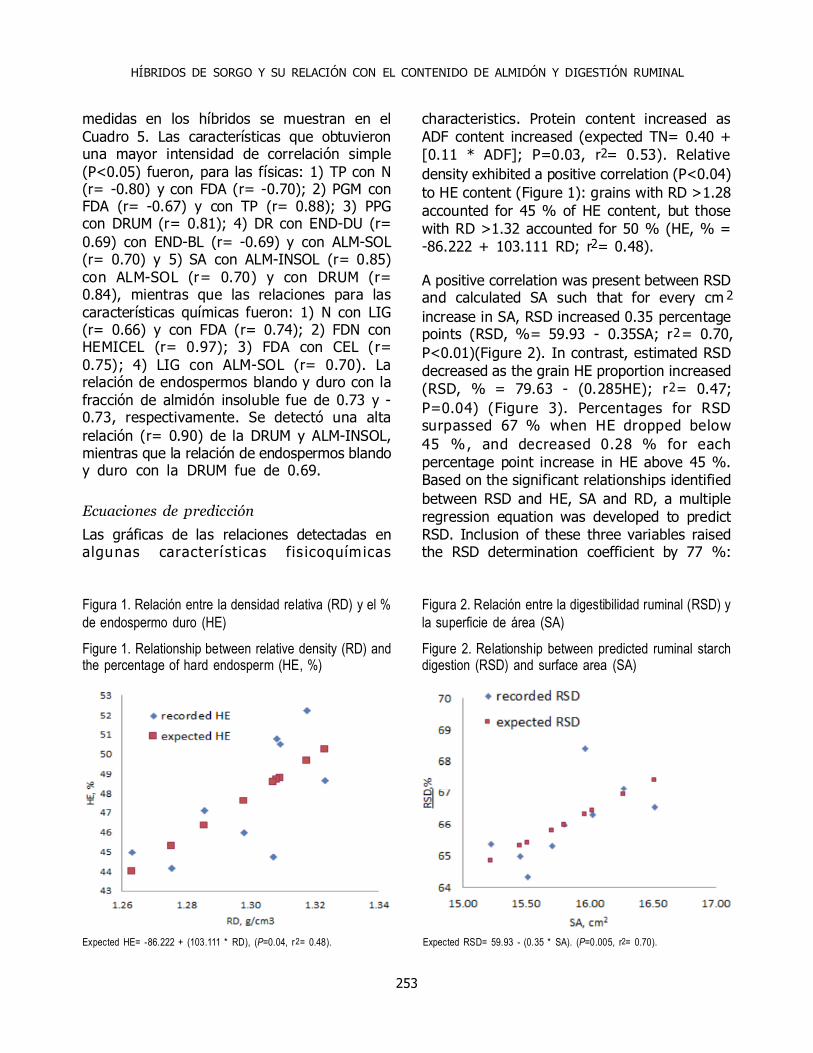
characteristics. Protein content increased asADF content increased (expected TN= 0.40 +[0.11 * ADF]; P=0.03, r2= 0.53). Relativedensity exhibited a positive correlation (P<0.04)to HE content (Figure 1): grains with RD >1.28accounted for 45 % of HE content, but thosewith RD >1.32 accounted for 50 % (HE, % =-86.222 + 103.111 RD; r2= 0.48).
A positive correlation was present between RSDand calculated SA such that for every cm 2
increase in SA, RSD increased 0.35 percentagepoints (RSD, %= 59.93 - 0.35SA; r2= 0.70,P<0.01)(Figure 2). In contrast, estimated RSDdecreased as the grain HE proportion increased(RSD, % = 79.63 - (0.285HE); r2= 0.47;P=0.04) (Figure 3). Percentages for RSDsurpassed 67 % when HE dropped below45 %, and decreased 0.28 % for eachpercentage point increase in HE above 45 %.Based on the significant relationships identifiedbetween RSD and HE, SA and RD, a multipleregression equation was developed to predictRSD. Inclusion of these three variables raisedthe RSD determination coefficient by 77 %:
Figura 1. Relación entre la densidad relativa (RD) y el %de endospermo duro (HE)
Figure 1. Relationship between relative density (RD) andthe percentage of hard endosperm (HE, %)
Figura 2. Relación entre la digestibilidad ruminal (RSD) yla superficie de área (SA)
Figure 2. Relationship between predicted ruminal starchdigestion (RSD) and surface area (SA)
Expected HE= -86.222 + (103.111 * RD), (P=0.04, r2= 0.48). Expected RSD= 59.93 - (0.35 * SA). (P=0.005, r2= 0.70).
HÍBRIDOS DE SORGO Y SU RELACIÓN CON EL CONTENIDO DE ALMIDÓN Y DIGESTIÓN RUMINAL
254
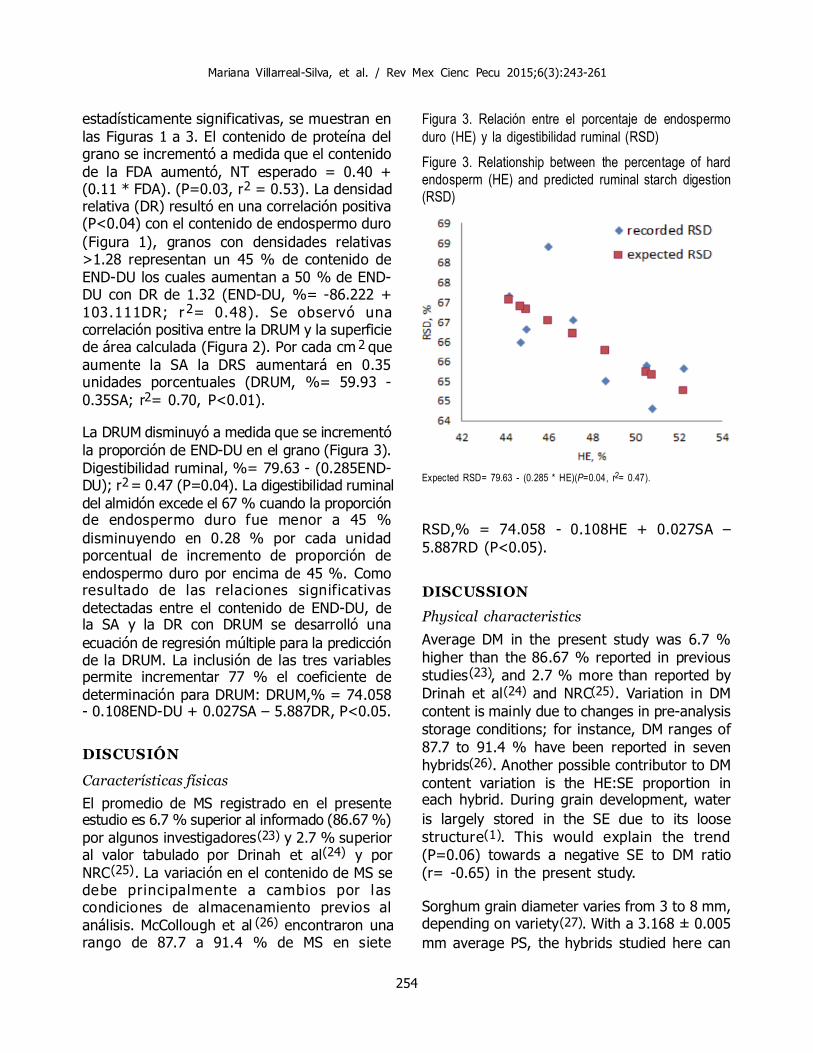
estadísticamente significativas, se muestran enlas Figuras 1 a 3. El contenido de proteína delgrano se incrementó a medida que el contenidode la FDA aumentó, NT esperado = 0.40 +(0.11 * FDA). (P=0.03, r2 = 0.53). La densidadrelativa (DR) resultó en una correlación positiva(P<0.04) con el contenido de endospermo duro(Figura 1), granos con densidades relativas>1.28 representan un 45 % de contenido deEND-DU los cuales aumentan a 50 % de END-DU con DR de 1.32 (END-DU, %= -86.222 +103.111DR; r2= 0.48). Se observó unacorrelación positiva entre la DRUM y la superficiede área calculada (Figura 2). Por cada cm 2 queaumente la SA la DRS aumentará en 0.35unidades porcentuales (DRUM, %= 59.93 -0.35SA; r2= 0.70, P<0.01).
La DRUM disminuyó a medida que se incrementóla proporción de END-DU en el grano (Figura 3).Digestibilidad ruminal, %= 79.63 - (0.285END-DU); r2= 0.47 (P=0.04). La digestibilidad ruminaldel almidón excede el 67 % cuando la proporciónde endospermo duro fue menor a 45 %disminuyendo en 0.28 % por cada unidadporcentual de incremento de proporción deendospermo duro por encima de 45 %. Comoresultado de las relaciones significativasdetectadas entre el contenido de END-DU, dela SA y la DR con DRUM se desarrolló unaecuación de regresión múltiple para la predicciónde la DRUM. La inclusión de las tres variablespermite incrementar 77 % el coeficiente dedeterminación para DRUM: DRUM,% = 74.058- 0.108END-DU + 0.027SA – 5.887DR, P<0.05.
DISCUSIÓN
Características físicas
El promedio de MS registrado en el presenteestudio es 6.7 % superior al informado (86.67 %)por algunos investigadores(23) y 2.7 % superioral valor tabulado por Drinah et al(24) y porNRC(25). La variación en el contenido de MS sedebe principalmente a cambios por lascondiciones de almacenamiento previos alanálisis. McCollough et al (26) encontraron unarango de 87.7 a 91.4 % de MS en siete
RSD,% = 74.058 - 0.108HE + 0.027SA –5.887RD (P<0.05).
DISCUSSION
Physical characteristics
Average DM in the present study was 6.7 %higher than the 86.67 % reported in previousstudies(23), and 2.7 % more than reported byDrinah et al(24) and NRC(25). Variation in DMcontent is mainly due to changes in pre-analysisstorage conditions; for instance, DM ranges of87.7 to 91.4 % have been reported in sevenhybrids(26). Another possible contributor to DMcontent variation is the HE:SE proportion ineach hybrid. During grain development, wateris largely stored in the SE due to its loosestructure(1). This would explain the trend(P=0.06) towards a negative SE to DM ratio(r= -0.65) in the present study.
Sorghum grain diameter varies from 3 to 8 mm,depending on variety(27). With a 3.168 ± 0.005mm average PS, the hybrids studied here can
Figura 3. Relación entre el porcentaje de endospermoduro (HE) y la digestibilidad ruminal (RSD)Figure 3. Relationship between the percentage of hardendosperm (HE) and predicted ruminal starch digestion(RSD)
Expected RSD= 79.63 - (0.285 * HE)(P=0.04, r2= 0.47).
Mariana Villarreal-Silva, et al. / Rev Mex Cienc Pecu 2015;6(3):243-261

255
híbridos evaluados. Otra posible causa quecontribuye a la variación en el contenido de laMS es la proporción de END-DU:END-BL quepresente cada híbrido. Durante el desarrollo delgrano, el agua se moviliza y almacenamayormente en el END-BL debido a suestructura más laxa(1) . Lo anterior puedeexplicar la tendencia (P=0.06) a la relaciónnegativa (r= -0.65) observada para laproporción de END-BL con MS (r= -0.65)encontrada en este estudio. Dependiendo dela variedad, el diámetro del grano de sorgooscila de 3 a 8 mm (27); por lo anterior, loshíbridos utilizados en este trabajo son de calibrepequeño, ya que el valor TP promedio obtenidofue de 3.168 ± 0.005 mm. La prueba de TPes una herramienta útil para conocer el diámetroy grado de molienda en las partículas de harinao del grano rolado(28). Para el grano entero,es mucho menos frecuente el uso de estaprueba, por esto, los datos presentados eneste trabajo pueden ser muy útiles como unanueva referencia sobre esta determinación. ElTP tuvo correlaciones significativas (P<0.04)con el contenido de N, con la FAD y con elPMG, lo que indica que la determinación del TPen grano entero puede utilizarse como unelemento adicional para valorar al grano desorgo. Adicionalmente, el cálculo de la SA,cálculo derivado del TP, demostró ser útil parala predicción de la DRUM (r= 0.84). El valorpromedio observado para PMG fue 21.1 %menor al valor promedio informado en otrotrabajo (29) pero similar a los valores de 20a 30 g reportados por Magness et al(30). Estosinvestigadores determinaron PMG pesando 100granos y multiplicando el resultado por 10. Encambio, tal como lo marca la técnica del RiceKnowledge Bank (31), para el presente estudiose contaron y pesaron 1,000 granos al azar.Físicamente, la medición del PMG es una medidarelativa del tamaño del grano, como resultadofue la alta correlación determinada en el presentetrabajo entre TP y el PMG (r= 0.88) por loque la ecuación de regresión: TP, µm= 2438.07+ (29.65PMG) permite establecer los valoresde TP promedio, y puede servir de referencia
be considered to have small grains. Particle size(PS) is a useful tool for understanding diameterand degree of grind in meal particles or rolledgrain(28) . Rarely has this test been applied towhole grains, meaning the present data couldbe used to create a new reference for sorghumwhole grain PS. Significant correlations (P<0.04)were observed between PS and TN, ADF andTGW; in whole sorghum grain, this parametercan therefore be used as an additionalevaluation element. In addition, calculation ofSA, which is derived from PS, was shown tobe useful in predicting RSD (r= 0.84).
In the present study, average TGW was 21.1% less than reported in one previous study(29),but similar to the 20 to 30 g reported inanother (30). Discrepancies between studies maybe due to slight differences in technique; forinstance, in the above studies 100 grains wereweighed out and this figure multiplied by ten,but in the present study 1,000 grains wererandomly counted out and weighed(31).Thousand-grain weight (TGW) is a relativemeasure of grain size, which is why thecorrelation between PS and TGW was high (r=0.88) in the present results. Moreover, for thisreason the regression equation (PS, µm=2438.07 + [29.65TGW]) allows for calculationof average PS, and can function as a referencein calculating whole grain sorghum size andweight.
Average RD (1.299 g/cm3 ± 0.02) in the presentstudy was 6.2 to 3.7 % lower than reported insome previous studies(29,32) . It did fall withinthe 1.14 to 1.37 g/cm3 range reported byChandrashekar and Kirleis(33) , although theyused dehulled sorghum grain and did notdescribe the technique used to measure RD.Differences in RD measurement techniques andthe substances used in them (e.g. nitrogen,xylene, distilled water) make valid comparisonsdifficult with other published data. Use of distilledwater tends to underestimate RD because thedegree of grain humidification depends on liquidsurface tension and other reactions that canoccur during contact between the grain and
HÍBRIDOS DE SORGO Y SU RELACIÓN CON EL CONTENIDO DE ALMIDÓN Y DIGESTIÓN RUMINAL
256
para determinaciones del tamaño y peso delgrano entero de sorgo.
El promedio de DR (1.299g/cm3 ± 0.02)observado en el presente estudio es 6.2 y3.7 % inferior a los informados en otrasinvestigaciones (29,32), aunque coinciden con elrango de 1.14 a 1.37g/cm3 indicado porChandrashekar y Kirleis(33); sin embargo, estosautores utilizaron sorgo descascarillado y nomencionan la técnica que usaron para medir ladensidad relativa. Las diferencias entre lastécnicas empleadas para medir DR, así comolas diferencias entre las sustancias utilizadas(nitrógeno, xileno, agua destilada), hacen difícilestablecer una comparación válida con el restode los valores publicados. Podemos suponerque la determinación de la DR con agua destiladatiende a subestimar el valor de densidad, debidoa que la humectación del grano depende de latensión superficial del l íquido y de otrasinteracciones que pudieran ocurrir durante elcontacto del grano con el líquido, como es laformación de burbujas o la disolución de algúncomponente de la cascarilla que no fueronmedidos ni controlados. La densidad es útilpara determinar la proporción de END-DU enel grano de sorgo, y aunque los valores decorrelación encontrados aquí son inferiores alos informados por otros(34), tuvieron un valorconsistente de correlación que permitió estableceruna ecuación de predicción de END-DU.Contrario a lo informado(29), no se detectócorrelación entre la DR y el contenido de N.La concentración de N en grano de sorgopublicada, se encuentra en el rango de 1.15a 2.64 %(25,33,35).
En concordancia con lo expresado por Buffo etal(29), se observó una tendencia (P=0.06) decorrelación negativa (r= -0.54) entre elporcentaje de almidón y el contenido de N, yaque un menor porcentaje de proteína puedeser resultado de mayores condiciones favorablesen el cultivo que permitan un mayoralmacenamiento de almidón en el grano durantesu desarrollo.
the liquid; examples include bubble formationand dissolution of a component in the hullthat was not measured or controlled. Relativedensity (RD) is useful in determining the HEproportion in a sorghum grain, although thecorrelation values observed here are lower thanreported elsewhere(34) . However, the value inthe present data was consistent, allowing useof a predictive equation for HE. In contrast toprevious studies(29), no correlation between RDand TN content was observed here. Publishedsorghum grain N contents range from 1.15 to2.64 %(25,33,35).
The tendency (P=0.06) towards a negativecorrelation (r= -0.54) between ST percentageand TN content coincides with Buffo et al(29).A lower protein percentage can be the result ofmore favorable cultivation conditions, whichallow greater starch storage in the grain duringdevelopment.
Quantification of fibrous fraction components(NDF, ADF, hemicellulose, cellulose and lignin)is uncommon in cereals because their fibercontent is quite low. For instance, when sorghumgrain is used as an energy source in ruminantfeeds, fiber requirements must be covered byother dietary components. The present valuesfor fiber components are very similar to thosereported elsewhere(25,36). Most (82.3 %) of thefiber fraction is represented by the pericarp,most of which is considered insoluble. Ligninaccounts for 20 % of the cell wall in sorghumgrain(27) , suggesting that evaluation of the fiberfraction could help in determining the amountof pericarp in this organ. Neutral detergent fiber(NDF) and ADF are measurements done bychemical and physical methods, and HEMI andCEL are estimations derived from these twomeasurements. High correlations between themcan therefore to be expected; in fact, thecorrelation was r= 0.97 between NDF and HEMI,and r= 0.75 between ADF and CEL. The highcorrelations between TN and ADF, and TN andLIG were unexpected since 80 % of grain Ncontent is in the endosperm and only 4 % is inthe fibrous structure(37).
Mariana Villarreal-Silva, et al. / Rev Mex Cienc Pecu 2015;6(3):243-261
257
La determinación de los componentes de lafracción fibrosa (FDN, FDA, hemicelulosa,celulosa y lignina) no es muy común en loscereales debido a que su contenido de fibra esmuy bajo, y a que el grano de sorgo que esutilizado en las dietas de rumiantes es comofuente de energía, y el aporte de fibra escubierto por el resto de los componentes dela misma. Aún así, los valores determinados enel presente estudio son muy similares a losvalores informados previamente (25,36) . Lamayor parte de la fracción fibra se encuentraen el pericarpio (82.3 %) y la mayoría de éstapuede considerarse fibra insoluble. Considerandoque en el grano de sorgo la lignina constituyeel 20 % de la pared celular (27); entonces, laevaluación de las fracciones de la fibra podríaser útil para determinar la cantidad de pericarpiopresente en el grano. En virtud de que FDNy FDA son determinaciones (a través deprocesos químicos y físicos) y HEMICEL y CELson estimaciones derivadas de ambas determi-naciones; es de esperarse correlaciones altasentre ellas mismas que fueron observadas tantopara FDN y HEMICEL (r= 0.97) como paraFDA y CEL (r= 0.75). La relación detectadapara FDA (r= 0.74, P=0.04) y para LIG (r=0.66) con el contenido total de N es sorpresiva,ya que el 80 % del total del nitrógeno (PC) delgrano se encuentra en el endospermo y sóloel 4 % en las estructuras fibrosas(37).
El sorgo varía ampliamente en la composicióny contenido de compuestos fenólicos. Basadosen el contenido de taninos extraíbles el granode sorgo se clasifica, de menor a mayorcontenido de taninos, como tipo I, II y III(15).En los últimos años se han dirigido los esfuerzosa la producción de variedades e híbridos libresde taninos, ya que estos reducen la disponibilidado digestibilidad de los nutrimentos del sorgoreduciendo su valor alimenticio; de hecho, enla actualidad el 99 % de sorgos producidos enlos Estados Unidos son libres de taninos(38).Por lo anterior, no es sorpresivo que lasvariedades aquí estudiadas resultaranprácticamente libres de estos compuestos.
Sorghum varies widely in phenolic compoundscontent and composition. Based on extractabletannins content (lesser to greater), sorghumgrain is classified as type I, II or III(15). Recentlydeveloped sorghum varieties and hybrids aretannin-free because this compound reducesnutrient availability or digestibility, therebyreducing dietary value. In the United States,99 % of the sorghum produced currently istannin-free (38). It is therefore no surprise thatall the studied hybrids had essentially nodetectable tannins.
In the nine analyzed sorghum hybrids, averagestarch (ST) content was 70 %(1), which is withinthe 61.9 to 83 % range reportedpreviously(39,40) . Variation in starch content islargely attributable to differences betweenhybrids, fertilization practices and quantificationtechniques. Starch content in the present studydid not significantly correlate to any of theother measured character i st ics , whichcoincided with a previous study(41). Thisprevents any precise, indirect estimation ofstarch content via these other compounds. Invivo ruminal starch digestion of ground sorghumstarch is approximately 65.9 % (40,42,43). In tworeviews covering over eighty studies that usedmore than 65 % sorghum starch in the diet,in vivo starch ruminal digestibility averaged66.87 %(44,45). In another study, ruminaldigestibility of ground sorghum was 60 ±12 %(46), and was found to vary depending ingenotype, hybrid and cultivation conditions. Theaverage (RSD) estimated in the present study(66.04 ± 1.20 %) was very similar to thesefigures. This parameter was estimated basedon the SST and IST fractions in the nine studiedhybrids(17). Considering that the coefficient is74 % in this technique, the in vivo ruminaldigestion estimated here is near expected levelsfor the studied hybrids.
Quantitative measurement of sorghum grain HEand SE using the technique of Kirleis et al(18)
is effective, but requires extensive experience,precision and manual dexterity. The modificationsmade to this technique in the present study
HÍBRIDOS DE SORGO Y SU RELACIÓN CON EL CONTENIDO DE ALMIDÓN Y DIGESTIÓN RUMINAL
258
El contenido de almidón en el sorgo promedia70 %(1), aunque está en el rango de 61.9 a 83%(39,40), esta variación es principalmenteatribuible a la diferencia genética entre híbridos,a las prácticas de fertilización y a las técnicasutilizadas en la determinación de almidón en elgrano. En concordancia con lo publicado (41), elcontenido de ALM no presentó ningunacorrelación significativa con el resto de lascaracterísticas medidas, por tanto, no es posibleestimar con precisión la cantidad de almidóncontenido en el grano por medio dedeterminaciones indirectas a través del restode los compuestos. Reportes previos indicanque la digestibilidad ruminal del almidón desorgo molido in vivo es aproximadamente del65.9 % (40,42,43). En revisiones realizadas dondese incluyen más de 80 experimentos y seutilizó más del 65 % de sorgo molido en ladieta, la digestibilidad ruminal del almidón invivo promedia 66.87 %(44,45). Ambruster (46)
indica que la digestiblidad ruminal del sorgomolido es de 60 ± 12 %, y que esta variaciónobedece al genotipo, al tipo de híbrido y a lascondiciones agronómicas donde se desarrolló elgrano. Todo lo anterior concuerda estrechamentecon el valor promedio estimado de digestibilidadruminal (66.04 ± 1.20 %) obtenido en elpresente estudio util izando la técnica deRodríguez et al(17) a través de la determinaciónde las fracciones soluble e insoluble de almidón.Considerando que el coeficiente de determinaciónde la técnica de Rodríguez es de 74 %,entonces, la estimación de la digestibilidadruminal obtenida en la presente investigaciónes muy cercana a lo esperado in vivo para loshíbridos estudiados.
Aunque la técnica de Kirleis et al(18) es muyútil para medir cuantitativamente las áreas deEND-DU y END-BL de grano de sorgo, su usotiene varias limitantes, ya que se requiere demucha experiencia, precisión y habilidad manual.La modificaciones realizadas al utilizar el cortecon bisturí para la exposición del centro delgermen y endospermo, al uso de microfotografíasdigitales y la medición de áreas a través delsoftware Adobe Photoshop Elements hace a
make it much more practical and rapid sincethe digital images can be modified at any time,any modifications can be reversed, marking ofthe area to be measured does not require acontinuous movement, and the equipment andsoftware are widely used and reasonably priced.
A sorghum grain consists of three morphologicalparts: pericarp, germ, and endosperm. Theproportions of basic starch structures (amyloseand amylopectin) in the hard (HE) and softendosperm (SE) affect starch digestibility(47).Depending on genotype, HE proportions canvary from 30 to 80 % of the total endosperm.Based on Waterman et al (48), grains areclassified into three classes of hardness: hard(~80 %), intermediate (~50 %), and soft(~30 %). The nine studied hybrids had anaverage HE:SE ratio of 47:53, classifying themas of intermediate hardness; only four of thenine exhibited differences (P<0.05). In corngrain, the HE:SE ratio has been proposed asone of the most important parameters limitingstarch digestion in ruminants(10). In an in vivodigestion study using different corn hybrids, ahigh correlation was observed between theproportion of HE and predicted ruminal starchdigestion (RSD): RSD = 78.91 -18.13 HE; R2=0.90. For sorghum, very little data is availableon the effect of endosperm proportions inruminal starch digestion(11) .
Starch molecular constitution in sorghum clearlyaffects starch digestibility, but so do the typeof starch granule encapsulation and thepercentage and type of sorghum proteins(kafirins). Accurate prediction of starchdigestibility in sorghum apparently requires useof more factors. For instance, when thepredictive equation was modified to includeSA correlated significantly to IST (r= 0.85)and SST (r= 0.70), and RD significantlycorrelated to HE (r= 0.69) and SE (r= -0.69),its determination coefficient increased to77 %: RSD,%= 74.058 - 0 .108HE +0.027SA – 5.887RD.
Mariana Villarreal-Silva, et al. / Rev Mex Cienc Pecu 2015;6(3):243-261

259
esta prueba más práctica y rápida, debido aque las fotografías pueden ser modificadas encualquier momento, se pueden revertir lasmodificaciones hechas a las mismas, ladelimitación de las áreas no requiere de untrazo o movimiento de la mano continuo através de todo el perímetro del área a medir,y los equipos y software utilizado no son dealto costo y son de uso común.
El grano de sorgo está compuesto por trespartes morfológicas: pericarpio, germen yendospermo. La proporción de las estructurasbásicas del almidón (amilosa y amilopectina) ydel endospermo vítreo o duro (END-DU) yblando o harinoso (END-BL) afectan ladigestibilidad del almidón(47). Dependiendo delgenotipo, la proporción de END-DU va desdeun 30 a un 80 % del total del endospermo, yla clasificación de dureza de acuerdo aWatterson et al(48) es: duro (~80 %), intermedio(~50 %) y blando (~30 %). Por lo anterior,de acuerdo a la proporción de END-DU: END-BL de 47:53, los híbridos aquí estudiados sepueden considerar como “intermedios”, y sólo4 de los 9 híbridos mostraron diferencia(P<0.05). Recientemente se ha sugerido quela proporción de endospermo duro:blando esuno de los factores más importantes que limitala digestión del almidón en el grano de maíz enrumiantes(10). En un experimento de digestiónin vivo en el cual utilizaron distintos híbridos demaíz(49), detectaron una alta correlación entrela proporción de endospermo duro y ladigestibilidad del almidón (DRUM): DRUM=78.91 -18.13 END-DU; R2=0.90. Sin embargoexiste información limitada sobre las relacionesde la proporción de endospermos con ladigestibilidad ruminal del almidón en el sorgo(11).No sólo la constitución molecular del almidónpor sí misma afecta la digestibilidad del almidón,también el tipo de encapsulamiento de gránulosde almidón y el porcentaje y tipo de proteínasdel sorgo (kafirinas) presentes influyen en estarelación. Aparentemente, para el sorgo debenconsiderarse el incluir más factores paraincrementar la fuerza de predicción. El incluir ala superficie de área (SA) relacionada
significativamente con ALM-INSOL (r= 0.85)con ALM-SOL (r= 0.70) y a la densidad relativa(DR) relacionada significativamente con END-DU (r= 0.69) con END-BL (r= -0.69) en laecuación se incrementó el coeficiente dedeterminación a 77 %: DRUM,%= 74.058 -0.108END-DU + 0.027SA – 5.887DR.
CONCLUSIONES E IMPLICACIONES
Las variables fisicoquímicas determinadas paralas nueve variedades de sorgo se encuentrandentro de los rangos especificados en otrasfuentes de información. De acuerdo a suscaracterísticas principales, las variedades seconsideran de dureza intermedia y libre detaninos. No se detectó ninguna relaciónsignificativa entre las variables físicas o químicas
CONCLUSIONS AND IMPLICATIONS
All the evaluated physicochemical variables forgrains from the nine sorghum hybrids werewithin previously published values. No significantrelationship was identified between the physicalor chemical variables and total grain starchcontent. Indirect quantification of starch contentusing other compounds in the grain is thereforenot possible. Unlike in corn, the hard endospermproportion in sorghum grain is not a goodindicator for measuring ruminal starch digestionfrom the soluble and insoluble starch fractions.However, adding relative density and surfacearea to the equation significantly raises itspredictive power.
ACKNOWLEDGEMENTS
Financial support for the research reported herewas provided by the Dirección General deAsuntos del Personal Académico, UNAM (Proj.No. PAPIIT IN206006).
End of english version
HÍBRIDOS DE SORGO Y SU RELACIÓN CON EL CONTENIDO DE ALMIDÓN Y DIGESTIÓN RUMINAL
260
con el contenido total de almidón en el grano,por tanto, no es posible estimar con precisiónla cantidad de almidón contenido en el granopor medio de determinaciones indirectas através del resto de los compuestos. Contrarioal maíz, la proporción de endospermo duro enel grano de sorgo no es un buen indicadorpara determinar la digestibilidad ruminal delalmidón a través de las fracciones de almidónsoluble e insoluble; sin embargo, cuando seañaden la densidad relativa y superficie deárea a la ecuación, ésta incrementa su poderde predicción en forma significativa.
AGRADECIMIENTOS
Se agradece el apoyo financiero para larealización del trabajo a través del proyectoPAPIIT IN206006 de la Dirección General delPersonal Académico de la UNAM.
LITERATURA CITADA
1. Huntington GB. Starch utilization by ruminants: From basicsto the bunk. J Anim Sci 1997;(75):852-67.
2. Duodu KG, Taylor JRN, Belton PS, Hamaker BR. Factorsaffecting sorghum protein d igestibi li ty. J Cereal Sci2003;(38):117-131.
3. Kumar AA, Reddy BV, Sharma HC, Hash CH, Rao PS,Ramaiah B, Reddy PS. Recent advances in sorghum geneticenhancement research at ICRISAT. Am J Plant Sci2011;(2):589-600.
4. Fernholz M. Evaluation of four sorghum hybrids throughthe development of sorghum flour tortillas. [MSc Thesis].Manhattan Kansas, USA: Kansas State University; 2008.
5. Streeter MN, Wagner DG, Hibberd CA, Owens FN.Comparison of corn with four sorghum grain hybrids: Siteand extent of d igest ion in steers. J Anim Sci1990;(68):3429.
6. Streeter MN, Wagner DG, Owens FN, Hibberd CA. Theeffect of pure and partial yellow endosperm sorghum grainhybrids on site and extent of digestion in beef steers. JAnim Sci 1991;(69):2571.
7. Stock RA. Nutritional benefits of specialty grain hybrids inbeef feedlot diets. J Anim Sci 1999;(82):208-212.
8. Hicks C, Bean SR, Lookhart GL, Pedersen JF, Kofoid KD,Tuinstra MR. Genet ic analysis of kafi r ins and theirphenotypic correlations with feed quality traits, in vitrodigestibility and seed weight in grain sorghum. CerealChem 2001;(78):412-416.
9. Tesso T, Ejeta G, Chandrashekar A, Huang CP, TandjungA, Lewamy M, Axtell JD, Hammaker BR. A novel modifiedendosperm texture in a mutant high-protein digestibility/high-lysine grain sorghum (Sorghum bicolor (L.) Moench).Cereal Chem 2006;(83):194-201.
10. Owens FN, Soderlund S. Corn grain: Assessing nutritionalva lue for l ivestock. Minnesota Catt le Feeders DayPublicat ion. Univ Minnesota. BP-1004. http://ww w.mnbeef.umn.e du/catt le- feeder/2010/BP1004-Owens.pdf. Accessed Aug 8, 2014.
11. Montiel MD, Elizalde JC, Santini F, Giorda L. Característicasfísicas y químicas del grano de sorgo. Relación con ladegradación ruminal en bovinos. Arch Zootec2011;(60):533-541.
12. AOAC. Official methods of analysis. 15th ed. Arlington,VA, USA: Association of Official Analytical Chemists; 1990.
13. Baker S, Herrman T. Evaluating particle size. FeedManufacturing. Kansas State Univ. Agric Exp Sta. CoopExt Service. 2002. http://www.ksre.ksu.edu/bookstore/pubs/mf2051.pdf Accessed Aug 8, 2014.
14. Van Soest PJ, Robertson JB, Lewis BA. Methods for dietaryfiber, neutral fiber and non starch polysaccharides inrelation to animal nutrition. J Dairy Sci 1991;74:3588-3597.
15. Price ML, Van Scoyoc S, Butler LA. Critical evaluation ofthe vanillin for tannin in sorghum grain. J Agric Food Chem1978;(26):1214-1218.
16. Zinn RA. Influence of flake density on the comparativefeeding value of steam-flaked corn for feedlot cattle. JAnim Sci 1990;(68):767-775.
17. Rodríguez S, Calderón JF, Zinn RA. Variation in ruminalstarch digestion due to dry rolling versus steam flakingcorn and sorghum can be reliably predicted based onchanges in starch solubility and 6-H amylase react iveinsoluble starch. Proc. Western Sect. Am Soc Anim Sci2001;(52): 529-530.
18. Kir leis AW, Crosby KD, Housley TL. A method forquant itat ively measur ing vit reous endosperm area insectioned sorghum grain. Cereal Chem 1984;(61):556-558.
19. Knoll T, Hamburg M, Pauliger M, Rys C, Schaefer S, HildtM. Adobe Photoshop Elements. Adobe SystemsIncorporated. © 1989-2001. U.S, patents pending.
20. SAS. SAS/STAT User’s guide. [Computer program] 4th ed.Version 6. Cary NC, USA: SAS Institute Inc. 1990.
21. Cochran WG, Cox GM. Exper imental designs. 2nd ed.Wiley Classics Library. New York, USA: John Wiley & Sons;1992.
22. Statistix for Windows. Versión 8.0, Tallahassee, (Florida)USA. Analytical software [on CD].
23. Yang P, Seib PA. Low-input wet-milling of grain sorghum forreadily accessible starch and animal feed. Cereal Chem1995;(72):498-503.
24. Drinah BG, Banda-Nyirenda, Vohra P, Ingebretson KH.Nutri tional evaluation of some varieties of sorghums(Sorghum bicolor L. Moench). Cereal Chem 1987;(64):413-417.
25. NRC. Nutrient requirements of beef cattle (updated 7th
Rev. Ed.) Washington DC, USA: Natl Acad Press; 2000.
Mariana Villarreal-Silva, et al. / Rev Mex Cienc Pecu 2015;6(3):243-261
261
26. McCollough RL, Riley JG, Drake CL, Roth GM. Feedlotperformance on nine hybrid sorghum grains fed to steerswinter, 1971-1972. Kansas Agric Exp Stat. Bull 557. 1972.
27. Dicko MH, Gruppen H, Traoré AS, Voragen AGJ, Berkel vanWJH. Review. Sorghum grain as human food in Africa:Relevance of content of starch and amylase activities. AfrJ Biotech 2006;(5):384-395.
28. Hales KE, Cole NA, Galyean ML, Leytem AB. Nutrientconcentrations and proportions in particle size fractions ofcorn steam flaked to different bulk densities. Prof Anim Sci2010;(26):511-519.
29. Buffo RA, Weller CL, Parkhurst AM. Relationships amonggrain sorghum quality factors. Cereal Chem 1998;(75):100-104.
30. Magness JR, Markle GM, Compton CC. Food and feedcrops of the United States. [Interregional Research ProjectIR-4.] IR Bul 1, New Jersey Agric Exp Sta New Brunswick.1971.
31. Rice knowledge bank [Edi torial]. 1000 Grain Weight.International Rice Research Insti tute.: http://w ww.knowl edg eban k. i r r i .o rg/ tra in i ng/ fact-s heets/postharvest-management/rice-quality-fact-sheet-category/item/measuring-white-rice-quality-fact-sheet. Accessed Aug8, 2014.
32. McCollough RL, Riley JG, Crake CL, Brent BE. Digestibilityof seven hybrid grain sorghums and two hybrid corns[abstract]. J Anim Sci 1972;(35):270.
33. Chandrashekar A, Kirleis AW. Influence of protein on starchgelatinization in Sorghum. Cereal Chem 1988;(65):457-462.
34. Maxson ED, Fryar WB, Rooney LW, Krishnaprased MN.Mi l ling propert ies of sorghum grain with di f ferentproportions of corneous to floury endosperm. Cereal Chem1971;(48):478-490.
35. Mossé J, Huet JC, Baudet J. The amino acid compositionof whole sorghum grain in relation to its nitrogen content.Cereal Chem 1988;(65):1988.
36. Ramírez E, Anaya AM, Mariscal G. Predicc ión de lacomposic ión química del grano de sorgo medianteespectroscopía de reflectancia cercana al infrarrojo (NIRS).Tec Pecu Mex 2005;(43):1-11.
37. Lochte-Watson, Wel ler CL, Eskr idge KM. Fractionalcomposition of grain sorghum (Sorghum bicolor) after wet-peeling in a centrifugal pump. Biol Sys Engin: Papers and
Publications. 2000. Paper 86. http://digitalcommons.unl.edu/biosysengfacpub/86. Accessed Aug 8, 2014.
38. Awika, JM Rooney LW. Sorghum phytochemicals and theirpotentia l impact on human health. Phytochem2004;(65):1199-1221.
39. Hibberd CA, Wagner DG, Schemm RL, Mitchel l Jr ED,Weibel DE, Hintz RL. Digestibility characteristics of isolatedstarch from sorghum and corn grain. J Anim Sci1982;(55):1490-1497.
40. Souilah R, Djabali D, Belhadi B, Mokrane H, Boudries N,Nadjemi B. In vitro starch digestion in sorghum flour fromAlgerian cultivars. Food Sci 2014;(3):251-259.
41. Hibberd CA, Wagner DG, Schemm RL, Mitchell Jr ED, HintzRL, Weibel DE. Nutritive characteristics of different varietiesof sorghum and corn grain. J Anim Sci 1982;(55):665-672.
42. Hinman DD, Johnson RR. Influence of processing methodson digestion of sorghum starch in high concentrate beefcattle rations. J Anim Sci 1974;(39):417-422.
43. Hinman DD, Johnson RR. Inf luence of degree ofmicronization on the site and extent of sorghum starchdigestion in beef cattle fed high concentrate rations. JAnim Sci 1974;(39):958-963.
44. Salinas J, Álvarez EG, Zinn RA. Influence of tempering onthe feeding value of steam-flaked sorghum for feedlotcattle. Proc Western Sect. Am Soc Anim Sci 1999;(50):325-330.
45. Owens FN, Zinn RA. Corn grain for cattle: Influence ofprocessing on site and extent of digestion. Proc 19th
Annual Southwest Nut & Management Conf. Phoenix AZ.2005;86-112.
46. Ambruster S. Steam-flaking grain for feedlot cattle: Aconsultant’s perspective. Proc Cattle Grain Proces Symp.Oklahoma State Beef Ext. 2006. http://beefextension.com/proceedings/cattle_grains06/06-7.pdf. Accessed Aug 8,2014.
47. Hoseney RC, Davis AB, Herbers LH. Per icarp andendosperm structure of sorghum grain shown by scanningelectron microscopy. Cereal Chem 1974;(51):552-558.
48. Watterson JJ, Shull JM, Kirleis AW. Quantitation of -, -and - kafirins in vitreous and opaque endosperm ofsorghum bicolor. Cereal Chem 1993;(70):452-457.
49. Corona L, Owens FN, Zinn RA. Impact of corn vitreousnessand processing of site and extent of digestion by feedlotcattle. J Anim Sci 2006;(84):3020-3031.
HÍBRIDOS DE SORGO Y SU RELACIÓN CON EL CONTENIDO DE ALMIDÓN Y DIGESTIÓN RUMINAL