transparencias técnicas de organización industrial ... 4 propuesta soluciones web.pdf ·...
TRANSCRIPT
Transparencias Técnicas de Organización
Industrial: Metodología para la selección y
gestión de proyectos. Fase IV.
Rubén Rami Rivas
D-13/2008
Publica:
Universitat Politècnica de Catalunya
www.upc.edu
Edita:
Cátedra Nissan-UPC
www.nissanchair.com
Departamento de Organización de Empresas
Universidad Politécnica de Cataluña
TOI -10
Departament
d’Organització
d’EmpresesDOE
TOI
Fase 4. Propuesta de
soluciones
TOI -20DOE www.nissanchair.com
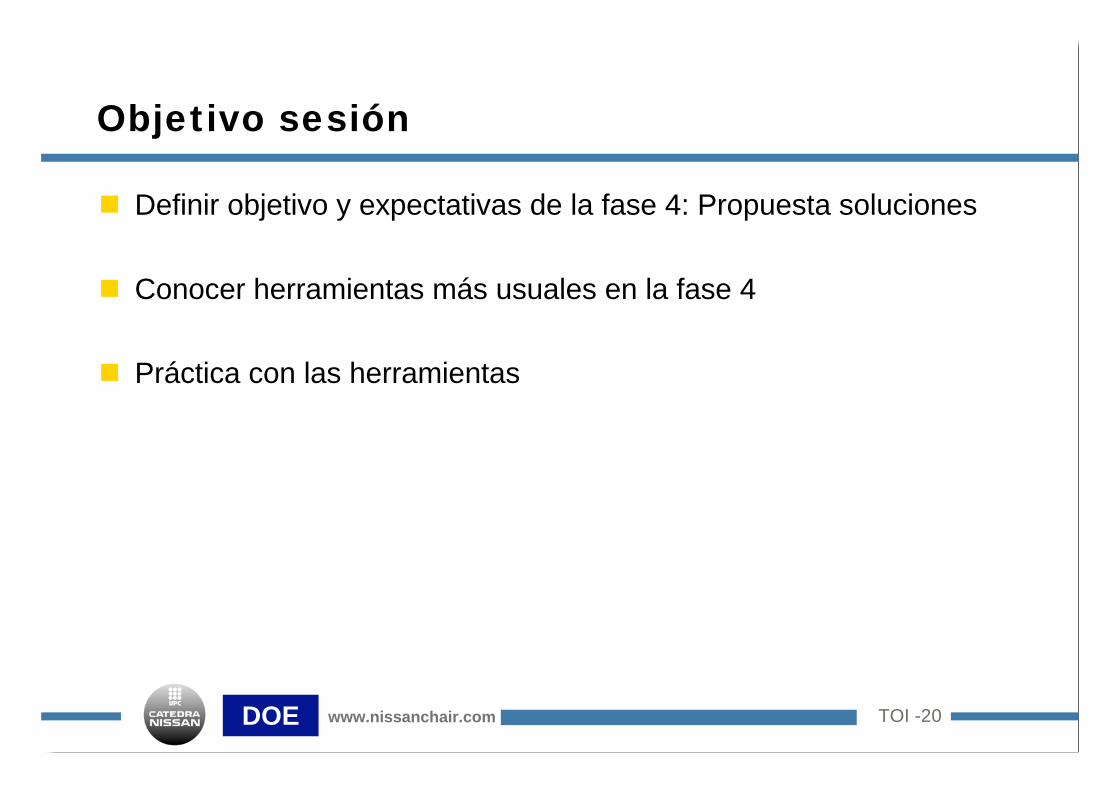
Objetivo sesión
Definir objetivo y expectativas de la fase 4: Propuesta soluciones
Conocer herramientas más usuales en la fase 4
Práctica con las herramientas
TOI -30DOE www.nissanchair.com
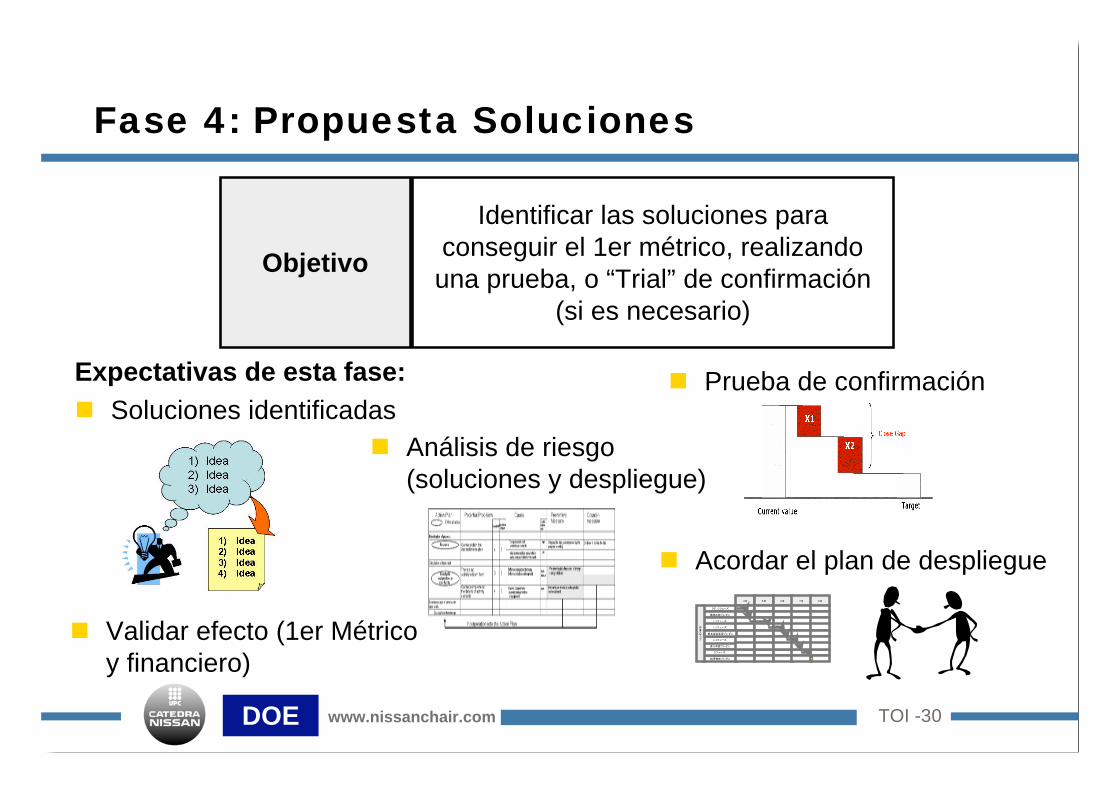
Objetivo
Identificar las soluciones para
conseguir el 1er métrico, realizando
una prueba, o “Trial” de confirmación
(si es necesario)
Fase 4: Propuesta Soluciones
Expectativas de esta fase:
Soluciones identificadasPrueba de confirmación
Análisis de riesgo
(soluciones y despliegue)
Validar efecto (1er Métrico
y financiero)
Acordar el plan de despliegue
DE
I-1
I-2
I-3
D
4 5 6 7 8
TOI -40DOE www.nissanchair.com
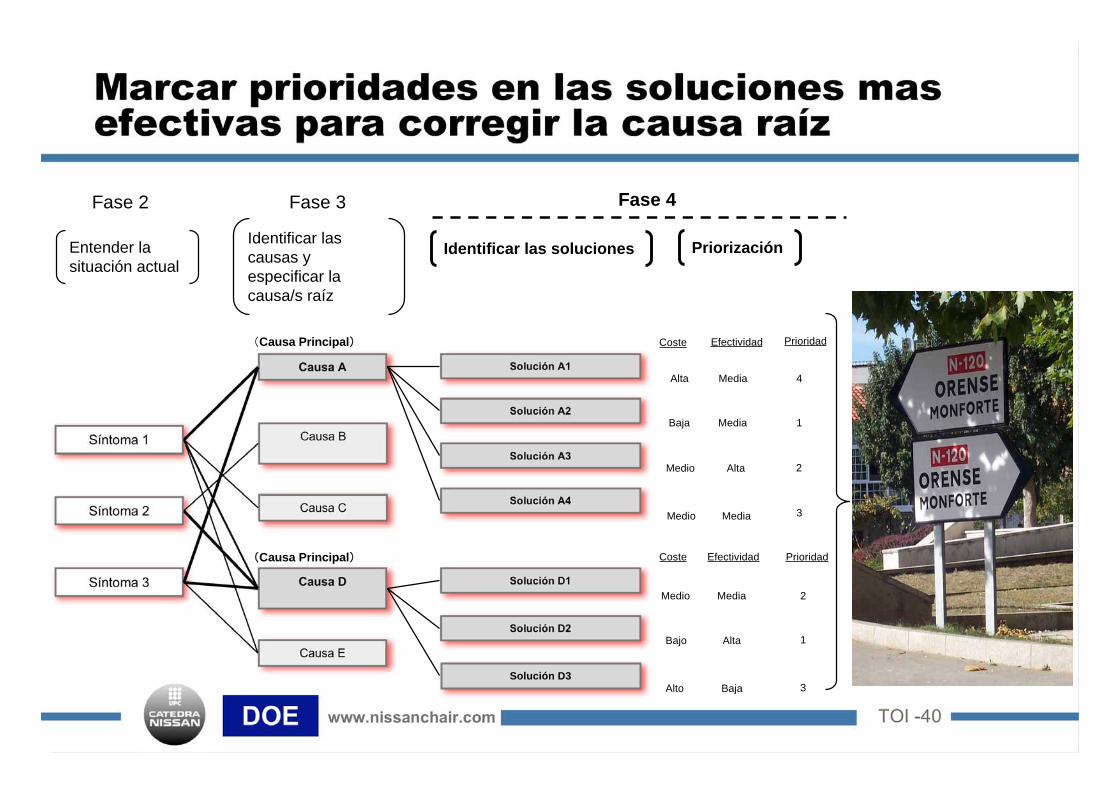
Marcar prioridades en las soluciones masefectivas para corregir la causa raíz
Síntoma 1
Síntoma 2
Síntoma 3
Causa A
Causa B
Causa C
Causa D
Causa E
Solución A1
Solución A2
Solución A3
Solución A4
Solución D1
Solución D2
Solución D3
Fase 2 Fase 3
Identificar las
causas y
especificar la
causa/s raíz
Causa Principal
Causa Principal
Fase 4
Identificar las soluciones Priorización
Coste Efectividad
Alta Media
Baja Media
Medio Alta
Medio Media
Coste Efectividad
Medio Media
Bajo Alta
Alto Baja
Prioridad
4
1
2
3
Prioridad
2
1
3
Entender la
situación actual
TOI -50DOE www.nissanchair.com
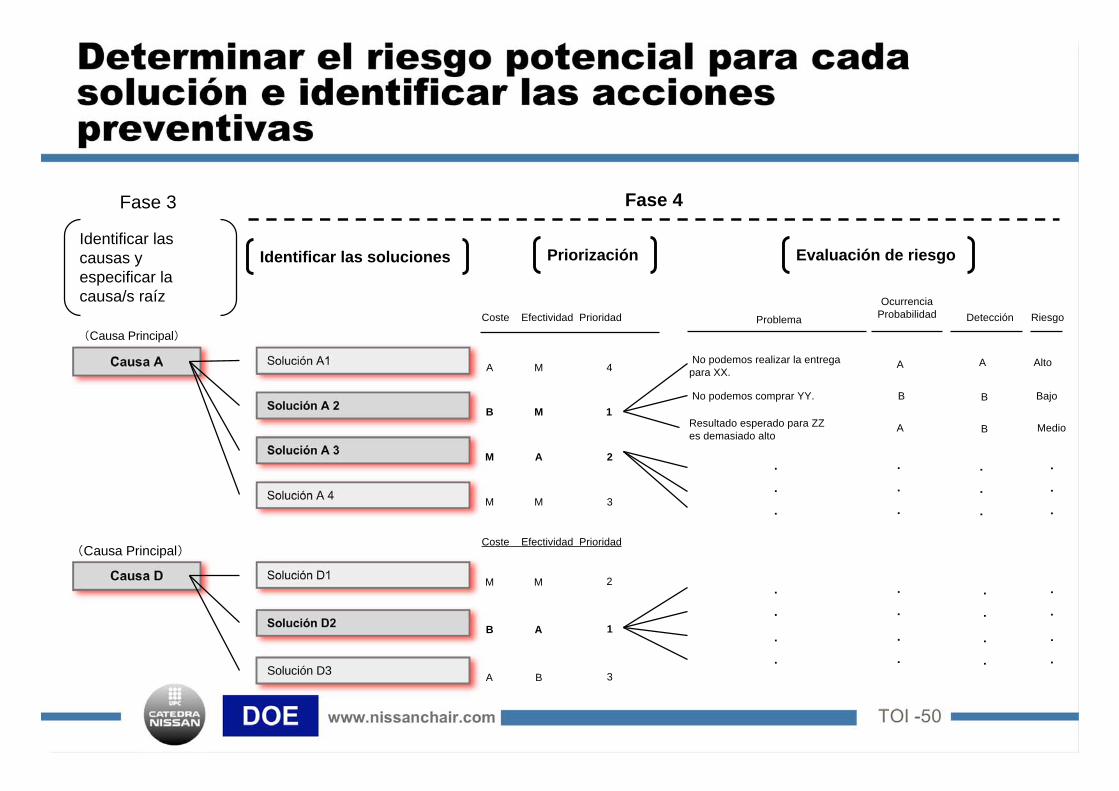
Determinar el riesgo potencial para cadasolución e identificar las accionespreventivas
Causa A
Causa D
Solución A1
Solución A 2
Solución A 3
Solución A 4
Solución D1
Solución D2
Solución D3
Fase 3
Causa Principal
Causa Principal
Fase 4
Coste Efectividad Prioridad
A M
B M
M A
M M
Coste Efectividad Prioridad
M M
B A
A B
4
1
2
3
2
1
3
No podemos realizar la entrega
para XX.
No podemos comprar YY.
Resultado esperado para ZZ
es demasiado alto
Riesgo
Alto
Bajo
Medio
Problema
Ocurrencia
Probabilidad
A
B
A
Detección
A
B
B
Evaluación de riesgo
Identificar las
causas y
especificar la
causa/s raíz
Identificar las soluciones Priorización
TOI -60DOE www.nissanchair.com
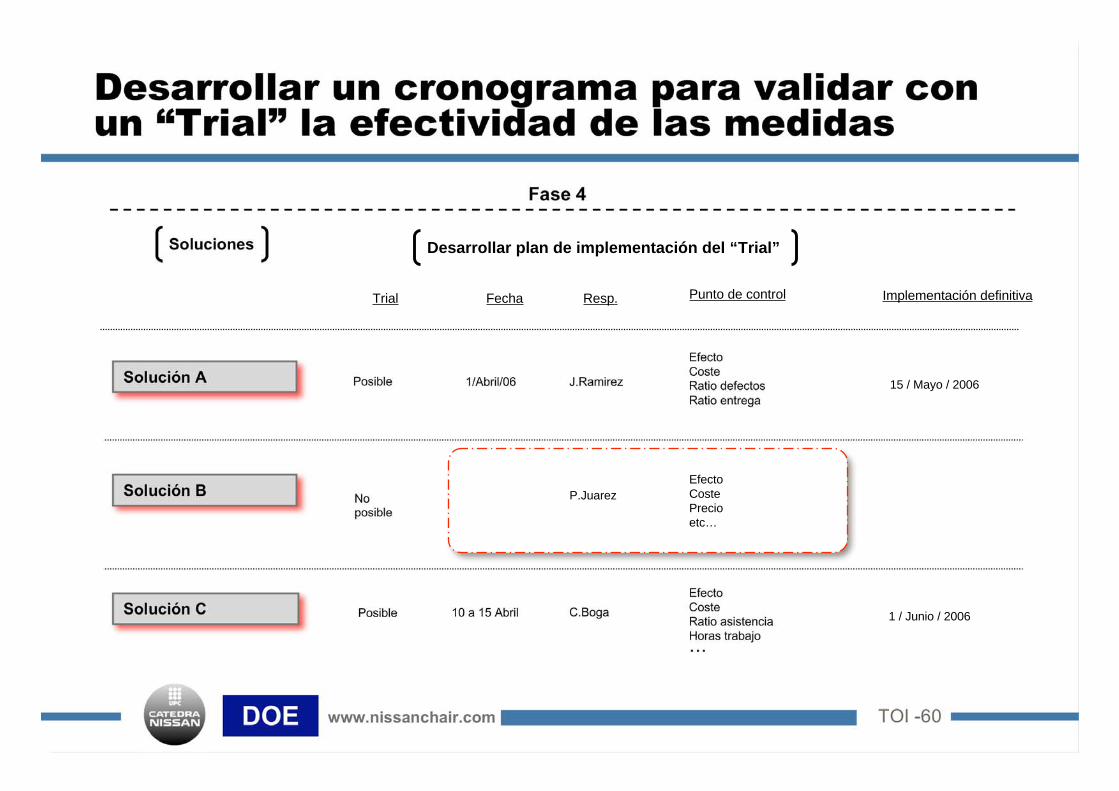
Desarrollar un cronograma para validar conun “Trial” la efectividad de las medidas
Solución A
Solución B
Solución C
Fase 4
Soluciones
Posible
Noposible
Posible
1/Abril/06
10 a 15 Abril
J.Ramirez
C.Boga
Efecto
Coste
Ratio defectos
Ratio entrega
EfectoCoste
Ratio asistencia
Horas trabajo
Trial Fecha Resp. Punto de control Implementación definitiva
15 / Mayo / 2006
1 / Junio / 2006
P.Juarez
Efecto
Coste
Precio
etc…
Desarrollar plan de implementación del “Trial”
TOI -70DOE www.nissanchair.com
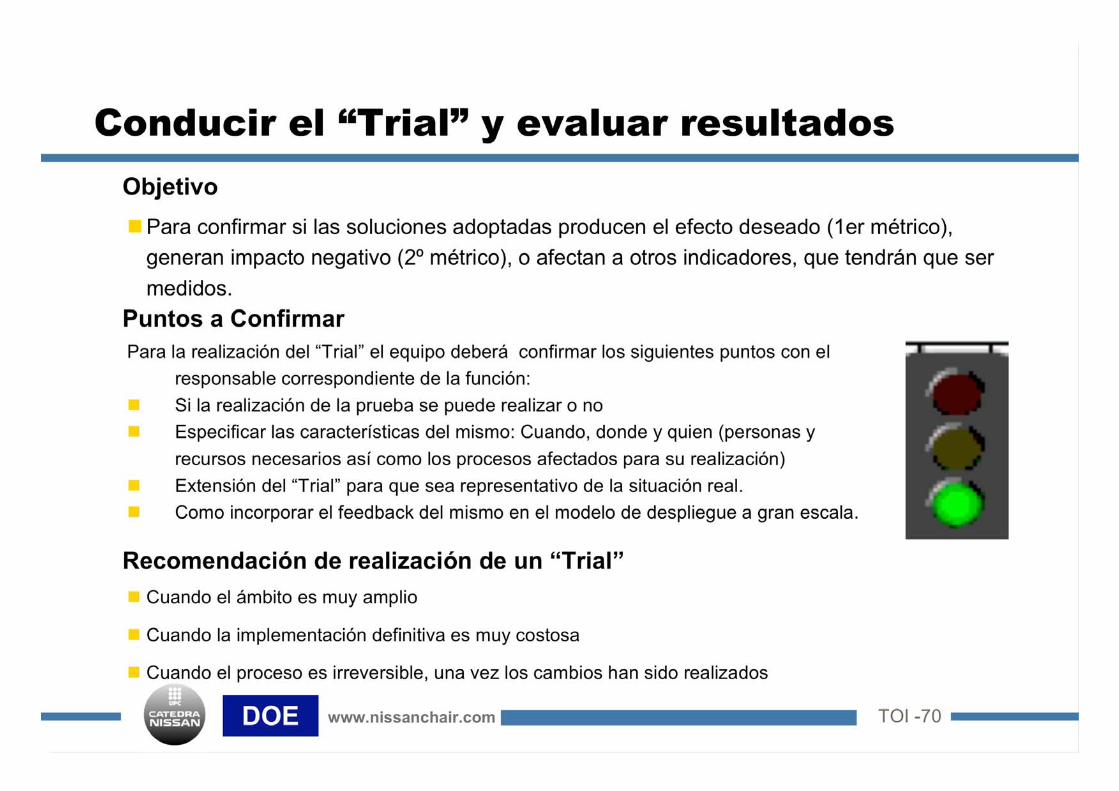
Conducir el “Trial” y evaluar resultados
Objetivo
Puntos a Confirmar
Para confirmar si las soluciones adoptadas producen el efecto deseado (1er métrico),
generan impacto negativo (2º métrico), o afectan a otros indicadores, que tendrán que ser
medidos.
Para la realización del “Trial” el equipo deberá confirmar los siguientes puntos con el
responsable correspondiente de la función:
Si la realización de la prueba se puede realizar o no
Especificar las características del mismo: Cuando, donde y quien (personas y
recursos necesarios así como los procesos afectados para su realización)
Extensión del “Trial” para que sea representativo de la situación real.
Como incorporar el feedback del mismo en el modelo de despliegue a gran escala.
Recomendación de realización de un “Trial”
Cuando el ámbito es muy amplio
Cuando la implementación definitiva es muy costosa
Cuando el proceso es irreversible, una vez los cambios han sido realizados

TOI -80DOE www.nissanchair.com
Decisión de Implementación de lasSoluciones
El responsable del proyecto deberá seguir y validar los efectos estimados durante la implementación
Solu
ció
nA
3
Efe
cto
s E
stim
ad
os
Solu
ció
nD
1
Solicitud de
validación
Notificación
Fin
an
za
s
Decisión de implementación (Responsable compañía)
Prim
er M
étr
ico
Se
gu
nd
o M
étr
ico
Objetivo
Co
nv
ertir
los
efe
cto
s e
n im
pa
cto
ec
on
óm
ico
Solución
A1
Solución
A2
Impacto
financiero
Impacto
financiero
Impacto
financiero
Solución
D1
Total impacto económico
Coste
(1)(2)
Coste
Coste
Solu
ció
nA
2
TOI -90DOE www.nissanchair.com
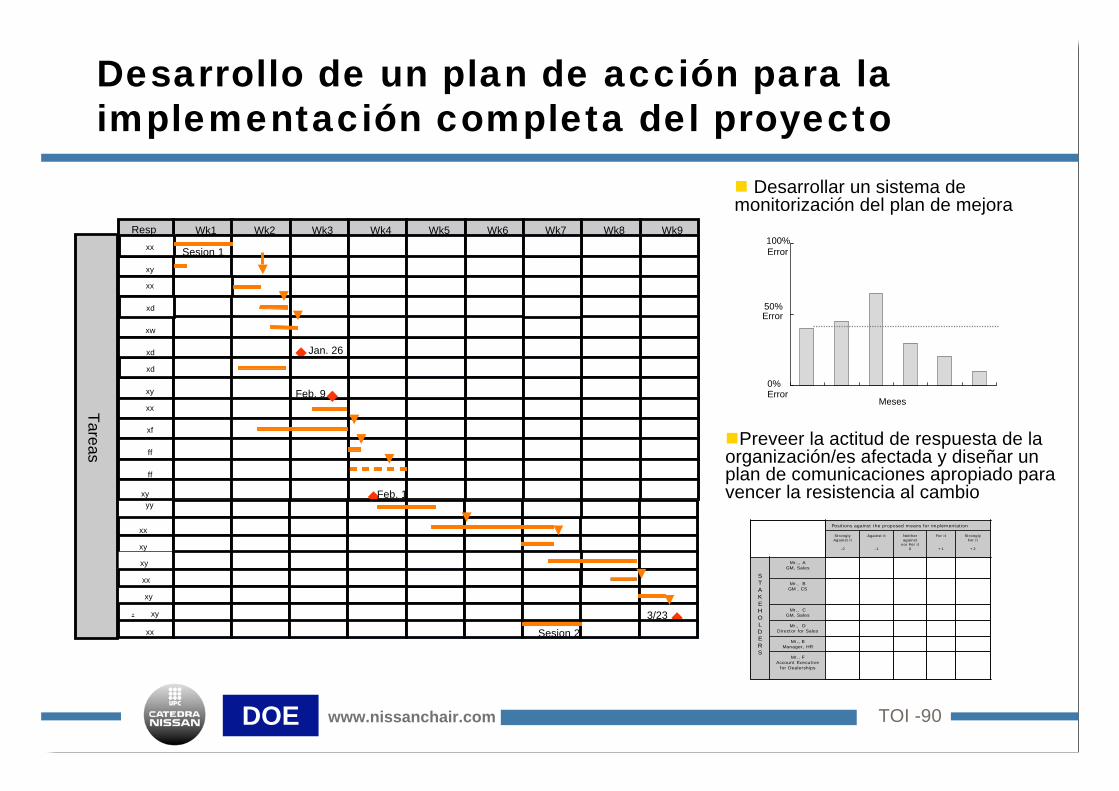
Desarrollo de un plan de acción para la
implementación completa del proyecto
Wk9Wk1 Wk2 Wk3 Wk4 Wk5 Wk6 Wk7 Wk8
V - Pilot
V - Pilot
V- Pilot
1/26
V - Pilot
- Leader
V- Pilot
2/9 xy
2/16xy
Resp
Sesion 1
Jan. 26
Feb. 9
Tare
as
Feb. 16 yy
V - Pilot
3/23- xy 3/23-
Sesion 2
xd
xd
xw
xd
xx
xf
ff
ff
xx
xy
xy
xx
xy
xx
xx
xy
xx
0%Error
Error
100%
Error
4 5 6 7 8 9Meses
50%
Mr., F
Account Executive
for Dealerships
Mr., E
Manager, HR
Mr., D
Director for Sales
Mr., C
GM, Sales
Mr., B
GM , CS
Mr.,, A
GM, Sales
S
T
A
K
E
H
O
L
D
E
R
S
Strongly
For it
+2
For it
+1
Neither
against
nor For it
0
Against it
-1
Strongly
Against it
-2
Positions against the proposed means for implementation
Desarrollar un sistema demonitorización del plan de mejora
Preveer la actitud de respuesta de laorganización/es afectada y diseñar unplan de comunicaciones apropiado paravencer la resistencia al cambio
TOI -100
Departament
d’Organització
d’EmpresesDOE
BENCHMARKING
PRIORIZATION MATRIX
RISK ANALISYS
AMFE
Fase 4. Herramientas
TOI -110DOE www.nissanchair.com
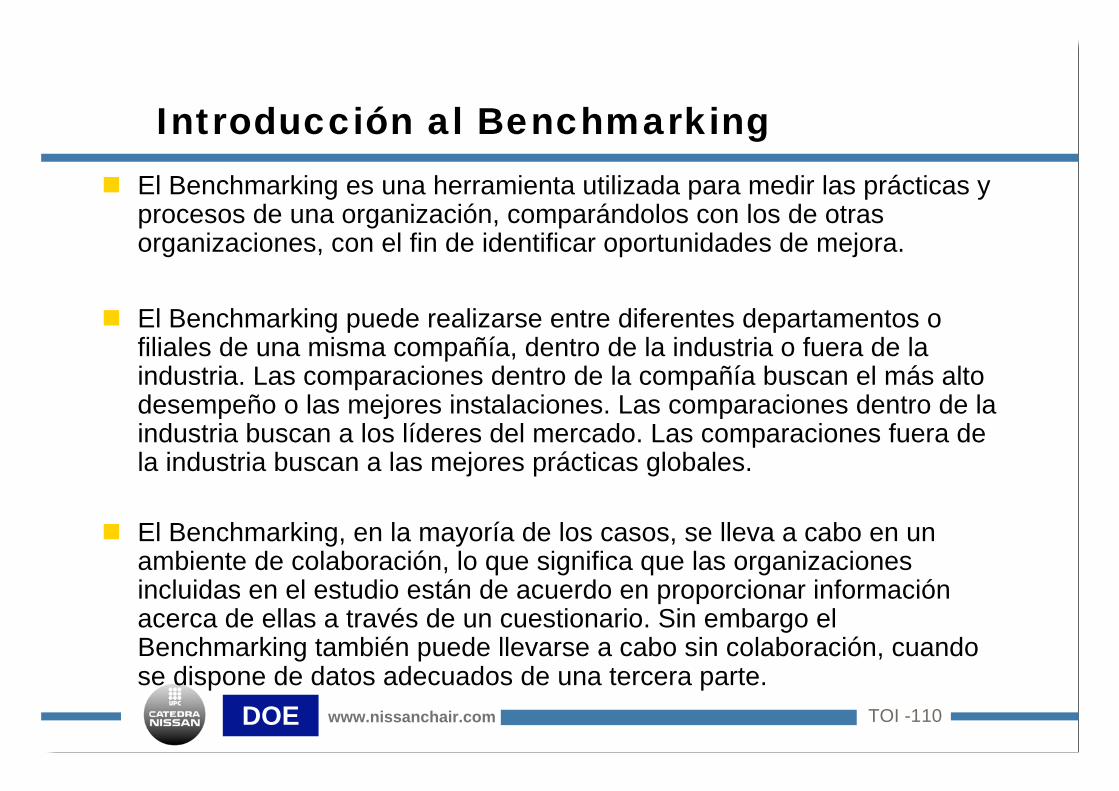
Introducción al Benchmarking
El Benchmarking es una herramienta utilizada para medir las prácticas yprocesos de una organización, comparándolos con los de otrasorganizaciones, con el fin de identificar oportunidades de mejora.
El Benchmarking puede realizarse entre diferentes departamentos ofiliales de una misma compañía, dentro de la industria o fuera de laindustria. Las comparaciones dentro de la compañía buscan el más altodesempeño o las mejores instalaciones. Las comparaciones dentro de laindustria buscan a los líderes del mercado. Las comparaciones fuera dela industria buscan a las mejores prácticas globales.
El Benchmarking, en la mayoría de los casos, se lleva a cabo en unambiente de colaboración, lo que significa que las organizacionesincluidas en el estudio están de acuerdo en proporcionar informaciónacerca de ellas a través de un cuestionario. Sin embargo elBenchmarking también puede llevarse a cabo sin colaboración, cuandose dispone de datos adecuados de una tercera parte.
TOI -120DOE www.nissanchair.com
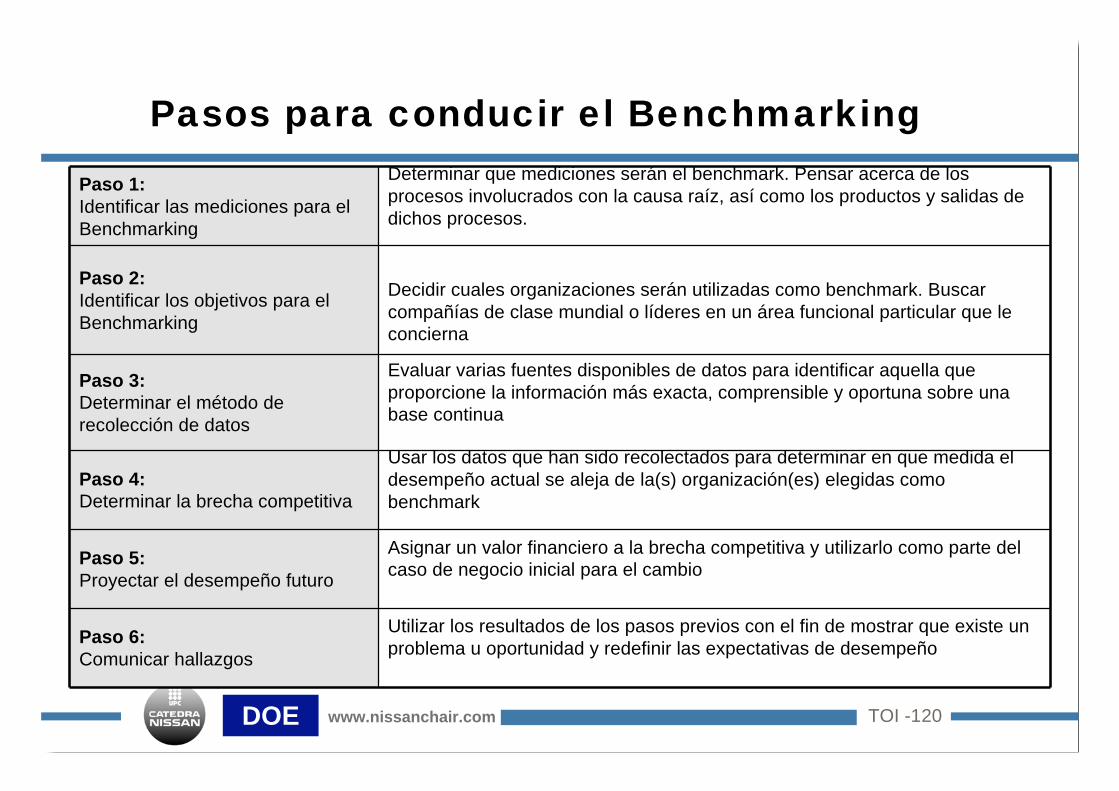
Pasos para conducir el Benchmarking
Utilizar los resultados de los pasos previos con el fin de mostrar que existe un
problema u oportunidad y redefinir las expectativas de desempeñoPaso 6:
Comunicar hallazgos
Asignar un valor financiero a la brecha competitiva y utilizarlo como parte del
caso de negocio inicial para el cambioPaso 5:
Proyectar el desempeño futuro
Usar los datos que han sido recolectados para determinar en que medida el
desempeño actual se aleja de la(s) organización(es) elegidas como
benchmark
Paso 4:
Determinar la brecha competitiva
Evaluar varias fuentes disponibles de datos para identificar aquella que
proporcione la información más exacta, comprensible y oportuna sobre una
base continua
Paso 3:
Determinar el método de
recolección de datos
Decidir cuales organizaciones serán utilizadas como benchmark. Buscar
compañías de clase mundial o líderes en un área funcional particular que le
concierna
Paso 2:
Identificar los objetivos para el
Benchmarking
Determinar que mediciones serán el benchmark. Pensar acerca de los
procesos involucrados con la causa raíz, así como los productos y salidas de
dichos procesos.
Paso 1:
Identificar las mediciones para el
Benchmarking

TOI -130DOE www.nissanchair.com
Ejemplo de Benchmarking
Problema: Los costos de embarque y gestión son demasiado altos debido a una
distribución ineficiente del almacén
Paso 6:
Comunicar hallazgos
Paso 5:
Proyectar el desempeño futuro
Paso 4:
Determinar la brecha competitiva
Paso 3:
Determinar el método de recolección
de datos
Paso 2:
Identificar los objetivos para el
Benchmarking
Paso 1:
Identificar las mediciones para el
Benchmarking
Utilizar los resultados con el fin de mostrar que la distribución del almacén es
ineficiente y que se justifica una acción correctiva
Multiplicar los costos de manejo actuales por la brecha competitiva (expresada en
porcentaje) con el fin de obtener una estimación de los ahorros potenciales que
pueden utilizarse en el caso de negocio
Comparar las líneas surtidas / persona / hora con alguna de las organizaciones
seleccionadas para benchmarking
Las posibles fuentes de información pueden incluir el Council of Logistics
Management, Modem Distribution Management Magazine, proveedores de equipo y
software de almacén, etc.
Las compañías ideales para benchmark tendrían un área similar de almacén (en
metros cuadrados) y un número comparable de SKU´s
Las mediciones apropiadas incluyen: líneas surtidas / persona / hora. Distancia
promedio de movimiento por surtimiento

TOI -140DOE www.nissanchair.com
Tips para conducir un Benchmarking efectivo
Tips para el éxito
1. Cuando se identifiquen organizaciones contra las cuales hacer el
Benchmarking, recordar enfocarse en procesos y objetivos, no en productos
o mercados específicos. Una organización en una industria completamente
diferente puede tener procesos muy similares a los suyos en el área
funcional en que se conduce el Benchmarking
2. Sea cuidadoso en su búsqueda de datos para el benchmark. Algunas fuentes
adecuadas incluyen:
Asociaciones y publicaciones industriales y profesionales
Organizaciones de Benchmarking
Contactos profesionales como clientes y proveedores
Información para inversionistas de competidores y reportes de analistas
3. Obtenga la aprobación del departamento legal antes de iniciar o participar en
cualquier tipo de estudio de Benchmarking colaborativo fuera de la
compañía
TOI -150DOE www.nissanchair.com
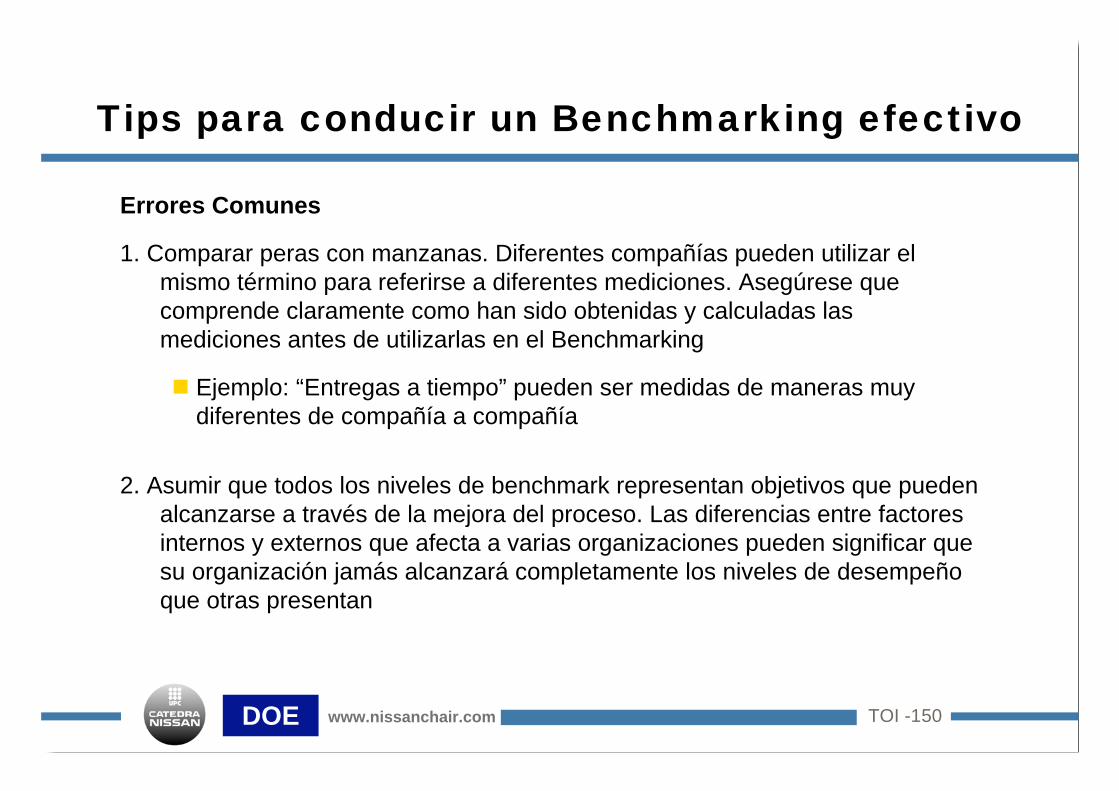
Errores Comunes
1. Comparar peras con manzanas. Diferentes compañías pueden utilizar el
mismo término para referirse a diferentes mediciones. Asegúrese que
comprende claramente como han sido obtenidas y calculadas las
mediciones antes de utilizarlas en el Benchmarking
Ejemplo: “Entregas a tiempo” pueden ser medidas de maneras muy
diferentes de compañía a compañía
2. Asumir que todos los niveles de benchmark representan objetivos que pueden
alcanzarse a través de la mejora del proceso. Las diferencias entre factores
internos y externos que afecta a varias organizaciones pueden significar que
su organización jamás alcanzará completamente los niveles de desempeño
que otras presentan
Tips para conducir un Benchmarking efectivo
TOI -160DOE www.nissanchair.com
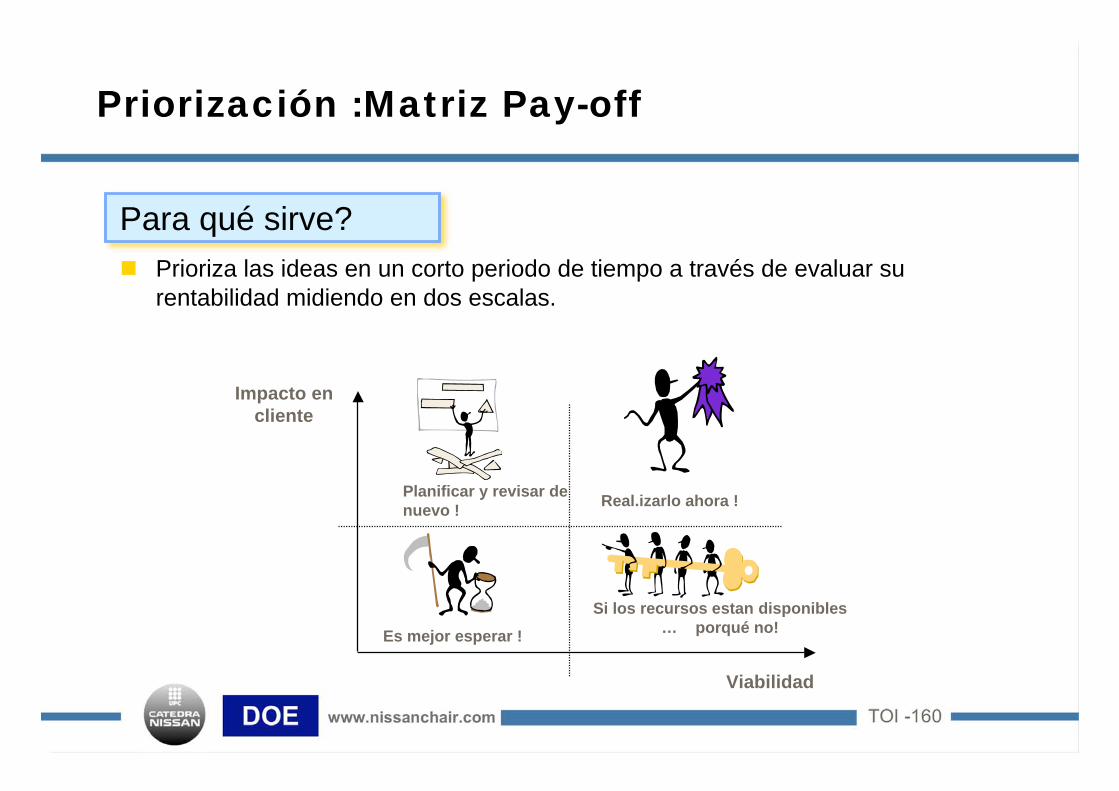
Priorización :Matriz Pay-off
Para qué sirve?
Prioriza las ideas en un corto periodo de tiempo a través de evaluar su
rentabilidad midiendo en dos escalas.
Viabilidad
Impacto en
cliente
Es mejor esperar !
Planificar y revisar de
nuevo !Real.izarlo ahora !
Si los recursos estan disponibles
… porqué no!
TOI -170DOE www.nissanchair.com
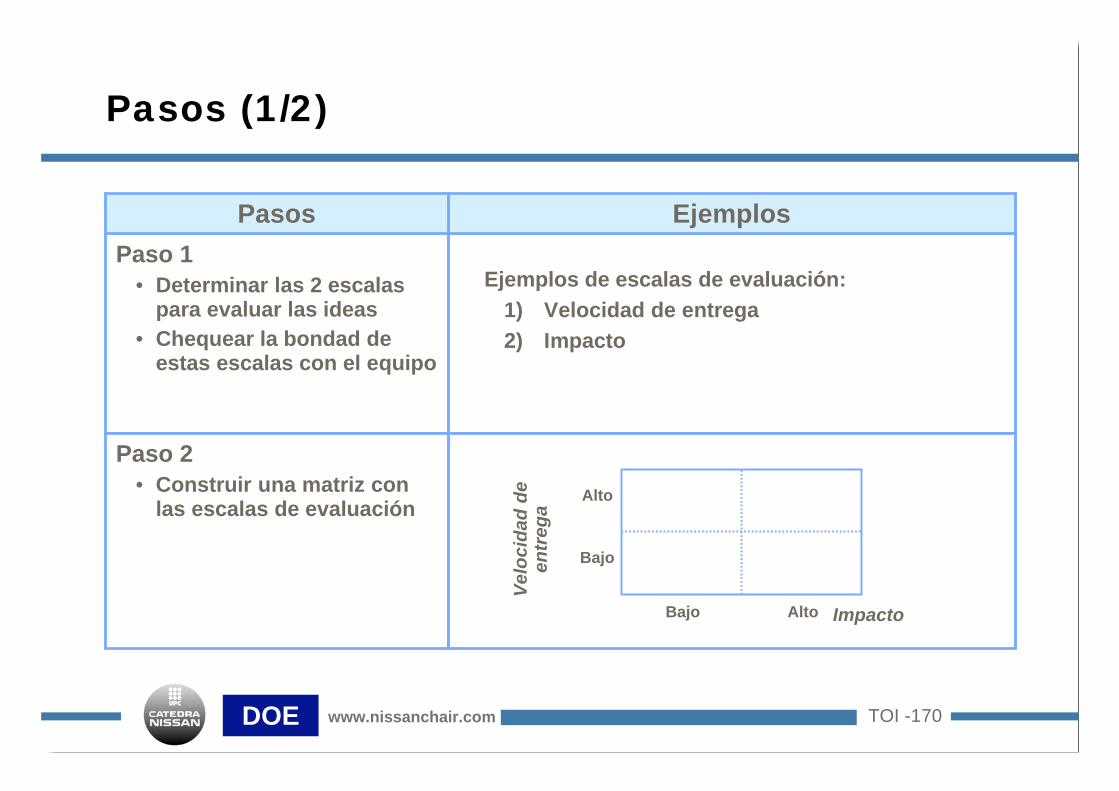
Pasos (1/2)
Paso 1
• Determinar las 2 escalas
para evaluar las ideas
• Chequear la bondad de
estas escalas con el equipo
Ejemplos de escalas de evaluación:
1) Velocidad de entrega
2) Impacto
Paso 2
• Construir una matriz con
las escalas de evaluación
EjemplosPasos
Alto
Bajo
Bajo Alto
Ve
loc
ida
d d
ee
ntr
eg
a
Impacto

TOI -180DOE www.nissanchair.com
Pasos(2/2)
Paso 3
• Poner las ideas en la matriz
a través de la discusión en
equipo
Paso 4
• Los factores con alta
velocidad de entrega y alto
impacto son definidos
como de alta prioridad.
(Zona 1 Zona 2)
EjemplosPasos
Alto
Bajo
Bajo Alto
Velo
cid
ad
de
en
treg
a
Impacto
Idea A
Idea B
Idea D
Idea C
Alto
BAjo
Bajo Alto
Velo
cid
ad
de
en
treg
a
Impacto
Zona 1
Zona 2
Zona 3
Idea A
Idea B
Idea D
Idea C
TOI -190DOE www.nissanchair.com
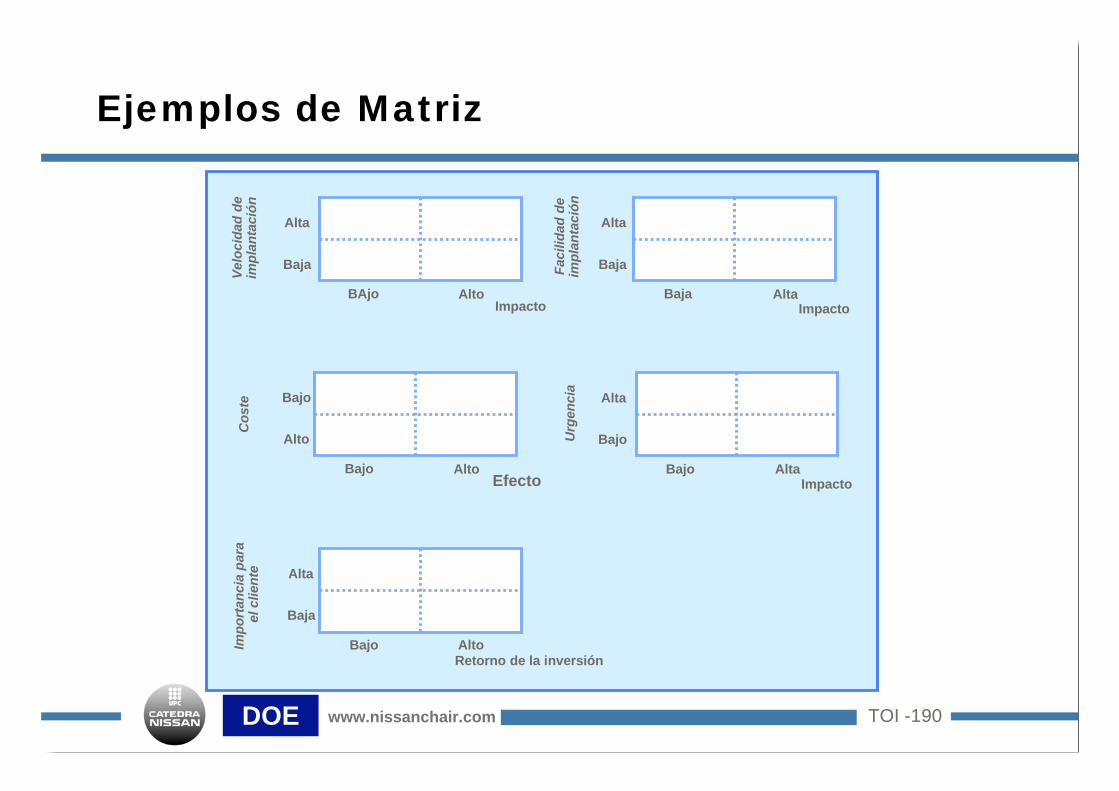
Ejemplos de Matriz
AltoBAjo
Alta
Baja
Velo
cid
ad
de
imp
lan
tació
n
ImpactoAltaBaja
Alta
BajaFacilid
ad
de
imp
lan
tació
n
Impacto
AltaBajo
Alta
BajoUrg
en
cia
Impacto
AltoBajo
Bajo
Alto
Co
ste
Efecto
AltoBajo
Alta
Baja
Imp
ort
an
cia
para
el c
lien
te
Retorno de la inversión
TOI -200DOE www.nissanchair.com
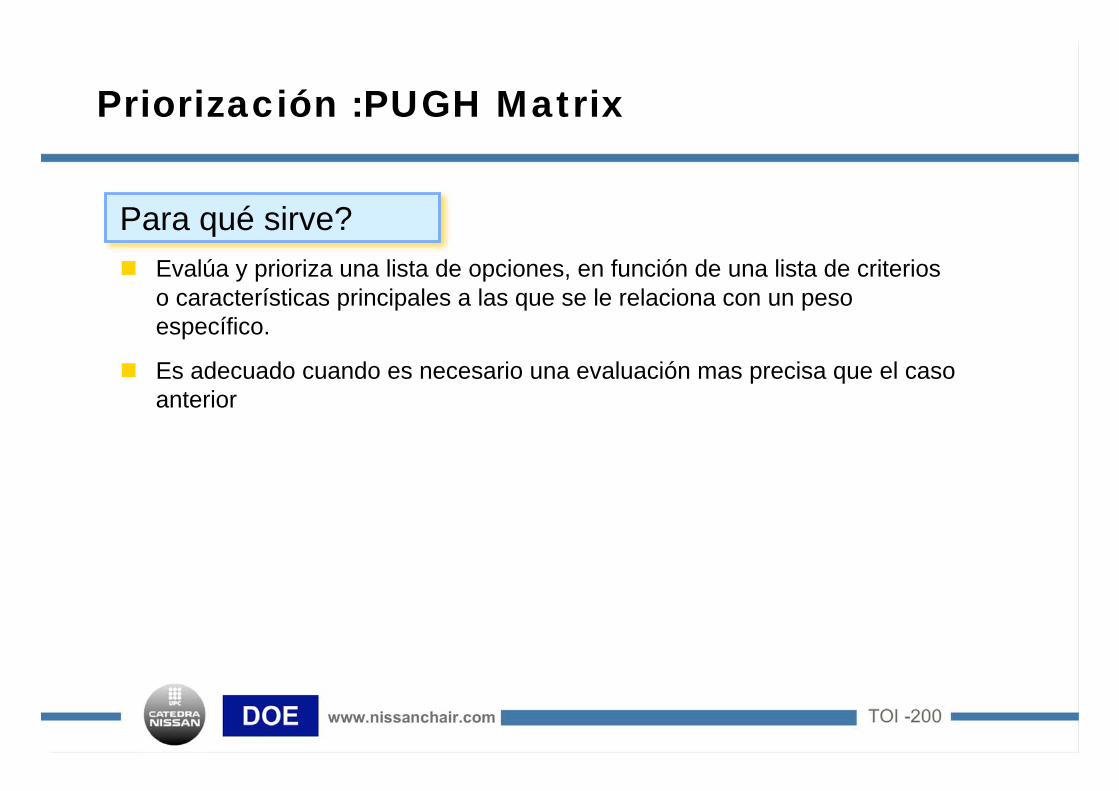
Priorización :PUGH Matrix
Para qué sirve?
Evalúa y prioriza una lista de opciones, en función de una lista de criterios
o características principales a las que se le relaciona con un peso
específico.
Es adecuado cuando es necesario una evaluación mas precisa que el caso
anterior

TOI -210DOE www.nissanchair.com
Proceso :PUGH Matrix
Paso 1: Selecciona los criterios para la comparación
Paso 2: Selecciona las opciones a ser comparadas
Paso 3: Construir una matriz con los criterios y las opciones. Evaluar cada
elección contra los criterios. Para cada comparación el producto debería
de evaluarse como mejor (numero +), igual (0) o peor (numero -)
Paso 4: Calcula la puntuación total
Title
# Options 3
# Criteria 6
CTQ Option 1 Option 2 Option 3
Criteria 1 1 0 -2
Criteria 2 2 0 -1
Criteria 3 0 1 2
Criteria 4 -1 1 2
Criteria 5 -2 1 0
Criteria 6 0 1 1
Total 0 4 2
Total + 3 4 5
Total - -3 0 -3
Priorizacion soluciones XXX
TOI -220DOE www.nissanchair.com
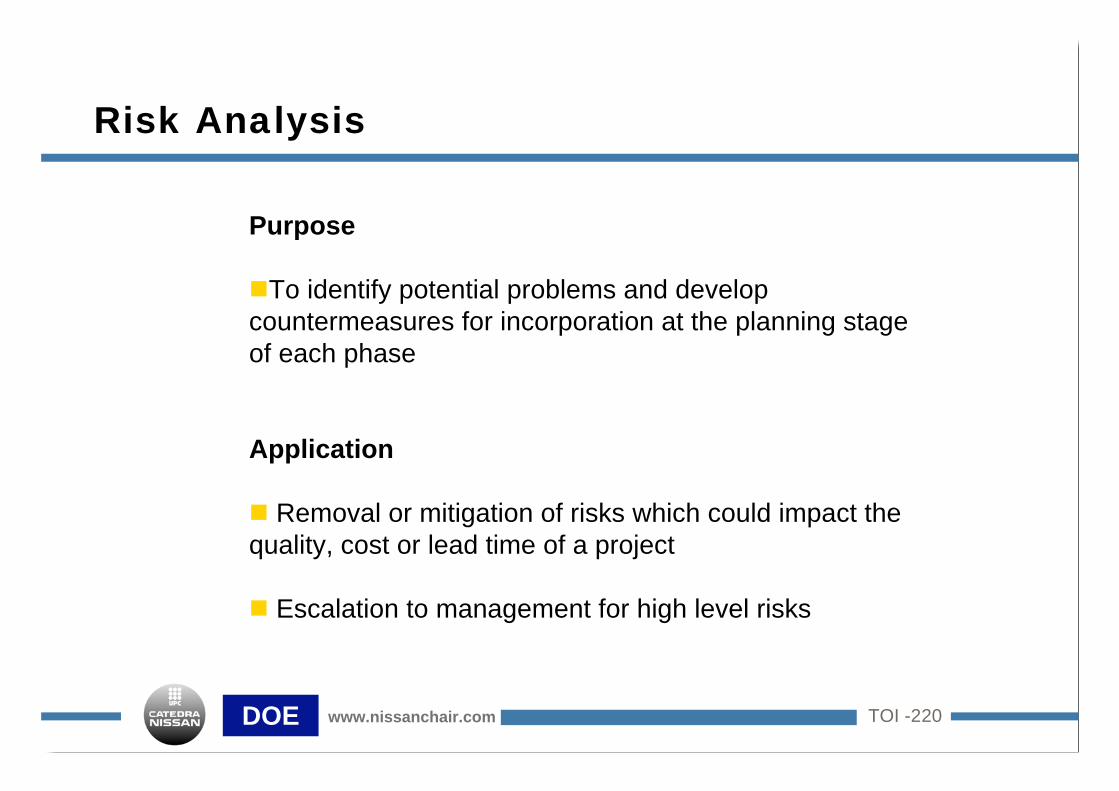
Risk Analysis
Purpose
To identify potential problems and develop
countermeasures for incorporation at the planning stage
of each phase
Application
Removal or mitigation of risks which could impact the
quality, cost or lead time of a project
Escalation to management for high level risks
TOI -230DOE www.nissanchair.com
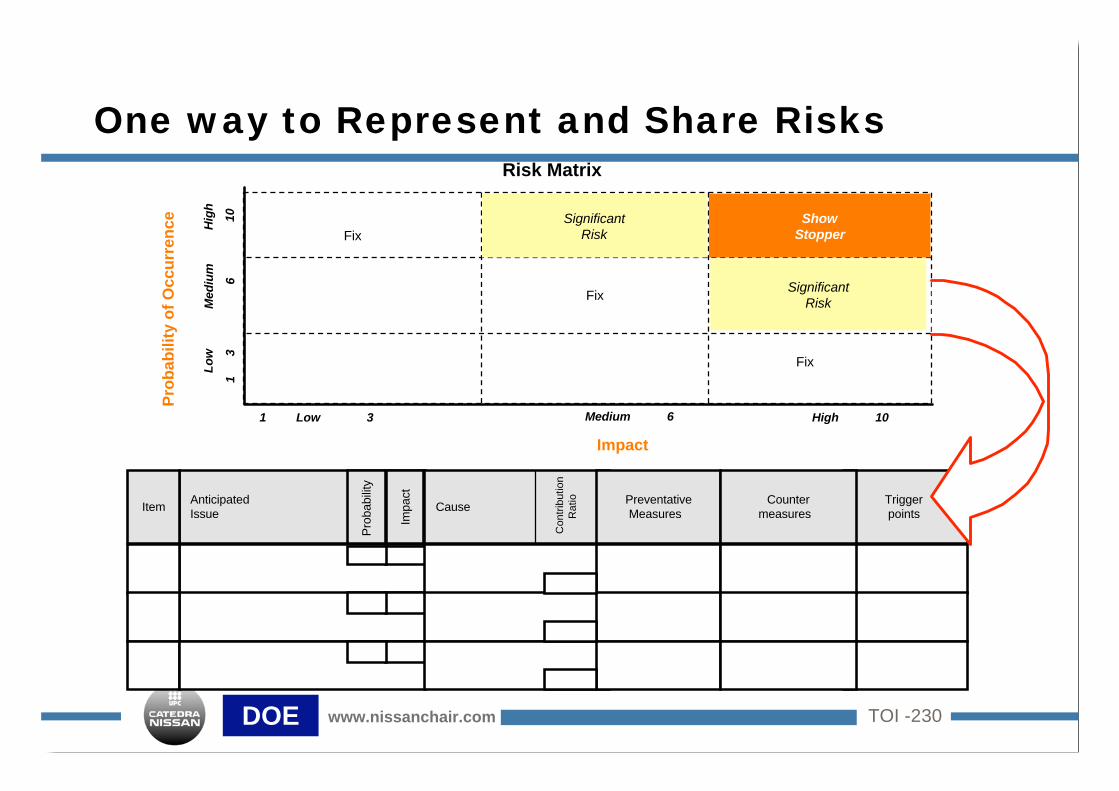
One way to Represent and Share Risks
Impact
Pro
bab
ilit
y o
f O
ccu
rren
ce
Fix
Significant
Risk
Show
Stopper
Significant
Risk
1 Low 3 Medium 6 High 10
L
ow
1 3
Med
ium
6
Hig
h
10
Fix
Fix
Risk Matrix
Anticipated
Issue
Pro
babili
ty
Impact
Item Cause Preventative
Measures
Trigger
points
Counter
measures
Co
ntr
ibu
tio
n
Ra
tio

TOI -240DOE www.nissanchair.com
Procedure for Conducting Risk AnalysisSTEP INSTRUCTION
Step 1:
Include Risk Analysis into the project plan
at each phase
• Plan for Risk Analysis with Crew and, if needed, with V-Leader - project risk at each phase - project definition risk at DE phase - improvement means risk at I3 phase - deployment plan risk at I3 phase - deployment execution at D phase
Step 2:
For each phase and each type of risk,
identify potential issues.
• Brainstorm potential issues with the V-crew; the question to ask is: What risks can resultin project delays or poor result vs the target?
Step 3:
Prioritize the potential issues
For each potential issue, rate :• The probability of occurrence (scale 1 to 10, 10 been almost certain)• The negative impact on achieving the target (scale 1 to 10, 10 being a show stopper
for the project)• Plot them on a matrix or a table to decide which risk you want to remove.
Step 4:
For high risks, analyse the causes
• Perform this step only if relevant (usually to be done for risk on solutions)• Assign a contribution ratio to each cause (e.g how much a given cause contributes to
the risk) Based on the scale and rating.
Step 5:
Develop preventative measures
• Develop preventative measures to prevent the risk from happening• Verify that the preventative measure is capable of lowering the impact rating down to
below 3.0 level.
Step 6:
Develop countermeasures to resolve the issue
• Perform this step only if it is not possible to have preventative action which removes therisk. The objective is to set up countermeasures if the risk occurs.
• Identify what will trigger the countermeasure (i.e. how do we know we need to launch thecountermeasure)
Step 7:
Incorporate into action plans
• Incorporate both the preventative measures and the to do list of implementing thecountermeasures into the action plan (project plan or deployment plan).
• Report major risks to the to V-leader
TOI -250DOE www.nissanchair.com
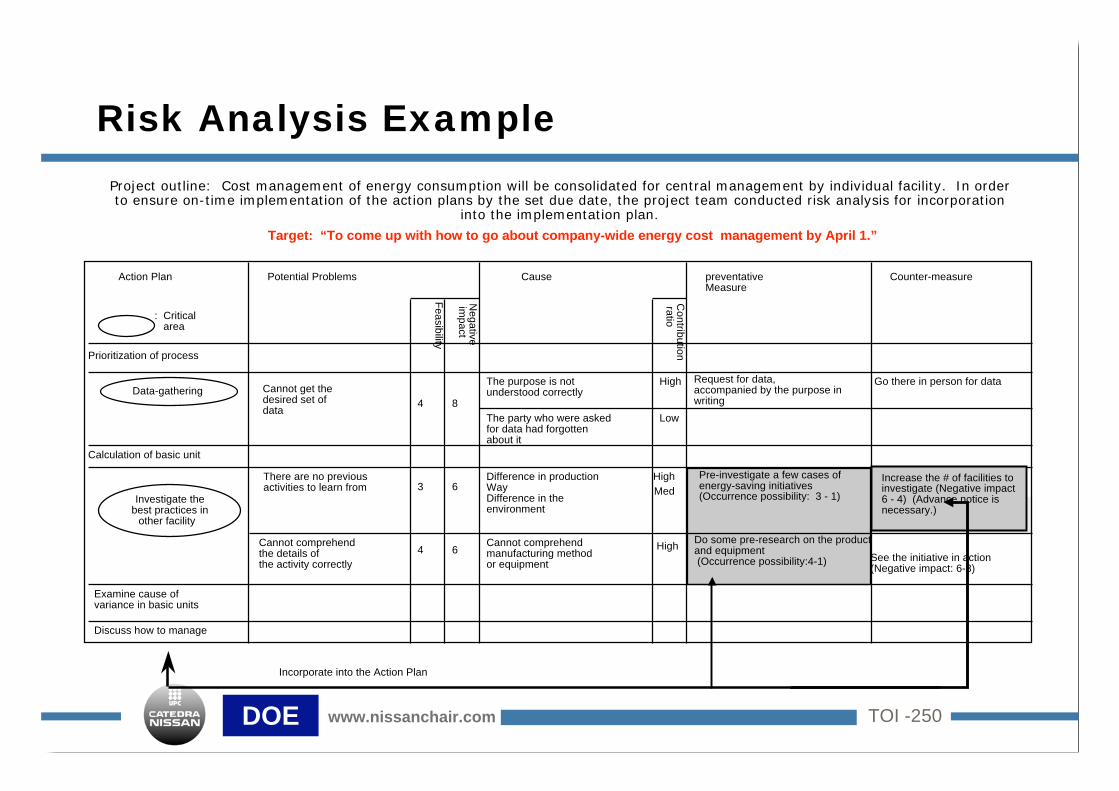
Project outline: Cost management of energy consumption will be consolidated for central management by individual facility. In order
to ensure on-time implementation of the action plans by the set due date, the project team conducted risk analysis for incorporation
into the implementation plan.
Target: “To come up with how to go about company-wide energy cost management by April 1.”
Action Plan Potential Problems
Fe
asib
ility
Ne
ga
tive
imp
act
Cause
Co
ntrib
utio
n ra
tio
preventative Measure
Counter-measure
Prioritization of process
Calculation of basic unit
Examine cause ofvariance in basic units
Discuss how to manage
Data-gathering
Investigate thebest practices in
other facility
Cannot get thedesired set ofdata
There are no previousactivities to learn from
4 8
3 6
Cannot comprehendthe details ofthe activity correctly
4 6
The purpose is not understood correctly
High
Low
Difference in productionWayDifference in theenvironment
High
Med
Cannot comprehendmanufacturing methodor equipment
High
Request for data,accompanied by the purpose inwriting
Go there in person for data
The party who were askedfor data had forgottenabout it
Pre-investigate a few cases ofenergy-saving initiatives(Occurrence possibility: 3 - 1)
Increase the # of facilities toinvestigate (Negative impact6 - 4) (Advance notice isnecessary.)
Do some pre-research on the productand equipment (Occurrence possibility:4-1) See the initiative in action
(Negative impact: 6-3)
: Critical area
Incorporate into the Action Plan
Risk Analysis Example
DOE www.nissanchair.com
FMEA
FMEA is designed to prevent failures from
occuring or from getting to internal and
external customers.
Therefore, FMEA is best suited for situations
where failures might occur and the effects of
those failures occurring are potentially serious.

DOE www.nissanchair.com
FMEA Steps
1.Fill in the header information
2.Fill in the process steps
3.For each process step, list requierements
4.For each requirement, list the failure mode
5.For each failure mode, list the effect of failure
6.For each effect of failure, estimate the severity
7.For each failure mode, list causes
DOE www.nissanchair.com
FMEA Steps
8.For each cause of failure, estimate
the likelihood of occurrence
9.For each cause of failure, list the current
process controls.
10.Fore each process control, estimate the
detection
11.For each cause of failure, calculate the Risk
Priority Number
12.For high priority causes of failure and/or failure
modes, develop recommended actions.
DOE www.nissanchair.com
FMEA Steps
13.For each recommended action, assign
reponsibility and completion dates.
14.For each recommended action, implement the
action and note its effect
15.For each implemented action, re- estimate the
severity, occurrence and detection ranking and
recalculate the RPN
DOE www.nissanchair.com
FMEA Step 1Fill in the header information
A) Describe the process
B) Number the FMEA
C) Identify the Pilot
D) Identify page numbers
E) List team members
F) Name the preparer
G) Enter the FMEA date
H) Enter the revision data
…..

DOE www.nissanchair.com
FMEA Step 2Fill in the process steps
ProcessStep
Requirements
Weld Nut to Pedestal
Add all value added
process steps from the
process map to the FMEA
form.
START STEP 1
STEP 2BSTEP 2A STEP 2C
Weld Nut to
Pedestal
REWORK ENDGOOD?
DOE www.nissanchair.com
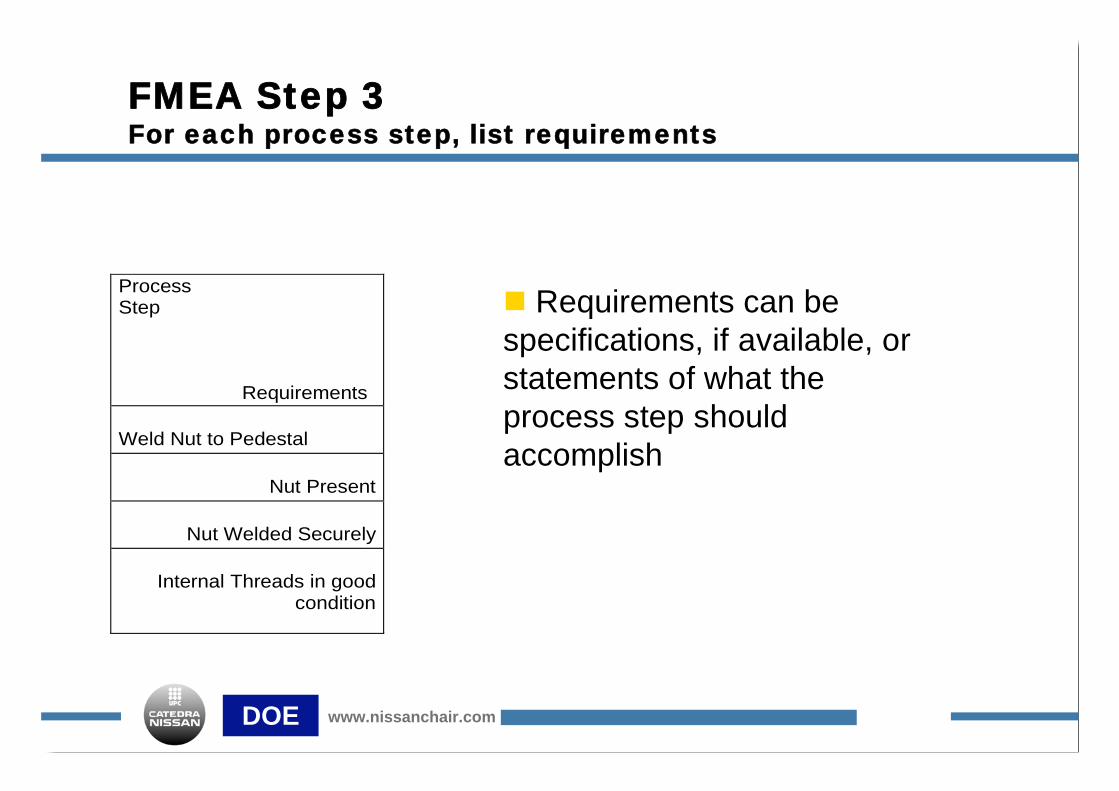
FMEA Step 3For each process step, list requirements
ProcessStep
Requirements
Weld Nut to Pedestal
Nut Present
Nut Welded Securely
Internal Threads in goodcondition
Requirements can be
specifications, if available, or
statements of what the
process step should
accomplish
DOE www.nissanchair.com
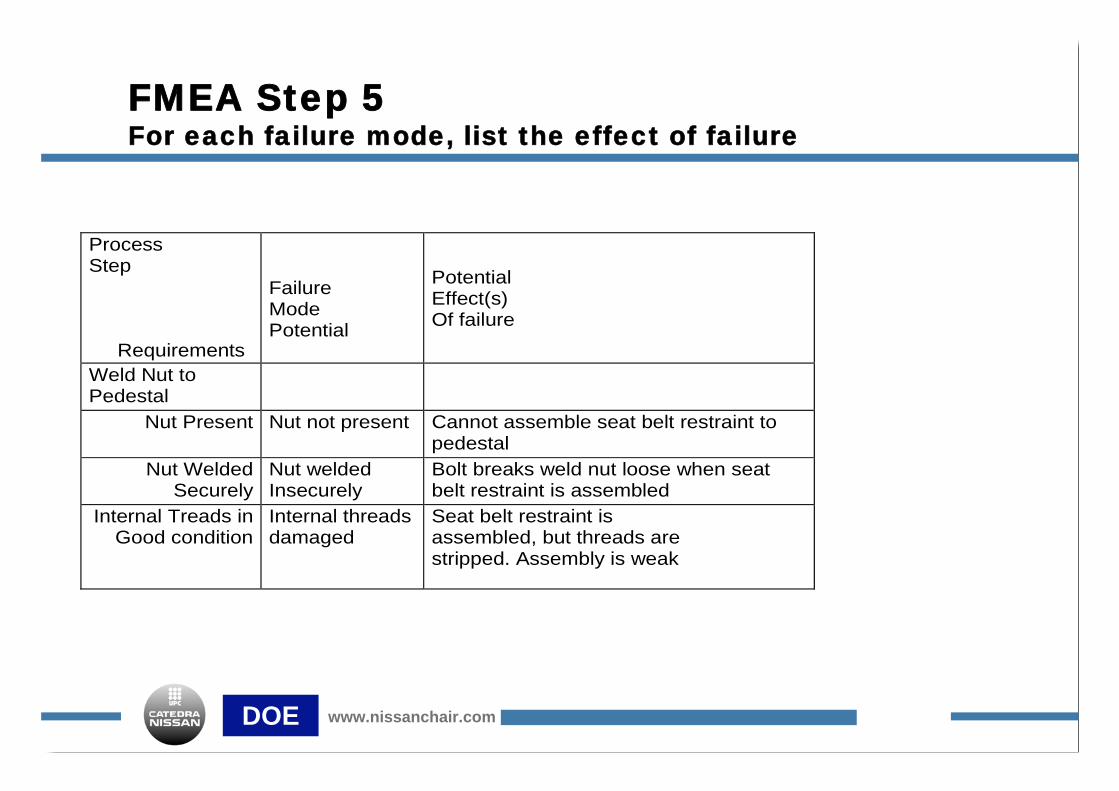
FMEA Step 5For each failure mode, list the effect of failure
ProcessStep
Requirements
FailureModePotential
PotentialEffect(s)Of failure
Weld Nut toPedestal
Nut Present Nut not present Cannot assemble seat belt restraint topedestal
Nut WeldedSecurely
Nut weldedInsecurely
Bolt breaks weld nut loose when seatbelt restraint is assembled
Internal Treads inGood condition
Internal threadsdamaged
Seat belt restraint isassembled, but threads arestripped. Assembly is weak

DOE www.nissanchair.com
FMEA Tips about Step 5For each failure mode, list the effect of failure
Tips about Step 5:
List only “worst case” effects of failure ( that´s all you
need to estimate severity).
Capture what actually happens when the failure mode
occurs. Avoid general statements like, “ Part is rejected”
or “Customer complaint”
By being specific in this column, later steps (estimating
severity & listing causes) will go much easier.

DOE www.nissanchair.com
FMEA Step 6For each effect of failure, estimate the severity
ProcessStep
Requirements
FailureModePotential
PotentialEffect(s)Of failure
severity
Weld Nut toPedestal
Nut Present Nut not present Cannot assemble seat belt restraint topedestal
5
Nut WeldedSecurely
Nut weldedInsecurely
Bolt breaks weld nut loose when seatbelt restraint is assembled
6
Internal Treads inGood condition
Internal threadsdamaged
Seat belt restraint isassembled, but threads arestripped. Assembly is weak
9

DOE www.nissanchair.com
EFFECT CRITERIA: SEVERITY OF EFFECT RANKING
Hazardous-
without warning
May endanger machine or assembly operator. Very high severity
ranking when a potential failure mode affects safe vehicle opeation
and/or non compliance with goverment regulation. çFauilure will
occur without warning.
10
Hazardous-
with warning
May endanger machine or assembly operator. Very high severity
ranking when a potential failure mode affects safe vehicle opeation
and/or non compliance with goverment regulation. çFauilure will
occur with warning.
9
Very High
Major disruption to production line. 100 % of product may have to
be scrapped. Vehicle/item inoperable, loss of primary function.
Customer very dissatisfied.
8
High
Minor disruption to production line. Product may have to be sorted
and a portion (less tahn 100 %) scrapped. Vehicle operable, but at
a reduced level of performance. Customer dissatisfied
7
Moderable
Minor disruption to production line. A portion (less than 100 %) of
the product may have to be scrapped ( no sorting). Vehicle/item
operable, but some comfort/convinience item(s) inoperable.
Customers experience discomfort.
6
low
Minor disruption to production line. 100% of the product may have
to be reworked. Vehicle/item opeable, but some
comfort/convenience item(s) operable at reduced level of
performance. Customer esperiences some dissatisaction
5
very low
Minor disruption to prodution line. The product may have to be
sorted and a portion (less than 100%) reworked. Fit &
Finish/Squeak & Rattle item does not conform. Defect noticed by
most customers
4
Minor
Minor distruption to production line. The produt may have to be
sorted and a portion ( less than 100%) reworked. Fit &
Finish/Squeak & rattle item does not conform. Defect noticed by
average customers
3
Very Minor
Minor disruption to prodution line. The product may have to be
sorted and a portion (less than 100%) reworked. Fit &
Finish/Squeak & Rattle item does not conform. Defect noticed by
discriminating customers
2
lowest No effect 1
FMEA Step 6 : AIAG Severity Guidelines
DOE www.nissanchair.com
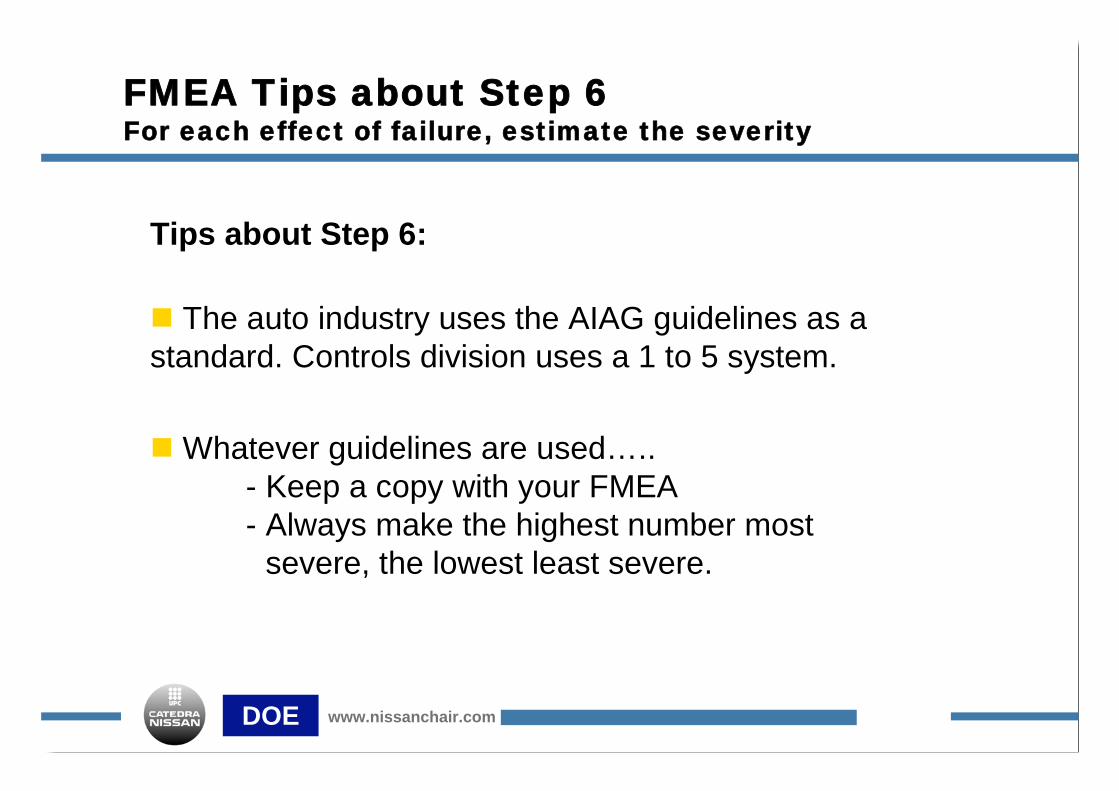
FMEA Tips about Step 6For each effect of failure, estimate the severity
Tips about Step 6:
The auto industry uses the AIAG guidelines as a
standard. Controls division uses a 1 to 5 system.
Whatever guidelines are used…..
- Keep a copy with your FMEA
- Always make the highest number most
severe, the lowest least severe.
DOE www.nissanchair.com
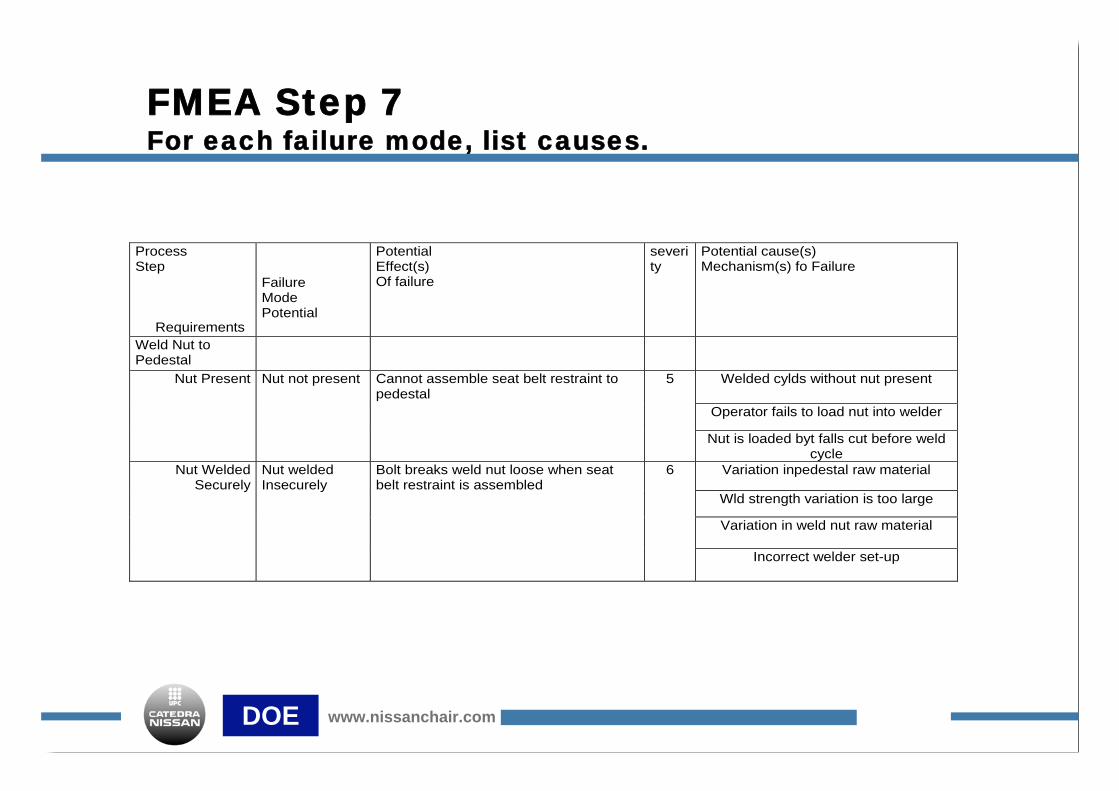
FMEA Step 7For each failure mode, list causes.
ProcessStep
Requirements
FailureModePotential
PotentialEffect(s)Of failure
severity
Potential cause(s)Mechanism(s) fo Failure
Weld Nut toPedestal
Welded cylds without nut present
Operator fails to load nut into welder
Nut Present Nut not present Cannot assemble seat belt restraint topedestal
5
Nut is loaded byt falls cut before weldcycle
Variation inpedestal raw material
Wld strength variation is too large
Variation in weld nut raw material
Nut WeldedSecurely
Nut weldedInsecurely
Bolt breaks weld nut loose when seatbelt restraint is assembled
6
Incorrect welder set-up
DOE www.nissanchair.com
FMEA Tips about Step 7For each failure mode, list causes
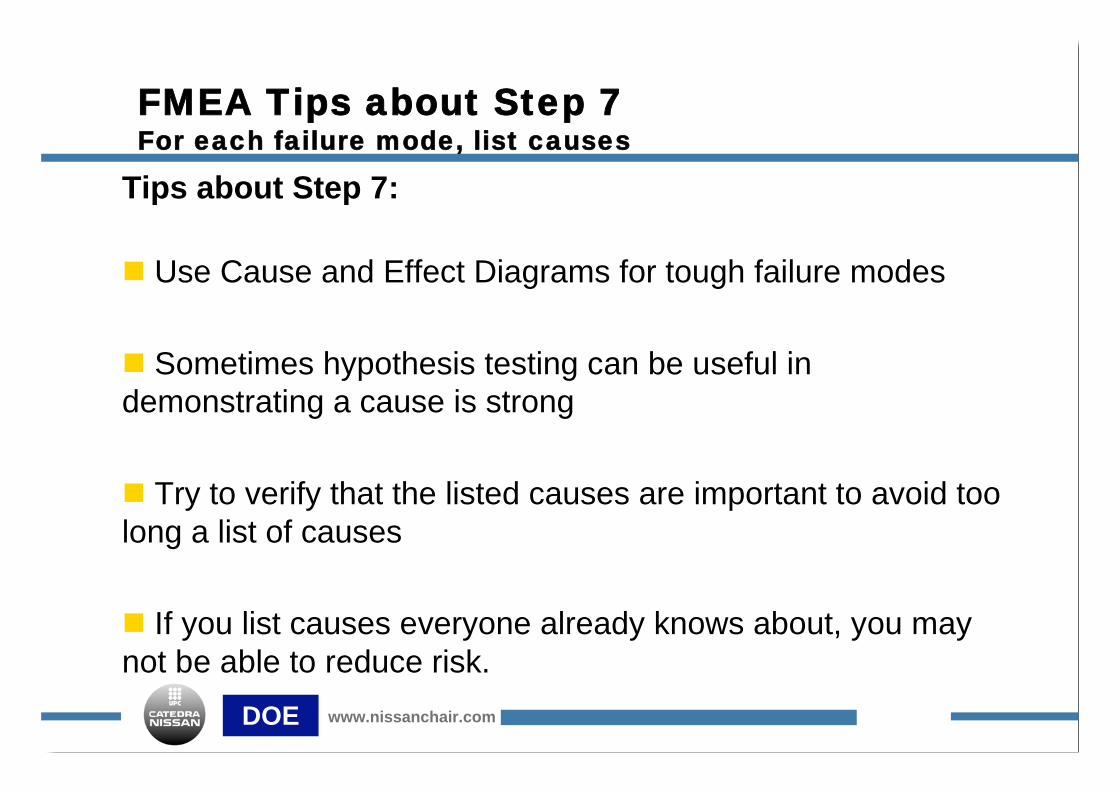
Tips about Step 7:
Use Cause and Effect Diagrams for tough failure modes
Sometimes hypothesis testing can be useful in
demonstrating a cause is strong
Try to verify that the listed causes are important to avoid too
long a list of causes
If you list causes everyone already knows about, you may
not be able to reduce risk.
DOE www.nissanchair.com
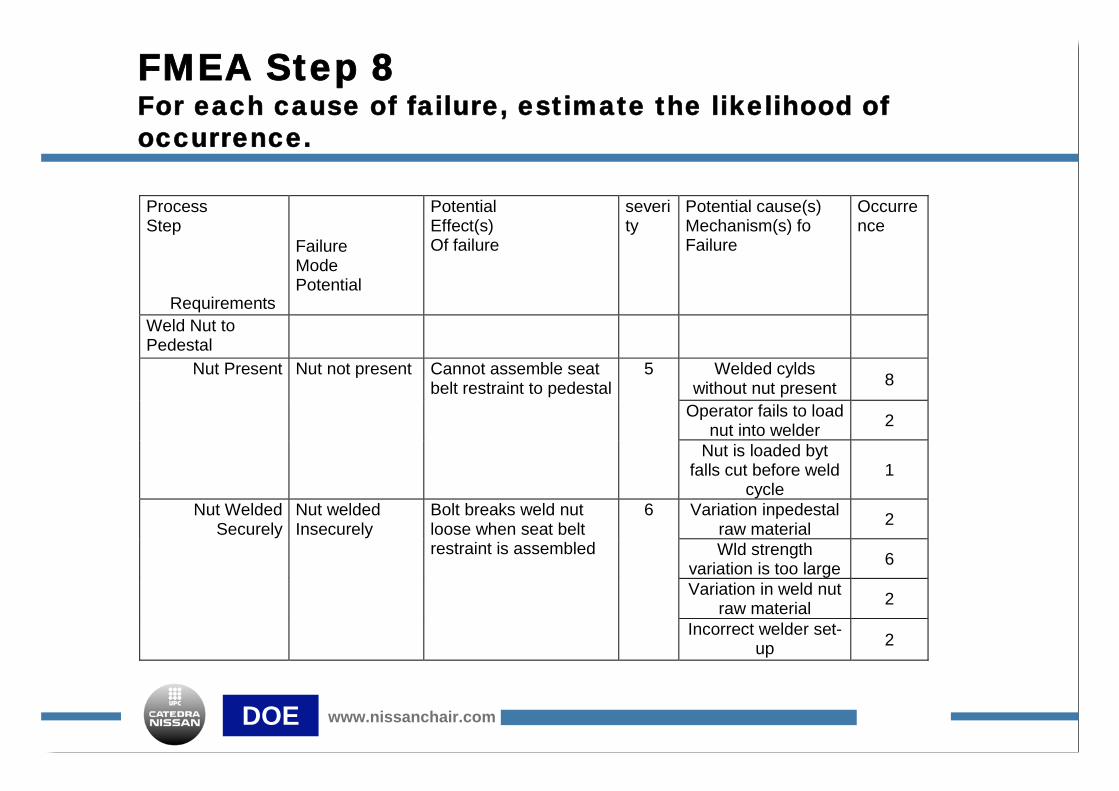
FMEA Step 8For each cause of failure, estimate the likelihood of
occurrence.
ProcessStep
Requirements
FailureModePotential
PotentialEffect(s)Of failure
severity
Potential cause(s)Mechanism(s) foFailure
Occurrence
Weld Nut toPedestal
Welded cyldswithout nut present
8
Operator fails to loadnut into welder
2
Nut Present Nut not present Cannot assemble seatbelt restraint to pedestal
5
Nut is loaded bytfalls cut before weld
cycle1
Variation inpedestalraw material
2
Wld strengthvariation is too large
6
Variation in weld nutraw material
2
Nut WeldedSecurely
Nut weldedInsecurely
Bolt breaks weld nutloose when seat beltrestraint is assembled
6
Incorrect welder set-up
2
DOE www.nissanchair.com
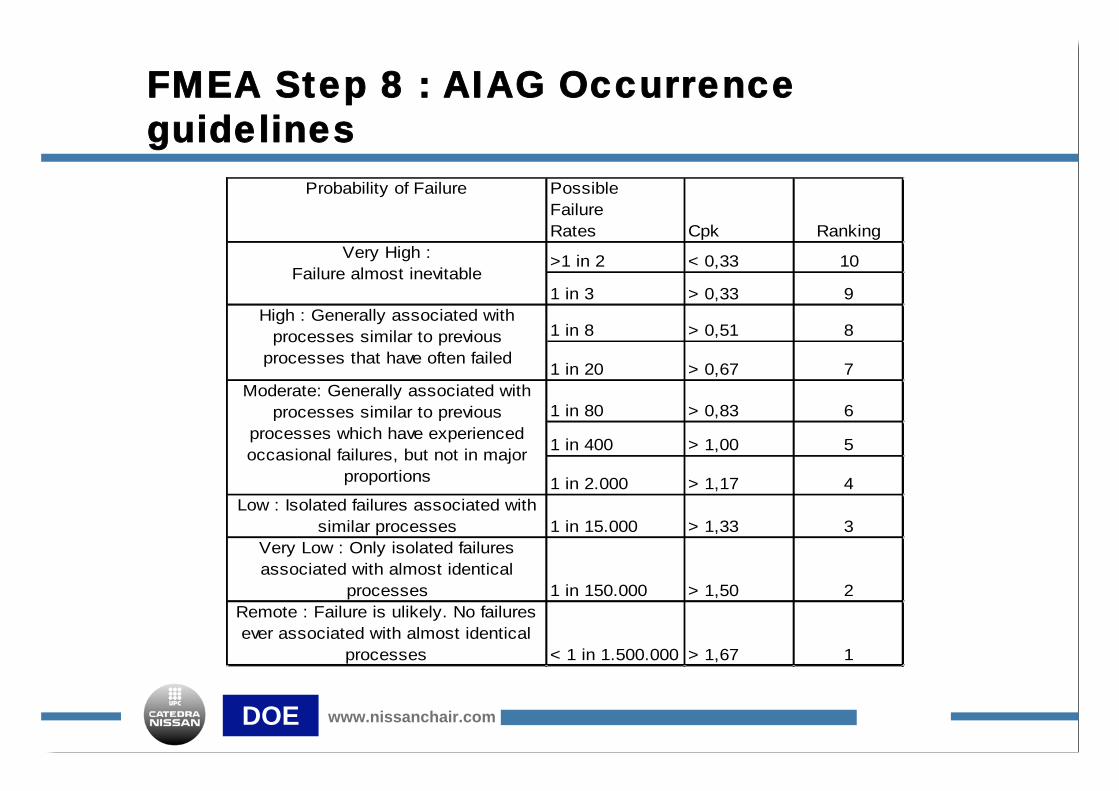
FMEA Step 8 : AIAG Occurrence
guidelines
Probability of Failure Possible
Failure
Rates Cpk Ranking
>1 in 2 < 0,33 10
1 in 3 > 0,33 9
1 in 8 > 0,51 8
1 in 20 > 0,67 7
1 in 80 > 0,83 6
1 in 400 > 1,00 5
1 in 2.000 > 1,17 4
Low : Isolated failures associated with
similar processes 1 in 15.000 > 1,33 3
Very Low : Only isolated failures
associated with almost identical
processes 1 in 150.000 > 1,50 2
Remote : Failure is ulikely. No failures
ever associated with almost identical
processes < 1 in 1.500.000 > 1,67 1
Very High :
Failure almost inevitable
High : Generally associated with
processes similar to previous
processes that have often failed
Moderate: Generally associated with
processes similar to previous
processes which have experienced
occasional failures, but not in major
proportions
DOE www.nissanchair.com
FMEA Tips about Step 8For each cause of failure, estimate the likelihood of
occurrence.
Tips about Step 8:
The auto industry uses the AIAG as a standard.
Controls Division uses as 1 to 5 system.
Whatever guidelines are used…
- Keep a copy with your FMEA
- Always make the highest number most
severe the lowest least severe.
DOE www.nissanchair.com
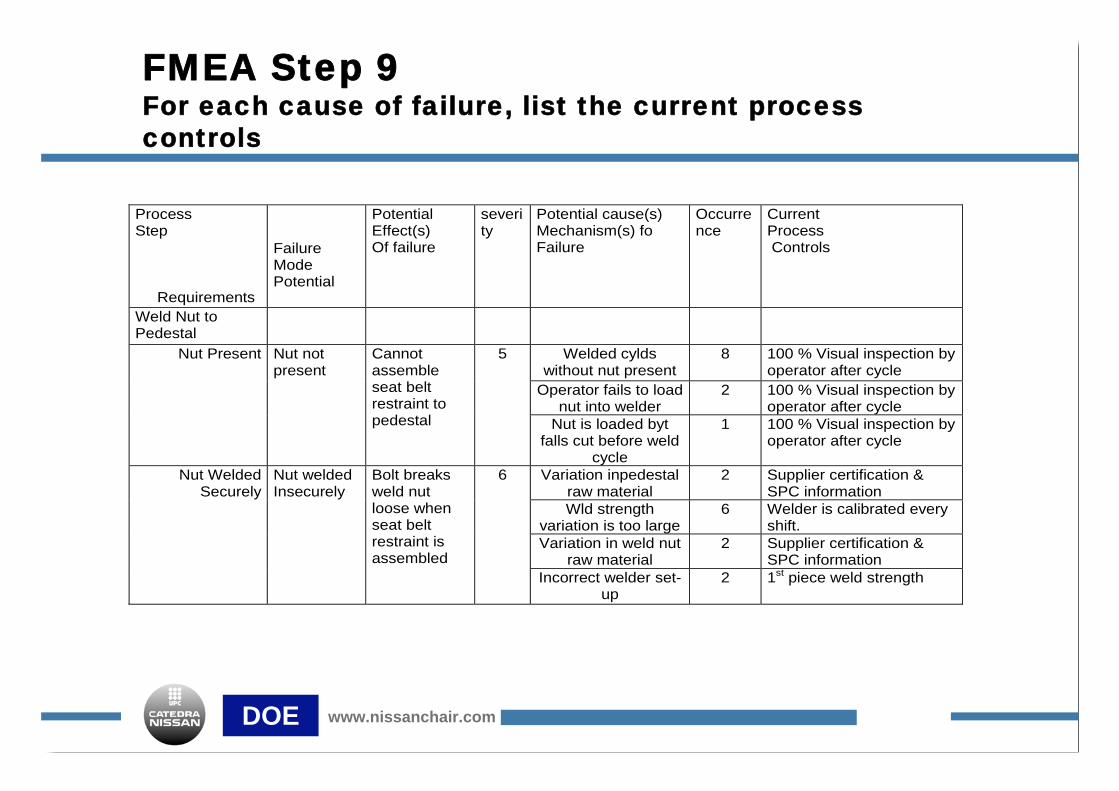
FMEA Step 9For each cause of failure, list the current process
controls
ProcessStep
Requirements
FailureModePotential
PotentialEffect(s)Of failure
severity
Potential cause(s)Mechanism(s) foFailure
Occurrence
CurrentProcess Controls
Weld Nut toPedestal
Welded cyldswithout nut present
8 100 % Visual inspection byoperator after cycle
Operator fails to loadnut into welder
2 100 % Visual inspection byoperator after cycle
Nut Present Nut notpresent
Cannotassembleseat beltrestraint topedestal
5
Nut is loaded bytfalls cut before weld
cycle
1 100 % Visual inspection byoperator after cycle
Variation inpedestalraw material
2 Supplier certification &SPC information
Wld strengthvariation is too large
6 Welder is calibrated everyshift.
Variation in weld nutraw material
2 Supplier certification &SPC information
Nut WeldedSecurely
Nut weldedInsecurely
Bolt breaksweld nutloose whenseat beltrestraint isassembled
6
Incorrect welder set-up
2 1st piece weld strength

DOE www.nissanchair.com
FMEA Tips about Step 9For eahc cause of failure, list the current process
controls
Tips about Step 9:
Make sure you list the actual controls.
Do not list “wannabe” controls.
Be brutally honest, if there is no control, just say it.
Frequently, there is no control for the cause of the
failure mode; but there is a control to detect the failure
mode itself.
DOE www.nissanchair.com
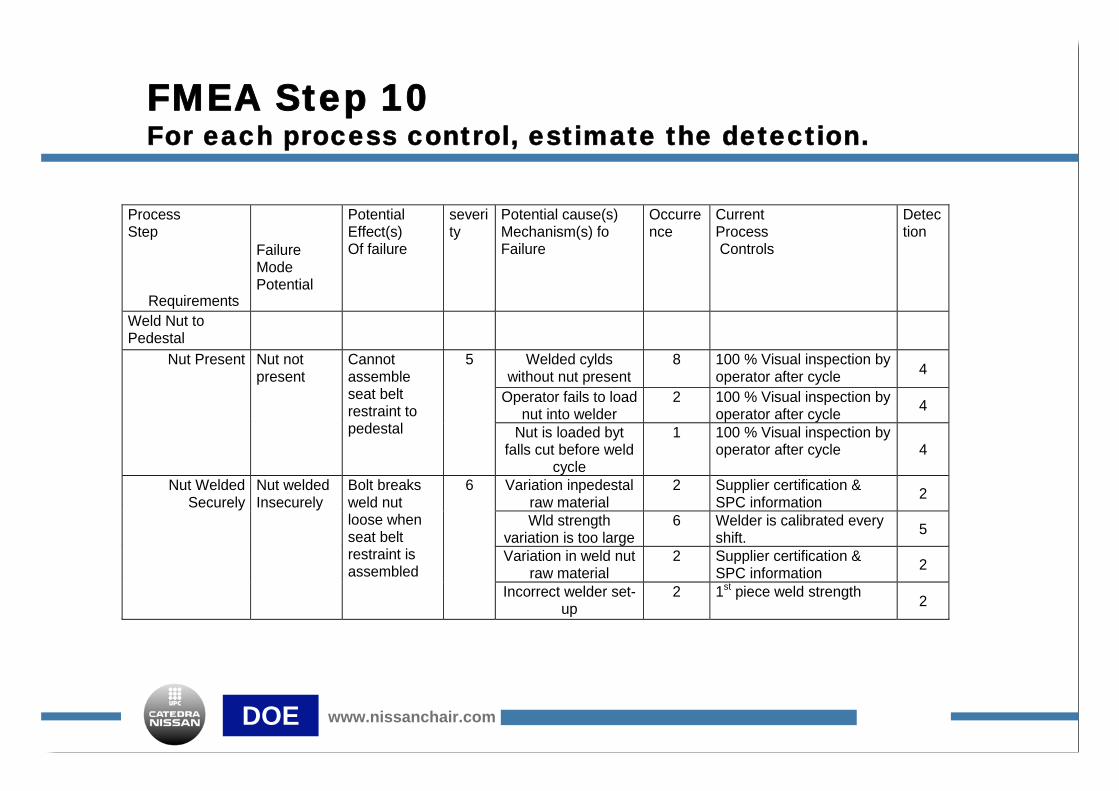
FMEA Step 10For each process control, estimate the detection.
ProcessStep
Requirements
FailureModePotential
PotentialEffect(s)Of failure
severity
Potential cause(s)Mechanism(s) foFailure
Occurrence
CurrentProcess Controls
Detection
Weld Nut toPedestal
Welded cyldswithout nut present
8 100 % Visual inspection byoperator after cycle
4
Operator fails to loadnut into welder
2 100 % Visual inspection byoperator after cycle
4
Nut Present Nut notpresent
Cannotassembleseat beltrestraint topedestal
5
Nut is loaded bytfalls cut before weld
cycle
1 100 % Visual inspection byoperator after cycle 4
Variation inpedestalraw material
2 Supplier certification &SPC information
2
Wld strengthvariation is too large
6 Welder is calibrated everyshift.
5
Variation in weld nutraw material
2 Supplier certification &SPC information
2
Nut WeldedSecurely
Nut weldedInsecurely
Bolt breaksweld nutloose whenseat beltrestraint isassembled
6
Incorrect welder set-up
2 1st piece weld strength2
DOE www.nissanchair.com
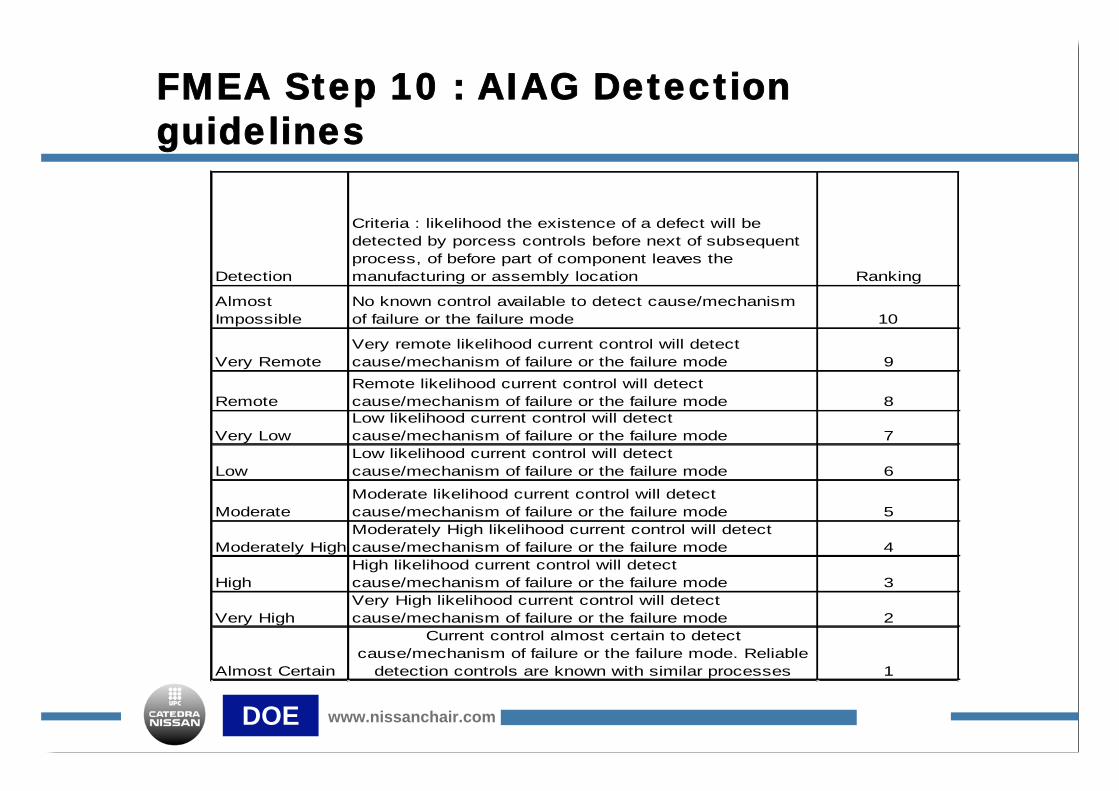
FMEA Step 10 : AIAG Detection
guidelines
Detection
Criteria : likelihood the existence of a defect will be
detected by porcess controls before next of subsequent
process, of before part of component leaves the
manufacturing or assembly location Ranking
Almost
Impossible
No known control available to detect cause/mechanism
of failure or the failure mode 10
Very Remote
Very remote likelihood current control will detect
cause/mechanism of failure or the failure mode 9
Remote
Remote likelihood current control will detect
cause/mechanism of failure or the failure mode 8
Very Low
Low likelihood current control will detect
cause/mechanism of failure or the failure mode 7
Low
Low likelihood current control will detect
cause/mechanism of failure or the failure mode 6
Moderate
Moderate likelihood current control will detect
cause/mechanism of failure or the failure mode 5
Moderately High
Moderately High likelihood current control will detect
cause/mechanism of failure or the failure mode 4
High
High likelihood current control will detect
cause/mechanism of failure or the failure mode 3
Very High
Very High likelihood current control will detect
cause/mechanism of failure or the failure mode 2
Almost Certain
Current control almost certain to detect
cause/mechanism of failure or the failure mode. Reliable
detection controls are known with similar processes 1
DOE www.nissanchair.com
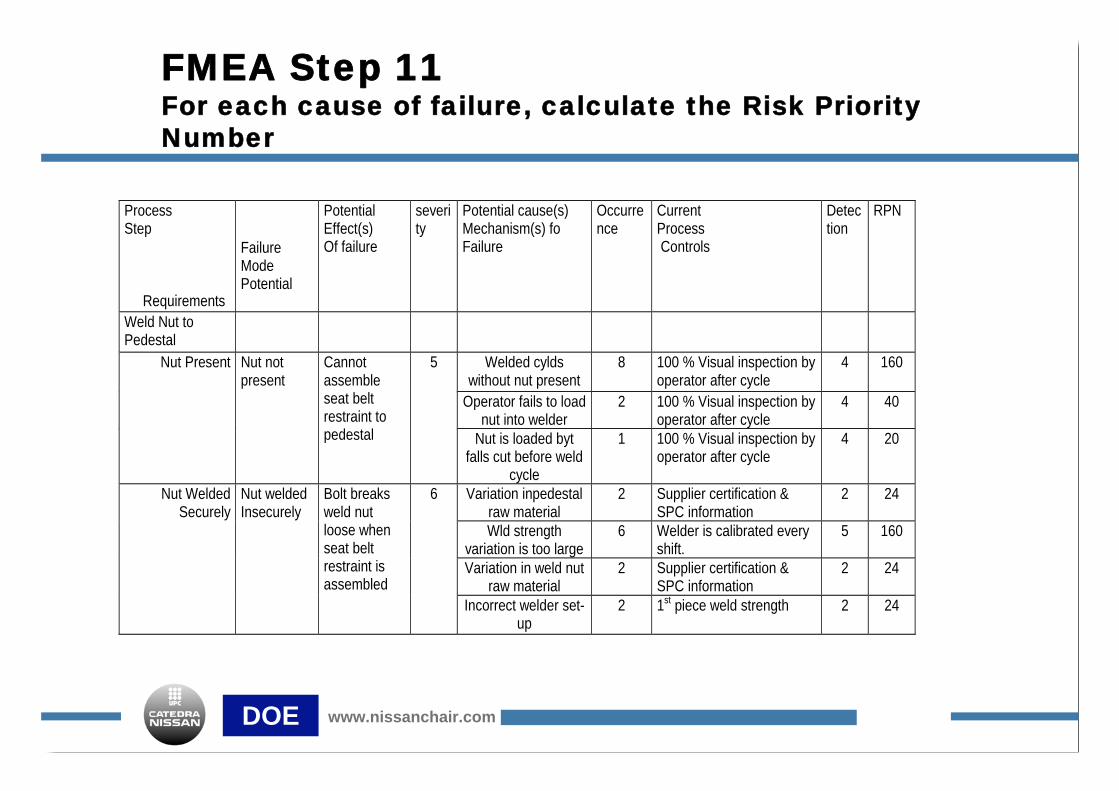
FMEA Step 11For each cause of failure, calculate the Risk Priority
Number
ProcessStep
Requirements
FailureModePotential
PotentialEffect(s)Of failure
severity
Potential cause(s)Mechanism(s) foFailure
Occurrence
CurrentProcess Controls
Detection
RPN
Weld Nut toPedestal
Welded cyldswithout nut present
8 100 % Visual inspection byoperator after cycle
4 160
Operator fails to loadnut into welder
2 100 % Visual inspection byoperator after cycle
4 40
Nut Present Nut notpresent
Cannotassembleseat beltrestraint topedestal
5
Nut is loaded bytfalls cut before weld
cycle
1 100 % Visual inspection byoperator after cycle
4 20
Variation inpedestalraw material
2 Supplier certification &SPC information
2 24
Wld strengthvariation is too large
6 Welder is calibrated everyshift.
5 160
Variation in weld nutraw material
2 Supplier certification &SPC information
2 24
Nut WeldedSecurely
Nut weldedInsecurely
Bolt breaksweld nutloose whenseat beltrestraint isassembled
6
Incorrect welder set-up
2 1st piece weld strength 2 24

DOE www.nissanchair.com
Risk Priority Number (RPN)
The RPN number is calculated from the team´s
estimates of Severity, Occurrence and Detection.
RPN = S x O x D
If you ar using 1-10 scale for Severtiy, Occurrence and
Detection, the worst RPN = 1000 (10x10x10), while the
best would be RPN = 1 (1x1x1)
Use RPN numbers to prioritize failure modes and/or
causes of failures in order to work on the highest priority
issues.
DOE www.nissanchair.com
FMEA Tips about Step 11For each cause of failure, calculate the Risk Priority
Number
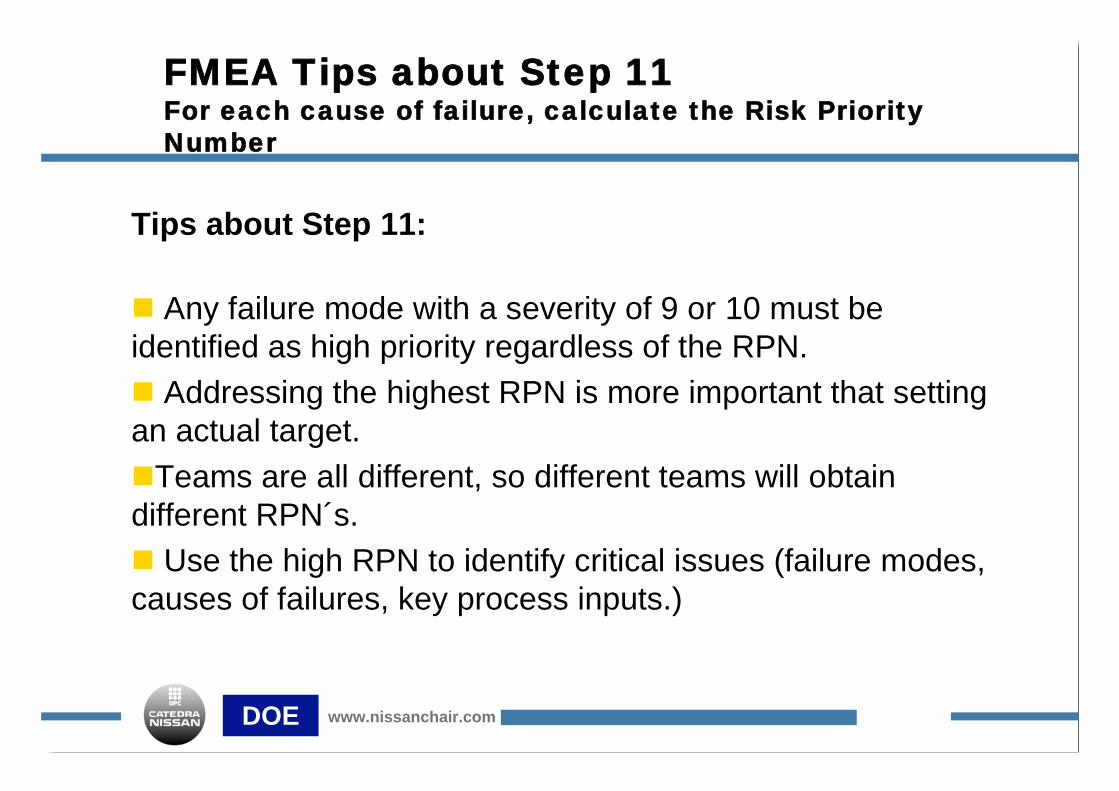
Tips about Step 11:
Any failure mode with a severity of 9 or 10 must be
identified as high priority regardless of the RPN.
Addressing the highest RPN is more important that setting
an actual target.
Teams are all different, so different teams will obtain
different RPN´s.
Use the high RPN to identify critical issues (failure modes,
causes of failures, key process inputs.)
DOE www.nissanchair.com
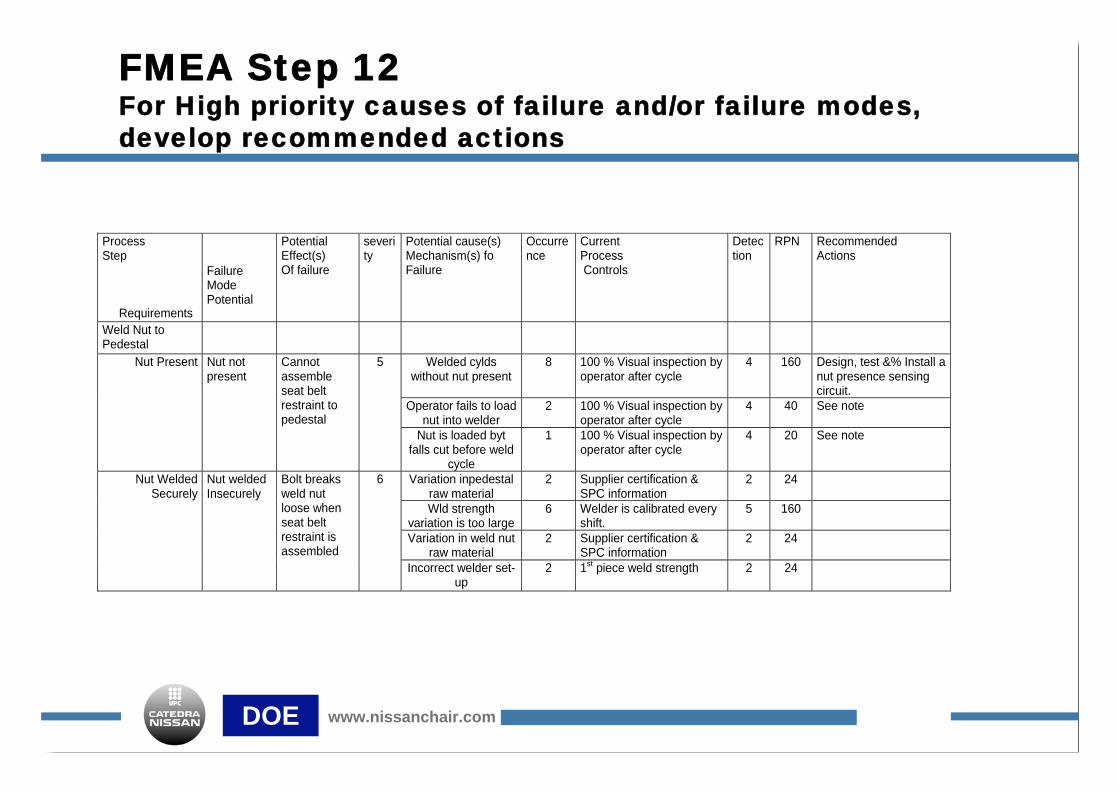
FMEA Step 12For High priority causes of failure and/or failure modes,
develop recommended actions
ProcessStep
Requirements
FailureModePotential
PotentialEffect(s)Of failure
severity
Potential cause(s)Mechanism(s) foFailure
Occurrence
CurrentProcess Controls
Detection
RPN RecommendedActions
Weld Nut toPedestal
Welded cyldswithout nut present
8 100 % Visual inspection byoperator after cycle
4 160 Design, test &% Install anut presence sensingcircuit.
Operator fails to loadnut into welder
2 100 % Visual inspection byoperator after cycle
4 40 See note
Nut Present Nut notpresent
Cannotassembleseat beltrestraint topedestal
5
Nut is loaded bytfalls cut before weld
cycle
1 100 % Visual inspection byoperator after cycle
4 20 See note
Variation inpedestalraw material
2 Supplier certification &SPC information
2 24
Wld strengthvariation is too large
6 Welder is calibrated everyshift.
5 160
Variation in weld nutraw material
2 Supplier certification &SPC information
2 24
Nut WeldedSecurely
Nut weldedInsecurely
Bolt breaksweld nutloose whenseat beltrestraint isassembled
6
Incorrect welder set-up
2 1st piece weld strength 2 24
DOE www.nissanchair.com
FMEA Step 13For each recommended action, assign responsibility and completion
dates.
FMEA Step 14For each recommended action, implement the action and note its
affect.
FMEA Step 15
For each implemented action, re-estimate the severity, occurrence and
detection rankings and recalculate the RPN.
Next Steps
DOE www.nissanchair.com
FMEA Tips about Step 15For each implemented action, re-estimate the severity,
occurrence and detection rankings and recalculate the RPN
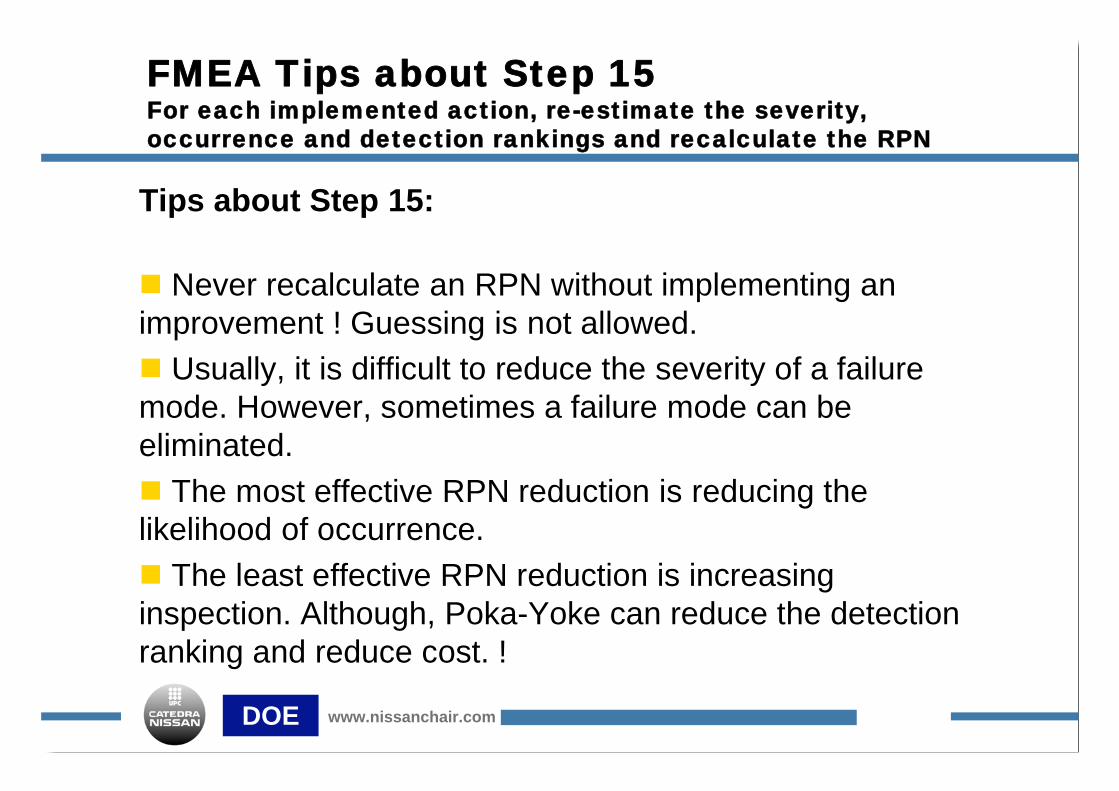
Tips about Step 15:
Never recalculate an RPN without implementing an
improvement ! Guessing is not allowed.
Usually, it is difficult to reduce the severity of a failure
mode. However, sometimes a failure mode can be
eliminated.
The most effective RPN reduction is reducing the
likelihood of occurrence.
The least effective RPN reduction is increasing
inspection. Although, Poka-Yoke can reduce the detection
ranking and reduce cost. !
TOI -530
Departament
d’Organització
d’EmpresesDOE
Ejercicio 15
Matriz Priorización: Partiendo de
las soluciones encontradas en el
ejercicio 4 (process map) mejora
proceso Burger Queen, marca un
orden de preferencia.
Decide los criterios y justifica los
resultados
Tiempo: 15 min (ejercicio) + 20 min
(todas las presentaciones)

TOI -540
Departament
d’Organització
d’EmpresesDOE
Ejercicio 16
AMFE: Realiza un análisis de
riesgo, utilizando el formato AMFE
teniendo en cuenta las soluciones
propuestas en el ejercicio 8 (QFD),
de diseño evento presentación
vehículos a prensa
Decide los modos de fallo, y
define acciones
preventivas/correctivas para los
modos con riesgo mayorTiempo: 30 min (ejercicio) + 50 min
(todas las presentaciones)
TOI -550
Departament
d’Organització
d’EmpresesDOE
SAMPLE SIZE
Fase 4. Herramientas
TOI -560DOE www.nissanchair.com
Execute a Trial / Sample size
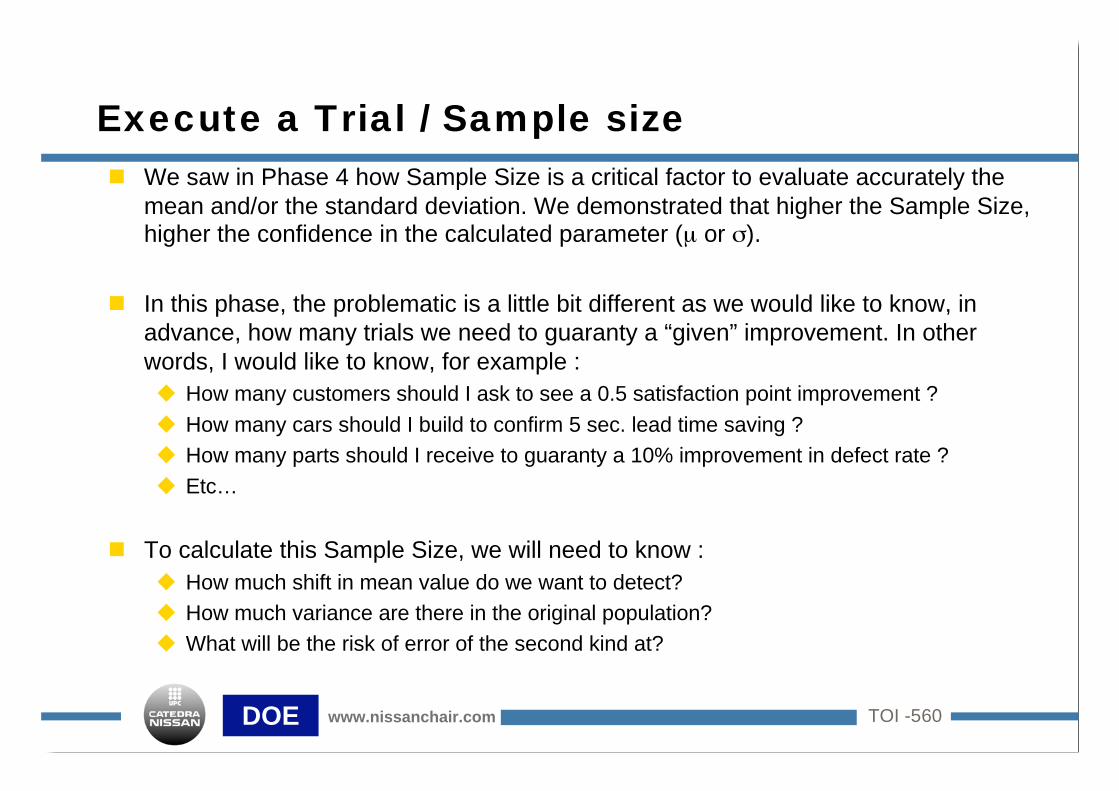
We saw in Phase 4 how Sample Size is a critical factor to evaluate accurately the
mean and/or the standard deviation. We demonstrated that higher the Sample Size,higher the confidence in the calculated parameter (μ or ).
In this phase, the problematic is a little bit different as we would like to know, in
advance, how many trials we need to guaranty a “given” improvement. In other
words, I would like to know, for example :
How many customers should I ask to see a 0.5 satisfaction point improvement ?
How many cars should I build to confirm 5 sec. lead time saving ?
How many parts should I receive to guaranty a 10% improvement in defect rate ?
Etc…
To calculate this Sample Size, we will need to know :
How much shift in mean value do we want to detect?
How much variance are there in the original population?
What will be the risk of error of the second kind at?

TOI -570DOE www.nissanchair.com
Expected
result of
the
project
Before
Project
started
Execute a Trial / Sample size
37% defect
5% defect
USL= 16 days
15 days
10 days
Assumption :
St Dev remains the
sameDistanc
e to be
detecte
d1-How many
samples to detect
a 5 day
improvement ?
2-What level of
risk do I take ?

TOI -580DOE www.nissanchair.com
Let’s be practical !
We will explore sample size calculation for 3 cases :
1) How many samples do we need to show a difference of
mean versus a historical population ?
2) How many samples do we need to show a difference
between two means ?
3) How many sample do we need to show a difference on
proportions ?
Execute a Trial / Sample size
TOI -590DOE www.nissanchair.com
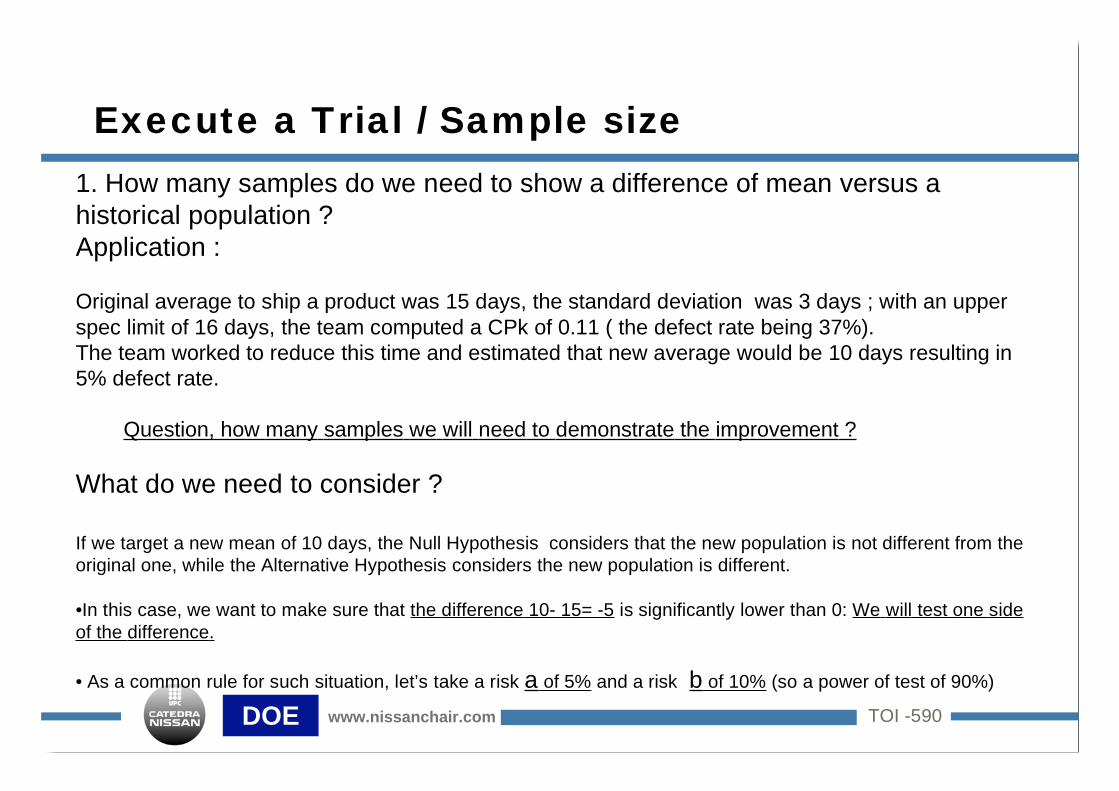
1. How many samples do we need to show a difference of mean versus a
historical population ?
Application :
Original average to ship a product was 15 days, the standard deviation was 3 days ; with an upper
spec limit of 16 days, the team computed a CPk of 0.11 ( the defect rate being 37%).
The team worked to reduce this time and estimated that new average would be 10 days resulting in
5% defect rate.
Question, how many samples we will need to demonstrate the improvement ?
What do we need to consider ?
If we target a new mean of 10 days, the Null Hypothesis considers that the new population is not different from the
original one, while the Alternative Hypothesis considers the new population is different.
•In this case, we want to make sure that the difference 10- 15= -5 is significantly lower than 0: We will test one side
of the difference.
• As a common rule for such situation, let’s take a risk a of 5% and a risk b of 10% (so a power of test of 90%)
Execute a Trial / Sample size
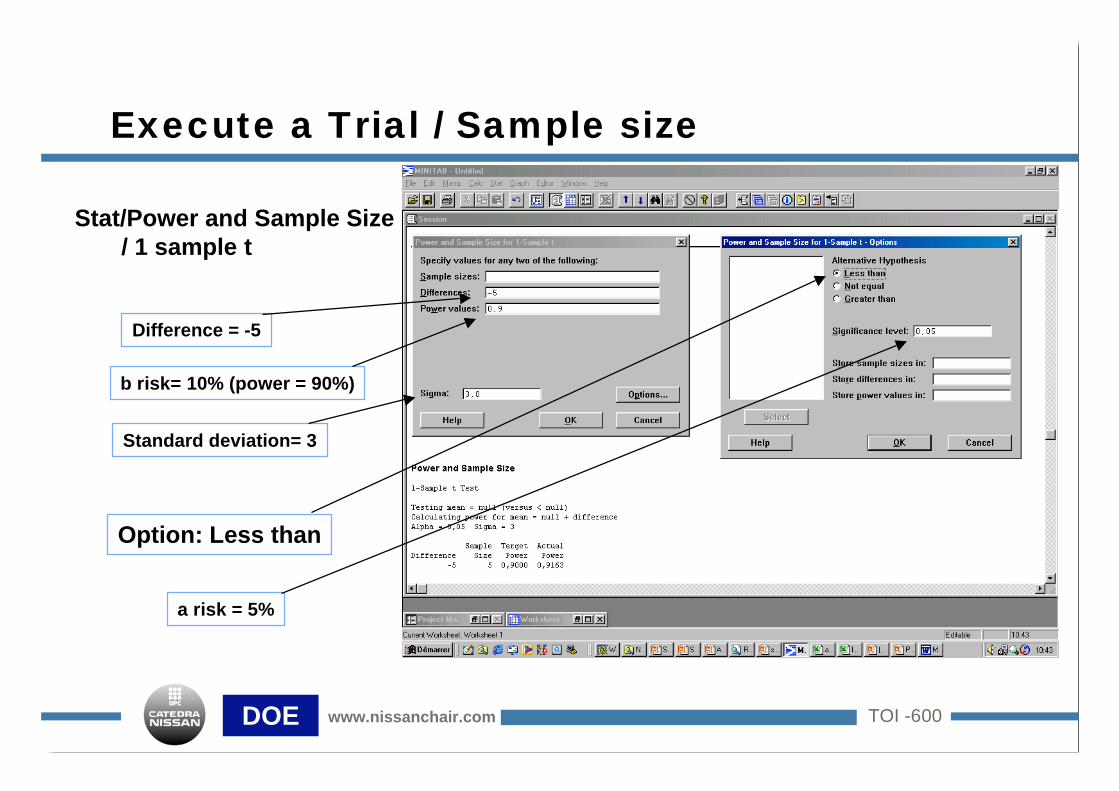
TOI -600DOE www.nissanchair.com
Stat/Power and Sample Size
/ 1 sample t
Option: Less than
Standard deviation= 3
a risk = 5%
Difference = -5
b risk= 10% (power = 90%)
Execute a Trial / Sample size

TOI -610DOE www.nissanchair.com
Power and Sample Size
1-Sample t Test
Testing mean = null (versus < null)
Calculating power for mean = null + difference
Alpha = 0,05 Sigma = 3
Sample Target Actual
Difference Size Power Power
-5 5 0,9000 0,9163
Let’s redo the test with risks of a=b=1%, how many samples do we need?
Let’s suppose we are targeting a new mean of 13 days (i.e 25% defect rate), how many samples do we need?
With only 5 samples, we will be able to demonstrate a
difference with the level of risk we selected and
assuming the standard deviation remained at 3 days.
Practically, we will :
• collect those 5 samples
• calculate the new mean
• compare with the old one
• do a t-test to validate the difference.
Execute a Trial / Sample size
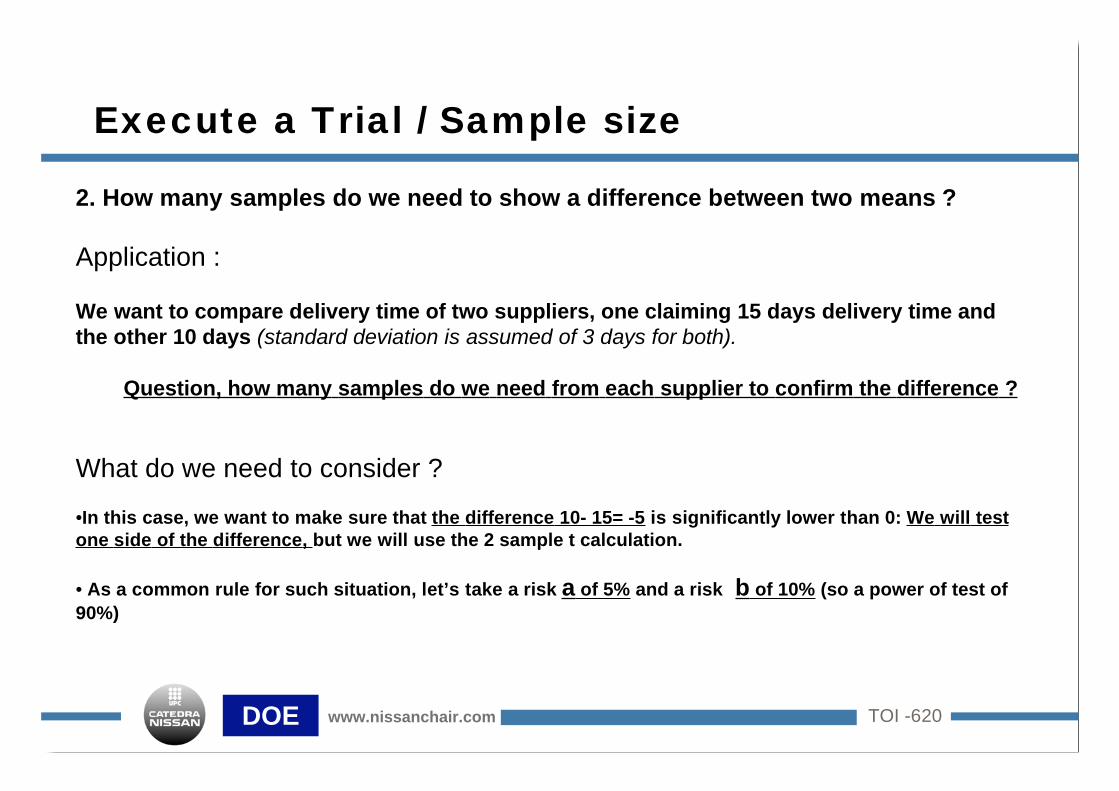
TOI -620DOE www.nissanchair.com
2. How many samples do we need to show a difference between two means ?
Application :
We want to compare delivery time of two suppliers, one claiming 15 days delivery time and
the other 10 days (standard deviation is assumed of 3 days for both).
Question, how many samples do we need from each supplier to confirm the difference ?
What do we need to consider ?
•In this case, we want to make sure that the difference 10- 15= -5 is significantly lower than 0: We will test
one side of the difference, but we will use the 2 sample t calculation.
• As a common rule for such situation, let’s take a risk a of 5% and a risk b of 10% (so a power of test of
90%)
Execute a Trial / Sample size
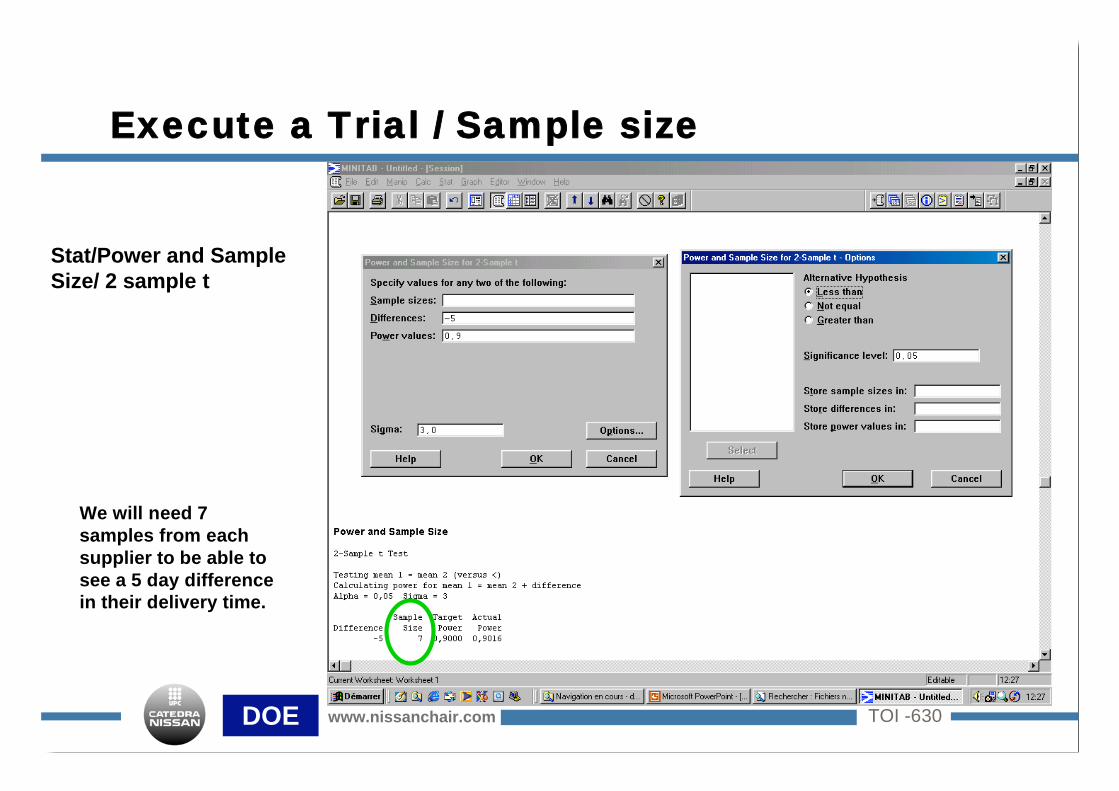
TOI -630DOE www.nissanchair.com
Stat/Power and Sample
Size/ 2 sample t
We will need 7
samples from each
supplier to be able to
see a 5 day difference
in their delivery time.
Execute a Trial / Sample size
TOI -640DOE www.nissanchair.com
3. How many sample do we need to show a difference on proportions ?
Application :
Back to our first example… Let’s suppose we only have defect rate, we want to
know how many sample we need to go from historical defect rate of 37% down
to 5%.
Question, how many samples do we need to confirm this improvement ?
What do we need to consider ?
• In this case, we will only need the historical % and the targeted %
• As a common rule for such situation, let’s take a risk a of 5% and a risk b of 10% (so a power of test of
90%)
Execute a Trial / Sample size
TOI -650DOE www.nissanchair.com
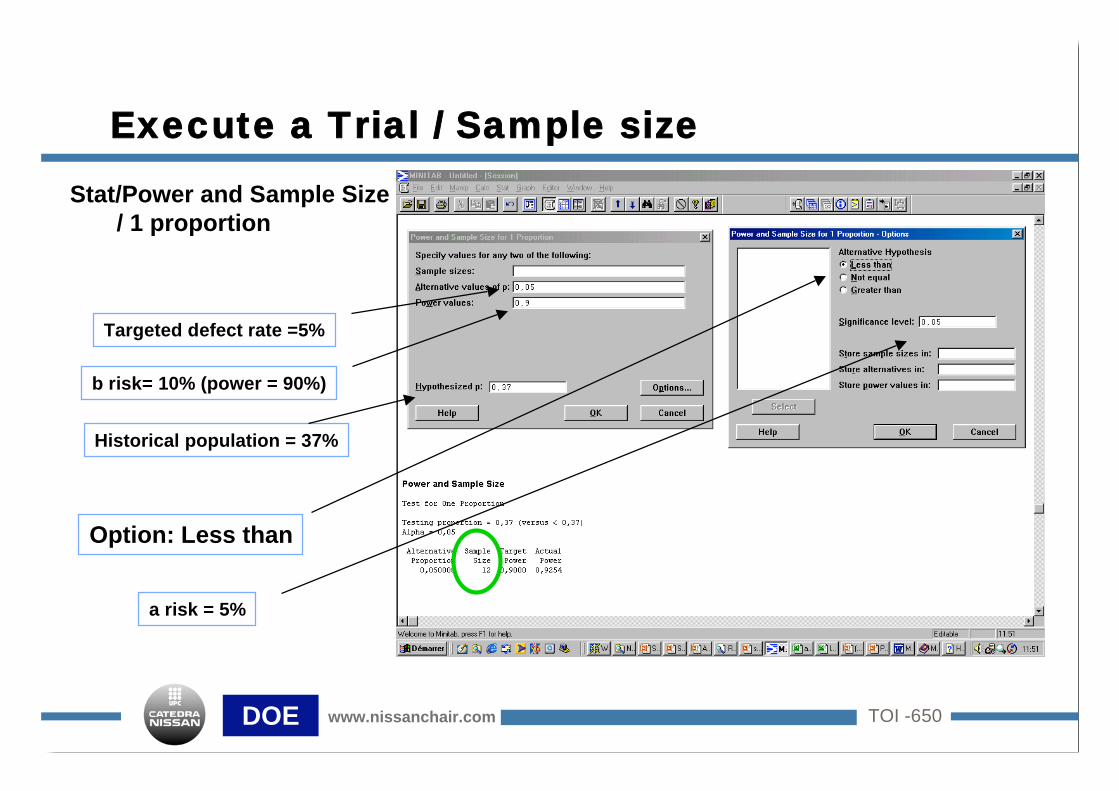
Stat/Power and Sample Size
/ 1 proportion
Option: Less than
Historical population = 37%
Targeted defect rate =5%
b risk= 10% (power = 90%)
a risk = 5%
Execute a Trial / Sample size

TOI -660DOE www.nissanchair.com
Power and Sample Size
Test for One Proportion
Testing proportion = 0,37 (versus < 0,37)
Alpha = 0,05
Alternative Sample Target Actual
Proportion Size Power Power
0,050000 12 0,9000 0,9254
Let’s redo the test with risks of a=b=1%, how many samples do we need?
Let’s suppose we are targeting 25% defect rate, how many samples do we need?
We will need 12 samples to demonstrate a
difference with the level of risk we took
versus 5 samples if we had continuous data
Execute a Trial / Sample size
TOI -670DOE www.nissanchair.com
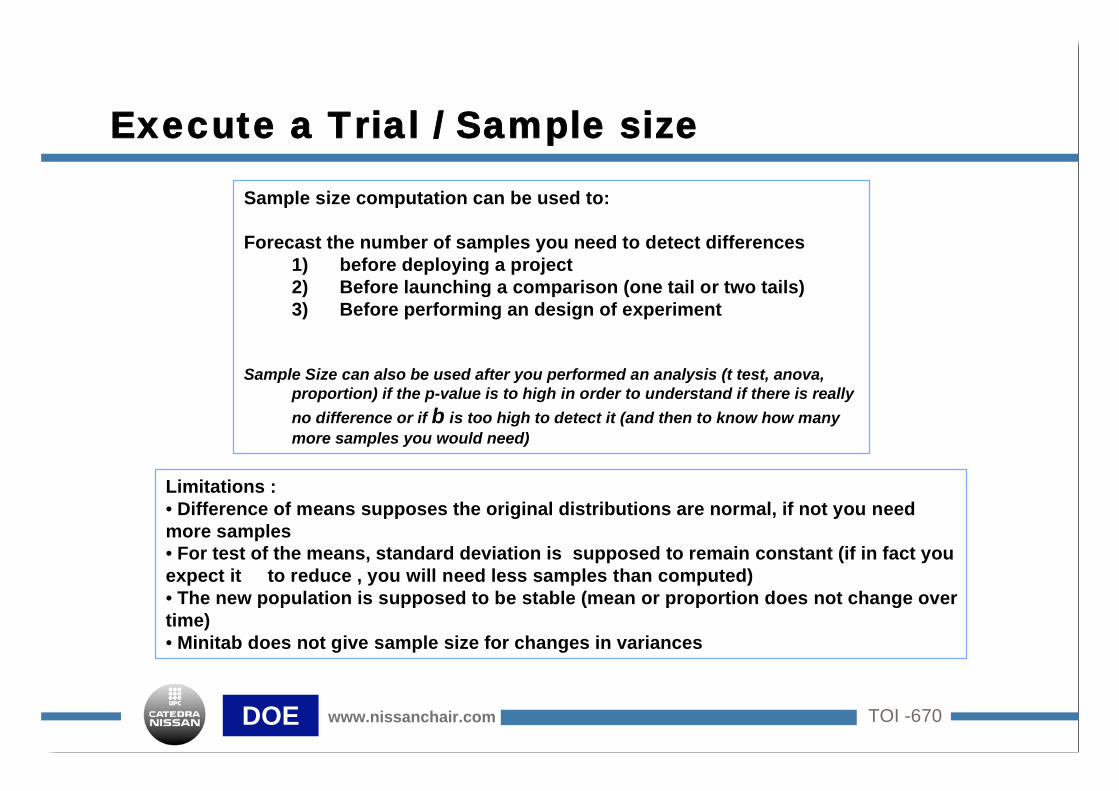
Sample size computation can be used to:
Forecast the number of samples you need to detect differences
1) before deploying a project
2) Before launching a comparison (one tail or two tails)
3) Before performing an design of experiment
Sample Size can also be used after you performed an analysis (t test, anova,
proportion) if the p-value is to high in order to understand if there is really
no difference or if b is too high to detect it (and then to know how many
more samples you would need)
Limitations :
• Difference of means supposes the original distributions are normal, if not you need
more samples
• For test of the means, standard deviation is supposed to remain constant (if in fact you
expect it to reduce , you will need less samples than computed)
• The new population is supposed to be stable (mean or proportion does not change over
time)
• Minitab does not give sample size for changes in variances
Execute a Trial / Sample size