efectos de tasa impositiva y la evasion
TRANSCRIPT
8/13/2019 Efectos de Tasa Impositiva y La Evasion
http://slidepdf.com/reader/full/efectos-de-tasa-impositiva-y-la-evasion 1/42
The Effect of Awareness and Incentiveson Tax Evasion
Annette AlstadsæterMartin Jacob
CES IFO WORKING PAPER NO. 4369CATEGORY 1: PUBLIC FINANCE
AUGUST 2013
Presented at CESifo Area Conference on Public Sector Economics, April 2013
An electronic version of the paper may be downloaded• from the SSRN website: www.SSRN.com
• from the RePEc website: www.RePEc.org• from the CESifo website: Twww.CESifo-group.org/wp T
8/13/2019 Efectos de Tasa Impositiva y La Evasion
http://slidepdf.com/reader/full/efectos-de-tasa-impositiva-y-la-evasion 2/42
CESifo Working Paper No. 4369
The Effect of Awareness and Incentiveson Tax Evasion
Abstract
We examine the role of tax incentives, tax awareness, and complexity in tax evasion. Weobserve a specific type of tax evasion among business owners in Swedish administrative panel data, after the tax authority has approved all tax returns. For the period 2006–2009,approximately 5% of tax returns overstate a claimed dividend allowance. Tax awarenessdecreases and complexity increases the likelihood of misreporting. Our results indicate thatsome observed misreporting could be accidental, while some misreporting is deliberate taxevasion. We identify a positive and significant effect of tax rates on tax evasion, by exploitinga large kink in the tax schedule. The majority of misreporting cases remains undetected by thetax authority. Self-correction of tax evasion by taxpayers is the dominant type of detection.
JEL-Code: H260, H240, D140.
Keywords: tax evasion, tax compliance, tax enforcement, tax awareness, detection.
Annette AlstadsæterUniversity of Oslo
Institute of Health Management and Health Economics
P.O. Box 1089 Blindern Norway – 0317 Oslo
Martin Jacob*WHU – Otto Beisheim School of
Management Burgplatz 2
Germany – 56179 [email protected]
*corresponding authorAugust 14, 2013We thank Jan-Erik Bäckman, Kay Blaufus, Michael Devereux, Sebastian Eichfelder, TimGoodspeed, Igor Goncharov, Christina Günther, Ingemar Hansson, Jochen Hundsdoerfer,Claus Thustrup Kreiner, Kaisa Kotakorpi, Christian Leuz, Henry Ohlsson, Michael Overesch,Agnar Sandmo, Thorsten Sellhorn, Joel Slemrod, Altin Vejsiu, and seminar participants at theUniversity of Copenhagen, University of Frankfurt am Main, WHU - Otto Beisheim Schoolof Management, Oxford Centre for Business Taxation 2013 Annual Symposium, 2013CESifo Area Conference on Public Sector Economics in Munich, the 2013 Nordic Workshopon Tax Evasion in Stockholm, 9th arqus-meeting in Bochum, and the Swedish tax authoritySkatteverket for helpful comments and suggestions. Alstadsæter gratefully acknowledges

8/13/2019 Efectos de Tasa Impositiva y La Evasion
http://slidepdf.com/reader/full/efectos-de-tasa-impositiva-y-la-evasion 3/42
1 Introduction
Taxpayers try to minimize tax liability through legal or illegal means. At the same time, taxauthorities attempt to improve compliance, detect tax evasion, enforce tax rules, and close un-intended loopholes for legal tax avoidance. 1 A growing literature emphasizes tax awareness as
an explanation as to why some taxpayers engage in legal tax avoidance activities while othersdo not. Taxpayer awareness of tax rules depends on the salience of taxes (Chetty, Looney, andKroft, 2009; Finkelstein, 2009). Slowness in adaption to changing income levels or procrastinationmay also explain why not all individuals respond to tax incentives (Jones, 2012; Kopczuk, 2012).Further, the ability to process available tax information varies across individuals and dependson the ow of information through informal networks (Alstadsæter, Kopczuk, and Telle, 2012;Chetty, Friedman, and Saez, 2013; Alstadsæter and Jacob, 2013). These arguments also explainwhy we observe less illegal tax evasion than we would expect from standard economic models.Kleven, Knudsen, Kreiner, Pedersen, and Saez (2011) show that not everyone with access to taxevasion opportunities actually chooses to participate in such activity. Non-pecuniary factors suchas moral disposition, norms, social conscience, and attitudes towards government all play a role inexplaining non-participation in tax evasion (Andreoni, Erard, and Feinstein, 1998; Slemrod, 2003;Sandmo, 2005, 2012).
While most of these arguments relate to the conscious decision to evade taxes, some taxpayersmay accidently le erroneous tax returns. Complexity of the tax system can increase unintentionalas well as intentional non-compliance (Kopczuk, 2006; Slemrod, 2007). The design of the taxreturn form can induce non-compliance if taxpayers have difficulty understanding the information
provided and asked for in the form. At the same time, taxpayers may deliberately take advantage of complex rules and tax forms if they perceive a low probability of detection. Therefore, organizationof the tax administration and strength of tax enforcement additionally affect non-compliance bytaxpayers. For example, if control routines of tax authorities are not adjusted following a taxreform that changes incentives, neither accidental nor intended tax evasion may be detected. Thisstudy examines the effects of complexity, tax awareness, and tax incentives on tax evasion.
The general challenge of any empirical study on tax evasion is the lack of appropriate data andan unobservable dependent variable. When using administrative data, the extent of tax evasion isunknown, since tax evasion is dened as the difference between true and (under-)reported income.In contrast to other studies (e.g., Clotfelter, 1983; Feinstein, 1991; Kleven, Knudsen, Kreiner,Pedersen, and Saez, 2011), we have a unique setting to empirically study tax evasion and non-compliance. We directly observe systematic errors in tax returns of business owners after thetax authority has approved the tax returns. By merging information across taxpayers and across
1 In practice there is a blurry line between legal tax avoidance and illegal tax evasion, due to unclear regulations,lack of enforcement, and tax agencies’ focus on particular types of transactions (Slemrod and Yitzhaki, 2002).
1

8/13/2019 Efectos de Tasa Impositiva y La Evasion
http://slidepdf.com/reader/full/efectos-de-tasa-impositiva-y-la-evasion 4/42
corporate and individual tax returns, we are able to uncover a specic type of tax evasion inadministrative data.
We use a large Swedish micro-panel data set for the years 2006–2009 with information onincome, tax rates, and other socioeconomic variables for individuals. This panel covers the popu-lation of all tax returns of all active Swedish closely held corporation (CHC) owners, including the
corresponding corporate tax returns. 2 The advantage of our tax evasion measure is that the extentof evasion is observable. We dene tax evasion as the difference between a claimed allowance,which is observed in the data, and the legal maximum allowance, which is dened in the tax code.More specically, we are interested in the dividend allowance, which determines the amount of dividends from a CHC that active owners may receive at a preferential tax rate. This dividendallowance is dened as a xed lump-sum per rm in a scal year. 3 The allowance is allocatedacross owners according to their share in equity. As the dividend allowance is claimed by eachshareholder individually, shareholders in a CHC with more than one owner can claim outright adividend allowance above their actual share. By overstating this dividend allowance, taxpayersattempt to illegally reclassify labor income as dividend income to reduce the total tax burden.
Over our sample period, approximately 5% of active owners overstate their dividend allowanceand, consequently, evade taxes. However, since 60% of individuals overstating the dividend al-lowance do not generate tax benets from such overstatement (based on current tax status), someof the tax evasion observed on the tax return data appears to be accidental. That is, some observedmisreporting is due to accidental mistakes and some is due to intended tax evasion. Both casesare treated as tax evasion under Swedish tax law. Both accidental and intentional tax evasionlead to penalties if detected and if the evasion generates a tax benet in the current tax year. In
contrast, if there is no dividend payout in the year of overstatement and detection, the authoritydoes not impose a penalty. 4 The tax authority treats this case as evasion but simply corrects the“mistake.” The taxpayer’s advantage from the latter treatment of tax evasion is that an overstatedand undetected dividend allowance in a year without a dividend payout can be carried forwardwith interest. This is a valuable option on future tax savings, as dividends of private, and in par-ticular of closely held rms, are very exible and are paid out irregularly (Jacob and Alstadsæter,2013). The Swedish tax administration did not systematically control for this type of tax evasionin the past. The tax authority does not merge information across shareholders to test if owners jointly claim a dividend allowance above the legal maximum per rm.
2 CHCs form the one of the most important organizational forms in Sweden. About 60% of all Swedish corpora-tions are treated as CHCs.
3 This allowance is used by 80% of CHC owners. Owners can choose an alternative calculation method, wherethe dividend allowance depends on equity and wages paid by the corporation.
4 In other jurisdictions, accidental and unintended tax evasion, i.e., negligence, usually yields lower penalties thanintentional tax evasion, i.e., tax fraud. For example, the Internal Revenue Service (IRS) imposes nes of up to 20%on accidental tax evasion while tax fraud can lead to a ne of up to 75%.
2

8/13/2019 Efectos de Tasa Impositiva y La Evasion
http://slidepdf.com/reader/full/efectos-de-tasa-impositiva-y-la-evasion 5/42
We are interested in three questions. First, who overstates the dividend allowance and whatcharacteristics increase the likelihood of evading taxes? Second, is overstating the dividend al-lowance driven by the tax benet from re-classifying labor income as dividend income? Third,what drives the dynamics of detecting the overstated dividend allowance?
We rst develop a simple model of overstating the dividend allowance with endogenous prob-
ability of detection and a risk-neutral taxpayer based on the tax evasion model of Allingham andSandmo (1972) and Kleven, Knudsen, Kreiner, Pedersen, and Saez (2011). Our model showsthat if the tax rate on dividends is below the tax rate on labor income, overstating the dividendallowance can increase net-of-tax income. Overstating the dividend allowance for each owner islimited to the maximum per rm, as the probability of detection becomes 1 above the maximum.Our model predicts that if an individual expects the dividend tax rate to be below the tax rateon labor income, he overstates the dividend allowance up to the legal maximum. In contrast, if the tax rate on dividends is expected to be above the tax rate on labor income, overstating thedividend allowance and paying out dividends reduces net-of-tax income and would be irrational.
We empirically test the effect of rm-level and individual-level characteristics on the probabilityof evading taxes. Our results suggest that the likelihood that a taxpayer overstates the dividendallowance is affected by tax complexity and tax awareness. For example, the likelihood of over-stating the dividend allowance increases with the number of owners per rm, with the number of rms an individual owns, and whether owners live in different municipalities. In contrast, payingout dividends reduces the likelihood of overstating the dividend allowance, as it raises awarenessof the level of the dividend allowance, increasing the probability of detection. Variables relatedto awareness and nancial literacy, such as higher education, being born in Sweden, and income,
reduce the probability of evading taxes. We also control for the purpose of the rm. Alstadsæterand Jacob (2013) show that some CHC types, such as holding, shell, and low-turnover corpora-tions, are used for legal tax avoidance. We nd that the probability of overstating the dividendallowance is lower if the rm is used for legal tax sheltering. This nding indicates that illegal taxevasion and legal tax avoidance are not used as complementary methods of tax minimization.
Second, we use an alternative identication strategy to test the effect of tax rates on taxevasion. The Swedish tax rate schedule, with its large kink, offers a suitable setting for identifyingthe predicted effect of tax rates on tax evasion in our model. If an individual is subject to anadditional surtax of 20% on labor income, the dividend tax rate is below the income tax rate onlabor income. This tax wedge creates an incentive to overstate the dividend allowance. If theindividual is not subject to the state tax, the individual has no tax incentive to reclassify laborincome as dividend income and to overstate the dividend allowance. That is, around the cutoff point of the state tax, the incentive to evade taxes changes. To identify the tax rate effect, weuse local linear regressions with very narrow ranges of SEK 1,000 and SEK 500 (about USD 136and USD 68) around this kink. As observable characteristics are smooth around the kink, the
3
8/13/2019 Efectos de Tasa Impositiva y La Evasion
http://slidepdf.com/reader/full/efectos-de-tasa-impositiva-y-la-evasion 6/42
identication stems only from differences in the tax rate. We nd that crossing state tax thresholdincreases the likelihood of overstating the dividend allowance by 2.0 percentage points, or about40% of the unconditional sample mean. We characterize this as intentional tax evasion, since thedecision to evade taxes is driven by the tax advantage. We nd that this tax rate effect, i.e.,deliberate tax evasion, is stronger for less complex tax returns. In contrast, individuals with more
complex tax returns do not respond to the tax incentive. Taken together, our ndings suggest thatcomplexity and lack of awareness can result in accidental tax evasion, while tax benets explainintentional tax evasion behavior.
Finally, we analyze the dynamics of detection. We distinguish two cases in the data. First, thetaxpayer changes behavior and complies with the tax rules after having overstated the dividendallowance for some years. Second, the tax authority detects evasion and automatically correctsprior-year outrightly claimed dividend allowances. Surprisingly, about 70% of the mistakes arecorrected by the taxpayer. Only 30% are corrected by the tax administration. This observationrelates to the importance of changing enforcement and control strategies following implementationof new tax rules. We use a competing risks proportional hazards model to analyze the dynamics of detecting the overstated dividend allowance, either by the taxpayer or by the tax authority. Ourresults suggest that complexity in compliance increases time until detection. If a rm has manyowners, it requires more effort to coordinate both the preparation of tax returns and their audit.However, our results indicate that only a few factors explain self-correction and external detectionof overstated dividend allowances.
Our results relate to the literature on tax enforcement strategies and the quality of tax com-pliance in general (e.g., S anchez and Sobel, 1993; Chander and Wilde, 1998; Boadway and Sato,
2009; Alm, Jackson, and McKee, 2009; Bigio and Zilberman, 2011). Our ndings have four mainimplications. First, economic models of tax evasion and avoidance should acknowledge that taxadministration, enforcement strategies, and the design of the tax return form can affect partici-pation in non-compliance and the level of tax evasion. Second, when designing tax reforms thatchange incentives for taxpayers, policy makers should also adjust enforcement and audit strategies.Third, to implement effective control and compliance strategies, tax authorities need to merge in-formation across taxpayers and use automated, computer-based plausibility checks. Fourth, someof the observed tax evasion observed in this paper appears to be accidental. Complex tax rulesand tax forms can trigger unintended tax evasion if mistakes stem from lack of tax awareness andslowness to adapt to new rules.
Our results also point toward more general challenges in complying with rules, norms, andforms. Business owners and corporations need to comply with employee health insurance require-ments, environmental standards, and tariff regulations. All these non-tax regulations change overtime and are vulnerable to accidental as well as intentional non-compliance.
4

8/13/2019 Efectos de Tasa Impositiva y La Evasion
http://slidepdf.com/reader/full/efectos-de-tasa-impositiva-y-la-evasion 7/42
2 Institutional Background
2.1 The Swedish tax system and tax treatment of CHCs
Sweden has a dual income tax, with a progressive tax on labor income and a proportional tax oncapital income. Progressivity in the tax on labor income is achieved through a municipality tax (onaverage 31.5%) and two levels of state taxes of 20% and 5%, which apply at different thresholds.In addition, social security contributions apply to all wage payments and are remitted by theemployer. These contributions generate substantial benets, such as health care, unemploymentpayments, and future pensions. Above a certain threshold, social security contributions stopgenerating benets (see Column 4, Table 1). We thus consider these contributions as insuranceand benet contributions, rather than as a tax below this threshold; we consider them as a taxabove the cutoff. Table 1 provides an overview of marginal tax rates and thresholds for the twolevels of state taxes and social security contributions for our sample period, 2006–2009.
[Insert Table 1 about here]
Table 1 also shows the combined dividend tax rate ( τ d ), which consists of the corporate incometax of 28% (26.3% in 2009) and the dividend tax rate for CHCs at the individual level of 20%.The difference between the marginal tax rates on labor and capital income creates incentives forindividuals subject to the state tax to reclassify wage income as dividend income. Alstadsæterand Jacob (2013) show that informed, highly taxed individuals establish CHCs with low turnoverto legally benet from the tax rate difference between τ d and τ i . If earned income is below thethreshold for the rst-level state tax (Column 2, Table 1), τ i is below τ d . That is, labor income is
taxed at lower rates than dividend income. As soon as earned income is subject to the rst levelof the state tax, the combined tax rate on dividends is below the labor income tax rate ( τ i > τ d ),and individuals then have an incentive to reclassify labor income as dividend income.
To reduce this type of income shifting by rm owners, the Swedish government implementedthe so-called 3:12 rules for active owners5 of CHCs.6 The purpose of these rules is to preventincome shifting from the labor income tax base to the capital income tax base by owner-managers.According to the 3:12 rules, dividends within an imputed dividend allowance are treated as divi-dends for tax purposes. Dividends in excess of the dividend allowance are taxed as labor income.The dividend allowance is a function of equity and wage costs of the corporation (general rule). 7
5 According to Swedish tax law, a shareholder is deemed active if the shareholder contributes to prot generationin the rm to a considerable extent .
6 The tax law denes a corporation as closely held if four or fewer shareholders own at least 50% of the shares.Multiple family members count as a single shareholder. Therefore, few rms have more than four owners. If thesecriteria are not met, the corporation is considered to be widely held. There are no differences in corporate taxationbetween widely and CHCs. Dividends from unlisted widely held corporations have been taxed at 25% since 2006.
7 The general rule denes the dividend allowance as a xed interest on nominal equity (around 11%) and a xedpercentage of wages (25% or 50%) paid by the corporation to its employees. A more detailed description of the3:12 rules and Swedish tax rates is found in Alstadsæter and Jacob (2012).
5
8/13/2019 Efectos de Tasa Impositiva y La Evasion
http://slidepdf.com/reader/full/efectos-de-tasa-impositiva-y-la-evasion 8/42
The allowance is calculated by each shareholder for each rm. In case of multiple owners, thedividend allowance is allocated across active shareholders according to the ownership share in thecorporation. Any unused dividend allowances are carried forward with interest at the shareholderlevel, to be utilized on future dividends from the same corporation. In 2006, the 3:12 rules werereformulated to foster entrepreneurship and growth of CHCs. The reform included a reduction in
the dividend tax rate from 30% to 20%, an increase in the dividend allowance from the general rule,and an introduction of an optional, xed dividend allowance per corporation (the SimplicationRule—Forenklingsregeln ).
2.2 Identifying misreporting
Each active shareholder in a CHC must le a K10-form. The K10-form is a four page documentwith which each shareholder calculates the dividend allowance for their particular corporation. 8
The K10-form is often lled out by the owner-manager. 9 The active owner chooses the calculation
method for imputing the dividend allowance under the 3:12 rules. That is, the active owner chooseseither the general rule or the simplication rule. We focus on the simplication rule and on taxevasion through overstating this lump-sum allowance. One reason behind implementation of thisrule was to simplify compliance. The dividend allowance, according to the simplication rule, isindependent of activity, equity, and employment in the rm. Approximately 80% of active ownersunder the 3:12 rules choose the simplication rule to calculate dividend allowance. These taxpayersll out only the rst page of the form. 10
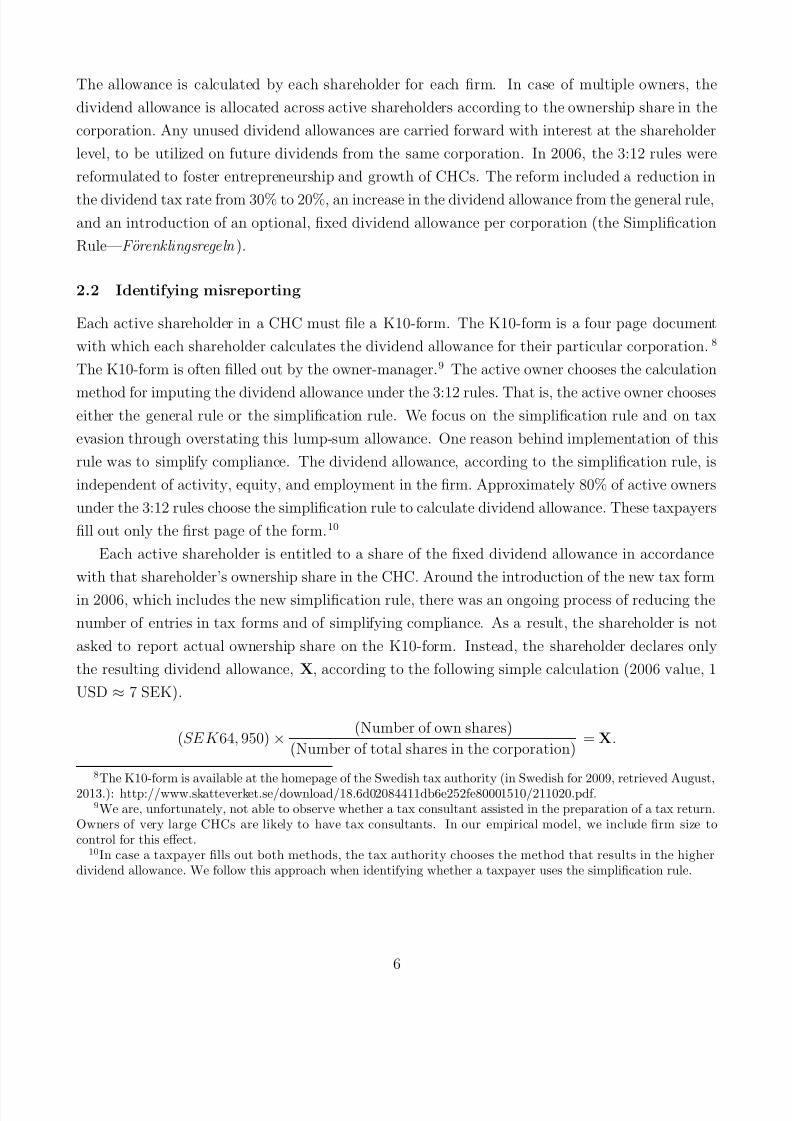
Each active shareholder is entitled to a share of the xed dividend allowance in accordancewith that shareholder’s ownership share in the CHC. Around the introduction of the new tax formin 2006, which includes the new simplication rule, there was an ongoing process of reducing thenumber of entries in tax forms and of simplifying compliance. As a result, the shareholder is notasked to report actual ownership share on the K10-form. Instead, the shareholder declares onlythe resulting dividend allowance, X, according to the following simple calculation (2006 value, 1USD ≈ 7 SEK).
(SEK 64, 950) ×(Number of own shares)
(Number of total shares in the corporation) = X .
8 The K10-form is available at the homepage of the Swedish tax authority (in Swedish for 2009, retrieved August,2013.): http://www.skatteverket.se/download/18.6d02084411db6e252fe80001510/211020.pdf.
9 We are, unfortunately, not able to observe whether a tax consultant assisted in the preparation of a tax return.Owners of very large CHCs are likely to have tax consultants. In our empirical model, we include rm size tocontrol for this effect.
10 In case a taxpayer lls out both methods, the tax authority chooses the method that results in the higherdividend allowance. We follow this approach when identifying whether a taxpayer uses the simplication rule.
6

8/13/2019 Efectos de Tasa Impositiva y La Evasion
http://slidepdf.com/reader/full/efectos-de-tasa-impositiva-y-la-evasion 9/42
Figure 1 shows the corresponding excerpt from the K10-form of the simplication rule for scalyear 2006. This is the rst line in the K10-form. The taxpayer lls in eld 410 ( X ) withoutexplicitly stating ownership share.
[Insert Figure 1 about here]
While this appears fairly straightforward, it does require some minimum level of mathematicaland cognitive ability. There are several potential sources of error in the case of multiple active rmowners. Let us consider an active shareholder who owns 50% of CHC equity. Instead of the share-holder’s actual 50% share of the dividend allowance (SEK 32,475 in year 2006), the shareholdercould ll in the maximum annual xed dividend allowance (SEK 64,950 in year 2006). Since thereis no shareholder register for CHCs or third-party reporting of ownership structure of privatelyheld corporations in Sweden, the tax authority is not able to cross-check implied ownership sharewith an external source. Further, the tax authority apparently does not systematically merge
information across shareholders to check whether shareholders in a CHC jointly claim more thanthe legal maximum per rm. As a result, taxpayers are able to overstate the dividend allowance.
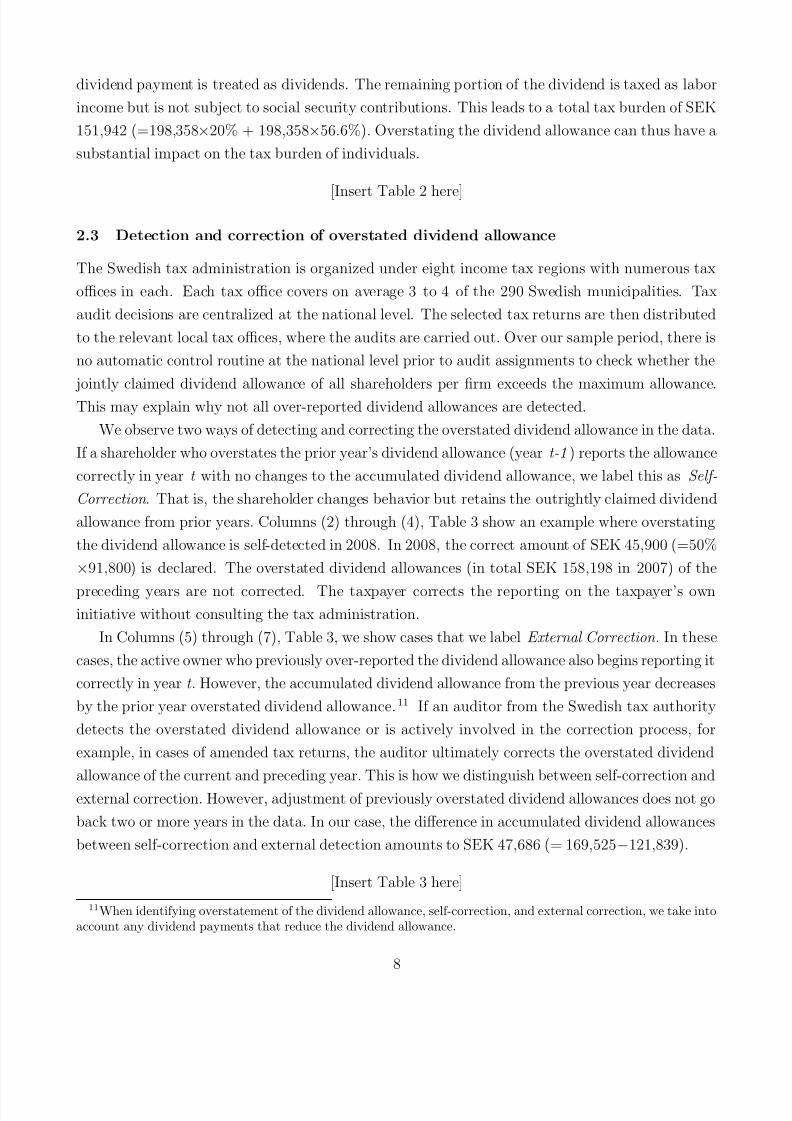
Overstating the dividend allowance is regarded as tax evasion by Swedish tax law, but theconsequences depend on the tax benets. If the overstated dividend allowance leads to a taxreduction in the current year, and if the overstated dividend allowance is detected (e.g., through ourdetection strategy), the Swedish tax authority imposes a penalty. However, if there is no dividendpayout in the year of overstatement and detection, the authority does not impose a penalty. Thetax authority simply corrects the “mistake.” The taxpayer’s advantage from the latter approachtoward tax evasion is that the overstated dividend allowance can be carried forward with interestand can be utilized when dividends are paid out in later years. This option is valuable, sincedividends of private, in particular CHCs, are very exible and are paid out irregularly (Jacob andAlstadsæter, 2013). The possibility of accumulating and forwarding unused dividend allowancesrepresents an option to generate future tax savings, even if they generate no tax saving in thepresent period. By overstating the dividend allowance in the present period, the taxpayer reducesthe present or future tax burden, depending on when (and whether) dividends are distributed tothe active owner. This type of tax evasion can therefore more or less be carried out without riskof penalty.
We illustrate the effect of overstating dividend allowance in Table 2. We consider an individualwith an ownership share of 50%. Columns (2) through (4) show the tax evasion case for overstatingthe dividend allowance. Columns (5) through (8) show the correct reporting. In case of evasion, thetaxpayer effectively doubles the dividend allowance. The potential tax benets are substantial.Consider a taxpayer who is in the top marginal tax bracket and subject to an income tax of 56.6%. If such taxpayer receives a dividend (after corporate taxes) of SEK 396,717, the dividendtax burden equals SEK 79,343 (=396,717 × 20%). In the case of correct reporting, only half the
7
8/13/2019 Efectos de Tasa Impositiva y La Evasion
http://slidepdf.com/reader/full/efectos-de-tasa-impositiva-y-la-evasion 10/42

8/13/2019 Efectos de Tasa Impositiva y La Evasion
http://slidepdf.com/reader/full/efectos-de-tasa-impositiva-y-la-evasion 11/42
Note that we may underestimate tax evasion in the data. We have information only on activeowners of CHCs. As long as active owners claim a total dividend allowance that is not above thelegal maximum, we dene this as correct reporting. However, if there is a (are) passive owner(s) inthis corporation, active owners should claim less than the maximum allowed dividend allowance.We are not able to identify this in the data, as there is no shareholder register and no third-party
reporting of ownership structure of privately held corporations in Sweden.
3 A simple model for overstating dividend allowance
We formalize our predictions about the tax rate effect on tax evasion in a simple model. Thismodel is based on the Allingham and Sandmo (1972) model. We assume risk-neutral taxpayerswho maximize expected income in the presence of an endogenous detection probability (Kleven,Knudsen, Kreiner, Pedersen, and Saez, 2011). 12 In contrast to the standard approach in modelingtax evasion by under-reporting true income, our measure of tax evasion refers to overstating thedividend allowance. This allowance denes the portion of dividend income that is to be taxed at aproportional dividend tax rate rather than a progressive tax rate on wage income. If dividends aretaxed at a lower rate than wage income, taxes are illegally minimized. However, it could well bethat individuals face an increase in tax burden if they accidently overstate the dividend allowancein cases where the marginal labor income tax rate is below the dividend tax rate. Kleven, Knudsen,Kreiner, Pedersen, and Saez (2011), for example, nd that some taxpayers overstate true incomeon their tax returns.
In our model, we rst consider a taxpayer with true income ¯y that is equal to his taxable
reported income y. We adjust the model to facilitate the dual income tax. A part α of the incomeis subject to the income tax rate τ i . The remaining portion (1 − α ) is subject to the dividend taxrate τ d . We dene the effective overall tax rate on y as τ e = α · τ i + (1 − α ) · τ d . The taxpayer canoverstate the dividend allowance by e. Overstating the dividend allowance by e does not affecttotal income y, but leads to a change in the tax burden of e · (τ d − τ i ) = e · ∆ τ . Depending on therelation between dividend taxes and income taxes, overstating the dividend allowance can reduceor increase the overall tax burden.
With probability p, the tax authority detects the overstated dividend allowance. We assumethat, in case of detection, the dividend allowance is fully adjusted. We assume that the probabilityof detection is increasing in the overstated dividend allowance. For example, as the individualbenets of overstating the dividend allowance increase with the number of owners, the likelihoodof being detected increases when more owners participate in tax evasion. If the tax authorityexposes the tax evasion of one owner, it checks the tax returns of the other owners as well. Since
12 See Sandmo (2005, 2012) for thorough literature overviews on tax evasion as a portfolio choice, following theseminal Allingham and Sandmo (1972).
9
8/13/2019 Efectos de Tasa Impositiva y La Evasion
http://slidepdf.com/reader/full/efectos-de-tasa-impositiva-y-la-evasion 12/42
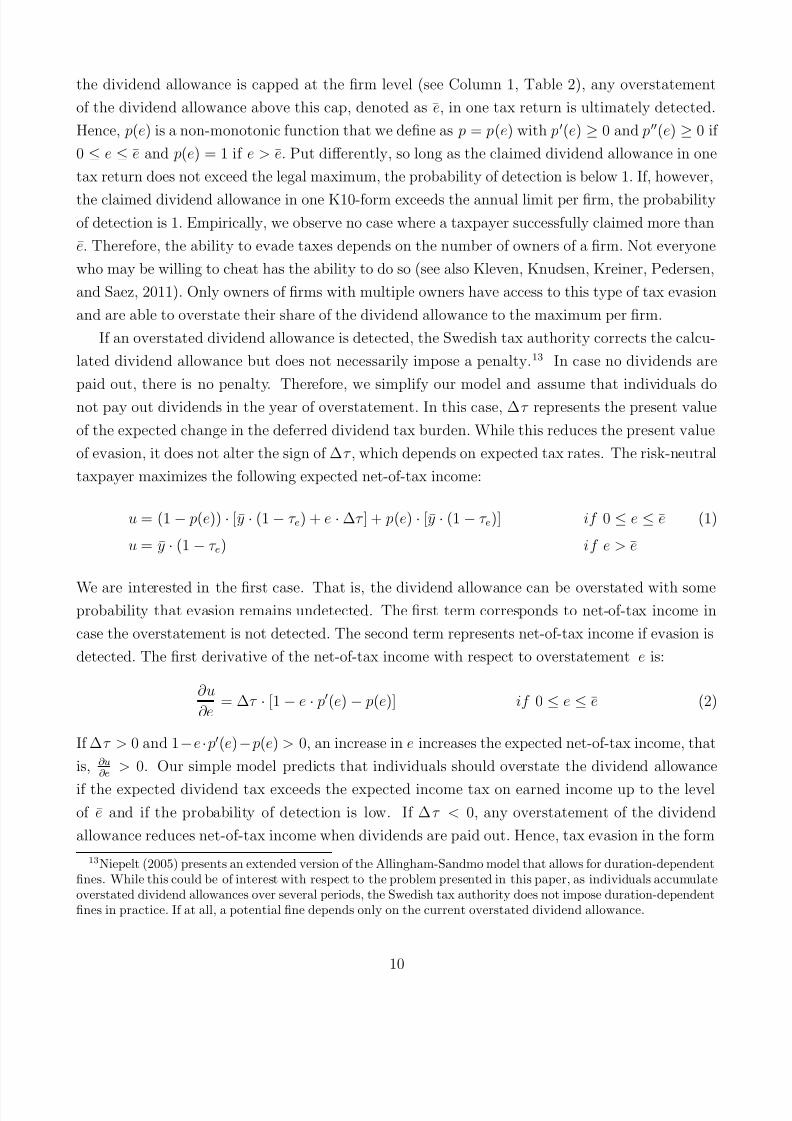
the dividend allowance is capped at the rm level (see Column 1, Table 2), any overstatementof the dividend allowance above this cap, denoted as e, in one tax return is ultimately detected.Hence, p(e) is a non-monotonic function that we dene as p = p(e) with p ′ (e) ≥ 0 and p ′′ (e) ≥ 0 if 0 ≤ e ≤ e and p(e) = 1 if e > e. Put differently, so long as the claimed dividend allowance in onetax return does not exceed the legal maximum, the probability of detection is below 1. If, however,
the claimed dividend allowance in one K10-form exceeds the annual limit per rm, the probabilityof detection is 1. Empirically, we observe no case where a taxpayer successfully claimed more thane. Therefore, the ability to evade taxes depends on the number of owners of a rm. Not everyonewho may be willing to cheat has the ability to do so (see also Kleven, Knudsen, Kreiner, Pedersen,and Saez, 2011). Only owners of rms with multiple owners have access to this type of tax evasionand are able to overstate their share of the dividend allowance to the maximum per rm.
If an overstated dividend allowance is detected, the Swedish tax authority corrects the calcu-lated dividend allowance but does not necessarily impose a penalty. 13 In case no dividends arepaid out, there is no penalty. Therefore, we simplify our model and assume that individuals donot pay out dividends in the year of overstatement. In this case, ∆ τ represents the present valueof the expected change in the deferred dividend tax burden. While this reduces the present valueof evasion, it does not alter the sign of ∆ τ , which depends on expected tax rates. The risk-neutraltaxpayer maximizes the following expected net-of-tax income:
u = (1 − p(e)) · [y · (1 − τ e ) + e · ∆ τ ] + p(e) · [y · (1 − τ e )] if 0 ≤ e ≤ e (1)
u = y · (1 − τ e ) if e > e
We are interested in the rst case. That is, the dividend allowance can be overstated with someprobability that evasion remains undetected. The rst term corresponds to net-of-tax income incase the overstatement is not detected. The second term represents net-of-tax income if evasion isdetected. The rst derivative of the net-of-tax income with respect to overstatement e is:
∂u∂e
= ∆ τ · [1 − e · p′ (e) − p(e)] if 0 ≤ e ≤ e (2)
If ∆ τ > 0 and 1− e · p′ (e) − p(e) > 0, an increase in e increases the expected net-of-tax income, thatis, ∂u
∂e > 0. Our simple model predicts that individuals should overstate the dividend allowance
if the expected dividend tax exceeds the expected income tax on earned income up to the levelof e and if the probability of detection is low. If ∆ τ < 0, any overstatement of the dividendallowance reduces net-of-tax income when dividends are paid out. Hence, tax evasion in the form
13 Niepelt (2005) presents an extended version of the Allingham-Sandmo model that allows for duration-dependentnes. While this could be of interest with respect to the problem presented in this paper, as individuals accumulateoverstated dividend allowances over several periods, the Swedish tax authority does not impose duration-dependentnes in practice. If at all, a potential ne depends only on the current overstated dividend allowance.
10

8/13/2019 Efectos de Tasa Impositiva y La Evasion
http://slidepdf.com/reader/full/efectos-de-tasa-impositiva-y-la-evasion 13/42
of overstating the dividend allowance is very likely to be accidental. However, there are twopotential problems with this conclusion. First, the model uses current tax status. Since we assumea case where the dividend payout is in later periods, our prediction should be based on expected rather than current tax status. That is, our model prediction relates to the uncertain future taxrate difference ∆ τ . Second, individuals with ∆˜τ < 0 may also overstate the dividend allowance,
as it represents an option on future tax savings; individuals decide on the real dividend-wage-mixthrough their payout behavior.
From our model, we formulate a simple prediction for the effect of tax rates on tax evasion,which we test empirically. The sign of ∆ τ depends on the expected relation of τ d to τ i . Theadvantage of our setting is that τ i < τ d if the individual is subject to the municipality tax. If anindividual is additionally subject to the state tax, τ i > τ d and ∆ τ become positive. Empirically,we expect that the likelihood of overstating the dividend allowance is higher for taxpayers that aresubject to the state tax.
4 Data sample, variable denitions, and estimation strategy
4.1 Data
We use the Firm Register and Individual Database (FRIDA) provided by Statistics Sweden. Thispanel data set is a combination of three main data sources: corporate tax statements, income taxstatements, and the K10-form for owners of closely held rms. The corporate and individual datasets are full samples of all CHCs and their active owners. Individual data contain informationon income and other socioeconomic variables. Due to unique identiers, we can link informationfrom the individual database and the corporate tax database to the population of K10-forms ledin the period 2006–2009. We include all observations where we can successfully link informationfrom the corporation (from the corporate tax database) and the individual (from the individualtax database) to the respective K10-form. The nal sample consists of 574,030 observations (K10-forms) from 163,097 CHCs and 213,380 individuals over the period 2006–2009.
4.2 Identifying tax evasion in the data
We use a simple algorithm to detect overstated dividend allowances. We compute the claimeddividend allowance for rm j in year t using the simplication rule. We do so by summing upthe claimed dividend allowances by all active owners of one rm. If the total claimed dividendallowance exceeds the maximum per rm, we ag each owner as having overstated the dividendallowance and set the dummy variable Failure to 1. This classication follows Swedish tax laws,according to which these cases are treated as tax evasion. If the claimed dividend allowance perrm does not exceed the maximum per rm, we set Failure to zero.
11

8/13/2019 Efectos de Tasa Impositiva y La Evasion
http://slidepdf.com/reader/full/efectos-de-tasa-impositiva-y-la-evasion 14/42
There are several concerns about this measure, as we treat every owner as a tax evader. Itcould be that only one of the shareholders overstates the dividend allowance, e.g., by claimingthe maximum for himself. As a robustness test, we re-run all tests using an alternative denitionwhere we set the dummy to 1 if the total claimed dividend allowance exceeds the maximum perrm and if the owner claims the legal maximum for himself. 14 However, we use Failure throughout
the paper, since owners can overstate the dividend allowance without claiming the full allowance.For example, we observe cases where two owners each claim 75% of the dividend allowance. Thealternative and stricter denition ignores this case. Most importantly, results for this alternativedenition are similar to the results when using Failure .
We observe overstated dividend allowances ( Failure = 1) in about 5% of the led K10-forms. 15
The overstated dividend allowances amount to approximately SEK 3.3 bn. This is a non-trivialamount, as it does not take into account that the outrightly claimed dividend allowances can becarried forward with interest rates of about 7% to 8%. Figure 2 plots the distribution of claimeddividend allowances per rm relative to the legal maximum. For example, a value of 2 indicatesthat a rm has claimed 200% of e. We plot the distribution for each sample year. We nd thatmisreporting is highest in the year of introduction of the new rule. Thereafter, tax authoritiesand/or taxpayers adapt to the new rules. Misreporting decreases but is still present. This is arst indication of inertia in the adoption of the new rules. The spikes in the distribution at thevalues of 1.5, 2, 3, 4, and 5 indicate that the majority of misreporting is due to rms with multipleowners, where each owner claims the full annual dividend allowance per rm without coordinatingdividend allowances across owners.
[Insert Figure 2 about here]
4.3 Estimation strategy
4.3.1 Likelihood of overstating dividend allowance
We test the implications our theoretical considerations using a linear probability model that con-trasts the likelihood of evading taxes by overstating the dividend allowance against correct state-ment of the dividend allowance. 16 We specify the regression model as
yi,j,t = α 1 + δ Π j,t + γ Θ i,t + α t + α c + ϵ j,t (3)14 Results using this alternative dependent variable are presented in Tables A.1 through A.4 in the Appendix.15 Taxpayers may also underreport the dividend allowance. We are, unfortunately, not able to observe this,
because we do not know the true share due to lack of a shareholder register. However, as mentioned above, thedividend allowance represents an option to pay out dividends; this option may or may not be utilized.
16 We run additional sensitivity tests and re-estimate the model using a probit model. Results (not reported) arevery similar.
12
8/13/2019 Efectos de Tasa Impositiva y La Evasion
http://slidepdf.com/reader/full/efectos-de-tasa-impositiva-y-la-evasion 15/42
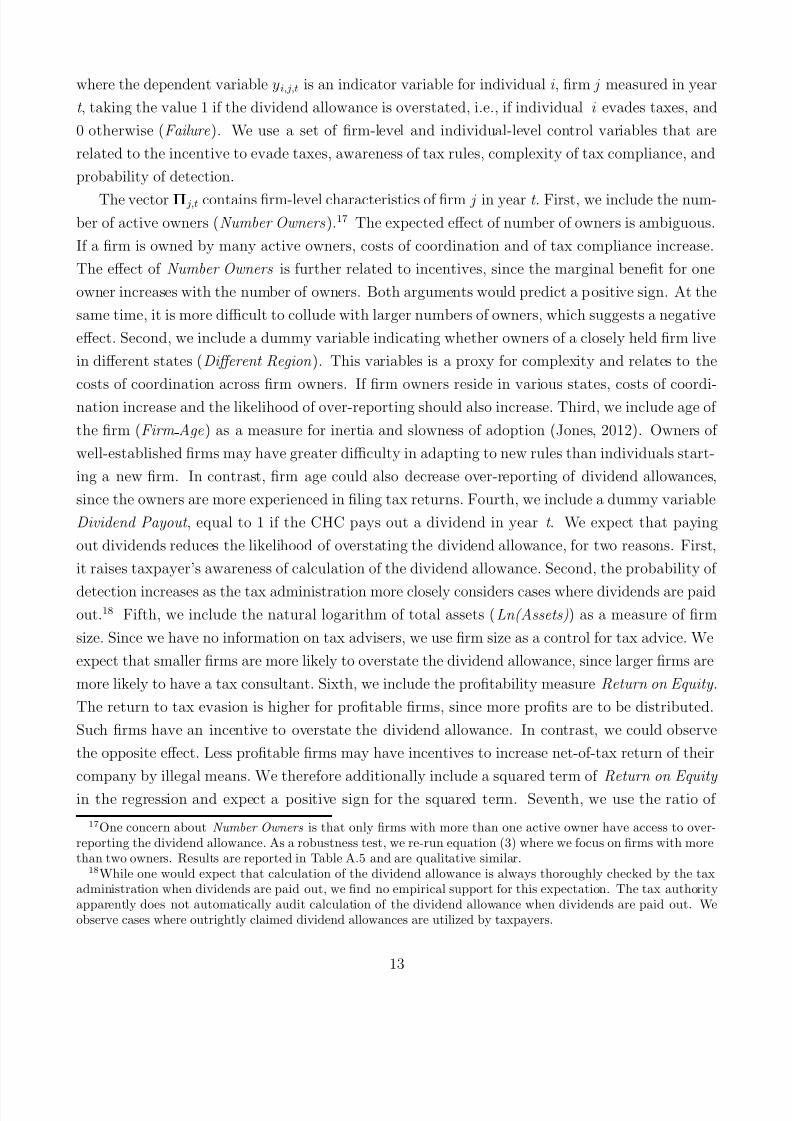
where the dependent variable yi,j,t is an indicator variable for individual i , rm j measured in yeart , taking the value 1 if the dividend allowance is overstated, i.e., if individual i evades taxes, and0 otherwise (Failure ). We use a set of rm-level and individual-level control variables that arerelated to the incentive to evade taxes, awareness of tax rules, complexity of tax compliance, andprobability of detection.
The vector Π j,t contains rm-level characteristics of rm j in year t . First, we include the num-ber of active owners (Number Owners ).17 The expected effect of number of owners is ambiguous.If a rm is owned by many active owners, costs of coordination and of tax compliance increase.The effect of Number Owners is further related to incentives, since the marginal benet for oneowner increases with the number of owners. Both arguments would predict a positive sign. At thesame time, it is more difficult to collude with larger numbers of owners, which suggests a negativeeffect. Second, we include a dummy variable indicating whether owners of a closely held rm livein different states ( Different Region ). This variables is a proxy for complexity and relates to thecosts of coordination across rm owners. If rm owners reside in various states, costs of coordi-nation increase and the likelihood of over-reporting should also increase. Third, we include age of the rm ( Firm Age ) as a measure for inertia and slowness of adoption (Jones, 2012). Owners of well-established rms may have greater difficulty in adapting to new rules than individuals start-ing a new rm. In contrast, rm age could also decrease over-reporting of dividend allowances,since the owners are more experienced in ling tax returns. Fourth, we include a dummy variableDividend Payout , equal to 1 if the CHC pays out a dividend in year t . We expect that payingout dividends reduces the likelihood of overstating the dividend allowance, for two reasons. First,it raises taxpayer’s awareness of calculation of the dividend allowance. Second, the probability of
detection increases as the tax administration more closely considers cases where dividends are paidout. 18 Fifth, we include the natural logarithm of total assets ( Ln(Assets) ) as a measure of rmsize. Since we have no information on tax advisers, we use rm size as a control for tax advice. Weexpect that smaller rms are more likely to overstate the dividend allowance, since larger rms aremore likely to have a tax consultant. Sixth, we include the protability measure Return on Equity .The return to tax evasion is higher for protable rms, since more prots are to be distributed.Such rms have an incentive to overstate the dividend allowance. In contrast, we could observethe opposite effect. Less protable rms may have incentives to increase net-of-tax return of theircompany by illegal means. We therefore additionally include a squared term of Return on Equity in the regression and expect a positive sign for the squared term. Seventh, we use the ratio of
17 One concern about Number Owners is that only rms with more than one active owner have access to over-reporting the dividend allowance. As a robustness test, we re-run equation (3) where we focus on rms with morethan two owners. Results are reported in Table A.5 and are qualitative similar.
18 While one would expect that calculation of the dividend allowance is always thoroughly checked by the taxadministration when dividends are paid out, we nd no empirical support for this expectation. The tax authorityapparently does not automatically audit calculation of the dividend allowance when dividends are paid out. Weobserve cases where outrightly claimed dividend allowances are utilized by taxpayers.
13
8/13/2019 Efectos de Tasa Impositiva y La Evasion
http://slidepdf.com/reader/full/efectos-de-tasa-impositiva-y-la-evasion 16/42
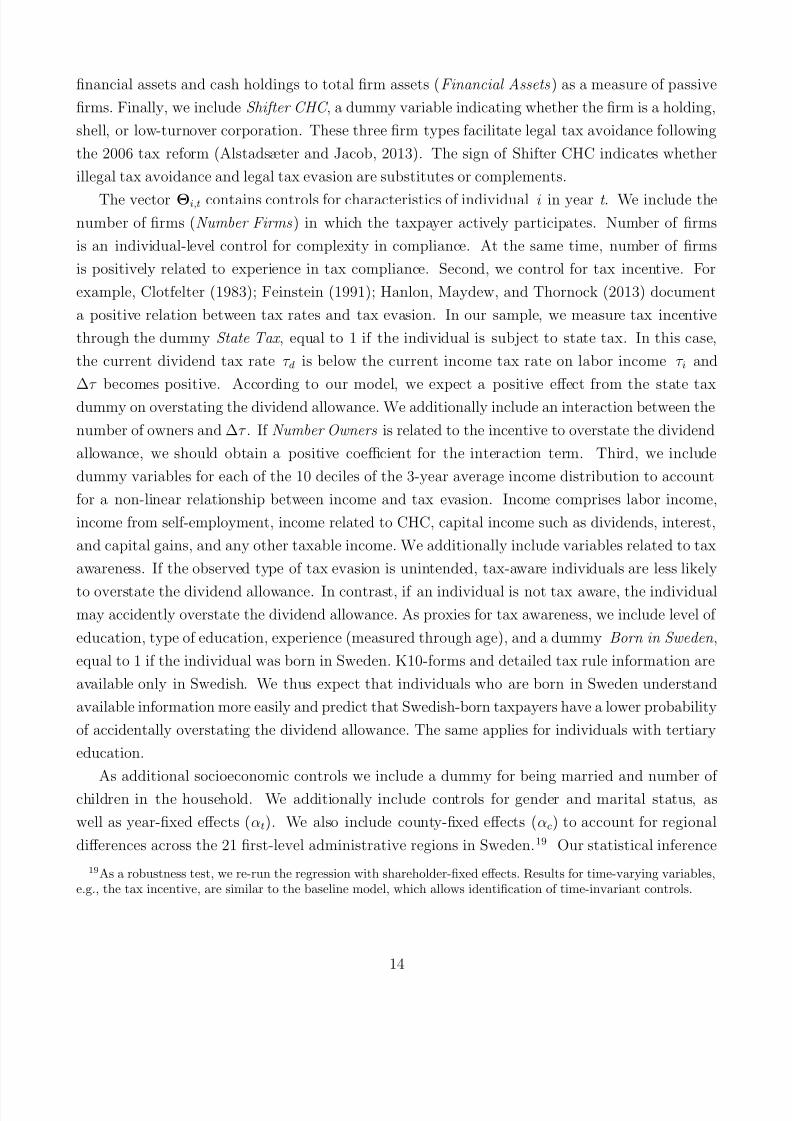
nancial assets and cash holdings to total rm assets ( Financial Assets ) as a measure of passiverms. Finally, we include Shifter CHC , a dummy variable indicating whether the rm is a holding,shell, or low-turnover corporation. These three rm types facilitate legal tax avoidance followingthe 2006 tax reform (Alstadsæter and Jacob, 2013). The sign of Shifter CHC indicates whetherillegal tax avoidance and legal tax evasion are substitutes or complements.
The vector Θ i,t contains controls for characteristics of individual i in year t . We include thenumber of rms (Number Firms ) in which the taxpayer actively participates. Number of rmsis an individual-level control for complexity in compliance. At the same time, number of rmsis positively related to experience in tax compliance. Second, we control for tax incentive. Forexample, Clotfelter (1983); Feinstein (1991); Hanlon, Maydew, and Thornock (2013) documenta positive relation between tax rates and tax evasion. In our sample, we measure tax incentivethrough the dummy State Tax , equal to 1 if the individual is subject to state tax. In this case,the current dividend tax rate τ d is below the current income tax rate on labor income τ i and∆ τ becomes positive. According to our model, we expect a positive effect from the state taxdummy on overstating the dividend allowance. We additionally include an interaction between thenumber of owners and ∆ τ . If Number Owners is related to the incentive to overstate the dividendallowance, we should obtain a positive coefficient for the interaction term. Third, we includedummy variables for each of the 10 deciles of the 3-year average income distribution to accountfor a non-linear relationship between income and tax evasion. Income comprises labor income,income from self-employment, income related to CHC, capital income such as dividends, interest,and capital gains, and any other taxable income. We additionally include variables related to taxawareness. If the observed type of tax evasion is unintended, tax-aware individuals are less likely
to overstate the dividend allowance. In contrast, if an individual is not tax aware, the individualmay accidently overstate the dividend allowance. As proxies for tax awareness, we include level of education, type of education, experience (measured through age), and a dummy Born in Sweden ,equal to 1 if the individual was born in Sweden. K10-forms and detailed tax rule information areavailable only in Swedish. We thus expect that individuals who are born in Sweden understandavailable information more easily and predict that Swedish-born taxpayers have a lower probabilityof accidentally overstating the dividend allowance. The same applies for individuals with tertiaryeducation.
As additional socioeconomic controls we include a dummy for being married and number of children in the household. We additionally include controls for gender and marital status, aswell as year-xed effects (α t ). We also include county-xed effects ( α c) to account for regionaldifferences across the 21 rst-level administrative regions in Sweden. 19 Our statistical inference
19 As a robustness test, we re-run the regression with shareholder-xed effects. Results for time-varying variables,e.g., the tax incentive, are similar to the baseline model, which allows identication of time-invariant controls.
14
8/13/2019 Efectos de Tasa Impositiva y La Evasion
http://slidepdf.com/reader/full/efectos-de-tasa-impositiva-y-la-evasion 17/42
is based on heteroskedasticity-robust standard errors clustered at the individual level. Table 4presents summary statistics and variable denitions for our sample.
[Insert Table 4 about here]
4.3.2 Identifying tax incentive—local linear regressions
The model from equation (3) includes the variable State Tax to test the effect of the tax wedgebetween dividend taxes and labor income taxes, ∆ τ , on tax evasion. We use an alternative identi-cation strategy to test the effect of tax rates on tax evasion. The Swedish tax rate schedule offersa suitable setting for testing the tax effect on tax evasion using a local linear regression. If anindividual is subject to the additional state tax of 20%, the tax rate on dividends falls below theincome tax rate on labor income. ∆ τ from equation (2) becomes positive and the individual has atax incentive to overstate the dividend allowance. Below the threshold, ∆ τ is negative and there isno incentive to overstate the dividend allowance. We take advantage of this major kink in the taxcode and the sign change in ∆ τ . We run a local linear regression to empirically test the relationbetween evasion and tax rates. Since we use a very narrow range around the kink, the effect is notdue to a large tax benet, since the average tax rate changes little. The effect is more related tothe salience of the kink to taxpayers (Chetty, Looney, and Kroft, 2009; Finkelstein, 2009). Belowthe kink, individuals pay municipality tax, whereas individuals above the kink pay municipalityand state tax. For example, Alstadsæter and Jacob (2013) use this kink to identify a tax effect onlegal income shifting. We follow their approach and run the following local linear regression:
yi,j,t = β 1 + β
2State Tax + µ j,t (4)
yi,j,t = β 1 + β 2State Tax + ϑΠ j,t + ξ Θ i,t + β t + β c + µ j,t (5)
where yi,j,t is an indicator variable taking the value 1 if individual i overstates the dividend al-lowance of rm j in year t , and 0 otherwise. We choose very narrow ranges of SEK 1,000 andSEK 500 (about USD 136 and USD 68) around the state tax threshold to ensure that there areno differences between individuals above and below the threshold in observable characteristics.In fact, we detect no statistically signicant differences in all variables of vectors Π j,t and Θ i,t
for individuals above and below the threshold (see Table A.6 of the Appendix). We are mainly
interested in the β 2 coefficient. According to our model, β 2 is expected to be positive. We test themodel with and without control variables. The specication in equation (4) includes no controlvariables. In equation (5), we control for rm-level controls ( Π j,t ), individual-level controls ( Θ i,t ),time (β t ), and county-xed effects ( β c). If our identifying assumptions hold, we should not observedifferences in the β 2 coefficients across the two equations.
We are additionally interested in the role of complexity in the effect of the tax incentive. Forthis purpose, we split the sample into rms with either two active owners (lower complexity) or
15
8/13/2019 Efectos de Tasa Impositiva y La Evasion
http://slidepdf.com/reader/full/efectos-de-tasa-impositiva-y-la-evasion 18/42
more than two active owners (higher complexity). 20 The complexity of tax compliance increasesin the number of taxpayers who need to align their dividend allowances across tax returns. Atthe same time, more owners increase their tax benets from overstating the dividend allowance.Using these cross-sectional differences in the number of owners, we test (1) whether the numberof owners is related to complexity and, given that this is true, (2) whether complexity is related
to intentional or accidental tax evasion. If taxpayers deliberately abuse complexity when evadingtaxes, the effect of crossing the cutoff for the state tax should increase in complexity. That is, theeffect of ∆τ should be larger in the high-complexity sample. In contrast, if complexity leads tounintentional tax evasion, the effect of tax rates on tax evasion should be more pronounced in thelow-complexity sample. It is an empirical question as to which of these two effects dominates.
5 Empirical results on participation in tax evasion
5.1 Likelihood to overstate dividend allowance
Table 5 presents regression results for the OLS regression from equation (3). We present results forthe rm-level variables ( Π j,t ), individual-level variables ( Θ i,t ), and for the full set of independentvariables. Our results suggest that the likelihood of overstating the dividend allowance is affectedby complexity and the cost of coordination. The likelihood of tax evasion increases with thenumber of owners of a rm and whether the owners live in different regions. The effects we ndare economically signicant. For example, an increase in the number of active owners by 1 increasesthe likelihood of overstating the dividend allowance by 3.87 percentage points, or about 79% of theunconditional sample mean. In contrast, paying out dividends raises awareness of the potentiallyincorrect calculation of the dividend allowance. We nd that the likelihood of overstating thedividend allowance decreases by 1.25 percentage points, or 25% of the unconditional mean, if arm distributes dividends. We further nd that the likelihood of overstating the allowance is higherfor older as well as for smaller rms. We observe a signicant effect of the squared term of returnon equity. The resulting U-shape pattern for the return on equity effect reects our expectationthat the least protable as well as the most protable rms evade taxes. While less protablerms may seek out illegal opportunities to increase net prots, owners of highly protable rmsmay overstate the dividend allowance as they enjoy large benets in the form of tax reductions.
Finally, the negative coefficient of Shifting CHC indicates that owners of CHC that are designedfor legal tax sheltering are less likely to also participate in illegal tax minimization. Being an ownerof a CHC designed for tax avoidance reduces the likelihood of overstating the dividend allowanceby 12%. This result indicates that tax evasion and tax avoidance are not used as complementary
20 We use alternative sample split variables (number of rms, living in different regions). Results (reported inTable A.7 and A.8 of the Appendix) are qualitatively similar when using these alternative variables.
16

8/13/2019 Efectos de Tasa Impositiva y La Evasion
http://slidepdf.com/reader/full/efectos-de-tasa-impositiva-y-la-evasion 19/42
ways of minimizing taxes. Taxpayers who avoid taxes are less likely to evade taxes. Our resultsfor the rm-level variables are not affected by inclusion of individual-level variables.
[Insert Table 5 about here]
We next turn to our individual-level variables. Our results suggest that variables related tocomplexity and awareness have a signicant effect on the likelihood to overstate dividend allowance;for example, this likelihood increases with the number of rms. Even though experience with taxcompliance increases with the number of rms, the complexity of tax compliance increases if anindividual actively participates in many rms. Our results suggest that an increase in the number of rms by 1 increases the likelihood of overstating the dividend allowance by 0.28 percentage points.We nd that tertiary education and being born in Sweden reduces the likelihood of tax evasion.For example, if an individual is born in Sweden, that individual has a 15% lower probabilityof evading taxes. Likewise, having a university degree reduces the probability of overstating the
dividend allowance by 24%. This result indicates that tax-aware individuals are less likely to evadetaxes. Further, we control for income, which is also related to tax awareness, nancial literacy,and potential tax advice. Seven of nine of our income indicator variables are signicant and havenegative signs.
In line with our theoretical model, we nd a positive estimate for the tax incentive coefficient(State Tax ). This is a rst indication that tax incentives positively affect tax evasion. However,the dummy State Tax is correlated with other variables, for example, our income decile indicatorvariables. Therefore, we use the alternative estimation strategy set forth below to estimate theeffect of ∆τ from our model on tax evasion. In Table 5, we further nd that the interaction betweenNumber Owners and State Tax is negative and signicant. This indicates that the number of owners is more related to complexity than to increased potential tax benets. Finally, it appearsthat there is a learning effect. The likelihood of overstating the dividend allowance decreases overtime, as indicated by the decreasing year–dummy variables.
Taken together, it appears that at least some of the observed tax evasion can be explainedby complexity and lack of awareness. Not all individuals who overstate the dividend allowanceactually benet from tax evasion. In fact, the overall tax burden could increase for individualssubject only to the municipality tax. Summary statistics (not reported) show that 60% of business
owners who overstate the dividend allowance are currently not subject to the state tax (∆ τ < 0).Still, some of the observed tax evasion may be due to deliberate tax evasion. Otherwise, owners of highly protable rms and owners subject to the state tax would not be more likely to overstatethe dividend allowance.
17
8/13/2019 Efectos de Tasa Impositiva y La Evasion
http://slidepdf.com/reader/full/efectos-de-tasa-impositiva-y-la-evasion 20/42
5.2 Tax incentive and evasion: evidence from local linear regressions
This section presents an alternative identication strategy to analyze the relation between taxrates and tax evasion and the effect of complexity on intended tax evasion. If individuals respondto the tax incentive, we may interpret this as deliberate tax evasion. Taxpayers would onlyoverstate the dividend allowance because of the tax benet. Our model from Section 3 has a clearprediction: if the expected dividend tax is below the expected labor income tax, overstating thedividend allowance can increase net-of-tax income. To test this prediction, we use the state taxcutoff that increases the marginal labor income tax rate by 20% and that changes the sign of ∆ τ .This approach has several advantages. First, since individuals above and below the threshold arestatistically not different from each other in observable characteristics, the identication stemsonly from the difference in ∆ τ . Second, the tax rate increase is salient. This increase is due tothe state-level tax in addition to the municipality tax. While the actual tax benet changes littlearound the kink, the increase in the marginal tax becomes quite salient. The cutoff, however,
changes the marginal and not the average tax rate. Therefore, the increase in tax benets isonly marginal. A potential reaction to the increase in the marginal labor income tax rate maybe explained by the salience of the tax cut or by taxpayer confusion of marginal with average taxrates (see, e.g., de Bartolome, 1995). Third, the threshold for the state tax changes each year.This time-series variation improves identication of the tax effect.
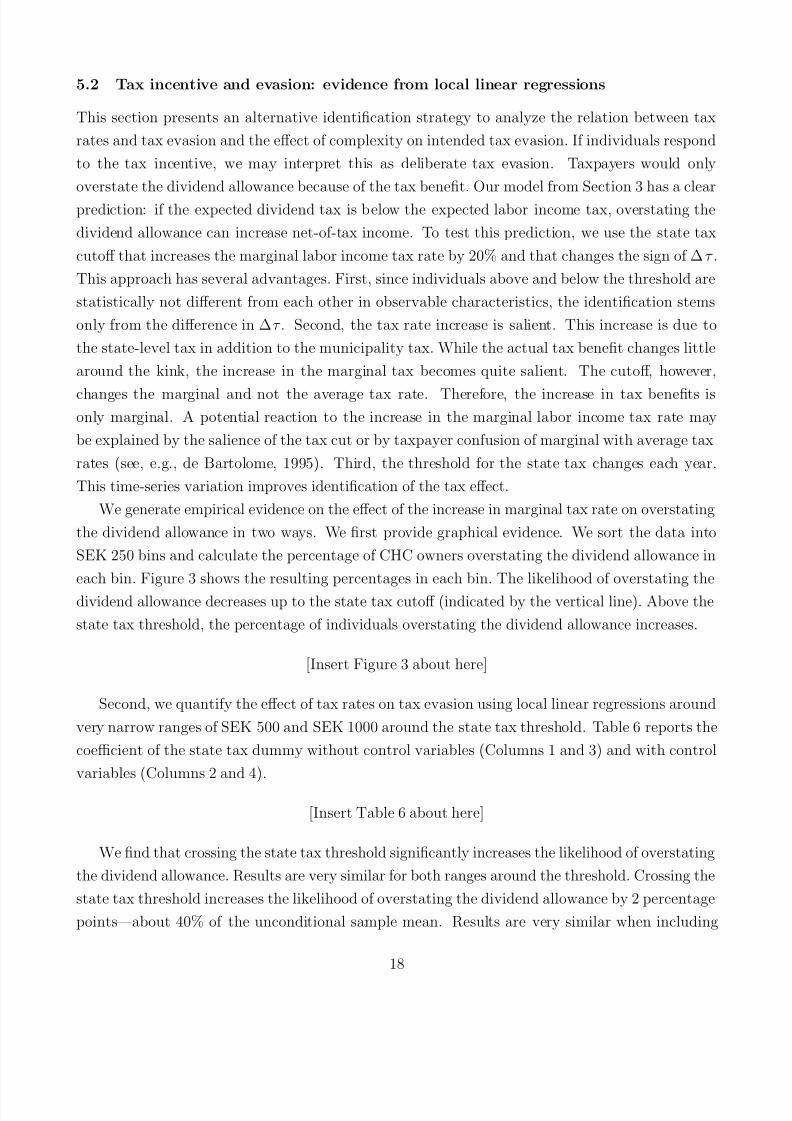
We generate empirical evidence on the effect of the increase in marginal tax rate on overstatingthe dividend allowance in two ways. We rst provide graphical evidence. We sort the data intoSEK 250 bins and calculate the percentage of CHC owners overstating the dividend allowance ineach bin. Figure 3 shows the resulting percentages in each bin. The likelihood of overstating thedividend allowance decreases up to the state tax cutoff (indicated by the vertical line). Above thestate tax threshold, the percentage of individuals overstating the dividend allowance increases.
[Insert Figure 3 about here]
Second, we quantify the effect of tax rates on tax evasion using local linear regressions aroundvery narrow ranges of SEK 500 and SEK 1000 around the state tax threshold. Table 6 reports thecoefficient of the state tax dummy without control variables (Columns 1 and 3) and with controlvariables (Columns 2 and 4).
[Insert Table 6 about here]
We nd that crossing the state tax threshold signicantly increases the likelihood of overstatingthe dividend allowance. Results are very similar for both ranges around the threshold. Crossing thestate tax threshold increases the likelihood of overstating the dividend allowance by 2 percentagepoints—about 40% of the unconditional sample mean. Results are very similar when including
18

8/13/2019 Efectos de Tasa Impositiva y La Evasion
http://slidepdf.com/reader/full/efectos-de-tasa-impositiva-y-la-evasion 21/42
controls. This conrms that the sample is reasonably smooth around the kink, as coefficientestimates are not affected by inclusion of control variables, year-xed effects, and county-xedeffects. Hence, some of the observed tax evasion is driven by the tax wedge between dividendtaxes and labor income taxes. Individuals intentionally overstate the dividend allowance to benetfrom lower dividend taxes as opposed to higher labor income taxes.
We are next interested in the role of complexity in intentional tax evasion. Since complextax compliance reduces the probability of detection, taxpayers may deliberately take advantage of complex situations. In contrast, complexity in compliance may result in accidental tax evasion.We therefore split the sample into two groups that differ in complexity. In Table 7, we presentcoefficient estimates for State Tax from local linear regressions for CHCs with two owners (lower-complexity sample) and for CHCs with more than two owners (higher-complexity sample). Ourresults indicate that complexity is related to accidental tax evasion. If incentives explain theresults of Number Owners , we would see a stronger effect of State Tax in the group of CHCs withmore than two owners. We nd a positive effect of crossing the state tax threshold only in thelow-complexity sample. In the high-complexity sample, crossing the state tax threshold does notaffect the probability of overstating the dividend allowance.
[Insert Table 7 about here]
We run robustness tests and use the number of rms an individual owns and whether theowners live in different states ( Different Regions ) as alternative proxies for complexity (TableA.7 and A.8 in the Appendix). Results are qualitatively similar. This robustness analysis alsoaddresses concerns that Number Owners is additionally related to collusion. Owners of rms withmany owners may not be able and willing to collude in tax evasion. In both robustness tests, wend a positive and signicant effect only in the low-complexity group.
We conclude that some tax evasion is driven by the tax advantage of dividend income over laborincome and tax awareness of the kink in the Swedish dual income tax. Individuals intentionallyevade taxes once they have a tax incentive. Hence, not only legal tax avoidance (Alstadsæter andJacob, 2013), but also tax evasion through overstating the dividend allowance is driven by taxincentives and tax awareness. Further, since one requires business partners for this type of taxevasion, this type of tax evasion is another example that not everyone who may be willing to cheat
also has the ability to do so (Kleven, Knudsen, Kreiner, Pedersen, and Saez, 2011).
6 Self-correction versus external correction of tax evasion
6.1 Detection of tax evasion
We distinguish between two different types of detection, which we label self-correction and externalcorrection, according to the legal consequences of detection by the tax administration (see above).
19
8/13/2019 Efectos de Tasa Impositiva y La Evasion
http://slidepdf.com/reader/full/efectos-de-tasa-impositiva-y-la-evasion 22/42
We set the indicator variable Self-Correction to 1 if the individual corrects the dividend allowancehimself, zero otherwise. We treat a case as self-detection only if the accumulated overstateddividend allowance from past years is not corrected. If the accumulated dividend allowance fromt-1 is corrected as shown in Columns (5) to (7) of Table 3, we set External Correction to 1.Self-Correction and External Correction are mutually exclusive. Either the taxpayer or the tax
authority detects the overstated dividend allowance.Figure 4 summarizes the percentage of K10-forms with overstated dividend allowances in the
preceding year and the percentage of cases detected. In 2007, about 40% of incorrect K10-formsfrom 2006 are corrected and now declared correctly. Surprisingly, 70% of these detected cases donot lead to a readjustment of the outrightly claimed dividend allowance. These cases are detectedby taxpayers themselves without consequences. The remaining 30% are corrections by the taxauthority. Overstating the dividend allowance is discovered by the authorities in only 12% (40%× 30%) of all evasion cases. This is a surprising result, as an automatic check across rm ownerscould have discovered all evasion cases.
Figure 4 also provides some rst indications that the probability of detection with consequences(External Correction ) decreases over time. First, the percentage of detected cases (self-correctedand externally detected) decreases from 40% in 2007 to 36.6% in 2009. Second, the share of external corrections decreases from 30% in 2007 and over 22% in 2008 to 20% in 2009. That is,only 7.23% of overstated dividend allowances are detected by tax authorities in 2009. In case of detection, the vast majority has no consequences on the accumulated dividend allowance; thatis, there is no penalty for taxpayers who self-correct misreporting. The motivation behind self-correction is not entirely clear. One may argue that self-correction is related to accidental tax
evasion. If taxpayers unintentionally overstate the dividend allowance, they may correct theirmistake without further obligation. However, one may also argue that self-correction can be usedby intentional tax evaders. These evaders overstate the dividend allowance up to the year in whichthey wish to pay out dividends. In the year of dividend payout, they comply with the rules, sincethere is no ne as long as the error does not lead to a reduction in income taxes in the year of misreporting.
[Insert Figure 4 about here]
6.2 Time until detection of overstated dividend allowance
Finally, we are interested in the factors that affect the dynamics of self-correction (taxpayer detectsthe mistake in calculating the dividend allowance) versus external correction (the tax authoritycorrects the dividend allowance). We examine the risk, or hazard, of being detected due either toself-correction or to external detection. As these two outcomes are mutually exclusive, i.e., com-peting events, we use a competing risks proportional hazards model with time-varying covariates
20

8/13/2019 Efectos de Tasa Impositiva y La Evasion
http://slidepdf.com/reader/full/efectos-de-tasa-impositiva-y-la-evasion 23/42
(Fine and Gray, 1999). We specify the model as:
λ (t) = λ (0)exp (θΠ j,t + ν Θ i,t ) (6)
where we use the time until self-correction and the time until external correction as dependent
variables and competing events. The advantage of a hazard model is that it informs us about thedynamics of detecting tax evasion. As independent variables, we include the rm-level controls(Π j,t ) and individual-level controls ( Π j,t ) from above. We run the competing risks model for allindividuals considered at risk . That is, we restrict the sample to owners who overstate the dividendallowance in at least one sample year; only these individuals can be detected. This restrictioncreates a sample-selection bias that we need to correct. To account for selection, we rst run aone-to-one matching procedure based on equation (3). We then use the predicted probability scoresfrom this probit regression as weights in the competing risks proportional hazards model (secondstage, equation (6)) to control for sample selection in our main model. Our statistical inference inthe competing risks hazards model is based on heteroskedasticity-robust standard errors clusteredat the individual level.
Table 8 presents regression results for the duration model from equation (6). We present resultsfor the time to self-correction in Panel A. We nd that the likelihood that a taxpayer corrects theoverstated dividend allowance on his own decreases with number of owners. Put differently, thetime until the overstated dividend allowance is self-corrected decreases as the number of ownersincreases. We nd a similar effect for least protable and most protable rms, as indicated bythe negative coefficient of the squared term of return on equity. That is, the least protable and
most protable rms are detected earlier than other rms. The positive coefficient of our rm sizevariable ln(Assets) suggests that owners of larger rms have a higher likelihood of self-correction.From the individual-level variables, we nd a negative effect from being married and a positiveeffect from family size on self-correction. Overall, the results in Panel A of Table 8 suggest that self-correction is not well explained by awareness and incentives. It appears that complexity increasesthe time until self-correction.
[Insert Table 8 about here]
Panel B of Table 8 presents results for time until external detection. Again, only a few variables
are signicant. For example, if the CHC is a tax sheltering rm, the likelihood of detection is higherand the tax authority detects the mistake earlier. Further, being married and living in a smallertown (Rural ) is associated with earlier external detection. In rural areas, the auditor may bemore familiar with businesses and their actual ownership structure in smaller municipalities. Thepositive sign on Born in Sweden could also be the result of amended tax returns. If a taxpayersconsults the tax authority about his past overstated dividend allowance, the tax authority isrequired to change the prior year’s dividend allowance.
21

8/13/2019 Efectos de Tasa Impositiva y La Evasion
http://slidepdf.com/reader/full/efectos-de-tasa-impositiva-y-la-evasion 24/42
Comparison of the results from Table 5 and Table 8 points toward the difference betweenthe characteristics of individuals who overstate the dividend allowance and the determinants of detection. Not all factors that increase the likelihood of ling erroneous tax returns also decreasetime until detection by the tax authority, i.e., external correction. For example, while the numberof owners is associated with a higher likelihood of overstating the dividend allowance, it has no
effect on time until external correction. In fact, we nd that only a few variables are signicantin the detection equations. One implication of this nding is that there is a lack of effective “red-ag” mechanisms. Such mechanisms should be based on empirical evidence of the characteristicsof individuals evading taxes and on factors that increase the complexity of compliance.
7 Conclusion
Tax authorities in many countries experience budget cuts while simultaneously trying to maintainthe quality and efficiency of tax compliance. The challenge is to improve tax revenue collectionwhen resources allocated to tax administration are reduced. Audits are costly and there arecontinuous efforts to automate controls and audit selection of taxpayers. This paper shows thatlack of awareness of the tax code and complexity in compliance can increase tax evasion. We alsond evidence for a relation between tax rates and observed tax evasion. The type of tax evasion,which we directly observe and identify in tax returns approved by the Swedish tax administration, isoften corrected by the taxpayer. Complexity increases the likelihood of misreporting and decreasesthe probability of detection. The relatively low detection rate of tax authorities can be explainedby slowness in adjusting enforcement and audit strategies following implementation of new tax
rules and tax forms.Our ndings have four main implications. First, economic models of tax evasion and avoidance
should take into account that tax administration and enforcement strategies can affect the taxevasion decision and the level of tax evasion (Shaw, Slemrod, and Whiting, 2010). Second, whendesigning tax reforms that change taxpayer incentives, policymakers should also adjust enforcementand audit strategies. Otherwise, a tax reform may have unintended consequences, or the desiredeffect may not occur at all. This argument not only applies to tax policy but to laws in general.For example, Christensen, Hail, and Leuz (2012) show that the liquidity benets of adopting inter-national nancial reporting standards are limited to those countries that also changed enforcementof accounting standards. Also, the threat of stronger enforcement and higher detection risk caneffectively decrease tax evasion (Alm, Jackson, and McKee, 2009; Fellner, Sausgruber, and Traxler,2013). Third, our results add to the literature on tax enforcement strategies (e.g., S´ anchez andSobel, 1993; Chander and Wilde, 1998; Boadway and Sato, 2009; Shaw, Slemrod, and Whiting,2010; Bigio and Zilberman, 2011). To implement effective control and compliance strategies, taxauthorities should merge information across taxpayers and use automated, computer-based plau-
22

8/13/2019 Efectos de Tasa Impositiva y La Evasion
http://slidepdf.com/reader/full/efectos-de-tasa-impositiva-y-la-evasion 25/42
sibility checks, which are capable of automatically detecting all overstated dividend allowancesexamined in this study. Fourth, at least some of the observed tax evasion observed in this paperappears to be accidental. Overall, only 40% of taxpayers actually benet from the observed taxevasion given their current tax status. Complex tax rules and tax forms can trigger unintendedtax evasion if mistakes are based on a lack of tax awareness and slowness in adapting to new rules.
The main challenge for tax authorities is to distinguish between accidental tax evaders andthose that deliberately evade taxes. Easily understandable and well-designed tax forms provideinformation to taxpayers and can reduce accidental misreporting. Integrating “easy-to-comply” taxforms into the design of control routines enables more automated auditing by tax administrations.Also, by reducing accidental misreporting, tax authorities can shift scarce auditing resources towarddetecting intentional tax evasion. Disentangling empirically unintentional and intentional taxnon-compliance is a relevant and challenging avenue for future research, policymakers, and taxauthorities. The challenge of non-compliance is not related exclusively to taxes. It is a centralissue in other areas, such as social security insurance, environmental standards, trade, and tariff regulations, where intended and accidental non-compliance are likely to be present.
23
8/13/2019 Efectos de Tasa Impositiva y La Evasion
http://slidepdf.com/reader/full/efectos-de-tasa-impositiva-y-la-evasion 26/42
References
Allingham, Michael G. and Agnar Sandmo (1972): Income Tax Evasion: A Theoretical Analysis,Journal of Public Economics , 1: 323–339.
Alm, James, Betty R. Jackson, and Michael McKee (2009): Getting the word out: Enforcementinformation dissemination and compliance behavior, Journal of Public Economics , 93: 392–402.
Alstadsæter, Annette and Martin Jacob (2012): Income Shifting in Sweden – An empirical evalu-ation of the 3:12 rules . Report to the Expert Group for Public Economics, Ministry of Finance,Stockholm.
Alstadsæter, Annette and Martin Jacob (2013): Who Participates in Tax Avoidance?, FAccTCenter Working Paper No. 08/2012.
Alstadsæter, Annette, Wojciech Kopczuk, and Kjetil Telle (2012): Social networks and individuals’tax avoidance participation, Mimeo, University of Oslo, Columbia University, and StatisticsNorway.
Andreoni, James, Brian Erard, and Jonathan Feinstein (1998): Tax compliance, Journal of Eco-nomic Literature , 36: 818–860.
Bigio, Saki and Eduardo Zilberman (2011): Optimal self-employment income tax enforcement,Journal of Public Economics , 95: 1021–1035.
Boadway, Robin and Motohiro Sato (2009): Optimal Tax Design and Enforcement with an InformalSector, American Economic Journal: Economic Policy , 1: 1–27.
Chander, Parkash and Louis L. Wilde (1998): A General Characterization of Optimal Income TaxEnforcement, Review of Economic Studies , 65: 165–183.
Chetty, Raj, John N. Friedman, and Emmanuel Saez (2013): Using Differences in KnowledgeAcross Neighborhoods to Uncover the Impacts of the EITC on Earnings, American Economic Review , forthcoming.
Chetty, Raj, Adam Looney, and Kory Kroft (2009): Salience and Taxation: Theory and Evidence,American Economic Review , 99: 1145–1177.
Christensen, Hans B., Luzi Hail, and Christian Leuz (2012): Mandatory IFRS Reporting andChanges in Enforcement, SSRN Working Paper.
Clotfelter, Charles T. (1983): Tax Evasion and Tax Rates: An Analysis of Individual Returns,Review of Economics and Statistics , 65: 363–373.
24

8/13/2019 Efectos de Tasa Impositiva y La Evasion
http://slidepdf.com/reader/full/efectos-de-tasa-impositiva-y-la-evasion 27/42
de Bartolome, Charles A.M. (1995): Which tax rate do people use: Average or marginal?, Journal of Public Economics , 56: 79–96.
Feinstein, Jonathan S. (1991): An econometric analysis of income tax evasion and its detection,RAND Journal of Economics , 22: 14–36.
Fellner, Gerlinde, Rupert Sausgruber, and Christian Traxler (2013): Testing enforcement strategiesin the eld: Threat, moral appeal and social information, Journal of the European Economic Association , 11: 634–660.
Fine, Jason P. and Robert J. Gray (1999): A Proportional Hazards Model for the Subdistributionof a Competing Risk, Journal of the American Statistical Association , 94: 496–509.
Finkelstein, Amy (2009): E-ZTAX: Tax Salience and Tax Rates, Quarterly Journal of Economics ,124: 969–1010.
Hanlon, Michelle, Edward L. Maydew, and Jacob R. Thornock (2013): Taking the Long WayHome: U.S. Tax Evasion and Offshore Investments in U.S. Equity and Debt Markets, Journal of Finance , forthcoming.
Jacob, Martin and Annette Alstadsæter (2013): Payout Policies of Privately Held Firms: Flexi-bility and the Role of Income Taxes, Mimeo, WHU, Vallendar.
Jones, Damon (2012): Inertia and Overwithholding: Explaining the Prevalence of Income TaxRefunds, American Economic Journal: Economic Policy , 4: 158–185.
Kleven, Henrik, Martin Knudsen, Claus Thustrup Kreiner, Soren Pedersen, and Emmanuel Saez(2011): Unwilling or Unable to Cheat? Evidence from a Tax Audit Experiment in Denmark,Econometrica , 79: 651–692.
Kopczuk, Wojciech (2006): Tax Simplication and Tax Compliance: An Economic Perspective, InMax Sawicky, editor, Bridging the Tax Gap. Addressing the Crisis in Tax Administration , pages111–143. Economic Policy Institute, Washington, DC.
Kopczuk, Wojciech (2012): The Polish business “at” tax and its effect on reported incomes: aPareto improving tax reform?, Mimeo, Columbia University.
Niepelt, Dirk (2005): Timing tax evasion, Journal of Public Economics , 89: 1612–1637.
Sandmo, Agnar (2005): The Theory of Tax Evasion: A Retrospective View, National Tax Journal ,58: 543–663.
Sandmo, Agnar (2012): An evasive topic: theorizing about the hidden economy, International Tax and Public Finance , 19: 5–24.
25

8/13/2019 Efectos de Tasa Impositiva y La Evasion
http://slidepdf.com/reader/full/efectos-de-tasa-impositiva-y-la-evasion 28/42
Shaw, Jonathan, Joel B. Slemrod, and John Whiting (2010): Administration and Compliance, InDimensions of Tax Design. The Mirrlees Review. Oxford University Press , pages 1100–1162.
Slemrod, Joel B. (2003): Trust in Public Finance, In Sijbren Cnossen and Hans-Werner Sinn, edi-tors, Public Finance and Public Policy in the New Century , page 49–88. MIT Press, Cambridge,
MA.Slemrod, Joel B. (2007): Cheating ourselves: The economics of tax evasion, Journal of Economic
Perspectives , 21: 25–48.
Slemrod, Joel B. and Shlomo Yitzhaki (2002): Tax avoidance, evasion, and administration, InAlan J. Auerbach and Martin Feldstein, editors, Handbook of Public Economics , volume 3, page1423–1470. Elsevier.
Sanchez, Isabel and Joel Sobel (1993): Hierarchical design and enforcement of income tax policies,
Journal of Public Economics , 50: 345–369.
26

8/13/2019 Efectos de Tasa Impositiva y La Evasion
http://slidepdf.com/reader/full/efectos-de-tasa-impositiva-y-la-evasion 29/42
Figure 1: Excerpt from K10-Form for CHC OwnersThis gure shows an excerpt from the K10-form for scal year 2006. The excerpt shows calculation of the dividend allowance(Ber¨ akning av gr¨ ansbelopp ) under the simplication rule ( F¨ orenklingsregeln ). The annual dividend allowance under the simpli-cation rule ( Arets gr¨ ansbelopp enligt f¨ orenklingsregeln ) is dened as 64,950 SEK, times the ratio of the number of own shares(Antal ¨ agde andelar ) to the number of total shares ( Totala antalet andelar ). Taxpayers ll in the eld 410 .
Alternativ 1 - Förenklingsregeln
1.1 Årets gränsbelopp enligt förenklingsregeln
Kr
+
Beräkning av gränsbelopp
Antal ägda andelar Totala antalet andelar
64 950 kr X
410
Figure 2: Frequencies of Excess Dividend Allowance Reporting, 2006–2009This gure plots the frequencies of misreported dividend allowances separately for each of our four sample years. On the horizontalaxis, we use the ratio of claimed dividend allowance per rm to the maximum allowance per rm according to the tax law. Avalue above 1 is regarded as tax evasion by law. On the vertical axis, we use the frequency of cases in each bin.
0
1 0 0 0
2 0 0 0
3 0 0 0
4 0 0 0
F r e q u e n c y
1 2 3 4 5Ratio of Claimed Dividend Allowance to Maximum A llowance
2006
0
1 0 0 0
2 0 0 0
3 0 0 0
4 0 0 0
F r e q u e n c y
1 2 3 4 5Ratio of Claimed Dividend Allowance to Maximum Allowance
2007
0
1 0 0 0
2 0 0 0
3 0 0 0
4 0 0 0
F r e q u e n c y
1 2 3 4 5Ratio of Claimed Dividend Allowance to Maximum A llowance
2008
0
1 0 0 0
2 0 0 0
3 0 0 0
4 0 0 0
F r e q u e n c y
1 2 3 4 5Ratio of Claimed Dividend Allowance to Maximum Allowance
2008
27

8/13/2019 Efectos de Tasa Impositiva y La Evasion
http://slidepdf.com/reader/full/efectos-de-tasa-impositiva-y-la-evasion 30/42
Figure 3: Over-reporting around the Major Kink in the Tax ScheduleThis gure shows the percentage of K10 forms with overstated dividend allowances in each bin of SEK250 around the major kink in the tax rate schedule.
. 0 2
. 0 3
. 0 4
. 0 5
. 0 6
. 0 7
P e r c e n
t a g e o
f O v e r r e p o r t e
d D i v i d e n
d A l l o w a n c e p e r
B i n
−2000 −1000 0 1000 2000Income in SEK 250 Bin around Kink
Figure 4: Self-Correction versus External CorrectionThis gure plots the percentage of overstated dividend allowances in the preceding year (black bar),the percentage of cases detected (gray bar), the fraction of cases detected by the taxpayer ( Self-Correction ), and the percentage of cases detected by the tax authority ( External Correction ). Thebasis for the calculation for all four statistics is total number K10-forms in a year.
000000000000000000000000000000000000000000000000000000000000000000000000000000000000000000000000000000000000000000000000000000000000000000000000000000000000000000000000000000000000000000000000000000000000000000000000000000000000000000000000000000000000000000000000000%
2%
4%
6%
8%
10%
2007 2008 2009Overstated Dividend Allowance (t-1) Detection000000000000Self-Correction External Correction
28

8/13/2019 Efectos de Tasa Impositiva y La Evasion
http://slidepdf.com/reader/full/efectos-de-tasa-impositiva-y-la-evasion 31/42
Table 1: Marginal tax rates and thresholds in Sweden, 2006–2009This table reports marginal tax rates on labor income and dividend income over the sample period. The marginal tax rate on laborincome consists of a municipality tax ( Local Tax , Column 1, averaged over all municipalities), a government-level tax of 20% ( State Tax Level 1 ) above the threshold reported in Column (2), and a second level of state tax of 5% above the threshold in Column (3).In Column (4), we present the threshold at which the social security contributions (32.4%) cease to generate benets. Above thethreshold, we treat social security contributions on wage income (remitted at the corporate level) as a tax. The thresholds are reportedin Swedish Krona (SEK). In 2006, USD 1 equaled SEK 7.38. The combined marginal tax rate, including social security τ i contributionsis presented in Column (5). We neglect the standard deduction and the earned income tax credit in the calculation. In Columns (6)through (8), we present the corporate tax rate on prots of CHCs (Column 6), dividend taxes at the individual level (Column 7), andcombined marginal tax rate on dividends, τ d , (Column (8)).
Labor Income Dividend Income CHC
Year Local State Tax State Tax Social τ i Corp. Dividend τ d
Tax Level 1 (20%) Level 2 (5%) Security Tax Tax Tax Ownerabove SEK above SEK Threshold Level
(1) (2) (3) (4) (5) (6) (7) (8)
2006 31.60% 317,700 472,300 359,100 31.6%-67.2% 28.00% 20% 42.40%2007 31.60% 328,600 488,600 403,000 31.6%-67.2% 28.00% 20% 42.40%2008 31.40% 340,900 507,100 410,000 31.4%-67.1% 28.00% 20% 42.40%2009 31.50% 380,200 538,800 428,000 31.5%-66.9% 26.30% 20% 41.00%
Table 2: Tax Misreporting in the Dividend AllowanceThis table illustrates calculation of the dividend allowance in case of tax misreporting. The example assumes that no dividends arepaid out. The maximum available allowance per rm is reported in Column 1. Columns 2 and 5 illustrate the claimed dividendallowance by one active owner holding 50% of shares. In Case 1, such owner claims twice the entitled allowance. In case of nodetection, the current claimed allowance increases the total allowance at year-end (Column 4 = Column 3 + 2 and Column 7 =Column 6 + 5). The accumulated allowances in year t in Column 3 and 6 equal the compounded total dividend allowance fromthe preceding year from Column 4 and 7. Interest rates are 6.54% in 2007, 7.16% in 2008, and 5.89% in 2009.
Year Maximum Case 1: Misreporting of Allowance, Case 2: Correct Reporting of Allowance in t Share in CHC = 50% Allowance, Share in CHC = 50%
Claimed Accumulated Total Claimed Accumulated TotalCurrent Allowance in Allowance Current Allowance in Allowance
Allowance year t from at the end Allowance year t from at the endin year t last years of year t in year t last years of year t
(1) (2) (3) (4) (5) (6) (7)
2006 64,950 64,950 0 64,950 32,475 0 32,4752007 89,000 89,000 69,198 158,198 44,500 34,599 79,0992008 91,800 91,800 169,525 261,325 45,900 84,762 130,6622009 120,000 120,000 276,717 396,717 60,000 138,358 198,358
29
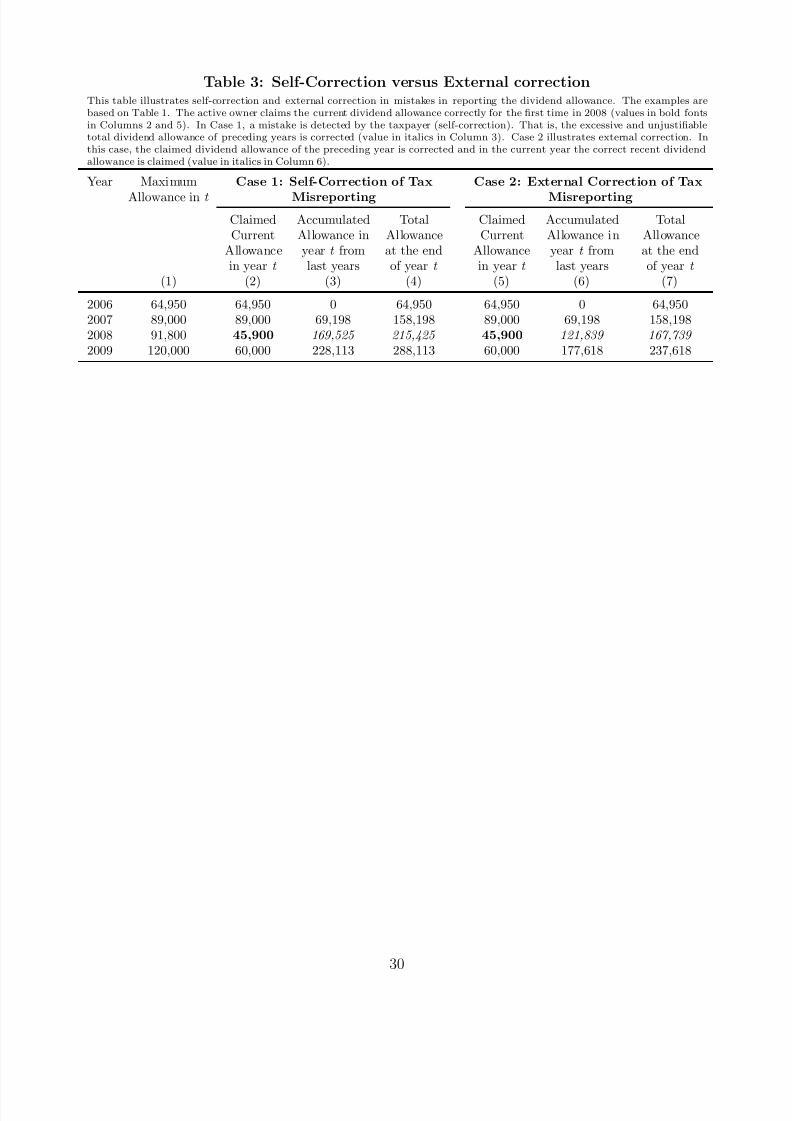
8/13/2019 Efectos de Tasa Impositiva y La Evasion
http://slidepdf.com/reader/full/efectos-de-tasa-impositiva-y-la-evasion 32/42
Table 3: Self-Correction versus External correctionThis table illustrates self-correction and external correction in mistakes in reporting the dividend allowance. The examples arebased on Table 1. The active owner claims the current dividend allowance correctly for the rst time in 2008 (values in bold fontsin Columns 2 and 5). In Case 1, a mistake is detected by the taxpayer (self-correction). That is, the excessive and unjustiabletotal dividend allowance of preceding years is corrected (value in italics in Column 3). Case 2 illustrates external correction. Inthis case, the claimed dividend allowance of the preceding year is corrected and in the current year the correct recent dividendallowance is claimed (value in italics in Column 6).
Year Maximum Case 1: Self-Correction of Tax Case 2: External Correction of Tax
Allowance in t Misreporting MisreportingClaimed Accumulated Total Claimed Accumulated TotalCurrent Allowance in Allowance Current Allowance in Allowance
Allowance year t from at the end Allowance year t from at the endin year t last years of year t in year t last years of year t
(1) (2) (3) (4) (5) (6) (7)
2006 64,950 64,950 0 64,950 64,950 0 64,9502007 89,000 89,000 69,198 158,198 89,000 69,198 158,1982008 91,800 45,900 169,525 215,425 45,900 121,839 167,739 2009 120,000 60,000 228,113 288,113 60,000 177,618 237,618
30

8/13/2019 Efectos de Tasa Impositiva y La Evasion
http://slidepdf.com/reader/full/efectos-de-tasa-impositiva-y-la-evasion 33/42
Table 4: Summary StatisticsThis table presents summary statistics for the sample of K10-forms over the period 2006–2009. Failure is a dummy variable equalto 1 if the dividend allowance is over-reported. Self-Correction (External correction ) is a dummy equal to 1 if the prior year’sfailure is corrected and if the excess claimed dividend allowance is not corrected (is corrected as well). Both variables are denedfor the 2007–2009 period only. Firm-level controls include eight variables. Number Owners is the number of active owners in therm. Different Region is a dummy equal to 1 if the owners of a corporation reside in different counties. Firm Age is the age of the rm in year t . Dividend Payout is a dummy variable equal to 1 if rm j pays out a dividend in year t . Ln(Assets) is thenatural logarithm of total assets in SEK. Return on Equity is the ratio of taxable prot at the CHC level in year t divided byprior-year total book equity. Financial Assets is the ratio of nancial assets and cash holdings at the CHC level in year t dividedby prior-year total assets. Shifting CHC is an indicator variable taking the value 1 if the CHC is a holding, shell, or low-turnovercorporation designed for tax avoidance (see, Alstadsæter and Jacob, 2013). We include thirteen individual-level control variables.Number Firms is the number of rms owned by an individual. State Tax is a dummy variable equal to 1 if earned income (laborand business income) in the preceding year exceeds the threshold for the state tax of 20%. Income Decile is the decile of the averageincome distribution of individual i in year t . Age is taxpayer age in years. Born in Sweden is a dummy equal to 1 if the individualwas born in Sweden. Female is a dummy variable equal to 1 if the taxpayer is female, zero otherwise. Married is a dummy variableequal to 1 if the taxpayer is married. Number Children is the number of children aged below 19 years. Tertiary Education is adummy variable equal to 1 if the individual holds a tertiary education degree of at least four years of college or university education.Business Degree is a dummy variable equal to 1 if the taxpayer holds a tertiary degree in business administration or economics.Law Degree (IT Degree ) is a dummy variable equal to 1 if the individual has studied law (computer sciences). Rural Area is anindicator variable equal to 1 if the individual resides in a small village. City is an indicator variable equal to 1 if the individualresides in a city with a population of more than 10,000.
N Mean Standard 10th Median 90thDeviation Percentile Percentile
Panel A: Misreporting Variables
Failure 574,030 0.049 0.217 0.000 0.000 0.000Self-Correction 472,628 0.018 0.134 0.000 0.000 0.000External correction 472,628 0.007 0.081 0.000 0.000 0.000
Panel B: Independent Variables
Number Owners 574,030 1.902 1.024 1.000 2.000 3.000Different Region 574,030 0.071 0.256 0.000 0.000 0.000Firm Age 574,030 14.870 11.390 3.000 14.000 27.000Dividend Payout 574,030 0.380 0.486 0.000 0.000 1.000Ln(Assets) 574,030 14.140 1.353 12.440 14.120 15.860Return on Equity 574,030 0.068 0.468 -0.354 0.025 0.397Financial Assets 574,030 0.406 0.356 0.011 0.311 0.985Shifting CHC 574,030 0.145 0.352 0.000 0.000 1.000Number Firms 574,030 1.256 0.647 1.000 1.000 2.000State Tax 574,030 0.447 0.497 0.000 0.000 1.000Income Decile 574,030 4.973 2.748 1.000 5.000 9.000Age 574,030 51.640 11.770 36.000 52.000 66.000Born in Sweden 574,030 0.930 0.256 1.000 1.000 1.000Female 574,030 0.237 0.425 0.000 0.000 1.000Married 574,030 0.632 0.482 0.000 1.000 1.000Number Children 574,030 0.643 0.978 0.000 0.000 2.000
Tertiary Education 574,030 0.195 0.396 0.000 0.000 1.000Business Degree 574,030 0.162 0.368 0.000 0.000 1.000Law Degree 574,030 0.017 0.130 0.000 0.000 0.000IT Degree 574,030 0.011 0.105 0.000 0.000 0.000Rural Area 574,030 0.172 0.377 0.000 0.000 1.000City 574,030 0.708 0.455 0.000 1.000 1.000
31
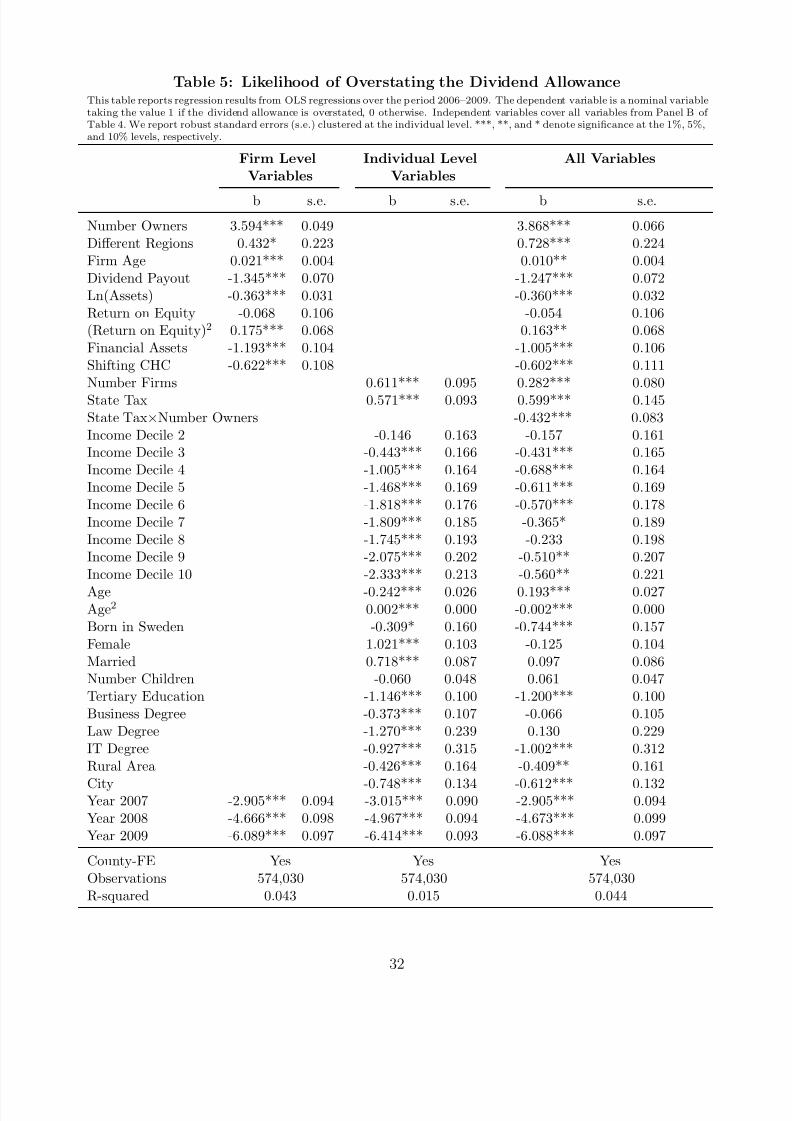
8/13/2019 Efectos de Tasa Impositiva y La Evasion
http://slidepdf.com/reader/full/efectos-de-tasa-impositiva-y-la-evasion 34/42
Table 5: Likelihood of Overstating the Dividend AllowanceThis table reports regression results from OLS regressions over the period 2006–2009. The dependent variable is a nominal variabletaking the value 1 if the dividend allowance is overstated, 0 otherwise. Independent variables cover all variables from Panel B of Table 4. We report robust standard errors (s.e.) clustered at the individual level. ***, **, and * denote signicance at the 1%, 5%,and 10% levels, respectively.
Firm Level Individual Level All VariablesVariables Variables
b s.e. b s.e. b s.e.
Number Owners 3.594*** 0.049 3.868*** 0.066Different Regions 0.432* 0.223 0.728*** 0.224Firm Age 0.021*** 0.004 0.010** 0.004Dividend Payout -1.345*** 0.070 -1.247*** 0.072Ln(Assets) -0.363*** 0.031 -0.360*** 0.032Return on Equity -0.068 0.106 -0.054 0.106(Return on Equity) 2 0.175*** 0.068 0.163** 0.068Financial Assets -1.193*** 0.104 -1.005*** 0.106Shifting CHC -0.622*** 0.108 -0.602*** 0.111Number Firms 0.611*** 0.095 0.282*** 0.080State Tax 0.571*** 0.093 0.599*** 0.145State Tax × Number Owners -0.432*** 0.083Income Decile 2 -0.146 0.163 -0.157 0.161Income Decile 3 -0.443*** 0.166 -0.431*** 0.165Income Decile 4 -1.005*** 0.164 -0.688*** 0.164Income Decile 5 -1.468*** 0.169 -0.611*** 0.169Income Decile 6 -1.818*** 0.176 -0.570*** 0.178Income Decile 7 -1.809*** 0.185 -0.365* 0.189Income Decile 8 -1.745*** 0.193 -0.233 0.198Income Decile 9 -2.075*** 0.202 -0.510** 0.207Income Decile 10 -2.333*** 0.213 -0.560** 0.221Age -0.242*** 0.026 0.193*** 0.027Age2 0.002*** 0.000 -0.002*** 0.000Born in Sweden -0.309* 0.160 -0.744*** 0.157Female 1.021*** 0.103 -0.125 0.104Married 0.718*** 0.087 0.097 0.086Number Children -0.060 0.048 0.061 0.047Tertiary Education -1.146*** 0.100 -1.200*** 0.100Business Degree -0.373*** 0.107 -0.066 0.105Law Degree -1.270*** 0.239 0.130 0.229IT Degree -0.927*** 0.315 -1.002*** 0.312Rural Area -0.426*** 0.164 -0.409** 0.161
City -0.748*** 0.134 -0.612*** 0.132Year 2007 -2.905*** 0.094 -3.015*** 0.090 -2.905*** 0.094Year 2008 -4.666*** 0.098 -4.967*** 0.094 -4.673*** 0.099Year 2009 -6.089*** 0.097 -6.414*** 0.093 -6.088*** 0.097
County-FE Yes Yes YesObservations 574,030 574,030 574,030R-squared 0.043 0.015 0.044
32

8/13/2019 Efectos de Tasa Impositiva y La Evasion
http://slidepdf.com/reader/full/efectos-de-tasa-impositiva-y-la-evasion 35/42
Table 6: Tax Incentives, Tax Awareness, and Overstating Dividend Allowances: LocalLinear Regressions
This table presents local linear regression results around the major kink in the marginal tax rate. We use the dummy variableFailure as the dependent variable. The range is dened in SEK around the rst state tax threshold. Individuals above this thresholdare subject to the 20% state tax. We present coefficient estimates for a dummy equal to 1 if the individual was above this threshold.We use a range of SEK 1,000 (Columns 1 and 2) and SEK 500 (Columns 3 and 4) around the state tax threshold. We presentresults without controls (Columns 1 and 3). Columns 2 and 4 present coefficient estimates for crossing the state tax threshold withcontrol variables. Independent variables cover all variables from Panel B of Table 4. Standard errors (shown in parentheses) allow
for heteroskedasticity and are clustered at the individual level. ***, **, and * denote signicance at the 1%, 5%, and 10% levels,respectively.
SEK 1,000 around Threshold SEK 500 around Threshold
(1) (2) (3) (4)
State Tax 1.839*** 1.438** 1.993*** 1.582**(0.622) (0.607) (0.707) (0.671)
Controls No Yes No YesYear-FE No Yes No YesCounty-FE No Yes No YesObservations 3,619 3,619 2,405 2,405
Table 7: Tax Incentives, Complexity, and Overstating Dividend AllowancesThis table presents local linear regression results around the major kink in the marginal tax rate. We use the dummy variableFailure as the dependent variable. The range is dened in SEK around the rst state tax threshold. Individuals above this thresholdare subject to the 20% state tax. We present coefficient estimates for a dummy equal to 1 if the individual was above this threshold.We use a range of SEK 1,000 (Columns 1 to 3) and SEK 500 (Columns 4 to 6) around the state tax threshold. We present resultswithout controls in Panel A. Panel B presents coefficient estimates for crossing the state tax threshold with control variables.Independent variables cover all variables from Panel B of Table 4. In Column (1) and (3), we restrict the sample to CHCs with twoactive owners. Columns (2) and (4) use CHCs with more than two active owners. Standard errors (shown in parentheses) allow forheteroskedasticity. ***, **, and * denote signicance at the 1%, 5%, and 10% levels, respectively.
Panel A: Local Linear Regression without Controls
SEK 1,000 around Threshold SEK 500 around Threshold2 Owners > 2 Owners 2 Owners > 2 Owners
(1) (2) (3) (4)
State Tax 3.490** 3.471 4.576*** 2.778(1.427) (2.627) (1.686) (3.454)
Controls No No No NoObservations 1,192 529 766 300
Panel B: Local Linear Regression With Controls
State Tax 2.762** 3.425 3.760** 3.047(1.393) (2.522) (1.650) (3.420)
Controls Yes Yes Yes YesObservations 1,192 529 766 300
33
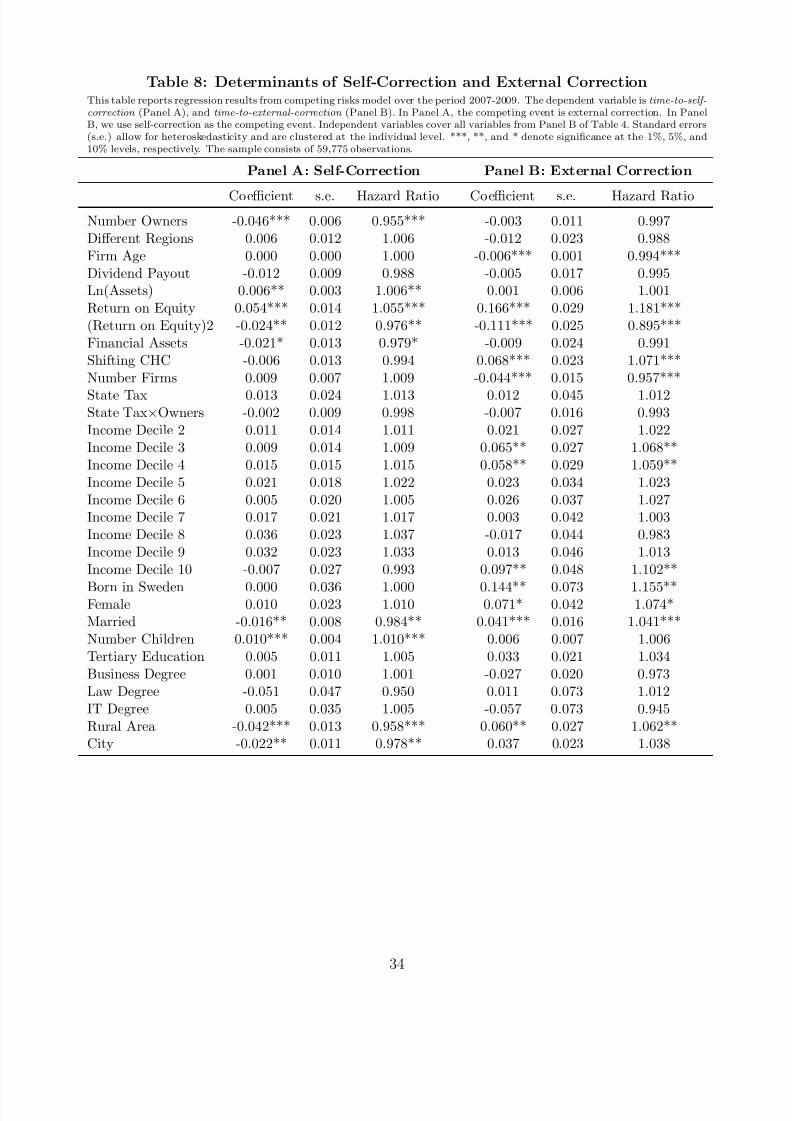
8/13/2019 Efectos de Tasa Impositiva y La Evasion
http://slidepdf.com/reader/full/efectos-de-tasa-impositiva-y-la-evasion 36/42
Table 8: Determinants of Self-Correction and External CorrectionThis table reports regression results from competing risks model over the period 2007-2009. The dependent variable is time-to-self-correction (Panel A), and time-to-external-correction (Panel B). In Panel A, the competing event is external correction. In PanelB, we use self-correction as the competing event. Independent variables cover all variables from Panel B of Table 4. Standard errors(s.e.) allow for heteroskedasticity and are clustered at the individual level. ***, **, and * denote signicance at the 1%, 5%, and10% levels, respectively. The sample consists of 59,775 observations.
Panel A: Self-Correction Panel B: External Correction
Coefficient s.e. Hazard Ratio Coefficient s.e. Hazard RatioNumber Owners -0.046*** 0.006 0.955*** -0.003 0.011 0.997Different Regions 0.006 0.012 1.006 -0.012 0.023 0.988Firm Age 0.000 0.000 1.000 -0.006*** 0.001 0.994***Dividend Payout -0.012 0.009 0.988 -0.005 0.017 0.995Ln(Assets) 0.006** 0.003 1.006** 0.001 0.006 1.001Return on Equity 0.054*** 0.014 1.055*** 0.166*** 0.029 1.181***(Return on Equity)2 -0.024** 0.012 0.976** -0.111*** 0.025 0.895***Financial Assets -0.021* 0.013 0.979* -0.009 0.024 0.991Shifting CHC -0.006 0.013 0.994 0.068*** 0.023 1.071***Number Firms 0.009 0.007 1.009 -0.044*** 0.015 0.957***State Tax 0.013 0.024 1.013 0.012 0.045 1.012State Tax × Owners -0.002 0.009 0.998 -0.007 0.016 0.993Income Decile 2 0.011 0.014 1.011 0.021 0.027 1.022Income Decile 3 0.009 0.014 1.009 0.065** 0.027 1.068**Income Decile 4 0.015 0.015 1.015 0.058** 0.029 1.059**Income Decile 5 0.021 0.018 1.022 0.023 0.034 1.023Income Decile 6 0.005 0.020 1.005 0.026 0.037 1.027Income Decile 7 0.017 0.021 1.017 0.003 0.042 1.003Income Decile 8 0.036 0.023 1.037 -0.017 0.044 0.983Income Decile 9 0.032 0.023 1.033 0.013 0.046 1.013Income Decile 10 -0.007 0.027 0.993 0.097** 0.048 1.102**
Born in Sweden 0.000 0.036 1.000 0.144** 0.073 1.155**Female 0.010 0.023 1.010 0.071* 0.042 1.074*Married -0.016** 0.008 0.984** 0.041*** 0.016 1.041***Number Children 0.010*** 0.004 1.010*** 0.006 0.007 1.006Tertiary Education 0.005 0.011 1.005 0.033 0.021 1.034Business Degree 0.001 0.010 1.001 -0.027 0.020 0.973Law Degree -0.051 0.047 0.950 0.011 0.073 1.012IT Degree 0.005 0.035 1.005 -0.057 0.073 0.945Rural Area -0.042*** 0.013 0.958*** 0.060** 0.027 1.062**City -0.022** 0.011 0.978** 0.037 0.023 1.038
34
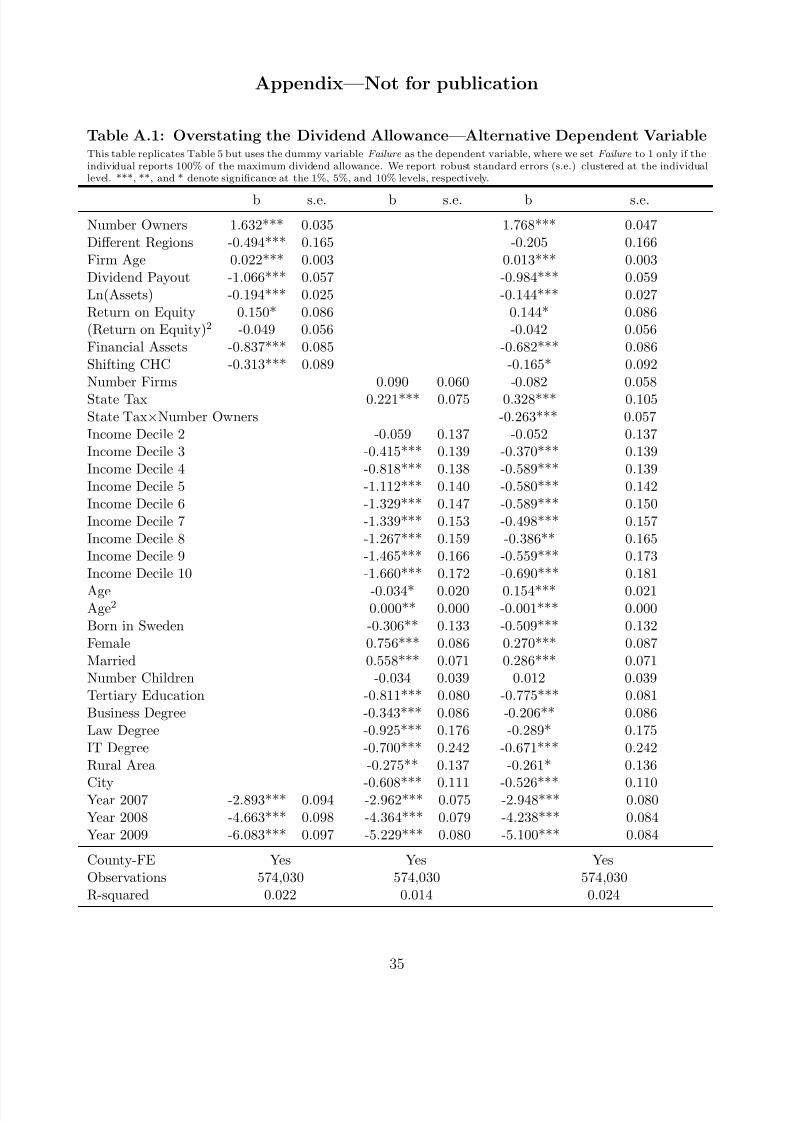
8/13/2019 Efectos de Tasa Impositiva y La Evasion
http://slidepdf.com/reader/full/efectos-de-tasa-impositiva-y-la-evasion 37/42
Appendix—Not for publication
Table A.1: Overstating the Dividend Allowance—Alternative Dependent VariableThis table replicates Table 5 but uses the dummy variable Failure as the dependent variable, where we set Failure to 1 only if theindividual reports 100% of the maximum dividend allowance. We report robust standard errors (s.e.) clustered at the individuallevel. ***, **, and * denote signicance at the 1%, 5%, and 10% levels, respectively.
b s.e. b s.e. b s.e.Number Owners 1.632*** 0.035 1.768*** 0.047Different Regions -0.494*** 0.165 -0.205 0.166Firm Age 0.022*** 0.003 0.013*** 0.003Dividend Payout -1.066*** 0.057 -0.984*** 0.059Ln(Assets) -0.194*** 0.025 -0.144*** 0.027Return on Equity 0.150* 0.086 0.144* 0.086(Return on Equity) 2 -0.049 0.056 -0.042 0.056Financial Assets -0.837*** 0.085 -0.682*** 0.086Shifting CHC -0.313*** 0.089 -0.165* 0.092Number Firms 0.090 0.060 -0.082 0.058State Tax 0.221*** 0.075 0.328*** 0.105State Tax × Number Owners -0.263*** 0.057Income Decile 2 -0.059 0.137 -0.052 0.137Income Decile 3 -0.415*** 0.139 -0.370*** 0.139Income Decile 4 -0.818*** 0.138 -0.589*** 0.139Income Decile 5 -1.112*** 0.140 -0.580*** 0.142Income Decile 6 -1.329*** 0.147 -0.589*** 0.150Income Decile 7 -1.339*** 0.153 -0.498*** 0.157Income Decile 8 -1.267*** 0.159 -0.386** 0.165Income Decile 9 -1.465*** 0.166 -0.559*** 0.173Income Decile 10 -1.660*** 0.172 -0.690*** 0.181Age -0.034* 0.020 0.154*** 0.021Age2 0.000** 0.000 -0.001*** 0.000Born in Sweden -0.306** 0.133 -0.509*** 0.132Female 0.756*** 0.086 0.270*** 0.087Married 0.558*** 0.071 0.286*** 0.071Number Children -0.034 0.039 0.012 0.039Tertiary Education -0.811*** 0.080 -0.775*** 0.081Business Degree -0.343*** 0.086 -0.206** 0.086Law Degree -0.925*** 0.176 -0.289* 0.175IT Degree -0.700*** 0.242 -0.671*** 0.242Rural Area -0.275** 0.137 -0.261* 0.136
City -0.608*** 0.111 -0.526*** 0.110Year 2007 -2.893*** 0.094 -2.962*** 0.075 -2.948*** 0.080Year 2008 -4.663*** 0.098 -4.364*** 0.079 -4.238*** 0.084Year 2009 -6.083*** 0.097 -5.229*** 0.080 -5.100*** 0.084
County-FE Yes Yes YesObservations 574,030 574,030 574,030R-squared 0.022 0.014 0.024
35
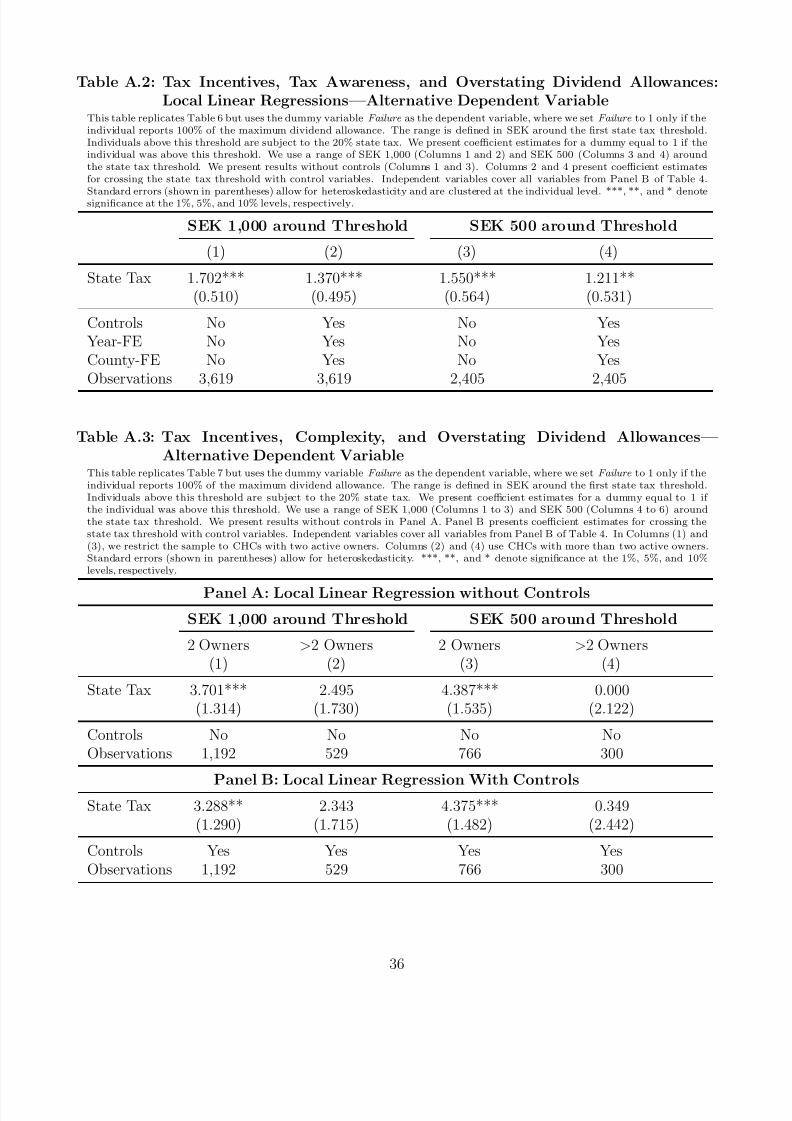
8/13/2019 Efectos de Tasa Impositiva y La Evasion
http://slidepdf.com/reader/full/efectos-de-tasa-impositiva-y-la-evasion 38/42
Table A.2: Tax Incentives, Tax Awareness, and Overstating Dividend Allowances:Local Linear Regressions—Alternative Dependent Variable
This table replicates Table 6 but uses the dummy variable Failure as the dependent variable, where we set Failure to 1 only if theindividual reports 100% of the maximum dividend allowance. The range is dened in SEK around the rst state tax threshold.Individuals above this threshold are subject to the 20% state tax. We present coefficient estimates for a dummy equal to 1 if theindividual was above this threshold. We use a range of SEK 1,000 (Columns 1 and 2) and SEK 500 (Columns 3 and 4) aroundthe state tax threshold. We present results without controls (Columns 1 and 3). Columns 2 and 4 present coefficient estimatesfor crossing the state tax threshold with control variables. Independent variables cover all variables from Panel B of Table 4.
Standard errors (shown in parentheses) allow for heteroskedasticity and are clustered at the individual level. ***, **, and * denotesignicance at the 1%, 5%, and 10% levels, respectively.
SEK 1,000 around Threshold SEK 500 around Threshold
(1) (2) (3) (4)
State Tax 1.702*** 1.370*** 1.550*** 1.211**(0.510) (0.495) (0.564) (0.531)
Controls No Yes No YesYear-FE No Yes No YesCounty-FE No Yes No YesObservations 3,619 3,619 2,405 2,405
Table A.3: Tax Incentives, Complexity, and Overstating Dividend Allowances—Alternative Dependent Variable
This table replicates Table 7 but uses the dummy variable Failure as the dependent variable, where we set Failure to 1 only if theindividual reports 100% of the maximum dividend allowance. The range is dened in SEK around the rst state tax threshold.Individuals above this threshold are subject to the 20% state tax. We present coefficient estimates for a dummy equal to 1 if the individual was above this threshold. We use a range of SEK 1,000 (Columns 1 to 3) and SEK 500 (Columns 4 to 6) aroundthe state tax threshold. We present results without controls in Panel A. Panel B presents coefficient estimates for crossing thestate tax threshold with control variables. Independent variables cover all variables from Panel B of Table 4. In Columns (1) and(3), we restrict the sample to CHCs with two active owners. Columns (2) and (4) use CHCs with more than two active owners.Standard errors (shown in parentheses) allow for heteroskedasticity. ***, **, and * denote signicance at the 1%, 5%, and 10%levels, respectively.
Panel A: Local Linear Regression without ControlsSEK 1,000 around Threshold SEK 500 around Threshold
2 Owners > 2 Owners 2 Owners > 2 Owners(1) (2) (3) (4)
State Tax 3.701*** 2.495 4.387*** 0.000(1.314) (1.730) (1.535) (2.122)
Controls No No No NoObservations 1,192 529 766 300
Panel B: Local Linear Regression With ControlsState Tax 3.288** 2.343 4.375*** 0.349
(1.290) (1.715) (1.482) (2.442)
Controls Yes Yes Yes YesObservations 1,192 529 766 300
36

8/13/2019 Efectos de Tasa Impositiva y La Evasion
http://slidepdf.com/reader/full/efectos-de-tasa-impositiva-y-la-evasion 39/42
Table A.4: Determinants of Self-Correction and External CorrectionThis table replicates Table 8 but uses the dummy variable Failure as the dependent variable, where we set Failure to 1 only if the individual reports 100% of the maximum dividend allowance. The dependent variable is time-to-self-correction (Panel A), andtime-to-external-correction (Panel B). In Panel A, the competing event is external correction. In Panel B, we use self-correctionas the competing event. Independent variables cover all variables from Panel B of Table 4. Standard errors (s.e.) allow forheteroskedasticity. ***, **, and * denote signicance at the 1%, 5%, and 10% levels, respectively. The sample consists of 39,092observations.
Panel A: Self-Correction Panel B: External Correction
Coefficient s.e. Hazard Ratio Coefficient s.e. Hazard Ratio
Number Owners -0.077*** 0.009 0.926*** 0.056*** 0.010 1.057***Different Regions -0.003 0.020 0.997 -0.014 0.025 0.986Firm Age 0.000 0.000 1.000 -0.007*** 0.001 0.993***Dividend Payout -0.007 0.012 0.993 -0.011 0.017 0.990Ln(Assets) 0.011*** 0.004 1.011*** -0.011* 0.006 0.989*Return on Equity 0.043** 0.018 1.044** 0.173*** 0.030 1.189***(Return on Equity) 2 0.019 0.015 1.019 -0.082*** 0.028 0.921***Financial Assets -0.049*** 0.017 0.952*** 0.007 0.024 1.007Shifting CHC -0.013 0.017 0.987 0.054** 0.024 1.055**
Number Firms -0.023** 0.011 0.978** -0.006 0.016 0.994State Tax -0.005 0.035 0.995 0.031 0.045 1.032State Tax × Owners 0.007 0.014 1.008 -0.020 0.016 0.981Income Decile 2 0.019 0.018 1.019 0.003 0.027 1.003Income Decile 3 0.015 0.018 1.015 0.045* 0.027 1.046*Income Decile 4 0.016 0.020 1.016 0.025 0.029 1.025Income Decile 5 0.018 0.023 1.018 0.029 0.035 1.030Income Decile 6 0.011 0.025 1.011 -0.011 0.037 0.989Income Decile 7 0.051* 0.027 1.052* -0.051 0.044 0.951Income Decile 8 0.014 0.031 1.014 -0.017 0.046 0.983Income Decile 9 0.031 0.031 1.032 0.051 0.046 1.052
Income Decile 10 0.020 0.035 1.020 0.056 0.051 1.057Born in Sweden -0.035 0.043 0.965 0.134* 0.073 1.144*Female -0.008 0.029 0.992 0.062 0.042 1.063Married -0.015 0.010 0.985 0.035** 0.016 1.036**Number Children 0.011** 0.005 1.011** 0.014* 0.007 1.014*Tertiary Education -0.014 0.015 0.986 0.033 0.021 1.033Business Degree -0.007 0.013 0.993 0.008 0.020 1.008Law Degree 0.027 0.054 1.027 -0.026 0.072 0.975IT Degree 0.024 0.045 1.024 -0.020 0.081 0.981Rural Area -0.057*** 0.017 0.945*** 0.023 0.027 1.023City -0.030** 0.014 0.971** 0.024 0.023 1.024
37

8/13/2019 Efectos de Tasa Impositiva y La Evasion
http://slidepdf.com/reader/full/efectos-de-tasa-impositiva-y-la-evasion 40/42
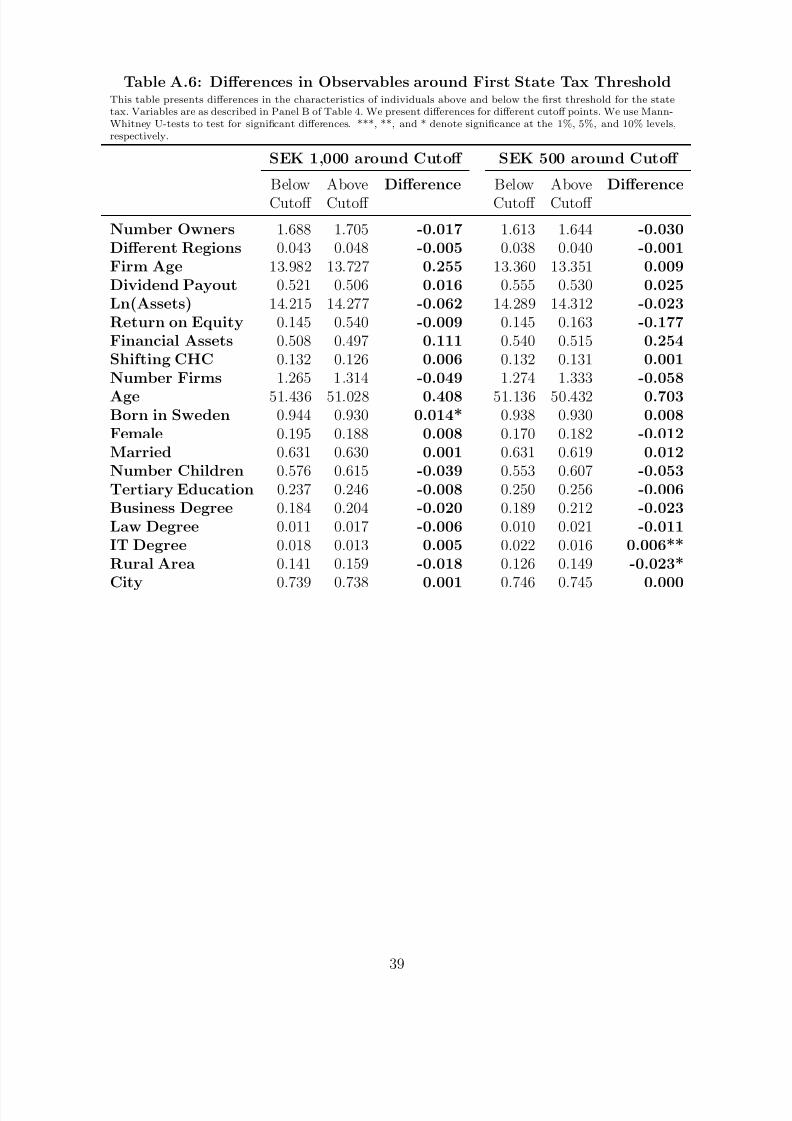
8/13/2019 Efectos de Tasa Impositiva y La Evasion
http://slidepdf.com/reader/full/efectos-de-tasa-impositiva-y-la-evasion 41/42
Table A.6: Differences in Observables around First State Tax ThresholdThis table presents differences in the characteristics of individuals above and below the rst threshold for the statetax. Variables are as described in Panel B of Table 4. We present differences for different cutoff points. We use Mann-Whitney U-tests to test for signicant differences. ***, **, and * denote signicance at the 1%, 5%, and 10% levels,respectively.
SEK 1,000 around Cutoff SEK 500 around Cutoff
Below Above Difference Below Above DifferenceCutoff Cutoff Cutoff Cutoff
Number Owners 1.688 1.705 -0.017 1.613 1.644 -0.030Different Regions 0.043 0.048 -0.005 0.038 0.040 -0.001Firm Age 13.982 13.727 0.255 13.360 13.351 0.009Dividend Payout 0.521 0.506 0.016 0.555 0.530 0.025Ln(Assets) 14.215 14.277 -0.062 14.289 14.312 -0.023Return on Equity 0.145 0.540 -0.009 0.145 0.163 -0.177Financial Assets 0.508 0.497 0.111 0.540 0.515 0.254Shifting CHC 0.132 0.126 0.006 0.132 0.131 0.001Number Firms 1.265 1.314 -0.049 1.274 1.333 -0.058Age 51.436 51.028 0.408 51.136 50.432 0.703Born in Sweden 0.944 0.930 0.014* 0.938 0.930 0.008Female 0.195 0.188 0.008 0.170 0.182 -0.012Married 0.631 0.630 0.001 0.631 0.619 0.012Number Children 0.576 0.615 -0.039 0.553 0.607 -0.053Tertiary Education 0.237 0.246 -0.008 0.250 0.256 -0.006Business Degree 0.184 0.204 -0.020 0.189 0.212 -0.023Law Degree 0.011 0.017 -0.006 0.010 0.021 -0.011IT Degree 0.018 0.013 0.005 0.022 0.016 0.006**Rural Area 0.141 0.159 -0.018 0.126 0.149 -0.023*
City 0.739 0.738 0.001 0.746 0.745 0.000
39
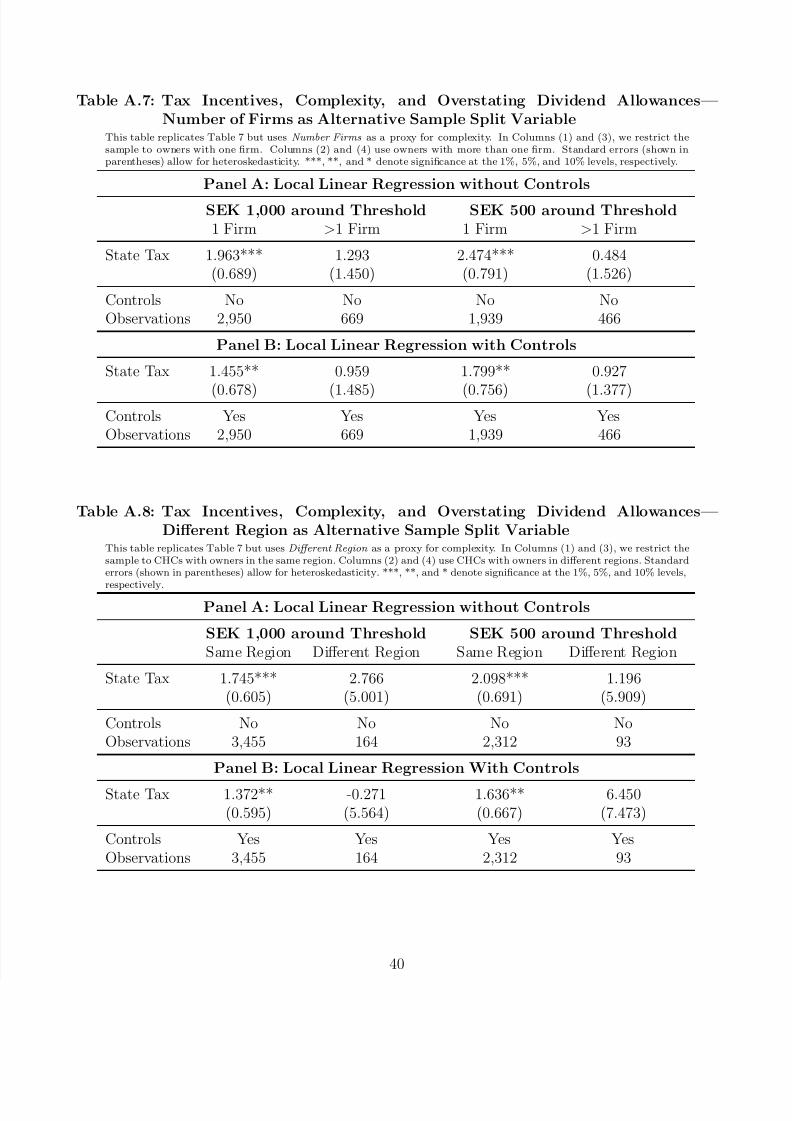
8/13/2019 Efectos de Tasa Impositiva y La Evasion
http://slidepdf.com/reader/full/efectos-de-tasa-impositiva-y-la-evasion 42/42
Table A.7: Tax Incentives, Complexity, and Overstating Dividend Allowances—Number of Firms as Alternative Sample Split Variable
This table replicates Table 7 but uses Number Firms as a proxy for complexity. In Columns (1) and (3), we restrict thesample to owners with one rm. Columns (2) and (4) use owners with more than one rm. Standard errors (shown inparentheses) allow for heteroskedasticity. ***, **, and * denote signicance at the 1%, 5%, and 10% levels, respectively.
Panel A: Local Linear Regression without Controls
SEK 1,000 around Threshold SEK 500 around Threshold1 Firm > 1 Firm 1 Firm > 1 Firm
State Tax 1.963*** 1.293 2.474*** 0.484(0.689) (1.450) (0.791) (1.526)
Controls No No No NoObservations 2,950 669 1,939 466
Panel B: Local Linear Regression with Controls
State Tax 1.455** 0.959 1.799** 0.927
(0.678) (1.485) (0.756) (1.377)Controls Yes Yes Yes YesObservations 2,950 669 1,939 466
Table A.8: Tax Incentives, Complexity, and Overstating Dividend Allowances—Different Region as Alternative Sample Split Variable
This table replicates Table 7 but uses Different Region as a proxy for complexity. In Columns (1) and (3), we restrict thesample to CHCs with owners in the same region. Columns (2) and (4) use CHCs with owners in different regions. Standarderrors (shown in parentheses) allow for heteroskedasticity. ***, **, and * denote signicance at the 1%, 5%, and 10% levels,
respectively.Panel A: Local Linear Regression without Controls
SEK 1,000 around Threshold SEK 500 around ThresholdSame Region Different Region Same Region Different Region
State Tax 1.745*** 2.766 2.098*** 1.196(0.605) (5.001) (0.691) (5.909)
Controls No No No NoObservations 3,455 164 2,312 93
Panel B: Local Linear Regression With Controls
State Tax 1.372** -0.271 1.636** 6.450(0.595) (5.564) (0.667) (7.473)
Controls Yes Yes Yes YesObservations 3,455 164 2,312 93