1 agua y biodiversidad delegación de la unión europea en méxico congreso nacional iclei
TRANSCRIPT
1
Agua y biodiversidad
Delegación de la Unión Europea en MéxicoCongreso Nacional ICLEI
2
1. Politicas de Agua y Biodiversidad en la Union Euopea
2. Proyecto RALCEA
Presentación

3
1. EU Biodiversity policy and post-2010 developments
4
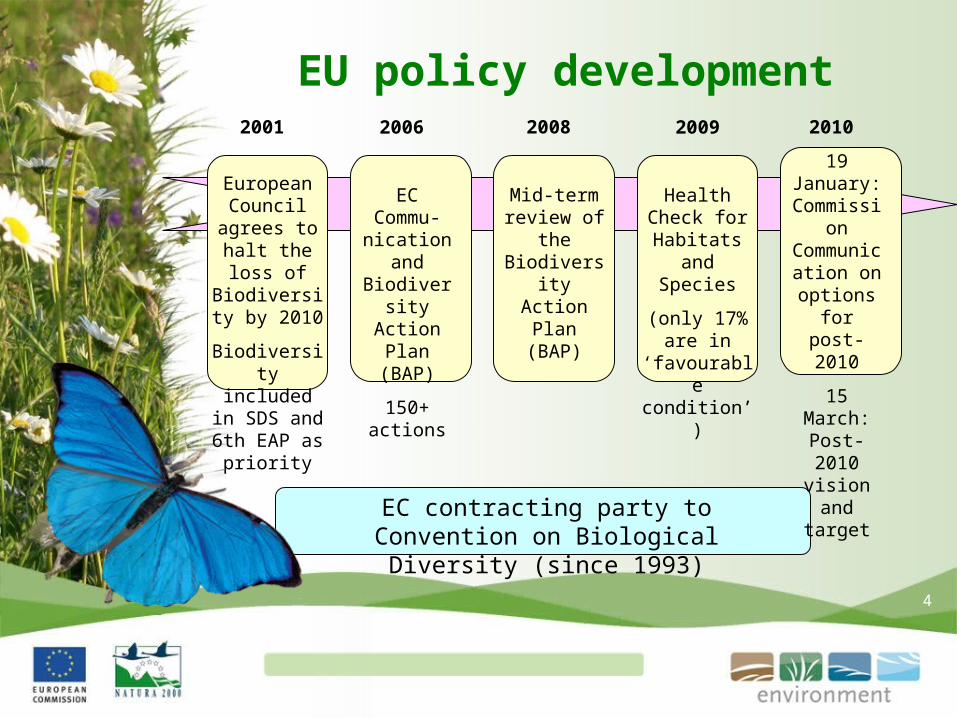
EU policy development
EC contracting party to Convention on Biological Diversity (since 1993)
2001
European Council agrees
to halt the loss of Biodiversity by
2010
Biodiversity included in SDS and 6th EAP as
priority
2010
19 January: Commission Communication on options for post-2010
15 March: Post-2010 vision and
target
2006
EC Commu-nication and Biodiversity Action Plan
(BAP)
150+ actions
2009
Health Check for Habitats and
Species
(only 17% are in ‘favourable condition’)
2008
Mid-term review of the Biodiversity Action Plan
(BAP)
5
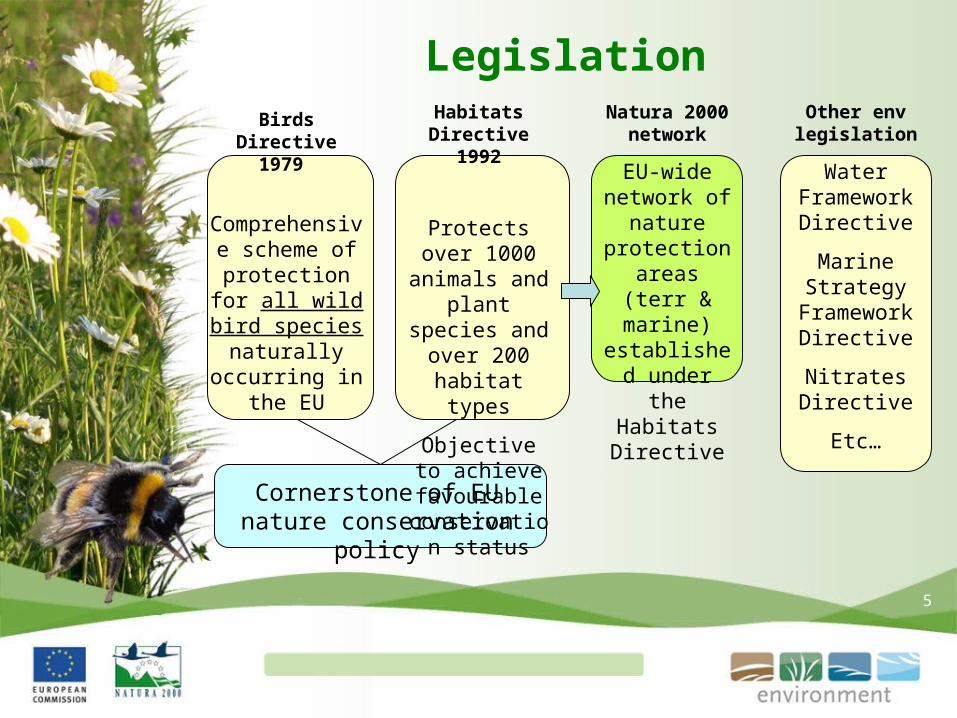
Legislation
Cornerstone of EU nature conservation policy
Birds Directive 1979
Comprehensive scheme of
protection for all wild bird species
naturally occurring in the EU
Other env legislation
Water Framework
Directive
Marine Strategy Framework
Directive
Nitrates Directive
Etc…
Natura 2000 network
EU-wide network of nature
protection areas (terr & marine)
established under the Habitats Directive
Habitats Directive 1992
Protects over 1000 animals and plant species and over 200 habitat types
Objective to achieve favourable
conservation status
6
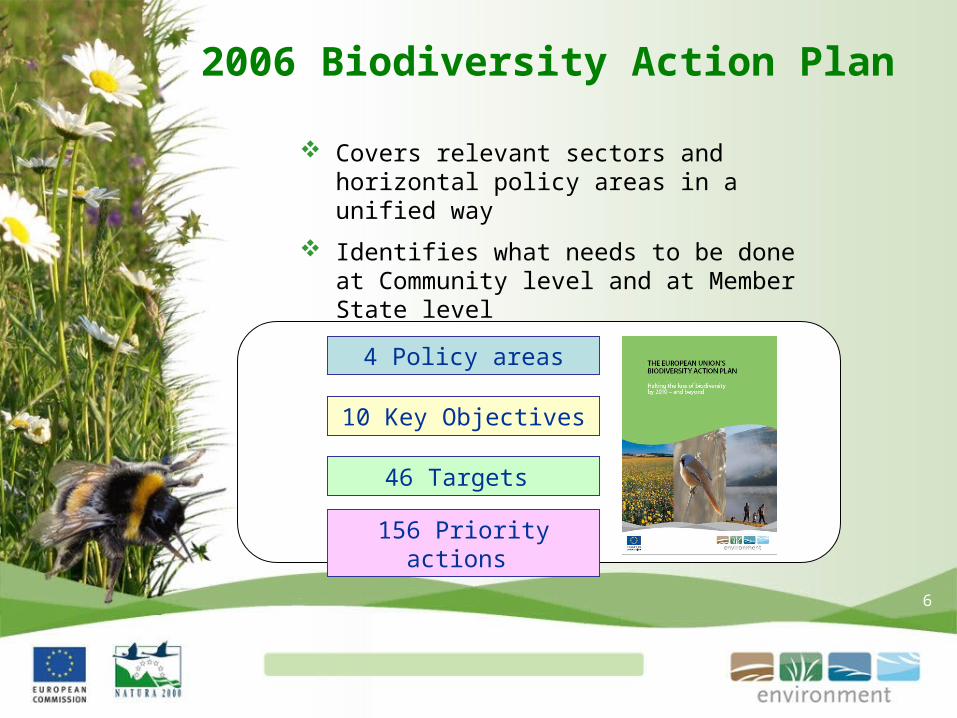
2006 Biodiversity Action Plan
Covers relevant sectors and horizontal policy areas in a unified way
Identifies what needs to be done at Community level and at Member State level
4 Policy areas
10 Key Objectives
156 Priority actions
46 Targets
7
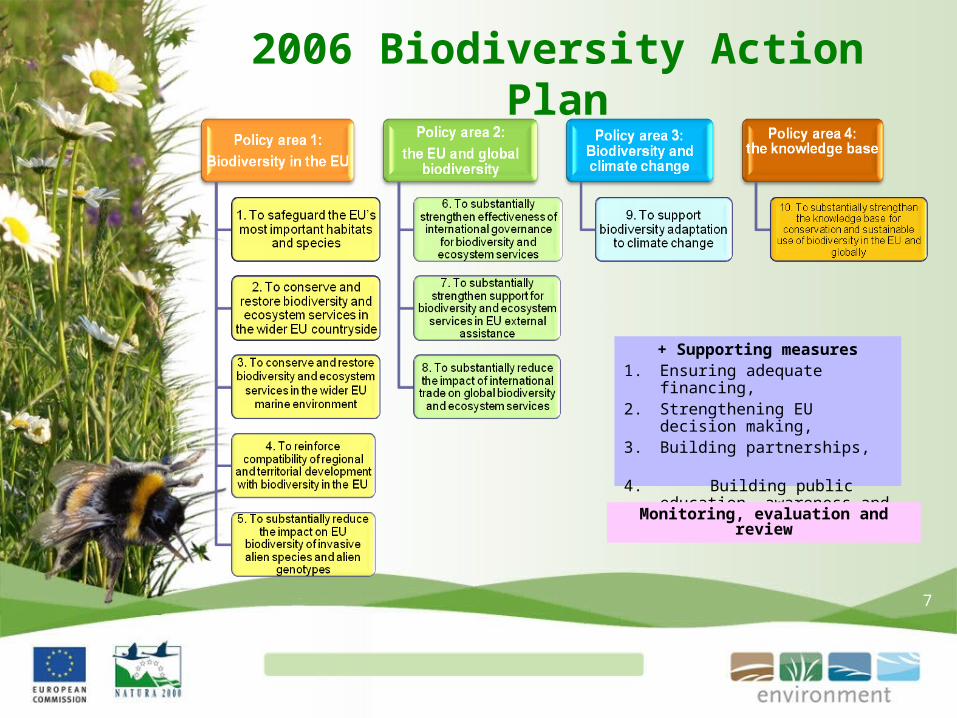
2006 Biodiversity Action Plan
+ Supporting measures1. Ensuring adequate financing, 2. Strengthening EU decision
making, 3. Building partnerships,
4. Building public education,
awareness and participation
Monitoring, evaluation and review
8
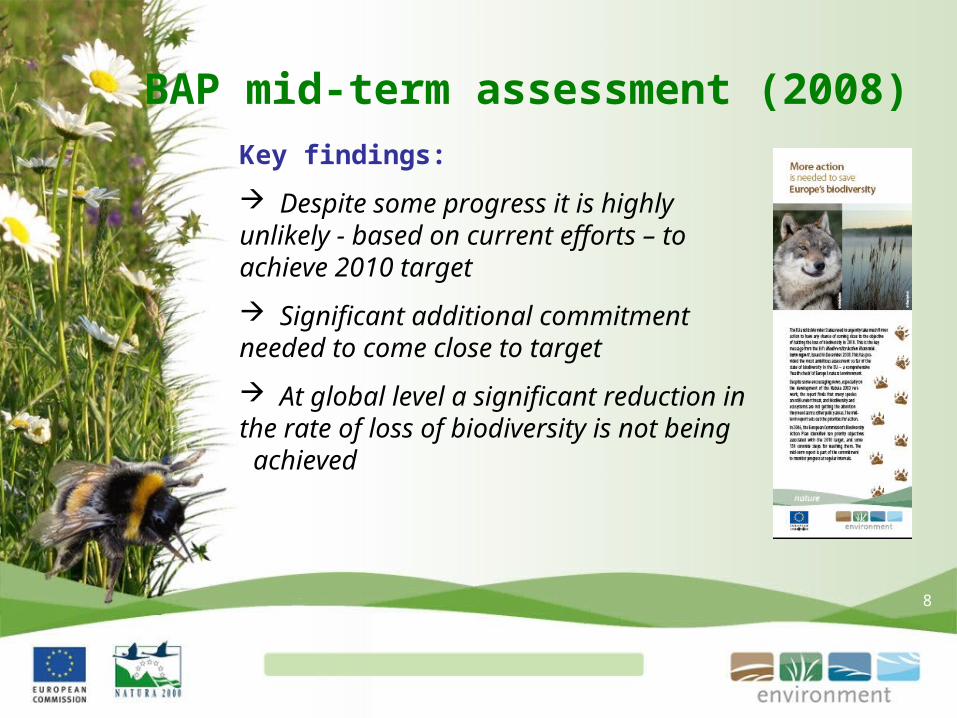
BAP mid-term assessment (2008)
Key findings:
Despite some progress it is highly unlikely - based on current efforts – to achieve 2010 target
Significant additional commitment needed to come close to target
At global level a significant reduction in the rate of loss of biodiversity is not being achieved
9
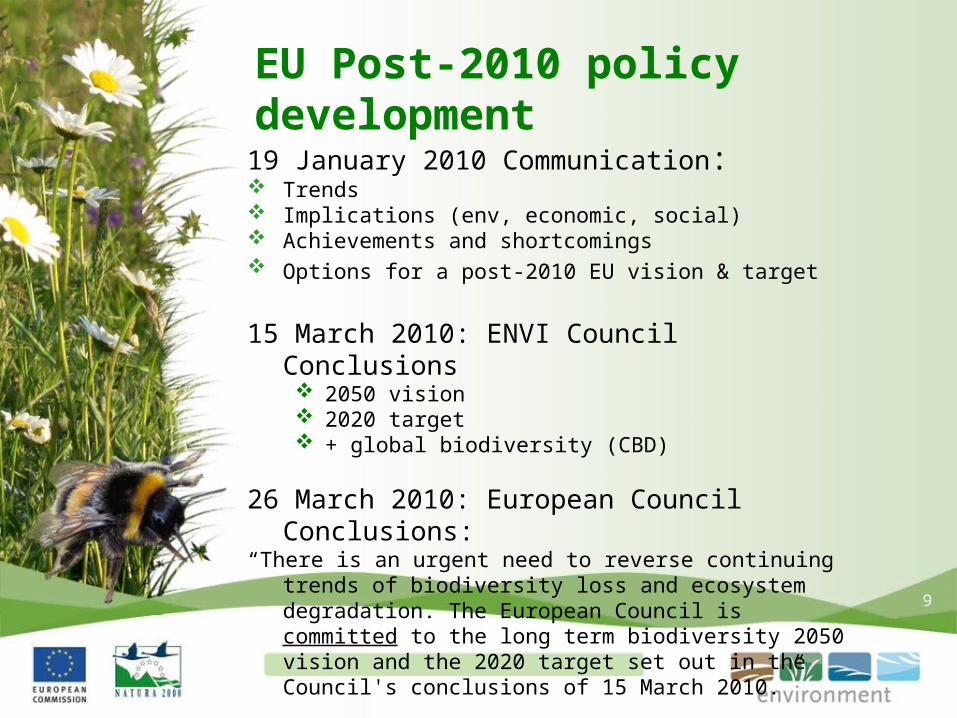
EU Post-2010 policy development
19 January 2010 Communication: Trends Implications (env, economic, social) Achievements and shortcomings Options for a post-2010 EU vision & target
15 March 2010: ENVI Council Conclusions 2050 vision 2020 target + global biodiversity (CBD)
26 March 2010: European Council Conclusions:“There is an urgent need to reverse continuing trends of
biodiversity loss and ecosystem degradation. The European Council is committed to the long term biodiversity 2050 vision and the 2020 target set out in the Council's conclusions of 15 March 2010.”

10
EU post-2010 vision and target
By 2050, European Union biodiversity and the ecosystem services it provides – its natural capital – are protected, valued and appropriately restored for biodiversity’s intrinsic value and for their essential contribution to human wellbeing and economic prosperity, and so that catastrophic changes caused by the loss of biodiversity are avoided.
By 2020, Halt the loss of biodiversity and ecosystem services in the EU and restore them insofar as feasible, and step up the EU's contribution to averting global biodiversity loss.
11
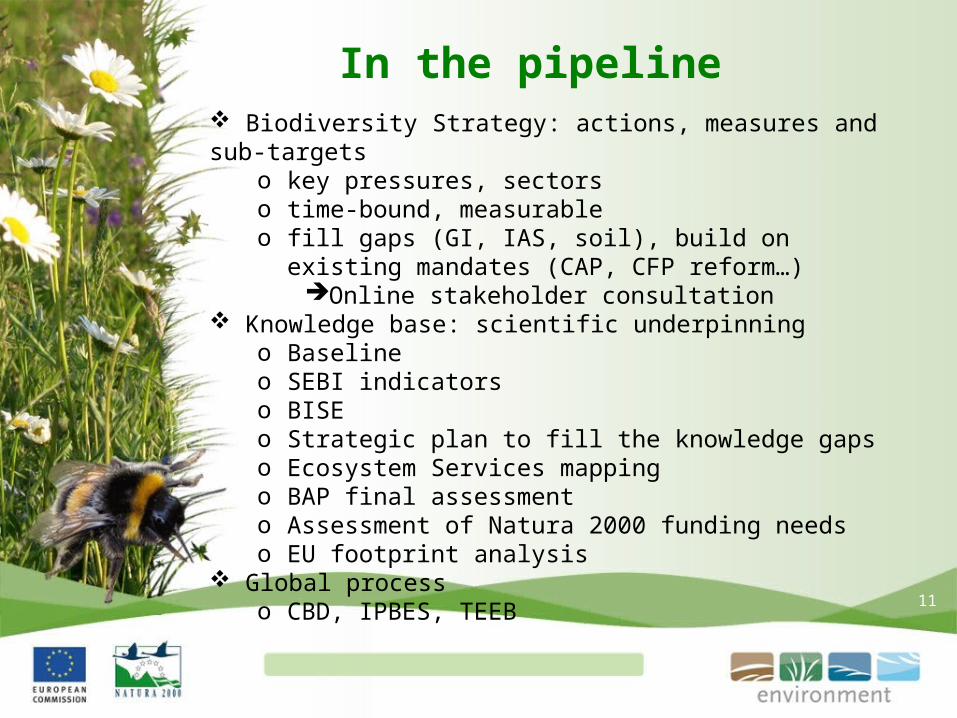
In the pipeline Biodiversity Strategy: actions, measures and sub-targets
o key pressures, sectorso time-bound, measurable o fill gaps (GI, IAS, soil), build on existing mandates (CAP,
CFP reform…)Online stakeholder consultation
Knowledge base: scientific underpinningo Baseline o SEBI indicatorso BISEo Strategic plan to fill the knowledge gaps o Ecosystem Services mappingo BAP final assessmento Assessment of Natura 2000 funding needso EU footprint analysis
Global processo CBD, IPBES, TEEB
12
2. Knowledge base to support policy
13
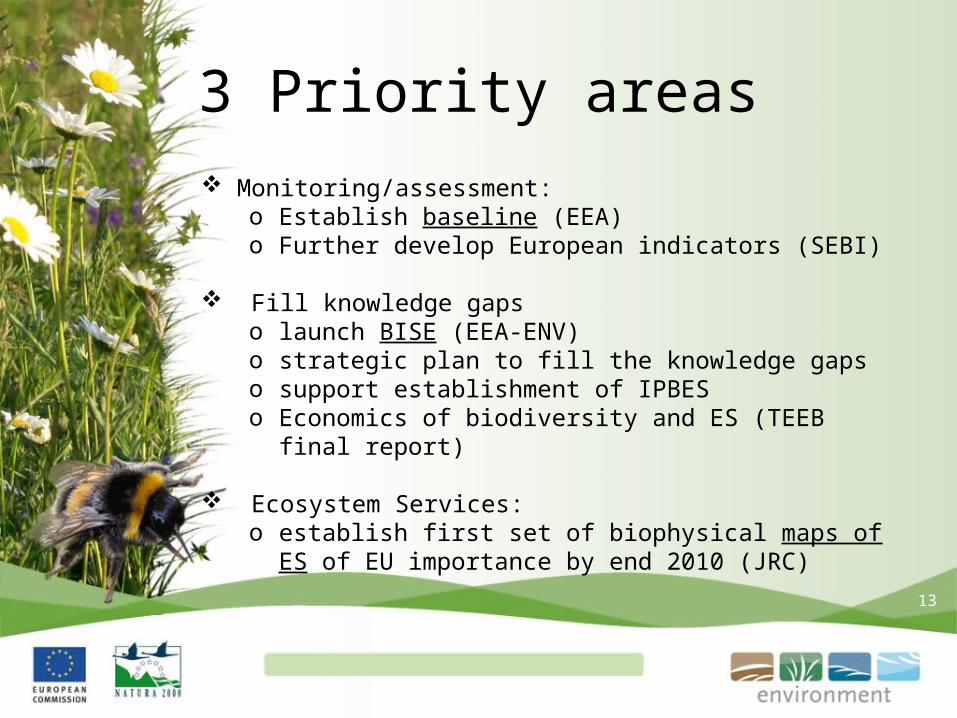
Monitoring/assessment:o Establish baseline (EEA)o Further develop European indicators (SEBI)
Fill knowledge gapso launch BISE (EEA-ENV)o strategic plan to fill the knowledge gaps o support establishment of IPBESo Economics of biodiversity and ES (TEEB final report)
Ecosystem Services:o establish first set of biophysical maps of ES of EU
importance by end 2010 (JRC)
3 Priority areas

14
I Baseline
• Facts & figures on the state/trends of and pressures on biodiversity & ecosystems components
• Provide arguments and rational why biodiversity is important and why is it urgent to act
• Support development of post-2010 target(s) and sub-targets
• Measure/monitor progress and achievement from 2011 to 2020

15
Baseline constraints
• Target audience: policy makers Laymen language• Compilation and re-arrangement of EXISTING data• No new data collection, no new assessments or
evaluations (except for updates)• Snapshot at EU level and/or biogeographical level • Use validated/published/peer reviewed data (reporting) • Compare different points in time ‘One-off’ data not useful
to monitor progress; may be useful to give context• Provide links ‘biodiversity / human well-being’
16
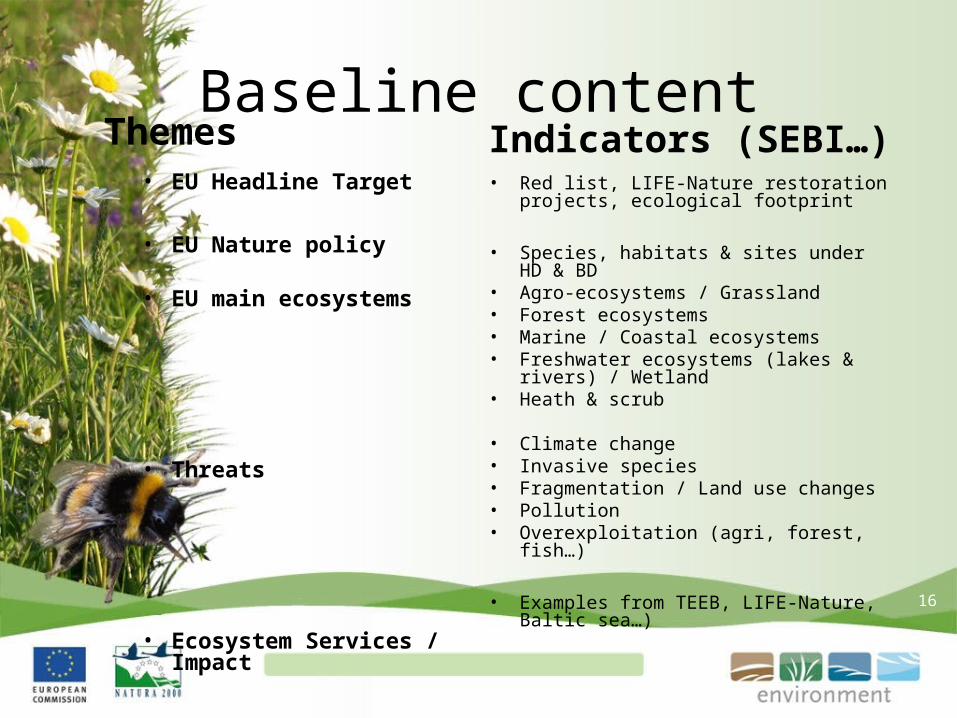
Baseline content• EU Headline Target
• EU Nature policy
• EU main ecosystems
• Threats
• Ecosystem Services / Impact
• Red list, LIFE-Nature restoration projects, ecological footprint
• Species, habitats & sites under HD & BD
• Agro-ecosystems / Grassland• Forest ecosystems• Marine / Coastal ecosystems• Freshwater ecosystems (lakes &
rivers) / Wetland• Heath & scrub
• Climate change• Invasive species• Fragmentation / Land use changes• Pollution• Overexploitation (agri, forest, fish…)
• Examples from TEEB, LIFE-Nature, Baltic sea…)
Themes Indicators (SEBI…)
17
Baseline Deliverables
• Executive summary – the what & why• Scoreboard – summary of facts & figures• Facts & figures
– Species and genetic resources– Ecosystems/Habitats
• Ecosystem services• Pressures (HIPOC)
Available for the Greenweek 1st June
18
II BISE Biodiversity Information System Europe
• Single Gateway to information on biodiversity in EU
• Dissemination of information via the WWW => BISE web page (1st phase)
• Sharing of information and knowledge with stakeholders (e.g. Member States) supported by the EC/CHM partnership network and using the Web technology => CHM technological platform
Launch at the Greenweek on 1st June

19
BISE
Direct links to:• Biodiversity policy framework, instruments• Biodiversity assessments with quality ensured
factual information• Biodiversity data (Biodiversity Data Centre)• Biodiversity knowledge and research results• Countries via EC Clearinghouse Mechanism• Focus on EU
20
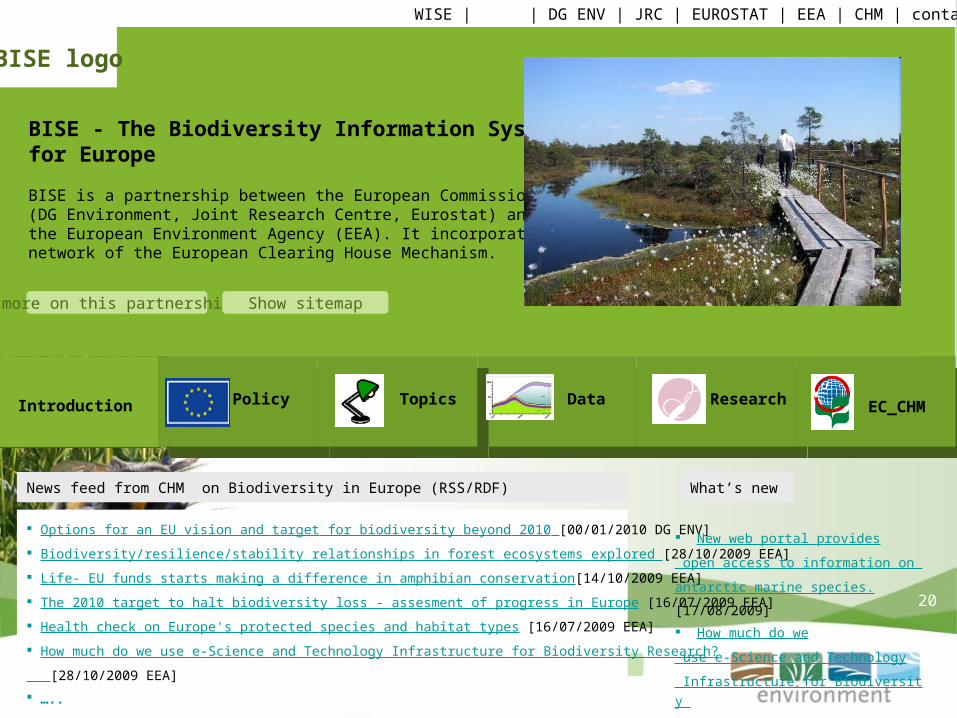
BISE - The Biodiversity Information Systemfor Europe
BISE is a partnership between the European Commission (DG Environment, Joint Research Centre, Eurostat) andthe European Environment Agency (EEA). It incorporates the network of the European Clearing House Mechanism.
Options for an EU vision and target for biodiversity beyond 2010 [00/01/2010 DG ENV]
Biodiversity/resilience/stability relationships in forest ecosystems explored [28/10/2009 EEA]
Life- EU funds starts making a difference in amphibian conservation[14/10/2009 EEA]
The 2010 target to halt biodiversity loss - assesment of progress in Europe [16/07/2009 EEA]
Health check on Europe's protected species and habitat types [16/07/2009 EEA]
How much do we use e-Science and Technology Infrastructure for Biodiversity Research?
[28/10/2009 EEA]
…..
News feed from CHM on Biodiversity in Europe (RSS/RDF) What’s new
New web portal provides open access
to information on antarctic marine species.
[17/08/2009]
How much do we use e-Science and
Technology Infrastructure for Biodiversity
Research?
[27/06/2009]
home WISE | | DG ENV | JRC | EUROSTAT | EEA | CHM | contact us | site map | search
BISE logo
more on this partnership Show sitemap
EC_CHMResearchTopics DataPolicyIntroduction

21
BISE -> Topics -> SEBI indicators
SEBI2010 – Streamlining European 2010 Biodiversity indicators - is a pan-European initiative launched in 2005. Its aim is to develop a European set of biodiversity indicators to assess and inform about progress towards the European 2010 targets and beyond.The EU was as the originator of the process and the results are used regularly. ……..
SEBI2010 – Streamlining European 2010 Biodiversity indicators more on SEBI 2010 indicators from the DG Env web page access to EEAs publications on indicators show the indicators
Example: The topics area of BISE with information on SEBI indicators
22
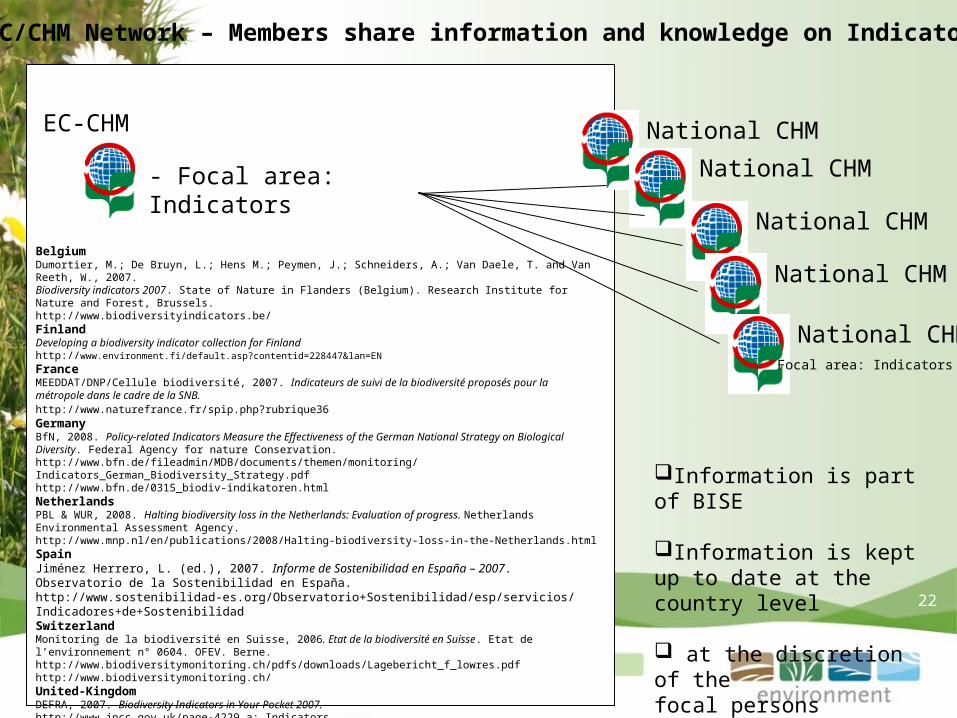
- Focal area: Indicators
EC-CHM National CHM
BelgiumDumortier, M.; De Bruyn, L.; Hens M.; Peymen, J.; Schneiders, A.; Van Daele, T. and Van Reeth, W., 2007. Biodiversity indicators 2007. State of Nature in Flanders (Belgium). Research Institute for Nature and Forest, Brussels.http://www.biodiversityindicators.be/FinlandDeveloping a biodiversity indicator collection for Finlandhttp://www.environment.fi/default.asp?contentid=228447&lan=EN FranceMEEDDAT/DNP/Cellule biodiversité, 2007. Indicateurs de suivi de la biodiversité proposés pour la métropole dans le cadre de la SNB.http://www.naturefrance.fr/spip.php?rubrique36 GermanyBfN, 2008. Policy-related Indicators Measure the Effectiveness of the German National Strategy on Biological Diversity. Federal Agency for nature Conservation.http://www.bfn.de/fileadmin/MDB/documents/themen/monitoring/Indicators_German_Biodiversity_Strategy.pdfhttp://www.bfn.de/0315_biodiv-indikatoren.htmlNetherlands PBL & WUR, 2008. Halting biodiversity loss in the Netherlands: Evaluation of progress. Netherlands Environmental Assessment Agency.http://www.mnp.nl/en/publications/2008/Halting-biodiversity-loss-in-the-Netherlands.htmlSpainJiménez Herrero, L. (ed.), 2007. Informe de Sostenibilidad en España – 2007. Observatorio de la Sostenibilidad en España.http://www.sostenibilidad-es.org/Observatorio+Sostenibilidad/esp/servicios/Indicadores+de+Sostenibilidad SwitzerlandMonitoring de la biodiversité en Suisse, 2006. Etat de la biodiversité en Suisse. Etat de l’environnement n° 0604. OFEV. Berne.http://www.biodiversitymonitoring.ch/pdfs/downloads/Lagebericht_f_lowres.pdfhttp://www.biodiversitymonitoring.ch/United-KingdomDEFRA, 2007. Biodiversity Indicators in Your Pocket 2007.http://www.jncc.gov.uk/page-4229 a: Indicators
National CHM
National CHM
National CHM
National CHMFocal area: Indicators
EC/CHM Network – Members share information and knowledge on Indicators
Information is part of BISE
Information is kept up to date at the country level
at the discretion of thefocal persons

23
III Ecosystem Services Map
Provisioning services• Crop production for food, fibre and fuel• Timber production• Fresh water provision
Regulating services• Air quality regulation• Climate regulation (carbon storage and sequestration)• Water quantity and quality regulation
Cultural services • Recreation
Available at the end of 2010
24
Objectives
Mapping the provision of ecosystem services at continental scale
• Estimate where and which and how much services are supplied by European landscapes
• Quantify the changes in service provision over time
• Relate the service provision to land use change
• Couple the biophysical service provision to the LEAC framework for monetary valuation
25
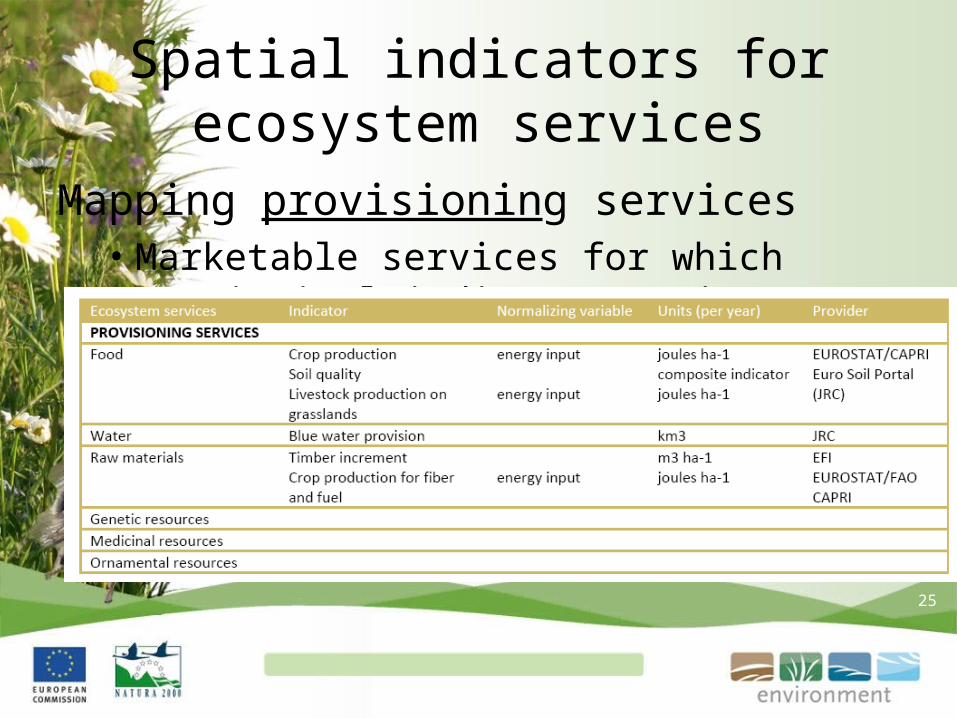
Spatial indicators for ecosystem services
Mapping provisioning services• Marketable services for which statistical
indicators exist
26
n
i
n
i
F1
i
1
iii ha/E*ha * y3
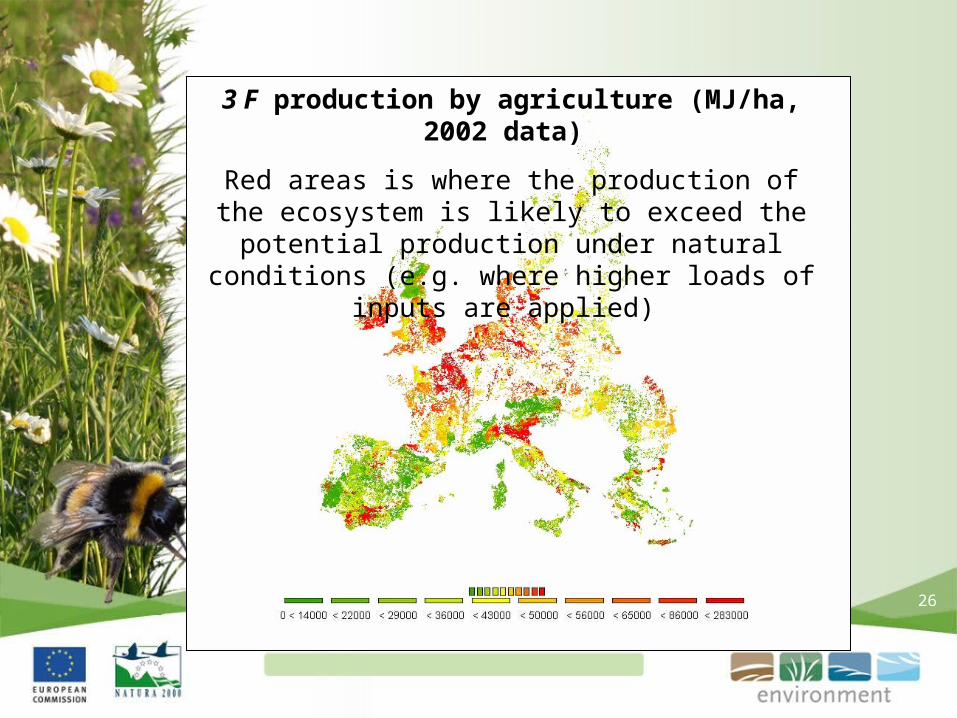
3 F production by agriculture (MJ/ha, 2002 data)
Red areas is where the production of the ecosystem is likely to exceed the potential production under natural conditions (e.g.
where higher loads of inputs are applied)
27
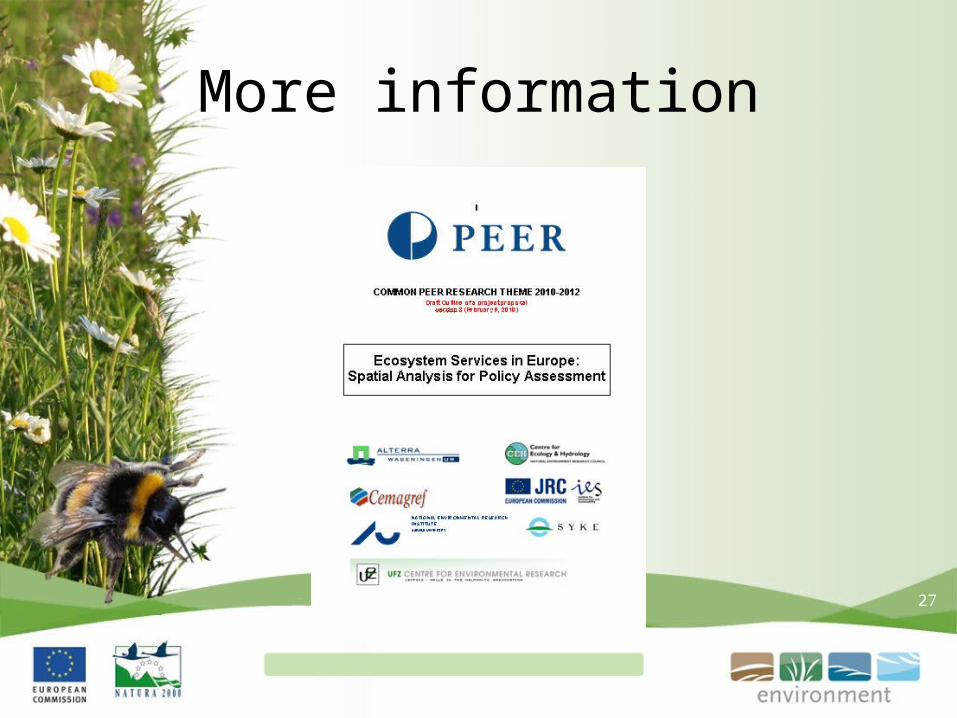
More information
28
THANK YOU
For more information go to:
http://ec.europa.eu/environment/nature