trav h is ays i s w e l l t r a v l d c a h a y s l l c a ... · v i s h a y s t r a v i s c a l d...
TRANSCRIPT
98
PLUM CREEK
"
"
"
"
"
"
"
"
"
"
"
"
"
"
"
"
"
"
"
"
"
"
"
"
!.
!.
#*#*
#*
#*
#* #*
#*
#*
#*
#*
#*
#*
"
"
"
1810
§̈¦35
£¤1831810
¬«21
¬«142
£¤183
PlumCreek
BrushyCreek
Elm
Creek
Dry
Creek
1810A
T ow n Branch
Clear ForkPlum
CreekW Fork PlumCreek
20
20
86
§̈¦10
TRAVISHAYS
TRAVISCALDWELL
HAYS
CALDWELL
Lockhart
Kyle
Luling
12640
12647
20509
17406
20488
20500
12556
12558
20491
PLUM CREEK
±0 2.5 5
MilesSAN
MARCOSRIVER
#
LEGEND
!. USGS Stream Gage
#* GBRA Sampling Station
"TCEQ Discharge/Domestic WW Permit
" Land Application Permit
Watershed Boundary
County Boundary
Major River/Stream
Stream

99
PLUM CREEK
Vegetation Cover: Evergreen Forest 1.21%, Deciduous Forest 11.64%, Shrubland 34.12%; Grassland 12.10%; Woody Wetlands: 3.07% Cultivated Crops 7.20% ; Pasture Hay 20.92%Land Uses: urban, suburban sprawl, light industry, and recreational.Development: Low Intensity 0.59% ; Medium Intensity 0.36%; High Intensity 0.09%; Open Space 6.52%Water Body Uses: aquatic life, contract recreation, general use, fish consumption, and agriculture and ranching.Soils: Dark, waxy soil to sandy loam, limestone to black waxy chocolate and grey loam Permitted Wastewater Treatment Facilities: Domestic 12, Land Application 2, Industrial 2
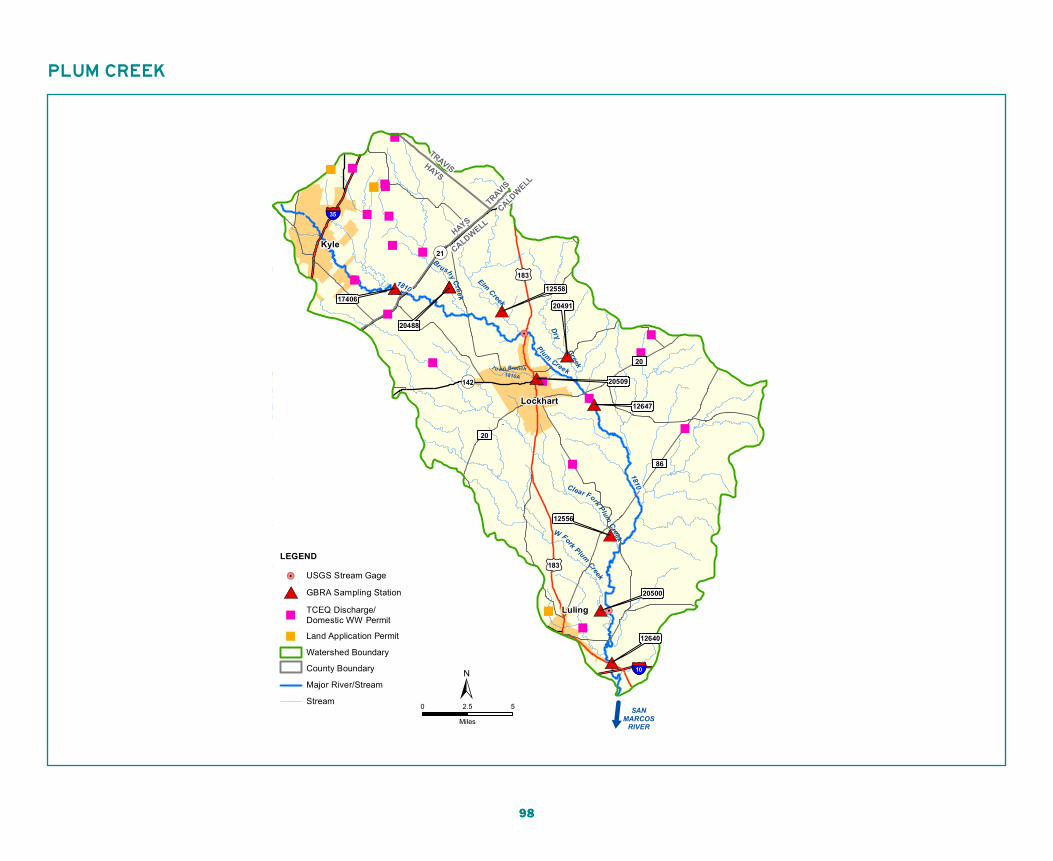
Plum Creek is a historically intermittent creek with contributing flows from several springs along its length. The creek become perennial as the surrounding communities of Buda, Kyle, Lockhart and Luling have developed in the watershed. These four cities contribute the bulk of the base flow to the stream by discharging wastewater effluent from five major discharges along its length. The Plum Creek Segment 1810 was listed on the Texas 303(d) list of impaired water bodies, as required by Clean Water Act Sections 303(d) and 305(b) in 2004. The middle and upper end of the water body from below Lockhart at CR 202 to
the upper end of the segment were found to be impaired for contact recreation with an E. coli geometric mean of 183 MPN/100 mL. The stream was also noted to have concerns for Nitrate+Nitrite Nitrogen at this time because over 25% of all measurements exceed the screening criteria of 1.95 mg/L. In 2006, the Texas State Soil and Water Conservation Board (TSSWCB), GBRA and Texas AgriLife Extension began working with local stakeholders to develop a Watershed Protection Plan (WPP) for the Plum Creek waterhshed. The TSSWCB also funded additional water quality monitoring in the watershed to facilitate
the development of the WPP by filling data gaps to supplement the existing CRP monitoring program. This plan was designed to address the known water quality impairments and concerns in the watershed. The WPP became the first plan in the state of Texas to be accepted by the EPA as meeting all guidance requirements and implementation of the plan began in 2008. In addition to identifying the sources of bacteria and nutrient loading in the watershed, the plan also identified a number of implementation activities that could be voluntarily undertaken by stakeholders in order to reduce targeted bacteria and
nutrient loading. These activities include feral hog removal, addressing leaking septic tanks, nutrient management training, pet waste management, and storm system conveyance assessments. In 2010, the TCEQ moved the watershed from assessment category 5a, which would require a regulatory TMDL to address the impairments in the watershed to category 4b, which would allow for the WPP to attempt to address the impairment with best management practices that are expected to result in attainment of the water quality
Segment 1810 represents the 52 mile long Plum Creek tributary of the San Marcos River. Plum Creek has a large 389 square mile drainage area that encompasses the cities of Buda, Kyle, Uhland, Lockhart and Luling. This watershed has been historically dominated by agricultural land use, but is rapidly urbanizing as the population of the area increases. The headwaters of Plum Creek are fed by natural springs from the Leona aquifer, with additional contributing springs arising throughout the watershed. The stream is largely wastewater dominant, as it receives the treated effluent discharge of twelve permitted wastewater treatment facilities.
Plum CreekDrainage Area: 389 square milesLength: 52 milesTributaries: Bunton Branch, Porter Creek, Andrew’s Branch, Richmond Branch, Cowpen Creek, Brushy Creek, Elm Creek, Dry Creek, Town Creek (1810A), Clear Fork, West Fork, Aquifer: Edwards Balcones Fault Zone, Leona Aquifer, Carrizo-Wilcox AquiferRiver Segments: 1810, 1810ACities and Communities: Buda, Kyle, Uhland, Lockhart, LulingCounties: Hays, CaldwellEcoRegion: Edwards Plateau, Texas Blackland Prairie, Post Oak SavannahClimate: Average annual rainfall 34.43 inches, Average annual temperature 70.64°F
CONTINUED ON PAGE 100
100
PLUM CREEK
standard. Following the acceptance of the plan the TSSWCB has funded several additional monitoring projects that have been used to quantitatively track the effectiveness of water quality restoration implementation activities over time. In the latest 2014 Texas Integrated Report of Surface Water Quality the geometric mean for E. coli in all three assessment units of the watershed has increased since the initial listing in 2004. Total Phosphorus and dissolved oxygen have also been added to nitrate nitrogen as ongoing concerns in the watershed. The TSSWCB funded a nitrate isotope study, in which the GBRA and USGS conducted monitoring of the surface water, shallow groundwater and springs from the
contributing Leona aquifer in order to determine the sources of nitrate nitrogen in the watershed. The results of this study showed that the majority of nitrate nitrogen in this watershed came from a wastewater source during normal and low flows, but during high flows additional contributions occurred from a mixture of nitrogen fertilizers and septic waste. This study eliminated past supposition that nitrate could be entering the watershed from atmospheric deposition or naturally occurring nitrate deposits. The TSSWCB also funded a bacterial source tracking study conducted by the GBRA and the Texas A&M Soil and Microbiology Laboratory (TAMU SAML). The results of this study showed that the majority
of bacteria samples collected during the twelve month long study came from wildlife sources and less than 10% of the bacteria came from a source that could be identified as human. The TCEQ has divided the creek into three assessment units that represent the upper, middle and lower portions of the watershed. Each section of the watershed was examined for water quality trends over time.
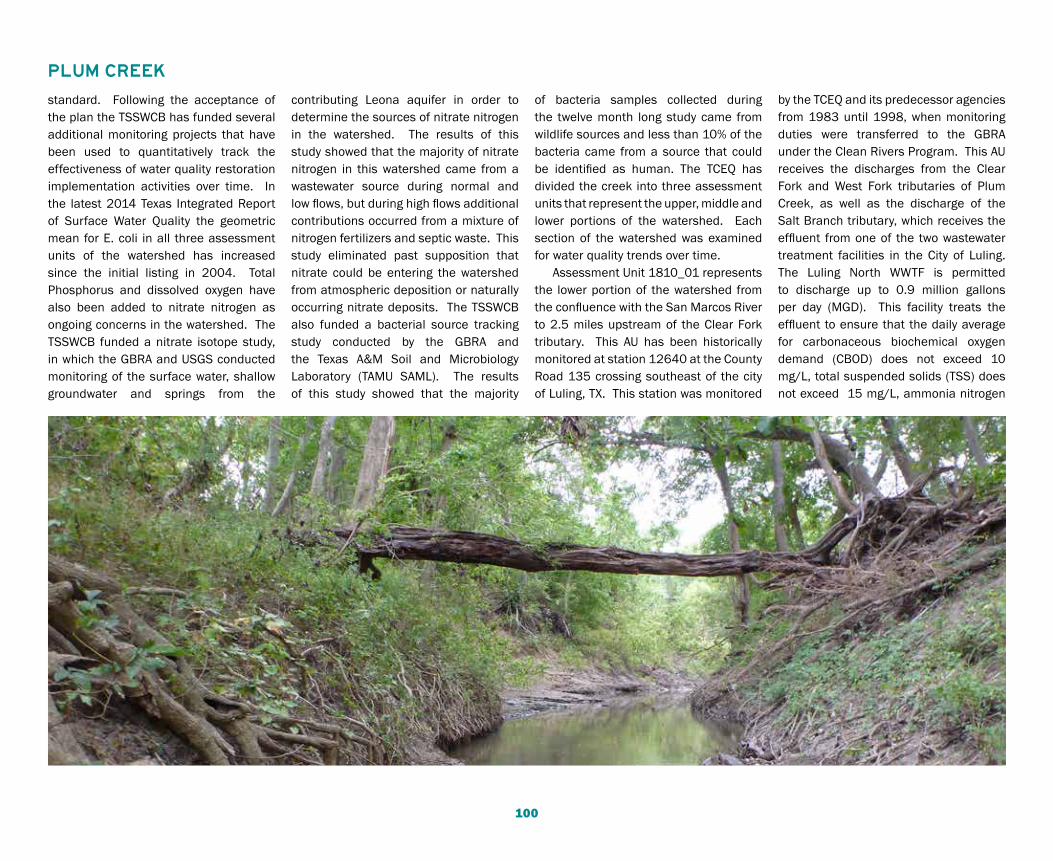
Assessment Unit 1810_01 represents the lower portion of the watershed from the confluence with the San Marcos River to 2.5 miles upstream of the Clear Fork tributary. This AU has been historically monitored at station 12640 at the County Road 135 crossing southeast of the city of Luling, TX. This station was monitored
by the TCEQ and its predecessor agencies from 1983 until 1998, when monitoring duties were transferred to the GBRA under the Clean Rivers Program. This AU receives the discharges from the Clear Fork and West Fork tributaries of Plum Creek, as well as the discharge of the Salt Branch tributary, which receives the effluent from one of the two wastewater treatment facilities in the City of Luling. The Luling North WWTF is permitted to discharge up to 0.9 million gallons per day (MGD). This facility treats the effluent to ensure that the daily average for carbonaceous biochemical oxygen demand (CBOD) does not exceed 10 mg/L, total suspended solids (TSS) does not exceed 15 mg/L, ammonia nitrogen

101
PLUM CREEK
does not exceed 3 mg/L and E. coli does not exceed 126 MPN/100 mL. Recently, several large wastewater permits to serve subdivisions near the City of Uhland have been issued to the Walton Group. These WWTFs are permitted to discharge into the Clear Fork tributary of this AU, but to date no construction has begun on these projects. In the most recent 2014 Texas Integrated Report of Surface Water Quality this AU had an assessed geometric mean of E. coli concentrations of 156.78 MPN/100 mL. This AU also had assessed concerns for dissolved oxygen grab and 24 hour average concentrations, below the screening criteria of 5.0 mg/L. The 2014 report also identified nutrient concerns for nitrate nitrogen and total phosphorus above the respective screening criteria of 1.95 mg/L and 0.69 mg/L. The assessed average of total phosphorus was 1.17 mg/L and the assessed average for nitrate nitrogen was 3.75 mg/L. The GBRA analyzed the most recent data from this AU and discovered several notable trends. The dissolved oxygen concentrations at this station are significantly decreasing over time, and this parameter correlates directly with stream flow (Figures 1 & 2). Total phosphorus concentration are also significantly increasing over time, and this parameter has an inverse relationship with stream flow (Figures 3 & 4).
Assessment Unit 1810_02 encompasses the middle portion of the watershed from 2.5 miles upstream of the Clear Fork tributary to 0.5 miles upstream of state highway 21. Historically, this AU
has been monitored at station 12647 at the County Road 202 crossing southeast of the city of Lockhart. This station was monitored by the TCEQ from 1981 and its predecessor agencies until 2005, when monitoring duties were transferred to the GBRA under the Clean Rivers Program. This AU receives the discharges from the Brushy Creek, Elm Creek, Dry Creek and Town Creek (1810A) tributaries. This AU also receives the discharges from both wastewater treatment facilities in the City of Lockhart, as well as permitted treatment plants for the Shadow Creek and Sunfield neighborhoods. The Lockhart #2 FM20 WWTF is permitted to discharge up to 1.5 million gallons per day (MGD). The Lockhart #1 Larremore WWTF is permitted to discharge up to 1.1 million gallons per day (MGD). Both facilities treat the effluent to ensure that the daily average for carbonaceous biochemical oxygen demand (CBOD) does not exceed 10 mg/L, total suspended solids (TSS) does not exceed 15 mg/L, ammonia nitrogen does not exceed 3 mg/L and E. coli does not exceed 126 MPN/100 mL. The 2014 Texas Integrated Report of Surface Water Quality reported that this AU had an assessed geometric mean of E. coli concentrations of 200.13 MPN/100 mL. This AU also assessed nutrient concentrations for nitrate nitrogen of 7.69 mg/L and total phosphorus of 1.52 mg/L, which were above the respective screening criteria of 1.95 mg/L and 0.69 mg/L. The 2014 report also identified a concern for impaired biological habitat because the average index of biological
integrity (IBI) for 5 screening events at this station was 24.40, which fell below the 29.00 IBI score needed to meet a high aquatic life use. Several of these screening events occurred during drought conditions and a full aquatic life monitoring event during normal stream flow conditions may be warranted in order to confirm this concern. The unclassified Town Creek (1810A) tributary to Plum Creek was also assessed in the 2014 report and the TCEQ identified concerns for the geometric mean of E. coli bacteria and average concentration of nitrate nitrogen and dissolved oxygen grabs over the 6 data points analyzed. GBRA reviewed all of the data available at station 20509 in Lockhart City Park through December of 2016. The GBRA found that the assessed concerns were justified for E. coli and nitrate nitrogen with a calculated geometric mean of E. coli of 273 MPN/100 mL, and an average nitrate nitrogen concentration of 10.0 mg/L over the 26 data points examined. This creek is heavily influenced by spring flows from the Leona aquifer, which has historically high nitrate nitrogen concentrations and the E. coli concentrations in this segment are most likely due to wildlife influences in this park setting. An aquatic life monitoring (ALM) event was performed at this station in 2017 to determine whether the dissolved oxygen concern was impacting the life in this stream. During the first day of the ALM, a trail of horses traveled through the middle of the stream bed, which visibly disturbed the substrate and fish nesting areas. This
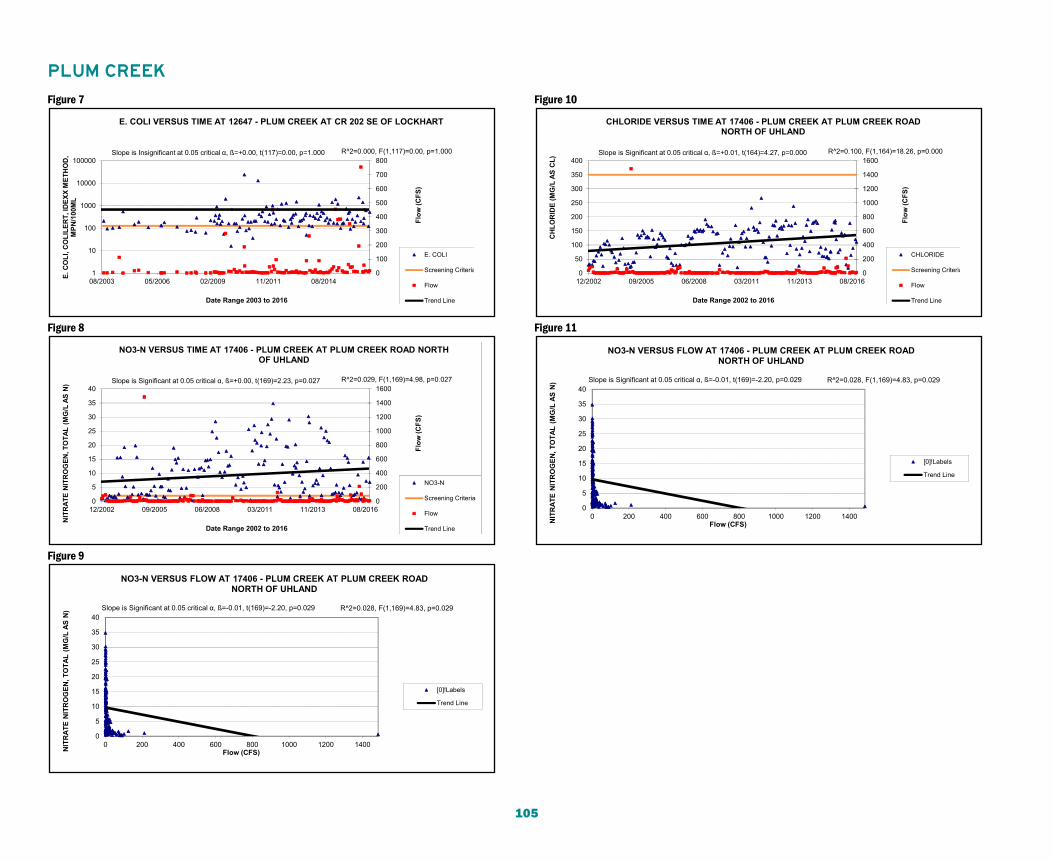
disturbance may have contributed to the intermediate fish and macroinvertebrate community scores observed on that day, but a successive monitoring event two months later confirmed that the fish community had recovered to high levels and the macroinvertebrate community were exceptional. The GBRA also identified several water quality trends in AU 1810_02. The nitrate nitrogen concentrations in this AU are significantly decreasing over time and are also inversely correlated with stream flow (Figures 5 & 6). This trend indicates that nitrate levels are diluted in the water column as flows increase following several years of drought conditions in the watershed. The E. coli concentrations for which there is an impairment in this AU, are not significantly changing over time (Figure 7).
Assessment Unit 1810_03 encompasses the middle portion of the watershed from 0.5 miles upstream of of State Highway 21 to the upper end of the segment above FM 150 in the City of Kyle. This AU has been monitored at station 17406 on Plum Creek Road upstream of the city of Uhland by the GBRA under the Clean Rivers Program. This AU receives the discharge from the Porter Creek tributary, which receives the wastewater discharge from the city of Buda. This AU also receives the effluent discharge from the city of Kyle. The Buda WWTF is permitted to discharge up to 1.5 million gallons per day (MGD). The Kyle WWTF is
CONTINUED ON PAGE 102

102
PLUM CREEK
permitted to discharge up to 4.5 million gallons per day (MGD). The Buda WWTF treats the effluent to ensure that the daily average for carbonaceous biochemical oxygen demand (CBOD) does not exceed 5 mg/L, total suspended solids (TSS) does not exceed 12 mg/L, ammonia nitrogen does not exceed 2 mg/L and total phosphorus does not exceed 0.8 mg/L, and E. coli does not exceed 126 MPN/100 mL. The Kyle WWTF treats the effluent to ensure that the daily average for carbonaceous biochemical oxygen demand (CBOD) does not exceed 10 mg/L, total suspended solids (TSS) does not exceed 15 mg/L, ammonia nitrogen
does not exceed 3 mg/L, and E. coli does not exceed 126 MPN/100 mL. The 2014 Integrated Report identified impairment for E. coli bacteria in this segment, as well as screening concerns for nitrate nitrogen and total phosphorus. The position of this AU upstream of the majority of the spring influences in the watershed cause it to experience a greater influence from wastewater effluent than the downstream AUS. The assessed E.coli bacteria geometric mean concentration of 306.54 MPN/100 mL, average nitrate nitrogen concentration of 14.17 mg/L and average total phosphorus concentration of 2.83 mg/L are also greater than in
any of the downstream AUS. The nutrient loading in this AU is most likely directly linked to the effects of wastewater effluent according to the nitrate nitrogen isotope study performed by the GBRA and USGS. The E. coli loading does not appear to be from human sources according to the bacterial source tracking study performed by the GBRA and TAMU SAML, but the rapid urbanization of this AU be contributing to additional use of the riparian corridors along the stream segment by contributing native wildlife. The wildlife are potentially being crowded closer to the stream in order to avoid human contact in the more urbanized
portions of the watershed. Several water quality trends were identified by the GBRA in this AU. The nitrate nitrogen concentrations are significantly increasing and this parameter is inversely correlated with stream flow (Figures 8 & 9). The chloride concentrations were also significantly increasing over time and inversely correlated with stream flow (Figures 10 & 11). The nutrient and salt concentrations will likely continue to increase as additional wastewater is discharged into this portion of the creek from an expanding population.
Table 1 Station 12640 – Plum Creek at CR 135 12/2002 - 11/2016
AU 1810_01 General Use Parameter Mean Maximum Minimum # of
Measurements Screening Criteria
Temperature (°C) 20.1 29.3 6.2 181 32.2 pH 7.8 8.3 7.0 180 6.5 – 9.0
Chloride (mg/L) 152 444 9.4 161 350.00 Sulfate (mg/L) 77 163 14.9 163 150.00
Total Dissolved Solids (mg/L)
731 1729 155 180 1120.00
NH3-N (mg/L) 0.15 0.66 <0.02 132 0.33 Total Phosphorus (mg/L) 0.60 2.69 <0.05 176 0.69
Chlorophyll-a (µg/L) 2.5 19.2 <1.0 161 14.1 Nitrate Nitrogen (mg/L) 1.83 7.96 <0.05 174 1.95
TKN (mg/L) 0.85 1.92 0.42 87 N/A AU 1810_01 Recreational Use
E. coli (MPN/100 mL) 198 Geomean 13,000 9 173 126 Geomean AU 1810_01 Aquatic Life Use
Dissolved Oxygen (mg/L) 7.4 14.6 3.4 180 ≥3.0 Minimum & ≥5.0 Average
Table 2 Station 12647 – Plum Creek at CR 202 12/2002 - 11/2016
AU 1810_02 General Use Parameter Mean Maximum Minimum # of
Measurements Screening Criteria
Temperature (°C) 21.0 28.8 8.1 135 32.2 pH 7.9 8.5 7.4 135 6.5 – 9.0
Chloride (mg/L) 86 139 5.0 116 350.00 Sulfate (mg/L) 76 319 5.0 116 150.00
Total Dissolved Solids (mg/L)
556 741 145 134 1120.00
NH3-N (mg/L) 0.17 1.43 <0.05 116 0.33 Total Phosphorus (mg/L) 1.03 2.69 0.14 133 0.69
Chlorophyll-a (µg/L) 3.2 15.5 <1.0 108 14.1 Nitrate Nitrogen (mg/L) 5.99 51.6 0.32 129 1.95
TKN (mg/L) 0.77 2.69 <0.2 106 N/A AU 1810_02 Recreational Use
E. coli (MPN/100 mL) 264 Geomean >24,000 16 119 126 Geomean AU 1810_02 Aquatic Life Use
Dissolved Oxygen (mg/L) 8.2 13.6 3.9 135 ≥3.0 Minimum & ≥5.0 Average

103
PLUM CREEK
Table 3
Table 3 Station 17406 – Plum Creek at Plum Creek Road 02/2003 - 10/2016
AU 1804_03 General Use Parameter Mean Maximum Minimum # of
Measurements Screening Criteria
Temperature (°C) 20.2 28.4 6.03 181 32.20 pH 7.8 8.7 7.0 181 6.5 – 9.0
Chloride (mg/L) 108 267 16.3 166 350.00 Sulfate (mg/L) 92 173 36.0 166 150.00
Total Dissolved Solids (mg/L)
640 1040 214 181 1120.00
NH3-N (mg/L) 0.74 15.5 <0.02 131 0.33 Total Phosphorus (mg/L) 1.90 5.26 <0.04 177 0.69
Chlorophyll-a (µg/L) 2.64 11.6 <1.0 162 14.1 Nitrate Nitrogen (mg/L) 9.41 34.8 0.22 171 1.95
TKN (mg/L) 1.07 8.13 <0.2 89 N/A AU 1810_03 Recreational Use
E. coli (MPN/100 mL) 348 Geomean 17,000 36 171 126 Geomean AU 1810_03 Aquatic Life Use
Dissolved Oxygen (mg/L) 7.6 14.1 2.2 181 ≥3.0 Minimum & ≥5.0 Average
Table 4 Station 20509 – Town Branch at Lockhart City Park 03/2008 - 10/2016
AU 1810A_01 General Use Parameter Mean Maximum Minimum # of
Measurements Screening Criteria
Temperature (°C) 21.5 26.6 11.2 26 32.20 pH 7.9 8.1 7.3 26 6.5 – 9.0
Chloride (mg/L) 30.0 40.9 21.8 26 350.00 Sulfate (mg/L) 64.0 78.6 48.2 26 150.00
Total Dissolved Solids (mg/L)
509 582 366 26 1120.00
NH3-N (mg/L) 0.16 0.60 <0.10 26 0.33 Total Phosphorus (mg/L) <0.05 0.17 <0.02 26 0.69
Chlorophyll-a (µg/L) N/A N/A N/A N/A 14.1 Nitrate Nitrogen (mg/L) 10.0 15.2 3.07 26 1.95
TKN (mg/L) 0.26 0.48 <0.20 22 N/A AU 1804_05 Recreational Use
E. coli (MPN/100 mL) 273 Geomean
1400 59 26 126 Geomean
AU 1804_05 Aquatic Life Use Dissolved Oxygen (mg/L) 9.2 14.0 3.6 26 ≥3.0 Minimum & ≥5.0
Average

104
PLUM CREEK
Figure 1 Figure 4
Figure 2 Figure 5
Figure 3 Figure 6
0
200
400
600
800
1000
1200
1400
1600
0
2
4
6
8
10
12
14
16
12/2002 09/2005 06/2008 03/2011 11/2013 08/2016
Flow
(CFS
)
OXY
GEN
, DIS
SOLV
ED (M
G/L
)
Date Range 2002 to 2016
DISSOLVED OXYGEN VERSUS TIME AT 12640 - PLUM CREEK AT PLUM CREEK ROAD NORTH OF UHLAND
DISSOLVEDOXYGENScreening Criteria
Flow
Trend Line
R^2=0.026, F(1,178)=4.83, p=0.029Slope is Significant at 0.05 critical α, ß=-0.00, t(178)=-2.20, p=0.029
0
0.5
1
1.5
2
2.5
3
1 201 401 601 801 1001 1201
PHO
SPH
OR
US,
TO
TAL,
WET
MET
HO
D
(MG
/L A
S P)
Flow (CFS)
TOTAL PHOSPHORUS VERSUS FLOW AT 12640 - PLUM CREEK AT OLD WOODEN BRIDGE ON CALDWELL CR 135 SE OF LULING
[0]!Labels
Trend Line
Slope is Significant at 0.05 critical α, ß=-0.00, t(174)=-2.79, p=0.006 R^2=0.043, F(1,174)=7.77, p=0.006
0
2
4
6
8
10
12
14
16
1 201 401 601 801 1001 1201
OXY
GEN
, DIS
SOLV
ED (M
G/L
)
Flow (CFS)
DISSOLVED OXYGEN VERSUS FLOW AT 12640 - PLUM CREEK AT OLD WOODEN BRIDGE ON CALDWELL CR 135 SE OF LULING
[0]!Labels
Trend Line
Slope is Significant at 0.05 critical α, ß=+0.00, t(178)=2.18, p=0.031 R^2=0.026, F(1,178)=4.75, p=0.031
0
100
200
300
400
500
600
700
800
0
10
20
30
40
50
60
02/2003 11/2005 07/2008 04/2011 01/2014 10/2016
Flow
(CFS
)
NIT
RAT
E N
ITR
OG
EN, T
OTA
L (M
G/L
AS
N)
Date Range 2003 to 2016
NO3-N VERSUS TIME AT 12647 - PLUM CREEK AT CR 202 SE OF LOCKHART
NO3-N
Screening Criteria
Flow
Trend Line
R^2=0.043, F(1,127)=5.70, p=0.018Slope is Significant at 0.05 critical α, ß=-0.00, t(127)=-2.39, p=0.018
0
200
400
600
800
1000
1200
1400
1600
0
0.5
1
1.5
2
2.5
3
12/2002 09/2005 06/2008 03/2011 11/2013 08/2016
Flow
(CFS
)
PHO
SPH
OR
US,
TO
TAL,
WET
MET
HO
D (M
G/L
AS
P)
Date Range 2002 to 2016
TOTAL PHOSPHORUS VERSUS TIME AT 12640 - PLUM CREEK AT OLD WOODEN BRIDGE ON CALDWELL CR 135 SE OF LULING
TOTALPHOSPHORUSScreening Criteria
Flow
Trend Line
R^2=0.046, F(1,174)=8.40, p=0.004Slope is Significant at 0.05 critical α, ß=+0.00, t(174)=2.90, p=0.004
0
10
20
30
40
50
60
0 100 200 300 400 500 600 700NIT
RAT
E N
ITR
OG
EN, T
OTA
L (M
G/L
AS
N)
Flow (CFS)
NO3-N VERSUS FLOW AT 12647 - PLUM CREEK AT CR 202 SE OF LOCKHART
[0]!Labels
Trend Line
Slope is Significant at 0.05 critical α, ß=-0.02, t(121)=-3.86, p=0.000 R^2=0.110, F(1,121)=14.89, p=0.000
105
PLUM CREEK
Figure 7 Figure 10
Figure 8 Figure 11
Figure 9
0
100
200
300
400
500
600
700
800
1
10
100
1000
10000
100000
08/2003 05/2006 02/2009 11/2011 08/2014
Flow
(CFS
)
E. C
OLI
, CO
LILE
RT,
IDEX
X M
ETH
OD
, M
PN/1
00M
L
Date Range 2003 to 2016
E. COLI VERSUS TIME AT 12647 - PLUM CREEK AT CR 202 SE OF LOCKHART
E. COLI
Screening Criteria
Flow
Trend Line
R^2=0.000, F(1,117)=0.00, p=1.000Slope is Insignificant at 0.05 critical α, ß=+0.00, t(117)=0.00, p=1.000
0
200
400
600
800
1000
1200
1400
1600
0
50
100
150
200
250
300
350
400
12/2002 09/2005 06/2008 03/2011 11/2013 08/2016
Flow
(CFS
)
CH
LOR
IDE
(MG
/L A
S C
L)
Date Range 2002 to 2016
CHLORIDE VERSUS TIME AT 17406 - PLUM CREEK AT PLUM CREEK ROAD NORTH OF UHLAND
CHLORIDE
Screening Criteria
Flow
Trend Line
R^2=0.100, F(1,164)=18.26, p=0.000Slope is Significant at 0.05 critical α, ß=+0.01, t(164)=4.27, p=0.000
0
200
400
600
800
1000
1200
1400
1600
0
5
10
15
20
25
30
35
40
12/2002 09/2005 06/2008 03/2011 11/2013 08/2016
Flow
(CFS
)
NIT
RAT
E N
ITR
OG
EN, T
OTA
L (M
G/L
AS
N)
Date Range 2002 to 2016
NO3-N VERSUS TIME AT 17406 - PLUM CREEK AT PLUM CREEK ROAD NORTH OF UHLAND
NO3-N
Screening Criteria
Flow
Trend Line
R^2=0.029, F(1,169)=4.98, p=0.027Slope is Significant at 0.05 critical α, ß=+0.00, t(169)=2.23, p=0.027
0
5
10
15
20
25
30
35
40
0 200 400 600 800 1000 1200 1400NIT
RAT
E N
ITR
OG
EN, T
OTA
L (M
G/L
AS
N)
Flow (CFS)
NO3-N VERSUS FLOW AT 17406 - PLUM CREEK AT PLUM CREEK ROAD NORTH OF UHLAND
[0]!Labels
Trend Line
Slope is Significant at 0.05 critical α, ß=-0.01, t(169)=-2.20, p=0.029 R^2=0.028, F(1,169)=4.83, p=0.029