revista enercetica - capevlacbiblioteca.olade.org/opac-tmpl/documentos/hm000271.pdflos...
TRANSCRIPT
EL POíENCIAL DE LAS ENERGIAS NUEVAS Y ílENOVABL[S EN EL ABASTECIMIENTO ENERGETICO EN A~1Ef11CA LATl'IA olado 1 H POl (\ Tll<I Of NI W ANU HENEW1\llL. [NI flGY SOLHCES 1\ cAT N AMflilC1\ s L \fRGY SUPf'L '/ olado uso RACIONAL [JE ENERGIA EN LA INDUSTRIA TEXTIL "LA EXPERIENCIA DE COLOMBIA olado Ri\'lfiNAc J~f Cf l:lvEílGY IN TI' HXll ~s INDUSl'RV Tllt ~o. DMllli\N tXPE~l'\C[' olado MARCO LEGAL PARA LA EXPLOTACION U~JIFFCADA DE YACI· MIENTO$ PETílOLIFEROS t\ NIVEL NACIONAL E INTERNACIONAi. olado TH[ l [Gt.l •HA ·~1:WORK f0'1 'l';IT1/11·1o•v OF p [R;) [UM CLPOSlíS 111 1.1- NA l)',AL MW l\T(RNATIONl\I uvn s olado USO RACIONAL DE LA ¡ENERGIA EN LA PROOUCCIOl\I DE ELECTRICIDAD "LA EXPERll:NCIA DE EL SALVA· DOR"' olado ~M>C'<AL USl r» fNFPGY 1\ ELEC-Rlc.·v PRODUCTIW~ IH[ EXPER1[1\iC( OF "l :,,~LV1\(JOH olado LA BIOENERGIA EN EL BALANCE ENERG[TICO DE AMl:HICA LATINA olado RIO"NHCY 1\ TH[ 1 \1 R(;Y eAI ANCE OF l1\TI'~ f .. •.¡l[R C1\ olado RACIONALIZACION EN EL CONSU· MO DE ENERGIA EN LA REFINERIA DE ZINC 01: CAJAMAROUILLA olado R.U10:M1 IZ4 o~ or [NI HGY c:;NSlJMi'l l()N 'N M NERC i'FHI 'S CA,IA 'H,'1(:Ll ••. t.. ZINC Re.· NLRV
Organización Latinoamericana de Energía Latín Amerícan Energy Organization
Noviembre • Oic1embre183 lv · .1v~·, 10(; 1 J···.:e · n:-:P.r 1 ti.J
REVISTA :1i
ENERCETICA 6183
Organización Latinoamericana de Energía

93
El crecimiento desordenado de la demanda y la incapacidad de la empresa privada de pro- mover una oferta adecuada, fue motivo para que por decreto legislativo se creara en el año 1948 la Comisión Ejecutiva Hidroeléctrica del Río Lempo (CEL), como Ente Autónomo de Ser- vicio Público para resolver el problema, a ni- vel nacional, de abastecimiento de energía eléctrico, con fines de desarrollo económico y social.
El desarrollo tecnológico, como consecuencia de la segunda guerra mundial, se sintió en El Salvador, dando inicio a su desarrollo industrial, presionado además por el gran crecimiento poblacional y la estrechez territorial; esto pro- vocó que se presentaran demandas de ener- gía eléctrico que no podían ser satisfechas con los medios de generación de que se disponía en la década de los 40.
2.1 DESARROLLO INSTITUCIONAL
2. EL MERCADO DE LA ENERGIA ELECTRICA
ginalmente la energía eléctrica se obtenía de pe- queñas plantas que quemaban gasolina o diesel y con el incremento en la demanda se planteó la explotación a nivel comercial, para lo cual se constituyeron empresas privadas de servicio públi- co que ·instalaron pequeñas centrales hidráulicas y térmicas con capacidades gobernadas por una de- manda sin proyecciones.
Francisco E. Granadino INGENIERO ELECTRICISTA
DIRECTOR EJECUTIVO
El uso de la energía eléctrica se inició en El Salva- dor a principios del presente siglo y su primer uso uso fue relacionado al sector residencial, poste- riormente se ocupó en el área comercial y alum- brado público y finalmente se incorporó a mover las máquinas de las instalaciones industriales. Ori-
Muchas veces al hablar de energía se asocia el concepto con la energía eléctrica, la cual es en realidad el producto de la transformación de for- mas de energía primaria, por lo que se le califica como energía secundario y se utiliza como tal en el consumo humano.
La República de El Salvador, con una extensión territorial equivalente al 5% de Centroamérica y una población de aproximadamente el 25% de los habitantes de la región, ocupa en el área un lugar prominente como país productor de energía eléc- trica, poseyendo un parque de generación inte- grado con Centrales hidroeléctricas, térmicas con- vencionales y geotérmicas y un sistema de trans- misión formado por una red que ha garantizado gran confiabilidad a la oferta de energía eléctrico, componente importante en el desarrollo económi- co y social del país.
Centroamérica es un área con recursos energéticos naturales 1 imitados a unas pocas fuentes, como lo son en forma de energía primaria, los recursos ve- getales, hidráulicos, geotérmicos y los hidrocarbu- ros.
1. INTRODUCCION
USO RACIONAL DE ENERGIA EN LA PRODUCCION DE ELECTRICIDAD
''LA EXPERIENCIA DE EL SALVADOR"
Organización Latinoamericana de Energía

En el cuadro siguiente se muestra la evolución de la composición porcentual de la demanda .
Los requerimientos del consumo han sufrido cambios en su magnitud desde que la CEL ini- ció la generación de electricidad, sin embargo el sector industria! a ocupado siempre el pri- mer lugar en lo demanda de potencia y ener- gía siguiendo en su orden los sectores residen- cial, comercial y gubernamental.
2.3 COMPOSICION PORCENTUAL DE LA DEMANDA
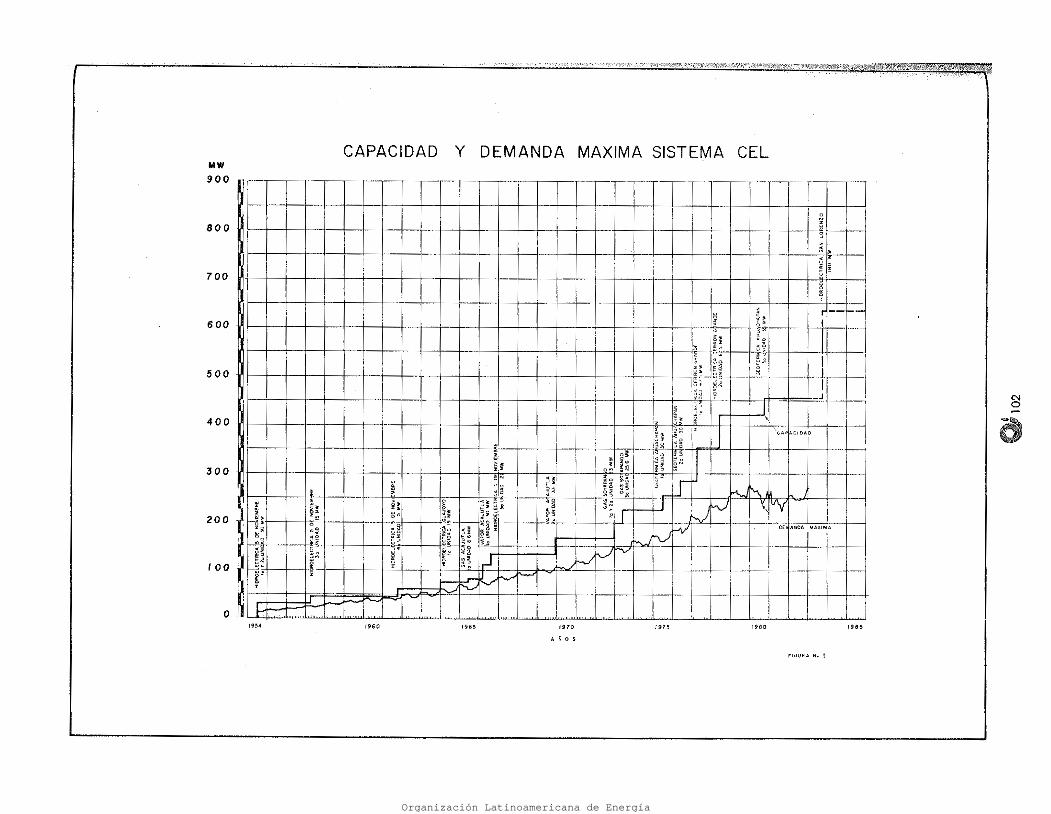
Al disponer de una oferta de suministro de energía eléctrica sin restricciones, la demanda creció rápidamente en· los primeros años lle- gando a establecerse un incremento histórico de la demanda de potencia y energía del or- . den de 10.5%, lo cual implico que ellas se du- plican coda 7 oños. Para determinar los pro- nósticos de la demanda se ha establecido que las pérdidas por transformación y distribución son del orden del 15 % de la generación neta. la demanda máxima del sistema se determina utilizando el pronóstico de generación neta anual y un factor de carga constante de 0.57. En la Figura 1 se indica los crecimientos de la demanda y la capacidad instalada a partir del año 1954. ·
Una aguda escasez eléctrica prevalecía en el país antes de que la CEL iniciara sus operacio- nes en junio de 1954. A mediados del siglo, la capacidad de potencia eléctrica instalada en El Salvador, era del orden de 33 MW de los cuales el 50% era suministrado por s~rvi~ cios públicos y el otro 50% provenía de 200 . pequeñas plantas privadas empleadas en acti- vidades industriales.
2. 2 EVOLUCION DE LA DEMANDA
Hacer uso racional de las fuentes internas y externas del financiamiento.
• 94
Hacer llegar a lo mayor cantidad de habi- tantes los beneficios de lo enerqio eléctrica.
Mantener un programa permanente de in- vestigación de fuentes no convencionales de energía.
Estudiar y promover medidos tendientes al uso racional de la energía por porte de los consumidores.
Aprovechar en forma racional los recursos naturales existentes en el país para generar energía eléctrica.
Proyector el crecimiento de la demanda por parte del consumidor y planificar la ex- pansión del sistema en forma de mantener una oferta de energía eléctrica anticipada a la demanda.
Dentro de los objetivos de la CEL como respon- sable del sector de energía eléctrica se traza- ron las siguientes políticas:
En el año de 1981, por decreto del Poder Eje- cutivo se modificó la Ley de la CEL para incor- porar dentro de sus objetivos "desarrollar, con- servar, administrar y utilizar los recursos ener- géticos y fuentes de energía de El Salvador".
A la fecha, la CEL dispone de un Sistema Hi- drotérmico de Generación, compuesto por mo- dernas plantas, cuya capacidad instalada de 455 MW, constituye una adecuada oferta poro el mercado eléctrico nacional. El sistema CEL suple el 98% de las demandas nacionales de potencia y energía.
Con la entrada en operación comercial, en ju- nio de 1954, de la primera unidad de 15 MW de la Central de 5 de noviembre, primer apro- vechamiento hidroeléctrico realizado por lo CEL, se inició en la República de El Salvador uno nueva época en que desaparecieron las restric- ciones para el uso de lo energía eléctrico.
Organización Latinoamericana de Energía

95
Centrales Térmica a Vapor 63 MW 1966 y 1969 Centrales Térmicas o Gas 65.2 1972/73
Dentro de lo planificación del equipamiento eléctrico, para atender lo creciente demanda del mercado, se incorporaron centrales conven- cionales de generación térmico para afirmar energía, debido a la irregular hidrología en la cuenca del Río Lempo, llegando o disponer de una ccpocidcd instalada de 128.2 MW, dis- tribuidos así:
3.2 TERMOLELECTRICIDAD
1,552 MW
Río Lempo Ríos de Flujo permanente lagos (Olomega, 11opongo Ríos de estación lluviosa
1,404 MW 60 45 43
El resumen del potencial disponible de ener- gía hidráulica para generar electricidad, se resume así:
la mayoría de los ríos salvadoreños son de pequeño caudal inferior a un metro cúbico por segundo durante la· estación lluviosa y permanecen sin caudal en la estación seca. Los ríos de flujo más grande, representan una fuente de aprovecha- miento hidráulico adicional al Río Lempo.
* Al enfrar en operación Zapotillo se cancela *' Al entrar en operación Son lorenzo el aprovechamiento del
Río, será de 30.5% en potencia y 43. 1 % en energía.
TOTAL ACTUAL AÑO Gwh/AÑO
. Guajoyo *15MW * 15 MW 1963 *54 Zapotillo 120 422 Paso del oso 40 152 Cerrón Grande 270 135 1977 515 5deNoviembre 202 82 1954 703 EITigre 540 718 San Lorenzo 180 ** 180 1983 722 Son Marcos 52 208
l,404MW 232MW 4,499
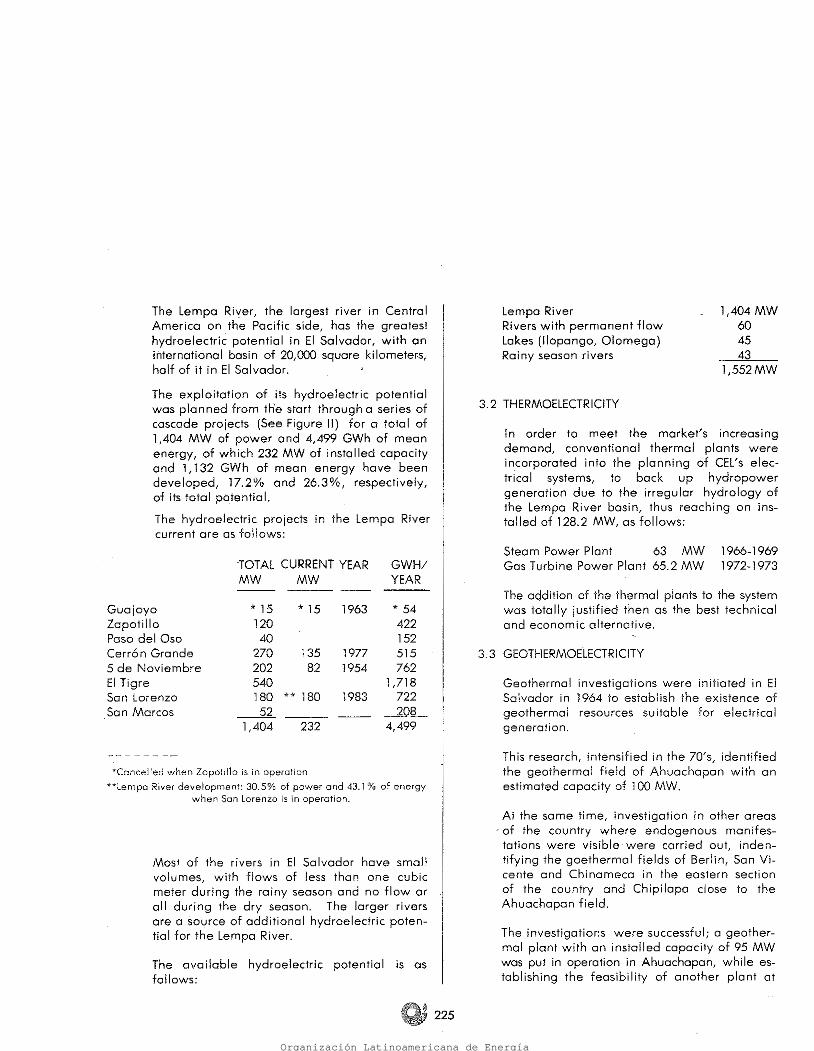
Los aprovechamientos hidroeléctricos del Río Lempo, de acuerdo o los estudios realizados, son los siguientes:
Desde los primeros estudios realizados se plan- teó su utilización planificando su explotación racional en una serie de siete aprovechamien- tos en cascada (Ver Figura 11), que permitirán disponer de 1,404 MW de potencia y 4,499 GWH de energía media, de lo cual se dispone actualmente de 232 MW de capacidad instala- do y l, 132 GWH de energía medía, que repre- sentan el 17.2% y el 26.3% respectivamente del potencial total.
El Río Lempo es el más caudaloso de lo Amé- rica Central en lo vertiente del Océano Pací- fico y es el mayor recurso hidráulico disponi- ble a nivel nocional. Su cuenca internacional es de aproximadamente 20,()(X} kilómetros cua- drados, de los cuales aproximadamente la mi- tad corresponde a territorio salvadoreño.
Desde que la CEL fue encargada de desarrollar, conservar y administrar los recursos capaces
· de generar electricidad en El .Salvador, su polí- tica fue orientado a lo explotación de los re- cursos naturales y es precisamente por esta ra- zón que el instituto eléctrico se denominó co- mo una Comisión Ejecutiva, para explotar el recurso hidráulico del Río Lempo generando electricidad en beneficio del país.
3. 1 HIDROELECTRICIDAD
3. PRODUCCION DE ELECTRICIDAD EN EL SALVADOR
1977 1981
-r, Industrial 45.5% 466.1 Gwh 38.9 % Residencial 26.6 383. l 31.9
·.·Comercial 13.5 165.0 13.8 Gubernamental 14.7 185.4 14.5
100.0 1, 199.6 100.0
Organización Latinoamericana de Energía

Tres son las formas de energía que participan en la implementación del sector industrial y ellas son: derivados de petróleo, residuos vegetales y elec- tricidad. De estos tres insumos el que tiene mayor participación es el petróleo con el 47% seguido del bagazo de coña con el 37.5% y finalmente la electricidad con el 15.5% .
El sector industrial es el preponderante en el con- sumo de energía eléctrico, habiendo participado hasta en un 47% de lo demanda total, sin embar- go a raíz de la crisis socio-económica actual su par- ticipación se ha restringido al orden de 39%.
4. CONSUMO DE ENERGIA EN LA INDUSTRIA
64.9% 15.0 20. l
100.0
412MW 95
128.2 635.2
1984 Hidroelectricidad Geotermoelectricidad Termoelectricidad
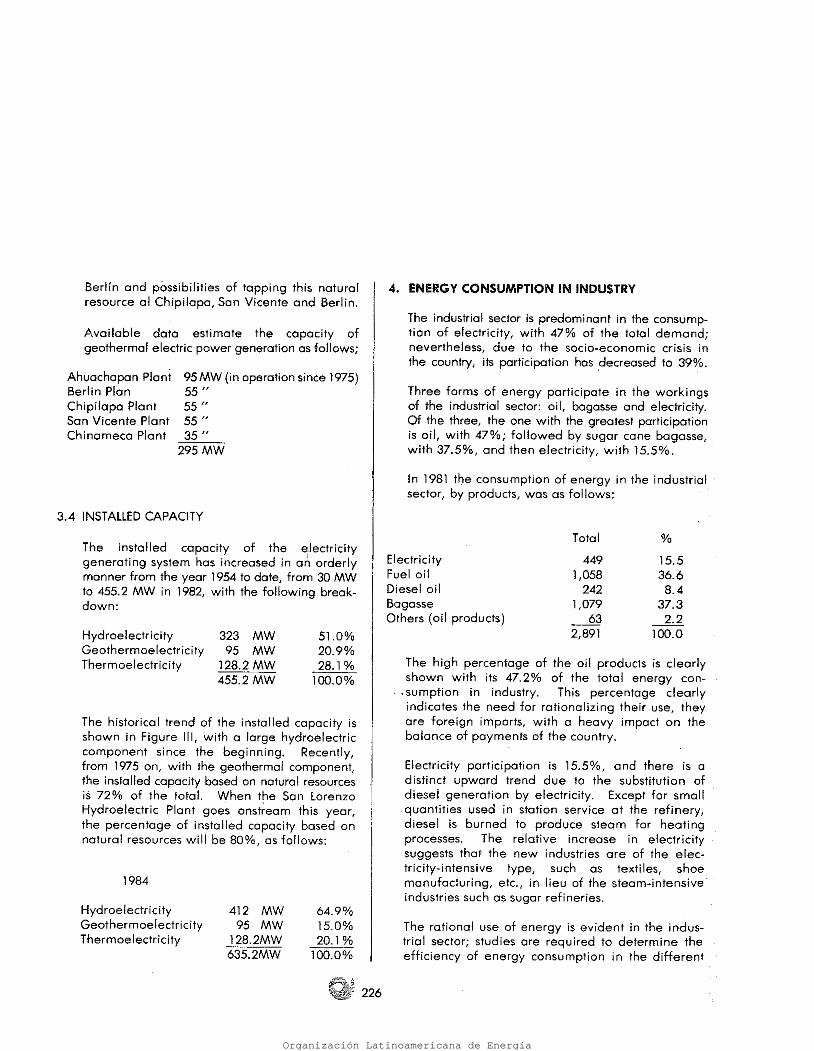
En la figura 111, se puede ver la evolución his- tórica de la capacidad instcloda, en la que se observa la gran participación de la hidroelectri- cidad y recientemente, a partir de 1975, el componente de capacidad geotérmica ha lle- vado al 72% la capacidad instalada de gene- ción de energía eléctrica con recursos natu- rales. Al entrar en operación la Central Hi- droeléctrica San Lorenzo, en el curso de! pre- te año, la composición de lo capacidad se mo- difica, alcanzando el 80% la capacidad insta- lada capaz de generar con recursos naturales.
51.0% 20.9 28.1
100.0%
323 MW 95
128.2 455.2
Hidroelectricidad Geotermoelectricidad Termoelectricidad
ción de energía eléctrica se ha incrementado en una forma planificada desde el año 1954 o la fecha, creciendo de 30 MW hasta 455.2 MW en el año 1982, con la siguiente composición actual:
• 96
la capacidad instalada del sistema de genera-
Central Ahuachapán95 MW(en operación desde 1975) Central Berlín · 55 Central Chipilapa 55 Central San Vicente 55 Central Chinameca 35
_2_9_5 ...,.M-W~
3.4 CAPACIDAD INSTALADA
los estudios realizados han permitido instalar y poner en operación una central con capaci- dad instalada de 95 MW en Ahuachapán, han establecido la factibilidad de otro central en Berlín y han señalado la posibilidad de explo- tar en Chipilapo, San Vicente y Berlín otros campos geotérmicos.
Con los datos que actualmente se dispone, se ha estimado la posibilidad de generar energía eléctrico con los recursos geotérmicos así:
Paralelamente se realizaron investigaciones en otros áreas del país en las que se manifies- ta la presencia de la energía endógena, ha- biendo determinado la existencia de los cam- pos geotérmicos de Berlín, San Vicente y Chi- nameco en el Oriente del país y Chipilopa en
las proximidades de Ahuachapán.
En la búsqueda que fue intensificada en la década de los 70, se logró identificar el cam- po geotérmico de Ahuachapán como capaz de producir TOO MW de potencia eléctrica.
Desde el año 1954 se iniciaron en la República de El Salvador investigaciones para estable- cer lo existencia de recursos geotérmicos capa- ces de general electricidad.
3.3 GEOTERMOElECTRICIDAD
la incorporación de los unidades térmicos al sistema fue totalmente justificado en su opor- tunidad con la mejor opción técnica y econó- mico.
Organización Latinoamericana de Energía

97
Para el año 1982 la situación del consumo de energía en El Salvador se presentó así:
De los balances energéticos históricos se llegó a establecer que el sector energético ha teni- do un comportamiento de crecimiento bastan- te uniforme en el período 1970 - 1978, con una tosa aproximada del 5%, observándose una marcada declinación en el período 73-74 y 78-79; ·el primero debido al planteamiento de la crisis energética y el segundo debido a la situación socio-política que vive el país.
5. 1 SITUACION DE LA DEMANDA
Es necesario en todo caso conocer el comporta- miento histórico del sector energético, para de allí derivar un diagnóstico y posteriormente plantear los proyecciones autónomas y no autónomas de acuerdo a los antecedentes históricos y a la políti- ca socio-económica de beneficio nacional.
Dentro de lo realidad que vivimos, debemos plan- tear con la mejor propiedad las característicos de nuestro universo energético, y dentro de este con- texto fijar los horizontes que marquen las metas a alcanzar.
5. PLANTEAMIENTO DEL ESQUEMA ENERGETICO
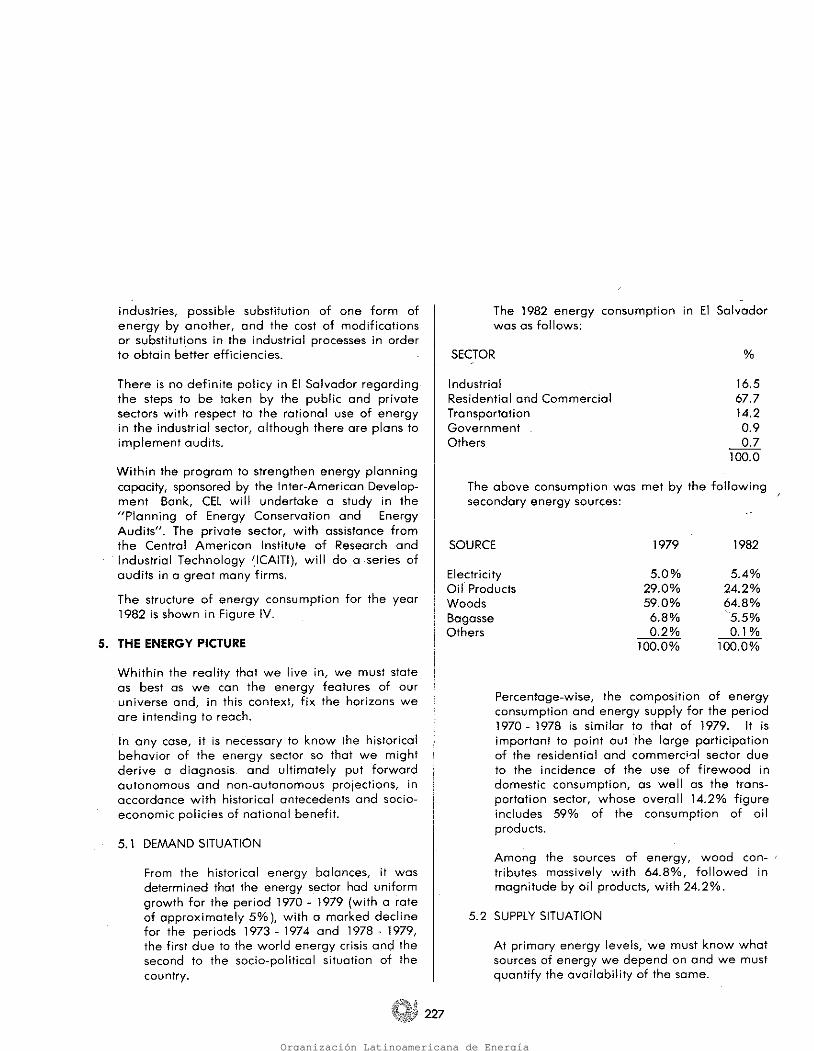
En la figura IV, se puede observar la estructura del consumo de energía poro el año 1982.
Dentro del Programa de Fortalecimiento de la ca- pacidad de Planificación Energética, actualmente se tramita entre la CEL y ekBonco ln!e.ramericano de Desarrollo (BID), un estudio titulado "Planifica- ción de la Conservación de la Energía y Auditos Energéticos". De parte del sector privado, está por realizarse en colaboración con el Instituto Cen- troamericano de Investigación de Tecnología In- dustrial (ICAITI), una serie de auditos de energía en la mayoría de las empresas industriales.
racional de la energía en el sector industrial, aun- que sí existen planes de realizar estudios de auditos.
En El Salvador no se tiene uno política definido en relación con las acciones que deben realizar los sectores públicos y privados en relación con el uso
En este cuadro se observa la alta participación de los derivados del petróleo, particularmente el fuel oil, que en conjunto representan el -47.2% del con- sumo energético en la industria. La alta partici- pación de los productos petroleros en el consumo industrial pone de manifiesto la necesidad de ra- cionalizar su consumo ya que son productos impor- tados y causan serios problemas en la balanza de pagos.
Por su parte la electricidad participa con el 15.5% y ha manifestado una tendencia· definidamente creciente, debido a un cloro mecanismo de susti- tución de diese! por electricidad. Exceptuando las las pequeños cantidades usadas como consumo propio en la refinería, el diesel se uso para la pro- ducción de vapor, el que o su vez se emplea en procesos de calentamiento y movimiento.
El crecimiento relativo de la electricidad suqier e que las nuevas industrias son del tipo electro-in- tensivos, como textiles, zapatos, etc., en lugar de termo-intensivos como los ingenios azucareros. En el sector industrial se hace evidente el uso ra- cional de la energía, para lo cual se reconoce lo necesidad de efectuar estudios que determinen las eficiencias con que los diferentes industrias consumen la energía, las posibles sustituciones entre una y otra fuente y los costos de modifica- ciones o sustituciones de [os procesos actuales, con miras o lograr mejores eficiencias.
% 15.5 36.6
8.4 37.3 2.2
100.0
Tcal 449
1058 242
1079 63
2891
Electricidad Fuel - Oil Diesel - Oíl Residuos Vegetales Otros (derivados petróleo)
En el año de 1981 el consumo de energía en el sector industrial del país, por producto es el si- guiente:
Organización Latinoamericana de Energía
98
La Planificación Energética no es más que una secuencia de acciones que se inician con el conocimiento del sector energético a través de los balances históricos, se continúa con el diagnóstico de situaciones para después plan-
5.3 PLANIFICACION ENERGETICA
De estos datos se desprende nuevamente el tremendo impacto que tiene la leña en el sec- tor energético.
300.000 abonados 137.000 vehículos
3.3 millones usuarios
Electricidad Derivados de Petróleo leña
Es también importante establecer cuantos ha- bitontes dependen de cada fuente, para cono- cer las prioridades y/o implicaciones de las poi íticas energéticas.
Se han podido establecer cifras oproxl modas de los beneficiarios de las diferentes formas de energía de la manera siguiente:
Las fuentes naturales de energía primaria son: los recursos vegetales que alimentan el 91.2% del sector residencial y comercial y el 45.4% del sector industrial; y los recursos hidráulicos y geotérmicos que participan en un 5.0% en la alimentación de los sectores de consumo industrial, residencial, comercial y de gobier- no a través de lo electricidad.
La disponibilidad de! petróleo es por el mo- mento bastante segura, debido a convenios de suministro suscrito con México y Venezue- la, limitados al suministro total de seis millo- nes de barriles anuales, sin embargo, es con- veniente investigar las posibilidades de sumi- nistros de carbón y el eventual uso de la ener- gía termo-nuclear.
dad el sector transporte, participar con un 42% en la estructura del sector industrial y con el 3.2% del sector residencial y comercial, para el año 1982.
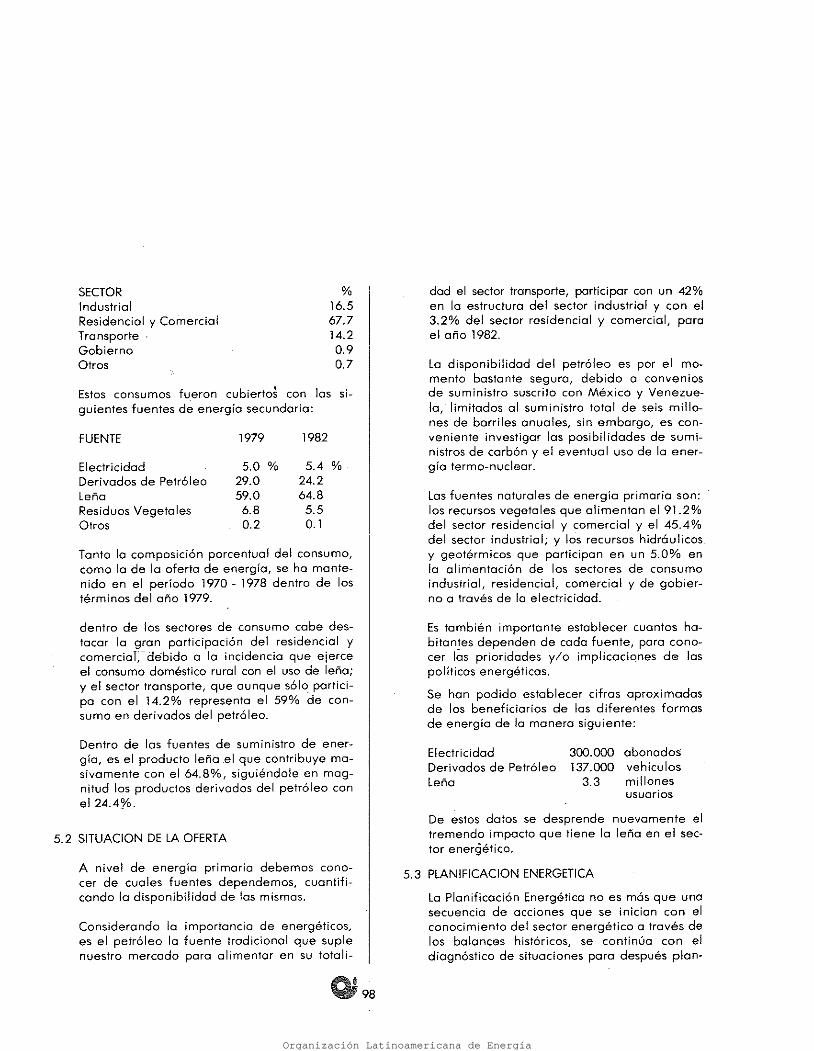
% 16.5 67.7 14.2 0.9 0.7
Considerando la importancia de energéticos, es el petróleo lo fuente tradicional que suple nuestro mercado para alimentar en su totali-
A nivel de energía primaria debemos cono- cer de cuales fuentes dependemos, cuantifi- cando la disponibilidad de las mismas.
5. 2 SITUACION DE LA OFERTA
Dentro de las fuentes de suministro de ener- gía, es el producto leña el que contribuye ma- sivamente con el 64.8%, siguiéndole en mag- nitud los productos derivados del petróleo con el 24.4o/o ..
dentro de los sectores de consumo cabe des- tacar la gran participación del residencial y comercie]," debido a la incidencia que ejerce el consumo doméstico rural con el uso de leña; y el sector transporte, que aunque sólo partici- pa con el 14.2% representa el 59% de con- sumo en derivados del petróleo.
Tanto la composición porcentual del consumo, como la de la oferta de energía, se ha mante- nido en el período 1970 - 1978 dentro de los términos del año 1979.
5.0 % 29.0 59.0
6.8 0.2
5.4 % 24.2 64.8
5.5 0.1
Electricidad Derivados de Petróleo Leña Residuos Vegetales Otros
1982 1979 FUENTE
Estos consumos fueron cubiertos con las si- guientes fuentes de energía secundaria:
SECTOR Industrial Residencial y Comercial Transporte Gobierno Otros
Organización Latinoamericana de Energía

99
ESTRUCTURA DEL CONSUMO NETO DE ENERGIA AÑ01982
ENERGIA SECTORES DE % SECUNDARIA TCal CONSUMO o/o
5.4 Electricidad 1ll9.6 Industrial 38.0 2.06 Residencial 30.7 1.67 Comercial 13.4 0.73 Gobierno 17.9 0.97
100.0
24.2 Derivados de 4970.8 Industrial 28.6 6.93 Petróleo Residencial
y Comercial 9.0 2.17 Transporte 58.8 14.22 No Identificados 0.8 0.18 No Energéticos 2.3 0.56 Gobierno 0.5 0.12
100.0
64.8 leño 13324.6 Industrial 2.7 1.75 Residencial 97.3 63.04
100.0
5.5 Residuos Vegetales ll30.5 Industrial 100.0 5.50 O.l Otros 20.0 Industrial 29.5 0.03
(Carbones y Coque) Residencial 70.5 0.07 TOO:O
El planteamiento energético, como lo hemos concebido, incorpora dentro de sus elementos el diagnóstico del sector, el cual incluye el análisis de tendencias absolutas, el análisis
Dentro de este proceso se usan los balances energéticos como herramientas que orientan el planteamiento en sus prospecciones.
En el cuadro siguiente se presento la estructu- ra de Consumo Neto de energía para el año 1982.
histórico de estructuras; la evolución de las principales variables económicas y sociales en su relación con lo energía y las tendencias que muestran los indicadores macroeconómi- cos. Además se plantean los proyecciones de la demando de energía por sectores, por pro- ductos y en forma total.
tear los hipótesis autónomos y no cutónornos que proyectan los planes de desarrollo.
Organización Latinoamericana de Energía
100
El seguimiento del comportamiento de la deman- da de energía eléctrica y uno adecuada planifica- ción en el equipamiento ha permitido a la CEL mantener una oferta firme dimensionado o lo ne- cesidad nocional.
l. CONCLUSIONES
La electricidad debe ser consumido también con mejor eficiencia; deben acelarse progra- mas de investigación para el uso de otros fuentes de energía renovable, que como el el sol y el viento, son capaces de producir electricidad, e implementar estudios de inter- conexión eléctrica con los países vecinos.
La leña debe ser consumido con mucha ma- yor eficiencia mediante el uso de cocinas de fuego cerrado que facilmente duplico su efi- ciencia; por otra porte se deben poner en eje- cución planes forestales que incluyan el culti- vo de árboles para producir leña; y finalmen- te sustituir parle del consumo de leña con fuentes renovables de bajo costo como lo es el biogas y la bosta.
Para los derivados del petróleo se debe in- crementar la eficiencia en su consumo y bus- car lo sustitución con otras fuentes de ener- gía renovable, como es la hidroelectricidad, lo geotermoelectricidad y el alcohol etílico.
Las acciones a seguir poro hacer frente al pro- blema, se pueden resumir de la siguiente manera:
Ante la problemática que se plantea en el sec- tor energético por las limitaciones de la oferta en las formas de energía, hay un denomina- dor común que le corresponde y es el uso eficiente.
6.2 FORMULACION DE POLITICAS ENERGETICAS
Presentado el esquema bajo la problemática del suministro de energía mediante las tres formas de energía referidas, surge una gran pregunto: ¿Qué podemos hacer?
LA ELECTRICIDAD
Es otra de los formas de energía que se consu- me en El Salvador, la cual presento la carac- terística de ser una forma de energía desea- ble, que puede ser generada por recursos na- turales nacionales renovables o por derivados del petróleo. La electricidad es un producto energético que sirve de soporte al desarrollo económico del país, a pesar de su escasa por- ticipoción en el sector energético, siendo un indicador de la situación en que se desarrolla la economía nacional.
LA LEÑA Es un producto energético que afecta uno ele- vada proporción de la población nacional, en particular el sector doméstico rural que es una población de escasos recursos económicos, para los cuales la leña les significo el único contacto con lo energía. La leña es una for- ma de energía usado tradicionalmente y está incorporado masivamente en el esquema energético nacional, siendo su implicación, además de social, ecológico por los efectos de la deforestación.
los derivados del petróleo opcrecen en el es- quema energético nacional con características de alto grado de dependencia, elevado costo y fug-a de divisos; es sin duda una formo de energía de la cual dependeremos o mediano y largo plazo, por lo que debemos buscar en nuestra planificación lo mejora alternativa de su uso. Esta forma de energía es de gran im- pacto en la economía nacional y afecto sus- tancialmente los sectores de transporte e in- dustrial.
lo sociedad salvadoreño se enfrento al pro- blema energético dependiendo de tres formas de energío, cada una de ellas con sus propias incidencias.
6. 1 ESQUEMA ENERGETICO
6. LA PROBLEMATICA ENERGETICA EN EL SALVADOR
Organización Latinoamericana de Energía

Aprovechamiento Hidroeléctrico Río Lempo Estructura de lo Potencia Instalada según Fuentes Consumo Neto de Energía Año 1982 Equipamiento Eléctrico Demanda y Capacidad de Potencia Alternativa y Equipamiento Demanda y disponibilidad de Energía Líneas de Transmisión
~ 101
Figura VII
Figura VI
Figura IV Figura V
Figura 111
Figura 11
Capacidad y Demanda Máxima Sistema CEL
Figuro 1
8. INDICE DE FIGURAS
En la República de El Salvador, la CEL ha logrado implementar un sistema de generación y transmi- sión de energía eléctrica que ha cumplido su co- metido dentro de los requerimientos socio-econó- micos del país.
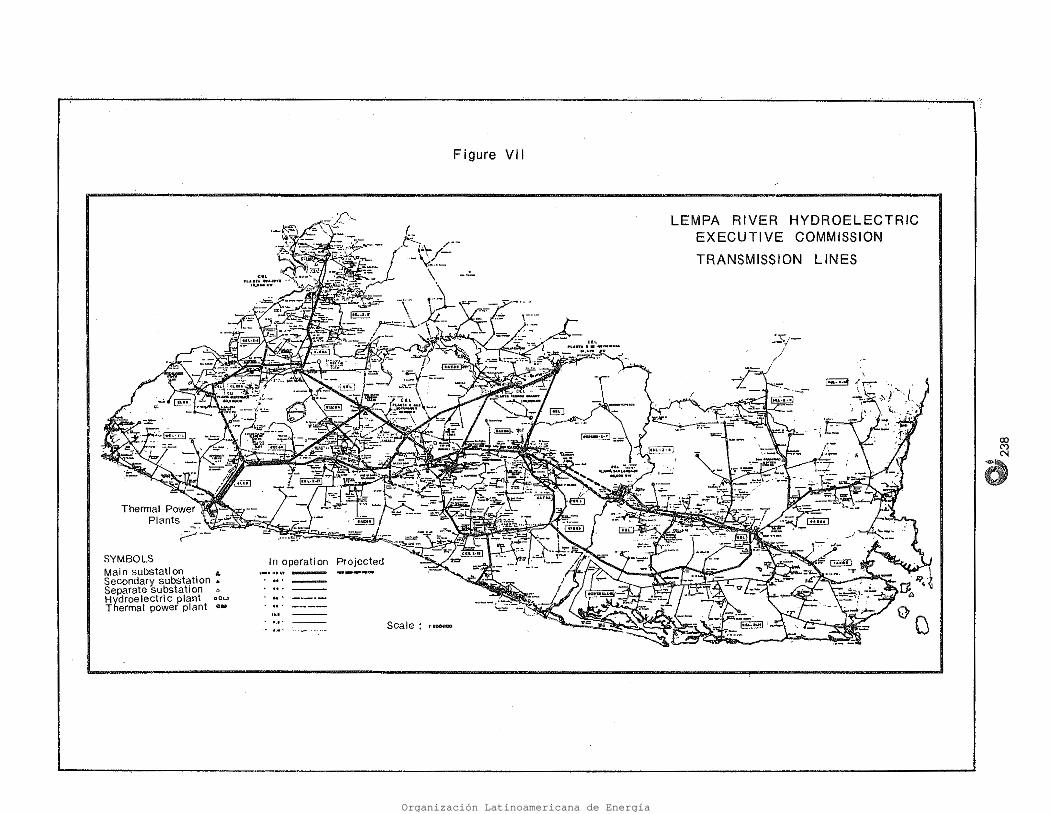
Asociado al Sistema de Generación se ha diseña- do y construido una red de líneos de transmisión a 115 KV que interconecta los centrales y transpor- ta lo energía eléctrica a los centros de carga. In- tegrada con el sistema de transmisión se superpo- ne la red de subtransmisión que opera a 44 KV y termina en las subestaciones de distribución don- de se inician las líneas de distribución primaria o 13.2 KV (Figura 7).
Como una unidad complementario, dentro del sis- tema de generación y transmisión, se ha incorpo- rado el Centro de Operaciones del Sistema (COS), que permite el manejo automático de los equipos del sistema, el cual está implementado en un 75% y está diseñado paro planificar, operar y supervi- sar la generación y transmisión de energía eléctri- ca por medio de un "Sistema de Computación de Tiempo Real". Este elemento del sistema permite la operación más eficiente, optimizando las dis- ponibilidades de los recursos dentro de las curvas de carga.
Con los criterios expuestos se mantiene una pla- nificación dinámica del equipamiento del sistema eléctrico, que genera programas como el que se presenta como uno alternativa en las figuras 5 y 6.
Dentro de la filosofía del equipamiento se ha da- do prioridad a la utilización de los recursos natura- les con miras a proveer lodo lo energía eléctrico con dichos 'recursos. Este objetivo fue logrado o partir del año 1977, cuando la ccpocídod instalada, dentro de lo planificado, alcanzó a cubrir las ne- cesidades totales de potencia y energía eléctrica de todo el país.
Organización Latinoamericana de Energía
FIGVA A N~ 1
1975 1970
A FI o s 196~ 1985 1980 1960
1 l I¡ 1 1 1~ ¡~~ ! iz ;3~ ':f 1
l
1
r
l
1
\
w ~ , §~ ~!! "¡; .. i~ ~, i. i'
i
I! •
J ~ ~ ; "
1 ~ ~-+-+--+-+-~~~+-+-+~-~~,-+-+--+-+-~1~3~+- ~ .
CAPACIDAD Y DEMANDA MAXIMA SISTEMA CEL
400'
500
600
700
800
MW 900
Organización Latinoamericana de Energía

~ PROYECTOS PROPUESTOS l PROYECTOS EN EJECUCION l PROYECTOS EN OPERACION
DISTANCIA EN KMS. (ORIGEN DESEMBOCADURA DEL RIO LEMPA)
Río Desagüe I Río Lempo 60 80 100 120 140 160 180 200 220 240 o 260 20 o 40 20
o Elev. 16.00 Oceáno
Pacífico
() <1l (J,
g· ¡} ------------0---t-------------------l a < ::l g- Q
e ~ IV O O
~ ~ ~ 1-----------.!+------------ ~ g- ------ ~
tn -<
<O" ro
¡:;; ~ d' s----$: - - "'--.!'------------------------------------~ ~ $: o ~ g-
Elev. 430.00 9 o
o -c o
G) e E.
N o 'o g. o
APROVECHAMIENTO HIDROELECTRICO RIO LEMPA
FIGURA 11
100
500 m r+ m < )> n o 400 z ~ ~ z s: 300
o ~ w
200
600
700
Organización Latinoamericana de Energía

FIGURA 111
2000 Años
1990 1985 1995 1980 1975 1970
o
10
20
30
40
50
60
70
80
90 1 1 1 1
TERMOELECTRICIDAD
i771 trrr ti/ l IJ
111 I r 1 i 1111 11 .71,
lf 11 11 ¡I I ¡ 11 ,,, 111 i
rrr 1111 11 GEC TERMOELECTRICIDAD 'rrn rm ' ' ' f j ' ' - ' - - \ -
'\' \ \. ' \ ' - I u ' I "' - ..... - ,
' I \"' ,, ' ~ HIDROELECTRICIDAD ,, '" 1\ -
~
--
% 100
ESTRUCTURA DE LA POTENCIA INSTALADA SEGUN FUENTES
Organización Latinoamericana de Energía

FIGURA IV
LEÑA 64.8 %
OTROS 0.1 %
24.2 % DERIVADOS DEL
PETROLEO
FORMA DE ENERGIA
ESTRUCTURA POR SECTORES
SECTOR % TCAL
Industrial 16.5 3,388.3 Residencial y comercial 67.7 13,919.0 Transporte 14.2 2,923.6 Gobierno 0.9 182.2 Otros 0.7 152.4
TOTAL 100 20,565.5
CONSUMO NETO DE ENERGIA
AÑO 1982
Organización Latinoamericana de Energía

1 1
--- 1997 --- ,,,. --- IH9
---- to)()
---- 1995 --- 199•
19,0 179Z 199l 1994
GEOfERMIA lli: GEOTER'llA 1[
GEOTERMIA ,11% El TIGRE 1 El TIGRE I GEOTERMIA U
GEOTERM1• 1ql! VAPOR l ' VAPOR l y lJl. l1. TIGllf i11
SAH lOf!CNZO 1 ---- 198' ~AM U>REJiZO 1 --- 199' AMPLIACl()N 8 DE NOV. - 1990
Calendario de Equipamiento
-- 1---· - ,___ ~~ ,__
o 19"/'0
1 eooc Ak>S i.n 1980 190~ 19110 IHS
Figura Jl. Equipamiento E.léctrico Demanda y Capacidad de Potencia
1
MW Zl)00-1--4---l---1--4---l--+--1----11---4-.;_.¡..--1-_...¡__..¡__.¡..__,____¡_-4_-l- __ ¡_..•__¡• __ .;_.¡.. __ .¡.._'__¡•1---4-.;_.¡..--1- _ _¡__..¡__+•--1--...J.
Organización Latinoamericana de Energía
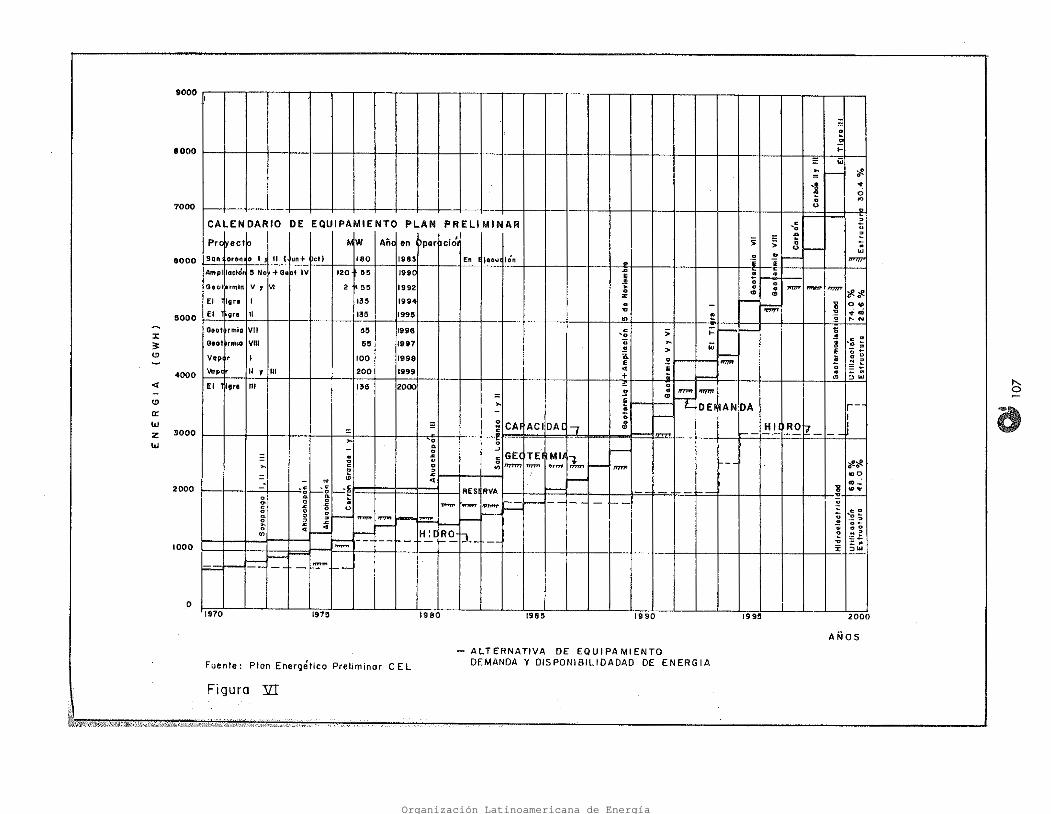
ALTERNATIVA DE EQUIPAMIENTO DEMANDA Y OlSPONIBILIDADAO DE ENERGIA
AÑOS
2000 1995 1990 198!1
r-, o
1980
Fuente: Pion Energético Preliminar CE L
Figuro fil
1970 1970 o
8000
7000
8000
9000
1000
- ' ..
~ 1-
- ¡¡; .. - o~ .. 1 ..
o a .., u n
CALENDARIO DE EQUIPAMIENTO PLAN PRELIMINAR " ~ 'o u ... ;:: Pr0t.ectb llW Añ< ~p1r 1JciÓ1 ~ ~ en > D . u '-- "' Sao or•n o 1 J 11 { un+ >et) 180 1985 En 1 Jeou1 lÓri D .! .___ """' . ·¡¡; ¡
Ampllool~1 S No + 0• bt IV 120 8!1 199C .. ; . E Vl
.. o o G•v t1trmlo V J 2 ~ 5!1 1992 . . . ""'" """' ,,,,,. o "' "' ";!!;;!? z - El lgr• 1 13!1 1994 . - - 'll o"' El 11 13S
-e """' ... . .; gro 1998 ... ~ :2 I'- N
0 .. 1 rmia VII 3!1 1998 e s ¡: ¡.....,_ - 't; •o ~ ~~ ~ º'º' '"'"' VIII ll!l 1997 o ... ¡;¡ 3 .. > E o - Vap r 1 100 1998 i. ...___
;; o o E .. """' ~ ~ ... E o ;: - \lap1 11 , 111 200 11199 . - . + !:: ' "' " ...
El •••• 111 "IS 2000 ~ o .!? • ,,.,.,., ,,,.,.,.,, = "'h: .. e DEI "AN DA r- - • o .___ 1
::; - ::? CAi ACI DAC ' el H 11 •RO u.. _j ¡¡ - ... D s - " ...J - o ., GEC TEI Mii - ~ ~ + ~-- #~ ,.. " D ;;; rmm """ '""' rmn - """ = ~ 1 "'º - .. <!> ... - ... ...: . - ~~~~ .s AES1 l!VA -- ~ ~ '8 ..... o G. CL -~ .., .___ l1' .. ..
"""' ,,.._, ,,,,,.,,. ~- -- -- - - - ,__ :~ .c 1i <.) ,.._ "" o o o - 'o~ i " " - '""" """' L-. - - :: ·- " " .c o- .e ... - o; ºº 1/)
.. _ ,.._ H :1 RO tL e ~E ....._ --· -- - 1-- -- -e =· ,,..,,.., x ""' ~ - ~~ - ~ ,__ -
!SOOO
:r 3: (!)
4000 <f
(!)
a: w 41:: 3000 w
2000
Organización Latinoamericana de Energía

C() o
H' o oca •• ---·-·•1•14&.. ~ ...... _ ....
·- .~~.¡- /
COlllllll E.IECutlVA . llDIOl!ll.CTllGA Dll llO LEilPA •&. IAL\'AOOa. (".A.
LIHAS DE TRAICSll'llSIOM
Figura VII
Organización Latinoamericana de Energía

With the commissioning in June 1954 of the first unit with a capacity of 15 MW for the "5 de Noviembre" Hydroelectric Plant (the first hydropower development by CEL), a new era wos initioted in El Salvador, in which the exis- ting re~trictions to the use of electric power disoppeared.
To dote, CEL has o hydrothermal generoting system composed of modern power plants with an instolled capocity of 455 MW, which
The uncontrolled increase in demand, and the inadequacy of the private enterprises to meet it, urged the creation of the Lempo River Executive Hydroelectric Commission (CEL), by legislative decree in 1948, as an Autonomous Public Service Agency, to solve the problem of the supply of electricity required by El Salva- dor's economic and social development.
The technological development following the Second World War made its impact in El Sal- vador .and brought about industrial develop- ment which, added to the populotion increase and the reduced size of its territory, resulted in demonds for electricity which could not be met with the generating means available in the 40's.
2. l 1 NSTITUTIONAL DEVELOPMENT
2. THE ELECTRIC POWER MARKET
Francisco E. Granadino ELECTRICAL ENGINEER EXECUTIVE DIRECTOR
FE
223 -~
El Salvador with an orea equivalen! to 5% of that of Central America, and a population approximately 25% of the total population of the region, holds a prominent place as a producer of electric power with a combination of hydroelectric, conventional steam, gas turbine and geothermal power plants and a transmission sysfem forming a grid providing a reliable supply of electricity, a very important component in the economic and social develop- ment of the country.
The use of electricify wos initiated in El Salvador at the beginning at the present century; 'flrst in the residential sector; later in the commercial sector; and finally in the industria! sector. lt was produced in small gasolina or diese! plants; as demand increased, ·the alternativas of commercial ex- ploitation through small prívate enterprises was considered and small hydroelectric and thermal plants were built without any thought to demand projections.
When !he word "energy" is mentioned, it is· usually associated with the concept of electricity which is, in reality, the by-product of a transformation of primary energy; and thus, it is termed secondary energy and utilized as such for human consumption.
Central America is a region whose natural energy resources are limited to a few sources of primary energy such as orgánic, hydraulic, geothermal and hydrocorbon resources.
1. INTRODUCTION
Organización Latinoamericana de Energía

With the aim of developing, preserving, ad- ministering and utilizing the resources capable of electricity generation in El Salvador, CEL policy was oriented to the exploitation of its natural resources; and it was precisely for this reason thot the institution was named os on Executive Commission to exploit the hydro- electric potentiol of the Lempo River for the benefit of the country.
3: 1 HYDROELECTRICITY
3. ELECTRICITY GENERATION IN EL SALVADOR
1977 1981
Industrial 45.5% 466. l GWh 38.9% Resídential 26.6 383.1 31.9 Commercial 13.5 165.0 13.8 Government 14.7 185.4 15.4
100.0 1, 199.6 100.0
The following table shows the evolution of the breakdown of demand in percentages:
The magnitude of consumptíon requírements. hove changed since the start of electricity · generotíon by CEL, with the industrial sector always leoding in the demond for energy, followed by the residentiol, commercial ond . government sectors, in thot order.
2.3 DEMAND COMPOSITION, PERCENTAGE-WISE
in both power and energy of 10.5% annually, that is, they doubled every 7 years. For. the purpose of demand projections, transmission and distributión losses are estimated as 15% of net generation, while the maxium demond · of the systems is determinad by applying a constan! load factor of 0.57 to the net generation projections. Figure 1 indicotes demand ond installed capacity for 1954.
• 224
With the availability of on unrestricted supply of electricity, the demand increased rapidly in the first years, reaching an historie increase
An acute shortcqe of electricity existed in El Salvador prior to CEL's initial operations in June 1954. By the middle of thís century, the installed capacity in El Salvador was 33 MW, of whích 50% was supplied by prívate utilities arÍd the other 50% by 200 small plants used in the industria! sector.
2. 2 DEMAND DEVELOPMENT
- To make rational use of the externa! and interna! sources of fínancing.
- To extend the benefits of electricity to the majority of the inhabitants of the country.
- To maintain an on-going program of research on non-conventional sources of energy.
To study and promete measures for the rotional use of energy by consumers.
·-:- To utilize in a rational way the existing natural resources for electricity generation.
To undertake demand projections and system planning so that the electricity supply will anticípate the demand.
Within those objectives, CEL, as the entity res- ponsible for the electric power sector, set the following policies:
In the year 1981, CEL's by - laws were · modified by Executive Decree to incorporate the following within its objectives: "to develop, preserve, administer and utilize the energy resources of El Salvador".
meets the demand of much of the national electricity market; this systems supplies 90% of the national power demand.
Organización Latinoamericana de Energía
The investigafions were successful; o geother- mal plan! with an insta!led capacity of 95 MW was put in operation in Ahuachapan, while es- tablishing the feosibility of another plant at
At the sorne time, investigotion in other oreas , of the country where endogenous manifes- tations were visible were corried out, inden- tifying the goethermal fields of Berlín, Son Vi- cente and Chinameca in the eastern section of the country and Chipilapa close to the Ahuachapan field.
This reseorch, íntensifled in the 70's, identífied the geothermal fíeld of Ahuachapon wíth an estimated capacity of l 00 MW.
Geothermal investigations were initiated in El Salvador in 1964 to establish !he existence of geothermal resources suítable for electrical generation.
3. 3 GEOTHERMOELECTRICITY
The cddition of the thermal plants to the system was totally justified then as the best technical and economic alternative.
1966-1969 1972-1973
Steom Power Plant 63 MW Gas Turbine Power Plan! 65.2 MW
In order to meet the market's increosing demand, conventional thermal plants were incorporoted into the planning of CEL's elec- tricol systems, to back up hydropower generation due to the irregular hydrology of the Lempo River basin, thus reaching on ins- tal led of 128.2 MW, as fol lows:
3.2 THERMOELECTRICITY
1,552MW
1,404 MW 60 45 43
Lempo River Rivers with permanent flow Lakes (llopango, Olomega) Rainy season rivers
225
The available hydroelectric potential is as follows:
Most of the rivers in El Salvador hove small volumes, with flows of less than one cubic meter during the rainy season ond no flow ar all during the dry season. The lorger rivers are a source of additional hydroelectric poten- tial for the Lempo River.
*Cancel led when Zopotil1o is in operation **Lempo River develcpment: 30.5% of power ond 43. l % of energy
when San Lorenzo is in operotion.
·TOTAL CURRENT YEAR GWH/ MW MW YEAR
Gua joyo * 15 * 15 1963 * 54 Zapotillo 120 422 Paso del Oso 40 152 Cerrón Grande 270 135 1977 515 5 de Noviembre 202 82 1954 762 El Tigre 540 l,718 San Lorenzo 180 ** 180 1983 722 Son Marcos ~ 208
l,404 232 4,499
The exploitation of its hydroelectric potential was planned from th'e start through a series of cascode projects (See Figure 11) for o total of 1,404 MW of power ond 4,499 GWh of mean energy, of which 232 MW of installed capacity ond 1, 132 GWh of mean energy hove been developed, 17.2% and 26.3%, respective!y, of its tota 1 potentia l. The hydroelectric projects in the Lempo River current ore as follows:
The Lempo Ri':"er, the largest river in Central Americe on the Pocific side, has the greatesl hydroelectric potential in El Salvador, with an inlernalional basin of 20,0CX) square kilometers, half of it in El Salvador.
Organización Latinoamericana de Energía
226
The rational use of energy is evident in the indus- trial sector; studies are required to determine the efficiency of energy consumption in the different
Electricity participation is 15.5%, and there is a dlstinct upword trend due to the substitution of diese! generation by electricity. Except for small quantities used in station service at the refinery, diese! is burned to produce steam for heating processes. The relotive increase in electricity suggests that the new industries are of the elec- tricity-intensive type, such as textiles, shoe manufacturing, etc., in lleu of the steam-intensive · industries such as sugar refineries.
The high percentage of the oil products is clearly shown with its 47.2% of the total energy con-
, sumption in industry. This percentoge clearly indicates the need for rationalizing their use, they are foreign imports, with a heavy impact on the balance of payments of the country.
Total % Electricity 449 15.5 Fuel oíl 1,058 36.6 Diesel oil 242 8.4 Bagas se 1,079 37.3 Others (oíl products} ~ ---2.:1.
2,891 100.0
In 1981 the consumption of energy in the industrial sector, by products, was as follows:
The industrial sector is predominan! in the consurnp- tion of electricity, with 47% of the total demand; nevertheless, due to the socio-economic crisis in the country, its participation has decreosed to 39%.
Three forms of energy participote in the workings of the industrial sector: oíl, bagosse and electricity. Of the three, the one with the greatest participation is oil, with 47%; followed by sugar cane bagasse, with 37.5%, and then electricity, with 15.5%. ·
4. ENERGY CONSUMPTION IN INDUSTRY
64.9% 15.0% 20.1 o/o
100.0%
412 MW 95 MW
128.2MW 635.2MW
Hydroelectricity Geothermoelectricity Thermoelectricity
1984
The historical trend of the installed capacity is shown in Figure 111, with a Jorge hydroelectric componen! since the beginning. Recently, from 1975 on, with the geothermal componen!, the inslalled capacity based on natural resources is 72% of the total. When the San Lorenzo Hydroelectric Plant goes onstreom this year, the percentage of installed capacity based on natural resources will be 80%, as follows:
51.0% 20. 9% 28.1%
100.0%
323 MW 95 MW
128.2MW 455.2 MW
Hydroelectricity Geothermoelectricity Thermoelectricity
The installed capacity of the electrtclty generating system has increased in on orderly mónner from the year 1954 to date, from 30 MW to 455.2 MW in 1982, with the following break- down:
3.4 INSTALLED CAPACITY
95MW (in operation since 1975) 55,,
55" 55,, 35"
295MW
Ahuachapan Plant Berlín Plan Chipilapa Plant San Vicente Plant Chinameca Plant
Avoiloble data estimate the capacity of geothermal electric power generation as follows;
Berlín and possibilities of tapping this natural resource al Chipilapa, San Vicente and Berlín.
Organización Latinoamericana de Energía
227
At primory energy leve!s, we must know what sources of energy we depend on and we must quantify the availability of the sorne.
5.2 SUPPLY SITUATlóN
Among the sources of energy, wood con- ' tributes massively wi!h 64.8%, followed in magnitude by oíl products, with 24.2%.
Percentage-wise, the composition of energy consumption and energy supply for the period 1970 - 1978 is similor to thot of 1979. lt is importan! to point out the large participation of the residential and commerciol sector due to the incidence of the use of firewood in domestic consumption, as well as the trons- portotion sector, whose overol! 14.2% figure includes 59% of the consumption of oil products.
SOURCE 1979 1982
Electricity 5.0% 5.4 o/o Oíl Producls 29.0o/o 24.2% Woods 59.0% 64.8% Bagasse 6.8% 5.5% Others 0.2% O.To/o
100.0% 100.0%
The above consumption was met by the following secondary energy sources:
16.5 67.7 14.2 0.9 0.7
100.0
Industrial Residential and Commercial Transportation Government Others
% SECTOR
The 1982 energy consumption in El Salvador was os fo!lows:
From the historical energy balances, it wos determined that the energy sector had uníforrn growth for the period 1970 - 1979 (with a rote of approximately 5%), with a marked decline for the periods 1973 - 1974 ond 1978 - 1979, the first due to the world energy crisis and the second to the socio-political situation of the country.
5.1 DEMAND SITUATION
Whithin the reality that we líve in, we must state as best as we can the energy features of our universe and, in this contex!, fix the horizons we are intending to reach.
In any cose, it is necessary to know the historical behovior of the energy sector so that we mighl derive a diagnosis and ultimately put forward autonomous and non-outonomous projections, in occordance with historical antecedents and socio- economic policies of national benefit.
5. THE ENERGY PICTURE
Within the program to strengthen energy planning capacity, sponsored by the lnter-American Develop- ment Bank, CEL will undertake a study in the "Planning of Energy Conservation and Energy Audits". The prívate sector, with assistance from the Central American lnstitute of Research and Industrial Technology ~ICAITI), will do a series of audits in a great many firms.
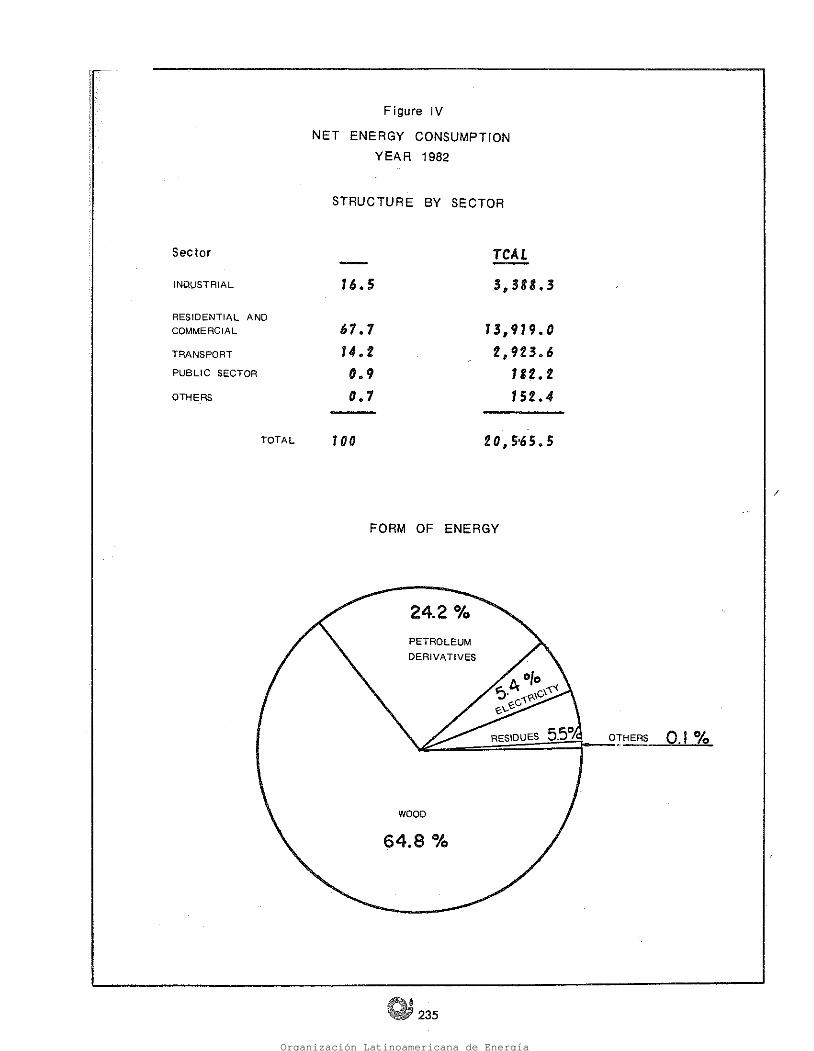
The structure of energy consumption for the year 1982 is shown in Figure IV.
There is no definite policy in El Salvador regarding the steps to be token by the public and private sectors with respect to the rational use of energy in the industrial sector, ahhough there are plans to implement audits.
industries, possible substitution of one form of energy by another, and the cost of modifications or substitutions in the industrial processes in order to obtain better efficiencies.
Organización Latinoamericana de Energía

Wood is an energy product that affects a very large proportion of the inhobitonts, in particular the low-lncome, rural domestic sector for which wood is the only source of . energy. Wood is a form of energy used · traditionally and incorporated massively into national energy problems, with social irn- . plications as well as ecological impact due to the deforestation effect.
OU produc:ts, in !he context of national energy problems, are characterized by a high degree of . foreign dependence, high costs and outflow of foreign exchange. Without doubt, they are a form of energy that we will depend on in the short and medium terms, qui alternatives must be found to substitute them. This form of energy has a great impact on national economy and substantially affects the transportation and · industrial sectors.
The Salvadorean society faces the energy problem through three types of energy, each one with its own impact:
6. 1 THE ENERGY PICTURE
6. THE ENERG Y PROBLEM IN EL SALVADOR
The chori on the following page presents the 1982 structure of net erierqy consumption.
5.4 NET ENERGY CONSUMPTION STRUCTURE - r982
Energy planning incorporates within its elements the diagnosis of the sector, which includes an analysis of the absolute tendencies and an historical analysis of structures; the evolution of the principal economic and social variables as related to energy and the trends
· shown by macroeconomic indicators. Energy demand is also projected by sectors, products, and globally.
Energy balances are used in this process as tools to guide the planning processes.
228
Energy planning is nothing more than the sequence of octions that are initiated with a view to unders!anding the energy sector through the historical energy balances, followed by a diagnosis of the situations so that the autonomous and non-autonomous hypotheses can be established for the development plans.
5.3 ENERGY PLANNJNG
The tremendous impact of the use of wood in the energy sector is clearly shown.
customers vehicles
users
300,000 137,000
3,300,000
Electricity Oí! Products Wood
The appoximate figures of the beneficiaries of the different forms of energy hove been determined as follows:
lt is also importan! to establish how many inhabitants depend on each source in order to know the priorities and/or implications of the energy poi icies.
The natural sources of primary energy are: organic resources which account for 91.2% in the residential and commercial sector and 45.5% in the industrial sector; and the hydro and geothermal resources with a 5.0% in- cidence in the industrial, residential and com- mercial, and government sector because of the ise of electricity.
The availability of oil is quite assured for the time being, due to the agreement with Mexico and Venezuela; nevertheless, it is convenient to investigate the possibilities of coal supplies and the eventual use of thermo-nuclear energy.
Considering energy imports in 1982, oil was the traditional source that supplied our market in its totality in the transportation sector; 42% in the industrial sector; and 3.2% in the residential and commercial sector.
Organización Latinoamericana de Energía
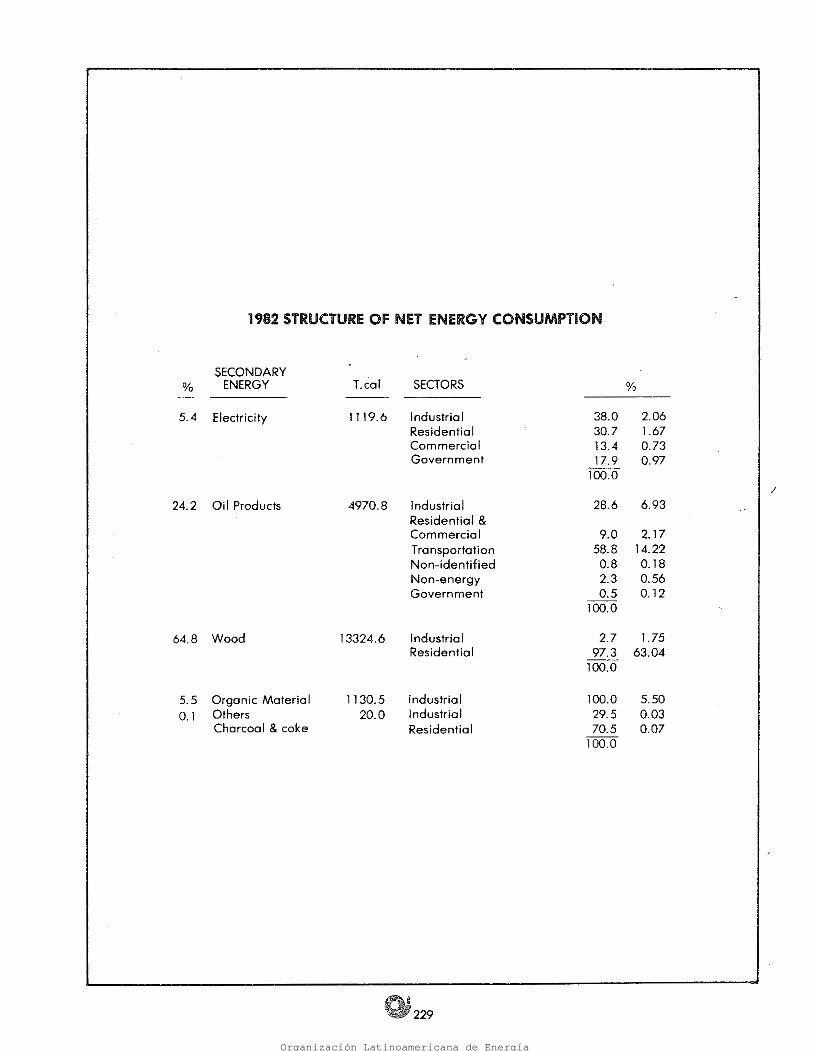
SECONDARY % ENERGY T.col = SECTORS %
5.4 Electricity 1119.6 Industrial 38.0 2.06 Residential 30.7 1.67 Commercial 13.4 0.73 Government 17.9 0.97
100.0 /
24.2 Oil Products 4970.8 Industrial 28.6 6.93 Residential & Commercial 9.0 2.17 Transportation 58.8 14.22 Non-identified 0.8 0.18 Non-energy 2.3 0.56 Government 0.5 0.12
100.0
64.8 Wood 13324.6 Industrial 2.7 1.75 Residential 97.3 63.04
100.0
5.5 Organic Material 1130.5 Industrial 100.0 5.50 0.1 Others 20.0 Industrial 29.5 0.03
Charcoal & coke Resídential 70.5 0.07 100.0
1982 STRUCTURE Of NET ENERGY CONSUMPTION
Organización Latinoamericana de Energía

')-:¡/)
In El Salvador, CEL has implemented electric power operations and tronsmission systems in keeping .' with the socio - econornic requirements of the country.
As a cornplernentorv unit to the generation ond, transmission system, a modern Load Dispotch · Center has been incorporated to 'provide for cutomctic operation of the systern. The Load· Dispatch Center is 75% complete and has been designad to pion, operate and supervise the generation and transmission system by means of a Real-Time Computar Systern. This new element · in the system will permit more efficient operation thereby improving resource availability within .. the load curves. ·
lntegrated with the tronsmission system, a sub- transmission network operating at 44 kV feeds the step-down substation and the reloted primary distribution lines at 13.2 kV. See Figure VII.
Associated with the generating system, a grid of 115-kV tronsmtssíon lines as been designed ond built to interconnect the generating plonts and transport the electricity to the load centers.
The meosures token to mointoin dynamic planning for the electrical system results in projections such as !hose presented in Figures V ond VI.
With this implementation policy, priority has been given to the use of natural resources in arder to provide ali the electric power from such resources. This objective was finolly reached in 1979 wheri the installed copocity based on natural resources met all of El Salvodor's requirernents of eleclric power ond energy.
A close follow-up · of the behavior of electricity demand ond the adequote outfitting of its different projects has permitted CEL to mointain o firm supply ·. to cover national needs.
7. CONCLUSIONS
Electricily must olso be used with better efficiency; research must be speeded up on other renewable energy sources such os the sun ond wind, olso capoble of producing elec- tricity, as well os on electricol interconnections with neighboring countries.
Wood must be consumad with greoter efficiency by meons of stoves of the closed-fire type, which double efficiency; in oddition, plans should be implemented including energy Forests and substitution of port of . the wood consumption by cheap renewoble sources of energy such as methane gas ond cow monure.
As for oil products, we mus! increose their efficient use and seek to subtitule them by other sources of renewoble energy such os hydroelectricity, geothermoelectricity and ethyl alcohol.
The octions to be token in coping with this problem can be summarized as follows:
The problematic situation facing the energy sector, due to limitations for the supply of energy, has a common denominotor: efficient use.
6. 2 FORMULA TION OF ENERGY POLICIES
Now thot the energy supply problem has been laid out in terms of the obove three types of energy, the question orises: What can we do?
Electrlcity is another of the types used in El Salvador, with the characteristic that it is a desirable form of energy thot can be produced by local renewable natural resources or by oil products. Electricity is one energy product thot supports the econornic development of the country in spite of its small role in the energy sector, but it is an indicotor of the way in which the economy of the country develops.
Organización Latinoamericana de Energía

• 231
Figure 1 CEL System Capacity and Maximun Demand Figure 11 Lempo River Hydroelectric Development Figure 111 lnstalled Power Structure by Source Figure IV 1982 Net Energy Consumption Figure V Electric Power Demand and Capacity Figure VI Electricity Demand and Capacity Alternatives Figure VII Transmission Lines
8. INDEX
Organización Latinoamericana de Energía

VEARS
1965 1980 197!1 ,970 1960
r----·-r-- ~--·+--+---t------1----1---t--->---+---+--+--+--t-~r----t----t---r--.---
o "
CE L SYSTEM MAXIMUM CAPACITY ANO DEMAND
Figure 1
300
400
500
600
700
800
r.iw 900
Organización Latinoamericana de Energía

~ PROJECTED l IN SERVJCE l UNDERWAY
TOO
Figure U
LEMPA RIVER HYDROELECTRIC USE
PACIFIC OCLAN o 110 1 o l40 110 10 o eo MO HO IOO IOO IJO ·60 40 20 o River Dt111i11 t-River LtlllH
DISTANCE IN KMS (FROM MOUTH OF RIVER LEMPA)
600 • • 2 2 o .., Cll
Vi ~
w o a: 500 .. 1- o·- ¡ w .... o ;E :J a JI .., N ~ Hl. lli.Q_O :1
...J g 11 w N 2 > 400
~ N
w o ...J
~ N 11 t 2
<(
~ w ·1 C") <1) C")
~ lfl e-. w 500 • ..
> u e o 1 ~ al <( .g irl • f- 2 :e IO ! s Ja Q 200 • _:1 w ~ ·2 N . :e t lit) s:
I! o _,
'ºº
Organización Latinoamericana de Energía

1990 zooo YEARS
Ut95 1985 1980 1970 o
10
20
30
40
50
60
70 ªº 90
1 1 1 1 1 THERMOELECTRICITY
77i 777 11 I f¡
V'' 11• rn 71 ', 'r'J7. I" . 11 'I I ' I' I ' I .111 I "\ I
, ,111 GEOTH ERMOELECTRICITY ','TT m ~ ,_ - , /, f, I ' ·- 1\ - .._ 1 1\ - \\ I\ \ I\ \ 1\ --- I u· - ' - ' ' \ ' ~ \ ' ' \ ' HYDROELECTRICITY
\ \~ ~" '
'ºº
Figure 111
STRUCTURE OF INS.TALLEO CAPACITY ACCORDING TO SOURCES
Organización Latinoamericana de Energía
/
64.8 o/o WOOD
PETROLEUM DERIVATIVES
FORM OF ENERGY
Sector TCAL - INQVSTRIAL 16.S 3,388.3 RESIDENTIAL ANO COMMERCIAL 61.7 13,919.0 TRANSPORT 14.2 2,923.6 PUBLIC SECTOR 0.9 Ut.2 OTHERS 0.1 152.4
TOTAL 100 2 o, 5·65. s
STRUCTURE BY SECTOR
NET ENERGY CONSUMPTION YEAR '1982
Figure IV
Organización Latinoamericana de Energía

O-+-~+--r.,-+--+-~,~-+-4--4--1--~--'-~-'--1---1--4---'-~~-1---1--.J.---1--+--1--~--1--+--1--~--l--+-+- ll110 1110 111110 1985 1990 19U toOO
YE~RS
·--t--lc--il--1--.---+--+--+--+---+---l _ ___,,____ ._ _ __..... _ _, __ ..._ _ _, __ ¡.__¡___¡___, __ 1---;.------+---·l--· .. ·'---'-------1-
--·--
.,..;_.__-'--+--...¡...,_...¡...,_¡ .. --+--+
+---+---+----!-·--+--+--+-
1 ··- ··--+--J.·--+·--+--+- 1
l,000 -+--!---+---+--
___ ._ __ ._ _ _, GEOTERMI .. 'IJ EL TIGRE I [L TIGRE 1 GEOTERMIA U llEOTEllMIA 'Íl¡Z VAPOR l 1
VAPOll 11 1 Jlt. lL tlGlt[ •
-+---+--+--!---·~--+--+---+ A"'PLIACION 0 ll( llOV. - 1990 OEOTERMIA llt 1990 GEOTERlllA 1t ~z
SAN LORE.1'%0 I --- 198l SAi! LOl!ENZO 1 ---- 1985
--· --·---'-----·-+--+--+--- ~ ·--~l--~1----i---1----1--1---t----+ __ ,_.___
t:OUIPMENT flME fACJLE --;-1---+---t
POWER DEMAND AND CAPACITY MW 2JJOO +--+--l---l--l--l--.J--+--+--+--+---+---+--.+--.+--+-+-+-+--<'t--<'1-~1--'t---'l--!---!-~1--1--+--· ---' -- ·•
1 ~ .~,_._._..-1----+---1---- ·--4---+---+-- . ...- ·-- -·- -- ~·---J--J--~-~-~--l--~--l- ,--l- ,--1--+--+--+--+-=+==~=*---+ 1(1 f-
nES[ fWE nESl:fWE !2
ELECTRICAL. EQUIPMENT F ígure V
Organización Latinoamericana de Energía

YEARS SOURCE ¡ CEL PRELIMINARY ENERGY PLANT
2000 1990 19'5 1980 11179 11170 o
1000
8000
7000
8000
= • .! .. = ¡¡¡ ~ ,__ .,,. "' 1 • o .. ., u n
e ~ EOUIPMENT TIME TABLE - PRELIMINARY PLAN 'o u
1 ! s ~ ~ PROJECTED !JW YEAR IN OPERATION > a .. u,...._ ... !!loo 1 11 ( un + Oct) 180 198' UNDERWAY ·i .! - ""'"' or1nJ o - 1 Ampl lool&o ~No -+ Clo DI IV 120 && 1118( A ! ; J o o Ooot 19rmlo V~ 111 2 . ~~ 1992 . • • - """' """ .,..,. D .. .. • --- El lgre 1 13~ 1994 • - ';;' 1 o .. .. .. ci El gre 11 13& 1998 .. ~ :i .. .,.
" s ¡: t; Qool rmla VII !lll 19U •o ~ ._,• ~ Cito! l'fllll'UGI VIQ u IH? u ... ¡¡; 1 .!! " .. > E .. - i. - ! D O Vop r 1 100 1•98 E .. """' .!! e e li o :; - \.'opcr 11 111 200 19118 • - .. ' + \ "' "' "'"' f:I ,,,. 10 138 200C - o .! . """ """' = ! .. t: ... DEMAND r- - z o - 1
- s CAPACITY f ,J HYDRO. z_ _j :;; li ~- ,_ ,.----- ... .. - o r r 1 - .. ..J t- .. i .& li GEOTHERMICS¡ i!il - .. -- ... ..
O') """'j """ 'l'l'7'TfT mm - """· :'! " eO .., = - m "' C( i--- e..: .: ,&: .e ·8 AES llVA - - ~ ~ 11 ..... .,,__., -~ ..,,_ o ... .. :~ ~ .. o ,,,_ ...., ......,. .-- - -- - - - r--- .e .e u - -~ !! o u o o ~
o o 1-- '""" ,.... ·- ...... - ·-" " " -- 1 . o- ~~ - -, ;; •º o -- HYDRAULIC e ~! "' n.. - -- -- .-.~ -- -- -- 'O ::: . ...... i: ::>l>l - -- -- -- - ~ .__
eooo ENERGY DEMANO ANO AVAILABILITY
EQUIPMENT OPTION Figure VI
11000
l\J X: w 3: '-A "'
4000 <t
"' a:: w z 3000 w
2000
Organización Latinoamericana de Energía
,, ...... Sea le
In operatlon _ ..... , Projected ----- SYMBOLS Mai n substati on ~econdary substat' .e.
eparate substatl ~~n ~~droelectric plant :0
ermat power plant .;
LEMPA RIVER EXEC HYDROELECTRIC UTIVE COMMISSION
TRANSMISSION LINES
VII Figure
Organización Latinoamericana de Energía