reformulacion de galletas de masa corta: cambios en
TRANSCRIPT
Reformulación de galletas de masa corta: cambios en reología, textura y
propiedades sensoriales
LAURA LAGUNA CRUAÑES

REFORMULACIÓN DE GALLETAS DE MASA CORTA: CAMBIOS EN REOLOGÍA, TEXTURA
Y PROPIEDADES SENSORIALES
Tesis Doctoral
Laura Laguna Cruañes
Dirigida por:
Dra. Ana Salvador Alcaraz
Dra. Teresa Sanz Taberner
Valencia, Abril 2013

Esta editorial es miembro de la UNE, lo que garantiza la difusión y comercialización de sus publicaciones a nivel nacional e internacional.
© Laura Laguna Cruañes
Primera edición, 2013
© de la presente edición: Editorial Universitat Politècnica de València www.editorial.upv.es ISBN: 978-84-9048-067-0 (versión impresa) Queda prohibida la reproducción, distribución, comercialización, transformación, y en general, cualquier otra forma de explotación, por cualquier procedimiento, de todo o parte de los contenidos de esta obra sin autorización expresa y por escrito de sus autores.
Dña. Ana Salvador Alcaraz, Investigadora Científica y Dña. Teresa Sanz
Taberner, Científica Titular, ambas del Instituto de Agroquímica y Tecnología
de Alimentos del Consejo Superior de Investigaciones Científicas (IATA-CSIC),
HACEN CONSTAR QUE:
el trabajo de investigación titulado “Reformulación de galletas de masa corta: cambios en reología, textura y propiedades sensoriales” que
presenta Dña. Laura Laguna Cruañes por la Universidad Politécnica de
Valencia, ha sido realizado en el instituto de Agroquímica y Tecnología de
Alimentos (IATA-CSIC) bajo nuestra dirección y que reúne las condiciones para
optar al grado de Doctor.
Valencia, abril de 2013.
Fdo.: Dra. Ana Salvador Alcaraz. Fdo.: Dra.Teresa Sanz Taberner.


Contra viento y marea,
a los que fueron pirata

AGRADECIMIENTOS
Es maravilloso finalizar una etapa de mi vida y estar agradecida a un sinfín de
personas.
A mis tutoras de tesis que me han apoyado tanto a lo largo de estos años. Ana
Salvador, por haber sido mi amiga y jefecilla, por ser tan práctica y resuelta, por
haberme ayudado con el análisis de datos y con mi vida personal. A Teresa
Sanz, muchas gracias por todo, por escucharme, ayudarme y por supuesto por,
introducirme en el mundo de la reología.
A Susana Fiszman, por estar ahí, por preocuparse siempre por mí, escribirme
durante mis estancias y seguir paso a paso los míos. Espero que sigamos
yendo a ver muchos musicales juntas.
A Paula Varela, por su conocimiento y apoyo en el área de Análisis Sensorial.,
y por aportarme una perspectiva diferente la vida. Amparo Tárrega, ha sido un
honor haber estado contigo en el mismo grupo, muchas gracias por todas tus
explicaciones y preguntas, por tu ética científica y profesionalidad, y sobre todo
por la paciencia y dedicación ofrecidas.
A todas las que han sido mis compañeras de laboratorio y amigas. Sandra
Martínez, muchas gracias por toda tu ayuda práctica y logística; espero que
todos tus deseos en la vida se cumplan. Paula Tarancón, ha sido un regalo
conocerte y ser amiga tuya, tu sola presencia ya me hace estar de buen humor.
Elizabeth Carrillo, haces que los viajes se conviertan en inolvidables, elevas la
categoría de todo lo que te rodea, te voy a echar muchísimo de menos. Ángela
Albert, te cogí cariño desde el primer momento, fuiste la compañera ideal
desde el inicio hasta el fin. A Alejandra Agudelo, no sólo te aprecio por lo
extremadamente bien que cocinas, gracias por preocuparte por mí y por todas
en todo momento. A Gabriela van Beest, porque eres una persona admirable.
Es tan simple como que todas vosotras, cada día, me habéis hecho sonreír al
pensar que tengo que ir al IATA.
A mis “chiquillas” que me han ayudado en parte del experimental, Noelia y
Virginia.
Gracias al panel de catadores entrenados, sin ellos, esta tesis estaría coja.
A mis compañeras y amigas de doctorado, Rossana Altamirano y Eleonora
Harries, porque hemos recorrido juntas un largo trayecto.
To every single person who did my short stays unforgettable.
Thank you to Sarab Sahi (Campden BRI) for answering day after day all my
questions. Albert Jurgens (TNO, Zeist), I consider you one of the most
intelligent person of this world, really thank you for trying to transmit me some
knowledge. Katleen Vallons, thank you for had been beside me and made me
feel at home. Thank you also to Richard Mattes (Purdue University) to give me
the opportunity to work in your lab with incredible people. I feel especially
grateful to Robin Tucker, for flying beside me.
Really thank you to Holly Blackman for your friendship, for teaching me the
apple Charlotte, for your English assistance and just for being Holly.
A Carlos Gracia (TA Instruments), por ser tan paciente en mis múltiples dudas
de reología y DSC.
A todos mis amigos de fuera del IATA con los que he pasado momentos
inolvidables y me han hecho realmente feliz, a la “chupipandi”. A mi compi de
baile, Vicent Benavent, por poder compartir mi afición por el swing; a mis
amigos de Vichy, en especial a María Guixeres; a mis amigos de Cambridge, a
los que tengo en gran estima y consideración, especialmente a Lluis Rubio,
porque me encantó tu visita a Holanda y a Laura Asensi. A Luis Marco, por
todos los momentos. A todas las personas que me han acompañado durante
mis años en la universidad, sobre todo en los años más difíciles, muchas
gracias Ana Torres y Merche Sotos. A todos vosotros por ser mi apoyo y dar
alegría a cada segundo de mis días.
A Consuelo Iborra, por caminar a mi lado cuando más lo he necesitado.

A las amigas con las que llevo juntas toda mi vida y forman parte muy
importante de ella, Ana y Alba. Muchas gracias Ani por ayudarme en el diseño
de la tapa.
A mis hermanos con los que me siento tan unida; Irene, por estar
sosteniéndome siempre y a Manuel por ser tan optimista y feliz.
A mis padres, por estar ahí y porque les quiero incondicionalmente.
¡Gracias, gracias!

RESUMEN
REFORMULACIÓN DE GALLETAS DE MASA CORTA: CAMBIOS EN
REOLOGÍA, TEXTURA Y PROPIEDADES SENSORIALES
El presente trabajo de tesis se ha centrado en la evaluación de las propiedades
físicas y sensoriales de galletas tras su reformulación con nuevos ingredientes
para crear productos más saludables utilizando técnicas reológicas, texturales y
sensoriales.
La formulación de galleta consta de tres ingredientes fundamentales: harina,
grasa y azúcar. Dada la demanda actual de los consumidores de alimentos
saludables, el reemplazo de grasa y azúcar así como la incorporación de fibra
en las galletas resulta de gran interés. Sin embargo, esta reformulación afecta
significativamente a las propiedades de las galletas. En esta tesis mediante la
aplicación de técnicas físicas y sensoriales se estudia la funcionalidad de los
ingredientes básicos y de nuevos ingredientes con la finalidad de seleccionar el
ingrediente óptimo que permita reformular obteniendo una galleta final de la
máxima calidad y aceptación sensorial.
Las propiedades de viscoelasticidad lineal de la masa pudieron predecir
aspectos de calidad tras el horneado como las dimensiones y la textura. Los
ingredientes fuente de fibra utilizados son el almidón resistente, la fibra de
manzana y la fibra de trigo. El almidón resistente confirió dureza a la masa
mientras que las galletas resultaron más blandas, la fibra de trigo aumentó la
resistencia a la deformación en la masa y la galleta, mientras que la
incorporación de fibra de manzana no modificó significativamente las
propiedades de la masa y galleta. El análisis sensorial descriptivo concluyó que
la fibra que menos afectó a las propiedades físicas de la galleta fue la fibra de
manzana, a pesar de que el color y aroma en el caso de la utilización de
almidón resistente y fibra de trigo cambiaba menos respecto a la galleta control.
El estudio de la trayectoria oral de las galletas se realizó utilizando una técnica
sensorial especializada denominada “predominio temporal de las sensaciones”.
Se estudiaron galletas altas y bajas en grasa y con y sin adición de fibra de
trigo. Se obtuvieron los atributos clave en el procesado oral. Se concluyó que el
grado de dominancia de algunos de los atributos obtenidos podrían influir
negativamente en la aceptabilidad por parte de los consumidores como ocurre
en el caso de la sensación de sequedad bucal y dureza.
La reformulación de la galleta influyó en las propiedades de textura y el sonido
emitido durante la fractura. El sonido emitido al romper las galletas y las curvas
de fuerza-desplazamiento se relacionaron con los atributos y puntuación
obtenidos mediante el análisis sensorial cuali y cuantitativo. Se observó que la
utilización de inulina como reemplazante de la sacarosa proporcionó mejores
resultados que el eritritol. La utilización de inulina como reemplazante de grasa
también proporcionó características de textura y sonido similares a la galleta
control, sin embargo, la utilización de hidroxipropilmetilcelulosa como
reemplazante de grasa proporcionó galletas más duras y sonoras que la galleta
control.
Un estudio más profundo de la funcionalidad del azúcar en galletas permitió
dilucidar que el maltitol es un excelente reemplazante de la sacarosa en
galletas. Para ello se estudiaron las diferentes interacciones de los
componentes de las galletas con los diferentes azúcares empleados (sacarosa,
eritritol y maltitol) en un sistema modelo, en la masa y en la galleta. Mediante
técnicas de calorimetría diferencial se concluyó que los polioles (eritritol y
maltitol) actúan plastificando el gluten modificando así su temperatura de
transición vítrea. Las propiedades de la masa y la galleta al sustituir con eritritol
se asemejan más a la masa y a la galleta que no contienen sacarosa, mientras
que el maltitol presentó un comportamiento reológico y una textura similar a la
sacarosa.
RESUM
REFORMULACIÓ DE GALLETES DE MASSA CURTA: CANVIS EN REOLOGÍA, TEXTURA I PROPIETATS SENSORIALS
El present treball de tesi s'ha centrat en l'avaluació de les propietats físiques i
sensorials de galletes després de la seua reformulació amb nous ingredients
per a crear productes més saludables utilitzant tècniques reológiques,
texturales i sensorials.
La formulació de galleta consta de tres ingredients fonamentals: farina, greix i
sucre. Donada la demanda actual dels consumidors d'aliments saludables, el
reemplaçament de greix i sucre així com la incorporació de fibra en les galletes
resulta de gran interès. No obstant això, esta reformulació afecta
significativament les propietats de les galletes. En esta tesi per mitjà de
l'aplicació de tècniques físiques i sensorials s'estudia la funcionalitat dels
ingredients bàsics i de nous ingredients amb la finalitat de seleccionar
l'ingredient òptim que permeta reformular obtenint una galleta final de la
màxima qualitat i acceptació sensorial.
Les propietats de viscoelasticidad lineal de la massa van poder predir aspectes
de qualitat després de l'enfornat com les dimensions i la textura. Els ingredients
font de fibra utilitzats són el midó resistent, la fibra de poma i la fibra de blat. El
midó resistent va conferir duresa a la massa mentres que les galletes van
resultar més blanes, la fibra de blat va augmentar la resistència a la deformació
en la massa i la galleta, mentres que la incorporació de fibra de poma no va
modificar significativament les propietats de la massa i galleta. L'anàlisi
sensorial descriptiu va concloure que la fibra que menys va afectar les
propietats físiques de la galleta va ser la fibra de poma, a pesar que el color i
aroma en el cas de la utilització de midó resistent i fibra de blat canviava menys
respecte a la galleta control.
L'estudi de la trajectòria oral de les galletes es va realitzar utilitzant una tècnica
sensorial especialitzada denominada 'predomini temporal de les sensacions'.
Es van estudiar galletes altes i baixes en greix i amb i sense addició de fibra de
blat. Es van obtindre els atributs clau en el processat oral. Es va concloure que
el grau de dominància d'alguns dels atributs obtinguts podrien influir
negativament en l'acceptabilitat per part dels consumidors com ocorre en el cas
de la sensació de sequedat bucal i duresa.
La reformulació de la galleta va influir en les propietats de textura i el so emés
durant la fractura. El so emés al trencar les galletes i les corbes de força-
desplaçament es van relacionar amb els atributs i puntuació obtinguts per mitjà
de l'anàlisi sensorial quali i quantitatiu. Es va observar que la utilització d'inulina
com reemplaçant de la sacarosa va proporcionar millors resultats que l'eritritol.
La utilització d'inulina com reemplaçant de greix també va proporcionar
característiques de textura i so semblants a la galleta control, no obstant això,
la utilització de hidroxipropilmetilcelulosa com reemplaçant de greix va
proporcionar galletes més dures i sonores que la galleta control.
Un estudi més profund de la funcionalitat del sucre en galletes va permetre
dilucidar que el maltitol és un excel·lent reemplaçant de la sacarosa en galletes.
Per a això es van estudiar les diferents interaccions dels components de les
galletes amb els diferents sucres empleats (sacarosa, eritritol i maltitol) en un
sistema model, en la massa i en la galleta. Per mitjà de tècniques de
calorimetria diferencial es va concloure que els poliols (eritritol i maltitol) actuen
plastificant el gluten modificant així la seua temperatura de transició vítria. Les
propietats de la massa i la galleta al substituir amb eritritol s'assemblen més a
la massa i a la galleta que no contenen sacarosa, mentres que el maltitol va
presentar un comportament reològic i una textura semblant a la sacarosa.
SUMMARY
SHORT-DOUGH BISCUIT REFORMULATION: CHANGES IN RHEOLOGY,
TEXTURE AND SENSORY PROPERTIES
This thesis work has focused on the evaluation of physical and sensory
properties of biscuits after reformulation with new ingredients to create healthier
products using rheological, textural and sensory techniques.
The biscuit formulation consists of three basic ingredients: flour, fat and sugar.
Currently, consumers demand healthy food. For that, fat and sugar replacement
and the inclusion of fiber in the biscuits is of great interest. However, this
reformulation significantly affects the properties of the biscuits. The functionality
of the common and new ingredients was studied by physical and sensory
techniques. After that, the optimal ingredient was selected for obtaining
healthier biscuits.
The linear viscoelastic properties of the dough could predict quality aspects
after baking as the dimensions and texture. The ingredients used as source of
fiber were: resistant starch, apple fiber and wheat fiber. Resistant starch
conferred to the dough hardness while the biscuits were softer, wheat fiber
increased resistance to deformation in the dough and in the biscuit, while the
apple fiber incorporation not significantly change the properties of dough or
biscuit. The descriptive sensory analysis concluded that fiber least affecting the
physical properties of the biscuit was apple fiber, although the color and flavor
in the case of the use of resistant starch and wheat fiber were more similar to
the control biscuit.
The study of oral path of biscuits was performed using a specialized sensory
technique called “Temporal dominance of sensations”. Biscuits were studied
with high and low fat content and with and without addition of wheat fiber. Key
attributes were obtained in oral processing. It was concluded that the degree of

dominance of some of the attributes obtained may adversely affect the
acceptability by consumers as in the case of the sensation of dry mouth and
hardness.
The reformulation of the biscuit influenced the textural properties and the sound
emitted during fracture. The sound emitted by breaking biscuits and force-
displacement curves related to the attributes and score obtained by qualitative
and quantitative sensory testing. It was observed that the use of inulin as a
replacement for sucrose gave better results than erythritol. The use of inulin as
fat replacer also provided texture characteristics similar to the biscuit sound
control, however, the use of hydroxypropylmethylcellulose as fat replacer
provided biscuits and sound harder than the control biscuit.
A deeper study of the sugar biscuit functionality allowed elucidate that maltitol is
an excellent replacement for sucrose in biscuits. The interactions of different
components with different sugars biscuits (sucrose, erythritol and maltitol) in a
model system, and the biscuit dough were studied. Using techniques of
differential calorimetry was concluded that the polyols (erythritol and maltitol)
act plasticizing gluten thus modifying its glass transition temperature. The
properties of the biscuits with erythritol were more similar to those without any
kind of sugar, however, maltitol biscuits showed similar rheological and texture
similar to sucrose.
ÍNDICE
Introducción 1
Objetivos 37
Estructura 41
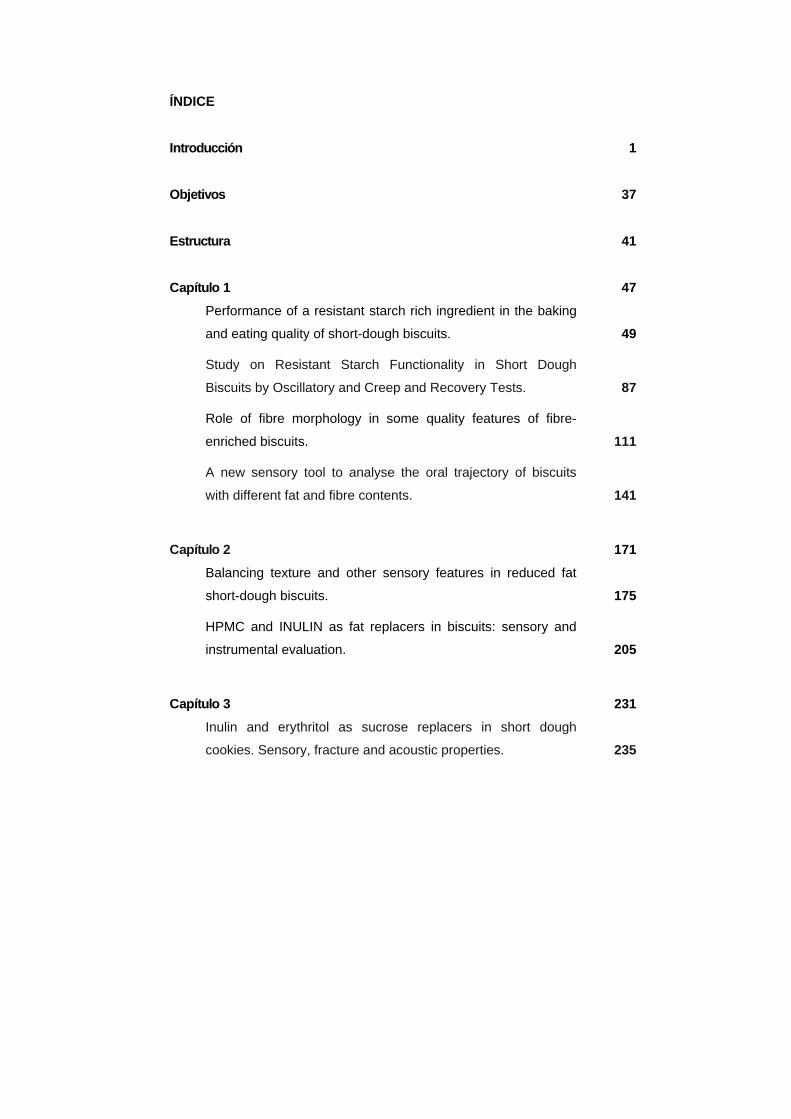
Capítulo 1 47
Performance of a resistant starch rich ingredient in the baking
and eating quality of short-dough biscuits. 49
Study on Resistant Starch Functionality in Short Dough
Biscuits by Oscillatory and Creep and Recovery Tests. 87
Role of fibre morphology in some quality features of fibre-
enriched biscuits. 111
A new sensory tool to analyse the oral trajectory of biscuits
with different fat and fibre contents. 141
Capítulo 2 171
Balancing texture and other sensory features in reduced fat
short-dough biscuits. 175
HPMC and INULIN as fat replacers in biscuits: sensory and
instrumental evaluation. 205
Capítulo 3 231
Inulin and erythritol as sucrose replacers in short dough
cookies. Sensory, fracture and acoustic properties. 235

Understanding the effect of sugar and sugar replacement in
short dough biscuits. 259
Resumen y discusión de los resultados 293
Conclusiones 303

INTRODUCCIÓN

INTRODUCCIÓN
3
INTRODUCCIÓN
1. Definición y clasificación de galletas
Según el Real Decreto 1124 (1982) se entiende por “galletas” los productos
alimenticios elaborados por una mezcla de harina, grasas comestibles y agua,
adicionada o no de azúcares y de otros productos alimenticios o alimentarios
(aditivos, aromas, condimentos, especias, etc.) sometidos a un proceso de
amasado y al posterior tratamiento térmico, dando lugar a un producto de
presentación muy variada, caracterizado por su bajo contenido en agua.
Las galletas se diferencian de otros productos derivados de cereales en base a
su contenido en agua. En general, se reconoce que las galletas poseen un
contenido en agua inferior al 5%, a diferencia de otros productos horneados
como el pan que posee un 35-40% de humedad o los bizcochos con un 15-
30% de humedad (Wade, 1988).
La legislación española (Real Decreto 1124 (1982)) clasifica las galletas dentro
de los siguientes grupos:
- Marías, tostadas y troqueladas.
- Cracker y de aperitivo.
- Barquillos con o sin relleno.
- Bizcochos secos y blandos.
- Sandwiches.
- Pastas blandas y duras.
- Bañadas con aceite vegetal.
- Recubiertas de chocolate.
- Surtidos.
- Elaboraciones complementarias.
INTRODUCCIÓN
4
Según Manley (1991) las galletas se pueden clasificar en base a la textura o
dureza del producto final, al cambio de forma en el horno, a la extensibilidad de
la masa, o a las diferentes formas de tratar la masa.
Otra clasificación (Wade, 1988) distingue entre dos tipos fundamentales de
galletas: “de masa dura” (hard dough) y “de masa corta” (short dough), siendo
una de las diferencias fundamentales entre estos dos tipos de galletas la
existencia o no de largas cadenas de gluten que confieren a la masa
extensibilidad (Manley, 1991). Cuando el gluten está desarrollado, la masa
presenta un comportamiento viscoelástico dando lugar a masas duras, sin
embargo, cuando la cantidad de grasa y azúcar es alta, el gluten no se puede
desarrollar completamente y la masa se queda corta. Además, las galletas de
masa corta aumentan su tamaño (spread o esparcimiento) durante los primeros
estadios del proceso de horneado, mientras que las galletas de masa dura
tienden a encoger longitudinalmente (Manley, 1991).
En España, las galletas de masa corta son más conocidas como “pastas de té”
y en el Reino Unido como short dough biscuit. Este tipo de galleta se
caracteriza por ser rica en grasa y azúcar con la presencia de pequeñas
cantidades de agua, por lo que la masa no es elástica y rompe fácilmente bajo
tensión (Manley, 1991).

INTRODUCCIÓN
5
2. Proceso de elaboración de galletas
La masa es el estado intermedio entre la harina y el producto terminado (Sai
Manohar y Haridas Rao, 1999a). La calidad de la masa queda determinada por
la cantidad y calidad de los ingredientes empleados. Cada masa tiene unas
cualidades particulares de consistencia, elasticidad, resilencia y moldeabilidad.
Al igual que existen numerosas formulaciones de galletas, también existen
diversos procesos para formar la masa de galleta. En las galletas de masa
corta el objetivo fundamental durante el amasado es que el gluten se desarrolle
lo mínimo aunque debe lograrse la dispersión adecuada de los ingredientes
(Baltsavias y col., 1999a). Hay fundamentalmente dos procesos de amasado:
- Método simple (single-method), donde se mezclan todos los ingredientes en
una sola etapa (Pareyt y Delcour, 2008a).
- Método de punto pomada (creaming-method), donde primero se mezcla la
mantequilla con el azúcar y los ingredientes minoritarios hasta alcanzar lo que
se conoce en pastelería como “punto pomada” (cream-up) y, posteriormente,
se añade el resto de ingredientes (Pareyt y Delcour, 2008a). En este caso, la
grasa se combina con el azúcar ayudando a atrapar el aire. De hecho, la grasa
envuelve individualmente los granos de azúcar impidiendo que se agreguen
entre sí y formen terrones. Si no fuera así, cuando el azúcar se fundiese
volvería a recristalizar formando partículas de mayor tamaño (Hutchinson,
1978). Esta etapa es determinante en la formación de la estructura del producto
terminado y en la densidad de la masa.
Durante el amasado, la energía impartida a la masa ha de ser menor que la
típicamente utilizada para el pan u otros productos de panadería, con el fin de
evitar el desarrollo del gluten ya que la masa de galleta necesita tener buena
extensibilidad, baja elasticidad y baja resistencia a la deformación (Cauvain y
Young, 2006).
INTRODUCCIÓN
6
El tiempo de amasado también afecta a la masa, haciéndola más deformable,
pero también puede afectar al gluten ayudándolo a desarrollarse (Baltsavias y
col., 1999b).
Según Pareyt y col. (2008a), la distribución de los ingredientes dentro de la
masa de galleta dependerá de la formulación empleada. De tal forma que si la
concentración de grasa es alta, respondería al modelo propuesto por Baltsavias
y Jurgens (1997a), donde la masa es un sistema bifásico compuesto por una
fase grasa y una fase no grasa formada por una solución saturada de azúcar
que envuelve las partículas de harina/gluten. Por otro lado, si el contenido en
grasa es bajo, representaría el modelo presentado por Chevallier y col. (2000a)
donde la masa de galleta es una suspensión de proteínas, complejos almidón-
proteína y gránulos aislados de almidón en una fase líquida continua basada en
una emulsión de lípidos en una solución concentrada de azúcar.
Durante el periodo de espera entre el amasado y el laminado de galletas
ocurren numerosos cambios en la masa (Wade, 1988). Las galletas de masa
corta cambian su consistencia en esta etapa. Aparentemente, parece que la
masa se seca, pero los cambios que ocurren se deben a la lenta absorción del
agua libre por los componentes hidrofílicos, como son la proteína y el almidón
de la harina (Pareyt y col., 2008a). Con un tiempo de espera de alrededor de
30 minutos, la masa se estabiliza y se reducen las diferencias entre un lote y
otro (Manley, 2000).
Posteriormente, la masa se lamina. Durante este proceso se recomienda girar
la masa 90º cada vez que se lamina para evitar la obtención de galletas de
forma ovalada tras el horneado, ya que el gluten se alinea en la dirección del
laminado (Fustier y col.,2008), por lo que la longitud de la galleta disminuirá
sólo en la dirección de la laminación mientras que la anchura aumentará
(Thacker, 1993).
En el proceso de horneado se producen numerosos cambios que modifican
radicalmente la estructura de la galleta como son la desnaturalización proteica,
la fusión de la grasa, las reacciones de Maillard, la evaporación del agua y la

INTRODUCCIÓN
7
expansión de los gases generados (Chevallier y col., 2002). Esto se traduce en
tres variaciones importantes. En primer lugar la disminución de la densidad del
producto unida al desarrollo de una textura abierta y porosa. Posteriormente la
reducción del nivel de humedad hasta 1-4% y finalemente un cambio en la
coloración de la superficie (Manley, 2000).
Durante el horneado existe un solapamiento de procesos (Manley, 2000). La
grasa es lo primero que funde y da a la masa un carácter plástico (Pareyt y col.,
2008a); de hecho, las masas con mayor cantidad de grasa fundida durante la
cocción se esparcirán más (Hoseney, 1994), retrasando por otra parte la acción
de los agentes leudantes que liberarán gases y se expandirán. La expansión
viene seguida de un colapso (Chevallier y col., 2000b), que marcará el diámetro
final de la galleta. El almidón y las proteínas también sufren un proceso de
calentamiento hinchándose y, en algunos casos, sufriendo una
desnaturalización. También el agua presente en la masa se evapora
contribuyendo a la expansión. La pérdida de humedad en la superficie de la
galleta está relacionada con la temperatura en superficie. El azúcar contribuye
a disminuir la viscosidad de la masa (Manley, 2000) y forma una estructura de
masa no coagulada al subir la temperatura (al contrario que ocurre en otras
masas como la de pan), por lo que durante la cocción la masa se convierte en
una estructura de matriz azucarada.
El final del horneado se define por dos hechos: el color y el contenido en
humedad, que están relacionados entre sí y se determinan muchas veces por
un examen visual y determinación de la humedad, respectivamente (Wade,
1988).
Posteriormente al horneado, las galletas necesitan enfriarse para terminar de
perder humedad y de estructurarse la matriz (Manley, 2000). De hecho, Burt y
Fearn (1983) concluyeron mediante un análisis estereológico que la distribución
de los componentes mayoritarios (grasa, proteína y almidón) era
completamente homogénea en la galleta después de este enfriamiento.
INTRODUCCIÓN
8
3. Ingredientes de las galletas
3.1. Ingredientes mayoritarios
3.1.1. Harina
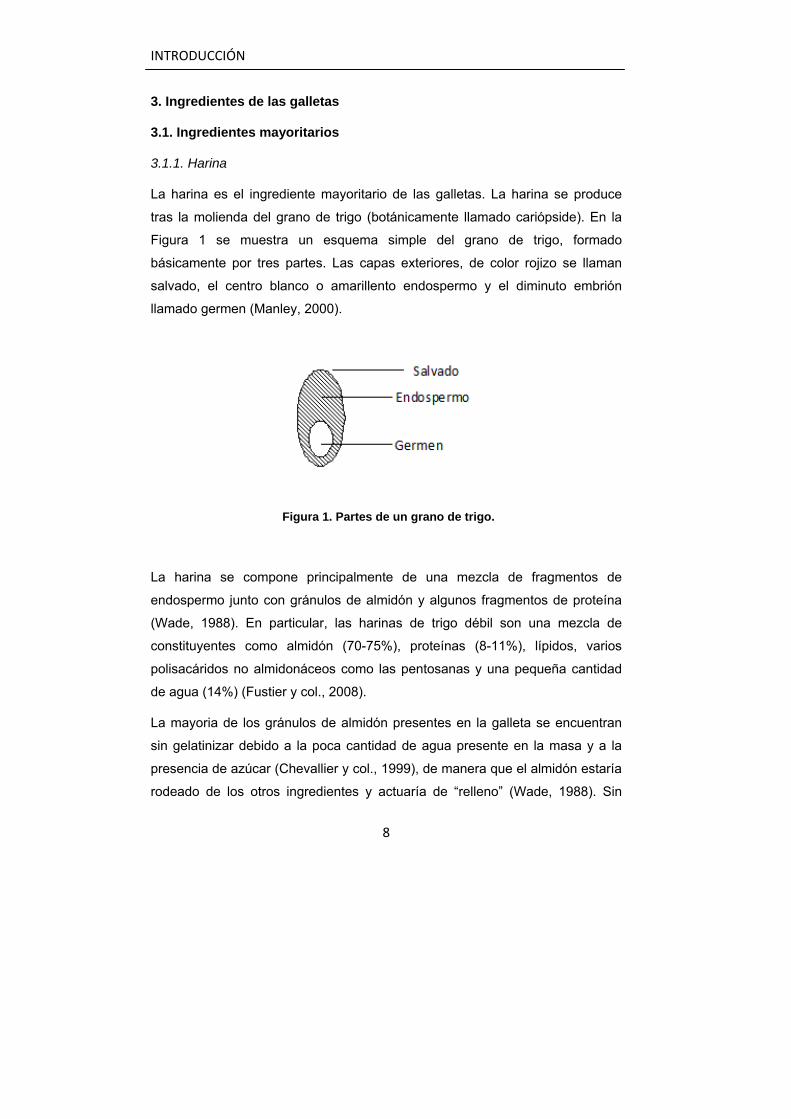
La harina es el ingrediente mayoritario de las galletas. La harina se produce
tras la molienda del grano de trigo (botánicamente llamado cariópside). En la
Figura 1 se muestra un esquema simple del grano de trigo, formado
básicamente por tres partes. Las capas exteriores, de color rojizo se llaman
salvado, el centro blanco o amarillento endospermo y el diminuto embrión
llamado germen (Manley, 2000).
Figura 1. Partes de un grano de trigo.
La harina se compone principalmente de una mezcla de fragmentos de
endospermo junto con gránulos de almidón y algunos fragmentos de proteína
(Wade, 1988). En particular, las harinas de trigo débil son una mezcla de
constituyentes como almidón (70-75%), proteínas (8-11%), lípidos, varios
polisacáridos no almidonáceos como las pentosanas y una pequeña cantidad
de agua (14%) (Fustier y col., 2008).
La mayoria de los gránulos de almidón presentes en la galleta se encuentran
sin gelatinizar debido a la poca cantidad de agua presente en la masa y a la
presencia de azúcar (Chevallier y col., 1999), de manera que el almidón estaría
rodeado de los otros ingredientes y actuaría de “relleno” (Wade, 1988). Sin
INTRODUCCIÓN
9
embargo, este hecho no es homogéneo en toda la galleta. Chevallier y col.
(2000a) afirmaron que el almidón está más hidrolizado en el centro que en la
periferia y superficie de la galleta donde el gránulo se mantiene intacto y
guarda su birrefringencia.
La proteína más importante de la harina es el gluten. Como ya se ha
comentado, el contenido en gluten de las harinas utilizadas en la industria
galletera es bajo (7-9%) (HadiNezhan y Butler, 2009). Una proporción
adecuada de agua y harina, como ocurre en la fabricación de pan, hace que el
gluten forme una masa viscoelástica (Pareyt y col., 2008a). Sin embargo, en el
caso de las galletas de masa corta, donde hay poca cantidad de agua y
sustancias que interfieren como la grasa o el azúcar, el gluten no es capaz de
hidratarse (Gaines, 1990). Aun así, la presencia de gluten es uno de los
factores que más afecta al diámetro de las galletas. De hecho, en la galleta el
contenido en gluten se relaciona con el diámetro final de la misma, de tal forma
que el diámetro de las galletas disminuye conforme aumenta el contenido de
gluten (Pareyt y col., 2008b; Kaldy y col., 1993).
3.1.2. Grasa
La grasa es un ingrediente esencial en la fabricación de galletas y tras la harina
es el segundo componente mayoritario en la formulación de la galleta (Sai
Manohar y Haridas Rao, 1999b). El uso de grasa en la masa de galleta hace
que la cantidad de agua necesaria para hacer la masa sea pequeña (Wade,
1988; Sai Manohar y Haridas Rao, 1999b), siendo la grasa el ingrediente
responsable de la unión de todos los ingredientes (Pareyt y col., 2008a).
Durante el amasado, la grasa actúa como lubricante y rodea la superficie de la
harina inhibiendo la creación de una red cohesiva y extensible de gluten
(Wade, 1988); además, la grasa presente en la masa de galleta rodea también
los gránulos de almidón, rompe la continuidad de la estructura proteína-almidón
(Ghotra y col., 2002) y afecta a la textura de la masa, de forma que la masa es
menos elástica y no se encoge tras su laminación (Baltsavias, 1997b; Maache-
Rezzonug y col., 1998). Por tanto, la grasa influye en el diámetro y en las
INTRODUCCIÓN
10
propiedades finales de textura de las galletas (Pareyt y col., 2009a), confiere a
la galleta humedad y aumenta la fragilidad de la galleta (Maage-Rezzoug y col.,
1998).
El preparado de grasa utilizado en la fabricación de galletas suele contener un
78% de materia grasa compuesta por grasa vegetal, aceites vegetales y
aceites vegetales hidrogenados, aunque también contiene emulgentes (lecitina,
mono y diglicéridos de ácidos grasos) que actúan rompiendo la grasa en
partículas muy pequeñas (Oreopoulu, 2006). En la industria se le acuna con el
nombre de “shortening” debido a que su adición inhibe la formación de una
masa elástica, acortándola, de ahí que en inglés se traduzca como “short”,
confiriéndole ciertas propiedades texturales al producto final (Pareyt y col.,
2008a).
3.1.3. Azúcar
El azúcar mayoritariamente empleado en la elaboración de galletas es la
sacarosa en forma cristalina, que es un disacárido no reductor (α-D-
glucopiranosil-(1→2)-β-D-fructofuranosa).
Desde el punto de vista sensorial, el azúcar en las galletas afecta al gusto,
color, dimensiones, dureza y superficie de la galleta (Gallagher y col., 2003).
Además, la cantidad y el tipo de azúcar influyen durante todo el proceso, desde
el amasado hasta el envasado. En el proceso de mezclado de ingredientes, el
azúcar compite con la harina por el agua inhibiendo la formación de gluten
(Gallagher y col., 2003) y afectando, por tanto, a la consistencia de la masa
(Olewnik y Kulp, 1984; Slade y Levine, 1994), que es fundamental en el
momento del laminado y corte. Durante el horneado, el azúcar también influye
en la gelatinización del almidón (Spies y Hoseney, 1982), en las reacciones de
pardeamiento (Kulp y col., 1991), en la movilidad del gluten (Pareyt y col.,
2009a), en la expansión de la galleta y en el carácter crujiente (Kulp y col.,
1991). En el horneado no hay suficiente agua para disolver el azúcar añadido
(Manley, 2000; Pareyt y col., 2008a), ya que el calor no se distribuye
homogéneamente en toda la masa de galleta, de forma que los gránulos de
INTRODUCCIÓN
11
azúcar en el centro de la galleta se pueden observar en forma amorfa y en
forma cristalina, mientras que los gránulos de azúcar en la superficie
únicamente están en forma cristalina debido a que en la superficie el agua se
evapora rápidamente durante el proceso de horneado (Chevallier y col. 2000a).
3.2. Ingredientes minoritarios de las galletas
3.2.1. Agua
El agua es un ingrediente clave durante el proceso de fabricación de las
galletas a pesar de ser un ingrediente minoritario en el proceso de fabricación y
ser casi totalmente eliminado durante el horneado (Pareyt y col., 2008a).
En la galleta el agua actúa como plastificante y disolvente, además influye en la
viscosidad de la masa y en la textura una vez horneada. En la primera parte del
amasado el agua actúa disolviendo algunos de los ingredientes llegando a
dispersarse en la grasa, por eso la mezcla de la masa final tiene un color crema
claro y una consistencia blanda, de ahí el nombre de “punto pomada” (Wade,
1988).
La cantidad de agua influye en la consistencia final de la galleta, de forma que,
las galletas con una baja humedad son más frágiles, y a medida que se
aumenta la cantidad de agua, el punto de fractura de la galleta disminuye,
revelando una mayor elasticidad y deformabilidad (Baltsavias et al, 1999a). Por
otra parte, el aumento en la cantidad de agua se ha asociado a masas más
cohesivas y adhesivas dando lugar a galletas más duras (Sai Manohar y
Haridas Rao,1999a).
3.2.2. Sal
El contenido en sodio de la sal utilizada mejora las propiedades sensoriales al
disminuir el sabor amargo y aumentar el dulzor (Keast y col., 2003). Su
concentración más eficaz en las galletas es de 1-1,5% del peso de la harina, ya
que a niveles superiores a 2,5% se hace desagradable al gusto (Manley, 2000).
INTRODUCCIÓN
12
3.2.3. Leche en polvo
La leche contribuye en la textura, gusto, color de la superficie y aporta un valor
nutricional extra. La presencia de aminoácidos provenientes de la leche
favorece las reacciones de pardeamiento durante el horneado, contribuyendo a
la obtención del color y el aroma deseados (Wade, 1988).
Actualmente la mayoría de la leche utilizada es en polvo dada su facilidad de
manejo y bajo contenido en humedad que prolonga su vida útil (Manley, 2000).
3.2.4. Agentes leudantes
Bicarbonato sódico (CO3HNa)
En presencia de humedad, el bicarbonato reacciona con el agua produciendo
anhídrido carbónico al formarse sal sódica y agua. Al calentarse, el bicarbonato
libera algo de dióxido de carbono y permanece como carbonato sódico,
actuando como agente esponjante, además controla el pH que puede afectar
en el esparcimiento de la masa y en el color de la galleta (Manley, 2000).
Bicarbonato amónico (CO3(NH4))
El bicarbonato amónico se descompone completamente por el calor
desprendiendo anhídrido carbónico, amoniaco gaseoso y agua. Por tanto, se
disuelve rápidamente produciendo un medio alcalino que hace que la masa sea
muy blanda. Al igual que el bicarbonato sódico, también actúa como agente
esponjante (Manley, 2000).
3.3. Ingredientes utilizados en la reformulación de galletas
El consumidor de hoy en día tiene una gran preocupación por su salud y
bienestar (Berasategi, 2010), por eso, busca alimentos bajos en calorías y
saludables (Baltsavias y col., 1997a).
Existen evidencias científicas que relacionan la ingesta de numerosos
componentes esenciales y no esenciales de la dieta y la prevención de

INTRODUCCIÓN
13
diferentes enfermedades (Milner, 2002). La mayoría de los productos de
panadería se pueden utilizar como vehículo de ingredientes nutricionalmente
saludables (Sudha y col., 2007).
3.3.1. Fibra
El consumo de fibra en los países occidentales es bajo (Baixauli 2008a,
2008b). El interés en alimentos con alto contenido de fibra en las últimas
décadas se ha incrementado, convirtiéndose en alimentos con un amplio
mercado.
La fibra puede definirse como una mezcla compleja de diferentes sustancias de
origen vegetal que son resistentes a la hidrólisis por las enzimas digestivas del
ser humano (Salas-Salvadó y Megias-Rangil, 2004).
La fibra dietética puede clasificarse en soluble e insoluble proveyendo ambas
funciones fisiológicas específicas y beneficios nutricionales. La fibra insoluble
promueve el movimiento de la materia a través del sistema digestivo y la fibra
soluble ayuda a disminuir el colesterol en sangre, así como regular los niveles
de glucosa en sangre (Tosh y Yada, 2010). Ambos tipos de fibra han sido
utilizadas en la fabricación de galletas.
El salvado de cereal como fuente de fibra para reemplazar harina en galletas
ha sido uno de los más utilizados. Numerosos autores han utilizado granos de
cebada en galletas como fuente de fibra (Prentice y col., 1978; Örzturk y col.,
2002). Gujral y col. (2003) reemplazaron parte de la harina de trigo con salvado
de trigo aumentado así la percepción sensorial y disminuyendo la resistencia a
la fractura. Leelavathi y Rao (1993) también reemplazaron la harina de galleta
por fibra cruda y tostada, consiguiendo substituir hasta el 30% sin disminuir la
calidad sensorial de la galleta. Recientemente, Ellouze-Ghorbel y col. (2010)
utilizaron diferentes fuentes de salvado de trigo (Aestivium and Durum) para
enriquecer galletas. Sudha y col. (2007) utilizaron diferentes salvados de
cereales obteniendo buena aceptación las galletas con un de 30% de salvado
de avena en la formulación o 20% de salvado de cebada.
INTRODUCCIÓN
14
Además de salvado de cereales, en el intento de incorporar fibra a las galletas
también ha sido muy popular la utilización de fibra de frutas, como por ejemplo,
la fibra de manzana (Chen y col., 1988), la fibra de plátano (Fasolin y col.,
2007) o la fibra de mango (Ajila y col., 2008). Incluso se han llegado a mezclar
en una misma formulación diversos tipos de fibra: manzana, limón, salvado de
trigo y fibra de trigo (Bilgiçli y col., 2007).
Sin embargo, se conoce bien que los consumidores perciben a menudo la fibra
como un sabor fuerte y desagradable, con una textura gruesa, color oscuro y
con una sensación de sequedad en la boca (Yue y Waring, 1998). Un tipo de
fibra que no produce estos efectos indeseables asociados al empleo de las
fibras tradicionales es el almidón resistente. El almidón resistente tiene un
tamaño de partícula pequeño, lo que evita la textura y densidad propia
asociada a los productos con alto contenido en fibra. Es de color blanco lo que
permite su incorporación sin alterar el color y es de sabor suave. Además,
posee beneficios fisiológicos similares a los de la fibra soluble. El almidón
resistente se define como el almidón y la suma de los productos de
degradación del almidón que no se absorben en el intestino delgado de
individuos sanos (Asp, 1992). Existen cuatro tipos de almidón resistente: tipo I,
es el almidón físicamente inaccesible encontrado de forma natural en los
alimentos; tipo II, es el almidón nativo granular; tipo III, es el almidón
retrogradado o cristalino y tipo IV, es el almidón químicamente modificado
(Champ, 2004).
Aparicio-Sanguilán y col. (2007) utilizaron en galletas un producto rico en
almidón resistente proveniente de banana sin obtener diferencias significativas
de preferencia entre la galleta control y las galletas con almidón resistente.
3.3.2. Sustitutos de grasa
La Comunidad Económica Europea (CEE), en su política de nutrición, sugiere
que únicamente el 20-30% de la energía ingerida debe de ser proveniente de la
grasa (O’Connor, 1992), ya que existen evidencias de que una mayor ingesta
está relacionada con enfermedades coronarias (LaRosa y col., 1990), además
INTRODUCCIÓN
15
de obesidad, cáncer y colesterol alto en sangre (Akoh, 1998). Por eso, la OMS
en 2004 sugirió a la industria alimentaria reducir el contenido graso en los
alimentos con el fin de disminuir la obesidad y los problemas derivados en el
primer mundo.
Los sustitutos de grasa son substancias de origen proteico o hidrocarbonado
que pueden mimetizar las propiedades funcionales y sensoriales de la grasa
pero con un menor contenido calórico (Zoulias y col., 2002a).
Los carbohidratos utilizados como sustitutos de grasa, como los almidones
procesados, imitan la grasa al absorber el agua dando así lubricidad, cuerpo y
una sensación placentera en boca en las galletas y otros productos horneados
(Bath y col., 1992; Nonaka, 1997); además, todos ellos aportan entre 0 y 4
kilocalorías por gramo, es decir menos energía que las grasas (9 Kcal. por
gramo).
Hasta el momento, se han investigado numerosas sustancias como sustitutos
de grasa en galletas como los β-glucanos (Inglett y col., 1994), mezclas de
polidextrosa, monogliceridos y ésteres de ácidos grasos (Campdell y col., 1994,
Sudha y col., 2007), maltodextrinas (Zoulias y col., 2002a, Sudha y col., 2007)
o inulina (Zoulias y col., 2002ab; Zbikowska y col., 2008). Además, existen
otras sustancias como mezclas de dextrinas y almidón, o derivados de
celulosas que pueden ser utilizados potencialmente como sustitutos de grasa
aunque no se han aplicado hasta el momento en galletas.
3.3.3. Sustitutos de azúcar
El alto consumo de azúcar está ligado a desórdenes de la salud como
obesidad, problemas dentales o diabetes tipo II (Pareyt y col., 2009b). La
reducción del azúcar en galletas es una buena manera de obtener un producto
con menos calorías y más saludable (Drewnowski, 1998).
Diversos autores han estudiado el reemplazo de azúcar en galletas utilizando
polioles (Olinger y Velasco, 1996; Zoulias, 2000), azúcares reductores como la
fructosa (Sai Manohar y Haridas Rao, 1997), inulina (Gallagher y col., 2003),
xilosa y glucosa, (Kweon y col., 2009) o arabinoxilano (Pareyt y col., 2011). No

INTRODUCCIÓN
16
obstante, el entendimiento de la depreciación de la calidad al utilizar sustitutos
de azúcar en galletas sigue siendo un reto para la industria.
INTRODUCCIÓN
17
4. Técnicas para evaluar la calidad de galletas 4.1. Reología La palabra reología, etimológicamente, significa estudio del flujo (del griego
reos: fluir y los: tratado, ciencia) y fue definida por Bingham en 1930 como “la
rama de la física cuyo objetivo es el conocimiento fundamental y práctico de la
deformación o flujo de la materia debido a la acción de fuerzas mecánicas
externas” (Hernández y col., 2006).
Desde un punto de vista reológico se puede definir un comportamiento elástico
(característico de los sólidos) y un comportamiento viscoso (característico de
los fluidos) (Hernández y col., 2006). Por su parte el comportamiento
viscoelástico es aquel que se caracteriza por poseer propiedades elásticas y
viscosas simultáneamente. El comportamiento viscoelástico se puede medir
instrumentalmente mediante ensayos reológicos oscilatorios y mediante
ensayos de fluencia/relajación, entre otros.
La reología alimentaria es la extensión de esta disciplina a los productos
alimentarios. De esta forma White (1970) define la reología alimentaria como
“el estudio de la deformación y flujo de los materiales frescos, productos
intermedios y productos finales de la industria alimentaria”.
En masas, el estudio de la reología es importante porque es un producto en
constante cambio (Faubion y Faridi, 1986), es decir, aunque se dejase la masa
reposar transcurrido un tiempo se podrían observar cambios; de igual forma
que cuando se le aplica un proceso, como el laminado, se producen cambios
en la viscoelasticidad de la misma. Por tanto, durante el procesado de las
masas hay que tener en cuenta los valores óptimos de concentraciones de
ingredientes, de tiempo de mezcla ingredientes, de espesor de laminado, etc.,
que es necesario controlar para que la calidad final del producto no se vea
perjudicada (Faubion y Faridi, 1986).
Las propiedades viscoelásticas de la masa de galletas dentro de la zona lineal
han sido estudiadas por numerosos autores. Baltsavias y col. (1997b)
evaluaron las propiedades viscoelásticas lineales de la masa de galletas con
diversas composiciones (variando la cantidad de los ingredientes de la masa:
INTRODUCCIÓN
18
harina, almidón, grasa, azúcar, agua y sal) concluyendo que la grasa y su
estado (líquido o sólido) era un factor fundamental que afectaba a la rigidez y
esparcimiento de la masa. Posteriormente, Papantoniou y col. (2003, 2004)
estudiaron los efectos de los lípidos de la harina y su influencia en la
viscosidad, y encontraron que la harina desgrasada poseía una mayor
viscoelasticidad.
La combinación de ensayos oscilatorios y ensayos de fluencia-relajación en
masa de galletas fue utilizada por Pedersen y col. (2004) para correlacionar la
utilización de harinas de diferentes cultivos con los cambios observados en las
dimensiones de galletas y en la viscoelasticidad de las masas. Posteriormente,
estos autores también estudiaron los cambios en las propiedades
viscoelásticas tras la adición de metasulfito de sodio o proteasas (Pedersen y
col. 2005).
4.2. Textura La textura de los alimentos se define como “la manifestación sensorial y
funcional de la estructura, propiedades mecánicas y de superficie de alimentos
percibidas por los sentidos de la visión, oído, tacto y cinestésicos” (Szczesniak,
2002). De esta definición, se concluye que la textura es una propiedad
sensorial por lo que sólo puede ser juzgada, percibida y descrita por el ser
humano. Sin embargo, instrumentalmente se pueden medir determinados
parámetros físicos que proporcionan información sobre la textura de los
alimentos.
Para los consumidores, la textura junto con el sabor y el color es una de las
propiedades fundamentales que van a influir en la elección de unas galletas u
otras (Mandala y col., 2006). De manera instrumental la textura se mide con un
texturómetro, que es un instrumento desarrollado para medir el comportamiento
mecánico de los alimentos. Se pueden realizar diferentes tipos de ensayos
adaptando células de medida de diferente geometría (Hernández y col., 2006).
Específicamente, para la medida de la textura en galletas se han utilizado
ensayos de punción (Gaines, 1991, Sai Manohar y Haridas Rao, 1997,
INTRODUCCIÓN
19
Mandala y col., 2006), compresión (Sai Manohar, 1999b) y ensayos de flexión y
rotura (Gaines, 1991; Baltsavias y col., 1999c, Saleem y col., 2005).
Además de la importancia de estudiar las propiedades mecánicas de las
galletas, el estudio del sonido producido al romper o ser triturada es crucial
para obtener un mayor entendimiento de la textura de las mismas. El estudio
del sonido de alimentos ha sido estudiado de forma instrumental por varios
científicos en relación con sus propiedades texturales (Drake, 1963, 1965ab;
Drake y Halldin, 1974; Vickers y Bourne, 1976; Vickers y Wasserman, 1979).
Iles y Elson (1972) mostraron que los consumidores clasificaban los productos
en el mismo orden según el sonido emitido y su preferencia. Desde entonces,
la industria alimentaria ha considerado de gran interés el estudio de la emisión
de sonido durante la producción y el almacenamiento (Roudat y col., 2002).
Entender y definir la terminología para describir las sensaciones asociadas a la
emisión de sonido difiere según la lengua utilizada (Varela y col., 2008). De tal
forma que, mientras que para la lengua japonesa existen numerosas
expresiones (Yoshikawa y col., 1970) para la lengua castellana o el inglés son
mucho más reducidas siendo crocante (para el inglés: crunchy) y quebradizo o
crujiente (para el inglés: crispy) las generalmente más utilizadas (Varela y col.,
2008). La diferencia entre estos dos grupos (crocante y crujiente) fue estudiada
por Vickers (1984) que los separó en función de la frecuencia del sonido
emitido. Frecuencias altas (higher pitched sounds) que producían sonidos
agudos se relacionaron con alimentos crujientes (crispy) como, por ejemplo,
una papa y frecuencias bajas (lower pitched sounds) se relacionaban con
alimentos crocantes (crunchy) como, por ejemplo, una almendra.
La caracterización instrumental del sonido se realiza comúnmente mediante la
utilización de un texturómetro y un micrófono acoplado al mismo, sometiendo a
los alimentos a diferentes deformaciones: compresión, flexión o penetración
(Castro-Prada y col., 2007). Esta combinación permite registrar las propiedades
mecánicas y acústicas simultáneamente (Drake, 1963; Vickers, 1976). La
combinación del análisis de fractura y las emisiones acústicas permite una
mayor comprensión del carácter crujiente de los alimentos, de forma que se

INTRODUCCIÓN
20
estudia como es la fractura y que eventos de sonido la acompañan (Castro-
Prada y col., 2007).
4.3. Propiedades térmicas La mayoría de alimentos procesados han sufrido un tratamiento térmico, como
ocurre durante el horneado de las galletas, produciéndose cambios en los
ingredientes y su función, así como interacciones entre ellos.
Para la medida de estos cambios se utilizan técnicas de calorimetría diferencial
de barrido (DSC), donde la muestra y una referencia se calientan de forma
independiente midiéndose la diferencia en el flujo de calor para mantener una
temperatura igual en ambas muestras (Sandoval y col., 2005).
La calorimetría diferencial de barrido ha sido ampliamente utilizada como
técnica para la caracterización de los cambios térmicos asociados al almidón,
los cuales poseen un gran impacto en la textura de los alimentos que lo
contienen (Biliaderis y col., 1983).
La gelatinización del almidón ocurre cuando en exceso de agua se produce un
cambio de un estado semi-cristalino a un estado amorfo (Sandoval y col.,
2005). La determinación de esta entalpía (contenido de calor en un sistema por
unidad de masa) se realiza integrando el área endotérmica del termograma
obtenido (Sahin y Gülüm Sumnu, 2005).
Diversos autores han estudiado la gelatinización del almidón en galletas
(Baltsavias y col., 1999a; Chevallier, 2002) concluyendo que ni la temperatura
alcanzada en la cocción ni la cantidad de agua presente en la formulación es
suficiente para una completa gelatinización del almidón contenido en la harina
de las galletas, encontrándose mayoritariamente almidón sin gelatinizar en la
superficie de las galletas (menor agua disponible) y almidón parcialmente
gelatinizado en el centro de éstas.
Por otra parte, la transición vítrea en los alimentos está siendo estudiada por su
relación con las características fisicoquímicas del alimento. En materiales
complejos la medida de la transición vítrea requiere de un calorímetro
diferencial de barrido con opción de termomodulación, que permite la
INTRODUCCIÓN
21
separación de las diferentes respuestas térmicas obtenidas (Kasapis, 2004). La
transición vítrea es un cambio reversible en la región amorfa de un polímero
desde o hacia una condición gomosa o desde o hacia una condición
relativamente dura o quebradiza. La transición vítrea del gluten y su
dependencia con el contenido en humedad fue observada por DSC por primera
vez en 1984 (Levine y Slade, 1990). Posteriormente, en galletas tipo “crackers”
se relacionó la transición vítrea (supuestamente del gluten) con los cambios en
las propiedades mecánicas y con la pérdida del carácter crujiente (Nikolaidis y
Labuza, 1996).
4.4. Propiedades sensoriales Stone y Sidel (2004) definen el análisis sensorial de los alimentos como “el
método científico usado para evocar, medir, analizar e interpretar las
reacciones a determinadas características de los alimentos tal y como son
percibidos por los sentidos de la vista, olfato, tacto, gusto y oído”.
Existen distintos tipos de pruebas sensoriales en función de la información que
necesitemos obtener. En la reformulación de alimentos resulta imprescindible,
por una parte, conocer los cambios sensoriales producidos por la adición de
nuevos ingredientes realizando pruebas descriptivas (Meilgaard y col., 1991),
así como conocer la aceptación de los nuevos alimentos reformulados por
parte de los consumidores mediante pruebas de aceptación (van Kleef y col.,
2006).
Entre todas las pruebas descriptivas, el análisis cuantitativo descriptivo (QDA,
en sus siglas en inglés) fue desarrollado por Stone y col. (1974) y es una de las
pruebas más utilizadas para caracterizar un producto, aportando una
terminología propia que lo define. En general, el objetivo primordial de dicho
análisis es encontrar un mínimo número de descriptores que contengan un
máximo de información sobre las características sensoriales del producto. Este
análisis se basa en la detección y la descripción de los aspectos sensoriales
cuantitativos por grupos de catadores que han sido entrenados previamente y
han elaborado una terminología estandarizada para describir el producto. Estos
INTRODUCCIÓN
22
jueces o catadores expertos deben dar valores cuantitativos proporcionales a la
intensidad que perciban de cada uno de los atributos evaluados durante el
análisis descriptivo (Stone y Sidel, 2004).
El análisis descriptivo ha sido extensamente empleado en la evaluación de la
dureza, textura o aroma de galletas (Brown y col., 1998; Brown and Braxton,
2000, Burseg y col., 2009) así como en la reformulación de galletas con bajo
contenido en sal y alto contenido en fibra (Vázquez y col., 2009).
Además del QDA, dentro de los ensayos descriptivos, existen diversos
métodos que además incluyen la temporalidad en la masticación del alimento
como el ensayo de Tiempo-Intensidad (Pineau y col., 2009), el ensayo Tiempo-
Intensidad Dual (del inglés “Dual-time Intenstive”) (Duizer y col., 1997) o el
Perfil-Progresivo (Jack y col., 1994).
Un nuevo método sensorial llamado Predominio Temporal de las Sensaciones
(del inglés Temporal Dominance of Sensations, TDS) presenta a los jueces una
lista completa de atributos de los que tienen que eligir la sensación dominante
en cada momento del tiempo de masticación así como su intensidad (Pineau y
col., 2009).
Hasta el momento la técnica TDS se ha utilizado para estudiar la percepción de
algunos vinos (Meillon y col., 2010), bebidas calientes (Le Révérend, 2008) y
productos lácteos líquidos (Pineau y col., 2009). También se han utilizado en
productos sólidos como los copos de trigo (Lenfant y col., 2009) o en nuggets
de pollo (Albert y col., 2012). Hasta el momento la técnica TDS no se ha
aplicado al estudio de la percepción de los diferentes atributos dominantes en
galletas ni otros productos de panadería.
Las pruebas de aceptación se utilizan para medir la evaluación del nivel de
agrado o desagrado de una muestra por los consumidores. Se utiliza una
escala hedónica, siendo una de las más utilizadas la desarrollada por Jones,
Peryam y Thurston (1955). Su principal ventaja es su facilidad de
entendimiento con mínimas instrucciones y su versatilidad para ser usada en

INTRODUCCIÓN
23
numerosos productos (Stone y Sidel, 2004), entre los que se incluyen las
galletas (Larrea y col., 2005, Aparicio-Sanguilán y col., 2007).
La posibilidad de reformular galletas tecnológicamente viables y conducirlas
hacia productos de mayor calidad nutricional, hace necesaria la utilización de
las técnicas expuestas para el análisis de la masa y de la galleta final. Además,
un estudio sensorial de las galletas nos permitirá no únicamente una valoración
de sus propiedades instrumentales, sino de la percepción real de los cambios y
aceptabilidad por el ser humano.
INTRODUCCIÓN
24
BIBLIOGRAFÍA
Akoh, C.C. (1998). Fat replacers. Food Technology 52, 47-53.
Albert, A., Salvador, A., Schlich, P. y Fiszman, S. M. (2012). Comparison between
temporal dominance of sensations (TDS) and key-attribute sensory profiling
for evaluating solid food with contrasting textural layers: Fish sticks. Food
Quality and Preference 24, 111–118.
Ajila, C.M., Leelavathi K. y Prasada Rao, U.J.S. (2008). Improvement of dietary
fiber content and antioxidant properties in soft dough biscuits with the
incorporation of mango peel powder. Journal of Cereal Science 48, 319-
326.
Aparicio-Saguilán, A., Sáyago-Ayerdi, S.G., Vargas-Torres, A., Tovar, J.,
Ascencio-Otero, T.E. y Bello-Pérez, L.A. (2007). Slowly digestible cookies
prepared from resistant starch-rich lintnerized banana starch. Journal of
Food Composition and Analysis 20, 175–181.
Asp, N.G. (1992). Resistant Starch. Proceedings from the 2nd plenary meeting
on EURESTA. Physiological Implications of the Consumption of Resistant
Starch in Man. European Journal of Clinical Nutrition 46, supplement 2, S1-
S148.
Baixauli R., Sanz T., Salvador A., Fiszman S.M. (2008a). Muffins with resistant
starch: Baking performance in relation to therheological properties of the
batter Journal of Cereal Science 47, 502–509
Baixauli, R., Salvador A., Hough G., Fiszman S.M. (2008b). How information
about fibre (traditional and resistant starch) influences consumer
acceptance of muffins. Food Quality and Preference 19, 628–635
Baltsavias, A. y Jurgens, A. (1997a). Factors affecting fracture properties of
Short-dough biscuits. Journal of Texture Studies 28, 205-219.

INTRODUCCIÓN
25
Baltsavias, A., Jurgens, A. y van Vliet T.(1997b). Rheological properties of short
doughs at small deformation. Journal of Cereal Science 26, 289-300.
Baltsavias, A., Jurgens, A. y van Vliet T. (1999a). Fracture Properties of Short-
Dough Biscuits: Effect of Composition Journal of Cereal Science 29,235–
244.
Baltsavias, A., Jurgens, A. y van Vliet, T. (1999b). Large deformation properties
of short doughs: effect of sucrose in relation to mixing time. Journal of
Cereal Science 29, 43-48.
Baltsavias, A., Jurgens, A. y van Vliet, T. (1999c). Properties of short-dough
biscuits in relation to structure. Journal of Cereal Science 29, 245-255.
Bath, D.E., Shelke, K. y Hoseney, R.C.(1992). Fat replacers in high-ratio layer
cakes. Cereal Foods World 37, 495-500.
Berasategi, I., Cuervo, M., Ruiz, de las Eras, A., Santiago, S., Martínez, J.A.,
Astiasarán, I. y Ansorena, D. (2010). The inclusion of functional foods
enriched in fibre, calcium, iodine, fat-soluble vitamins and n-3 fatty acids in
a conventional diet improves the nutrient profile according to the Spanish
reference intake. Public Health Nutrition 14(3), 451-458.
Biliaderis, C.G., Maurice, T.J. y Vose, J.R. (1980). Starch gelatinization
phenomena studied by differential scanning calorimetry. Journal of Food
Science 45, 1669-1674.
Bilgiçli, N., Ibanoglu, S. y Herken, E.N. (2007). Effect of dietary fibre addition on
the selected nutritional properties of cookies. Journal of Food Engineering
78, 86-89.
Brown, W.E., Langley, K.R. y Braxton, D.(1998). Insight into consumers’
assessments of biscuit texture based on mastication analysis-hardness
versus crunchiness. Journal of Texture Studies 29, 481-497.

INTRODUCCIÓN
26
Brown, W.E. y Braxton, D.(2000). Dynamics of food breakdown during eating in
relation to perceptions of texture and preference: a study on biscuit. Food
Quality and Preference 11, 259-267.
Burseg, K., Linfort, R.S.T., Hort, J. y Taylor, A.J. (2009). Flavor perception in
biscuits; correlating sensory properties with composition, aroma release,
and texture. Chemical perception 2, 70-78.
Burt, D.J. y Fearn T. (1983). A quantitative study of biscuit microstructure.
Starch 35(10), 351-354.
Campdell, L.A., Ketelsen, S.M. y Antenucci, R.N. (1994). Formulating oatmeal
cookies with calorie-sparing ingredients. Food Technology 48(5), 98-105.
Castro-Prada, E., Luyten, H., Lichtendonk, W., Hamer, R.J. y van Vlien, T.
(2007). An improved instrumental characterization of mechanical and
acoustic properties of crispy cellular solid food. Journal of Texture Studies
38, 698-724.
Cauvain, S. y Young, L. (2006). Baked products: science, technology and
practices. Blackwell Publishing, Ames, USA.
Champ, M. (2004). Resistant starch. In Eliasson AC (ed.) Starch in food:
structure, function and applications. Woodhead Publishing Ltd, Cambridge.
Chen, H., Rubenthaler, G.L. y Schanus, E.G. (1988.) Effect of Apple Fiber and
Cellulose on the Physical Properties of Wheat Flour. Journal of Food
Science and Technology 53, 304-305.
Chevallier, S. y Colonna, P. (1999)Thermal analysis of protein-starch
interactions at low moisture contents. Sciences des Aliments 19, 167-182.
Chevallier, S., Colonna, P., Buleón, A. y Della Valle, G. (2000a).
Physicochemical behaviors of sugars, lipids and gluten in short dough and
biscuit. Jornal of Agricultural Food Chemistry 48, 1322-1326.
INTRODUCCIÓN
27
Chevallier, S., Colonna, O., Buleón, A. y Lourdin, D. (2000b). Contribution of
major ingredients during baking of biscuit dough systems. Journal of Cereal
Science 31, 241-252.
Chevallier, S., Della Valle G., Colonna P., Broyart B. y Tryatram G. (2002).
Structural and Chemical Modifications of Short Dough During Baking.
Journal of Cereal Science 35, 1-10.
Drewnowski, A., Nordenstenb, K. y Dwyer, C.J. (1998). Replacing sugar and fat
in cookies: Impact on product quality and preference. Food Quality and
Preference 9, 13-20.
Drake, B.K. (1963). Food crushing sounds: an introductory study. Journal of
Food Science 28, 233-244.
Drake B.K. (1965a). Food crushing sounds: comparison of objective and
subjective data. Journal of Food Science 30, 556-559.
Drake, B. (1965b). On the biorheology of human mastication: an amplitude-
frequency-time analysis of food crushing sounds. Biorhelogy 3, 21-31.
Drake B. y Halldin L. (1974). Food crushing sounds: an analytic approach.
Rheological Acta 13, 608-612.
Duizer L.M., Bloom K. y Findlay C.J. (1997). Dual-attribute time-intensity
sensory evaluation: a new method for temporal measurement of sensory
perceptions. Food Quality and Preference 8, 261-269.
Ellouze-Ghorbel, R., Kamoun, A., Neifar, M., Belguith, S., Ayadi, M.A., Kamoun,
A. y Ellouze-Chabouni. (2010). Development of fiber-enriched biscuits
formula by a mixture design. Journal of Texture Studies 41, 472-491.
Fasolin, L.H., Almeida, G.C., Castanho, P.S. y Netto-Oliveira, E.R. (2007).
Cookies produced with banana meal: chemical, physical and sensorial
evaluation. Ciência e tecnologia de alimentos 27(3), 524-529.
INTRODUCCIÓN
28
Faubion, J.M. y Faridi, H.A. (1986). Dough Rheology: Its benefits to cereal
chemist. En: Fundamentals of dough Rheology. Edited by Hamed Faridi
and Jon M.Faubion. Published by The American Association of Cereal
Chemist, Ic, St.Paul, Minesota.
Fustier P., Castigne F., Turgeon S.L. y Biliaderis C.G.(2008). Flour constituent
interactions and their influence on dough rheology and quality of semi-
sweet biscuits: a mixture desing approach with reconstituted blends of
gluten, water-solubles and starch fractions. Journal of Cereal Science 48,
144-158.
Gallagher, E., O’ Brien, C.M., Scannell, A.G.M. y Arendt E.K. (2003). Evaluation
of sugar replacers in short dough biscuit production. Journal of Food
Engineering 56, 261–263.
Gaines, C.S. (1990). Influence of chemical and physical modification of soft
wheat protein on sugar-snap cookie dough consistency, cookie size, and
hardness. Cereal Chemistry 67, 73–77.
Gaines, C.S. (1991). Instrumental measurement of the hardness of cookies and
crackers. Cereal Foods World 36, 989-996.
Ghotra B.S., Dyal S.D. y Narine S.S. (2002). Lipid shortenings: a review. Food
Research International 35, 1015-1048.
Gujral, H.S., Mehta, S., Samra, I.S. y Goyal, P. (2003). Effect of wheat bran,
coarse wheat flour and rice flour on the instrumental texture of cookies.
International Journal of Food Properties 6(2), 329-340.
HadiNezhad M. y Butler F. (2009). Association of glutenin subunit composition
and dough rheological characteristics with cookie baking properties of soft
wheat cultivars. Cereal Chemistry 86(3), 339-349.
Hernández, M.J., Dolz, M. y Delegido, J. (2006). Introducción a la reología:
aplicación a sistemas farmacéuticos y alimentarios. Moliner-40. Burjassot
(Valencia).
INTRODUCCIÓN
29
Hoseney, R.D. (1994). Principles of Cereal Science and Technology, second
ed. AACC, St-Paul, Minnesota, USA.
Hutchinson, P.E. (1978). Emulsifiers in Cookies- Yesterday, Today and
Tomorrow 53rd annual Biscuit and Cracker Manufacturers Association
Technologists Conference.
Iles, B. C. y Elson, C.R. (1972). Crispness of cereal. In Pomeranz, Y. (Ed.),
Advances in cereal science and technology. (pp 1-19).
Inglett, G.E., Warner, K. y Newman, R.K. (1994). Sensory and Nutritional
Evaluations of Oatrim. Cereal Foods World 39,10, 755-756.
Jack, F.R., Piggot, J.R. y Paterson, A. (1994). Analysis of textural changes in
hard cheese during mastication by progressive profiling. Journal of Food
Science 59, 539-543.
Kaldy, M.S., Kereliuk, G.R. y Kozub, G.C. (1993). Influence of gluten
components and flour lipids on soft white wheat quality. Cereal Chemistry
70, 77-80.
Kasapis, S (2004). Definition of a Mechanical Glass Transition Temperature for
Dehydrated Foods. Journal of Agricultural and Food Chemistry 52, 2262-
2268.
Keast, R.S.J.; Breslin, P.A.S. (2003). An overview of binary taste-taste
interactions. Food Quality and Preference 14, 111–124.
Kulp, K., Olewnik, M. y Lorenz, K. (1991). Starch Functionality in Cookie
Systems. Starch, 43, 53-57.
Kweon, M., Slade, L., Levin, H., Martin, R. y Souza, E. (2009). Exploration of
sugar functionality in sugar-snap and wire-cut cookie baking: implications
for potential sucrose replacement or reduction. Cereal Chemisty 86 (4),
425-433.
INTRODUCCIÓN
30
Larrea, M.A,. Chang, Y.K, Martinez-Bustos, F. (2005). Some functional
properties of extruded orange pulp and its effect on the quality of cookies.
LWT-Food Science and Technology 38,213–220
LaRosa, J.C., Hunninghake, D., Bush, D., Criqui, M.H., Getz, G.S., Gollo A.M.,
Grundy S.M., Rakita L., Robertson R.M., Weisfelt M.L. y Cleeman J.I.
(1990). The Cholesterol Facts. A summary of the evidence relating dietary
fats, serum cholesterol and coronary heart disease. Circulation 81, 1721-
1733.
Lenfant, F., Loret, C., Pineau, N., Hartman, C. y Martin, N. (2009). Perception of
oral food breakdown. The concept of sensory trajectory. Appetite 52, 659-667.
Levine, H. y Slade, L. (1990). ‘Dough Rheology and Baked product Texture:
Theory and Practice’ (Eds. H. Faridi and J.M. Faubion), Van Nostrand
Reinhold/AVI New York .pp 157.
Leelavathi, K. Y Rao, P. H. (1993). Development of high fibre biscuits using
wheat bran. Journal of Food Science and Technology 30, 187–191.
Le Révérend, F. M., Hidrio, C., Fernandes, A. y Aubry, V. (2008). Comparison
between temporal dominance of sensations and time intensity results. Food
Quality and Preference 19, 174–178
Loening-Baucke, V., Miele, E. y Staiano, A. (2004). Fiber (Glucomannan) Is
Beneficial in the Treatment of Childhood Constipation. Pediatrics, 113, 259-
264
Maache-Rezzoug, Z., Bouvier, J.M., Allaf, K. y Patras C. (1998) Effect of
principal ingredients on rheological behaviour of biscuit dough and on
quality of biscuits. Journal of Food Engineering 35 (1), 23-42.
Mandala, I.G., Ioannou, C.A. y Kostaropoulus, A.E. (2006). Textural attributes of
commercial biscuits. Effect of relative humidity on their quality. International
Journal of Food Science and Technology 41, 782-789.
INTRODUCCIÓN
31
Manley, D. J. R. (1991).Classification of biscuits. In ‘Technology Gelatinization
of wheat starch in the presence of sucrose of Biscuits, Crackers and
Cookies’ 2nd edn., Ellis Hor- and sodium chloride: Correlation between
gelatinization wood, Chichester pp 231–237.
Manley, D. J. R. (2000). Tecnología de la industria galletera. Galletas, crackers
y otros horneados. Segunda Edición. Editorial Acribia, Zaragoza, España.
Meilgaard, M., Civille, G.V.,y Carr, B.T. (1991). Sensory evaluation techniques
(2nd ed.). Boca Raton, FL: CRC Press Inc.p. 288.
Meillon, S., Viala, D., Medel, M., Urbano, C., Guillot, G. y Schlich, P. (2010).
Impact of partial alcohol reduction in Syrah wine on perceived complexity
and temporality of sensations and link with preference. Food Quality and
Preference 21, 732–740.
Milner, J.A. (2002) Functional foods and health: a US perspective. British
Journal of Nutrition 88, Supl. 2, S151-S158.
Nonaka, H.H. (1997). Plant carbohydrate-derived products as fat replacers and
calorie reducers. Cereal Foods World 42, 376-378.
Nikolaidis, ,A. y Labuza, T.P. (1996). Glass transition state diagram of a baked
cracker and its relationship to gluten. Journal of Food Science 61 (4), 803-
806.
O’Connor, M. (1992). Europe and Nutrition. British Medical Journal 304, 178-
182.
Olewnik, M.C. y Kulp, K. (1984). The effect of mixing time and ingredient
variation on farinograms of cookie doughs. Cereal Chemistry 61, 532-537.
Olinger, P.M. y Velasco, V.S. (1996). Opportunities and advantges of sugar
replacement. Cereal Food World 41(3), 110-117.
INTRODUCCIÓN
32
OMS. (2004). WHO Global Strategy on Diet. Available from: http://www.who.int/
Oreopoulu, V. (2006). en Bakery Products, Science and Technology, Capítulo
10: Fat replacers. Hui Y.H. (Editor).
Öztürk, S., Özboy, Ö. y Kökse,L. H. (2002). Effects of Brewer’s spent grain on
the quality and dietary fibre content of cookies. Journal of the Institute of
Brewing 108 (1), 23-27.
Papantoniou, E., Hammond, E.W., Tsiami, A.A., Scriven, F., Fordon, M.H., y
Schofield J.D. (2003). Effects of endogenous flour lipids on the quality of
semisweet biscuits. Journal of Agricultural and Food chemistry 51, 1057-
1063.
Papantoniou, E., Hammond, E.W., Tsiami, A.A., Scriven F., Fordon, M.H., y
Schofield J.D. (2004). Effects of endogeneous flour lipids on the quality of
short-dough biscuits. Journal of the Science of Food and Agriculture 84,
1371-1380.
Pareyt, B. y Delcour, J.A. (2008a). The role of wheat flour, constituents, sugar
and fat in low moisture cereal based products: a review on Sugar-snap
cookies. Critical Review in Food Science and Nutrition 48, 824-839.
Pareyt, B., Wilderjans, E., Goesaert, H., Brijs, K. y Delcour, J.A. (2008b). The
role of gluten in a sugar-snap cookie system:a model approach based on
gluten-starch blends. Journal of Cereal Science 48, 863-869.
Pareyt, B., Brijs, K.y Delcour, J.A. (2009a). Sugar-snap cookie dough setting:
the impact of sucrose on gluten functionality. Journal of Agriculture and
Food Chemistry 57, 7814-7818.
Pareyt, B., Talhaoui, F., Kerckhofs, G., Brijs, K., Goasaert, H., Wevers,M. y
Delcour, J.A.. (2009b) The role of sugar and fat in sugar-snap cookies:
Structural and textural properties. Journal of Food Engineering 90, 400-408.
INTRODUCCIÓN
33
Pareyt, B., Goovaerts, M., Broekaert, W.F. y Delcour, J.A. (2011). Arabinoxylan
oligosaccharides (AXOS) as a potential sucrose replacer in sugar-snap
cookies. LWT- Food Science and Technology, 44, 725-728.
Pedersen, L., Kaack, K., Berg, M.N. y Adler-Nilssen, J. (2004). Rheological
properties of biscuit dough form different cultivars, and relationship to
baking characteristics. Journal of Cereal Science 39, 37-46.
Pedersen, L., Kaack, K., Bergs, M.N. y Adler-Nissen, J. (2005). Effects of
Chemical and Enzymatic modification on dough rheology and biscuit
characteristics. Journal of Food Science 70, 152-158.
Pineau, N., Schlich, P., Cordelle, S., Mathonnière, C., Issanchou, S. y Imbert, A.
(2009). Temporal Dominance of sensations: Construction of the TDS curves
and comparison with time–intensity. Food Quality and Preference 20, 450–
455.
Prentice, N., Kissell, L.T., Lindsay, R.C. y Yamazaki, W.T. (1978). High–Fibre
cookies containing brewer’s spent grain. Cereal Chemistry 55(5), 712-721.
Real Decreto 1124. (1982). Real Decreto 1124/1982, de 30 de abril, por el que
se aprueba la Reglamentación Técnico-Sanitaria para la Elaboración
Fabricación, Circulación y Comercio de Galletas. Boletín Oficial del Estado,
núm. 133 de 4 de junio de 1982, páginas 15069 a 15072. BOE-A-1982-
13243.
Roudat, G., Dacremont, C., Vallès Pàmies, B., Colas, B. y Le Meste M. (2002).
Crispness: a critical review on sensory and material science approaches.
Trends in Food Science and Technology 13, 217-227.
Sahin, S. y Gülüm Sumnu,S. (2005). Physical properties of foods. Food science
Text series. Springer, E.E.U.U.
INTRODUCCIÓN
34
Sai Manohar, R. y Haridas Rao, P. (1999a). Effects of water on the rheological
characteristics of biscuit dough and quality of biscuits. European Food
Research and Technology 209, 281-285
Sai Manohar, R. y Haridas Rao, P. (1999b). Effect of emulsifiers, fat level and
type on the rheological characteristics of biscuit dough and quality of
biscuits. Journal of the Science of Food and Agriculture 79, 1223-1231.
Sai Manohar, R. y Haridas Rao, P. (1997). Effect of sugars on the rheological
characteristics of biscuit dough and quality of biscuits. Journal of Science
and Food Agriculture 75, 383-390.
Salas–Salvadó, J. y Megias-Rangil I. (2004). Introducción a las dietas
controladas en fibra. En: Nutrición y dietética clínica.Ed. Masson.
Saleem, Q., Wildman, R.D., Huntley, J.M. y Whitworth, M.B. (2005). Material
properties of semi-sweet biscuits for finite element modelling of biscuit
cracking. Journal of Food Engineering 68, 19-32.
Sandoval-Aldana, A., Rodríguez-Sandoval, E. y Fernandez-Quintero, A. (2005).
Aplicación del análisis por calorimetría diferencial de barrido (DSC) para la
cracterización de las modificaciones del almidón. Dyna 72(146), 45-53.
Slade, L. y Levine, H. (1994). Structure-function relationships of cookie and
craker ingredients. En ‘The Science of Cookie and Cracker Production’.
(H.Faridi, ed.), Chapamn&Hall, New York. 99, 23-24
Spies, R.C. y Hoseney, R.C. (1982). Effect of sugars on starch gelatinization.
Cereal Chemistry 59, 128-131.
Stone, H., Sidel, J., Oliver, S., Woolsey, A. y Singleton, R.C. (1974). Sensory
evaluation by quantitative descriptive analysis. Food Technology 45(6), 88,
90, 92-95.
Stone, H. y Sidel, J.E. (2004). Sensory Evaluation Practices. Third Edition .
Food Science and Technology. International series. Elsevier Academic
Press, London, UK.

INTRODUCCIÓN
35
Sudha, M.L., Vetrimani, R. y Leelavathi, K. (2007). Influence of fibre from
different cereals on the rheological characteristics of wheat flour dough and
on biscuit quality. Food Chemistry 100, 1365-1370
Szczesniak, A.S. (2002). Texture is a sensory property. Food Quality and
Preference 13, 215-225.
Thacker, D. (1993). Evaluation of flour for biscuit making. En: Turner, A.,(Ed.),
Food Technology International Europe, Sterling Publications, London, pp.
154–158.
Tosh, S.M. y Yada, S. (2010). Dietary fibres in pulse seeds ad fractions:
Characterization, functional attributes and applications. Food Research
International 43, 450-460.
Van Kleef E., Van Trijp H.C.M. y Luning P. (2006). Internal versus external
preference analysis: An exploratory study on end-user evaluation. Food
Quality and Preference 408, 17, 387–399.
Varela, P., Salvador, A., Gámbaro, A. y Fiszman, S. (2008). Texture concepts
for consumers: a better understanding of crispy-crunchy sensory
perception. European Food Research and Technology 226, 1081-1090
Vázquez, M.B., Curia, A. y Hough, G. (2009). Sensory descriptive analysis,
sensory acceptability and expectation Studies on Biscuits with reduced
added salt and increased fiber. Journal of Sensory Studies 24, 498-511.
White, G.W. (1970) Rheology in Food Research. International Journal of Food
Science & Technology 5(1), 1–32.
Vickers, Z.M. y Bourne, M.C. (1976). A psychoacoustical theory of crispness.
Journal of Food Science 41, 1158-1164.
Vickers, Z.M. y Wasserman, S.S. (1979). Sensory qualities of food sounds
based on individual perceptions. Journal of Texture Studies 10, 319-332.
INTRODUCCIÓN
36
Vickers, Z.M. (1984). Crispness and Crunchiness- a difference in pitch? Journal
of Food Texture 15, 157-163.
Wade, P. (1988). Preparation of biscuit doughs. En: Biscuits, Cookies and
crackers. The principles of the craft. London: Elsevier Applied Science.
Yoshikawa, S., Nishimaru, S., Tashiro, T. y Yoshida, M. (1970). Collection and
classification of words for description of food texture. I. collection of words.
Journal of Texture Studies 1, 437-442.
Yue, P. y Waring, S. (1998). Functionality of RS in food application. Food
Australia 50, 615-621.
Zbikowska, A. y Rutkowska, J. (2008). Possibility of partial replacement of fat by
inuline in cookies in order to decrease their caloric value. Polish Journal
of Food and Nutrition Sciences 58, 1, 113-117
Zoulias, E.I., Piknis, S. y Oreopoulou, V. (2000). Effect of sugar replacemnt by
polyols and acesulfame-K on properties of low-fat cookies. Journal of the
Science of Food and Agriculture 80:2049-2056.
Zoulias E., Kounalaki E. y Oreopoulu, V. (2002a). Effect of fat and sugar
replacement on cookie properties. Journal of the Science of Food and
Agriculture 82, 1637-1644.
Zoulias, E.I., Oreopoulou, V. y Tzia, C. (2002b). Textural properties of low-fat
cookies containing carbohydrate-or protein-based fat replacers. Journal
of Food Engineering 55, 337–342.

OBJETIVOS

OBJETIVOS
39
OBJETIVOS DE LA TESIS DOCTORAL
El objetivo general de la presente tesis fue evaluar las propiedades físicas y
sensoriales de galletas reformuladas con nuevos ingredientes ricos en fibra y
sustitutos de sacarosa y grasa para conocer su estructura y obtener galletas
con mayor valor nutricional, menor contenido calórico y buena aceptación
sensorial.
Para la consecución de este objetivo general se establecieron los siguientes
objetivos parciales:
1. Evaluar los cambios reológicos (propiedades viscoelásticas lineales),
texturales y sensoriales cuando parte de la harina se sustituye por
concentraciones crecientes de almidón resistente.
2. Evaluar los cambios reológicos (propiedades viscoelásticas lineales),
texturales y sensoriales cuando parte de la harina se sustituye por
concentraciones crecientes de fibra de trigo de dos longitudes y de
fibra de manzana. Influencia de la dosis, morfología y solubilidad de
dichas fibras.
3. Aplicar nuevas técnicas sensoriales en el estudio del procesado oral de
galletas ricas en fibra y bajas en grasa y su relación con la aceptación
por parte del consumidor.
4. Evaluar los cambios en las propiedades sensoriales de las galletas
cuando se sustituye parte de la grasa por un ingrediente alto en
dextrinas.
5. Estudiar el efecto de la sustitución de grasa por inulina e
hidroxipropilmetilcelulosa en las propiedades mecánicas y acústicas
de las galletas durante la fractura y su correlación con el análisis
descriptivo cuantitativo sensorial y con la aceptabilidad.

OBJETIVOS
40
6. Estudiar el efecto de la sustitución de azúcar por inulina y eritritol en
las propiedades mecánicas y acústicas de las galletas durante la
fractura y su correlación con el análisis descriptivo cuantitativo
sensorial y con la aceptabilidad.
7. Estudio de la funcionalidad de la sacarosa en las propiedades térmicas,
reológicas y texturales en un sistema modelo, en la masa de galleta
(producto intermedio) y en la galleta (producto final). Determinación de
la funcionalidad del eritritol y el maltitol como sustitutos de la sacarosa.
ESTRUCTURA DE LA TESIS

ESTRUCTURA
43
ESTRUCTURA DE LA TESIS
El trabajo de investigación realizado ha dado origen a diversas publicaciones
científicas que responden a los objetivos planteados y cuyo contenido se
presenta en los distintos capítulos de la presente tesis doctoral. Las referencias
de las publicaciones y el capítulo en que aparecen son:
Capítulo 1. Laura Laguna, Ana Salvador, Teresa Sanz and Susana M. Fiszman. (2011).
Performance of a resistant starch rich ingredient in the baking and eating quality
of short-dough biscuits. LWT - Food Science and Technology 44, 737-746.
Laura Laguna, María J. Hernández, Ana Salvador and Teresa Sanz. (2012).
Study on Resistant Starch Functionality in Short Dough Biscuits by Oscillatory
and Creep and Recovery Tests. Food Bioprocess and Technology DOI
10.1007/s11947-012-0785-x.
Laura Laguna, Teresa Sanz, Sarab Sahi and Susana M. Fiszman. (2012). Role
of fibre morphology in some quality features of fibre-enriched biscuits.
International Journal of Food Properties (aceptado).
Laura Laguna, Paula Varela, Ana Salvador and Susana Fiszman. (2012). A
new sensory tool to analyse the oral trajectory of biscuits with different fat and
fibre contents. Food Research International (aceptado).
Capítulo 2. Laura Laguna, Paula Varela, Ana Salvador, Teresa Sanz, Susana M. Fiszman.
(2012). Balancing texture and other sensory features in reduced fat short-dough
biscuits. Journal of Texture Studies 43, 235-245.
ESTRUCTURA
44
Laura Laguna, Paula Varela, Cristina Primo, Ana Salvador, and Teresa Sanz.
HPMC and INULIN as fat replacers in biscuits: sensory and instrumental
evaluation. LWT - Food Science and Technology (enviado).
Capítulo 3. Laura Laguna, Cristina Primo-Martín, Ana Salvador and Teresa Sanz. (2012).
Inulin and erythritol as sucrose replacers in short dough cookies. Sensory,
fracture and acoustic properties. Food Bioprocess and Technology (enviado).
Laura Laguna, Katleen J.R. Vallons, Albert Jurgens, Teresa Sanz (2012).
Understanding the effect of sugar and sugar replacement in short dough
biscuits. Food Bioprocess and Technology, DOI: 10.1007/s11947-012-0968-5.
Los capítulos de la tesis se han estructurado en base a la funcionalidad del
ingrediente utilizado en la reformulación de las galletas.
El capítulo 1 aborda los objetivos relacionados con el reemplazo de parte de la
harina por fibra. Como fuentes de fibra se utilizaron almidón resistente, fibra de
trigo y fibra de manzana. Se evalúan las propiedades reológicas de la masa
para determinar la funcionalidad de las fibras sobre la estructura de la masa y
de las galletas, así como las propiedades de textura y los cambios sensoriales
que se producen en las galletas. Además, se aborda el estudio de la
percepción sensorial de la textura durante la masticación y su relación con la
aceptabilidad sensorial utilizando nuevas herramientas sensoriales no
aplicadas anteriormente a este producto.
El capítulo 2 se centra en la resolución de los objetivos asociados a la
sustitución de parte de la grasa empleada en la formulación de las galletas por
nuevos ingredientes a base de carbohidratos. Se utilizaron: un ingrediente alto
en dextrinas, hidroxipropilmetilcelulosa e inulina. En este capítulo se aborda el
estudio del reemplazo parcial en las características de fractura analizando los
ESTRUCTURA
45
eventos de fuerza simultáneamente con los de sonido, tanto de forma
instrumental como sensorial.
Por último, el capítulo 3 se centra en los objetivos relacionados con la
reducción de la sacarosa. Se estudiaron los cambios en las propiedades físicas
y sensoriales al utilizar inulina, maltitol y eritritol como sustitutos de sacarosa.
Se evalúan las propiedades de fractura y sonido y se determinan los atributos
sensoriales que mejor describen y caracterizan dichas galletas. Por otro lado,
para un mayor entendimiento de los cambios que se producen en la estructura
del producto al utilizar diferentes azúcares, se realiza un estudio más profundo
con el diseño de un sistema modelo que permite predecir cuál es el sustituto de
sacarosa más adecuado que aporta propiedades similares la sacarosa sin
modificar la calidad de la galleta.


CAPÍTULO 1


PERFORMANCE OF A RESISTANT STARCH RICH INGREDIENT IN THE
BAKING AND EATING QUALITY OF SHORT-DOUGH BISCUITS
Laura Laguna, Ana Salvador, Teresa Sanz and Susana M. Fiszman
LWT- Food Sicence and Technology 44(2011) 737-746


CAPÍTULO 1
51
Abstract
The effect of replacing part of the wheat flour with a resistant starch rich
ingredient (RSRI) − a source of functional fibre with potential health benefits −
was studied in short dough biscuits. A control with no replacement and 3
formulations in which 20, 40 and 60g of flour per 100g were replaced by an
RSRI (samples 20RSRI, 40RSRI and 60RSRI) were prepared. From a
technological point of view, the RSRI level influenced the consistency of the raw
dough and the ease of sheeting and cutting. Regarding the eating quality of the
final product, addition of the RSRI increased the breaking strength and
crumbliness and reduced the resistance to penetration. In the RSRI biscuits,
both the surface and the crumb were paler. The sensory acceptance of the
20RSRI biscuits did not differ significantly from that of the control. 40RSRI
reduced the acceptability of the colour, appearance and texture without altering
the taste, sweetness and overall acceptance. Neither of these two levels
significantly reduced the consumption intention. However, 60% flour
replacement produced biscuits with lower sensory acceptability and a significant
reduction in consumption intention. In general, the results could be interpreted
in terms of the protein-diluting effect of the added ingredient and changes in the
water-retention capacity of flour mixtures containing RSRI. The present results
proved that resistant starch rich ingredients (RSRI) have good potential for
developing fibre-rich biscuits without changing their general features.
Key words: resistant starch, biscuits, flour replacement, baking performance,
eating quality, acceptability

CAPÍTULO 1
52
1. Introduction
A new trend is that consumers are demanding foods which display two main
properties: the first is the traditional nutritional aspects of the food, the second is
that additional health benefits are expected from its regular ingestion (Aparicio-
Sanguilán, Sáyago-Avendi, Vargas-Torres, Tovar, Ascensio-Otero & Bello-
Pérez, 2007).
The effect of dietary fibre on promoting health and preventing disease has been
an issue of interest for many years and has become a subject of renewed
research (Shahidi, 2000). The intake of fibre and fibre-containing foods remains
low in many populations worldwide (Loening-Baucke, Miele, & Staiano, 2004).
The interest in foods with high fibre contents has increased in recent decades
and the importance of this food constituent has led to the development of a
large market for fibre source ingredients in products such as bread, snacks,
muffins or a number of types of biscuits that are conveniently consumed at
breakfast (Nilsson, Ostman, Holst & Bjorck, 2008). As new ingredients emerge,
there is a need to understand their functionality and their effects on formulation.
This way of increasing fibre levels can be useful for ensuring that the population
receives adequate amounts of fibre (Baixauli, Salvador & Fiszman, 2008a).
Most bakery products can be used as vehicles for different nutritionally rich
ingredients, permitting diversification (Sudha, Vetrimani & Leelavathi, 2007).
It is well known that consumers often perceive fibre as having a strong flavour,
being unpalatable and possessing a coarse texture and a poor, dry mouth feel
(Yue & Waring, 1998); these and other negative attributes such as dark colour
and a masking of flavour are often associated with high-fibre baked products.
Sources of soluble dietary fibre, such as oat bran, have been the focus of
numerous new products. However, the level of oat bran in commercial baked
products is usually low, possibly because bran adversely affects product texture
compared to the original formulations (Hudson, Chiu & Knuckles, 1992).
Like fibre, resistant starch (RS) is being examined for both its potential health
benefits and its techno-functional properties in foods. RS is the sum of starch
CAPÍTULO 1
53
and products of starch degradation not absorbed in the small intestine of
healthy individuals (Asp, 1992). Four types of RS have been identified (Champ,
2004): RS type I is a physically inaccessible starch found in starchy foods which
are not fractionated and refined – mostly pulses and some cereals. RS type II
refers to native resistant starch granules. RS type III comprises retrograded
starches (Eerlingen, Jacobs, & Delcour, 1994; Eerlingen, Van den Broeck,
Delcour, Slade, & Levine, 1994). Finally, RS type IV is made up of chemically
modified starches with a far higher number of modifications than the usual
chemically-modified starches authorised in Europe; type IV is authorised in
Japan. RS has been shown to provide benefits such as increased digestive
tract activity and the production of desirable metabolites like short-chain fatty
acids in the colon (Yue & Waring, 1998).
Moreover, RS has become commercially available as RS-rich ingredients that
can be used to produce foods of improved quality. Compared to conventional
fibres, it has many advantageous features. It is a natural white source of dietary
fibre, has a bland flavour and gives a better appearance, texture and mouth feel
than other typical fibres (Baixauli, Salvador, Hough & Fiszman, 2008; Eerlingen,
van Haesendonck, de Paepe, & Delcour, 1994).
Biscuits are the most popular bakery items which are consumed by nearly all
levels of society. This is mainly due to their being ready to eat, of good
nutritional quality and available in different varieties at an affordable cost.
The addition of fibre to biscuits has been studied for different fibre sources such
as coconut residue (Khan, Hagenmaier, Rooney & Mattil, 1976), brewers’ spent
grain (Prentice, Kissell, Lindsay & Yamzaki, 1978), wheat bran (Leelavathi &
Rao, 1993) and rice bran (Babcock, 1987; Saunders, 1989; Skurray,
Wooldridge & Nguyen, 1986). Sudha et al. (2007) studied the effects of the
addition of different cereal brans (wheat, rice, oat and barley); the biscuits with
wheat bran (20%), oat bran (30%) and barley bran (20%) were highly
acceptable. However, few papers deal with RS enrichment of biscuits. Aparicio-
Sanguilán et al. (2007) used an experimental RS-rich product (RSRP) obtained
CAPÍTULO 1
54
from lintnerized banana in cbiscuits; an affective test showed no difference in
preference between the RSRP biscuits and the control sample without the
RSRP. However, they did not perform any tests to ascertain the changes
induced by this ingredient in the physical properties of the dough, during the
baking procedure, or in the final product.
All the studies mentioned have shown the possibility of using biscuits as
effective carriers of different sources of fibre in order to improve the daily fibre
intake of human beings. Short dough biscuits constitute a simple system which
consists of three major ingredients (flour, sugar and fat) and a small amount of
water; they have high acceptability and are very popular in many countries.
Furthermore, an increasing number of commercial resistant starch-rich
ingredients is available.
The aim of this study was to evaluate the physical, textural and sensory
changes that take place in short dough biscuits when increasing proportions of
the flour are replaced by an RS-rich ingredient (RSRI). Additionally, the
resistant starch was analysed in order to verify the actual RS content of the
biscuits with the different formulations.
2. Materials and methods
2.1. Materials
Four formulations were prepared using the same quantity of all the ingredients
except the wheat flour and RS. The proportions of these two ingredients were
100:0 (control), 80:20, 60:40 and 40:60; the latter three samples were named
20RSRI, 40RSRI, and 60RSRI respectively. The biscuit ingredients
(percentages given on a dough basis) were: a) soft wheat flour suitable for
biscuits (Belenguer,S.A., Valencia, Spain) (composition data provided by the
supplier: 15% moisture, 11% protein, 0.6% ash; alveograph parameters
P/L=0.27, where P=maximum pressure required and L=extensibility; and W
=134, where W=baking strength of the dough) and b) RSRI, a source of
CAPÍTULO 1
55
resistant starch (Hi-maize 260, National Starch Food Innovation, Manchester,
UK, composition data provided by the supplier 10% moisture, 58% dietary fibre
according to AOAC 991.43 method), together making up 50g/100g, c)
shortening 30g/100g (St. Auvent, Vandemoortele France), d) sugar 15g/100g
(Azucarera Ebro, Madrid, Spain), e) milk powder 0.3 g/100g (Central Lechera
Asturiana, Peñasanta, Spain), f) salt 0.1 g/100g, g) sodium bicarbonate 0.1
g/100g (A. Martínez, Cheste, Spain), h) ammonium hydrogen carbonate 0.06
g/100g (Panreac Quimica, Barcelona, Spain) and i) tap water 4.44 g/100g; the
water level thus remained constant in all the formulations.
2.2. Moisture content
The % moisture content of flour and RSRI was determined according to the
Approved Method 44-15.02 (AACC International, 2009)
2.3. Alkaline water-retention capacity
The % alkaline water retention capacity (%AWRC) of the flour, the RSRI and
the flour/RSRI mixtures (proportions 100:0, 80:20, 60:40 and 40:60) was
calculated according to the Approved Method 56-10.02 (AACC International,
2009).
2.4. Biscuit preparation
The shortening was creamed in a mixer (Kenwood Major Classic, UK) for 4
minutes at minimum speed to obtain a homogenous cream. After this, the sugar
was added and mixed in for 2 minutes at speed 4. The milk powder, previously
dissolved in all the water, was added and mixed in for 2 minutes at the minimum
speed. Finally, the flour (or flour/RS), sodium bicarbonate and ammonium
hydrogen carbonate were mixed in together at minimum speed for 2 minutes.
The dough was then sheeted using a rolling pin over a 300 x 240 x 16 mm
(length x width x height) rectangular frame to ensure a sheeted dough of even
height. The sheeted dough was allowed to rest for 30 minutes at 4ºC before
cutting it into rectangular pieces measuring 80 x 30 x 16 mm (length x width x
height). Twelve pieces were placed on a perforated tray. The biscuits were

CAPÍTULO 1
56
baked in a conventional oven for 6 min at 175 ºC, then the trays were turned
180º, bringing the side that had been at the back to the front of the oven to
ensure homogenous cooking, and baked for a further 6 min at the same
temperature. The oven and the oven trays were always the same, the trays
were placed at the same level in the oven and the number of biscuits baked
was always the same. After cooling, the biscuits were packed and stored in
heat-sealed metalized polypropylene bags. The biscuit samples were evaluated
on the following day in all cases.
2.5. Dough characteristics
2.5.1. Density measurements
The dough density was calculated in three replicates as the weight of a piece of
dough divided by the nominal dough piece nominal volume (3.84x10⁻⁴ m3),
expressed in g.cm-3.
The sheeted dough (16-mm thick) from the different formulations was analysed.
A TA-XT.plus Texture Analyzer equipped with the Texture Exponent software
(version 2.0.7.0. Stable Microsystems, Godalming, UK) was used. A test speed
of 1mms-1 and a trigger force of 5g were used in all the tests. Each test was
conducted on six replicates of each formulation.
2.5.2. Wire cutting measurements
Rectangles of biscuit dough measuring 80 x 30 (length x width), the same size
as the biscuits, were sheared transversally through the middle with a wire
cutter. The mean cutting force on the plateau region (N) was measured.
2.5.3. Sphere penetration measurements
Dough discs with a diameter of 45 mm were penetrated to a depth of 10 mm
with a 0.5 mm-diameter spherical stainless steel probe (P/0.5). The maximum
force (N) attained during penetration was measured.
2.5.4. Flat disc extensional compression measurements. Dough discs, 45 mm in
diameter, were compressed up to 50% of their initial height using a 75 mm-

CAPÍTULO 1
57
diameter aluminium plate (P/75). The maximum force (N) and the final diameter
(mm) of the dough discs after compression were measured. The diameter gain
was calculated (final diameter (mm) − 45mm).
2.6. Differential scanning calorimetry (DSC)
DSC measurements were performed with a Q2000 modulated DSC (TA-
Instruments Inc., USA). Measurements were performed in the doughs and in
the corresponding biscuits of the control and the 60RSRI samples. Freeze-dried
samples were weighed and distilled water added at a 1:3 (w/v) sample to water
ratio in large volume DSC pans (TA-Instruments Inc., USA). The samples were
heated from 5 to 130ºC at 10ºC/min. The enthalpy was expressed in J/g of dried
sample and in J/g of dried wheat starch.
2. 7. Biscuit evaluation
2.7.1. Moisture content and aw
The moisture content of the biscuits was determined in three replicates of each
formulation according to the Approved Method 44-01 (AACC International,
2009).
Water activity (aw) was determined in three replicates of each formulation,
using a Decagon AquaLab meter (Pullman, WA, USA) calibrated with a
saturated potassium acetate solution (aw=0.22).
2.7.2. RS and total dietary fibre (TDF) content
The RS content of the commercial ingredient (RSRI) and of the biscuits with
different RSRI concentrations was determined according to the Approved
Method 32-40 (AACC International, 2009). The method was carried out with a
Megazyme Kit. Three replicates of biscuits from each formulation and of the
resistant starch ingredient Hi-Maize 260 were incubated with alpha amylase and
amyloglucosidase for sixteen hours in a shaking water bath, after which
denatured alcohol was added and the RS from the samples was recovered with
consecutive centrifugations and washed with denatured alcohol. The RS, which
CAPÍTULO 1
58
was recovered in pellet form, was then dissolved (with KOH and subsequently
with an acetate buffer) and incubated with amyloglucosidase. The D-glucose
obtained was measured using a glucose oxidase/peroxidase reagent in a
spectrophotometer.
The total dietary fibre content of the doughs and the biscuits was determined in
three replicates by the Approved Method 32-07 (AACC International, 2009),
using a FOSS Fibretec E 1023 Filtration module and Shaking Water Bath 1024
system.
2.7.3. Physical characteristics of the biscuits
The biscuit density was calculated in six replicates as the weight of a biscuit
divided by its volume, expressed in g.cm-3.
The biscuit length and width were measured by placing 10 biscuits edge-to-
edge (both vertically and horizontally). The biscuit thickness was measured by
stacking 10 biscuits. Measurements were expressed in mm as the mean
value/10 of three different trials. Changes in the dimensions were expressed as
gains (+) in comparison with the initial dimensions of the biscuits before baking
(80-mm long x 30-mm wide x 16-mm thick). Each biscuit was also weighed
individually before and after baking.
2.7.4. Colour
Measurement of the upper surface and internal (crumb) colour of the biscuits
was carried out with a Konica Minolta CM-35000d spectrophotocolorimeter. To
measure the crumb colour, the biscuits were cut perpendicularly with a finely-
serrated knife and the cut surface was measured. Four replicates of each
formulation were measured. The results were expressed in accordance with the
CIELAB system with reference to illuminant D65 and a visual angle of 10º. The
parameters determined were L* (L* = 0 [black], L* = 100 [white]), a* (–a* =
greenness, +a* = redness), b* (–b* = blueness, +b* = yellowness).
Chroma (Cab*) is the attribute that allows the degree of difference in comparison
to a grey colour of the same lightness to be determined for each hue, so it is
CAPÍTULO 1
59
considered the quantitative attribute of colourfulness; Hue (hab) is the attribute
according to which colours have been traditionally defined as reddish, greenish,
etc. These two parameters were defined by the following equations:
C*ab = [(a*)2 + (b*)2] ½
hab = arctan [b*/a*]
The total colour difference (DE*) between the control biscuit and the different
RSRI biscuits was calculated as follows:
DE* = [(L*c – L*s)2 + (a*c – a*s)2 + (b*c – b*s)]½
where subscript c = control and subscript s = samples containing the RSRI.
The values used to determine whether the total colour difference was visually
obvious were the following (Francis & Clydesdale, 1975):
∆E* > 3: colour differences are obvious to the human eye.
2.7.5. Biscuit texture analysis
The texture of the biscuits was measured using the Texture Analyzer described
above. A test speed of 1mm/s was used for all tests. Ten replicates of each
formulation were conducted.
Breaking strength. Biscuits were broken using the three point bending rig probe
(A/3PB). The experimental conditions were: supports 50 mm apart, a 20 mm
probe travel distance and a trigger force of 20g. The force at break (N) and the
gradient of the initial steep slope of the curve (N.mm) were measured.
Crumbliness. The biscuits were cut into 2-cm sized cubes with a finely-serrated
knife. The cubes were compressed to 50% of their initial height using a 75-mm
diameter aluminium plate (P/75) with a trigger force of 10g. The maximum force
(N) during compression was taken as the Crumbliness Index.
Bite test. Penetration tests were conducted with the upper Volodkevich Bite Jaw
(VB), penetrating the sample (whole biscuit) to 10 mm; a trigger force of 20 g
was set. Two 'bites' were made in each biscuit (one third in from each end), so

CAPÍTULO 1
60
a total of 20 values were registered for each formulation. The maximum force at
penetration (N) was measured.
2.7.6. Consumer sensory analysis
A total of 103 untrained panellists (consumers) aged from 15 to 70 years who
consumed this type of biscuit frequently took part in the study. 77 were female
and 26 male. Each consumer received four biscuits, one for each RSRI content
(control, 20RSRI, 40RSRI and 60RSRI), presented individually in a single
session following a balanced complete block experimental design. The biscuits
were coded with random three-digit numbers.
Consumer acceptance testing was carried out using a nine point hedonic scale
(9 = like extremely; and 1 = dislike extremely). The consumers had to score
their liking for the ‘appearance’, ‘texture’, ‘colour’, ‘sweetness’, ‘taste ’, and
‘overall acceptance’ of each biscuit sample.
2.8. Statistical analysis
Analysis of variance (one way-ANOVA) was applied to study the differences
between formulations; least significant differences were calculated by the Tukey
test and the significance at p<0.05 was determined. These analyses were
performed using SPSS for Windows Version 12 (SPSS Inc., USA).
3. Results and discussion
The source of resistant starch (RS) used was a thermally-modified Type II
based on the ae-VII corn hybrid; the modification renders the native granule
more stable when the starch is held at a high temperature in the presence of
limited water, according to Haralampu (2000). Observation of this ingredient
suspended in an excess of water and heated to 100°C for 5 minutes, viewed
under the microscope using polarised light, showed that the starch granules had
not lost their birefringence (data not shown), which is an indication of their
resistance to gelatinisation.
CAPÍTULO 1
61
3.1. Dough characteristics
The rheological properties of biscuit doughs are important, as they influence the
machinability of the dough as well as the quality of the biscuits. Chevallier,
Colonna, Buléon and Della Valle (2000) identified the structure of short dough
as a suspension of proteins, starch-protein associations and isolated starch
granules in a continuous sugar solution phase in which lipids are emulsified in a
concentrated sugar solution. The fat has a lubricating function in the dough (so
very little water is required to achieve the desired consistency) and restricts
gluten formation, implying that physical properties of biscuit dough depend on
the distribution of water and fat in the system. The %AWRC values for the flour,
the 80/20, 60/40 and 40/60 flour/RSRI mixtures, and RSRI were 74.59, 81.02,
93.16, 106.9 and 129.8 g/g on a dry basis, respectively. Since these values
rose significantly as the proportion of RSRI increased, the presence of the RSRI
could be expected to reduce the water availability in the system, producing
drier, harder doughs.
The biscuit dough density could also affect the dough's rheological properties,
as it is considered an indicator of the amount of air incorporated into the dough
during mixing (HadiNezhad & Butler, 2009). In the present study, the density of
the control dough was significantly lower (1.24±0/02 g/cm-3) than that of the
three formulations with partial replacement of the flour with different levels of the
RSRI; no significant differences were encountered between these three
(1.35±0.02 g/cm-3). It may therefore be considered that the air incorporation
efficiency was greater when no RSRI was present.
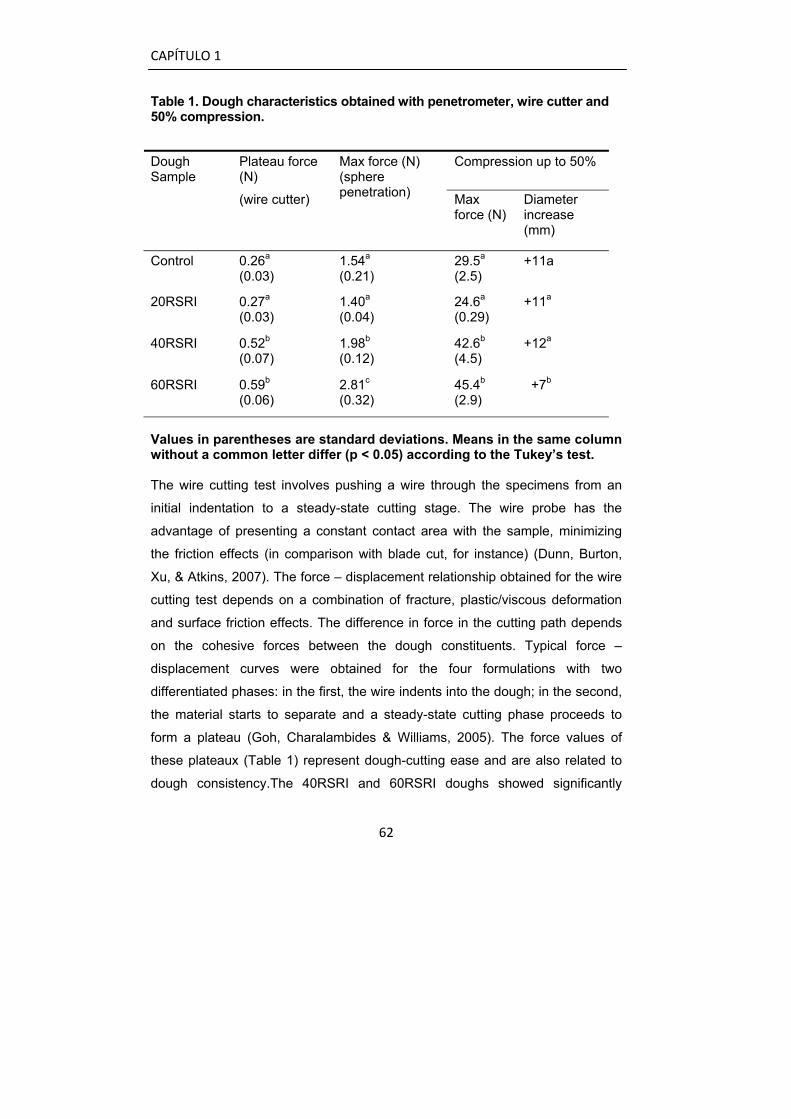
CAPÍTULO 1
62
Table 1. Dough characteristics obtained with penetrometer, wire cutter and 50% compression.
Values in parentheses are standard deviations. Means in the same column without a common letter differ (p < 0.05) according to the Tukey’s test. The wire cutting test involves pushing a wire through the specimens from an
initial indentation to a steady-state cutting stage. The wire probe has the
advantage of presenting a constant contact area with the sample, minimizing
the friction effects (in comparison with blade cut, for instance) (Dunn, Burton,
Xu, & Atkins, 2007). The force – displacement relationship obtained for the wire
cutting test depends on a combination of fracture, plastic/viscous deformation
and surface friction effects. The difference in force in the cutting path depends
on the cohesive forces between the dough constituents. Typical force –
displacement curves were obtained for the four formulations with two
differentiated phases: in the first, the wire indents into the dough; in the second,
the material starts to separate and a steady-state cutting phase proceeds to
form a plateau (Goh, Charalambides & Williams, 2005). The force values of
these plateaux (Table 1) represent dough-cutting ease and are also related to
dough consistency.The 40RSRI and 60RSRI doughs showed significantly
Plateau force (N)
Compression up to 50% Dough Sample (wire cutter)
Max force (N) (sphere penetration) Max
force (N)
Diameter increase (mm)
Control 0.26a (0.03)
1.54a (0.21)
29.5a (2.5)
+11a
20RSRI 0.27a (0.03)
1.40a (0.04)
24.6a (0.29)
+11a
40RSRI 0.52b (0.07)
1.98b (0.12)
42.6b (4.5)
+12a
60RSRI 0.59b (0.06)
2.81c (0.32)
45.4b (2.9)
+7b
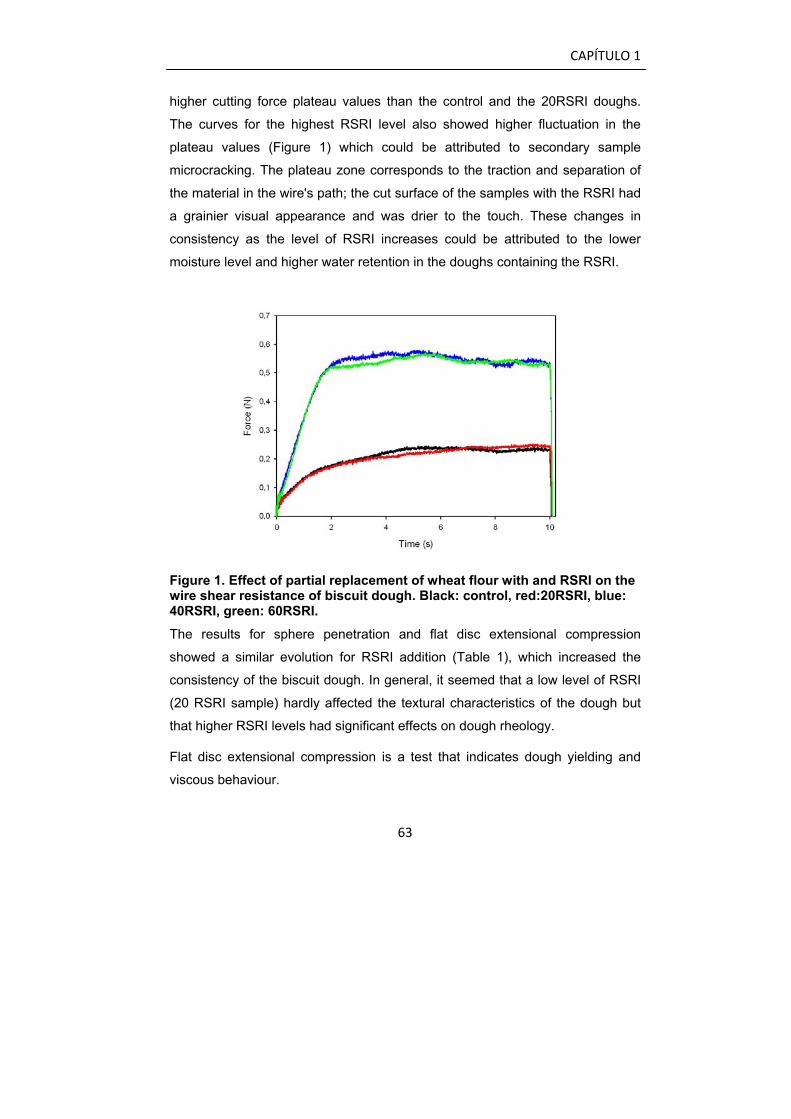
CAPÍTULO 1
63
higher cutting force plateau values than the control and the 20RSRI doughs.
The curves for the highest RSRI level also showed higher fluctuation in the
plateau values (Figure 1) which could be attributed to secondary sample
microcracking. The plateau zone corresponds to the traction and separation of
the material in the wire's path; the cut surface of the samples with the RSRI had
a grainier visual appearance and was drier to the touch. These changes in
consistency as the level of RSRI increases could be attributed to the lower
moisture level and higher water retention in the doughs containing the RSRI.
Figure 1. Effect of partial replacement of wheat flour with and RSRI on the wire shear resistance of biscuit dough. Black: control, red:20RSRI, blue: 40RSRI, green: 60RSRI.
The results for sphere penetration and flat disc extensional compression
showed a similar evolution for RSRI addition (Table 1), which increased the
consistency of the biscuit dough. In general, it seemed that a low level of RSRI
(20 RSRI sample) hardly affected the textural characteristics of the dough but
that higher RSRI levels had significant effects on dough rheology.
Flat disc extensional compression is a test that indicates dough yielding and
viscous behaviour.

CAPÍTULO 1
64
Yielding occurred under very small strain, where the systems predominantly
behaved like solids; under a large strain they behaved more like shear thinning
liquids; Baltsavias, Jurgens, and van Vliet (1999a) have stated that yielding
behaviour is strongly influenced by intact flour particles that act as defects in the
material.
The differences in extensional compression values can be attributed to
differences in the amount of material compressed (HadiNezhad & Butler, 2009),
since the samples containing the RSRI showed higher density; in addition, the
differences could be explained by taking into account the higher AWRC of the
RSRI samples: as more water was retained, its mobility and availability for
gluten development were restricted; also, the RSRI samples contained less
wheat protein, which contributes dough viscosity when hydrated. In a biscuit
system model approach based on gluten–starch blends, Pareyt Wilderjans,
Goesaert, Brijs and Delcour (2008) also found that dough hardness decreased
when more gluten was added.
From a technological point of view, it is not advisable for the dough to be too
stiff; however, none of the formulations presented any problems during mixing
or rolling.
Gaines (1990) suggested that some functional associations of soft wheat
proteins occur during biscuit dough mixing, affecting dough consistency to some
(slight) extent. The diluting effect of the RSRI on the wheat proteins of the flour
should give a less cohesive or structured dough; however, the higher AWRC of
the flour/RSRI mixtures compared to flour seems to have had a major effect in
the present case, producing harder doughs.
3.2. RS and Total Dietary Fibre content
The analyses indicated that the RSRI contained 39.1% RS as determined
enzymatically. As expected, the RS content of the biscuits increased with the
addition of RSRI (Table 2). These results confirm that the RSRI made a
significant contribution to the final RS content of the formulated biscuits and that

CAPÍTULO 1
65
baking did not alter the indigestibility of this ingredient. The TDF contents in
biscuits (Table 2) were compared with the corresponding values in
doughs (4.40, 11.38, 13.88, and 15.40 g/g on a dry basis for control, 20RSRI,
40RSRI and 60RSRI respectively) showing a good recovery of TDF after
baking. The biscuits have high fibre content and are a promising way to
formulate fibre-enriched food.
Table 2. Biscuit characteristics for control and resistant starch-rich ingredient (RSRI) formulations.
Biscuit sample
Moisture (g/100g)
aw Water loss(g/100g)
RS content (g/100g)
TDF (g/100g)
Control 4.37a (0.01)
0.50a (0.0)
5.0a (0.2)
0.78a (0.08)
6.03a (0.59)
20RSRI 5.51b (0.49)
0.59c
(0.0) 4.2b (1.2)
6.04b (0.05)
13.67b (0.75)
40RSRI 5.09ab (0.05)
0.56b (0.01)
4.0b (0.4)
12.32c (0.48)
17.41c (1.02)
60RSRI 5.21ab (0.13)
0.55b (0.01)
4.2b (0.2)
14.10d (0.37)
22.83d (2.6)
Values in parentheses are standard deviations. Means in the same column without a common letter differ ( p < 0.05) according to the Tukey test.
3.3. DSC measurements
In order to evaluate the degree of starch gelatinization after cooking and to
understand the contribution of starch to the structural characteristics of the
biscuits, DSC measurements were performed. Representative DSC
thermograms corresponding to the doughs and the biscuits of the control and
the 60RSRI samples are shown in Fig. 2.
All the samples showed and endothermic peak at 70ºC, which corresponds to
the melting of starch crystals. The presence of this peak in the biscuits implied
that part of starch granules from the wheat flour remained ungelatinized after
the baking process.
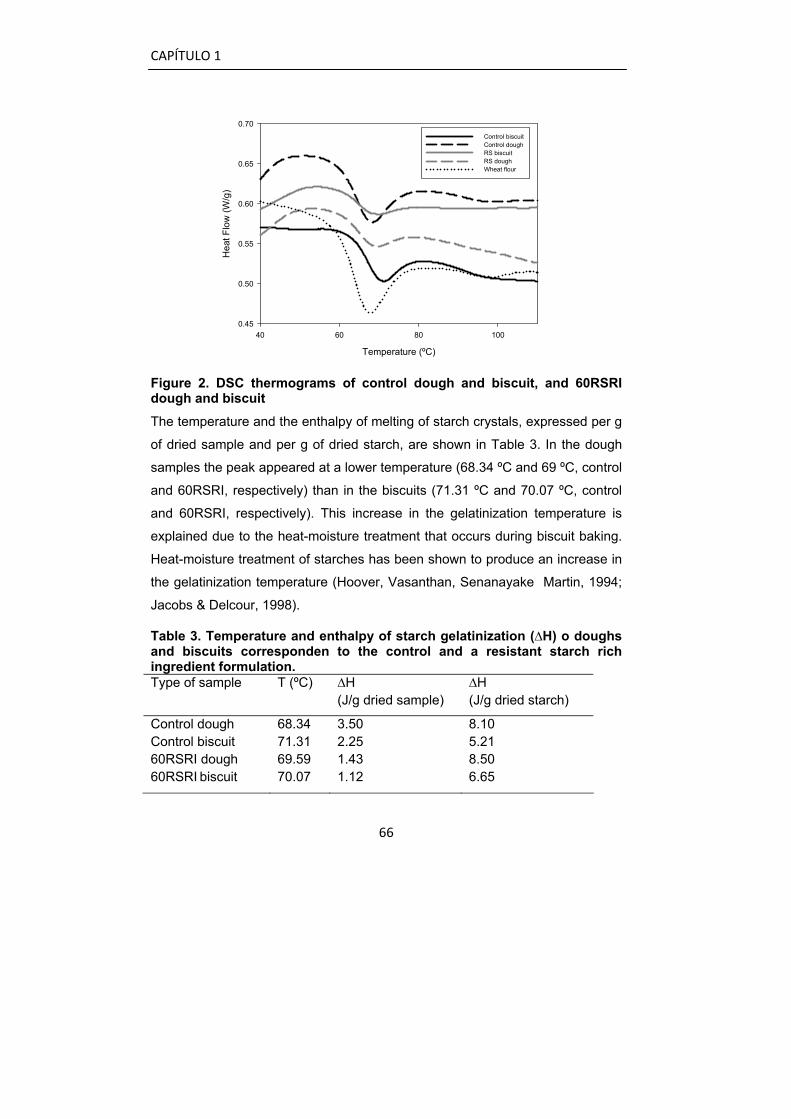
CAPÍTULO 1
66
Temperature (ºC)
40 60 80 100
Hea
t Flo
w (W
/g)
0.45
0.50
0.55
0.60
0.65
0.70Control biscuitControl doughRS biscuitRS doughWheat flour
Figure 2. DSC thermograms of control dough and biscuit, and 60RSRI dough and biscuit
The temperature and the enthalpy of melting of starch crystals, expressed per g
of dried sample and per g of dried starch, are shown in Table 3. In the dough
samples the peak appeared at a lower temperature (68.34 ºC and 69 ºC, control
and 60RSRI, respectively) than in the biscuits (71.31 ºC and 70.07 ºC, control
and 60RSRI, respectively). This increase in the gelatinization temperature is
explained due to the heat-moisture treatment that occurs during biscuit baking.
Heat-moisture treatment of starches has been shown to produce an increase in
the gelatinization temperature (Hoover, Vasanthan, Senanayake Martin, 1994;
Jacobs & Delcour, 1998).
Table 3. Temperature and enthalpy of starch gelatinization (∆H) o doughs and biscuits corresponden to the control and a resistant starch rich ingredient formulation. Type of sample T (ºC) ∆H
(J/g dried sample) ∆H (J/g dried starch)
Control dough 68.34 3.50 8.10 Control biscuit 71.31 2.25 5.21 60RSRI dough 69.59 1.43 8.50 60RSRI biscuit 70.07 1.12 6.65

CAPÍTULO 1
67
The control dough showed higher enthalpy per weigh of dried sample than the
60RSRI, which is associated to the lower starch content present in the 60RSRI
(wheat flour was replaced by RS). As expected, the enthalpies expressed per
weigh of dried wheat starch were very similar in both doughs (8.1 and 8.5 for
the control and 60RSRI, respectively), as the difference in both doughs were
related to the different amount of raw wheat starch present.
The comparison of the enthalpies per weight of the dried samples, or per weight
of dried wheat starch, reflected a decrease in the transition energy in the
biscuits in comparison to the corresponding doughs (same wheat starch
content), which reflects and increase in the extent of starch gelatinization the
biscuits in comparison to the corresponding doughs. The decrease in the
enthalpy was higher in the control than in the 60RSRI samples, which reflects
the lower starch content available for gelatinizationin the 60RSRI.
The thermograms also reflected the presence of a peak at 100ºC attributed to
dissociation of amylase-lipid complexes in all the samples.
3.4. Biscuit evaluation
3.4.1. Moisture content and water activity
Both the moisture content and the water activity were higher in the biscuits with
the RSRI than in the control (Table 2). This could be attributed to the higher
water retention capacity of the system, which increased in line with the
proportion of the RSRI (see section 3.1). Aparicio-Sanguilán et al. (2007) also
obtained an increase in moisture and water activity for biscuits enriched with a
RS-containing product extracted from bananas; the increase was related to
each material's relative abundance of amorphous starch zones, which had a
considerable influence on water absorption.
CAPÍTULO 1
68
3.4.2. Physical characteristics
Biscuits comprise a matrix and the biscuits' properties are mainly determined by
the volume of air spaces and fat globules, as well as the level of
inhomogeneities (Blaszczak Fornal & Ramy, 2004). The baking process
transforms the dough into a cellular solid with a characteristic final texture
(Chevallier et al., 2000). Because of the CO2 gases produced by the raising
agents and water evaporation, biscuits undergo a substantial expansion early in
baking. The degree of spread is controlled by the spread rate and the set time
which, in turn, depend on the level of water in the dough that is free to act as a
solvent and the strength of the dough (Ram & Singh, 2004). Levine and Slade
(1990) stated that “good” biscuits facilitate expansion without significant
functional network formation followed by structural collapse into a rubbery,
thermoplastic polymer system. Pareyt et al. (2008) and Kweon, Slade, Levine,
Martin and Souza (2009), among others, have recorded changes in biscuit
geometry during baking by taking time-lapse photographs at intervals through a
glass window in the oven door; these experiments have demonstrated the two-
step process mentioned above.
The RSRI used in the present work consists of granules of high-amylose hybrid
maize starch; these high-amylose starches are resistant to the activity of
enzymes. Brown (1996) stated that granules of enzyme-resistant high-amylose
maize starch are not completely gelatinised even at the boiling point of water.
This fact agrees with the DSC experiments where lower enthalpy associated to
starch gelatinization was found in the RSRI containing dough than in the control
dough, as RSRI did not gelatinize at that temperature. Consequently, the effect
of adding the RSRI to formulations will mainly depend on two factors: its greater
water-holding capacity and the lower quantity of wheat proteins as flour
replacement increases; differences as a result of the ungelatinised starch
granule content of the dough would not be expected.
In the present formulations, the control biscuit presented the highest length and
width values (Table 4). In the RSRI biscuits, the higher the amount of RSRI the
CAPÍTULO 1
69
lower the spread, both in length and width, and no change in the thickness of
the biscuits was observed (values very near to 16.4 for all formulations) (data
not shown). The biscuit's dimensions are determined by the spread rate, which
is controlled by the dough consistency and biscuit set time (Miller & Hoseney,
1997). Pareyt et al. (2008) showed that the spread rate decreased linearly with
the gluten level. The RSRI substitution had a diluting effect on the wheat
proteins. The moisture content and the AWRC data (see section 3.1.) for the
different flour/RSRI mixtures showed that the water, which acts as a plasticiser
(Slade, Levine, Ievolella & Wang, 1993), is in a lowering level and is
increasingly retained as the RSRI level in the system rises; a less pronounced
dissolution of the sucrose conducted to a less prononunced volume creation
during baking. This has a knock-on effect in delaying the onset of spread,
another important factor as Pareyt et al. (2008) showed. Sudha et al. (2007)
found that depending on the fibre type (oat, barley, wheat or rice bran) added to
a biscuit formulation, the resistance to extension varied; they attributed this
effect to interaction between the polysaccharides and the protein in the wheat
flour.
The presence of the RSRI reduced the water loss during cooking (Table 2). This
result is in accordance with the higher moisture content and water activity
obtained for the biscuits of all the formulations containing RSRI. These results
were in agreement with the AWRC values for RSRI systems (see section 3.1),
indicating that water management of the system was altered by the
incorporation of the RSRI to replace part of the wheat flour. In addition, it has
been taken into consideration that RSRI-containing dough had a lower moisture
level.

CAPÍTULO 1
70
Table 4. Biscuit physical and texture characteristic for control and resistant starch-rich ingredient (RSRI) formulations.
3- Point Break Test Biscuit sample
Length gain (mm)
Width gain (mm)
Force at break (N)
Gradient (N mm)
Crumbliness (N)
Volodkevich Max Force (N)
Control +13.7 +5.5 17.2a (1.4)
9.6a (0.9)
3.4a (1.1)
12.21a (0.26)
20RSRI +13.0 +9.1 7.5ab (0.7)
4.9c (0.2)
2.6b (0.6)
7.53c (0.50)
40RSRI +10.0 +7.3 7.0bc (0.8)
4.5c (0.3)
1.9b (0.4)
8.65b (0.24)
60RSRI +6.10 +5.2 5.9c (0.6)
6.5b (1.1)
2.2b (0.4)
8.52b (0.54)
Values in parentheses are standard deviations. Means (N=10) in the same column with the same letter do not differ significantly (p<0.05) according to the Tukey test. 3.4.3. Colour
The golden-brown colour of biscuits is mainly caused by reducing sugars-
aminoacid interaction or a Maillard-type reaction, which forms brown polymers
or melanoidins. The colour parameter values (L*, C*, H*, a*, b*) of the biscuits'
upper surface and crumb are shown in Table 5. The surface and crumb of the
control biscuit were significantly darker (L*= 65.99) and slightly yellower than in
biscuits made with RSRI. The addition of the RSRI communicated lightness
both to the surface and to the crumb. Baiuxauli, Salvador and Fiszman (2008)
had already reported that muffins made with increasing amounts of an RSRI
were whiter than the control formulation without the RSRI; they attributed this to
a diluting effect of the RSRI on the pigmented elements (egg yolk) of the
formulation. This could be the case here with the pigmented elements of the
biscuit shortening. In addition, the samples with the RSRI contained a lower
level of wheat proteins and had a higher moisture content, contributing to a
reduction in the Maillard reaction. Gallagher, Kenny, and Arendt (2005) reported
that as the levels of protein substitution increased from 5 to 15% in a short
dough biscuit formulation, L* values decreased. Ozturk, Koksel and Ng (2009)

CAPÍTULO 1
71
also found that crust colour values decreased at 30% addition in several RSRI-
supplemented breads
In terms of the total colour difference (DE*) between the control biscuit and the
biscuits containing the RSRI, the only sample with a crumb colour DE* value
higher than 3 was sample 60RSRI. On the upper surface, all the samples that
contained the RSRI had a DE* of over 4 (data not shown), meaning that all of
them were paler than the control. 60RSRI biscuits would be perceived as
whiter, having higher values of L*, lower values of b* and a less saturated
colour (lower C* values). This means that there was a reduction in the typical
golden or very light brown colour caused by Maillard reactions in the external
crust; although Maillard reactions take place throughout the biscuit dough,
browning takes place more intensely on the external surface, promoted by high
temperatures and a low moisture content. According to Hadiyanto, Asselman,
van Straten, Boom, Esveld and van Boxtel (2007), baking of most products is
finished before caramelisation (and carbonisation) reactions at temperatures
above 150 °C start: even though oven temperatures above 150°C are being
used, the temperature of the surface seldom exceeds this value.
No significant differences in hue (H*) and redness (a*) were found between the
formulations.
However, the colour values of the biscuit surface were darker than the crumb in
all cases, as expected. It is interesting that the addition of the resistant starch
did not alter the colour of the biscuits to any drastic extent. Adding other fibres
such as wheat, oat or rice bran darkens the biscuits considerably, causing
colour value differences of over 3 even at 10% concentrations (Sudha et al.,
2007)
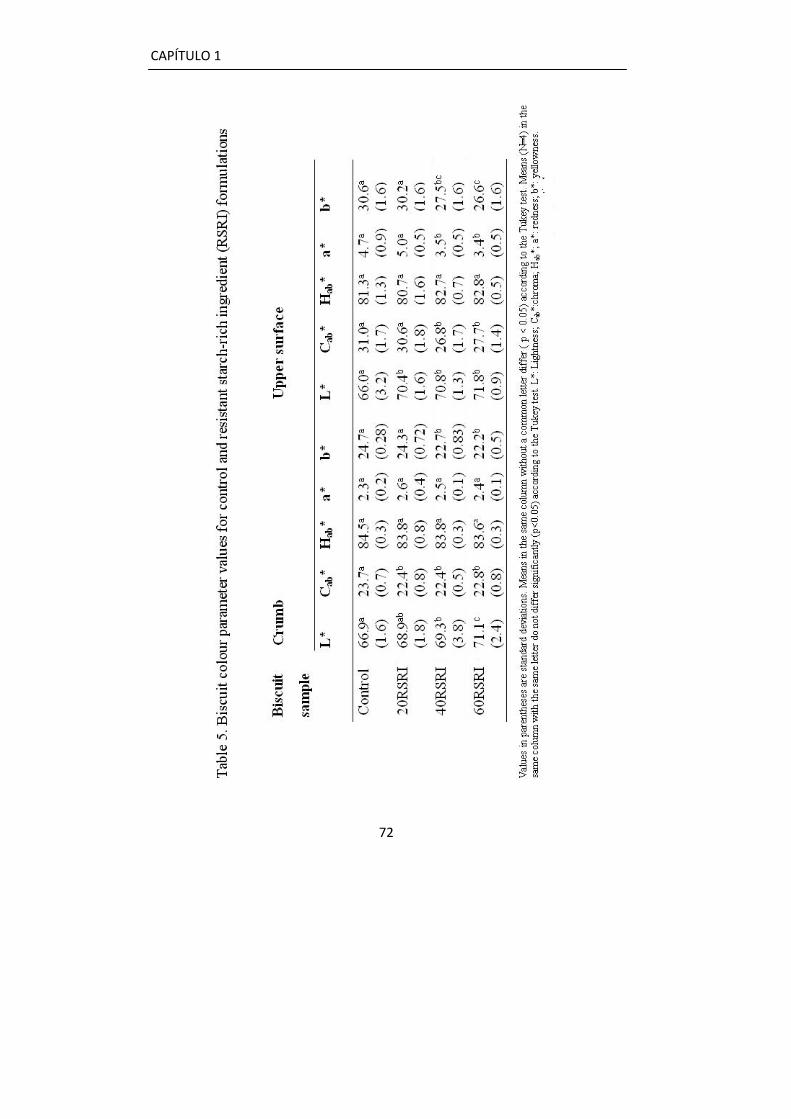
CAPÍTULO 1
72

CAPÍTULO 1
73
3.4.4. Texture analysis
The texture of biscuits can be interpreted in terms of the state of their principal
ingredients. The process of baking a short dough induces a large decrease in
product bulk density, leading to a cellular solid with a thin coloured surface and
a porous inner structure. Kulp, Olewnik and Lorenz (1991) determined that
starch granules remained in their native condition during biscuit baking and did
not form a continuous structure. According to Slade and Levine (1994), biscuit
sugar is in a concentrated solution that delays or prevents starch
gelatinisation/pasting during biscuit baking. Baltsavias, Jurgens and van Vliet
(1999b) showed that irrespective of composition, starch gelatinisation is slight
due to the limited water content coupled with the low baking temperature, giving
a crisp texture. Also, proteins do not aggregate and hydrate enough to form a
gluten network (Chevallier, Della Valle, Colonna, Broyart, & Trystram 2002).
In this case, the quantity and type of both fat and sugar was the same in the
four formulations, the changes in the properties of the doughs and the biscuits
should be interpreted in terms of the water distribution and lower protein content
of the formulations with the RSRI. According to Eliasson and Larsson (1993, p.
263) water plays a complex role, since it determines the conformational state of
biopolymers, affects the nature of interactions between the various constituents
of the formulation and contributes to dough structuring. If the proportion of water
is too low, the dough becomes brittle, not consistent (Sai Manohar & Haridas
Rao 1999). The presence of increasing proportions of the RSRI has the effect of
decreasing total dough moisture level because wheat flour had a higher
moisture level than RSRI; also RSRI diluted the flour proteins which needs to be
taken into account when interpreting the results. Soft wheat flour proteins are
not functionally inert in biscuit dough, especially during baking, when more
associations of proteins probably occur due to increasingly hydration and
proximity, affecting biscuit texture (Gaines 1990).
3.4.4.1. 3-Point Break Test. All the biscuits fractured in tension and the fracture
took place relatively close to their central zone, where maximum stress

CAPÍTULO 1
74
occurred. This implies that the condition regarding the distance between
supports was satisfied. The control biscuit slope (Fig. 3) is typical of the force-
deformation curves described for materials exhibiting brittle fracture,
characterized by an essentially elastic response and a small fracture strain.
However, a somewhat shoulder-shaped part appeared in the curve just before
fracture; this could imply some plastic deformation in the vicinity of the crack.
This behaviour is highly dependent on the proportion of the biscuit ingredients.
Nevertheless, what is important is the comparison between the control and the
other formulations.
Figure 3. Effect of partial replacement of wheat flour with and RSRI on the beaking strength of biscuits. Black: control, red:20RSRI, blue: 40RSRI, green: 60RSRI.
The highest value of force at break corresponded to the control biscuit (Table
4), indicating a more interconnected, structured matrix, probably due to the
higher level of wheat proteins in the control samples. The biscuits containing the
RSRI showed curves characterized by a lower initial force gradient and lower
peak force values, indicating lower resistance to snapping. In particular, for
60RSRI biscuit, bending strength is even lower and the peak value was
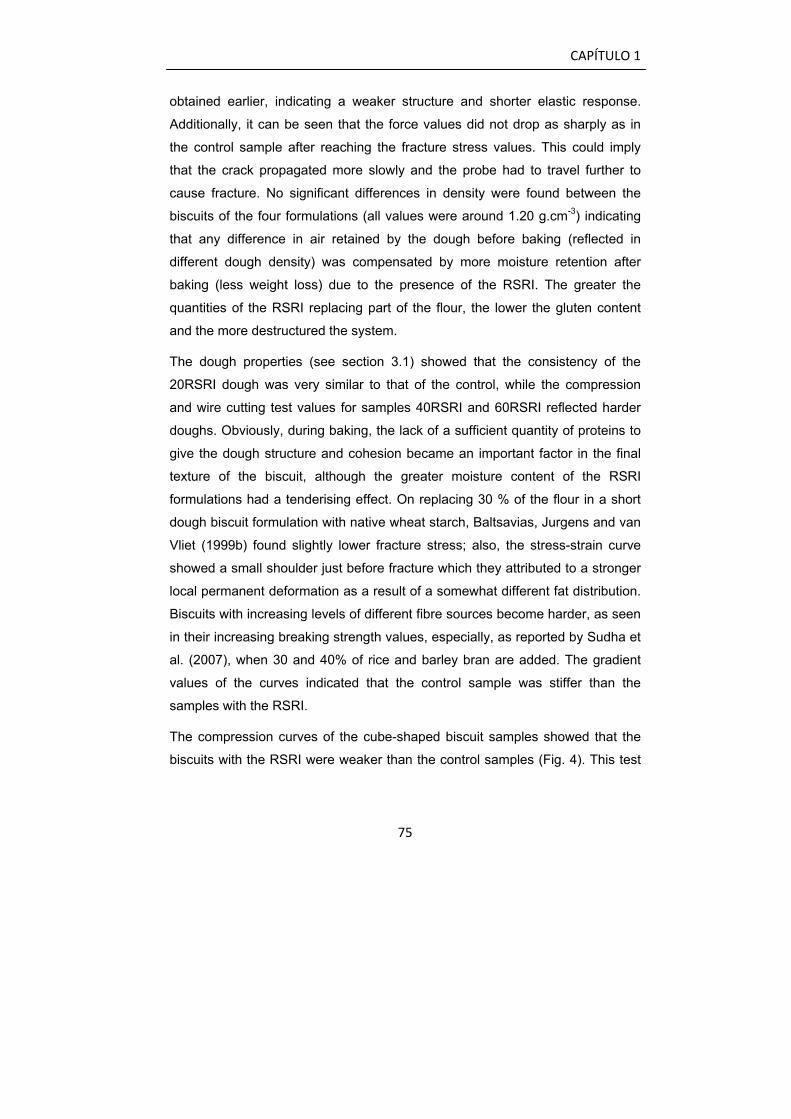
CAPÍTULO 1
75
obtained earlier, indicating a weaker structure and shorter elastic response.
Additionally, it can be seen that the force values did not drop as sharply as in
the control sample after reaching the fracture stress values. This could imply
that the crack propagated more slowly and the probe had to travel further to
cause fracture. No significant differences in density were found between the
biscuits of the four formulations (all values were around 1.20 g.cm-3) indicating
that any difference in air retained by the dough before baking (reflected in
different dough density) was compensated by more moisture retention after
baking (less weight loss) due to the presence of the RSRI. The greater the
quantities of the RSRI replacing part of the flour, the lower the gluten content
and the more destructured the system.
The dough properties (see section 3.1) showed that the consistency of the
20RSRI dough was very similar to that of the control, while the compression
and wire cutting test values for samples 40RSRI and 60RSRI reflected harder
doughs. Obviously, during baking, the lack of a sufficient quantity of proteins to
give the dough structure and cohesion became an important factor in the final
texture of the biscuit, although the greater moisture content of the RSRI
formulations had a tenderising effect. On replacing 30 % of the flour in a short
dough biscuit formulation with native wheat starch, Baltsavias, Jurgens and van
Vliet (1999b) found slightly lower fracture stress; also, the stress-strain curve
showed a small shoulder just before fracture which they attributed to a stronger
local permanent deformation as a result of a somewhat different fat distribution.
Biscuits with increasing levels of different fibre sources become harder, as seen
in their increasing breaking strength values, especially, as reported by Sudha et
al. (2007), when 30 and 40% of rice and barley bran are added. The gradient
values of the curves indicated that the control sample was stiffer than the
samples with the RSRI.
The compression curves of the cube-shaped biscuit samples showed that the
biscuits with the RSRI were weaker than the control samples (Fig. 4). This test
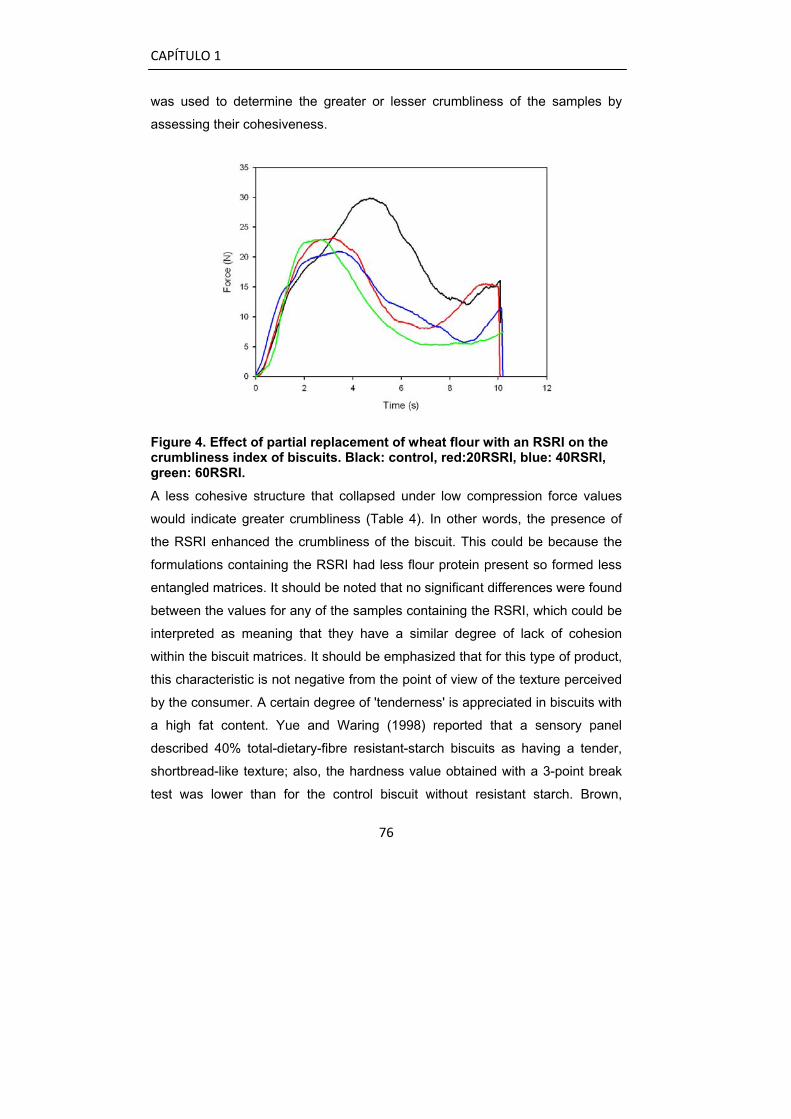
CAPÍTULO 1
76
was used to determine the greater or lesser crumbliness of the samples by
assessing their cohesiveness.
Figure 4. Effect of partial replacement of wheat flour with an RSRI on the crumbliness index of biscuits. Black: control, red:20RSRI, blue: 40RSRI, green: 60RSRI.
A less cohesive structure that collapsed under low compression force values
would indicate greater crumbliness (Table 4). In other words, the presence of
the RSRI enhanced the crumbliness of the biscuit. This could be because the
formulations containing the RSRI had less flour protein present so formed less
entangled matrices. It should be noted that no significant differences were found
between the values for any of the samples containing the RSRI, which could be
interpreted as meaning that they have a similar degree of lack of cohesion
within the biscuit matrices. It should be emphasized that for this type of product,
this characteristic is not negative from the point of view of the texture perceived
by the consumer. A certain degree of 'tenderness' is appreciated in biscuits with
a high fat content. Yue and Waring (1998) reported that a sensory panel
described 40% total-dietary-fibre resistant-starch biscuits as having a tender,
shortbread-like texture; also, the hardness value obtained with a 3-point break
test was lower than for the control biscuit without resistant starch. Brown,
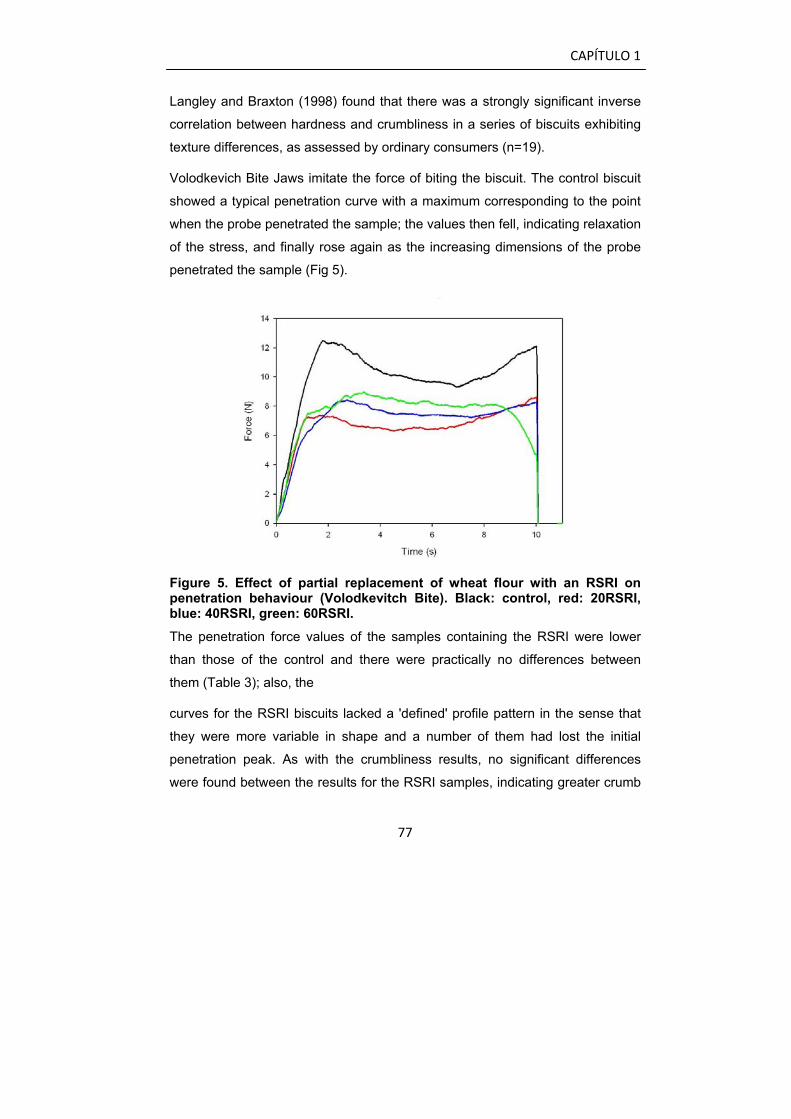
CAPÍTULO 1
77
Langley and Braxton (1998) found that there was a strongly significant inverse
correlation between hardness and crumbliness in a series of biscuits exhibiting
texture differences, as assessed by ordinary consumers (n=19).
Volodkevich Bite Jaws imitate the force of biting the biscuit. The control biscuit
showed a typical penetration curve with a maximum corresponding to the point
when the probe penetrated the sample; the values then fell, indicating relaxation
of the stress, and finally rose again as the increasing dimensions of the probe
penetrated the sample (Fig 5).
Figure 5. Effect of partial replacement of wheat flour with an RSRI on penetration behaviour (Volodkevitch Bite). Black: control, red: 20RSRI, blue: 40RSRI, green: 60RSRI.
The penetration force values of the samples containing the RSRI were lower
than those of the control and there were practically no differences between
them (Table 3); also, the
curves for the RSRI biscuits lacked a 'defined' profile pattern in the sense that
they were more variable in shape and a number of them had lost the initial
penetration peak. As with the crumbliness results, no significant differences
were found between the results for the RSRI samples, indicating greater crumb

CAPÍTULO 1
78
tenderness than in the control sample. None of these methods distinguished
between different levels of the RSRI. Gaines, Kassuba and Finney (1996) used
a puncture test on various biscuits and reported that the fracture force rose with
increasing flour protein content. In the present case, the RSRI dilutes the
protein content of the flour.
3.4.5. Sensory analysis
Four biscuits (one of each formulation) were monadically given to consumers
who were free to taste as much as necessary to rate the acceptability of each of
the six attributes to be analysed. None of the consumers mentioned any fatigue
or sense of fullness that could affect their scores. The mean sensory
acceptance scores for the ‘appearance’, ‘colour’, ‘texture’, ‘taste’ and
‘sweetness’, and ‘overall acceptance’ of biscuits with different RSRI levels are
presented in Figure 6.
Figure 6. Sensory hedonic tests of biscuits prepared with different levels of an RSRI. 1=dislike extremely. Black: control, red: 20RSRI, blue: 40RSRI, green: 60RSRI.
The acceptance scores for the control and 20RSRI biscuits were not
significantly different for any of the sensory attributes. 40RSRI obtained lower
scores only for appearance, colour and texture, whereas the taste, sweetness
and overall acceptance values showed no significant differences compared to
the control and 20RSRI samples. The 60RSRI biscuit was the least acceptable
sample. None of the consumers observed the dry mouth feel, lack of
CAPÍTULO 1
79
smoothness in the biscuit surface or dark crumb colour reported by Sudha et al.
(2007) for biscuits prepared with different bran sources.
Consumption intention values, expressed as the percentage of consumers that
answered “yes” to the question Would you consume this product?, were 76, 74,
66, and 43% for the control, 20, 40, and 60RSRI biscuits respectively, a
consumption intention of over 50% for all the formulations except the 60RSRI
biscuits. Baixauli, Salvador, Hough et al. (2008) stated that consumers
generally identified fibre-enriched products with dark products, so when using
an alternative fibre such as the RSRI, which is white (the final products were not
darker), it is advisable to give consumers more information on what these fibres
are and thereby provide them with better criteria on which to base their choice.
This study has shown the good potential of a resistant starch rich ingredient
(RSRI) for developing fibre-rich biscuits with the aim of developing products that
increase dietary fibre intake by substituting this ingredient for part of the flour in
the formulation. Replacing 20% of the wheat flour with the RSRI did not affect
the dough rheology, while higher proportions gave stiffer doughs. In the baked
biscuits, replacing part of the flour with the RSRI gave crumblier, tenderer, less
hard textures and shapes that spread less. Consumer acceptance of the
biscuits was good and significant differences were practically non-existent
except in the 60RSRI formulation, which was significantly less acceptable.
References
AACC International. (2009). Approved methods of analysis. Method 56-10.02,
44-40.01, 32-40.01, 32-07.01. (11 th Ed.). St. Paul, MN, U.S.A.: AACC
International.
Aparicio-Sanguilán, A., Sáyago-Avendi, S. G., Vargas-Torres, A., Tovar, J.,
Ascensio-Otero, T. E., & Bello-Pérez, L. A. (2007). Slowly digestible cookies
prepared from RS-rich lintnerized banana starch. Journal of Food
Composition and Analysis, 20, 175-181.
CAPÍTULO 1
80
Asp, N. G. (1992). Resistant Starch. Proceedings from the 2nd plenary meeting
on EURESTA. Physiological Implications of the Consumption of Resistant
Starch in Man. European Journal of Clinical Nutrition, 46, supplement 2, S1-
S148.
Babcock, D. (1987). Rice bran as a source of dietary fibre. Cereal Foods World,
32, 538-540.
Baixauli, R., Salvador, A., & Fiszman, S. M. (2008a). Textural and colour
changes during storage and sensory shelf life of muffins containing resistant
starch. European Food Research and Technology, 226, 523-530.
Baixauli, R., Salvador, A, Hough, G., & Fiszman, S. M. (2008b). How
information about fibre (traditional and RS) influences consumer
acceptance of muffins. Food Quality and Preference, 19, 628-635.
Baltsavias A., Jurgens A., & van Vliet, T. (1999a). Rheological Properties of
Short Doughs at Large Deformation. Journal of Cereal Science, 29, 33-42.
Baltsavias A., Jurgens A., & van Vliet, T. (1999b). Fracture Properties of Short-
Dough Biscuits: Effect of Composition. Journal of Cereal Science, 29, 235-
244.
Blaszczak, W., Fornal, J., & Ramy, A. (2004). Effect of emulsifiers’ addition on
dough properties, backing quality and microstructure of biscuits. Poland.
Journal Food Nutrition Science, 13/54, 343–348.
Brown, I. (1996). Complex carbohydrates and resistant starch. Nutrition
Reviews 54, S115–S119.
Brown, W. E., Langley, K. R., & Braxton, D. (1998). Insight into consumers'
assessments of biscuit hardness versus crunchiness texture based on
mastication analysis. Journal of Texture Studies, 29, 481-497.
Champ M. (2004). Resistant starch. In Eliasson AC (ed.) Starch in food:
structure, function and applications. Woodhead Publishing Ltd, Cambridge.
CAPÍTULO 1
81
Chevallier, S., Colonna, P., Buléon, A., & Della Valle, G. (2000).
Physicochemical Behaviors of Sugars, Lipids, and Gluten in Short Dough
and Biscuit. Journal of Agricultural and Food Chemistry, 48, 1322-1326.
Chevallier, S., Della Valle, G., Colonna, P., Broyart, B., & Trystram, G. (2002).
Structural and Chemical Modifications of Short Dough during Baking.
Journal of Cereal Science, 35, 1-10.
Dunn P. D., Burton, J. D., Xu X., & Atkins, A. G. (2007). Paths swept out by
initially slack flexible wires when cutting soft solids; when passing through a
very viscous medium; and during regelation. Proceedings of the Royal
Society A, 463 (2077), 1-20.
Eerlingen, R. C., Jacobs, H., & Delcour, J. A. (1994). Enzyme-resistant starch.
V. Effect of retrogradation of waxy maize starch on enzyme susceptibility.
Cereal Chemistry, 71, 351-355.
Eerlingen, R. C., Van den Broeck, I., Delcour, J. A., Slade, L., & Levine, H.
(1994). Enzyme-resistant starch. VI. Influence of sugars on resistant starch
formation. Cereal Chemistry, 71, 472-476.
Eerlingen, R. C., Van Haesendonck, I. P., de Paepe, G., & Delcour, J. A.
(1994). Enzymeresistant starch. III. The quality of straight-dough bread
containing varying levels of enzyme-resistant starch. Cereal Chemistry, 71,
165-170.
Eliasson, A. C., & Larsson, K. (1993). Cereals in breadmaking: A molecular
colloidal approach (p. 263). New York: Marcel Dekker.
Francis, F. J., & Clydesdale, F. M. (1975). Food Colourimetry: Theory and
Applications. The Avi Publishing Company, Inc, Westport, Connecticut.
Gaines, C. S., Kassuba, A., & Finney, P. L. (1996). Using wire-cut and suger-
snap formula cookie test baking methods to evaluate distinctive soft wheat
flour sets: implication for quality testing. Cereal Foods World, 41, 155-160.
CAPÍTULO 1
82
Gaines, C. S. (1990). Influence of chemical and physical modification of soft
wheat protein on sugar-snap cookie dough consistency, cookie size and
hardness. Cereal Chemistry, 67, 73-77.
Gallagher, E., Kenny, S., & Arendt, E. K. (2005). Impact of dairy protein
powders on biscuit quality. European Food Research and Technology, 221,
237- 243.
Goh, S. M., Charalambides, M. N., & Williams, J. G. (2005). On the mechanics
of wire cutting of cheese. Engineering Fracture Mechanics, 72, 931-946.
HadiNezhad, M., & Butler, F. (2009). Effect of flour type and dough rheological
properties on cookie spread measured dynamically during baking. Journal
of Cereal Science, 49, 178–183.
Hadiyanto, H., Asselman, A., van Straten, G., Boom, R. M., Esveld, D. C., & van
Boxtel, A. J. B. (2007). Quality prediction of bakery products in the initial
phase of process design. Innovative Food Science and Emerging
Technologies, 8, 285–298.
Haralampu, S. G. (2000). Resistant starch—a review of the physical properties
and biological impact of RS3. Carbohydrate Polymers, 41, 285-292.
Hoover, R., Vasanthan, T., Senanayake, N. J., & Martin, A. M. (1994). The
effects of defatting and heat-moisture treatment on the retrogradation of
starch gels from wheat, oat, potato, and lentil. Carbohydrate Research, 261,
13-24.
Hudson, C. A., Chiu, M. M., & Knuckles, B. E. (1992). Development and
characteristics of high-fibre muffins with oat bran, rice bran, or barley fibre
fractions. Cereal Foods World, 37 (5), 373-376, 378.
Jacobs, H., & Delcour, J. A. (1998). Hydrothermal modifications of granular
starch, with retention of the granular structure: a review. Journal of
Agricultural and Food Chemistry, 46, 2895-2905.
CAPÍTULO 1
83
Khan, M. N., Hagenmaier, R. D., Rooney, L. W., & Mattil, K. F. (1976). High
fibre coconut products for baking systems. The Baker’s Digest, 50, 19–25.
Kulp, K., Olewnik, M., Lorenz, K. (1991). Starch Functionality in Cookie
Systems. Starch, 43, 53-57.
Kweon, M., Slade, L., Levine, H., Martin, R., & Souza, E. (2009). Exploration of
Sugar Functionality in Sugar-Snap and Wire-Cut Cookie.Baking:
Implications for Potential Sucrose Replacement or Reduction. Cereal
Chemistry, 86(4), 425-433.
Leelavathi, K., & Rao, P. H. (1993). Development of high fibre Biscuits using
wheat bran. Journal of Food Science and Technology, 30, 187-191.
Levine, H., & Slade, L. 1990. Influences of the glassy and rubbery states on the
thermal, mechanical, and structural properties of doughs and baked
products. In H. Faridi and J. M. Faubion. Dough Rheology and Baked
Product Texture: Theory and Practice (pp 157-330) New York: Van
Nostrand Reinhold.
Loening-Baucke, V., Miele, E., & Staiano, A. (2004). Fiber (Glucomannan) Is
Beneficial in the Treatment of Childhood Constipation. Pediatrics, 113, 259-
264.
Miller R. A., & Hoseney, R. C. (1997). Factors in hard wheat flour responsible
for reduced cookie spread. Cereal Chemistry, 74, 330-336.
Nilsson, A. C., Ostman, E. M., Holst, J. J., & Bjorck, I. M. E. (2008). Including
indigestible carbohydrates in the evening meal of healthy subjects improves
glucose tolerance, lowers inflammatory markers, and increases satiety after
a subsequent standardized breakfast. Journal of Nutrition, 138 (4), 732-739.
Ozturk, S., Koksel, H., & Ng, P. K. W. (2009). Farinograph properties and bread
quality of flours supplemented with resistant starch. International Journal of
Food Science and Nutrition, 60 (6), 449-457.
CAPÍTULO 1
84
Pareyt, B., Wilderjans, E., Goesaert, H., Brijs, K., & Delcour, J. A. (2008). The
role of gluten in a sugar-snap cookie system: A model approach based on
gluten-starch blends. Journal of Cereal Science, 48, 863-869.
Prentice, N., Kissell, L. T., Lindsay, R. C., & Yamazaki, W. T. (1978). High fibre
cookies containing brewers’ spent grain. Cereal Chemistry, 55, 712-721.
Ram, S., & Singh, R. P. (2004). Solvent retention capacities of Indian wheats
and their relationships with cookie-making quality. Cereal Chemistry, 81,
128-133.
Sai Manohar, R. & Haridas Rao, P. (1999). Effect of emulsifiers, fat level and
type on the rheological characteristics of biscuit dough and quality of
biscuits. Journal of the Science of Food and Agriculture, 79, 1223-1231.
Saunders, R. M. (1989). Development of new rice products as a consequence
of bran stabilization. Bulletin Association of Operative Millers, Oct., 5559-
5561.
Shahidi, F. (2000). Antioxidants in food and food antioxidants. Die Nahrung,
44(3),158-63.
Skurray, G. R., Wooldridge, D. A., & Nguyen, M. (1986). Rice bran as a source
of dietary fibre in bread. Journal of Food Technology, 21, 727-730.
Slade, L., & Levine, H. (1994). Structure-function relationships of cookie and
cracker ingredients. In H. Faridi, ed. Chapman and Hall. The Science of
Cookie and Cracker Production, New York. pp 23-141.
Slade, L., Levine, H., Ievolella, J. & Wang, M. (1993). The glassy state
phenomenon in applications for the food industry: application of the food
polymer science approach to structure-function relationships of sucrose in
cookie and cracker systems. Journal of the Science of Food and Agriculture
63(2), 133 -176.

CAPÍTULO 1
85
Sudha, M. L., Vetrimani, R., & Leelavathi, K. (2007). Influence of fibre from
different cereals on the rheological characteristics of wheat flour dough and
on biscuit quality. Food Chemistry, 100, 1365-1370.
Yue, P, & Waring, S. (1998). Functionality of RS in food application. Food
Australia, 50, 615-621.

STUDY ON RESISTANT STARCH FUNCTIONALITY IN SHORT DOUGH
BISCUITS BY OSCILLATORY AND CREEP AND RECOVERY TEST
Laura Laguna, María Jesús Hernández, Ana Salvador, and Teresa Sanz
Food Bioprocess and Technology DOI 10.1007/S11947-012-0785-X

CAPÍTULO 1
89
Abstract
The effect of wheat flour replacement by a resistant starch rich ingredient
(RSRI) on the structure of short dough biscuits was studied by oscillatory and
creep and recovery tests to determine linear viscoelastic properties. The RSRI
was substituted for the flour at three different levels: 20, 40 and 60% (w/w). The
use of RSRI increased the elastic and the viscous moduli but did not influence
tanδ. The compliance values during the creep test were adjusted successfully to
the Burger model. The creep and recovery test revealed an increase in elasticity
and resistance to flow and a decrease in deformability with RSRI, but the
differences were only significant at the 40% and 60% levels. The RSRI did not
affect relative recovery, thus no effect on the type of structure is expected.
Deformability was positively correlated with biscuit spread during baking.
Key words: short dough, biscuit, rheology, oscillatory, creep-recovery
CAPÍTULO 1
90
1. Introduction
Biscuits can be good fibre carriers because are widely consumed. Previous
work showed the possibility to incorporate resistant starch, as a source of fibre
in biscuits, with good consumer acceptability. The resistant starch rich
ingredient (RSRI) was added to short dough biscuits, replacing wheat flour, and
its effect on dough and biscuit texture was studied by empirical instrumental
tests and by sensory analysis (Laguna et al., 2011). The RSRI increased the
consistency of the raw dough and the ease of sheeting and cutting. Replacing
20% of the wheat flour with RSRI did not affect the dough texture significantly,
while higher proportions gave stiffer dough’s. In the baked biscuits, replacing
part of the flour with the RSRI gave crumblier, tenderer, less hard textures and
shapes that spread less. Resistant starches are broadly researched due to their
important benefits in the human nutrition (Hodsagi et al. 2011).
To increase the knowledge about the inner structure of the dough and the
relation to the microstructure, fundamental rheological measurements are
required (Menjivar 1990)
Oscillatory and creep-recovery are fundamental tests that measure the linear
viscoelastic properties of a substance. The stress applied to the sample in the
linear viscoelastic region is low enough not to produce an irreversible change in
the structure, so information about the unaltered system structure is obtained.
In an oscillatory test the sample is submitted to an oscillatory shear movement
of a certain frequency and stress (or strain) amplitude inside the linear region
and the strain (or stress) produced is measured (Barnes 2000).
The linear viscoelastic properties of biscuit doughs have been studied by a
number of authors. Baltsavias et al. (1997) evaluated the linear viscoelastic
properties of short-doughs with various compositions. They concluded that fat
was a crucial structural component; decreasing the fat content or replacing solid
fat with liquid oil caused a marked decrease in the stiffness of the dough and
greater dispersal of the fat in the dough. Also, the authors (Baltsavias et al.,
CAPÍTULO 1
91
1997) studied the effect of flour replacement by native starch and observed a
quantitative decrease in the viscoelastic modulus and the absence of gluten
was expected to affect water distribution and, thereby, the rheological properties
of the non fat phase. The contribution of other flour components like damaged
starch, which increase short dough consistency, or pentosans, which decrease
G’, was difficult to establish, as it was not possible to separate the effects due to
the gluten, pentosans and damaged starch. As for the role of sucrose, it
increased the liquid-like properties of the dough, because sucrose modifies the
properties of the non-fat phase via its influence on the amount of solvent.
The effect of endogenous flour lipids on the structure of semi-sweet doughs and
short doughs has been studied by oscillatory tests (Papantoniou et al., 2003;
Papantoniou et al., 2004). The employment of defatted flour produced higher
viscoelasticity and the microstructure of the defatted short dough biscuits
revealed that their gluten protein was more hydrated and developed. It was
suggested that polar lipids form bonds with the protein molecules and help to
control the access of water to the proteins (Papantoniou et al., 2004).
Creep and recovery are transient tests in which an instantaneous stress in the
lineal viscoelastic region is applied to the sample for a certain time (creep) and
after removal of the stress the deformation is measured (recovery). The system
deformation per unit stress is called compliance and is measured over time.
The mathematical treatment of the theory of creep and recovery uses model
substances such as springs and dashpots (Schramm 1994). One of the most
widely used model is the four-components Burguer model, comprising the
association in series of the Maxwell model (association of spring and dashpot in
series) and the Kelvin-Voigt model (parallel association) (Dolz et al., 2008).
Pedersen et al., (2004) used oscillatory and creep-recovery tests to study the
linear viscoelastic properties of semi-sweet biscuit doughs made with flours
from eight different cultivars and related them to changes in biscuit dimension.
The decrease in biscuit length was correlated to the phase angle δ the
farinograph and the creep recovery parameters. Pedersen et al. (2005) also
CAPÍTULO 1
92
evaluated the effect of adding sodium meta-bisulphite and a commercial
protease. An increase in dough extensibility and a decrease in elasticity were
observed. Biscuit contraction and spread were mostly correlated to % recovery
of the dough and to protein and gluten content.
However, in spite of the volume of studies on rheology and texture of dough, we
are not aware of any detailed studies that have described the oscillatory or
creep and recovery behaviours of short dough biscuits containing resistant
starches, with established mathematical models.
The aim of the present study was to understand the functionality of RSRI in the
short dough biscuit structure by studying the linear viscoelastic properties
(oscillatory and creep and recovery tests) of the dough. The rheological results
were described according to mathematical models and related to previous
results from empirical tests carried out in the biscuit dough and in baked
biscuits.
2. Material and methods
2.1. Short dough biscuit ingredients
Four formulations were prepared using the same quantity of all the ingredients
except the wheat flour and RSRI (a resistant starch rich ingredient) as shown in
Table1.
2.2. Short dough biscuit preparation
The shortening was creamed in a mixer (Kenwood Major Classic, UK) for 4
minutes at minimum speed (60 rpm) to obtain a homogenous cream. After this,
the sugar was added and mixed in for 2 min at speed 4 (255 rpm). The milk
powder, previously dissolved in all the water, was added and mixed in for 2 min
at the minimum speed. The flour (or flour/RSRI), sodium bicarbonate and
ammonium hydrogen carbonate were then mixed in together at minimum speed
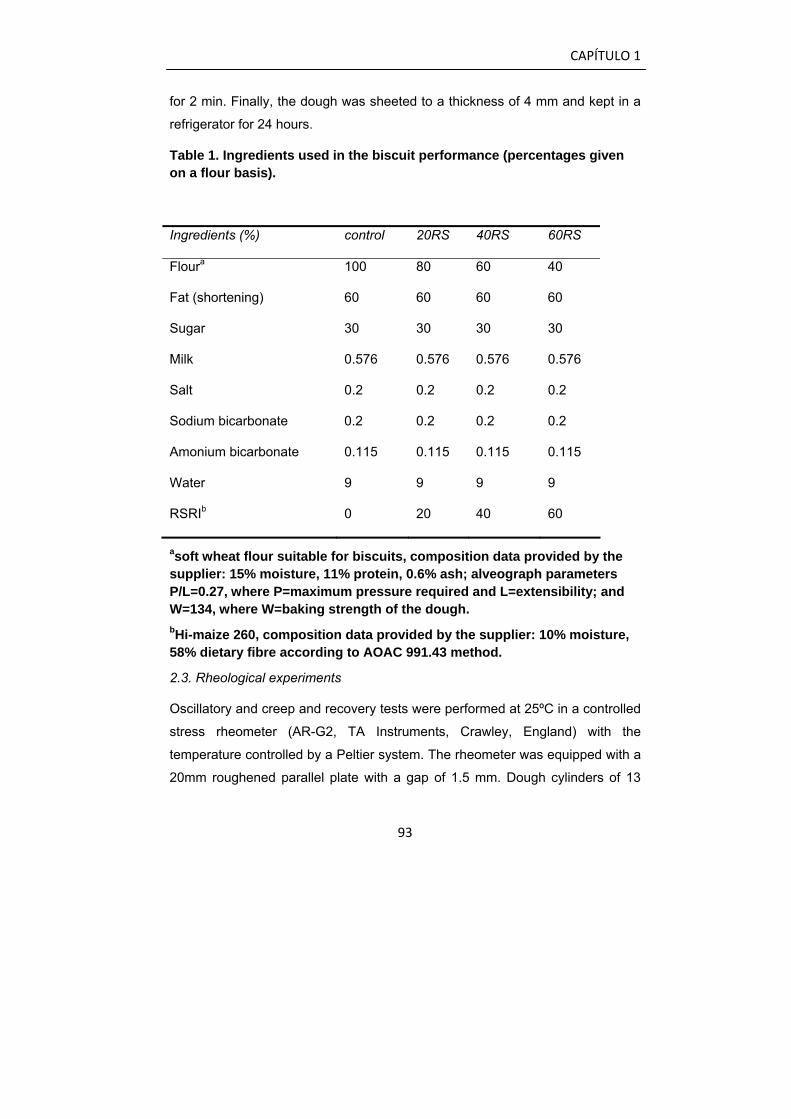
CAPÍTULO 1
93
for 2 min. Finally, the dough was sheeted to a thickness of 4 mm and kept in a
refrigerator for 24 hours.
Table 1. Ingredients used in the biscuit performance (percentages given on a flour basis).
asoft wheat flour suitable for biscuits, composition data provided by the supplier: 15% moisture, 11% protein, 0.6% ash; alveograph parameters P/L=0.27, where P=maximum pressure required and L=extensibility; and W=134, where W=baking strength of the dough. bHi-maize 260, composition data provided by the supplier: 10% moisture, 58% dietary fibre according to AOAC 991.43 method.
2.3. Rheological experiments
Oscillatory and creep and recovery tests were performed at 25ºC in a controlled
stress rheometer (AR-G2, TA Instruments, Crawley, England) with the
temperature controlled by a Peltier system. The rheometer was equipped with a
20mm roughened parallel plate with a gap of 1.5 mm. Dough cylinders of 13
Ingredients (%) control 20RS 40RS 60RS
Floura 100 80 60 40
Fat (shortening) 60 60 60 60
Sugar 30 30 30 30
Milk 0.576 0.576 0.576 0.576
Salt 0.2 0.2 0.2 0.2
Sodium bicarbonate 0.2 0.2 0.2 0.2
Amonium bicarbonate 0.115 0.115 0.115 0.115
Water 9 9 9 9
RSRIb 0 20 40 60

CAPÍTULO 1
94
mm internal diameter were placed on the rheometer. The samples were allowed
to rest in the measurement position for a 10 min equilibration time.
2.3.1. Oscillatory tests
A stress sweep test was carried out to determine the linear viscoelastic region,
after which frequency sweeps were conducted from 10-0.01Hz at stress
amplitude of 20 Pa within the linear viscoelastic region. The storage modulus
(G’), loss modulus (G’’) and loss tangent (tanδ = G’’/G’) values were recorded.
2.3.2. Creep and recovery tests
An instantaneous stress, σ0, was applied within the linear viscoelastic region
and maintained for 1200s. The stress was then removed and the sample was
allowed to relax for 1200s. The system deformation per unit stress, called
compliance, was measured by the following formula: J(t) = γ (t)/ σ0.
Each measurement was carried out 3 times in doughs prepared on different
days. To protect against dehydration, vaseline oil (Panreac, Spain) was applied
to the exposed surfaces of all the samples.
For the entire rheological values non-linear curve fitting is applied to the data
using the Levenberg-Marquardt algorithm (KaleidaGraph 4.0, Synergy
Software). This is a non-linear iterative method, so an initial value for each
parameter is supplied. They are improved in each interaction until a correct
order of magnitude previously established.
2.4. Statistical analysis
Analysis of variance (one way-ANOVA) was applied to study the differences
between formulations; the least significant differences were calculated by the
Tukey test and the significance at p<0.05 was determined. Principal component
analysis (PCA) was used to correlate the sensory and instrumental parameters.
These analyses were performed using SPSS for Windows Version 12 (SPSS
Inc., USA).
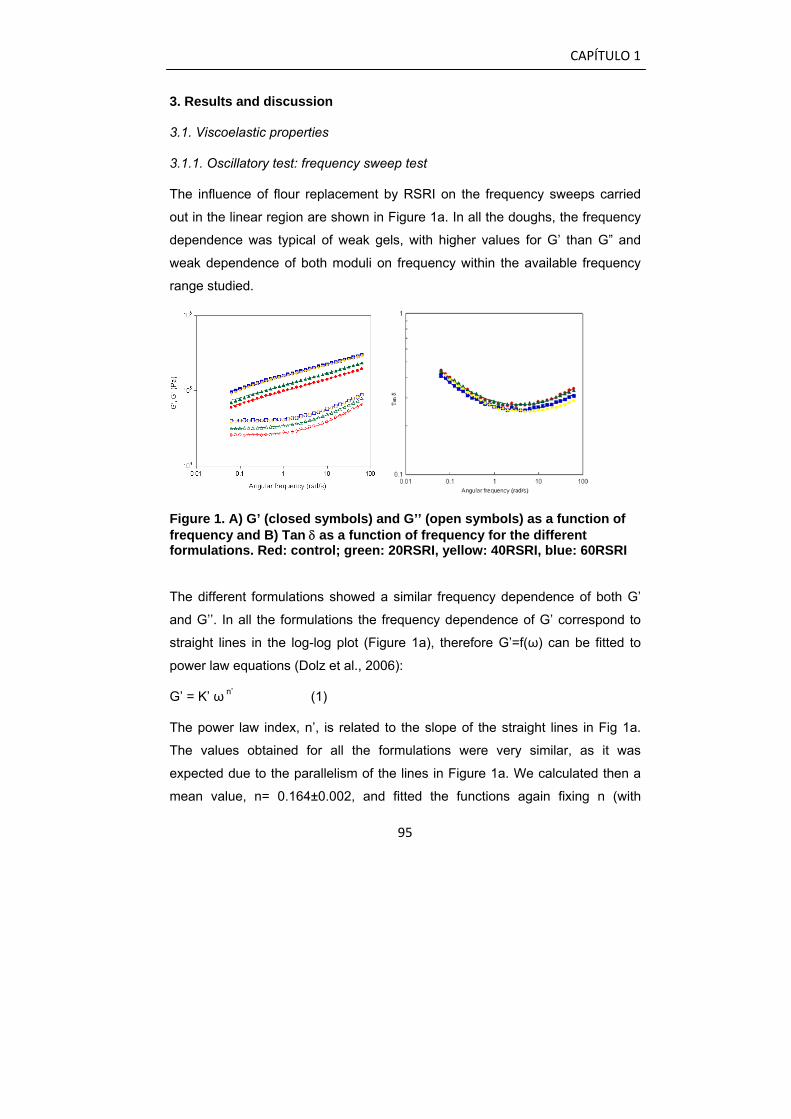
CAPÍTULO 1
95
3. Results and discussion
3.1. Viscoelastic properties
3.1.1. Oscillatory test: frequency sweep test
The influence of flour replacement by RSRI on the frequency sweeps carried
out in the linear region are shown in Figure 1a. In all the doughs, the frequency
dependence was typical of weak gels, with higher values for G’ than G” and
weak dependence of both moduli on frequency within the available frequency
range studied.
Figure 1. A) G’ (closed symbols) and G’’ (open symbols) as a function of frequency and B) Tan δ as a function of frequency for the different formulations. Red: control; green: 20RSRI, yellow: 40RSRI, blue: 60RSRI
The different formulations showed a similar frequency dependence of both G’
and G’’. In all the formulations the frequency dependence of G’ correspond to
straight lines in the log-log plot (Figure 1a), therefore G’=f(ω) can be fitted to
power law equations (Dolz et al., 2006):
G’ = K’ ω n’ (1)
The power law index, n’, is related to the slope of the straight lines in Fig 1a.
The values obtained for all the formulations were very similar, as it was
expected due to the parallelism of the lines in Figure 1a. We calculated then a
mean value, n= 0.164±0.002, and fitted the functions again fixing n (with
CAPÍTULO 1
96
R>0.996). The values obtained for K’ are shown in Table 2. They correspond to
the values of storage modulus for ω = 1 rad/s.
The G” values also showed a similar dependence with frequency in all the
samples, which were adjusted to the following empirical equation (Dolz et al.,
2006):
G” = K” – Z exp (10 – T ω n“) (2)
In order to simplify and make easier the discussion, we reduced the number of
parameters in eq. (2). As the values obtained for Z and n” were similar, we
refitted the functions fixing Z and n”, using the mean values, Z= 2.81±0.23 Pa
and n” = 0.80±0.02 (R >0.998). Values obtained for K” and T are shown in
Table 2. The parameter T gives information about dependence with frequency.
Their values are not statistically different, as it was expected when observing
Figure 1a. The parameter K” corresponds to the G’’ values for very low
frequencies.
Replacing flour with RSRI increased the values of G’ and G’’, which is reflected
in the increase in the parameters K’ and K”. The control dough showed the
lowest values of both parameters, followed in increasing order by 20RSRI,
40RSRI and 60RSRI. However, the differences with the control sample were
only significant for the higher levels of flour replacement (40RSRI and 60RSRI).
Tanδ values versus frequency are shown in Figure 1b. The tan δ values reflect
the existence of more solid behaviour (tanδ closer to 0) at higher frequencies
(shorter time) and a more liquid behaviour (tanδ closer to 1) at lower
frequencies (longer time). The frequency dependence of tan δ can be fitted to
the following equation:
log (tanδ) = A (log ω)2 + Β (log ω)+C (3)
As the values obtained for A were similar, the average value of A were
calculated being 0.154±0.003 (R>0.996). The values of B and C are shown in
Table 2.
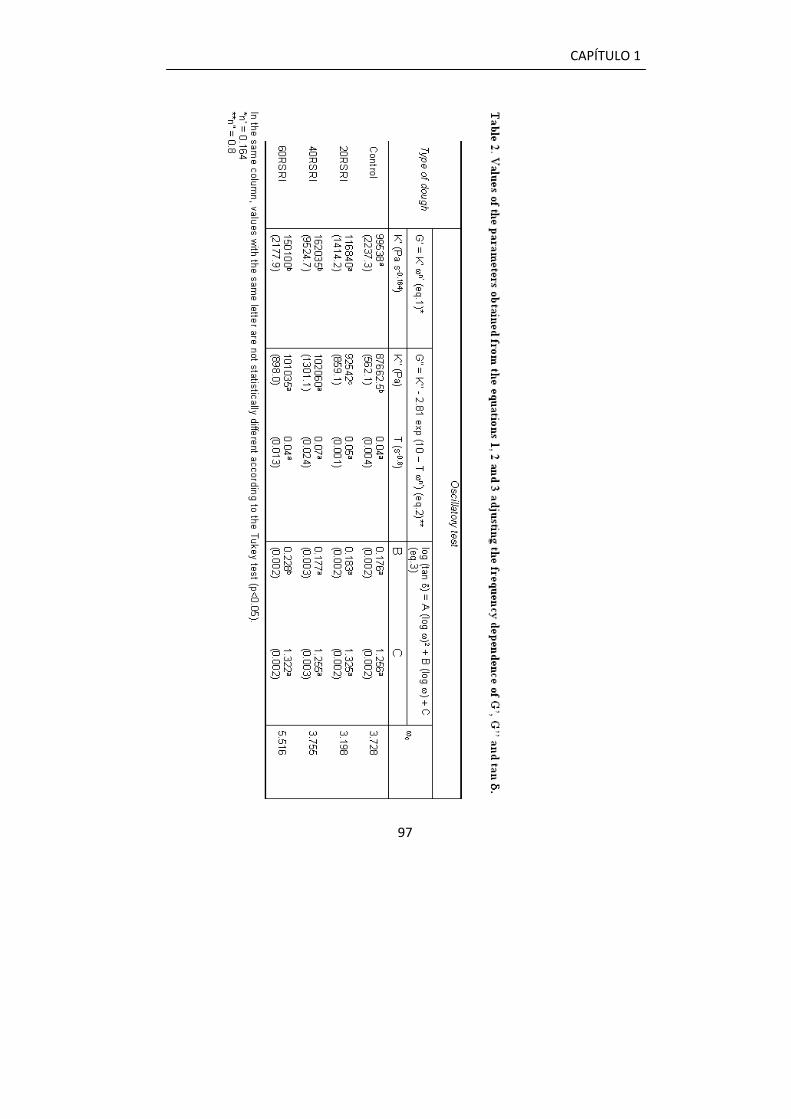
CAPÍTULO 1
97
CAPÍTULO 1
98
The value of frequency at which tanδ reachs a minimum (ωc) was calculated
according to equation (4) as suggested by Sopade et al. (2004). The obtained
valued of ωc are shown in Table 2.
0δ=
ωd(logtan )
d(log ) (4)
In general, no differences in B and C values were found among the samples
(Table 2), indicating that although the substitution of RSRI affected the G’ and
G” values, no effect on the relationship of the two moduli was observed. As Fig.
1 shows, the increment in RSRI produced an increment in G’ and G’’ but the
relation between G’ and G’’ (tanδ=G”/G’) was kept constant. The fact that the
viscoelastic properties (values of tanδ were not altered indicates that no
significant structural change occurs). Therefore it could be stated that the type
of organization of the structure was not significantly affected by RSRI
incorporation.
3.1.2. Creep and recovery tests
The effect of replacing flour on average of three replicates with RSRI on the
compliance values (J= γ/σ) as a function of time in the creep and recovery tests
is shown in Figure 2.
All the systems showed both viscous and elastic characteristics (some
instantaneous deformation and a certain percentage of recovery). As in the
oscillatory tests, the creep and recovery tests showed that the viscoelastic
characteristics were affected by flour replacement. A decrease in the
compliance values was observed as the replacement of flour by RSRI
increased, indicating a greater resistance to deformation. Lower compliance
values are indicative of stronger structural matrices, which show higher
resistance to deformation.
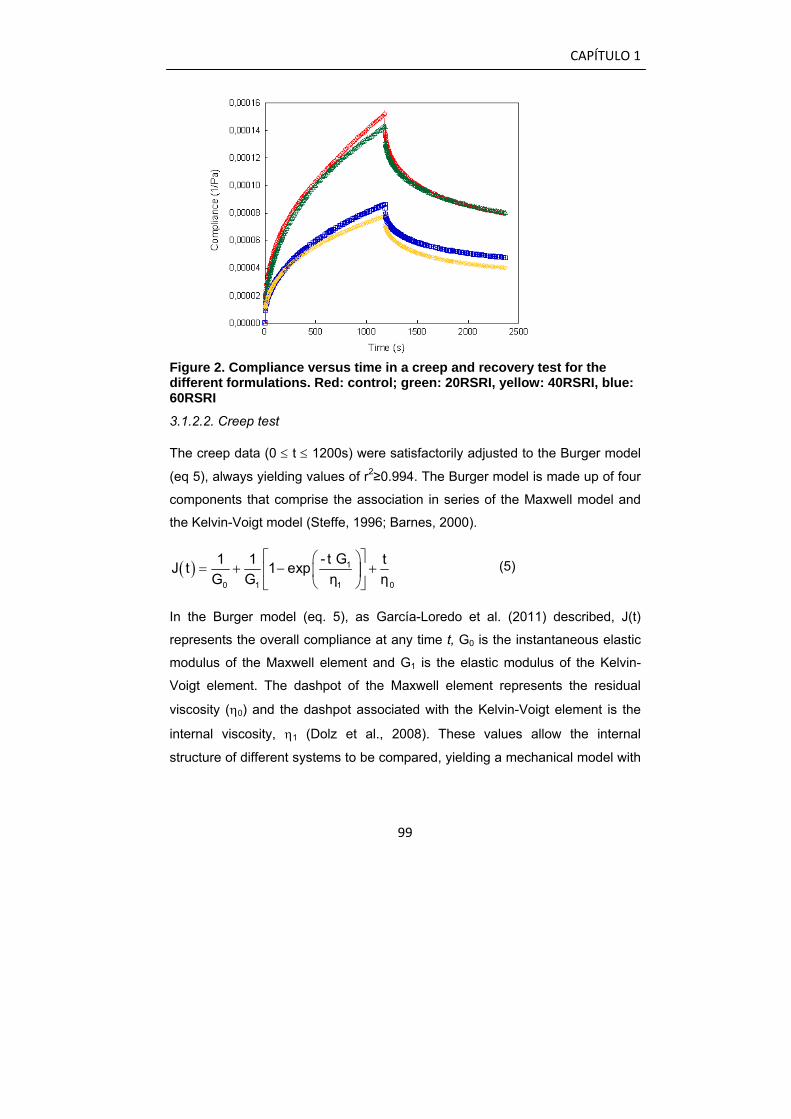
CAPÍTULO 1
99
Figure 2. Compliance versus time in a creep and recovery test for the different formulations. Red: control; green: 20RSRI, yellow: 40RSRI, blue: 60RSRI
3.1.2.2. Creep test
The creep data (0 ≤ t ≤ 1200s) were satisfactorily adjusted to the Burger model
(eq 5), always yielding values of r2≥0.994. The Burger model is made up of four
components that comprise the association in series of the Maxwell model and
the Kelvin-Voigt model (Steffe, 1996; Barnes, 2000).
( ) 1
00 1 1
- t G1 1 tJ t 1 expG G η η
⎡ ⎤⎛ ⎞= + − +⎢ ⎥⎜ ⎟
⎝ ⎠⎣ ⎦ (5)
In the Burger model (eq. 5), as García-Loredo et al. (2011) described, J(t)
represents the overall compliance at any time t, G0 is the instantaneous elastic
modulus of the Maxwell element and G1 is the elastic modulus of the Kelvin-
Voigt element. The dashpot of the Maxwell element represents the residual
viscosity (η0) and the dashpot associated with the Kelvin-Voigt element is the
internal viscosity, η1 (Dolz et al., 2008). These values allow the internal
structure of different systems to be compared, yielding a mechanical model with
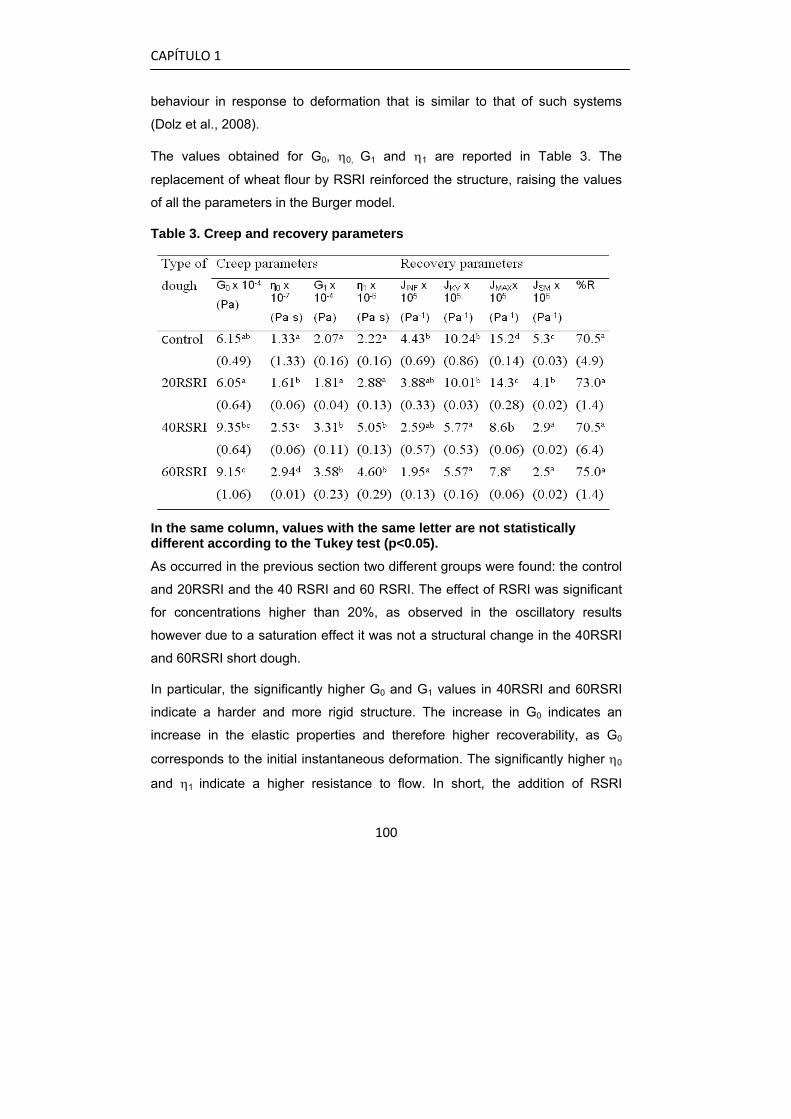
CAPÍTULO 1
100
behaviour in response to deformation that is similar to that of such systems
(Dolz et al., 2008).
The values obtained for G0, η0, G1 and η1 are reported in Table 3. The
replacement of wheat flour by RSRI reinforced the structure, raising the values
of all the parameters in the Burger model.
Table 3. Creep and recovery parameters
In the same column, values with the same letter are not statistically different according to the Tukey test (p<0.05).
As occurred in the previous section two different groups were found: the control
and 20RSRI and the 40 RSRI and 60 RSRI. The effect of RSRI was significant
for concentrations higher than 20%, as observed in the oscillatory results
however due to a saturation effect it was not a structural change in the 40RSRI
and 60RSRI short dough.
In particular, the significantly higher G0 and G1 values in 40RSRI and 60RSRI
indicate a harder and more rigid structure. The increase in G0 indicates an
increase in the elastic properties and therefore higher recoverability, as G0
corresponds to the initial instantaneous deformation. The significantly higher η0
and η1 indicate a higher resistance to flow. In short, the addition of RSRI
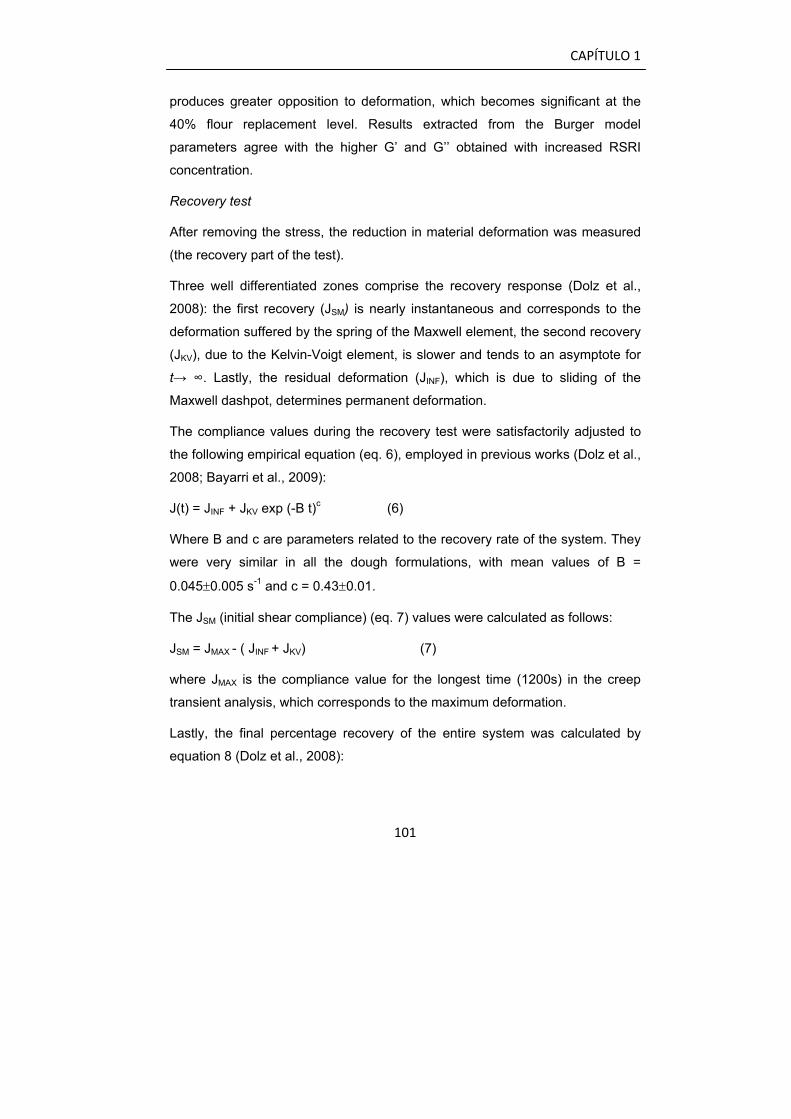
CAPÍTULO 1
101
produces greater opposition to deformation, which becomes significant at the
40% flour replacement level. Results extracted from the Burger model
parameters agree with the higher G’ and G’’ obtained with increased RSRI
concentration.
Recovery test
After removing the stress, the reduction in material deformation was measured
(the recovery part of the test).
Three well differentiated zones comprise the recovery response (Dolz et al.,
2008): the first recovery (JSM) is nearly instantaneous and corresponds to the
deformation suffered by the spring of the Maxwell element, the second recovery
(JKV), due to the Kelvin-Voigt element, is slower and tends to an asymptote for
t→ ∞. Lastly, the residual deformation (JINF), which is due to sliding of the
Maxwell dashpot, determines permanent deformation.
The compliance values during the recovery test were satisfactorily adjusted to
the following empirical equation (eq. 6), employed in previous works (Dolz et al.,
2008; Bayarri et al., 2009):
J(t) = JINF + JKV exp (-B t)c (6)
Where B and c are parameters related to the recovery rate of the system. They
were very similar in all the dough formulations, with mean values of B =
0.045±0.005 s-1 and c = 0.43±0.01.
The JSM (initial shear compliance) (eq. 7) values were calculated as follows:
JSM = JMAX - ( JINF + JKV) (7)
where JMAX is the compliance value for the longest time (1200s) in the creep
transient analysis, which corresponds to the maximum deformation.
Lastly, the final percentage recovery of the entire system was calculated by
equation 8 (Dolz et al., 2008):
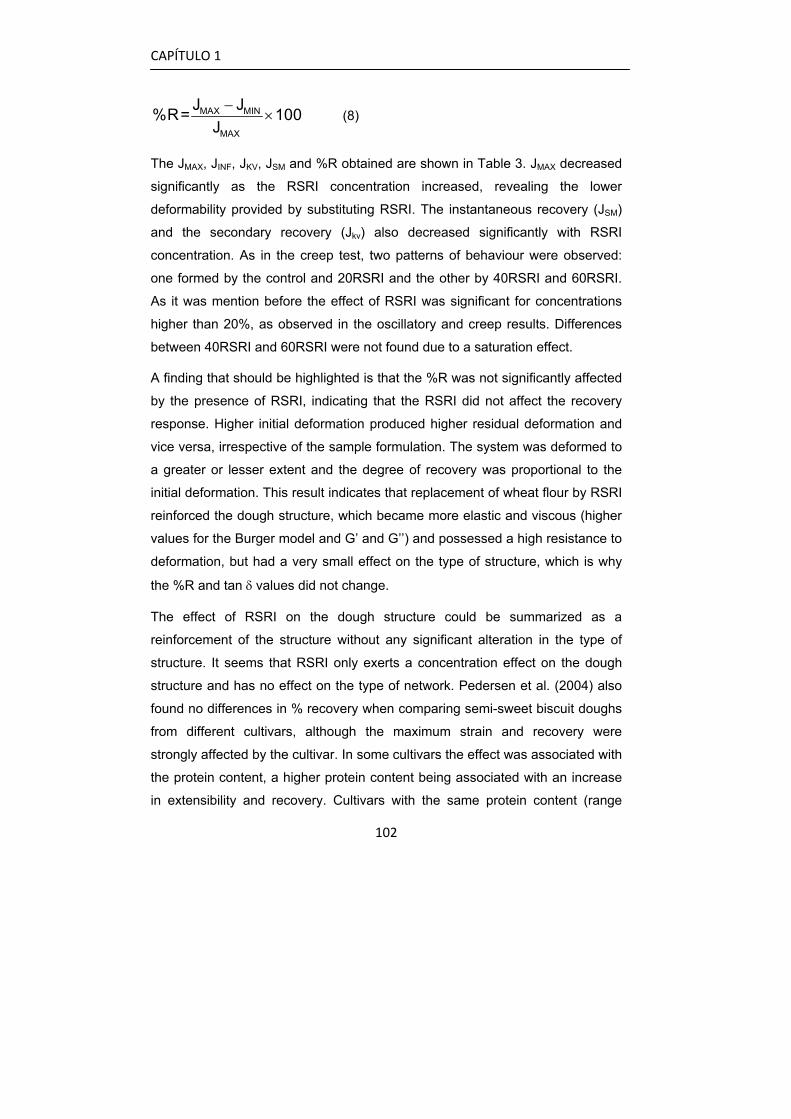
CAPÍTULO 1
102
−×MAX MIN
MAX
J J%R= 100J
(8)
The JMAX, JINF, JKV, JSM and %R obtained are shown in Table 3. JMAX decreased
significantly as the RSRI concentration increased, revealing the lower
deformability provided by substituting RSRI. The instantaneous recovery (JSM)
and the secondary recovery (Jkv) also decreased significantly with RSRI
concentration. As in the creep test, two patterns of behaviour were observed:
one formed by the control and 20RSRI and the other by 40RSRI and 60RSRI.
As it was mention before the effect of RSRI was significant for concentrations
higher than 20%, as observed in the oscillatory and creep results. Differences
between 40RSRI and 60RSRI were not found due to a saturation effect.
A finding that should be highlighted is that the %R was not significantly affected
by the presence of RSRI, indicating that the RSRI did not affect the recovery
response. Higher initial deformation produced higher residual deformation and
vice versa, irrespective of the sample formulation. The system was deformed to
a greater or lesser extent and the degree of recovery was proportional to the
initial deformation. This result indicates that replacement of wheat flour by RSRI
reinforced the dough structure, which became more elastic and viscous (higher
values for the Burger model and G’ and G’’) and possessed a high resistance to
deformation, but had a very small effect on the type of structure, which is why
the %R and tan δ values did not change.
The effect of RSRI on the dough structure could be summarized as a
reinforcement of the structure without any significant alteration in the type of
structure. It seems that RSRI only exerts a concentration effect on the dough
structure and has no effect on the type of network. Pedersen et al. (2004) also
found no differences in % recovery when comparing semi-sweet biscuit doughs
from different cultivars, although the maximum strain and recovery were
strongly affected by the cultivar. In some cultivars the effect was associated with
the protein content, a higher protein content being associated with an increase
in extensibility and recovery. Cultivars with the same protein content (range
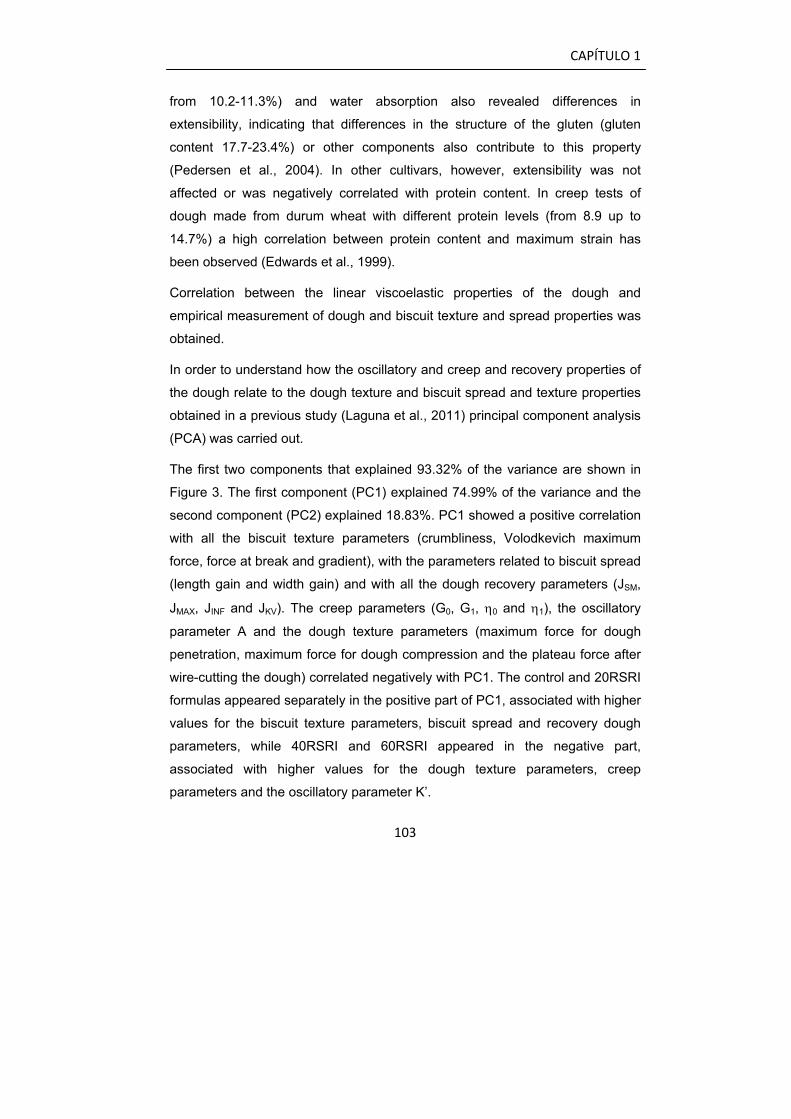
CAPÍTULO 1
103
from 10.2-11.3%) and water absorption also revealed differences in
extensibility, indicating that differences in the structure of the gluten (gluten
content 17.7-23.4%) or other components also contribute to this property
(Pedersen et al., 2004). In other cultivars, however, extensibility was not
affected or was negatively correlated with protein content. In creep tests of
dough made from durum wheat with different protein levels (from 8.9 up to
14.7%) a high correlation between protein content and maximum strain has
been observed (Edwards et al., 1999).
Correlation between the linear viscoelastic properties of the dough and
empirical measurement of dough and biscuit texture and spread properties was
obtained.
In order to understand how the oscillatory and creep and recovery properties of
the dough relate to the dough texture and biscuit spread and texture properties
obtained in a previous study (Laguna et al., 2011) principal component analysis
(PCA) was carried out.
The first two components that explained 93.32% of the variance are shown in
Figure 3. The first component (PC1) explained 74.99% of the variance and the
second component (PC2) explained 18.83%. PC1 showed a positive correlation
with all the biscuit texture parameters (crumbliness, Volodkevich maximum
force, force at break and gradient), with the parameters related to biscuit spread
(length gain and width gain) and with all the dough recovery parameters (JSM,
JMAX, JINF and JKV). The creep parameters (G0, G1, η0 and η1), the oscillatory
parameter A and the dough texture parameters (maximum force for dough
penetration, maximum force for dough compression and the plateau force after
wire-cutting the dough) correlated negatively with PC1. The control and 20RSRI
formulas appeared separately in the positive part of PC1, associated with higher
values for the biscuit texture parameters, biscuit spread and recovery dough
parameters, while 40RSRI and 60RSRI appeared in the negative part,
associated with higher values for the dough texture parameters, creep
parameters and the oscillatory parameter K’.
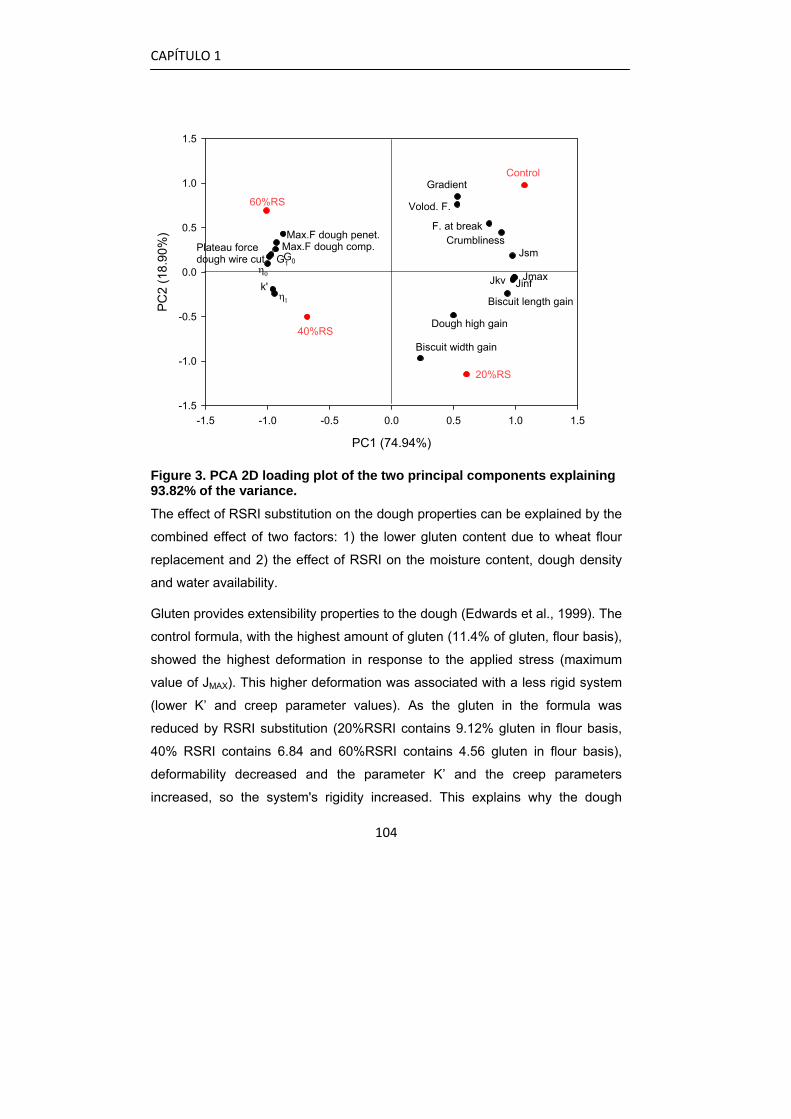
CAPÍTULO 1
104
PC1 (74.94%)
-1.5 -1.0 -0.5 0.0 0.5 1.0 1.5
PC2
(18.
90%
)
-1.5
-1.0
-0.5
0.0
0.5
1.0
1.5
Control
20%RS
40%RS
60%RS
η0
η1
G0G1
Plateau force dough wire cut
Max.F dough penet.Max.F dough comp.
Biscuit width gain
Biscuit length gain
Gradient
Crumbliness
JmaxJinfJkv
Jsm
Dough high gain
F. at break
Volod. F.
k'
Figure 3. PCA 2D loading plot of the two principal components explaining 93.82% of the variance.
The effect of RSRI substitution on the dough properties can be explained by the
combined effect of two factors: 1) the lower gluten content due to wheat flour
replacement and 2) the effect of RSRI on the moisture content, dough density
and water availability.
Gluten provides extensibility properties to the dough (Edwards et al., 1999). The
control formula, with the highest amount of gluten (11.4% of gluten, flour basis),
showed the highest deformation in response to the applied stress (maximum
value of JMAX). This higher deformation was associated with a less rigid system
(lower K’ and creep parameter values). As the gluten in the formula was
reduced by RSRI substitution (20%RSRI contains 9.12% gluten in flour basis,
40% RSRI contains 6.84 and 60%RSRI contains 4.56 gluten in flour basis),
deformability decreased and the parameter K’ and the creep parameters
increased, so the system's rigidity increased. This explains why the dough
CAPÍTULO 1
105
recovery parameters appear separately from the parameter K’, the creep
parameters and the dough texture parameters in the PCA diagram. The control
and 20RSRI showed the highest deformability (higher JMAX values) and the
lowest K’ and creep and texture parameter values (lower rigidity). In contrast,
40RSRI and 60RSRI showed the lowest values for recovery parameters (least
deformation) and the highest values for K’ and the creep and texture
parameters, indicating their greater rigidity.
The increase in rigidity and decrease in deformability associated with wheat
flour replacement by the RSRI can also be associated with the lower moisture
content of RSRI in comparison to flour (Laguna et al., 2011), which produces
drier doughs and a increase in dough density associated with the addition of
RSRI. In addition, RSRI increases the water retention capacity (the %AWRC
values for the flour, the 80/20, 60/40 and 40/60 flour/RSRI mixtures were 74.59,
81.02, 106.9 and 129.8 g/g on a dry basis, respectively), reducing the water
available for gluten development. Although water is a minor component of the
biscuit dough, the level of water in the formula affects gluten development,
spread, final moisture and eating quality (Lai and Lin, 2006).
In biscuits, substituting RSRI decreased the texture parameters. The control
and 20RSRI appeared to be related to the highest biscuit texture parameter
values, while 40RSRI and 60RSRI were associated with lower values.
The effect of the RSRI on biscuit texture may be associated with the decrease
in gluten functionality (through the diluting effect of RSRI and lower water
availability), combined with the increase in water retention properties. The
decrease in gluten functionality made the biscuit matrix less structured and
gave it a softer, less tough texture, while the RSRI created more amorphous
zones in it (Laguna et al., 2011). The higher moisture and water activity in the
biscuits with the RSRI may also explain the softer biscuit texture in the
presence of RSRI. Higher moisture is associated with a softer biscuit texture.
Another important biscuit property which was significantly affected by wheat
flour replacement by the RSRI was the spread rate. The control and 20RSRI

CAPÍTULO 1
106
showed higher spread (gain in width and length), while 40RSRI and 60RSRI
showed the lowest. The higher spread rate was positively associated with the
recovery parameters, which reflect deformability and are negatively associated
with the oscillatory parameter A and the creep parameters, and these in turn
reflect the elastic properties. The effect of RSRI on the spread rate cannot be
explained in terms of gluten content and gluten functionality reduction, as
previous studies have stated that the spread rate decreases linearly with the
gluten level (Donelson, 1988). Therefore, the effect on the spread rate has to be
associated with RSRI functionality in the system rather than with decreased
gluten functionality. Gaines and Finney (1989) associated a faster spread rate
and later setting with the employment of soft wheat flour instead of hard wheat
flour, as soft wheat dough was less viscous during baking. The presence of
RSRI decreases deformability and increases system elasticity and resistance to
flow, which may explain the decrease in spread.
4. Conclusions
This study showed the effect of RSRI in short dough biscuit. The values
obtained for linear viscoelastic properties of the short dough biscuit revealed
that replacement of wheat flour by RSRI increases system rigidity and reduces
deformability. However, tan δ and % recovery were not altered, implying that
the RSRI was not changing the type of structure but exerting a concentration
effect on the dough structure. This effect of the RSRI can be associated with
lower gluten functionality and lower water availability on dough in presence of
RSRI. The spread of the biscuits could be predicted from the dough properties,
as higher dough deformation correlated positively to biscuit length and width
gain.
The comparison among small (oscillatory and creep-recovery) and large
deformation (texture) measurements revealed that both can be correlated and
explained dough changes during baking.
CAPÍTULO 1
107
For all the tests, two samples groups (control-20RSRI and 40RSRI-60RSRI)
were found and the results can be related with the RSRI quantity that affects the
gluten content and water disponibility.
References
Aparicio-Sanguilán, A., Sáyago-Avendi, S.G., Vargas-Torres, A., Tovar, J.,
Ascensio- Otero, T.E. & Bello-Pérez, L.A. (2007). Slowly digestible cookies
prepared from RS-rich lintnerized banana starch. Journal of Food
Composition and Analysis, 20, 175-181.
Asp, N.G. & Björck, I. (1992). Resistant Starch. Trends in Food Science &
Technology, 3, 111-114.
Baltsavias, A., Jurgens, A. & van Vliet, T. (1997). Rheological properties of
short doughs at small deformations. Journal of Cereal Science, 26, 289-
300.
Barnes, A. (2000). A Handbook of Elementary Rheology. Aberystwyth: Institute
of Non-Newtonian Fluid Mechanics Wales: University of Wales, UK.
Bayarri, S., Dolz, M. & Hernández, M.J. (2009). Effect of carboxymethyl
cellulose concentration on rheological behaviour of milk and aqueous
systems. A creep and recovery study. Journal of Applied Polymer Science,
114, 1626-1632.
Dolz, M., Hernández, M.J. & Delegido, J. (2006). Oscillatory measurements for
salad dressings stabilized with modified starch, xanthan gum and locust
bean gum. Journal of Applied Polymer Science, 102, 897-903.
Dolz, M., Hernández, M.J. & Delegido, J. (2008). Creep and recovery
experimental investigation of low oil content food emulsions. Food
Hydrocolloids, 22, 421-427.
Donelson, J.R. (1988). The contribution of high-protein fractions from cake and
cookie flours to baking performance. Cereal Chemistry, 65, 389–391.
CAPÍTULO 1
108
Edwards, N.M., Dexter, J.E., Scanlon, M.G. & Cenkowski, S. (1999).
Relationship of creep-recovery and dynamic oscillatory measurements to
durum wheat physical dough properties. Cereal Chemistry, 76, 638–45.
Gaines, C.S. & Finney, P.L. (1989). Effects of selected commercial enzymes on
cookie spread and cookie dough consistency. Cereal Chemistry, 66, 73–78.
García-Loredo A. B., Guerrero S.N, Gomez P.L., Almazora S.M. (2011).
Relationships between rheological properties, texture and structure of apple
(Granny Smith var.) affected by blanching and/or osmotic dehydration. Food
and Bioprocess Technology. DOI 10.1007/s11947-011-0701-9
Hódsági M., Gelencsér T., Gergely S., Salgó A. (2010). In vitro digestibility of
native and resistant starches: correlation to the change of its rheological
properties. Food and Bioprocess Technology. DOI 10.1007/s11947-010-
0391-8
Laguna, L., Salvador, A., Sanz, T. & Fiszman, S.M. (2011). Performance of a
resistant starch rich ingredient in the baking and eating quality of short-
dough biscuits. LWT- Food Science and Technology, 44, 737-746.
Lai, H-M & Lin, T-C (2006). Bakery Products: Science and Technology. In: Hui
Y. H, Corke H, De Leyn I, Nip W-K, & Cross N. (Eds). Bakery Products:
Science and Technology, pp 3–65 Blackwell Publishing, Ames, USA.
Loening-Baucke, V., Miele, E. & Staiano, A. (2004). Fiber (glucomannan) is
beneficial in the treatment of childhood constipation. Pediatrics, 113, 259-
264.
Menjivar, J.A. (1990). Fundamental aspects of dough rheology. In Dough
Rheology and Baked Product Texture, Ed Faridi, H, Aubion, J.F. Van
Nostrand Reinold Publishers, New York, pp.1-28.
Nilsson, A.C., Ostman, E. M., Holst, J.J. & Bjorck, I.M.E. (2008). Including
indigestible carbohydrates in the evening meal of healthy subjects improves
CAPÍTULO 1
109
glucose tolerance, lowers inflammatory markers, and increases satiety after
a subsequent standardized breakfast. Journal of Nutrition, 138 (4), 732-739.
Papantoniou, E., Hammond, E.W., Tsiami, A.A., Scriven, F., Gordon, M.H. &
Schofield, J.D. (2003). Effects of Endogenous Flour Lipids on the Quality of
Semisweet Biscuits. Journal of Agricultural and Food Chemistry, 51, 1057-
1063.
Papantoniou, E., Hammond, E.W., Scriven, F., Gordon, M.H. & Schofield, J.D.
(2004). Effects of endogenous flour lipids on the quality of short-dough
biscuits. Journal of the Science of Food and Agriculture, 84, 1371-1380.
Pedersen, L., Kaack, K., Bergs, M.N. & Adler-Nissen, J. (2004). Rheological
properties of biscuit dough from different cultivars, and relationship to
baking characteristics. Journal of Cereal Science, 39, 37–46.
Pedersen, L., Kaack, K., Bergs, M.N. & Adler-Nissen, J. (2005) Effects of
Chemical and Enzymatic modification on dough rheology and biscuit
characteristics. Journal of Food Science, 70 (2), 152-158.
Schramm, G. (1994). A Practical Approach to Rheology and Rheometry.
Karlsruhe: Gebrueder HAAKE.
Sopade, P.A., Halley, P.J., D'Arcy, B., Bhandari, B. & Caffin, N. (2004).
Dynamic and steady-state rheology of Australian honeys at sub-zero
temperatures. Journal of Food Process Engineering, 27, 284-309.
Steffe, J.F. (1996) Rheological methods in food process engineering. Freeman
Press, East Lansing, USA.
Yue, P. & Waring, S. (1998). Functionality of RS in food application. Food
Australia, 50, 615-621.

ROLE OF FIBRE MORPHOLOGY IN SOME QUALITY FEATURES OF FIBRE-
ENRICHED BISCUITS
Laura Laguna, Teresa Sanz, Sarab Sahi and Susana M. Fiszman
INTERNATIONAL JOURNAL OF FOOD PROPERTIES

CAPÍTULO 1
113
Abstract
The effect of replacing 5% and 10% of the flour in a biscuit formulation with two
wheat fibres (of different lengths) and apple fibre (differences in morphology
and proportion of soluble fraction) was studied. All the fibres decreased the flour
pasting properties. The longer wheat fibre produced the greatest increase in the
G’ and G” viscoelastic moduli of the dough compared to the control (no fibres
added). The biscuit texture properties were measured using the 3-point break
test and cone penetrometry: wheat fibre biscuits were more resistant to
breaking while apple fibre produced a crumbly biscuit. The biscuits’ matrices
were observed by C-Cell (image analysis): the apple fibre biscuits were more
airy and less compact than the wheat fibre biscuits. Sensory analysis by a
trained panel showed minor changes in the apple fibre biscuits compared to the
control and greater hardness in the wheat fibre biscuits.
Key words: biscuit, fibres, physical and sensory changes
CAPÍTULO 1
114
1. Introduction
Nowadays, consumers are increasingly interested in healthy food products. In
the 1980s, dietary fibre was identified as an important component of a healthy
diet and the food industry began to look for palatable ways to increase the fibre
content of its products (Aparicio-Sanguilán, 2007). In the past decade, research
has documented connections between dietary fibre intake and decreased risks
of chronic diseases (Truswell, 1993). For this reason, fibre has received much
attention in both scientific and informative literature.
However, the intake of fibre and fibre-containing foods remains low in many
populations worldwide.Interest in foods with high fibre contents has increased in
recent decades and the importance of this food constituent has led to the
development of a large market for fibre-rich ingredients to be used in baked
products such as snacks, muffins or a number of types of biscuits that are
convenient to consume at breakfast (Nilsson et al., 2008). Because of their
diversity, bakery products are used as a source of different nutritionally-rich
ingredients (Sudha, 2007). Biscuits are a very popular bakery item which is
consumed by nearly all levels of society. Some of the reasons for such wide
popularity are their ready-to-eat nature, affordable cost, good nutritional quality,
availability in different tastes and longer shelf life (Ajila, 2008).
Dietary fibres can be classified into insoluble or soluble and each fraction
provides specific physiological functions and nutritional benefits: insoluble fibre
promotes the movement of material through the digestive system and soluble
fibre helps to lower blood cholesterol and regulate blood glucose levels (Tosh et
al., 2010). Both types have been used in biscuits to increase the daily intake of
fibre, mainly using cereal brans, which are rich in insoluble fibre, and gums such
as pectin, which are soluble fibres.
Cereal bran as a source of fibre to replace flour in biscuits has been studied by
many authors. Brewers’ spent grain has been studied in sugar biscuits (Prentice
et al., 1978) and in wire cut biscuits (Örztürk et al., 2002). Gujral et al., (2003)
replaced part of the wheat flour with wheat bran and coarse wheat flour in
CAPÍTULO 1
115
biscuits; the latter replacement increased the sensory scores and lowered the
fracture strength. Leelavathi and Rao (1993) studied the replacement of flour by
raw and toasted wheat bran, reporting that the former, up to 30%, could be
used as a substitute for flour in the preparation of high-fibre biscuits without
affecting the overall biscuit quality. Recently, Ellouze-Ghorbel et al. (2010) used
different sources of wheat bran (Aestivium and Durum) to enrich biscuits.
Sudha et al. (2007) reported on the influence of different cereal brans on the
sensory quality of biscuits; they obtained acceptable biscuits by incorporating
30% of oat bran or 20% of barley bran into the formulation.
Some studies have been carried out using fruit fibres: apple fibre (Chen, 1988),
banana (Fasolin et al., 2007) and mango dietary fibre (Ajila et al., 2008). Bilgiçli
et al. (2007) replaced wheat flour with apple fibre, lemon fibre, wheat fibre and
wheat bran; however, they did not compare the effect of the different solubilities
of the fibres used.
More recently, a new generation of fibres has been studied, including inulin, oat
beta-glucan enriched fraction (BGEF) and potato fibre and resistant starch
(Brenan et al., 2004). Aparicio-Sanguilan et al. (2007) obtained biscuits with
resistant starch from lintnerized banana and Tuohy (2001) added guar gum,
obtaining biscuits with a prebiotic effect.
All the papers mentioned above studied the physicochemical changes in the
dough or the biscuit (as well as physiological changes) as being dependent on
the source of fibre employed; in general, they did not mention the morphology of
the fibre as a factor to take into consideration.
Prentice et al. (1978) and Örztürk et al. (2002) stated that fibre length could be
expected to have an important effect on the properties of the dough and the
biscuits, but on comparing these two studies, the final conclusion about the
influence of different fibre sizes in biscuits was not clear.

CAPÍTULO 1
116
The aim of the present work is to study the influence of dose, fibre length and
proportion of soluble fraction on short dough biscuits using an apple fibre and
two wheat fibres of different lengths to replace part of the flour.
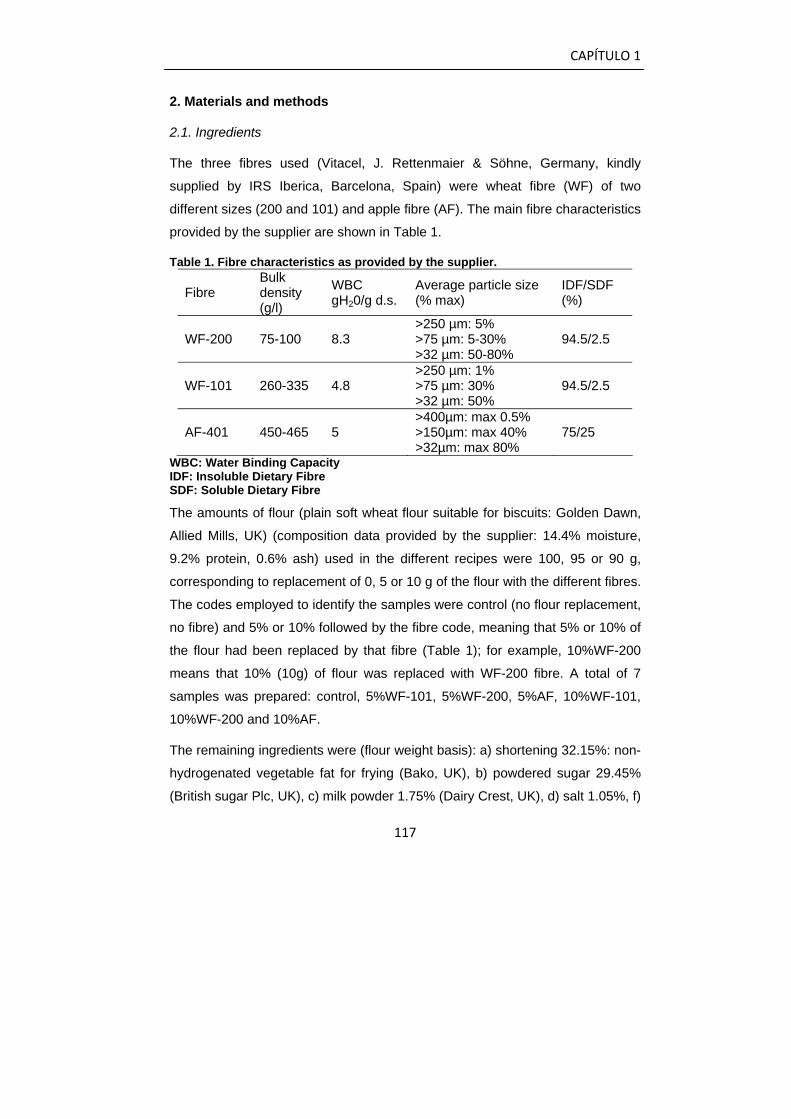
CAPÍTULO 1
117
2. Materials and methods
2.1. Ingredients
The three fibres used (Vitacel, J. Rettenmaier & Söhne, Germany, kindly
supplied by IRS Iberica, Barcelona, Spain) were wheat fibre (WF) of two
different sizes (200 and 101) and apple fibre (AF). The main fibre characteristics
provided by the supplier are shown in Table 1.
Table 1. Fibre characteristics as provided by the supplier.
Fibre Bulk density (g/l)
WBC gH20/g d.s.
Average particle size (% max)
IDF/SDF (%)
WF-200 75-100 8.3 >250 µm: 5% >75 µm: 5-30% >32 µm: 50-80%
94.5/2.5
WF-101 260-335 4.8 >250 µm: 1% >75 µm: 30% >32 µm: 50%
94.5/2.5
AF-401 450-465 5 >400µm: max 0.5% >150µm: max 40% >32µm: max 80%
75/25
WBC: Water Binding Capacity IDF: Insoluble Dietary Fibre SDF: Soluble Dietary Fibre
The amounts of flour (plain soft wheat flour suitable for biscuits: Golden Dawn,
Allied Mills, UK) (composition data provided by the supplier: 14.4% moisture,
9.2% protein, 0.6% ash) used in the different recipes were 100, 95 or 90 g,
corresponding to replacement of 0, 5 or 10 g of the flour with the different fibres.
The codes employed to identify the samples were control (no flour replacement,
no fibre) and 5% or 10% followed by the fibre code, meaning that 5% or 10% of
the flour had been replaced by that fibre (Table 1); for example, 10%WF-200
means that 10% (10g) of flour was replaced with WF-200 fibre. A total of 7
samples was prepared: control, 5%WF-101, 5%WF-200, 5%AF, 10%WF-101,
10%WF-200 and 10%AF.
The remaining ingredients were (flour weight basis): a) shortening 32.15%: non-
hydrogenated vegetable fat for frying (Bako, UK), b) powdered sugar 29.45%
(British sugar Plc, UK), c) milk powder 1.75% (Dairy Crest, UK), d) salt 1.05%, f)
CAPÍTULO 1
118
sodium bicarbonate 0.35%, e) ammonium hydrogen 0.2% and f) tap water 11%,
adjusted for each formula: (control: 11.00%, 5%WF101: 11.60%,
5%WF200:11.73%, 5%AF:12.84%, 10%WF101:12.17%, 10%WF200:12.46%,
and 10%AF:13.36%).
2.2. Biscuit preparation
The flour and fibre were pre-blended for 15 minutes in a double cone mixer
(KEK-Gardener, UK). The fat, sugar, milk powder, leaving agents, salt and
water were mixed in a mixer (Fit Hobart mixer, USA) for 30 seconds at low
speed (no.1), the bowl was scraped down and they were mixed again for 3
minutes at a higher speed (no.3). The flour or the flour/fibre mix was then added
and mixed in for 20 seconds at speed 1 then, after scraping down the bowl once
more, for a further 40 seconds at speed 1.
After a 10-minutes resting period in a plastic bag, the dough was sheeted and
moulded to 6.5 cm diameter x 0,5 cm thick (with docking and logo) in a single
step using a RTech Minilab sheeting line (Rtech Ltd., Warrington UK); 15
biscuits were placed on each 48x21.5 cm perforated tray and baked in a tunnel
oven (Spooner UK) with two sections at different temperatures, 220 and 200 °C,
for a total of 5.3 minutes.
2.3. Flour pasting properties
The pasting properties of the flour and the flour/fibre mixes were measured
using a Rapid Visco Analyser (RVA-4, Newport Scientific, Australia). Flour or a
flour/fibre mix (3.5 g) was added to 25 mL of water. 3.28 and 3.22 g of flour
alone (representing the removal of 5% and 10% of the flour respectively) in 25
mL of water were also tested.
Rapid initial stirring was carried out by applying a 960 rpm stirring step for the
first 10s of the test, followed by decreasing and stabilizing the stirring to 160
rpm for the rest of the test. A reference maize starch (Colflo 67, National Starch)
was employed to calibrate the RVA before testing each batch of each
formulation.
CAPÍTULO 1
119
The temperature profile consisted of an initial holding time of 1 min at 25 °C,
raising the temperature to 95 °C at a rate of 14 °C/min, a holding stage at 95 °C
for 3 min and lowering the temperature to 25 °C at a rate of 14 °C/min, followed
by a final holding period of 2 min at 25 °C. The paste viscosity was expressed in
centipoises (cp; 12 cp ≅ RVU - rapid viscosity units). The following parameters
were determined: peak viscosity, through viscosity, breakdown, final viscosity,
setback, peak temperature and pasting temperature. At least two
determinations were carried out in each sample.
2.4. Dough rheology properties
Strain sweep tests were performed using a strain-controlled ARES rheometer
(TA Instruments, UK) fitted with parallel plates (25 mm diameter, 2 mm gap).
The measurements were performed at 25 °C. The elastic modulus (G'), viscous
modulus (G”) and phase angle (δ) were obtained.
The rheological analysis was always carried out just after moulding the dough.
Each formulation was prepared twice, on different days, and 4 samples of each
preparation were measured. The results were expressed as the average of the
8 determinations performed per formulation.
2.5. Biscuit properties
2.5.1. Texture and sound emissions
The texture of the biscuits was measured using a Texture Analyzer TA.TX.plus
(Stable Micro Systems, Godalming, UK). Data management was performed
using Texture Exponent software (version 2.0.7.0. Stable Microsystems,
Godalming, UK). Twenty replicates of each formulation were conducted.
Breaking strength. The biscuits were broken using the three point bending rig
probe (A/3PB). The experimental conditions were: supports 50 mm apart, a 20
mm probe travel distance and a trigger force of 20g. The max force (N), the
area (N.sec), and the displacement at rupture (mm) were measured.
CAPÍTULO 1
120
An acoustic envelope detector (AED) coupled to the texturometer was used for
sound recording; the experimental conditions were adapted from Varela et
al.(2006). The gain of the AED was set at 1. A Bruel and Kjaer free-field
microphone (8-mm diameter), calibrated using a Type 4231 Acoustic calibrator
(94 and 114 dB SPL-1,000 Hz), was placed in a frontal position in order to gain
a better acoustic signal, at a distance of 4 cm and an angle of 45º to the
sample. A built-in low pass (anti-aliasing) filter set the upper calibrated and
measured frequency at 16 kHz. Ambient acoustic and mechanical noise were
filtered by a 1 kHz high-pass filter. The AED operates by integrating all the
frequencies within the band pass range, generating a voltage proportional to the
sound pressure level (SPL). The data acquisition rate was 500 points/s for both
force and acoustic signals. All tests were performed in a laboratory with no
special soundproofing facilities at an ambient temperature of 22 ± 2ºC.
The texture and sound parameter measured for each formulation was the
number of sound peaks and SPLmax (dB). Each sound graph was
simultaneously displayed with the correspondent force/displacement graph and
after choosing the real peaks (rather than those due to external noise), the
statistics were calculated.
Cone penetrometry. The test was performed under the following experimental
conditions: a test speed of 5mm/s, a trigger force of 5g and a cone travelling
distance of 12mm. The parameters obtained from the cone penetrometry probe
were area under the curve (N/sec), total number of peaks, maximum force (N),
maximum time (sec) at break, number of peaks at one sec and force at one sec
(N).
2.5.2. Image analysis
Two biscuit from each formulation were cut on a horizontal plane and the
surface of the biscuit was removed. The exposed surface was photographed
with a C-Cell imaging system (Calibre Control International, Campden &
Chorleywood Food Research Association, UK).

CAPÍTULO 1
121
2.5.3. Scanning Electron Microscope
The fibres and biscuit samples were examined without any further preparation
using a Carl Zeiss EVO 60 Scanning Electron Microscope (Cambridge UK); the
pressure was controlled at 60Pa.
The biscuits were broken in two to obtain a fracture surface, then the sample
was trimmed behind the fracture surface to produce a strip of biscuit a few
millimetres wide for examination. The biscuit sample, with the fractured surface
uppermost, was stuck to an aluminium SEM stub with silver 'DAG' cement.
2.5.4. Dimensions
Biscuit thickness was measured by stacking 10 biscuits vertically against the
biscuit thickness ruler, sliding the gauge to rest on top of the pile and recording
the average thickness.
Biscuit 'length' was measured by arranging the biscuits along the length ruler
with the stamped word parallel to its long edge and recording the average
length; the biscuits were then rearranged with the written word perpendicular to
the long edge on the ruler and the average 'width' was measured. These
measurements were expressed in mm as the average value/10 of two
replicates.
2.5.5. Moisture and fibre determination
The % moisture content of the flour, flour/fibre mixtures and biscuits was
determined according to Approved Method 44-15.02 (AACC International.
2009).
The total dietary fibre content of the doughs and biscuits was determined in
three replicates by Approved Method 32-07.01 (AACC International, 2009),
using a FOSS Fibretec E 1023 Filtration module and Shaking Water Bath 1024
system.

CAPÍTULO 1
122
2.6. Sensory Analysis
Selection of terms and panel training. A panel of eight assessors (between 25
and 38 years old) skilled in quantitative descriptive analysis (QDA) was trained
to select the descriptors using the checklist method.
Terms were selected and discussed in an open session with the panel leader.
The assessors were given a brief outline of the procedures and a list of
attributes and representative samples, and were asked to choose and write
down the most appropriate attributes to describe all the sensory properties of
the biscuits, or to suggest new ones. The panel leader collected and wrote all
the attributes on a board. The panel then discussed the appropriateness of the
selected attributes, their definitions and the procedures for assessing them. At
the end of the session a consensus on the list of attributes (colour; thickness;
flour, butter and toast odour; visual structure; manual hardness; crumbliness;
fragility; hardness; crunchiness; doughy, flour, butter and apple taste) and
procedures had been chosen; this procedure was proposed by Stone and Sidel
(2004) in order to obtain a complete sensory description of a product.
The panellists attended twelve 1-hour training sessions. Training involved two
stages: in the first stage, different samples were tested by the panellists to gain
a better understanding of all the descriptors and different tastings were carried
out until the panel was homogeneous in its assessments, as explained here
below under Statistical Analysis. In the second stage, the panellists used 10-cm
unstructured scales to score the intensity of the selected attributes. The
assessors were instructed to score the external appearance first, followed by
odour, then the manual properties of the biscuit, then in-mouth texture and,
finally, taste. The panel's performance was evaluated by principal component
analysis, using the Pearson correlation matrix, until there were no outliers in the
group between the different training sessions.
Formal assessment. A balanced complete block experimental design was
carried out in duplicate (two sessions) to evaluate the samples. The intensities
of the sensory attributes were scored on a 10 cm unstructured line scale. Seven
CAPÍTULO 1
123
samples were evaluated per session. In each session, the samples were
randomly selected from each cooking batch and served in random order, each
on a separate plastic tray identified with random three-digit codes. The
panellists were instructed to rinse their mouths with water between sample
evaluations.
Testing was carried out in a sensory laboratory equipped with individual booths
(ISO 8589, 1988). Data acquisition was performed using Compusense five
release 5.0 software (Compusense Inc., Guelph, Ont., 158 Canada).
2.7. Statistical Analysis
Analysis of variance (one way-ANOVA) was applied to study the differences
between formulations; least significant differences were calculated by the Tukey
test and the significance at p<0.05 was determined. These analyses were
performed using SPSS for Windows Version 12 (SPSS Inc., USA).
For each descriptor, two-way ANOVA was applied to check panel performance
considering assessors, samples and their interaction as factors.
Analysis of variance (one-way ANOVA) was applied to the trained panel in
order to study the effect of formulation; least significant differences were
calculated by Tukey’s test (p<0.05).
3. Results and discussion
3.1. Fibre morphology and hydration properties
The morphology of the different fibres was studied by SEM. The two wheat
fibres both had an elongated shape but were different in length, WF-200 being
longer than WF-101 (Figures 1a and 1b, respectively); the apple fibre had a
completely different morphology, as its particles were shorter and rounded in
shape (Figure 1c). These observations were in accordance with the size data
provided by the supplier (Table 1).
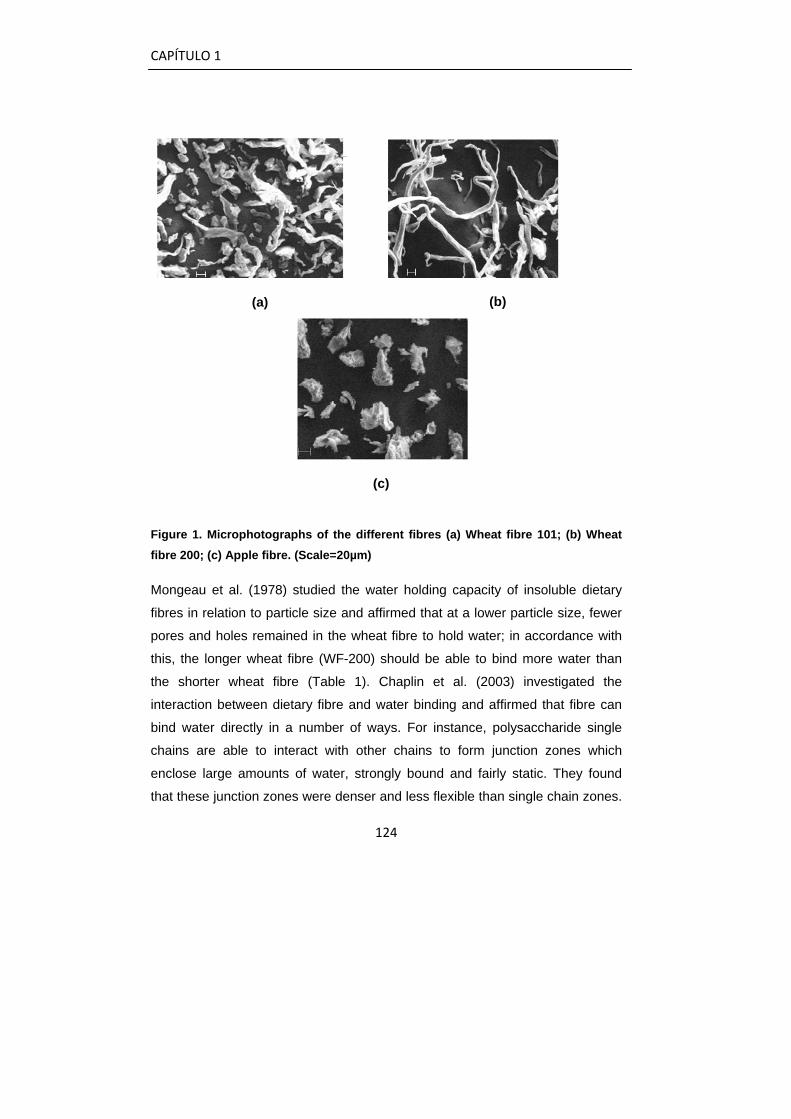
CAPÍTULO 1
124
Figure 1. Microphotographs of the different fibres (a) Wheat fibre 101; (b) Wheat fibre 200; (c) Apple fibre. (Scale=20µm)
Mongeau et al. (1978) studied the water holding capacity of insoluble dietary
fibres in relation to particle size and affirmed that at a lower particle size, fewer
pores and holes remained in the wheat fibre to hold water; in accordance with
this, the longer wheat fibre (WF-200) should be able to bind more water than
the shorter wheat fibre (Table 1). Chaplin et al. (2003) investigated the
interaction between dietary fibre and water binding and affirmed that fibre can
bind water directly in a number of ways. For instance, polysaccharide single
chains are able to interact with other chains to form junction zones which
enclose large amounts of water, strongly bound and fairly static. They found
that these junction zones were denser and less flexible than single chain zones.
(a)
(b)
(c)
CAPÍTULO 1
125
This situation effectively increases the fibre diameter of the junction zones,
reducing the pore size, increasing the capillarity and reducing the tendency for
the water to exit the cavities. That could also explain why WF-200 has a higher
water binding capacity (WBC) than WF-101, as the long chains could form more
junctions, entrapping the water better.
The morphology of the apple fibre (AF-401) indicated a completely different
scenario. Whilst wheat fibre is almost totally insoluble, apple fibre contains 25%
soluble fibre. Although it does not contain long or long-shaped fibres, its soluble
fraction (pectin) is highly hydrophilic (Tosh et al., 2010), exhibiting a WBC value
approaching that of the longer wheat fibre (WF 200). Thibault et al. (2001)
reported that the hydration properties of fibres depend on their chemical and
physical structures (surface area and particle size) and on their processing
history.
In turn, all these factors that could affect the water status in the dough would
affect its technological characteristics (such as handling properties) and the final
properties of the biscuits.
While water is a minor component in a biscuit dough formula, it plays an
important role during dough and biscuit preparation (Pareyt et al., 2008). The
water level used in the recipe affects gluten development in the dough, biscuit
spread during baking, moisture retention and the eating quality of the finished
product (Lai et al., 2006).
In the present study the fibres absorbed high amounts of water, preventing
proper hydration of the ingredients and making the dough powdery or causing it
to fall apart. In consequence, the proper water level for each formulation was
determined by a mixograph in preliminary tests (data not shown).
3.1.2. Flour pasting properties
The parameters generated by the RVA describe starch swelling, gelatinization,
and gelling ability. During one RVA cycle (heating- temperature maintenance -
cooling), the starch granules in excess water swell and absorb moisture, leading

CAPÍTULO 1
126
to disruption of the hydrogen bonds and leaching of amylose from the starch
granules. Finally, during the cooling cycle stage, the starch molecules
reassociate and form a gel (Brennan et al., 2004). The changes in rhelogical
properties observed during starch gelatinization depend on the presence of
swollen starch granules in a dispersed amylase-amylopectin matrix and on the
amylose-amylopectin interaction (Eliasson et al., 1986), which would also be
affected by the addition of fibre.
The maximum peak viscosity was obtained with flour alone (100% = 3.5 g). In
the samples containing 5% and 10% less flour (3.28 and 3.11g of flour
respectively in the same amount of water), the peak viscosity values decreased
as expected. When these percentages of flour were replaced with any of the
fibres, the values recovered to some extent, varying according to the type of
replacement (Table 2). The closest values to the 100% flour sample
corresponded to 5%WF-200, where they were higher than for the 5%-less flour-
only sample, so this fibre makes the mix more viscous, probably by absorbing
part of the available water. This sample was followed by 5%AF and 5%WF-
101. Whilst the composition of WF-200 and WF-101 was the same, their
differing physical shapes led to different behaviour. The samples with 10%
replacement followed the same trend (WF-200>AF>WF-101), but in this case
they all presented higher peak viscosity values than the flour-only sample with
10% less flour.
All the pasting parameter values indicated that the effects on these properties of
replacing part of the flour with fibres could be
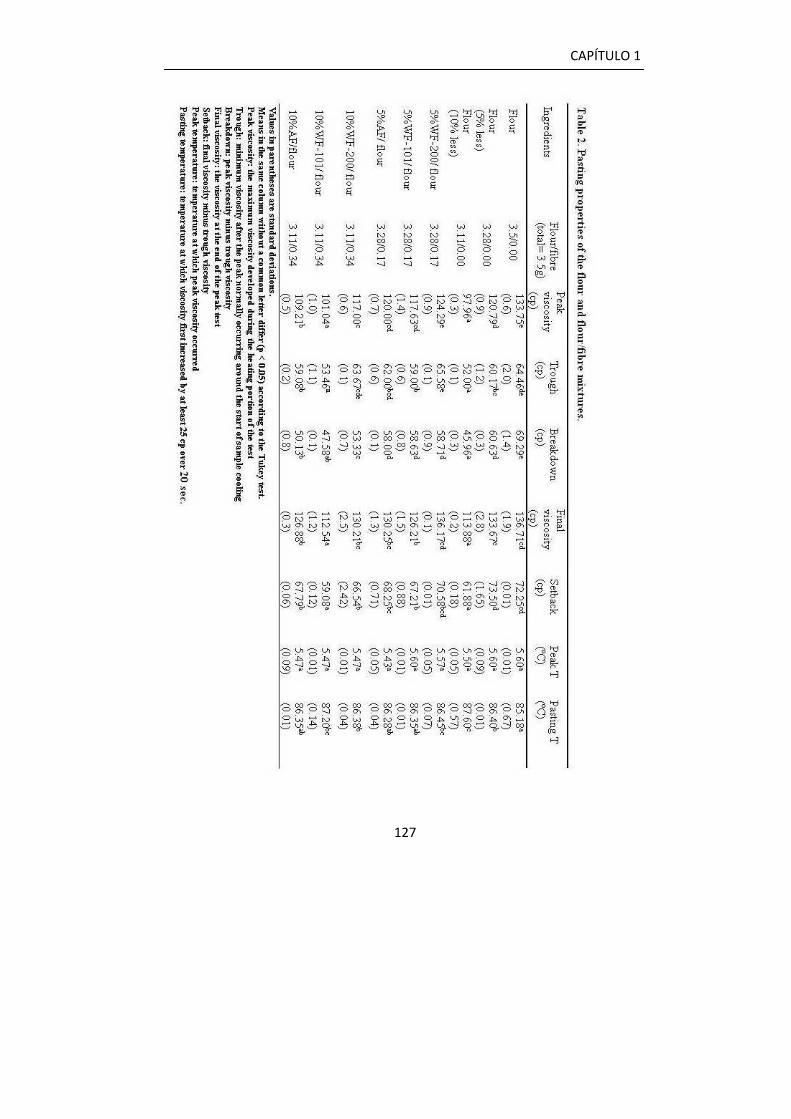
CAPÍTULO 1
127
CAPÍTULO 1
128
explained by the different WBCs of the fibres, which make less water available
for the flour.
Brennan et al., 2004 studied flour replacement with resistant starch (RS) and
inulin; as the level of these two fibres rose, the peak viscosity values fell, an
effect that these authors attributed to a reduction in the amount of gelatinizable
starch. In the present case, when the flour was replaced with fibre the pasting
values were slightly higher than those for the reduced flour alone samples (5%
or 10% less), so although the starch content was lower, the fibre helped to
recover (and in some cases exceed) the viscous properties of the starch (flour)
that had been replaced.
3.2. Dough properties
Dough properties depend on the contributions of the differents ingredients as
starch, proteins and the water present, which in turn influence the handling
properties. If the dough is too firm or too soft, it is not easy to handle; the dough
must be sufficiently cohesive to hold together during the different processing
steps and viscoelastic enough to separate cleanly when cut by the mould
(Gujral el al., 2003).
Rheological properties. The G’ and G” values were independent of the applied
strain up to a critical value (δ c) which defines the onset of non-linear response.
In all the doughs, G’ was always higher than G” (Table 3). The replacement of
flour by all the fibres resulted in an increase in both G’ and G” values, the
highest increase being found with 10% replacement by WF-200; 5%WF-200,
10%WF-101 and AF doughs showed similar elasticity (G’) results. Therefore,
the main difference was that the longest fibre (WF-200) gave the dough the
most elasticity.

CAPÍTULO 1
129
Table 3. Influence of different fibres and flour replacement levels on linear viscoelastic properties during strain sweeps at 25ºC. G’ (storage modulus), G” (loss modulus), ⎜G*⎜(complex modulus), tan delta and critical strain γc.
Sample G' G" ⎜G*⎪ Tan delta γc
Control 223483a
(18567) 128615a
(12114) 257853a
(22117) 0,58d (0,01)
0,054bc (0,01)
5%WF101 277455b
(22114) 154886ab (12623)
317773ab (25253)
0,56cd (0,01)
0,058c (0,00)
5%WF200 359857c
(24016) 195714c (14302)
409544cd (27855)
0,54bc (0,01)
0,051abc (0,01)
5%AF 226500a (21079)
129250a (12632)
260871a (24436)
0,57cd (0,01)
0,059c (0,00)
10%WF101 365914c
(16145) 196430c (7204)
415346cd (16385)
0,54b (0,02)
0,039ab (0,01)
10%WF200 661200d (35968)
321200d
(13627) 751351d (83974)
0,49a (0,02)
0,037a (0,01)
10%AF 317000bc (32501)
169714bc (19533)
359661bc (37443)
0,53a (0,02)
0,045abc (0,01)
Values in parentheses are standard deviations. Means in the same column without a common letter differ (p < 0.05) according to the Tukey test.
A decrease in tan delta (values closer to 0) was also found for the 10%
replacement with WF-200, implying greater predominance of the elastic as
opposed to the viscous component.
The effect of the fibres on the onset of non-linear response (γc) was only
significant for the 10% fibre addition level, which reduced the γc values,
meaning that the sample became less resistant to the applied strain.
3.3. Biscuit properties
Many chemical and physicochemical reactions occur during baking, like protein
denaturation, some loss of the starch's granular structure, fat melting, Maillard
reactions and browning, dough expansion, water evaporation and the
production and thermal expansion of gases (Chevallier, 2002). After baking, the
dough will be transformed into a solid structure where each ingredient has
different roles: the flour influences water binding and limits the dough's
expansion, fat gives aeration and lubrication and interferes with gluten
CAPÍTULO 1
130
development and sugar influences dough viscosity and gluten development
(Pareyt et al., 2008).
In the present work the flour was replaced by fibres with different properties and
compositions; in consequence, the dough properties had changed and the
properties of the biscuit would conceivably also be affected.
3.3.1. Texture analysis
3-Point break test. All the biscuits fractured under tension and the fracture took
place relatively close to their central zone (in the lower surface), where the
maximum stress occurred. This implied that the condition regarding the distance
between supports was satisfied. The curves obtained from the 3-point bending
test (not shown) were similar to others previously reported for materials with
brittle fracture patterns (Saleem, 2005): they were characterized by an initial
elastic response followed by a small fracture strain.
No significant differences were found in the values for maximum force
(hardness) and displacement on breaking into two pieces, although they were
higher for the biscuits containing WF-200, followed by WF-101 (Table 4). The
samples with AF presented similar maximum force values to those of the control
sample. Consequently, a clear relationship was found between fibre size and
hardness: the greater the fibre size, the higher force required to break the
biscuit. This was observed for both levels of fibres replacing part of the flour.
The number of sound peaks, an indication of crispness, showed that the wheat
fibre reduced this attribute (at both replacement levels), which means that there
was less microcracking and probably denotes a more compact biscuit matrix,
whereas the apple fibre retained or increased biscuit crispness. This result is of
great technological importance when deciding which fibre to use to enrich a
biscuit, as it shows that a smaller particle size will give a crisper, crumblier
texture.
Displacement at rupture presented no significant differences between fibres
(Table 4), however, it can be observed that the control biscuit broke before the
CAPÍTULO 1
131
biscuits with flour replacements, meaning that the control biscuits presented a
lower capacity for elastic deformation.
Saleem et al. (2005) reported a correlation between the moisture content and
the curves obtained by 3-point bending, pointing out that for less moisture the
load (N) was higher; in the present case, no correlation between moisture
content and force was found with fibre enrichment; this discrepancy is probably
because those authors studied changes in moisture higher than 1%, whereas in
the present case the maximum difference between the moisture contents of the
samples was 0.49%.
Previous authors (Sudha et al., 2007; Gujral et al., 2003) have observed
increased breaking strength when flour is replaced by fibre. Brennan et al.
(2004) used different soluble and insoluble fibres for flour replacement in
biscuits, observing a slight increase in the breaking strength probe values for
those containing potato peel (insoluble) and no increase for inulin and beta-
glucans (soluble). However, none of these studies discussed the particle size of
the fibres added.
Cone penetrometry test. The area under the curve could be an indication of the
sample's resistance to cone penetration as well as of the toughness of the
sample; 10%WF-200 was the toughest biscuit (Table 4).
All the force deformation curves showed numerous peaks that could be
understood as the breaking events that occurred when the probe passes though
the layers within the product structure. A more compact structure will be
reflected by fewer peaks and an airy or layered structure by a high number of
peaks.
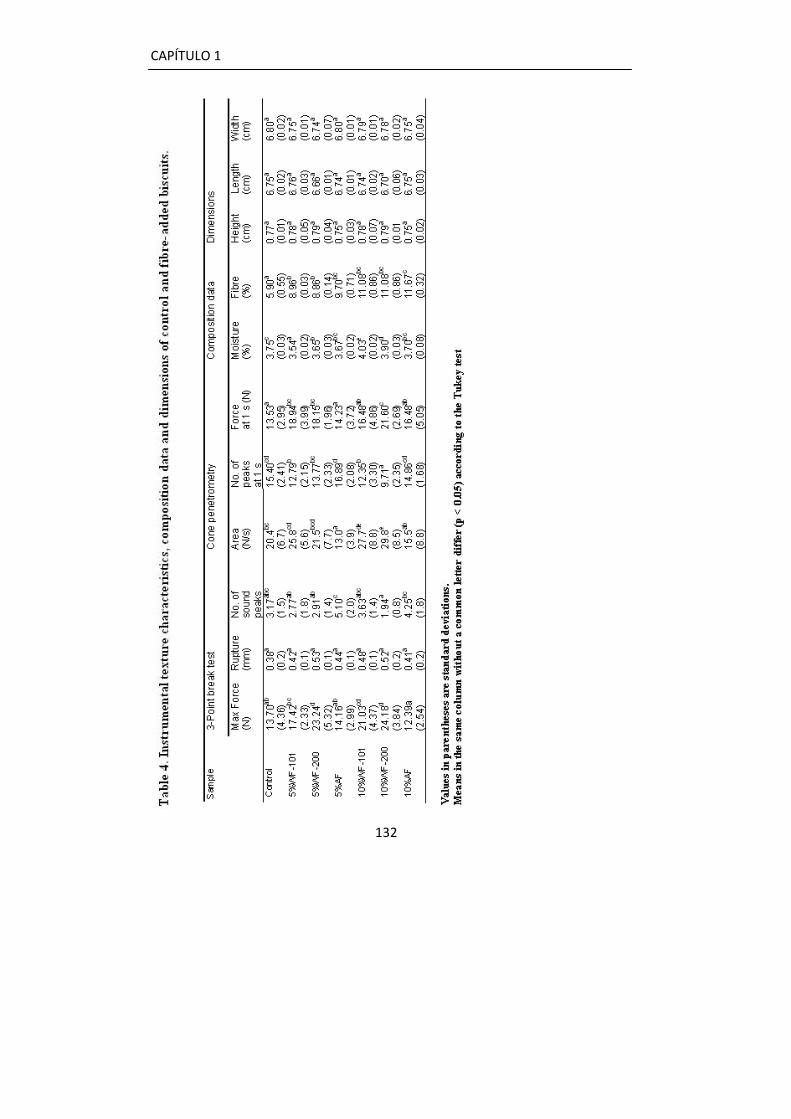
CAPÍTULO 1
132

CAPÍTULO 1
133
In order to study the biscuit matrix properly, as well as the mean resistance of
each biscuit, the number of peaks and the force at one second were also
measured (Table 4). Fewer peaks and a higher maximum force were observed
for the 10%WF-200 biscuit, while the AF fibre provided the biscuit with a high
number of peaks, related to an airy structure and lower maximum force as the
cone penetrated, which could be related to its having a brittle structure and
being the easiest to fracture.
The differences between WF-200 and WF-101 could be attributed to their
different fibre size, as the long WF-200 could form chain entanglements,
creating an internal network that provides strength and more resistance at the
breaking point. Despite this, the WF (WF-101 and WF-200) samples were very
similar to each other.
3.3.2. Biscuit images
Baltsavias et al. (1999) considered the biscuit a cellular solid, a model structure
of connected beams or plates. In the present study, each peak found by the
cone penetrometry was related to a microfracture in the biscuit matrix, so it
could be said that the control biscuit and AF biscuit contained more of
Baltsavias’ plates, created by air inside the biscuit matrix. In order to confirm
this theory, the structure shown by images was studied.
The photographs of 10%WF-200 proved it to have a highly compact structure,
while the control had more air pockets and holes in the biscuit matrix (images
not shown). Blaszcak et al. (2004) explained that biscuit matrix properties are
mainly determined by air spaces and fat globules. These observations are in
accordance with the texture results obtained in the present study: more
microcracking during cone penetrometry occurred in the control samples,
favoured by air pockets, whereas the wheat fibres created a more compact
structure. Images of the AF biscuits could not be obtained due to the brittleness
of the samples, which made them impossible to cut perpendicularly without
breaking into several pieces.
CAPÍTULO 1
134
3.3.4. Scanning Electro Microscopy
No evident differences due to replacing flour with fibres were observed in the
SEM photographs of the biscuits’ matrices (images not shown). The
photographs showed two kinds of fat globules in the biscuit matrix, as described
by other authors (Blaszczak et al., 2004); the matrix observed was mainly
protein with embedded fat globules and starch granules.
3.3.5. Dimensions
No significant differences were found in the biscuits’ height, width or length due
to the addition of fibres. Some reduction in the biscuits’ dimensions due to fibre
addition has been observed in previous works; Brennan et al. (2004) suggested
that the fibres may act as biscuit dough mixture stabilizers at up to 10% of
replacement, enabling the reformulated biscuit dough to retain its diameter
during baking. Higher replacement of flour (60%) with resistant starch has been
related to a lower gluten content (Laguna et al., 2010).
3.3.6. Moisture and fibre content
The analysis showed no significant differences in the final moisture content of
the biscuits (Table 4). Each recipe had a different water content, so the water
loss rate during the baking process was also different. The dough with the
highest water loss was AF (at both 5% and 10%). This could be attributed to the
apple fibre's being unable to retain as much water as the cellulosic material of
the wheat fibre.
The fibre content (Table 4) showed the expected differences due to the
percentages of fibre added.
3.4. Sensory analysis
The appearance of the wheat fibres was that of white powders with a neutral
flavour and odour; the apple fibre had a slightly fruity odour and a beige-brown
colour.
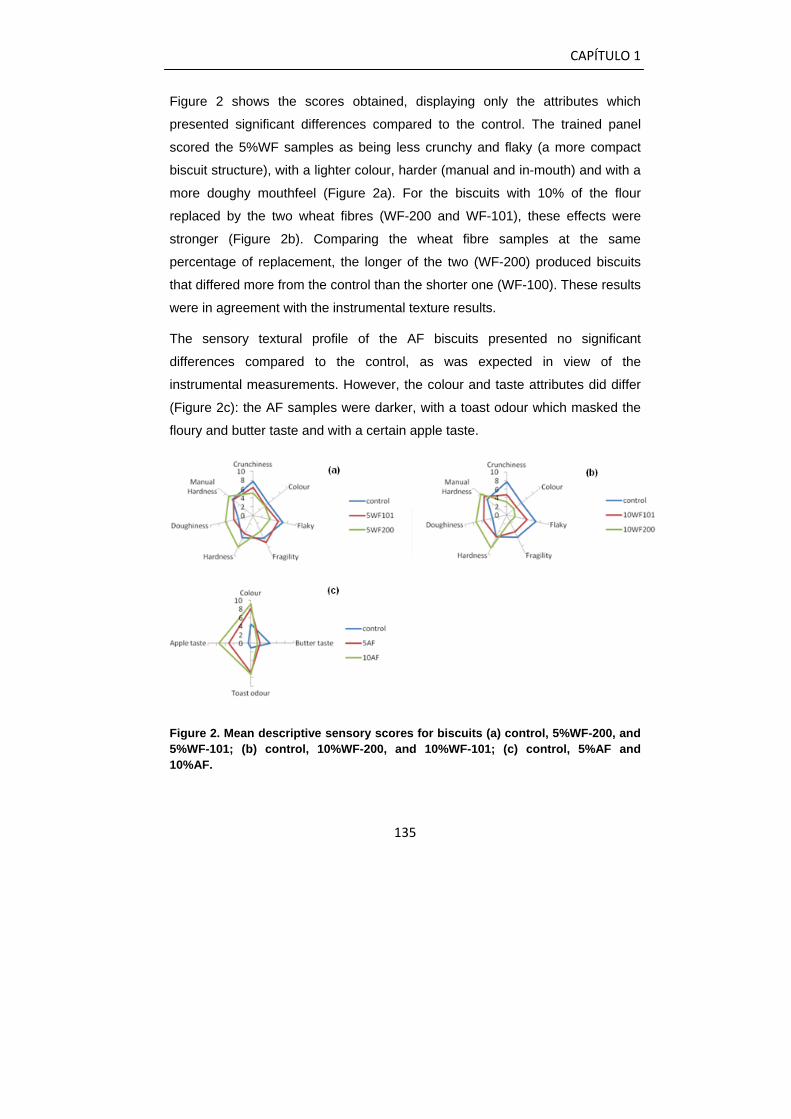
CAPÍTULO 1
135
Figure 2 shows the scores obtained, displaying only the attributes which
presented significant differences compared to the control. The trained panel
scored the 5%WF samples as being less crunchy and flaky (a more compact
biscuit structure), with a lighter colour, harder (manual and in-mouth) and with a
more doughy mouthfeel (Figure 2a). For the biscuits with 10% of the flour
replaced by the two wheat fibres (WF-200 and WF-101), these effects were
stronger (Figure 2b). Comparing the wheat fibre samples at the same
percentage of replacement, the longer of the two (WF-200) produced biscuits
that differed more from the control than the shorter one (WF-100). These results
were in agreement with the instrumental texture results.
The sensory textural profile of the AF biscuits presented no significant
differences compared to the control, as was expected in view of the
instrumental measurements. However, the colour and taste attributes did differ
(Figure 2c): the AF samples were darker, with a toast odour which masked the
floury and butter taste and with a certain apple taste.
Figure 2. Mean descriptive sensory scores for biscuits (a) control, 5%WF-200, and 5%WF-101; (b) control, 10%WF-200, and 10%WF-101; (c) control, 5%AF and 10%AF.
CAPÍTULO 1
136
Conclusions
This study has shown the influence of the morphology of the different fibres on
the dough and biscuit matrix properties, making proper selection of fibre size
and shape essential when formulating a fibre-enriched biscuit.
The apple fibre needed more water to reach the correct water level for dough
handling, although all the fibre-enriched biscuits had a similar final water
content. The AF biscuits had similar texture properties to the control but the
fibre gave them a fruity taste. The biscuits with wheat fibre were neutral in
flavour but harder in texture; this was attributed to the high water binding
capacity of these elongated fibrils, which created a compact biscuit matrix
structure. The medium length wheat fibre (WF-101) biscuits were not as hard as
those with the longer wheat fibre (WF-200).
References
AACC International. (2009). Approved Methods of Analysis, 11th Ed. Method
44-15.02 , 32-40.01 International, St. Paul, MN, U.S.A.
Ajila, C.M., Leelavathi, K., Rao, H. (2008). Improvement of dietary fibre content
and antioxidant properties in soft dough biscuits with the incorporation of
mango peel powder. Journal of Cereal Science. 48 (2), 319-326.
Aparicio-Saguilán, A., Sáyago-Ayerdi, S.G., Vargas-Torres, A., Tovar J.,
Ascencio-Otero, T.E., Bello-Pérez, L.A.(2007). Slowly digestible cookies
prepared from resistant starch-rich lintnerized banana starch. Journal of
Food Composition and Analysis 20, 175–181.
Baltsavias, A., Jurgens, A., Van vliet, T. (1999). Fracture Properties of Short-
Dough Biscuits: Effect of composition. Journal of Cereal Science 29, 235-
244.
Blaszczak, W., Fornal, J., & Ramy, A. (2004). Effect of emulsifiers’ addition on
dough properties, backing quality and microstructure of biscuits. Polish
Journal of Food and Nutrition Sciences, 13/54, 343-348.
CAPÍTULO 1
137
Bilgiçli, N., Ibanoglu, S., Nur Heken, E. (2005). Effect of dietary fibre addition on
the selected nutritional properties of cookies. Journal of Food Engineering
78, 86-89.
Brennan, C.S., Samyue, E. (2004). Evaluation of Starch Degradation and
Textural Characteristics of Dietary Fiber Enriched biscuits. International
Journal of Food Properties 7 (3), 647-657.
Chaplin, F.M. (2003). Fibre and water binding. Proceedings of the Nutrition
Society, 62; 223-227.
Chen, H., Rubenthaler, G.L., Schanus, E.G. (1988). Effect of Apple Fiber and
Cellulose on the Physical Properties of Wheat Flour. Journal of Food
Science and Technology, 53, 1.
Chevallier, S., Colonna, P., Della Valle, G., Lourdin, D. (2000). Contribution of
Major Ingredients during Baking of Biscuit Dough Systems. Journal of
Cereal Science 31, 241–252.
Eliasson, A.C. (1986). A comparison of the viscous behaviour during
gelatinisation of starch. Journal Texture Studies17, 253-265.
Ellouze-Ghorbel, R., Kamoun, A., Neifar, M., Belguith, S., Ayadi, M.A., Kamoun,
A., Ellouze-Chabouni, S. (2010). Development of fiber-enriched biscuits
formula by a mixture design. Journal of texture studies 41, 472-491.
Fasolin, L.H., Almeida, G.C., Castanho, P.S., Netto-Oliveira, E.R. (2007).
Cookies produced with banana meal: chemical, physical and sensorial
evaluation. Ciência e tecnologia de alimentos 27(3), 524-529.
Gujral, H.S., Mehta, S., Samra, I.S., Goyal, P. (2003). Effect of wheat bran,
coarse wheat flour and rice flour on the instrumental texture of cookies.
International Journal of Food properties 6(2), 329-340.
Lai, H.M. and Lin T.C. (2006.) Bakery products: science and technology.pp.3-
65. In: Bakery Products: Science and Technology. Hui Y.H., Corke H., De
Leyn I., nip W.-K., Cross N. Elckwell Publishing Ames, USA.
CAPÍTULO 1
138
Laguna, L., Salvador, A., Sanz, T., Fiszman, S.M. (2012). Performance of a
resistant starch rich ingredient in the baking and eating quality of short-
dough biscuits. LWT - Food Science and Technology 44, 737-746.
Leelavathi, K., Haridas Rao, P. (1993). Development of high fibre biscuits using
wheat bran. Journal of Food Science and Technology 30, 187–191.
Mongeau, R., Brassard, R.(1982). Insoluble Dietary fiber from Breakfast
Cereals and Brans: Bile Salt Binding and Water-Holding Capacity in
Relation to Particle Size. Cereal Chemistry 59(5), 413-417.
Nilsson, A. C., Ostman, E. M., Holst, J. J.,Bjorck, I. M. E. (2008). Including
indigestible carbohydrates in the evening meal of healthy subjects improves
glucose tolerance, lowers inflammatory markers, and increases satiety after
a subsequent standardized breakfast. Journal of Nutrition 138 (4), 732-739.
Öztürk S., Özboy Ö., Köksel H. (2002). Effects of Brewer’s spent grain on the
quality and dietary fibre content of cookies. Journal of the Institute of
Brewing. 108 (1), 23-27.
Pareyt, B., Wilderjans, E., Goesaert, H., Brijs, K., Delcour, J.A. (2009).The role
of gluten in a sugar-snap cookie system: A model approach based on
gluten–starch blends. Journal of Cereal Science 48, 863–869.
Prentice, N., Kissell, L.T., Lindsay, R.C., Yamazaki, W.T. (1978). High–Fibre
cookies containing brewer’s spent grain. Cereal Chemistry 55(5),712-721.
Saleem, Q., Wildman, R.D., Huntley, J.M., Whitworth M.B. (2005). Material
properties of semi-sweet biscuits for finite element modelling of biscuit
cracking. Journal of food engineering 68, 19-32.
Stone, H, Sidel, J. (2004). Quantitative Descriptive Analysis (The QDA Method).
In: Sensory Evaluation Practices, 3rd Ed. Elsevier Academic Press, San
Diego, CA. 774 pp.215-235.
CAPÍTULO 1
139
Sudha, M.L., Vetrimani, R., Leelavathi, K. (2007). Influence of fibre from
different cereals on the rheological characteristics of wheat flour dough and
on biscuit quality. Food Chemistry 100, 1365-1370.
Thibault, J.F., Ralet, M.C. (2001). Pectins, their origin, structure and functions.
In B.V. McCleary & L.Prosky (Eds.). In: Advanced dietary fibre technology
(pp. 369-378), Oxford: Blackwell Science Ltd.
Tosh, S.M., Yada ,S. (2010). Dietary fibres in pulse seeds ad fractions:
Characterization, functional attributes and applications. Food Research
International 43, 450-460.
Truswell, A.A.(1993). Dietary fiber and health. World Review of Nutrition and
Dietetics, 72, 148.
Tuohy, K.M., Kolida ,S., Lustenberger, A.M.; Gibson G.R. (2001). The prebiotic
effects of biscuits containing partially hydrolysed guar gum and
fructooligosaccharides — a human volunteer study. British Journal of
Nutrition 86, 341–348.
Varela, P., Chen, J., Fiszman, S., Povey, M. (2006). Crispness assessment of
toasted almonds by an integrated approach to texture description: Texture,
acoustics, sensory and structure. Journal of Chemometrics, 20:311–320

A NEW SENSORY TOOL TO ANALYSE THE ORAL TRAJECTORY OF
BISCUITS WITH DIFFERENT FAT AND FIBRE CONTENTS
Laura Laguna, Paula Varela, Ana Salvador, Susana Fiszman
FOOD RESEARCH INTERNATIONAL

CAPÍTULO 1
143
Abstract
Reformulating traditional products such as biscuits can be a useful tool for
providing the population with healthier snacks. However, it involves changes in
the eating characteristics of the final product. This study focuses on the oral
perception of these biscuits, using the Temporal Dominance of Sensation (TDS)
technique with two different amounts of fat (60g and 30g fat/100g flour) and
fibre (4g and 8g fibre/100g flour). The TDS data obtained with a trained panel
showed that hardness was the first dominant attribute in all the formulations
during the mastication process. The dominance of the other parameters
appeared to depend more on the fat and fibre contents, as crispness appeared
with high-fat biscuits and crunchiness with low-fat, high-fibre ones, while both
attributes were perceived in intermediate formulations. In the high-fibre
formulations, grittiness and dry mouthfeel appeared during chewing and dry
mouthfeel was dominant. At the end of the mastication all the biscuits were
perceived as pasty. A fat mouthfeel was also perceived with both high-fat and
low-fat biscuits, with or without the addition of a low level of fibre. Biscuits with
high fibre and low fat contents were perceived as less crisp. Penalty analysis
based on JAR scales, showed that excesive hardness and dry mouthfeel were
the most penalizing attributes causing significant drop in biscuit acceptability.
Keywords: oral processing; temporal dominance of sensations; biscuit;
consumer perception
CAPÍTULO 1
144
1. Introduction
Biscuits are consumed at almost every level of society. The reasons for the
widespread popularity of these baked products include their being ready-to-eat,
affordable, of good nutritional quality, available in different tastes and having a
long shelf life (Ajila, Leelavathi, & Rao, 2008). However, biscuits contain high
levels of fat and nowadays consumers demand reduced-calorie foods with
health benefits (Handa, Goomer,& Siddhu, 2012).
Reducing fat and adding fibre to biscuits without affecting the sensory
characteristics is a significant challenge. Fat imparts shortening, richness and
tenderness, improving flavour and mouthfeel (Pareyt & Delcour, 2008). Fibre
generally gives the product some flavour but makes it unpalatable, with a
coarse texture and a poor, dry mouth feel (Yue & Waring, 1998). In
consequence, lowering the fat content and increasing the fibre are expected to
greatly influence mechanical behaviour in the mouth, which has implications for
product acceptability (Hutchings & Lillford, 1988).
Brown & Braxton (2000) related a preference for “Rich Tea”-type biscuits with
their relative ease of oral breakdown, using the Time Intensity Procedure . Time
intensity (TI) is the method most often used to study the evolution of sensations
with time. However, only one attribute is evaluated at a time and the number of
attributes is limited (Pineau, et al., 2009). Other dynamic sensory
methodologies that have been used to describe changes in sensory attributes
during the eating process include Dual Time Intensity, which measures two
sensory attributes simultaneously (Duizer, Bloom, & Findlay, 1997), or
Progressive Profiling, where the panellist scores the same attributes several
times during eating (Jack, Piggot, & Paterson, 1994). However, these
techniques cannot give information about the dominant attributes in real time
while the product is being eaten.
A new sensory method called Temporal Dominance Sensation (TDS) presents
the panellists with a complete list of attributes, from which they choose the
dominant one at each point in time, at the same time also scoring its intensity
CAPÍTULO 1
145
up to the moment the sensation ends (Pineau et al., 2009). Labbe et al. (2009)
and Pineau et al. (2009) compared the TI and TDS techniques in gels with
different levels of odorants and in dairy products, respectively, concluding that
although both techniques resulted in closely-matched behaviour patterns, TDS
improved the sequencing of sensations over time. Albert, Salvador, Schlich, and
Fiszman (2012) compared the results of TDS (with untrained panellists) and
descriptive sensory profiling (with a trained panel). They showed that TDS gave
similar results, making it possible to monitor the behaviour of the food piece
when it is broken down and physically transformed by the organs of the mouth.
The objectives of this study were: (1) to conduct an in-depth study of the
mechanical phenomena occurring in mouth during the oral processing of
biscuits using TDS, (2) to study the impact of fibre addition and fat reduction on
the perception of texture over time during in-mouth handling, (3) to achieve a
better understanding of the factors affecting consumer acceptance.
2. Materials and Methods
2.1. Biscuit Ingredients and Preparation
Six samples (3x2 design) were tested. The percentages of the biscuit
ingredients are shown in Table 1. The code letters for the samples were C
(control, complete formulation), LF (50% less fat), LW and HW (respectively 4%
and 8% added fibre replacing flour), LWLF (low fibre and low fat) and HWLF
(high fibre and low fat).
Ingredients. The ingredients employed to prepare the biscuits were: soft wheat
flour suitable for biscuits (Belenguer, S.A., Valencia, Spain) (composition data
provided by the supplier: 15% moisture, 11% protein, 0.6% ash; alveograph
parameters P/L=0.27, where P is the maximum pressure required and L is the
extensibility; W, the baking strength of the dough, was 134), shortening (St.
Auvent, Vandemoortele France), fibre (wheat fibre with a fibre length of 200μm,
(Rettenmaier Ibérica, Barcelona, Spain), sugar (Azucarera Ebro, Madrid,
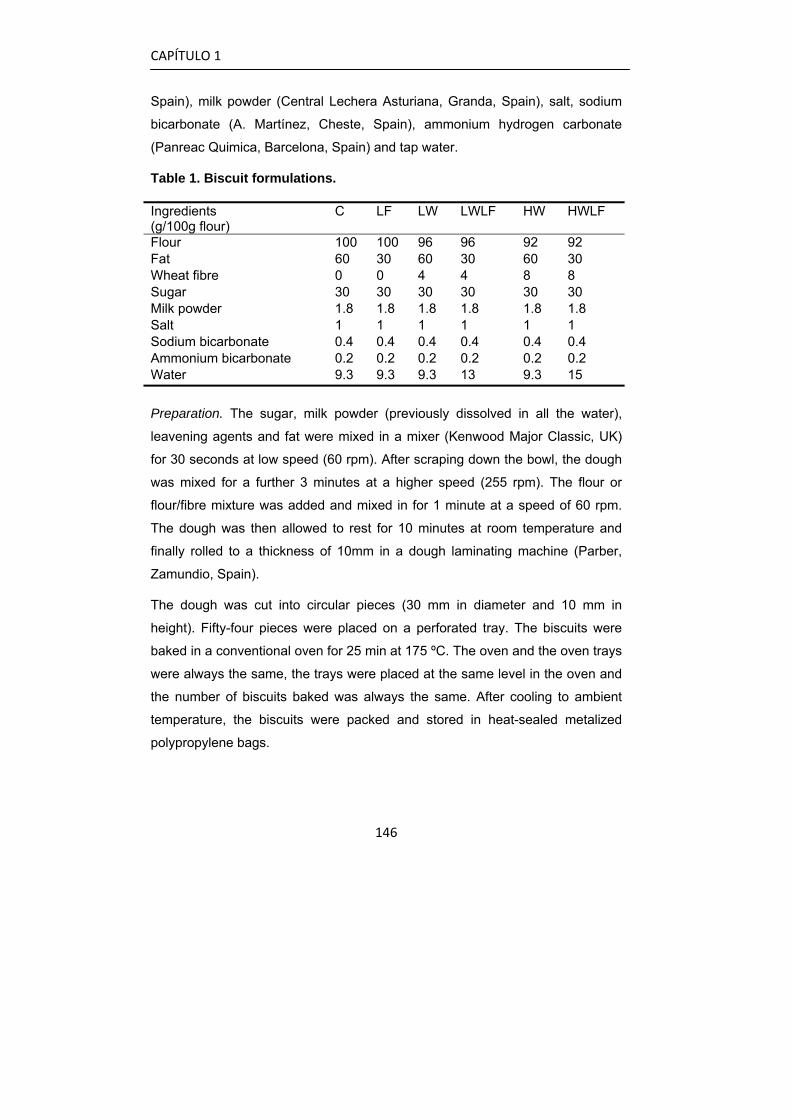
CAPÍTULO 1
146
Spain), milk powder (Central Lechera Asturiana, Granda, Spain), salt, sodium
bicarbonate (A. Martínez, Cheste, Spain), ammonium hydrogen carbonate
(Panreac Quimica, Barcelona, Spain) and tap water.
Table 1. Biscuit formulations.
Preparation. The sugar, milk powder (previously dissolved in all the water),
leavening agents and fat were mixed in a mixer (Kenwood Major Classic, UK)
for 30 seconds at low speed (60 rpm). After scraping down the bowl, the dough
was mixed for a further 3 minutes at a higher speed (255 rpm). The flour or
flour/fibre mixture was added and mixed in for 1 minute at a speed of 60 rpm.
The dough was then allowed to rest for 10 minutes at room temperature and
finally rolled to a thickness of 10mm in a dough laminating machine (Parber,
Zamundio, Spain).
The dough was cut into circular pieces (30 mm in diameter and 10 mm in
height). Fifty-four pieces were placed on a perforated tray. The biscuits were
baked in a conventional oven for 25 min at 175 ºC. The oven and the oven trays
were always the same, the trays were placed at the same level in the oven and
the number of biscuits baked was always the same. After cooling to ambient
temperature, the biscuits were packed and stored in heat-sealed metalized
polypropylene bags.
Ingredients (g/100g flour)
C LF LW LWLF HW HWLF
Flour 100 100 96 96 92 92 Fat 60 30 60 30 60 30 Wheat fibre 0 0 4 4 8 8 Sugar 30 30 30 30 30 30 Milk powder 1.8 1.8 1.8 1.8 1.8 1.8 Salt 1 1 1 1 1 1 Sodium bicarbonate 0.4 0.4 0.4 0.4 0.4 0.4 Ammonium bicarbonate 0.2 0.2 0.2 0.2 0.2 0.2 Water 9.3 9.3 9.3 13 9.3 15
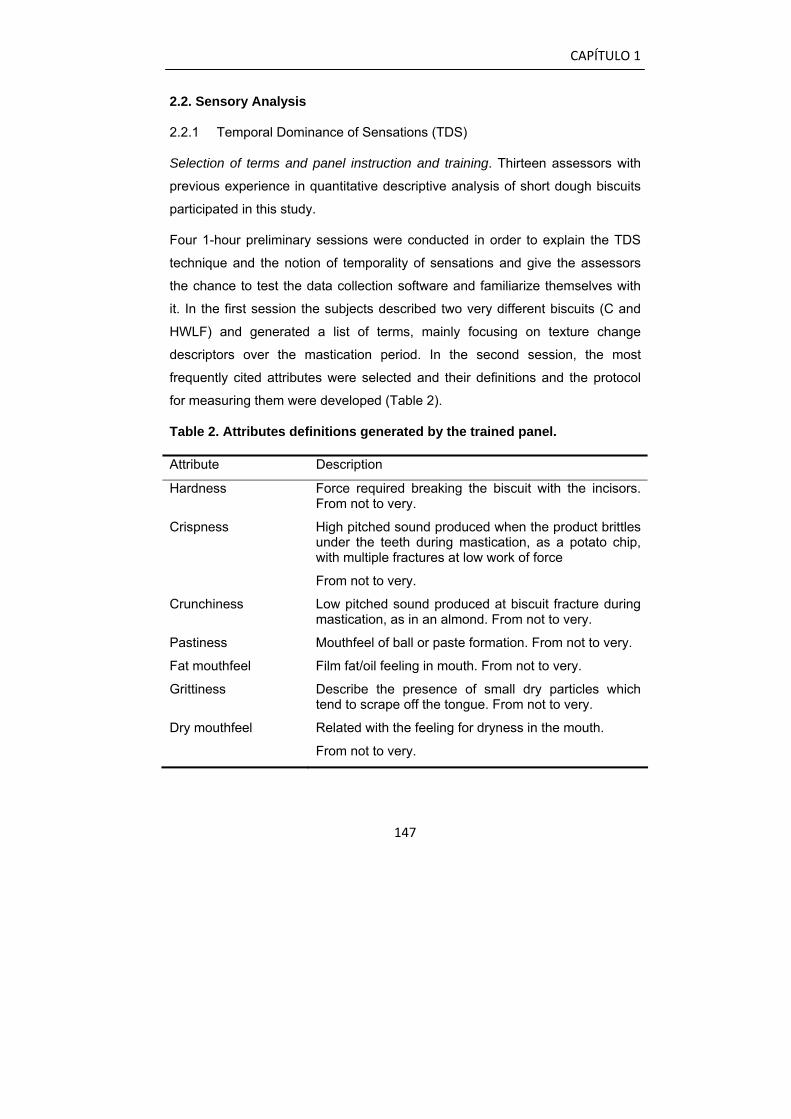
CAPÍTULO 1
147
2.2. Sensory Analysis
2.2.1 Temporal Dominance of Sensations (TDS)
Selection of terms and panel instruction and training. Thirteen assessors with
previous experience in quantitative descriptive analysis of short dough biscuits
participated in this study.
Four 1-hour preliminary sessions were conducted in order to explain the TDS
technique and the notion of temporality of sensations and give the assessors
the chance to test the data collection software and familiarize themselves with
it. In the first session the subjects described two very different biscuits (C and
HWLF) and generated a list of terms, mainly focusing on texture change
descriptors over the mastication period. In the second session, the most
frequently cited attributes were selected and their definitions and the protocol
for measuring them were developed (Table 2).
Table 2. Attributes definitions generated by the trained panel.
Attribute Description
Hardness Force required breaking the biscuit with the incisors. From not to very.
Crispness High pitched sound produced when the product brittles under the teeth during mastication, as a potato chip, with multiple fractures at low work of force
From not to very.
Crunchiness Low pitched sound produced at biscuit fracture during mastication, as in an almond. From not to very.
Pastiness Mouthfeel of ball or paste formation. From not to very.
Fat mouthfeel Film fat/oil feeling in mouth. From not to very.
Grittiness Describe the presence of small dry particles which tend to scrape off the tongue. From not to very.
Dry mouthfeel Related with the feeling for dryness in the mouth.
From not to very.
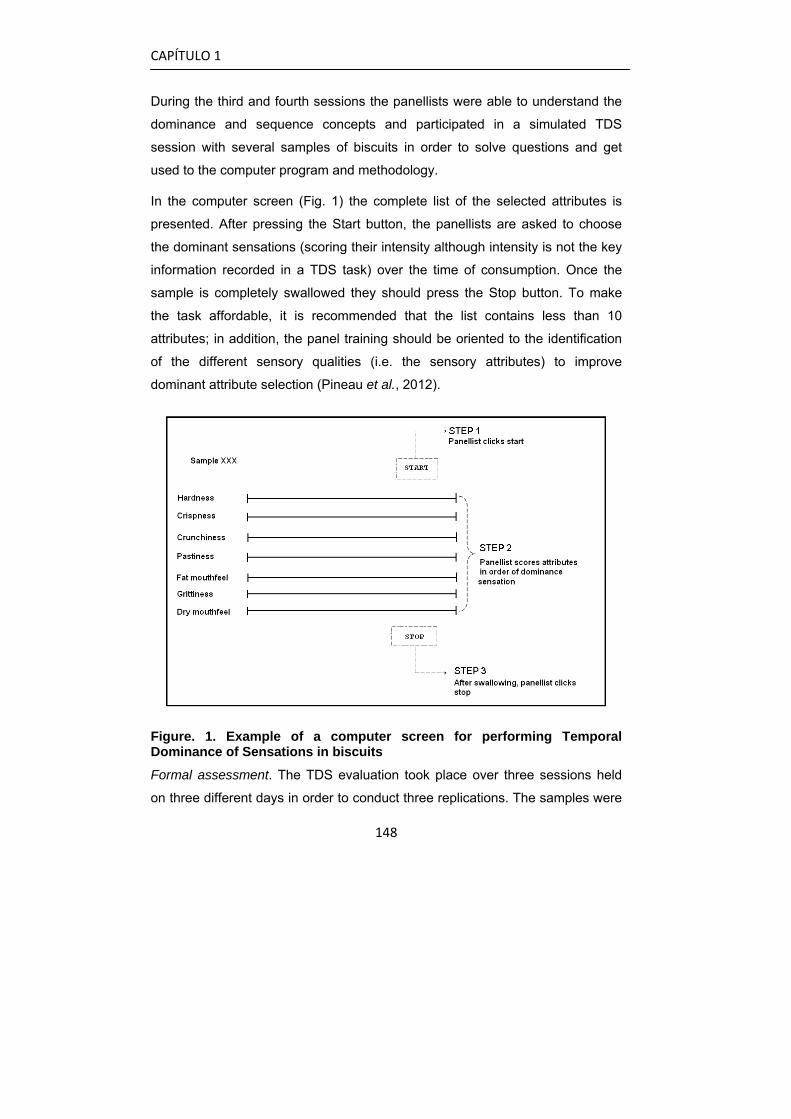
CAPÍTULO 1
148
During the third and fourth sessions the panellists were able to understand the
dominance and sequence concepts and participated in a simulated TDS
session with several samples of biscuits in order to solve questions and get
used to the computer program and methodology.
In the computer screen (Fig. 1) the complete list of the selected attributes is
presented. After pressing the Start button, the panellists are asked to choose
the dominant sensations (scoring their intensity although intensity is not the key
information recorded in a TDS task) over the time of consumption. Once the
sample is completely swallowed they should press the Stop button. To make
the task affordable, it is recommended that the list contains less than 10
attributes; in addition, the panel training should be oriented to the identification
of the different sensory qualities (i.e. the sensory attributes) to improve
dominant attribute selection (Pineau et al., 2012).
Figure. 1. Example of a computer screen for performing Temporal Dominance of Sensations in biscuits
Formal assessment. The TDS evaluation took place over three sessions held
on three different days in order to conduct three replications. The samples were
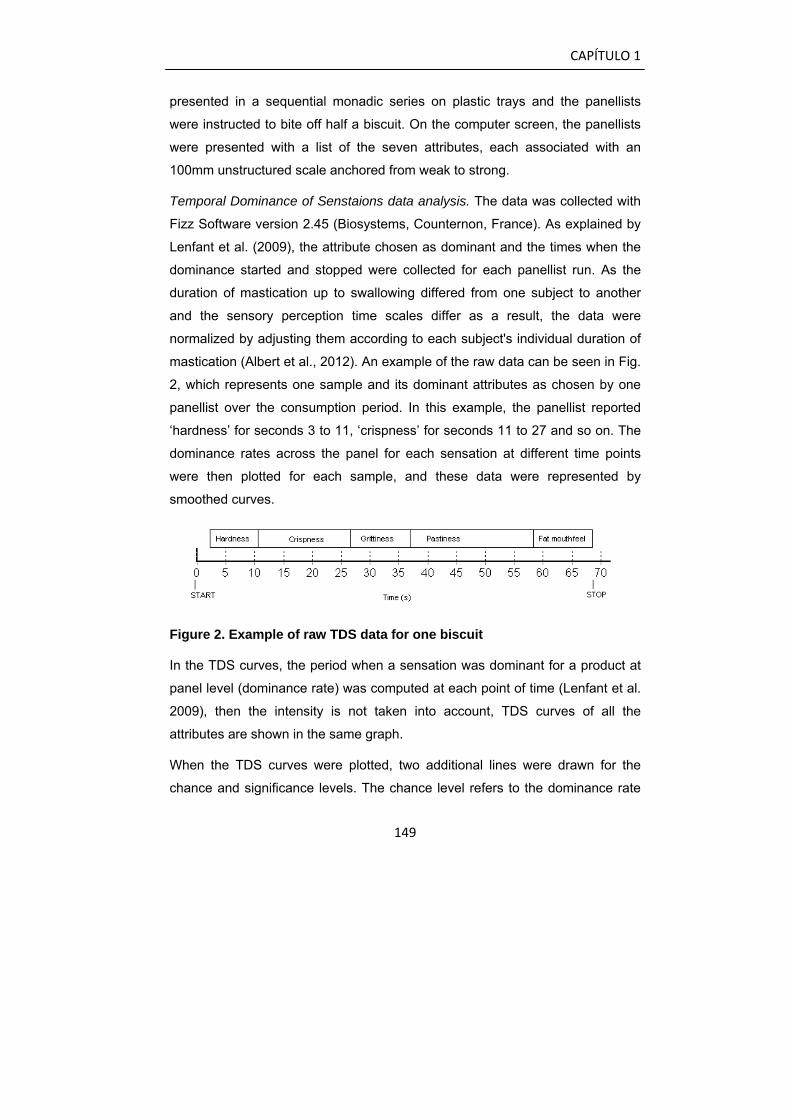
CAPÍTULO 1
149
presented in a sequential monadic series on plastic trays and the panellists
were instructed to bite off half a biscuit. On the computer screen, the panellists
were presented with a list of the seven attributes, each associated with an
100mm unstructured scale anchored from weak to strong.
Temporal Dominance of Senstaions data analysis. The data was collected with
Fizz Software version 2.45 (Biosystems, Counternon, France). As explained by
Lenfant et al. (2009), the attribute chosen as dominant and the times when the
dominance started and stopped were collected for each panellist run. As the
duration of mastication up to swallowing differed from one subject to another
and the sensory perception time scales differ as a result, the data were
normalized by adjusting them according to each subject's individual duration of
mastication (Albert et al., 2012). An example of the raw data can be seen in Fig.
2, which represents one sample and its dominant attributes as chosen by one
panellist over the consumption period. In this example, the panellist reported
‘hardness’ for seconds 3 to 11, ‘crispness’ for seconds 11 to 27 and so on. The
dominance rates across the panel for each sensation at different time points
were then plotted for each sample, and these data were represented by
smoothed curves.
Figure 2. Example of raw TDS data for one biscuit
In the TDS curves, the period when a sensation was dominant for a product at
panel level (dominance rate) was computed at each point of time (Lenfant et al.
2009), then the intensity is not taken into account, TDS curves of all the
attributes are shown in the same graph.
When the TDS curves were plotted, two additional lines were drawn for the
chance and significance levels. The chance level refers to the dominance rate
CAPÍTULO 1
150
that an attribute could obtain by chance. Its value is inversely proportional to the
number of attributes (P0 = 1/p, where p is the number of attributes). The
significance level is the minimum value this proportion should equal if it is to be
considered significantly (p<0.05) higher than P0. It is calculated as follows:
nPP
PPs)1(
645.1 000
−+=
where Ps is the lowest significant proportion value (α= 0.05) at any point in time
for a TDS curve and n is the number of subjects x number of replications.
Rosner (1995) recommended that np(1-p)>5 (where n = number of trials and p
= probability of success). In the present study, 13 panellists performed 3
replications of each product and 7 attributes were used.
2.2.2. Consumer test
All the consumer sessions were held mid-morning, before lunchtime (11.00 -
13.00). A total of 100 consumers aged from 18 to 65 years who frequently
consume this type of biscuit agreed to take part in the study. The consumers
evaluated the six samples in a single session. The biscuits were coded with
random three-digit numbers following a balanced complete block experimental
design. Overall liking, texture liking and flavour liking were scored on nine-point
hedonic scales (from 1=dislike extremely to 9=like extremely).
The adequacy of four of the attributes was measured with “just-about right”
(JAR) scales. These scales usually have five points to assess whether there is
too little, too much or a “just-about-right” level of an attribute (Lawless &
Heymann, 1998). The end-points are anchored with labels that represent levels
of the attribute that deviate from a respondent’s theoretical ideal point in
opposite directions, while the central point is the ideal (Rothman, 2007). In this
study, the adequacy of the ‘hardness’, ‘dry mouthfeel’, ‘fat mouthfeel’ and
‘pastiness’ levels of each sample were scored on bipolar JAR scales (from
1=much too little to 5=much too much, with 3=just about right).
CAPÍTULO 1
151
Crispness intensity was measured on a 9-point intensity scale rather than a JAR
scale, as crispness is an example of a well-liked attribute that “you can never
have too much of”, so in this case JAR scales do not help to understand the
adequacy or attribute level, as it may never be possible to reach the theoretical
“ideal level” (Rothman, 2007).
2.3. Instrumental texture analysis
The texture of the biscuits was measured instrumentally using a TA.TX.plus
Texture Analyzer (S Table Micro Systems, Godalming, UK). Penetration tests
(12 mm diameter cylindrical probe P/0.5), were conducted with whole biscuits,
setting a distance of 10mm, a test speed of 1mm/s and a trigger force of 0.19N.
Twelve biscuits corresponding to two batches of each formulation prepared on
different days were measured.
The maximum force (N) as a measure of hardness, the number of force peaks
(with a threshold of 0.01N) as an index of crispness/grittiness and the gradient
of the initial steep slope of the curve (N/sec) as a measure of biscuit
deformability were measured.
In order to take a picture of the samples after breaking, two biscuits from each
formulation were placed in Petri dishes before the penetration test. The dishes
with the broken biscuits were then placed in a flatbed scanner (HP 4300c,
Hewlett Packard, USA) and the images, with a resolution of 199 pixels per inch,
were saved.
2.4. Data analysis
Analysis of variance (two-way ANOVA with fat, fibre and their interaction as
factors) was applied to the consumer liking scores, instrumental texture analysis
results and TDS mean maximum intensity scores to study the differences
between the formulations. The least significant differences were calculated by
Tukey's test (p < 0.05). These analyses were performed using XLSTAT
2009.4.03 statistical software (Microsoft, Mountain View, CA).
CAPÍTULO 1
152
The JAR results were analysed by penalty analysis (PA), using XLSTAT
software, to identify potential directions for product improvement on the basis of
consumer acceptance by highlighting the most penalizing attributes in liking
terms. The respondent percentages (x-axis) were plotted against the penalties
(y-axis), and an attribute was considered significant when the respondent
percentage was higher than 20% (Xiong & Meullenet, 2006) and the penalty
score (drop in overall liking) was higher than 1. Penalty analysis was used in
order to gain an understanding of the attributes that most affected liking ratings
(Plaehn & Horne, 2008). This technique is used to relate JAR scales to liking
data, particularly in order to understand which side of the JAR scale is linked to
lower hedonic ratings. The usefulness of the method is that it provides guidance
for product reformulation or a better understanding of attribute adequacy in
relation to liking in terms of direction, with the assumption that the maximum
hedonic score will occur at the “just about right” point (Rothman, 2007).
Principal Component Analyses (PCA) of the instrumental analysis scores and
mean maximum intensity scored in the TDS tests were plotted using XLSTAT
software.
The results of attribute dominances over time were considered along with
instrumental texture parameters and other sensory measurements that helped
to understand the biscuits’ eating quality.
3. Results and Discussion
3.1. Texture changes during oral processing of the biscuits
When the TDS curves rise from between the chance and significance levels to
above the latter, they are considered consistent at panel level. In the present
study, in the TDS curves (Fig. 3) the x-axis corresponds to the standardized
time (%) and the y-axis to the dominance rate (%).
CAPÍTULO 1
153
A general overview of the TDS curves showed that hardness is the first
sensation perceived for all the biscuits at the beginning of the mastication
period. Subsequently, depending on the level of fat, the biscuits were perceived
as being crisp (those with the full level of fat: samples C, LW and HW) or
crunchy (those with the low fat level: samples LF, LWLF and HWLF). At the end
of the mastication period, dry mouthfeel appeared as the dominant sensation for
the samples with added fibre. This sensation was more accentuated for the low-
fat biscuits. Fat mouthfeel was detected at a late stage with samples C, LW and
LF.
3.1.1. Hardness
This was the first dominant sensation perceived for all the biscuits at the
beginning of the mastication period (Figure 3).
The sensory perception of hardness was based on the force required to break
the biscuits with the incisors, in accordance with Lillford (2011), who states that
the first fracture in a biscuit occurs between the teeth.
In agreement with the sensory perception of hardness, the instrumental
measurement of hardness (maximum force during penetration) showed
significant differences (p-value<0.005) with different fat and fibre contents
(Table 3). The samples with a low fat content (LF, LWLF, and HWLF) were
significantly (p<0,05) harder than the full-fat biscuits and hardness was
increased by the addition of fibre (Figure 4) as the interaction in table 3 shows.
The first explanation for these two facts is that when the fat content is reduced
the flour particles become more hydrated, making their components more
accessible to water, so the gluten also becomes more hydrated and a tougher
dough is obtained, resulting in harder biscuits (Ghotra, Dyal, & Narine, 2002).
The second is that fibre consists of single polysaccharide chains that can
interact with each other to form junction zones which can enclose large
amounts of strongly bound and fairly static water, making the junction zones
denser and less flexible than the single chain zones (Chaplin, 2003).
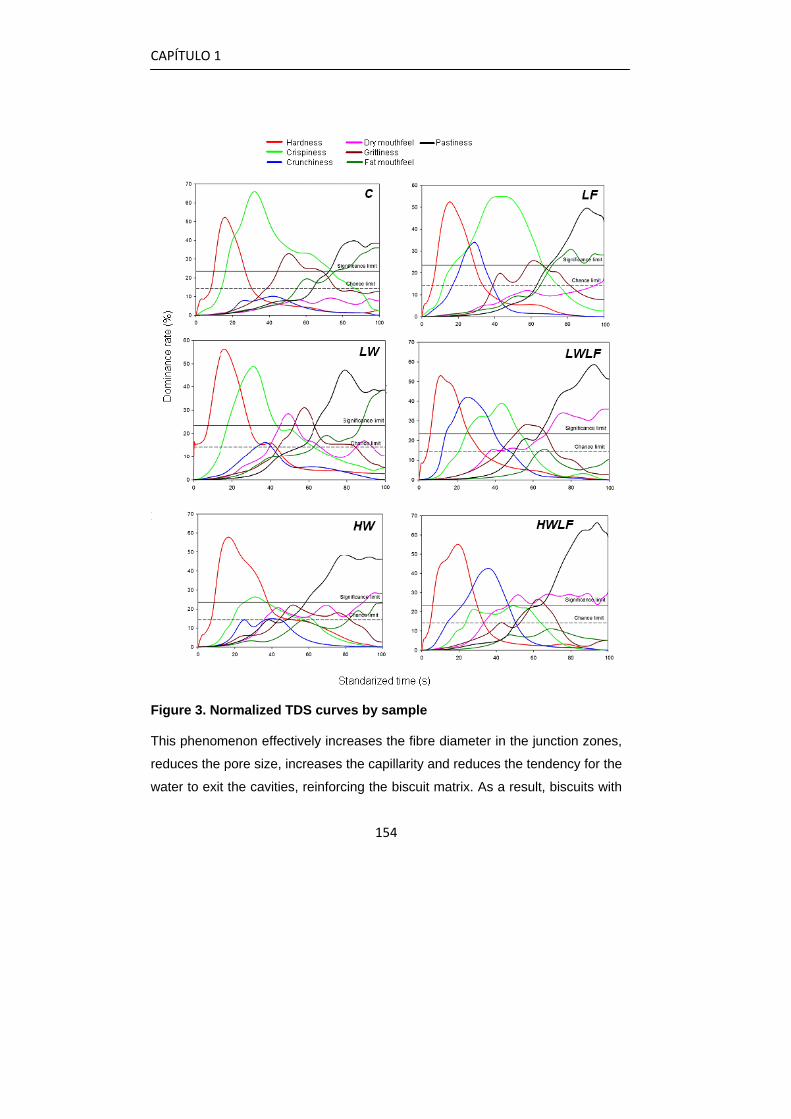
CAPÍTULO 1
154
Figure 3. Normalized TDS curves by sample
This phenomenon effectively increases the fibre diameter in the junction zones,
reduces the pore size, increases the capillarity and reduces the tendency for the
water to exit the cavities, reinforcing the biscuit matrix. As a result, biscuits with
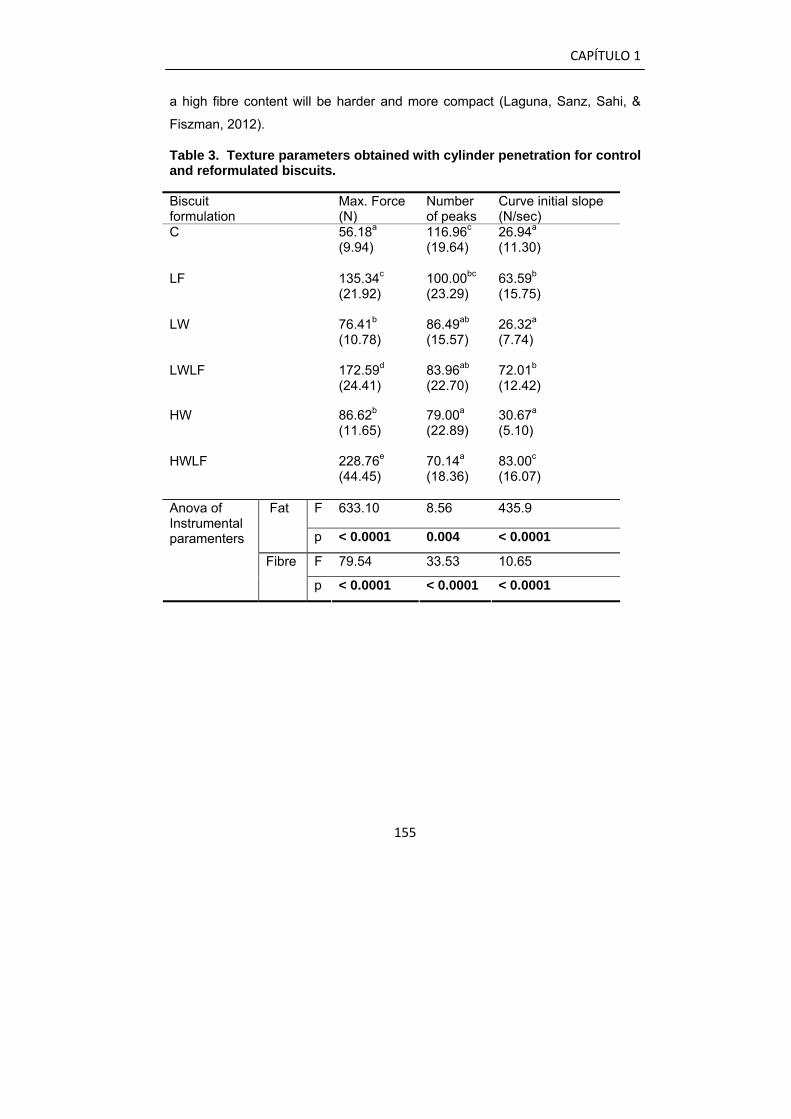
CAPÍTULO 1
155
a high fibre content will be harder and more compact (Laguna, Sanz, Sahi, &
Fiszman, 2012).
Table 3. Texture parameters obtained with cylinder penetration for control and reformulated biscuits.
Biscuit formulation
Max. Force (N)
Number of peaks
Curve initial slope (N/sec)
C 56.18a (9.94)
116.96c
(19.64) 26.94a (11.30)
LF 135.34c (21.92)
100.00bc (23.29)
63.59b (15.75)
LW 76.41b (10.78)
86.49ab (15.57)
26.32a
(7.74)
LWLF 172.59d
(24.41) 83.96ab (22.70)
72.01b (12.42)
HW 86.62b
(11.65) 79.00a (22.89)
30.67a (5.10)
HWLF 228.76e (44.45)
70.14a (18.36)
83.00c (16.07)
F 633.10 8.56 435.9 Fat
p < 0.0001 0.004 < 0.0001
F 79.54 33.53 10.65
Anova of Instrumental paramenters
Fibre
p < 0.0001 < 0.0001 < 0.0001
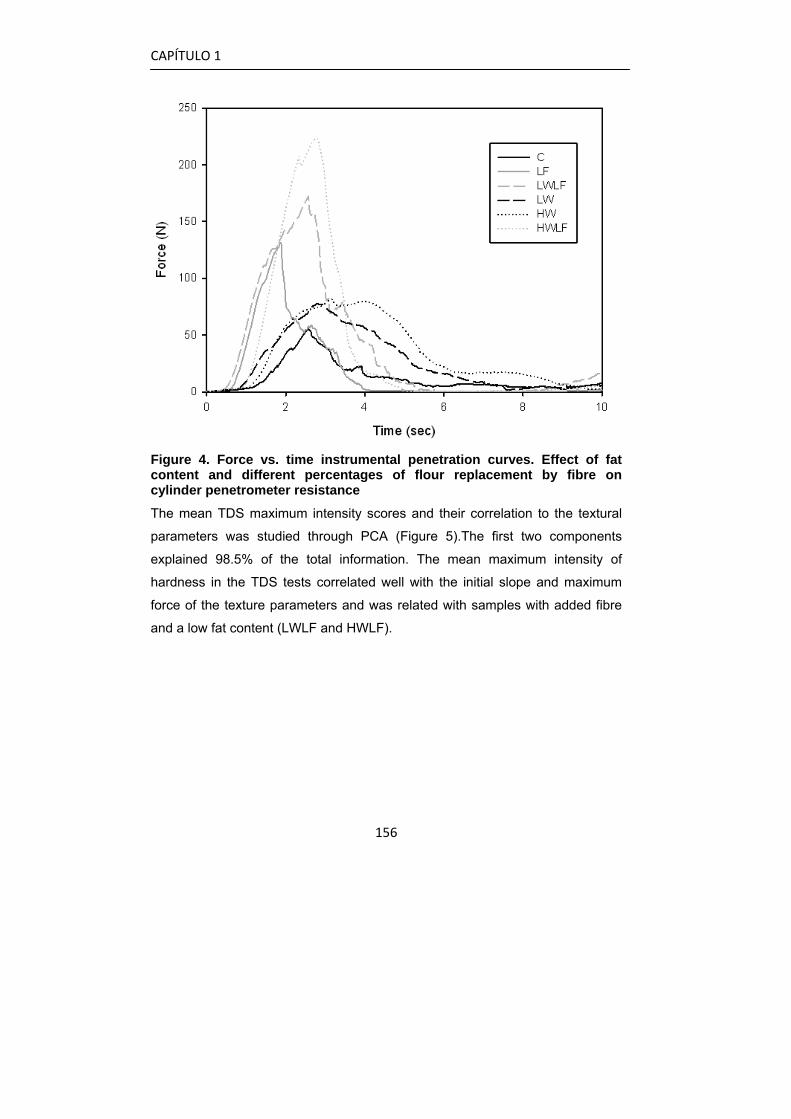
CAPÍTULO 1
156
Figure 4. Force vs. time instrumental penetration curves. Effect of fat content and different percentages of flour replacement by fibre on cylinder penetrometer resistance
The mean TDS maximum intensity scores and their correlation to the textural
parameters was studied through PCA (Figure 5).The first two components
explained 98.5% of the total information. The mean maximum intensity of
hardness in the TDS tests correlated well with the initial slope and maximum
force of the texture parameters and was related with samples with added fibre
and a low fat content (LWLF and HWLF).
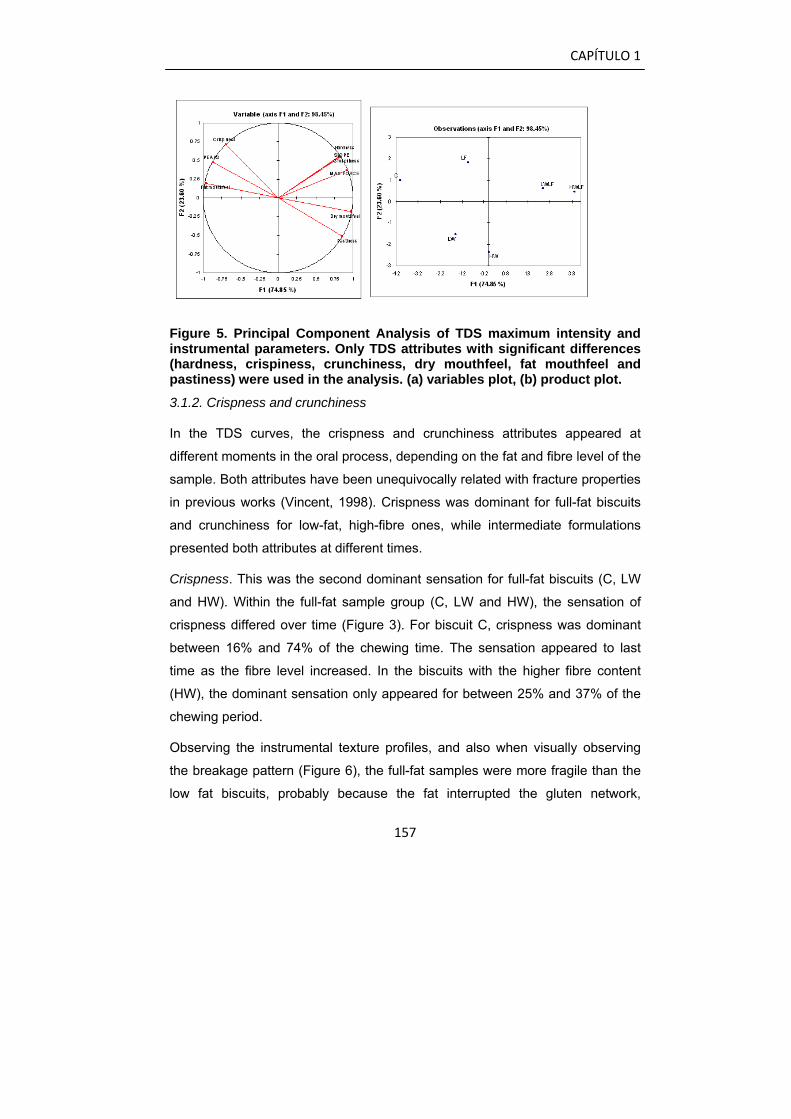
CAPÍTULO 1
157
Figure 5. Principal Component Analysis of TDS maximum intensity and instrumental parameters. Only TDS attributes with significant differences (hardness, crispiness, crunchiness, dry mouthfeel, fat mouthfeel and pastiness) were used in the analysis. (a) variables plot, (b) product plot.
3.1.2. Crispness and crunchiness
In the TDS curves, the crispness and crunchiness attributes appeared at
different moments in the oral process, depending on the fat and fibre level of the
sample. Both attributes have been unequivocally related with fracture properties
in previous works (Vincent, 1998). Crispness was dominant for full-fat biscuits
and crunchiness for low-fat, high-fibre ones, while intermediate formulations
presented both attributes at different times.
Crispness. This was the second dominant sensation for full-fat biscuits (C, LW
and HW). Within the full-fat sample group (C, LW and HW), the sensation of
crispness differed over time (Figure 3). For biscuit C, crispness was dominant
between 16% and 74% of the chewing time. The sensation appeared to last
time as the fibre level increased. In the biscuits with the higher fibre content
(HW), the dominant sensation only appeared for between 25% and 37% of the
chewing period.
Observing the instrumental texture profiles, and also when visually observing
the breakage pattern (Figure 6), the full-fat samples were more fragile than the
low fat biscuits, probably because the fat interrupted the gluten network,
CAPÍTULO 1
158
creating smaller pieces. This type of breakage pattern is usually perceived
sensorially as crispness and is typically accompanied by high-pitched sounds
(Vickers, 1984). As can be observed from the ANOVA values (Table 3), the
breaking slopes of these three samples (C, LW and HW) did not differ
significantly but the number of peaks decreased with fibre addition. In a full-fat
biscuit, therefore, fibre can be said to have more effect on the number of peaks
than on resistance at break (the initial slope of the curve).
Crunchiness. In samples with a low fat content and the addition of two levels of
fibre (LWLF and HWLF), crunchiness was the second dominant attribute
(Figure 3). Both biscuits had a more compact structure than the full-fat samples
and broke into larger pieces in the penetration tests (Figure 5). This kind of
breakage pattern is commonly associated with the sensory perception of
crunchiness and is usually accompanied by a low-pitched sound (Vickers,
1984).
As the instrumental texture analysis showed (table 3) that the initial slope was
higher (see also Figure 4) for the low fat biscuits (LF, LWLF, HWLF) than for the
full-fat samples (C, LW, HW). This slope pattern is associated with hardness or
rigidity. Also, the curve of the low fat biscuits fell rapidly after the first rupture,
signalling a clear cut, whereas the curve of the full-fat biscuits declined
gradually. Consequently, fat was the main factor that significantly influenced the
break (Table 3).
The biscuits LWLF and LF were the only samples in which both crunchy and
crisp attributes were perceived as dominant. The two attributes were
superimposed during part of the mastication period, indicating that some
panellists found crispness dominant and others crunchiness, or that the same
panellist may have selected both attributes, one after the other, during
mastication. Samples LWLF and LF were precisely the ones with a intermediate
texture profile: they formed small (crisp) and large (crunchy) crumbs, but could
also be understood as breaking more cleanly but later forming crisper crumbs.
CAPÍTULO 1
159
The samples without added fibre were related to crispness (C and LF) whilst the
samples with addded fibre (both levels, low and high) were related more to
crunchiness and to the instrumental parameter of maximum force (Figure 4).
In Table 4, the mean maximum intensity perceived showed that crispness
diminished with fibre addition and was more influenced by fibre, as the ANOVA
F statistic showed (F (fibre) on crispness= 55.865; F(fat) on crispness=0.272),
whereas crunchiness was more influenced by the fat content (F (fat) on
crunchiness= 193.15; F (fibre) on crunchiness=3.54).
3.1.3. Dry mouthfeel, pastiness and fat mouthfeel
These attributes were predominant during the next phase of mastication.
Dry mouthfeel and grittiness. As it can be observed in figure 3, these two
attributes were the predominant sensations during chewing. Saliva enters the
mouth and helps the jaw to form the bolus. The samples with a high fibre
content have a higher saliva demand because the fibre can absorb more water
than flour, so a dry mouthfeel was created. The samples without added fibre in
the formulation (C and LF) elicited a predominantly gritty sensation, more so
and for longer in sample C, but no dry mouthfeel was perceived. The rest of the
samples showed intermediate predominance (in some cases not significant) of
both attributes. In the samples with the lower level of fat (LWLFand HWLF) the
dry mouthfeel predominated for much longer, reaching the end of the chew in
both cases.
Dry mouthfeel intensity was scored higher by the panellists when the fat content
was reduced and fibre was added. For this reason, dry mouthfeel was situated
in the opposite quadrant (figure 5) to the C and LF samples in the PCA and
described samples LWLF and HWLF better than the other attributes.
Grittiness did not present significant differences in TDS intensity.
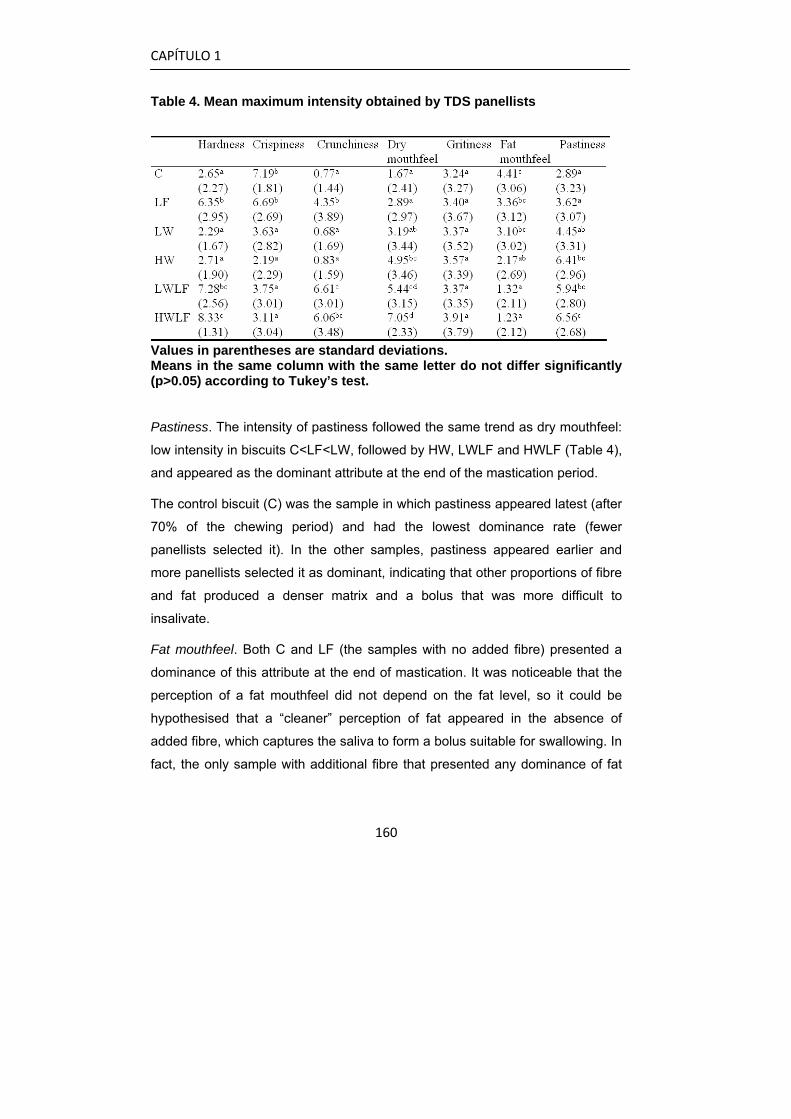
CAPÍTULO 1
160
Table 4. Mean maximum intensity obtained by TDS panellists
Values in parentheses are standard deviations. Means in the same column with the same letter do not differ significantly (p>0.05) according to Tukey’s test.
Pastiness. The intensity of pastiness followed the same trend as dry mouthfeel:
low intensity in biscuits C<LF<LW, followed by HW, LWLF and HWLF (Table 4),
and appeared as the dominant attribute at the end of the mastication period.
The control biscuit (C) was the sample in which pastiness appeared latest (after
70% of the chewing period) and had the lowest dominance rate (fewer
panellists selected it). In the other samples, pastiness appeared earlier and
more panellists selected it as dominant, indicating that other proportions of fibre
and fat produced a denser matrix and a bolus that was more difficult to
insalivate.
Fat mouthfeel. Both C and LF (the samples with no added fibre) presented a
dominance of this attribute at the end of mastication. It was noticeable that the
perception of a fat mouthfeel did not depend on the fat level, so it could be
hypothesised that a “cleaner” perception of fat appeared in the absence of
added fibre, which captures the saliva to form a bolus suitable for swallowing. In
fact, the only sample with additional fibre that presented any dominance of fat
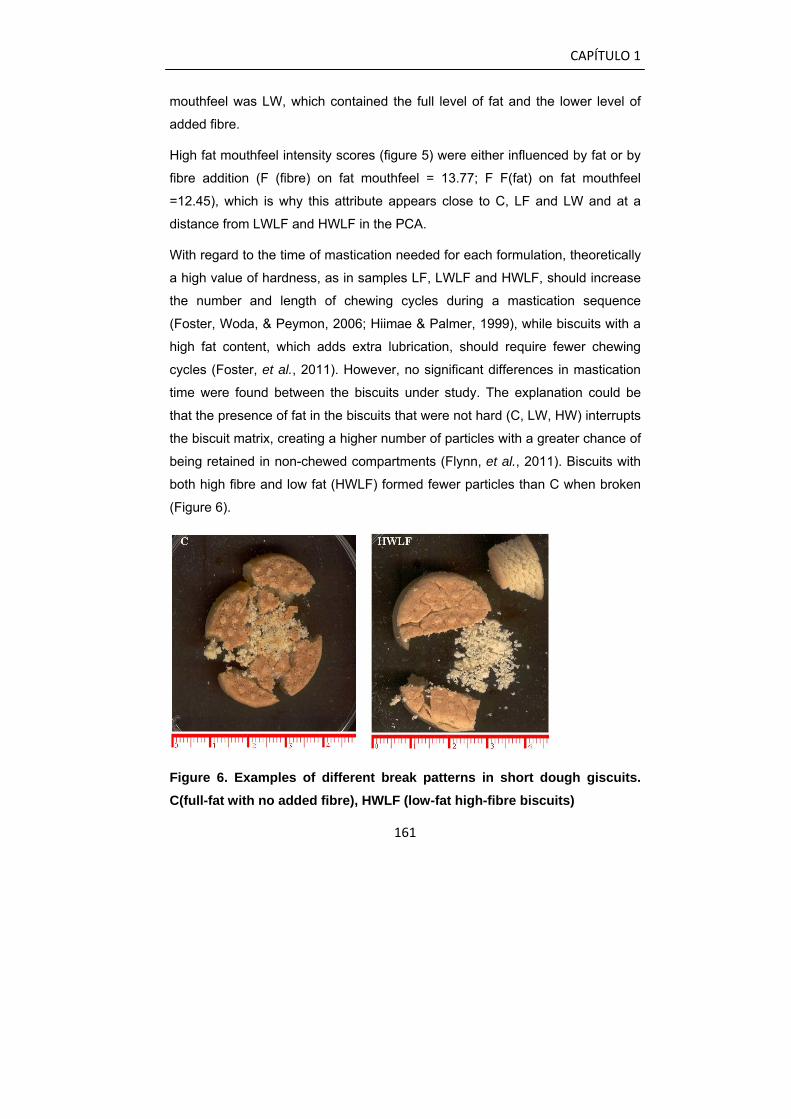
CAPÍTULO 1
161
mouthfeel was LW, which contained the full level of fat and the lower level of
added fibre.
High fat mouthfeel intensity scores (figure 5) were either influenced by fat or by
fibre addition (F (fibre) on fat mouthfeel = 13.77; F F(fat) on fat mouthfeel
=12.45), which is why this attribute appears close to C, LF and LW and at a
distance from LWLF and HWLF in the PCA.
With regard to the time of mastication needed for each formulation, theoretically
a high value of hardness, as in samples LF, LWLF and HWLF, should increase
the number and length of chewing cycles during a mastication sequence
(Foster, Woda, & Peymon, 2006; Hiimae & Palmer, 1999), while biscuits with a
high fat content, which adds extra lubrication, should require fewer chewing
cycles (Foster, et al., 2011). However, no significant differences in mastication
time were found between the biscuits under study. The explanation could be
that the presence of fat in the biscuits that were not hard (C, LW, HW) interrupts
the biscuit matrix, creating a higher number of particles with a greater chance of
being retained in non-chewed compartments (Flynn, et al., 2011). Biscuits with
both high fibre and low fat (HWLF) formed fewer particles than C when broken
(Figure 6).
Figure 6. Examples of different break patterns in short dough giscuits. C(full-fat with no added fibre), HWLF (low-fat high-fibre biscuits)
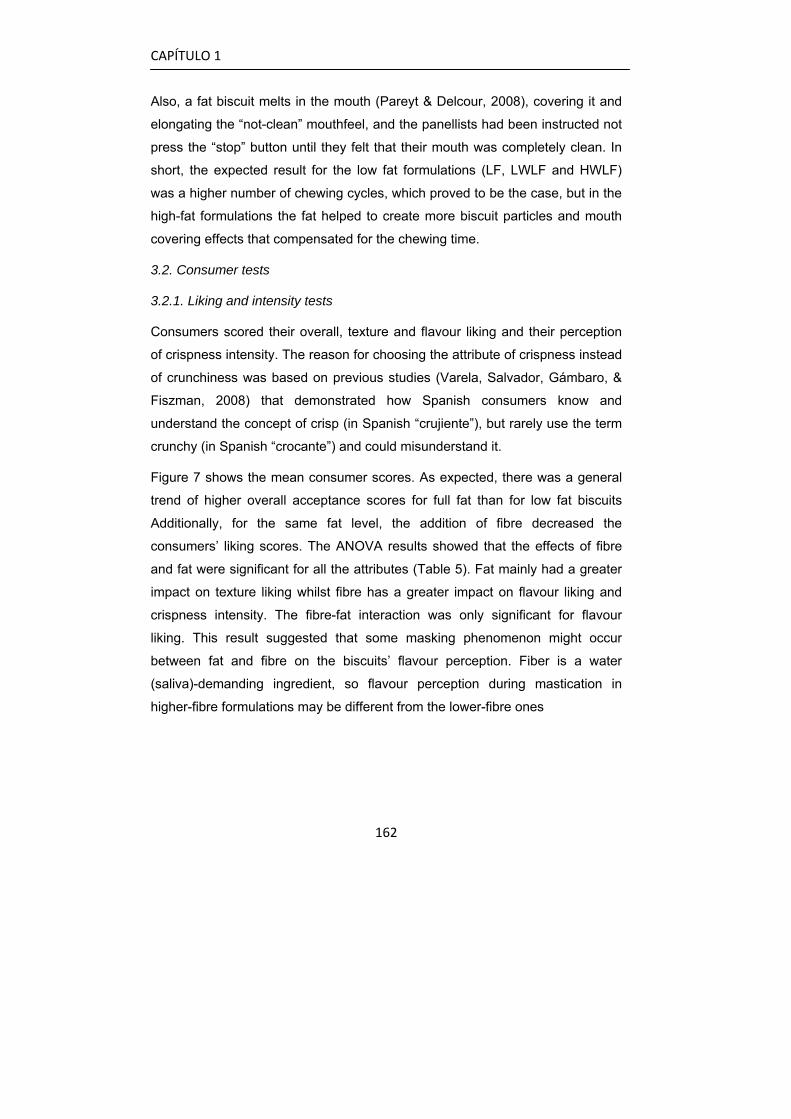
CAPÍTULO 1
162
Also, a fat biscuit melts in the mouth (Pareyt & Delcour, 2008), covering it and
elongating the “not-clean” mouthfeel, and the panellists had been instructed not
press the “stop” button until they felt that their mouth was completely clean. In
short, the expected result for the low fat formulations (LF, LWLF and HWLF)
was a higher number of chewing cycles, which proved to be the case, but in the
high-fat formulations the fat helped to create more biscuit particles and mouth
covering effects that compensated for the chewing time.
3.2. Consumer tests
3.2.1. Liking and intensity tests
Consumers scored their overall, texture and flavour liking and their perception
of crispness intensity. The reason for choosing the attribute of crispness instead
of crunchiness was based on previous studies (Varela, Salvador, Gámbaro, &
Fiszman, 2008) that demonstrated how Spanish consumers know and
understand the concept of crisp (in Spanish “crujiente”), but rarely use the term
crunchy (in Spanish “crocante”) and could misunderstand it.
Figure 7 shows the mean consumer scores. As expected, there was a general
trend of higher overall acceptance scores for full fat than for low fat biscuits
Additionally, for the same fat level, the addition of fibre decreased the
consumers’ liking scores. The ANOVA results showed that the effects of fibre
and fat were significant for all the attributes (Table 5). Fat mainly had a greater
impact on texture liking whilst fibre has a greater impact on flavour liking and
crispness intensity. The fibre-fat interaction was only significant for flavour
liking. This result suggested that some masking phenomenon might occur
between fat and fibre on the biscuits’ flavour perception. Fiber is a water
(saliva)-demanding ingredient, so flavour perception during mastication in
higher-fibre formulations may be different from the lower-fibre ones
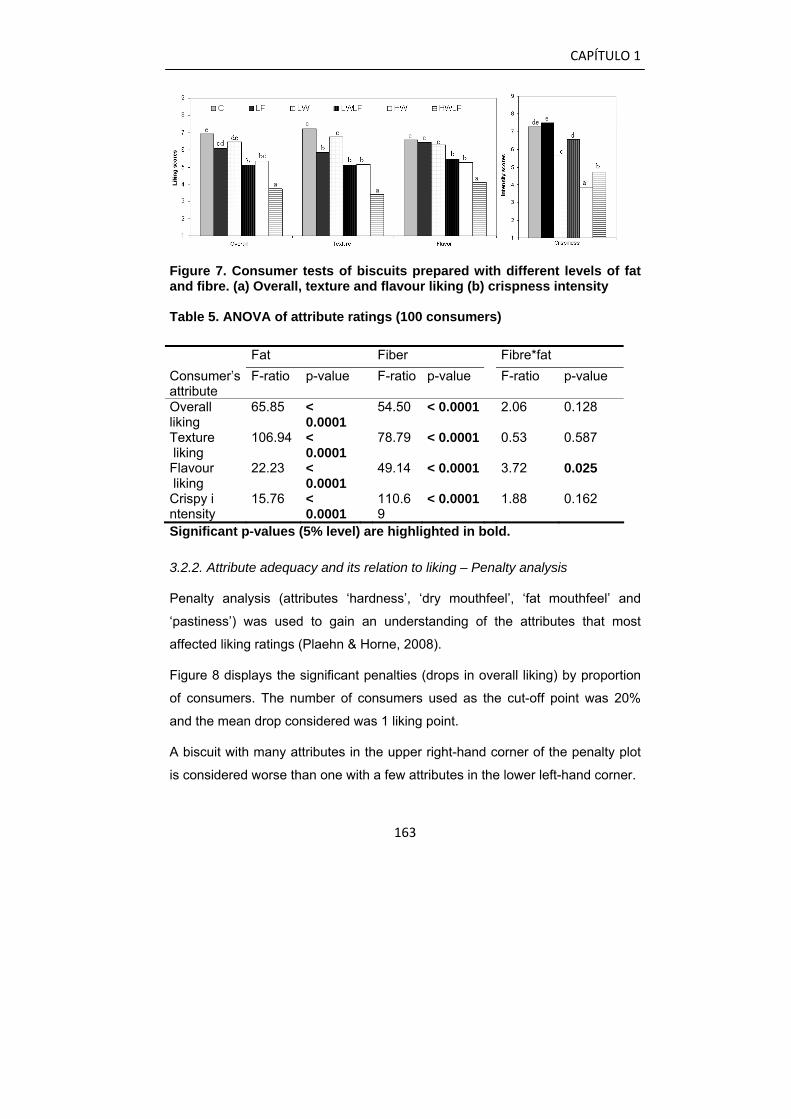
CAPÍTULO 1
163
Figure 7. Consumer tests of biscuits prepared with different levels of fat and fibre. (a) Overall, texture and flavour liking (b) crispness intensity Table 5. ANOVA of attribute ratings (100 consumers)
Fat Fiber Fibre*fat Consumer’s attribute
F-ratio p-value F-ratio p-value F-ratio p-value
Overall liking
65.85 < 0.0001
54.50 < 0.0001 2.06 0.128
Texture liking
106.94 < 0.0001
78.79 < 0.0001 0.53 0.587
Flavour liking
22.23 < 0.0001
49.14 < 0.0001 3.72 0.025
Crispy i ntensity
15.76 < 0.0001
110.69
< 0.0001 1.88 0.162
Significant p-values (5% level) are highlighted in bold.
3.2.2. Attribute adequacy and its relation to liking – Penalty analysis
Penalty analysis (attributes ‘hardness’, ‘dry mouthfeel’, ‘fat mouthfeel’ and
‘pastiness’) was used to gain an understanding of the attributes that most
affected liking ratings (Plaehn & Horne, 2008).
Figure 8 displays the significant penalties (drops in overall liking) by proportion
of consumers. The number of consumers used as the cut-off point was 20%
and the mean drop considered was 1 liking point.
A biscuit with many attributes in the upper right-hand corner of the penalty plot
is considered worse than one with a few attributes in the lower left-hand corner.
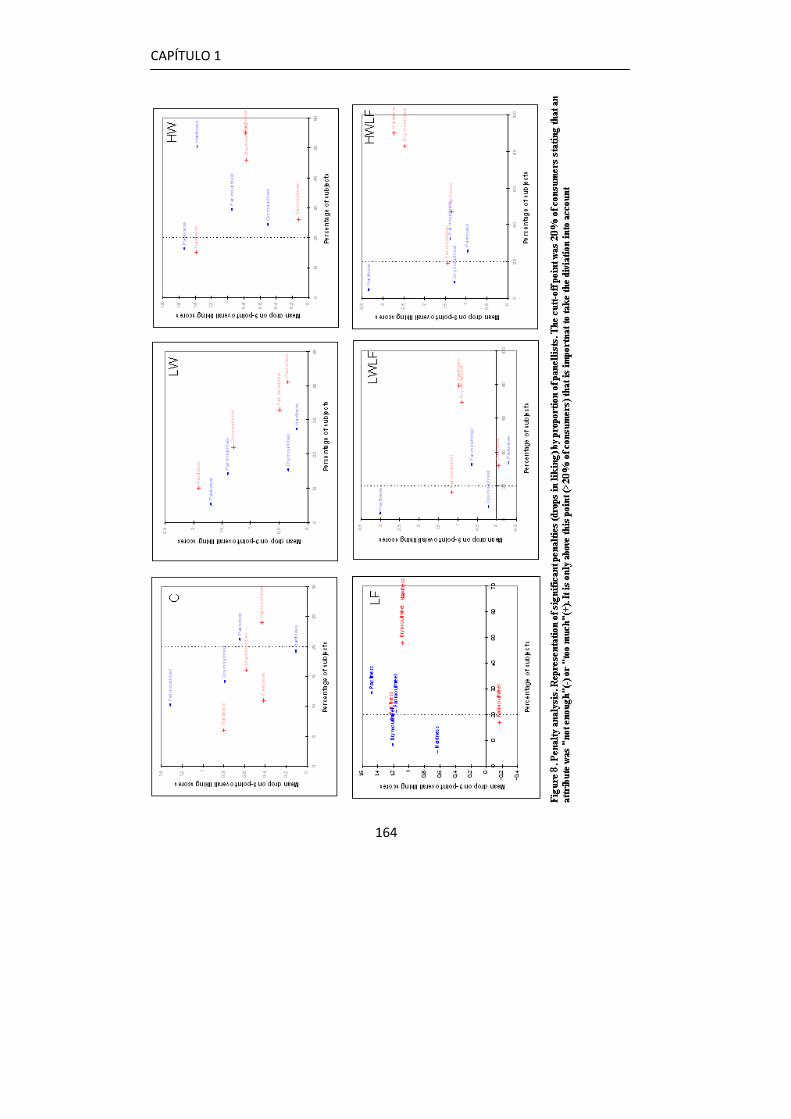
CAPÍTULO 1
164
CAPÍTULO 1
165
The “desired response” is attributes located in the lower left area of the penalty
plot, meaning that only a few consumers say the attribute level is not right and
the impact on overall liking is small. The C and LW biscuits were in this
favourable situation, with low percentages of consumers finding attributes that
deviated from their ideal and therefore with low penalties. The opposite position,
the upper right-hand corner, contains the attributes that a new reformulation
would aim tochange: those which are responsible for the largest drops in liking
and which high percentages of consumers rate as “not right”.
In general, the most penalising attributes that deviated from the ideal “right
point” were “too much” hardness and “too much” dry mouthfeel, found for all the
low-fat samples and especially for the high fibre and low fat sample (HWLF).
Over 80% of consumers thought that the attributes of HWLF were “not right”
and it was penalized with a drop in liking of more than 2.5 points. Another
attribute related to the low acceptability of this sample was pastiness, with
almost 50% of consumers finding it “too much” and a penalty of 1.5 points. Fat
mouthfeel was a penalising attribute for 30% of consumers, with an associated
drop in overall liking of around 1.5.
HWLF was the least-appreciated biscuit for texture, flavour and overall liking,
and the consumers considered it had quite low crispness. The consumers'
adequacy ratings were in good agreement with the findings of the TDS analysis,
where dry mouthfeel was dominant at the mid-mastication stage and pastiness
appeared as highly dominant at the end of the oral process before swallowing
(65-100%). Also, crispness and fat mouthfeel did not appear as significant
attributes of this sample at any point of the oral process, meaning that this
product lacks those typical sensations of this class of biscuits.
Interestingly, the HW biscuits were penalized with a drop of 1.4 points in their
liking; according to penalty analysis hardness was the only attribute that would
be responsible for this liking drop. However, they were harder than C via
instrumental analysis, and no difference in intensity of hardness was registered
by the TDS (trained panel); so there is probably another attribute (not
CAPÍTULO 1
166
measured) that may have driven the consumers' perception. In addition,
assessment of atribute intensity by consumers is subjected to some limitations
since they were not “calibrated” as trained panellists did. When looking at the
TDS profile, it is clear that HW was the least complex sample, with no
dominance of crispness or crunchiness and with pastiness driving most of the
in-mouth perception from the early mastication stage. Its instrumental texture
was also characterized by a low number of force peaks, signalling a lack of
fracture events related to crispness. The consumers probably perceived it as
not being hard enough because hardness is often linked to crispness in their
minds, and a sample that collapsed in the mouth immediately with no
perception of crispness, leading to a dryish paste, made them wish for a harder
and hopefully crisper biscuit.
This is the first study of dynamic method for biscuits and reveals that with the
use of TDS is easy to highlights differences in mouth processing among
samples. However, more study is needed in this area in order to correlate better
which time-attributes may be critical for the consumers’ acceptance. In
addition,further studies should cover other food matrices.
As limitations, in the present study it has been noticed that panellists
complained about the difficulty to keep in mind all the attributes simultaneously
during an evaluation, as also reported by other authors (Pineau et al. 2009).
The panellists found easy to click the dominant sensation of each attribute but
less easy to think in its intensity.
Additionally, each panellist had different paths of mastication (force, number of
bites, mouth size or time needed to swallow), so is important to standardize all
the experimental conditions as good as possible.
4. Conclusions
The present study proposes new tools for a better understanding of biscuit
eating quality. As food ingestion is a dynamic action, this paper has contributed

CAPÍTULO 1
167
a dynamic approach by obtaining TDS data and trying to link them to
consumers' liking scores.
The fat and fibre levels modulated the dominance of the sensations
experienced during the biscuit oral assessment; knowledge of the occurrence
and intensity of these characteristics would be a valuable tool to know biscuit
eating quality.
The adequacy of some sensory attributes assessed by consumers through JAR
scales and penalty analysis, together with the dynamic sensory profiles
measured by a trained panel, provided insights which could give clear pointers
for biscuit reformulation. Studies correlating perceived sensations and
consumer acceptance would be of high interest.
References
Ajila, C. M., Leelavathi, K., & Rao H. (2008). Improvement of dietary fibre
content and antioxidant properties in soft dough biscuits with the
incorporation of mango peel powder. Journal of Cereal Science, 48, 319-
326.
Albert, A., Salvador, A., Schlich, P., & Fiszman, S. M. (2012). Comparison
between temporal dominance of sensations (TDS) and key-attribute
sensory profiling for evaluating solid food with contrasting textural layers:
Fish sticks. Food Quality and Preference, 24, 111–118.
Brown, W. E., & Braxton, D. E. (2000). Dynamics of food breakdown during
eating in relation to perceptions of texture and preference: a study on
biscuits. Food Quality and Preference, 11, 259–267.
Chaplin, F. M. (2003). Fibre and water binding. Proceedings of the Nutrition
Society, 62, 223-227.
Duizer, L. M., Bloom, K., & Findlay, C. J. (1997). Dual-attribute time-intensity
sensory evaluation: a new method for temporal measurement of sensory
perceptions. Food Quality and Preference, 8, 261-269.
CAPÍTULO 1
168
Flynn, C. S., Foster K. D., Bronlund J. E., Lentle R. G., Jones J. R., &
Morgenstern M. P. (2011). Identification of multiple compartments present
during the mastication of solid food. Archive of Oral Biology, 56, 345-352.
Foster, K. D., Woda, A., & Peyon M. A. (2006). Effect of texture of plastic and
elastic model foods on the parameters of mastication. Journal of
Neurophysiology, 95, 3469-3479.
Foster, K. D., Grigor, J. M. V., Cheong, J. N., Yoo M. J. Y., Bronlund J. E., &
Morgenstern M. P. (2011). The role of oral processing in dynamic sensory
perception. Journal of Food Science, 76, R49-61.
Ghotra, B. S., Dyal, S. S., & Narine S. S. (2002). Lipid shortenings: a review.
Food Research International, 35, 1015-1048.
Handa, C., Goomer, S., & Siddhu, A. (2012). Physicochemical properties and
sensory evaluation of fructoligosaccharide enriched cookies. Journal of
Food Science and Technology, 49, 192-199.
Hiimae, K. M., & Palmer, J. B. (1999). Food transport and boluls formation
during complete feeding sequences on foods of different initial consistency.
Dysphagia, 14, 31-42.
Hutchings, J., & Lillford, P. (1988). The perception of food texture-the
philosophy of the breakdown path. Journal of Texture Studies 19, 103-115.
Jack, F. R., Piggot , J. R., & Paterson, A. (1994). Analysis of textural changes in
hard cheese during mastication by progressive profiling. Journal of Food
Science, 59, 539-543.
Labbe, D., Schlich, P., Pineau, N., Gilbert, F., & Martin, N. (2009). Temporal
dominance of sensations and sensory profiling: A comparative study. Food
Quality and Preference, 20, 216–221.
Laguna, L., Sanz, T., Sahi, S., & Fiszman, S. M. (2012). Role of fibre
morphology in some quality features of fibre-enriched biscuits. International
Journal of Food Properties, in press.
CAPÍTULO 1
169
Lawless, H. T., & Heymann, H. H. (1998). Sensory evaluation of food. New
York: Chapman & Hall.
Lenfant, F., Loret, C., Pineau, N., Hartmann C., & Martin N. (2009). Perception
of oral food breakdown. The concept of sensory trajectory. Appetite, 52,
659-667.
Lillford, P.J. (2011). The importance of food microstructure in fracture physics
and texture perception. Journal of Texture Studies, 42, 130-136.
Pareyt, B., & Delcour, J. A. (2008). The role of wheat flour constituents, sugar,
and fat in low moisture cereal based products: A review on sugar-snap
cookies. Critical Review of Food Science and Nutrition, 48, 824–839.
Pineau, N., Schlich, P., Cordelle, S., Mathonnière, C., Issanchou, S., & Imbert,
A. (2009). Temporal Dominance of sensations: Construction of the TDS
curves and comparison with time–intensity. Food Quality and Preference,
20, 450–455.
Plaehn, D., & Horne, J. (2008). A regression-based approach for testing
significance of “just-about-right” variable penalties. Food Quality and
Preference, 19, 21-32.
Rosner, B. (1995). Fundamentals of biostatistics (4th ed.). Belmont: Duxbury
Press.
Rothman, L. (2007). The use of just-about-right (JAR) scales in food product
development and reformulation. In H. Macfie (Ed.), Consumer-led food
product development, pp. 407-433, Woodhead Publishing in Food Science,
Technology and Nutrition.
Varela, P., Salvador, A., Gámbaro, A., & Fiszman, S. (2008). Texture concepts
for consumers: a better understanding of crispy-crunchy sensory
perception. European Food Research and Technology, 226, 1081-1090.
Vickers, Z. M. (1984). Crispiness and crunchiness- a difference in pitch?
Journal of Texture Studies, 15, 157-163

CAPÍTULO 1
170
Vincent, J. F. V. (1998). The quantification of crispness. Journal of the Science
of Food and Agriculture, 78, 162–168.

CAPÍTULO 2


BALANCING TEXTURE AND OTHER SENSORY FEATURES IN REDUCED
FAT SHORT DOUGH BISCUITS
Laura Laguna, Paula Varela, Ana Salvador, Teresa Sanz and Susana M.
Fiszman
JOURNAL OF TEXTURE STUDIES Volume: 43 Issue: 3 Pages: 235-245

CAPÍTULO 2
175
Abstract
Shortening in short dough biscuits was replaced by a new ingredient, N-
Dulge, (a mixture of tapioca dextrin and tapioca starch) at two different levels
(10%, 20%). The texture was balanced by replacing part of the flour with
resistant starch (RS) (20%, 40%).Nine different formulations were tested by a
trained panel and by consumers. The results were also correlated with textural
characteristics. The trained panel results showed that the fat replacer increased
the hardness and crumbliness and that these effects were balanced out by the
addition of resistant starch. These results correlated well with the instrumental
texture parameters. The consumers did not find significant differences in
acceptability between the control biscuits (no replacement) and the biscuits with
10% fat replaced by N-Dulge and 20% of flour replaced by resistant starch.
Keywords: biscuit, descriptive analysis, fat replacement, resistant starch.
CAPÍTULO 2
176
1. Introduction
Reducing fat in the everyday diet has become a public health issue and a
concern for most consumers (Zoulias et al. 2002a). In the USA and Europe, fat
consumption constitutes about 40% of the total daily calorie intake, whereas
health specialists recommend that it should not exceed 30% (Zoulias et al.
2002b). The reason for this recommendation is that high fat intake is associated
with various health disorders such as obesity, cancer, high blood cholesterol
and coronary heart disease (Akoh 1998). The WHO (2004) has suggested that
the food industry should reduce the fat content of processed foods to decrease
the high obesity rate in the first world.
Fat is an essential ingredient in short dough biscuits and is the largest
component after flour (Manohar et al. 1999). The major functions of fats in this
baked system are imparting shortening, richness, and tenderness and
improving flavour and mouthfeel (Pareyt et al. 2008). To reduce the fat content
and still obtain acceptable biscuits, fat replacers can be used. Fat replacers are
substances of carbohydrate or protein origin which can be used in some foods
to imitate the functional and sensory properties of fat with considerably fewer
calories. Carbohydrate-based fat replacers like processed starches imitate fat
by binding water and providing lubricity, body and a pleasant mouth sensation
in biscuits and similar baked products (Bath et al. 1992; Nonaka 1997).
Replacement of 50% of fat by soluble β-glucan and amylodextrins derived from
oat flour produced cookies that were not significantly different from full-fat ones.
At higher substitution levels, moistness and overall quality decreased (Inglett et
al. 1994). The tenderness of biscuits decreased with increased fat substitution
by replacers based on pectins (a blend of gums) or oats. Fat substitute use
produced a significant increase in moisture content. Variations in volume and
crumb firmness were associated with the type of fat substitute and level of fat
replaced (Conforti et al. 1996).
A blend of polydextrose, monoglycerides, diglycerides and acid esters is
another fat mimetic that has been tested in oatmeal biscuits (Campbell et al.
CAPÍTULO 2
177
1994). Up to 100% of the fat was replaced and a sensory panel rated five
attributes (first bite, first chew, chew down, chewed down mass and residual).
The panel found that the 100% blend affected the first chew and residual
characteristics of the biscuit but that lower substitution percentages did not have
a significant effect on any of the five sensory categories.
Zoulias et al. (2002a) studied the textural properties of biscuits using five types
of fat mimetics (Litesse, an improved maltodextrose; C*deLight, maltodextrin
with a low dextrose equivalent; Dairytrim, a rich oat β-glucan product; Raftiline,
an inulin product; and SimplesseDry, a blend of microparticulated whey
proteins). C*delight, Raftline and Simplesse gave low-fat cookies a more tender
texture, measured through instrumental analysis, but no sensory evaluation was
carried out in this study.
Sudha et al. (2007) reduced fat from 20% (control) to 10%, 8% and 6% in soft
dough biscuits, replacing it with polydextrose or maltodextrin. The biscuits’
hardness increased with the replacement and the sensory parameters of
texture, taste and flavour were affected. These results show that besides being
responsible for texture, fat also imparts flavour, taste, mouthfeel and lubricity to
the biscuits.
Reducing the fat content of biscuit recipes affects the overall product quality
less than a comparable reduction of sugar, allowing for equal or greater calorie
savings, as studied by Drewnowski et al. (1998) in a number of types of biscuit.
A new fat replacer, N-Dulge, was launched in 2009. N-Dulge is the commercial
name of a mixture of tapioca dextrin and starch intended for fat reduction in
sweet baked products like cookies. As its components have undergone physical
processing but no chemical processing, it meets clean-label requirements. The
label declaration is “dextrin starch”.
The addition of the new ingredient addition in a food product, requires a sensory
evaluation by a trained descriptive panel (Meilgaard et al. 1991). The evaluation
needs to include the appearance of any new sensory features (Baixauli et al.

CAPÍTULO 2
178
2008) and to correlate these effects with consumer perceptions. Consumer
research in the early stages of new product development makes it possible to
go further and deeper into understanding consumer needs, often well beyond
what could be understood without them (Van Kleef et al. 2005).
A number of consumer studies have been carried out on added-ingredient
biscuits. For instance, good results have been obtained with extruded orange
pulp (Larrea et al., 2005), resistant starch-rich lintnerized banana starch
(Aparicio-Sanquilán et al. 2007) and King palm (Vieira et al. 2008), but fewer
studies have used trained descriptive panels (Brown et al. 1998; Brown and
Braxton 2000; Martínez et al. 2002; Vázquez et al. 2009; and Burseg et al.
2009). The same applies to fat replacement studies. Zoulias et al. (2002b)
studied the replacement of fat using a trained sensory panel and found that the
hardness and brittleness estimated by the panel were in good agreement with
measurements derived from a texturometer. Moreover, a previous study
replacing flour with apricot kernel flour obtained similar properties to those of
the control biscuits with up to 40% fat replacement (Seker et al. 2010).
However, once the performance of a new ingredient has been described,
normally no effort is made to solve or compensate for the appearance of an
unbalanced sensory profile.
The two main objectives of the present study were 1) to assess the effect of
different levels of shortening replacement by a dextrin-rich ingredient on the
sensory profile of short dough biscuits and 2) to counterbalance any sensory
changes produced by the fat replacement and obtain similar sensory properties
to those of the full fat biscuits. They were addressed in two stages.
2. Materials and methods
2.1. Ingredients
The biscuit formulations employed in the two stages of this study (fat
replacement and counterbalancing sensory features) are shown in Table 1. The
CAPÍTULO 2
179
percentages of shortening replacement (10% and 20%) were selected after a
preliminary study which showed that 25% or more of shortening replacement
made the dough unmanageable.
The ingredients were: a) soft wheat flour suitable for biscuits (Belenguer,S.A.,
Valencia, Spain) (composition data provided by the supplier: 15% moisture,
11% protein, 0.6% ash; alveograph parameters P/L=0.27, where P=maximum
pressure required and L=extensibility; and W =134, where W=baking strength of
the dough), b) ND (N-Dulge FR, National Starch Food Innovation, Manchester,
UK, a mixture of tapioca dextrin and tapioca starch), c) RSRI, a source of
resistant starch (Hi-maize 260, National Starch Food Innovation, Manchester,
UK, composition data provided by the supplier 10% moisture, 58% dietary
fibre), d) shortening (78% fat, St. Auvent, Vandemoortele France), e) sugar
(Azucarera Ebro, Madrid, Spain), f) milk powder (Central Lechera Asturiana,
Peñasanta, Spain), g) salt, h) sodium bicarbonate (A. Martínez, Cheste, Spain),
i) ammonium hydrogen carbonate (Panreac Quimica, Barcelona, Spain) and j)
tap water.
Fat replacement with a dextrin-rich ingredient: two formulations were prepared
using the same quantity of all the ingredients except for 10% and 20% of the
shortening, which was replaced with ND (samples 10ND and 20ND, Table 1).
Counterbalancing atypical sensory features: High levels of fat in biscuits
produce a very soft texture (Pareyt et al. 2008) and low fat levels make the
texture harder. In order to decrease this atypical effect, a resistant starch rich
ingredient was added, as a previous study (Laguna et al. 2010) showed that
biscuits with flour replacement by resistant starch exhibit a softer, crumblier
texture. As shown in Table 1, four formulations were prepared with 10% and
20% of the shortening replaced by ND and 20% and 40% of the flour by a
resistant starch rich ingredient (RSRI) (samples 10ND-20RSRI, 10ND-40RSRI,
20ND-20RSRI and 20ND-40RSRI). The control with no substitutions and two
additional formulations with only the two levels of flour replacement by RSRI
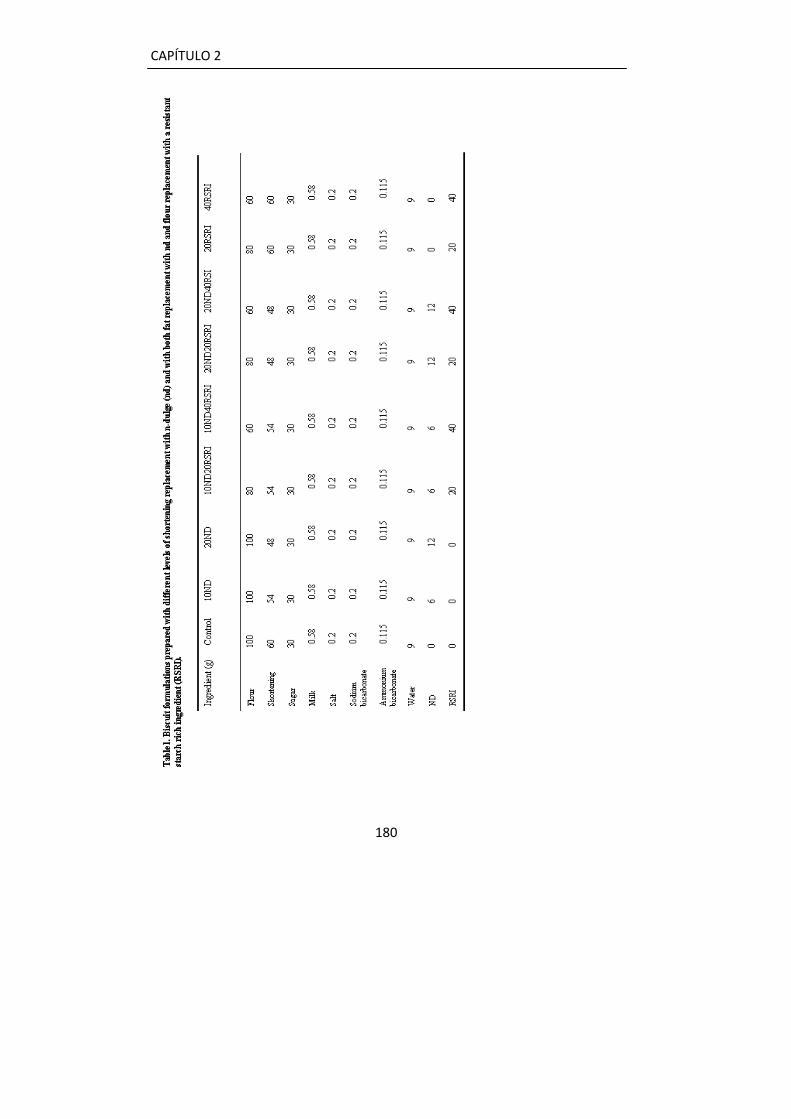
CAPÍTULO 2
180

CAPÍTULO 2
181
(20% and 40%: samples 20RSRI and 40RSRI respectively) were also prepared
for comparison purposes.
2.2. Biscuit preparation
The sugar, milk powder (previously dissolved in all of the water), leavening
agents and shortening were mixed in a mixer (Kenwood Major Classic, UK) for
30 seconds at low speed (#1). The dough was scraped from the sides of the
bowl and mixed for 3 minutes at a higher speed (#3). The flour or the flour/ND,
flour/RSRI or flour/ND/RSRI mixture was then added and mixed for 1 minute at
speed #1.
The dough was sheeted with an 8 mm high rolling pin and allowed to rest for 30
minutes at 4ºC before cutting it into rectangular pieces measuring 50 x 30 x
8mm (length x width x height). Twenty-five pieces were placed on a perforated
tray. The biscuits were baked in a conventional oven for 4 min at 175 ºC then
the trays were turned 180º and baked for a further 4.5 min at the same
temperature. Turning the trays brought the side that had been at the back to the
front of the oven to ensure homogenous cooking. The oven and the oven trays
were always the same, the trays were placed at the same level in the oven and
the number of biscuits baked was always the same. After reaching ambient
temperature, the biscuits were packed and stored in heat-sealed metalized
polypropylene bags. The biscuit samples were evaluated on the following day in
all cases.
2.3. Sensory Analysis
Testing was carried out in a sensory laboratory equipped with individual booths
(ISO 8589, 1988). Data acquisition was performed using Compusense five
release 5.0 software (Compusense Inc., Guelph, Ont., 158 Canada).
2.3.1 Descriptive analysis
Selection of terms - A panel of eight assessors, aged between 25 and 36 years
and skilled in quantitative descriptive analysis, was trained to select the
descriptors using the checklist method (Lawless et al., 1998).
CAPÍTULO 2
182
Terms were selected and discussed in an open session with the panel leader.
The assessors were first given a brief outline of the procedures and a list of
attributes and representative samples. They were then asked to choose and
write down the most appropriate attributes to describe all the sensory properties
of the biscuits or to suggest new ones. The panel leader collected and wrote all
the attributes on a board and the panel discussed the appropriateness of the
selected attributes, their definitions and preliminary discussions on how to
assess the products. At the end of this session a consensus on the list of
attributes was reached (Table 2). This procedure was proposed by Stone and
Sidel (2004) in order to obtain a complete description of a product’s sensory
properties.
Panel training.-The panellists attended twelve 1-hour training sessions. Training
involved two stages. During the first stage, different samples were tasted by the
panellists to attain a better understanding and final agreement of how to
measure all the descriptors and different tastings were conducted until the panel
was homogeneous in its assessments. At these sessions, external references
were provided as an aid to identifying some attributes.
For example, for floury odor a Petri dish with flour was available and for buttery
odor a mixture made of shortening and milled biscuit was provided. In this way,
the panellists understood the extremes of the scales.
During the second stage, the panellists used 10 cm unstructured scales to
score the selected attributes of the biscuits. Assessors were instructed to score
the odors first, followed by color, shape regularity, hardness (hand), and
brittleness (hand). They then had to take a bite from the edge of the biscuit in
order to score the flavour, crunchiness and pasty mouthfeel. Panel performance
and consensus were evaluated by principal component analysis, using the
Pearson correlation matrix (Cliff and King.1999).
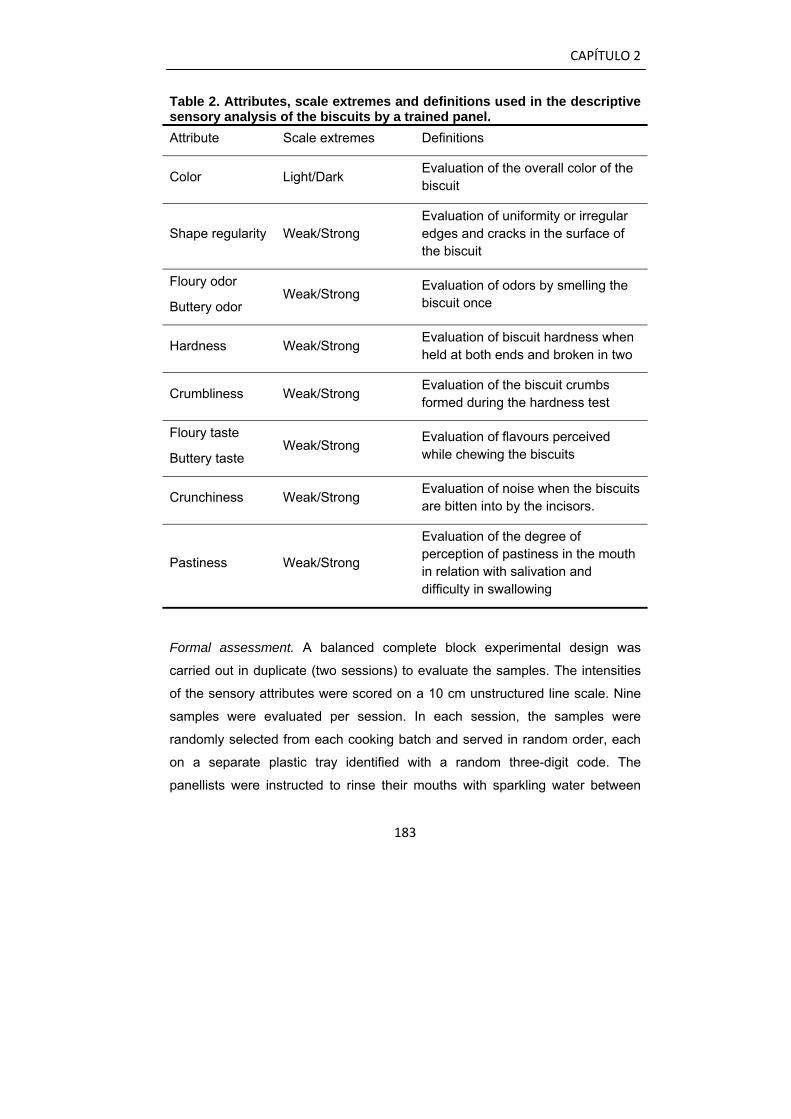
CAPÍTULO 2
183
Table 2. Attributes, scale extremes and definitions used in the descriptive sensory analysis of the biscuits by a trained panel. Attribute Scale extremes Definitions
Color Light/Dark Evaluation of the overall color of the biscuit
Shape regularity Weak/Strong Evaluation of uniformity or irregular edges and cracks in the surface of the biscuit
Floury odor
Buttery odor Weak/Strong Evaluation of odors by smelling the
biscuit once
Hardness Weak/Strong Evaluation of biscuit hardness when held at both ends and broken in two
Crumbliness Weak/Strong Evaluation of the biscuit crumbs formed during the hardness test
Floury taste
Buttery taste Weak/Strong Evaluation of flavours perceived
while chewing the biscuits
Crunchiness Weak/Strong Evaluation of noise when the biscuits are bitten into by the incisors.
Pastiness Weak/Strong
Evaluation of the degree of perception of pastiness in the mouth in relation with salivation and difficulty in swallowing
Formal assessment. A balanced complete block experimental design was
carried out in duplicate (two sessions) to evaluate the samples. The intensities
of the sensory attributes were scored on a 10 cm unstructured line scale. Nine
samples were evaluated per session. In each session, the samples were
randomly selected from each cooking batch and served in random order, each
on a separate plastic tray identified with a random three-digit code. The
panellists were instructed to rinse their mouths with sparkling water between

CAPÍTULO 2
184
sample evaluations, as sparkling water was found to remove shortening from
the mouth between samples more efficiently than still water.
2.3.2. Consumer test
A total of 100 frequent short dough biscuits’ consumers (untrained) aged from
18 to 65 years took part in the study. To avoid fatigue, the consumers evaluated
7 samples over three sessions (three biscuits at each session). The biscuits
were coded with random three-digit numbers following a balanced complete
block experimental design. Consumer acceptance testing was carried out using
a nine point hedonic scale (9 = like extremely; and 1 = dislike extremely). The
consumers scored their liking for the ‘appearance’, ‘hardness’, ‘color’,
‘sweetness’, ‘taste’, and ‘overall acceptance’ of each sample.
2.4. Biscuit texture analysis
The texture of the biscuits was measured using a TA.TX.plus Texture Analyzer
(Stable Micro Systems, Godalming, UK). A test speed of 1mm/s was used for all
the tests. Ten biscuits from each formulation were measured.
Breaking strength. The biscuits were fractured using the three point bending rig
probe (A/3PB). The experimental conditions were as follows: distance between
supports: 40 mm, probe travel distance: 20 mm, trigger force: 20g. The force at
break (N) was taken as the breaking strength.
Bite test. Penetration tests were conducted with the upper Volodkevich Bite Jaw
(VB), penetrating the sample (whole biscuit) to a distance of 5mm, again with a
trigger force of 20g. Two 'bites' were made in each biscuit (one third from each
end), so a total of 20 values was registered for each formulation. The
parameters measured were the area under the curve (N.seg), taken as the
resistance to penetration, and the number of peaks, taken as an index of
crunchiness.
CAPÍTULO 2
185
2.5. Color
Measurement of the upper surface color of the biscuits was carried out with a
Konica Minolta CM-35000d spectrophotocolorimeter. Four replicates of each
formulation were measured. The results were expressed in accordance with the
CIELAB system with reference to illuminant D65 and a visual angle of 10º. The
parameters determined were L* (L* = 0 [black], L* = 100 [white]), a* (–a* =
greenness, +a* = redness), b* (–b* = blueness, +b* = yellowness).
The total color difference (ΔE*) between the control biscuit and the different ND,
ND/RSRI biscuit was calculated as follows:
ΔE* = [(L*c – L*s)2 + (a*c – a*s)2 + (b*c – b*s) 2]½
where subscript c = control and subscript s = samples containing the ND or
ND/RSRI.
The value used to determine whether the total color difference was visually
obvious was (Francis & Clydesdale, 1975):
ΔE*> 3: color differences are obvious to the human eye.
2.6. Statistical analysis
Two-way ANOVA was applied to each descriptor to check panel performance,
considering the assessors, the samples and their interaction as factors.
Analysis of variance (one way-ANOVA) was applied to the consumer test in
order to study the effect of formulation; least significant differences were
calculated by Tukey’s test and the significance at p<0.05 was determined.
Pearson correlation was calculated for the instrumental analysis, descriptive
analysis and consumer test data.
All the statistical analyses were performed with XLSTAT 2009.4.03 statistical
software (Microsoft).
3. Results and discussion
3.1. Sensory Analysis
CAPÍTULO 2
186
3.1.1. Quantitative descriptive analysis
Step 1, N-Dulge substitution
Compared with the control sample, replacing 10% or 20% of the shortening with
ND (samples 10ND and 20ND, respectively) affected the textural attributes
most. A significant increase (p<0.05) in hardness and crunchiness scores and a
significant decrease (p<0.05) in crumbliness were found (Fig. 1a). These results
were in accordance with previous works which have reported that a reduction in
fat levels leads to harder biscuits (Lai and Lin, 2006). Brown et al. (2000),
studying rich tea biscuits, stated that a biscuit must be somewhat hard in order
to be perceived as crunchy, but soft enough to obtain the expected crumbly
texture. These authors also found an inverse relation between hardness and
crumbliness, while crunchiness appeared as an independent characteristic
related to hardness and crumbliness.
Pastiness was not significantly affected by replacing shortening with ND. The
perception of pastiness arises when the crumbs generated by fragmentation of
the biscuits begin to absorb saliva and form a paste which is difficult to handle
in the mouth. The pastiness values of N-Dulge biscuits were low and did not
present significant differences compared with the control samples (p<0.05).
The texture of biscuits can be interpreted in terms of the state of their main
ingredients. The process of baking short dough leads to a cellular solid matrix
with a porous inner structure. Kulp et al. (1991) determined that due to the
limited water content, the starch granules remained in practically their native
condition during biscuit baking rather than forming a continuous structure, thus
providing a crispy/crunchy texture. When fat is mixed with the flour before
hydration it prevents the gluten from forming a network. A gluten network is
undesirable in biscuit dough as it leads to toughness (Sudha et al. 2007).
According to Baltsavias et al. (1999), fat can form a more continuous phase
when the system is rich in fat, or can be dispersed when present at lower levels.
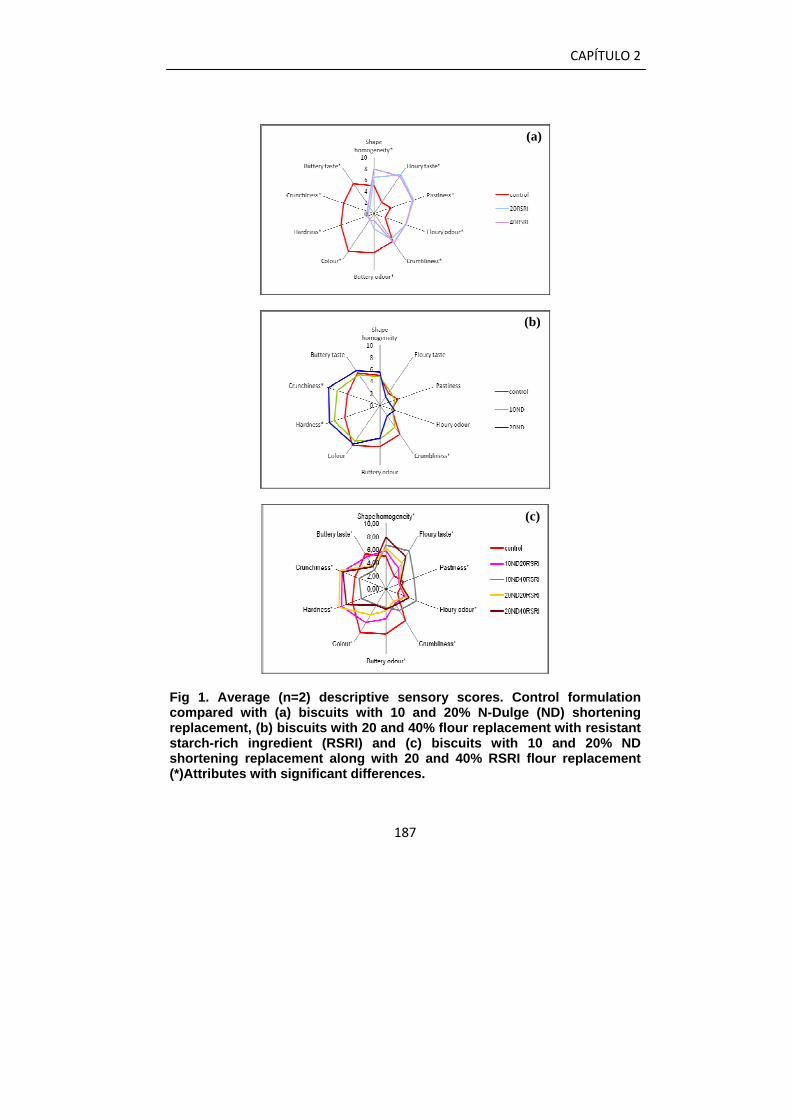
CAPÍTULO 2
187
Fig 1. Average (n=2) descriptive sensory scores. Control formulation compared with (a) biscuits with 10 and 20% N-Dulge (ND) shortening replacement, (b) biscuits with 20 and 40% flour replacement with resistant starch-rich ingredient (RSRI) and (c) biscuits with 10 and 20% ND shortening replacement along with 20 and 40% RSRI flour replacement (*)Attributes with significant differences.
(a)
(b)
(c)
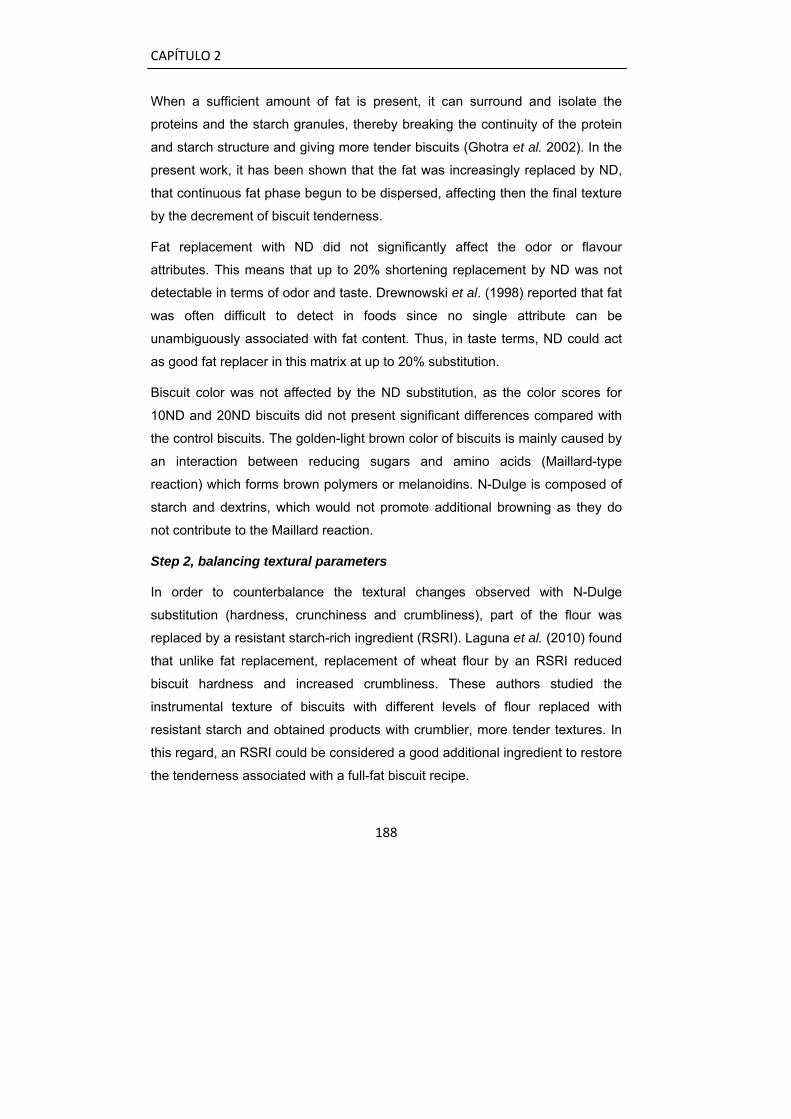
CAPÍTULO 2
188
When a sufficient amount of fat is present, it can surround and isolate the
proteins and the starch granules, thereby breaking the continuity of the protein
and starch structure and giving more tender biscuits (Ghotra et al. 2002). In the
present work, it has been shown that the fat was increasingly replaced by ND,
that continuous fat phase begun to be dispersed, affecting then the final texture
by the decrement of biscuit tenderness.
Fat replacement with ND did not significantly affect the odor or flavour
attributes. This means that up to 20% shortening replacement by ND was not
detectable in terms of odor and taste. Drewnowski et al. (1998) reported that fat
was often difficult to detect in foods since no single attribute can be
unambiguously associated with fat content. Thus, in taste terms, ND could act
as good fat replacer in this matrix at up to 20% substitution.
Biscuit color was not affected by the ND substitution, as the color scores for
10ND and 20ND biscuits did not present significant differences compared with
the control biscuits. The golden-light brown color of biscuits is mainly caused by
an interaction between reducing sugars and amino acids (Maillard-type
reaction) which forms brown polymers or melanoidins. N-Dulge is composed of
starch and dextrins, which would not promote additional browning as they do
not contribute to the Maillard reaction.
Step 2, balancing textural parameters
In order to counterbalance the textural changes observed with N-Dulge
substitution (hardness, crunchiness and crumbliness), part of the flour was
replaced by a resistant starch-rich ingredient (RSRI). Laguna et al. (2010) found
that unlike fat replacement, replacement of wheat flour by an RSRI reduced
biscuit hardness and increased crumbliness. These authors studied the
instrumental texture of biscuits with different levels of flour replaced with
resistant starch and obtained products with crumblier, more tender textures. In
this regard, an RSRI could be considered a good additional ingredient to restore
the tenderness associated with a full-fat biscuit recipe.
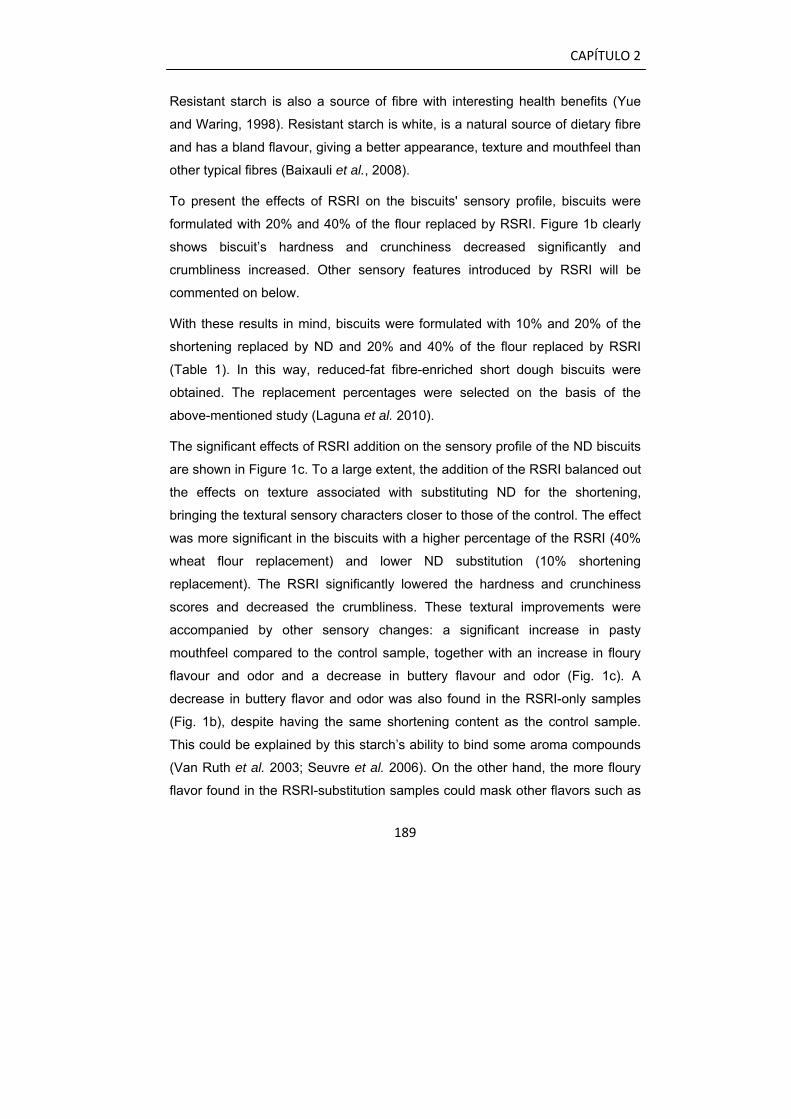
CAPÍTULO 2
189
Resistant starch is also a source of fibre with interesting health benefits (Yue
and Waring, 1998). Resistant starch is white, is a natural source of dietary fibre
and has a bland flavour, giving a better appearance, texture and mouthfeel than
other typical fibres (Baixauli et al., 2008).
To present the effects of RSRI on the biscuits' sensory profile, biscuits were
formulated with 20% and 40% of the flour replaced by RSRI. Figure 1b clearly
shows biscuit’s hardness and crunchiness decreased significantly and
crumbliness increased. Other sensory features introduced by RSRI will be
commented on below.
With these results in mind, biscuits were formulated with 10% and 20% of the
shortening replaced by ND and 20% and 40% of the flour replaced by RSRI
(Table 1). In this way, reduced-fat fibre-enriched short dough biscuits were
obtained. The replacement percentages were selected on the basis of the
above-mentioned study (Laguna et al. 2010).
The significant effects of RSRI addition on the sensory profile of the ND biscuits
are shown in Figure 1c. To a large extent, the addition of the RSRI balanced out
the effects on texture associated with substituting ND for the shortening,
bringing the textural sensory characters closer to those of the control. The effect
was more significant in the biscuits with a higher percentage of the RSRI (40%
wheat flour replacement) and lower ND substitution (10% shortening
replacement). The RSRI significantly lowered the hardness and crunchiness
scores and decreased the crumbliness. These textural improvements were
accompanied by other sensory changes: a significant increase in pasty
mouthfeel compared to the control sample, together with an increase in floury
flavour and odor and a decrease in buttery flavour and odor (Fig. 1c). A
decrease in buttery flavor and odor was also found in the RSRI-only samples
(Fig. 1b), despite having the same shortening content as the control sample.
This could be explained by this starch’s ability to bind some aroma compounds
(Van Ruth et al. 2003; Seuvre et al. 2006). On the other hand, the more floury
flavor found in the RSRI-substitution samples could mask other flavors such as
CAPÍTULO 2
190
the buttery one. In the ND-only substitution biscuits, even at the lowest final
shortening content (20ND), the perception of buttery flavor was not significantly
different from that of the control biscuit, meaning that the flavor was still
perceptible at the same levels.Thus, it could be concluded that the changes in
flavor perception were due to the RSRI.
The ND/RSRI-substitution biscuits had significantly lighter color (Fig. 1c),
lacking brown color when compared with the control. RSRI is whiter than wheat
flour,which could have helped make the dough lighter from the start. In addition,
the total amount of proteins available for Maillard rowning is lower in RSRI than
in the same amount of flour, o less browning during baking is to be expected
(Laguna et al. 2011). Also, ND/RSRI-substitution biscuits had a significantly
more regular shape; the addition of RSRI could reduce the elasticity and
deformability of the dough; also, the gluten content is lower when less wheat
flour is present, which would explain why the shape of these biscuits was
significantly more regular than in the control sample.
3.1.2. Consumer test
The mean scores for liking of appearance, color, texture, taste, sweetness and
overall liking are shown in Figure 2.
For the seven formulations evaluated, all the mean scores were between 3.5
and 6.8. The control biscuit obtained the maximum scores for appearance and
liking of color. However, sample 10ND20RSRI scored highest for overall liking,
texture and liking of sweetness (although not significantly different from the
control scores), meaning that this reformulated biscuit with less fat and
therefore fewer calories (fat provides 9 kcal/g and carbohydrates only 4 kcal/g)
was the most acceptable.
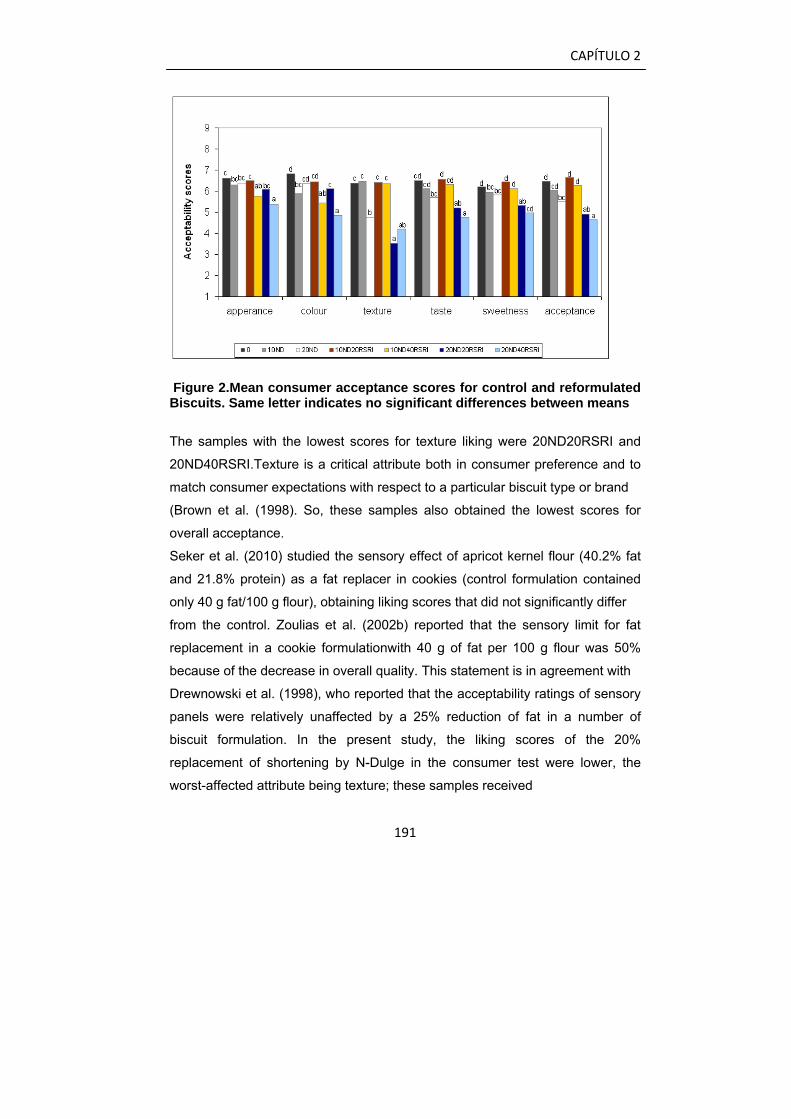
CAPÍTULO 2
191
Figure 2.Mean consumer acceptance scores for control and reformulated Biscuits. Same letter indicates no significant differences between means
The samples with the lowest scores for texture liking were 20ND20RSRI and
20ND40RSRI.Texture is a critical attribute both in consumer preference and to
match consumer expectations with respect to a particular biscuit type or brand
(Brown et al. (1998). So, these samples also obtained the lowest scores for
overall acceptance.
Seker et al. (2010) studied the sensory effect of apricot kernel flour (40.2% fat
and 21.8% protein) as a fat replacer in cookies (control formulation contained
only 40 g fat/100 g flour), obtaining liking scores that did not significantly differ
from the control. Zoulias et al. (2002b) reported that the sensory limit for fat
replacement in a cookie formulationwith 40 g of fat per 100 g flour was 50%
because of the decrease in overall quality. This statement is in agreement with
Drewnowski et al. (1998), who reported that the acceptability ratings of sensory
panels were relatively unaffected by a 25% reduction of fat in a number of
biscuit formulation. In the present study, the liking scores of the 20%
replacement of shortening by N-Dulge in the consumer test were lower, the
worst-affected attribute being texture; these samples received
CAPÍTULO 2
192
the highest hardness scores for the trained panel (see the Quantitative
Descriptive Analysis section). Zoulias et al. (2002a) also noted that a high
hardness value is an unpleasant characteristic for this category of product.
The biscuits with the highest replacement of fat (20%) by NDand highest
replacement of flour (40%) by RSRI obtained the lowest scores. Laguna et al.
(2011) reported that biscuits with 60% of flour replacement by RSRIwere too
soft andwere rated lower than the control biscuit by the consumers. Brown and
Braxton (2000) obtained a similar response for soft biscuits; their preference
mapping showed a consistent dislike of the samples of rich tea-type biscuits
that had been softened by leaving the biscuits in a moist atmosphere for 1 h
prior to testing.
3.2. Biscuit texture analysis
The instrumental texture analysis results for the biscuits are shown in Table 3.
The biscuit with 20% shortening replacement by ND showed the highest
breaking strength and bite test penetration resistance values. Zoulias et al.
(2002a,b) also found that the hardness of low-fat biscuits increased with the use
of fat mimetics (polydextrose, maltodextrine with low dextrose, oat product rich
in β-glucans, oligofructose and a blend of microparticulated whey proteins and
emulsifiers). Similarly, Seker et al. (2010) studied fat replacement by apricot
kernel flour in a wire-cut cookie and found that the force necessary to break the
biscuit increased with fat replacement.
The increase in hardness due to fat replacement is associated with gluten
development. Ghotra et al. (2002) noted that in the absence of shortening, the
water interacts with the flour protein to create more cohesive and extensible
gluten, while if the fat level is high, the fat surrounds the proteins, shortening
their development. Pareyt et al. (2008) reported that in this type of biscuit little if
any gluten is formed, giving a very soft texture. In the present study, the higher
the fat level the softer the biscuits (lower bite test area and breaking strength
values).
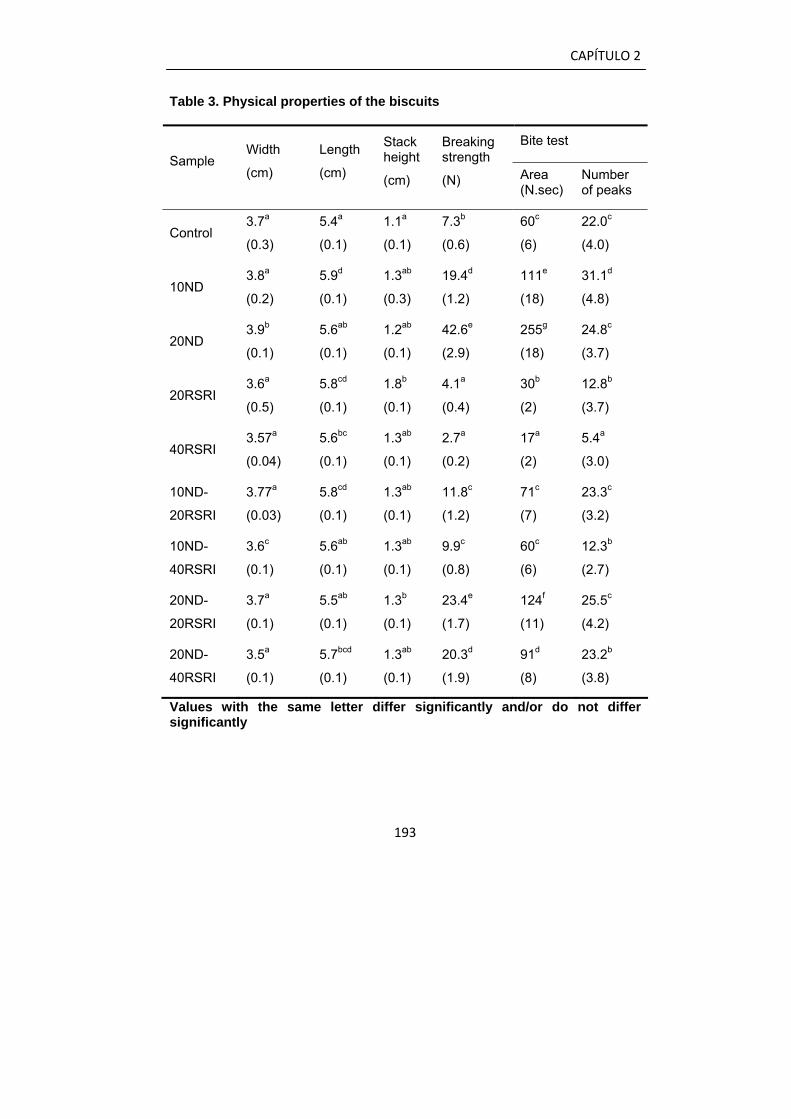
CAPÍTULO 2
193
Table 3. Physical properties of the biscuits
Bite test Sample
Width
(cm)
Length
(cm)
Stack height
(cm)
Breaking strength
(N) Area (N.sec)
Number of peaks
Control 3.7a
(0.3)
5.4a
(0.1)
1.1a
(0.1)
7.3b
(0.6)
60c
(6)
22.0c
(4.0)
10ND 3.8a
(0.2)
5.9d
(0.1)
1.3ab
(0.3)
19.4d
(1.2)
111e
(18)
31.1d
(4.8)
20ND 3.9b
(0.1)
5.6ab
(0.1)
1.2ab
(0.1)
42.6e
(2.9)
255g
(18)
24.8c
(3.7)
20RSRI 3.6a
(0.5)
5.8cd
(0.1)
1.8b
(0.1)
4.1a
(0.4)
30b
(2)
12.8b
(3.7)
40RSRI 3.57a
(0.04)
5.6bc
(0.1)
1.3ab
(0.1)
2.7a
(0.2)
17a
(2)
5.4a
(3.0)
10ND-
20RSRI
3.77a
(0.03)
5.8cd
(0.1)
1.3ab
(0.1)
11.8c
(1.2)
71c
(7)
23.3c
(3.2)
10ND-
40RSRI
3.6c
(0.1)
5.6ab
(0.1)
1.3ab
(0.1)
9.9c
(0.8)
60c
(6)
12.3b
(2.7)
20ND-
20RSRI
3.7a
(0.1)
5.5ab
(0.1)
1.3b
(0.1)
23.4e
(1.7)
124f
(11)
25.5c
(4.2)
20ND-
40RSRI
3.5a
(0.1)
5.7bcd
(0.1)
1.3ab
(0.1)
20.3d
(1.9)
91d
(8)
23.2b
(3.8)
Values with the same letter differ significantly and/or do not differ significantly
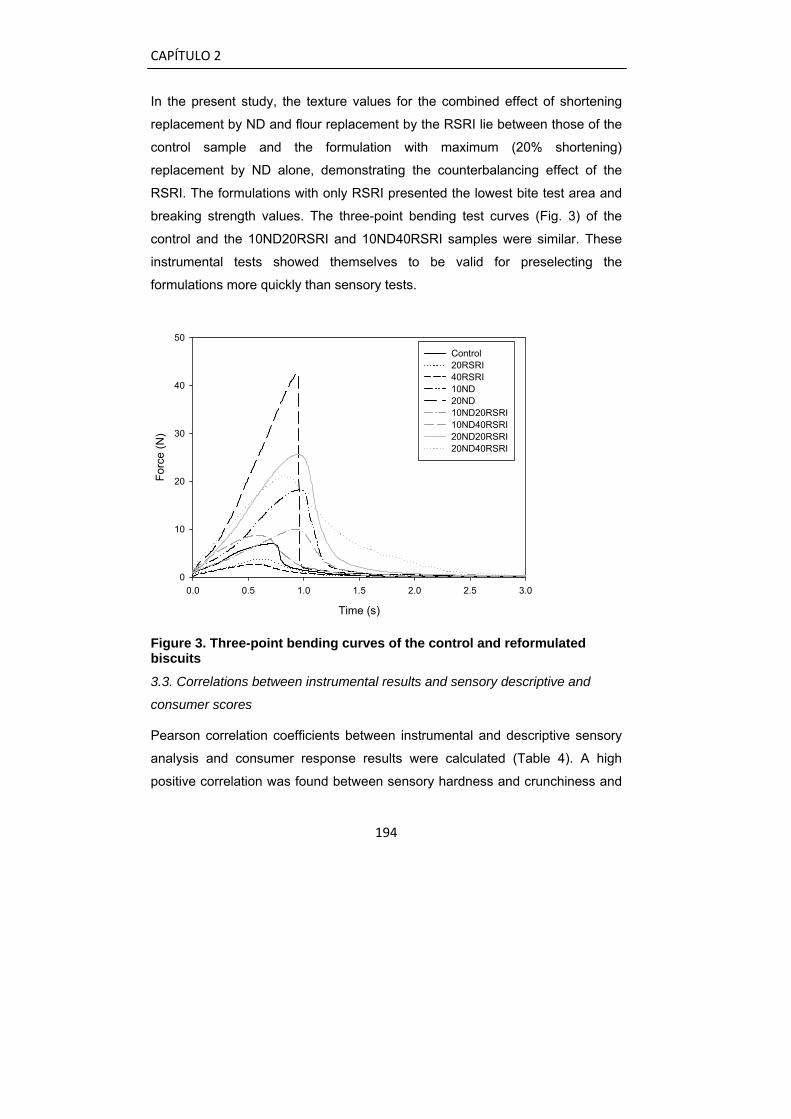
CAPÍTULO 2
194
In the present study, the texture values for the combined effect of shortening
replacement by ND and flour replacement by the RSRI lie between those of the
control sample and the formulation with maximum (20% shortening)
replacement by ND alone, demonstrating the counterbalancing effect of the
RSRI. The formulations with only RSRI presented the lowest bite test area and
breaking strength values. The three-point bending test curves (Fig. 3) of the
control and the 10ND20RSRI and 10ND40RSRI samples were similar. These
instrumental tests showed themselves to be valid for preselecting the
formulations more quickly than sensory tests.
Time (s)
0.0 0.5 1.0 1.5 2.0 2.5 3.0
Forc
e (N
)
0
10
20
30
40
50
Control20RSRI40RSRI10ND20ND10ND20RSRI10ND40RSRI20ND20RSRI20ND40RSRI
Figure 3. Three-point bending curves of the control and reformulated biscuits
3.3. Correlations between instrumental results and sensory descriptive and
consumer scores
Pearson correlation coefficients between instrumental and descriptive sensory
analysis and consumer response results were calculated (Table 4). A high
positive correlation was found between sensory hardness and crunchiness and
CAPÍTULO 2
195
the instrumental texture parameters measured (number of peaks, area of curve
and maximum peaks).
Negative correlations were found between instrumentally measured biscuit
width and shape regularity in the sensory test, indicating that a slightly barrel-
shaped biscuit was detected as a lack of regularity. This same attribute
correlated positively with consumer liking of the appearance, meaning that
wider biscuits obtained higher consumer acceptance, which could be explained
as a preference for a more homemade appearance rather than geometrically
perfect biscuits.
Instrumental color ΔE* correlated negatively with color consumer liking. Less
acceptance was expressed when the biscuit differed from the control color,
mainly due to L* values.
Since peaks in biting test represent fracture events, the expected clear
association between the number of peaks and the perception of crunchiness
was found. It was also found that sensory hardness correlated significantly and
positively with resistance to biting (obtained from the number of peaks and area
under the curve) and breaking strength (the maximum peak with the 3-point
bending rig), indicating that the texture scores of the trained panel correlated
well with instrumental texture parameters. Color as measured by the trained
panel correlated positively with the number of peaks, which could be explained
by the fact that the crunchier biscuits were also the darkest (more dehydrated)
ones.
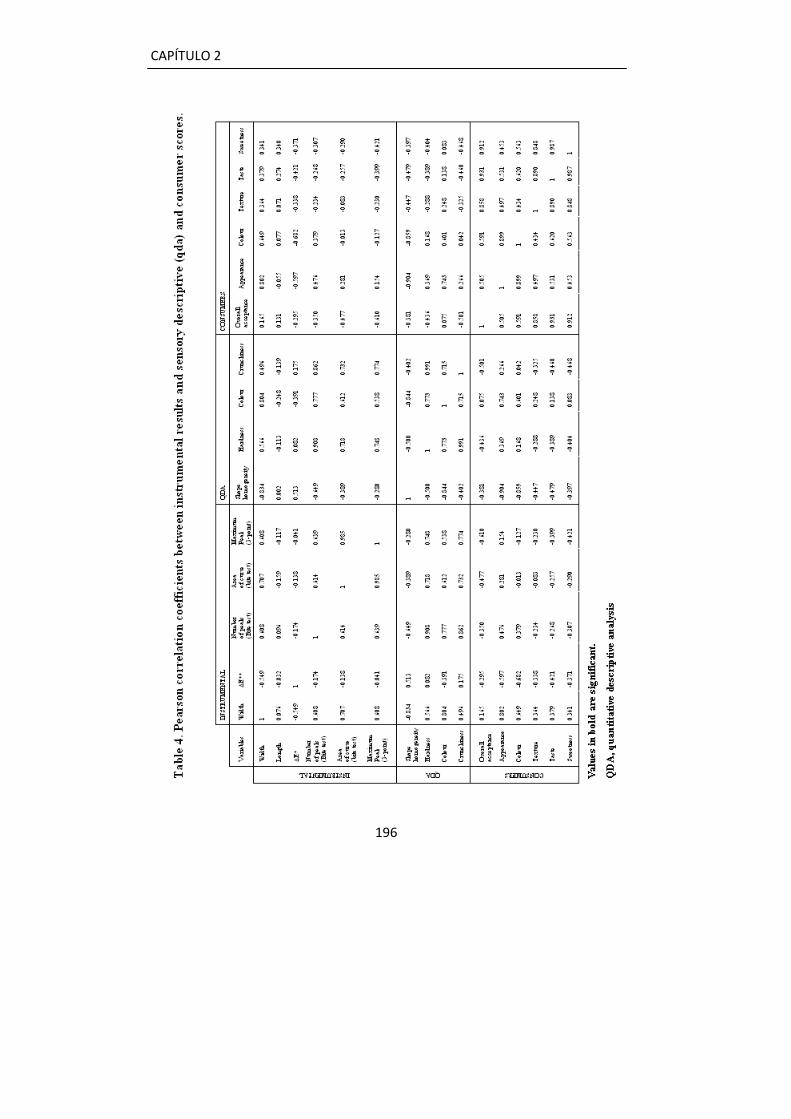
CAPÍTULO 2
196
CAPÍTULO 2
197
Lastly but no less importantly, overall liking was highly correlated to the
consumers' texture, taste and appearance liking scores. This suggests that
these three parameters were important drivers of liking for the consumers
evaluating the products. In particular, texture and taste liking showed a great
drop in all biscuit formulations with 20%ND when compared to the control
sample. The reformulated biscuit with 10% shortening replaced by N-Dulge
along with 20% of flour replaced by resistant starch overcame this drop,
showing acceptability values that were not significantly different to those of the
control sample (Fig. 2).
4. Conclusion
This study shows how sensory analysis can be used successfully to ascertain
how to balance the effects of new ingredients. Texture was the main issue
when a percentage of fat was removed: the biscuits got harder and crumblier.
In the present study, the addition of resistant starch to replace part of the flour
proved to be a good way of balancing out the detrimental effects of fat
replacement on texture. In the case of 10% shortening replacement by N-Dulge
(a mixture of tapioca dextrin and tapioca starch), this addition achieved
samples with good acceptability.
References
Aparicio-Saguilán, A., Sáyago-Ayerdi, S.G., Vargas-Torres, A., Tovar J.,
Ascencio-Otero, T.E., Bello-Pérez, L.A. (2007). Slowly digestible cookies
prepared from resistant starch-rich lintnerized banana starch. Journal of
Food Composition and Analysis 20:175–181.
Arvisenet, G., Voilley, A, Cayot, N .(2002). Retention of aroma compounds in
starch matrices: Competitions between aroma compounds toward amylose
and amylopectin. Journal Agriculture of Food Chemistry 50(25):7345–7349

CAPÍTULO 2
198
Akoh, C.C. (1998). Fat replacers. Food techonology 52: 47-53
Bath, D.E, Shelke, K., Hoseney, R.C. (1992). Fat replacers in high-ratio layer
cakes. Cereal Foods World, 37(7):495–500.
Baixauli, R., Salvador, A., Hough, G., Fiszman S.M. (2008). How information
about fibre (traditional and RSRI) influences consumer acceptance of
muffins. Food Quality and Preference, 19:628-635.
Baltsavias, A., Jurgens, A., Van Vlient, T. (1999). Properties of short-dough
biscuits in relation to structure. Journal of Cereal Science, 29:242-255.
Brown, W.E., Langley, K.R., Braxton, D. (1998). Insight into consumers’
assessments of biscuit texture based on mastication analysis-hardness
versus crunchiness. Journal of Texture Studies 29: 481-497.
Brown, W.E., Braxton, D. (2000). Dynamics of food breakdown during eating in
relation to perceptions of texture and preference: a study on biscuit. Food
Quality and Preference 11: 259-267.
Burseg, K., Linfort, R.S.T., Hort, J., Taylor, A.J. (2009). Flavor perception in
biscuits; correlating sensory properties with composition, aroma release,
and texture. Chemical perception 2:70-78.
Campbell, L.A., Ketelsen, S.M., Antenucci, R.N. (1994). Formulating oatmeal
cookies with calorie-sparing ingredients. Food Technology, 48(5), 98–105.
Cliff, M.A., King, M. (1999). Use of principal component analysis for the
evaluation and consumer acceptance of carbohydrate-based fat replacers
in biscuits. Journal of Consumer Studies Home Economy 20, 285-296.
Conforti, F.D., Charle, S.A., Dunkan, S.E. (1996). Sensory evaluation and
consumer acceptance of carbohydrate-based fat replacers in biscuits.
Journal of Consumer Studies and Home Economics, 20:285–296.
Drewnowski, A., Nordenstenb, K., Dwyer, C.J. (1998). Replacing sugar and fat
in cookies: Impact on product quality and preference. Food Quality and
Preference 9: 13-20.
CAPÍTULO 2
199
Francis, F.J. ,Clydesdale, F.M. (1975). Food Colorimetry: Theory and
Applications. The Avi Publishing Company, Inc, Westport, CT.
Ghotra, B.S., Dyal, S.D., Narine, S.S. (2002). Lipid shortenings: a review. Food
Research International 35:1015–1048.
Inglett, G.E., Warner, K., Newman, R.K. (1994). Sensory and Nutritional
Evaluations of Oatrim. Cereal Foods World, 39(10), 755-756.
ISO 8589. (1988). Sensory analysis. General guidance for design of test
rooms. Standard no. 8589. Geneva, Switzerland.
Kulp, K., Olewnik, M., Lorenz, K. (1991). Starch functionality in cookie systems.
Starch 43:53-57
Lai, H.M., Lin, T.C. (2006). Bakery Products: Science and Technology. In
Bakery Products: Science and Technology., pp. 3–65. Blackwell Publishing,
Ames, IA.
Laguna, L., Salvador, A., Sanz, T., Fiszman, S.M. (2011). Performance of a
resistant starch rich ingredient in the baking and eating quality of short-
dough biscuits. LWT-Food Science and. Technology. 44,737-746.
Larrea, M.A., Chang, Y.K., Martinez-Bustos, F. (2005). Some functional
properties of extruded orange pulp and its effect on the quality of cookies.
LWT-Food Science and. Technology. 38:213–220
Lawless, H., Heymann, H. (1998). Sensory evaluation of food. Principles and
practices. Chapman & Hall, New York., NY.
Martínez,C., Santa Cruz., M.J., Hough, G. (2002). Preference mapping of
cracker type biscuits. Food Quality and Preference 13:535–544
Sai Manohar, R., Haridas Rao, P. (1999). Effect of emulsifiers, fat level and
type on the rheological characteristics of biscuit dough and quality of
biscuits. Journal of the Science of Food and Agriculture 79:1223-1231.
CAPÍTULO 2
200
Meilgaard, M., Civille, G.V., Carr, B.T. (1991). Sensory evaluation techniques
(2nd ed.). Boca Raton, FL: CRC Press Inc.p. 288
Nonaka, H. H. (1997). Plant carbohydrate-derived products as fat replacers and
calorie reducers. Cereal foods world 42(5):376-378.
Pareyt, B., Delcour, J.A. (2008). The Role of Wheat Flour Constituents, Sugar,
and Fat in Low Moisture Cereal Based Products: A Review on Sugar-Snap
Cookies. Critical Reviews in Food Science and Nutrition, 48:824–839
Seker, I.T., Ozboy-Ozbas, O., Ozturk, S., Koksel, H. (2010). Utilization of
Apricot Kernel Flour as fat replacer in cookies. Journal of Food Processing
and Preservation, 34: 15-26.
Seuvre, A.M., Philippe, E., Rochard, S., Voilley, A. (2006). Retention of aroma
compounds in food matrices of similar rheological behaviour and different
compositions. Food Chemistry 96(1):104–114
Stone, H., Sidel, J. (2004). Quantitative Descriptive Analysis (The QDA
Method), Sensory Evaluation Practices, 3rd Ed. Elsevier Academic Press,
San Diego, CA. pp-215-235
Sudha, M.L., Srivastava, A.K., Vetrimani, R., Leelavathi K. (2007). Fat
replacement in soft dough biscuits: Its implications on dough rheology and
biscuit quality Journal of Food Engineering 80:922–930.
Van Ruth, S.M., King, C. (2003). Effect of starch and amylopectin
concentrations on volatile flavour release from aqueous model food
systems. Flavour Fragrance Journal 18(5):407–416
Van Kleef, E., Van Trijp, H.C.M., Luning P. (2006). Internal versus external
preference analysis: An exploratory study on end-user evaluation. Food
Quality and Preference 408, 17: 387–399.
Vázquez, M.B., Curia, A., Hough, G. (2009). Sensory descriptive analysis,
sensory acceptability and expectation studies on biscuits with reduced
added salt and increased fiber. Journal of Sensory Studies 24: 498–511.

CAPÍTULO 2
201
Vieira, M.A., Tramonte, K.C., Podestá, R., Avancini, S.R.P., Amboni, R.D.M.C.,
Amante, E.R. (2008). Physicochemical and sensory characteristics of
cookies containing residue from king palm (Archontophoenix alexandrae)
processing. International Journal of Food Science and Technology 43,
1534–1540.
WHO. (2004). WHO Global Strategy on Diet. Available from: http://www.who.int/
Yue ,P., Waring, S. (1998). Functionality of RS in food application. Food
Australia, 50:615-621.
Zoulias, E.I., Oreopoulou, V., Tzia, C. (2002a). Textural properties of low-fat
cookies containing carbohydrate-or protein-based fat replacers. Journal of
Food Engineering 55:337–342.
Zoulias, E.I., Oreopoulou, V., Kounalaki, E. (2002b). Effect of fat and sugar
replacement on cookie properties.Journal of the Science of Food and
Agriculture 82:1637–1644.

HPMC AND INULIN AS FAT REPLACERS IN BISCUITS: SENSORY AND INSTRUMENTAL EVALUATION
Laura Laguna, Cristina Primo-Martín, Paula Varela, Ana Salvador
and Teresa Sanz

CAPÍTULO 2
205
Abstract
Because a high fat content in foods is associated with health disorders,
consumers demand low fat products, but without any loss of their texture
quality. The instrumental texture and sensory properties of biscuits in which
15% and 30% of the fat had been replaced by two different carbohydrate-based
fat replacers (inulin and hydroxypropyl methylcellulose) were studied. The
instrumental texture measurements showed that inulin and hydroxypropyl
methylcellulose (HPMC) biscuits were harder and the sound emissions were
higher than for the control biscuits. The trained sensory panel rated the biscuit
with 15% fat replacement by inulin as crisper than the control. The consumer
study revealed that fat replacement up to 15% with inulin or HPMC provided
acceptable biscuits, but higher replacement decreased the overall acceptability.
Keywords: Biscuits, fat replacers, inulin, HPMC, texture.
CAPÍTULO 2
206
1. Introduction
In biscuits, fat is a very important ingredient, contributing to the texture,
mouthfeel, flavour and overall perception of them (Zoulias, Oreopoulou, & Tzia,
2002a). However, an excess of energy intake and the consequent high amount
of fat (especially saturated fat) is associated with health disorders such as
obesity, cancer, high blood cholesterol and coronary heart disease (Akoh,
1998). In fact, the total fat content should not be higher than 30% of daily
energy intake. Saturated fats should not be more than 10% and
monounsaturated and polyunsaturated 20% of total energy intake (USDA
2000).
For this reason concerned consumers want to reduce the fat content of their
food, without affecting flavour and texture (Nonaka, 1997). In fact, mechanical
properties of biscuits are largely dependent on the fat component of the
formulation (Baltsavias, Jurgens, & van Vilet, 1999) because fat interacts with
the other ingredients to develop and mould texture, mouthfeel and overall
sensation of lubricity of the product (Giese, 1996; Stauffer, 1998). Fat
replacement in biscuits has been studied by many different authors (Röβle,
Ktenioudaki, & Gallagher, 2011; Zbikowska & Rutkowska, 2008; Zoulias et al.
2002a; Zoulias, Oreopoulou, & Kounalaki, 2002b; Sudha, Srivastava, Vetrimani,
& Leelavathi 2007; Laguna, Varela, Salvador, Sanz, & Fiszman, 2011).
Nevertheless, the problem ssociated to the loss of texture quality remains
unsolved. Nowadays, the consumer appreciation is the criteria for the food
choice and a loss in desirable quality parameters is a problem (Roudaut,
Dacremont, Pamies, Colas, & Meste, 2002). In biscuits, texture plays a decisive
role in appreciation. Specifically for some types of biscuits crispness has a main
role for biscuit acceptability.
Fat has an important role during the manufacturing process as well as in the
final texture of biscuits. During dough mixing, fat competes with the water for
the flour surface surrounding the starch and protein (Pareyt & Delcour, 2008),
producing tender biscuits (Baltsavias, Jurgens, & van Vliet, 1999). Replacing fat
CAPÍTULO 2
207
without affecting product quality characteristics is a challenging task (Röβle et
al., 2011). “Fat replacers” are substances of carbohydrate or protein origin
which can imitate the functional and sensory properties of fat while “fat
substitute” is referred to the substances that provides identical physical and
sensory properties to fats, as well as fat replacers, but does not provide calories
(Lindsay 2000).
Inulin has been used as a fat replacer in the dairy industry (Guven, Yasar,
Karaka, & Hayaloglu, 2005), in spreads and fillings, desserts and dressings
(Franck, 2002; Roberfroid, 2005), in bread making (O’Brien, Mueller, Scannell,
& Arendt, 2003) and in biscuits (Zoulias et al., 2002ab; Zbikowska et al., 2008).
Zoulias et al. (2002a) used compression tests to compare the biscuit with or
without fat replacer. An increase in the maximum stress of no fat replacer
biscuits was obtained respect to the inulin biscuits; however, they did not
compare with full fat biscuits. Additionally, and increase in maximum stress was
associated with harder biscuits. Zbikowska et al. (2008) also used inulin as fat
replacer. A sensory panel described texture biscuits attributes and found inulin
biscuits as less crispy and harder in comparison with full fat biscuits.
Both manuscripts reveal that inulin could be use as fat replacer: however, none
of these studies conducted a study of the instrumental and sensory properties
to understand the influence of inulin on texture.
Hydroxypropyl methylcellulose (HPMC), a cellulose ether, has also been used
as fat replacer in many food applications. It imparts creaminess, lubricity, air
entrapment and moisture retention to baked goods, frozen desserts, dry mix
sauces, pourable and spoonable sauces, dressings (Akoh, 1996), gluten free
breads (Sabanis and Tzia, 2011; Mariotti et al. 2012;) and it has been used as
films in processed fruits and vegetables (Krochta and De Mulder-Johnston,
1997; Park 1999; Villalobos 2006).To date, HPMC has not been used as a fat
replacer in biscuits.

CAPÍTULO 2
208
The aim of this work was to study the effect of partial fat replacement with inulin
and HPMC in biscuits. Instrumental texture was studied through simultaneous
fracture and sound emission measurements and the sensory properties
(appearance, texture and sound) of the biscuits were studied using both a
trained panel and a consumer panel.
2. Material and methods
2.1. Materials
Two different fat replacers were used: inulin (Frutafit® HD, provided by Sensus
Roosendal, The Netherlands; composition data as provided by the
manufacturer: carbohydrates > 99,5%, inulin > 90%, fructose < 10%), and
hydroxypropyl methylcellulose (Methocel F4M Food Grade, Dow Chemical
Company, Midland, MI, USA; composition data as provided by the
manufacturer: methoxyl and hydroxypropyl substitution of methyl cellulose 29%
and 6.8% respectively, viscosity 4000 mPa·s in a 20g/L solution). The biscuit
formulations are shown in Table 1.
2.2. Biscuit preparation
Biscuit preparation followed the same procedure as Laguna, Salvador, Sanz
and Fiszman (2011) with the following modifications: in the biscuits with HPMC,
the HPMC was dissolved in water at 2% and then added after the flour and
mixed for 30 seconds at speed 60 rpm and the dough was sheeted to 10 mm in
a dough laminating machine (Parber, Zamundio, Spain) and cut into rectangular
pieces measuring 50 x 30 x 10mm (length x width x height). Twenty-five pieces
were placed on a perforated tray. The biscuits were baked in a conventional
oven for 4 min at 175 °C. The trays were then turned 180°, bringing the side
that had been at the back to the front of the oven to ensure even cooking, and
baked for a further 4.5 min at the same temperature. The oven and the oven
trays were always the same, the trays were placed at the same level in the oven
each time, and the number of biscuits baked was always the same. After
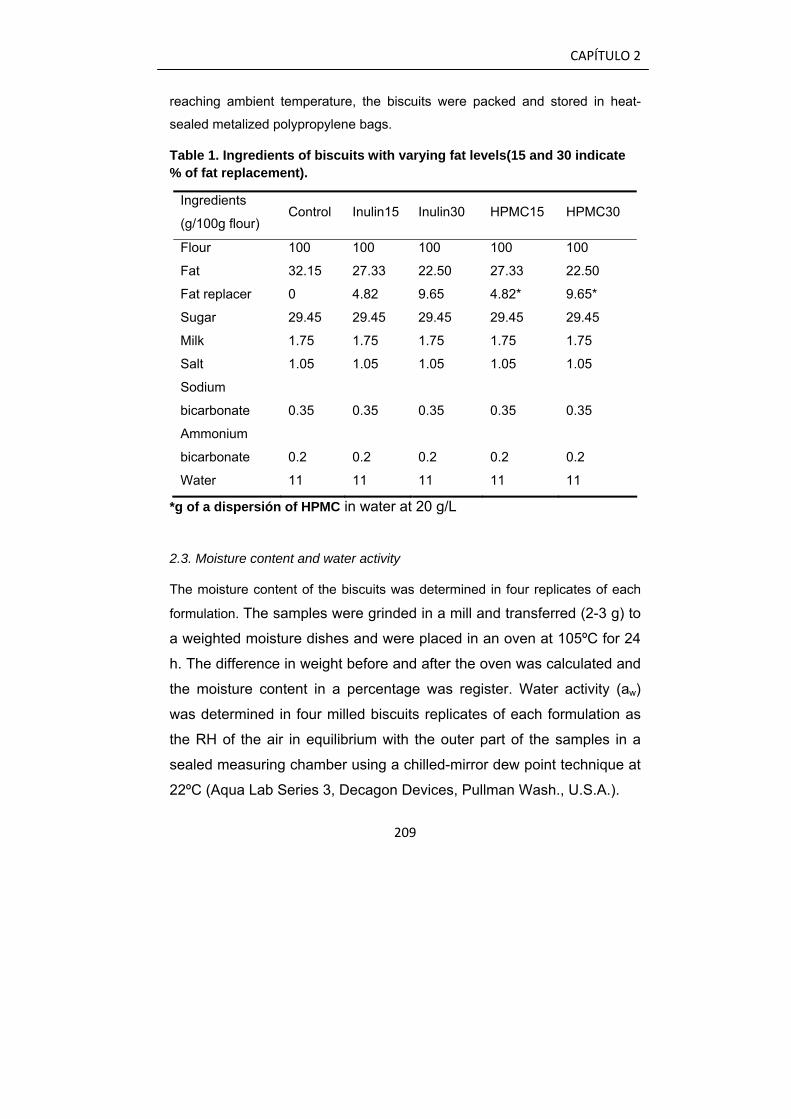
CAPÍTULO 2
209
reaching ambient temperature, the biscuits were packed and stored in heat-
sealed metalized polypropylene bags.
Table 1. Ingredients of biscuits with varying fat levels(15 and 30 indicate % of fat replacement).
Ingredients
(g/100g flour) Control Inulin15 Inulin30 HPMC15 HPMC30
Flour 100 100 100 100 100
Fat 32.15 27.33 22.50 27.33 22.50
Fat replacer 0 4.82 9.65 4.82* 9.65*
Sugar 29.45 29.45 29.45 29.45 29.45
Milk 1.75 1.75 1.75 1.75 1.75
Salt 1.05 1.05 1.05 1.05 1.05
Sodium
bicarbonate 0.35 0.35 0.35 0.35 0.35
Ammonium
bicarbonate 0.2 0.2 0.2 0.2 0.2
Water 11 11 11 11 11
*g of a dispersión of HPMC in water at 20 g/L
2.3. Moisture content and water activity
The moisture content of the biscuits was determined in four replicates of each
formulation. The samples were grinded in a mill and transferred (2-3 g) to
a weighted moisture dishes and were placed in an oven at 105ºC for 24
h. The difference in weight before and after the oven was calculated and
the moisture content in a percentage was register. Water activity (aw)
was determined in four milled biscuits replicates of each formulation as
the RH of the air in equilibrium with the outer part of the samples in a
sealed measuring chamber using a chilled-mirror dew point technique at
22ºC (Aqua Lab Series 3, Decagon Devices, Pullman Wash., U.S.A.).
CAPÍTULO 2
210
2.4. Simultaneous fracture and sound emission of the biscuits
The acoustic emission of the biscuits was measured during fracturing at 20
mm/s using a Texture Analyzer (TA-XT Plus, Stable Micro Systems Ltd.,
Surrey, UK) inside an isolated acoustic chamber with a prepolarized free-field
½” microphone in combination with a Deltatron preamplifier microphone (Brüel
Kjær, Nærum, Denmark) as described by Primo-Martín, Sözer, Hamer, & van
Vliet (2009). The biscuit was placed on a flat platform with a slit (width 4 mm,
length 60 mm). Test pieces were fractured between a wedge (30° cutting angle,
32 mm wide) and the platform. The wedge shaped probe and a deformation
speed of 20 mm/s (and a 65 kHz data sampling rate) were chosen to simulate
biting with the front teeth (Vincent, Jeronimidis, Khan, & Luyten, 1991). The
distance between the microphone and the sample was 7 cm. Extensive analysis
of the sound was performed using MatLab (Matworks 7.0.4) as described by
Castro-Prada, Primo-Martín, Meinders, Hamer, & Van Vliet (2009). The sound
emitted was characterized in terms of the number of sound pulses and mean
intensity (dB), both of which are related to the perception of crispness (Castro-
Prada et al., 2009). The total energy (W/m2), and maximum intensity (dB) were
also measured. The mechanical parameters measured were the number of
force drops (drop in force higher than 0.5N), slope of the first event (gradient of
the curve up to the first major peak) (N/s), and maximum force (N).
2.5. Sensory Analysis
Sensory testing was carried out in a sensory laboratory equipped with
individual booths (ISO 8589, 1988). Data acquisition was performed using
Compusense five release 5.0 software (Compusense Inc., Guelph, Ont.,
Canada).
The samples analyzed by sensory analysis were: control, inulin15, HPMC15,
and HPMC30. The inulin30 biscuits were not subjected to sensory testing as
CAPÍTULO 2
211
they were not considered edible due to their hardness on the first bite with
the incisors.
2.5.1. Consumer test
A total of 100 consumers (untrained, 50 males and 50 females) recruited
in the centre of research (IATA) and the university of Valencia, aged
from 18 to 65 years and frequent consumers of short dough biscuits,
took part in the study. The consumers evaluated the 4 samples in one
session. The biscuits were coded with random three-digit numbers and
the sample presentation followed a balanced complete block
experimental design. Consumer acceptance was rated on nine-point
hedonic scales (1 = dislike extremely and 9 = like extremely). For each
sample, the consumers scored the attributes acceptability in the
following order ‘overall acceptability’, ‘appearance’, ‘colour’, ‘odour’,
‘texture’, ‘hardness’, ‘crispness’, ‘dry mouthfeel’, ‘taste’, ‘sweetness’ and
’buttery taste’.
2.5.2. Quantitative Descriptive Analysis
The QDA method (Stone et al., 1974; Stone and Sidel, 1998, 2003)
provides a complete word description of a product and it was done as
follow.
Selection of terms. A panel of eight assessors, aged between 25 and 40
years and with wide experience in quantitative descriptive analysis, was
trained to assess the biscuit samples. The assessors selected the
descriptors using the checklist method (Lawless & Heymann, 1998).
Terms were selected and discussed in an open session with the panel
leader. The panel leader collected all these attributes that the trained
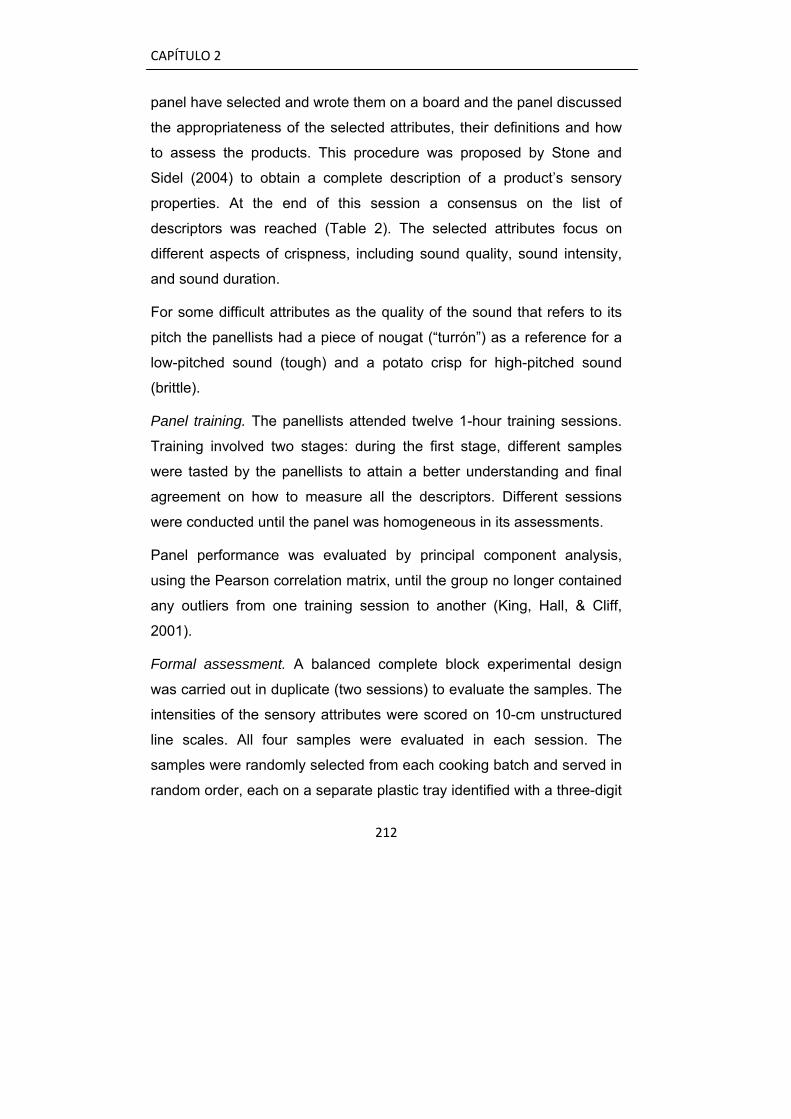
CAPÍTULO 2
212
panel have selected and wrote them on a board and the panel discussed
the appropriateness of the selected attributes, their definitions and how
to assess the products. This procedure was proposed by Stone and
Sidel (2004) to obtain a complete description of a product’s sensory
properties. At the end of this session a consensus on the list of
descriptors was reached (Table 2). The selected attributes focus on
different aspects of crispness, including sound quality, sound intensity,
and sound duration.
For some difficult attributes as the quality of the sound that refers to its
pitch the panellists had a piece of nougat (“turrón”) as a reference for a
low-pitched sound (tough) and a potato crisp for high-pitched sound
(brittle).
Panel training. The panellists attended twelve 1-hour training sessions.
Training involved two stages: during the first stage, different samples
were tasted by the panellists to attain a better understanding and final
agreement on how to measure all the descriptors. Different sessions
were conducted until the panel was homogeneous in its assessments.
Panel performance was evaluated by principal component analysis,
using the Pearson correlation matrix, until the group no longer contained
any outliers from one training session to another (King, Hall, & Cliff,
2001).
Formal assessment. A balanced complete block experimental design
was carried out in duplicate (two sessions) to evaluate the samples. The
intensities of the sensory attributes were scored on 10-cm unstructured
line scales. All four samples were evaluated in each session. The
samples were randomly selected from each cooking batch and served in
random order, each on a separate plastic tray identified with a three-digit
CAPÍTULO 2
213
code. The panellists were instructed to rinse their mouths with water
between sample evaluations.
2.6. Statistical analysis
Analysis of variance (one way-ANOVA) was applied to study the
differences between formulations. Least significant differences were
calculated by the Tukey test and the significance at p < 0.05 was
determined.
Two-way ANOVA was applied to each descriptor to check panel
performance, considering the assessors, the samples and their
interaction as factors. Analysis of variance (one way-ANOVA) was
applied to the consumer test in order to study the effect of formulation.
Least significant differences were calculated by Tukey’s test and the
significance at p<0.05 was determined.
Pearson correlation was calculated to correlate the sensory data with the
instrumental parameters.
All the statistical analyses were performed with XLSTAT 2009.4.03
statistical software (Microsoft).
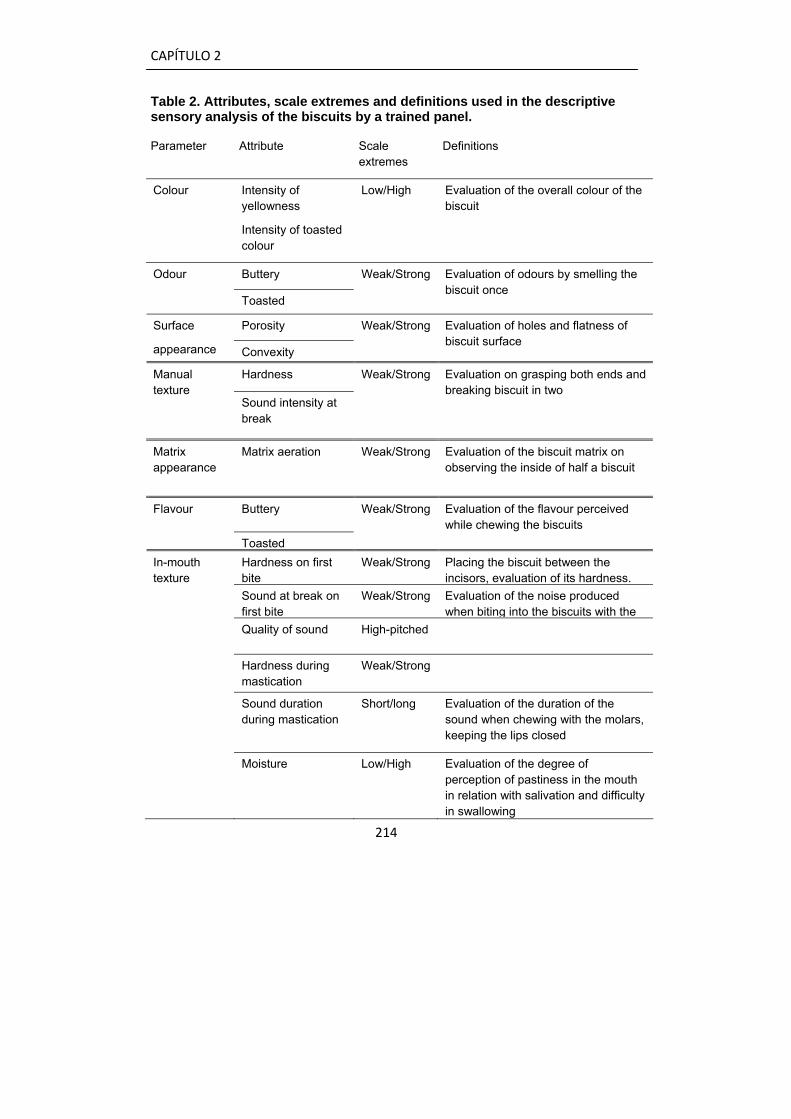
CAPÍTULO 2
214
Table 2. Attributes, scale extremes and definitions used in the descriptive sensory analysis of the biscuits by a trained panel.
Parameter Attribute Scale extremes
Definitions
Colour Intensity of yellowness
Intensity of toasted colour
Low/High Evaluation of the overall colour of the biscuit
Buttery Odour
Toasted
Weak/Strong Evaluation of odours by smelling the biscuit once
Porosity Surface
appearance Convexity
Weak/Strong Evaluation of holes and flatness of biscuit surface
Hardness Manual texture
Sound intensity at break
Weak/Strong
Evaluation on grasping both ends and breaking biscuit in two
Matrix appearance
Matrix aeration Weak/Strong Evaluation of the biscuit matrix on observing the inside of half a biscuit
Buttery Flavour
Toasted
Weak/Strong Evaluation of the flavour perceived while chewing the biscuits
Hardness on first bite
Weak/Strong Placing the biscuit between the incisors, evaluation of its hardness.
In-mouth texture
Sound at break on first bite
Weak/Strong Evaluation of the noise produced when biting into the biscuits with the
Quality of sound High-pitched
Hardness during mastication
Weak/Strong
Sound duration during mastication
Short/long Evaluation of the duration of the sound when chewing with the molars, keeping the lips closed
Moisture Low/High Evaluation of the degree of perception of pastiness in the mouth in relation with salivation and difficulty in swallowing
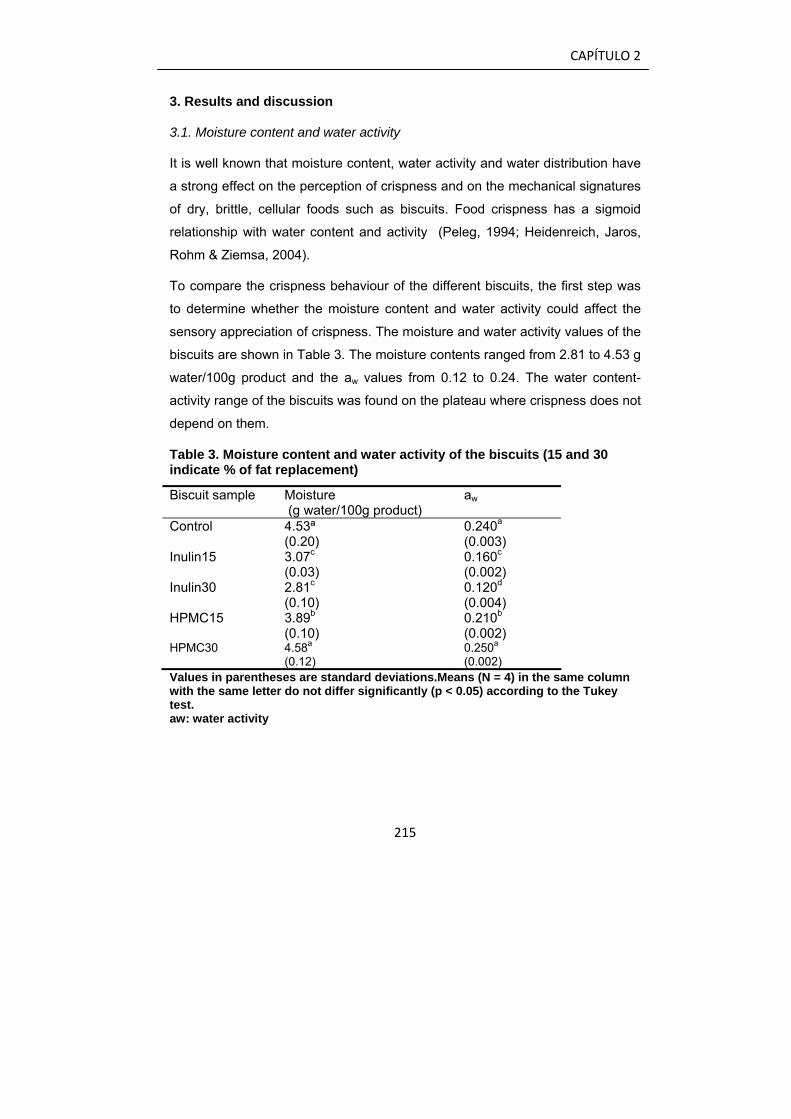
CAPÍTULO 2
215
3. Results and discussion
3.1. Moisture content and water activity
It is well known that moisture content, water activity and water distribution have
a strong effect on the perception of crispness and on the mechanical signatures
of dry, brittle, cellular foods such as biscuits. Food crispness has a sigmoid
relationship with water content and activity (Peleg, 1994; Heidenreich, Jaros,
Rohm & Ziemsa, 2004).
To compare the crispness behaviour of the different biscuits, the first step was
to determine whether the moisture content and water activity could affect the
sensory appreciation of crispness. The moisture and water activity values of the
biscuits are shown in Table 3. The moisture contents ranged from 2.81 to 4.53 g
water/100g product and the aw values from 0.12 to 0.24. The water content-
activity range of the biscuits was found on the plateau where crispness does not
depend on them.
Table 3. Moisture content and water activity of the biscuits (15 and 30 indicate % of fat replacement)
Biscuit sample Moisture (g water/100g product)
aw
Control 4.53ª (0.20)
0.240a (0.003)
Inulin15 3.07c (0.03)
0.160c
(0.002) Inulin30 2.81c
(0.10) 0.120d (0.004)
HPMC15 3.89b (0.10)
0.210b (0.002)
HPMC30 4.58a (0.12)
0.250a (0.002)
Values in parentheses are standard deviations.Means (N = 4) in the same column with the same letter do not differ significantly (p < 0.05) according to the Tukey test. aw: water activity
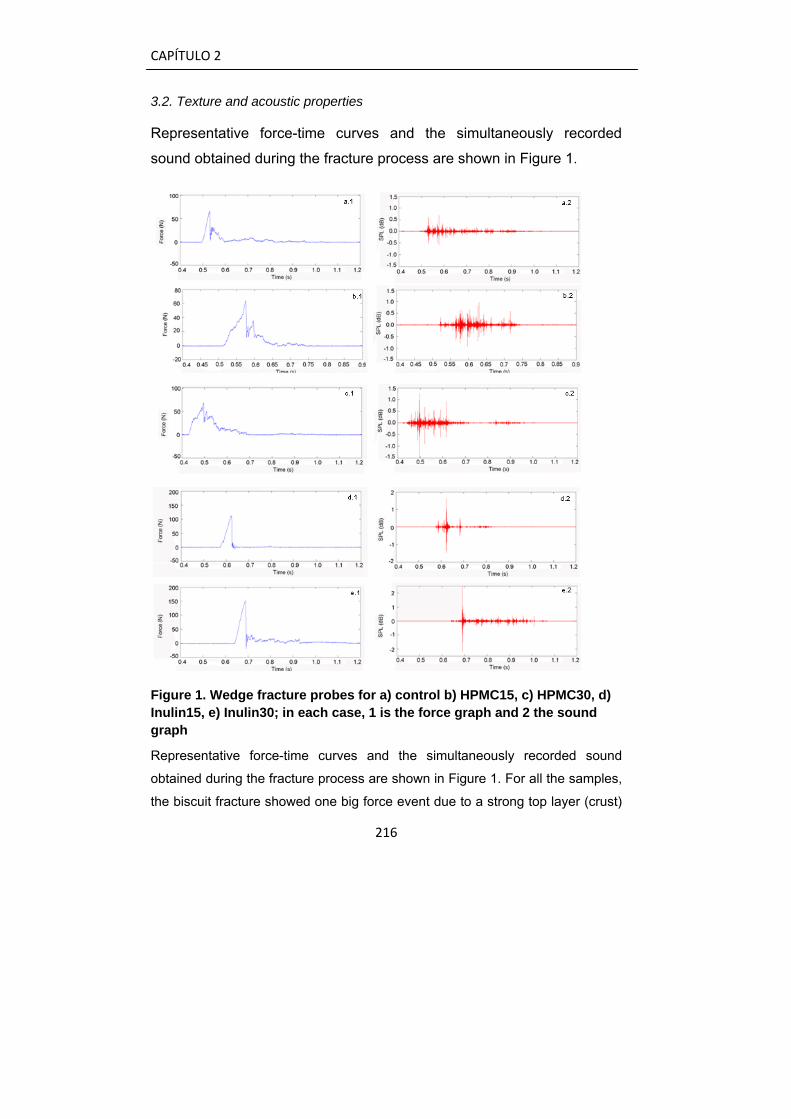
CAPÍTULO 2
216
3.2. Texture and acoustic properties
Representative force-time curves and the simultaneously recorded
sound obtained during the fracture process are shown in Figure 1.
Figure 1. Wedge fracture probes for a) control b) HPMC15, c) HPMC30, d) Inulin15, e) Inulin30; in each case, 1 is the force graph and 2 the sound graph
Representative force-time curves and the simultaneously recorded sound
obtained during the fracture process are shown in Figure 1. For all the samples,
the biscuit fracture showed one big force event due to a strong top layer (crust)
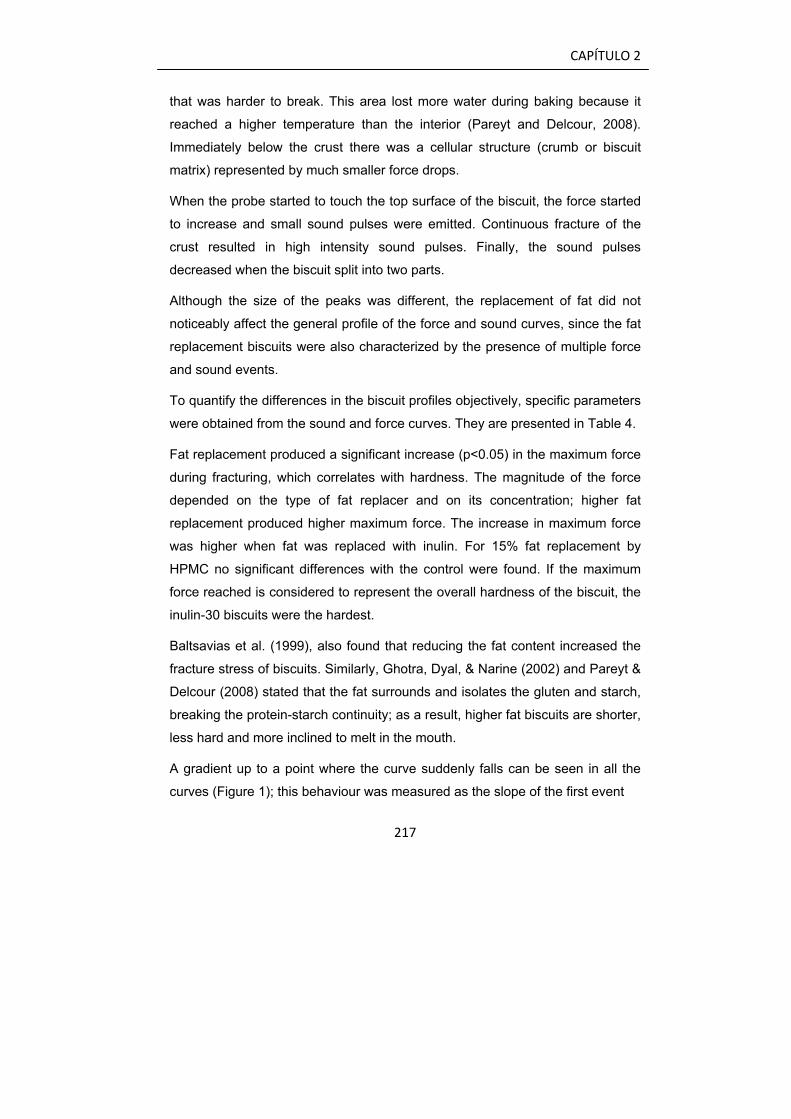
CAPÍTULO 2
217
that was harder to break. This area lost more water during baking because it
reached a higher temperature than the interior (Pareyt and Delcour, 2008).
Immediately below the crust there was a cellular structure (crumb or biscuit
matrix) represented by much smaller force drops.
When the probe started to touch the top surface of the biscuit, the force started
to increase and small sound pulses were emitted. Continuous fracture of the
crust resulted in high intensity sound pulses. Finally, the sound pulses
decreased when the biscuit split into two parts.
Although the size of the peaks was different, the replacement of fat did not
noticeably affect the general profile of the force and sound curves, since the fat
replacement biscuits were also characterized by the presence of multiple force
and sound events.
To quantify the differences in the biscuit profiles objectively, specific parameters
were obtained from the sound and force curves. They are presented in Table 4.
Fat replacement produced a significant increase (p<0.05) in the maximum force
during fracturing, which correlates with hardness. The magnitude of the force
depended on the type of fat replacer and on its concentration; higher fat
replacement produced higher maximum force. The increase in maximum force
was higher when fat was replaced with inulin. For 15% fat replacement by
HPMC no significant differences with the control were found. If the maximum
force reached is considered to represent the overall hardness of the biscuit, the
inulin-30 biscuits were the hardest.
Baltsavias et al. (1999), also found that reducing the fat content increased the
fracture stress of biscuits. Similarly, Ghotra, Dyal, & Narine (2002) and Pareyt &
Delcour (2008) stated that the fat surrounds and isolates the gluten and starch,
breaking the protein-starch continuity; as a result, higher fat biscuits are shorter,
less hard and more inclined to melt in the mouth.
A gradient up to a point where the curve suddenly falls can be seen in all the
curves (Figure 1); this behaviour was measured as the slope of the first event
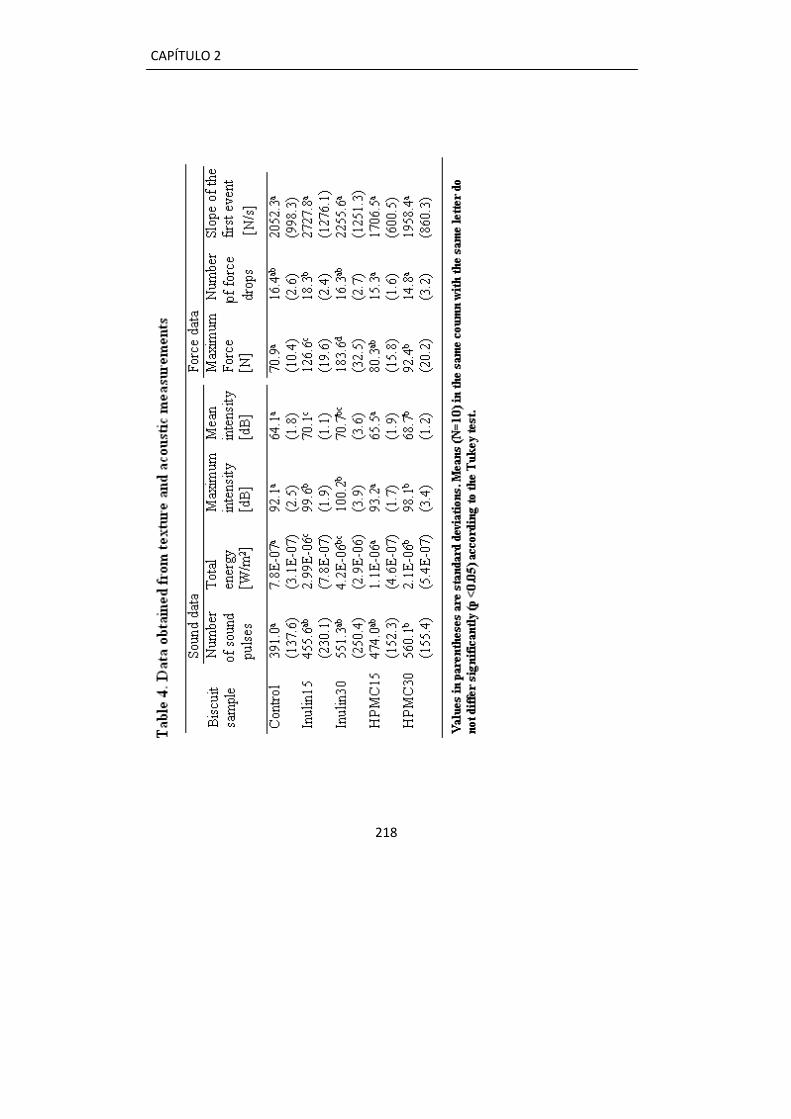
CAPÍTULO 2
218
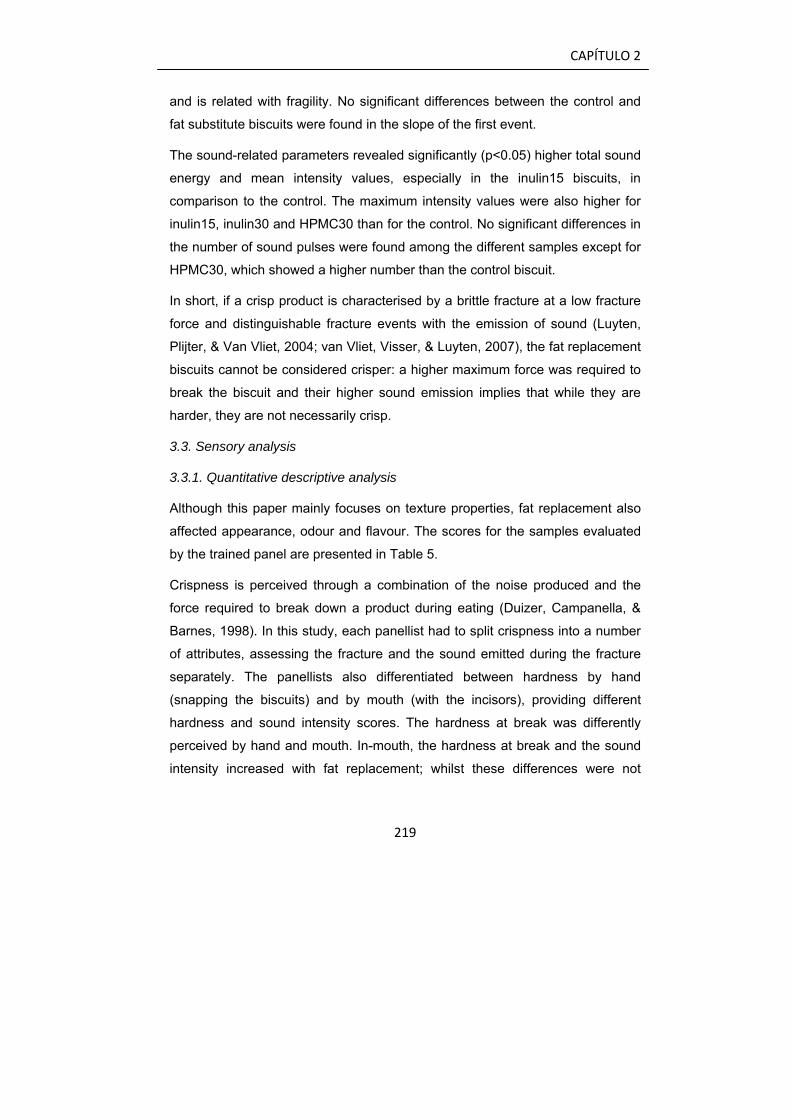
CAPÍTULO 2
219
and is related with fragility. No significant differences between the control and
fat substitute biscuits were found in the slope of the first event.
The sound-related parameters revealed significantly (p<0.05) higher total sound
energy and mean intensity values, especially in the inulin15 biscuits, in
comparison to the control. The maximum intensity values were also higher for
inulin15, inulin30 and HPMC30 than for the control. No significant differences in
the number of sound pulses were found among the different samples except for
HPMC30, which showed a higher number than the control biscuit.
In short, if a crisp product is characterised by a brittle fracture at a low fracture
force and distinguishable fracture events with the emission of sound (Luyten,
Plijter, & Van Vliet, 2004; van Vliet, Visser, & Luyten, 2007), the fat replacement
biscuits cannot be considered crisper: a higher maximum force was required to
break the biscuit and their higher sound emission implies that while they are
harder, they are not necessarily crisp.
3.3. Sensory analysis
3.3.1. Quantitative descriptive analysis
Although this paper mainly focuses on texture properties, fat replacement also
affected appearance, odour and flavour. The scores for the samples evaluated
by the trained panel are presented in Table 5.
Crispness is perceived through a combination of the noise produced and the
force required to break down a product during eating (Duizer, Campanella, &
Barnes, 1998). In this study, each panellist had to split crispness into a number
of attributes, assessing the fracture and the sound emitted during the fracture
separately. The panellists also differentiated between hardness by hand
(snapping the biscuits) and by mouth (with the incisors), providing different
hardness and sound intensity scores. The hardness at break was differently
perceived by hand and mouth. In-mouth, the hardness at break and the sound
intensity increased with fat replacement; whilst these differences were not

CAPÍTULO 2
220
appreciable by hand. The in-mouth sensory results were reflected by the
instrumental results.
The panellists found that the inulin15 biscuit had the highest-pitched fracture
sound, followed by HPMC15 and the control, while the HPMC30 produced the
lowest-pitched sound.
During mastication, each biscuit formulation exhibits its own “breakdown path”.
The panellists probably characterized these differences as hardness and sound
duration during mastication. The control biscuit was the softest. This is in
agreement with Baltsavias et al. (1999), who stated that the incorporation of fat
into a biscuit dramatically decreased the fracture stress. They also asserted that
this decrease is due to air cell size reduction; however, in the present study the
panellists scored the full-fat biscuit (control) as having a more aerated matrix.
The sound duration during in-mouth mastication was independent of the
quantity of fat and the inulin15 biscuit had the longest sound.
As the toasted colour increased, so did the toasted odour. The inulin15 biscuit
had the most toasted colour. This could be attributed to a greater presence of
reduced sugar (provided by the inulin), which would increase the reducing
sugar/aminoacid interaction for the Maillard-type reaction (Chevallier, Colonna,
Buleón, & Della Valle, 2000) which forms brown polymers or melanoidins.
Additionally, the low moisture content of inulin15 would enhance the Maillard
reaction.
The yellowness cited by the trained panel was only significantly different for the
biscuit with the highest fat replacement, HPMC30, and may have been due to
pigment dilution in the presence of the HPMC solution, although no differences
were found between the control, HPMC15 and inulin15.
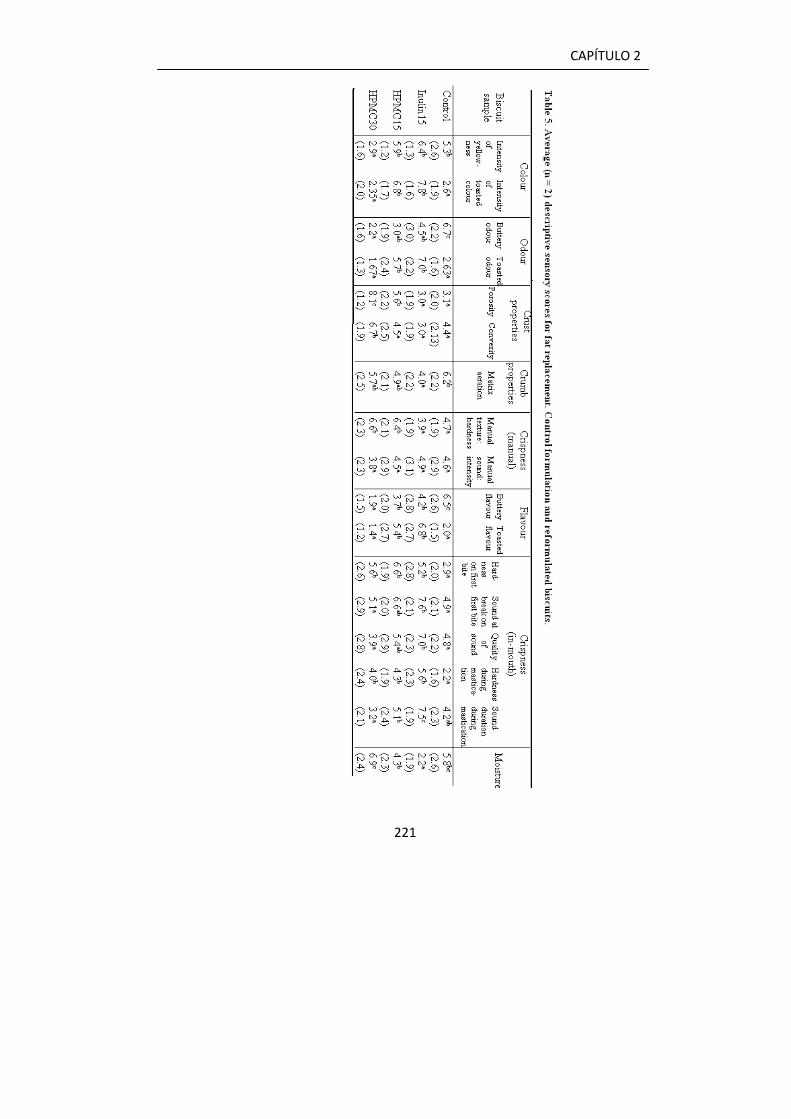
CAPÍTULO 2
221
CAPÍTULO 2
222
The perception of moisture was significantly different between the samples; the
highest was HPMC30 with no significant differences with control biscuit. Lillford
(2011) affirmed that the presence of fat in cakes gave a high sensory perception
of greater moistness. Consequently, HPMC was able to imitate this moist
mouthfeel.
Fat mimetics are less flavourful than the fat they replace because, as they
usually absorb water, they are able to carry soluble flavours but not lipid-soluble
flavour compounds (Akoh, 1988). These statements are in accordance with the
panellists' scores, where the fat replacement was found to decrease the buttery
odour and flavour, which is associated to the reduced fat content per se; this
difference was greater in the HPMC biscuits.
3.3.2. Consumer test
T3.3.2. Consumer test
The consumers assessed their overall acceptance and their liking for the
biscuits' appearance, colour, odour, texture, hardness, crispness, dry mouthfeel,
flavour, sweetness and buttery taste. Figure 2 shows the mean scores of the
four formulations for each attribute. Control, inulin15 and HPMC15 obtained
similar scores for almost all the attributes, while HPMC30 scored lower mean
values. Focusing on texture, the inulin15 scores showed a less acceptable
texture than the control and the HPMC15 biscuit but achieved good overall
acceptance (the highest score, in fact), meaning that although texture is
considered a critical attribute (Brown, Langley, & Braxton, 1998), it did not affect
the overall acceptance
Dry mouthfeel, sweetness and buttery taste obtained low liking scores in
comparison with the other attributes. The dry mouthfeel liking score for inulin15
was low; this dry mouthfeel was also reported by Forker, Zhan, & Rohm (2011)
and Conforti, Charles, & Duncan (1997) as a negative perceived attribute. In the
present study, high replacement with HPMC was not rated differently from the
control biscuit. Forker et al. (2011) stated that the impression of sweetness

CAPÍTULO 2
223
increased with fat replacement, but no significant differences between the
concentrations or type of fat replacers used (inulin or HPMC) were found in the
present study. However, the buttery taste was different for high fat replacement
(HPMC30).
On the basis of these results, consumers did not consider control, inulin15 and
HPMC15 to differ significantly, whereas HPMC30 was not acceptable.
1
2
3
4
5
6
7
Global
accep
tance
Appere
ance
Colour
Odour
Texture
Hardness
Crispin
ess
Dry mou
thfee
lFlav
or
Sweetne
ss
Butter
taste
Acc
epta
bilit
y sc
ores
Control Inulin 15 HPMC 15 HPMC 30
a a
b
b
b
b
a
ab
b
b
a
a
bbc bb
b
b
a
b
b
a
b
bb
b
a
b b
aab
ab
b
b
c
b b
a
a
b
ab
c
b
a
Figure 2. Mean consumer acceptance scores for the control biscuit and biscuits with fat replaced by Inulin and HPMC.
Previous works have also obtained acceptable scores for low fat biscuits.
Seker, Ozboy-Ozbas, Ozturk, & Koksel (2010) studied the sensory effect of
apricot kernel flour in biscuits to replace up to 40% of fat, obtaining acceptability
scores that were not significantly different from the control. Zoulias et al.
(2002b) reported a sensory limit for fat replacement in a biscuit formulation of
50% because of the decreasing overall quality. Drewnowski, Nordenstenb, &
Dwyer (1998) reported that the acceptability ratings of sensory panels are
relatively unaffected by a 25% reduction in fat. These results probably denote
that biscuit formulations are very variable (different kinds of fat, quantities of
CAPÍTULO 2
224
flour or fat replacers), so each formulation has its own characteristics and
consumer expectations.
4. Conclusions
This work is a preliminary study about the suitability of inulin and HPMC as fat
replacers in biscuits. The relationship between texture properties perceived by
humans and measured instrumentally is evaluated. Higher degrees of fat
replacement gave biscuits of unacceptable sensory-texture properties. The level
and type of fat replacer influence the texture characteristics of biscuits and their
sensory qualities. Inulin and HPMC increase the hardness and maximum sound
intensity, however, inulin cannot achieve fat replacement percentages higher
than 15%. HPMC can be used at higher fat replacement rates while keeping the
dough workable, but concentrations higher than 15% cannot be employed if
good sensory properties are to be retained.
References
Akoh C.C. (1988). Fat replacers. Food Technology, 52, 3.
Baltsavias, A., Jurgens, A., & van Vliet, T. (1999). Fracture properties of short-
dough biscuits:effect of composition. Journal of Cereal Science, 29, 235–
244.
Brown, W.E., Langley, K.R., & Braxton, D. (1998). Insight into consumer’s
assessment of biscuit texture based on mastication analysis-hardness
versus crunchiness. Journal of Texture Studies, 29, 481-497.
Castro-Prada, E.M., Primo-Martín, C., Meinders, M.B.J., Hamer, J., & Van Vliet,
T. (2009). Relationship between water activity, deformation speed, and
crispness characterization. Journal of Texture Studies, 40, 127-156.

CAPÍTULO 2
225
Conforti, F.D., Charles, S.A., & Duncan, S.E. (1997). Evaluation of a
carbohydrate-based fat replacer in a fat reduced baking powder biscuit.
Journal of Food Quality, 20, 247-256.
Chevallier, S., Colonna, P., Buleón, A., & Della Valle, G. (2000).
Physicolchemical behaviors of sugars, lipids, and gluten in short dough and
biscuit. Journal of Agriculture Food Chemistry, 48, 1322-1326.
Drewnowski, A., Nordenstenb, K., & Dwyer, C. J. (1998). Replacing sugar and
fat in cookies: Impact on product quality and preference. Food Quality and
Preference, 9, 13-20.
Duizer, L.M., Campanella, O.H., & Barnes, G.R.G..(1998). Sensory,
instrumental and acoustic characteristic of extruded snack food products.
Journal of Texture Studies, 29(4), 397-411.
Forker, A., Zhan, S., & Rohm, H. (2011). A combination of fat replacers enables
the production of fat-reduced shortdough biscuit with high-sensory quality.
Food Bioprocess Technology, DOI 10.1007/s11947-011-0536-4.
Franck, A. (2002). Technological functionality of inulin and oligofructose. British
Journal of Nutrition, 87, 287–291.
Ghotra, B.S., Dyal, S.S., & Narine, S.S. (2002) .Lipid shortenings: a review.
Food Research International, 35, 1015-1048.
Giese, J. (1996). Fats and fat replacers, balancing the health benefits. Food
Technology, 50, 76–78.
Guven, M., Yasar, K., Karaka, O.B., & Hayaloglu, A.A. (2005). The effect of
inulin as a fat replacer on the quality of set-type low-fat yogurt manufacture.
International Journal of Dairy Technology, 58, 180–184.
ISO 8589. (1988). Sensory analysis. General guidance for design of test rooms.
Standard no. 8589. Geneva, Switzerland.
CAPÍTULO 2
226
Heidenreich, S., Jaros, D., Rohm, H., Ziemsa, A. (2004). Relationship between
water activity and crispness of extruded rice crisps. Journal of Texture
Studies, 35, (6) 621-633.
King, M., Hall, J., & Cliff, M. (2001).. Evaluation of Wine competition Judge
Performance Using Principal Component Similarity Analysis. Journal of
Sensory Studies, 16, 567–581.
Krochta, J.J, & De Mulder-Johnston, C (1997). Edible and biodegradable
polymer films challenges and opportunities. Food Technology, 51, 61–74.
Laguna, L., Salvador, A., Sanz, T., & Fiszman, S.M. (2011). Performance of a
resistant starch rich ingredient in the baking and eating quality of short-
dough biscuits. LWT- Food Science and Technology 44, 737-746.
Laguna, L., Varela, P., Salvador, A., Sanz, T., & Fiszman, S.M. (2011).
Balancing texture and other sensory features in reduced fat short-dough
biscuits. Journal of Texture Studies, doi:10.1111/j.1745-4603.2011.00333.x.
Lawless, H. & Heymann, H. (1998). Sensory Evaluation of Food: Principles and
Practices. Chapman & Hall,NewYork, NY.
Lillford, P.J. (2011). The importance of food microstructure in fracture physics
and texture perception. Journal of Texture Studies, 42 (2), 130-136.
Lindsay, R.D. (2000). Aditivos alimentarios, In: Química de los
alimentos, 2ª Edición, Owen R.Fennema, Ed. Acribia pp 949.
Luyten, H., Plijter, J.J., & van Vliet, T. (2004). Crispy/crunchy crust of cellular
solid foods: a literature review with discussion. Journal of Texture Studies,
35 (5), 445-492.
Mariotti M,. Pagani M. A, Lucisano M. (2012).The role of buckwheat and HPMC
on the breadmaking properties of some commercial gluten-free bread
mixtures. LWT-Food Science and Technology doi:10.1016/
j.lwt.2012.03.001
CAPÍTULO 2
227
Ney, K.H. (1988). Sensogammen, eine methodishce Erweiterung der
Aromagrame. Gordian, 88 (1), 19.
Nonaka, H.H. (1997). Plant carbohydrate-derived products as fat replacers and
calorie reducers. Cereal Foods World, 42(5), 376-378.
O'Brien, C.M., Mueller, A., Scannell, A.G.M, & Arendt, E.K. (2003). Evaluation
of the effects of fat replacers on the quality of wheat bread. Journal of Food
Engineering, 56, 265–267.
Pareyt, B. & Delcour, J.A. (2008). The role of wheat flour constituents, sugar,
and fat in low moisture cereal based products: a review on sugar-snap
cookies. Critical Review in Food Science and Nutrition, 48, 824-839.
Park, H. J. (1999). Development of advanced edible coatings for fruits. Trends
in Food Science and Technology, 10, 254–260.
Peleg, M. (1994). A mathematical model for crunchiness/crispness loss in
breakfast cereals. Journal of Texture Studies, 25, 403-410.
Primo-Martín, C., Sözer, N., Hamer, R.J. & van Vliet, T. (2009). Effect of water
activity on fracture and acoustic characteristics of a crust model. Journal of
Food Engineering, 90, 277–284.
Roberfroid, M. (2005). Inulin-Type Fructans. Functional Food Ingredients. Boca
Raton: CRC Press.
Rößle, C., Ktenioudaki, A., & Gallagher, E. (2011). Inulin and oligofructose as
at and sugar substitutes in quick breads (scones): a mixture design
approach. European Food Research and Technology, 233, 167-181.
Roudaut, G., Dacremont, C., Pamies, B.V., Colas, B., & Meste, M.L. (2002).
Crispness: a critical review on sensory and material science approaches.
Food Science and Technology, 13, 217–227.
Sabanis, D., & Tzia, C. (2011). Effect of hydrocolloids on selected properties of
gluten-free dough and bread. Food Science and Technology International,
17, (4), 279-291.
CAPÍTULO 2
228
Seker, I.T., Ozboy-Ozbas, O., Ozturk, S., & Koksel, H. (2010). Utilization of
Apricot Kernel Flour as fat replacer in cookies. Journal of Food Processing
and Preservation, 34, 15-26.
Stauffer, C. E. (1998). Fats and oils in bakery products. Cereal Foods World,
43, 120–126.
Stone, H., Sidel J., Oliver, S., Woolsey, A., & Singleon R.C. (1974). Sensory
evaluation by quantitative descriptive analysis. Food Technology, 28, (11),
24-34.
Stone, H., & Sidel, J. (1998). Quantitative descriptive analysis developments,
applications, and the future. Food Technology, 52, (8), 48-52.
Stone, H., & Sidel, J. (2003). Descriptive analysis. In “Encyclopedia of Food
Science”, 2nd ed., pp. 5152-5161. Academic Press, London.
Stone, H. & Sidel, J.l. (2004). Quantitative Descriptive Analysis (The QDA
Method). Sensory Evaluation Practices. 3rd Ed. Elsevier Academic Press,
San Diego, CA. pp-215-235.
Sudha, M.L., Srivastava, A.K., Vetrimani, R., & Leelavathi, K. (2007). Fat
replacement in soft dough biscuits: Its implications on dough rheology and
biscuit quality. Journal of Food Engineering, 80, 922–930.
USDA. US Department of Agriculture/US Department of Health and Human
Services. Nutricion and Your Health: Dietary Guidelines for Americans.
Whashington, DC: US Government Printing Office; 2000. Homes and
Garden Bulletin 232.
Van Vliet, T., Visser, J. E., & Luyten, H. (2007). On the mechanism by which oil
uptake decreases crispy/crunchy behaviour of fried products. Food
Research International, 40, 1122–1128.
Villalobos, R., Hernandez-Munoz, P.,& Chiralt, A. (2006). Effect of surfactants
on water sorption and barrier properties of hydroxypropyl methylcellulose
films. Food Hydrocolloids, 20, (4), 502-509.
CAPÍTULO 2
229
Vincent, J.F.V., Jeronimidis, G., Khan, A.A., & Luyten, H. (1991). The wedge
fracture test a new method for measurement of food texture .Journal of
Texture Studies 22, (1), 45–57.
Zbikowska, A. & Rutkowska, J. (2008). Possibility of partial replacement of fat
by inuline in cookies in order to decrease their caloric value. Polish Journal
of Food and Nutrition Sciences, 58 (1), 113-117.
Zoulias, E.I., Oreopoulou. V., & Tzia, C. (2002a). Textural properties of low-fat
cookies containing carbohydrate-or protein-based fat replacers. Journal of
Food Engineering, 55, 337–342.
Zoulias, E.I., Oreopoulou, V., & Kounalaki, E. (2002b). Effect of fat and sugar
replacement on cookie properties Journal of the Science of Food and
Agriculture, 82, 1637–1644.


CAPÍTULO 3

INULIN AND ERYTHRITOL AS SUCROSE REPLACERS IN SHORT DOUGH COOKIES. SENSORY, FRACTURE AND ACOUSTIC PROPERTIES
Laura Laguna, Cristina Primo-Martín, Ana Salvador and Teresa Sanz

CAPÍTULO 3
235
Abstract
The effect of sucrose replacement by erythritol and inulin was studied in short
dough cookies using instrumental and sensory analysis. Two levels of
replacement were used (25 and 50% of total sucrose content). Descriptive
sensory analysis showed that the sucrose replacement affects visual and
texture cookies characteristics, being the differences perceived by mouth
greater than by hand. In general, sucrose substitutes produced a less crispy
cookie and lower consumer acceptability, with the exception of 25% sucrose
replacement by inulin. Matrix aeration attributes such as open and crumbly
obtained by trained panel were important properties, and correlated positively
with consumer acceptance and negatively with maximum force at break
(hardness). Inulin cookies sensory properties were more similar to the control
than the erythritol cookies. Also, consumer overall acceptance decreased
significantly with sucrose replacement by erythritol. The analysis of texture and
sound revealed that inulin cookies were softer while erythritol cookies were
harder in comparison with control cookies; despite this difference, inulin cookies
had similar sound characteristics to erythritol cookies.
Keywords: cookie, sucrose replace, inulin, erythritol, texture, sound.

CAPÍTULO 3
236
1. Introduction
Sucrose is the main sugar utilised in the cookie industry. High sugar levels are
undesirable for health reasons such as dental problems, obesity and type II-
diabetes (Pareyt and others 2009). Nowadays, consumers are concerned about
health (Berasategi 2010) and they are looking for non-caloric and healthy
products (Baltasavias and Jurgens 1997). For this reason the interest in
research about reduction of sucrose content in cookies without reducing
sensory quality has increased (Drewnowski 1998).
In general, sugar affects flavor, dimensions, color, hardness, surface
characteristics (Gallagher and others 2003) and crispness (Kulp and others
1991). The absence of sucrose in cookies increased the gluten network
providing elasticity to the dough and the cookies, which is an undesirable effect
(Laguna and others, 2012).
The effect of sucrose replacement in cookies has been studied by many
authors. Olinger and Velasco (1996) replaced sugar in baked products such as
cakes and cookies with polyols. Lactitol cookie was the closest sample to the
control cookie from a sensorial point of view. Sai Manohar and Haridas Rao
(1997) employed reducing sugars as sucrose replacers in cookies and studied
their rheological characteristics. They concluded that liquid glucose and invert
syrup produced greater changes in adhesiveness and stickiness, while high
fructose corn syrup had a greater effect on the color of cookies. Zoulias and
others (2000) studied also the effect of sugar replacement by different polyols,
fructose, and acesulfame-K in cookies that contain polydextrose as fat replacer.
They found that cookies prepared with maltitol and lactitol were closed to
control cookie. On the other hand, xylitol affected negatively the flavor, fructose
provided a bitter aftertaste and mannitol was not suitable as sucrose replacer
for cookies. In general, all the polyol-containing cookies were less sweet, than
acesulfame-K-cookies, which improved the perceived flavor and general
acceptance. Gallagher and others (2003) used an oligosaccharide to replace
20-30% of the sugar in cookies. They obtained softer eating cookies and
CAPÍTULO 3
237
different surface color attributes. Kweon and others (2009) studied the
functionality of xylose, glucose, fructose and sucrose in the cookie, concluding
that whereas formulations with sucrose optimize the flour performance for the
cookie, the formulation with xylose exaggerates the worst aspect of cookie flour
functionality. Recently, Pareyt and others (2011) used arabinoxylan
oligosaccharides as potential sucrose replacers in sugar-snap cookies to
replace up to 30% sucrose. They obtained cookies with a diameter and height
comparable to their control sample; however, the color of the cookies was
darker in comparison with the control.
Inulin, made from the chicory plant, is a fructosyl-fructose-linked oligomeric
carbohydrate with a degree of polymerization ≥10 (De Vries 2003). It is
moderately water soluble and in water can form a short, spreadable gel network
(Zahn and others 2010). Inulin possesses the advantage that may act as dietary
fibre with prebiotic effects (Meyer et al. 2011). Inulin has been used as a
sucrose replacer in low-sugar milk chocolate with prebiotic properties
(Farzanmehr and Abbasi 2009). There are no studies about the employ of inulin
as sucrose replacer in cookies.
Erythritol is a 4-carbon sugar alcohol, white, anhydrous, non-hygroscopic,
cristalling substance with a mild sweetness and an appearance similar to
sucrose (Perko and DeCock 2008). Erythirtol is not caloric and due to its small
molecular size is absorbed in the small intestine and no fermented as other
sugars alcohols having high digestive tolerance (Perko et al. 2008). Erythritol
has been used as a sucrose replacer in bakery products such as chiffon cake
(Lin and others 2003) or Danish cookies (Lin and others 2010) obtaining good
stability during baking, increasing cookie lightness, and giving acceptable
hedonic scores up to 50% sucrose replacement.
Texture is one of the most important sensory properties determining the quality
of cookies. Texture is a sensory and functional manifestation of the structural,
mechanical and surface properties of foods, detected through the senses of
sight, hearing, touch, and kinesthetics. Only human beings can perceive and
CAPÍTULO 3
238
describe texture; instruments are just able to measure certain physical
parameters that can be correlated to the sensory parameters (Szczesniak
2002).
Up to now, none of the previous studies in sucrose reduction in cookies has
focused on the change of sensory and physical properties. As far as texture is
one of the main cookie characteristic determining quality and consumer
acceptability, a complete sensory and instrumental texture study in sucrose
reduced cookies became of special interest.
Inulin and erythritol may be considered as sucrose substitutes with
advantageous properties. Inulin possesses the advantage that may act as
dietary fibre with prebiotic effects (Meyer et al. 2011) and erythritol has better
digestive tolerance than other polyols.
The hypothesis of this work was to understand the functionality and to evaluate
the suitability of inulin and erythritol as partial sucrose replacers in cookies
through the study of the instrumental and sensory properties of texture. Sensory
analysis, including hedonic and descriptive tests were carried out and their
relationship with instrumental properties evaluated.
Material and Methods
Ingredients
The cookie formulations used are shown in Table 1. Five samples were tested:
a typical short dough composition as the control or full fat cookie (control), and
two sucrose replacers (erythritol and inulin) at two different sucrose
replacement levels of 25% and 50% were used. The cookies were namely 25
SE (25% of sucrose replacement by erythritol), 50SE (50% of sucrose
replacement by erythritol), 25SI (25% of sucrose replacement by inulin) and
50SI (50% of sucrose replacement by inulin).
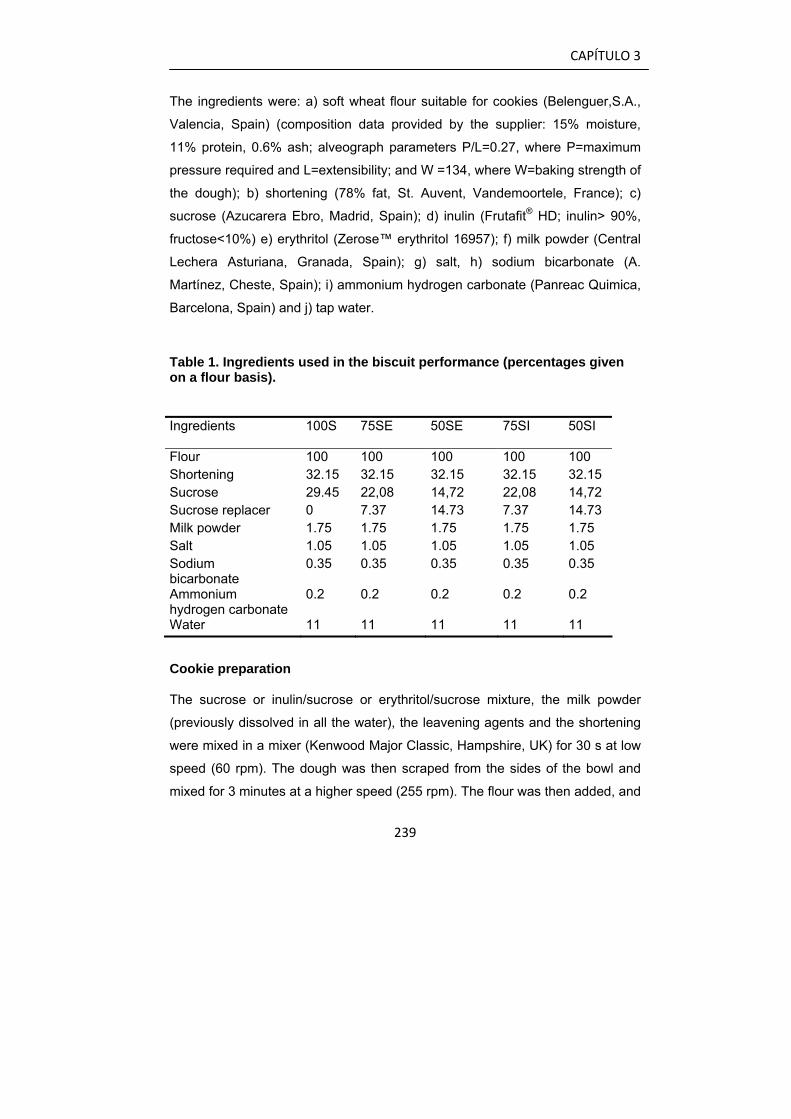
CAPÍTULO 3
239
The ingredients were: a) soft wheat flour suitable for cookies (Belenguer,S.A.,
Valencia, Spain) (composition data provided by the supplier: 15% moisture,
11% protein, 0.6% ash; alveograph parameters P/L=0.27, where P=maximum
pressure required and L=extensibility; and W =134, where W=baking strength of
the dough); b) shortening (78% fat, St. Auvent, Vandemoortele, France); c)
sucrose (Azucarera Ebro, Madrid, Spain); d) inulin (Frutafit® HD; inulin> 90%,
fructose<10%) e) erythritol (Zerose™ erythritol 16957); f) milk powder (Central
Lechera Asturiana, Granada, Spain); g) salt, h) sodium bicarbonate (A.
Martínez, Cheste, Spain); i) ammonium hydrogen carbonate (Panreac Quimica,
Barcelona, Spain) and j) tap water.
Table 1. Ingredients used in the biscuit performance (percentages given on a flour basis).
Ingredients 100S 75SE 50SE 75SI 50SI
Flour 100 100 100 100 100 Shortening 32.15 32.15 32.15 32.15 32.15 Sucrose 29.45 22,08 14,72 22,08 14,72 Sucrose replacer 0 7.37 14.73 7.37 14.73 Milk powder 1.75 1.75 1.75 1.75 1.75 Salt 1.05 1.05 1.05 1.05 1.05 Sodium bicarbonate
0.35 0.35 0.35 0.35 0.35
Ammonium hydrogen carbonate
0.2 0.2 0.2 0.2 0.2
Water 11 11 11 11 11
Cookie preparation
The sucrose or inulin/sucrose or erythritol/sucrose mixture, the milk powder
(previously dissolved in all the water), the leavening agents and the shortening
were mixed in a mixer (Kenwood Major Classic, Hampshire, UK) for 30 s at low
speed (60 rpm). The dough was then scraped from the sides of the bowl and
mixed for 3 minutes at a higher speed (255 rpm). The flour was then added, and
CAPÍTULO 3
240
mixed for 1 minute at low speed (60 rpm). After a 10 min resting period in a
plastic bag, the dough was sheeted in a laminating machine (Parber, Zamudio,
Spain) to 10 mm and cut into rectangular pieces measuring 50 x 30 x 10mm
(length x width x height). Twenty-five pieces were placed on a perforated tray.
The cookies were baked in a conventional oven for 4 min at 175 °C. The trays
were then turned 180°, bringing the side that had been at the back to the front
of the oven to ensure even cooking, and baked for a further 4.5 min at the same
temperature. The oven and the oven trays were always the same, the trays
were placed at the same level in the oven each time, and the number of cookies
baked was always the same. After reaching ambient temperature, the cookies
were packed and stored in heat-sealed metalized polypropylene bags. The
cookie samples were evaluated on the following day in all cases.
Sensory Analysis
Testing was carried out in a sensory laboratory equipped with individual booths
(ISO 8589, 1988). Data acquisition was performed using Compusense five
release 5.0 software (Compusense Inc., Guelph, Ontario, Canada).
Descriptive analysis
Selection of terms and panel training - A panel of nine assessors, aged between
25 and 45 years and skilled in quantitative descriptive analysis, was trained to
select the descriptors using the checklist method (Lawless and Heyman 1998).
The assessors were first given a brief outline of the procedures and a list of
attributes and representative samples; they were then asked to choose and
write down the most appropriate attributes to describe all the sensory properties
of the cookies or to suggest new ones. The panel leader collected and wrote all
the attributes on a board and the panel discussed the appropriateness of the
selected attributes, their definitions and preliminary discussions on how to
assess the products. At the end of this session a consensus on the list of
attributes was reached. This procedure was proposed by Stone and Sidel
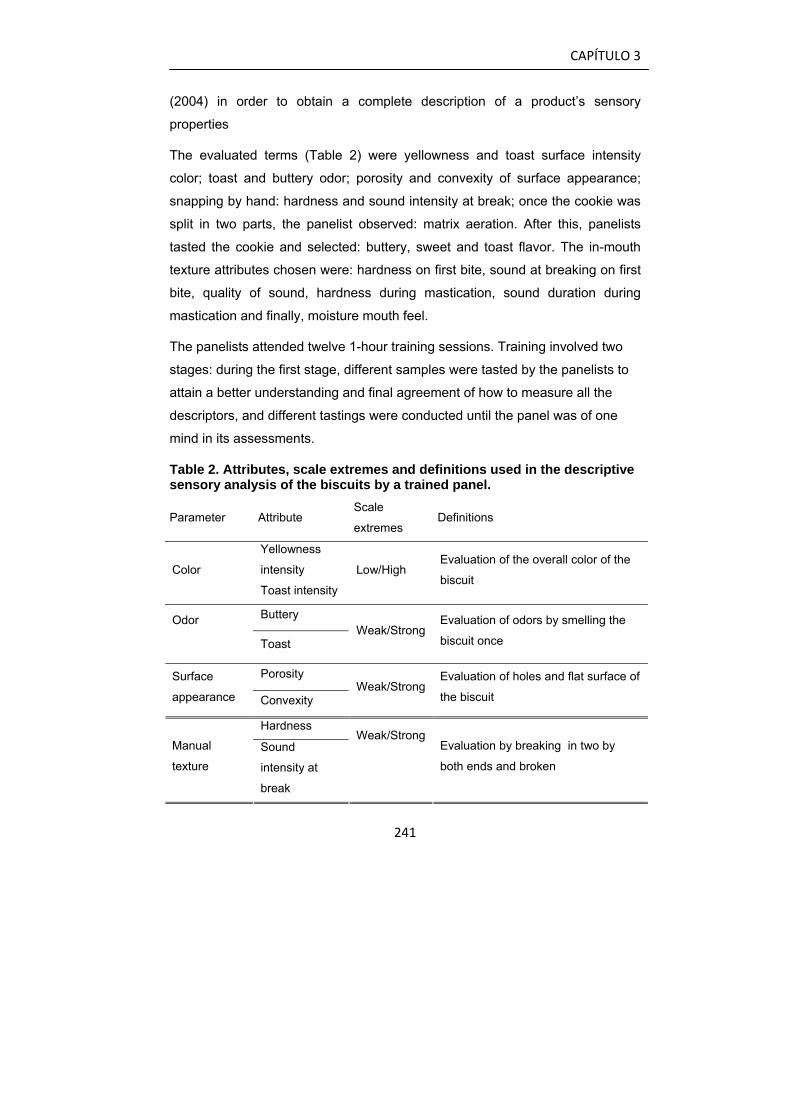
CAPÍTULO 3
241
(2004) in order to obtain a complete description of a product’s sensory
properties
The evaluated terms (Table 2) were yellowness and toast surface intensity
color; toast and buttery odor; porosity and convexity of surface appearance;
snapping by hand: hardness and sound intensity at break; once the cookie was
split in two parts, the panelist observed: matrix aeration. After this, panelists
tasted the cookie and selected: buttery, sweet and toast flavor. The in-mouth
texture attributes chosen were: hardness on first bite, sound at breaking on first
bite, quality of sound, hardness during mastication, sound duration during
mastication and finally, moisture mouth feel.
The panelists attended twelve 1-hour training sessions. Training involved two
stages: during the first stage, different samples were tasted by the panelists to
attain a better understanding and final agreement of how to measure all the
descriptors, and different tastings were conducted until the panel was of one
mind in its assessments.
Table 2. Attributes, scale extremes and definitions used in the descriptive sensory analysis of the biscuits by a trained panel.
Parameter Attribute Scale
extremes Definitions
Color
Yellowness
intensity
Toast intensity
Low/High Evaluation of the overall color of the
biscuit
Buttery Odor
Toast Weak/Strong
Evaluation of odors by smelling the
biscuit once
Porosity Surface
appearance Convexity Weak/Strong
Evaluation of holes and flat surface of
the biscuit
Hardness
Manual
texture Sound
intensity at
break
Weak/Strong
Evaluation by breaking in two by
both ends and broken
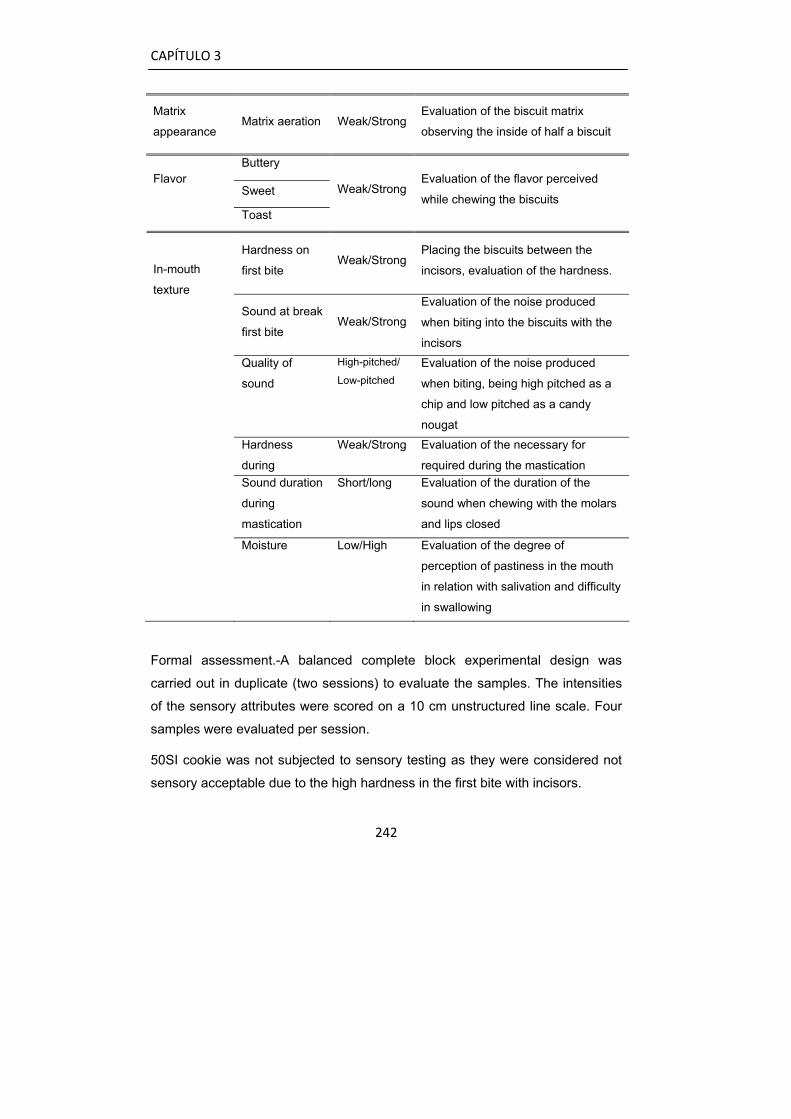
CAPÍTULO 3
242
Matrix
appearance Matrix aeration Weak/Strong
Evaluation of the biscuit matrix
observing the inside of half a biscuit
Buttery
Sweet Flavor
Toast
Weak/Strong Evaluation of the flavor perceived
while chewing the biscuits
Hardness on
first bite Weak/Strong
Placing the biscuits between the
incisors, evaluation of the hardness. In-mouth
texture
Sound at break
first bite Weak/Strong
Evaluation of the noise produced
when biting into the biscuits with the
incisors Quality of
sound
High-pitched/
Low-pitched
Evaluation of the noise produced
when biting, being high pitched as a
chip and low pitched as a candy
nougat
Hardness
during
Weak/Strong Evaluation of the necessary for
required during the mastication Sound duration
during
mastication
Short/long Evaluation of the duration of the
sound when chewing with the molars
and lips closed
Moisture Low/High Evaluation of the degree of
perception of pastiness in the mouth
in relation with salivation and difficulty
in swallowing
Formal assessment.-A balanced complete block experimental design was
carried out in duplicate (two sessions) to evaluate the samples. The intensities
of the sensory attributes were scored on a 10 cm unstructured line scale. Four
samples were evaluated per session.
50SI cookie was not subjected to sensory testing as they were considered not
sensory acceptable due to the high hardness in the first bite with incisors.
CAPÍTULO 3
243
In each session, the samples were randomly selected from each baked batch
and served in random order, each on a separate plastic tray identified with a
random three-digit code. The panelists were instructed to rinse their mouths
with water between sample evaluations.
Consumer test
A total of 100 consumers (untrained), aged from 18 to 65 years, who were
frequent consumers of short dough cookies took part in the study. The
consumers evaluated four samples in one session. The cookies were coded
with random three-digit numbers; sample presentation followed a balanced
complete block experimental design. Consumer acceptance testing was carried
out using nine-point hedonic scales (1 = dislike extremely and 9 = like
extremely). The consumers scored their liking for the ‘overall acceptance’,
‘appearance’, ‘color’, ‘odor’, ‘texture’, ‘hardness’, ‘crispness’, ‘dry mouthfeel’,
‘taste’, ‘sweetness’ and ’butter taste’ of each sample.
Moisture content and water activity
The moisture content of the cookies was determined in four replicates of each
formulation according to the Approved Method 44-40.01 (AACC International
2009) placing the samples in an oven at 105°C in order to achieve constant
weight. Water activity (aw) was determined in four replicates of each formulation
as the relative humidity of the air in equilibrium with the outer part of the
samples in a sealed measuring chamber using a chilled-mirror dew point
technique at 22ºC (Aqua Lab Series 3, Decagon Devices, Pullman WA, U.S.A.).
Simultaneous fracture and sound emission of the cookies
Acoustic emission of the cookies was measured during fracturing using a
Texture Analyzer with a load cell of 30Kg (TA-XT Plus, Stable Micro Systems
Ltd., Surrey, UK) inside an isolated acoustic chamber with a prepolarized free-
field one-half-in” microphone in combination with a Deltatron preamplifier
microphone (Brüel Kjær, Nærum, Denmark) as described by Primo-Martín and
CAPÍTULO 3
244
others (2009). The cookie was placed on a flat surface with a slot aperture
(width 4 mm, length 60 mm). Test pieces were crushed between a wedge (30°
cutting angle, 32 mm wide) and the surface. The wedge shaped probe, and a
deformation speed of 20 mm/s (and 65 kHz data sampling rate) were chosen to
simulate biting with the front teeth (Vincent 1998). The distance of the
microphone to the sample was 7 cm. Extensive analysis of the sound was
performed using MatLab (Matworks 7.0.4) as described by Castro-Prada and
others (2009). Emitted sound was characterized in terms of the number of
sound events and mean intensity (dB) which are related to crispness perception
(Castro-Prada and others 2009). From the force curves, represented in x-axis
with time and y-axis as Sound Pressure Level (SPL), the number of force drops,
the slope at rise first event (N/s), and the maximum force (N) were studied.
Statistical analysis
Analysis of variance (one way-ANOVA) was applied to texture, sound and
consumer acceptability to study the effect of the formulation; least significant
differences were calculated by the Tukey’s test and the significance at p < 0.05
was determined.
Two way analysis of variance (ANOVA) was applied to each descriptor to check
panel performance, considering the assessors, the samples and their
interaction as factors.
Pearson correlation was calculated to correlate the sensory data with the
instrumental data.
All the statistical analyses were performed using XLSTAT 2009.4.03 statistical
software (Microsoft, Mountain View, CA).

CAPÍTULO 3
245
Results and Discussion
Quantitative descriptive analysis
The scores for the four samples evaluated by the trained panel are presented in
Figure 1. Among all the attributes studied, ten were statistically different: toast
color intensity, surface porosity, manual hardness at break, matrix aeration,
buttery and sweet flavor, hardness at first bite, sound intensity in mouth at break
in the first bite, sound duration during mastication and moisture mouthfeel.
The highest toast intensity color was for the 50SE cookies, followed by the
control cookies, although no significant differences between these two samples
were found.
Figure 1. Average (n = 2) descriptive sensory scores for sucrose replacement. Control formulation compared with erythritol and inulin replacement.
In short dough recipes, the water is insufficient to dissolve all the added sugars,
so crystal sugars are found, being the size of the crystal an important quality
CAPÍTULO 3
246
aspect (Manley 2000). In this study crystal sugars were observed on the cookie
surface. The panelists defined the cookie porosity as the holes and spots
formed due to crystal sugars found in the cookie surface. The highest score for
porosity was given to the erythritol cookies (50SE) obtaining an increase in
porosity with the sucrose replacement. The “porosity” found by the panelists in
the erythritol sample may be explained due to the fact that erythritol could not
be dissolved in the water employed in this cookie formula and remained as
intact granules on the cookie surface. So higher concentrations of erythritol
implied higher number of holes or spots presented on the cookie surface. Also,
the erythritol cookie was significantly different from inulin and control cookie,
whose surfaces were evaluated as flat.
Manual hardness at break was also one of the differentiate attributes. The
control and 25SI cookies were the hardest samples, followed by the 50SE and
25SE.
In the matrix aeration two groups were found, control-25SI and 50SE-25SE
cookies. Matrix aeration refers to the entrap air in the cookie matrix. It seems
that erythritol did not allow air to be entrapped in the dough, whilst the control
and inulin did.
The sweet flavor and butter flavor were marked by the trained panel as
significantly different. Both flavors were described as significantly higher for the
control sample compared to the sucrose replaced samples. It is known that
sweetness is determined by the sugar used and both sucrose replacers used
were less sweet. The erythritol is 60-70% less sweet than sucrose (Perko and
DeCock 2008) and the inulin used is mainly composed by long chained
polymers of fructose having less sweetness (approximately 10% of the
sweetness of sucrose) (Orafti 1996). No changes in the fat of the cookie formula
were made so, it seems that sucrose increased the butter taste, as the control
cookie was given the most buttery taste, followed by 25% of sucrose
replacement (in both replacers: inulin and erythritol) and finally the least buttery
taste was the 50% erythritol cookie.
CAPÍTULO 3
247
The hardness on first bite was in relation with manual hardness, but higher
differences can be observed between samples in-mouth, than by hand.
Panelists scored the control cookie as the hardest while sucrose replacement
cookies were perceived as softer, without significant differences among them.
However, theoretically, and as it will be discussed further on in this work, the
sucrose replacement enhanced gluten cross-linking increasing the instrumental
cookie breaking strength (Pareyt and others 2009). It was noticed that panelists
perceived the crust (top layer of the cookie) as harder in the presence of
sucrose. The moisture mouthfeel was found to be higher in the inulin/sucrose
and erythritol/sucrose cookies than the control; this fact probably contributed to
the hardness perceived in the control sample.
The sound intensity at break in the first bite and the sound duration during
mastication was strong for the control and inulin cookies, and weak for the
erythritol cookies. There will be further discussion about this subject in the next
section.
The results from the descriptive analysis tests provide a complete sensory
description of the effect of sucrose replacement in cookies, and the basis for
determining those sensory attributes that are important to acceptance.
Consumer test
Apart from being nutritious, the food product sensory properties should be
acceptable by consumer to guaranty success (Scholtz and Bosman 2005).
Sensory consumer tests are essential to evaluate food acceptability. The mean
consumer scores for global acceptance and consumer liking of appearance,
color, odor, texture, hardness, crispness, dry mouth feel, taste, sweetness and
butter taste for the control sample and sucrose replacement cookies are
presented in Figure 2.
In all the attributes scored, the acceptability of the 25SI cookie did not differ
from the control cookie. The opposite behavior occurred for 50SE which was
different in almost all the attributes except in hardness and dry mouthfeel.
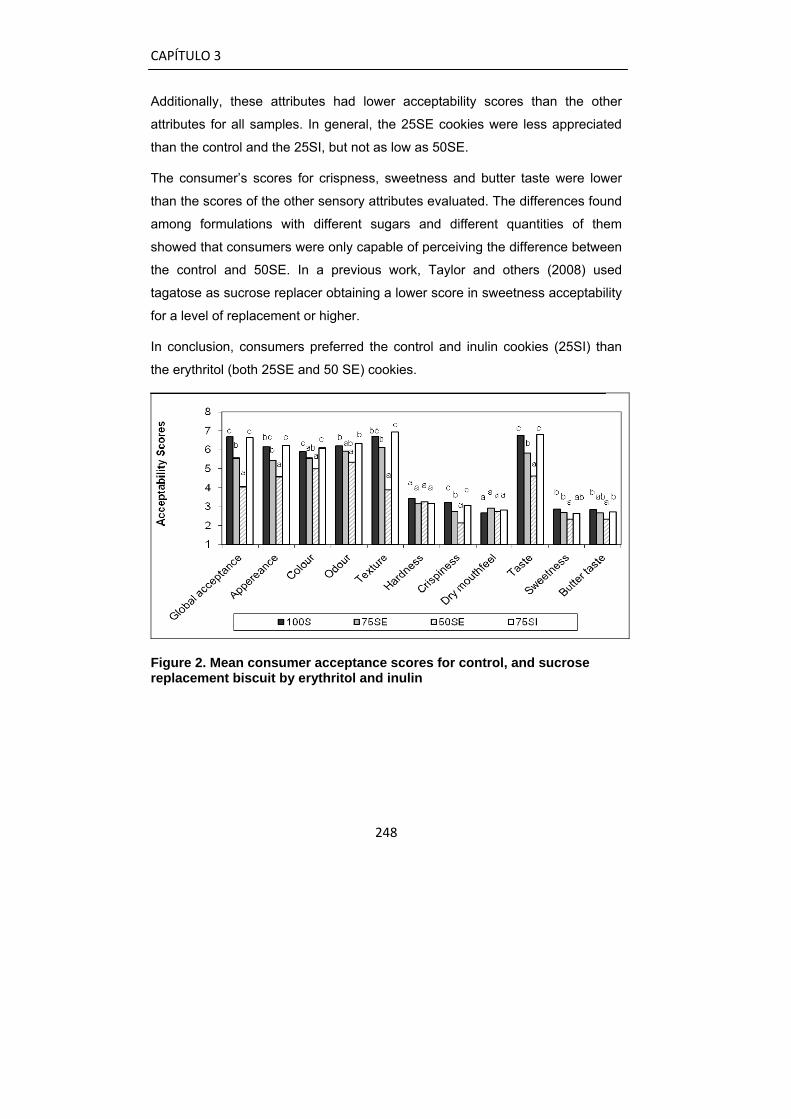
CAPÍTULO 3
248
Additionally, these attributes had lower acceptability scores than the other
attributes for all samples. In general, the 25SE cookies were less appreciated
than the control and the 25SI, but not as low as 50SE.
The consumer’s scores for crispness, sweetness and butter taste were lower
than the scores of the other sensory attributes evaluated. The differences found
among formulations with different sugars and different quantities of them
showed that consumers were only capable of perceiving the difference between
the control and 50SE. In a previous work, Taylor and others (2008) used
tagatose as sucrose replacer obtaining a lower score in sweetness acceptability
for a level of replacement or higher.
In conclusion, consumers preferred the control and inulin cookies (25SI) than
the erythritol (both 25SE and 50 SE) cookies.
Figure 2. Mean consumer acceptance scores for control, and sucrose replacement biscuit by erythritol and inulin
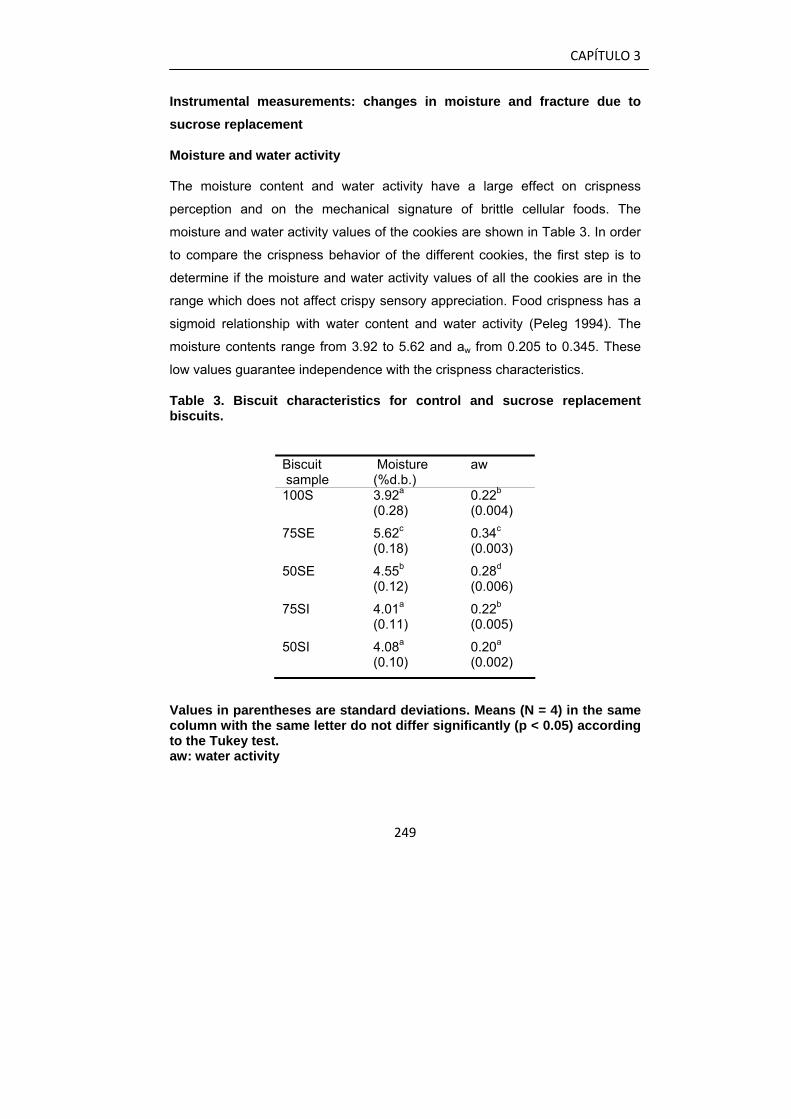
CAPÍTULO 3
249
Instrumental measurements: changes in moisture and fracture due to sucrose replacement
Moisture and water activity
The moisture content and water activity have a large effect on crispness
perception and on the mechanical signature of brittle cellular foods. The
moisture and water activity values of the cookies are shown in Table 3. In order
to compare the crispness behavior of the different cookies, the first step is to
determine if the moisture and water activity values of all the cookies are in the
range which does not affect crispy sensory appreciation. Food crispness has a
sigmoid relationship with water content and water activity (Peleg 1994). The
moisture contents range from 3.92 to 5.62 and aw from 0.205 to 0.345. These
low values guarantee independence with the crispness characteristics.
Table 3. Biscuit characteristics for control and sucrose replacement biscuits.
Biscuit sample
Moisture (%d.b.)
aw
100S 3.92a (0.28)
0.22b (0.004)
75SE 5.62c (0.18)
0.34c (0.003)
50SE 4.55b (0.12)
0.28d (0.006)
75SI 4.01a (0.11)
0.22b (0.005)
50SI 4.08a (0.10)
0.20a (0.002)
Values in parentheses are standard deviations. Means (N = 4) in the same column with the same letter do not differ significantly (p < 0.05) according to the Tukey test. aw: water activity
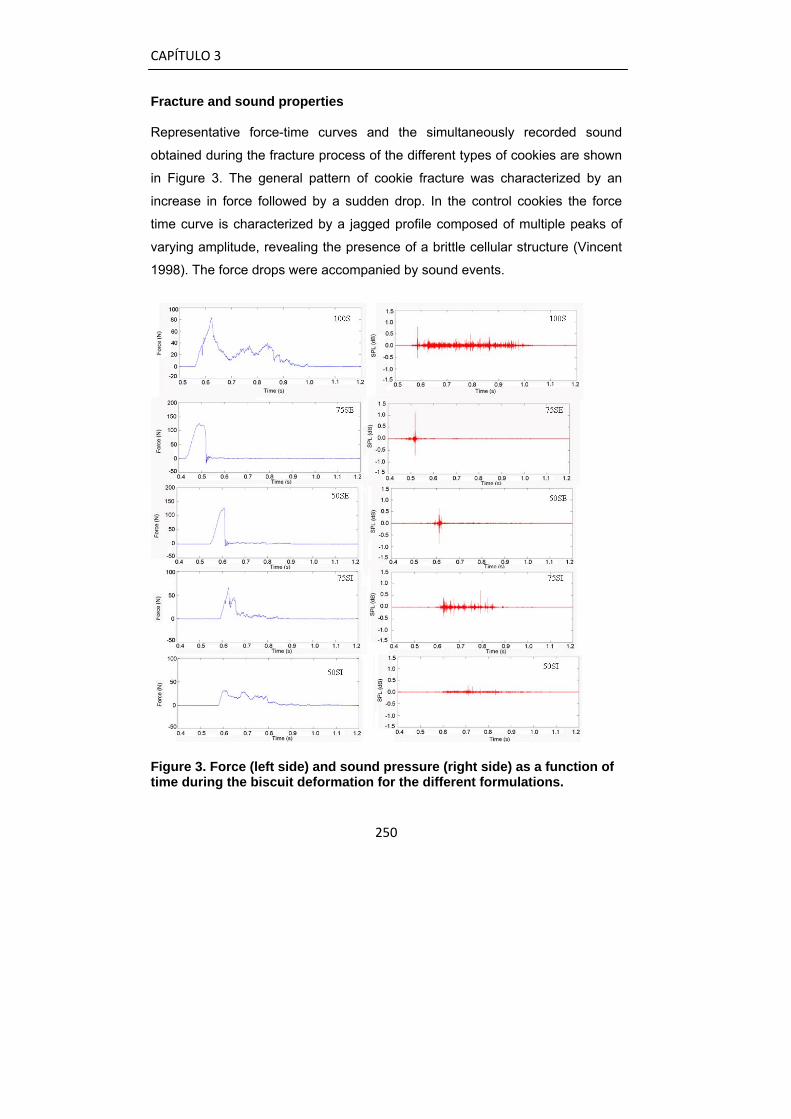
CAPÍTULO 3
250
Fracture and sound properties
Representative force-time curves and the simultaneously recorded sound
obtained during the fracture process of the different types of cookies are shown
in Figure 3. The general pattern of cookie fracture was characterized by an
increase in force followed by a sudden drop. In the control cookies the force
time curve is characterized by a jagged profile composed of multiple peaks of
varying amplitude, revealing the presence of a brittle cellular structure (Vincent
1998). The force drops were accompanied by sound events.
Figure 3. Force (left side) and sound pressure (right side) as a function of time during the biscuit deformation for the different formulations.
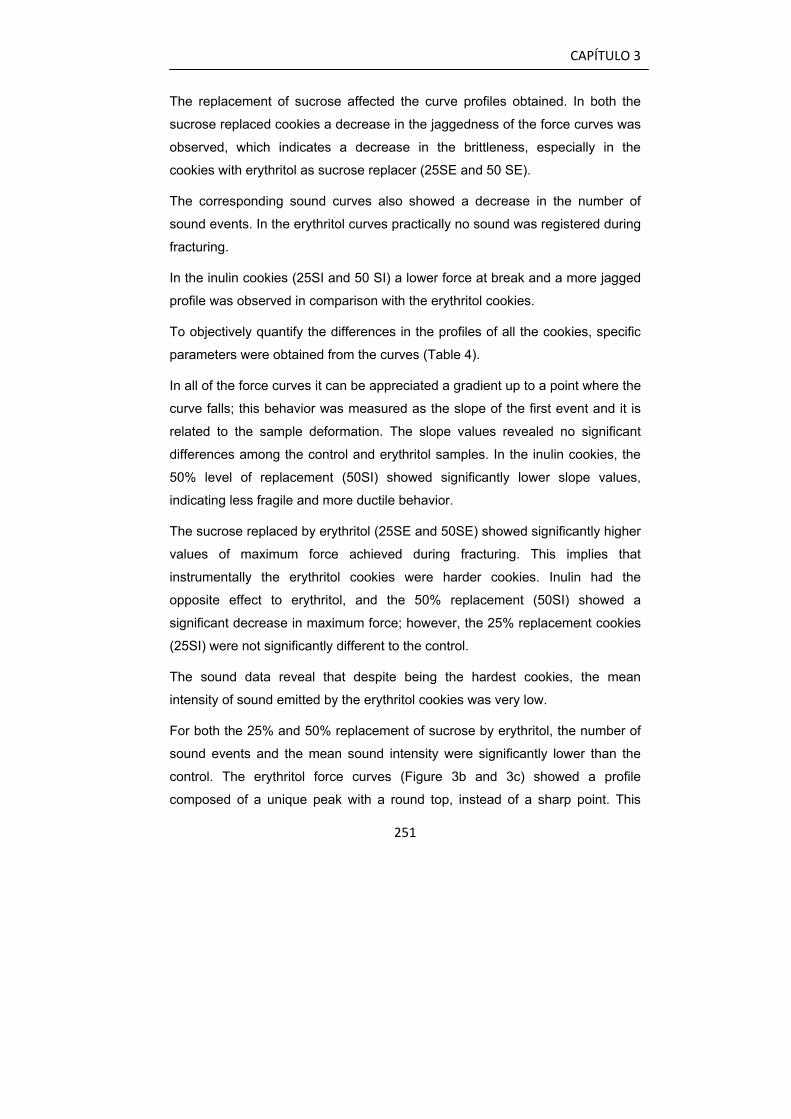
CAPÍTULO 3
251
The replacement of sucrose affected the curve profiles obtained. In both the
sucrose replaced cookies a decrease in the jaggedness of the force curves was
observed, which indicates a decrease in the brittleness, especially in the
cookies with erythritol as sucrose replacer (25SE and 50 SE).
The corresponding sound curves also showed a decrease in the number of
sound events. In the erythritol curves practically no sound was registered during
fracturing.
In the inulin cookies (25SI and 50 SI) a lower force at break and a more jagged
profile was observed in comparison with the erythritol cookies.
To objectively quantify the differences in the profiles of all the cookies, specific
parameters were obtained from the curves (Table 4).
In all of the force curves it can be appreciated a gradient up to a point where the
curve falls; this behavior was measured as the slope of the first event and it is
related to the sample deformation. The slope values revealed no significant
differences among the control and erythritol samples. In the inulin cookies, the
50% level of replacement (50SI) showed significantly lower slope values,
indicating less fragile and more ductile behavior.
The sucrose replaced by erythritol (25SE and 50SE) showed significantly higher
values of maximum force achieved during fracturing. This implies that
instrumentally the erythritol cookies were harder cookies. Inulin had the
opposite effect to erythritol, and the 50% replacement (50SI) showed a
significant decrease in maximum force; however, the 25% replacement cookies
(25SI) were not significantly different to the control.
The sound data reveal that despite being the hardest cookies, the mean
intensity of sound emitted by the erythritol cookies was very low.
For both the 25% and 50% replacement of sucrose by erythritol, the number of
sound events and the mean sound intensity were significantly lower than the
control. The erythritol force curves (Figure 3b and 3c) showed a profile
composed of a unique peak with a round top, instead of a sharp point. This
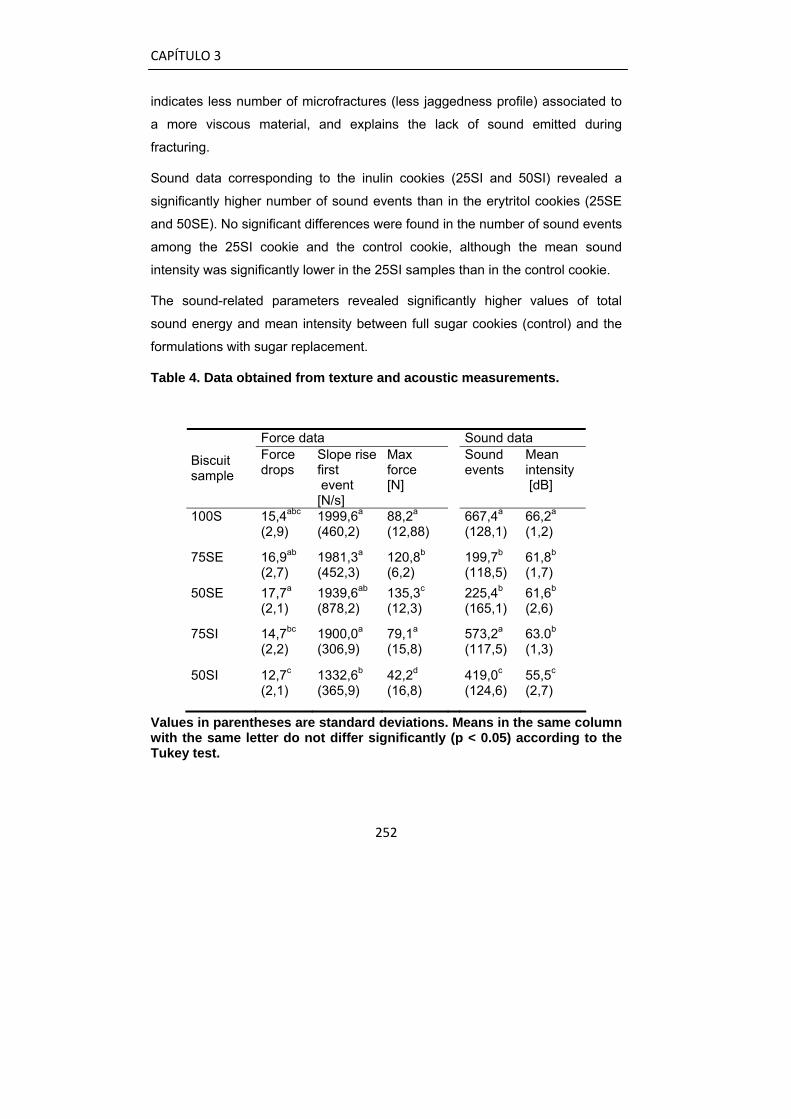
CAPÍTULO 3
252
indicates less number of microfractures (less jaggedness profile) associated to
a more viscous material, and explains the lack of sound emitted during
fracturing.
Sound data corresponding to the inulin cookies (25SI and 50SI) revealed a
significantly higher number of sound events than in the erytritol cookies (25SE
and 50SE). No significant differences were found in the number of sound events
among the 25SI cookie and the control cookie, although the mean sound
intensity was significantly lower in the 25SI samples than in the control cookie.
The sound-related parameters revealed significantly higher values of total
sound energy and mean intensity between full sugar cookies (control) and the
formulations with sugar replacement.
Table 4. Data obtained from texture and acoustic measurements.
Values in parentheses are standard deviations. Means in the same column with the same letter do not differ significantly (p < 0.05) according to the Tukey test.
Force data Sound data
Biscuit sample
Force drops
Slope rise first event [N/s]
Max force [N]
Sound events
Mean intensity [dB]
100S 15,4abc (2,9)
1999,6a (460,2)
88,2a (12,88)
667,4a (128,1)
66,2a (1,2)
75SE 16,9ab (2,7)
1981,3a (452,3)
120,8b (6,2)
199,7b (118,5)
61,8b (1,7)
50SE 17,7a (2,1)
1939,6ab
(878,2) 135,3c (12,3)
225,4b (165,1)
61,6b (2,6)
75SI 14,7bc (2,2)
1900,0a (306,9)
79,1a (15,8)
573,2a (117,5)
63.0b (1,3)
50SI 12,7c (2,1)
1332,6b (365,9)
42,2d (16,8)
419,0c (124,6)
55,5c (2,7)

CAPÍTULO 3
253
Despite the fact that no definition was given for a “crispy attribute” from the
trained panel, in figure 1 it can be observed that the trained panel related the
sound intensity with the sound event, fitting in the definition of crispy products
(fracture and sound emitted at low force at break). The panel agreed that the
crispiest cookie was the control cookie, followed by the 25SI cookie, the 25SE
cookie and the 50SE cookie.
In summary, the instrumental data based on the fracture behavior and the
accompanied sound emission revealed two different behaviors between
erythritol and inulin. Partial replacement of sucrose by erythritol was associated
with lower sound events and a higher force required for breaking the cookie.
Inulin cookies, however, were softer in texture but produced sound properties
closer to the control cookie.
A food product is considered crispy when it fractures with multiple fracture
events at a relative low work of mastication, and these different successive
fracture events are accompanied by sound emission (Luyten and others 2004).
According to this definition, the instrumental results showed that inulin will
perform better than erythritol as a partial sucrose replacer in order to maintain
the crispness properties of the cookie.
Correlation between sensory and instrumental values
Correlation between sensory and instrumental values
The correlations between sensorial (descriptive and acceptability) and
instrumental parameters were studied.
The sound events measured by instrumental analysis correlated well with the
sound at break first bite in mouth scored by the trained panel (r=0.959). This
could mean that the panelist scored as the cookie with more sound the samples
that have more sound events, following the order: control>25SI>50SE>25SE.
The maximum force obtained instrumentally was negatively correlated with
sensory matrix aeration (r=-0.993). In the present work, the creaming method
was used to mix the ingredients, meaning that the sugar is mixed with the fat
CAPÍTULO 3
254
and water to form a cream-like mixture, and as Pareyt and Delcour (2008) cited,
it is at this stage when the air is incorporated and the sugar helps to cream the
air into the fat. As the results showed, the sucrose (control) and the inulin
cookies (25SI) had the highest levels of matrix aeration, compared to the
erythritol cookies (25SE, 50SE) that had a dense matrix. The cookies scored
with the highest matrix aeration by the trained panel (control and 25SI) were
also the ones with the highest number of sound events obtained by instrumental
analysis. As more air is entrapped in the cookie matrix (sensorial test) more
sound events were found (instrumental test). The matrix aeration was also
positively correlated with consumer’s acceptance: global acceptance and
appearance (r=0.972 and 0.987, respectively).
The liking scores of crispness and sweetness by consumers were not
statistically correlated (Pearson correlation) with the instrumental data obtained.
However, these scores followed the same trend than the number of sound
events and the mean intensity of sound (i.e., when the sound events and the
mean intensity of sound increased, an increase in crispness was found by
consumers).
Conclusions
From the collected data of this study it could be concluded that sucrose
replacement affects the cookie’s appearance as well as the cookie matrix. As a
consequence, changes in sensory and instrumental data are observed. The
trained panel found significant differences in toast color, surface porosity,
manual hardness, matrix aeration, butter and sweet flavors, sound break at first
bite, sound duration during mastication, and moisture mouth feel; the 25SI
cookies were the closest sample to control sample. Consumer acceptance
decreased with erythritol replacement, especially at 50% sucrose replacement,
except for hardness and dry mouthfeel where no significant differences among
the samples were found. The instrumental data collected shows that the 25SI

CAPÍTULO 3
255
cookies were softer and more brittle (compared to control cookie) and the 25SE
and 50SE cookies were harder and tougher.
This study has shown that although sucrose replacement using erythritol
produces suitable dough from a processing point of view, erythritol is not
suitable from a sensory point of view (too hard cookie). Inulin could be use to
replace up to 25% of sucrose in short dough cookies without having a
detrimental effect on consumer perception of the product. Further studies will be
needed to achieve a complete sucrose replacement without quality loss.
References
AACC International Method.(2009) Approved Method of Analysis 11th Ed.
Method 38-44-15.02.
Baltsavias A, Jurgens A. 1997. Factors affecting fracture properties of short-
dough cookies. J Texture Stud 28:205-219.
Berasategi I, Cuervo M, Ruiz de las Eras A, Santiago S, Martínez JA,
Astiasarán I, Ansorena D. 2010. The inclusion of functional foods enriched
in fibre, calcium, iodine, fat-soluble vitamins and n-3 fatty acids in a
conventional diet improves the nutrient profile according to the Spanish
reference intake. Public Health Nutrition 14(3): 451-458.
Castro-Prada, E.M., Primo-Martín, C., Meinders, M.B.J., Hamer, J. & Van Vliet,
T. (2009) Relationship between water activity, deformation speed, and
crispness characterization. Journal of Texture Studies, 40, 127-156.
De Vries, J.W. (2003) On defining dietary fibre. Proceedings of the Nutrition
Society, 62, 37–43.
Drewnowski A, Nordenstenb K, Dwyer CJ. 1998. Replacing sugar and fat in
cookies: Impact on product quality and preference. Food Qual Prefer 9:13-
20.
CAPÍTULO 3
256
Farzanmehr, H., Abbasi, S. (2009) Effects of inulin and bulking agents on some
physicochemical, textural and sensory properties or milk chocolate. Journal
of Texture Studies, 40, 563-553.
Gallagher, E., O’ Brien, C.M., Scannell, A.G.M. & Arendt, E.K. (2003)
Evaluation of sugar replacers in short dough biscuit production. Journal of
Food Engineering, 56 ,261–263.
ISO 8589 (1988) Sensory analysis. General guidance for design of test rooms.
Standard no. 8589. Geneva, Switzerland.
Kulp, K., Lorenz, K., Stone, M. (1991) Functionality of carbohydrate ingredients
in bakery products. Food Technology, 45(3), 136-140.
Kweon, M., Slad, L., Levin, H., Martin, R., Souza, E. (2009). Exploration of
sugar functionality in sugar-snap and wire-cut cookie baking: implications
for potencial sucrose replacement or reduction. Cereal Chemistry 86, (4),
425-433.
Laguna L, Vallons KJR, Jurgens A, Sanz T. 2012. Understanding the effect of
sugar and sugar replacement in short dough biscuits. Food Bioprocess and
Technology DOI 10.1007/s11947-012-0968-5.
Lawless, H., Heyman, H. (1998) Sensory Evaluation of Food: Principles and
Practices, Chapman & Hall, New Yorl, NY.
Lin, S.D., Hwang, C.F., Yeh, C.H. (2003) Physical and sensory characteristics
of chiffon cake prepared with erythritol as replacement for sucrose. Journal
of Food Science, 68, 2107–2110.
Lin, S.D., Lee, C.C., Mau, J.L., Lin ,L.Y., Chiou S.Y. (2010) Effect of erythritol
on quality characteristics of reduced-calorie danish cookies. Journal of Food
Quality, 33, 14–26.
Luyten, H., Plijter, J.J., Van Vliet, T. (2004) Crispy/crunch crusts of cellular solid
foods: A literature review with discussion. Journal of Texture Studies, 35,
445-492.
CAPÍTULO 3
257
Meyer D, Bayarri S, Tárrega A, Costell E. 2011. Inulin as texture modifier in
dairy products. Food Hydrocolloids 25: 1881-1890.
Manley, D. (2000) Technology of Biscuits, Crackers and Cookies, Third edition.
Woodhead Publishing Limited, Cambridge, UK.
Olinger, P.M., Velasco, V.S. (1996) Opportunities and advantages of sugar
replacement. Cereal Food World, 41(3), 110-11.
Orafti (1996) Raftilose® and Raftiline® Product Book. Orafti, Belgium.
Pareyt, B., Delcour, J.A. (2008) The role of wheat flour constituents, sugar, and
fat in low moisture cereal based products: a review on sugar-snap biscuits.
Critical Reviews in Food Science and Nutrition, 48, 824-839.
Pareyt, B., Talhaoui, F., Kerckhofs, G., Brijs, K., Goesaert, H., Wevers, M.,
Delcour, J.A. (2009) The role of sugar and fat in Sugar-Snap cookies:
structural and textural properties. Journal of Food Enginering, 90 (3), 400-
408.
Pareyt B , Goovaerts M, Broekaert WF, Delcour JA. 2011. Arabinoxylan
oligosaccharides (AXOS) as a potential sucrose replacer in sugar-snap
cookies. LWT- Food Sci Technol 44(3):725-728.
Peleg M. 1994. A mathematical model for crunchiness/crispness loss in
breakfast cereals. J Texture Stud 25:403-410.
Perko R, DeCock P. 2008. Erythritol. Sweeteners and Sugar Alternatives in
Food Technology. Mitchell, Helen (Editor) Chichester, England: Wiley,
2008. p 157.
Primo-Martín C, Sözer N, Hamer RJ, van Vliet T. 2009. Effect of water activity
on fracture and acoustic characteristics of a crust model. J Food Eng
90:277–284.
Sai Manohar R, Haridas Rao P. 1997. Effect of sugars on the rheological
characteristics of cookie dough and quality of Cookies. J Sci Food Agr
75:383-390.
CAPÍTULO 3
258
Scholtz S, Bosman JCM. 2005. Consumer acceptance of high-fibre muffins and
rusks baked with red palm olein. Int J Food Sci Technol 40:857-866.
Szczesniak AS. 2002. Texture is a sensory property. Food Qual Prefer 13:215-
225.
Stone, H., Sidel., J. (2004) Quantitative Descriptive Analysis (The QDA
Method), Sensory Evaluation Practices, 3rd Ed., pp-215-235, Elsevier
Academic Press, San Diego, CA.
Taylor, T.P., Fasina, O., Bell, L.N. (2008) Physical properties and consumer
liking of cookies prepared by replacing sucrose with tagatose. Journal of
Food Science, 73 (3), S145-151.
Vincent, J.F.V. (1998) The quantification of crispness. Journal of the Science of
Food and Agriculture, 78(2), 162-168.
Zhan, S., Pepke, F., Rohm, H., (2010) Effect of inulin as a fat replacer on
texture and sensory properties of muffins. International Journal of Food
Science and Technology, 45, 2531–2537.
Zoulias, E.I., Piknis, S., Oreopoulu, V. (2000) Effect of sugar replacement by
polyols and acesulfame-K on properties of low-fat cookies. Journal of the
Science of Food and Agriculture, 80, 2049-2056.
UNDERSTANDING THE EFFECT OF SUGAR AND SUGAR REPLACEMENT
IN SHORT DOUGH BISCUITS
Laura Laguna, Katleen J.R. Vallons, Albert Jurgens and Teresa Sanz
FOOD BIOPROCESS AND TECHNOLOGY
DOI 10.1007/s11947-012-0968-5

CAPÍTULO 3
261
Abstract
Sucrose is the main sugar used in short dough biscuit formula and it plays an
important role in the biscuit manufacturing as well as in the biscuits final quality.
However, for health reasons, high levels of sucrose are undesirable, making
sucrose replacement an important issue to study. The present study focused on
sucrose reduction and its replacement by polyols (erythritol and maltitol) in short
dough biscuits. The effects were investigated in a model system composed of
gluten and different sugars (sucrose, maltitol and erythritol), in biscuit dough
and in baked biscuits. Modulated thermal analysis showed that sucrose
decreases the glass transition temperature, however for both polyols studied,
no transition was found due to a plasticization effect. The gelatinization of starch
in the biscuits was not affected by the sugar or quantity of sugar used.
Temperature sweeps of short dough revealed that the presence of sugar delays
the transitions. Furthermore, G* increased with sucrose replacement, with the
smallest changes for the maltitol-containing biscuits compared to the control.
Finally, texture and dimension analysis were carried out. Sugar-free and
erythritol-containing biscuits were compact, elastic and resistant to the breaking
force compared to the control biscuits and the maltitol-containing biscuits.
Keywords: Thermal properties, rheology, biscuit, sugar, polyols
CAPÍTULO 3
262
1. Introduction
Biscuits are popular bakery items, consumed by nearly all levels of society.
They are ready to eat, of good nutritional quality and available in different
varieties at an affordable cost. Short–dough biscuits compromise widely diverse
products. Generally, they are rich in both fat and sugar while containing only a
small amount of water. Sucrose is the main sugar utilized in the biscuit industry.
Nowadays, however, such high sugar levels are considered undesirable
(Gallagher 2003) for several health reasons such as dental problems, obesity,
type II-diabetes, high blood cholesterol and coronary disease (Pareyt 2009a).
Decreasing the amount of sugar added to biscuits is a good way to obtain a
healthier and lower-calorie product (Drewnowski 1998).
From a sensorial point of view, sugar affects flavor, dimensions, color, hardness
and surface of the biscuit finished product (Gallagher 2003). Additionally, the
quantity and type of sugar used will have an effect during the whole biscuit
preparation procedure (from dough mixing to packaging). In the mixing
process, sucrose competes with flour for the available water, inhibiting the
gluten development (Gallagher 2003). Moreover, it affects the dough
consistency (Olewnik et al. 1984) which plays a role in the sheeting step. During
baking, sugar has an effect on gelatinization of starch (Spies et al. 1982),
browning reaction (Kulp et al.1991), gluten mobility (Pareyt et al. 2009b), biscuit
spread, crispness, and surface characteristics (Kulp et al.1991).
Due to all the sugar functions in biscuits, sugar replacement is rather difficult to
achieve. The effects of sugar reduction and sugar replacement in biscuit have
been studied by many authors. Olinger and Velasco (1996) replaced sugar in
baked products such as cake and biscuit with lactitol, maltitol, isomalt, sorbitol
and polydextrose. They describe changes in the spread, crust color, and tacky
surface. Sai Manohar et al. (1997) applied reducing sugars in biscuits and
studied their dough rheological characteristics and biscuit quality, concluding
that among the different reducing sugars, high fructose corn syrup imparted the
CAPÍTULO 3
263
best color to biscuits. Zoulias et al. (2000) studied the effect of sugar
replacement by different polyols (maltitol, lactitol, sorbitol, xylitol, mannitol),
fructose and acesulfame-k, observing that the biscuits prepared with maltitol
and lactitol resembled the control biscuit, while also sorbitol-containing biscuits
had acceptable properties. However, xylitol and fructose negatively affected the
flavor and mannitol restricted the spread and imparted unpleasant flavor and
appearance, making them unsuitable for biscuits. In general, all the polyol-
containing biscuits were less sweet than the control while the sweeteness of
biscuits containing acesulfame-k was increased improving their perceived flavor
and general acceptance. Lately, Gallagher et al. (2003) used an
oligosaccharide, Raftilose, to replace 20-30% of the sugar resulting in softer
biscuits and different surface color attributes. Kweon et al. (2009) studied the
effects of xylose, glucose, fructose and sucrose on flour functionality in biscuits,
concluding that while sucrose optimizes the flour performance, xylose
negatively affected biscuit quality. Recently, Pareyt et al (2011) used
arabinoxylan oligosaccharides as a potential sucrose replacer in sugar-snap
biscuit to replace up to 30% sucrose obtaining comparable diameters and
heights; however, darker colors were found compared to the control.
Although the effect of sugar reduction and replacement on dough and biscuit
properties has been widely studied, understanding of ingredient interactions and
fundamental concepts is lacking. Deeper knowledge of the functionalities of
sugar and sugar replacers in the different processing steps is essential in order
to improve the quality of low-calorie biscuits. Therefore, the objective of this
paper is to study the feasibility of using various sugars (sucrose, erythritol and
maltitol) in short dough biscuits from three viewpoints: 1) in a model system
composed of hydrated gluten with sugar 2) in biscuit dough and 3) in baked
biscuits. The obtained results will provide essential information on the role of
sugars in biscuit manufacturing and quality and on the suitability of erythritol
and maltitol as sugar replacers. In addition, understanding of sugar ingredient
interactions in short dough biscuits will be obtained.
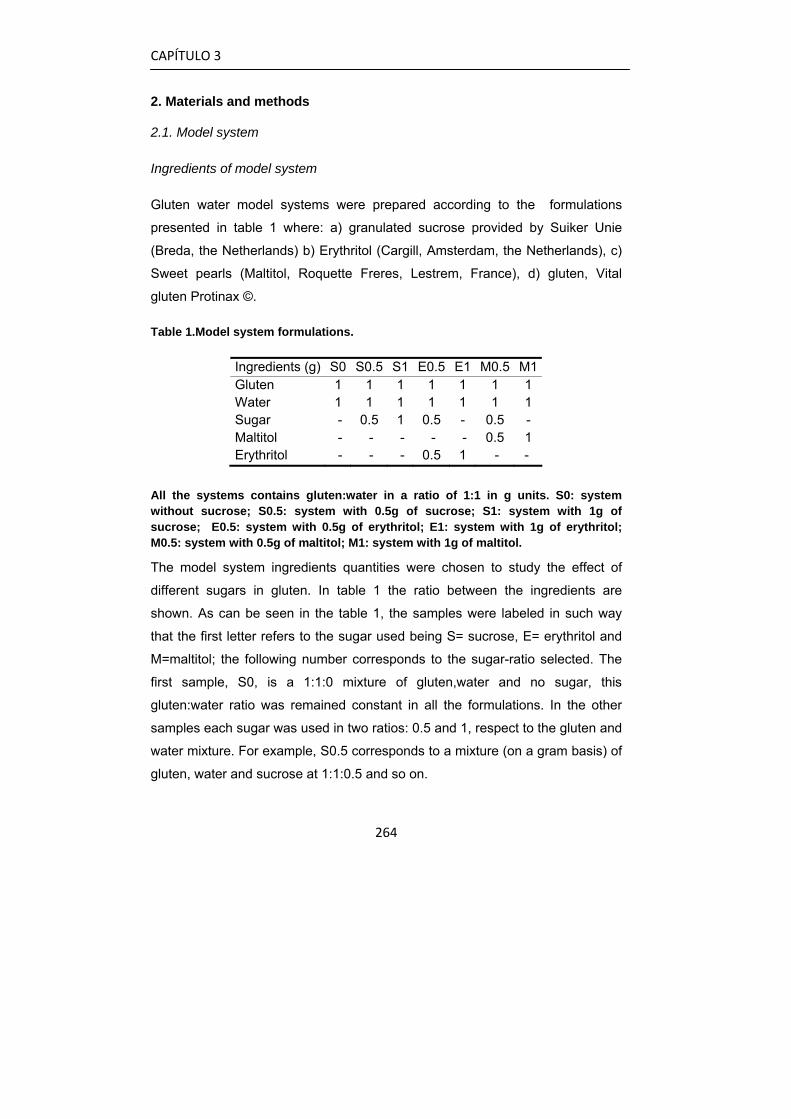
CAPÍTULO 3
264
2. Materials and methods
2.1. Model system
Ingredients of model system
Gluten water model systems were prepared according to the formulations
presented in table 1 where: a) granulated sucrose provided by Suiker Unie
(Breda, the Netherlands) b) Erythritol (Cargill, Amsterdam, the Netherlands), c)
Sweet pearls (Maltitol, Roquette Freres, Lestrem, France), d) gluten, Vital
gluten Protinax ©.
Table 1.Model system formulations.
All the systems contains gluten:water in a ratio of 1:1 in g units. S0: system without sucrose; S0.5: system with 0.5g of sucrose; S1: system with 1g of sucrose; E0.5: system with 0.5g of erythritol; E1: system with 1g of erythritol; M0.5: system with 0.5g of maltitol; M1: system with 1g of maltitol.
The model system ingredients quantities were chosen to study the effect of
different sugars in gluten. In table 1 the ratio between the ingredients are
shown. As can be seen in the table 1, the samples were labeled in such way
that the first letter refers to the sugar used being S= sucrose, E= erythritol and
M=maltitol; the following number corresponds to the sugar-ratio selected. The
first sample, S0, is a 1:1:0 mixture of gluten,water and no sugar, this
gluten:water ratio was remained constant in all the formulations. In the other
samples each sugar was used in two ratios: 0.5 and 1, respect to the gluten and
water mixture. For example, S0.5 corresponds to a mixture (on a gram basis) of
gluten, water and sucrose at 1:1:0.5 and so on.
Ingredients (g) S0 S0.5 S1 E0.5 E1 M0.5 M1Gluten 1 1 1 1 1 1 1 Water 1 1 1 1 1 1 1 Sugar - 0.5 1 0.5 - 0.5 - Maltitol - - - - - 0.5 1 Erythritol - - - 0.5 1 - -
CAPÍTULO 3
265
Preparation of model system
The model systems were prepared according to a modification of the method
described by Kalichevsky et al. (1992), in which gluten is hydrated and mixed
using approximately 200ml of liquid nitrogen, 100 ml of water or the mixture of
sugar and water, was sprinkled into liquid nitrogen and milled in a Retsch
Grindomix GM 200 (Retsch Benelux, Belgium) for 10 seconds at 8 r.p.m. by an
electric mill. More liquid nitrogen was added and the gluten powder was milled
together with the water, again for 10 seconds. Subsequently, the mixture was
transferred to a plastic container, rested overnight at 4ºC and finally transferred
into a metal tray.
Next, all the samples were dried in an oven at 30 ºC for 24 hours. The samples
were then stored for 3 days over P2O5 for optimal drying, and subsequently over
saturated salt solutions of various relative humidities for at least two weeks in
order to obtain a variety of water contents. The salts used were KNO3
(aw=0.936), KCl (aw=0.843), KI (aw=0.69), Ca(NO3)2 (aw=0.51), K2CO3
(aw=0.432), MgCl2 (aw=0.328), CH3CO2K (aw=0.22) and LiCl (aw=0.113). One
part of each sample was transferred to DSC pans while the other part was
transferred into a separate dish for water activity measurement. The water
activity was measured using a Decagon Aqua Lab meter (Pullman, WA, USA)
calibrated with a 8.57 molal lithium chloride solution (aw=0.500).
The equilibrium moisture content of the samples was determined gravimetrically
by drying in an oven at 105 ºC for at least 24 hours.
Modulated Differencial Scanning Calorimetry (MDSC)
Modulated calorimetric measurements were carried out using a MDSC Q2000
(TA Instruments, New Castle, USA).
The samples (10-15 mg) were scanned from -40 ºC to 120 ºC at a rate of
2ºC/min and the cycle was repeated two times in order to provide a good
resolution of the transition phenomena. The period and the amplitude of
CAPÍTULO 3
266
modulation were 100s and 0.5°C respectively. The glass transition temperature
(Tg) was determined as the mid-point temperature in the reversing heat flow
signal, using the automatic Tg analysis tool available in the Universal Analysis
software (TA instruments, New Castle, USA).
2.2. Dough and biscuit performance
Biscuit ingredients
Two different sucrose replacers were used: erythritol and maltitol.
The biscuit formulations are based on a short dough biscuit recipe from Manley
(1991) and shown in table 2. The sweetener quantities were calculated based
on their molarities in order to maintain the same molar concentration of sugar.
The ingredient ratios used were such as to avoid a slightly cohesive dough
powder and the final dough obtained was poorly elastic but extensible enough
to allow an easy shaping of the material. All the reformulations were calculated
such that the ratio between flour and other ingredients (except sucrose) was
kept the same, see table 2.
The sample names in table 2 are composed of a number and a letter, the
number corresponds to the level of sugar used, taking 17.14g of sucrose in the
control biscuit as 100, and the letter refers to the sugar used being S= sucrose,
E= erythritol and M=maltitol.
The ingredients were: a) commercial wheat flour suitable for biscuits, IJsvogel
from Meneba Meel BV (Rotterdam, The Netherlands) (composition data
provided by the supplier: 15.0% moisture, 10.5% protein, 0.58% ash) b) fat (Trio
Wals) provided by Unipro, Professional Bakery, (Bergen op Zoom, The
granulated sucrose, (c) granulated 204
sucrose d) sweeteners: erythritol, maltitol, same supplier as for the model
systems, e) sodium chloride f) sodium bicarbonate g) ammonium bicarbonate
and e) deionized water was used in all the experiments.
CAPÍTULO 3
267
Preparation of biscuits
First, sucrose syrup was prepared for each of the formulations by adding the
sugar to distilled water and stirring for 1 hr in a water bath.
Secondly, the syrup, fat and salt were mixed in a mixer (Fit Hobart mixer, USA)
for 30s at low speed (no.1), the bowl was scraped down and mixing was
continued for 3min at a higher speed (no.2). Next, the flour was added and
mixed in for 20s at speed no.1 and, after scraping down the bowl once more, for
a further 40s at the same speed. After mixing, the dough was allowed to stand
for 10 minutes during which starch and proteins absorbed the water (Pareyt et
al. 2008) and in order to reduce significant differences in dough quality (Manley
1991). Then, the dough was sheeted to 4.8 mm thickness. To avoid gluten
development and the subsequent deformation of shape and dimensions, the
dough was turned 90º during the sheeting process, after each sheeting over the
roller.
Biscuits were shaped by a biscuit molder of a circular shape with a diameter of
6.5 cm and 24 holes of 1 mm. Sixteen biscuits were placed on a baking tray and
baked for 16 min in a standard electric oven with 190 ºC bottom- and 210 ºC
top-temperatures. After baking and reaching ambient temperature, the biscuits
were packed and stored in plastic bags. The biscuit properties were analyzed
after 1 day of storage.
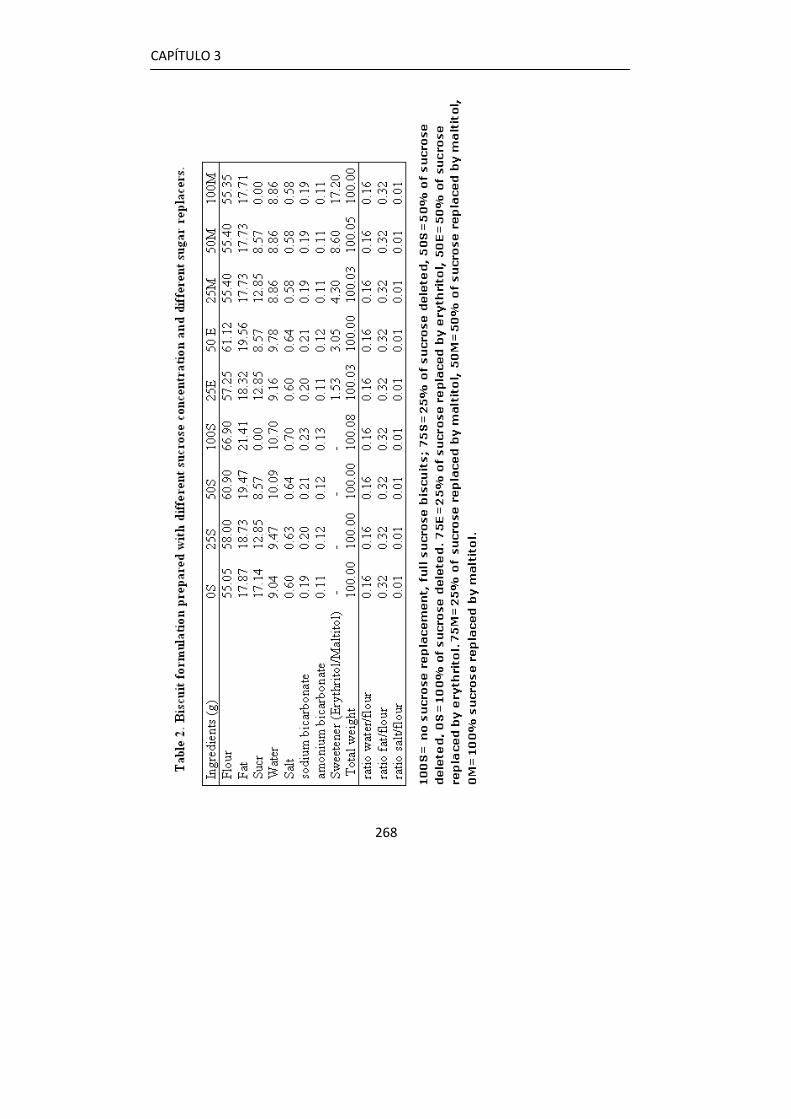
CAPÍTULO 3
268

CAPÍTULO 3
269
2.3. Dough and biscuit analysis Starch gelatinization
The starch gelatinization was determined according to a standard procedure
described by Biliaderis et al. (1980), using a DSC Q2000 (TA Instruments, New
Castle, USA). Samples were heated from 20 °C to 160 °C at a rate of 10 °C/min
in Perkin-Elmer stainless steel hermetically sealed pans. Both, biscuit dough
and baked biscuit, were analyzed in excess of water (1:3).
Water content and water activity
The moisture content of the model system, biscuit dough and biscuits were
determined according to the Approved Method 44-15.02 (AACC International
2009).
Water activity (aw) was determined using a Decagon Aqua Lab meter (Pullman,
WA, USA) calibrated with a 8.57 molal litium chloride solution (aw=0.500).
Rheological experiments
A controlled stress rheometer (AR 2000, TA Instruments, Crawley, UK),
equipped with the Environmental Test Chamber (ETC) and serrated parallel
plates (25 mm geometry) with a gap of 3 mm, was used for rheological
characterization. Strain sweep tests (0.00001-0.1) were performed to measure
the linear viscoelastic properties at a constant frequency of 1 Hz. A critical
shear strain (γc), the strain at which a deviation from linear behavior occurs, was
estimated from the normalized plot of G’ and G’’ (data not shown). In order to
simulate the effect of the baking process, temperature sweeps at a constant
deformation amplitude within the linear viscoelastic region, (γ=0.0001 at 1 Hz)
were carried out by increasing the temperature from 25 ºC up to 160 ºC, at a
constant rate of 5 ºC/min. The storage modulus (G’), loss modulus (G”) and loss
tangent (tanδ= G”/G´) which is consider the ratio of viscous to elastic properties
were measured. Both modulus ( G’ and G”) are derived from the complex shear
modulus G* which represents the total resistance of dough to imposed
deformation and are related with G* as the following equation shows:
CAPÍTULO 3
270
22 )"()'(* GGG +=
G* represents the total resistance of dough to imposed deformation.
Biscuit texture analysis
The texture of the biscuit was measured using a TA.TX.plus Texture Analyzer
(Stable Micro Systems, Goldaming, UK). Texture analysis of the biscuits was
performed by two tests:
- Fracture Strength. The biscuits were fractured using a three point bending
probe and support (A/3PB). The experimental conditions were: test speed 0.5
mm/s; distance between supports 20 mm apart; probe travel distance 3 mm;
trigger force 50 g. The force at fracture (N), the distance at break (mm) and the
gradient of the curve (N/sec) were recorded
- Puncture test. Penetration tests were conducted with a semispherical probe (5
mm diameter), placing the sample upside down and penetrating at 0.5 mm/s
(whole biscuit) to a distance of 10 mm with a trigger force of 50 g. Five holes
were made in each biscuit. The parameters measured were the area under the
curve (N.mm) as the resistance to penetration and the number of peaks as an
index of crunchiness.
Biscuit dimensions
Biscuit thickness was measured by stacking 10 biscuits vertically against a
biscuit thickness ruler, sliding a gauge to rest on top of the pile and calculate the
average thickness from the height determined. Biscuit 'length' was measured by
arranging 10 biscuits along the length ruler (with the stamped word parallel to its
long edge) and recording the average length. Next, the biscuits were turned 90º
and the average 'width' was determined. These measurements were expressed
in mm as the average value/10 by duplicates.
CAPÍTULO 3
271
2.4.Statistical analysis
Analysis of variance (one way-ANOVA) was applied to study the differences
between formulations; least significant differences were calculated by the Tukey
test and the significance at p < 0.05 was determined. These analyses were
performed using SPSS for Windows Version 12 (SPSS Inc., USA).
3. RESULTS
3.1 Modulated Differential Scanning Calorimetry of the model systems
In MDSC, the conventional linear temperature increase/decrease is overlaid by
a sinusoidal oscillation. The resulting modulated heat-flow signal can be
separated into reversible and non-reversible signals, which aids in the data
interpretation (Auh et al. 2003). The glass transitions (Tg) can be observed in
the reversible heat flow signal, while melting/crystallization transitions can be
observed in the non-reversible signals
Figure 1 shows the Tg’s of the gluten-sucrose model systems as a function of
moisture content, as determined by MDSC. For S0, S0.5 and S1 the Tg of
gluten was depressed with increasing sucrose content in the range of moisture
contents studied. This result is in accordance with Kalichevsky et al. 1992.
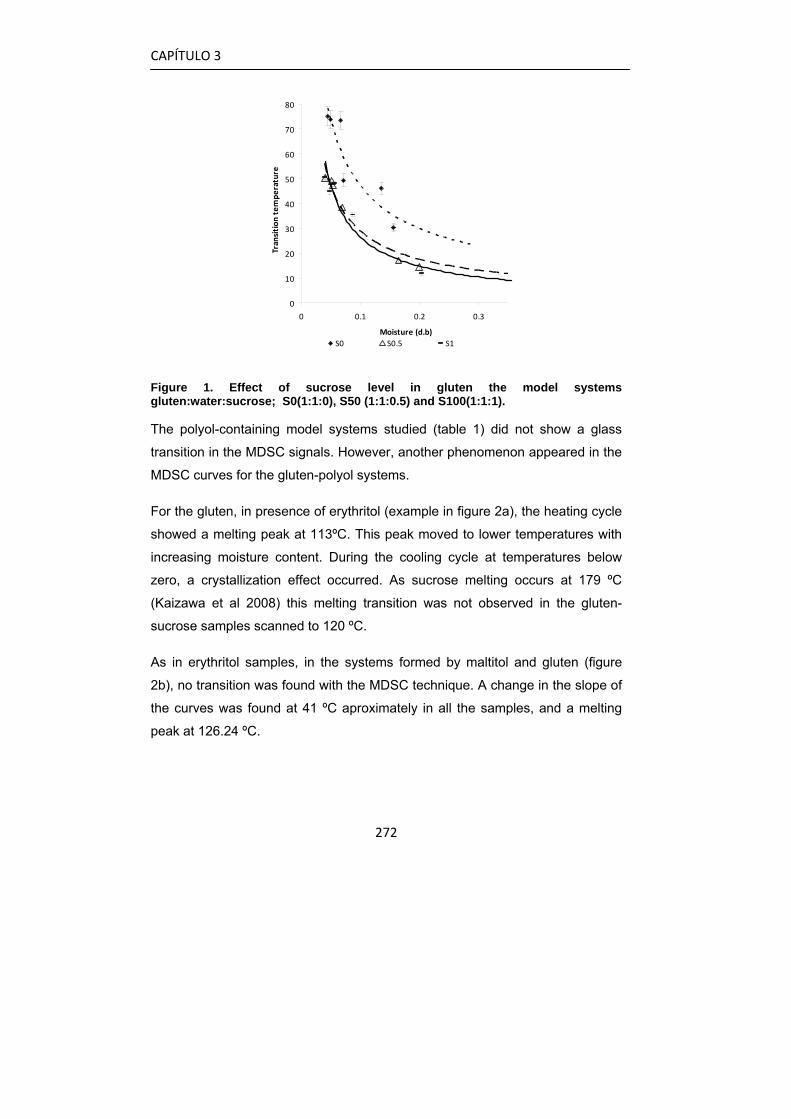
CAPÍTULO 3
272
0
10
20
30
40
50
60
70
80
0 0.1 0.2 0.3
Moisture (d.b)
Transition
tem
perature
S0 S0.5 S1
Figure 1. Effect of sucrose level in gluten the model systems gluten:water:sucrose; S0(1:1:0), S50 (1:1:0.5) and S100(1:1:1).
The polyol-containing model systems studied (table 1) did not show a glass
transition in the MDSC signals. However, another phenomenon appeared in the
MDSC curves for the gluten-polyol systems.
For the gluten, in presence of erythritol (example in figure 2a), the heating cycle
showed a melting peak at 113ºC. This peak moved to lower temperatures with
increasing moisture content. During the cooling cycle at temperatures below
zero, a crystallization effect occurred. As sucrose melting occurs at 179 ºC
(Kaizawa et al 2008) this melting transition was not observed in the gluten-
sucrose samples scanned to 120 ºC.
As in erythritol samples, in the systems formed by maltitol and gluten (figure
2b), no transition was found with the MDSC technique. A change in the slope of
the curves was found at 41 ºC aproximately in all the samples, and a melting
peak at 126.24 ºC.
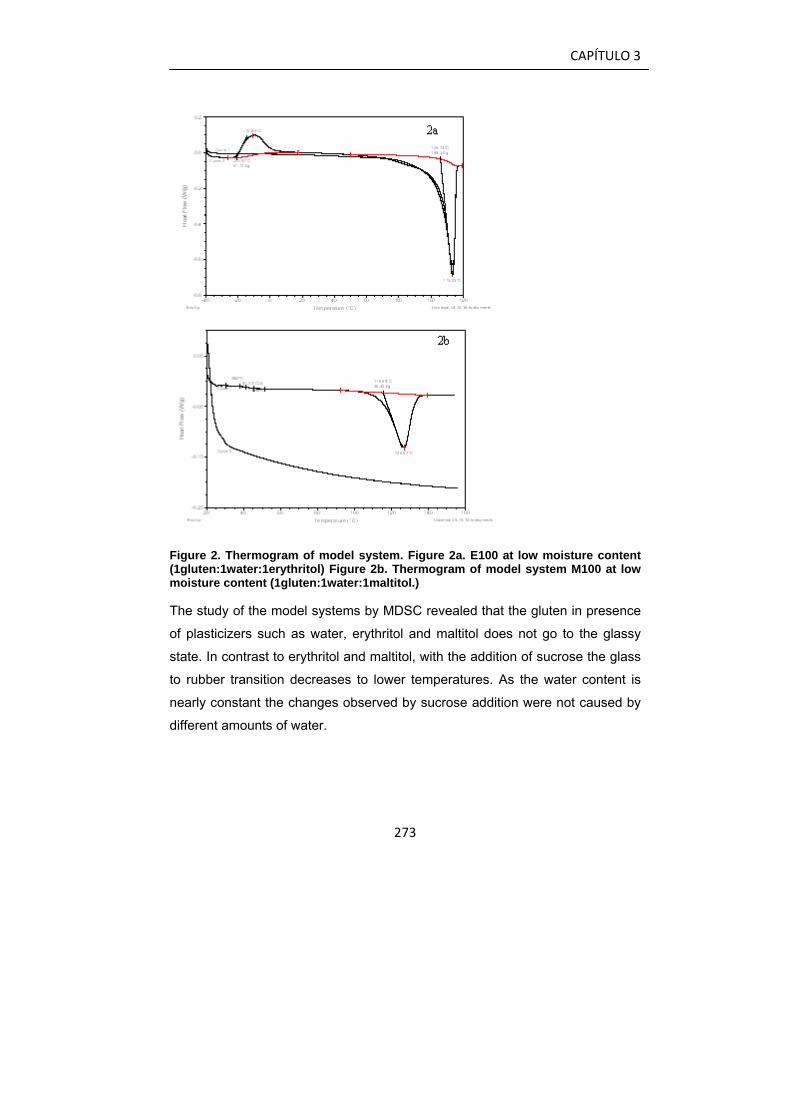
CAPÍTULO 3
273
Figure 2. Thermogram of model system. Figure 2a. E100 at low moisture content (1gluten:1water:1erythritol) Figure 2b. Thermogram of model system M100 at low moisture content (1gluten:1water:1maltitol.)
The study of the model systems by MDSC revealed that the gluten in presence
of plasticizers such as water, erythritol and maltitol does not go to the glassy
state. In contrast to erythritol and maltitol, with the addition of sucrose the glass
to rubber transition decreases to lower temperatures. As the water content is
nearly constant the changes observed by sucrose addition were not caused by
different amounts of water.
CAPÍTULO 3
274
3.2. Calorimetric measurement in dough and biscuits.
In order to evaluate the degree of starch gelatinization in presence/absence of
sugar DSC analysis was carried out on dough and biscuit samples in excess of
water (1:3). A summary of the DSC results is presented in table 3. In all the
thermograms (biscuit and dough) an endothermic peak between 66.53 and
75.63 ºC appeared which corresponds to the starch gelatinization, in
accordance with other authors (Baltsavias et al. 1999). The presence of this
peak in the biscuit implies that the extent of starch gelatinization during baking
was very low. In the dough samples the peak appeared at lower temperature
than in the biscuit samples. This increase in the gelatinization temperature after
baking can be attributed to structural changes within the starch granules
occurring as a result of the heat-moisture treatment (baking), which involves
mainly amylose-amylose and amylose-lipid interactions (Hoover et al. 1994).
Furthermore, the comparison of the melting enthalpies (table 3) reflects a
decrease in the transition energy in the biscuits in comparison to the
corresponding dough (same starch content). This decrease is associated to the
fact that during the dough baking process some starch gelatinization occurs,
resulting in a lower melting enthalpy after baking. Table 3 showed no significant
difference among biscuits dough formulations neither in onset temperature nor
peak temperature. In baked biscuits however the sucrose decrement samples
(50S and 100S biscuits) presented slightly higher peak gelatinization
temperatures compared to the 0S. Morevover, no effect of polyol addition on
gelatinization temperatures was observed. As occurred in the onset and peak
temperature, no relation between sugar content and enthalpy was found.
Eliasson et al. (1992) described a shift to higher gelatinization temperatures in
starch-sugar-water systems compared to starch-water systems, and they
attributed this stabilizing effect of sugar to sugar molecules forming bridges
between neighbouring polysaccharides located within the amorphous region of
the granules thereby restricting movement of these areas. In the biscuit systems
used in the current study however, this phenomenon was not found.
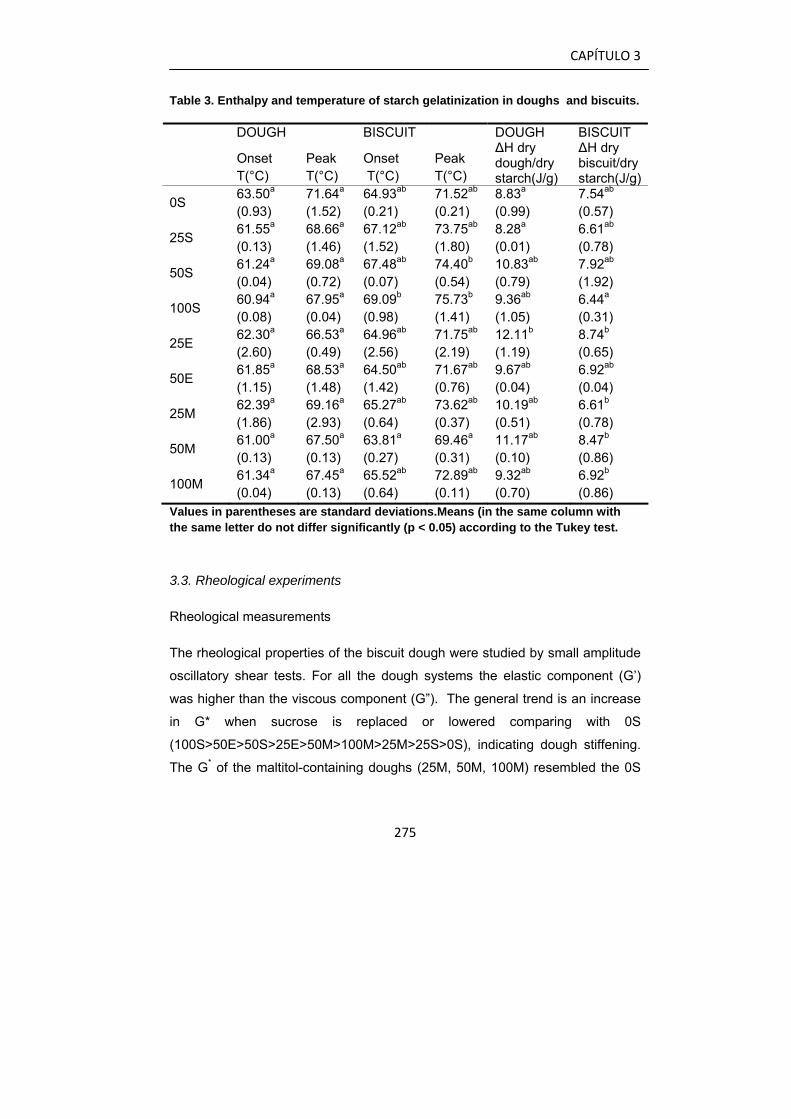
CAPÍTULO 3
275
Table 3. Enthalpy and temperature of starch gelatinization in doughs and biscuits.
DOUGH BISCUIT
Onset T(°C)
Peak T(°C)
Onset T(°C)
Peak T(°C)
DOUGH ΔH dry dough/dry starch(J/g)
BISCUIT ΔH dry biscuit/dry starch(J/g)
0S 63.50a (0.93)
71.64a
(1.52) 64.93ab (0.21)
71.52ab (0.21)
8.83a (0.99)
7.54ab (0.57)
25S 61.55a (0.13)
68.66a (1.46)
67.12ab (1.52)
73.75ab (1.80)
8.28a (0.01)
6.61ab (0.78)
50S 61.24a (0.04)
69.08a (0.72)
67.48ab (0.07)
74.40b (0.54)
10.83ab (0.79)
7.92ab (1.92)
100S 60.94a (0.08)
67.95a (0.04)
69.09b (0.98)
75.73b (1.41)
9.36ab (1.05)
6.44a (0.31)
25E 62.30a (2.60)
66.53a (0.49)
64.96ab (2.56)
71.75ab (2.19)
12.11b (1.19)
8.74b (0.65)
50E 61.85a (1.15)
68.53a (1.48)
64.50ab (1.42)
71.67ab (0.76)
9.67ab (0.04)
6.92ab (0.04)
25M 62.39a (1.86)
69.16a (2.93)
65.27ab (0.64)
73.62ab (0.37)
10.19ab (0.51)
6.61b (0.78)
50M 61.00a (0.13)
67.50a (0.13)
63.81a (0.27)
69.46a (0.31)
11.17ab (0.10)
8.47b (0.86)
100M 61.34a (0.04)
67.45a (0.13)
65.52ab (0.64)
72.89ab (0.11)
9.32ab
(0.70) 6.92b (0.86)
Values in parentheses are standard deviations.Means (in the same column with the same letter do not differ significantly (p < 0.05) according to the Tukey test.
3.3. Rheological experiments
Rheological measurements
The rheological properties of the biscuit dough were studied by small amplitude
oscillatory shear tests. For all the dough systems the elastic component (G’)
was higher than the viscous component (G”). The general trend is an increase
in G* when sucrose is replaced or lowered comparing with 0S
(100S>50E>50S>25E>50M>100M>25M>25S>0S), indicating dough stiffening.
The G* of the maltitol-containing doughs (25M, 50M, 100M) resembled the 0S
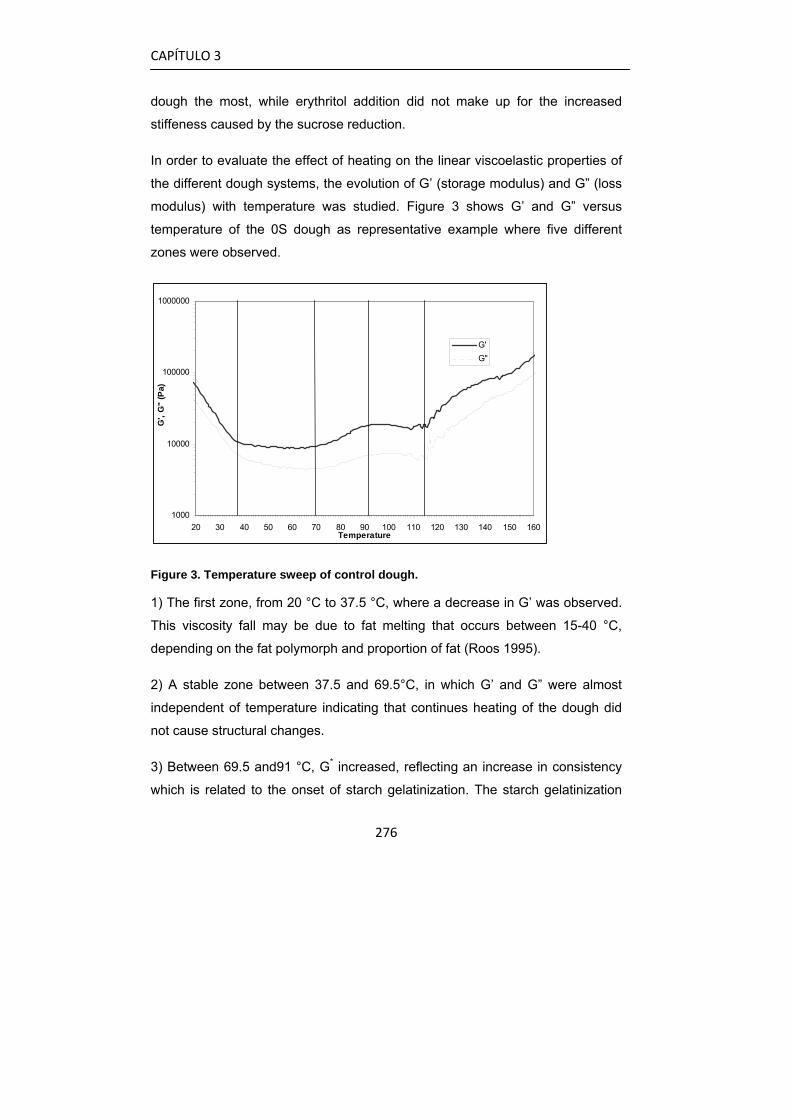
CAPÍTULO 3
276
dough the most, while erythritol addition did not make up for the increased
stiffeness caused by the sucrose reduction.
In order to evaluate the effect of heating on the linear viscoelastic properties of
the different dough systems, the evolution of G’ (storage modulus) and G” (loss
modulus) with temperature was studied. Figure 3 shows G’ and G” versus
temperature of the 0S dough as representative example where five different
zones were observed.
1000
10000
100000
1000000
20 30 40 50 60 70 80 90 100 110 120 130 140 150 160Temperature
G',
G"
(Pa)
G'G''
Figure 3. Temperature sweep of control dough.
1) The first zone, from 20 °C to 37.5 °C, where a decrease in G’ was observed.
This viscosity fall may be due to fat melting that occurs between 15-40 °C,
depending on the fat polymorph and proportion of fat (Roos 1995).
2) A stable zone between 37.5 and 69.5°C, in which G’ and G” were almost
independent of temperature indicating that continues heating of the dough did
not cause structural changes.
3) Between 69.5 and91 °C, G* increased, reflecting an increase in consistency
which is related to the onset of starch gelatinization. The starch gelatinization

CAPÍTULO 3
277
occurs at 60-75 °C depending upon the type of starch and the presence of other
ingredient (Singh et al. 2005). It is well known that sugar delays the starch
gelatinization (Chevallier et al. 2000). However, it should be kept in mind that
most of the starch granules do not gelatinize during baking as observed by DSC
analysis.
4) A second shorter constant range from 91.5 to 115°C.
5) Finally, from 115 °C up to the end of the test at 160 °C an increase in G’ and
G” occured. At this temperature the dough reached the water boiling point,
contributing to dough stiffening (Singh et al.2005). The dough has turned into a
cellular solid. Several authors previously studied the change in rheological
properties in wheat dough. Bloksma (1980), Dreese et al.(1998) and Singh et al.
(2005), observed three different stages during heating. Singh et al. (2005)
defined a first part from 25 to 60 ºC associated with bubble growth and fat
melting. In the second phase, between 60 and 75 ºC, a rapid bubble expansion,
starch gelatinization and glutenin polymerization occurred. Between 87 and 100
ºC final curing and water evaporation took part. Compared to the model
described by Singh, the changes of G’and G’’ with temperature were less
pronounced. This may be due to differences in dough composition, with fat
melting depending on the amount and polymorphism of the fat, and starch
gelatinization as well as glutenin polymerization depending on the amount and
type of sugar (Pareyt et al. 2009b).
The specific effects of sucrose reduction and sucrose replacement by maltitol
and erythritol on the moduli are shown in Figure 4a to 4c. The graphs were
grouped according to the sucrose level and sucrose replacer.
Figure 4a shows different sucrose levels from full sucrose dough (0S) to sugar
free dough (100S). With the progressive sucrose decrement the transitions
mentioned (fat melting, starch gelatinization, gluten polymerization) occurred at
lower temperature. Both moduli (G’, G”) were higher for the sugar free biscuit
dough than for the 0S dough, meaning more dough resistance. Tan δ, (data not
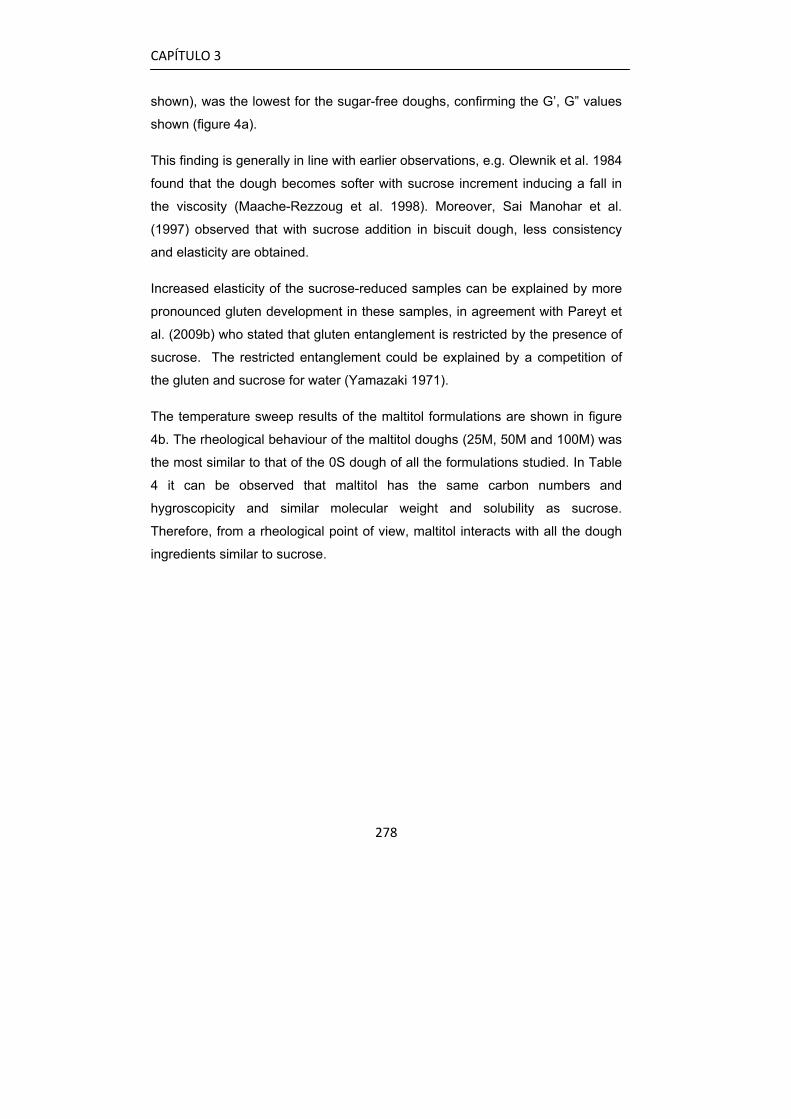
CAPÍTULO 3
278
shown), was the lowest for the sugar-free doughs, confirming the G’, G” values
shown (figure 4a).
This finding is generally in line with earlier observations, e.g. Olewnik et al. 1984
found that the dough becomes softer with sucrose increment inducing a fall in
the viscosity (Maache-Rezzoug et al. 1998). Moreover, Sai Manohar et al.
(1997) observed that with sucrose addition in biscuit dough, less consistency
and elasticity are obtained.
Increased elasticity of the sucrose-reduced samples can be explained by more
pronounced gluten development in these samples, in agreement with Pareyt et
al. (2009b) who stated that gluten entanglement is restricted by the presence of
sucrose. The restricted entanglement could be explained by a competition of
the gluten and sucrose for water (Yamazaki 1971).
The temperature sweep results of the maltitol formulations are shown in figure
4b. The rheological behaviour of the maltitol doughs (25M, 50M and 100M) was
the most similar to that of the 0S dough of all the formulations studied. In Table
4 it can be observed that maltitol has the same carbon numbers and
hygroscopicity and similar molecular weight and solubility as sucrose.
Therefore, from a rheological point of view, maltitol interacts with all the dough
ingredients similar to sucrose.
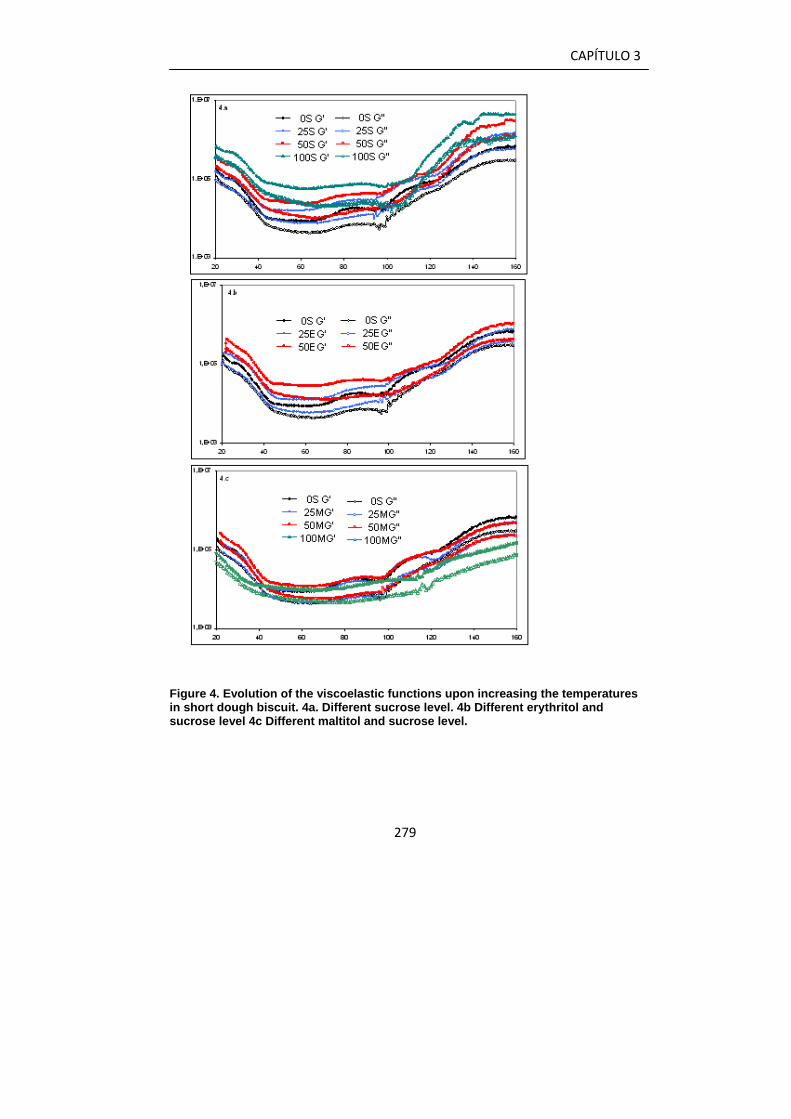
CAPÍTULO 3
279
Figure 4. Evolution of the viscoelastic functions upon increasing the temperatures in short dough biscuit. 4a. Different sucrose level. 4b Different erythritol and sucrose level 4c Different maltitol and sucrose level.
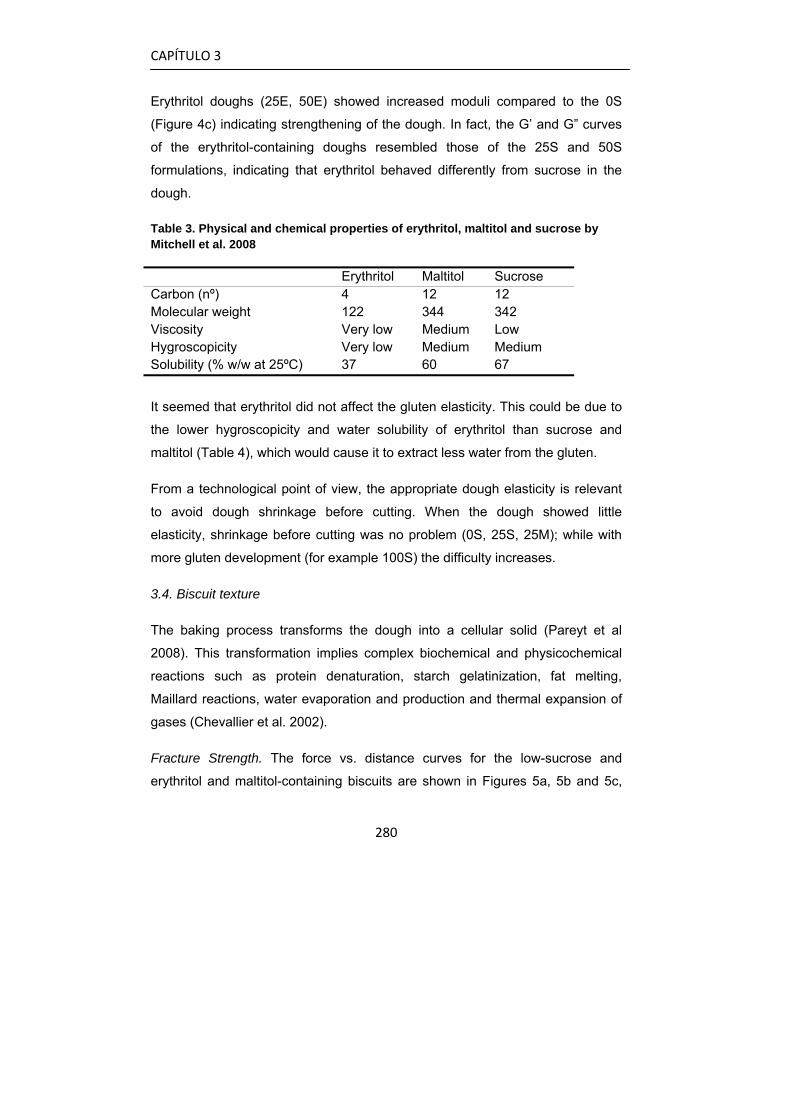
CAPÍTULO 3
280
Erythritol doughs (25E, 50E) showed increased moduli compared to the 0S
(Figure 4c) indicating strengthening of the dough. In fact, the G’ and G” curves
of the erythritol-containing doughs resembled those of the 25S and 50S
formulations, indicating that erythritol behaved differently from sucrose in the
dough.
Table 3. Physical and chemical properties of erythritol, maltitol and sucrose by Mitchell et al. 2008
Erythritol Maltitol Sucrose Carbon (nº) 4 12 12 Molecular weight 122 344 342 Viscosity Very low Medium Low Hygroscopicity Very low Medium Medium Solubility (% w/w at 25ºC) 37 60 67 It seemed that erythritol did not affect the gluten elasticity. This could be due to
the lower hygroscopicity and water solubility of erythritol than sucrose and
maltitol (Table 4), which would cause it to extract less water from the gluten.
From a technological point of view, the appropriate dough elasticity is relevant
to avoid dough shrinkage before cutting. When the dough showed little
elasticity, shrinkage before cutting was no problem (0S, 25S, 25M); while with
more gluten development (for example 100S) the difficulty increases.
3.4. Biscuit texture
The baking process transforms the dough into a cellular solid (Pareyt et al
2008). This transformation implies complex biochemical and physicochemical
reactions such as protein denaturation, starch gelatinization, fat melting,
Maillard reactions, water evaporation and production and thermal expansion of
gases (Chevallier et al. 2002).
Fracture Strength. The force vs. distance curves for the low-sucrose and
erythritol and maltitol-containing biscuits are shown in Figures 5a, 5b and 5c,
CAPÍTULO 3
281
respectively. In all the curves it can be seen that the force increased up to a
point where it drops instantaneously. The distance at the point of break is the
resistance of the sample to bend and is related with the fragility of the sample.
All the biscuits fractured under tension close to the central zone where the
maximum stress occurred.
Figure 5a shows that for biscuits with reduced sucrose content (50S and 100SF
biscuits) the distance until fracture increased, meaning more resistance to
fracture and higher elastic response. 0S biscuits showed the highest force while
the sucrose-reduced biscuits showed decreased fracture strength. 25S biscuits
had similar resistance to break as the 0S biscuits but, but with lower fracture
force. These findings are in agreement with previous studies (Sai Manohar et al.
1997, Pareyt et al. 2009b) who presented decreased break strength with
decreased sugar content.
The present authors demonstrated the competition of sucrose with gluten for
the water in earlier experiments with mixtures of gluten and sugar. A gluten
network was developed in a mixograph with water. Once sugar was added, the
water came out (sugar preference) and the gluten network created was broken,
which was also reported by other authors (e.g. Pareyt et al.2008). One impact
of sucrose in the final biscuit isthat a weak network is formed and biscuits break
easily. As the sucrose quantity decreases, the gluten network becomes stronger
resulting in an increasing breaking strength. Also, Maache-Rezzoug et al.
(1988) affirms that sucrose disperses protein and also starch molecules, making
the biscuit a fragile product. Furthermore, the decrease in breaking force was
less abrupt in the sucrose-free biscuits. In agreement with Baltsavias et al.
(1999), this indicates that the crack was propagated at smaller velocity caused
by more energy dissipation due to plastic deformation for the sucrose-reduced
biscuits. Also the study of the gradient reflects this behaviour (figure5a), with the
0S having the highest gradient followed by 25S>50S and 100S.
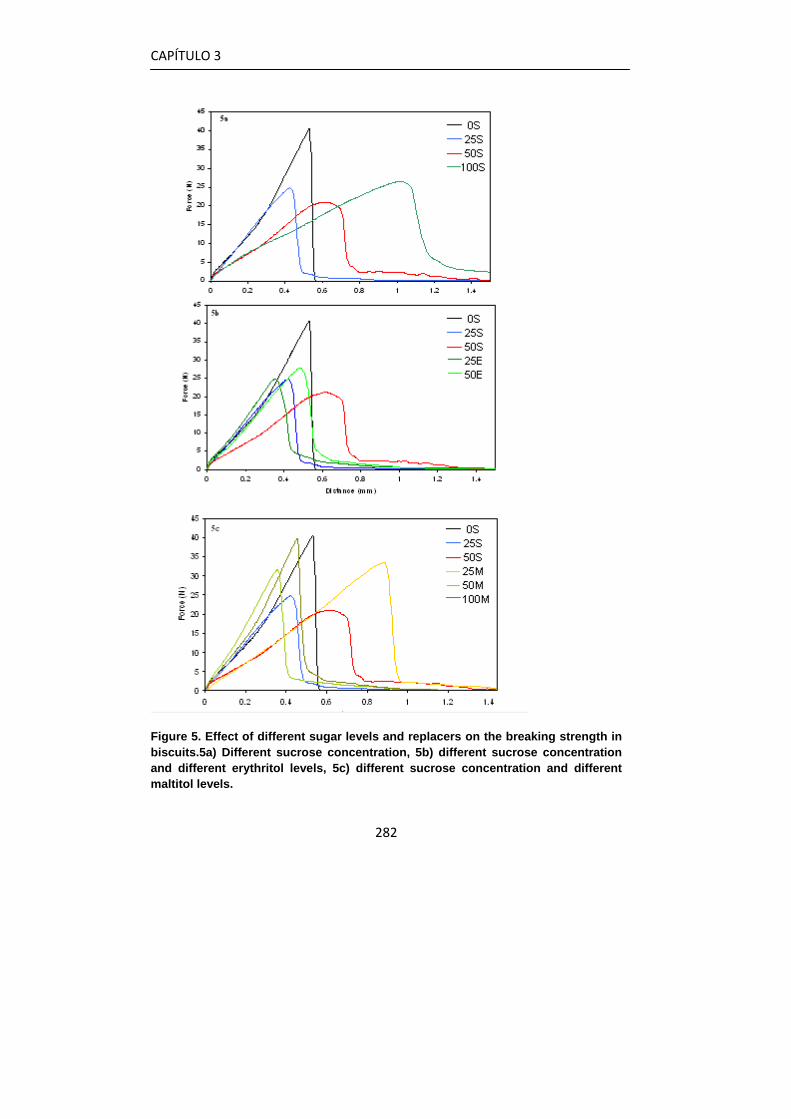
CAPÍTULO 3
282
Figure 5. Effect of different sugar levels and replacers on the breaking strength in biscuits.5a) Different sucrose concentration, 5b) different sucrose concentration and different erythritol levels, 5c) different sucrose concentration and different maltitol levels.
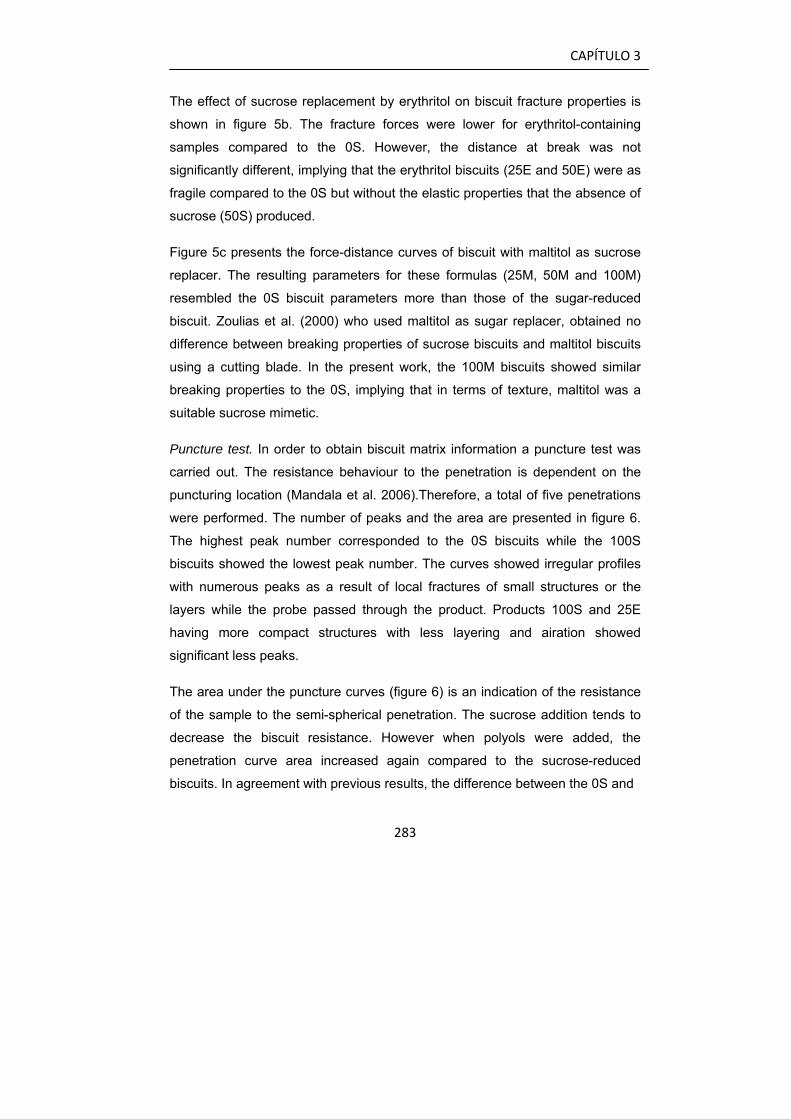
CAPÍTULO 3
283
The effect of sucrose replacement by erythritol on biscuit fracture properties is
shown in figure 5b. The fracture forces were lower for erythritol-containing
samples compared to the 0S. However, the distance at break was not
significantly different, implying that the erythritol biscuits (25E and 50E) were as
fragile compared to the 0S but without the elastic properties that the absence of
sucrose (50S) produced.
Figure 5c presents the force-distance curves of biscuit with maltitol as sucrose
replacer. The resulting parameters for these formulas (25M, 50M and 100M)
resembled the 0S biscuit parameters more than those of the sugar-reduced
biscuit. Zoulias et al. (2000) who used maltitol as sugar replacer, obtained no
difference between breaking properties of sucrose biscuits and maltitol biscuits
using a cutting blade. In the present work, the 100M biscuits showed similar
breaking properties to the 0S, implying that in terms of texture, maltitol was a
suitable sucrose mimetic.
Puncture test. In order to obtain biscuit matrix information a puncture test was
carried out. The resistance behaviour to the penetration is dependent on the
puncturing location (Mandala et al. 2006).Therefore, a total of five penetrations
were performed. The number of peaks and the area are presented in figure 6.
The highest peak number corresponded to the 0S biscuits while the 100S
biscuits showed the lowest peak number. The curves showed irregular profiles
with numerous peaks as a result of local fractures of small structures or the
layers while the probe passed through the product. Products 100S and 25E
having more compact structures with less layering and airation showed
significant less peaks.
The area under the puncture curves (figure 6) is an indication of the resistance
of the sample to the semi-spherical penetration. The sucrose addition tends to
decrease the biscuit resistance. However when polyols were added, the
penetration curve area increased again compared to the sucrose-reduced
biscuits. In agreement with previous results, the difference between the 0S and
CAPÍTULO 3
284
Figure 6. Effect of different sugar levels and replacers on the puncture test in biscuits. 6a) Different sucrose concentration, 6b) different sucrose concentration and different erythritol levels, 6c) different sucrose concentration and different maltitol levels.
CAPÍTULO 3
285
the polyol-containing biscuits was the less accentuated when sucrose was
replaced by maltitol (25M, 50M, 100M) compared to erythritol (25E, 50E)
3.5. Biscuit dimensions
Table 5 presents the biscuit dimensions. Sucrose reduction tended to decrease
biscuit diameter (length and width) while increasing the thickness. However, no
significant effects of sucrose reduction and sucrose replacement were found on
biscuit dimensions. Several authors have previously observed an increase in
biscuit diameter (Zoulias 2000, Sai Manohar 1997) and decrease in height
(Pareyt 2009b) with increasing sucrose content. Zoulias et al. (2000) also found
no changes when using maltitol as sucrose replacement. Billaux et al. 1991
related the baking spread with the viscosity. As the solubility of maltitol in water
is similar to that of sucrose it is expected that the dough will flow similarly
resulting in equal dimensions.
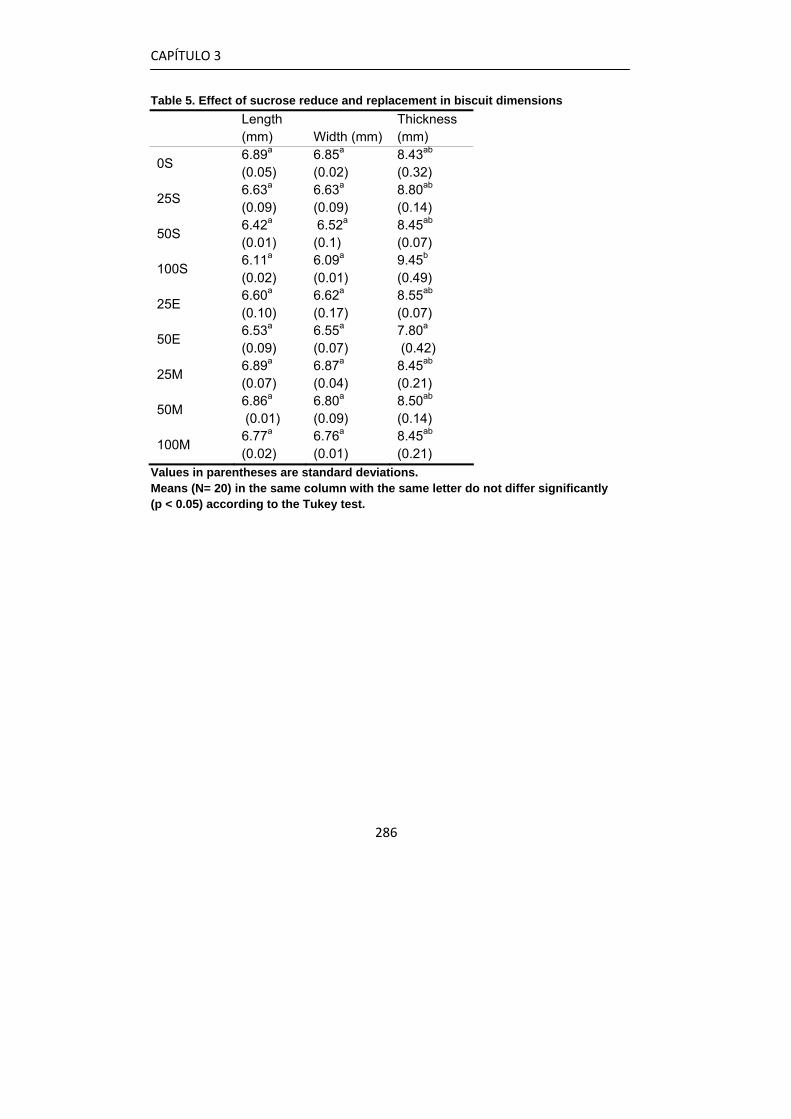
CAPÍTULO 3
286
Table 5. Effect of sucrose reduce and replacement in biscuit dimensions
Length (mm) Width (mm)
Thickness (mm)
0S 6.89a (0.05)
6.85a (0.02)
8.43ab (0.32)
25S 6.63a (0.09)
6.63a (0.09)
8.80ab (0.14)
50S 6.42a (0.01)
6.52a (0.1)
8.45ab (0.07)
100S 6.11a (0.02)
6.09a (0.01)
9.45b (0.49)
25E 6.60a (0.10)
6.62a (0.17)
8.55ab (0.07)
50E 6.53a
(0.09) 6.55a (0.07)
7.80a (0.42)
25M 6.89a (0.07)
6.87a (0.04)
8.45ab (0.21)
50M 6.86a (0.01)
6.80a (0.09)
8.50ab (0.14)
100M 6.77a (0.02)
6.76a (0.01)
8.45ab (0.21)
Values in parentheses are standard deviations. Means (N= 20) in the same column with the same letter do not differ significantly (p < 0.05) according to the Tukey test.
CAPÍTULO 3
287
4. Conclusion
The results described in previous sections indicated that sucrose plays an
important role in biscuit production and final biscuit characteristics. The amount
and type of sugar replacer used have been shown to be very important factors
and the effect of the sugar replacer on the gluten development and its
interaction with water seem very important factors to take into account in
reformulation with regard to sugar replacement.
The total absence of sucrose increases the gluten network providing elasticity to
the dough and the biscuit, which is an undesirable effect in short dough biscuit.
Biscuit formulas with high sucrose replacement by erythritol showed higher
elasticity that the ones with sucrose or maltitol.
Only complete sucrose replacement was achieved with maltitol (100M), whilst
the erythritol can be used up to 50% of sucrose replacement (50E)
Compared to the reference biscuit with about 17% (sugar/flour percentage)
sucrose (0S) the complete replacement of sucrose by maltitol (100M) was not
significantly different in breaking strength. Comparing 50S, 50M and 50E, the
biscuit with 50% sucrose replacement with erythritol (50E) showed the largest
reduction in texture quality, i.e fracture behaviour.
References
AACC International Method. (2009). Approved Method of Analysis 11th Ed.
Method 38-12.02, 44-15.02.
Auh J.H., Lee H.G., Kim J.W., Kim J.C., Yon H.S., Park K.H. (1999). Highly
concentrated oligosaccharides as a protein cryoprotectant for surimi.
Journal of Food Science 64, 418-422.
CAPÍTULO 3
288
Baltsavias A., Jurgens A., Van Vliet T. (1999). Fracture properties of short-
dough biscuits: effect of composition. Journal of Cereal Science 29, 235-
244.
Biliaderis C.G., Maurice T. J., Vose J.R. (1980). Starch gelatinization
phenomena studied by differential scanning calorimetry. Journal of Food
Science 45, 1669-1680.
Billaux M.S., Flourie B., Jacquemin C. and Messing B. (1991).Sugar alcohols.
In: Hadbook of Sweeteners. Ed by Marie S and Piggot JR, Blackie,
Glasgow, pp72-103.
Bloksma A.H. (1980). Effect heating rate on viscosity of wheat flour doughs.
Journal of Texture Studies 10, 261-269.
Bloksma, A.H. (1990). Dough structure, dough rheology, and baking quality.
Cereal Food World 35, 237-244.
Chevallier S., Colonna P., Della Valle G., Lourdin D. (2000). Contribution of
major ingredients during baking of biscuit dough system. Journal of Cereal
Science 31, 241-252.
Chevallier S., Colonna P., A. Buleón, Della Valle G. (2000). Physicolchemical
behaviors of sugars, lipids, and gluten in short dough and biscuit. Journal of
Agriculture Food Chemistry 48, 1322-1326.
Chevallier S., Della Valle G., Colonna P., Broyart B., Trystram G. (2002).
Structural and chemical modifications of short dough during baking. Journal
of Cereal Science 35, 1-10.
Dreese P.D., Faubion J.M., Hoseney R.C. (1988). Dynamic rheological
properties of flour, gluten and gluten-starch doughs. Temperature dependen
changes during heating. Cereal chemistry 65, 348-352.
Drewnowski A., Nordenstenb K., Dwyer C. J. (1998). Replacing sugar and fat in
cookies: Impact on product quality and preference. Food Quality and
Preference 9, 13-20.
CAPÍTULO 3
289
Eliasson A.C.1992. A calorimetric investigationof the influence of sucrose on the
gelatinization of starch. Carbohydrate Polymers 18, 131-138.
Gallagher E., O’ Brien C.M., Scannell A.G.M., Arendt E.K. (2003). Evaluation of
sugar replacers in short dough biscuit production. Journal of food
engineering 56, 261-263.
Hoover R., Vasanthan T. 1994. Effect of heat-moisture treatment on the
structure and physicochemical properties of cereal, tuber, and legume
starches. Carbohydrate Research 252 (1994), pp 33-53.
Jacobs, H., & Delcour, J. A. (1998). Hydrothermal modifications of granular
starch, with retention of the granular structure: a review. Journal of
Agricultural and Food Chemistry, 46, 2895-2905.
Kaizawa A., Maruoka N., Kawai A., Kamano H., Jozuka T., Senda T., Akiyama,
T. (2008). Thermophysical and heat transfer properties of phase change
material candidate for waste heat transportation system. Heat Mass
Transfer 44, 763-769.
Kalichevsky M.T., Jaroszkiewscz E.M., Blanshard J.M.V.(1992). Glass transition
of gluten.1: gluten and gluten-sugar mixtures. International Journal of
Biological Macromoleculs 14 (5) 257-266.
Kulp K., Lorenz K and Stone M. (1991). Functionality of carbohydrate
ingredients in bakery products. Food Technology 45(3), 136-140.
Kweon M., Slad L. Levin H., Martin R., Souza E. (2009). Exploration of sugar
functionality in sugar-snap and wire-cut cookie baking: implications for
potencial sucrose replacement or reduction.Cereal Chemisrty 86 (4), 425-
433.
Maache Rezzoug Z., Bouvier J.M, Allaf K., Patras C. (1998). Effect of principal
ingredients on rheological behaviour of biscuit dough and on quality of
biscuits. Journal of Food engineering 35, 23-42.
CAPÍTULO 3
290
Mandala I.G., Ioannou C.A., Kostaropoulos A.E. (2006). Textural attributes of
commercial biscuits. Effect of relative humidity on their quality. International
Journal of Food Science and Technology 41, 782-789.
Manley J.R.D. In “Technology of Biscuits, Crackers and Cookies” 2nd ed., Ellis
Horwwood, Chistester (1991) pp 153.
Mitchell, Helen (Editor). Sweeteners and Sugar Alternatives in Food
Technology.Chichester, England: Wiley, (2008). p 157.
Olewnik M.C. Kulp K. (1984). The effect of mixing time and ingredient variation
on farinograms of cookie doughs. Cereal Chemistry 61, 532-537.
Olinger P.M., Velas V.S. (1996). Opportunities and advantges of sugar
replacement. Cereal food world 41(3) 110-117.
Pareyt B., Delcour J.A. (2008). The role of wheat flour constituents, sugar, and
fat in low moisture cereal based products: a review on sugar-snap biscuits.
Critical reviews in food science and nutrition 48, 824-839.
Pareyt, B. , Talhaoui, F. , Kerckhofs, G. , Brijs, K. , Goesaert, H. , Wevers, M. ,
Delcour, J.A. (2009a). The role of sugar and fat in Sugar-Snap cookies:
structural and textural properties. Journal of Food Enginering 90(3), 400-
408
Pareyt B. , Brijs, K. , Delcour J.A. (2009b). Sugar-Snap cookie dough setting:
the impact of sucrose on gluten functionality. Journal of Agricultural Food
Chemistry 57,7 814-7818.
Pareyt B., Goovaerts M., Broekaert W.F., Delcour J.A. (2011). Arabinoxylan
oligosaccharides (AXOS) as a potencial sucrose replacer in sugar-snap
cookies. LWT-Food Science and Technology 44, 725-728.
Roos Y.H.(1995). Food components and polymers In ‘Phase Transitions in
Foods’(S.L. Taylor,ed.) pp.133-135, Academic Press, San Diego, CA.
Spies R.D., Hoseney R.C. (1982). Effects of sugars on starch gelatinization.
Cereal Chemistry 59,128-131.
CAPÍTULO 3
291
Sai Manohar R., Haridas Rao P.(1997). Effect of sugars on the rheological
characteristics of biscuit dough and quality of Biscuits. Journal o Food
Science and Agriculture 75, 383-390.
Singh A.P., Bhattacharya M. (2005). Development of dynamic modulus and cell
opening of dough during baking. Journal of Texture Studies 36, 44-67.
Yamazaki W.T. (1971). Soft wheat products. In: Wheat Chemistry and
Technology, ed. Pomeranaz Y. American Association of Cereal Chemists,
St Paul, MN USA, pp 749.
Zoulias E.I., Piknis S., Oreopoulou V. (2000). Effect of sugar replacemnt by
polyols and acesulfame-K on properties of low-fat cookies. Journal of the
science of food and agriculture 80, 2049-2056.


RESUMEN Y DISCUSIÓN DE LOS RESULTADOS

RESUMEN Y DISCUSIÓN DE LOS RESULTADOS
295
RESUMEN Y DISCUSIÓN DE RESULTADOS
La presente tesis doctoral se enmarca dentro del proyecto de la Comisión
Interministerial de Ciencia y Tecnología titulado “Reformulación de alimentos
por adición de nuevos ingredientes comerciales para disminuir los contenidos
en azúcar o grasas. Efectos sobre la reología, microestructura, propiedades
sensoriales y aceptación”. El proyecto se centra en el estudio de las
interacciones entre ingredientes y los cambios estructurales que introducen los
nuevos ingredientes, así como su efecto sobre la calidad y la aceptación del
producto final por parte del consumidor. El proyecto aborda el estudio de dos
modelos de matrices alimentarias: uno de baja humedad y otro de alta
humedad.
En particular, la presente tesis doctoral se centra en el estudio de galletas de
masa corta, seleccionadas como el modelo de baja humedad. Se estudia el
efecto de la incorporación de fibra, el reemplazo de azúcar y el reemplazo de
grasa utilizando nuevos ingredientes.
A pesar de que, actualmente en el mercado, el precio de los sustitutos
utilizados elevaría el precio del producto, se esperaría compensar el
incremento del precio con el beneficio obtenido al disminuir el contenido
calórico y el aumento del contenido en fibra.
Los dos primeros objetivos que se abordaron se basaron en la sustitución de la
harina presente en la formulación de las galletas por concentraciones
crecientes de almidón resistente (AR) como fuente de fibra. El estudio de la
masa reveló una mayor densidad de la misma con la adición de AR y una
mayor resistencia al corte. La dureza de la masa también aumentó con la
adición de AR como se mostró mediante ensayos de penetración y compresión.
El estudio reológico de la masas mostró la estructura típica de un gel débil, con
valores mayores de G’ respecto a G”. Una sustitución del 20% de harina por
AR mostró un comportamiento estructural similar a la galleta control según los
RESUMEN Y DISCUSIÓN DE LOS RESULTADOS
296
ensayos oscilatorios de viscoelasticidad lineal, mientras que sustituciones del
40 y 60% de harina por AR presentaron un comportamiento diferenciado con
valores de G’ y G’’ significativamente mayores, aunque en ningún caso se
afectó tanδ, es decir la relación entre la componente viscosa y la elástica. Los
resultados de los ensayos de fluencia-relajación mostraron cómo la adición de
AR aumentó la elasticidad y disminuyó la deformabilidad de la masa. Al igual
que tanδ, el % de recuperación no se alteró por la adición de AR lo que implica
que la incorporación del AR no provocó un cambio en el tipo de estructura, sino
un efecto concentrador de los elementos estructurales. La deformabilidad de la
masa se correlacionó positivamente con el aumento en las dimensiones de la
galleta durante el horneado, es decir las masas menos elásticas fueron más
deformables y dieron lugar a galletas de mayores dimensiones.
En la galleta, la adición de AR proporcionó galletas menos deformables y
menos rígidas que la galleta control (sin reemplazo de harina por AR). También
se observó cambios en el color al adicionar AR aumentando el valor de
luminosidad. La aceptabilidad de las galletas con AR por los consumidores fue
buena, así para niveles de reemplazo de la harina de hasta el 40% no se
encontraron diferencias significativas con el control. Para niveles superiores de
reemplazo (60%), disminuyó la aceptabilidad y se afectó negativamente la
decisión de compra.
La cantidad diaria recomendada de fibra se encuentra entre 25-30g/dia. La
galleta consumida comúnmente en España aporta 2,1g fibra/100g de producto,
mientras que la galleta más alta con almidón resistente contiene 15,4g
fibra/100g de producto. Evidentemente, el consumo de galletas puede no ser
diario y puede ser puntual, además, no se esperaría alcanzar los 100g de
producto al día, únicamente, sino unos 30-50g; por lo que con el consumo de
galletas con almidón resistente se aumentaría unos 7g de fibra a la cantidad
diaria (23% de la CDR) para aquellos consumidores habituales.
Por otro lado, se estudió la sustitución de harina en un 5 y un 10% por fibra de
manzana y por fibra de trigo de dos longitudes.
RESUMEN Y DISCUSIÓN DE LOS RESULTADOS
297
El estudio reológico de la masa mostró que la adición de todas las fibras a la
concentración del 10% aumentó significativamente los módulos de elasticidad
(G’) y viscosidad (G”).
En las galletas se observó que las fibras de trigo proporcionaron un olor y sabor
neutro a la galleta, sin embargo, al hidratarse y crear una matriz más compacta
(como mostraron los ensayos de penetración e imagen), la resistencia a la
rotura frente a la galleta control aumentó y disminuyó la cantidad de picos de
sonido. La resistencia a la rotura y el sonido producido con la adición de fibra
de manzana resultó ser similar a la galleta control aunque esta fibra confirió un
aroma y sabor afrutado.
La trayectoria oral de las galletas con fibra de manzana a dos niveles diferentes
de grasa se estudió mediante la técnica sensorial dinámica llamada
“Predominio Temporal de las Sensaciones”, y se relacionó con las preferencias
de los consumidores. Como resultado se concluyó que la primera sensación
dominante al comer una galleta fue la dureza seguida de los términos
crujiente/crocante, arenoso, seco en boca, pastoso y sensación grasa. Por otra
parte, los consumidores penalizaron las galletas excesivamente duras y las que
proporcionaron mayor sensación de sequedad bucal, que resultaron ser las
altas en fibra y bajas en grasa; además, estas galletas se percibieron como las
de menor carácter crujiente.
Otro de los objetivos planteados fue la sustitución de grasa por tres
ingredientes diferentes: ingrediente mezcla de dextrinas (N-Dulge), inulina de
alto peso molecular e hidroxipropilmetilcelulosa (HPMC).
En todas las sustituciones se observó un aumento de la fuerza de rotura de las
galletas. Este efecto se vio mermado, en el caso de sustitución de la grasa por
dextrinas, con la adición de AR como sustituto parcial de la harina.
La fuerza máxima de penetración aumentó con la sustitución de grasa,
presentando las galletas con inulina una mayor dureza respecto a la galleta
control, así como mayor intensidad del sonido emitido. Por otra parte, aunque
RESUMEN Y DISCUSIÓN DE LOS RESULTADOS
298
instrumentalmente las galletas con un 15% de inulina fueron más sonoras que
la galleta control, este hecho no se vio reflejado en el análisis sensorial
descriptivo, donde si que se registraron cambios en el aroma, sabor y color de
las diferentes formulaciones con dextrinas y HPMC. Cuando se utilizó dextrinas
y AR, el panel de entrenados halló diferencias significativas para la dureza,
carácter crujiente y friabilidad de las galletas bajas en grasa respecto a la
galleta control.
Los consumidores encontraron aceptables las galletas en las que la grasa
había sido reemplazada por inulina o HPMC en un 15%, no resultando
aceptables porcentajes mayores de sustitución (30%). Sin embargo, en las
galletas con reemplazo de grasa por dextrinas y harina por AR (a niveles de 10
y 20% respectivamente) no se encontraron diferencias significativas con la
galleta control.
Finalmente, la sustitución de sacarosa por inulina y eritritol también fue
estudiada desde un punto de vista sensorial e instrumental. Un panel de jueces
entrenados encontró diez atributos significativamente diferentes respecto a la
apariencia externa/interna, la textura, el sonido al masticar, la sensación de
humedad y el sabor. Ambos sustitutos produjeron galletas menos crujientes y
con menor aceptabilidad por parte del consumidor, aunque la aceptación global
de galletas con concentraciones de inulina del 25% no difirió significativamente
de la galleta control. El atributo sensorial más correlacionado con la
aceptabilidad global de los consumidores fue la aireación de la matriz. Los
datos instrumentales reflejaron que el reemplazo parcial de sacarosa por
eritritol disminuyó el carácter crujiente de las galletas y aumentó la dureza
respecto a la galleta control, mientras que las galletas con reemplazo de
sacarosa por inulina dieron galletas más blandas y con características sonoras
más similares a la galleta control. Las características de textura instrumental se
correlacionaron bien con el análisis sensorial descriptivo, en concreto, se vio
que conforme aumentaban los eventos de sonido instrumentales los jueces
clasificaban las galletas con más sonido al morder/masticar.

RESUMEN Y DISCUSIÓN DE LOS RESULTADOS
299
Para obtener un mayor conocimiento de la función de la sacarosa en las
galletas de masa corta se realizó un estudio de las propiedades térmicas,
reológicas y de textura tanto de la masa como de la galleta.
De los diferentes componentes de las galletas, el gluten fue uno de los más
afectados por la presencia de diferentes azúcares (sacarosa, eritritol y maltitol).
El maltitol y la sacarosa confirieron a la masa y a la galleta propiedades físicas
similares, mientras que los resultados obtenidos con el eritritol fueron similares
a los obtenidos en ausencia de azúcar, dando lugar a galletas más compactas,
elásticas y con mayor fuerza de rotura en comparación con las galletas control
con azúcar o con las galletas con maltitol como sustituto de sacarosa.


CONCLUSIONES

CONCLUSIONES
303
Conclusiones
Las conclusiones principales que se extraen de la presente tesis son:
- Las propiedades reológicas de la masa confieren información estructural de utilidad para la predicción del comportamiento de la masa durante las distintas etapas de la fabricación de las galletas.
- Las propiedades mecánicas y el sonido emitido durante la fractura de la galleta son parámetros fundamentales determinantes de la calidad de la galleta y están relacionados con la aceptabilidad por parte del consumidor.
- El uso de técnicas de calorimetría diferencial proporcionan información de la estructura molecular de los ingredientes de la galleta y explican su funcionalidad.
- La utilización del análisis sensorial descriptivo-cuantitativo es de gran utilidad en la reformulación de galletas, ya que permite un conocimiento global y completo de los atributos que determinan la calidad de las mismas.
- Las nuevas técnicas de análisis sensorial dinámico como el predominio temporal de las sensaciones muestran como el orden e intensidad de aparición de los atributos característicos de las galletas durante el proceso de masticación.
- El aumento de la fuerza de rotura instrumental de las galletas, es decir su dureza, es inversamente proporcional a la aceptación de las mismas.
- El conocimiento de la funcionalidad de los ingredientes de las galletas permite la elección de sustitutos que disminuyen el aporte energético o aumentan su valor nutricional con el

CONCLUSIONES
304
mínimo efecto sobre la calidad sensorial del producto y su aceptabilidad.
- El almidón resistente es un ingrediente que permite incrementar muy significativamente el contenido en fibra de las galletas, ya que se puede incorporar a altas concentraciones sin devaluación de la calidad.
- El almidón resistente confirie rigidez y mayor resistencia a la deformación de la masa, sin embargo, tras el horneado de la masa las galletas obtenidas son más blandas debido a un mayor contenido en humedad y a una menor estructuración de la matriz de la galleta.
- Las propiedades de la fibra utilizada en la sustitución de la harina influye en las características finales de la galleta.
- La adición de fibra de manzana no modifica las características texturales de la galleta confiriéndoles un sabor y aroma afrutado. Por el contrario, las fibras de trigo no modifican el sabor y el aroma pero si las características de textura y sonido de las galletas.
- El reemplazo de grasa por un ingrediente alto en dextrinas aumenta la dureza de la galleta provocando una disminución en la aceptabilidad sensorial, sin embargo, la combinación de las dextrinas con almidón resistente disminuye la dureza y mejora la aceptabilidad que se iguala a la de la galleta control con toda la grasa.
- La inulina utilizada como reemplazante del 15% de grasa aumenta el carácter crujiente de la galleta siendo más apreciada que la galleta control por los consumidores.

CONCLUSIONES
305
- El uso de la hidroxipropilmetilcelulosa para reemplazar grasa afecta a las propiedades mecánicas y da lugar a galletas más duras y con mayor emisión de sonido, que son aceptables hasta un nivel de reemplazo del 15%.
- El estudio de la funcionalidad de los azúcares en galletas muestra que azúcares similares en estructura química como son la sacarosa y el maltitol, proporcionan galletas con características similares.
- El eritritol es un sustituto de sacarosa conveniente porque no tiene efecto fermentativo en el intestino humano pero no resulta óptimo en la formulación de galletas ya que proporciona galletas más elásticas, compactas y resistentes a la fractura respecto a la galleta control.
- El uso de inulina como sustituto de sacarosa en la formulación de galletas resulta óptimo en porcentajes iguales o inferiores al 25%.