mónica delgado gracia - zaguan.unizar.es · la presente tesis doctoral trata el análisis de...
TRANSCRIPT
2013 119
Mónica Delgado Gracia
Analysis of microencapsulatedphase change material slurries
and phase change material emulsions as heat transfer fluid
and thermal storage material
Departamento
Director/es
Ingeniería Mecánica
Zalba Nonay, BelénLázaro Fernández, Ana
Director/es
Tesis Doctoral
Autor
Repositorio de la Universidad de Zaragoza – Zaguan http://zaguan.unizar.es
UNIVERSIDAD DE ZARAGOZA
Departamento
Director/es
Mónica Delgado Gracia
ANALYSIS OF MICROENCAPSULATED PHASECHANGE MATERIAL SLURRIES AND PHASECHANGE MATERIAL EMULSIONS AS HEAT
TRANSFER FLUID AND THERMAL STORAGEMATERIAL
Director/es
Ingeniería Mecánica
Zalba Nonay, BelénLázaro Fernández, Ana
Tesis Doctoral
Autor
Repositorio de la Universidad de Zaragoza – Zaguan http://zaguan.unizar.es
UNIVERSIDAD DE ZARAGOZA

Departamento
Director/es
Director/es
Tesis Doctoral
Autor
Repositorio de la Universidad de Zaragoza – Zaguan http://zaguan.unizar.es
UNIVERSIDAD DE ZARAGOZA
Mónica Delgado Gracia
Zaragoza, August 2013
Ph.D. Thesis
Analysis of microencapsulated phase
change material slurries and phase
change material emulsions as heat
transfer fluid and thermal storage
material

Analysis of microencapsulated phase change material slurries and phase change
material emulsions as heat transfer fluid and thermal storage material
Dissertation presented by MÓNICA DELGADO GRACIA in fulfillment of the requirements for the degree of Doctor at the University of Zaragoza. Advisors: Prof. Mª Belén Zalba Nonay, Ph.D. Prof. Ana Lázaro Fernández, Ph.D. Escuela de Ingeniería y Arquitectura (EINA) Departamento de Ingeniería Mecánica Área de Máquinas y Motores Térmicos Instituto de Investigación en Ingeniería de Aragón (I3A) Universidad de Zaragoza Zaragoza, August 2013

AGRADECIMIENTOS / ACKNOWLEDGMENTS
i
Me gustaría que estas líneas sirvieran para expresar mi agradecimiento a quienes han financiado mi trabajo durante este tiempo, a la empresa CIAT y al Vicerrectorado de Investigación de la Universidad de Zaragoza por la ayuda concedida para la realización de este trabajo. Al Programa Europa de becas de la Obra Social de la CAI y a la COST Action TU 0802 por financiar mi estancia de investigación en Alemania. Así como a las empresas e institutos de investigación que han colaborado con el envío de muestras: BASF, Rubitherm, Fraunhofer UMSICHT, AERO.
A mis directoras de tesis Belén y Ana, por su apoyo técnico y personal, por su rigor académico, por su sensatez y complementariedad, por su constante empuje y por haber confiado en mí para la realización de este trabajo.
To Stefan Gschwander and all the people of the group “Thermally Active Materials and Solar Cooling” from Fraunhofer ISE Institute, for their warm welcome during those months in Freiburg. To all the people that I met there and made more bearable those days away from my friends and family.
A mis amigos, compañeros y familia, a los que están más cerca y a los que están más lejos, por todos esos ratos de ocio que requiere todo esfuerzo continuado.
Al grupo GITSE por su buena acogida, especialmente a Luis Serra y a José María Marín.
A mis compañeros de trabajo y sala durante estos años, por ser además de compañeros buenos amigos, por compartir innumerables momentos con ellos: especialmente a Pablo, Conchita, Nuria, Sergio, Javi, Mateo, Marisa, Monica C., José Luis y Gemma. La atmósfera de trabajo junto a ellos ha sido simplemente perfecta.
A mi hermano, por ser mi referente en este camino, por sus consejos académicos, por sus continuo buen humor, y como no, a mis sobrinos Hugo y Andrea, porque la mejor manera de despejarme y olvidar por un momento la tesis han sido esos ratos junto a ellos.
A mis padres, por ser el pilar fundamental en todo lo que soy, para los que no hay suficientes palabras para agradecerles todo su esfuerzo y amor.
Y ya para terminar a Sebas, por su paciencia, compresión, cariño y amor. Por el placer cotidiano de estar junto a él en el día a día.

Analysis of microencapsulated phase change material slurries and phase change material emulsions as heat transfer fluid and thermal storage material
ii
RESUMEN / ABSTRACT
iii
RESUMEN / ABSTRACT
La presente tesis doctoral trata el análisis de suspensiones y emulsiones de materiales de cambio de fase para su uso como fluido caloportador y material de almacenamiento térmico.
El interés de la tesis nace de la actual conyuntura energética. Dentro de la línea de búsqueda de un modelo energético sostenible, el almacenamiento térmico de energía contribuye a la utilización eficiente de la energía. Las aplicaciones del almacenamiento térmico de energía mediante cambio de fase sólido-líquido se encuentran en fase de expansión y es durante los últimos años cuando está tomando más relevancia el uso de estos materiales de cambio de fase suspendidos en agua.
Por el momento existen todavía puntos críticos a tratar que permitan su integración de forma más extensa. Con este trabajo se ha pretendido avanzar en la resolución de estas dificultades, y analizar su comportamiento térmico y viabilidad técnica frente a sistemas de almacenamiento en sensible con agua, o frente a los sistemas de almacenamiento donde el material de cambio de fase hasta el momento era macroencapsulado.
Esta tesis doctoral parte de un exhaustivo estado del arte acerca de estos nuevos fluidos, prestando especial atención a sus propiedades termofísicas y reológicas y al fenómeno de transferencia de calor. Dentro de esta revisión bibliográfica se han determinado cuáles son las magnitudes objetivo a la hora de seleccionar una suspensión o emulsión de materiales de cambio de fase para su uso como fluido caloportador y material de almacenamiento térmico. Además de estas magnitudes objetivo se han determinado cuáles son sus factores de influencia y cómo se da esta influencia.
Se ha realizado una profunda búsqueda de suspensiones y emulsiones de materiales de cambio de fase, en el mercado comercial, universidades y centros de investigación, llegando a recopilar un total de doce muestras en el laboratorio. Aquellas que no han evidenciado ningún tipo de incompatibilidad con su recipiente contenedor ni ningún proceso de desestabilización física durante los primeros días de almacenamiento en el laboratorio han sido analizadas. En primer lugar se han obtenido sus curvas Entalpía-Temperatura, analizando qué muestras son las que presentan una mayor capacidad de
Analysis of microencapsulated phase change material slurries and phase change material emulsions as heat transfer fluid and thermal storage material
iv
almacenamiento térmico, y analizando posibles fenómenos de histéresis y subenfriamiento. En base a estos primeros análisis han resultado candidatas dos muestras, con diversas fracciones másicas del material de cambio de fase en suspensión para su uso como fluido caloportador y material de almacenamiento térmico. De estas muestras candidatas se han obtenido las curvas de Conductividad térmica-Temperatura, a partir de las medidas de densidad, calor específico y difusividad térmica. En el caso de las medidas de difusividad térmica se ha planteado una metodología de medida para la obtención de valores fiables y reproducibles en la caracterización de suspensiones y emulsiones de materiales de cambio de fase con un equipo Láser Flash.
Para completar esta caracterización, se han determinado sus propiedades reológicas, obteniendo las curvas de Viscosidad-Velocidad de Cizalla y determinando su modelo de comportamiento.
Dentro de este trabajo de carácter reológico, realizado con un reómetro de esfuerzo controlado, se ha planteado una primera metodología para la determinación de la viscosidad del octadecano como material de cambio de fase, en estado líquido y durante su transición de estado. Esta propuesta de metodología permite la determinación de la viscosidad de otros materiales de cambio de fase. Estos valores se pueden utilizar en los modelos numéricos para simular la convección natural en los sistemas con el material de cambio de fase macroencapsulado.
De forma complementaria a esta caracterización experimental, se ha analizado la estabilidad y compatibilidad tanto de sistemas tradicionales de almacenamiento de energía térmica donde el material de cambio de fase está macroencapsulado, como de sistemas donde el material de cambio de fase se encuentra en forma de suspensión o emulsión. Se ha analizado la estabilidad física de suspensiones de materiales de cambio de fase microencapsulado, en cuanto a posibles problemas de estratificación o cremado y en cuanto a la posible ruptura de sus microcápsulas cuando éstas son sometidas a ciclos termo-mecánicos. Se ha completado este análisis de estabilidad con el análisis de posibles fenómenos de contaminación microbiana. En términos de compatibilidad, se ha evaluado la compatibilidad de diversos materiales de cambio de fase de baja temperatura con cápsulas esféricas de plástico. Además se han analizado los posibles fenómenos de corrosión de aleaciones metálicas típicas de instalaciones térmicas, cuando entran en contacto con estas suspensiones de materiales de cambio de fase.
RESUMEN / ABSTRACT
v
En vista del análisis bibliográfico, quedó patente la controversia en los resultados experimentales y numéricos de los diversos autores acerca del fenómeno de transferencia de calor en estos nuevos fluidos. Es por este motivo que se ha diseñado, puesto en marcha y validado una instalación experimental, la cual permite el estudio del fenómeno de transferencia de calor y de la mecánica de fluidos en suspensiones y emulsiones de materiales de cambio de fase. Es en esta instalación experimental donde se ha analizado la idoneidad de las suspensiones de materiales de cambio de fase candidatas para su uso como fluido caloportador.
La tesis doctoral finaliza con un análisis de aplicaciones. Se ha comparado el funcionamiento de un depósito de almacenamiento de energía térmica con suspensiones de materiales de cambio de fase, frente a un depósito con cápsulas esféricas de materiales de cambio de fase, y frente a un depósito de almacenamiento térmico en sensible con agua. Esta comparación se ha realizado en base a términos de potencia, densidad energética y pérdida de carga.

Analysis of microencapsulated phase change material slurries and phase change material emulsions as heat transfer fluid and thermal storage material
vi
INDEX
vii
INDEX
Agradecimientos / Acknowledgments .......................................................... i
Resumen / Abstract ........................................................................................ iii
Index of figures ............................................................................................... xi
Index of tables ................................................................................................ xix
Nomenclature ................................................................................................. xxi
Preamble: motivation, objectives and framework of the thesis ........................ 1 Motivation .............................................................................................. 3 Thesis structure and specific objectives................................................. 4 Framework of the thesis ......................................................................... 5
Chapter 1. State of technology. Review on PCM emulsions and microencapsulated PCM slurries: Materials, heat transfer studies and applications ...................................................................................................... 9
1.1 General aspects about PCM emulsions and PCM slurries ......... 10 1.2 Manufacture procces .................................................................. 13
1.2.1 Elaboration of emulsions .................................................. 13 1.2.2 Fabrication of PCM microcapsules ................................... 13
1.3 Compilation of PCM emulsions and microencapsulated PCM slurries ......................................................................................... 17
1.4 Main characteristics of PCM emulsions and mPCM slurries ....... 24 1.4.1 Hysteresis and subcooling ....................................... 24 1.4.2 Stability ..................................................................... 28 1.4.3 Rheological behavior, viscosity and pressure drop .. 32 1.4.4 Thermal properties: thermal conductivity .................. 36
1.5 Heat transfer ............................................................................... 39 1.5.1 Heat transfer by internal forced convection .............. 39 1.5.2 Heat transfer through natural convection in mPCM
slurries ..................................................................... 40 1.5.3 Other studies ............................................................ 44
1.6 Applications ................................................................................. 44 1.7 Conclusions ................................................................................. 46
Chapter 2. Determination of the thermophysical properties of PCM slurries and PCM emulsions ......................................................................................... 49
2.1 Introduction ................................................................................. 50 2.2 Enthalpy depending on the temperature ..................................... 52
Analysis of microencapsulated phase change material slurries and phase change material emulsions as heat transfer fluid and thermal storage material
viii
2.2.1 Equipment for the determination of the Enthalpy depending on the temperature .................................................... 53 2.2.2 Results obtained ................................................................. 53
2.3 Thermal conductivity ................................................................... 56 2.3.1 Theoretical basis for the measurement of thermal diffusivity with Laser Flash equipment ......................................... 58
2.3.2 Measurement of liquids whose thermal diffusivity is known .................................................................................................... 63 2.3.3 Measurement of the PCM slurries ...................................... 66
2.4 Conclusions ................................................................................. 67
Chapter 3. Determination of rheological properties ......................................... 69 3.1 Introduction or theoretical basis of the measurements to
accomplish .................................................................................. 70 3.2 Rheological characterization of PCM slurries and PCM
emulsions .................................................................................... 74 3.2.1 Results of the round tests ................................................... 75
3.3 Rheological characterization of PCMs for the study of natural convection ................................................................................... 82
3.3.1 Materials and methodology ................................................ 85 3.3.2 Results ............................................................................... 87 3.3.3 Analysis of the results ........................................................ 93
3.3.4 Methodology proposed for the determination of the viscosity ....................................................................................... 95
3.4 Conclusions ................................................................................. 97 3.4.1 Conclusions about the rheological characterization of PCM slurries and PCM emulsions ........................................................ 97 3.4.2 Conclusions about the rheological characterization of PCMs for the study of natural convection .................................... 98
Chapter 4. Analysis of stability and compatibility of thermal energy storage systems with PCM ............................................................................................ 99
4.1 Physical stability of PCM slurries and PCM emulsions ................ 100 4.1.1 Problems of stratification or creaming ................................ 100
4.1.2 Problems of rupture of PCM microcapsules in suspension 107 4.1.3 Microbial contamination ...................................................... 112
4.2 Analysis of compatibility .............................................................. 112 4.2.1 PCM-plastic compatibility ................................................... 112
4.2.2 Corrosion phenomena of different metallic alloys when being in contact with PCM slurries and PCM emulsions ............. 115
4.3 Conclusions ................................................................................. 122
Chapter 5. Design, start-up and validation of an experimental installation for the study of heat transfer and pressure loss in microencapsulated PCM slurries and emulsions ...................................................................................... 125
INDEX
ix
5.1 Introduction ................................................................................. 127 5.2 Description of the experimental installation ................................. 127
5.2.1 Description of the devices of the experimental installation . 128 5.3 Validation of the experimental installation ................................... 134
5.3.1 Validation of the measurement of pressure drop ................ 136 5.3.2 Validation of the heat flux ................................................... 137 5.3.3 Validation of the wall temperature measurements .............. 138
5.4 Empirical model for the correction of the wall temperature measurements ............................................................................ 142
5.5 Data acquisition programme ....................................................... 145 5.6 Conclusions ................................................................................. 146
Chapter 6. Analysis of microencapsulated PCM slurries as heat transfer fluid 149 6.1 Aim of the tests ........................................................................... 150 6.2 Experimental results .................................................................... 151
6.2.1 Verification of the energy balance ...................................... 151 6.2.2 Measurements of pressure drop and comparison to water 158
6.2.3 Measurements of wall temperature and determination of the internal forced convective coefficient. Comparison to water .. 163
6.3 Conclusions ................................................................................. 172
Chapter 7. Analysis of applications: tanks of PCM slurries. Comparison with other thermal energy storage systems ...................................................................... 175
7.1 Introduction ................................................................................. 176 7.1.1 Review of latent TES systems. Water exchange ................ 178 7.1.2 Considerations about heat transfer in latent TES systems ....................................................................................... 182 7.1.3 Objetives ............................................................................ 182
7.2 TES system with spherical capsules of PCM .............................. 183 7.2.1 PCM used .......................................................................... 183
7.2.2 Development of the numerical model for the melting of a sphere ......................................................................................... 185
7.2.3 Model of the tank with PCM spheres .................................. 190 7.3 TES system with water and with microencapsulated PCM slurry 197
7.3.1 Microencapsulated PCM slurry and description of the tank ............................................................................................. 197 7.3.2 Model of the tank with water and with the microencapsulated PCM slurry .................................................... 198
7.4 Comparison among the results of the studied TES systems ....... 205 7.5 Conclusions ................................................................................. 207
Chapter 8. Conclusions and future work .......................................................... 209 8.1 Contributions ............................................................................... 210
8.1.1 Bibliographic review ........................................................... 210 8.1.2 Thermophysical properties ................................................. 210
Analysis of microencapsulated phase change material slurries and phase change material emulsions as heat transfer fluid and thermal storage material
x
8.1.3 Rheological properties ........................................................ 211 8.1.4 Analysis of stability and compatibility of TES systems with PCMs .......................................................................................... 233 8.1.5 Results of heat transfer and fluids mechanics .................... 212 8.1.6 Thermal and technical behavior of TES systems ............... 214
8.2 Dissemination of results .............................................................. 214 8.3 Future work ................................................................................. 215
Capítulo 8. Conclusiones y trabajo future ........................................................ 219 8.1 Aportaciones ............................................................................... 220 8.1.1 Revisión bibliográfica ......................................................... 220 8.1.2 Propiedades termofísicas ................................................... 220 8.1.3 Propiedades reológicas ...................................................... 221
8.1.4 Análisis de estabilidad y compatibilidad de sistemas de almacenamiento de energía térmica con PCMs .......................... 222 8.1.5 Resultados sobre la transferencia de calor y mecánica de fluidos .......................................................................................... 223 8.1.6 Comportamiento térmico y técnico de sistemas de almacenamiento de energía térmica ........................................... 224
8.2 Difusión de resultados ................................................................. 225 8.3 Líneas futuras ............................................................................. 227
Bibliographic references ............................................................................... 229
Appendix I. Handling and storage of PCM slurries ..................................... 249
Appendix II. Technical specifications of the equipments and calibration certificates ...................................................................................................... 255
Appendix III. Numerical models of simulation in EES of TES systems ..... 271
Appendix IV. Substances analyzed .............................................................. 277
INDEX OF FIGURES
xi
INDEX OF FIGURES
Figure 1.1 Energy density of different Thermal Energy Storage systems. ....... 12 Figure 1.2 Morphology of microcapsules through a SEM microscope (Su et al. 2007 a) ........................................................................................................ 15 Figure 1.3 Microencapsulation process from (Schmidt 2008) .......................... 16 Figure 1.4 Drying process from BASF (Schmidt 2008) .................................... 16 Figure 1.5 Subcooling and hysteresis phenomena .......................................... 24 Figure 1.6 Effect of two different types of seeds on the nucleation process (Günther et al. 2011) ........................................................................................ 27 Figure 1.7 Instability processes in emulsions (Huang et al. 2009) ................... 29 Figure 1.8 Relationship between pumping power and heat transfer (Chen et al. 2006) ........................................................................................................... 33 Figure 1.9 Friction factors vs. Reynolds number (Wang et al. 2007) ............... 35 Figure 1.10 Viscosity values of different PCM dispersions studied in literature ......................................................................................................................... 36 Figure 1.11 Thermal conductivity values for different mPCM slurries studied in literature ........................................................................................................ 38 Figure 2.1 Aspect of the slurries prepared from PCM microcapsules. PCM mass fractions 10, 20 and 30%. Left: BASF manufacturer; Right: Microtek Laboratories ..................................................................................................... 51 Figure 2.2 Emulsion Fraunhofer UMSICHT with thickener. Deformation of the plastic container ............................................................................................... 52 Figure 2.3 Installation of the T-history method for the determination of the Enthalpy-Temperature curves (Lázaro 2008) ................................................... 54 Figure 2.4 Enthalpy-Temperature curves for the different PCM emulsions and mPCM slurries analyzed ............................................................................ 55 Figure 2.5 Enthalpy-Temperature curves of the candidate mPCM slurries ..... 56 Figure 2.6 Installation of the test bench for the determination of the thermal conductivity of materials in the laboratory for determination of thermophysical properties. Left: DSC; Right: Laser Flash equipment ....................................... 58 Figure 2.7 Image of the sampleholder for liquids from Netzsch ...................... 60 Figure 2.8 Drawing of the sampleholder for liquids .......................................... 62 Figure 2.9 Signal of the infrared sensor with the empty sampleholder and with water ........................................................................................................ 63 Figure 2.10 Thermal diffusivity values of water under vacuum or otherwise ... 64
Analysis of microencapsulated phase change material slurries and phase change material emulsions as heat transfer fluid and thermal storage material
xii
Figure 2.11 Values of thermal conductivity of liquids in comparison with their reference values ............................................................................................... 65 Figure 2.12 Thermal conductivity values measured for the candidate slurries DS 5007 and DS 5045 with different PCM microcapsule mass fractions ......... 66 Figure 3.1 Control stress rheometer AR-G2 from TA Instruments ................... 70 Figure 3.2 Oscillatory strain (geomtry seen from above) ................................. 72 Figure 3.3 Left image: Elastic behaviour; Right image: Viscous behaviour (Moreno 2006) .................................................................................................. 73 Figure 3.4 Left image: Strain or stress sweep; Right image: Frequency sweep (Moreno 2006) ...................................................................................... 73 Figure 3.5 Left image: “Solvent trap” placed on the geometry and on the Peltier plate. Right image: Plate geometry for Peltier configuration with “solvent trap” with sample of slurry placed. ..................................................... 75 Figure 3.6 DS 5007 sample. Time sweep. Temperature=28ºC, strain=10%, frequency=1 Hz. Plate geometry of 25 mm without solvent trap. Sample loaded with a narrow pipette and without pre-shear ........................................ 76 Figure 3.7 DS 5007 sample. Time sweep. Temperature=28ºC, strain=10%, frequency=1 Hz. Plate geometry of 25 mm without solvent trap. Sample loaded with a narrow pipette and without pre-shear. ........................................ 76 Figure 3.8 DS 5007 sample. Time sweep. Temperature=28ºC, strain=10%, frequency=1 Hz. Plate geometry of 25 mm without solvent trap. Sample loaded with spatula and without pre-shear. ...................................................... 77 Figure 3.9 DS 5007 sample. Time sweep. Temperature=28ºC, strain=10%, frequency=1 Hz. Plate geometry of 40 mm with solvent trap. Sample loaded with spatula and without pre-shear. .................................................................. 78 Figure 3.10 Viscosity-Shear rate for the DS 5007 slurry at a temperature of 27ºC and for the DS 5045 slurry at a temperature of 29ºC ............................... 79 Figure 3.11 Formation of layers under the shear. Shear thinning or pseudoplastic behavior (Barnes 2000) ............................................................. 79 Figure 3.12 Velocity and shear rate profile for water under laminar flow (uaverage=0.2 m/s) and under turbulent flow (uaverage =1 m/s) .............................. 81 Figure 3.13 Viscosity-Temperature for the DS 5007 slurry with a microcapsules mass fraction of 30%, shear rate=100 1/s ................................ 82 Figure 3.14 Stress sweep at different temperatures (melted phase and transition phase). Frequency=1 Hz. Gap ∼0.5mm. .......................................... 87 Figure 3.15 Comparison between the melting and solidification curves obtained from the oscillatory temperature steps. Frequency=1 Hz. Shear stress=10 Pa. Gap∼0.5mm. ............................................................................. 89
INDEX OF FIGURES
xiii
Figure 3.16 Variation of the gap when controling normal force during the phase change of octadecane. .......................................................................... 89 Figure 3.17 Comparison of the flow curve and the frequency sweep to check if the Cox-Merz rule is fulfilled. Gap∼0.4mm. Temperature=29ºC. Conditions of the flow curve: see in text. Conditions of the frequency sweep: shear stress=1 Pa ...................................................................................................... 90 Figure 3.18 Torque applied by the rheometer during the measuremts of the flow curve. The red area points out the non-reliable results due to the minimum torque of the rheometer ................................................................... 91 Figure 3.19 Melting and solidification curves with a gap of 1.4 mm for the different heating and cooling rates. Frequency=1 Hz. Shear stress=1 Pa. ....... 93 Figure3.20 Melting and solidification curves with a gap of 0.4 mm for the different heating and cooling rats. Frequency=1 Hz. Shear stress=1 Pa. ......... 93 Figure 3.21 Influence of the applied stress (within the linear viscoelastic region) on the Complex viscosity-Temperature curves. Gap=1.4 mm. Heating rate=0.5ºC/min. ................................................................................................ 94 Figure3.22 Influence of the applied stress (within the linear viscoelastic region) on the Complex viscosity-Temperature curves. Gap=0.4 mm. Heating rate=0.5ºC/min. ................................................................................................ 95 Figure 3.23 Influence of the frequency on the Complex Viscosity-Temperature curves. Shear stress=1 Pa. Gap=0.5 mm. Heating rate=0.5ºC/min ................................................................................................. 95 Figure 4.1 Strain sweeps for the four samples of DS 5007; Temperature=27ºC; f=1 Hz .............................................................................. 101 Figure 4.2 Oscillatory response for real systems (Barnes 2000) ..................... 102 Figure 4.3 Frequency sweeps for the four DS 5007 samples: Temperature=27ºC; Strain=0.1 ........................................................................ 102 Figure 4.4 Creaming observed in the four samples at t=10080 minutes.......... 104 Figure 4.5 Creaming percentage over time of PCM microcapsules in suspension ....................................................................................................... 105 Figure 4.6 Relationship between the G’ modulus and the creaming percentage at t=31703 minutes. ....................................................................... 105 Figure 4.7 Relationship between the cohesive energy and creaming percentage ....................................................................................................... 107 Figure 4.8 Balanced valve of mass flow clogged by the PCM microcapsules from DS 5007 slurry with a mass fraction of 30% ............................................. 108 Figure 4.9 DS 5007 non-thermal-mechanical cycled sample, observed by an enviromental SEM. ........................................................................................... 109
Analysis of microencapsulated phase change material slurries and phase change material emulsions as heat transfer fluid and thermal storage material
xiv
Figure 4.10 DS 5007 sample cycled during 3 weeks observed by an environmental SEM (dehydration process) ...................................................... 109 Figure 4.11 DS 5007 sample cycled during two weeks observed with an environemental SEM ........................................................................................ 110 Figure 4.12 DS 5045 non-thermal-mechanical cycled sample, observed with an environmental SEM. Blurry image ............................................................... 110 Figure 4.13 DS 5045 sample observed with an environmental SEM. Top left image: sample with a 40% mass fraction. Top right image: sample with a 35% mass fraction pumped during 5 weeks. Lower left image: sample with a 35% mass fraction pumped during 2 weeks. Lower right image: sample with a 25% mass fraction pumped during 4 weeks. ................................................. 111 Figure 4.14 DS 5007 contaminated after a storage period of 12 months. Culture in non-selective medium ...................................................................... 112 Figure 4.15 Spherical capsules analyzed in the compatibility study with PCMs ......................................................................................................................... 113 Figure 4.16 Mass loss of the plastic spheres over time for different PCMs ..... 115 Figure 4.17 Corrosion tests. Test specimens immersed in beakers that contain the slurry without contamination and the slurry with microbiological contamination ................................................................................................... 119 Figure 4.18 Results of the corrosion tests on the aluminum and copper specimens ........................................................................................................ 120 Figure 4.19 Aluminum specimen slightly oxidized ........................................... 122 Figure 5.1 Diagram of the experimental installation ......................................... 128 Figure 5.2 Temperatures of the copper tube .................................................. 129 Figure 5.3 Temperatures of the PEX tube ....................................................... 129 Figure 5.4 Picture of the Coriolis mass flow meter used for the mass flow measurement ................................................................................................... 131 Figure 5.5 Picture of the balancing valve where the points for the measurement of differential pressure are shown .............................................. 132 Figure 5.6 Left image: Pt100 sensor for the measurement of the fluid temperature. Right image: Thermocouples type T for the measurement of the wall temperature ............................................................................................... 133 Figure 5.7 Picture of the heating resistance .................................................... 134 Figure 5.8 Picture of the ammeter and of the electronic power regulator with phase angle regulator ..................................................................................... 135 Figure 5.9 Picture of the data acquisition system ............................................ 135 Figure 5.10 Picture of the experimental installation ......................................... 136 Figure 5.11 Calculated values of pressure drop in comparison to the measured values .............................................................................................. 137
INDEX OF FIGURES
xv
Figure 5.12 Detail of the arrangement of the thermocouple in the heat transfer section ................................................................................................. 139 Figure 5.13 Influence of the interruption of the heat flux for the arrangement of the thermocouple on the measured temperatures ........................................ 140 Figure 5.14 Zone of calculated temperatures in comparison to zone of measured temperatures ................................................................................... 141 Figure 5.15 Difference of measured temperatures (Tmeasured-Tcalculated) in comparison to the temperatures difference estimated for the sensor in position x=1.42 m ............................................................................................ 143 Figure 5.16 Algorithm for the application of the empirical model of correction of wall temperatures ......................................................................................... 144 Figure 5.17 Application of the correction model. Tenv=25ºC; Mass flow=20 kg/h; Q=430W .................................................................................................. 145 Figure 5.18 Image of the results screen .......................................................... 146 Figure 6.1 Enthalpy-Temperature curves obtained by energy balance to the heat transfer section for the DS 5007 slurry. Top: 14% mass fraction; Middle: 20% mass fraction; Below: 30% mass fraction ................................................. 152 Figure 6.2 Enthalpy-Temperature curves obtained by energy balance to the heat transfer section for the DS 5045 slurry with a mass fraction of 20% ........ 155 Figure 6.3 Enthalpy-Temperature curves obtained by energy balance to the heat transfer section for the DS 5045 slurry with a mass fraction of 30% (sample with an initial mass fraction of 35% initially before deteriorating) ........ 156 Figure 6.4 Analysis of the hysteresis of the slurry on the enthalpy .................. 157 Figure 6.5 Measurements of pressure drop for the DS 5007 slurry with PCM microcapsule mass fractions of 14, 20 and 30% and comparison to water ...... 158 Figure 6.6 Improvement ratio vs. Average velocity of the fluid for the DS 5007 slurry with mass fractions of 14, 20 and 30%. Temperature difference=3ºC (21-24ºC) ................................................................................. 159 Figure 6.7 Pumping power vs. Transported Thermal Energy for the DS 5007 slurry with mass fractions of 14, 20 and 30%. Temperature difference=3ºC (21-24ºC) .......................................................................................................... 160 Figure 6.8 Measurements of pressure drop for the DS 5045 slurry with a mass fraction of 20 and 30%. Comparison to water. ........................................ 161 Figure 6.9 Pumping power vs. Transported energy for the DS 5045 slurry with mass fractions of 20 and 30%. Thermal difference=6ºC (22-28ºC) ........... 162 Figure 6.10 Improvement ratio vs. Average fluid velocity for the DS 5045 slurry with mass fractions of 20 and 30%. Thermal difference=6ºC (22-28ºC) . 162
Analysis of microencapsulated phase change material slurries and phase change material emulsions as heat transfer fluid and thermal storage material
xvi
Figure 6.11 DS 5007 sample. Wall temperature-Position in the tube for different mass fractions. Top: mass flow=20 kg/h; Below: mass flow=50 kg/h186 ............................................................................................................ 164 Figure 6.12 DS 5007 sample. Heat transfer coefficient by convection-Position in the tube for the different PCM mass fractions. Top: mass flow=20 kg/h; Below: mass flow=50 kg/h ....................................................................... 165 Figure 6.13 DS 5007 sample. Average decrease of the wall temperature in comparison to water depending on the PCM microcapsules mass fraction .... 167 Figure 6.14 DS 5007 sample. Average improvement of the heat transfer coefficient by convection in comparison to water depending on the PCM microcapsules mass fraction ............................................................................ 167 Figure 6.15 Influence of the flow patterns of thermal development on the heat transfer phenomenon ............................................................................... 169 Figure 6.16 DS 5045 sample. Wall temperature for the DS 5045 slurry with a 20% mass fraction in comparison to water ...................................................... 170 Figure 6.17 DS 5045 sample. Heat transfer coefficient by convection for the DS 5045 slurry with a 20% mass fraction in comparison to water .................... 171 Figure 6.18 DS 5045 sample. Wall temperature and convective heat transfer coefficient for the DS 5045 slurry with a mass fraction of 35% with a mass flow of 25 kg/h. RTO=0.66 ................................................................................ 171 Figure 7.1 Diagram of the solar cooling installation by absorption with the unit of thermal energy storage and dry air cooler, instead of wet cooling (Helm et al. 2009) ............................................................................................. 177 Figure 7.2 h-T curves for parafin RT6 .............................................................. 184 Figure 7.3 cp-T curve measured and cp-T curved fitted for the melting .......... 184 Figure 7.4 Comparison between the solution of the finite difference scheme and the analytical solution ................................................................................ 188 Figure 7.5 Verification of the energy balance. Energy that has entered the sphere until an instant j. Case of a water sphere. ............................................. 189 Figure 7.6 Temperature profiles of the sphere. ................................................ 189 Figure 7.7 Unit cell of the hexagonal compact packaging. .............................. 190 Figure 7.8 Sphere distribution in the tank for different relationships of dp/Dtank seen from above ............................................................................................... 191
Figure 7.9 Graph of the mesh used in a model of approximation of porous medium (Arkar and Medved, 2005). ................................................................. 192 Figure 7.10 Scheme of the model suggested .................................................. 193 Figure 7.11 Temporal evolution of the PCM temperature inside the sphere for two heights in the tank and different sphere diameters .............................. 195
INDEX OF FIGURES
xvii
Figure 7.12 Pressure drop of the water when flowing through the tank with spheres of dp=0,044 m according to the different models of pressure drop and according to the interstitial velocity ............................................................ 195 Figure 7.13 Pressure drop of the water when flowing through the sphere tank according to the sphere size and according to the interstitial velocity, calculated by the Ergun correlation (Ergun 1952) ............................................ 196 Figure 7.14 cp-T curve estimated for the RT6 slurry for melting ...................... 197 Figure 7.15 Image of the tank with a helical coil .............................................. 198 Figure 7.16 Temporal evolution for different mass flow of the water temperature at different heights of the tank and temporal evolution of the heat transfer fluid at the outlet .................................................................................. 202 Figure 7.17 Temporal evolution for different mass flow of the microencapsulated RT6 slurry temperature at different heights of the tank and temporal evolution of the heat transfer fluid at the outlet .......................... 203 Figure 7.18 Pressure drop experienced by the heat transfer fluid (water) when flowing through the interior of the helical coil of the tank according to different models ............................................................................................... 204 Figure 7.19 Power according to the different configurations of the TES systems ............................................................................................................ 205 Figure 7.20 Comparison of the TES systems in terms of average power and time during which the system is capable of supplying water with a temperature lower than 10ºC ............................................................................ 206

Analysis of microencapsulated phase change material slurries and phase change material emulsions as heat transfer fluid and thermal storage material
xviii
INDEX OF TABLES
xix
INDEX OF TABLES
Table I.1 PCM microcapsules and mPCM slurries studied in literature ........... 18 Table I.2 PCM emulsions studied in literature .................................................. 21 Table I.3 Commercially available PCM microcapsules .................................... 23 Table I.4 Compilation of studies carried out on the heat transfer phenomenon in PCM emulsions and mPCM slurries ............................................................. 42 Table I.5 Objective magnitudes and influential parameters at the time of selection of a PCm emulsion or mPCM slurry as heat transfer fluid or thermal storage material. ............................................................................................... 48 Table II.1 Samples gathered in the laboratory ................................................. 50 Table III.1 Adjustment coefficients according to the Carreau model (Carreau 1972) ................................................................................................................ 80 Table III.2 Properties of octadecane ................................................................ 86 Table IV.1 Values obtained from the frequency sweeps for the study of the structural stability of DS 5007 slurries. ............................................................. 103 Table IV.2 Values obtained from the strain sweep for the study of the structural stability of DS 5007 slurries ............................................................. 106
Table IV.3 Chemical solutions used for the removal of the corrosion products ......................................................................................................................... 120 Table V.1 Example of analysis by thermal resistances to evaluate the dominant resistance in the heat transfer phenomenon ..................................... 139 Table VII.1 Numerical and experimental studies in the literature about PCM-water heat exchangers .................................................................................... 179
Table VII.2 Fitting parameters for the cp-T curve ............................................. 185 Table VII.3 Finite difference scheme for intermediate nodes, for the central node and for the external node ......................................................................... 186 Table VII.4 Correlations analyzed .................................................................... 194 Table VII.5 Comparison of the TES systems according to the diameter of the PCM spheres. ................................................................................................... 197 Table VII.6 Pressure drop correlations in helical coils under laminar flow conditions and isothermal flow ......................................................................... 202 Table VII.7 Comparison of the sensible TES system with water and the TES system with the microencapsulated RT6 slurry ................................................ 204 Table VIII.1 Disemination of the most relevant results in scientific journal and international conferences ................................................................................ 215

Analysis of microencapsulated phase change material slurries and phase change material emulsions as heat transfer fluid and thermal storage material
xx
NOMENCLATURE
xxi
Abbreviations
AC Alternating current
Cfu Colony-forming unit
COP Coefficient of performance
DC Direct current
DM Density Meter
DSC Differential Scanning Calorimetry
EES Equation Engineering Solver
EU European Union
EU-27 Member states of the European Union
FCC Face Centered Cubic
FD Finite differences
GITSE Thermal Engineering and Energy Systems Group
HDPE High density polyethylene
HTF Heat Transfer Fluid
IEA International Energy Agency
IEC International Electrotechnical Commision
InSb Indium Antimonide
I3A Aragon Institute of Engineering Research
JCR Journal Citation Reports
LDPE Low density polyethylene
LFA Laser Flash
MF Mass fraction
mPCM Microencapsulated phase change material
n.a. Not availabe
NIST National Institute of Standards and Technology
OECD Organisation for Economic Co-operation and Development
O/W Oil in Water
PCM Phase Change Material
PEMA Polyethyl methacrylate
Analysis of microencapsulated phase change material slurries and phase change material emulsions as heat transfer fluid and thermal storage material
xxii
PET Polyethylene terephthalate
PEX Cross-linked polyethylene
PMMA Polymethyl methacrylate
PP Polypropylene
PS Polystyrene
Pt90Rd10 Metallic alloy of 90% platinum and 10% rhodium
PVAc Polyvinyl acetate
RTO Operation temperatures range
R&D&i Research and development and innovation
SEM Scanning Electron Microscope
ssPCM Shape-stabilized PCM
TES Thermal Energy Storage
TMA Thermomechanical Analyzer
UNS Unified Numbering System
WEO World Energy Outlook
wt weight
1D, 2D, 3D one-dimensional, two-dimensional, three-dimensional
Nomenclature
A Area of heat transfer [m2]
Bi Biot number [-]
cp Specific heat at constant pressure [kJ/(kg·K)]
cps Specific heat at constant pressure in solid and liquid state [kJ/(kg·ºC)]
c Volumetric concentration [-]
D Internal diameter of the test section [m]
Dtank Diameter of the cylindrical tank [m]
Dhelix Diameter of the coil helix [m]
dp/Dtank Relationship between the diameter of the spherical capsules and the tank diameter
NOMENCLATURE
xxiii
de External diameter of the coil [m]
di Internal diameter of the coil [m]
dp Diameter of the spherical capsules [m]
De Dean number [-]
E Transported thermal energy [W]
Ec Cohesive energy in viscoelastic fluids [J/m3]
f Frequency [Hz]
fp Losses factor [-]
fD Friction factor of Darcy Weisbach [-]
fF Friction factor of Fanning [-]
Fo Fourier number [-]
G’ Elastic modulus [Pa]
G’’ Viscous or loss modulus [Pa]
G* Complex modulus [Pa]
Gr Graetz number [-]
hconv Convective heat transfer coefficient [W/(m2·K)]
h Enthalpy [kJ/kg]
hm Phase change enthalpy [kJ/kg]
I Intensity of current [A]
L Length [m]
m Mass flow [kg/s]
m Mass [g]
mPCM PCM mass in the tank [kg]
N Work per length [W/m]
Nu Nusselt number [-]
Analysis of microencapsulated phase change material slurries and phase change material emulsions as heat transfer fluid and thermal storage material
xxiv
n data number [-]
nspheres Spheres number [-]
nnodes Nodes number for the discretization of the tank [-]
nlayers Layers number for the discretization of the tank [-]
Pe Peclet number[-]
Pr Prandlt number[-]
Q Energy exchanged by heat [J]
Q Heat transfer per unit of time [W]
q’’ Heat flux [W/m2]
R Radius [m]
Ra Rayleigh number [-]
Re Reynolds number [-]
Ret Reynolds number of transition from laminar to turbulent [-]
r Radial coordinate [m]
T Temperature [ºC]
t Time [s]
U Global heat transfer coefficient [W/(m2·K)]
u Velocity [m/s]
V Volume [m3]
v Average velocity [m/s]
vint Interstitial velocity of the heat transfer fluid in the spheres tank [m/s]
W Power [W]
x Axial coordinate [m]
∆m Mass variation [kg]
∆P Pressure drop [bar or Pa]
∆t Time step [s]
NOMENCLATURE
xxv
∆U Voltage [V]
Greek symbols
α Thermal diffusivity [m2/s]
γ Strain [-]
γ Shear rate [-]
δ Phase lag [rad, º]
ε Tank porosity [-]
η Dynamic viscosity [Pa·s]
Θi Sphere wall temperature in the tank model in layer i [ºC]
λ Thermal conductivity [W/(m·ºC)]
λe Effective thermal conductivity [W/(m·ºC)]
ρ Density [kg/m3]
σ Standard deviation
τ Shear stress [Pa]
Φ Microcapsules diameter [μm]
ω Angular frequency [rad/s]
Subscripts
c Curved (for coils)
calc Calculated
cil Cylinder
conv Convection
cr Critical
d Dispersion
e Efecctive
env Environment
ext External
f Fluid

Analysis of microencapsulated phase change material slurries and phase change material emulsions as heat transfer fluid and thermal storage material
xxvi
fd,t Fully thermal development
i Position in space
in Inlet
ini Initial
int Internal
j Position in time
m Melting
max Maximum
mea Measured
m1 Beginning of the melting
m2 End of the melting
p particle, sphere
prev In the previous time
suspPCM microencapsulated PCM slurry
out outlet
x local position
½ Half of the maximum value del valor máximo
0 At very low shear rates
∞ At very high shear rates

Preamble: motivation, objectives and framework of the thesis
1
Preamble: motivation, objectives and framework of the thesis
Analysis of microencapsulated phase change material slurries and phase change material emulsions as heat transfer fluid and thermal storage material
2
The International Energy Agency (IEA) published at the end of 2012 the World Energy Outlook (WEO) 2012, a report which presents the evolution of all energy sectors and their projections until 2035. According to the IEA, the global demand for energy will increase by more than a third compared to today due to the increasing demand of countries such as China, India and the Middle-East. The increase in energy demand in the OECD countries will be barely noticeable and a gradual change in the primary energy sources from coal, oil and nuclear energy to natural gas and renewable energies will be observed.
According to the IEA 2012 report, the continuous rise of hydraulic energy and the fast expansion of wind power and solar energy has consolidated the position of renewable energies as an essential part of the energy mix. In 2035, renewable energies will represent almost a third of the total production of electricity. Solar energy is growing more quickly than any other renewable technology. Renewable energies will become the second source of electricity generation in the world by around 2015, producing approximately half that of coal. By 2035, they will come near to matching coal as the primary source of electricity generation.
The depletion of non-renewable energy sources has led to a situation where the EU increasingly depends on importing primary energy to satisfy its demand. In Spain, the dependence on energy imports is noticeably higher than the average of the 27 EU countries, reaching 80% (data from September 2011, Eurostat).
The development of renewable energy sources is thus a crucial part of national energy policy because besides decreasing our dependence and diversifying our supply sources, it can contribute efficiently to the reduction of greenhouse gas emissions, in particular CO2.
For these reasons, the Directive 2009/28/EC of the European Parliament and the Council of Europe of 23 April 2009 on the promotion of the use of energy from renewable sources established the general objective, of achieving a share of 20% of energy coming from renewable energies of the gross final energy consumption of the European Union. For this purpose, it established objectives for each of the member states to be achieved by 2020 with minimum guidelines to be followed until that year. In Spain, the objective is for renewable sources to account for at least 20% of energy consumption in 2020, the same objective as the EU average.
Preamble: motivation, objectives and framework of the thesis
3
The EU has identified R&D&i policy as one of the most effective tools for addressing the new challenges of the energy sector and combating climate change. The European R&D Framework Programme has assigned a significant part of its budget to energy and climate change programmes.
Motivation
In the search for a sustainable energy model, thermal energy storage (TES) represents a significant contribution to the efficient use of energy. Examples of this contribution include energy savings in applications such as bioclimatic architecture or free cooling, and the adaptation of the demand and production curves with renewable energies such as solar energy, where this discrepancy is one of the main problems for its establishment or for the reduction of costs due to the consumption of electrical energy taking advantage of off-peak hours and therefore the night rate.
The applications of thermal energy storage using solid-liquid phase change are spreading due to the constant incorporation of new materials with very different properties and phase change temperature ranges. The main R+D lines of these new materials known as PCMs (Phase Change Materials) include the development of materials, the development of encapsulation, the determination of their thermophysical properties, the analysis of economic costs and their integration into systems. Recently, a new technique has been proposed to face some of these challenges. This technique consists of forming a biphasic fluid from the mix of a fluid such as water and a PCM. This gives rise to a fluid that allows storing thermal energy during the phase change of the PCM in suspension. This new fluid could be used as a thermal energy storage material and as a heat transfer fluid.
However, there are still some critical points that must be addressed before these materials can be more extensively implemented. These critical issues are: 1) subcooling and hysteresis, 2) lack of physical stability, with regard to stratification problems and rupture of microcapsules in suspension, and 3) analysis of the heat transfer phenomenon to analyze the improvement in comparison to conventional heat transfer fluids. The results of different authors concerning this heat transfer phenomenon are not conclusive. With this work, it is hoped to make further progress towards the solution of these difficulties, and to analyze the thermal behavior and technical viability of systems with these biphasic fluids in comparison with sensible storage systems with water, or with
Analysis of microencapsulated phase change material slurries and phase change material emulsions as heat transfer fluid and thermal storage material
4
storage systems in which the PCM has to date been macroencapsulated. The objectives of this thesis are set out in the following section.
Thesis structure and specific objectives
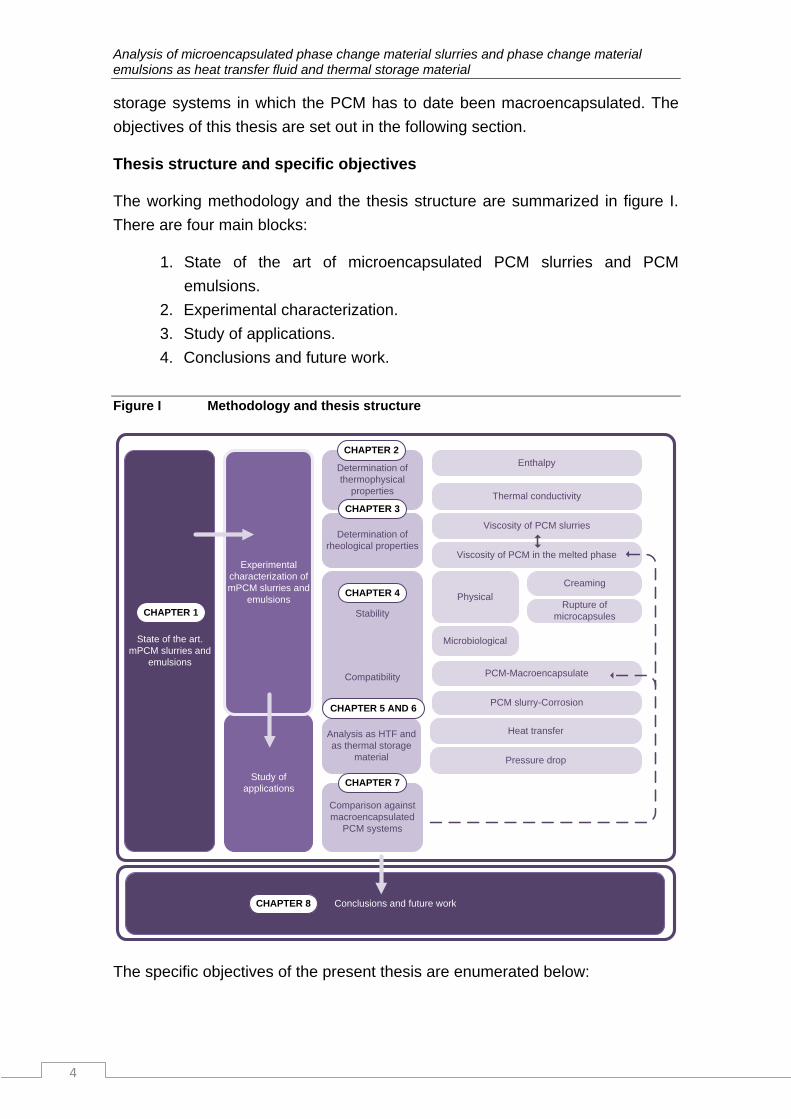
The working methodology and the thesis structure are summarized in figure I. There are four main blocks:
1. State of the art of microencapsulated PCM slurries and PCM emulsions.
2. Experimental characterization. 3. Study of applications. 4. Conclusions and future work.
Figure I Methodology and thesis structure
State of the art. mPCM slurries and
emulsions
Study of applications
Experimental characterization of mPCM slurries and
emulsions
Determination of thermophysical
properties
Determination of rheological properties
Compatibility
Stability
Enthalpy
Thermal conductivity
Viscosity of PCM slurries
Comparison against macroencapsulated
PCM systems
PCM-Macroencapsulate
PCM slurry-Corrosion
Physical
Microbiological
Creaming
Rupture of microcapsules
Viscosity of PCM in the melted phase
Analysis as HTF and as thermal storage
material
Heat transfer
Pressure drop
Conclusions and future work
CHAPTER 1
CHAPTER 2
CHAPTER 3
CHAPTER 4
CHAPTER 5 AND 6
CHAPTER 7
CHAPTER 8
The specific objectives of the present thesis are enumerated below:
Preamble: motivation, objectives and framework of the thesis
5
1. Exhaustive review and analysis of the literature about microencapsulated PCM slurries and PCM emulsions focusing on:
a) Manufacturing processes. b) Synthesis in tables of the microencapsulated PCM slurries and PCM
emulsions developed in the commercial market, universities and research institutes, together with their thermal properties.
c) Problems of subcooling and hysteresis. d) Rheological behavior. e) Analysis of the heat transfer phenomenon.
2. Determination of some PCM thermophysical and rheological properties: specifically, obtaining the Enthalpy-Temperature curve, the Thermal Conductivity-Temperature curve and the Viscosity-Shear rate curve. In the case of these two last properties, a methodology is proposed for their correct characterization.
3. Measurement methodology of the viscosity of melted PCMs and during the phase transition, for application in studies of natural convection.
4. Rheological study for the analysis of the destabilization processes in microencapsulated PCM slurries and PCM emulsions.
5. Analysis of the rupture of PCM microcapsules in suspension when subjected to thermal-mechanical cycles.
6. Compatibility study of PCMs with the plastic material of encapsulated geometries.
7. Corrosion measurements in typical metallic alloys that make up thermal installations when coming into contact with microencapsulated PCM slurries and PCM emulsions.
8. Design, start up, validation and series of tests of an experimental installation for the study of the heat transfer phenomenon, the pressure drop and the technical viability of microencapsulated PCM slurries and PCM emulsions.
9. Comparison of a thermal energy storage system using PCM slurries with systems with macroencapsulated PCM or sensible storage systems. Comparison in terms of energy density, thermal power and pressure drop.
Framework of the thesis
The development of this thesis is linked to a grant for Research Personnel in Training (reference PIF-UZ-2009-TEC-02) awarded by the Research Vice-Deanship of the University of Zaragoza.
Analysis of microencapsulated phase change material slurries and phase change material emulsions as heat transfer fluid and thermal storage material
6
This thesis comes within the research line into Thermal Energy Storage with Phase Change Materials carried out by the Thermal Engineering and Energy Systems Group (GITSE), a research group recognized as a consolidated group by the Government of Aragón and belonging to the Aragón Institute for Engineering Research (I3A). This research line was initiated in 1998 with the doctoral thesis of Dr. Belén Zalba, co-advisor of this thesis.
The continuation and relevance of this line of research is reflected in the defense in 2009 and 2011 of two theses by two members of the GITSE group (Ana Lázaro and Pablo Dolado) on the characterization and modeling of storage equipment for heat transfer by air. In addition, two theses are currently being developed within the group: low cost PCM such as by-products from industry carried out by the researcher Mª Concepción Peñalosa; and the study of the inclusion of PCM in active elements of construction, carried out by the researcher Javier Mazo.
This academic interest is being corroborated in the national sphere at an institutional level by the consecutive granting of four projects by the National R&D&I Programme in public calls. This thesis has been developed within the framework of the following projects:
Project of the National R&D&I Programme (2009 to 2011): “Contribution of thermal energy storage to energy efficiency in buildings and industrial applications”. Reference ENE2008-06687-C02-02.
Project of the National R&D&I Programme (2012 to 2014): “Improvement of energy efficiency in buildings through thermal energy storage”. Reference ENE2011-28269-C03-01.
Project with a private company: “R&D Project on thermal energy storage through phase change materials and its application in solar heating and cooling systems”.
With the objectives of knowing the state of development of the relevant fields of work through knowledge exchange and of contributing as much as possible to this development, while working on this thesis the Ph.D. candidate has collaborated with other international groups within the joint working group of the programmes “Energy Conservation through Energy Storage” and “Solar Heating and Cooling” of the International Energy Agency Task 42-Annex 24: Compact Thermal Energy Storage, Material Development and System Integration. She has also collaborated in the European Project of Cooperation COST Action

Preamble: motivation, objectives and framework of the thesis
7
TU0802; and in two projects of cross-border cooperation with the Université de Pau et des Pays de L’Adour. A result of these collaborations was a research stay by the Ph.D. student in the Fraunhofer Institute ISE, in Freiburg, Germany, partially funded by grants awarded in public calls by the COST Action TU0802 and by the Europe Programme of the Social Activities from CAI. The most relevant results of this thesis have been made public in international scientific journals and in diverse scientific forums. To date, as result of this work 5 papers have been published in international scientific journals indexed in JCR and 11 works have been presented at both national and international conferences.

Analysis of microencapsulated phase change material slurries and phase change material emulsions as heat transfer fluid and thermal storage material
8
CHAPTER 1. State of technology. Review on PCM emulsions and microencapsulated PCM slurries: Materials, heat transfer studies and applications.
9
This first chapter presents PCM emulsions and mPCM slurries as new thermal energy storage material and as new heat transfer fluid. Although it is a recent technology, the literature volume starts to be significant. This review has compiled in tables information about the different PCM emulsions and mPCM slurries, as well as the commercial products available up to the moment. Thermophysical and rheological properties of these new fluids have been analyzed, by paying special attention to the heat transfer phenomenon.
1 State of technology. Review on PCM emulsions and microencapsulated PCM slurries: Materials, heat transfer studies and applications
Analysis of microencapasulated phase change material slurries and phase change material emulsions as heat transfer fluid and thermal storage material
10
1.1 General aspects about PCM emulsions and microencapsulated PCM slurries
It has been 20 years since a new technique was proposed to use phase change
materials in thermal storage systems, heat exchangers and thermal control
systems. However over the last 10 years a greater progress in its study has
taken place. This new technique consists of forming a two-phase fluid, from the
mixture of a fluid, such as water, and a phase change material, resulting in a
fluid for thermal energy storage with an improved specific heat. Inaba (2000)
classifies thermal fluids and describes the main characteristics and applications.
Among the latent thermal fluids, five types of fluids are mentioned:
1) Ice slurries.
2) Phase change material microemulsions, in which the PCM is
dispersed in water through an emulsifying agent.
3) Microencapsulated PCM slurries (mPCM slurries), where the PCM is
microencapsulated in a polymeric capsule and dispersed in water.
4) Clathrate hydrate PCM slurries, where the clathrate hydrates are
composed of water molecules (host molecule) forming a weaved
structure where the molecules of the other substance (guest
molecule) are accommodated, constituting a special molecular
structure where the heat associated with the chemical reaction of
formation and dissociation of clathrate hydrate is greater than that of
ice melting.
5) Shape-stabilized PCM slurries (ssPCM slurries), based on ssPCM,
these can consist of paraffin infiltrated in high density polyethylene,
with a melting temperature higher than of the paraffin. In this way the
paraffin is retained inside the structure of high density polyethylene,
avoiding the leak of the PCM.
Zhang et al. (2010) published a review, focused on two latent thermal fluid
types: mPCM slurries and clathrate hydrate slurries, putting special emphasis
on thermal properties and applications.
The review presented herein in the framework of this thesis aims at completing
the work of Zhang et al. (2010) regarding mPCM slurries and going a step
further by analyzing the information available in literature on PCM emulsions
and by studying the heat transfer phenomenon.
CHAPTER 1. State of technology. Review on PCM emulsions and microencapsulated PCM slurries: Materials, heat transfer studies and applications.
11
As main issues to be tackled, some studies inform that in the case of mPCM
slurries it is particularly difficult to maintain a stable homogeneous flow if the
particles are not processed with very small size and high flexibility. Besides, the
PCM capsule entails an extra cost. The capsule prevents the PCM in
continuous phase from leaking, which in that case could solidify in ducts and
cause clogging. It is important that the capsules are sufficiently resistant against
the stress produced by the pumps. In the case of emulsions, previous
experiments indicated that it is difficult to maintain a stable emulsion above
melting temperature, as instabilities could appear during phase change (Royon
et al. 1998). Stratification problems will appear, as the paraffin droplets will form
greater droplets and finally a PCM layer will float in the upper part of the storage
system, due to the difference of densities (Mehling and Cabeza, 2008).
These new fluids offer many advantages and can be used either as thermal storage materials or heat transfer fluids (Royon and Guiffant, 2008), due to:
1) High storage capacity during phase change regarding water.
2) Possibility to use the same medium either to transport or store energy,
as these slurries are pumpable (reducing in this way heat transfer
losses).
3) Heat transfer at an approximately constant temperature.
4) High heat transfer rate due to the elevated ratio surface/volume.
5) Lower pumping power, as a consequence of the reduction in mass
flow due to higher heat capacity.
6) A better cooling performance than conventional heat transfer fluids,
due to the decrease in fluid temperature as a consequence of higher
heat capacity.
As additional advantages, these novel fluids present a thermal energy storage
density that results advantageous in comparison to conventional systems of
sensible heat storage in water and can be competitive against
macroencapsulated PCM tanks. According to the consulted literature,
macroencapsulated PCM tanks present porosity values between approximately
0.37 and 0.47 (Bedecarrats et al. 1996, Cho y Choi 2000, Chen et al. 2000).
This means that the PCM volume together with the container system represents
approximately 53-63% of the volume of the thermal energy storage system.
Therefore slurries with PCM concentrations volumes of approximately 30-40%
Analysis of microencapasulated phase change material slurries and phase change material emulsions as heat transfer fluid and thermal storage material
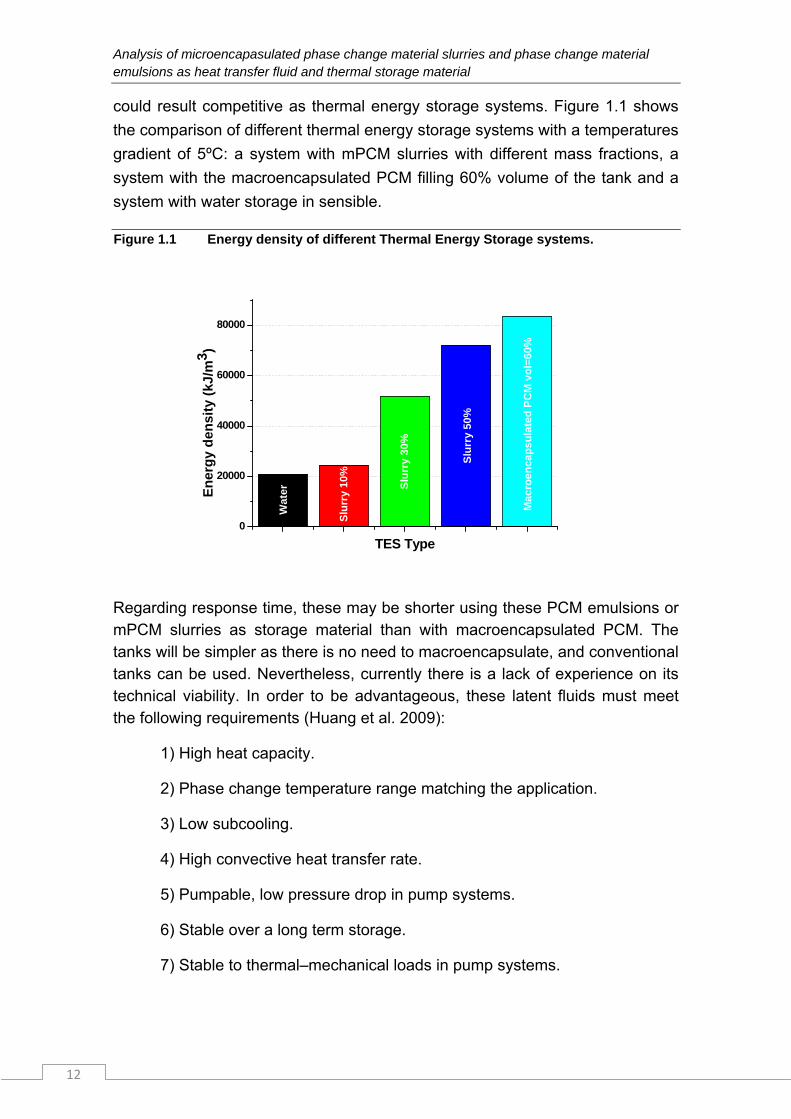
12
could result competitive as thermal energy storage systems. Figure 1.1 shows
the comparison of different thermal energy storage systems with a temperatures
gradient of 5ºC: a system with mPCM slurries with different mass fractions, a
system with the macroencapsulated PCM filling 60% volume of the tank and a
system with water storage in sensible.
Figure 1.1 Energy density of different Thermal Energy Storage systems.
0
20000
40000
60000
80000
Slu
rry
50%
Slu
rry
30%
En
erg
y d
ensi
ty (
kJ/m
3 )
TES Type
Wat
er
Slu
rry
10%
Ma
cro
enca
psu
late
d P
CM
vo
l=6
0%
Regarding response time, these may be shorter using these PCM emulsions or mPCM slurries as storage material than with macroencapsulated PCM. The tanks will be simpler as there is no need to macroencapsulate, and conventional tanks can be used. Nevertheless, currently there is a lack of experience on its technical viability. In order to be advantageous, these latent fluids must meet the following requirements (Huang et al. 2009):
1) High heat capacity.
2) Phase change temperature range matching the application.
3) Low subcooling.
4) High convective heat transfer rate.
5) Pumpable, low pressure drop in pump systems.
6) Stable over a long term storage.
7) Stable to thermal–mechanical loads in pump systems.
CHAPTER 1. State of technology. Review on PCM emulsions and microencapsulated PCM slurries: Materials, heat transfer studies and applications.
13
This article encompasses a review of scientific literature as well as a technical and commercial compilation of PCM emulsions and mPCM slurries regarding their use as heat transfer fluids and thermal storage materials.
It should be pointed out that, the present work goes a step further by making an
exhaustive analysis on heat transfer phenomena in these fluids, concluding with
the factors affecting the phenomena. The review is structured in five greater
sections: a first section that considers the elaboration of emulsions and the
different fabrication techniques for microcapsules; a second section that
presents tables containing compilation of PCM microcapsules and emulsions,
both in research stage and commercially available; a third section that analyzes
the thermophysical and rheological properties of PCM emulsions and mPCM
slurries, also considering the subcooling problem and stability of fluids; a fourth
section that deepens knowledge on heat transfer phenomena; and finally, a fifth
section that enumerates and describes application examples where these new
fluids have been employed.
1.2 Manufacture process
1.2.1 Elaboration of emulsions
Emulsions are systems formed by two immiscible liquid phases, one of which is
dispersed in the other in the form of droplets through substances that modify
interfacial activity, denominated surfactants. In the case of emulsions, special
attention must be given to viscosity and stability. The viscosity of an emulsion
will increase when thickening agents are aggregated, avoiding destabilization
processes by increasing the disperse phase proportion and reducing the size of
the emulsion particles. Emulsifying methods can be classified in two groups:
high and low energy methods (Schalbart et al. 2010). High energy methods
produce coarse emulsions (5-100 µm) through a high degree of shearing
generated by helix or turbine mixers. A greater reduction in the droplet size
requires a great amount of mechanical energy. The formation of nanoemulsions
using high energy methods is usually very expensive, as it requires the use of
high pressure homogenizers, ultrasonic generators, microfluidizers, etc. The low
energy methods are those where the energy required to form the emulsion
originates from transitions or phase changes occurring during the production of
the emulsions.
1.2.2 Fabrication of PCM microcapsules
The microencapsulation technique has been widely used in the pharmaceutical
and chemical engineering fields. In recent years this technology has reached
Analysis of microencapasulated phase change material slurries and phase change material emulsions as heat transfer fluid and thermal storage material
14
the field of phase change materials in order to improve their behavior.
Microcapsules are small particles of material coated by another material, the
second material forming a thin film over the first one, isolating and protecting
from the environment. Size range of microcapsules is quite wide, with diameter
between 2 and 2000 μm. The size of the shells oscillates between 0.5-150 μm
thickness and the core constitutes between 20 and 95% of the total mass.
There are many different fabrication techniques for microcapsules, and the
choice is made depending on the characteristics of the active material to be
encapsulated and the type of polymeric material used as shell (Monllor 2007).
In a first stage, a dispersion is formed with the active material. In a second
stage, this dispersion is transformed and finally, stabilization and solidification
techniques are applied to the shells before separation. Emulsifying techniques
are, in principle, the most simple and extended for the obtaining of
microcapsules.
There are several methods that can be used to produce microcapsules.
Depending on the nature of the process, there are physical, physical-chemical,
and chemical processes. The most utilized techniques in literature for PCM
microencapsulation according to the aforementioned classification are: for the
first group, the spray drying technique; for the second group, coacervation; and
for the third group, in situ and interfacial polymerization. These techniques are
explained in the following paragraph.
The spray-drying technique is based on the preparation of an emulsion,
dispersing the material of the core (in this case the PCM) in a concentrated
solution of the material forming the capsule, until the desired particle size is
obtained. This emulsion is pulverized into droplets, which will be next dried
when makes contact with a hot medium, evaporating the present water
instantly, and consequently allowing the active material to be trapped inside a
film of encapsulating material. In the coacervation technique, the polymeric
solute is separated in the form of small liquid droplets (forming the coacervate)
and deposited around the insoluble particles dispersed into a liquid. These
droplets slowly unite and form a continuous cover around the core. In order to
obtain a longer lifetime of microcapsules, coacervation can be accomplished in
two steps, adding the polymer twice. Through this mechanism, a smaller
thickness of the microencapsulate shell can be obtained with the same weight
index, during a longer time so that the polymer regulates its molecules with the
PCM core. Compactability and impermeability are improved (a lower speed of
polymer deposition increases impermeability), proportioning greater stability to
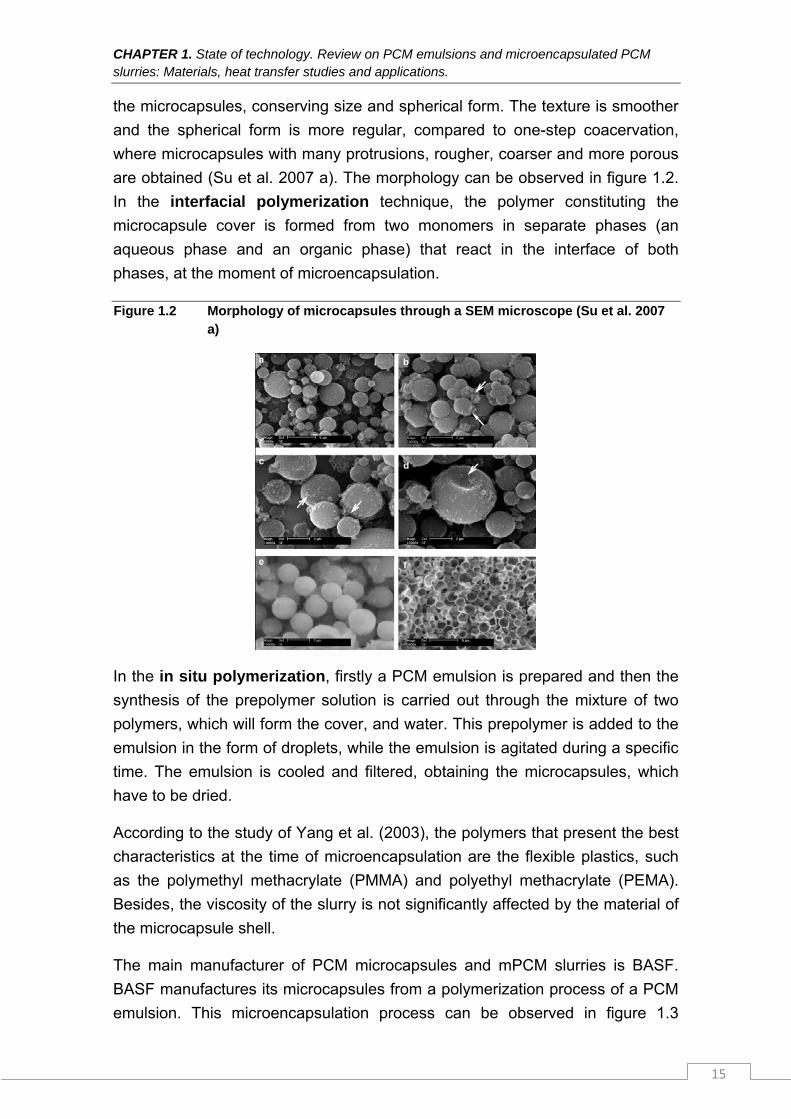
CHAPTER 1. State of technology. Review on PCM emulsions and microencapsulated PCM slurries: Materials, heat transfer studies and applications.
15
the microcapsules, conserving size and spherical form. The texture is smoother
and the spherical form is more regular, compared to one-step coacervation,
where microcapsules with many protrusions, rougher, coarser and more porous
are obtained (Su et al. 2007 a). The morphology can be observed in figure 1.2.
In the interfacial polymerization technique, the polymer constituting the
microcapsule cover is formed from two monomers in separate phases (an
aqueous phase and an organic phase) that react in the interface of both
phases, at the moment of microencapsulation.
Figure 1.2 Morphology of microcapsules through a SEM microscope (Su et al. 2007 a)
In the in situ polymerization, firstly a PCM emulsion is prepared and then the
synthesis of the prepolymer solution is carried out through the mixture of two
polymers, which will form the cover, and water. This prepolymer is added to the
emulsion in the form of droplets, while the emulsion is agitated during a specific
time. The emulsion is cooled and filtered, obtaining the microcapsules, which
have to be dried.
According to the study of Yang et al. (2003), the polymers that present the best
characteristics at the time of microencapsulation are the flexible plastics, such
as the polymethyl methacrylate (PMMA) and polyethyl methacrylate (PEMA).
Besides, the viscosity of the slurry is not significantly affected by the material of
the microcapsule shell.
The main manufacturer of PCM microcapsules and mPCM slurries is BASF.
BASF manufactures its microcapsules from a polymerization process of a PCM
emulsion. This microencapsulation process can be observed in figure 1.3
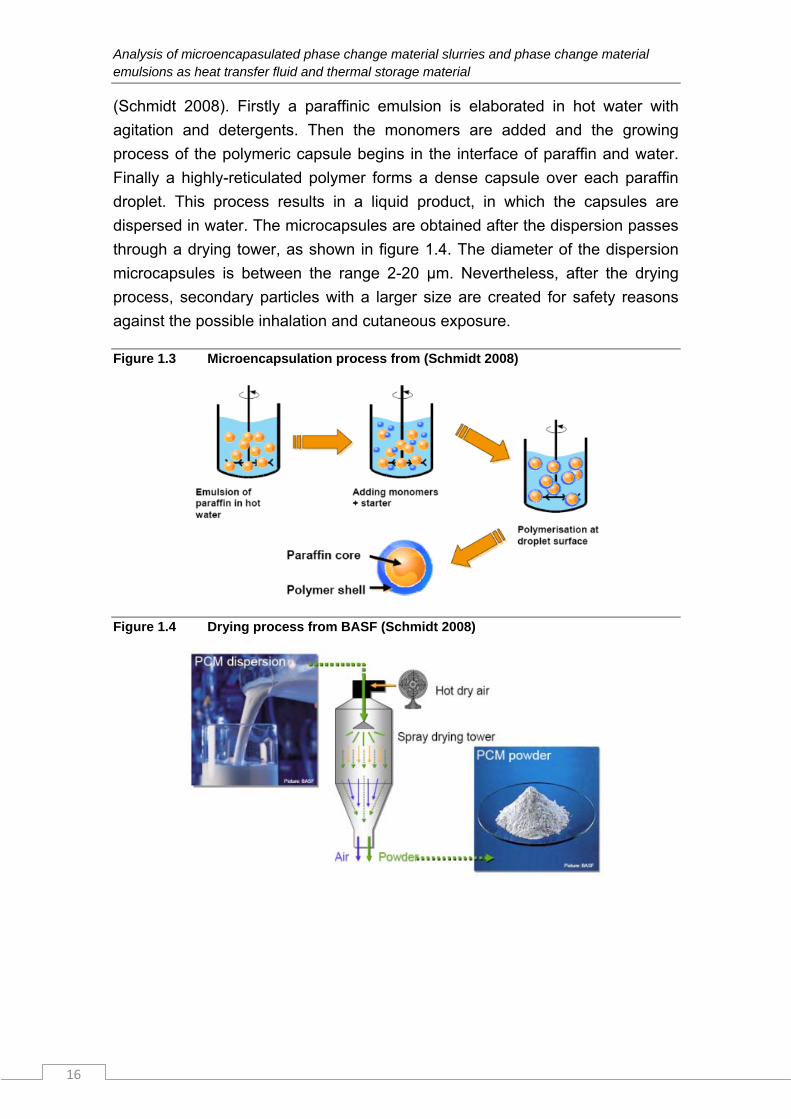
Analysis of microencapasulated phase change material slurries and phase change material emulsions as heat transfer fluid and thermal storage material
16
(Schmidt 2008). Firstly a paraffinic emulsion is elaborated in hot water with
agitation and detergents. Then the monomers are added and the growing
process of the polymeric capsule begins in the interface of paraffin and water.
Finally a highly-reticulated polymer forms a dense capsule over each paraffin
droplet. This process results in a liquid product, in which the capsules are
dispersed in water. The microcapsules are obtained after the dispersion passes
through a drying tower, as shown in figure 1.4. The diameter of the dispersion
microcapsules is between the range 2-20 µm. Nevertheless, after the drying
process, secondary particles with a larger size are created for safety reasons
against the possible inhalation and cutaneous exposure.
Figure 1.3 Microencapsulation process from (Schmidt 2008)
Figure 1.4 Drying process from BASF (Schmidt 2008)
CHAPTER 1. State of technology. Review on PCM emulsions and microencapsulated PCM slurries: Materials, heat transfer studies and applications.
17
1.3 Compilation of PCM emulsions and microencapsulated PCM slurries
Table I.1 shows information on the PCM microcapsules and mPCM slurries
studied in literature, together with some thermophysical properties, as well as
additional interesting information given by the authors. Table I.2 shows a
compilation of PCM emulsions studied in literature.
At the moment there are few PCM manufacturers approaching these
techniques. Table I.3 collects data on commercially available PCM emulsions,
mPCM slurries and PCM microcapsules up to date.
As is known, inorganic PCM, usually salt hydrates, present certain advantages
when compared to organic PCM, such as a higher energy storage density,
higher thermal conductivity, non-flammability, and are cheaper. Nevertheless,
inorganic PCM also present a series of inconveniences, such as the corrosion
problem, phase segregation and subcooling. When the material in the melted
phase, it must be cooled below its melting temperature so that it starts to solidify
is named subcooling. As a consequence of this phenomenon (which in
microscopic geometries would be worse due to probabilistic reasons), there are
still few studies on inorganic PCM microencapsulation. After systematic
reviews, the only manufacturer of inorganic microencapsulated PCM is Salca
BV, selling microcapsules of salt hydrates and the only consulted work is that of
Salaün et al. (2008). This last work investigates the effects of the preparation
conditions (solvent evaporation-precipitation process) on the morphology of the
capsule and on the efficiency of the sodium phosphate dodecahydrate
encapsulation.
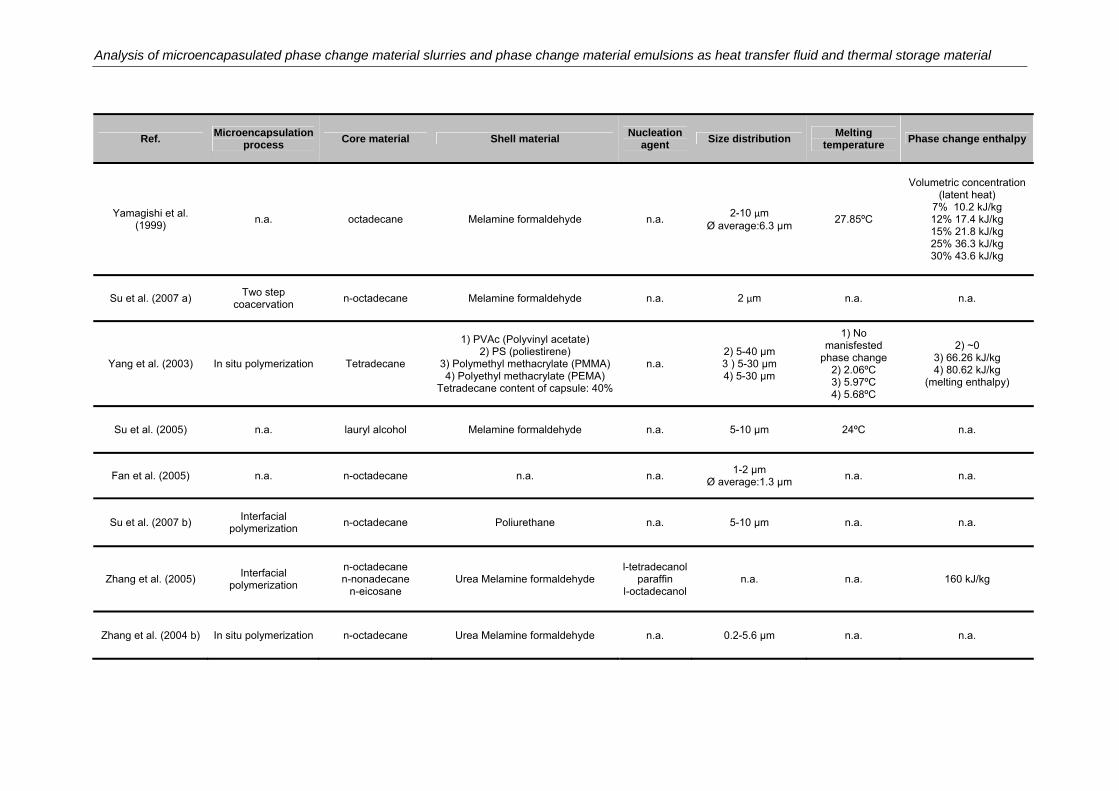
Analysis of microencapasulated phase change material slurries and phase change material emulsions as heat transfer fluid and thermal storage material
Ref. Microencapsulation
process Core material Shell material
Nucleation agent
Size distribution Melting
temperature Phase change enthalpy
Yamagishi et al. (1999)
n.a. octadecane Melamine formaldehyde n.a. 2-10 µm
Ø average:6.3 µm 27.85ºC
Volumetric concentration
(latent heat) 7% 10.2 kJ/kg 12% 17.4 kJ/kg 15% 21.8 kJ/kg 25% 36.3 kJ/kg 30% 43.6 kJ/kg
Su et al. (2007 a) Two step
coacervation n-octadecane Melamine formaldehyde n.a. 2 µm n.a. n.a.
Yang et al. (2003) In situ polymerization Tetradecane
1) PVAc (Polyvinyl acetate) 2) PS (poliestirene)
3) Polymethyl methacrylate (PMMA) 4) Polyethyl methacrylate (PEMA)
Tetradecane content of capsule: 40%
n.a. 2) 5-40 μm 3 ) 5-30 μm 4) 5-30 μm
1) No manisfested
phase change 2) 2.06ºC 3) 5.97ºC 4) 5.68ºC
2) ~0 3) 66.26 kJ/kg 4) 80.62 kJ/kg
(melting enthalpy)
Su et al. (2005) n.a. lauryl alcohol Melamine formaldehyde n.a. 5-10 µm 24ºC n.a.
Fan et al. (2005) n.a. n-octadecane n.a. n.a. 1-2 µm
Ø average:1.3 µm n.a. n.a.
Su et al. (2007 b) Interfacial
polymerization n-octadecane Poliurethane n.a. 5-10 µm n.a. n.a.
Zhang et al. (2005) Interfacial
polymerization
n-octadecane n-nonadecane
n-eicosane Urea Melamine formaldehyde
l-tetradecanol paraffin
l-octadecanoln.a. n.a. 160 kJ/kg
Zhang et al. (2004 b) In situ polymerization n-octadecane Urea Melamine formaldehyde n.a. 0.2-5.6 µm n.a. n.a.
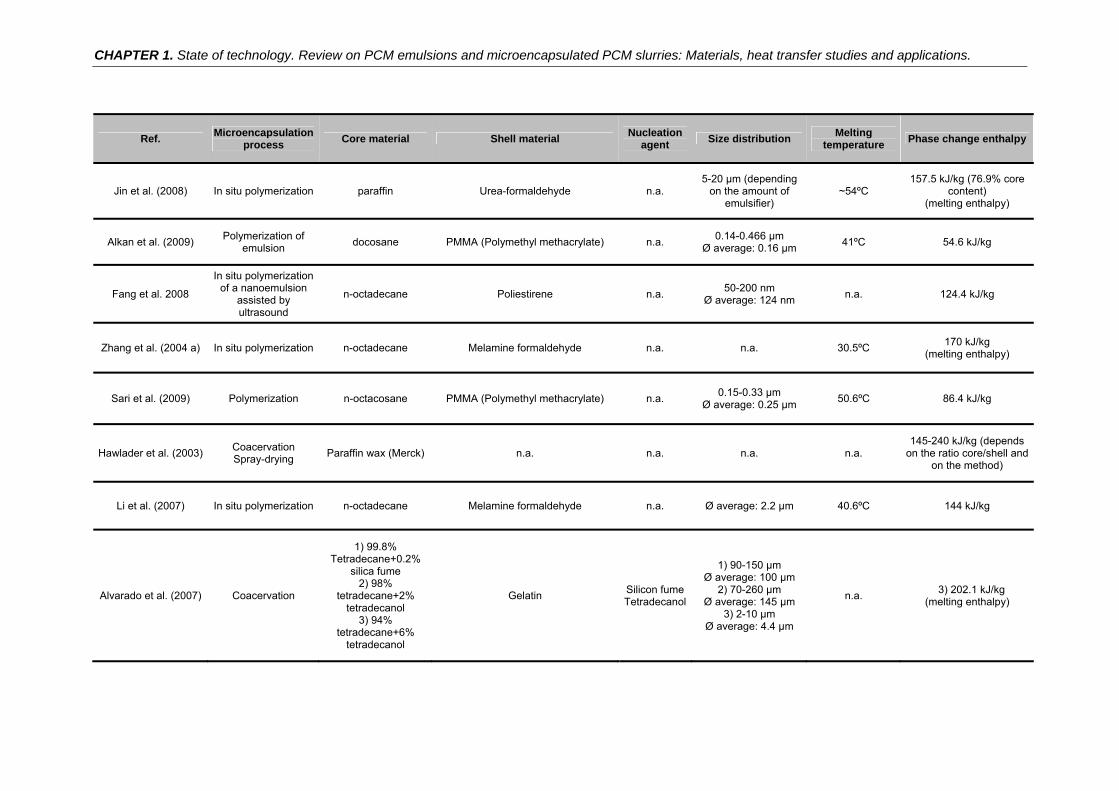
CHAPTER 1. State of technology. Review on PCM emulsions and microencapsulated PCM slurries: Materials, heat transfer studies and applications.
Ref. Microencapsulation
process Core material Shell material
Nucleation agent
Size distribution Melting
temperature Phase change enthalpy
Jin et al. (2008) In situ polymerization paraffin Urea-formaldehyde n.a. 5-20 µm (depending
on the amount of emulsifier)
~54ºC 157.5 kJ/kg (76.9% core
content) (melting enthalpy)
Alkan et al. (2009) Polymerization of
emulsion docosane PMMA (Polymethyl methacrylate) n.a.
0.14-0.466 µm Ø average: 0.16 µm
41ºC 54.6 kJ/kg
Fang et al. 2008
In situ polymerization of a nanoemulsion
assisted by ultrasound
n-octadecane Poliestirene n.a. 50-200 nm
Ø average: 124 nm n.a. 124.4 kJ/kg
Zhang et al. (2004 a) In situ polymerization n-octadecane Melamine formaldehyde n.a. n.a. 30.5ºC 170 kJ/kg
(melting enthalpy)
Sari et al. (2009) Polymerization n-octacosane PMMA (Polymethyl methacrylate) n.a. 0.15-0.33 µm
Ø average: 0.25 µm 50.6ºC 86.4 kJ/kg
Hawlader et al. (2003)Coacervation Spray-drying
Paraffin wax (Merck) n.a. n.a. n.a. n.a. 145-240 kJ/kg (depends
on the ratio core/shell and on the method)
Li et al. (2007) In situ polymerization n-octadecane Melamine formaldehyde n.a. Ø average: 2.2 µm 40.6ºC 144 kJ/kg
Alvarado et al. (2007) Coacervation
1) 99.8% Tetradecane+0.2%
silica fume 2) 98%
tetradecane+2% tetradecanol
3) 94% tetradecane+6%
tetradecanol
Gelatin Silicon fume Tetradecanol
1) 90-150 µm Ø average: 100 µm
2) 70-260 µm Ø average: 145 µm
3) 2-10 µm Ø average: 4.4 µm
n.a. 3) 202.1 kJ/kg
(melting enthalpy)
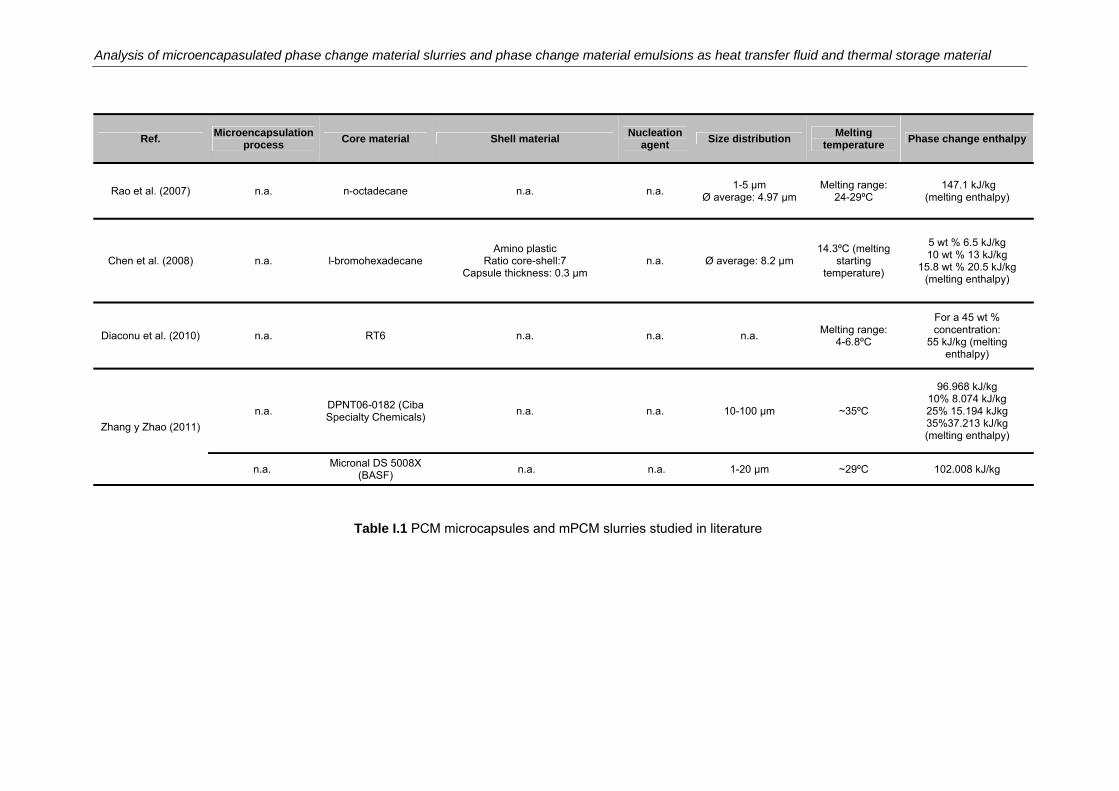
Analysis of microencapasulated phase change material slurries and phase change material emulsions as heat transfer fluid and thermal storage material
Ref. Microencapsulation
process Core material Shell material
Nucleation agent
Size distribution Melting
temperature Phase change enthalpy
Rao et al. (2007) n.a. n-octadecane n.a. n.a. 1-5 μm
Ø average: 4.97 μm Melting range:
24-29ºC 147.1 kJ/kg
(melting enthalpy)
Chen et al. (2008) n.a. l-bromohexadecane Amino plastic
Ratio core-shell:7 Capsule thickness: 0.3 µm
n.a. Ø average: 8.2 μm 14.3ºC (melting
starting temperature)
5 wt % 6.5 kJ/kg 10 wt % 13 kJ/kg
15.8 wt % 20.5 kJ/kg (melting enthalpy)
Diaconu et al. (2010) n.a. RT6 n.a. n.a. n.a. Melting range:
4-6.8ºC
For a 45 wt % concentration:
55 kJ/kg (melting enthalpy)
Zhang y Zhao (2011)
n.a. DPNT06-0182 (Ciba Specialty Chemicals)
n.a. n.a. 10-100 µm ~35ºC
96.968 kJ/kg 10% 8.074 kJ/kg 25% 15.194 kJkg 35%37.213 kJ/kg (melting enthalpy)
n.a. Micronal DS 5008X
(BASF) n.a. n.a. 1-20 µm ~29ºC 102.008 kJ/kg
Table I.1 PCM microcapsules and mPCM slurries studied in literature
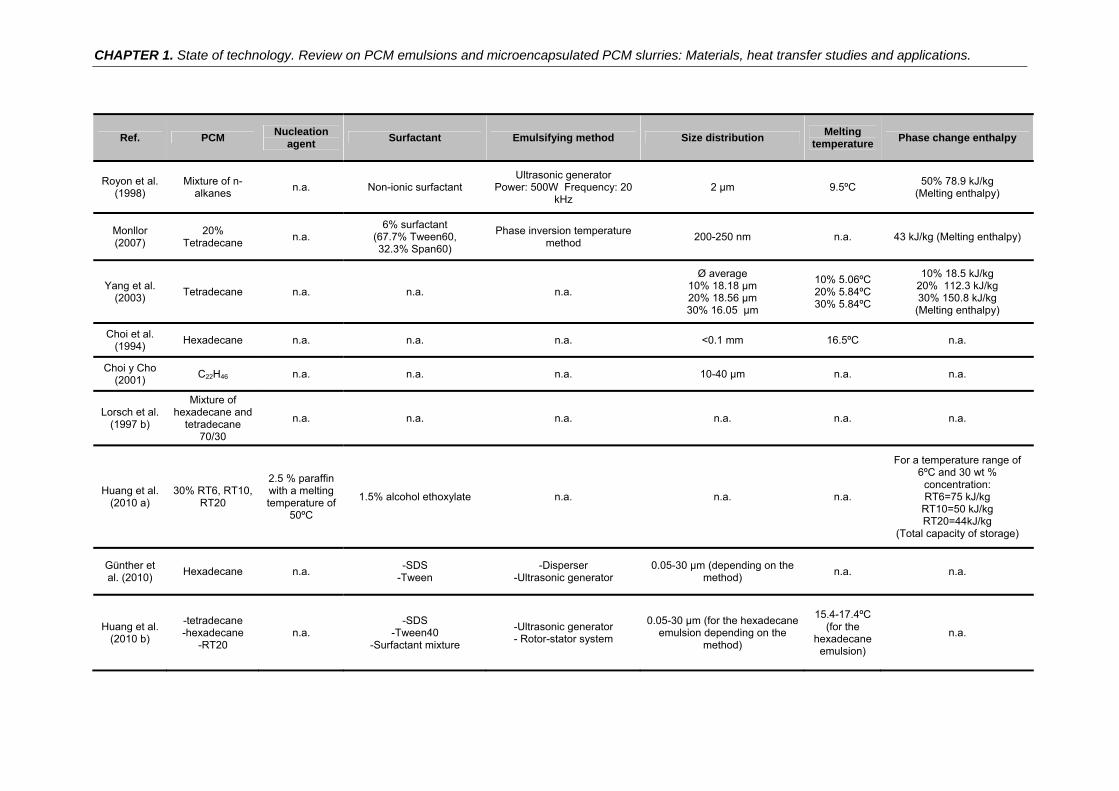
CHAPTER 1. State of technology. Review on PCM emulsions and microencapsulated PCM slurries: Materials, heat transfer studies and applications.
Ref. PCM Nucleation
agent Surfactant Emulsifying method Size distribution
Melting temperature
Phase change enthalpy
Royon et al. (1998)
Mixture of n-alkanes
n.a. Non-ionic surfactant Ultrasonic generator
Power: 500W Frequency: 20 kHz
2 µm 9.5ºC 50% 78.9 kJ/kg
(Melting enthalpy)
Monllor (2007)
20% Tetradecane
n.a. 6% surfactant
(67.7% Tween60, 32.3% Span60)
Phase inversion temperature method
200-250 nm n.a. 43 kJ/kg (Melting enthalpy)
Yang et al. (2003)
Tetradecane n.a. n.a. n.a.
Ø average 10% 18.18 μm 20% 18.56 μm 30% 16.05 μm
10% 5.06ºC 20% 5.84ºC 30% 5.84ºC
10% 18.5 kJ/kg 20% 112.3 kJ/kg 30% 150.8 kJ/kg
(Melting enthalpy)
Choi et al. (1994)
Hexadecane n.a. n.a. n.a. <0.1 mm 16.5ºC n.a.
Choi y Cho (2001)
C22H46 n.a. n.a. n.a. 10-40 µm n.a. n.a.
Lorsch et al. (1997 b)
Mixture of hexadecane and
tetradecane 70/30
n.a. n.a. n.a. n.a. n.a. n.a.
Huang et al. (2010 a)
30% RT6, RT10, RT20
2.5 % paraffin with a melting temperature of
50ºC
1.5% alcohol ethoxylate n.a. n.a. n.a.
For a temperature range of 6ºC and 30 wt %
concentration: RT6=75 kJ/kg
RT10=50 kJ/kg RT20=44kJ/kg
(Total capacity of storage)
Günther et al. (2010)
Hexadecane n.a. -SDS
-Tween -Disperser
-Ultrasonic generator 0.05-30 μm (depending on the
method) n.a. n.a.
Huang et al. (2010 b)
-tetradecane -hexadecane
-RT20 n.a.
-SDS -Tween40
-Surfactant mixture
-Ultrasonic generator - Rotor-stator system
0.05-30 μm (for the hexadecane emulsion depending on the
method)
15.4-17.4ºC (for the
hexadecane emulsion)
n.a.
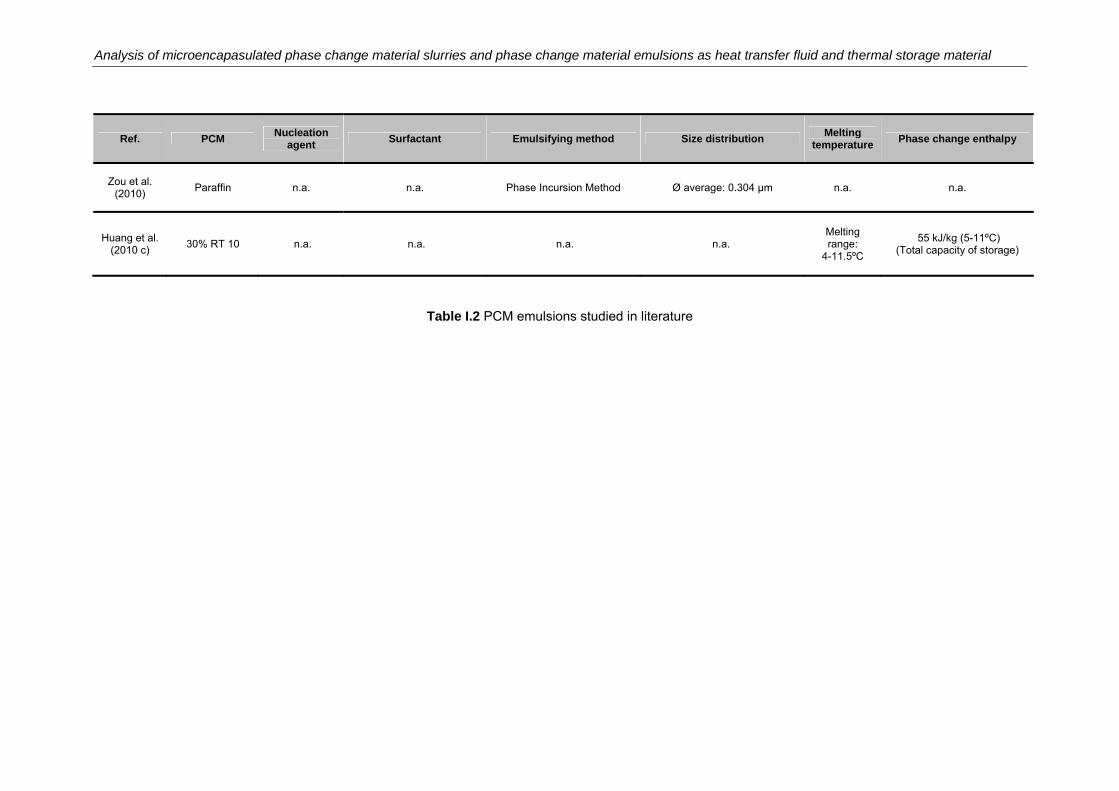
Analysis of microencapasulated phase change material slurries and phase change material emulsions as heat transfer fluid and thermal storage material
Ref. PCM Nucleation
agent Surfactant Emulsifying method Size distribution
Melting temperature
Phase change enthalpy
Zou et al. (2010)
Paraffin n.a. n.a. Phase Incursion Method Ø average: 0.304 μm n.a. n.a.
Huang et al. (2010 c)
30% RT 10 n.a. n.a. n.a. n.a. Melting range:
4-11.5ºC
55 kJ/kg (5-11ºC) (Total capacity of storage)
Table I.2 PCM emulsions studied in literature
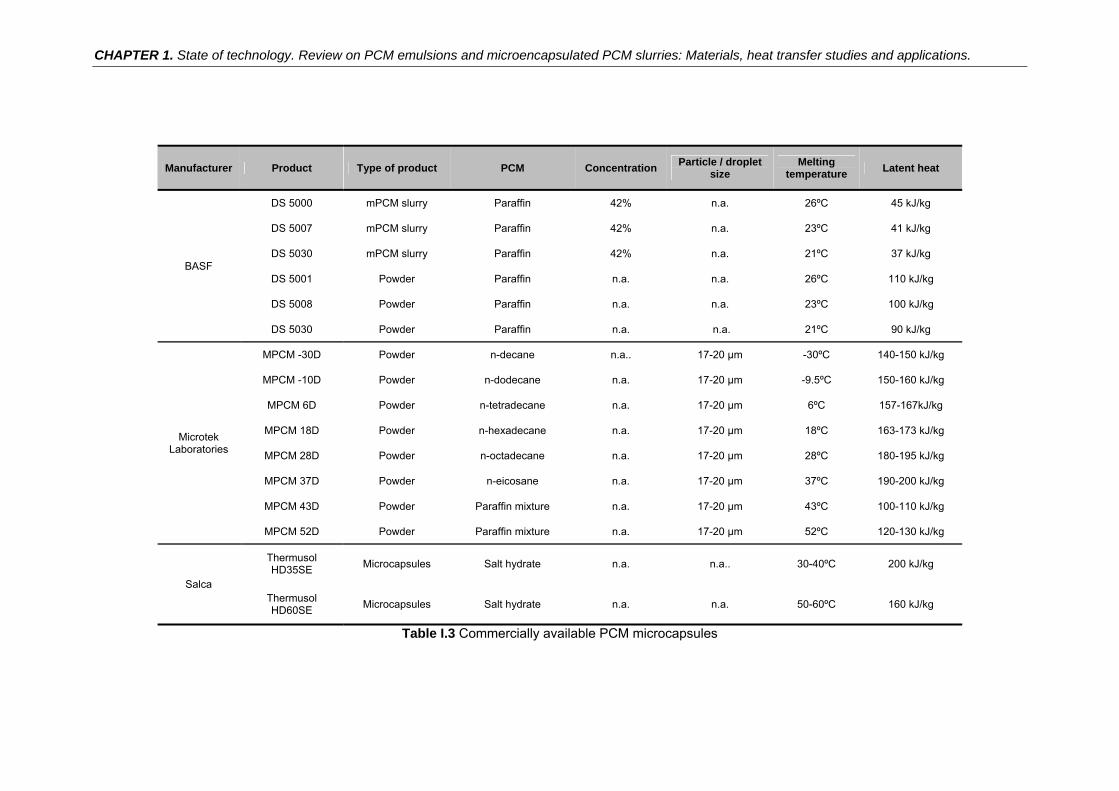
CHAPTER 1. State of technology. Review on PCM emulsions and microencapsulated PCM slurries: Materials, heat transfer studies and applications.
Manufacturer Product Type of product PCM Concentration Particle / droplet
size Melting
temperature Latent heat
BASF
DS 5000 mPCM slurry Paraffin 42% n.a. 26ºC 45 kJ/kg
DS 5007 mPCM slurry Paraffin 42% n.a. 23ºC 41 kJ/kg
DS 5030 mPCM slurry Paraffin 42% n.a. 21ºC 37 kJ/kg
DS 5001 Powder Paraffin n.a. n.a. 26ºC 110 kJ/kg
DS 5008 Powder Paraffin n.a. n.a. 23ºC 100 kJ/kg
DS 5030 Powder Paraffin n.a. n.a. 21ºC 90 kJ/kg
Microtek Laboratories
MPCM -30D Powder n-decane n.a.. 17-20 μm -30ºC 140-150 kJ/kg
MPCM -10D Powder n-dodecane n.a. 17-20 μm -9.5ºC 150-160 kJ/kg
MPCM 6D Powder n-tetradecane n.a. 17-20 μm 6ºC 157-167kJ/kg
MPCM 18D Powder n-hexadecane n.a. 17-20 μm 18ºC 163-173 kJ/kg
MPCM 28D Powder n-octadecane n.a. 17-20 μm 28ºC 180-195 kJ/kg
MPCM 37D Powder n-eicosane n.a. 17-20 μm 37ºC 190-200 kJ/kg
MPCM 43D Powder Paraffin mixture n.a. 17-20 μm 43ºC 100-110 kJ/kg
MPCM 52D Powder Paraffin mixture n.a. 17-20 μm 52ºC 120-130 kJ/kg
Salca
Thermusol HD35SE
Microcapsules Salt hydrate n.a. n.a.. 30-40ºC 200 kJ/kg
Thermusol HD60SE
Microcapsules Salt hydrate n.a. n.a. 50-60ºC 160 kJ/kg
Table I.3 Commercially available PCM microcapsules
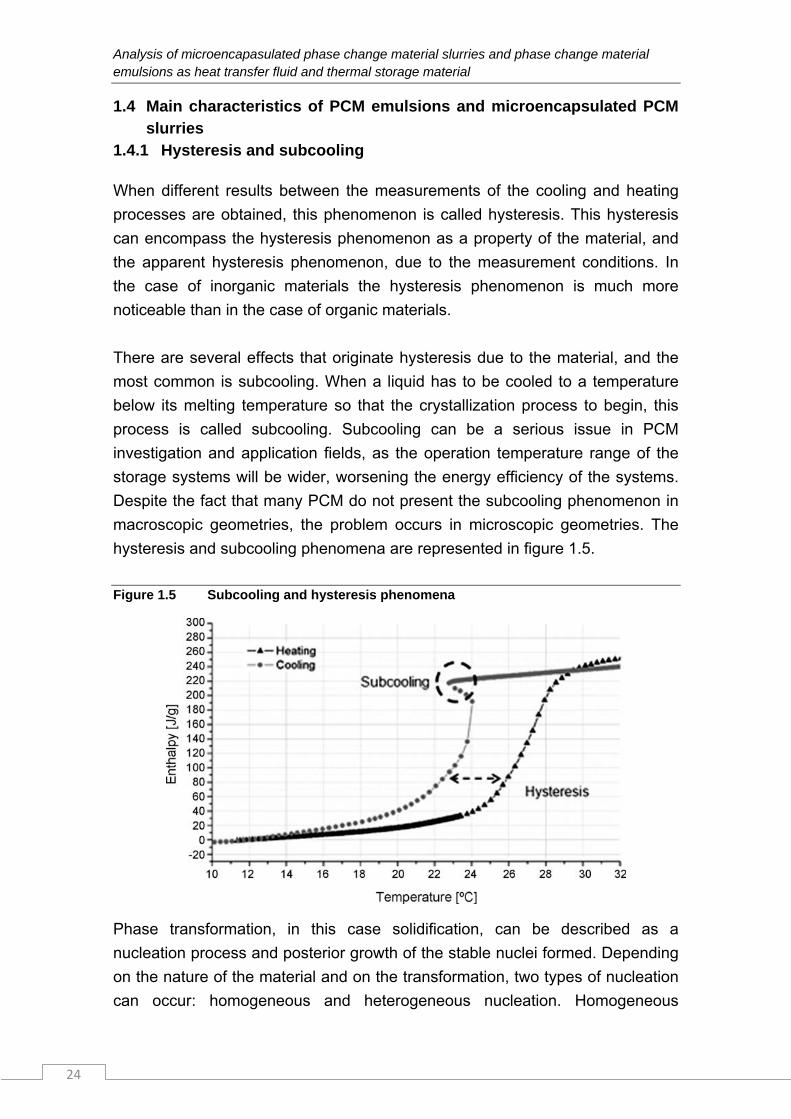
Analysis of microencapasulated phase change material slurries and phase change material emulsions as heat transfer fluid and thermal storage material
24
1.4 Main characteristics of PCM emulsions and microencapsulated PCM slurries
1.4.1 Hysteresis and subcooling
When different results between the measurements of the cooling and heating
processes are obtained, this phenomenon is called hysteresis. This hysteresis
can encompass the hysteresis phenomenon as a property of the material, and
the apparent hysteresis phenomenon, due to the measurement conditions. In
the case of inorganic materials the hysteresis phenomenon is much more
noticeable than in the case of organic materials.
There are several effects that originate hysteresis due to the material, and the
most common is subcooling. When a liquid has to be cooled to a temperature
below its melting temperature so that the crystallization process to begin, this
process is called subcooling. Subcooling can be a serious issue in PCM
investigation and application fields, as the operation temperature range of the
storage systems will be wider, worsening the energy efficiency of the systems.
Despite the fact that many PCM do not present the subcooling phenomenon in
macroscopic geometries, the problem occurs in microscopic geometries. The
hysteresis and subcooling phenomena are represented in figure 1.5.
Figure 1.5 Subcooling and hysteresis phenomena
Phase transformation, in this case solidification, can be described as a
nucleation process and posterior growth of the stable nuclei formed. Depending
on the nature of the material and on the transformation, two types of nucleation
can occur: homogeneous and heterogeneous nucleation. Homogeneous
CHAPTER 1. State of technology. Review on PCM emulsions and microencapsulated PCM slurries: Materials, heat transfer studies and applications.
25
nucleation occurs if all volumes of the initial phase are identical from energy,
chemical, and structural viewpoints. This is not the most common process as
materials inevitably contain defects or non-homogeneities that cause local
differences in some properties. In this case nucleation will occur preferably in
those locations where non-homogeneities occurred. The process ceases to be
random as there are preferential nucleation locations and then heterogeneous
nucleation takes place. In heterogeneous nucleation the formation of nuclei
begins in preferential locations such as walls or imperfections. The addition of
impurities such as nucleation elements is a technique used to obtain greater
homogeneity in the structure of the solidified material. The aggregation of
particles that act as nucleation agents can result in solidification at lower
subcooling, avoiding the formation and growth of nuclei mainly from the walls of
the mold, and leading to structures with anisotropic behaviour. In his
experimental work, Huang et al. (2010 a) utilized paraffin as a nucleation agent,
with a higher melting temperature than the material in solidification, obtaining in
this way solid surfaces on which to begin the solidification process.
Nevertheless, due to the microscopic size of particles in the case of PCM
emulsions and mPCM slurries, the probability that nucleation agents are
present to begin the solidification process of the PCM is lower, and therefore a
lower temperature is required for solidification to start. This effect is explained
by Günther et al. (2010) in their article. According to these authors, for a given
concentration of seeds, the number of active volumes (droplets) by these seeds
is dependent on the size of the volumes. The remaining inactive volumes
(droplets without seeds) can only solidify after homogeneous nucleation. The
fraction of active volumes with respect to the inactive volumes in function of the
size of the element corresponds to a Poisson distribution.
There are many authors that have studied the subcooling problem in PCM
emulsions and mPCM slurries as well as the way to eliminate such problem.
The authors of the different studies consider the value of subcooling as the
difference between the peak temperatures in the heating curve and in the
cooling curve, obtained with the DSC (DSC, Differential Scanning Calorimetry).
In the case of the paraffin emulsion developed by Huang et al. (2009), in order
to prevent subcooling, a nucleation agent was added to the paraffin before the
emulsifying process. The nucleation agent offered the necessary surface to
start nucleation in the interior of the paraffin droplets, acting therefore as a
nucleation catalyser. The emulsion without nucleation agents presented a 7ºC
subcooling, while with the addition of the nucleation agent it was reduced to
Analysis of microencapasulated phase change material slurries and phase change material emulsions as heat transfer fluid and thermal storage material
26
0.1ºC. To study the effect of the droplet size on the nucleation and subcooling,
Huang et al. (2010b) prepared different paraffin-in-water emulsions with various
droplet sizes. They found that besides the droplet size, the surfactant of the
emulsion had a significant influence on the solidification. They also observed
that all emulsions containing nucleation agents showed a freezing peak
spectrum. In the second part of this paper, Günther et al. (2011) discussed
possible interpretations of the observations according to the nucleation theory.
They relate the increased subcooling in emulsions to the droplet size. The seed
deactivation for a given seed concentration increases when the droplet size
decreases. Regarding to the surfactants, they point out that their chemical
structure could promote the nucleation. They also mention that while in larger
droplets (low curvature), the alignment of the surfactants tails is almost parallel,
offering in this way a pattern for crystallization of the alkane crystal, in smaller
droplets (high curvature) this alignment is more complicated. The freezing peak
spectrum is explained with different seed types, as it can be observed in figure
1.6. In a bulk sample, nucleation is dominated by primary seeds (dots according
to figure 1.6), at their nucleation temperature T1. When the volume is divided
into droplets, secondary seeds (squares according to figure 1.6) become active
at T2. For smaller droplets, nucleation on the droplets wall or homogeneus
nucleation comes into the play at T3. Alvarado et al. (2006) studied the
subcooling process in n-tetradecane microcapsules, as well as its elimination
due to the addition of nucleation agents. N-tetradecane microcapsules were
prepared with gelatine capsules, producing microcapsules with an average
diameter of 100 µm, utilizing two different substances and concentrations as
nucleation agents (0.2% silica, 2 and 4% tetradecanol). Silica fume did not
result adequate as a nucleation agent. A concentration of 2% tetradecanol
resulted sufficient to suppress subcooling both in tetradecane and
microencapsulated tetradecane, suggesting that heterogeneous nucleation was
more favourable in the presence of tetradecanol. Nevertheless the amount of
nucleation agent should be the smallest possible in order to eliminate
subcooling and reduce by the least the melting latent heat. Zhang et al. (2005)
also investigated crystallization from a DSC for the n-octadecane
microencapsulated with l-octadecanol as a nucleation agent. The cooling curves
obtained from the DSC for the microencapsulated n-octadecane were mainly
affected by the average diameter of particles. The maximum degree of
subcooling was 26ºC with a cooling/heating rate of the DSC of 10ºC/min. An
addition of 10% in weight of l-octadecanol inside the microcapsules as a
nucleation agent decreased subcooling from 26ºC to 12ºC with a DSC rate of
10ºC/min. The influence of the heating and cooling rate on the obtained results
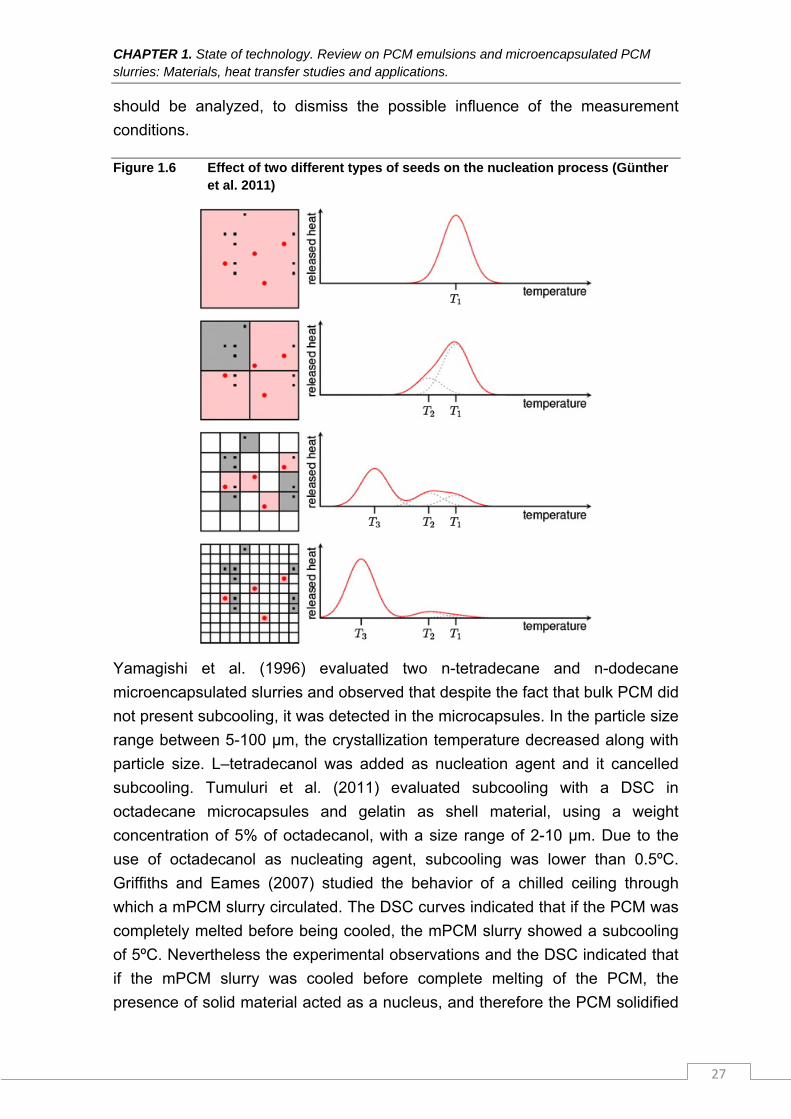
CHAPTER 1. State of technology. Review on PCM emulsions and microencapsulated PCM slurries: Materials, heat transfer studies and applications.
27
should be analyzed, to dismiss the possible influence of the measurement
conditions.
Figure 1.6 Effect of two different types of seeds on the nucleation process (Günther et al. 2011)
Yamagishi et al. (1996) evaluated two n-tetradecane and n-dodecane
microencapsulated slurries and observed that despite the fact that bulk PCM did
not present subcooling, it was detected in the microcapsules. In the particle size
range between 5-100 µm, the crystallization temperature decreased along with
particle size. L–tetradecanol was added as nucleation agent and it cancelled
subcooling. Tumuluri et al. (2011) evaluated subcooling with a DSC in
octadecane microcapsules and gelatin as shell material, using a weight
concentration of 5% of octadecanol, with a size range of 2-10 µm. Due to the
use of octadecanol as nucleating agent, subcooling was lower than 0.5ºC.
Griffiths and Eames (2007) studied the behavior of a chilled ceiling through
which a mPCM slurry circulated. The DSC curves indicated that if the PCM was
completely melted before being cooled, the mPCM slurry showed a subcooling
of 5ºC. Nevertheless the experimental observations and the DSC indicated that
if the mPCM slurry was cooled before complete melting of the PCM, the
presence of solid material acted as a nucleus, and therefore the PCM solidified
Analysis of microencapasulated phase change material slurries and phase change material emulsions as heat transfer fluid and thermal storage material
28
at higher temperatures. For this reason lower outlet temperatures than those of
complete melting of the PCM were used.
1.4.2 Stability Stability of PCM emulsions
The stability question is always a concern during the development and
production of an emulsion. There are five main instability problems (Tadros
2004):
Creaming or sedimentation, as a result of gravity if there are density
differences between disperses and continuous phases. In an O/W
emulsion (oil/water), creaming is the movement of the oil droplets due to
gravity, causing a concentrated layer at the superior part of the sample.
Sedimentation is the opposite process.
Flocculation, the process of agglomerating the emulsion droplets.
Coalescence, process through which two or more droplets of the
disperse phase melt and form a bigger droplet.
Ostwald ripening, as a result of solubility differences of the disperse
phase contained in droplets of different sizes.
Phase inversion, process through which the continuous phase converts
itself into the disperse phase and the disperse phase converts itself into
the continuous phase.
Creaming, sedimentation and flocculation are not accompanied by a change in
size distribution of the disperse phase, while coalescence and Ostwald ripening
cause an increase in the size of the droplet. Figure 1.7 shows the instability
processes mentioned.
In a stable emulsion, the aforementioned instability processes never occur.
However, the majority of emulsions inherently tend to separate, especially
under complex operation conditions. Many studies analyze the stability of
emulsions, which is of vital importance in the future use of emulsions as thermal
storage materials. It is also important that thermal properties remain invariable
after thermal cycling. Huang et al. (2009) observed that, after a one-month
storage period of a RT 10 emulsion (paraffin from Rubitherm), emulsions with a
15-60% weight concentration presented creaming, while emulsions with a 60-
75% concentration did not present instability. After one year, no changes in size
distribution of particles were detected and the emulsions maintained their heat
capacity. Under mechanical-thermal loads, the droplet size of the paraffin
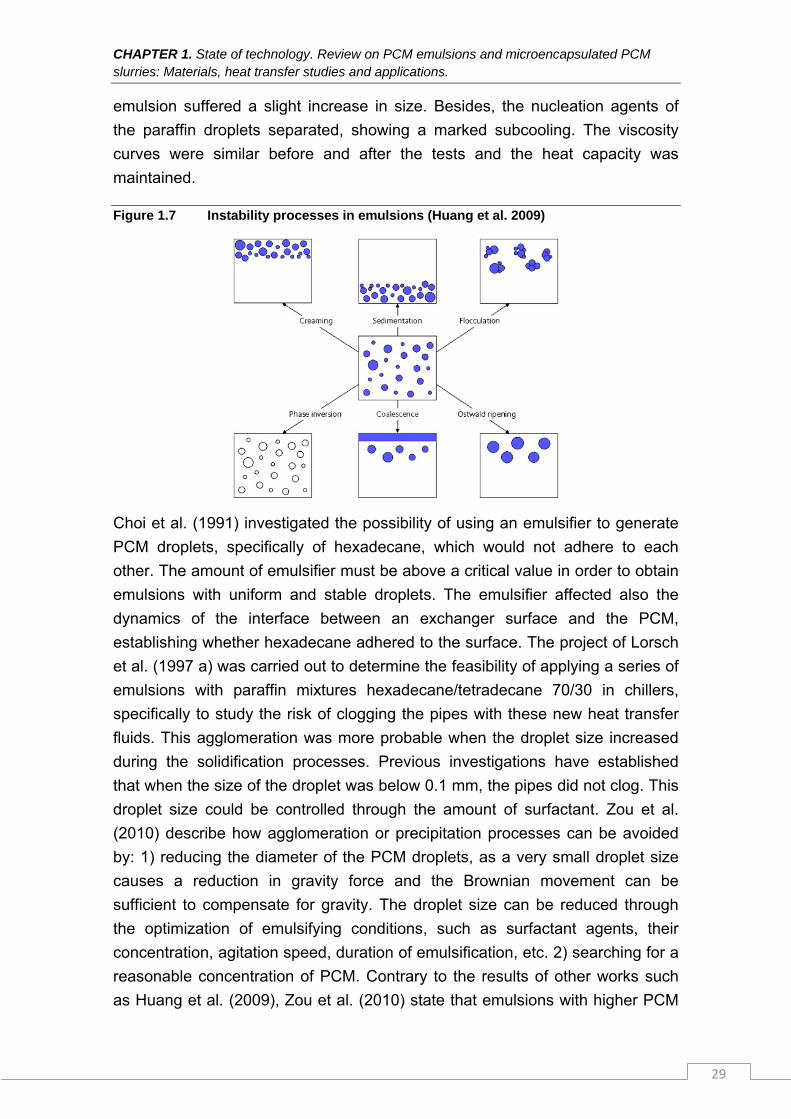
CHAPTER 1. State of technology. Review on PCM emulsions and microencapsulated PCM slurries: Materials, heat transfer studies and applications.
29
emulsion suffered a slight increase in size. Besides, the nucleation agents of
the paraffin droplets separated, showing a marked subcooling. The viscosity
curves were similar before and after the tests and the heat capacity was
maintained.
Figure 1.7 Instability processes in emulsions (Huang et al. 2009)
Choi et al. (1991) investigated the possibility of using an emulsifier to generate
PCM droplets, specifically of hexadecane, which would not adhere to each
other. The amount of emulsifier must be above a critical value in order to obtain
emulsions with uniform and stable droplets. The emulsifier affected also the
dynamics of the interface between an exchanger surface and the PCM,
establishing whether hexadecane adhered to the surface. The project of Lorsch
et al. (1997 a) was carried out to determine the feasibility of applying a series of
emulsions with paraffin mixtures hexadecane/tetradecane 70/30 in chillers,
specifically to study the risk of clogging the pipes with these new heat transfer
fluids. This agglomeration was more probable when the droplet size increased
during the solidification processes. Previous investigations have established
that when the size of the droplet was below 0.1 mm, the pipes did not clog. This
droplet size could be controlled through the amount of surfactant. Zou et al.
(2010) describe how agglomeration or precipitation processes can be avoided
by: 1) reducing the diameter of the PCM droplets, as a very small droplet size
causes a reduction in gravity force and the Brownian movement can be
sufficient to compensate for gravity. The droplet size can be reduced through
the optimization of emulsifying conditions, such as surfactant agents, their
concentration, agitation speed, duration of emulsification, etc. 2) searching for a
reasonable concentration of PCM. Contrary to the results of other works such
as Huang et al. (2009), Zou et al. (2010) state that emulsions with higher PCM
Analysis of microencapasulated phase change material slurries and phase change material emulsions as heat transfer fluid and thermal storage material
30
concentrations will make agglomeration or sedimentation appear. Schalbart et
al. (2010) prepared several PCM nanoemulsions using different emulsification
routes from low energy emulsification methods (phase inversion temperature
method), determining the best emulsification routes to obtain satisfactory
stability in the resultant emulsions.
Stability of microencapsulated PCM slurries
In the case of mPCM slurries, problems such as sedimentation, creaming or
agglomeration can also occur, but the main problem is microcapsule rupture.
Yamagishi et al. (1996) studied the damage produced by the stresses caused
by the pump or by agitation on microcapsules. They observed that agitation did
not damage microcapsules and when suffering stresses caused by the pump,
the rupture index decreased along with particle size. Regarding thermal cycling
(contraction-expansion), it was observed that the 5 μm microcapsules did not
rupture and the thermal properties of cycled microcapsules remained invariable.
Zhang et al. (2004 b) studied the influential factors on thermal stability in
relation to the structure of n-octadecane microencapsulated into urea melamine
formaldehyde capsules. A loss of liquid n-octadecane from the microcapsule
was observed due to microcapsule rupture, as a consequence of a bad
adjustment of core and capsule expansion at high temperatures. Zhang et al.
(2004 a) investigated the effects of several parameters of the
microencapsulation process on the properties and stability of n-octadecane
microencapsulated and nanocapsulated into melamine formaldehyde capsules.
The thermal stability of the microcapsules and nanocapsules increased along
with the increase in agitation speed and with the emulsifier content.
Gschwander et al. (2005) built an experimental setup to cycle different mPCM
slurries. The mPCM slurries were pumped during several weeks in order to
study stability. Conventional components such as expansion valves, heat
exchangers, etc., worked well with mPCM slurries. The stability of
microcapsules was negatively affected by high shearing speeds, which
occurred mainly in the pump. After testing several pumps, the centrifugal pumps
resulted in less damage or less destruction of the microcapsule shell. The good
stability of capsules was a result of a smaller diameter and a thicker shell. This
configuration resulted in a smaller fraction of paraffin and therefore a lower
melting enthalpy. The microcapsules could be pumped during weeks, which
resulted into a period equivalent to years in a real installation (800 cycles per
day). Fan et al. (2005) synthesized and studied in detail the thermal stability and
permeability of microencapsulated n-octadecane and cyclohexane. The content
CHAPTER 1. State of technology. Review on PCM emulsions and microencapsulated PCM slurries: Materials, heat transfer studies and applications.
31
of cyclohexane in the core has a remarkable effect on morphology, thermal
stability and permeability. After thermal treatment of capsules, the volatile
character of cyclohexane caused an expansible space to be formed, which
improved the thermal stability of microcapsules. These microcapsules
presented a greater resistance to temperature and less mass loss. This weight
loss was attributed mainly to the loss of n-octadecane in some broken capsules.
Alvarado et al. (2007) presented thermophysical properties of a
microencapsulated tetradecane slurry. In concrete, with respect to microparticle
stability, it was observed that the size of the microcapsule should be smaller
than 20 μm to avoid rupture. If a considerable amount of microcapsules were
broken during durability tests, smaller capsules or capsules with a higher
thickness/diameter ratio were tested. Microcapsules with a 2-10 μm diameter
showed less damage during circulation through a progressive pump. Jin et al.
(2008) prepared and studied the behavior of paraffin microcapsules with a
phase change temperature of 50.2ºC, specifically the influence of the weight
percentage with respect to the PCM core on the stability during phase change.
They observed that the microcapsules suffered coalescence when the content
of the capsules was inferior to 2.1% in weight as a consequence of
microcapsule rupture. When the content of the capsule was 16.7% in weight,
the microcapsules suffered partial coalescence. When this percentage
increased to 28%, the capsules remained intact after an elevated number of
thermal cycles and presented a better thermal stability than bulk paraffin. Alkan
et al. (2009) characterized the behavior of docosane microencapsulated into
PMMA (Polymethyl methacrylate) capsules, which were synthesized by them.
Degradation of bulk docosane took place in a single stage at a temperature of
approximately 120ºC, while microcapsules degraded in two stages: at 240ºC
and at 323ºC. No significant changes were observed in the temperature or
phase change enthalpies, after thermal cycles (1000, 3000, and 5000 cycles).
Griffiths and Eames (2007) pumped a mPCM slurry through a chilled ceiling.
During the experiments, deposition of microcapsules was not observed in the
pipe elbows and around valves. Degradation of the slurry was not observed
either. It was observed that dry pumps were adequate to pump the slurry.
From this review on the stability of PCM emulsions and mPCM slurries it can be
concluded that, for the case of PCM emulsions and mPCM slurries, the
creaming phenomenon and microcapsule rupture are the most frequent
problems. In the case of emulsions, the creaming problem can be solved
through the reduction of the PCM droplet size. In the case of the mPCM
slurries, microcapsule rupture is solved through the reduction of particle size
Analysis of microencapasulated phase change material slurries and phase change material emulsions as heat transfer fluid and thermal storage material
32
and/or increase of the relationship thickness capsule/thickness core for the
PCM.
1.4.3 Rheological behavior, viscosity and pressure drop
The viscosity measurement and rheological characterization of these slurries
systems, PCM emulsions and mPCM slurries, must be taken into account as
although it seems homogeneous at a macroscopic level, the presence of other
phases at a microscopic level modifies their behavior significantly. The concept
of viscosity is based on the supposition that fluids are homogeneous and that,
as a consequence, can be treated as continuous. Nevertheless, disperse
systems exhibit a behavior that diverges strongly from the behavior observed in
homogeneous fluids. This is due to the presence of two or more phases, which
generates one or more interfaces of different nature. As a consequence, the
behavior of the flow can range from simply Newtonian in diluted particle
systems with no interaction, to highly non-Newtonian behaviors in concentrated
or diluted systems where there is elevated interaction between particles. The
main physical properties that influence rheological behavior are the content of
the disperse phase; size, form and distribution of particle size and temperature.
For the case of emulsions, two other factors must also be considered: degree of
droplet deformation and disperse phase viscosity (Barnes 2000).
Rheological behavior of PCM emulsions
Choi et al. (1994) observed that in their 10% hexadecane emulsion, pressure
drop decreased significantly starting from the melting point of PCM particles.
The focus of the work of Royon et al. (1998) was on the study of the
thermorheological behavior of an emulsion with a 50% n-alkane concentration
in weight. The results of the rheological experiments showed a pseudoplastic
behavior and the apparent viscosity of the emulsion followed the power law
(τ=K·φn). Viscosity decreased with the increase of temperature and the n and K
indices were functions of temperature. The K index decreased with an increase
in temperature, and the relationship between the K index and temperature was
exponential. The n index showed a slight rise close to 9.5ºC (phase change
temperature), mainly caused by the phase change of the component in
dispersion. Chen et al. (2006) built an experimental installation to study the
rheological characteristics of a tetradecane emulsion with a weight
concentration of 30%, prepared by the phase inversion temperature method.
The emulsion could be considered a Newtonian fluid. The friction factor was
adjusted to the classical function fD=64/Re for laminar flow. Viscosity of the
emulsion was 5.57 times that of water. The pump power decreased
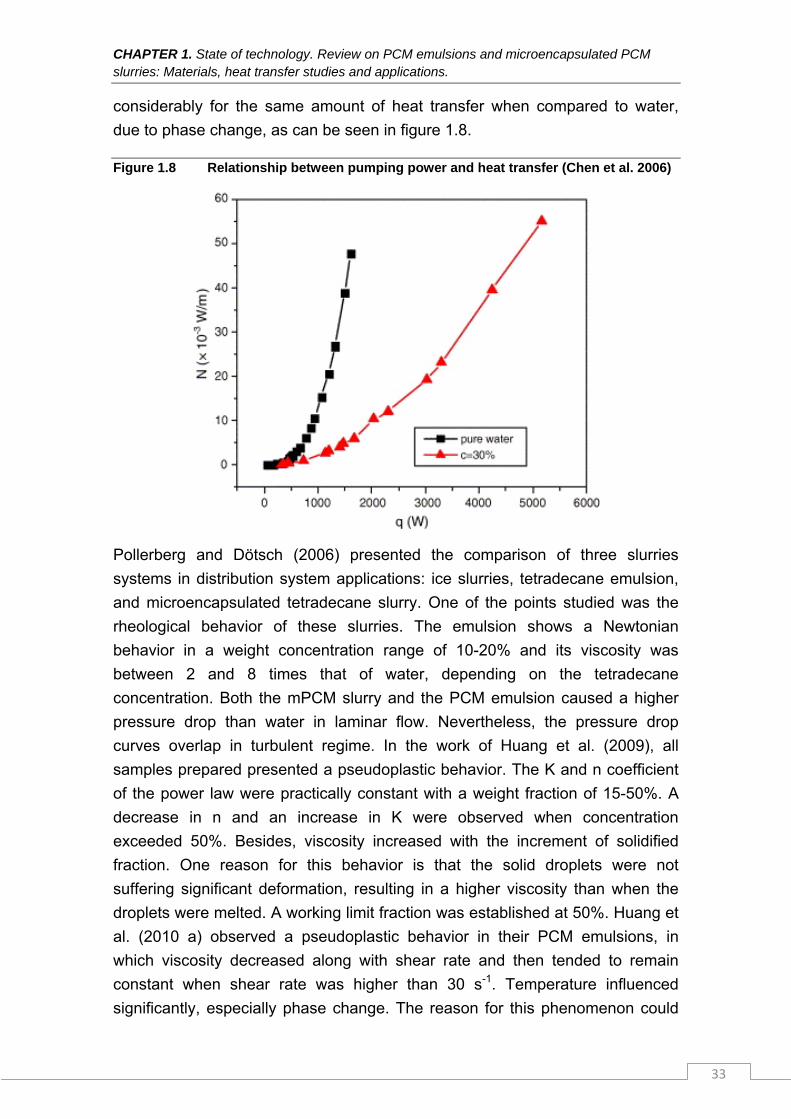
CHAPTER 1. State of technology. Review on PCM emulsions and microencapsulated PCM slurries: Materials, heat transfer studies and applications.
33
considerably for the same amount of heat transfer when compared to water,
due to phase change, as can be seen in figure 1.8.
Figure 1.8 Relationship between pumping power and heat transfer (Chen et al. 2006)
Pollerberg and Dötsch (2006) presented the comparison of three slurries
systems in distribution system applications: ice slurries, tetradecane emulsion,
and microencapsulated tetradecane slurry. One of the points studied was the
rheological behavior of these slurries. The emulsion shows a Newtonian
behavior in a weight concentration range of 10-20% and its viscosity was
between 2 and 8 times that of water, depending on the tetradecane
concentration. Both the mPCM slurry and the PCM emulsion caused a higher
pressure drop than water in laminar flow. Nevertheless, the pressure drop
curves overlap in turbulent regime. In the work of Huang et al. (2009), all
samples prepared presented a pseudoplastic behavior. The K and n coefficient
of the power law were practically constant with a weight fraction of 15-50%. A
decrease in n and an increase in K were observed when concentration
exceeded 50%. Besides, viscosity increased with the increment of solidified
fraction. One reason for this behavior is that the solid droplets were not
suffering significant deformation, resulting in a higher viscosity than when the
droplets were melted. A working limit fraction was established at 50%. Huang et
al. (2010 a) observed a pseudoplastic behavior in their PCM emulsions, in
which viscosity decreased along with shear rate and then tended to remain
constant when shear rate was higher than 30 s-1. Temperature influenced
significantly, especially phase change. The reason for this phenomenon could
Analysis of microencapasulated phase change material slurries and phase change material emulsions as heat transfer fluid and thermal storage material
34
be that the solid particles were not very deformed by shearing, causing a higher
viscosity than that of liquid droplets. Cho et al. (1991) observed that the
increase in pumping work in the case of their emulsion with a 25% volumetric
concentration of PCM was small in the turbulent region, in comparison to water.
In the case of the emulsion of Lorsch et al. (1997 b), a fraction of volume up to
20% increased the pressure drop only by 3% compared to water. When the
mixture was cooled to a temperature below PCM solidification, the pressure
drop increased from 3 to 5%. Zou et al. (2010) verified that for a given PCM
concentration, there is a flow rate that causes the greatest savings in pumping
consumptions.
Rheological behavior of microencapsulated PCM slurries
Yamagishi et al. (1996) studied the feasibility of n-tetradecane and n-dodecane
microencapsulated slurries in low temperature applications. One of the studied
aspects was the viscosity of these slurries. Specifically, viscosity was measured
by a cylindrical Couette viscometer and it was observed that apparent viscosity
depended on several parameters: PCM concentration, temperature of slurry,
and microcapsule size. When adding addictives such as surfactant agents, the
slurry stopped behaving as a non-Newtonian fluid and started behaving as a
Newtonian fluid. Yang et al. (2003) prepared slurries with microencapsulated
tetradecane from different materials and observed that the capsule material did
not influence the viscosity of the sample. Rao et al. (2006) centered their study
on the flow characteristics of microencapsulated n-octadecane slurries with
concentrations from 5 to 20%, circulating through horizontal minichannels. The
friction factor of the slurries under laminar regime increased along with the PCM
concentration. Compared to the friction fraction of water, a slight increase was
observed in low-concentration (5%) slurries. Nevertheless, when concentration
was 10% or higher, the increment in friction factor was more marked. The
increment in PCM concentration of the slurries tended to suppress the
generation of turbulence in the flow. When concentration was at least 15%, no
obvious transition was observed from laminar to turbulent flow as occurred in
low-concentration PCM at Re=2000. The pressure drop of the mPCM slurries
flowing through the minichannels increased throughout the speed range when
concentration increased. As previously mentioned, Pollerberg and Dötsch
(2006) compared an ice slurry, a tetradecane emulsion and a
microencapsulated tetradecane emulsion, the three systems with a 20% PCM
concentration. The slurry presented the behavior of a pseudoplastic fluid, and
viscosity was between 120 and 550 times that of water. Both the mPCM slurry
and the PCM emulsion studied in this work presented a higher pressure drop
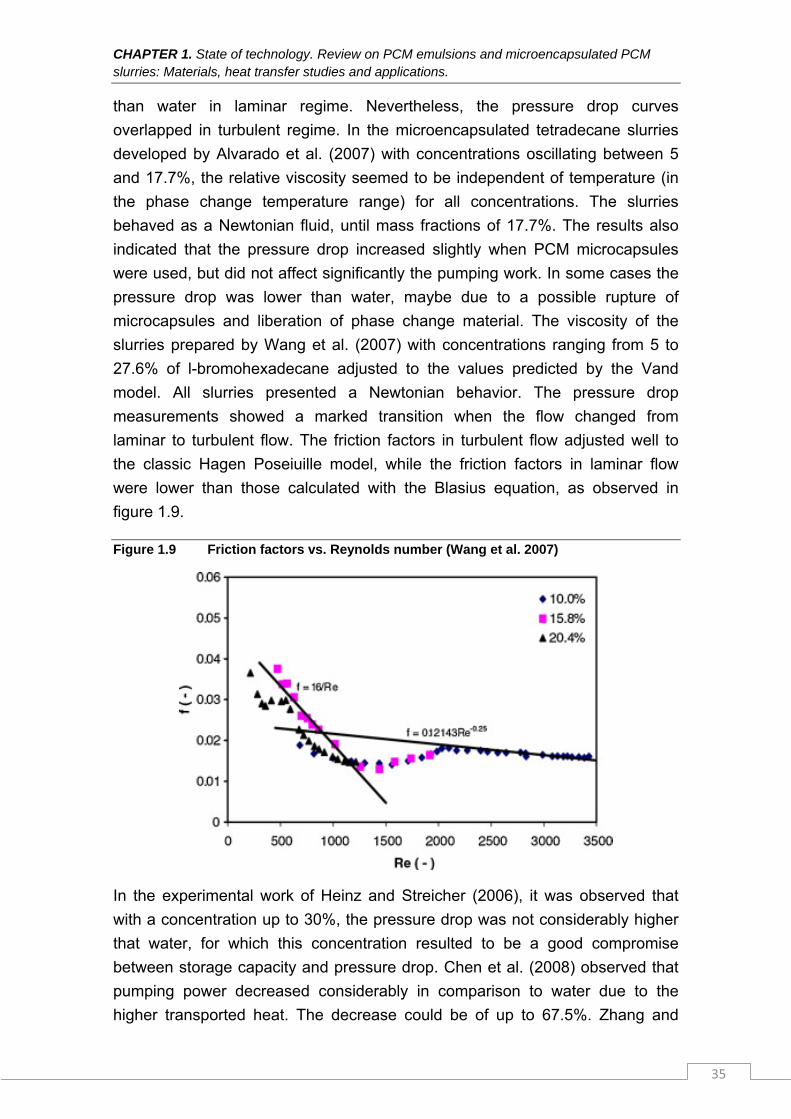
CHAPTER 1. State of technology. Review on PCM emulsions and microencapsulated PCM slurries: Materials, heat transfer studies and applications.
35
than water in laminar regime. Nevertheless, the pressure drop curves
overlapped in turbulent regime. In the microencapsulated tetradecane slurries
developed by Alvarado et al. (2007) with concentrations oscillating between 5
and 17.7%, the relative viscosity seemed to be independent of temperature (in
the phase change temperature range) for all concentrations. The slurries
behaved as a Newtonian fluid, until mass fractions of 17.7%. The results also
indicated that the pressure drop increased slightly when PCM microcapsules
were used, but did not affect significantly the pumping work. In some cases the
pressure drop was lower than water, maybe due to a possible rupture of
microcapsules and liberation of phase change material. The viscosity of the
slurries prepared by Wang et al. (2007) with concentrations ranging from 5 to
27.6% of l-bromohexadecane adjusted to the values predicted by the Vand
model. All slurries presented a Newtonian behavior. The pressure drop
measurements showed a marked transition when the flow changed from
laminar to turbulent flow. The friction factors in turbulent flow adjusted well to
the classic Hagen Poseiuille model, while the friction factors in laminar flow
were lower than those calculated with the Blasius equation, as observed in
figure 1.9.
Figure 1.9 Friction factors vs. Reynolds number (Wang et al. 2007)
In the experimental work of Heinz and Streicher (2006), it was observed that
with a concentration up to 30%, the pressure drop was not considerably higher
that water, for which this concentration resulted to be a good compromise
between storage capacity and pressure drop. Chen et al. (2008) observed that
pumping power decreased considerably in comparison to water due to the
higher transported heat. The decrease could be of up to 67.5%. Zhang and
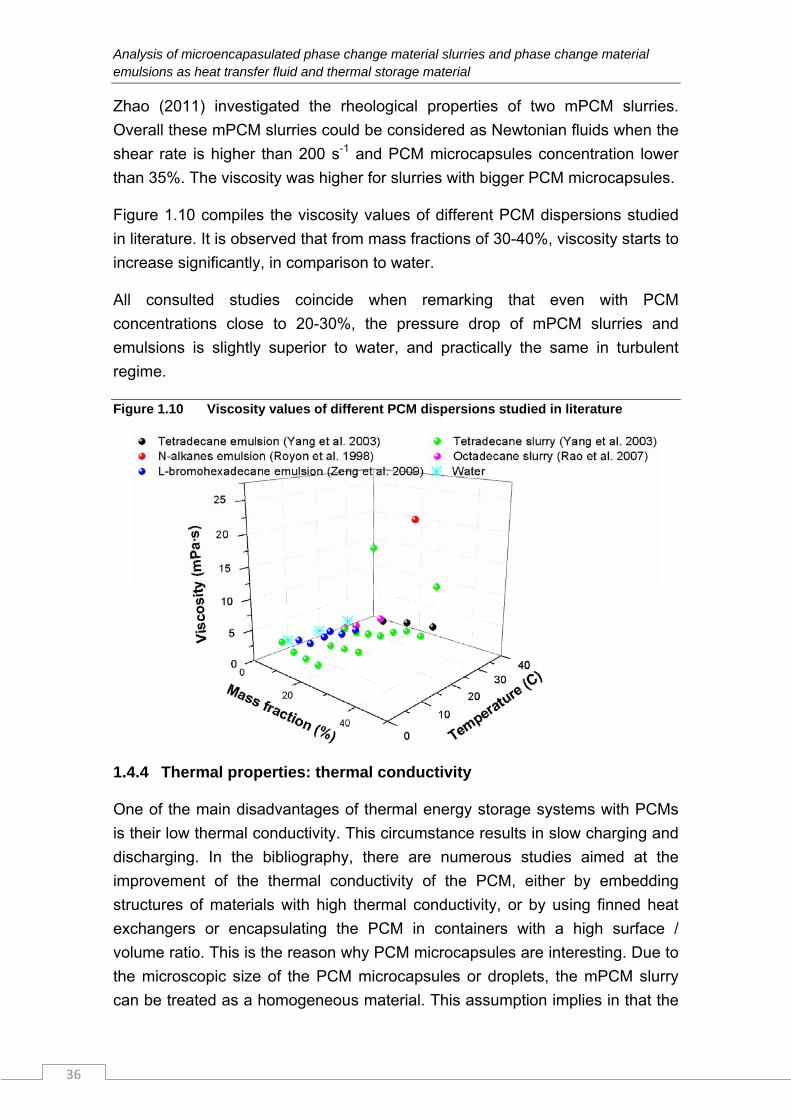
Analysis of microencapasulated phase change material slurries and phase change material emulsions as heat transfer fluid and thermal storage material
36
Zhao (2011) investigated the rheological properties of two mPCM slurries.
Overall these mPCM slurries could be considered as Newtonian fluids when the
shear rate is higher than 200 s-1 and PCM microcapsules concentration lower
than 35%. The viscosity was higher for slurries with bigger PCM microcapsules.
Figure 1.10 compiles the viscosity values of different PCM dispersions studied
in literature. It is observed that from mass fractions of 30-40%, viscosity starts to
increase significantly, in comparison to water.
All consulted studies coincide when remarking that even with PCM
concentrations close to 20-30%, the pressure drop of mPCM slurries and
emulsions is slightly superior to water, and practically the same in turbulent
regime.
Figure 1.10 Viscosity values of different PCM dispersions studied in literature
1.4.4 Thermal properties: thermal conductivity
One of the main disadvantages of thermal energy storage systems with PCMs
is their low thermal conductivity. This circumstance results in slow charging and
discharging. In the bibliography, there are numerous studies aimed at the
improvement of the thermal conductivity of the PCM, either by embedding
structures of materials with high thermal conductivity, or by using finned heat
exchangers or encapsulating the PCM in containers with a high surface /
volume ratio. This is the reason why PCM microcapsules are interesting. Due to
the microscopic size of the PCM microcapsules or droplets, the mPCM slurry
can be treated as a homogeneous material. This assumption implies in that the
CHAPTER 1. State of technology. Review on PCM emulsions and microencapsulated PCM slurries: Materials, heat transfer studies and applications.
37
temperature gradients inside the solid are negligible. This is accomplished if the
convective thermal resistance inside the microcapsules is low in comparison to
the convective thermal resistance between the microcapsule and its
surroundings. The fulfillment of this condition can be analyzed through the Biot
number, which should be under 0.1. If the Biot number is calculated for a PCM
microcapsule, a value much lower than 0.1 will be obtained. This means that
inside the microcapsule the temperature gradients in the PCM are very low and
that the conductive resistance can be neglected. When the PCM is
microencapsulated, low thermal conductivity ceases to be a problem (Streicher
et al. 2005).
So, PCM slurries in water can improve heat transfer as a consequence of the
relationship area/volume of droplets in the case of emulsions and of
microcapsules in the case of slurries, in comparison to systems in which the
PCM is macroencapsulated. Besides, the fact of dispersing phase change
particles into a fluid can improve heat transfer through convection with respect
to water. These slurries can serve either as thermal storage materials or heat
transfer fluids. The thermal properties of these slurries are different from those
of PCM and the fluid in question, which are essential to evaluate the fluid and
the heat transfer characteristics of a system with these slurries. The thermal
properties to be discussed are thermal conductivity and convection heat transfer
coefficient. The analysis of the different studies regarding the convection heat
transfer coefficient is presented in a separate section, due to their extension
and importance within this review.
The thermal conductivity of diluted dispersions, λd, can be evaluated from
Maxwell’s relationship, described in equation 1.1:
)λλ
·(cλλ
)-λλ
·(c·kλ
λ
λ
f
p
f
p
f
p
f
p
f
d
12
122
--
(eq. 1.1)
Where λp is the thermal conductivity of the disperse phase, λf is the thermal
conductivity of the continuous phase and c is the volumetric concentration of the
disperse phase. As a consequence of the interactions particle/fluid, the effective
thermal conductivity is greater than that predicted by this equation, and can be
obtained from the correlation of equation 1.2:
mp
f
e Pe·c·Bλ
λ 1 (eq. 1.2)
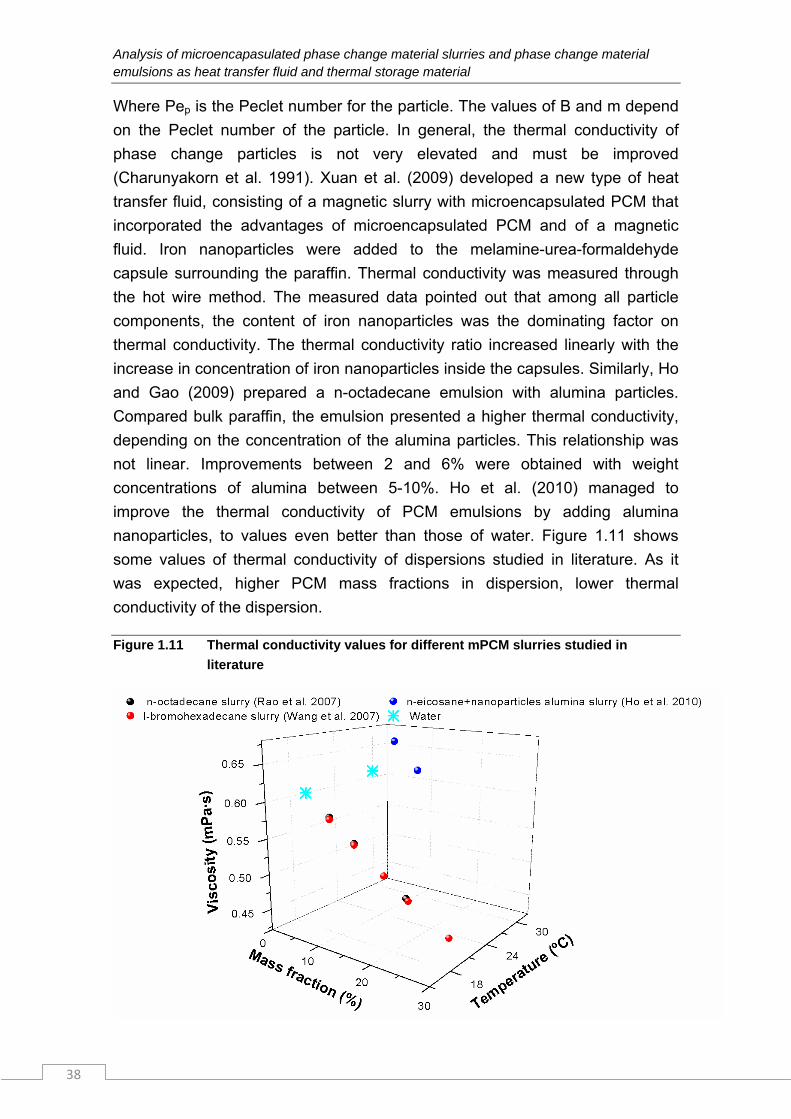
Analysis of microencapasulated phase change material slurries and phase change material emulsions as heat transfer fluid and thermal storage material
38
Where Pep is the Peclet number for the particle. The values of B and m depend
on the Peclet number of the particle. In general, the thermal conductivity of
phase change particles is not very elevated and must be improved
(Charunyakorn et al. 1991). Xuan et al. (2009) developed a new type of heat
transfer fluid, consisting of a magnetic slurry with microencapsulated PCM that
incorporated the advantages of microencapsulated PCM and of a magnetic
fluid. Iron nanoparticles were added to the melamine-urea-formaldehyde
capsule surrounding the paraffin. Thermal conductivity was measured through
the hot wire method. The measured data pointed out that among all particle
components, the content of iron nanoparticles was the dominating factor on
thermal conductivity. The thermal conductivity ratio increased linearly with the
increase in concentration of iron nanoparticles inside the capsules. Similarly, Ho
and Gao (2009) prepared a n-octadecane emulsion with alumina particles.
Compared bulk paraffin, the emulsion presented a higher thermal conductivity,
depending on the concentration of the alumina particles. This relationship was
not linear. Improvements between 2 and 6% were obtained with weight
concentrations of alumina between 5-10%. Ho et al. (2010) managed to
improve the thermal conductivity of PCM emulsions by adding alumina
nanoparticles, to values even better than those of water. Figure 1.11 shows
some values of thermal conductivity of dispersions studied in literature. As it
was expected, higher PCM mass fractions in dispersion, lower thermal
conductivity of the dispersion.
Figure 1.11 Thermal conductivity values for different mPCM slurries studied in
literature
CHAPTER 1. State of technology. Review on PCM emulsions and microencapsulated PCM slurries: Materials, heat transfer studies and applications.
39
1.5 Heat transfer
The main objective of the publication by Kasza and Chen (1985) was to point
out the benefits of the use of PCM slurries in water, such as the improvement in
heat transfer and increase in storage efficiency. Some of the specific benefits
mentioned were:
1) Reduction in the temperature difference between source-drain.
2) Increase of the heat capacity of the fluid, as a consequence of the PCM
dispersion, giving place to a lower mass flow and therefore a lower
pumping consumption.
3) Dynamic use of the PCM. In a conventional system, heat exchange
between PCM (static use) and a separated heat transfer fluid is needed
to transport heat or cooling. Nevertheless with PCM slurries, thermal
storage and the heat transfer fluid are integrated into the PCM slurry.
The energy losses of the heat exchange will be annulled, as the
necessity for a secondary heat transfer fluid is eliminated.
The possible improvement mechanisms for heat transfer are enumerated.
Improvement in heat transfer occurs in slurries, with or without phase change.
This improvement is substantially greater when considering PCM slurries.
Several mechanisms responsible for this improvement were examined,
including particle rotation and migration in the flow as well as the role of phase
change.
1.5.1 Heat transfer by internal forced convection
In the review article published by the author of the present thesis (Delgado et al.
2012), a review of the studies carried out up to the moment about the heat
transfer phenomenon is shown (mainly internal convective heat transfer in a
tube) and they have been classified according to the type of fluid (mPCM slurry
or PCM emulsion), according to the type of study, experimental or numerical,
and according to the flow pattern. Also the geometry and the boundary
conditions have been taken into account. This compilation presented in the
paper expects to complete the subsection of numerical modeling on the heat
transfer phenomenon in PCM slurries of the review of Dutil et al. (2011) about
PCMs and mathematical modeling.
In table I.4, a summary of the studies carried out about the heat transfer by
internal forced convection in PCM dispersions can be observed, according to
Analysis of microencapasulated phase change material slurries and phase change material emulsions as heat transfer fluid and thermal storage material
40
the flow pattern of the dispersion, the type of study, geometry (circular tube or
rectangular channels) and boundary conditions. In total, 7 experimental works
and 12 numerical works have been analyzed. From these 12 numerical works, 6
were validated with the same experimental work. According to the analysis
accomplished from the review of these papers, no clear conclusions about if
these new fluids improve the heat transfer phenomenon by internal forced
convection in comparison to water can be deduced.
Regarding to other type of geometries, different from the circular tube and from
the rectangular channel, Heinz and Streicher (2006) studied the heat transfer
water-mPCM slurry in a plate heat exchanger. It was observed that the
convective heat transfer coefficient decreased with the concentration of PCM,
due to a greater viscosity and lower thermal conductivity. With a 20%
concentration it decreased 30% in comparison to water, and with a 40%
concentration, a decrease of 40% was observed. In spite of the lower overall
heat transfer coefficient, the exchanged power of the plate heat exchanger is
approximately the same as that of water. This is due to the higher difference in
average temperatures, as result of the higher heat capacity of the slurry.
1.5.2 Heat transfer through natural convection in microencapsulated PCM slurries
Heinz and Streicher (2006), in addition to analyze the heat transfer in a heat
exchanger, they studied experimentally a 200-liter tank with a mPCM slurry
developed by BASF with a melting temperature of 60ºC, with a typical spiral
exchanger, inside which water circulated. As the limiting factor for heat transfer
is the natural convection of the surface of the exchanger to the storage fluid, it
resulted interesting to study the heat transfer coefficient by natural convection.
The heat transfer coefficients decreased as phase change process takes place,
due to the reduction in the difference of temperatures between the exchanger
and the storage fluid. Due to higher viscosities, the heat transfer coefficient
through natural convection decreased when the PCM concentration increased
in water. Even with the lowest PCM concentration, 20%, the values of the heat
transfer coefficients for natural convection were lower than for water.
A very similar study was carried out by Diaconu et al. (2010). An experimental
study was carried out on the heat transfer phenomenon of natural convection in
a tank filled with a microencapsulated RT6 slurry (organic PCM from the
manufacturer Rubitherm), where the heat exchanger through which water
circulated consisted of a helical copper tube, used as storage tank for solar air
conditioning applications. During phase change of PCM, it was observed that
CHAPTER 1. State of technology. Review on PCM emulsions and microencapsulated PCM slurries: Materials, heat transfer studies and applications.
41
the natural convective coefficient could be up to five times that of water,
depending on the temperature conditions. The reason for this improvement
could not be justified, as the phase change temperature range overlapped the
temperature range in which water presented a drop in the natural convection
coefficient.
Huang et al. (2011) also studied a heat storage system with a helical coil heat
exchanger using a mPCM slurry with a phase change temperature 65ºC
(produced by BASF) with a 25, 35 and 50% of volumetric concentration of PCM.
The mPCM slurry was used as thermal energy storage material and water as
secondary heat transfer fluid. The results showed that the mPCM slurry with a
volumetric concentration of 50% was not suitable, since the low thermal
conductivity and high viscosity reduced the heat transfer from the heat
exchanger to the storage media.
Inaba et al. (2007) developed a numerical two-dimensional model to study
natural convection in a rectangular building with a non-Newtonian slurry of
mPCM. The heat transfer coefficients were higher when compared to slurries
without phase change. When the PCM concentration increased within the range
20-40%, the convection coefficient decreased, while for the range 10-20%, the
convective coefficient improved.
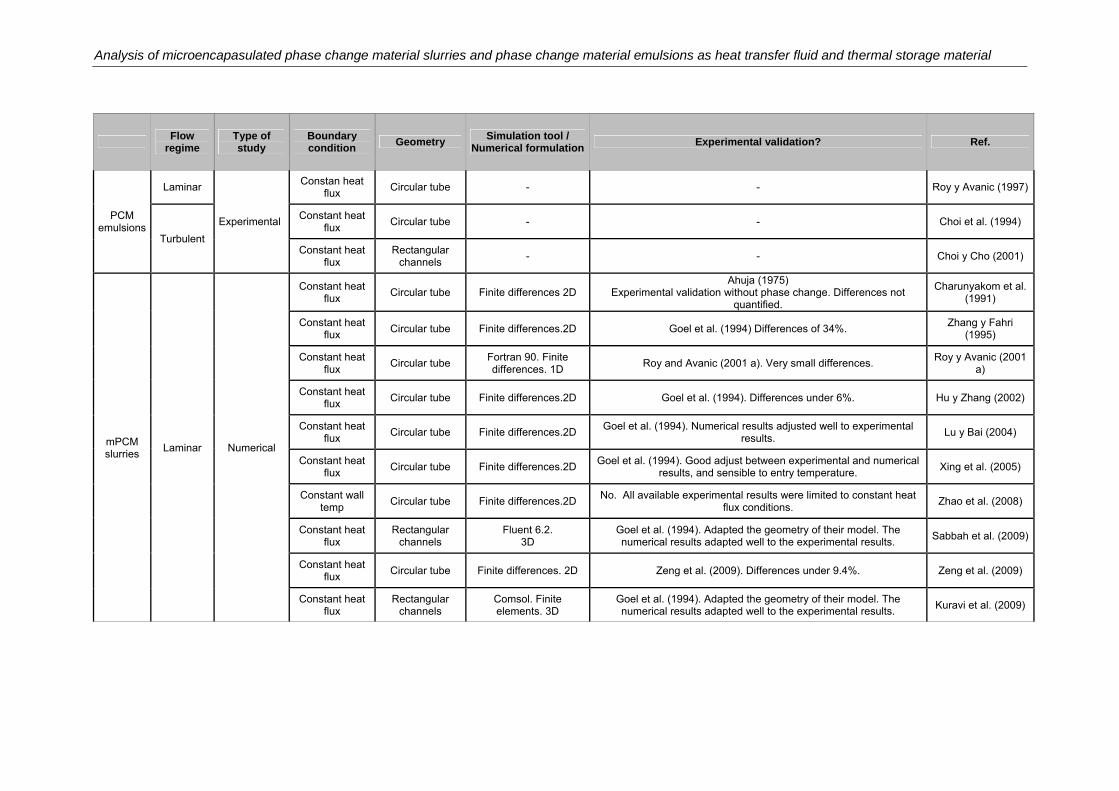
Analysis of microencapasulated phase change material slurries and phase change material emulsions as heat transfer fluid and thermal storage material
Flow
regime Type of study
Boundary condition
Geometry Simulation tool /
Numerical formulationExperimental validation? Ref.
PCM emulsions
Laminar
Experimental
Constan heat flux
Circular tube - - Roy y Avanic (1997)
Turbulent
Constant heat flux
Circular tube - - Choi et al. (1994)
Constant heat flux
Rectangular channels
- - Choi y Cho (2001)
mPCM slurries
Laminar Numerical
Constant heat flux
Circular tube Finite differences 2D Ahuja (1975)
Experimental validation without phase change. Differences not quantified.
Charunyakom et al. (1991)
Constant heat flux
Circular tube Finite differences.2D Goel et al. (1994) Differences of 34%. Zhang y Fahri
(1995)
Constant heat flux
Circular tube Fortran 90. Finite differences. 1D
Roy and Avanic (2001 a). Very small differences. Roy y Avanic (2001
a)
Constant heat flux
Circular tube Finite differences.2D Goel et al. (1994). Differences under 6%. Hu y Zhang (2002)
Constant heat flux
Circular tube Finite differences.2D Goel et al. (1994). Numerical results adjusted well to experimental
results. Lu y Bai (2004)
Constant heat flux
Circular tube Finite differences.2D Goel et al. (1994). Good adjust between experimental and numerical
results, and sensible to entry temperature. Xing et al. (2005)
Constant wall temp
Circular tube Finite differences.2D No. All available experimental results were limited to constant heat
flux conditions. Zhao et al. (2008)
Constant heat flux
Rectangular channels
Fluent 6.2. 3D
Goel et al. (1994). Adapted the geometry of their model. The numerical results adapted well to the experimental results.
Sabbah et al. (2009)
Constant heat flux
Circular tube Finite differences. 2D Zeng et al. (2009). Differences under 9.4%. Zeng et al. (2009)
Constant heat flux
Rectangular channels
Comsol. Finite elements. 3D
Goel et al. (1994). Adapted the geometry of their model. The numerical results adapted well to the experimental results.
Kuravi et al. (2009)
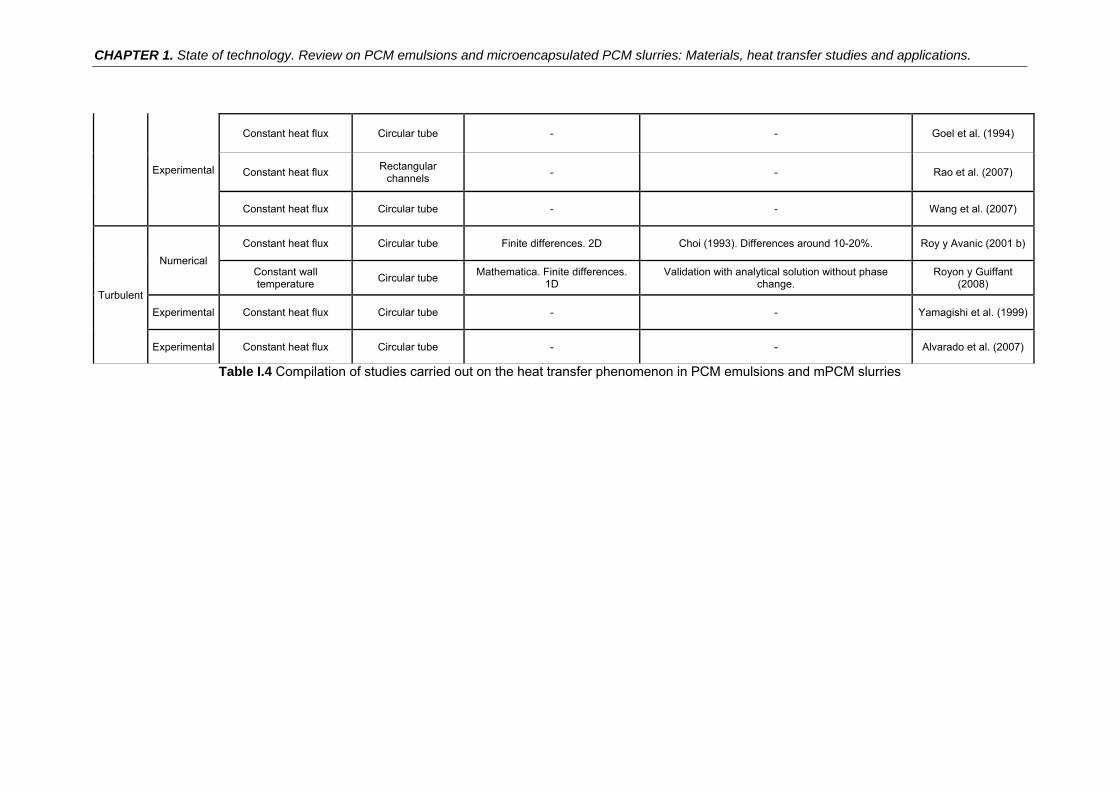
CHAPTER 1. State of technology. Review on PCM emulsions and microencapsulated PCM slurries: Materials, heat transfer studies and applications.
Experimental
Constant heat flux Circular tube - - Goel et al. (1994)
Constant heat flux Rectangular
channels - - Rao et al. (2007)
Constant heat flux Circular tube - - Wang et al. (2007)
Turbulent
Numerical
Constant heat flux Circular tube Finite differences. 2D Choi (1993). Differences around 10-20%. Roy y Avanic (2001 b)
Constant wall temperature
Circular tube Mathematica. Finite differences.
1D Validation with analytical solution without phase
change. Royon y Guiffant
(2008)
Experimental Constant heat flux Circular tube - - Yamagishi et al. (1999)
Experimental Constant heat flux Circular tube - - Alvarado et al. (2007)
Table I.4 Compilation of studies carried out on the heat transfer phenomenon in PCM emulsions and mPCM slurries
Analysis of microencapasulated phase change material slurries and phase change material emulsions as heat transfer fluid and thermal storage material
44
1.5.3 Other studies
The majority of the works, both experimental and numerical, have assumed that
the dispersed PCM and water are in thermal equilibrium. Nevertheless, Diaconu
(2009) analyzed through simulation the heat transfer phenomenon between the
PCM microcapsules and water. The results considered a convective coefficient
between microcapsules and water, and it was observed that the temperatures
of water and PCM microcapsules were very close, which was attributed to the
great exchange area between the PCM microcapsules and water. The greater
differences between the temperatures of water and PCM microcapsules
occurred during melting/solidification.
1.6 Applications
For the moment, the main application present in literature is the utilization of
these PCM emulsions and mPCM slurries as thermal storage materials and
heat transfer fluids in chilled ceilings. Wang and Niu (2009) presented the
results of a mathematical simulation of a combined system of chilled ceiling and
storage tank with a mPCM slurry, in addition to an air treatment unit for the
ventilation necessities, in a room with the climatology of Hong Kong. The slurry
was cooled and stored in the tank during the night, which resulted in electricity
peak shaving, taking advantage of the nocturnal tariff and of a higher COP of
the machine due to operation during lower environmental temperatures. During
working hours, the mPCM slurry flowed from the tank to the chilled ceiling,
melting the PCM and releasing the latent heat. The combination of the chilled
ceiling plus storage tank against a conventional water system achieved peak
shaving, and therefore a smaller cooling unit/chiller could be sufficient. Three
systems were compared regarding energy consumption: 1) Conventional
system without storage, 2) Nocturnal storage with mPCM slurry, 3) Storage with
ice, where the loads of the air treatment unit and chilled ceiling were supplied by
the tank. The consumptions were practically the same for the mPCM slurry and
the conventional system. Nevertheless, it must be taken into account that
calculations were carried out using the same COP for the case of the tank with
water and mPCM slurry, when in reality the COP for the case of the tank with
mPCM slurry is higher due to operation at lower environment temperatures
(charging during the night). The electrical power will be lower. For ratios up to
2.4 (diurnal tariff/nocturnal tariff), the tank with mPCM slurrry presents higher
economic benefits.
CHAPTER 1. State of technology. Review on PCM emulsions and microencapsulated PCM slurries: Materials, heat transfer studies and applications.
45
Griffiths and Eames (2007) studied experimentally the pumping of a mPCM
slurry from BASF manufacturer through a chilled ceiling in a room. The room
was tested during four months with a 40% PCM concentration. When water was
pumped through the chilled ceiling, a mass flow of 0.7 l/s was required for an
inlet temperature of 16ºC and outlet temperature of 18ºC, maintaining the room
at 19ºC. When water was substituted by the mPCM slurry, the slurry was
capable of maintaining a temperature of 20-21ºC with a mass flow of 0.25 l/s.
This means that the ceiling required a lower mass flow (pumping savings were
not quantified), could absorb energy at a constant temperature, avoiding
increments in the panel surface temperature when internal gains increased.
Another well-known application, similar to the previously described, was carried
out at the Narita Airport in Tokio by Shibutani (2002). The issue in the
installation of the Narita Airport in Tokio was the change of refrigerants due to
environmental reasons. When R11 and R22 were substituted by R134a and
R123 without changing the chiller unit, this resulted in lower cooling power and
the chiller was non-capable to absorb the demand peaks at specific times of the
day. This problem was solved through the installation of a tank filled with a
mPCM slurry custom-developed by Mitsubishi Heavy Industries. The
characteristic temperatures on the demand side were a supply temperature of
5ºC and a return flow temperature of 12ºC. A mPCM slurry was selected with a
phase change temperature range between 5 and 8ºC. The demand peaks
occurred between 8:00 and 22:00, and therefore the cooling produced during
the night by the chiller unit could be stored and reduce the demand peaks
during the day. The slurry presented a storage density of 67 MJ/m3, lower in
comparison to an ice tank, 167 MJ/m3, but higher in comparison to water with a
temperatures gradient of 5ºC, 21 MJ/m3. Both the COP of the system and the
operational costs for water and mPCM slurry were similar and lower than the ice
tank, due to the higher temperature of the evaporator.
Pollerberg and Dötsch (2006) proposed an emulsion with a 20% weight
concentration of tetradecane (melting temperature=5ºC) for cooling supply
networks. In this way, the required volumetric flow was low, allowing for the
reduction of the pumping power and pipe dimensions, with lower operation and
investment costs. The results compared three scenarios for a fictitious cooling
supply network: tetradecane emulsion, ice slurry and water. The calculations
considered the generation and distribution costs of cooling. A power of 500 kW
was assumed, with a distribution length of 600 m and 1000 operation hours
throughout the year.
Analysis of microencapasulated phase change material slurries and phase change material emulsions as heat transfer fluid and thermal storage material
46
As a consequence of the higher heat capacity of the ice slurry, these presented
lower distribution costs. The distributions costs for the emulsion were lower than
those of water. The calculation of distribution costs takes into account the
rheological behavior at the time of calculating the pressure drop. Due to the fact
that the temperature of the evaporator must be lower in order to produce ice
slurries or solidify the tetradecane, the COP of the chiller was worse and
therefore the generation of cooling was more expensive. The tetradecane
emulsion balanced out the additional generation costs with the reduction in
distribution costs, resulting in the lowest specific cost for the three studied
cases.
1.7 Conclusions
From this review it cannot be concluded whether PCM emulsions and mPCM
slurries improved the heat transfer phenomenon in comparison to water as a
heat transfer fluid, as it depends on the combination of influential factors. The
influence direction of these factors is known, but the degree of influence is still
unknown. There is a lack of an enough number of experimental studies, which
are required to deepen the analysis carried out herein as well as to validate the
results of different numerical studies, as a great part of the studies has been
verified through the same reference or with results that did not consider phase
change.
After analysis of the works compiled herein, the main conclusions are presented
in table I.5. It summarizes the objective magnitudes at the time of selecting a
PCM emulsion or a mPCM slurry as heat transfer fluid or thermal storage
material. The table includes the factors that influence the objective magnitudes
and how this influence occurs.
This review has focused, on one hand, on the elaboration and fabrication of
these new liquids, and on the compilation of the PCM slurries elaborated and
utilized up to date in literature. On the other hand, this review focused on the
analysis of properties, which is a key factor in the optimal development of
storage fluids. The main problems in thermal storage material applications are
subcooling and instability issues. In heat transfer fluid applications, it is
interesting to achieve a higher heat transfer in comparison to a typical heat
transfer fluid, such as water. Nevertheless, after systematic reviews, a clear
conclusion still cannot be drawn, as several factors play a role.

CHAPTER 1. State of technology. Review on PCM emulsions and microencapsulated PCM slurries: Materials, heat transfer studies and applications.
47
For the moment there are very few installation examples that make use of PCM
emulsions and mPCM slurries. The main application seems to be oriented
towards storage tanks combined with chilled ceilings, shifting the cooling
production to the night in order to shave the demand peaks, improve COP, and
make better use of nocturnal tariffs. Some authors also suggest the use of
these new fluids in supply networks.
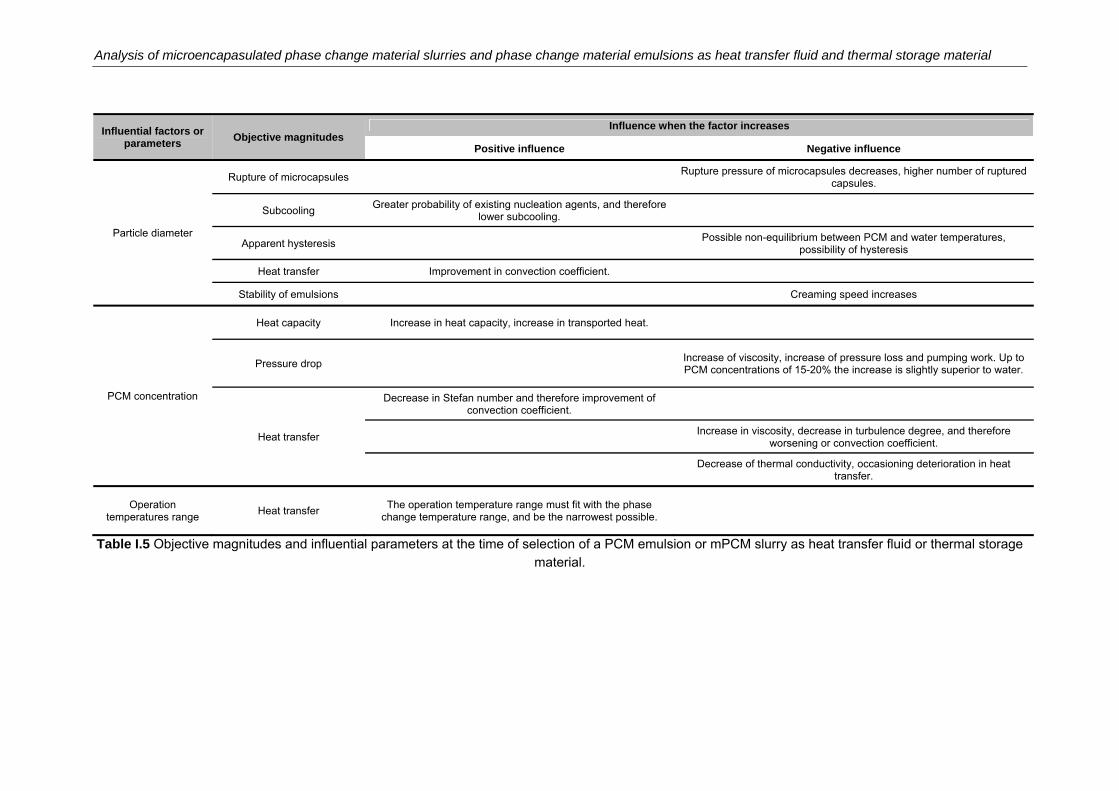
Analysis of microencapasulated phase change material slurries and phase change material emulsions as heat transfer fluid and thermal storage material
Influential factors or parameters
Objective magnitudes Influence when the factor increases
Positive influence Negative influence
Particle diameter
Rupture of microcapsules Rupture pressure of microcapsules decreases, higher number of ruptured
capsules.
Subcooling Greater probability of existing nucleation agents, and therefore
lower subcooling.
Apparent hysteresis Possible non-equilibrium between PCM and water temperatures,
possibility of hysteresis
Heat transfer Improvement in convection coefficient.
Stability of emulsions Creaming speed increases
PCM concentration
Heat capacity Increase in heat capacity, increase in transported heat.
Pressure drop Increase of viscosity, increase of pressure loss and pumping work. Up to PCM concentrations of 15-20% the increase is slightly superior to water.
Heat transfer
Decrease in Stefan number and therefore improvement of convection coefficient.
Increase in viscosity, decrease in turbulence degree, and therefore
worsening or convection coefficient.
Decrease of thermal conductivity, occasioning deterioration in heat
transfer.
Operation temperatures range
Heat transfer The operation temperature range must fit with the phase
change temperature range, and be the narrowest possible.
Table I.5 Objective magnitudes and influential parameters at the time of selection of a PCM emulsion or mPCM slurry as heat transfer fluid or thermal storage material.
CHAPTER 2. Determination of the thermophysical properties of microencapsulated PCM slurries and PCM emulsions.
49
This chapter describes the search for mPCM slurries and
PCM emulsions in the commercial market, universities
and research institutes. In addition, the thermophysical
properties are determined, specifically the Enthalpy-
Temperature curves and the Thermal Conductivity-
Temperature curves. In the latter case, it is suggested
how to measure the thermal diffusivity in liquids with
Laser Flash equipment.
2 Determination of the thermophysical properties
of microencapsulated PCM slurries and PCM
emulsions
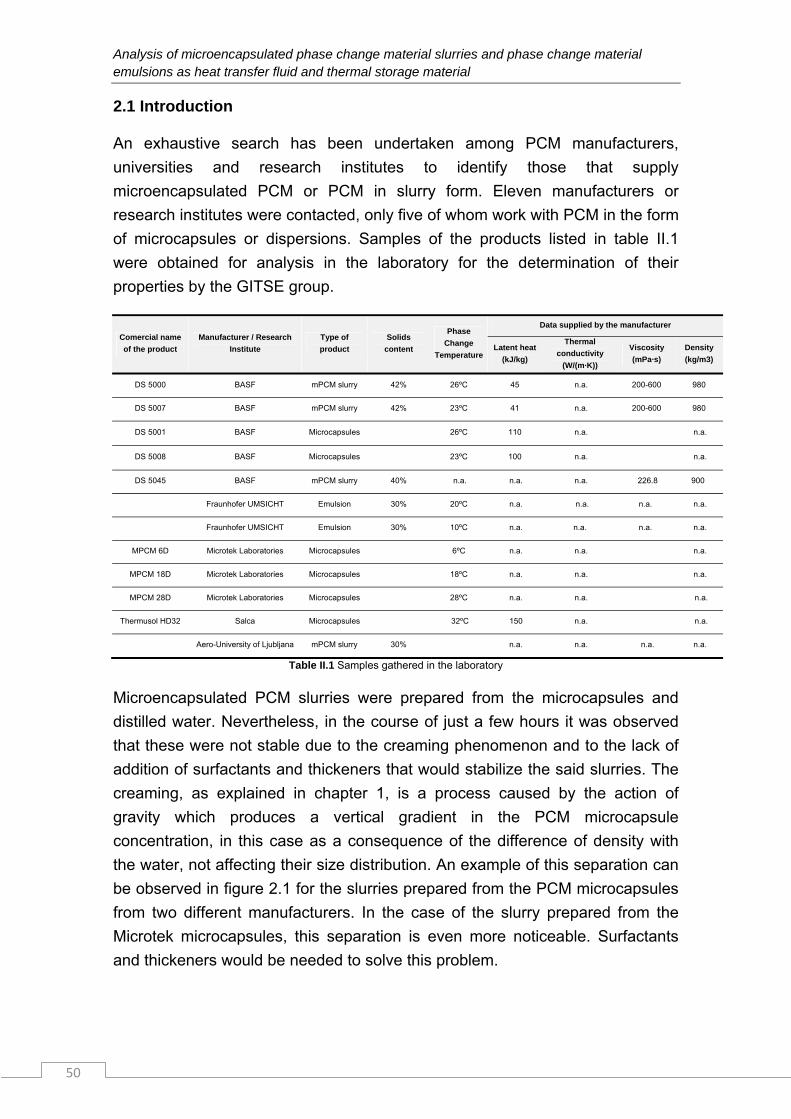
Analysis of microencapsulated phase change material slurries and phase change material emulsions as heat transfer fluid and thermal storage material
50
2.1 Introduction
An exhaustive search has been undertaken among PCM manufacturers,
universities and research institutes to identify those that supply
microencapsulated PCM or PCM in slurry form. Eleven manufacturers or
research institutes were contacted, only five of whom work with PCM in the form
of microcapsules or dispersions. Samples of the products listed in table II.1
were obtained for analysis in the laboratory for the determination of their
properties by the GITSE group.
Comercial name
of the product
Manufacturer / Research
Institute
Type of
product
Solids
content
Phase
Change
Temperature
Data supplied by the manufacturer
Latent heat
(kJ/kg)
Thermal
conductivity
(W/(m·K))
Viscosity
(mPa·s)
Density
(kg/m3)
DS 5000 BASF mPCM slurry 42% 26ºC 45 n.a. 200-600 980
DS 5007 BASF mPCM slurry 42% 23ºC 41 n.a. 200-600 980
DS 5001 BASF Microcapsules
26ºC 110 n.a. n.a.
DS 5008 BASF Microcapsules
23ºC 100 n.a. n.a.
DS 5045 BASF mPCM slurry 40% n.a. n.a. n.a. 226.8 900
Fraunhofer UMSICHT Emulsion 30% 20ºC n.a. n.a. n.a. n.a.
Fraunhofer UMSICHT Emulsion 30% 10ºC n.a. n.a. n.a. n.a.
MPCM 6D Microtek Laboratories Microcapsules 6ºC n.a. n.a. n.a.
MPCM 18D Microtek Laboratories Microcapsules 18ºC n.a. n.a. n.a.
MPCM 28D Microtek Laboratories Microcapsules 28ºC n.a. n.a. n.a.
Thermusol HD32 Salca Microcapsules 32ºC 150 n.a. n.a.
Aero-University of Ljubljana mPCM slurry 30% n.a. n.a. n.a. n.a.
Table II.1 Samples gathered in the laboratory
Microencapsulated PCM slurries were prepared from the microcapsules and
distilled water. Nevertheless, in the course of just a few hours it was observed
that these were not stable due to the creaming phenomenon and to the lack of
addition of surfactants and thickeners that would stabilize the said slurries. The
creaming, as explained in chapter 1, is a process caused by the action of
gravity which produces a vertical gradient in the PCM microcapsule
concentration, in this case as a consequence of the difference of density with
the water, not affecting their size distribution. An example of this separation can
be observed in figure 2.1 for the slurries prepared from the PCM microcapsules
from two different manufacturers. In the case of the slurry prepared from the
Microtek microcapsules, this separation is even more noticeable. Surfactants
and thickeners would be needed to solve this problem.
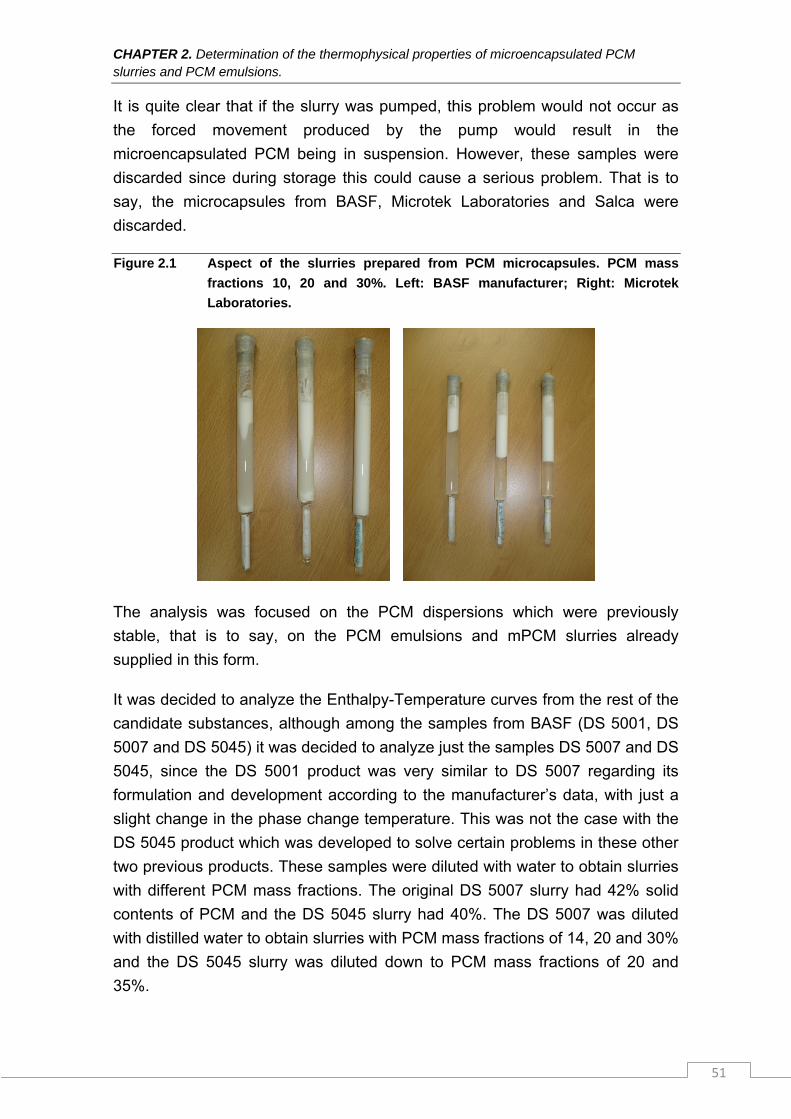
CHAPTER 2. Determination of the thermophysical properties of microencapsulated PCM slurries and PCM emulsions.
51
It is quite clear that if the slurry was pumped, this problem would not occur as
the forced movement produced by the pump would result in the
microencapsulated PCM being in suspension. However, these samples were
discarded since during storage this could cause a serious problem. That is to
say, the microcapsules from BASF, Microtek Laboratories and Salca were
discarded.
Figure 2.1 Aspect of the slurries prepared from PCM microcapsules. PCM mass
fractions 10, 20 and 30%. Left: BASF manufacturer; Right: Microtek
Laboratories.
The analysis was focused on the PCM dispersions which were previously
stable, that is to say, on the PCM emulsions and mPCM slurries already
supplied in this form.
It was decided to analyze the Enthalpy-Temperature curves from the rest of the
candidate substances, although among the samples from BASF (DS 5001, DS
5007 and DS 5045) it was decided to analyze just the samples DS 5007 and DS
5045, since the DS 5001 product was very similar to DS 5007 regarding its
formulation and development according to the manufacturer’s data, with just a
slight change in the phase change temperature. This was not the case with the
DS 5045 product which was developed to solve certain problems in these other
two previous products. These samples were diluted with water to obtain slurries
with different PCM mass fractions. The original DS 5007 slurry had 42% solid
contents of PCM and the DS 5045 slurry had 40%. The DS 5007 was diluted
with distilled water to obtain slurries with PCM mass fractions of 14, 20 and 30%
and the DS 5045 slurry was diluted down to PCM mass fractions of 20 and
35%.
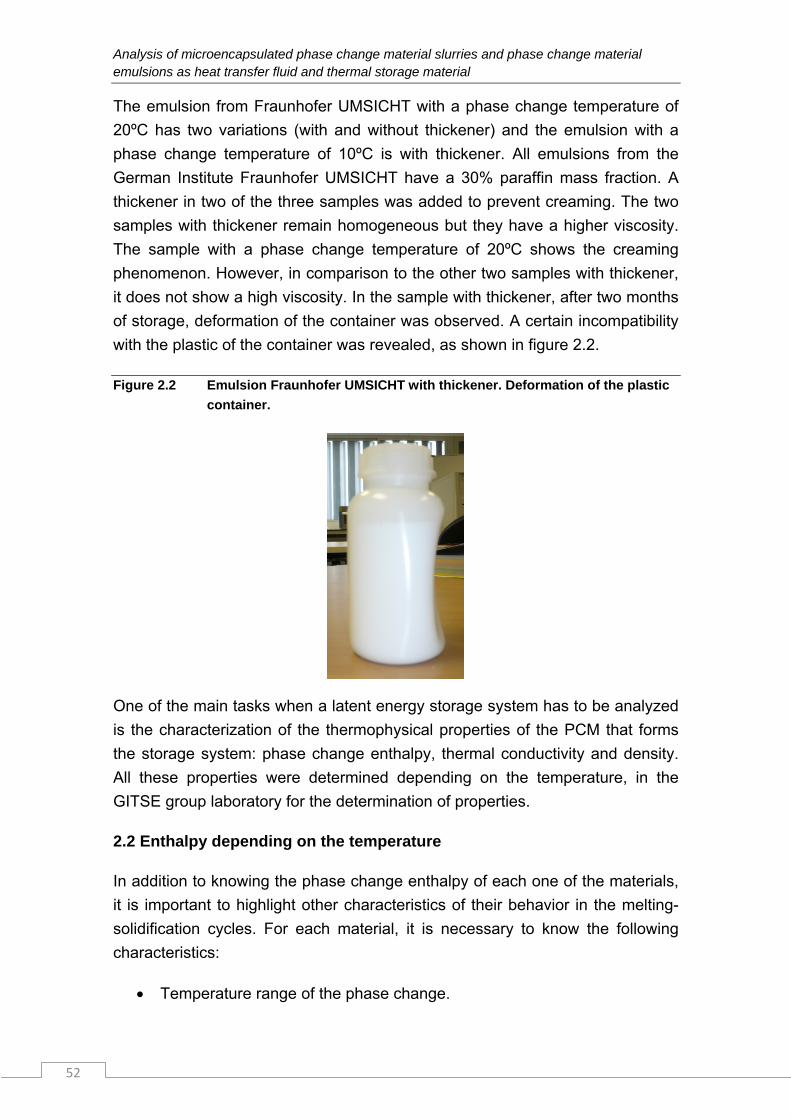
Analysis of microencapsulated phase change material slurries and phase change material emulsions as heat transfer fluid and thermal storage material
52
The emulsion from Fraunhofer UMSICHT with a phase change temperature of
20ºC has two variations (with and without thickener) and the emulsion with a
phase change temperature of 10ºC is with thickener. All emulsions from the
German Institute Fraunhofer UMSICHT have a 30% paraffin mass fraction. A
thickener in two of the three samples was added to prevent creaming. The two
samples with thickener remain homogeneous but they have a higher viscosity.
The sample with a phase change temperature of 20ºC shows the creaming
phenomenon. However, in comparison to the other two samples with thickener,
it does not show a high viscosity. In the sample with thickener, after two months
of storage, deformation of the container was observed. A certain incompatibility
with the plastic of the container was revealed, as shown in figure 2.2.
Figure 2.2 Emulsion Fraunhofer UMSICHT with thickener. Deformation of the plastic
container.
One of the main tasks when a latent energy storage system has to be analyzed
is the characterization of the thermophysical properties of the PCM that forms
the storage system: phase change enthalpy, thermal conductivity and density.
All these properties were determined depending on the temperature, in the
GITSE group laboratory for the determination of properties.
2.2 Enthalpy depending on the temperature
In addition to knowing the phase change enthalpy of each one of the materials,
it is important to highlight other characteristics of their behavior in the melting-
solidification cycles. For each material, it is necessary to know the following
characteristics:
Temperature range of the phase change.
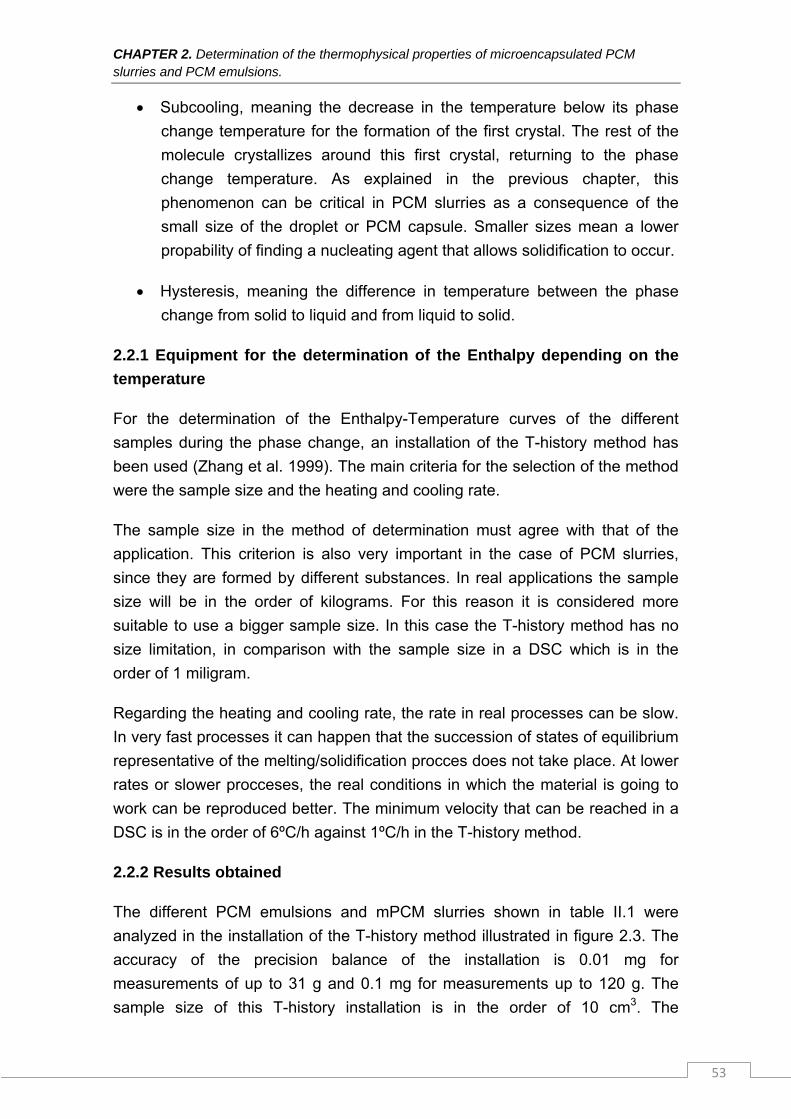
CHAPTER 2. Determination of the thermophysical properties of microencapsulated PCM slurries and PCM emulsions.
53
Subcooling, meaning the decrease in the temperature below its phase
change temperature for the formation of the first crystal. The rest of the
molecule crystallizes around this first crystal, returning to the phase
change temperature. As explained in the previous chapter, this
phenomenon can be critical in PCM slurries as a consequence of the
small size of the droplet or PCM capsule. Smaller sizes mean a lower
propability of finding a nucleating agent that allows solidification to occur.
Hysteresis, meaning the difference in temperature between the phase
change from solid to liquid and from liquid to solid.
2.2.1 Equipment for the determination of the Enthalpy depending on the
temperature
For the determination of the Enthalpy-Temperature curves of the different
samples during the phase change, an installation of the T-history method has
been used (Zhang et al. 1999). The main criteria for the selection of the method
were the sample size and the heating and cooling rate.
The sample size in the method of determination must agree with that of the
application. This criterion is also very important in the case of PCM slurries,
since they are formed by different substances. In real applications the sample
size will be in the order of kilograms. For this reason it is considered more
suitable to use a bigger sample size. In this case the T-history method has no
size limitation, in comparison with the sample size in a DSC which is in the
order of 1 miligram.
Regarding the heating and cooling rate, the rate in real processes can be slow.
In very fast processes it can happen that the succession of states of equilibrium
representative of the melting/solidification procces does not take place. At lower
rates or slower procceses, the real conditions in which the material is going to
work can be reproduced better. The minimum velocity that can be reached in a
DSC is in the order of 6ºC/h against 1ºC/h in the T-history method.
2.2.2 Results obtained
The different PCM emulsions and mPCM slurries shown in table II.1 were
analyzed in the installation of the T-history method illustrated in figure 2.3. The
accuracy of the precision balance of the installation is 0.01 mg for
measurements of up to 31 g and 0.1 mg for measurements up to 120 g. The
sample size of this T-history installation is in the order of 10 cm3. The
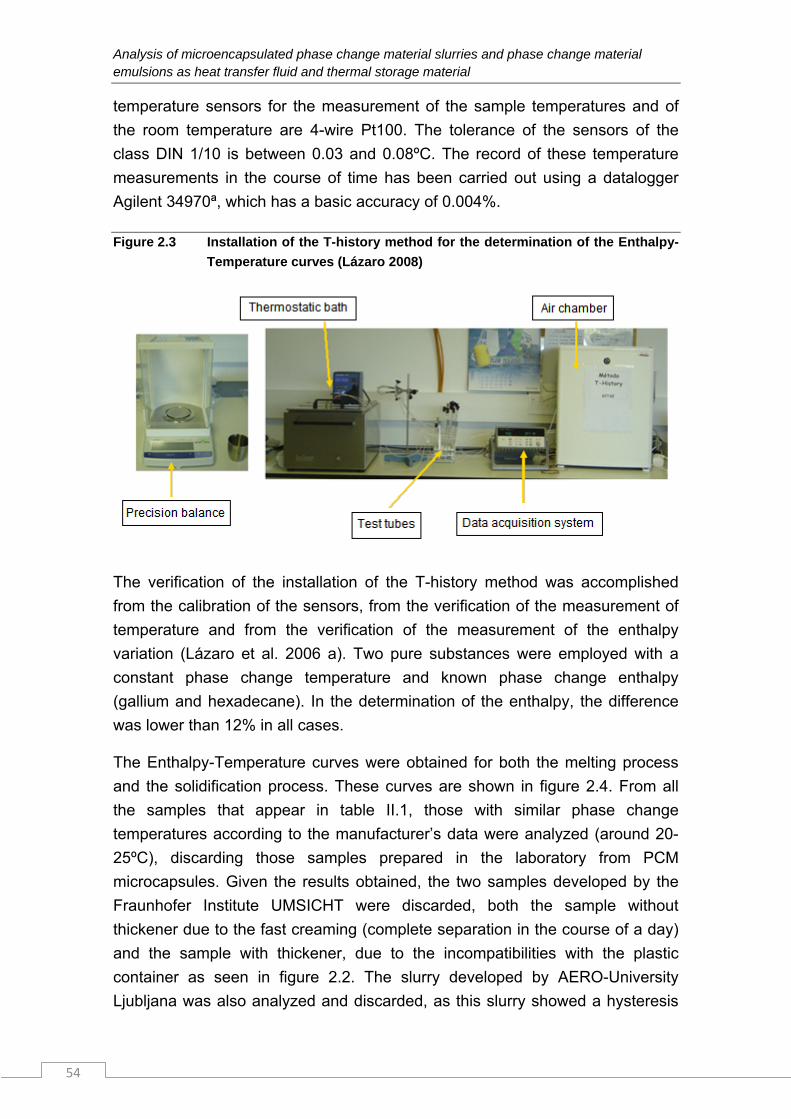
Analysis of microencapsulated phase change material slurries and phase change material emulsions as heat transfer fluid and thermal storage material
54
temperature sensors for the measurement of the sample temperatures and of
the room temperature are 4-wire Pt100. The tolerance of the sensors of the
class DIN 1/10 is between 0.03 and 0.08ºC. The record of these temperature
measurements in the course of time has been carried out using a datalogger
Agilent 34970ª, which has a basic accuracy of 0.004%.
Figure 2.3 Installation of the T-history method for the determination of the Enthalpy-
Temperature curves (Lázaro 2008)
The verification of the installation of the T-history method was accomplished
from the calibration of the sensors, from the verification of the measurement of
temperature and from the verification of the measurement of the enthalpy
variation (Lázaro et al. 2006 a). Two pure substances were employed with a
constant phase change temperature and known phase change enthalpy
(gallium and hexadecane). In the determination of the enthalpy, the difference
was lower than 12% in all cases.
The Enthalpy-Temperature curves were obtained for both the melting process
and the solidification process. These curves are shown in figure 2.4. From all
the samples that appear in table II.1, those with similar phase change
temperatures according to the manufacturer’s data were analyzed (around 20-
25ºC), discarding those samples prepared in the laboratory from PCM
microcapsules. Given the results obtained, the two samples developed by the
Fraunhofer Institute UMSICHT were discarded, both the sample without
thickener due to the fast creaming (complete separation in the course of a day)
and the sample with thickener, due to the incompatibilities with the plastic
container as seen in figure 2.2. The slurry developed by AERO-University
Ljubljana was also analyzed and discarded, as this slurry showed a hysteresis
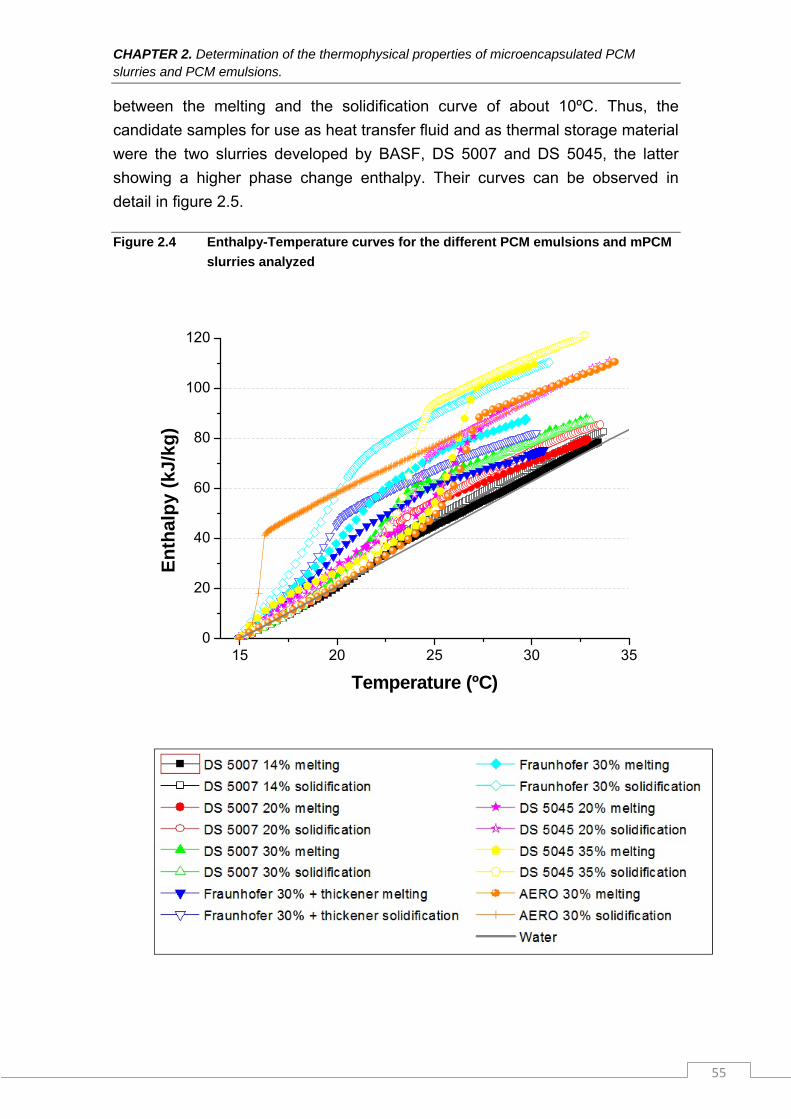
CHAPTER 2. Determination of the thermophysical properties of microencapsulated PCM slurries and PCM emulsions.
55
between the melting and the solidification curve of about 10ºC. Thus, the
candidate samples for use as heat transfer fluid and as thermal storage material
were the two slurries developed by BASF, DS 5007 and DS 5045, the latter
showing a higher phase change enthalpy. Their curves can be observed in
detail in figure 2.5.
Figure 2.4 Enthalpy-Temperature curves for the different PCM emulsions and mPCM
slurries analyzed
15 20 25 30 350
20
40
60
80
100
120
En
thal
py
(kJ/
kg)
Temperature (ºC)
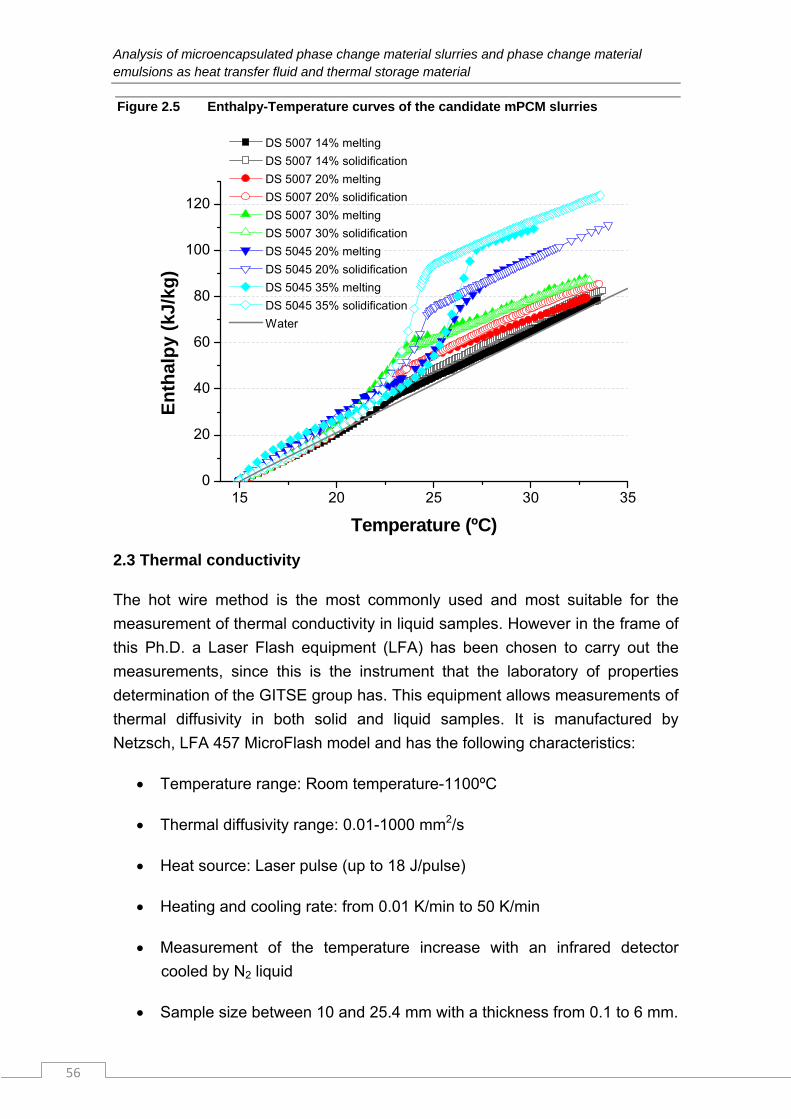
Analysis of microencapsulated phase change material slurries and phase change material emulsions as heat transfer fluid and thermal storage material
56
Figure 2.5 Enthalpy-Temperature curves of the candidate mPCM slurries
15 20 25 30 350
20
40
60
80
100
120
En
thal
py
(kJ/
kg)
Temperature (ºC)
DS 5007 14% melting
DS 5007 14% solidification
DS 5007 20% melting
DS 5007 20% solidification
DS 5007 30% melting
DS 5007 30% solidification
DS 5045 20% melting
DS 5045 20% solidification
DS 5045 35% melting
DS 5045 35% solidification
Water
2.3 Thermal conductivity
The hot wire method is the most commonly used and most suitable for the
measurement of thermal conductivity in liquid samples. However in the frame of
this Ph.D. a Laser Flash equipment (LFA) has been chosen to carry out the
measurements, since this is the instrument that the laboratory of properties
determination of the GITSE group has. This equipment allows measurements of
thermal diffusivity in both solid and liquid samples. It is manufactured by
Netzsch, LFA 457 MicroFlash model and has the following characteristics:
Temperature range: Room temperature-1100ºC
Thermal diffusivity range: 0.01-1000 mm2/s
Heat source: Laser pulse (up to 18 J/pulse)
Heating and cooling rate: from 0.01 K/min to 50 K/min
Measurement of the temperature increase with an infrared detector
cooled by N2 liquid
Sample size between 10 and 25.4 mm with a thickness from 0.1 to 6 mm.
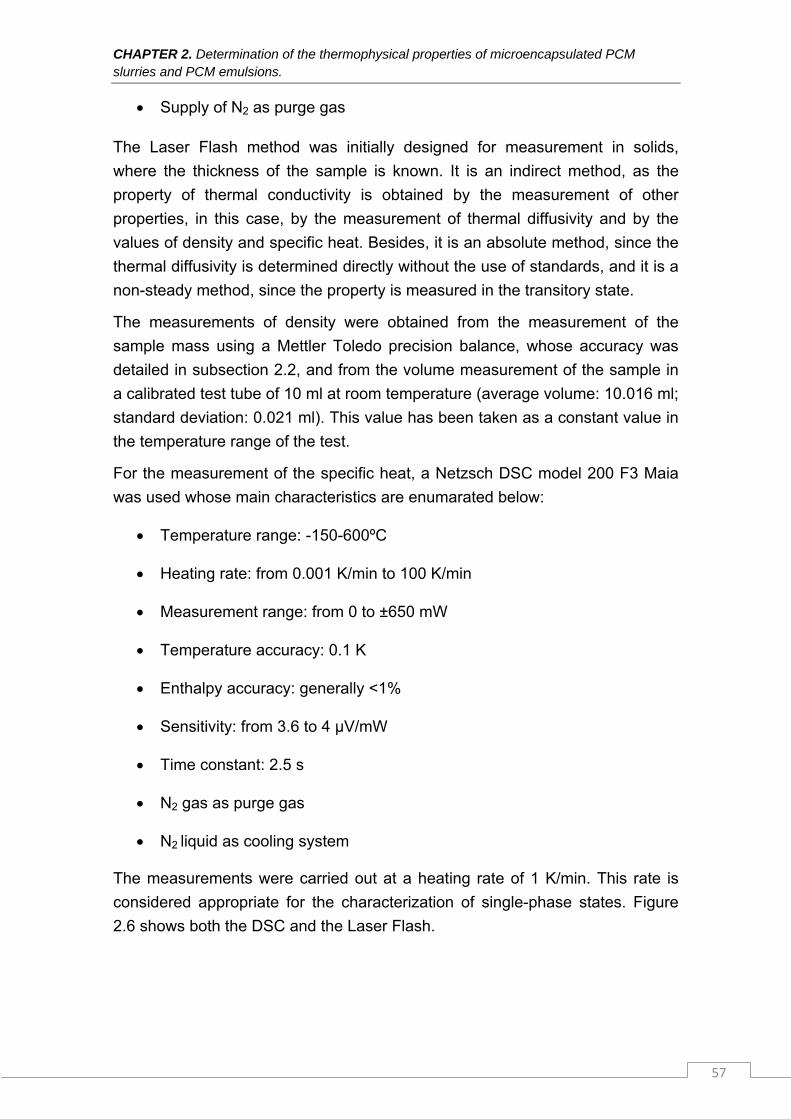
CHAPTER 2. Determination of the thermophysical properties of microencapsulated PCM slurries and PCM emulsions.
57
Supply of N2 as purge gas
The Laser Flash method was initially designed for measurement in solids,
where the thickness of the sample is known. It is an indirect method, as the
property of thermal conductivity is obtained by the measurement of other
properties, in this case, by the measurement of thermal diffusivity and by the
values of density and specific heat. Besides, it is an absolute method, since the
thermal diffusivity is determined directly without the use of standards, and it is a
non-steady method, since the property is measured in the transitory state.
The measurements of density were obtained from the measurement of the
sample mass using a Mettler Toledo precision balance, whose accuracy was
detailed in subsection 2.2, and from the volume measurement of the sample in
a calibrated test tube of 10 ml at room temperature (average volume: 10.016 ml;
standard deviation: 0.021 ml). This value has been taken as a constant value in
the temperature range of the test.
For the measurement of the specific heat, a Netzsch DSC model 200 F3 Maia
was used whose main characteristics are enumarated below:
Temperature range: -150-600ºC
Heating rate: from 0.001 K/min to 100 K/min
Measurement range: from 0 to ±650 mW
Temperature accuracy: 0.1 K
Enthalpy accuracy: generally <1%
Sensitivity: from 3.6 to 4 μV/mW
Time constant: 2.5 s
N2 gas as purge gas
N2 liquid as cooling system
The measurements were carried out at a heating rate of 1 K/min. This rate is
considered appropriate for the characterization of single-phase states. Figure
2.6 shows both the DSC and the Laser Flash.
Analysis of microencapsulated phase change material slurries and phase change material emulsions as heat transfer fluid and thermal storage material
58
Figure 2.6 Installation of the test bench for the determination of the thermal
conductivity of materials in the laboratory for determination of
thermophysical properties. Left: DSC; Right: Laser Flash equipment
2.3.1 Theoretical basis for the measurement of thermal diffusivity with
Laser Flash equipment
In order to obtain the thermal diffusivity, one of the sample surfaces is heated in
a homogeneous manner using a laser pulse, where the voltage and
transmission filter are controlled. Using this method, the heat absorbed in the
surface is transferred through the sample and a rise in temperature is produced
in the rear surface. This increase is measured over time with a liquid nitrogen-
cooled InSb photocell. The temperature signal recorded is processed using
different mathematical models that solve the differential equation for the heat
conduction in transitory regime.
Carslaw and Jaeger (1986) solved this equation for the particular case of a
thermally isolated solid of thickness L subjected to an initial temperature
distribution T(x,0). The temperature distribution of the solid in any point could be
determined by equation 2.1:
L L
n
L
t·α·π·n
dxL
x·π·ncos),x(T
L
x·π·n·cose
Ldx),x(T
L)t,x(T
0 01
02
01 2
22
(eq. 2.1)
If an energy pulse Q is instantaneous and uniformly absorbed in a small
superficial layer of thickness g, (assuming that this thickness is very small), the
temperature distribution in the initial instant t=0 will be determined by equations
2.2 and 2.3:
g·c·ρ
Q),x(T
p0 0<x<g (eq. 2.2)
CHAPTER 2. Determination of the thermophysical properties of microencapsulated PCM slurries and PCM emulsions.
59
00 ),x(T g<x<L (eq. 2.3)
Assuming that g is very small, the temperature distribution in the rear face for
any time t will be:
∑∞
--1
2
121
n
F·nn
maxe·)(
T
)t,L(T)t,L(V (eq. 2.4)
where Tmax=Q/(ρ·cp·L), V(L,t) is a dimensionless parameter of temperature and
F is defined according to equation 2.5 as:
2
2
L
t·α·πF (eq. 2.5)
Parker et al. (1961) obtained a value of F of 1.38 when the temperature reached
half of its maximum value. This time (t1/2) is easily measurable and from
equation 2.6 the thermal diffusivity can be determined.
212
2381
/t·π
L·.α (eq. 2.6)
However, this equation is only valid when the following requirements are met:
1) the sample is homogeneous;
2) the heat conduction is one-dimensional;
3) the width of the laser pulse is very small compared to the time of
measurement t1/2;
4) the sample is adiabatically isolated.
Generally there are radial heat losses, and therefore the previous equation
ceases to be valid. In addition, for materials with high thermal diffusivity, the
width of the laser pulse can cease to be negligible in comparison to t1/2. For this
reason different theoretical models have been developed that solve the heat
equation in an analytical way by considering a term of losses and a finite width
of the laser pulse, obtaining different expressions to those of equation 2.6.
Some of these solutions take into account that the heat conduction is two-
dimensional. Recently, solutions based on numerical methods have been
formulated.
Cowan (1963) considered a term of heat losses by convection and radiation on
the surface. The same year Cape and Lehman (1963) took into account in
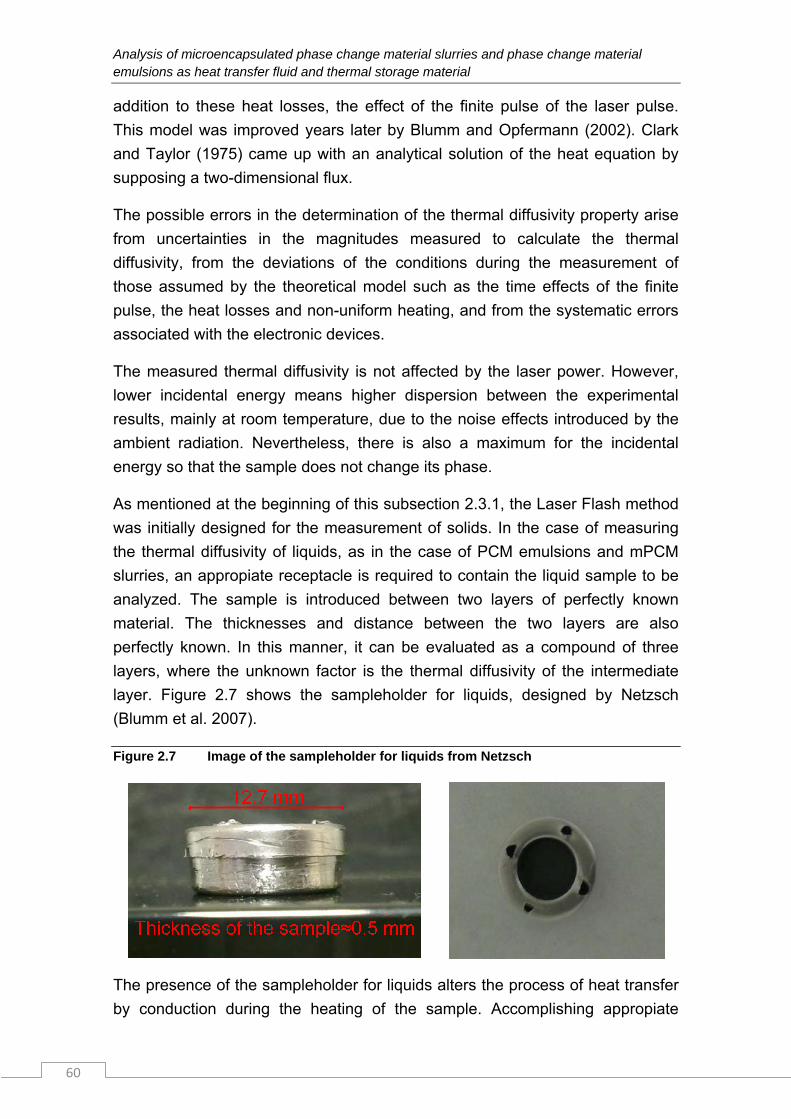
Analysis of microencapsulated phase change material slurries and phase change material emulsions as heat transfer fluid and thermal storage material
60
addition to these heat losses, the effect of the finite pulse of the laser pulse.
This model was improved years later by Blumm and Opfermann (2002). Clark
and Taylor (1975) came up with an analytical solution of the heat equation by
supposing a two-dimensional flux.
The possible errors in the determination of the thermal diffusivity property arise
from uncertainties in the magnitudes measured to calculate the thermal
diffusivity, from the deviations of the conditions during the measurement of
those assumed by the theoretical model such as the time effects of the finite
pulse, the heat losses and non-uniform heating, and from the systematic errors
associated with the electronic devices.
The measured thermal diffusivity is not affected by the laser power. However,
lower incidental energy means higher dispersion between the experimental
results, mainly at room temperature, due to the noise effects introduced by the
ambient radiation. Nevertheless, there is also a maximum for the incidental
energy so that the sample does not change its phase.
As mentioned at the beginning of this subsection 2.3.1, the Laser Flash method
was initially designed for the measurement of solids. In the case of measuring
the thermal diffusivity of liquids, as in the case of PCM emulsions and mPCM
slurries, an appropiate receptacle is required to contain the liquid sample to be
analyzed. The sample is introduced between two layers of perfectly known
material. The thicknesses and distance between the two layers are also
perfectly known. In this manner, it can be evaluated as a compound of three
layers, where the unknown factor is the thermal diffusivity of the intermediate
layer. Figure 2.7 shows the sampleholder for liquids, designed by Netzsch
(Blumm et al. 2007).
Figure 2.7 Image of the sampleholder for liquids from Netzsch
The presence of the sampleholder for liquids alters the process of heat transfer
by conduction during the heating of the sample. Accomplishing appropiate
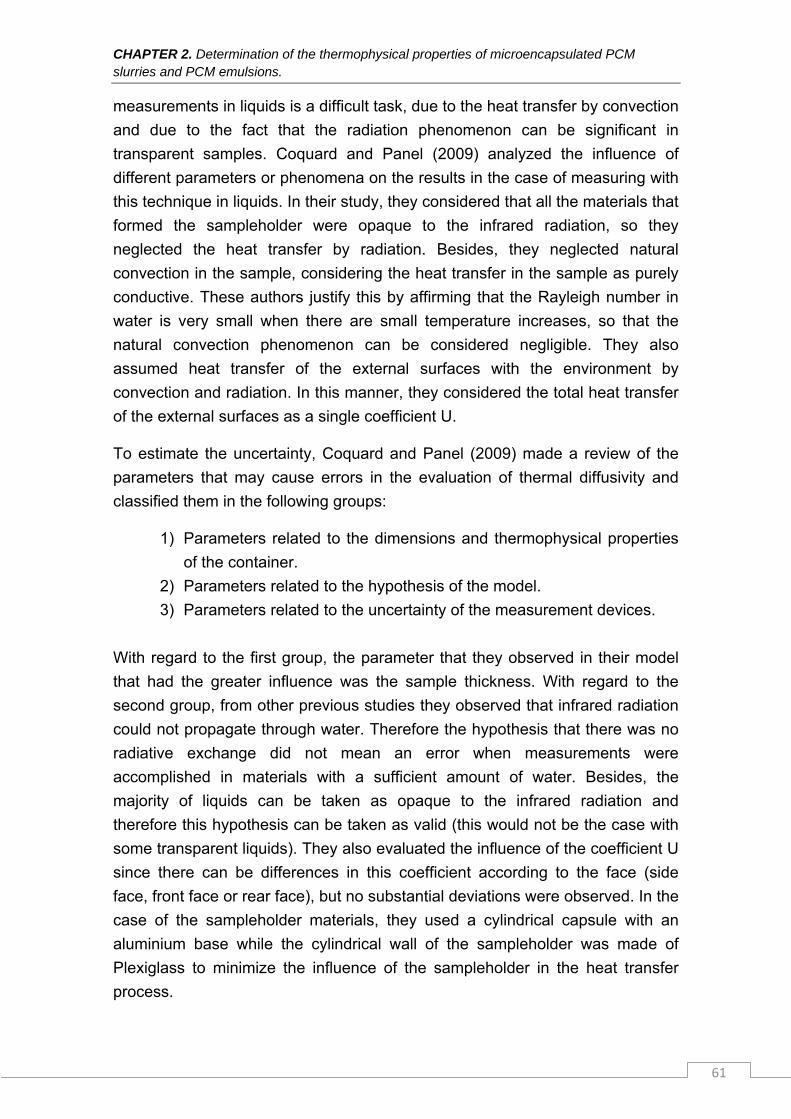
CHAPTER 2. Determination of the thermophysical properties of microencapsulated PCM slurries and PCM emulsions.
61
measurements in liquids is a difficult task, due to the heat transfer by convection
and due to the fact that the radiation phenomenon can be significant in
transparent samples. Coquard and Panel (2009) analyzed the influence of
different parameters or phenomena on the results in the case of measuring with
this technique in liquids. In their study, they considered that all the materials that
formed the sampleholder were opaque to the infrared radiation, so they
neglected the heat transfer by radiation. Besides, they neglected natural
convection in the sample, considering the heat transfer in the sample as purely
conductive. These authors justify this by affirming that the Rayleigh number in
water is very small when there are small temperature increases, so that the
natural convection phenomenon can be considered negligible. They also
assumed heat transfer of the external surfaces with the environment by
convection and radiation. In this manner, they considered the total heat transfer
of the external surfaces as a single coefficient U.
To estimate the uncertainty, Coquard and Panel (2009) made a review of the
parameters that may cause errors in the evaluation of thermal diffusivity and
classified them in the following groups:
1) Parameters related to the dimensions and thermophysical properties
of the container.
2) Parameters related to the hypothesis of the model.
3) Parameters related to the uncertainty of the measurement devices.
With regard to the first group, the parameter that they observed in their model
that had the greater influence was the sample thickness. With regard to the
second group, from other previous studies they observed that infrared radiation
could not propagate through water. Therefore the hypothesis that there was no
radiative exchange did not mean an error when measurements were
accomplished in materials with a sufficient amount of water. Besides, the
majority of liquids can be taken as opaque to the infrared radiation and
therefore this hypothesis can be taken as valid (this would not be the case with
some transparent liquids). They also evaluated the influence of the coefficient U
since there can be differences in this coefficient according to the face (side
face, front face or rear face), but no substantial deviations were observed. In the
case of the sampleholder materials, they used a cylindrical capsule with an
aluminium base while the cylindrical wall of the sampleholder was made of
Plexiglass to minimize the influence of the sampleholder in the heat transfer
process.
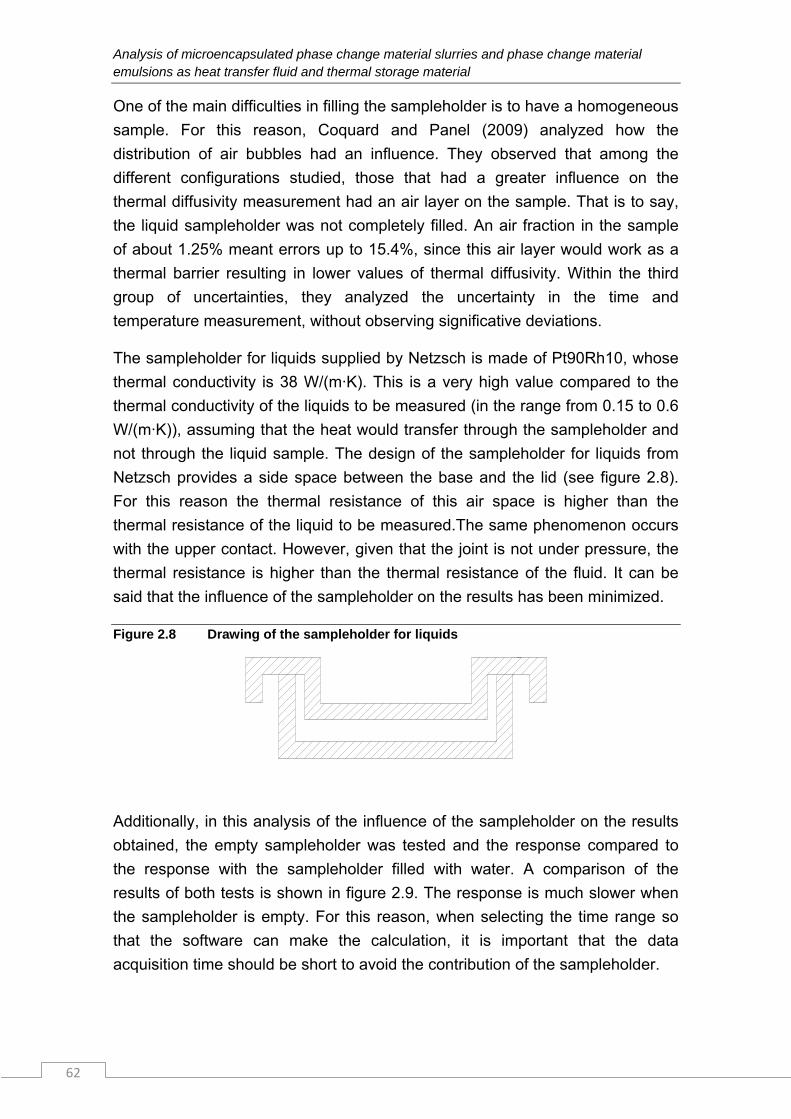
Analysis of microencapsulated phase change material slurries and phase change material emulsions as heat transfer fluid and thermal storage material
62
One of the main difficulties in filling the sampleholder is to have a homogeneous
sample. For this reason, Coquard and Panel (2009) analyzed how the
distribution of air bubbles had an influence. They observed that among the
different configurations studied, those that had a greater influence on the
thermal diffusivity measurement had an air layer on the sample. That is to say,
the liquid sampleholder was not completely filled. An air fraction in the sample
of about 1.25% meant errors up to 15.4%, since this air layer would work as a
thermal barrier resulting in lower values of thermal diffusivity. Within the third
group of uncertainties, they analyzed the uncertainty in the time and
temperature measurement, without observing significative deviations.
The sampleholder for liquids supplied by Netzsch is made of Pt90Rh10, whose
thermal conductivity is 38 W/(m·K). This is a very high value compared to the
thermal conductivity of the liquids to be measured (in the range from 0.15 to 0.6
W/(m·K)), assuming that the heat would transfer through the sampleholder and
not through the liquid sample. The design of the sampleholder for liquids from
Netzsch provides a side space between the base and the lid (see figure 2.8).
For this reason the thermal resistance of this air space is higher than the
thermal resistance of the liquid to be measured.The same phenomenon occurs
with the upper contact. However, given that the joint is not under pressure, the
thermal resistance is higher than the thermal resistance of the fluid. It can be
said that the influence of the sampleholder on the results has been minimized.
Figure 2.8 Drawing of the sampleholder for liquids
Additionally, in this analysis of the influence of the sampleholder on the results
obtained, the empty sampleholder was tested and the response compared to
the response with the sampleholder filled with water. A comparison of the
results of both tests is shown in figure 2.9. The response is much slower when
the sampleholder is empty. For this reason, when selecting the time range so
that the software can make the calculation, it is important that the data
acquisition time should be short to avoid the contribution of the sampleholder.
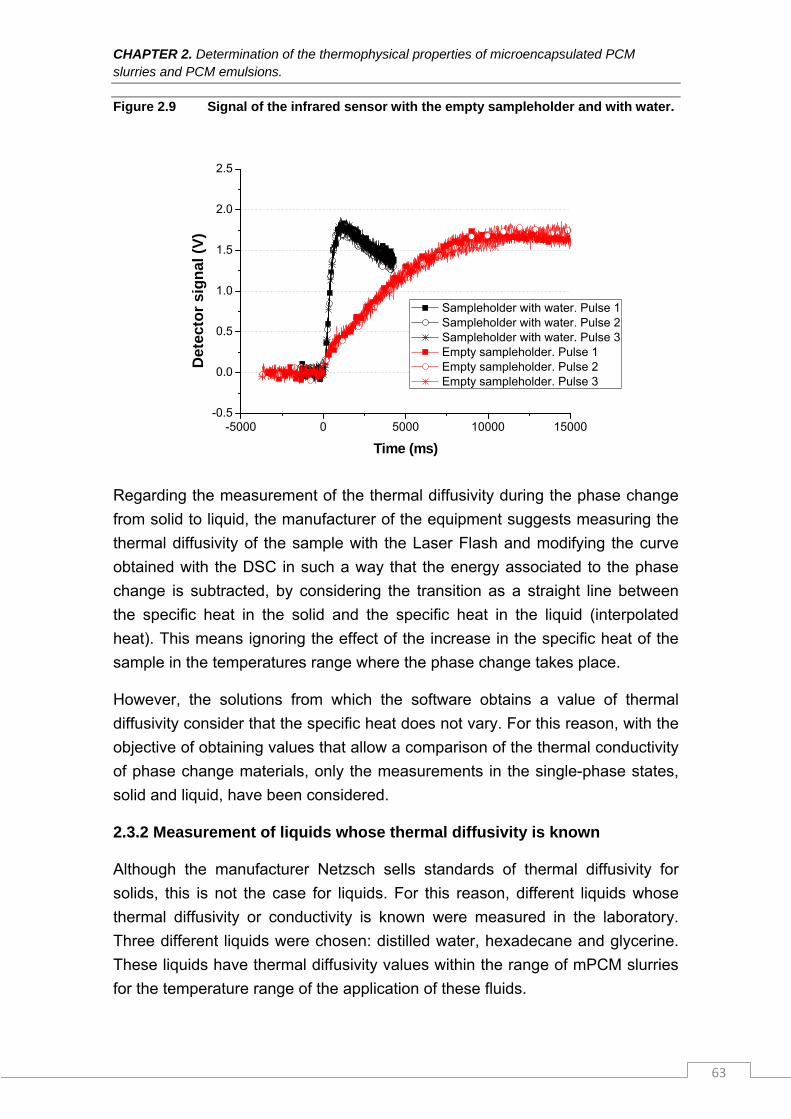
CHAPTER 2. Determination of the thermophysical properties of microencapsulated PCM slurries and PCM emulsions.
63
Figure 2.9 Signal of the infrared sensor with the empty sampleholder and with water.
-5000 0 5000 10000 15000-0.5
0.0
0.5
1.0
1.5
2.0
2.5
Det
ecto
r si
gn
al (
V)
Time (ms)
Sampleholder with water. Pulse 1 Sampleholder with water. Pulse 2 Sampleholder with water. Pulse 3 Empty sampleholder. Pulse 1 Empty sampleholder. Pulse 2 Empty sampleholder. Pulse 3
Regarding the measurement of the thermal diffusivity during the phase change
from solid to liquid, the manufacturer of the equipment suggests measuring the
thermal diffusivity of the sample with the Laser Flash and modifying the curve
obtained with the DSC in such a way that the energy associated to the phase
change is subtracted, by considering the transition as a straight line between
the specific heat in the solid and the specific heat in the liquid (interpolated
heat). This means ignoring the effect of the increase in the specific heat of the
sample in the temperatures range where the phase change takes place.
However, the solutions from which the software obtains a value of thermal
diffusivity consider that the specific heat does not vary. For this reason, with the
objective of obtaining values that allow a comparison of the thermal conductivity
of phase change materials, only the measurements in the single-phase states,
solid and liquid, have been considered.
2.3.2 Measurement of liquids whose thermal diffusivity is known
Although the manufacturer Netzsch sells standards of thermal diffusivity for
solids, this is not the case for liquids. For this reason, different liquids whose
thermal diffusivity or conductivity is known were measured in the laboratory.
Three different liquids were chosen: distilled water, hexadecane and glycerine.
These liquids have thermal diffusivity values within the range of mPCM slurries
for the temperature range of the application of these fluids.
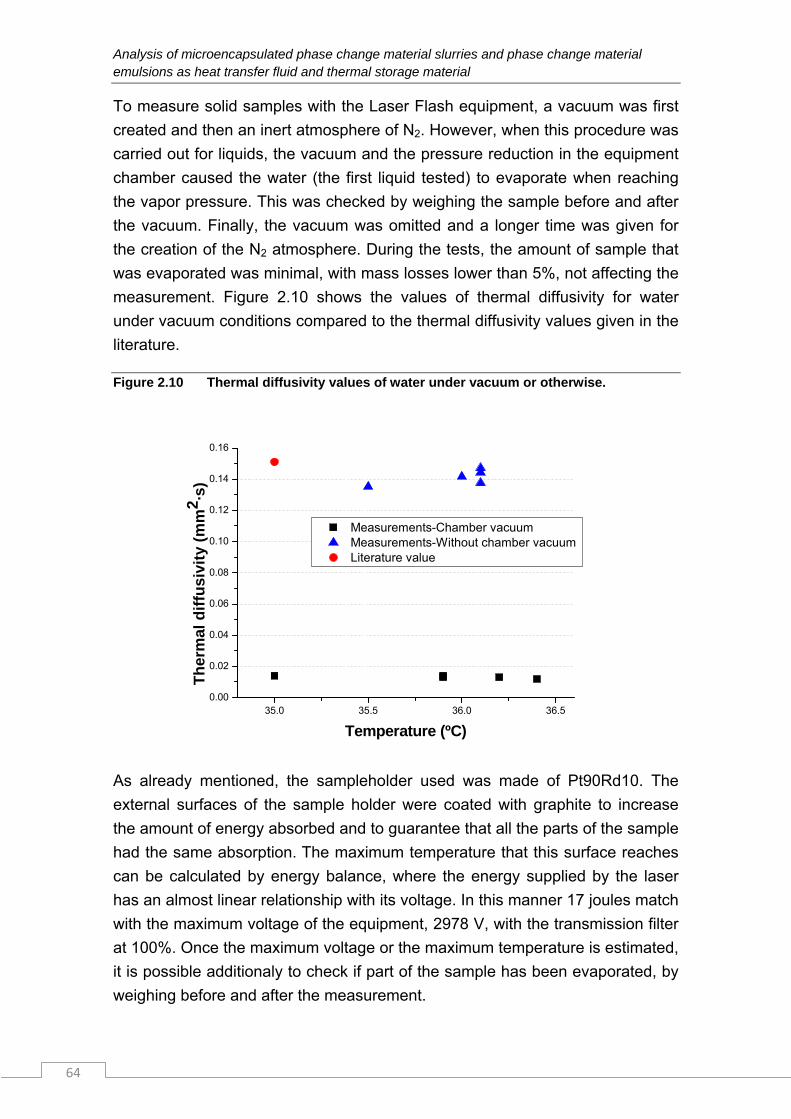
Analysis of microencapsulated phase change material slurries and phase change material emulsions as heat transfer fluid and thermal storage material
64
To measure solid samples with the Laser Flash equipment, a vacuum was first
created and then an inert atmosphere of N2. However, when this procedure was
carried out for liquids, the vacuum and the pressure reduction in the equipment
chamber caused the water (the first liquid tested) to evaporate when reaching
the vapor pressure. This was checked by weighing the sample before and after
the vacuum. Finally, the vacuum was omitted and a longer time was given for
the creation of the N2 atmosphere. During the tests, the amount of sample that
was evaporated was minimal, with mass losses lower than 5%, not affecting the
measurement. Figure 2.10 shows the values of thermal diffusivity for water
under vacuum conditions compared to the thermal diffusivity values given in the
literature.
Figure 2.10 Thermal diffusivity values of water under vacuum or otherwise.
35.0 35.5 36.0 36.50.00
0.02
0.04
0.06
0.08
0.10
0.12
0.14
0.16
Measurements-Chamber vacuum Measurements-Without chamber vacuum Literature value
Th
erm
al d
iffu
sivi
ty (
mm
2 ·s)
Temperature (ºC)
As already mentioned, the sampleholder used was made of Pt90Rd10. The
external surfaces of the sample holder were coated with graphite to increase
the amount of energy absorbed and to guarantee that all the parts of the sample
had the same absorption. The maximum temperature that this surface reaches
can be calculated by energy balance, where the energy supplied by the laser
has an almost linear relationship with its voltage. In this manner 17 joules match
with the maximum voltage of the equipment, 2978 V, with the transmission filter
at 100%. Once the maximum voltage or the maximum temperature is estimated,
it is possible additionaly to check if part of the sample has been evaporated, by
weighing before and after the measurement.
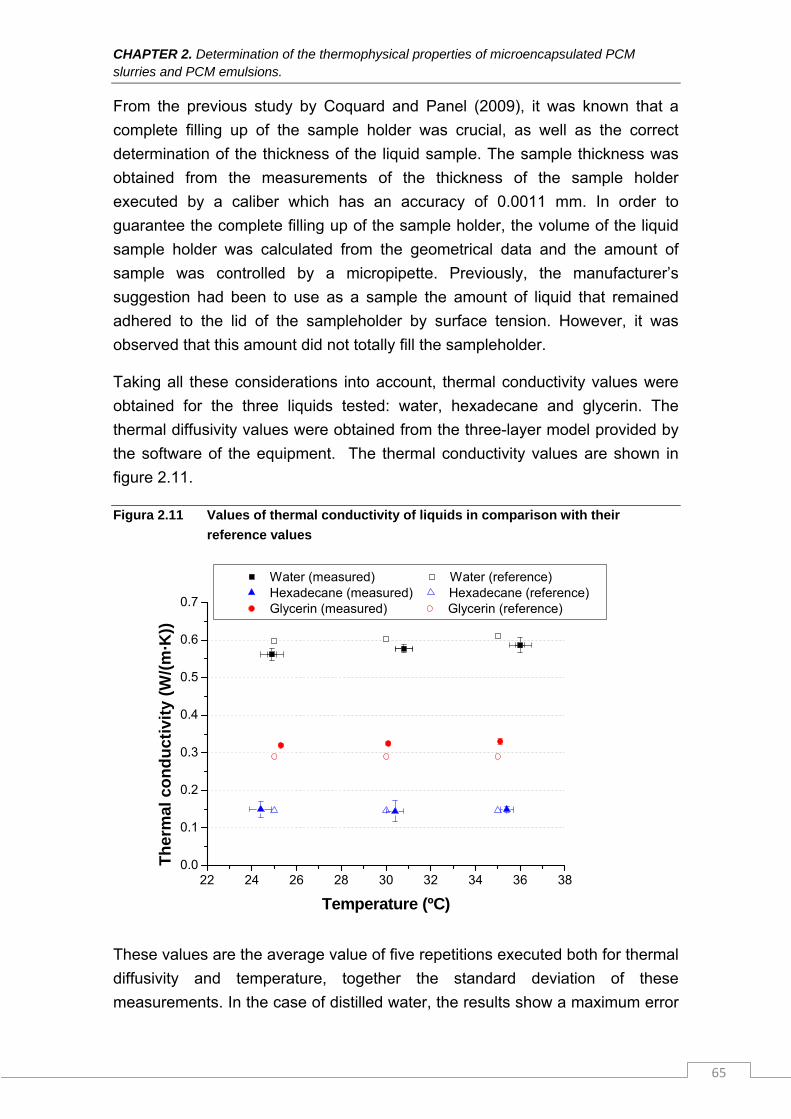
CHAPTER 2. Determination of the thermophysical properties of microencapsulated PCM slurries and PCM emulsions.
65
From the previous study by Coquard and Panel (2009), it was known that a
complete filling up of the sample holder was crucial, as well as the correct
determination of the thickness of the liquid sample. The sample thickness was
obtained from the measurements of the thickness of the sample holder
executed by a caliber which has an accuracy of 0.0011 mm. In order to
guarantee the complete filling up of the sample holder, the volume of the liquid
sample holder was calculated from the geometrical data and the amount of
sample was controlled by a micropipette. Previously, the manufacturer’s
suggestion had been to use as a sample the amount of liquid that remained
adhered to the lid of the sampleholder by surface tension. However, it was
observed that this amount did not totally fill the sampleholder.
Taking all these considerations into account, thermal conductivity values were
obtained for the three liquids tested: water, hexadecane and glycerin. The
thermal diffusivity values were obtained from the three-layer model provided by
the software of the equipment. The thermal conductivity values are shown in
figure 2.11.
Figura 2.11 Values of thermal conductivity of liquids in comparison with their
reference values
22 24 26 28 30 32 34 36 380.0
0.1
0.2
0.3
0.4
0.5
0.6
0.7
Water (measured) Water (reference) Hexadecane (measured) Hexadecane (reference) Glycerin (measured) Glycerin (reference)
Th
erm
al c
on
du
ctiv
ity
(W/(
m·K
))
Temperature (ºC)
These values are the average value of five repetitions executed both for thermal
diffusivity and temperature, together the standard deviation of these
measurements. In the case of distilled water, the results show a maximum error
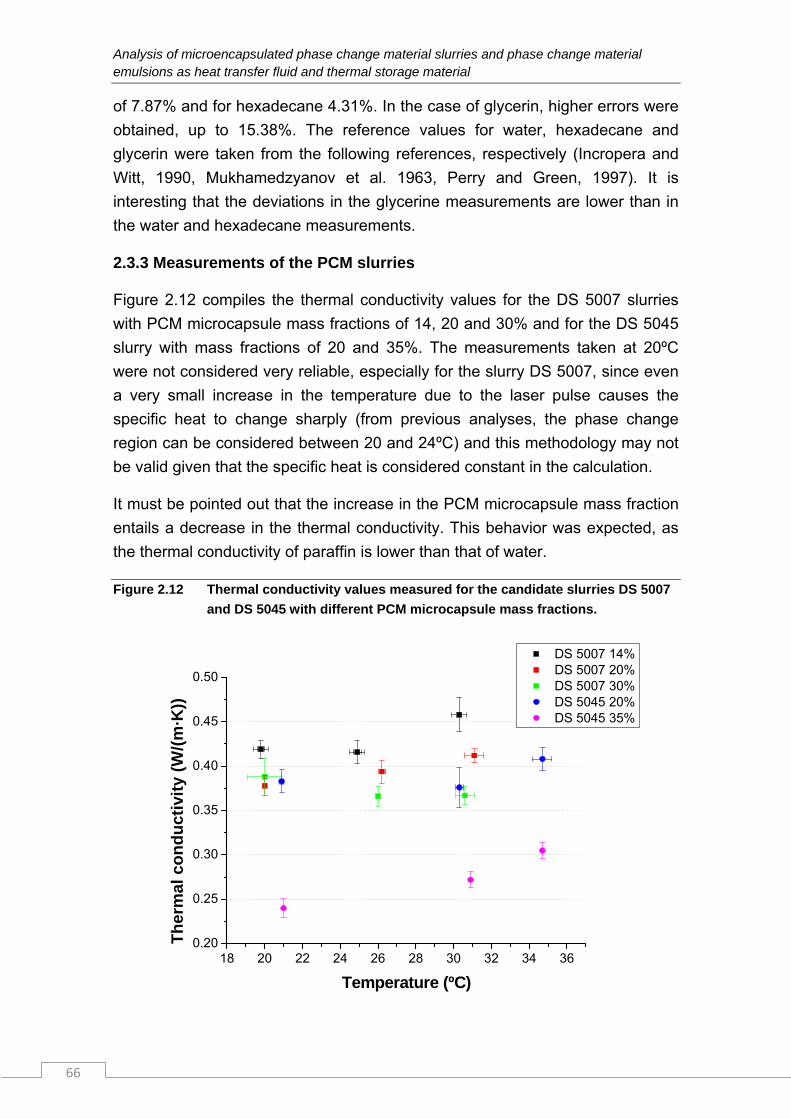
Analysis of microencapsulated phase change material slurries and phase change material emulsions as heat transfer fluid and thermal storage material
66
of 7.87% and for hexadecane 4.31%. In the case of glycerin, higher errors were
obtained, up to 15.38%. The reference values for water, hexadecane and
glycerin were taken from the following references, respectively (Incropera and
Witt, 1990, Mukhamedzyanov et al. 1963, Perry and Green, 1997). It is
interesting that the deviations in the glycerine measurements are lower than in
the water and hexadecane measurements.
2.3.3 Measurements of the PCM slurries
Figure 2.12 compiles the thermal conductivity values for the DS 5007 slurries
with PCM microcapsule mass fractions of 14, 20 and 30% and for the DS 5045
slurry with mass fractions of 20 and 35%. The measurements taken at 20ºC
were not considered very reliable, especially for the slurry DS 5007, since even
a very small increase in the temperature due to the laser pulse causes the
specific heat to change sharply (from previous analyses, the phase change
region can be considered between 20 and 24ºC) and this methodology may not
be valid given that the specific heat is considered constant in the calculation.
It must be pointed out that the increase in the PCM microcapsule mass fraction
entails a decrease in the thermal conductivity. This behavior was expected, as
the thermal conductivity of paraffin is lower than that of water.
Figure 2.12 Thermal conductivity values measured for the candidate slurries DS 5007
and DS 5045 with different PCM microcapsule mass fractions.
18 20 22 24 26 28 30 32 34 360.20
0.25
0.30
0.35
0.40
0.45
0.50
DS 5007 14% DS 5007 20% DS 5007 30% DS 5045 20% DS 5045 35%
Th
erm
al c
on
du
ctiv
ity
(W/(
m·K
))
Temperature (ºC)
CHAPTER 2. Determination of the thermophysical properties of microencapsulated PCM slurries and PCM emulsions.
67
Specifically, at around 30ºC for a 20% PCM microcapsule mass fraction, the DS
5007 and DS 5045 slurry experienced a reduction of their thermal conductivity
in comparison to water by 31.7 and 37.6% respectively.
2.4 Conclusions
The Enthalpy-Temperature curves of 5 PCM slurries have been obtained in the
laboratory, specifically the curves of 3 mPCM slurries (2 of them with different
PCM microcapsule mass fractions) and of 2 PCM emulsions. These curves
have been obtained from an installation using the T-history method. Further
tests in the case of the slurry from the AERO-University of Ljubljana were
rejected because of a hysteresis of about 10ºC. Further tests on the samples
developed by Fraunhofer UMSICHT were also rejected because of stratification
problems (in the sample without thickener) or problems of incompatibility with
the plastic (in the sample with thickener).
Regarding the thermal diffusivity measurements, a first approach to a
methodology has been established to accomplish measurements with a Laser
Flash in the case of measuring mPCM slurries and PCM emulsions at
temperatures close to the ambient temperature. The analyses carried out
indicate that for the correct measurement of this property the following aspects
must be considered:
A vacuum should not be created in the chamber of the Laser Flash so as
to avoid the evaporation of the sample.
The amount of sample evaporated during the test must be controlled. It
must be checked that the amount of sample that is evaporated is small
(mass loss<5%).
The sampleholder must be correctly filled by calculating the volume of
the sample from the geometric parameters of the sampleholder.
When applying the corresponding calculation model for obtaining thermal
diffusivity values from the data recorded by the infrared sensor, the
observation time must be as short as possible to avoid the influence of
the sampleholder.
After having satisfactorily measured the thermal diffusivity of water and
hexadecane with errors below 8%, the thermal diffusivity of DS 5007 and DS
5045 slurries for different mass fractions were measured. As expected, it was
observed that when increasing the PCM microcapsule mass fraction, the

Analysis of microencapsulated phase change material slurries and phase change material emulsions as heat transfer fluid and thermal storage material
68
thermal conductivity of the slurry decreased due to the lower thermal
conductivity of paraffin compared to water.
CHAPTER 3. Determination of rheological properties
69
In the previous chapter the enthalpy and the thermal conductivity depending on temperature of mPCM slurries and PCM emulsions compiled in the laboratory have been determined. To complete the characterization, this chapter addresses the rheological characterization of the candidate mPCM slurries. The chapter has been completed with the approach of a methodology for the determination of the viscosity of octadecane in the melted phase and during the phase transition. The methodology proposed can be useful for the determination of the viscosity of other PCMs. These values could be used when modeling natural convection in PCM in melted phase, in traditional thermal energy storage systems with PCMs.
3 Determination of rheological properties
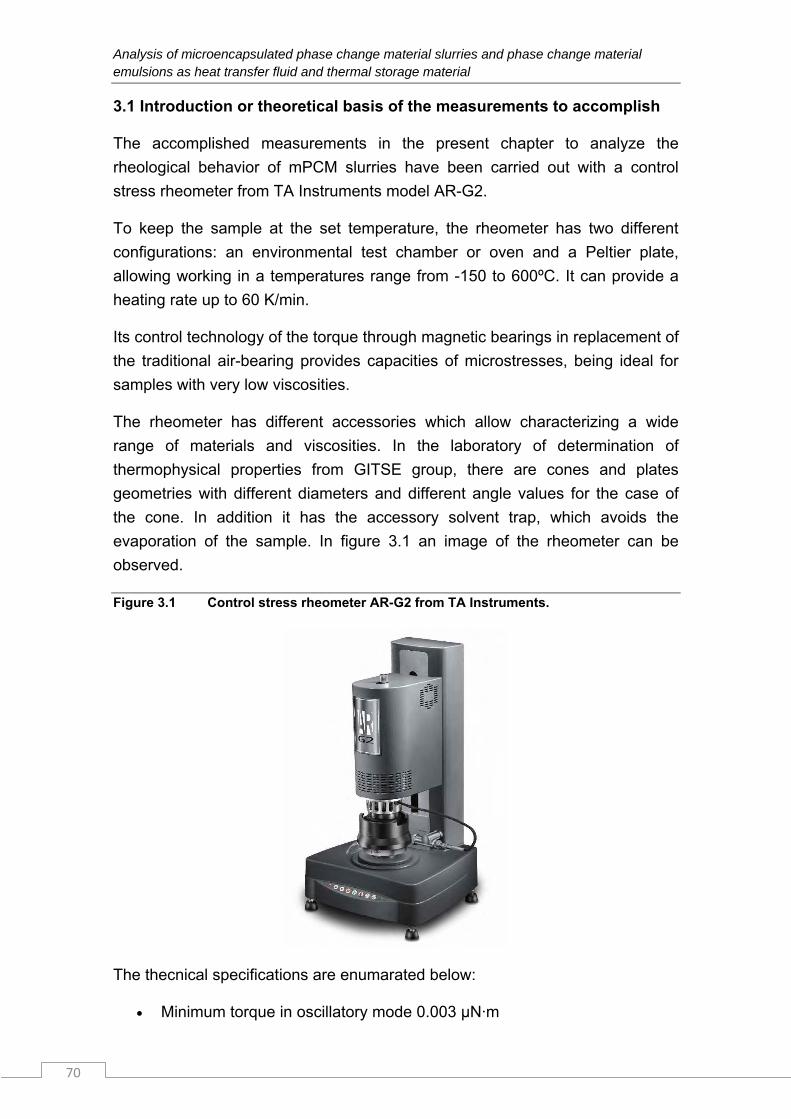
Analysis of microencapsulated phase change material slurries and phase change material emulsions as heat transfer fluid and thermal storage material
70
3.1 Introduction or theoretical basis of the measurements to accomplish
The accomplished measurements in the present chapter to analyze the
rheological behavior of mPCM slurries have been carried out with a control
stress rheometer from TA Instruments model AR-G2.
To keep the sample at the set temperature, the rheometer has two different
configurations: an environmental test chamber or oven and a Peltier plate,
allowing working in a temperatures range from -150 to 600ºC. It can provide a
heating rate up to 60 K/min.
Its control technology of the torque through magnetic bearings in replacement of
the traditional air-bearing provides capacities of microstresses, being ideal for
samples with very low viscosities.
The rheometer has different accessories which allow characterizing a wide
range of materials and viscosities. In the laboratory of determination of
thermophysical properties from GITSE group, there are cones and plates
geometries with different diameters and different angle values for the case of
the cone. In addition it has the accessory solvent trap, which avoids the
evaporation of the sample. In figure 3.1 an image of the rheometer can be
observed.
Figure 3.1 Control stress rheometer AR-G2 from TA Instruments.
The thecnical specifications are enumarated below:
Minimum torque in oscillatory mode 0.003 µN·m
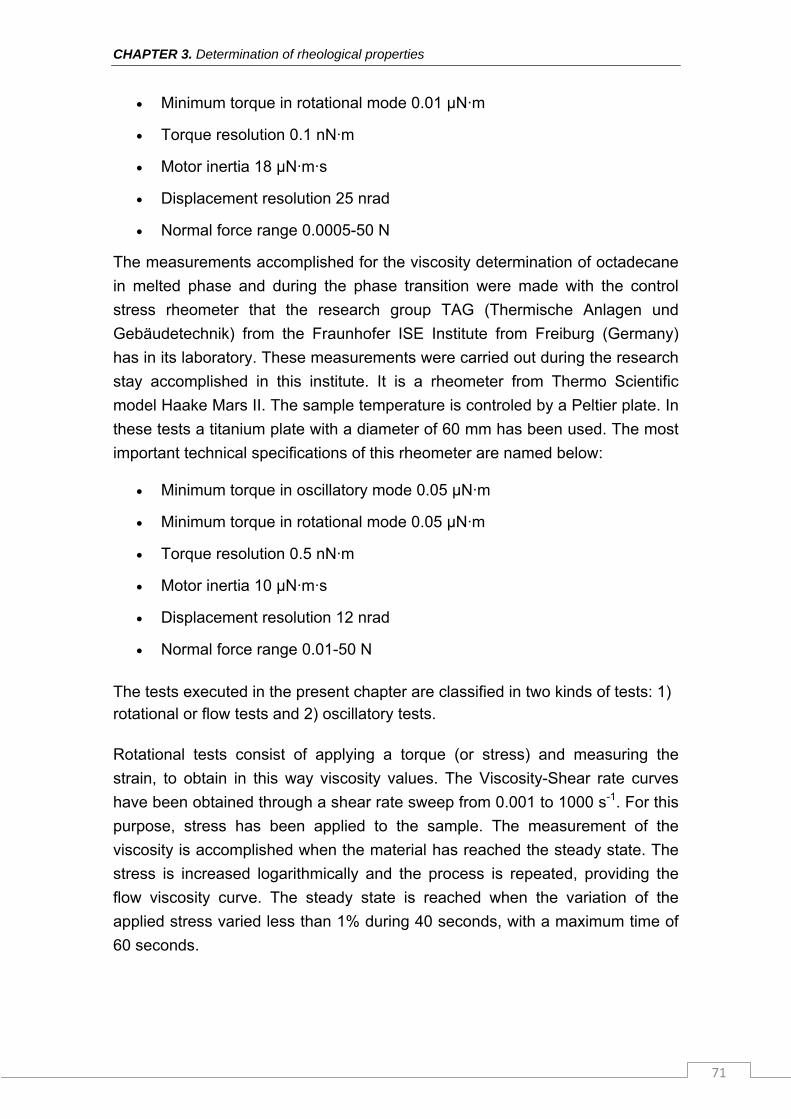
CHAPTER 3. Determination of rheological properties
71
Minimum torque in rotational mode 0.01 µN·m
Torque resolution 0.1 nN·m
Motor inertia 18 µN·m·s
Displacement resolution 25 nrad
Normal force range 0.0005-50 N
The measurements accomplished for the viscosity determination of octadecane
in melted phase and during the phase transition were made with the control
stress rheometer that the research group TAG (Thermische Anlagen und
Gebäudetechnik) from the Fraunhofer ISE Institute from Freiburg (Germany)
has in its laboratory. These measurements were carried out during the research
stay accomplished in this institute. It is a rheometer from Thermo Scientific
model Haake Mars II. The sample temperature is controled by a Peltier plate. In
these tests a titanium plate with a diameter of 60 mm has been used. The most
important technical specifications of this rheometer are named below:
Minimum torque in oscillatory mode 0.05 µN·m
Minimum torque in rotational mode 0.05 µN·m
Torque resolution 0.5 nN·m
Motor inertia 10 µN·m·s
Displacement resolution 12 nrad
Normal force range 0.01-50 N
The tests executed in the present chapter are classified in two kinds of tests: 1) rotational or flow tests and 2) oscillatory tests.
Rotational tests consist of applying a torque (or stress) and measuring the
strain, to obtain in this way viscosity values. The Viscosity-Shear rate curves
have been obtained through a shear rate sweep from 0.001 to 1000 s-1. For this
purpose, stress has been applied to the sample. The measurement of the
viscosity is accomplished when the material has reached the steady state. The
stress is increased logarithmically and the process is repeated, providing the
flow viscosity curve. The steady state is reached when the variation of the
applied stress varied less than 1% during 40 seconds, with a maximum time of
60 seconds.
Analysis of microencapsulated phase change material slurries and phase change material emulsions as heat transfer fluid and thermal storage material
72
In oscillatory tests the sample is subjected to an oscillatory strain of low
amplitude and the stress that the fluid causes is measured (see in figure 3.2.).
According to the lag between the applied strain ( )tω·cos(γγ 0 ) and the
measured stress ( )δtω·cos(ττ 0 ):
If δ=0º → elastic solid
If δ=90º → fluid purely viscous
If 0< δ<90ºC → viscoelastic fluid
Figure 3.2 Oscillatory strain (geomtry seen from above)
)wt·cos(γ=γ 0
In this manner an elastic module (G’) that would be the elastic or returnable part
and a viscous or loss module (G’’), that would be the viscous or non-returnable
part are obtained (equation 3.1):
''* iG'GG (eq. 3.1)
In the left image of figure 3.3 the curve obtained in the case of an elastic
response is shown, where the oscillatory stress would be )tω(sen·γ·Gτ *0
and the resulting strain )tω(sen·γγ 0 . In the right image of figure 3.3 the curve
that would be obtained in the case of a viscous response is shown, the
oscillatory stress would be )tω·cos(γ·ω·ηγ·ητ 0
and the strain
)δ-tω(sen·γγ 0 .
Two types of oscillatory test have been carried out: strain or stress sweeps and
frequency sweeps. In the strain or stress sweeps a frequency is set for the test,
a strain or stress is applied and the response is measured (stress or strain). In
the frequency sweeps, the strain or stress is set, a frequency sweep is executed
and the response is measured (stress or strain). Both tests appear drawn in
figure 3.4.
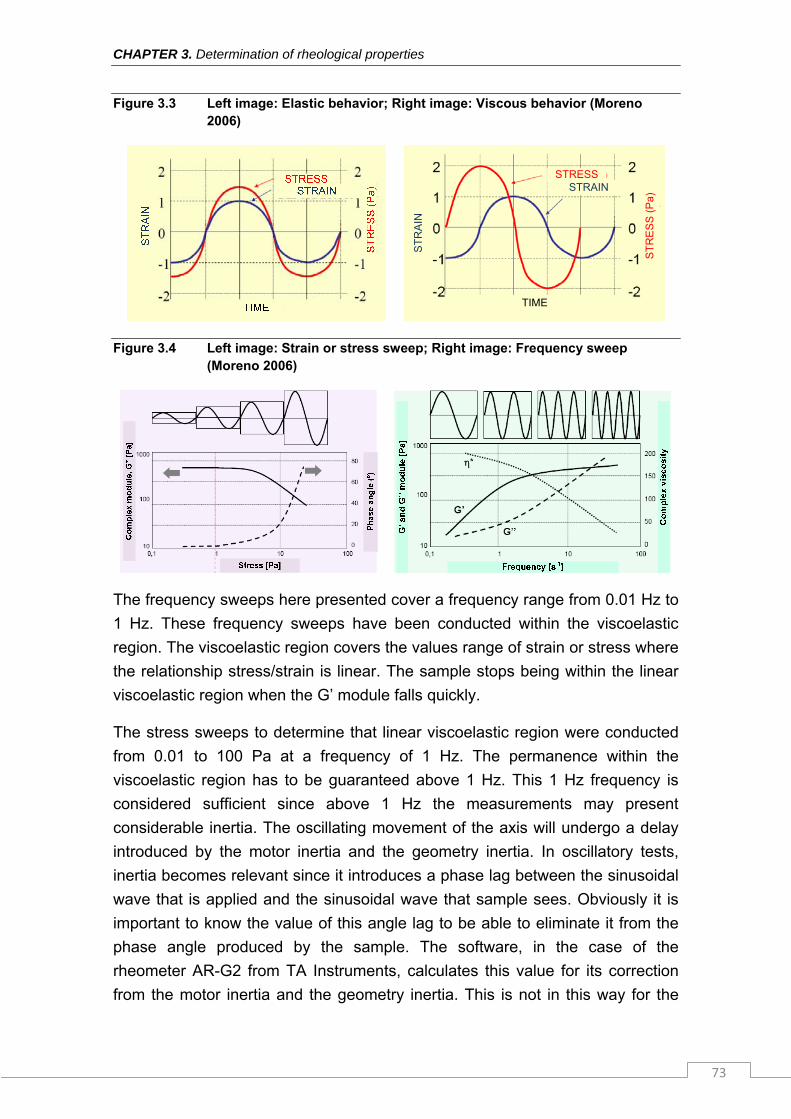
CHAPTER 3. Determination of rheological properties
73
Figure 3.3 Left image: Elastic behavior; Right image: Viscous behavior (Moreno 2006)
ST
RA
IN
ST
RE
SS
(P
a)
TIME
STRAINSTRESS
Figure 3.4 Left image: Strain or stress sweep; Right image: Frequency sweep (Moreno 2006)
The frequency sweeps here presented cover a frequency range from 0.01 Hz to
1 Hz. These frequency sweeps have been conducted within the viscoelastic
region. The viscoelastic region covers the values range of strain or stress where
the relationship stress/strain is linear. The sample stops being within the linear
viscoelastic region when the G’ module falls quickly.
The stress sweeps to determine that linear viscoelastic region were conducted
from 0.01 to 100 Pa at a frequency of 1 Hz. The permanence within the
viscoelastic region has to be guaranteed above 1 Hz. This 1 Hz frequency is
considered sufficient since above 1 Hz the measurements may present
considerable inertia. The oscillating movement of the axis will undergo a delay
introduced by the motor inertia and the geometry inertia. In oscillatory tests,
inertia becomes relevant since it introduces a phase lag between the sinusoidal
wave that is applied and the sinusoidal wave that sample sees. Obviously it is
important to know the value of this angle lag to be able to eliminate it from the
phase angle produced by the sample. The software, in the case of the
rheometer AR-G2 from TA Instruments, calculates this value for its correction
from the motor inertia and the geometry inertia. This is not in this way for the
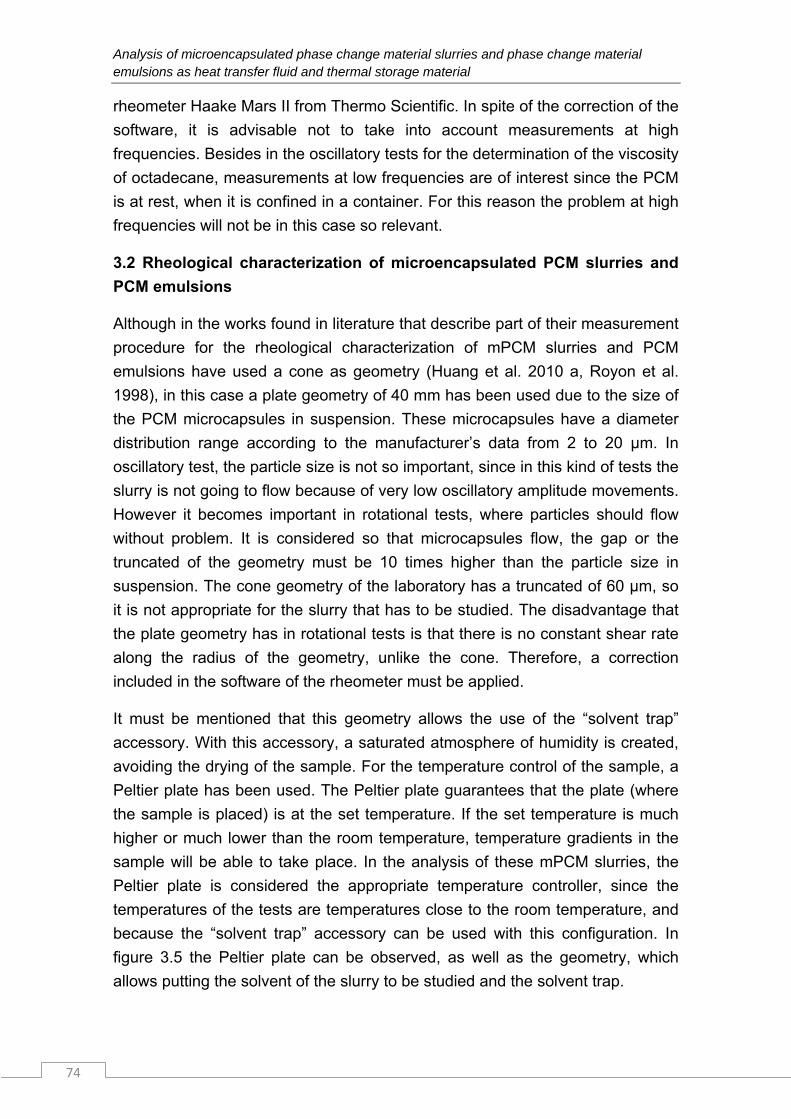
Analysis of microencapsulated phase change material slurries and phase change material emulsions as heat transfer fluid and thermal storage material
74
rheometer Haake Mars II from Thermo Scientific. In spite of the correction of the
software, it is advisable not to take into account measurements at high
frequencies. Besides in the oscillatory tests for the determination of the viscosity
of octadecane, measurements at low frequencies are of interest since the PCM
is at rest, when it is confined in a container. For this reason the problem at high
frequencies will not be in this case so relevant.
3.2 Rheological characterization of microencapsulated PCM slurries and
PCM emulsions
Although in the works found in literature that describe part of their measurement
procedure for the rheological characterization of mPCM slurries and PCM
emulsions have used a cone as geometry (Huang et al. 2010 a, Royon et al.
1998), in this case a plate geometry of 40 mm has been used due to the size of
the PCM microcapsules in suspension. These microcapsules have a diameter
distribution range according to the manufacturer’s data from 2 to 20 µm. In
oscillatory test, the particle size is not so important, since in this kind of tests the
slurry is not going to flow because of very low oscillatory amplitude movements.
However it becomes important in rotational tests, where particles should flow
without problem. It is considered so that microcapsules flow, the gap or the
truncated of the geometry must be 10 times higher than the particle size in
suspension. The cone geometry of the laboratory has a truncated of 60 µm, so
it is not appropriate for the slurry that has to be studied. The disadvantage that
the plate geometry has in rotational tests is that there is no constant shear rate
along the radius of the geometry, unlike the cone. Therefore, a correction
included in the software of the rheometer must be applied.
It must be mentioned that this geometry allows the use of the “solvent trap”
accessory. With this accessory, a saturated atmosphere of humidity is created,
avoiding the drying of the sample. For the temperature control of the sample, a
Peltier plate has been used. The Peltier plate guarantees that the plate (where
the sample is placed) is at the set temperature. If the set temperature is much
higher or much lower than the room temperature, temperature gradients in the
sample will be able to take place. In the analysis of these mPCM slurries, the
Peltier plate is considered the appropriate temperature controller, since the
temperatures of the tests are temperatures close to the room temperature, and
because the “solvent trap” accessory can be used with this configuration. In
figure 3.5 the Peltier plate can be observed, as well as the geometry, which
allows putting the solvent of the slurry to be studied and the solvent trap.
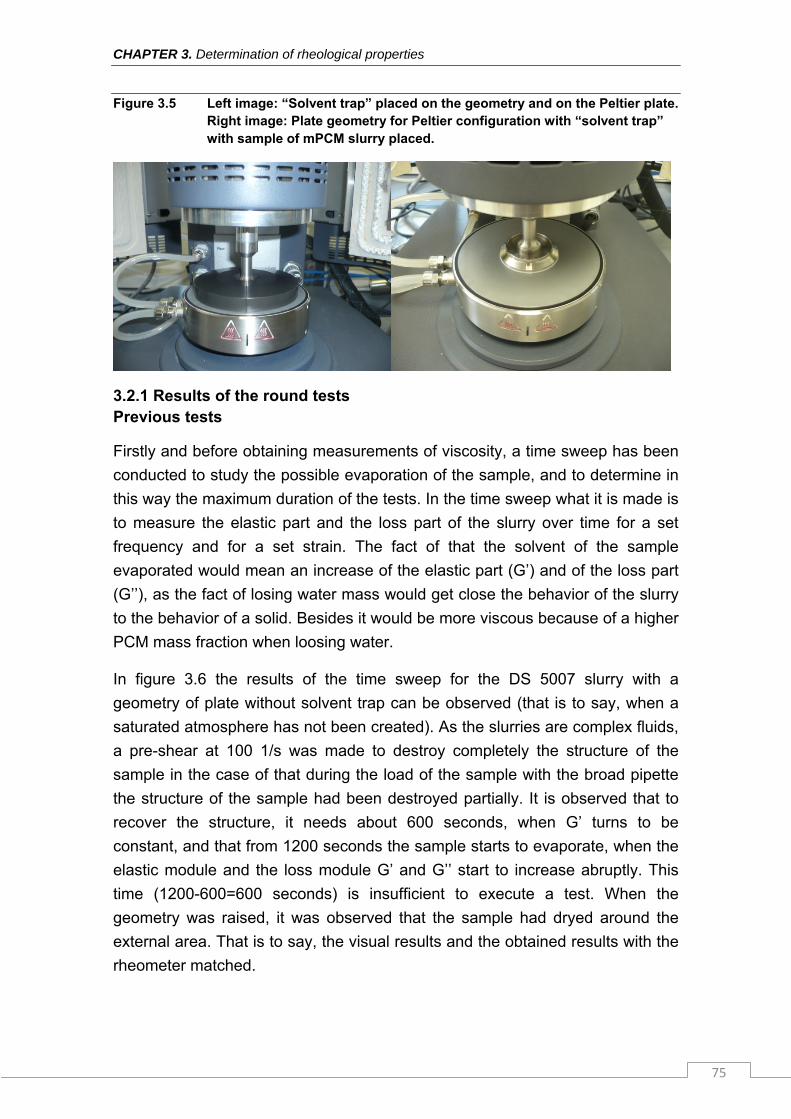
CHAPTER 3. Determination of rheological properties
75
Figure 3.5 Left image: “Solvent trap” placed on the geometry and on the Peltier plate. Right image: Plate geometry for Peltier configuration with “solvent trap” with sample of mPCM slurry placed.
3.2.1 Results of the round tests Previous tests
Firstly and before obtaining measurements of viscosity, a time sweep has been
conducted to study the possible evaporation of the sample, and to determine in
this way the maximum duration of the tests. In the time sweep what it is made is
to measure the elastic part and the loss part of the slurry over time for a set
frequency and for a set strain. The fact of that the solvent of the sample
evaporated would mean an increase of the elastic part (G’) and of the loss part
(G’’), as the fact of losing water mass would get close the behavior of the slurry
to the behavior of a solid. Besides it would be more viscous because of a higher
PCM mass fraction when loosing water.
In figure 3.6 the results of the time sweep for the DS 5007 slurry with a
geometry of plate without solvent trap can be observed (that is to say, when a
saturated atmosphere has not been created). As the slurries are complex fluids,
a pre-shear at 100 1/s was made to destroy completely the structure of the
sample in the case of that during the load of the sample with the broad pipette
the structure of the sample had been destroyed partially. It is observed that to
recover the structure, it needs about 600 seconds, when G’ turns to be
constant, and that from 1200 seconds the sample starts to evaporate, when the
elastic module and the loss module G’ and G’’ start to increase abruptly. This
time (1200-600=600 seconds) is insufficient to execute a test. When the
geometry was raised, it was observed that the sample had dryed around the
external area. That is to say, the visual results and the obtained results with the
rheometer matched.
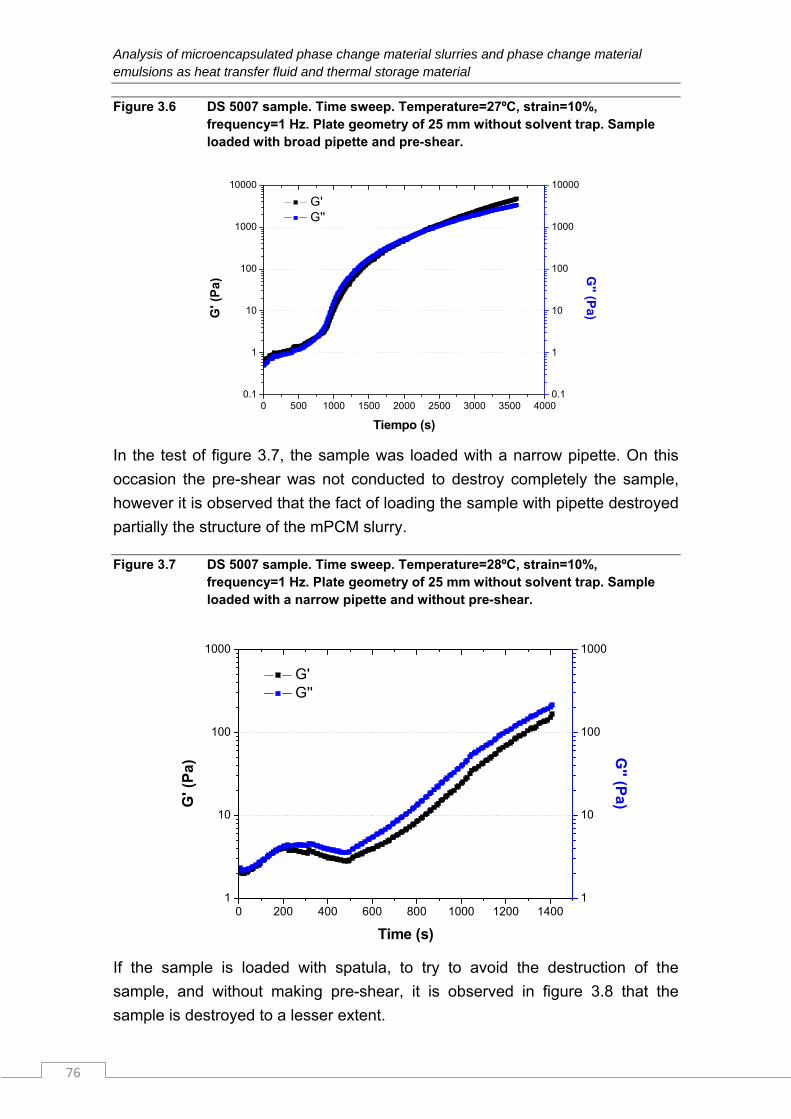
Analysis of microencapsulated phase change material slurries and phase change material emulsions as heat transfer fluid and thermal storage material
76
Figure 3.6 DS 5007 sample. Time sweep. Temperature=27ºC, strain=10%, frequency=1 Hz. Plate geometry of 25 mm without solvent trap. Sample loaded with broad pipette and pre-shear.
0 500 1000 1500 2000 2500 3000 3500 40000.1
1
10
100
1000
10000
G' G''
Tiempo (s)
G' (
Pa
)
0.1
1
10
100
1000
10000
G'' (P
a)
In the test of figure 3.7, the sample was loaded with a narrow pipette. On this
occasion the pre-shear was not conducted to destroy completely the sample,
however it is observed that the fact of loading the sample with pipette destroyed
partially the structure of the mPCM slurry.
Figure 3.7 DS 5007 sample. Time sweep. Temperature=28ºC, strain=10%, frequency=1 Hz. Plate geometry of 25 mm without solvent trap. Sample loaded with a narrow pipette and without pre-shear.
0 200 400 600 800 1000 1200 14001
10
100
1000
G' G''
Time (s)
G' (
Pa
)
1
10
100
1000
G'' (P
a)
If the sample is loaded with spatula, to try to avoid the destruction of the
sample, and without making pre-shear, it is observed in figure 3.8 that the
sample is destroyed to a lesser extent.
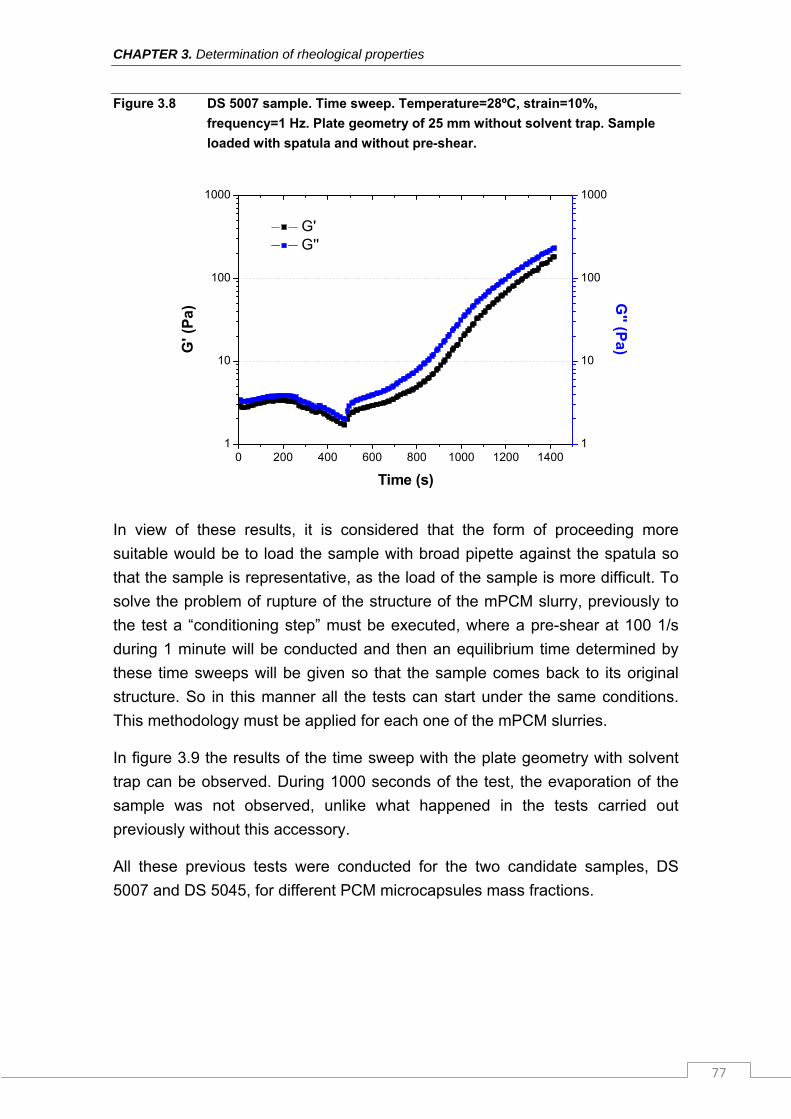
CHAPTER 3. Determination of rheological properties
77
Figure 3.8 DS 5007 sample. Time sweep. Temperature=28ºC, strain=10%,
frequency=1 Hz. Plate geometry of 25 mm without solvent trap. Sample
loaded with spatula and without pre-shear.
0 200 400 600 800 1000 1200 14001
10
100
1000
G' G''
Time (s)
G' (
Pa
)
1
10
100
1000
G'' (P
a)
In view of these results, it is considered that the form of proceeding more
suitable would be to load the sample with broad pipette against the spatula so
that the sample is representative, as the load of the sample is more difficult. To
solve the problem of rupture of the structure of the mPCM slurry, previously to
the test a “conditioning step” must be executed, where a pre-shear at 100 1/s
during 1 minute will be conducted and then an equilibrium time determined by
these time sweeps will be given so that the sample comes back to its original
structure. So in this manner all the tests can start under the same conditions.
This methodology must be applied for each one of the mPCM slurries.
In figure 3.9 the results of the time sweep with the plate geometry with solvent
trap can be observed. During 1000 seconds of the test, the evaporation of the
sample was not observed, unlike what happened in the tests carried out
previously without this accessory.
All these previous tests were conducted for the two candidate samples, DS
5007 and DS 5045, for different PCM microcapsules mass fractions.
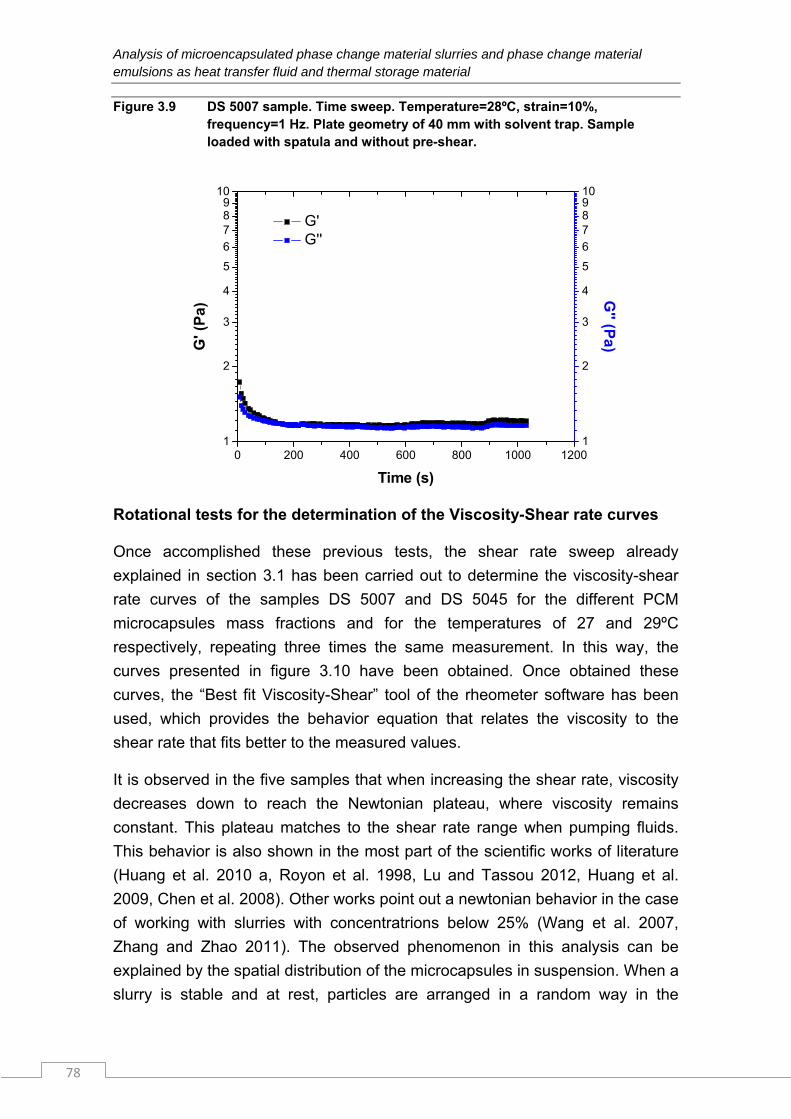
Analysis of microencapsulated phase change material slurries and phase change material emulsions as heat transfer fluid and thermal storage material
78
Figure 3.9 DS 5007 sample. Time sweep. Temperature=28ºC, strain=10%, frequency=1 Hz. Plate geometry of 40 mm with solvent trap. Sample loaded with spatula and without pre-shear.
0 200 400 600 800 1000 12001
2
3
4
5
6
789
10
G' G''
Time (s)
G' (
Pa)
1
2
3
4
5
6
78910
G'' (P
a)
Rotational tests for the determination of the Viscosity-Shear rate curves
Once accomplished these previous tests, the shear rate sweep already
explained in section 3.1 has been carried out to determine the viscosity-shear
rate curves of the samples DS 5007 and DS 5045 for the different PCM
microcapsules mass fractions and for the temperatures of 27 and 29ºC
respectively, repeating three times the same measurement. In this way, the
curves presented in figure 3.10 have been obtained. Once obtained these
curves, the “Best fit Viscosity-Shear” tool of the rheometer software has been
used, which provides the behavior equation that relates the viscosity to the
shear rate that fits better to the measured values.
It is observed in the five samples that when increasing the shear rate, viscosity
decreases down to reach the Newtonian plateau, where viscosity remains
constant. This plateau matches to the shear rate range when pumping fluids.
This behavior is also shown in the most part of the scientific works of literature
(Huang et al. 2010 a, Royon et al. 1998, Lu and Tassou 2012, Huang et al.
2009, Chen et al. 2008). Other works point out a newtonian behavior in the case
of working with slurries with concentratrions below 25% (Wang et al. 2007,
Zhang and Zhao 2011). The observed phenomenon in this analysis can be
explained by the spatial distribution of the microcapsules in suspension. When a
slurry is stable and at rest, particles are arranged in a random way in the
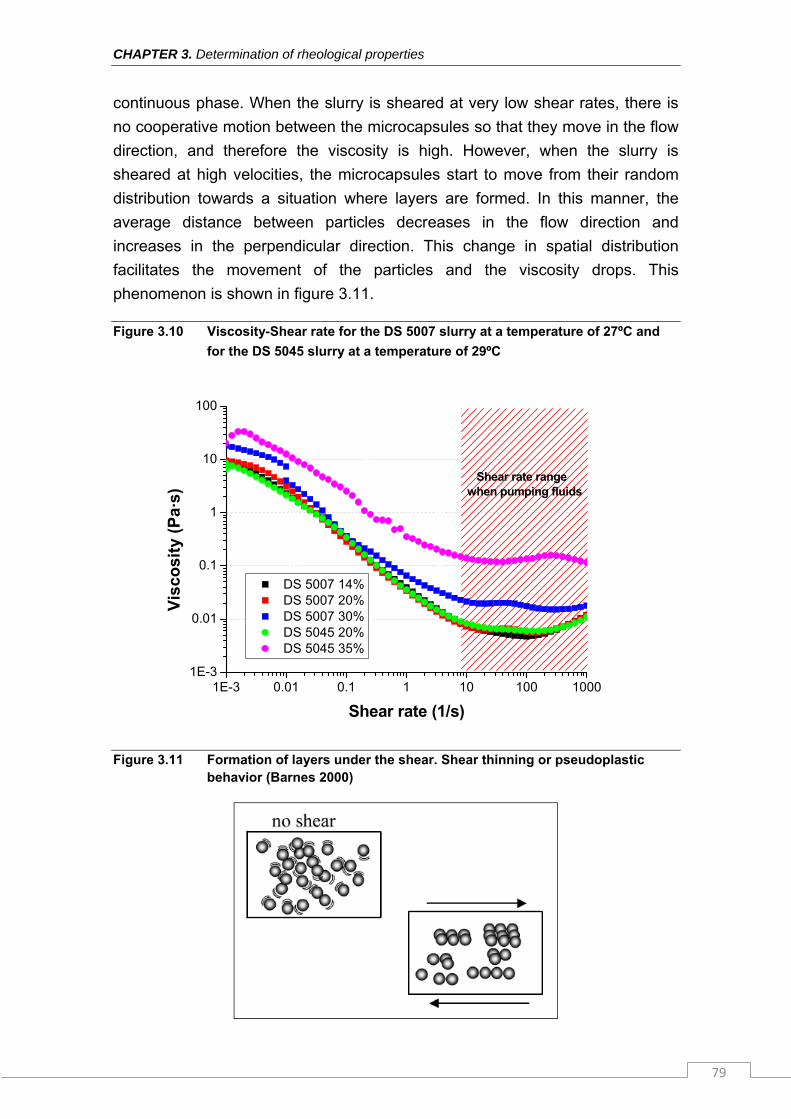
CHAPTER 3. Determination of rheological properties
79
continuous phase. When the slurry is sheared at very low shear rates, there is
no cooperative motion between the microcapsules so that they move in the flow
direction, and therefore the viscosity is high. However, when the slurry is
sheared at high velocities, the microcapsules start to move from their random
distribution towards a situation where layers are formed. In this manner, the
average distance between particles decreases in the flow direction and
increases in the perpendicular direction. This change in spatial distribution
facilitates the movement of the particles and the viscosity drops. This
phenomenon is shown in figure 3.11.
Figure 3.10 Viscosity-Shear rate for the DS 5007 slurry at a temperature of 27ºC and
for the DS 5045 slurry at a temperature of 29ºC
1E-3 0.01 0.1 1 10 100 10001E-3
0.01
0.1
1
10
100
DS 5007 14% DS 5007 20% DS 5007 30% DS 5045 20% DS 5045 35%
Vis
cosi
ty (
Pa·
s)
Shear rate (1/s)
Shear rate range when pumping fluids
Figure 3.11 Formation of layers under the shear. Shear thinning or pseudoplastic behavior (Barnes 2000)
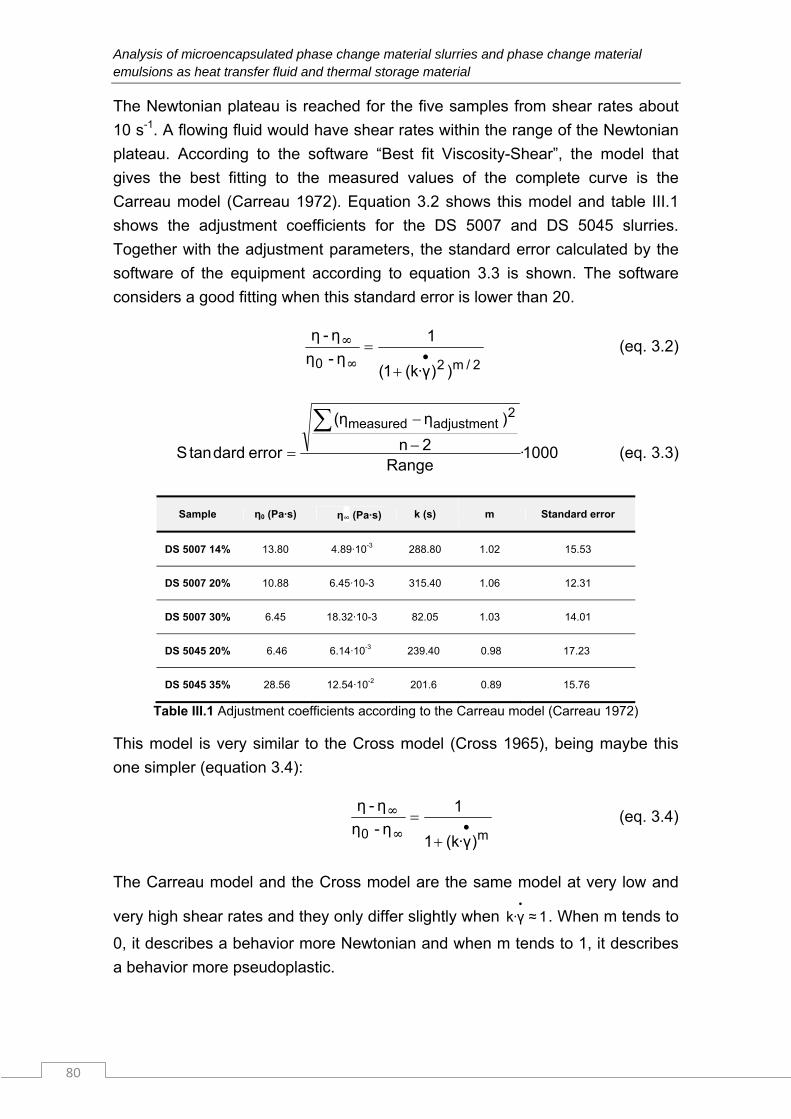
Analysis of microencapsulated phase change material slurries and phase change material emulsions as heat transfer fluid and thermal storage material
80
The Newtonian plateau is reached for the five samples from shear rates about
10 s-1. A flowing fluid would have shear rates within the range of the Newtonian
plateau. According to the software “Best fit Viscosity-Shear”, the model that
gives the best fitting to the measured values of the complete curve is the
Carreau model (Carreau 1972). Equation 3.2 shows this model and table III.1
shows the adjustment coefficients for the DS 5007 and DS 5045 slurries.
Together with the adjustment parameters, the standard error calculated by the
software of the equipment according to equation 3.3 is shown. The software
considers a good fitting when this standard error is lower than 20.
221
1
/m0 ))γ·k((η-η
η-η
∞
∞ (eq. 3.2)
10002
2
·Range
n
)ηη(
errordardtanS
adjustmentmeasured
(eq. 3.3)
Sample η0 (Pa·s) η∞ (Pa·s) k (s) m Standard error
DS 5007 14% 13.80 4.89·10-3 288.80 1.02 15.53
DS 5007 20% 10.88 6.45·10-3 315.40 1.06 12.31
DS 5007 30% 6.45 18.32·10-3 82.05 1.03 14.01
DS 5045 20% 6.46 6.14·10-3 239.40 0.98 17.23
DS 5045 35% 28.56 12.54·10-2 201.6 0.89 15.76
Table III.1 Adjustment coefficients according to the Carreau model (Carreau 1972)
This model is very similar to the Cross model (Cross 1965), being maybe this
one simpler (equation 3.4):
m0 )γ·k(η-η
η-η
1
1
∞
∞ (eq. 3.4)
The Carreau model and the Cross model are the same model at very low and
very high shear rates and they only differ slightly when 1≈γ·k•
. When m tends to
0, it describes a behavior more Newtonian and when m tends to 1, it describes
a behavior more pseudoplastic.
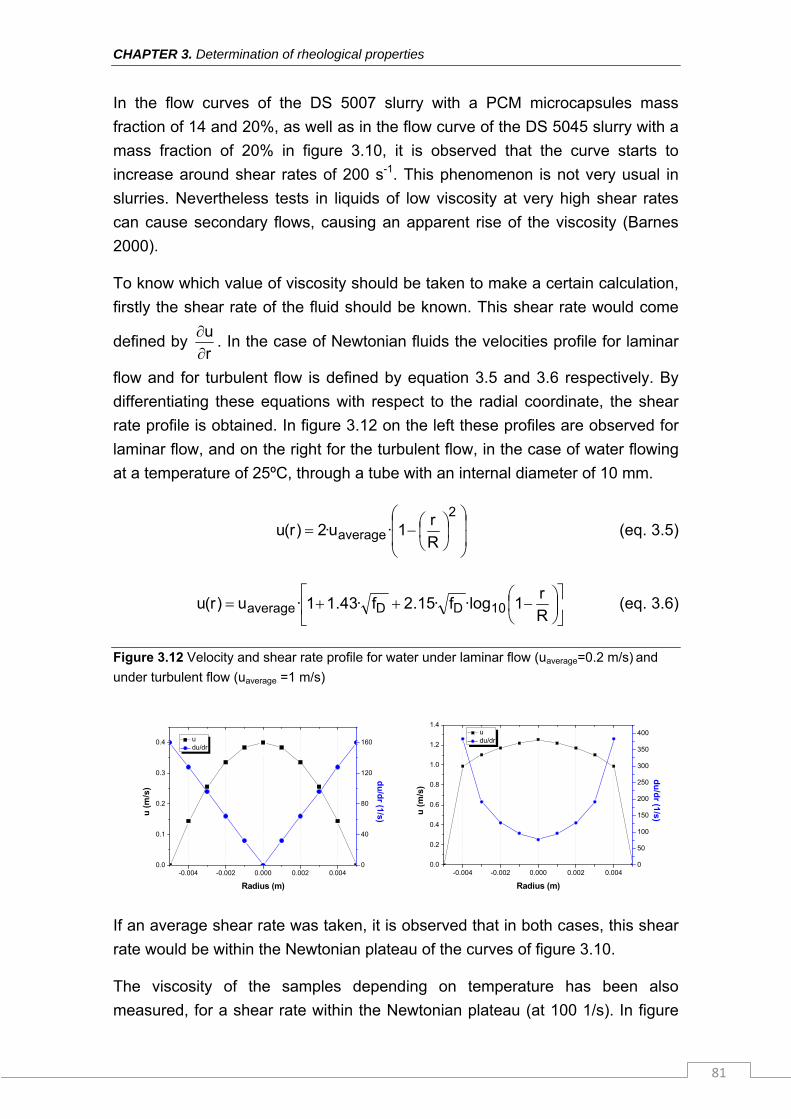
CHAPTER 3. Determination of rheological properties
81
In the flow curves of the DS 5007 slurry with a PCM microcapsules mass
fraction of 14 and 20%, as well as in the flow curve of the DS 5045 slurry with a
mass fraction of 20% in figure 3.10, it is observed that the curve starts to
increase around shear rates of 200 s-1. This phenomenon is not very usual in
slurries. Nevertheless tests in liquids of low viscosity at very high shear rates
can cause secondary flows, causing an apparent rise of the viscosity (Barnes
2000).
To know which value of viscosity should be taken to make a certain calculation,
firstly the shear rate of the fluid should be known. This shear rate would come
defined by ru
. In the case of Newtonian fluids the velocities profile for laminar
flow and for turbulent flow is defined by equation 3.5 and 3.6 respectively. By
differentiating these equations with respect to the radial coordinate, the shear
rate profile is obtained. In figure 3.12 on the left these profiles are observed for
laminar flow, and on the right for the turbulent flow, in the case of water flowing
at a temperature of 25ºC, through a tube with an internal diameter of 10 mm.
2
12R
r·u·)r(u average (eq. 3.5)
R
r·logf·.f·.·u)r(u DDaverage 11524311 10 (eq. 3.6)
Figure 3.12 Velocity and shear rate profile for water under laminar flow (uaverage=0.2 m/s) and
under turbulent flow (uaverage =1 m/s)
-0.004 -0.002 0.000 0.002 0.0040.0
0.1
0.2
0.3
0.4 u du/dr
Radius (m)
u (
m/s
)
0
40
80
120
160
du
/dr (1/s)
-0.004 -0.002 0.000 0.002 0.0040.0
0.2
0.4
0.6
0.8
1.0
1.2
1.4 u du/dr
Radius (m)
u (
m/s
)
0
50
100
150
200
250
300
350
400
du
/dr (1/s)
If an average shear rate was taken, it is observed that in both cases, this shear
rate would be within the Newtonian plateau of the curves of figure 3.10.
The viscosity of the samples depending on temperature has been also
measured, for a shear rate within the Newtonian plateau (at 100 1/s). In figure
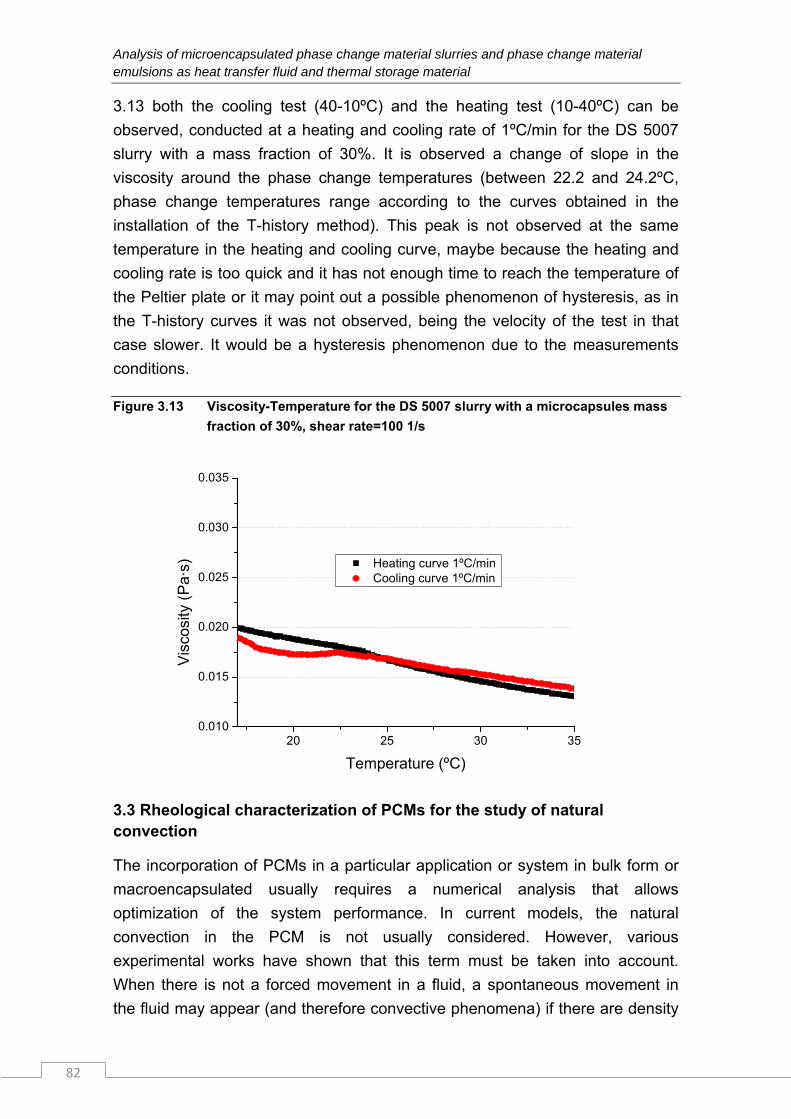
Analysis of microencapsulated phase change material slurries and phase change material emulsions as heat transfer fluid and thermal storage material
82
3.13 both the cooling test (40-10ºC) and the heating test (10-40ºC) can be
observed, conducted at a heating and cooling rate of 1ºC/min for the DS 5007
slurry with a mass fraction of 30%. It is observed a change of slope in the
viscosity around the phase change temperatures (between 22.2 and 24.2ºC,
phase change temperatures range according to the curves obtained in the
installation of the T-history method). This peak is not observed at the same
temperature in the heating and cooling curve, maybe because the heating and
cooling rate is too quick and it has not enough time to reach the temperature of
the Peltier plate or it may point out a possible phenomenon of hysteresis, as in
the T-history curves it was not observed, being the velocity of the test in that
case slower. It would be a hysteresis phenomenon due to the measurements
conditions.
Figure 3.13 Viscosity-Temperature for the DS 5007 slurry with a microcapsules mass
fraction of 30%, shear rate=100 1/s
20 25 30 350.010
0.015
0.020
0.025
0.030
0.035
Heating curve 1ºC/min Cooling curve 1ºC/min
Vis
cosi
ty (
Pa·
s)
Temperature (ºC)
3.3 Rheological characterization of PCMs for the study of natural convection
The incorporation of PCMs in a particular application or system in bulk form or
macroencapsulated usually requires a numerical analysis that allows
optimization of the system performance. In current models, the natural
convection in the PCM is not usually considered. However, various
experimental works have shown that this term must be taken into account.
When there is not a forced movement in a fluid, a spontaneous movement in
the fluid may appear (and therefore convective phenomena) if there are density
CHAPTER 3. Determination of rheological properties
83
gradients (due to temperatures gradients) under a gravitational field. Apart from
the buoyancy forces, this convective phenomenon called natural convection will
depend on viscous forces, which will prevent that movement. For this reason,
the determination of the viscosity property is relevant.
In TES systems, where PCM is in bulk form or macroencapsulated (no forced
movement of the PCM), the natural convection could take place in the liquid
phase or during the transition. Natural convection will be more relevant in the
melted phase than in the melting phase, due to the increasing values of
viscosity during the phase transition.
More specifically in macroencapsulated PCM or in the bulk PCM, during
melting, heat is transferred to the PCM first by conduction, and later by natural
convection, because the thickness of the liquid region increases near the heat
transfer surface. Due to the lower themal conductivity of liquid PCM in
comparison to solid PCM, the heat transfer by conduction almost becomes
negligible when the melting continues, dominating the natural convection in the
liquid phase. On the other hand, during solidification, the heat transfer
phenomenon is dominated by conduction. In this case, natural convection is
important at the beginning and as the time goes, natural convection become
almost zero compared to the conduction. The review of Jegadheeswaran and
Pohekar (2009) and the chapter 4 of the doctoral thesis of Campos (2012)
compile many experimental references that prove this phenomenon of natural
convection in latent thermal energy storage systems.
In view of the presence of the natural convection phenomenon in TES systems
with PCM, and the dependence of the natural convection on the viscosity, this
property should be measured. How accurate the viscosity must be determined,
it will depend on the error that we want to assume in our response of interest (in
this case, the effect of natural convection) and on the specific application
(boundary conditions, operation…). In general, once established the response
of interest and the error to assume, the precision of this property could be
determined according to an uncertainty analysis (Dolado 2011).
Arkar and Medved (2005) pointed out the importance of determining PCM
properties. They compared the results of their numerical model with
experimental results. The comparison confirmed their hypothesis of the
importance of the role played by the thermal properties of the PCM, especially
in slow running processes. Specifically, they studied the influence of the Heat
Analysis of microencapsulated phase change material slurries and phase change material emulsions as heat transfer fluid and thermal storage material
84
capacity-Temperature curve obtained with a DSC for different heating and
cooling rates on the results of a TES system with PCM spheres.
The first studies to take natural convection into account were those of Sparrow
et al. (1978) and Bathelt et al. (1979). To simulate this heat transfer mechanism,
some authors (Farid y Husian 1990, Farid et al. 1998, Rieger et al. 1983)
considered an effective thermal conductivity (equation 3.7), whose value will
depend on the viscosity property:
ne Ra·cλ
λ (eq. 3.7)
Costa et al. (1991) studied numerically the thermal behavior of three PCMs, a
paraffin (octadecane) and two metals, confined in a rectangular domain where
the natural convection in the fluid and the conduction in the solid were both
considered. In the case of the octadecane, the authors pointed out a bad fitting
with the experimental results in the upper part. The PCM started to melt at the
sides. This melted PCM occupied the upper part of the rectangular domain as a
consequence of its lower density, the melting in this zone being faster. The
authors think that the discrepancies between the theoretical and experimental
results were caused by thermal inertias, systems instabilities, thermal losses,
lack of reliable information about the physical properties of the materials, 3D
behavior, consideration of constant thermophysical properties, density
variations, high calculation time and an important change in the viscosity with
the temperature. The same authors in a later publication (Costa et al. 1997)
observed discrepancies between their numerical solution and experimental
results. These discrepancies could be attributed to the viscosity value taken in
the numerical simulation, a constant value of 0.003898 Pa·s. To check its
influence, they took the value of viscosity at a higher temperature. The change
in the viscosity value caused differences in the melting front. However, the
variation of viscosity with temperature did not explain other differences.
Due to the dependence of viscosity on natural convection, it is therefore
necessary to determine rheological behavior, and specifically the viscosity
property dependent on the temperature and even in the phase transition, in
order to incorporate these data in natural convection simulations.
However, there are few reported studies about the rheological properties of
PCMs. In fact, a recent review about the methods of characterization of PCMs,
accomplished in the field of the COST Action TU 0802, proves that there is a
CHAPTER 3. Determination of rheological properties
85
lack of researchers working in the rheological behavior of PCMs within this
framework.
Tipvarakarnkoon et al. (2008) analyzed the rheological properties of three
commercial coconut fats and undertook a structure analysis during their solid-
liquid and liquid-solid phase transition. They obtained flow curves (viscosity vs.
shear rate) in the liquid phase, using a double gap rotational cylinder. The shear
rate was increased from 100 to 1500 1/s in 2 minutes and then decreased from
1500 to 100 1/s in 2 minutes. To evaluate the phase transition, the G’ and G’’
modulus were obtained from oscillatory tests. Specifically, stepwise temperature
sweeps were carried out with a cooling rate of 0.5 K/min. Values of tan
G’’/G’>>1 corresponded with the liquid phase, values of tan G’’/G’<<1
corresponded with the solid phase and values of tan G’’/G’=1 corresponded
with the phase transition.
The work presented in this section 3.3 is part of the COST Action TU0802 (Next
generation cost effective phase change materials for increased energy
efficiency in renewable energy systems in buildings). One of the objectives of
this action is to develop standardized methodologies to characterize PCM, in
which the importance of rheology for PCM is also identified. This work also
represents a contribution to Task 42-Annex 24 of the International Energy
Agency (IEA). Specifically, it is included within the development of measuring
and testing procedures to characterize new storage materials reliably and
reproducibly. The aim of the work presented here is to develop a measurement
procedure of the viscosity property. In Task 42-Annex 24, much work has
already been accomplished on the standardization procedure for Enthalpy-
Temperatures curves with DSC. Octadecane has been used for this, and is also
used here for viscosity property measurements.
Therefore, the objective of the tests that are going to be shown in the following
sections is to propose a test methodology, as well as suggestions of the test
conditions, that allow to characterize rheologically the PCM in a reproducible
way, obtaining reliable values of viscosity depending on the temperature in a
temperatures range close to the solid-liquid phase transition.
3.3.1 Materials and methodology
Materials
As it has just been mentioned, octadecane has been characterized, in spite of
the fact that the most part of comercial PCMs of organic nature are blend of
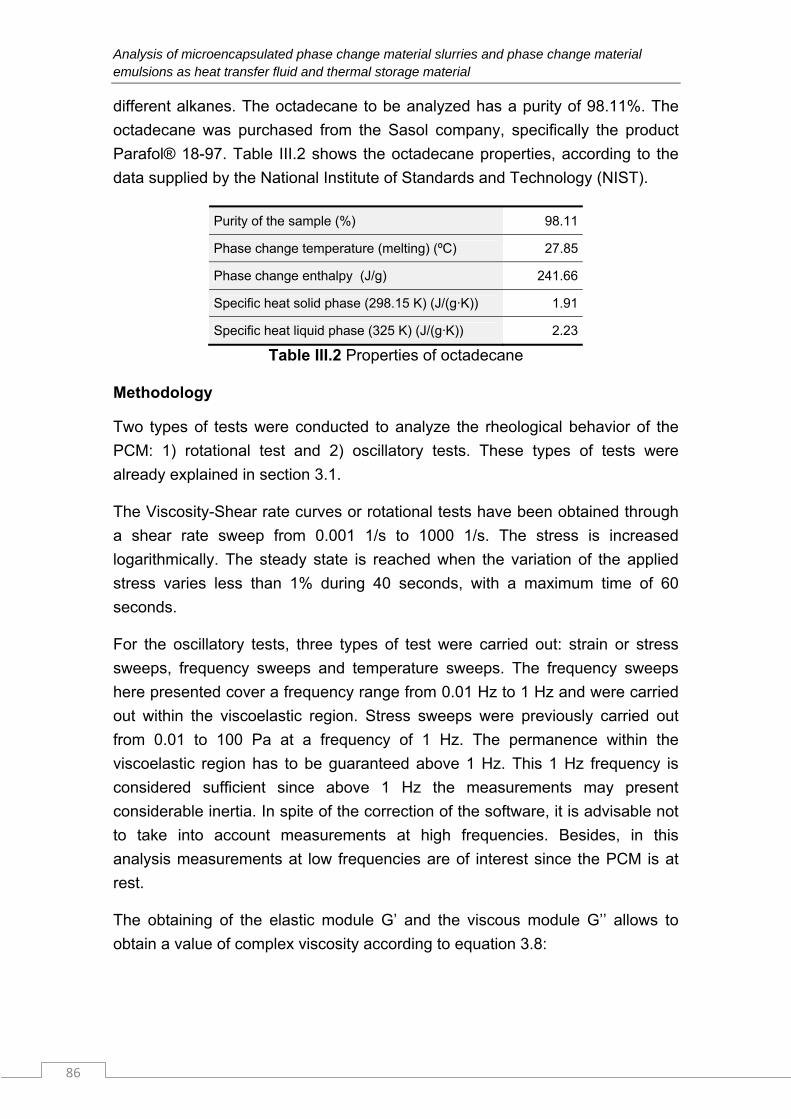
Analysis of microencapsulated phase change material slurries and phase change material emulsions as heat transfer fluid and thermal storage material
86
different alkanes. The octadecane to be analyzed has a purity of 98.11%. The
octadecane was purchased from the Sasol company, specifically the product
Parafol® 18-97. Table III.2 shows the octadecane properties, according to the
data supplied by the National Institute of Standards and Technology (NIST).
Purity of the sample (%) 98.11
Phase change temperature (melting) (ºC) 27.85
Phase change enthalpy (J/g) 241.66
Specific heat solid phase (298.15 K) (J/(g·K)) 1.91
Specific heat liquid phase (325 K) (J/(g·K)) 2.23
Table III.2 Properties of octadecane
Methodology
Two types of tests were conducted to analyze the rheological behavior of the
PCM: 1) rotational test and 2) oscillatory tests. These types of tests were
already explained in section 3.1.
The Viscosity-Shear rate curves or rotational tests have been obtained through
a shear rate sweep from 0.001 1/s to 1000 1/s. The stress is increased
logarithmically. The steady state is reached when the variation of the applied
stress varies less than 1% during 40 seconds, with a maximum time of 60
seconds.
For the oscillatory tests, three types of test were carried out: strain or stress
sweeps, frequency sweeps and temperature sweeps. The frequency sweeps
here presented cover a frequency range from 0.01 Hz to 1 Hz and were carried
out within the viscoelastic region. Stress sweeps were previously carried out
from 0.01 to 100 Pa at a frequency of 1 Hz. The permanence within the
viscoelastic region has to be guaranteed above 1 Hz. This 1 Hz frequency is
considered sufficient since above 1 Hz the measurements may present
considerable inertia. In spite of the correction of the software, it is advisable not
to take into account measurements at high frequencies. Besides, in this
analysis measurements at low frequencies are of interest since the PCM is at
rest.
The obtaining of the elastic module G’ and the viscous module G’’ allows to
obtain a value of complex viscosity according to equation 3.8:
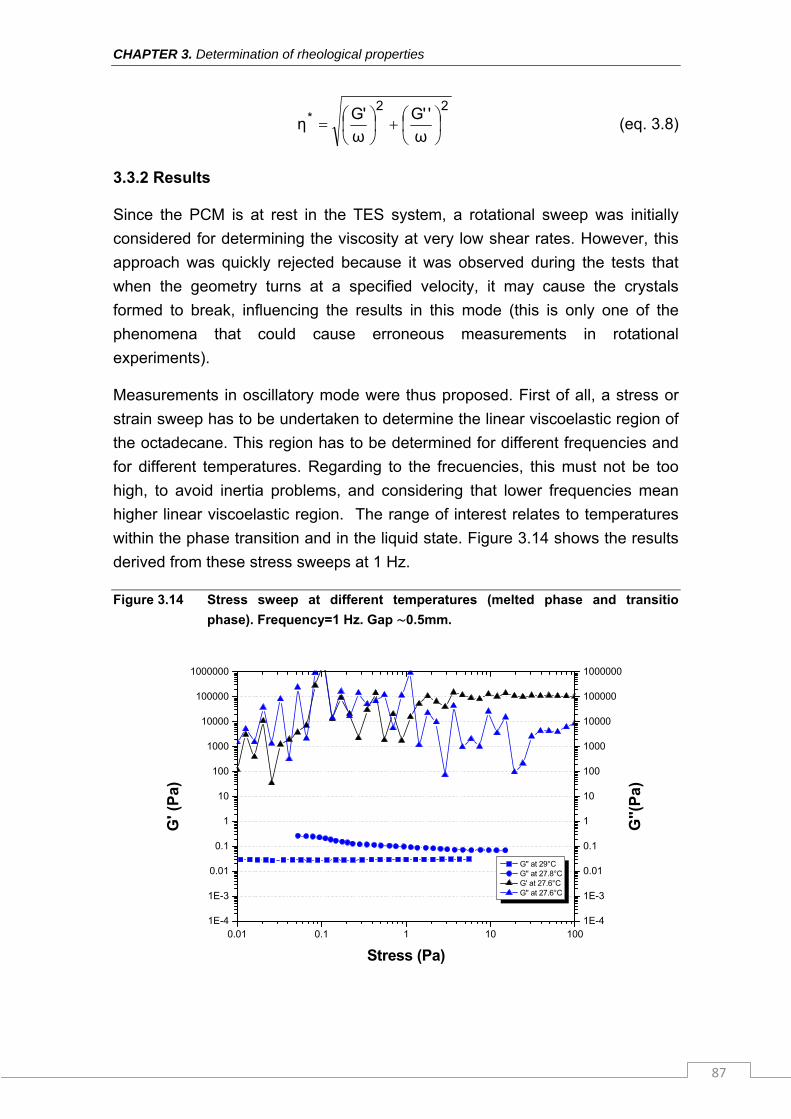
CHAPTER 3. Determination of rheological properties
87
22
ω
''G
ω
'Gη* (eq. 3.8)
3.3.2 Results
Since the PCM is at rest in the TES system, a rotational sweep was initially
considered for determining the viscosity at very low shear rates. However, this
approach was quickly rejected because it was observed during the tests that
when the geometry turns at a specified velocity, it may cause the crystals
formed to break, influencing the results in this mode (this is only one of the
phenomena that could cause erroneous measurements in rotational
experiments).
Measurements in oscillatory mode were thus proposed. First of all, a stress or
strain sweep has to be undertaken to determine the linear viscoelastic region of
the octadecane. This region has to be determined for different frequencies and
for different temperatures. Regarding to the frecuencies, this must not be too
high, to avoid inertia problems, and considering that lower frequencies mean
higher linear viscoelastic region. The range of interest relates to temperatures
within the phase transition and in the liquid state. Figure 3.14 shows the results
derived from these stress sweeps at 1 Hz.
Figure 3.14 Stress sweep at different temperatures (melted phase and transitio
phase). Frequency=1 Hz. Gap ∼0.5mm.
0.01 0.1 1 10 1001E-4
1E-3
0.01
0.1
1
10
100
1000
10000
100000
1000000
G'' at 29°C G'' at 27.8°C G' at 27.6°C G'' at 27.6°C
Stress (Pa)
G' (
Pa)
1E-4
1E-3
0.01
0.1
1
10
100
1000
10000
100000
1000000
G''(
Pa)
Analysis of microencapsulated phase change material slurries and phase change material emulsions as heat transfer fluid and thermal storage material
88
At 29°C and 27.8ºC the G’ module is not visible in the graph because the PCM
is completely melted and its elastic part is too low for the rheometer to obtain a
value. At 27.6°C (during the phase transition), it can observed that at very low
stresses (up to 1 Pa approximately) the measurements show considerable
noise. From liquid to solid, when the transition takes place, the material starts to
form molecular bonds, what it means an abrupt increase in the G’ module due
to the fast transition, leading to an increase in the complex viscosity (see figure
3.15 to support this fact). With high values of viscosity, low stresses will cause
even lower strains. These strain values that are going to be measured by the
sensor of the rheometer will be low, they might be close to the resolution of the
displacement sensor of the rheometer, 12 nrad in this case. If the values
obtained from measurement with low stresses are discarded, it can be seen that
the linear viscoelastic region reaches values up to 100 Pa.
Once the linear viscoelastic region was determined, the “oscillatory temperature
steps” procedure was carried out both for the melting curve and for the
solidification curve. The procedure was done using temperature steps of 0.1ºC.
Since the sample needs an equilibrium time to reach the Peltier plate
temperature, a stabilization time of 60 seconds was chosen. The sample was
loaded at its liquid phase. The gap, which is the distance between the Peltier
plate and the geometry, was adjusted so that the sample formed a meniscus.
Once the sample was placed between the Peltier plate and the geometry, the
value of the normal force present was fixed as a reference (contact force
exerted on the sample). When the PCM changed phase, the rheometer thus
adapted the gap between the Peltier plate and the geometry in such a way as to
maintain the same normal force value, since with the phase transition the
sample changes its volume and this would affect the normal force. For this
reason, plate geometry was chosen in order to be able to adapt the gap. Figure
3.15 shows the obtained results.
According to this graph, the octadecane changes from liquid to solid at 27.3-
27.4°C and from solid to liquid in the temperature range 27.6-28°C. Figure 3.16
shows how the rheometer changed the gap during the phase transition to
maintain the same normal force reference value.
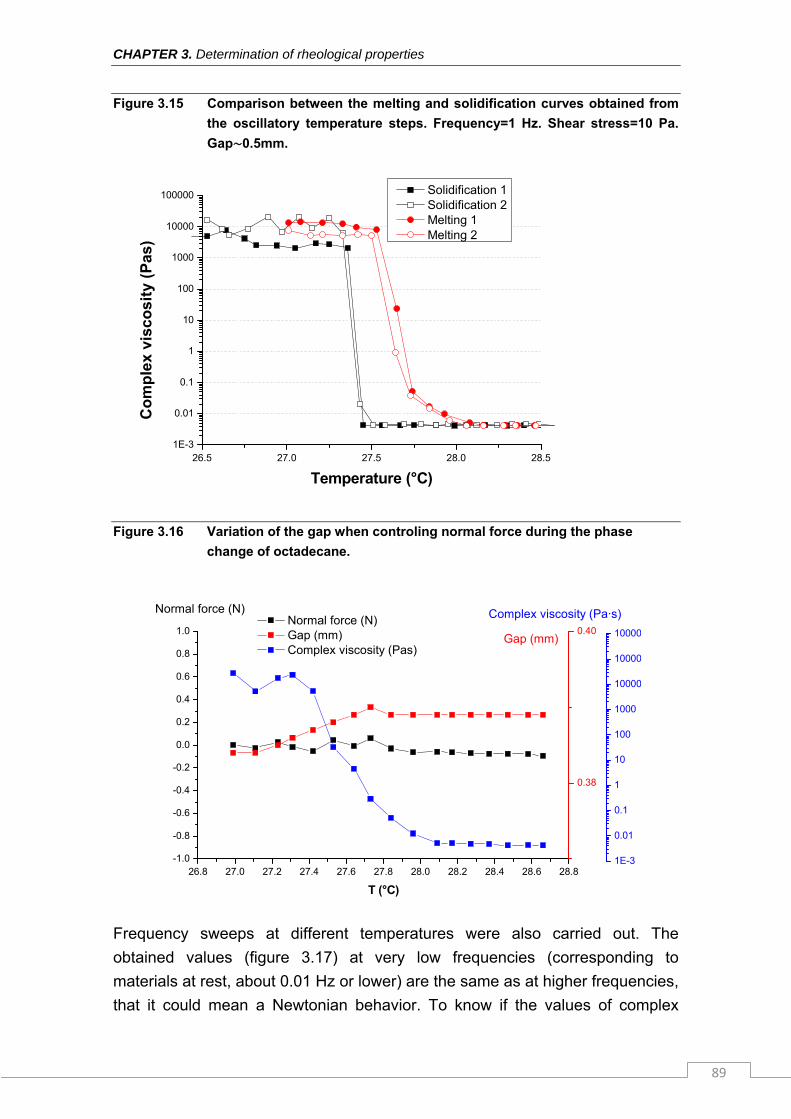
CHAPTER 3. Determination of rheological properties
89
Figure 3.15 Comparison between the melting and solidification curves obtained from
the oscillatory temperature steps. Frequency=1 Hz. Shear stress=10 Pa.
Gap∼0.5mm.
26.5 27.0 27.5 28.0 28.51E-3
0.01
0.1
1
10
100
1000
10000
100000
Co
mp
lex
visc
osi
ty (
Pas
)
Temperature (°C)
Solidification 1 Solidification 2 Melting 1 Melting 2
Figure 3.16 Variation of the gap when controling normal force during the phase
change of octadecane.
26.8 27.0 27.2 27.4 27.6 27.8 28.0 28.2 28.4 28.6 28.8-1.0
-0.8
-0.6
-0.4
-0.2
0.0
0.2
0.4
0.6
0.8
1.0
Normal force (N) Gap (mm) Complex viscosity (Pas)
T (°C)
0.38
0.40
1E-3
0.01
0.1
1
10
100
1000
10000
10000
10000
Normal force (N)
Gap (mm)
Complex viscosity (Pa·s)
Frequency sweeps at different temperatures were also carried out. The
obtained values (figure 3.17) at very low frequencies (corresponding to
materials at rest, about 0.01 Hz or lower) are the same as at higher frequencies,
that it could mean a Newtonian behavior. To know if the values of complex
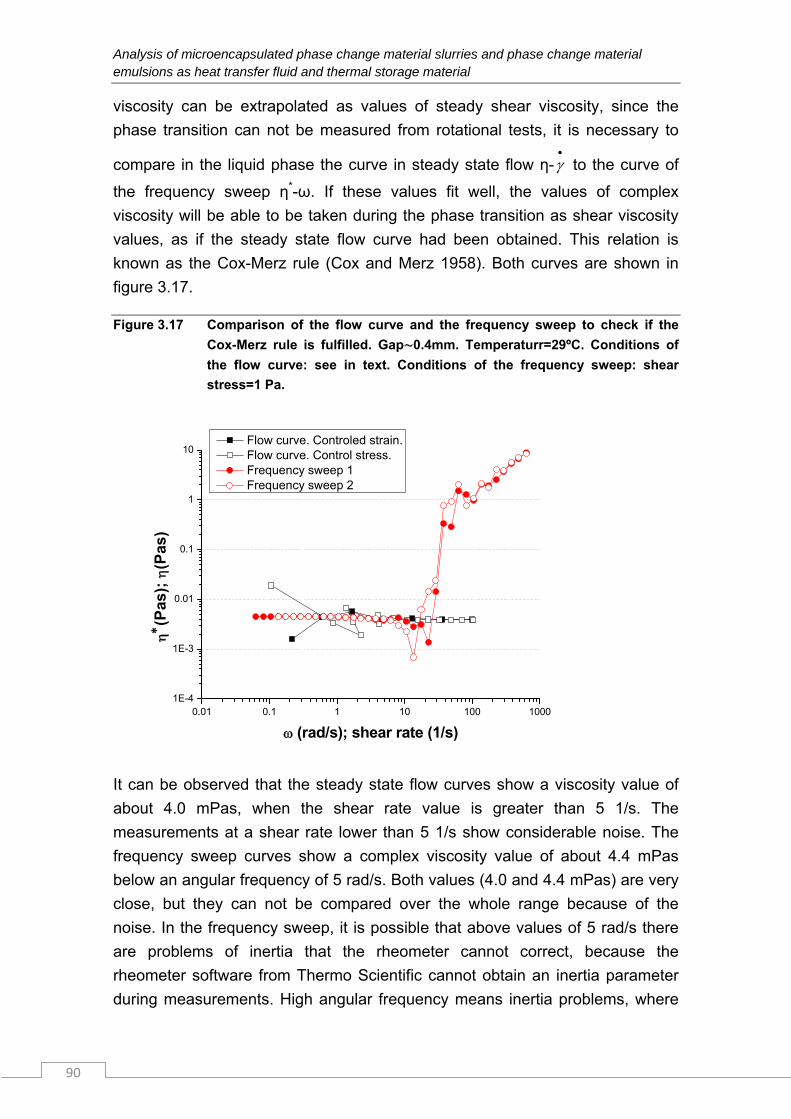
Analysis of microencapsulated phase change material slurries and phase change material emulsions as heat transfer fluid and thermal storage material
90
viscosity can be extrapolated as values of steady shear viscosity, since the
phase transition can not be measured from rotational tests, it is necessary to
compare in the liquid phase the curve in steady state flow η-
to the curve of
the frequency sweep η*-ω. If these values fit well, the values of complex
viscosity will be able to be taken during the phase transition as shear viscosity
values, as if the steady state flow curve had been obtained. This relation is
known as the Cox-Merz rule (Cox and Merz 1958). Both curves are shown in
figure 3.17.
Figure 3.17 Comparison of the flow curve and the frequency sweep to check if the
Cox-Merz rule is fulfilled. Gap∼0.4mm. Temperaturr=29ºC. Conditions of
the flow curve: see in text. Conditions of the frequency sweep: shear
stress=1 Pa.
0.01 0.1 1 10 100 10001E-4
1E-3
0.01
0.1
1
10
(
Pas
);
(Pas
)
(rad/s); shear rate (1/s)
Flow curve. Controled strain. Flow curve. Control stress. Frequency sweep 1 Frequency sweep 2
It can be observed that the steady state flow curves show a viscosity value of
about 4.0 mPas, when the shear rate value is greater than 5 1/s. The
measurements at a shear rate lower than 5 1/s show considerable noise. The
frequency sweep curves show a complex viscosity value of about 4.4 mPas
below an angular frequency of 5 rad/s. Both values (4.0 and 4.4 mPas) are very
close, but they can not be compared over the whole range because of the
noise. In the frequency sweep, it is possible that above values of 5 rad/s there
are problems of inertia that the rheometer cannot correct, because the
rheometer software from Thermo Scientific cannot obtain an inertia parameter
during measurements. High angular frequency means inertia problems, where
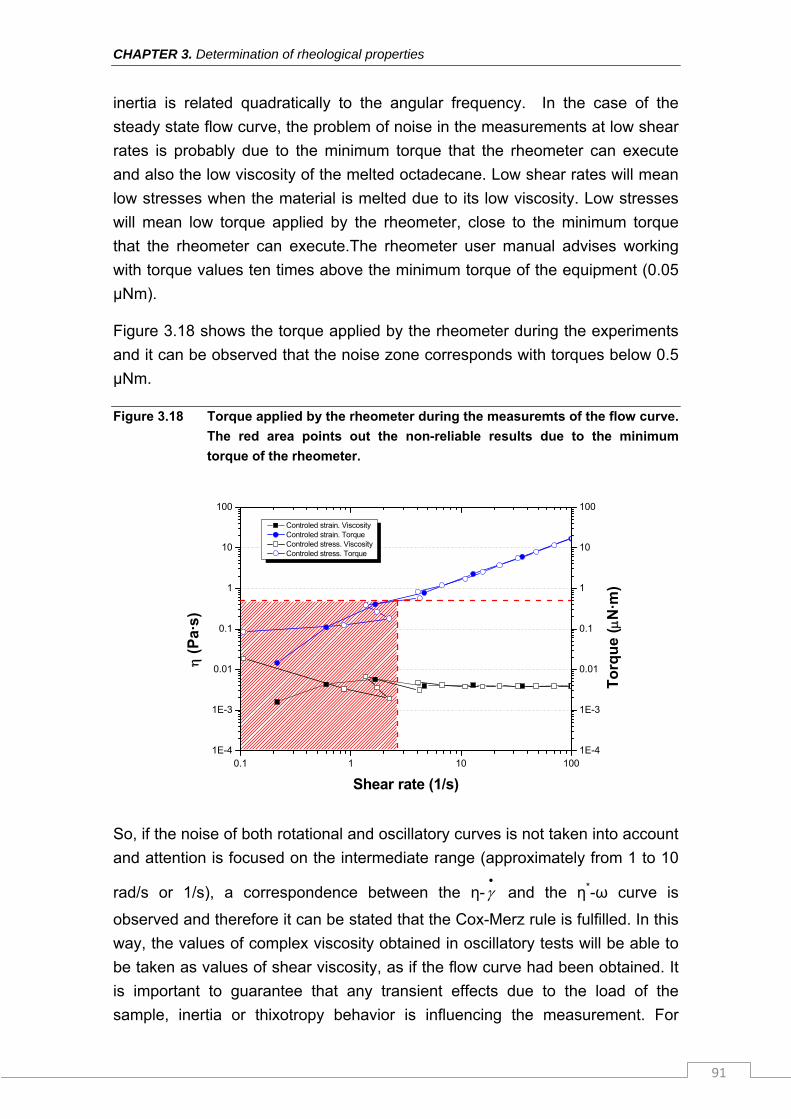
CHAPTER 3. Determination of rheological properties
91
inertia is related quadratically to the angular frequency. In the case of the
steady state flow curve, the problem of noise in the measurements at low shear
rates is probably due to the minimum torque that the rheometer can execute
and also the low viscosity of the melted octadecane. Low shear rates will mean
low stresses when the material is melted due to its low viscosity. Low stresses
will mean low torque applied by the rheometer, close to the minimum torque
that the rheometer can execute.The rheometer user manual advises working
with torque values ten times above the minimum torque of the equipment (0.05
µNm).
Figure 3.18 shows the torque applied by the rheometer during the experiments
and it can be observed that the noise zone corresponds with torques below 0.5
µNm.
Figure 3.18 Torque applied by the rheometer during the measuremts of the flow curve.
The red area points out the non-reliable results due to the minimum
torque of the rheometer.
0.1 1 10 1001E-4
1E-3
0.01
0.1
1
10
100
Controled strain. Viscosity Controled strain. Torque Controled stress. Viscosity Controled stress. Torque
Shear rate (1/s)
(
Pa·
s)
1E-4
1E-3
0.01
0.1
1
10
100
To
rqu
e (
N·m
)
So, if the noise of both rotational and oscillatory curves is not taken into account
and attention is focused on the intermediate range (approximately from 1 to 10
rad/s or 1/s), a correspondence between the η-
and the η*-ω curve is
observed and therefore it can be stated that the Cox-Merz rule is fulfilled. In this
way, the values of complex viscosity obtained in oscillatory tests will be able to
be taken as values of shear viscosity, as if the flow curve had been obtained. It
is important to guarantee that any transient effects due to the load of the
sample, inertia or thixotropy behavior is influencing the measurement. For
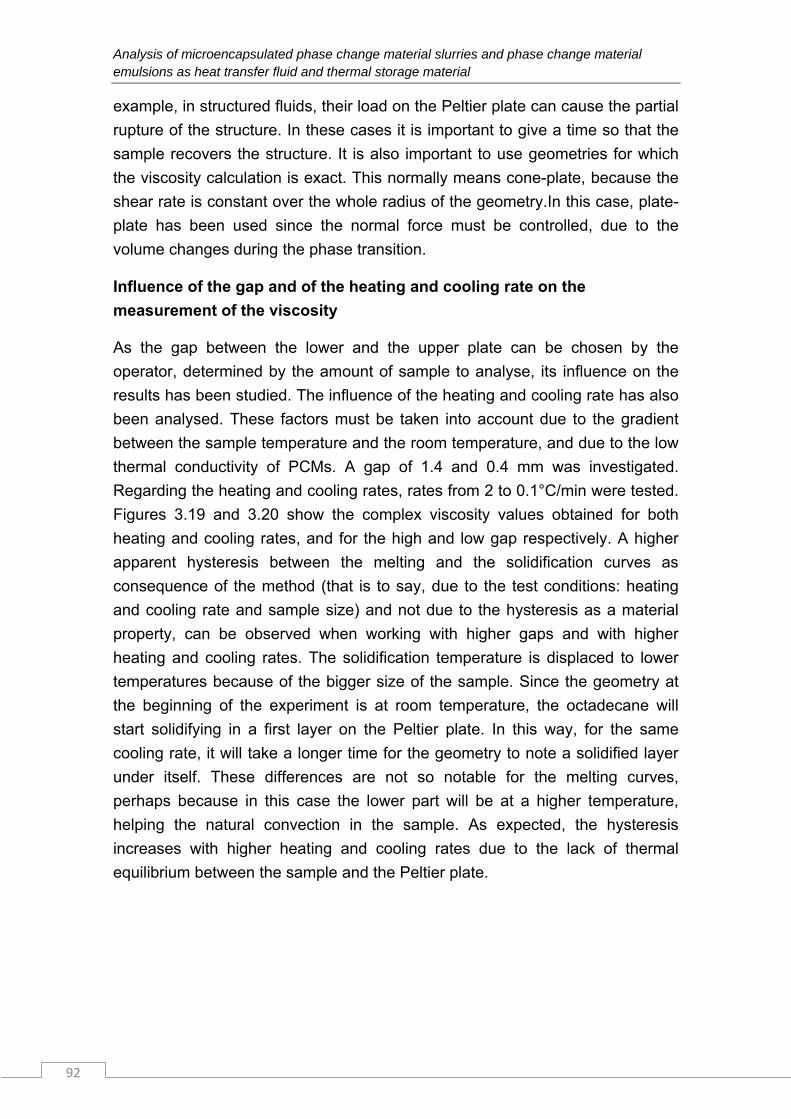
Analysis of microencapsulated phase change material slurries and phase change material emulsions as heat transfer fluid and thermal storage material
92
example, in structured fluids, their load on the Peltier plate can cause the partial
rupture of the structure. In these cases it is important to give a time so that the
sample recovers the structure. It is also important to use geometries for which
the viscosity calculation is exact. This normally means cone-plate, because the
shear rate is constant over the whole radius of the geometry.In this case, plate-
plate has been used since the normal force must be controlled, due to the
volume changes during the phase transition.
Influence of the gap and of the heating and cooling rate on the
measurement of the viscosity
As the gap between the lower and the upper plate can be chosen by the
operator, determined by the amount of sample to analyse, its influence on the
results has been studied. The influence of the heating and cooling rate has also
been analysed. These factors must be taken into account due to the gradient
between the sample temperature and the room temperature, and due to the low
thermal conductivity of PCMs. A gap of 1.4 and 0.4 mm was investigated.
Regarding the heating and cooling rates, rates from 2 to 0.1°C/min were tested.
Figures 3.19 and 3.20 show the complex viscosity values obtained for both
heating and cooling rates, and for the high and low gap respectively. A higher
apparent hysteresis between the melting and the solidification curves as
consequence of the method (that is to say, due to the test conditions: heating
and cooling rate and sample size) and not due to the hysteresis as a material
property, can be observed when working with higher gaps and with higher
heating and cooling rates. The solidification temperature is displaced to lower
temperatures because of the bigger size of the sample. Since the geometry at
the beginning of the experiment is at room temperature, the octadecane will
start solidifying in a first layer on the Peltier plate. In this way, for the same
cooling rate, it will take a longer time for the geometry to note a solidified layer
under itself. These differences are not so notable for the melting curves,
perhaps because in this case the lower part will be at a higher temperature,
helping the natural convection in the sample. As expected, the hysteresis
increases with higher heating and cooling rates due to the lack of thermal
equilibrium between the sample and the Peltier plate.
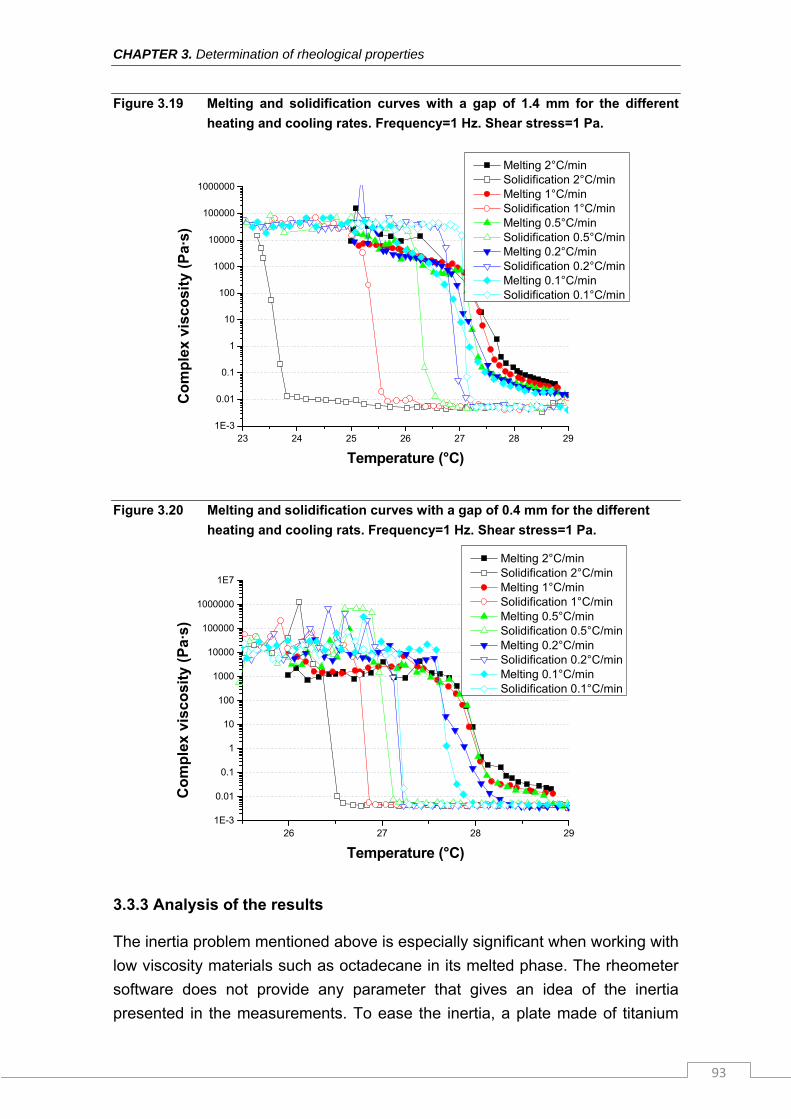
CHAPTER 3. Determination of rheological properties
93
Figure 3.19 Melting and solidification curves with a gap of 1.4 mm for the different
heating and cooling rates. Frequency=1 Hz. Shear stress=1 Pa.
23 24 25 26 27 28 291E-3
0.01
0.1
1
10
100
1000
10000
100000
1000000C
om
ple
x vi
sco
sity
(P
a·s)
Temperature (°C)
Melting 2°C/min Solidification 2°C/min Melting 1°C/min Solidification 1°C/min Melting 0.5°C/min Solidification 0.5°C/min Melting 0.2°C/min Solidification 0.2°C/min Melting 0.1°C/min Solidification 0.1°C/min
Figure 3.20 Melting and solidification curves with a gap of 0.4 mm for the different
heating and cooling rats. Frequency=1 Hz. Shear stress=1 Pa.
26 27 28 291E-3
0.01
0.1
1
10
100
1000
10000
100000
1000000
1E7
Co
mp
lex
visc
osi
ty (
Pa·
s)
Temperature (°C)
Melting 2°C/min Solidification 2°C/min Melting 1°C/min Solidification 1°C/min Melting 0.5°C/min Solidification 0.5°C/min Melting 0.2°C/min Solidification 0.2°C/min Melting 0.1°C/min Solidification 0.1°C/min
3.3.3 Analysis of the results
The inertia problem mentioned above is especially significant when working with
low viscosity materials such as octadecane in its melted phase. The rheometer
software does not provide any parameter that gives an idea of the inertia
presented in the measurements. To ease the inertia, a plate made of titanium
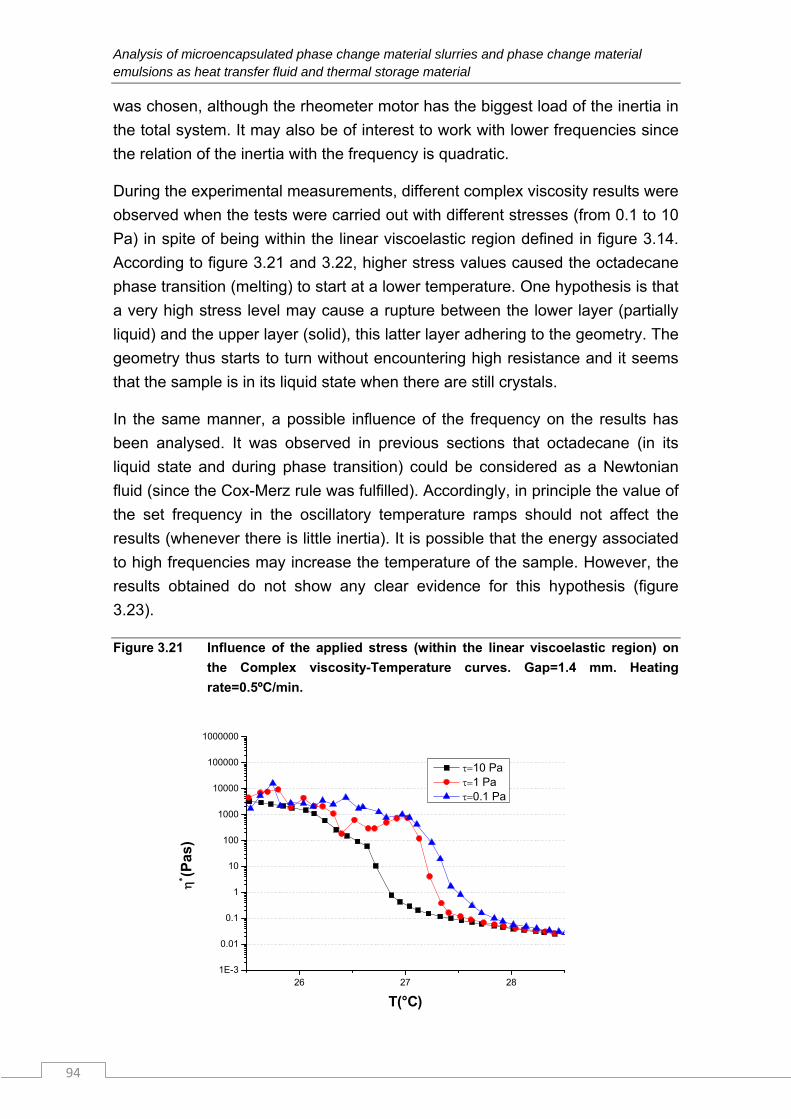
Analysis of microencapsulated phase change material slurries and phase change material emulsions as heat transfer fluid and thermal storage material
94
was chosen, although the rheometer motor has the biggest load of the inertia in
the total system. It may also be of interest to work with lower frequencies since
the relation of the inertia with the frequency is quadratic.
During the experimental measurements, different complex viscosity results were
observed when the tests were carried out with different stresses (from 0.1 to 10
Pa) in spite of being within the linear viscoelastic region defined in figure 3.14.
According to figure 3.21 and 3.22, higher stress values caused the octadecane
phase transition (melting) to start at a lower temperature. One hypothesis is that
a very high stress level may cause a rupture between the lower layer (partially
liquid) and the upper layer (solid), this latter layer adhering to the geometry. The
geometry thus starts to turn without encountering high resistance and it seems
that the sample is in its liquid state when there are still crystals.
In the same manner, a possible influence of the frequency on the results has
been analysed. It was observed in previous sections that octadecane (in its
liquid state and during phase transition) could be considered as a Newtonian
fluid (since the Cox-Merz rule was fulfilled). Accordingly, in principle the value of
the set frequency in the oscillatory temperature ramps should not affect the
results (whenever there is little inertia). It is possible that the energy associated
to high frequencies may increase the temperature of the sample. However, the
results obtained do not show any clear evidence for this hypothesis (figure
3.23).
Figure 3.21 Influence of the applied stress (within the linear viscoelastic region) on
the Complex viscosity-Temperature curves. Gap=1.4 mm. Heating
rate=0.5ºC/min.
26 27 281E-3
0.01
0.1
1
10
100
1000
10000
100000
1000000
(P
as)
T(°C)
10 Pa 1 Pa 0.1 Pa
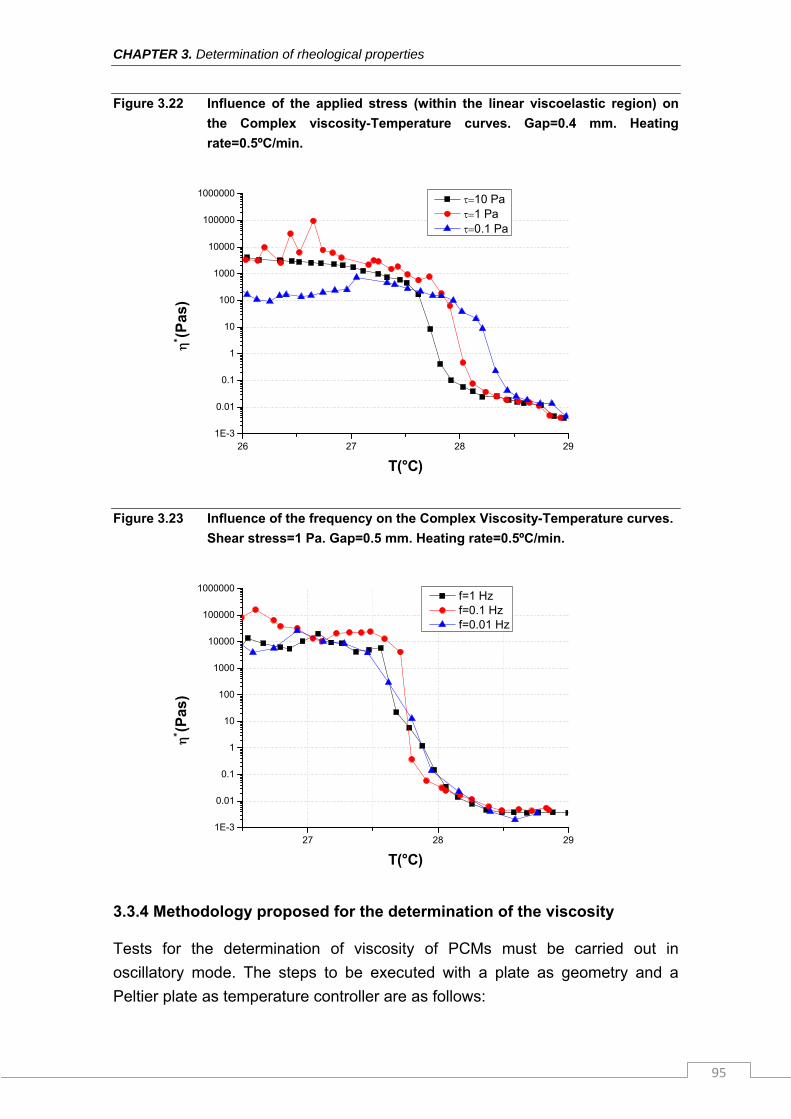
CHAPTER 3. Determination of rheological properties
95
Figure 3.22 Influence of the applied stress (within the linear viscoelastic region) on
the Complex viscosity-Temperature curves. Gap=0.4 mm. Heating
rate=0.5ºC/min.
26 27 28 291E-3
0.01
0.1
1
10
100
1000
10000
100000
1000000 (P
as)
T(°C)
10 Pa 1 Pa 0.1 Pa
Figure 3.23 Influence of the frequency on the Complex Viscosity-Temperature curves.
Shear stress=1 Pa. Gap=0.5 mm. Heating rate=0.5ºC/min.
27 28 291E-3
0.01
0.1
1
10
100
1000
10000
100000
1000000
(P
as)
T(°C)
f=1 Hz f=0.1 Hz f=0.01 Hz
3.3.4 Methodology proposed for the determination of the viscosity
Tests for the determination of viscosity of PCMs must be carried out in
oscillatory mode. The steps to be executed with a plate as geometry and a
Peltier plate as temperature controller are as follows:
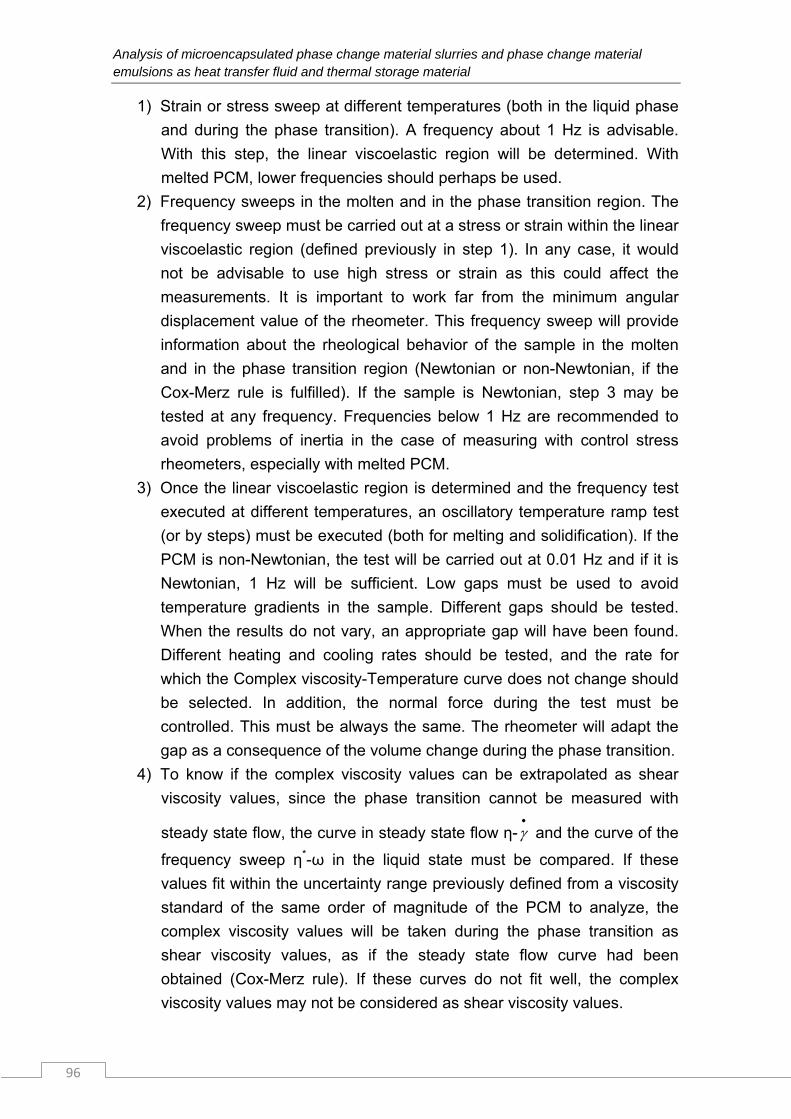
Analysis of microencapsulated phase change material slurries and phase change material emulsions as heat transfer fluid and thermal storage material
96
1) Strain or stress sweep at different temperatures (both in the liquid phase
and during the phase transition). A frequency about 1 Hz is advisable.
With this step, the linear viscoelastic region will be determined. With
melted PCM, lower frequencies should perhaps be used.
2) Frequency sweeps in the molten and in the phase transition region. The
frequency sweep must be carried out at a stress or strain within the linear
viscoelastic region (defined previously in step 1). In any case, it would
not be advisable to use high stress or strain as this could affect the
measurements. It is important to work far from the minimum angular
displacement value of the rheometer. This frequency sweep will provide
information about the rheological behavior of the sample in the molten
and in the phase transition region (Newtonian or non-Newtonian, if the
Cox-Merz rule is fulfilled). If the sample is Newtonian, step 3 may be
tested at any frequency. Frequencies below 1 Hz are recommended to
avoid problems of inertia in the case of measuring with control stress
rheometers, especially with melted PCM.
3) Once the linear viscoelastic region is determined and the frequency test
executed at different temperatures, an oscillatory temperature ramp test
(or by steps) must be executed (both for melting and solidification). If the
PCM is non-Newtonian, the test will be carried out at 0.01 Hz and if it is
Newtonian, 1 Hz will be sufficient. Low gaps must be used to avoid
temperature gradients in the sample. Different gaps should be tested.
When the results do not vary, an appropriate gap will have been found.
Different heating and cooling rates should be tested, and the rate for
which the Complex viscosity-Temperature curve does not change should
be selected. In addition, the normal force during the test must be
controlled. This must be always the same. The rheometer will adapt the
gap as a consequence of the volume change during the phase transition.
4) To know if the complex viscosity values can be extrapolated as shear
viscosity values, since the phase transition cannot be measured with
steady state flow, the curve in steady state flow η-
and the curve of the
frequency sweep η*-ω in the liquid state must be compared. If these
values fit within the uncertainty range previously defined from a viscosity
standard of the same order of magnitude of the PCM to analyze, the
complex viscosity values will be taken during the phase transition as
shear viscosity values, as if the steady state flow curve had been
obtained (Cox-Merz rule). If these curves do not fit well, the complex
viscosity values may not be considered as shear viscosity values.
CHAPTER 3. Determination of rheological properties
97
Notes about the methodology:
- The procedure described above is for working with plate geometry and a
Peltier controller. The plate is not necessarily the most appropriate geometry,
due to the shear gradient across the sample. However, a cone does not allow
the normal force to be controlled since the gap is set by the geometry itself.
Regarding the temperature controller, it would be interesting to use an
“environmental test chamber” in order to provide more realistic results for PCMs
with phase transition temperatures well above or below room temperature,
since this controller would avoid the temperature gradient in the sample.
However, the air flow in the test chamber can cause the melted PCM to leave
the geometry due to its low viscosity. Also, the problem may be solved with the
combination of a Peltier Plate and an upper heated plate.
- If the PCM during its phase transition or in its liquid phase is not a Newtonian
fluid, or if the measurements with the tested frequency present considerable
inertia, it is necessary to test the oscillatory temperature ramp at very low
frequencies, about 0.01 Hz (PCM at rest). The problem in this case is that the
rheometer needs at least one period to obtain a value of complex viscosity. If
the frequency is 0.01 Hz, the rheometer would need at least 100 seconds. If the
heating and cooling rate is, for example, 0.2°C/min, in these 100 seconds the
temperature will vary by about 0.34°C. The measurement would not therefore
be a correct measurement due to the inconstant temperature. In this case,
precise measurements at set temperatures should be carried out. For this
reason, a temperature steps procedure is considered to be better than a
temperature ramp.
3.4 Conclusions
3.4.1 Conclusions about the rheological characterization of
microencapsulated PCM slurries and PCM emulsions
The methodology and results of the rheological characterization of mPCM
slurries studied in the framework of this doctoral thesis by a control stress
rheometer has been presented. Besides the behavior models of these mPCM
slurries for different PCM microcapsules mass fraction have been obtained. As
example, it is mentioned that both slurries, DS 5007 and DS 5045, for a 20%
PCM microcapsule mass fraction, reach in their Newtonian plateau a viscosity
six times higher than of the water.

Analysis of microencapsulated phase change material slurries and phase change material emulsions as heat transfer fluid and thermal storage material
98
3.4.2 Conclusions about the rheological characterization of PCMs for the
study of natural convection
From the results obtained of the tests, a first approach of methodology has
been proposed for the measurement of viscosity of PCMs during its melted
phase and during the phase transition. These values will be able to be used in
numerical simulations of thermal energy storage systems with PCM, in the case
of that natural convection plays an important role in the heat transfer
phenomenon.
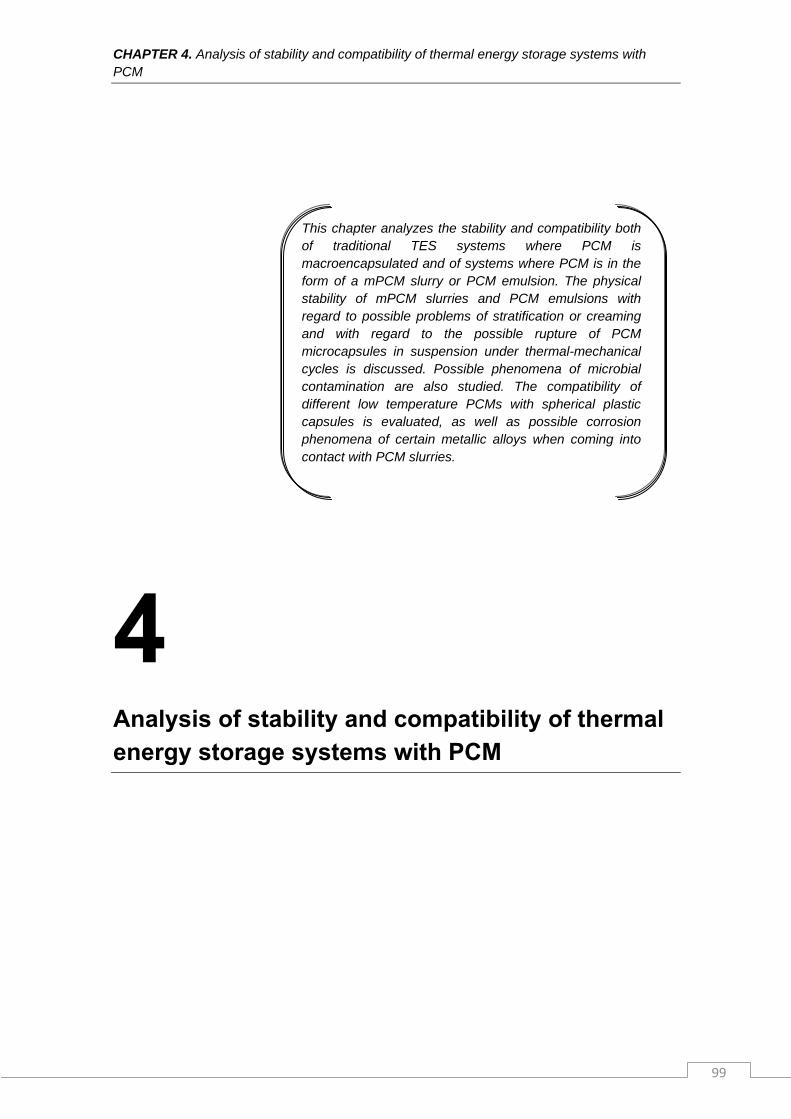
CHAPTER 4. Analysis of stability and compatibility of thermal energy storage systems with PCM
99
This chapter analyzes the stability and compatibility both of traditional TES systems where PCM is macroencapsulated and of systems where PCM is in the form of a mPCM slurry or PCM emulsion. The physical stability of mPCM slurries and PCM emulsions with regard to possible problems of stratification or creaming and with regard to the possible rupture of PCM microcapsules in suspension under thermal-mechanical cycles is discussed. Possible phenomena of microbial contamination are also studied. The compatibility of different low temperature PCMs with spherical plastic capsules is evaluated, as well as possible corrosion phenomena of certain metallic alloys when coming into contact with PCM slurries.
4 Analysis of stability and compatibility of thermal energy storage systems with PCM
Analysis of microencapsulated phase change material slurries and phase change material emulsions as heat transfer fluid and thermal storage material
100
4.1 Physical stability of microencapsulated PCM slurries and PCM
emulsions
4.1.1 Problems of stratification or creaming
As mentioned in the first chapter, one of the main issues to be tackled in mPCM
slurries and PCM emulsions is their lack of stability, since stratification or
creaming problems tend to occur. Stirring could be adopted as a solution to this
problem; however, this stirring could destroy the thermal stratification.
Generally, the destabilization process can take weeks and even months. To
predict the physical stability of PCM slurries without having to wait so long, a
methodology well known in the food and pharmaceutical field has been applied.
This methodology basically consists of measuring samples with a rheometer in
oscillatory mode. These measurements can be related to measurements
visually obtained of the destabilization process of creaming, specifically with the
creaming percentage over time. In this way, the dominant parameters relating to
destabilization can be obtained which manufacturers can modify in order to
improve the physical stability of PCM slurries, or to predict such destabilization
processes.
For this analysis, measurements in oscillatory mode were performed with the
control stress rheometer AR-G2 from TA Instruments whose characteristics
have been detailed in chapter 3. The theoretical basis of these measurements
has already been explained in section 3.1. The results of the oscillatory tests
can be related to the destabilization processes observed in the sample DS 5007
for different PCM microcapsule mass fractions. Specifically, it has been
attempted to relate these oscillatory results for the DS 5007 slurries with PCM
microcapsule mass fractions of 14, 20, 30 and 42% with the creaming height
observed in these samples in the course of time. To date, this study has not
been developed with the DS 5045 sample. Such a destabilization process was
not observed in this sample. It is suggested that such an analysis could be the
subject of future work since the results may be used to set objective parameters
for the sample to avoid destabilization processes.
Firstly, a strain sweep was carried out at a frequency of 1 Hz on each sample to
determine the linear viscoelastic region. The results are shown in figure 4.1.
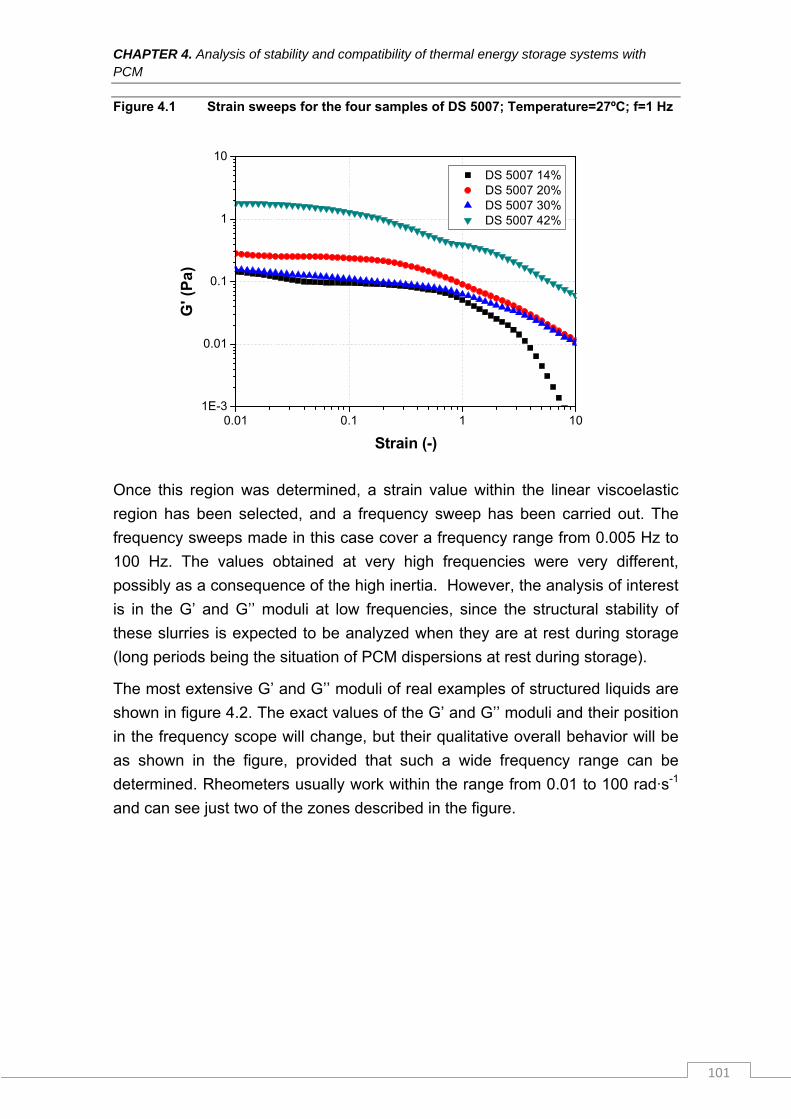
CHAPTER 4. Analysis of stability and compatibility of thermal energy storage systems with PCM
101
Figure 4.1 Strain sweeps for the four samples of DS 5007; Temperature=27ºC; f=1 Hz
0.01 0.1 1 101E-3
0.01
0.1
1
10
DS 5007 14% DS 5007 20% DS 5007 30% DS 5007 42%
G' (
Pa)
Strain (-)
Once this region was determined, a strain value within the linear viscoelastic
region has been selected, and a frequency sweep has been carried out. The
frequency sweeps made in this case cover a frequency range from 0.005 Hz to
100 Hz. The values obtained at very high frequencies were very different,
possibly as a consequence of the high inertia. However, the analysis of interest
is in the G’ and G’’ moduli at low frequencies, since the structural stability of
these slurries is expected to be analyzed when they are at rest during storage
(long periods being the situation of PCM dispersions at rest during storage).
The most extensive G’ and G’’ moduli of real examples of structured liquids are
shown in figure 4.2. The exact values of the G’ and G’’ moduli and their position
in the frequency scope will change, but their qualitative overall behavior will be
as shown in the figure, provided that such a wide frequency range can be
determined. Rheometers usually work within the range from 0.01 to 100 rad·s-1
and can see just two of the zones described in the figure.
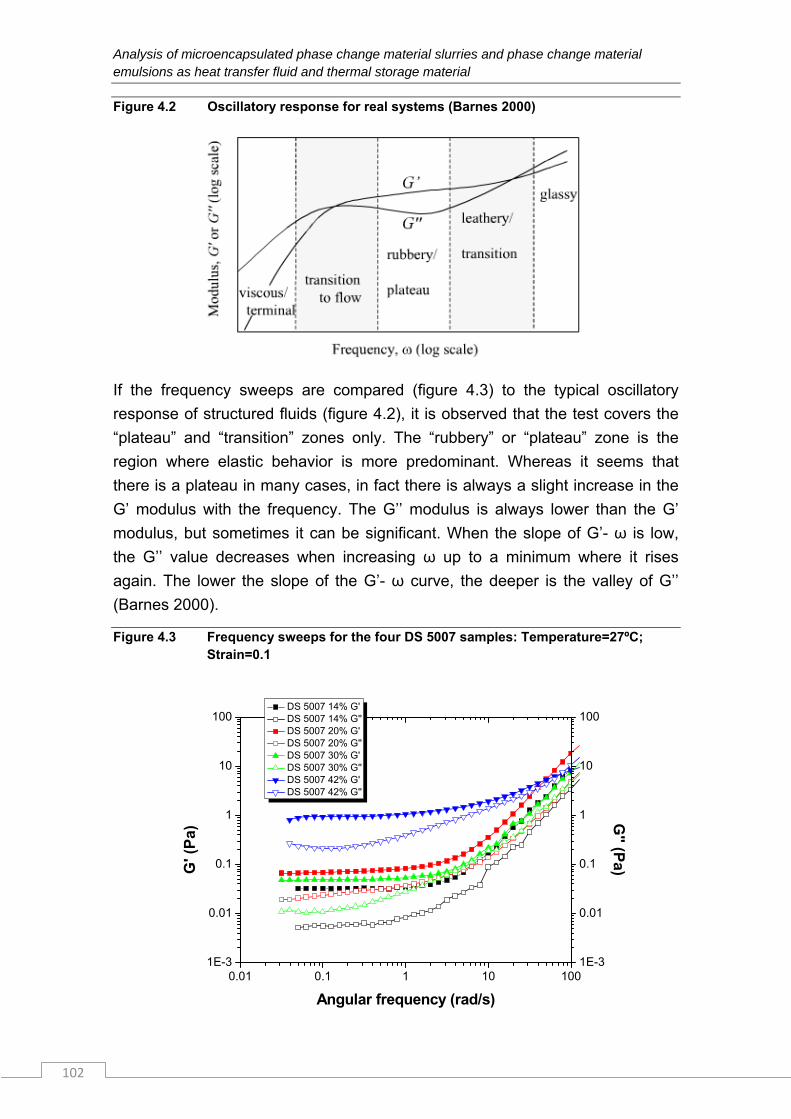
Analysis of microencapsulated phase change material slurries and phase change material emulsions as heat transfer fluid and thermal storage material
102
Figure 4.2 Oscillatory response for real systems (Barnes 2000)
If the frequency sweeps are compared (figure 4.3) to the typical oscillatory
response of structured fluids (figure 4.2), it is observed that the test covers the
“plateau” and “transition” zones only. The “rubbery” or “plateau” zone is the
region where elastic behavior is more predominant. Whereas it seems that
there is a plateau in many cases, in fact there is always a slight increase in the
G’ modulus with the frequency. The G’’ modulus is always lower than the G’
modulus, but sometimes it can be significant. When the slope of G’- ω is low,
the G’’ value decreases when increasing ω up to a minimum where it rises
again. The lower the slope of the G’- ω curve, the deeper is the valley of G’’
(Barnes 2000).
Figure 4.3 Frequency sweeps for the four DS 5007 samples: Temperature=27ºC; Strain=0.1
0.01 0.1 1 10 1001E-3
0.01
0.1
1
10
100 DS 5007 14% G' DS 5007 14% G'' DS 5007 20% G' DS 5007 20% G'' DS 5007 30% G' DS 5007 30% G'' DS 5007 42% G' DS 5007 42% G''
Angular frequency (rad/s)
G' (
Pa)
1E-3
0.01
0.1
1
10
100
G'' (P
a)
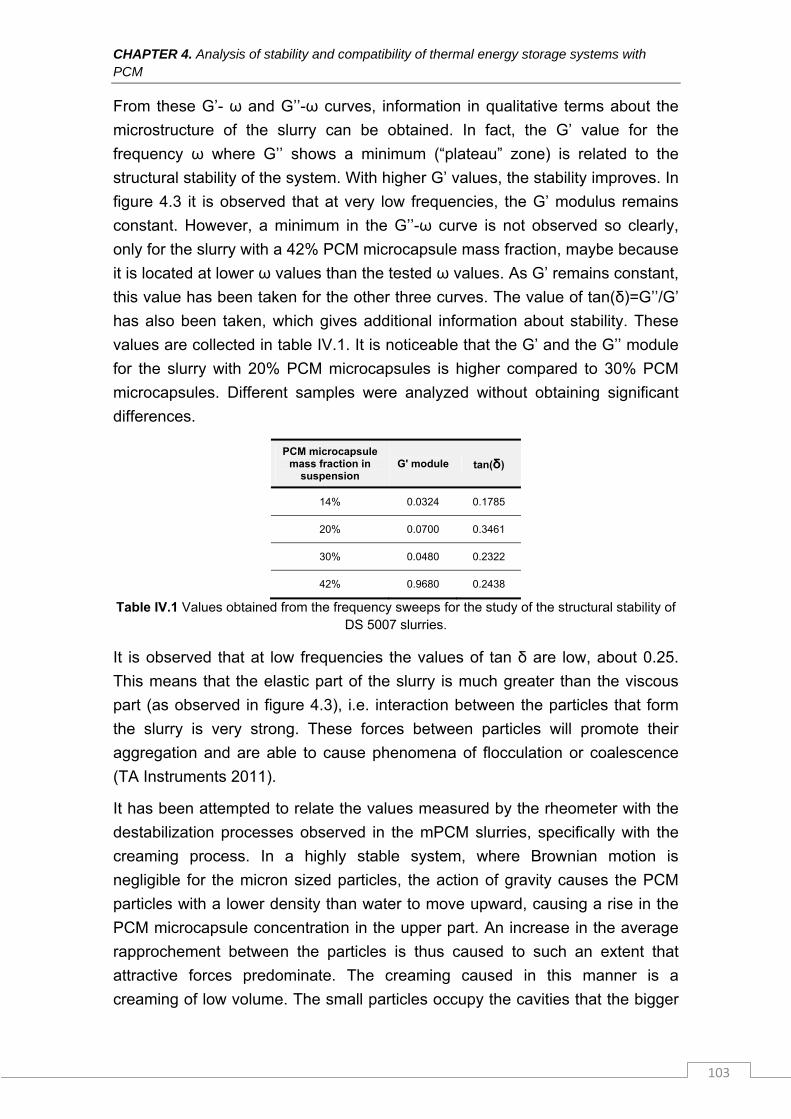
CHAPTER 4. Analysis of stability and compatibility of thermal energy storage systems with PCM
103
From these G’- ω and G’’-ω curves, information in qualitative terms about the
microstructure of the slurry can be obtained. In fact, the G’ value for the
frequency ω where G’’ shows a minimum (“plateau” zone) is related to the
structural stability of the system. With higher G’ values, the stability improves. In
figure 4.3 it is observed that at very low frequencies, the G’ modulus remains
constant. However, a minimum in the G’’-ω curve is not observed so clearly,
only for the slurry with a 42% PCM microcapsule mass fraction, maybe because
it is located at lower ω values than the tested ω values. As G’ remains constant,
this value has been taken for the other three curves. The value of tan(δ)=G’’/G’
has also been taken, which gives additional information about stability. These
values are collected in table IV.1. It is noticeable that the G’ and the G’’ module
for the slurry with 20% PCM microcapsules is higher compared to 30% PCM
microcapsules. Different samples were analyzed without obtaining significant
differences.
PCM microcapsule mass fraction in
suspension G' module tan(δ)
14% 0.0324 0.1785
20% 0.0700 0.3461
30% 0.0480 0.2322
42% 0.9680 0.2438
Table IV.1 Values obtained from the frequency sweeps for the study of the structural stability of DS 5007 slurries.
It is observed that at low frequencies the values of tan δ are low, about 0.25.
This means that the elastic part of the slurry is much greater than the viscous
part (as observed in figure 4.3), i.e. interaction between the particles that form
the slurry is very strong. These forces between particles will promote their
aggregation and are able to cause phenomena of flocculation or coalescence
(TA Instruments 2011).
It has been attempted to relate the values measured by the rheometer with the
destabilization processes observed in the mPCM slurries, specifically with the
creaming process. In a highly stable system, where Brownian motion is
negligible for the micron sized particles, the action of gravity causes the PCM
particles with a lower density than water to move upward, causing a rise in the
PCM microcapsule concentration in the upper part. An increase in the average
rapprochement between the particles is thus caused to such an extent that
attractive forces predominate. The creaming caused in this manner is a
creaming of low volume. The small particles occupy the cavities that the bigger
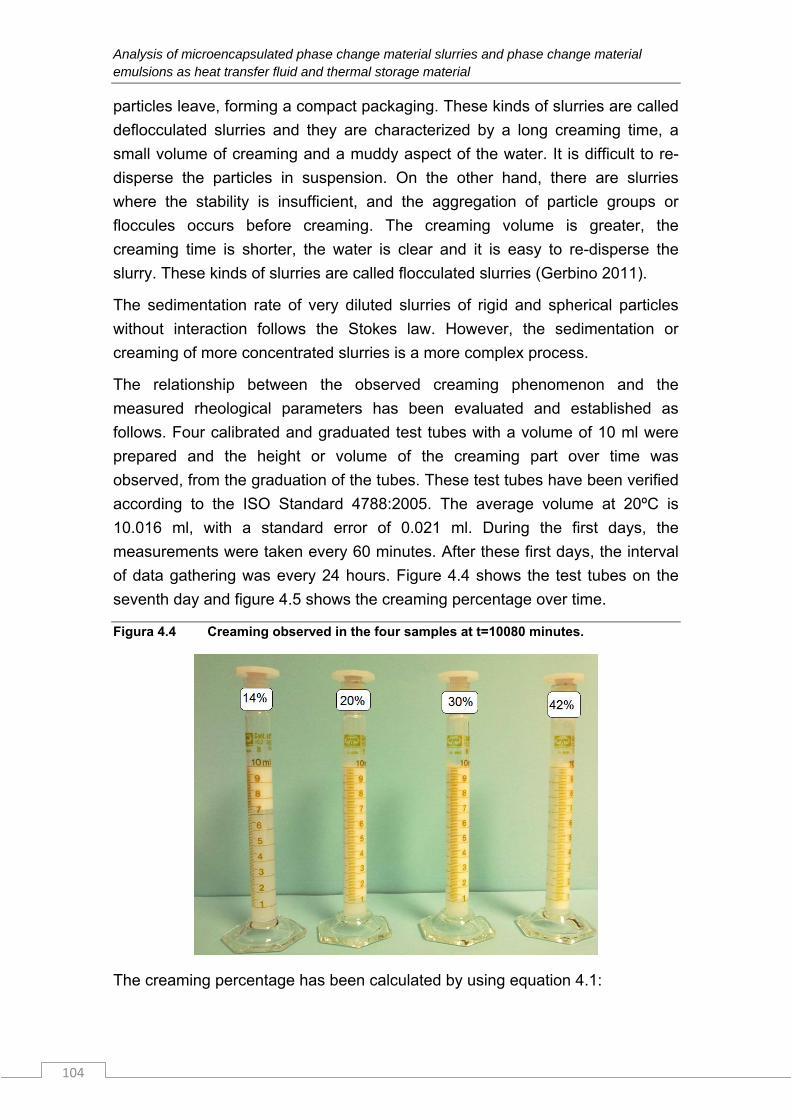
Analysis of microencapsulated phase change material slurries and phase change material emulsions as heat transfer fluid and thermal storage material
104
particles leave, forming a compact packaging. These kinds of slurries are called
deflocculated slurries and they are characterized by a long creaming time, a
small volume of creaming and a muddy aspect of the water. It is difficult to re-
disperse the particles in suspension. On the other hand, there are slurries
where the stability is insufficient, and the aggregation of particle groups or
floccules occurs before creaming. The creaming volume is greater, the
creaming time is shorter, the water is clear and it is easy to re-disperse the
slurry. These kinds of slurries are called flocculated slurries (Gerbino 2011).
The sedimentation rate of very diluted slurries of rigid and spherical particles
without interaction follows the Stokes law. However, the sedimentation or
creaming of more concentrated slurries is a more complex process.
The relationship between the observed creaming phenomenon and the
measured rheological parameters has been evaluated and established as
follows. Four calibrated and graduated test tubes with a volume of 10 ml were
prepared and the height or volume of the creaming part over time was
observed, from the graduation of the tubes. These test tubes have been verified
according to the ISO Standard 4788:2005. The average volume at 20ºC is
10.016 ml, with a standard error of 0.021 ml. During the first days, the
measurements were taken every 60 minutes. After these first days, the interval
of data gathering was every 24 hours. Figure 4.4 shows the test tubes on the
seventh day and figure 4.5 shows the creaming percentage over time.
Figura 4.4 Creaming observed in the four samples at t=10080 minutes.
The creaming percentage has been calculated by using equation 4.1:
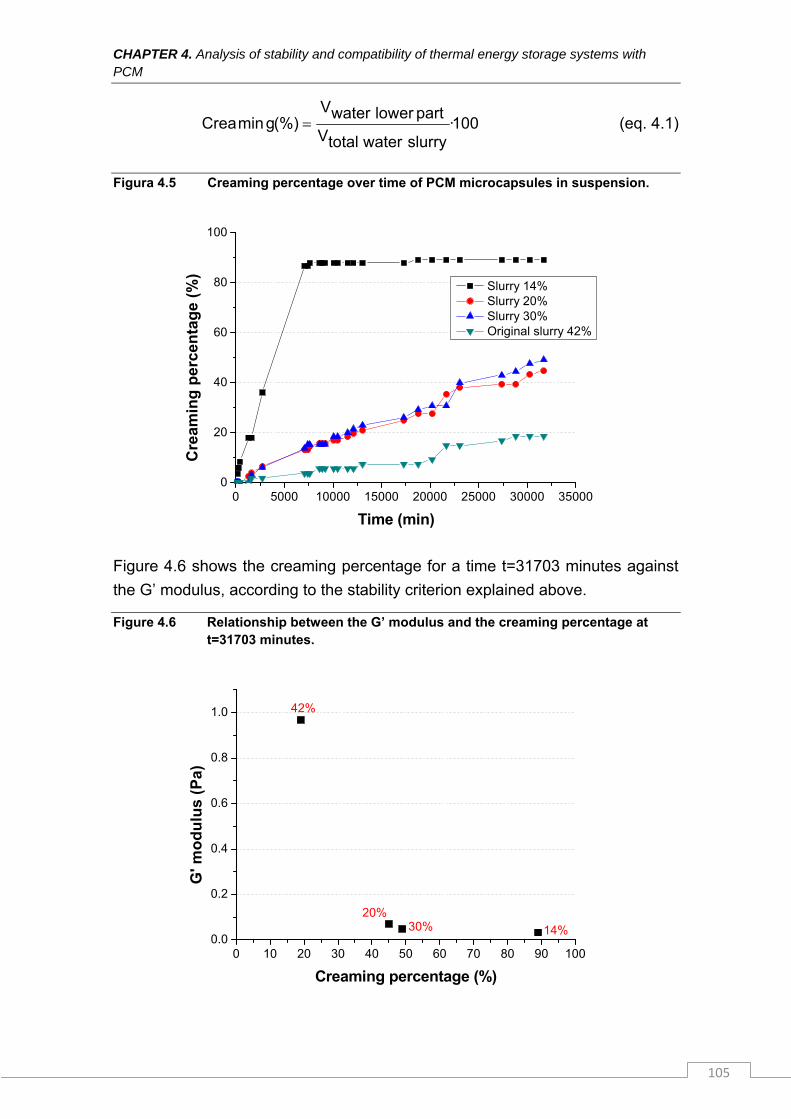
CHAPTER 4. Analysis of stability and compatibility of thermal energy storage systems with PCM
105
100·slurrywatertotalV
partlowerwaterV(%)gminCrea (eq. 4.1)
Figura 4.5 Creaming percentage over time of PCM microcapsules in suspension.
0 5000 10000 15000 20000 25000 30000 350000
20
40
60
80
100
Slurry 14% Slurry 20% Slurry 30% Original slurry 42%
Cre
amin
g p
erce
nta
ge
(%)
Time (min)
Figure 4.6 shows the creaming percentage for a time t=31703 minutes against
the G’ modulus, according to the stability criterion explained above.
Figure 4.6 Relationship between the G’ modulus and the creaming percentage at t=31703 minutes.
0 10 20 30 40 50 60 70 80 90 1000.0
0.2
0.4
0.6
0.8
1.0
G' m
od
ulu
s (P
a)
Creaming percentage (%)
42%
30%20%
14%
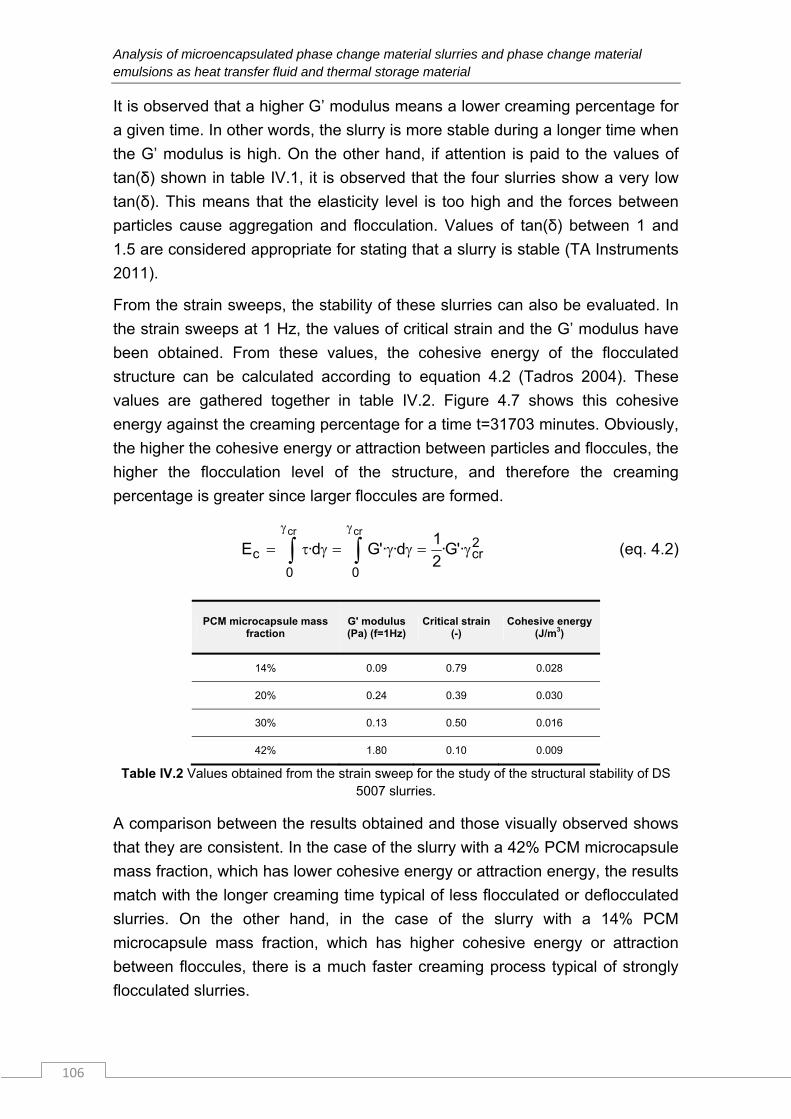
Analysis of microencapsulated phase change material slurries and phase change material emulsions as heat transfer fluid and thermal storage material
106
It is observed that a higher G’ modulus means a lower creaming percentage for
a given time. In other words, the slurry is more stable during a longer time when
the G’ modulus is high. On the other hand, if attention is paid to the values of
tan(δ) shown in table IV.1, it is observed that the four slurries show a very low
tan(δ). This means that the elasticity level is too high and the forces between
particles cause aggregation and flocculation. Values of tan(δ) between 1 and
1.5 are considered appropriate for stating that a slurry is stable (TA Instruments
2011).
From the strain sweeps, the stability of these slurries can also be evaluated. In
the strain sweeps at 1 Hz, the values of critical strain and the G’ modulus have
been obtained. From these values, the cohesive energy of the flocculated
structure can be calculated according to equation 4.2 (Tadros 2004). These
values are gathered together in table IV.2. Figure 4.7 shows this cohesive
energy against the creaming percentage for a time t=31703 minutes. Obviously,
the higher the cohesive energy or attraction between particles and floccules, the
higher the flocculation level of the structure, and therefore the creaming
percentage is greater since larger floccules are formed.
2cr
00
c '·G·2
1d·'·Gd·E
crcr
(eq. 4.2)
PCM microcapsule mass fraction
G' modulus (Pa) (f=1Hz)
Critical strain (-)
Cohesive energy (J/m3)
14% 0.09 0.79 0.028
20% 0.24 0.39 0.030
30% 0.13 0.50 0.016
42% 1.80 0.10 0.009
Table IV.2 Values obtained from the strain sweep for the study of the structural stability of DS 5007 slurries.
A comparison between the results obtained and those visually observed shows
that they are consistent. In the case of the slurry with a 42% PCM microcapsule
mass fraction, which has lower cohesive energy or attraction energy, the results
match with the longer creaming time typical of less flocculated or deflocculated
slurries. On the other hand, in the case of the slurry with a 14% PCM
microcapsule mass fraction, which has higher cohesive energy or attraction
between floccules, there is a much faster creaming process typical of strongly
flocculated slurries.
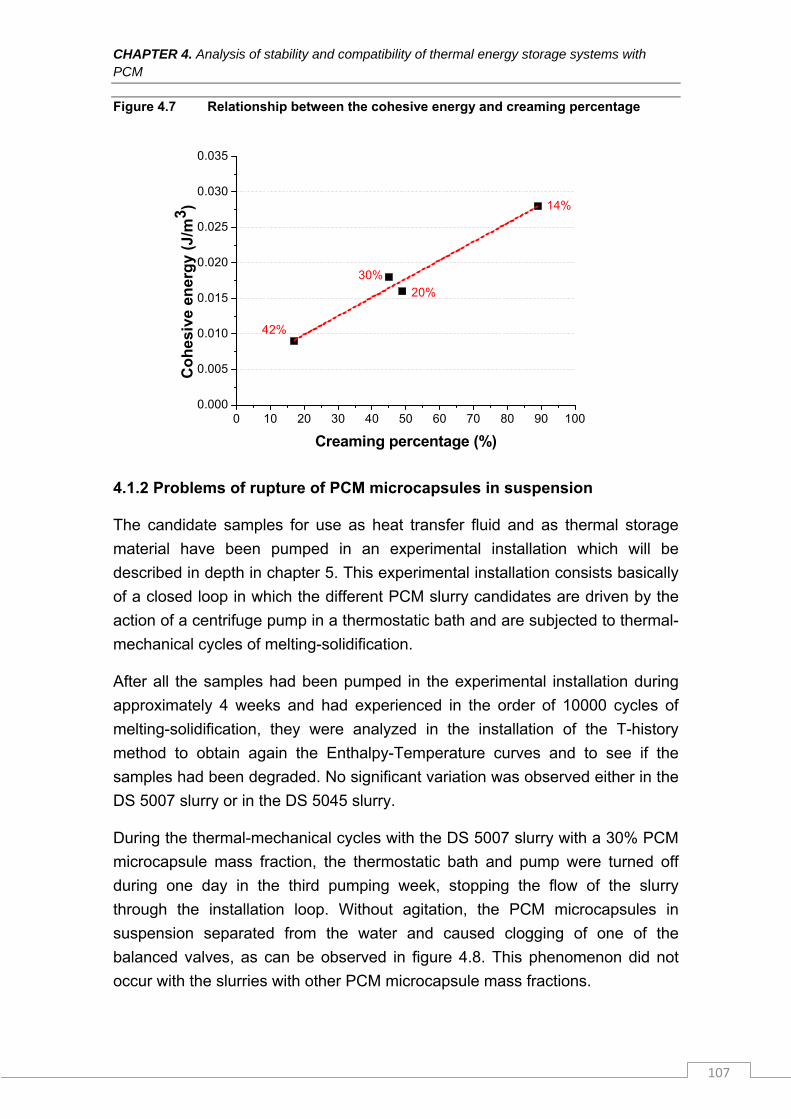
CHAPTER 4. Analysis of stability and compatibility of thermal energy storage systems with PCM
107
Figure 4.7 Relationship between the cohesive energy and creaming percentage
0 10 20 30 40 50 60 70 80 90 1000.000
0.005
0.010
0.015
0.020
0.025
0.030
0.035
Co
hes
ive
ener
gy
(J/m
3 )
Creaming percentage (%)
14%
42%
20%
30%
4.1.2 Problems of rupture of PCM microcapsules in suspension
The candidate samples for use as heat transfer fluid and as thermal storage
material have been pumped in an experimental installation which will be
described in depth in chapter 5. This experimental installation consists basically
of a closed loop in which the different PCM slurry candidates are driven by the
action of a centrifuge pump in a thermostatic bath and are subjected to thermal-
mechanical cycles of melting-solidification.
After all the samples had been pumped in the experimental installation during
approximately 4 weeks and had experienced in the order of 10000 cycles of
melting-solidification, they were analyzed in the installation of the T-history
method to obtain again the Enthalpy-Temperature curves and to see if the
samples had been degraded. No significant variation was observed either in the
DS 5007 slurry or in the DS 5045 slurry.
During the thermal-mechanical cycles with the DS 5007 slurry with a 30% PCM
microcapsule mass fraction, the thermostatic bath and pump were turned off
during one day in the third pumping week, stopping the flow of the slurry
through the installation loop. Without agitation, the PCM microcapsules in
suspension separated from the water and caused clogging of one of the
balanced valves, as can be observed in figure 4.8. This phenomenon did not
occur with the slurries with other PCM microcapsule mass fractions.
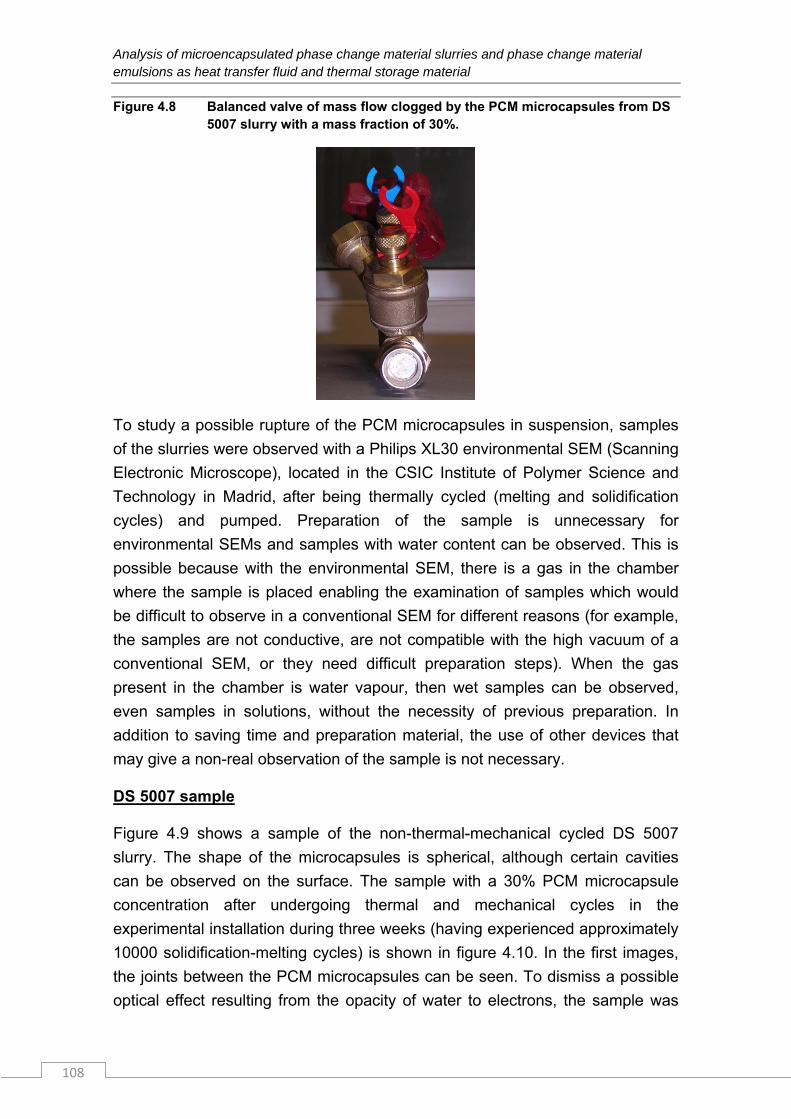
Analysis of microencapsulated phase change material slurries and phase change material emulsions as heat transfer fluid and thermal storage material
108
Figure 4.8 Balanced valve of mass flow clogged by the PCM microcapsules from DS 5007 slurry with a mass fraction of 30%.
To study a possible rupture of the PCM microcapsules in suspension, samples
of the slurries were observed with a Philips XL30 environmental SEM (Scanning
Electronic Microscope), located in the CSIC Institute of Polymer Science and
Technology in Madrid, after being thermally cycled (melting and solidification
cycles) and pumped. Preparation of the sample is unnecessary for
environmental SEMs and samples with water content can be observed. This is
possible because with the environmental SEM, there is a gas in the chamber
where the sample is placed enabling the examination of samples which would
be difficult to observe in a conventional SEM for different reasons (for example,
the samples are not conductive, are not compatible with the high vacuum of a
conventional SEM, or they need difficult preparation steps). When the gas
present in the chamber is water vapour, then wet samples can be observed,
even samples in solutions, without the necessity of previous preparation. In
addition to saving time and preparation material, the use of other devices that
may give a non-real observation of the sample is not necessary.
DS 5007 sample
Figure 4.9 shows a sample of the non-thermal-mechanical cycled DS 5007
slurry. The shape of the microcapsules is spherical, although certain cavities
can be observed on the surface. The sample with a 30% PCM microcapsule
concentration after undergoing thermal and mechanical cycles in the
experimental installation during three weeks (having experienced approximately
10000 solidification-melting cycles) is shown in figure 4.10. In the first images,
the joints between the PCM microcapsules can be seen. To dismiss a possible
optical effect resulting from the opacity of water to electrons, the sample was
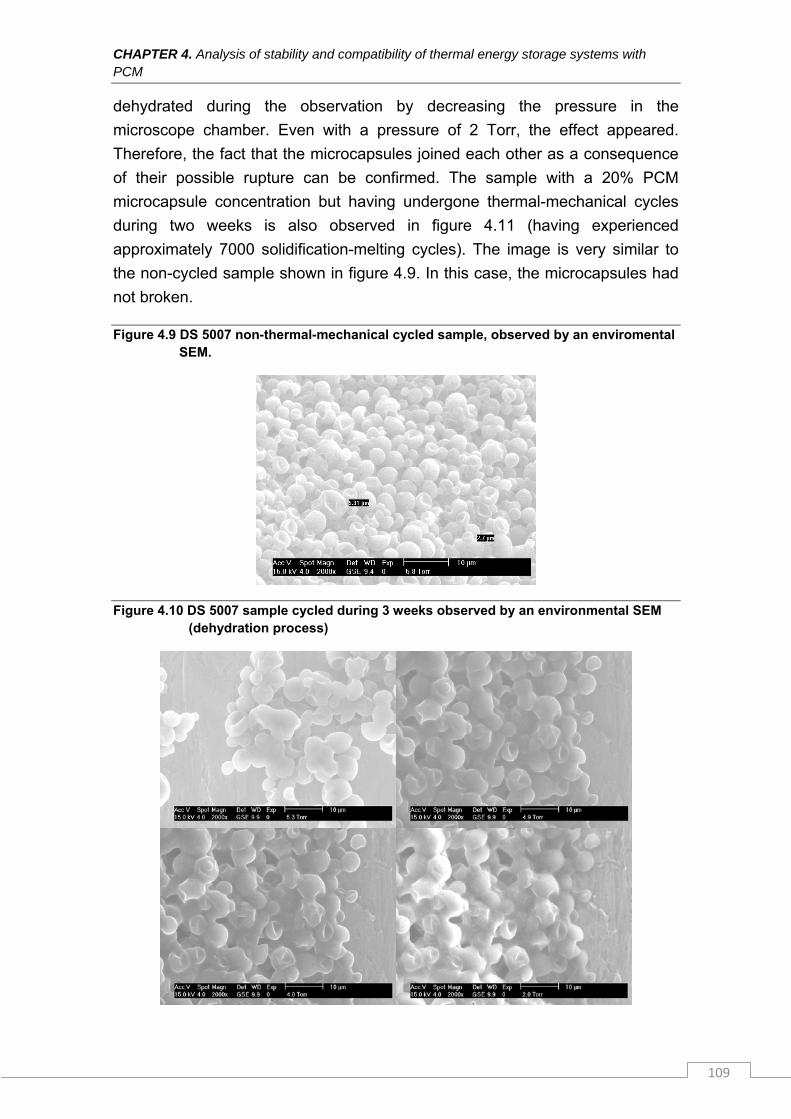
CHAPTER 4. Analysis of stability and compatibility of thermal energy storage systems with PCM
109
dehydrated during the observation by decreasing the pressure in the
microscope chamber. Even with a pressure of 2 Torr, the effect appeared.
Therefore, the fact that the microcapsules joined each other as a consequence
of their possible rupture can be confirmed. The sample with a 20% PCM
microcapsule concentration but having undergone thermal-mechanical cycles
during two weeks is also observed in figure 4.11 (having experienced
approximately 7000 solidification-melting cycles). The image is very similar to
the non-cycled sample shown in figure 4.9. In this case, the microcapsules had
not broken.
Figure 4.9 DS 5007 non-thermal-mechanical cycled sample, observed by an enviromental SEM.
Figure 4.10 DS 5007 sample cycled during 3 weeks observed by an environmental SEM (dehydration process)
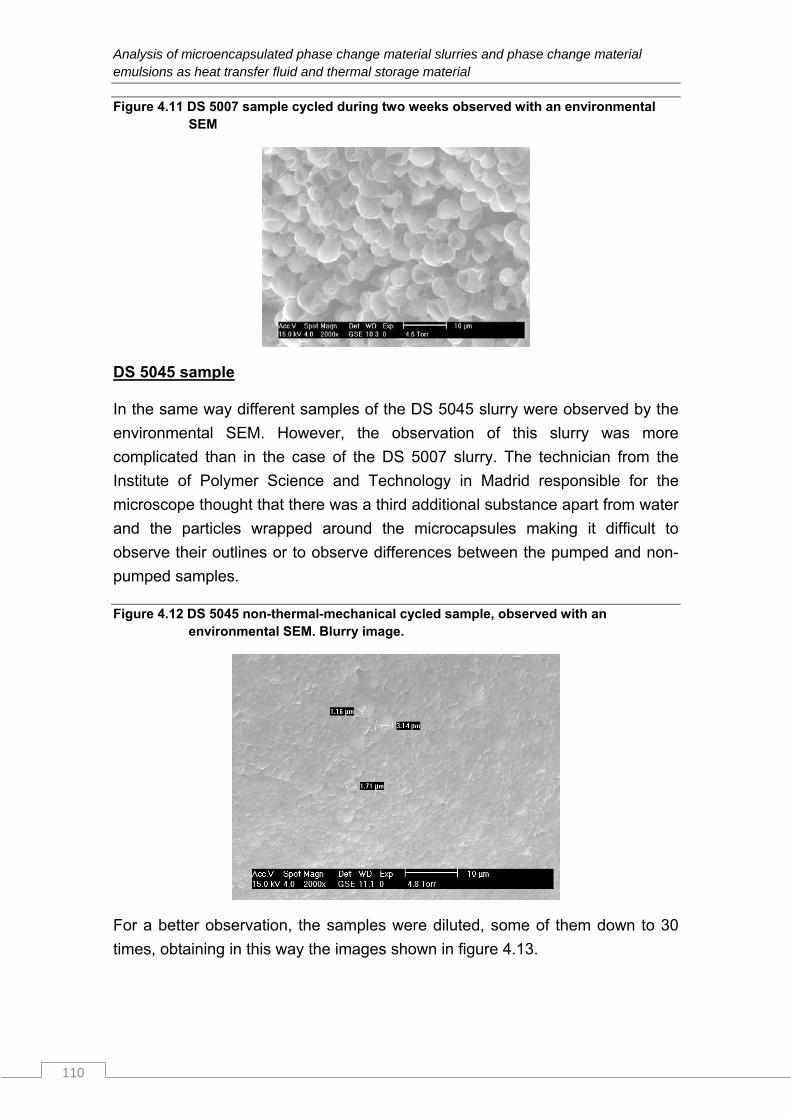
Analysis of microencapsulated phase change material slurries and phase change material emulsions as heat transfer fluid and thermal storage material
110
Figure 4.11 DS 5007 sample cycled during two weeks observed with an environmental SEM
DS 5045 sample
In the same way different samples of the DS 5045 slurry were observed by the
environmental SEM. However, the observation of this slurry was more
complicated than in the case of the DS 5007 slurry. The technician from the
Institute of Polymer Science and Technology in Madrid responsible for the
microscope thought that there was a third additional substance apart from water
and the particles wrapped around the microcapsules making it difficult to
observe their outlines or to observe differences between the pumped and non-
pumped samples.
Figure 4.12 DS 5045 non-thermal-mechanical cycled sample, observed with an environmental SEM. Blurry image.
For a better observation, the samples were diluted, some of them down to 30
times, obtaining in this way the images shown in figure 4.13.
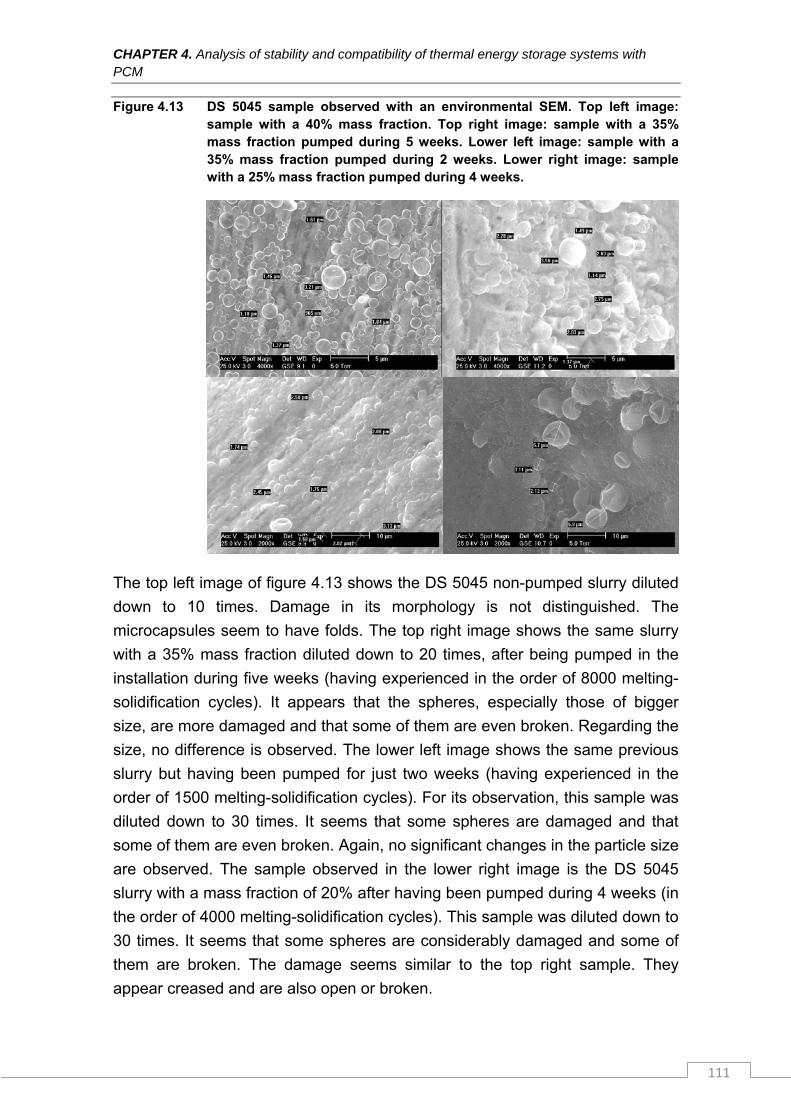
CHAPTER 4. Analysis of stability and compatibility of thermal energy storage systems with PCM
111
Figure 4.13 DS 5045 sample observed with an environmental SEM. Top left image: sample with a 40% mass fraction. Top right image: sample with a 35% mass fraction pumped during 5 weeks. Lower left image: sample with a 35% mass fraction pumped during 2 weeks. Lower right image: sample with a 25% mass fraction pumped during 4 weeks.
The top left image of figure 4.13 shows the DS 5045 non-pumped slurry diluted
down to 10 times. Damage in its morphology is not distinguished. The
microcapsules seem to have folds. The top right image shows the same slurry
with a 35% mass fraction diluted down to 20 times, after being pumped in the
installation during five weeks (having experienced in the order of 8000 melting-
solidification cycles). It appears that the spheres, especially those of bigger
size, are more damaged and that some of them are even broken. Regarding the
size, no difference is observed. The lower left image shows the same previous
slurry but having been pumped for just two weeks (having experienced in the
order of 1500 melting-solidification cycles). For its observation, this sample was
diluted down to 30 times. It seems that some spheres are damaged and that
some of them are even broken. Again, no significant changes in the particle size
are observed. The sample observed in the lower right image is the DS 5045
slurry with a mass fraction of 20% after having been pumped during 4 weeks (in
the order of 4000 melting-solidification cycles). This sample was diluted down to
30 times. It seems that some spheres are considerably damaged and some of
them are broken. The damage seems similar to the top right sample. They
appear creased and are also open or broken.
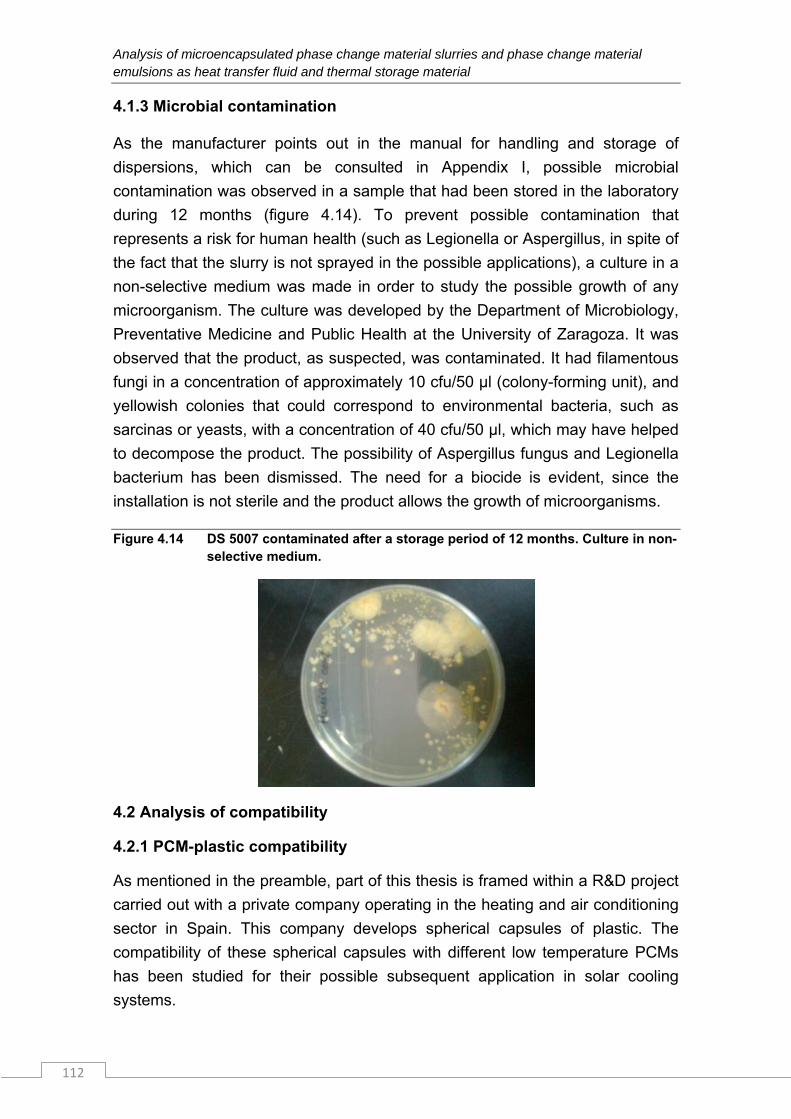
Analysis of microencapsulated phase change material slurries and phase change material emulsions as heat transfer fluid and thermal storage material
112
4.1.3 Microbial contamination
As the manufacturer points out in the manual for handling and storage of
dispersions, which can be consulted in Appendix I, possible microbial
contamination was observed in a sample that had been stored in the laboratory
during 12 months (figure 4.14). To prevent possible contamination that
represents a risk for human health (such as Legionella or Aspergillus, in spite of
the fact that the slurry is not sprayed in the possible applications), a culture in a
non-selective medium was made in order to study the possible growth of any
microorganism. The culture was developed by the Department of Microbiology,
Preventative Medicine and Public Health at the University of Zaragoza. It was
observed that the product, as suspected, was contaminated. It had filamentous
fungi in a concentration of approximately 10 cfu/50 µl (colony-forming unit), and
yellowish colonies that could correspond to environmental bacteria, such as
sarcinas or yeasts, with a concentration of 40 cfu/50 µl, which may have helped
to decompose the product. The possibility of Aspergillus fungus and Legionella
bacterium has been dismissed. The need for a biocide is evident, since the
installation is not sterile and the product allows the growth of microorganisms.
Figure 4.14 DS 5007 contaminated after a storage period of 12 months. Culture in non-selective medium.
4.2 Analysis of compatibility
4.2.1 PCM-plastic compatibility
As mentioned in the preamble, part of this thesis is framed within a R&D project
carried out with a private company operating in the heating and air conditioning
sector in Spain. This company develops spherical capsules of plastic. The
compatibility of these spherical capsules with different low temperature PCMs
has been studied for their possible subsequent application in solar cooling
systems.
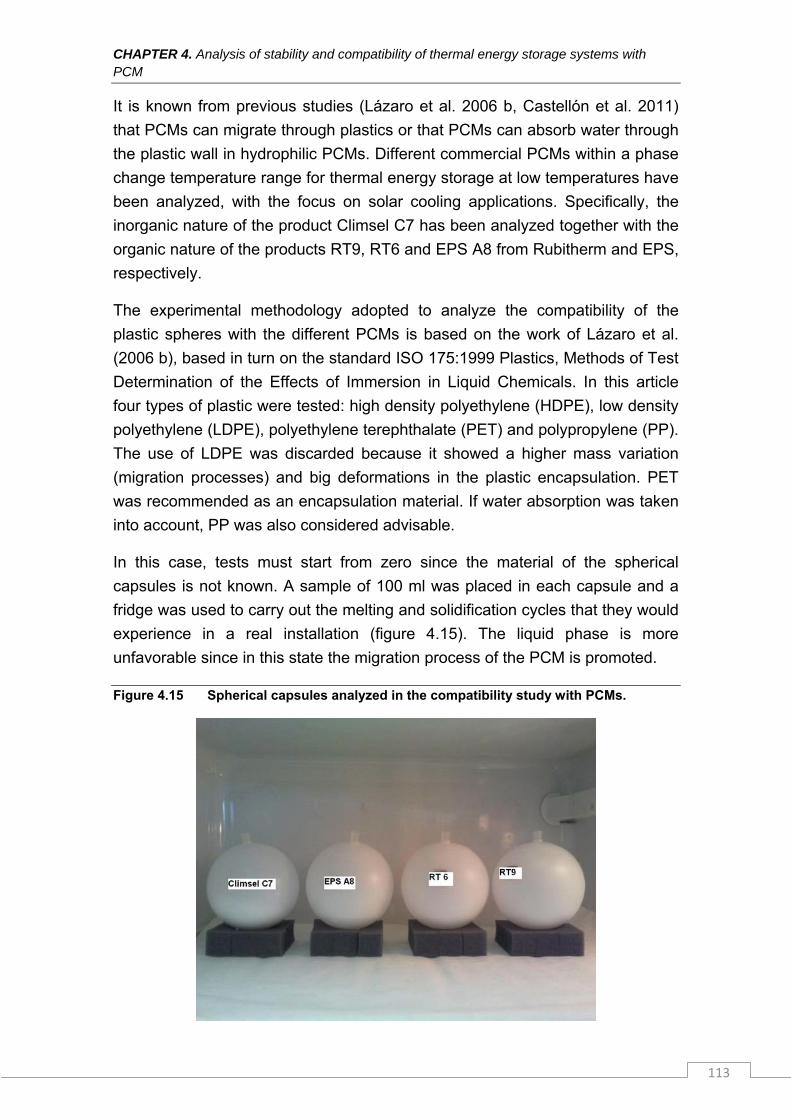
CHAPTER 4. Analysis of stability and compatibility of thermal energy storage systems with PCM
113
It is known from previous studies (Lázaro et al. 2006 b, Castellón et al. 2011)
that PCMs can migrate through plastics or that PCMs can absorb water through
the plastic wall in hydrophilic PCMs. Different commercial PCMs within a phase
change temperature range for thermal energy storage at low temperatures have
been analyzed, with the focus on solar cooling applications. Specifically, the
inorganic nature of the product Climsel C7 has been analyzed together with the
organic nature of the products RT9, RT6 and EPS A8 from Rubitherm and EPS,
respectively.
The experimental methodology adopted to analyze the compatibility of the
plastic spheres with the different PCMs is based on the work of Lázaro et al.
(2006 b), based in turn on the standard ISO 175:1999 Plastics, Methods of Test
Determination of the Effects of Immersion in Liquid Chemicals. In this article
four types of plastic were tested: high density polyethylene (HDPE), low density
polyethylene (LDPE), polyethylene terephthalate (PET) and polypropylene (PP).
The use of LDPE was discarded because it showed a higher mass variation
(migration processes) and big deformations in the plastic encapsulation. PET
was recommended as an encapsulation material. If water absorption was taken
into account, PP was also considered advisable.
In this case, tests must start from zero since the material of the spherical
capsules is not known. A sample of 100 ml was placed in each capsule and a
fridge was used to carry out the melting and solidification cycles that they would
experience in a real installation (figure 4.15). The liquid phase is more
unfavorable since in this state the migration process of the PCM is promoted.
Figure 4.15 Spherical capsules analyzed in the compatibility study with PCMs.
Analysis of microencapsulated phase change material slurries and phase change material emulsions as heat transfer fluid and thermal storage material
114
The experimental methodology is explained below:
1. Place 100 ml of previously agitated liquid PCM in the spherical plastic
capsule.
2. Weigh the spherical capsule containing the PCM. This is done with a
Mettler Toledo precision balance with an accuracy of 0.1 mg.
3. Place the spherical capsules with their corresponding PCMs in the lower
part of the fridge (position 6) during 3 hours (solidification).
4. Next, place the spherical capsules with their corresponding PCMs in the
upper part of the fridge (position 1) during 3 hours (melting). The thermal
cycles thus take place in a similar way to the cycles in a real application.
5. These steps are repeated and the capsules checked regularly to observe
possible deformations in the plastic or other phenomena.
6. The mass measurements are taken at room temperature to avoid
deviations due to temperature variation. Absorbent paper is used to
remove the PCM that may have migrated and the particles deposited in
the walls. Each capsule is then weighed. This measurement is carried
out weekly.
The mass loss is calculated as:
Δm=m(t0)-m(t) (eq. 4.3)
Δm(%)=[m(t0)-m(t)]/m(t0) (eq. 4.4)
Figure 4.16 shows the mass loss of the spheres with the different PCMs.
Although in the spheres with organic PCM (EPS A8, RT6, RT9) it is observed
that the PCM has a tendency to migrate through the plastic, in the case of the
inorganic PCM this mass loss is not observed. However, the possible water
absorption should be analyzed, which could counteract a possible mass loss. A
sharp change in the slope of the mass loss is observed in the case of organic
PCMs EPS A8 and RT6 from around 325 days. After 392 days, the organic
PCMs EPS A8, RT6 and RT9 lost 0.422, 0.322 and 0.123% of mass,
respectively. The inorganic PCM CLIMSEL C7 gained a mass of 0.017%.
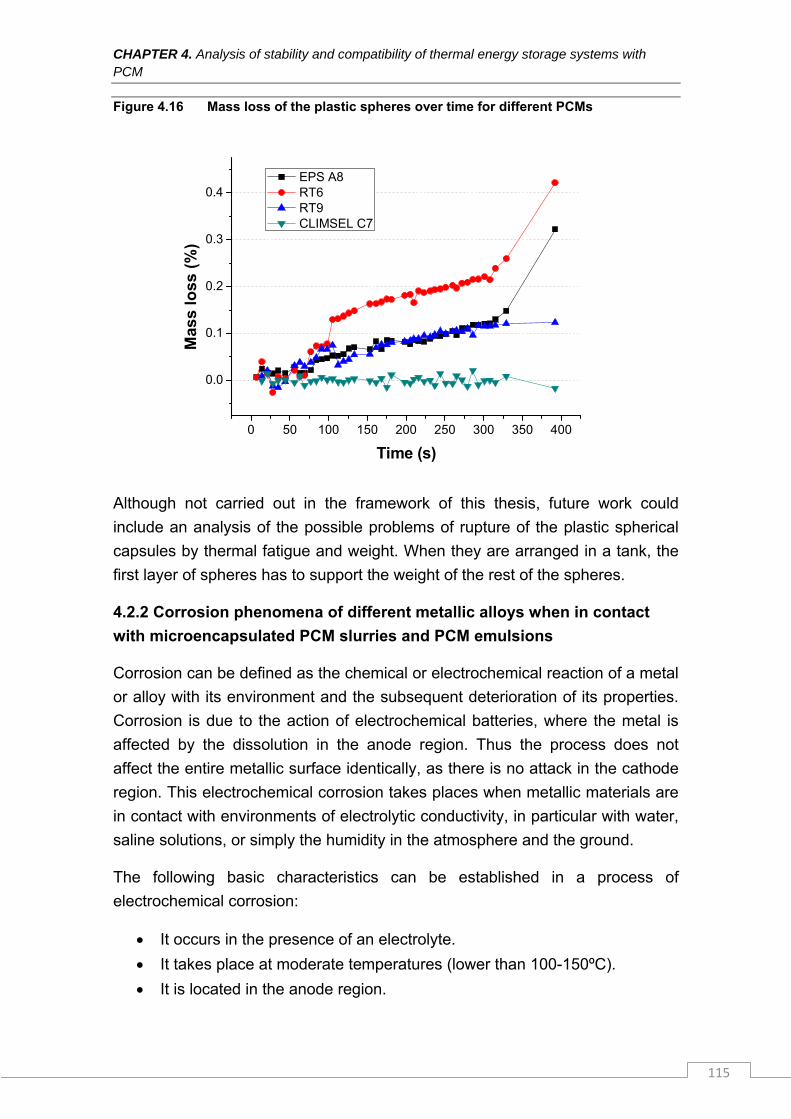
CHAPTER 4. Analysis of stability and compatibility of thermal energy storage systems with PCM
115
Figure 4.16 Mass loss of the plastic spheres over time for different PCMs
0 50 100 150 200 250 300 350 400
0.0
0.1
0.2
0.3
0.4M
ass
loss
(%
)
Time (s)
EPS A8 RT6 RT9 CLIMSEL C7
Although not carried out in the framework of this thesis, future work could
include an analysis of the possible problems of rupture of the plastic spherical
capsules by thermal fatigue and weight. When they are arranged in a tank, the
first layer of spheres has to support the weight of the rest of the spheres.
4.2.2 Corrosion phenomena of different metallic alloys when in contact
with microencapsulated PCM slurries and PCM emulsions
Corrosion can be defined as the chemical or electrochemical reaction of a metal
or alloy with its environment and the subsequent deterioration of its properties.
Corrosion is due to the action of electrochemical batteries, where the metal is
affected by the dissolution in the anode region. Thus the process does not
affect the entire metallic surface identically, as there is no attack in the cathode
region. This electrochemical corrosion takes places when metallic materials are
in contact with environments of electrolytic conductivity, in particular with water,
saline solutions, or simply the humidity in the atmosphere and the ground.
The following basic characteristics can be established in a process of
electrochemical corrosion:
It occurs in the presence of an electrolyte.
It takes place at moderate temperatures (lower than 100-150ºC).
It is located in the anode region.
Analysis of microencapsulated phase change material slurries and phase change material emulsions as heat transfer fluid and thermal storage material
116
The movement of the electrons takes place from the anode to the
cathode through the metal.
The circuit is closed by the electrolyte through the charge transport by
means of the ions.
The most usual corrosion products are hydroxides that are formed in the
electrolyte, although they can later adhere to the metallic surface
introducing a certain solid barrier effect between the metal and the
aggressive environment, complicating the subsequent corrosion. These
hydroxides are usually later transformed into oxides in the presence of
oxygen.
The corrosion of metallic materials in contact with water usually fits the general
model:
Anode region: Me ↔ Men+ + en-
Cathode region: O2 + 2H2O + 4e- ↔ 4OH-
Therefore, the presence of oxygen is required so that the electrochemical
process can take place. There is usually a proportional relationship between the
corrosion velocity and the oxygen concentration present in the electrolyte. The
amount of salts in the water, that has a significant influence on its conductivity,
also determines its aggressiveness (Otero 1997).
In closed water systems, corrosion can be non-existent when the oxygen is
used up by the cathode reaction during the first stages. From a certain time, the
lack of cathode reactive avoids the electrochemical phenomenon of corrosion.
Also, hard waters are less corrosive than soft waters (Otero 1997).
There are different types of corrosion. The most important types include general
or uniform corrosion and galvanic corrosion. This can occur when different
metals, with different redox potential, are joined electrically in the presence of
an electrolyte. Regarding localized corrosion, where the metal loss occurs in
localized regions, microbiological corrosion is significant, where microorganisms
(that are generally found in aqueous media) act as an accelerant of the
localized corrosive process. These biological organisms present in the water act
on the metal surface, accelerating the corrosion phenomenon through different
processes.
Since PCM slurries have an aqueous basis, and water plays a crucial role in the
corrosion phenomenon of metals acting as an electrolyte, an experimental
analysis has been conducted to study the possible oxidation of the metals that
will be in contact with PCM slurries in possible future applications.
CHAPTER 4. Analysis of stability and compatibility of thermal energy storage systems with PCM
117
Several studies have already been carried out relating to the corrosion of metals
in contact with PCMs, specifically in contact with hydrated salts. Porisini (1988)
examined the corrosion phenomenon in different metals (stainless steel, carbon
steel, copper and aluminum alloys) that contained four commercial salts.
Stainless steel was the most resistant metal against corrosion.
In several works by Cabeza et al. (2001 a, 2001 b, 2001 c, 2002), the corrosion
rate in aluminum and copper was evaluated when in contact with molten
hydrated salts. They observed that aluminum tends to show corrosion by pitting
when it is in contact with chlorides, forming Al(OH)3. However, aluminum
showed a strong resistance to corrosion in the case of sodium acetate. Copper
was resistant to calcium chloride, but not to sodium acetate.
Farrell et al. (2006) studied the corrosion phenomenon in the salts Climsel C18
and EPS E17 on copper samples (UNS C38600) and aluminum (UNS A92024)
used in heat exchangers in the air conditioning field. They estimated a mass
loss of 0.8 and 0.145 g/(m2·h), respectively. In the case of samples with
aluminum, the sample showed a corrosion rate by pitting when in contact with
Climsel C18 of 7·10-5 g/(m2·h). In the case of EPS E17, the mass loss was not
significant, although the metallographic observations showed localized
corrosion by pitting with a diameter of the pitting from 2.5 to 30 µm. In the case
of galvanic corrosion, when combining the copper samples and the aluminum
alloy, they also observed localized corrosion by pitting, concluding that the use
of copper heat exchangers with aluminum fins would not be suitable.
Nagano et al. (2004) conducted corrosion tests on different metals (copper,
carbon steel, brass and two different types of stainless steel, UNS S30400 and
UNS S31600) when in contact with magnesium nitrate hexahydrate, and when
the aluminum is also in contact with a salt blend Mg(NO3)2·6H2O+10%
MgCl2·6H2O. After 90 days the mass loss of each test plate was measured,
observing a more severe corrosion for copper and carbon steel. The stainless
steel S31600 and the aluminum showed better results.
García-Romero et al. (2009) also conducted a study to analyze the corrosion
phenomenon on four types of aluminum alloys (UNS A92024, UNS A93003,
UNS A96063 and A91050) when in contact with commercial salts based on
Glauber’s salt (Na2SO4·10H2O). The results showed that the alloy UNS A92024
was not compatible with this material due to the extensive formation of
NaAlCO3·(OH)2, when in contact with air. The other three alloys were
compatible with Glauber’s salt.
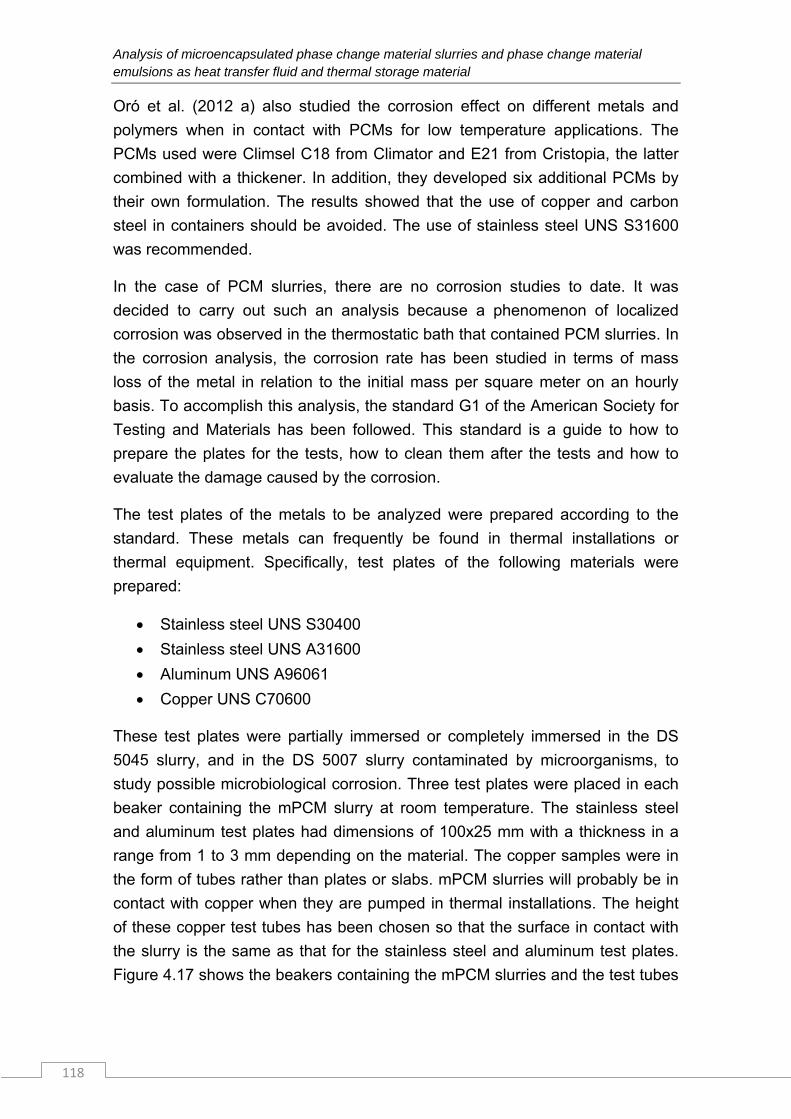
Analysis of microencapsulated phase change material slurries and phase change material emulsions as heat transfer fluid and thermal storage material
118
Oró et al. (2012 a) also studied the corrosion effect on different metals and
polymers when in contact with PCMs for low temperature applications. The
PCMs used were Climsel C18 from Climator and E21 from Cristopia, the latter
combined with a thickener. In addition, they developed six additional PCMs by
their own formulation. The results showed that the use of copper and carbon
steel in containers should be avoided. The use of stainless steel UNS S31600
was recommended.
In the case of PCM slurries, there are no corrosion studies to date. It was
decided to carry out such an analysis because a phenomenon of localized
corrosion was observed in the thermostatic bath that contained PCM slurries. In
the corrosion analysis, the corrosion rate has been studied in terms of mass
loss of the metal in relation to the initial mass per square meter on an hourly
basis. To accomplish this analysis, the standard G1 of the American Society for
Testing and Materials has been followed. This standard is a guide to how to
prepare the plates for the tests, how to clean them after the tests and how to
evaluate the damage caused by the corrosion.
The test plates of the metals to be analyzed were prepared according to the
standard. These metals can frequently be found in thermal installations or
thermal equipment. Specifically, test plates of the following materials were
prepared:
Stainless steel UNS S30400
Stainless steel UNS A31600
Aluminum UNS A96061
Copper UNS C70600
These test plates were partially immersed or completely immersed in the DS
5045 slurry, and in the DS 5007 slurry contaminated by microorganisms, to
study possible microbiological corrosion. Three test plates were placed in each
beaker containing the mPCM slurry at room temperature. The stainless steel
and aluminum test plates had dimensions of 100x25 mm with a thickness in a
range from 1 to 3 mm depending on the material. The copper samples were in
the form of tubes rather than plates or slabs. mPCM slurries will probably be in
contact with copper when they are pumped in thermal installations. The height
of these copper test tubes has been chosen so that the surface in contact with
the slurry is the same as that for the stainless steel and aluminum test plates.
Figure 4.17 shows the beakers containing the mPCM slurries and the test tubes
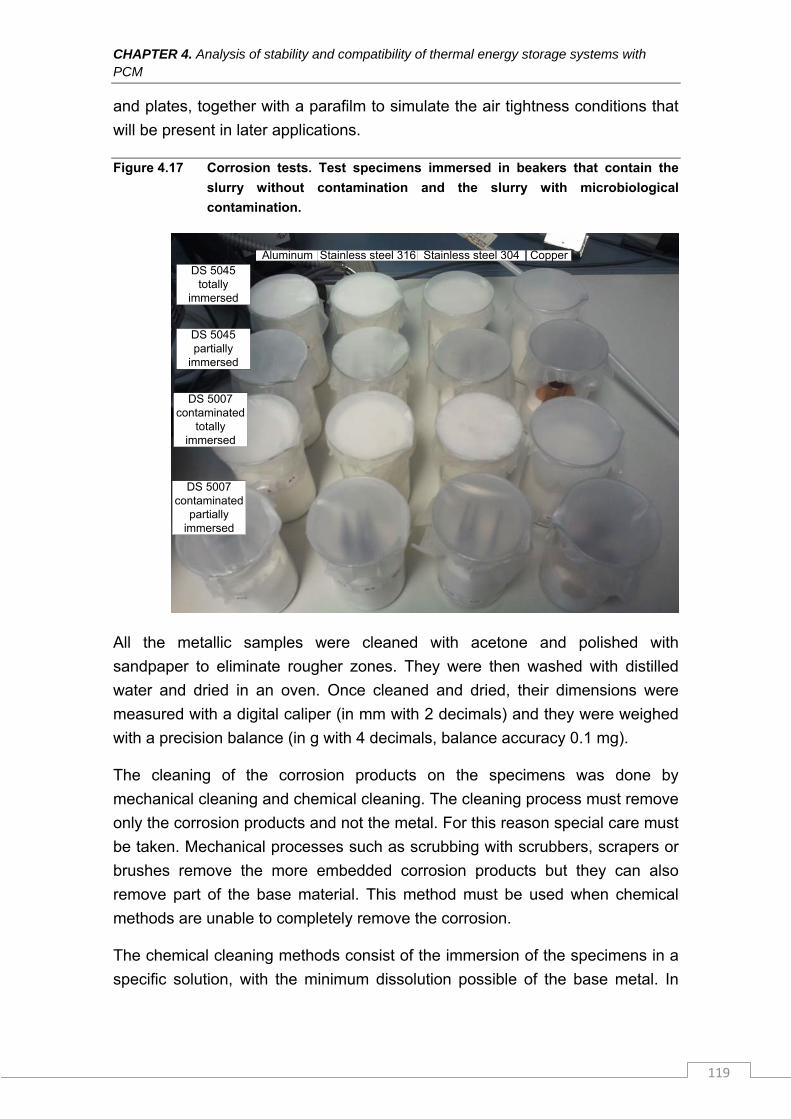
CHAPTER 4. Analysis of stability and compatibility of thermal energy storage systems with PCM
119
and plates, together with a parafilm to simulate the air tightness conditions that
will be present in later applications.
Figure 4.17 Corrosion tests. Test specimens immersed in beakers that contain the
slurry without contamination and the slurry with microbiological
contamination.
Aluminum Stainless steel 316 Stainless steel 304 CopperDS 5045
totally immersed
DS 5045 partially
immersed
DS 5007 contaminated
totally immersed
DS 5007 contaminated
partially immersed
All the metallic samples were cleaned with acetone and polished with
sandpaper to eliminate rougher zones. They were then washed with distilled
water and dried in an oven. Once cleaned and dried, their dimensions were
measured with a digital caliper (in mm with 2 decimals) and they were weighed
with a precision balance (in g with 4 decimals, balance accuracy 0.1 mg).
The cleaning of the corrosion products on the specimens was done by
mechanical cleaning and chemical cleaning. The cleaning process must remove
only the corrosion products and not the metal. For this reason special care must
be taken. Mechanical processes such as scrubbing with scrubbers, scrapers or
brushes remove the more embedded corrosion products but they can also
remove part of the base material. This method must be used when chemical
methods are unable to completely remove the corrosion.
The chemical cleaning methods consist of the immersion of the specimens in a
specific solution, with the minimum dissolution possible of the base metal. In
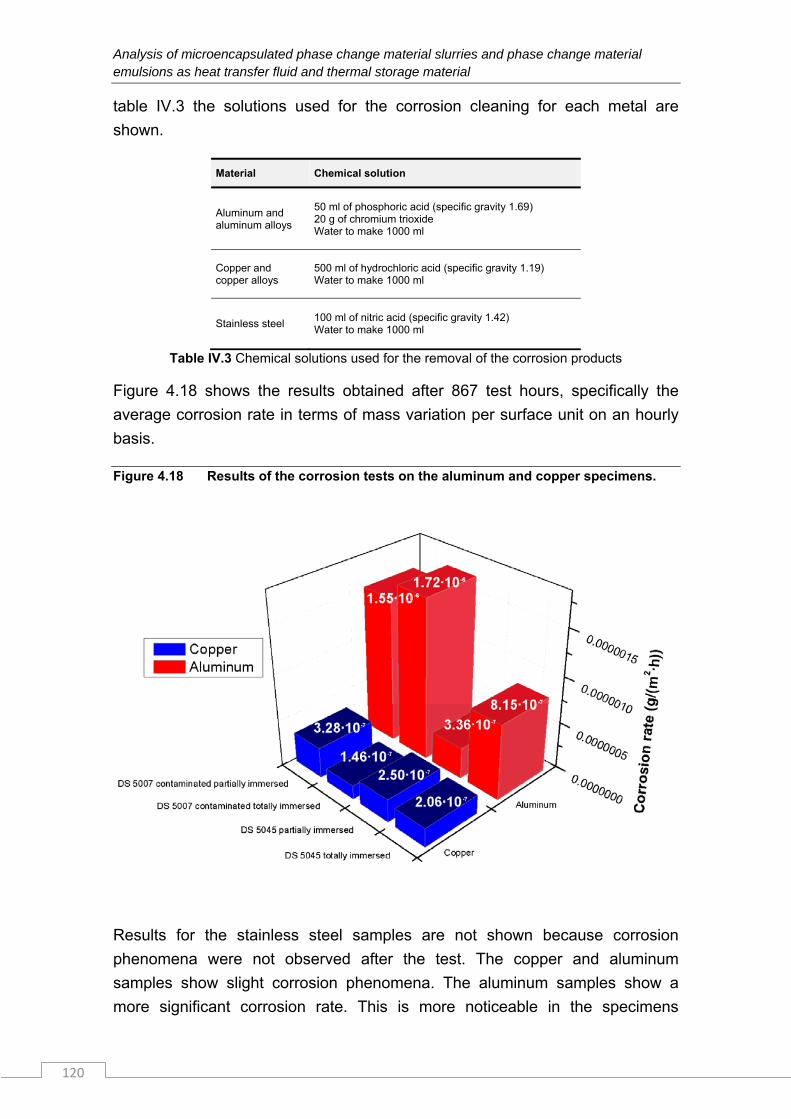
Analysis of microencapsulated phase change material slurries and phase change material emulsions as heat transfer fluid and thermal storage material
120
table IV.3 the solutions used for the corrosion cleaning for each metal are
shown.
Material Chemical solution
Aluminum and aluminum alloys
50 ml of phosphoric acid (specific gravity 1.69) 20 g of chromium trioxide Water to make 1000 ml
Copper and copper alloys
500 ml of hydrochloric acid (specific gravity 1.19) Water to make 1000 ml
Stainless steel 100 ml of nitric acid (specific gravity 1.42) Water to make 1000 ml
Table IV.3 Chemical solutions used for the removal of the corrosion products
Figure 4.18 shows the results obtained after 867 test hours, specifically the
average corrosion rate in terms of mass variation per surface unit on an hourly
basis.
Figure 4.18 Results of the corrosion tests on the aluminum and copper specimens.
Results for the stainless steel samples are not shown because corrosion
phenomena were not observed after the test. The copper and aluminum
samples show slight corrosion phenomena. The aluminum samples show a
more significant corrosion rate. This is more noticeable in the specimens
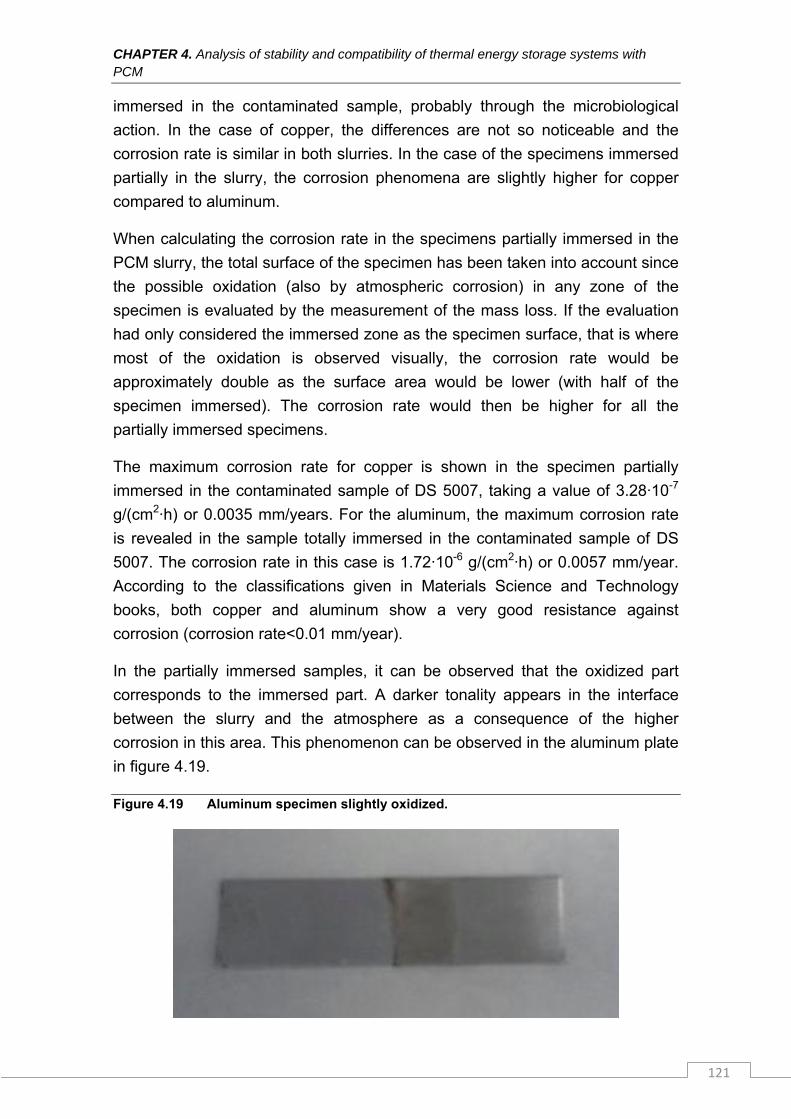
CHAPTER 4. Analysis of stability and compatibility of thermal energy storage systems with PCM
121
immersed in the contaminated sample, probably through the microbiological
action. In the case of copper, the differences are not so noticeable and the
corrosion rate is similar in both slurries. In the case of the specimens immersed
partially in the slurry, the corrosion phenomena are slightly higher for copper
compared to aluminum.
When calculating the corrosion rate in the specimens partially immersed in the
PCM slurry, the total surface of the specimen has been taken into account since
the possible oxidation (also by atmospheric corrosion) in any zone of the
specimen is evaluated by the measurement of the mass loss. If the evaluation
had only considered the immersed zone as the specimen surface, that is where
most of the oxidation is observed visually, the corrosion rate would be
approximately double as the surface area would be lower (with half of the
specimen immersed). The corrosion rate would then be higher for all the
partially immersed specimens.
The maximum corrosion rate for copper is shown in the specimen partially
immersed in the contaminated sample of DS 5007, taking a value of 3.28·10-7
g/(cm2·h) or 0.0035 mm/years. For the aluminum, the maximum corrosion rate
is revealed in the sample totally immersed in the contaminated sample of DS
5007. The corrosion rate in this case is 1.72·10-6 g/(cm2·h) or 0.0057 mm/year.
According to the classifications given in Materials Science and Technology
books, both copper and aluminum show a very good resistance against
corrosion (corrosion rate<0.01 mm/year).
In the partially immersed samples, it can be observed that the oxidized part
corresponds to the immersed part. A darker tonality appears in the interface
between the slurry and the atmosphere as a consequence of the higher
corrosion in this area. This phenomenon can be observed in the aluminum plate
in figure 4.19.
Figure 4.19 Aluminum specimen slightly oxidized.
Analysis of microencapsulated phase change material slurries and phase change material emulsions as heat transfer fluid and thermal storage material
122
In this interface, due to the presence of oxygen from the atmosphere and from
the water in the slurry, the cathode reaction of oxygen reduction will be more
favorable. In the case of being totally immersed, this reaction would take place
with the oxygen dissolved in the water.
In the case of the slurries where the copper specimens were immersed, it was
observed that the slurries were colored green, maybe as a consequence of the
possible formation of cupric hydroxide. It should be remembered that in the
case of copper, the idea is the flowing of these PCM slurries through copper
tubes and it should thus be taken into account that the corrosion rate is affected
by the fluid velocity.
Once cleaned, the samples were placed again in the corresponding slurries to
continue analyzing the corrosion phenomena. When the beakers were opened
for the cleaning and measurement process, the oxygen concentration increased
again since oxygen could have been used up by the cathode reaction. This
process can be reflected in the maintenance work in tanks.
It should be mentioned that, although not analyzed here, a specific situation that
could be present in thermal installations is the joining of tube sections, valves,
devices, etc. of different metallic alloys with different redox potential. In this
case the possible problems of galvanic corrosion should be analyzed.
4.3 Conclusions
The physical stability of the DS 5007 slurry has been analyzed by oscillatory
tests with the control stress rheometer. Different stability criteria found in
literature have been applied and related to the destabilization processes
observed in the samples. An exponential correlation between the creaming
percentage and the elastic module of the mPCM slurries has been obtained
from frequency sweeps. This elastic module should take values higher than 1
Pa to improve stability. From the strain sweeps, the cohesive energy of the
mPCM slurries has been calculated and related to the creaming percentage,
obtaining in this case a linear relationship. According to the tests, this cohesive
energy should take values below 0.01 J/m3 in order to avoid the observed
creaming process. These correlations can be used as a guide so that
manufacturers can reformulate the slurry to achieve better physical stability. In
addition, the duration of the destabilization time could be estimated without the
necessity of waiting for the complete destabilization.
CHAPTER 4. Analysis of stability and compatibility of thermal energy storage systems with PCM
123
The rupture of the microcapsules in the DS 5007 sample that were thermally
and mechanically cycled during 3 weeks (having experienced approximately in
the order of 10000 melting-solidification cycles) was observed with the
environmental SEM microscope. In relation to the DS 5045 sample, the
microscope observations were not so conclusive.
Regarding the analysis of possible microbiological contamination in the PCM
slurries, contamination by fungi and bacteria were found in one of the samples
stored in the laboratory. The presence of the Aspergillus fungus and of the
Legionella bacterium was dismissed. The need for biocides is evident.
In the case of TES systems with spherical PCM capsules, the compatibility of
different low temperature PCMs with these containers has been analyzed. This
compatibility analysis was conducted from the measurement of the mass
variation over time. A mass loss through the plastic of the sphere in the case of
organic PCMs was observed. After 392 days, the organic PCMs EPS A8, RT6
and RT9 lost 0.422, 0.322 and 0.123% of mass, respectively. In the inorganic
PCM CLIMSEL C7, the sphere gained a mass of 0.017%. Although mass loss
was not observed, the possible water absorption of the hydrated salt should be
studied.
With regard to the corrosion study, none of the specimens of stainless steel
UNS S30400 and UNS A31600 were oxidized. Although the specimens of
aluminum UNS A96061 and copper UNS C70600 were oxidized, this oxidation
was not very significant, being more perceptible in aluminum. Aluminum, in its
most unfavorable situation (totally immersed in the contaminated sample DS
5007), showed a corrosion rate of 1.72·10-6 (g/(cm2·h)). In the copper sample a
rate of 3.28·10-7 g/(cm2·h) was measured when the sample was partially
immersed in the contaminated DS 5007 sample. In spite of this, both materials
could be used since they show good resistance against corrosion.

Analysis of microencapsulated phase change material slurries and phase change material emulsions as heat transfer fluid and thermal storage material
124
CHAPTER 5. Design, start-up and validation of an experimental installation for the study of heat transfer and pressure loss in microencapsulated PCM slurries and PCM emulsions
125
This chapter covers the design, start-up and validation of an experimental installation which allows the study of the heat transfer phenomenon and the fluid mechanics of mPCM slurries and PCM emulsions. The problems arising during this stage and the measures adopted for their solution are set out.
5 Design, start-up and validation of an experimental installation for the study of heat transfer and pressure loss in microencapsulated PCM slurries and PCM emulsions
Analysis of microencapsulated phase change material slurries and phase change material emulsions as heat transfer fluid and thermal storage material
126
5.1 Introduction
In the bibliographic review given in chapter 1, it was observed that the existing
results to date concerning heat transfer processes in mPCM slurries and PCM
emulsions are incomplete and contradictory in many cases. These results do
not show clear evidence of improvement in the heat transfer process. For this
reason it was decided to carry out the design, start-up and validation of an
experimental installation that allows studying the heat transfer by internal forced
convection of mPCM slurries and PCM emulsions flowing through tubes, under
laminar flow conditions and boundary conditions of constant heat flux. A
detailed test methodology has been proposed for obtaining these convective
coefficients, as the observed variations among the different experimental works
in the scientific literature could have their origin in the use of an incorrect test
methodology. In some of these works, a lack of information has been detected
about the description of the validation process of the experimental installations
with which their authors obtain convective coefficients.
Simple test conditions have been chosen to obtain initial conclusions. On the
one hand, constant heat flux has been chosen as a boundary condition, since
this condition is simpler to achieve than constant surface temperature, although
in real applications the boundary condition would be an intermediate condition
between the two. Regarding the flow pattern, laminar flow has been chosen.
mPCM slurries and PCM emulsions have considerably higher viscosities than
water, so if it is wanted to test under turbulent flow conditions, considerably
higher mass flows are needed and therefore high heating powers if the PCM in
suspension has to change its phase. If the most unfavorable of the PCM
dispersions in relation to its viscosity among those analyzed in section 3.2.1 is
taken, which is the DS 5045 slurry with a 35% microcapsule mass fraction, this
reaches a viscosity of 0.2 Pa·s in its Newtonian plateau (shear rates that match
the fluid flow). To work under transition or turbulent flow conditions, the mass
flow should be higher than 3.6 kg/s. Taking a phase change enthalpy of around
50 kJ/kg according to figure 2.3 would require a heating power of 180 kW for
the PCM in suspension to change its phase.
Given this is a case of internal forced convection in a tube under laminar flow
conditions, the thermal boundary layer is not going to develop freely. Two
regions can appear in the test section of the experimental installation: the
thermal entry region and the fully developed thermal region. Although in the
latter region the convective heat transfer coefficient remains practically
constant, this does not occur in the thermal entry region where the convective
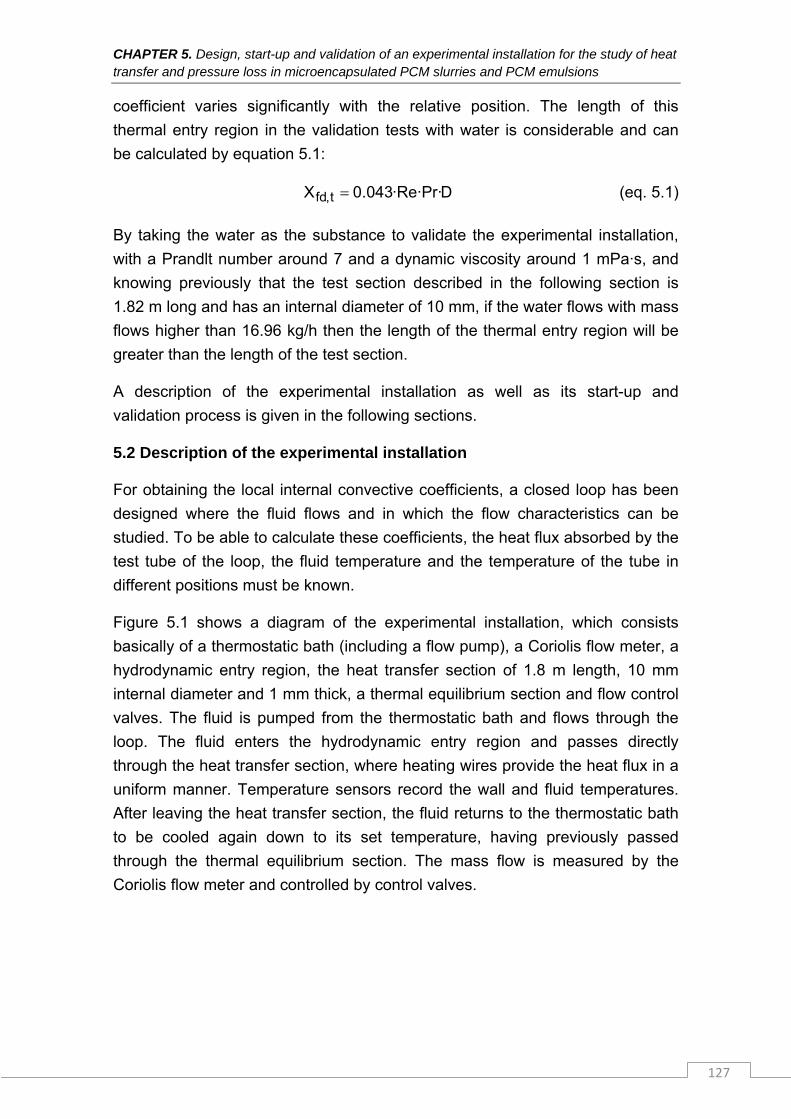
CHAPTER 5. Design, start-up and validation of an experimental installation for the study of heat transfer and pressure loss in microencapsulated PCM slurries and PCM emulsions
127
coefficient varies significantly with the relative position. The length of this
thermal entry region in the validation tests with water is considerable and can
be calculated by equation 5.1:
D·Re·Pr·043.0X t,fd (eq. 5.1)
By taking the water as the substance to validate the experimental installation,
with a Prandlt number around 7 and a dynamic viscosity around 1 mPa·s, and
knowing previously that the test section described in the following section is
1.82 m long and has an internal diameter of 10 mm, if the water flows with mass
flows higher than 16.96 kg/h then the length of the thermal entry region will be
greater than the length of the test section.
A description of the experimental installation as well as its start-up and
validation process is given in the following sections.
5.2 Description of the experimental installation
For obtaining the local internal convective coefficients, a closed loop has been
designed where the fluid flows and in which the flow characteristics can be
studied. To be able to calculate these coefficients, the heat flux absorbed by the
test tube of the loop, the fluid temperature and the temperature of the tube in
different positions must be known.
Figure 5.1 shows a diagram of the experimental installation, which consists
basically of a thermostatic bath (including a flow pump), a Coriolis flow meter, a
hydrodynamic entry region, the heat transfer section of 1.8 m length, 10 mm
internal diameter and 1 mm thick, a thermal equilibrium section and flow control
valves. The fluid is pumped from the thermostatic bath and flows through the
loop. The fluid enters the hydrodynamic entry region and passes directly
through the heat transfer section, where heating wires provide the heat flux in a
uniform manner. Temperature sensors record the wall and fluid temperatures.
After leaving the heat transfer section, the fluid returns to the thermostatic bath
to be cooled again down to its set temperature, having previously passed
through the thermal equilibrium section. The mass flow is measured by the
Coriolis flow meter and controlled by control valves.
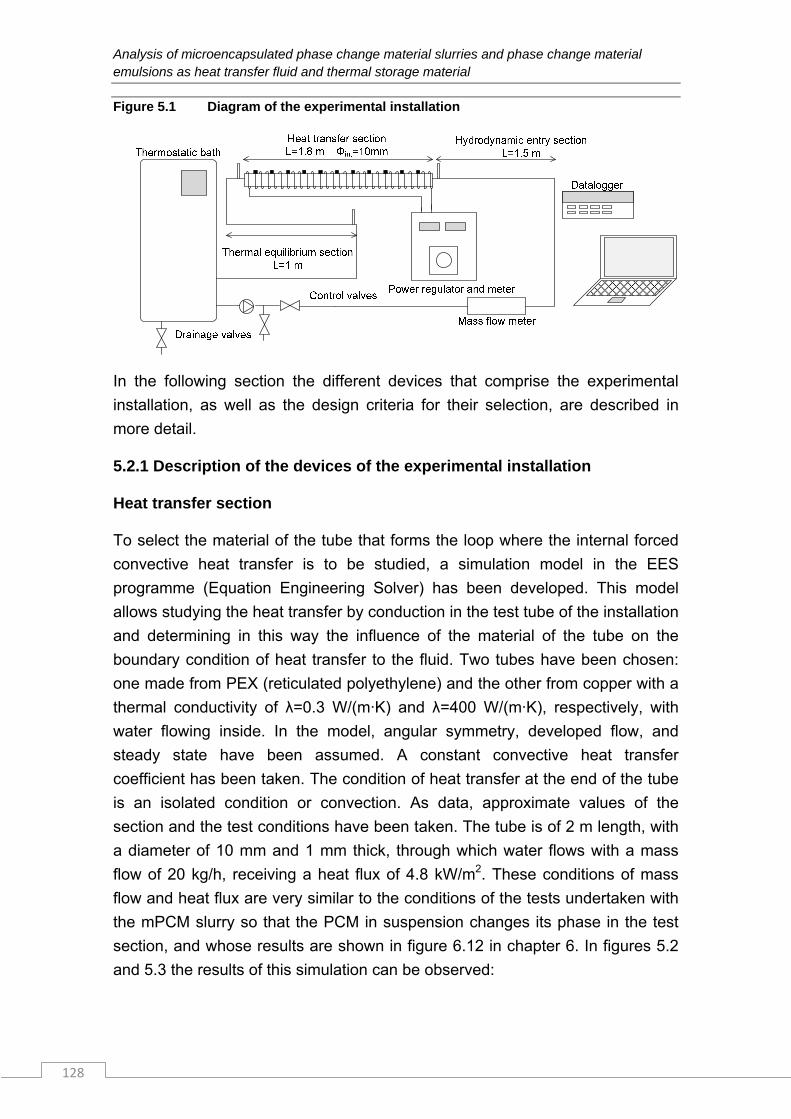
Analysis of microencapsulated phase change material slurries and phase change material emulsions as heat transfer fluid and thermal storage material
128
Figure 5.1 Diagram of the experimental installation
In the following section the different devices that comprise the experimental
installation, as well as the design criteria for their selection, are described in
more detail.
5.2.1 Description of the devices of the experimental installation
Heat transfer section
To select the material of the tube that forms the loop where the internal forced
convective heat transfer is to be studied, a simulation model in the EES
programme (Equation Engineering Solver) has been developed. This model
allows studying the heat transfer by conduction in the test tube of the installation
and determining in this way the influence of the material of the tube on the
boundary condition of heat transfer to the fluid. Two tubes have been chosen:
one made from PEX (reticulated polyethylene) and the other from copper with a
thermal conductivity of λ=0.3 W/(m·K) and λ=400 W/(m·K), respectively, with
water flowing inside. In the model, angular symmetry, developed flow, and
steady state have been assumed. A constant convective heat transfer
coefficient has been taken. The condition of heat transfer at the end of the tube
is an isolated condition or convection. As data, approximate values of the
section and the test conditions have been taken. The tube is of 2 m length, with
a diameter of 10 mm and 1 mm thick, through which water flows with a mass
flow of 20 kg/h, receiving a heat flux of 4.8 kW/m2. These conditions of mass
flow and heat flux are very similar to the conditions of the tests undertaken with
the mPCM slurry so that the PCM in suspension changes its phase in the test
section, and whose results are shown in figure 6.12 in chapter 6. In figures 5.2
and 5.3 the results of this simulation can be observed:
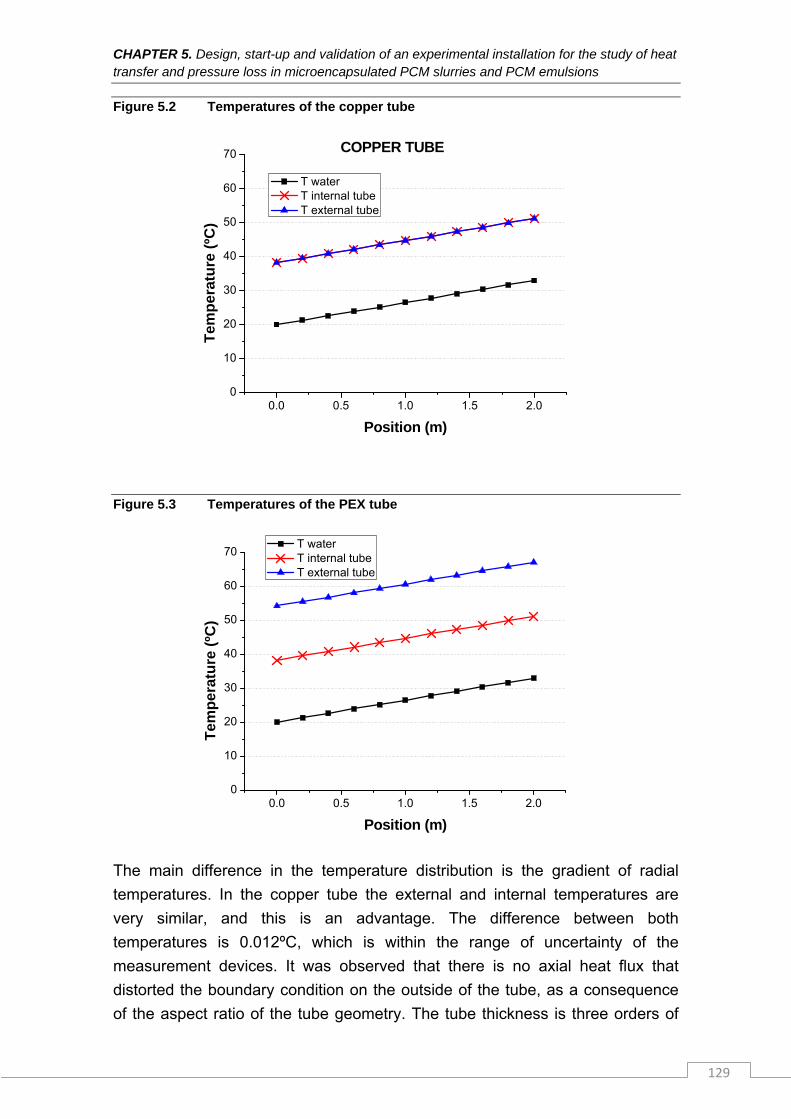
CHAPTER 5. Design, start-up and validation of an experimental installation for the study of heat transfer and pressure loss in microencapsulated PCM slurries and PCM emulsions
129
Figure 5.2 Temperatures of the copper tube
0.0 0.5 1.0 1.5 2.00
10
20
30
40
50
60
70
Tem
per
atu
re (
ºC)
Position (m)
T water T internal tube T external tube
COPPER TUBE
Figure 5.3 Temperatures of the PEX tube
0.0 0.5 1.0 1.5 2.00
10
20
30
40
50
60
70
Tem
per
atu
re (
ºC)
Position (m)
T water T internal tube T external tube
The main difference in the temperature distribution is the gradient of radial
temperatures. In the copper tube the external and internal temperatures are
very similar, and this is an advantage. The difference between both
temperatures is 0.012ºC, which is within the range of uncertainty of the
measurement devices. It was observed that there is no axial heat flux that
distorted the boundary condition on the outside of the tube, as a consequence
of the aspect ratio of the tube geometry. The tube thickness is three orders of
Analysis of microencapsulated phase change material slurries and phase change material emulsions as heat transfer fluid and thermal storage material
130
magnitude lower than the length. The heat transfer resistance by axial
conduction is thus much higher than in the radial direction. Therefore, uniform
heat flux can be taken as a boundary condition.
It was thus considered that the best option was to use a copper tube and to
consider the inner tube temperature the same as the outer tube temperature,
with uniform and constant heat flux as a boundary condition.
Tests were carried out after an adiabatic section, to have a fully developed
hydraulic region and to avoid the simultaneous development of the thermal
layer and the hydrodynamic layer in the region called throughout work the “heat
transfer section”. It is in this section where the heat transfer phenomenon by
internal convection has been studied. The hydraulic development for laminar
flow must be taken into account from the elbow, as although the velocity profile
is developed at the entrance of the elbow, passing through it causes an
alteration. The velocity profile has been studied with the computational fluid
dynamics software Fluent. In the light of these results, a 1.5 m long section was
considered necessary so that the flow enters the test section fully developed.
Thermostatic bath
A Hüber model Unichiller UC040T thermostatic bath was chosen to control the
inlet temperature of the test section. This is a chiller cooled by air. Besides, this
model has heating allowing a maximum temperature of 100ºC to be reached.
The temperature stability of the bath is 0.1 K. The selection of this bath was
made based on the work by Gschwander et al. (2005). After testing different
pumps, the author of this work concluded that centrifugal pumps were able to
pump mPCM slurries during a longer period of time without damaging or
breaking the microcapsules.
Mass flow meter
When selecting the mass flow meter, the following criteria were taken into
account: 1) the type of flow to be measured, in this case mPCM slurries which
can reach significant viscosity values, 2) the measurement range and 3) the
accuracy of the measurement.
After analyzing the different types of flow meters, the Coriolis mass flow meter
model Optimas 7000 with MFC300 converter shown in figure 5.4 was selected.
It has an accuracy of 0.1% for liquids and its measurement range is 0.3-7 l/min.
The calibration certificate is attached in Appendix II.
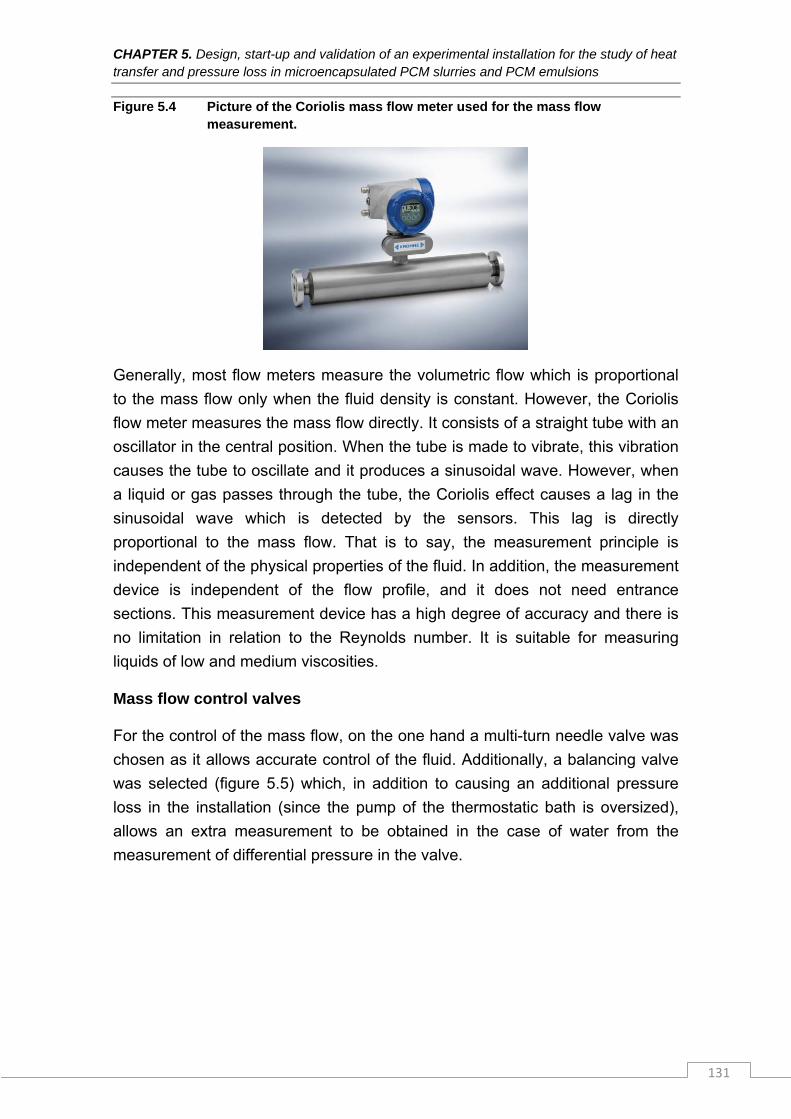
CHAPTER 5. Design, start-up and validation of an experimental installation for the study of heat transfer and pressure loss in microencapsulated PCM slurries and PCM emulsions
131
Figure 5.4 Picture of the Coriolis mass flow meter used for the mass flow measurement.
Generally, most flow meters measure the volumetric flow which is proportional
to the mass flow only when the fluid density is constant. However, the Coriolis
flow meter measures the mass flow directly. It consists of a straight tube with an
oscillator in the central position. When the tube is made to vibrate, this vibration
causes the tube to oscillate and it produces a sinusoidal wave. However, when
a liquid or gas passes through the tube, the Coriolis effect causes a lag in the
sinusoidal wave which is detected by the sensors. This lag is directly
proportional to the mass flow. That is to say, the measurement principle is
independent of the physical properties of the fluid. In addition, the measurement
device is independent of the flow profile, and it does not need entrance
sections. This measurement device has a high degree of accuracy and there is
no limitation in relation to the Reynolds number. It is suitable for measuring
liquids of low and medium viscosities.
Mass flow control valves
For the control of the mass flow, on the one hand a multi-turn needle valve was
chosen as it allows accurate control of the fluid. Additionally, a balancing valve
was selected (figure 5.5) which, in addition to causing an additional pressure
loss in the installation (since the pump of the thermostatic bath is oversized),
allows an extra measurement to be obtained in the case of water from the
measurement of differential pressure in the valve.
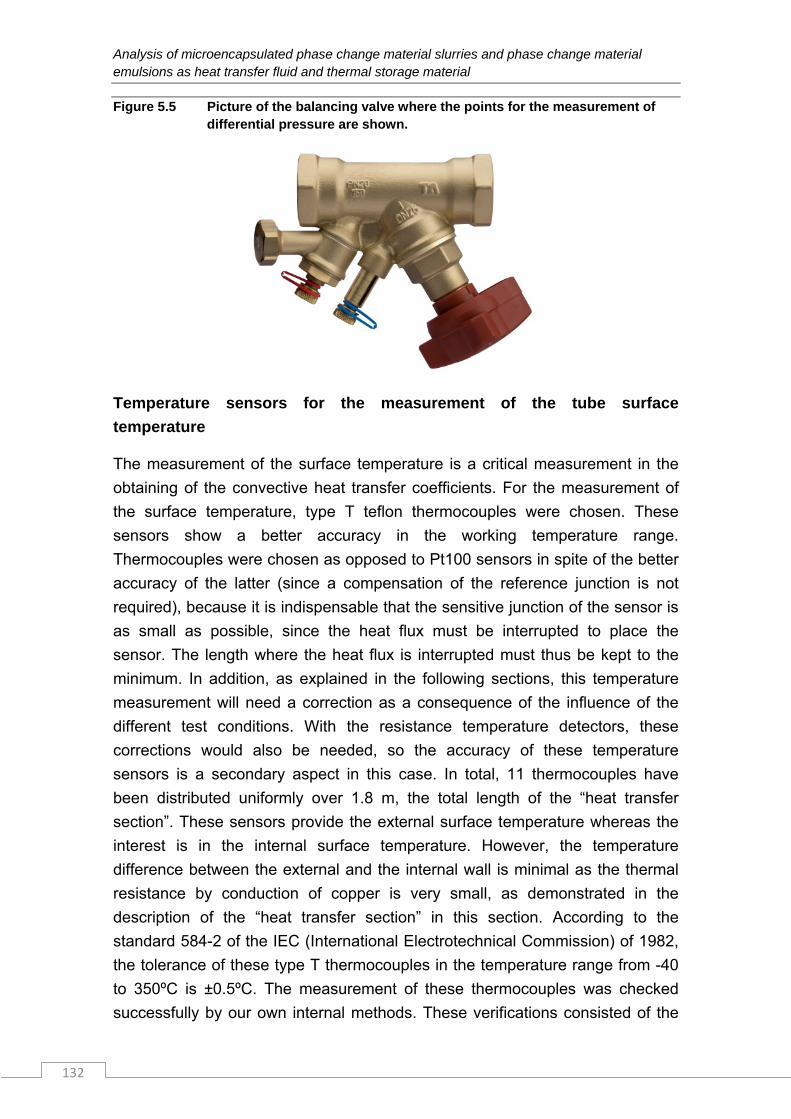
Analysis of microencapsulated phase change material slurries and phase change material emulsions as heat transfer fluid and thermal storage material
132
Figure 5.5 Picture of the balancing valve where the points for the measurement of differential pressure are shown.
Temperature sensors for the measurement of the tube surface
temperature
The measurement of the surface temperature is a critical measurement in the
obtaining of the convective heat transfer coefficients. For the measurement of
the surface temperature, type T teflon thermocouples were chosen. These
sensors show a better accuracy in the working temperature range.
Thermocouples were chosen as opposed to Pt100 sensors in spite of the better
accuracy of the latter (since a compensation of the reference junction is not
required), because it is indispensable that the sensitive junction of the sensor is
as small as possible, since the heat flux must be interrupted to place the
sensor. The length where the heat flux is interrupted must thus be kept to the
minimum. In addition, as explained in the following sections, this temperature
measurement will need a correction as a consequence of the influence of the
different test conditions. With the resistance temperature detectors, these
corrections would also be needed, so the accuracy of these temperature
sensors is a secondary aspect in this case. In total, 11 thermocouples have
been distributed uniformly over 1.8 m, the total length of the “heat transfer
section”. These sensors provide the external surface temperature whereas the
interest is in the internal surface temperature. However, the temperature
difference between the external and the internal wall is minimal as the thermal
resistance by conduction of copper is very small, as demonstrated in the
description of the “heat transfer section” in this section. According to the
standard 584-2 of the IEC (International Electrotechnical Commission) of 1982,
the tolerance of these type T thermocouples in the temperature range from -40
to 350ºC is ±0.5ºC. The measurement of these thermocouples was checked
successfully by our own internal methods. These verifications consisted of the
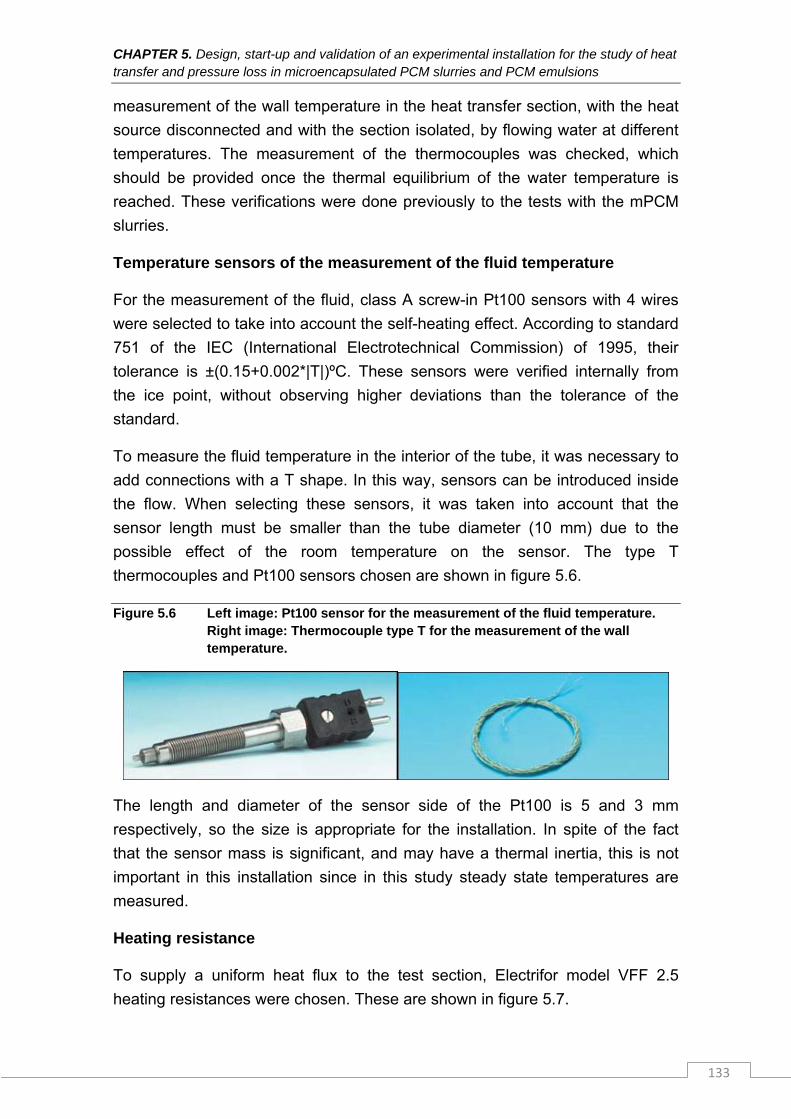
CHAPTER 5. Design, start-up and validation of an experimental installation for the study of heat transfer and pressure loss in microencapsulated PCM slurries and PCM emulsions
133
measurement of the wall temperature in the heat transfer section, with the heat
source disconnected and with the section isolated, by flowing water at different
temperatures. The measurement of the thermocouples was checked, which
should be provided once the thermal equilibrium of the water temperature is
reached. These verifications were done previously to the tests with the mPCM
slurries.
Temperature sensors of the measurement of the fluid temperature
For the measurement of the fluid, class A screw-in Pt100 sensors with 4 wires
were selected to take into account the self-heating effect. According to standard
751 of the IEC (International Electrotechnical Commission) of 1995, their
tolerance is ±(0.15+0.002*|T|)ºC. These sensors were verified internally from
the ice point, without observing higher deviations than the tolerance of the
standard.
To measure the fluid temperature in the interior of the tube, it was necessary to
add connections with a T shape. In this way, sensors can be introduced inside
the flow. When selecting these sensors, it was taken into account that the
sensor length must be smaller than the tube diameter (10 mm) due to the
possible effect of the room temperature on the sensor. The type T
thermocouples and Pt100 sensors chosen are shown in figure 5.6.
Figure 5.6 Left image: Pt100 sensor for the measurement of the fluid temperature. Right image: Thermocouple type T for the measurement of the wall temperature.
The length and diameter of the sensor side of the Pt100 is 5 and 3 mm
respectively, so the size is appropriate for the installation. In spite of the fact
that the sensor mass is significant, and may have a thermal inertia, this is not
important in this installation since in this study steady state temperatures are
measured.
Heating resistance
To supply a uniform heat flux to the test section, Electrifor model VFF 2.5
heating resistances were chosen. These are shown in figure 5.7.
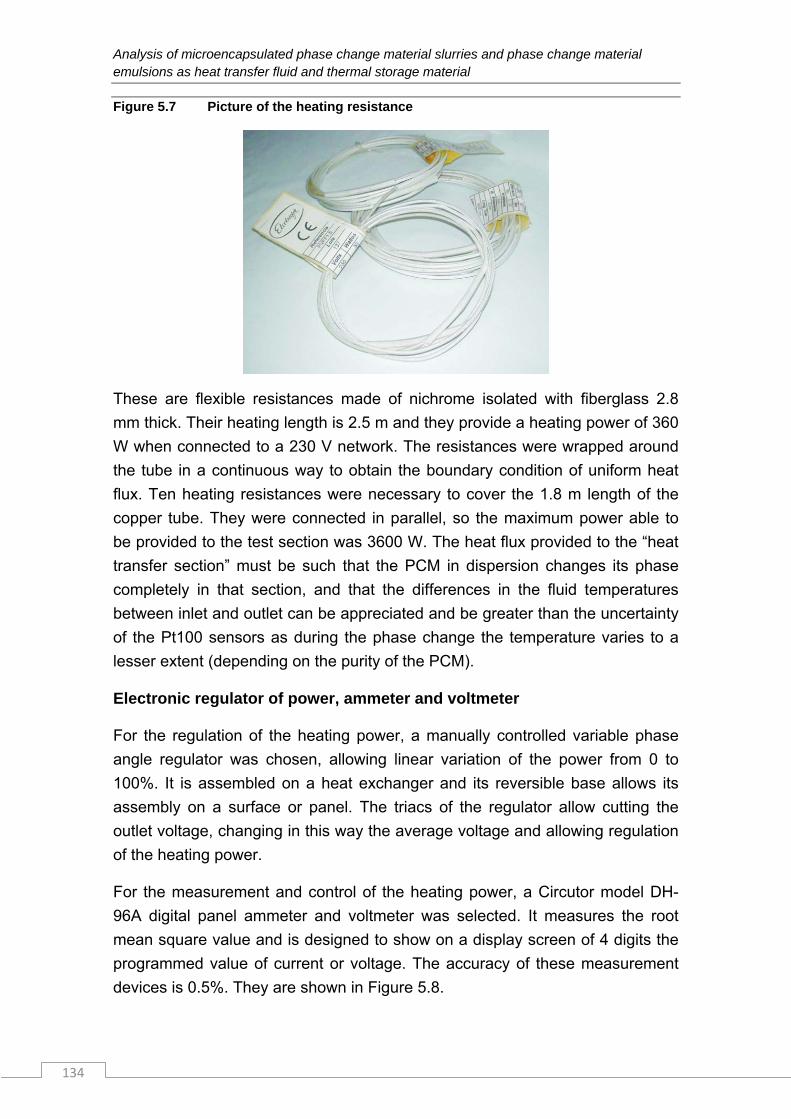
Analysis of microencapsulated phase change material slurries and phase change material emulsions as heat transfer fluid and thermal storage material
134
Figure 5.7 Picture of the heating resistance
These are flexible resistances made of nichrome isolated with fiberglass 2.8
mm thick. Their heating length is 2.5 m and they provide a heating power of 360
W when connected to a 230 V network. The resistances were wrapped around
the tube in a continuous way to obtain the boundary condition of uniform heat
flux. Ten heating resistances were necessary to cover the 1.8 m length of the
copper tube. They were connected in parallel, so the maximum power able to
be provided to the test section was 3600 W. The heat flux provided to the “heat
transfer section” must be such that the PCM in dispersion changes its phase
completely in that section, and that the differences in the fluid temperatures
between inlet and outlet can be appreciated and be greater than the uncertainty
of the Pt100 sensors as during the phase change the temperature varies to a
lesser extent (depending on the purity of the PCM).
Electronic regulator of power, ammeter and voltmeter
For the regulation of the heating power, a manually controlled variable phase
angle regulator was chosen, allowing linear variation of the power from 0 to
100%. It is assembled on a heat exchanger and its reversible base allows its
assembly on a surface or panel. The triacs of the regulator allow cutting the
outlet voltage, changing in this way the average voltage and allowing regulation
of the heating power.
For the measurement and control of the heating power, a Circutor model DH-
96A digital panel ammeter and voltmeter was selected. It measures the root
mean square value and is designed to show on a display screen of 4 digits the
programmed value of current or voltage. The accuracy of these measurement
devices is 0.5%. They are shown in Figure 5.8.
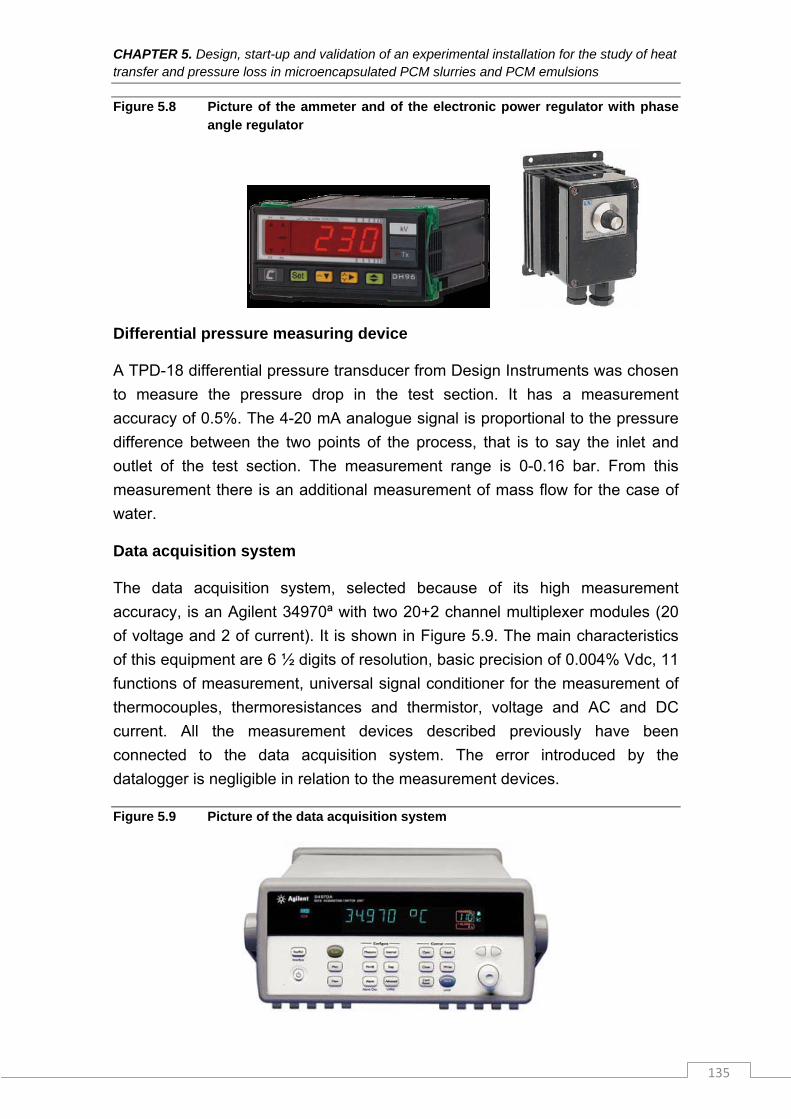
CHAPTER 5. Design, start-up and validation of an experimental installation for the study of heat transfer and pressure loss in microencapsulated PCM slurries and PCM emulsions
135
Figure 5.8 Picture of the ammeter and of the electronic power regulator with phase angle regulator
Differential pressure measuring device
A TPD-18 differential pressure transducer from Design Instruments was chosen
to measure the pressure drop in the test section. It has a measurement
accuracy of 0.5%. The 4-20 mA analogue signal is proportional to the pressure
difference between the two points of the process, that is to say the inlet and
outlet of the test section. The measurement range is 0-0.16 bar. From this
measurement there is an additional measurement of mass flow for the case of
water.
Data acquisition system
The data acquisition system, selected because of its high measurement
accuracy, is an Agilent 34970ª with two 20+2 channel multiplexer modules (20
of voltage and 2 of current). It is shown in Figure 5.9. The main characteristics
of this equipment are 6 ½ digits of resolution, basic precision of 0.004% Vdc, 11
functions of measurement, universal signal conditioner for the measurement of
thermocouples, thermoresistances and thermistor, voltage and AC and DC
current. All the measurement devices described previously have been
connected to the data acquisition system. The error introduced by the
datalogger is negligible in relation to the measurement devices.
Figure 5.9 Picture of the data acquisition system
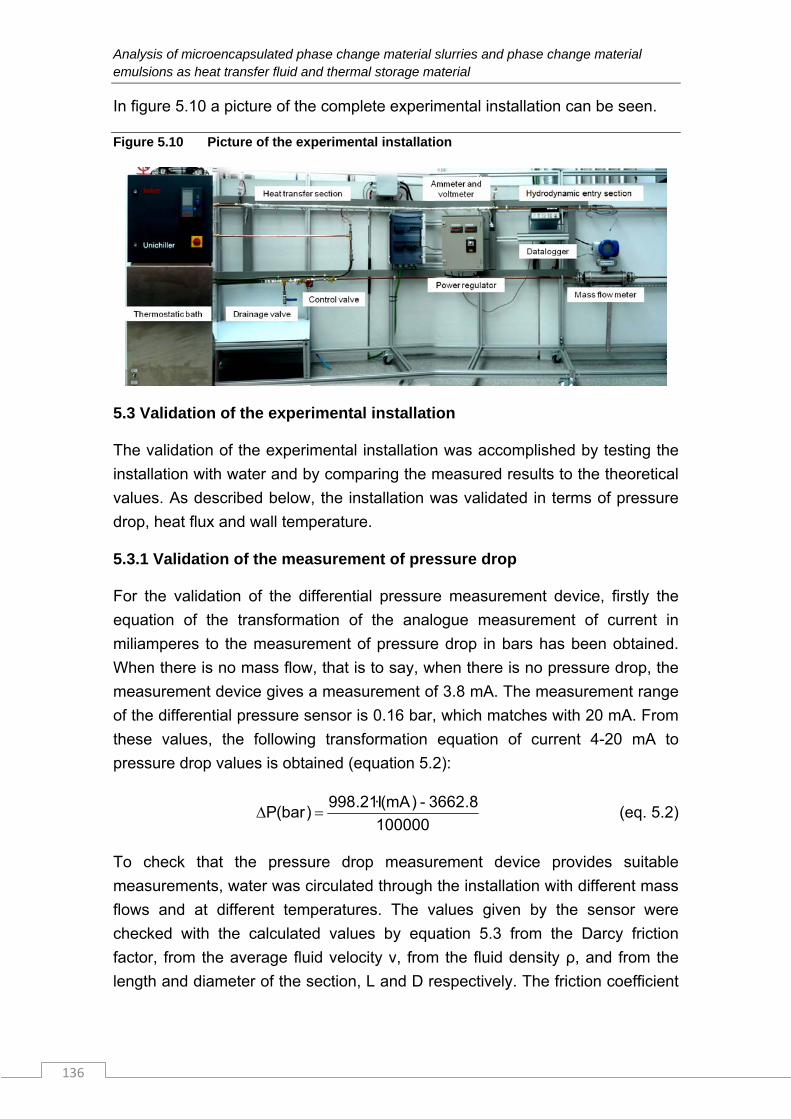
Analysis of microencapsulated phase change material slurries and phase change material emulsions as heat transfer fluid and thermal storage material
136
In figure 5.10 a picture of the complete experimental installation can be seen.
Figure 5.10 Picture of the experimental installation
5.3 Validation of the experimental installation
The validation of the experimental installation was accomplished by testing the
installation with water and by comparing the measured results to the theoretical
values. As described below, the installation was validated in terms of pressure
drop, heat flux and wall temperature.
5.3.1 Validation of the measurement of pressure drop
For the validation of the differential pressure measurement device, firstly the
equation of the transformation of the analogue measurement of current in
miliamperes to the measurement of pressure drop in bars has been obtained.
When there is no mass flow, that is to say, when there is no pressure drop, the
measurement device gives a measurement of 3.8 mA. The measurement range
of the differential pressure sensor is 0.16 bar, which matches with 20 mA. From
these values, the following transformation equation of current 4-20 mA to
pressure drop values is obtained (equation 5.2):
100000
8.3662-)mA(I·21.998)bar(P (eq. 5.2)
To check that the pressure drop measurement device provides suitable
measurements, water was circulated through the installation with different mass
flows and at different temperatures. The values given by the sensor were
checked with the calculated values by equation 5.3 from the Darcy friction
factor, from the average fluid velocity v, from the fluid density ρ, and from the
length and diameter of the section, L and D respectively. The friction coefficient
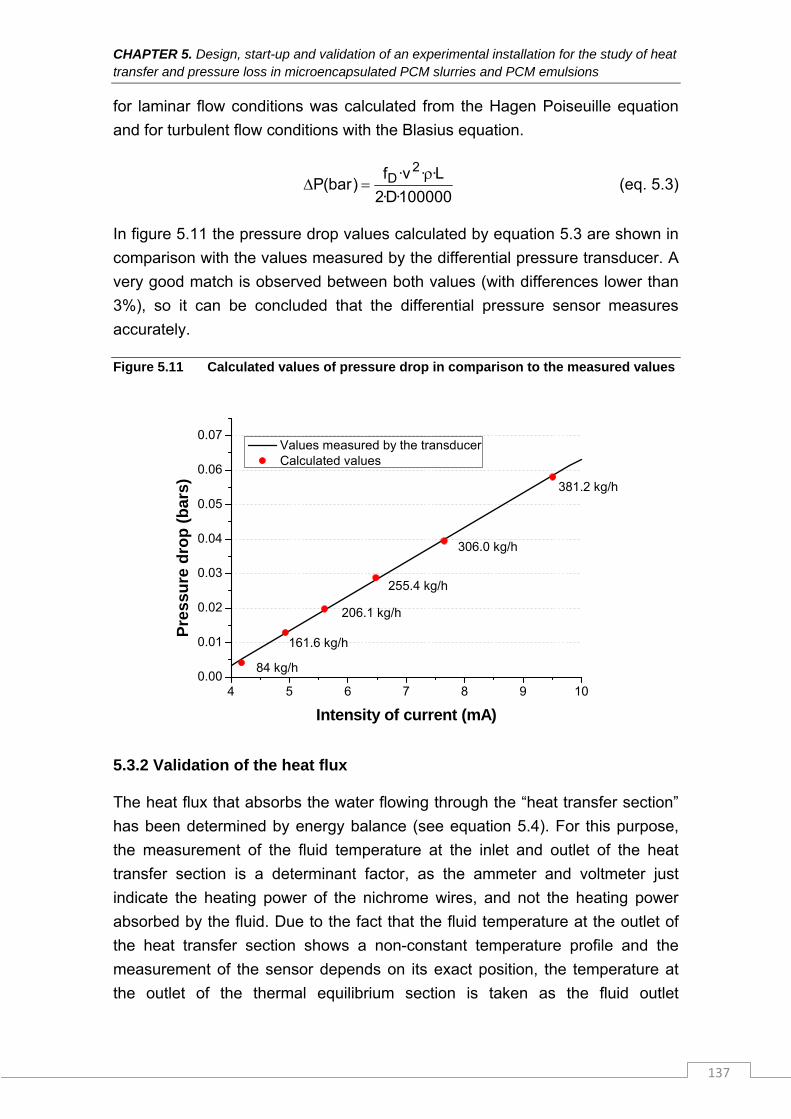
CHAPTER 5. Design, start-up and validation of an experimental installation for the study of heat transfer and pressure loss in microencapsulated PCM slurries and PCM emulsions
137
for laminar flow conditions was calculated from the Hagen Poiseuille equation
and for turbulent flow conditions with the Blasius equation.
100000·D·2
L··v·f)bar(P
2D
(eq. 5.3)
In figure 5.11 the pressure drop values calculated by equation 5.3 are shown in
comparison with the values measured by the differential pressure transducer. A
very good match is observed between both values (with differences lower than
3%), so it can be concluded that the differential pressure sensor measures
accurately.
Figure 5.11 Calculated values of pressure drop in comparison to the measured values
4 5 6 7 8 9 100.00
0.01
0.02
0.03
0.04
0.05
0.06
0.07
381.2 kg/h
306.0 kg/h
161.6 kg/h
206.1 kg/h
255.4 kg/h
Pre
ssu
re d
rop
(b
ars)
Intensity of current (mA)
Values measured by the transducer Calculated values
84 kg/h
5.3.2 Validation of the heat flux
The heat flux that absorbs the water flowing through the “heat transfer section”
has been determined by energy balance (see equation 5.4). For this purpose,
the measurement of the fluid temperature at the inlet and outlet of the heat
transfer section is a determinant factor, as the ammeter and voltmeter just
indicate the heating power of the nichrome wires, and not the heating power
absorbed by the fluid. Due to the fact that the fluid temperature at the outlet of
the heat transfer section shows a non-constant temperature profile and the
measurement of the sensor depends on its exact position, the temperature at
the outlet of the thermal equilibrium section is taken as the fluid outlet
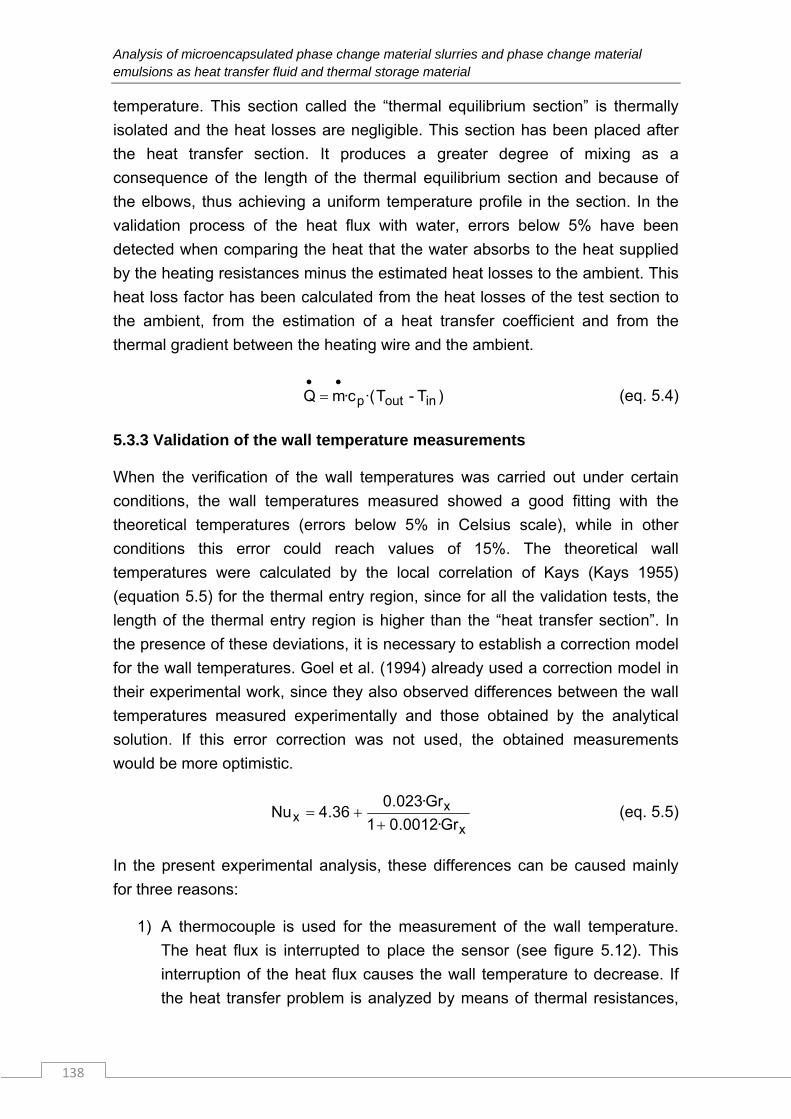
Analysis of microencapsulated phase change material slurries and phase change material emulsions as heat transfer fluid and thermal storage material
138
temperature. This section called the “thermal equilibrium section” is thermally
isolated and the heat losses are negligible. This section has been placed after
the heat transfer section. It produces a greater degree of mixing as a
consequence of the length of the thermal equilibrium section and because of
the elbows, thus achieving a uniform temperature profile in the section. In the
validation process of the heat flux with water, errors below 5% have been
detected when comparing the heat that the water absorbs to the heat supplied
by the heating resistances minus the estimated heat losses to the ambient. This
heat loss factor has been calculated from the heat losses of the test section to
the ambient, from the estimation of a heat transfer coefficient and from the
thermal gradient between the heating wire and the ambient.
)T-T·(c·mQ inoutp
(eq. 5.4)
5.3.3 Validation of the wall temperature measurements
When the verification of the wall temperatures was carried out under certain
conditions, the wall temperatures measured showed a good fitting with the
theoretical temperatures (errors below 5% in Celsius scale), while in other
conditions this error could reach values of 15%. The theoretical wall
temperatures were calculated by the local correlation of Kays (Kays 1955)
(equation 5.5) for the thermal entry region, since for all the validation tests, the
length of the thermal entry region is higher than the “heat transfer section”. In
the presence of these deviations, it is necessary to establish a correction model
for the wall temperatures. Goel et al. (1994) already used a correction model in
their experimental work, since they also observed differences between the wall
temperatures measured experimentally and those obtained by the analytical
solution. If this error correction was not used, the obtained measurements
would be more optimistic.
x
xx Gr·0012.01
Gr·023.036.4Nu
(eq. 5.5)
In the present experimental analysis, these differences can be caused mainly
for three reasons:
1) A thermocouple is used for the measurement of the wall temperature.
The heat flux is interrupted to place the sensor (see figure 5.12). This
interruption of the heat flux causes the wall temperature to decrease. If
the heat transfer problem is analyzed by means of thermal resistances,
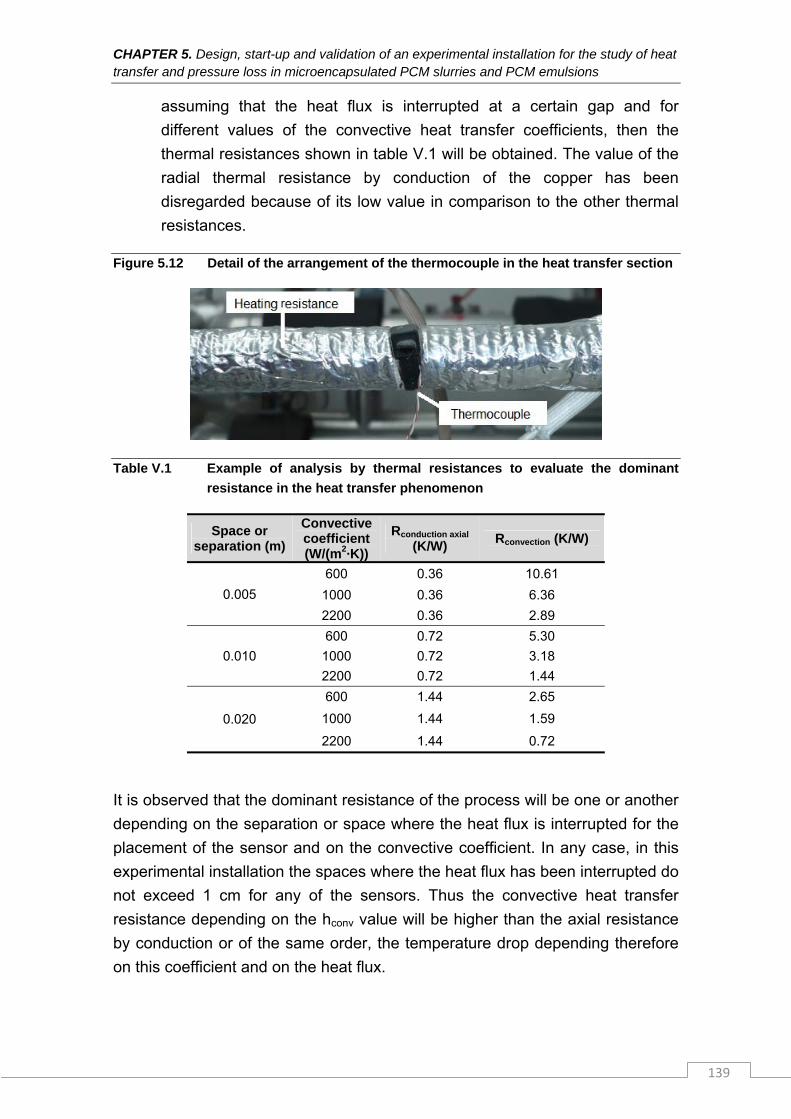
CHAPTER 5. Design, start-up and validation of an experimental installation for the study of heat transfer and pressure loss in microencapsulated PCM slurries and PCM emulsions
139
assuming that the heat flux is interrupted at a certain gap and for
different values of the convective heat transfer coefficients, then the
thermal resistances shown in table V.1 will be obtained. The value of the
radial thermal resistance by conduction of the copper has been
disregarded because of its low value in comparison to the other thermal
resistances.
Figure 5.12 Detail of the arrangement of the thermocouple in the heat transfer section
Table V.1 Example of analysis by thermal resistances to evaluate the dominant
resistance in the heat transfer phenomenon
Space or separation (m)
Convective coefficient (W/(m2·K))
Rconduction axial
(K/W) Rconvection (K/W)
0.005
600 0.36 10.61
1000 0.36 6.36
2200 0.36 2.89
0.010
600 0.72 5.30
1000 0.72 3.18
2200 0.72 1.44
0.020
600 1.44 2.65
1000 1.44 1.59
2200 1.44 0.72
It is observed that the dominant resistance of the process will be one or another
depending on the separation or space where the heat flux is interrupted for the
placement of the sensor and on the convective coefficient. In any case, in this
experimental installation the spaces where the heat flux has been interrupted do
not exceed 1 cm for any of the sensors. Thus the convective heat transfer
resistance depending on the hconv value will be higher than the axial resistance
by conduction or of the same order, the temperature drop depending therefore
on this coefficient and on the heat flux.
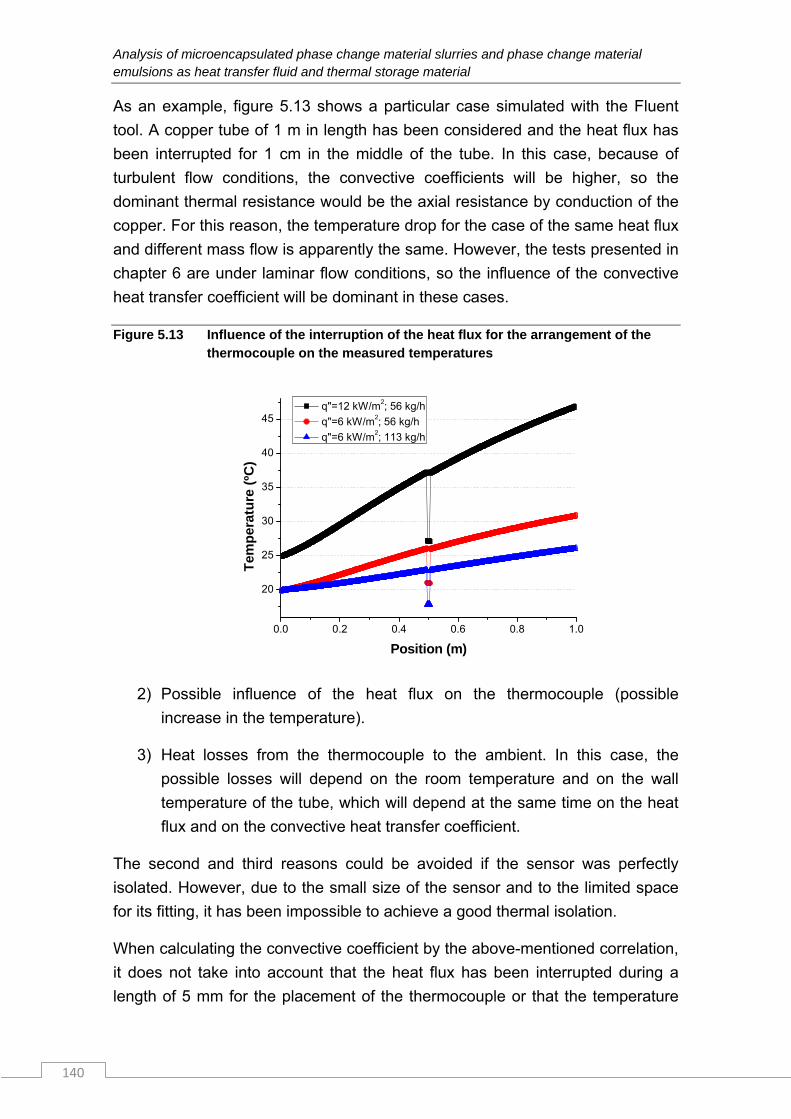
Analysis of microencapsulated phase change material slurries and phase change material emulsions as heat transfer fluid and thermal storage material
140
As an example, figure 5.13 shows a particular case simulated with the Fluent
tool. A copper tube of 1 m in length has been considered and the heat flux has
been interrupted for 1 cm in the middle of the tube. In this case, because of
turbulent flow conditions, the convective coefficients will be higher, so the
dominant thermal resistance would be the axial resistance by conduction of the
copper. For this reason, the temperature drop for the case of the same heat flux
and different mass flow is apparently the same. However, the tests presented in
chapter 6 are under laminar flow conditions, so the influence of the convective
heat transfer coefficient will be dominant in these cases.
Figure 5.13 Influence of the interruption of the heat flux for the arrangement of the thermocouple on the measured temperatures
0.0 0.2 0.4 0.6 0.8 1.0
20
25
30
35
40
45
Tem
per
atu
re (
ºC)
Position (m)
q"=12 kW/m2; 56 kg/h
q"=6 kW/m2; 56 kg/h
q"=6 kW/m2; 113 kg/h
2) Possible influence of the heat flux on the thermocouple (possible
increase in the temperature).
3) Heat losses from the thermocouple to the ambient. In this case, the
possible losses will depend on the room temperature and on the wall
temperature of the tube, which will depend at the same time on the heat
flux and on the convective heat transfer coefficient.
The second and third reasons could be avoided if the sensor was perfectly
isolated. However, due to the small size of the sensor and to the limited space
for its fitting, it has been impossible to achieve a good thermal isolation.
When calculating the convective coefficient by the above-mentioned correlation,
it does not take into account that the heat flux has been interrupted during a
length of 5 mm for the placement of the thermocouple or that the temperature
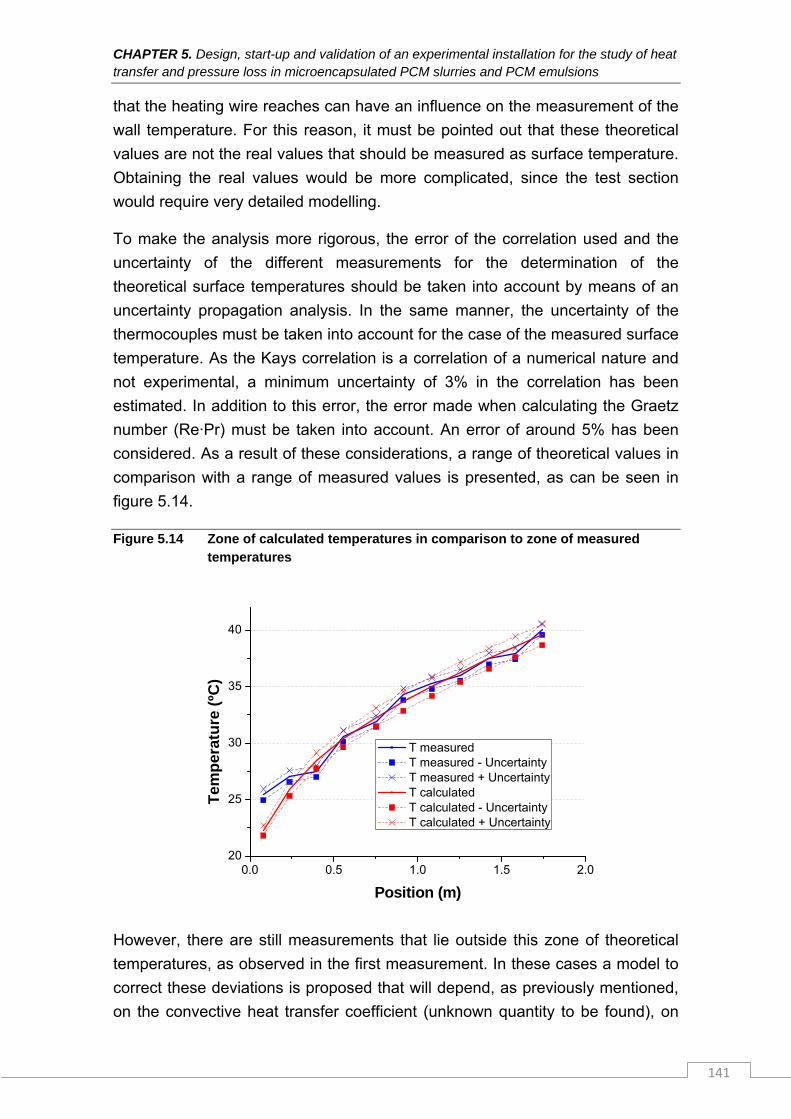
CHAPTER 5. Design, start-up and validation of an experimental installation for the study of heat transfer and pressure loss in microencapsulated PCM slurries and PCM emulsions
141
that the heating wire reaches can have an influence on the measurement of the
wall temperature. For this reason, it must be pointed out that these theoretical
values are not the real values that should be measured as surface temperature.
Obtaining the real values would be more complicated, since the test section
would require very detailed modelling.
To make the analysis more rigorous, the error of the correlation used and the
uncertainty of the different measurements for the determination of the
theoretical surface temperatures should be taken into account by means of an
uncertainty propagation analysis. In the same manner, the uncertainty of the
thermocouples must be taken into account for the case of the measured surface
temperature. As the Kays correlation is a correlation of a numerical nature and
not experimental, a minimum uncertainty of 3% in the correlation has been
estimated. In addition to this error, the error made when calculating the Graetz
number (Re·Pr) must be taken into account. An error of around 5% has been
considered. As a result of these considerations, a range of theoretical values in
comparison with a range of measured values is presented, as can be seen in
figure 5.14.
Figure 5.14 Zone of calculated temperatures in comparison to zone of measured temperatures
0.0 0.5 1.0 1.5 2.020
25
30
35
40
Tem
per
atu
re (
ºC)
Position (m)
T measured T measured - Uncertainty T measured + Uncertainty T calculated T calculated - Uncertainty T calculated + Uncertainty
However, there are still measurements that lie outside this zone of theoretical
temperatures, as observed in the first measurement. In these cases a model to
correct these deviations is proposed that will depend, as previously mentioned,
on the convective heat transfer coefficient (unknown quantity to be found), on
Analysis of microencapsulated phase change material slurries and phase change material emulsions as heat transfer fluid and thermal storage material
142
the heat flux and on the room temperature. For each sensor there will be a
temperature correction, as in some cases the sensitive junction of the
thermocouple will be more or less close to the heating wire and it can be
affected to a greater or lesser extent by each one of the effects that take place.
The repeatability of the tests has also been analyzed, observing a good
repeatability in the measurements, with maximum variations of 1ºC in the wall
temperature. These more noticeable variations are due to the difficulty of
adjusting in the tests the same mass flow, the same heat flux and the same inlet
temperature of the fluid. The room temperature in the tests, in spite of being
carried out on different days, was practically the same.
In this process of validation of the installation, a model for the temperature
correction has been suggested from the experimental data compiled during the
tests with water. Details of the model are presented in section 5.4.
5.4 Empirical model for the correction of the wall temperature
measurements
As seen in previous graphs, the temperatures measured in many of the tests
are very similar to those temperatures predicted by the Kays correlation.
However, there are certain conditions where the differences are more
significant, so a model to correct these differences is necessary. On some
occasions the studied phenomenon is well known, and it is possible to write a
functional form of theoretical considerations. Although in this case study the
factors which influence these temperature differences can be presupposed
(convective coefficient, heat flux and room temperature), the mechanism that
manages the process is not known sufficiently well or is too complicated for an
exact model to be postulated by theoretical considerations. Under these
circumstances, an empirical model can be useful.
For a room temperature of the laboratory where the experimental installation is
located and testing with water, different mass flows and different heat fluxes
have been set, obtaining for each of these tests and for each of the
thermocouples a difference in wall temperatures between the theoretical
calculated value and the measured value. Having compiled the errors of the
diverse tests, a least squares fitting of the error to a surface has been
accomplished, based on the calculated convective coefficient (unknown quantity
to be found) and on the heat flux. The error has been fitted to a polynomial of
second order (equation 5.6):
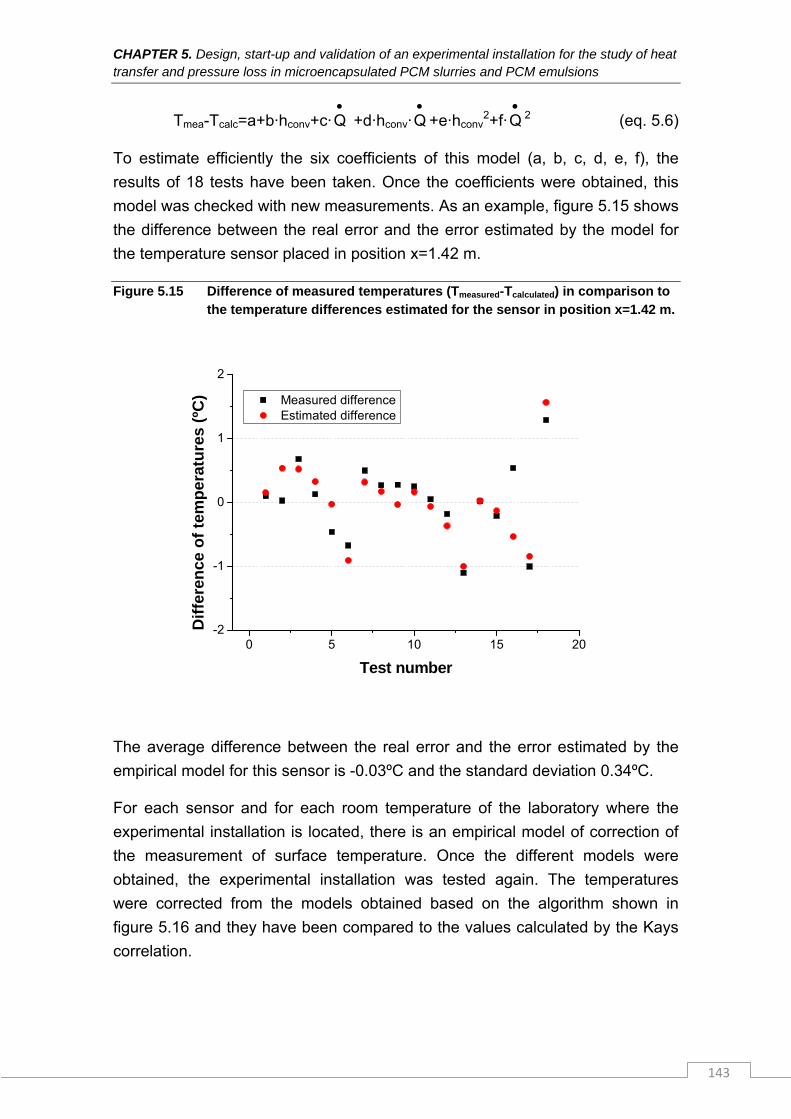
CHAPTER 5. Design, start-up and validation of an experimental installation for the study of heat transfer and pressure loss in microencapsulated PCM slurries and PCM emulsions
143
Tmea-Tcalc=a+b·hconv+c·Q +d·hconv·
Q +e·hconv
2+f·Q 2 (eq. 5.6)
To estimate efficiently the six coefficients of this model (a, b, c, d, e, f), the
results of 18 tests have been taken. Once the coefficients were obtained, this
model was checked with new measurements. As an example, figure 5.15 shows
the difference between the real error and the error estimated by the model for
the temperature sensor placed in position x=1.42 m.
Figure 5.15 Difference of measured temperatures (Tmeasured-Tcalculated) in comparison to the temperature differences estimated for the sensor in position x=1.42 m.
0 5 10 15 20-2
-1
0
1
2
Measured difference Estimated difference
Dif
fere
nce
of
tem
per
atu
res
(ºC
)
Test number
The average difference between the real error and the error estimated by the
empirical model for this sensor is -0.03ºC and the standard deviation 0.34ºC.
For each sensor and for each room temperature of the laboratory where the
experimental installation is located, there is an empirical model of correction of
the measurement of surface temperature. Once the different models were
obtained, the experimental installation was tested again. The temperatures
were corrected from the models obtained based on the algorithm shown in
figure 5.16 and they have been compared to the values calculated by the Kays
correlation.
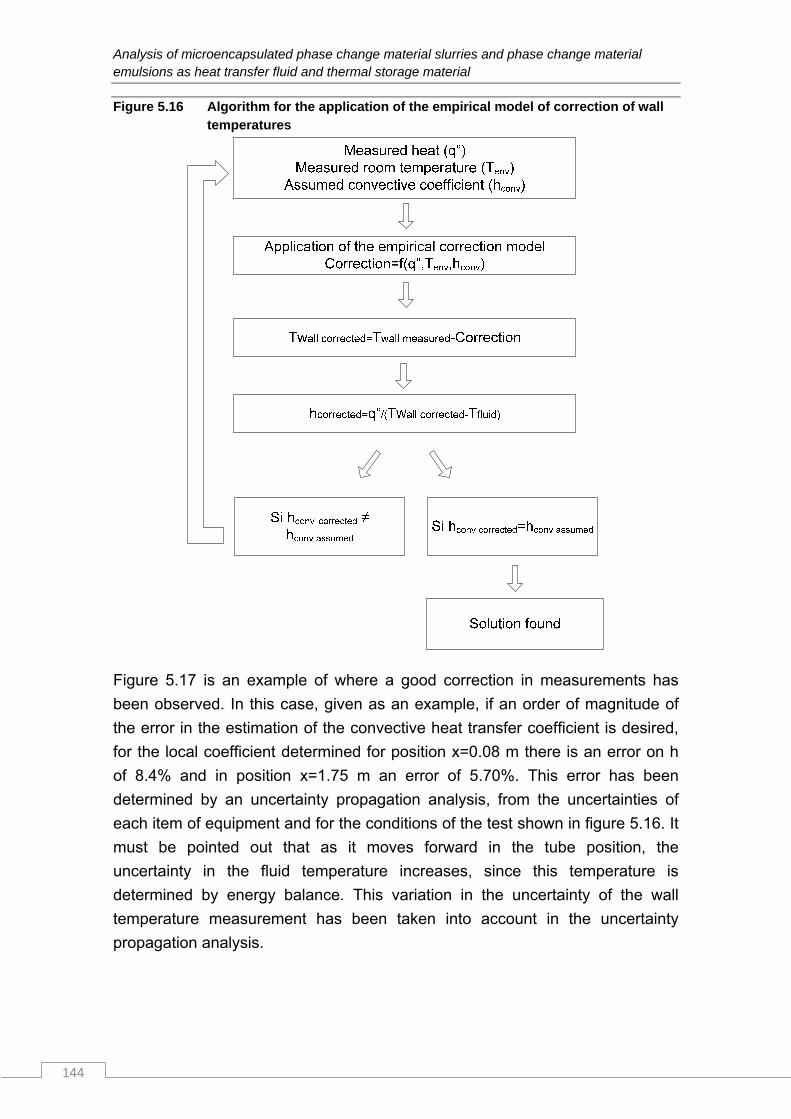
Analysis of microencapsulated phase change material slurries and phase change material emulsions as heat transfer fluid and thermal storage material
144
Figure 5.16 Algorithm for the application of the empirical model of correction of wall temperatures
Figure 5.17 is an example of where a good correction in measurements has
been observed. In this case, given as an example, if an order of magnitude of
the error in the estimation of the convective heat transfer coefficient is desired,
for the local coefficient determined for position x=0.08 m there is an error on h
of 8.4% and in position x=1.75 m an error of 5.70%. This error has been
determined by an uncertainty propagation analysis, from the uncertainties of
each item of equipment and for the conditions of the test shown in figure 5.16. It
must be pointed out that as it moves forward in the tube position, the
uncertainty in the fluid temperature increases, since this temperature is
determined by energy balance. This variation in the uncertainty of the wall
temperature measurement has been taken into account in the uncertainty
propagation analysis.
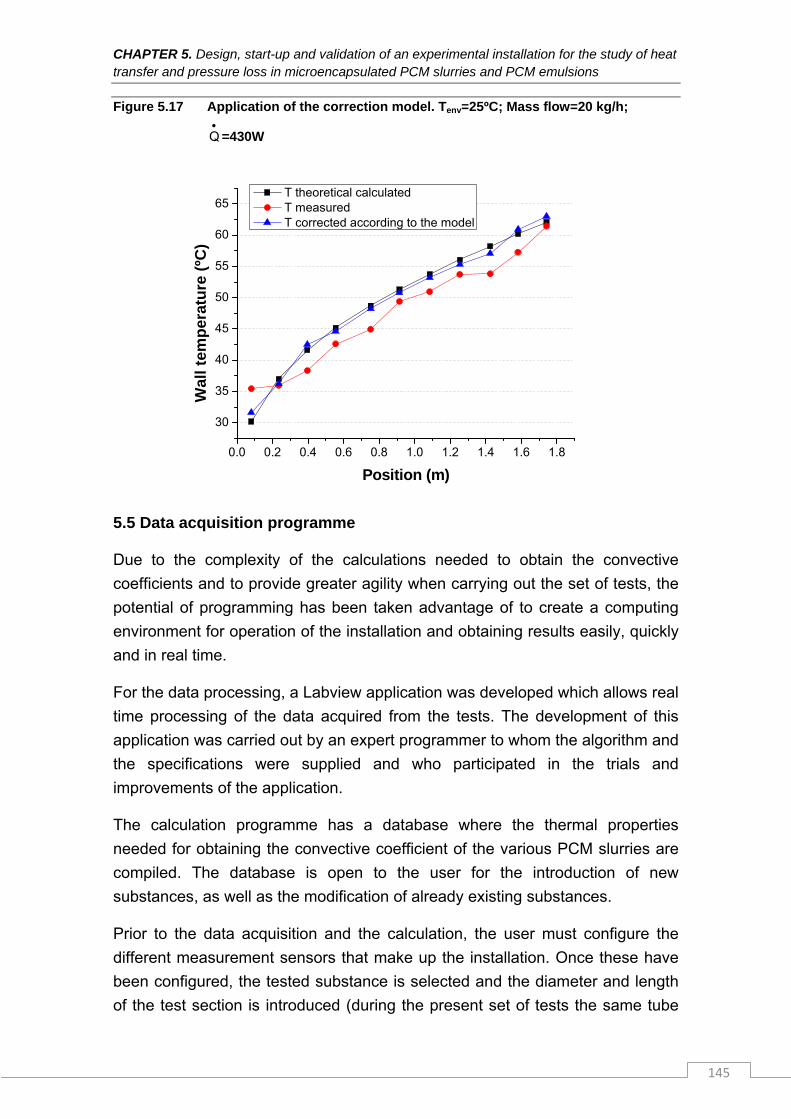
CHAPTER 5. Design, start-up and validation of an experimental installation for the study of heat transfer and pressure loss in microencapsulated PCM slurries and PCM emulsions
145
Figure 5.17 Application of the correction model. Tenv=25ºC; Mass flow=20 kg/h; Q =430W
0.0 0.2 0.4 0.6 0.8 1.0 1.2 1.4 1.6 1.8
30
35
40
45
50
55
60
65W
all
tem
per
atu
re (
ºC)
Position (m)
T theoretical calculated T measured T corrected according to the model
5.5 Data acquisition programme
Due to the complexity of the calculations needed to obtain the convective
coefficients and to provide greater agility when carrying out the set of tests, the
potential of programming has been taken advantage of to create a computing
environment for operation of the installation and obtaining results easily, quickly
and in real time.
For the data processing, a Labview application was developed which allows real
time processing of the data acquired from the tests. The development of this
application was carried out by an expert programmer to whom the algorithm and
the specifications were supplied and who participated in the trials and
improvements of the application.
The calculation programme has a database where the thermal properties
needed for obtaining the convective coefficient of the various PCM slurries are
compiled. The database is open to the user for the introduction of new
substances, as well as the modification of already existing substances.
Prior to the data acquisition and the calculation, the user must configure the
different measurement sensors that make up the installation. Once these have
been configured, the tested substance is selected and the diameter and length
of the test section is introduced (during the present set of tests the same tube
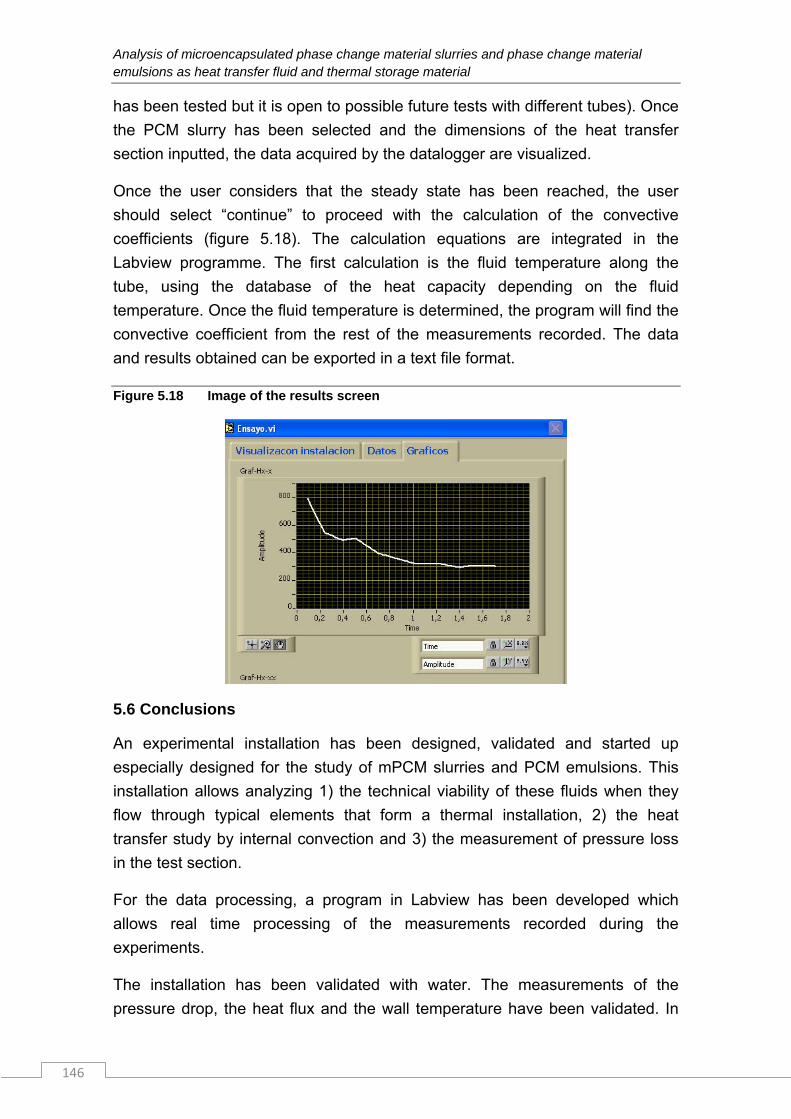
Analysis of microencapsulated phase change material slurries and phase change material emulsions as heat transfer fluid and thermal storage material
146
has been tested but it is open to possible future tests with different tubes). Once
the PCM slurry has been selected and the dimensions of the heat transfer
section inputted, the data acquired by the datalogger are visualized.
Once the user considers that the steady state has been reached, the user
should select “continue” to proceed with the calculation of the convective
coefficients (figure 5.18). The calculation equations are integrated in the
Labview programme. The first calculation is the fluid temperature along the
tube, using the database of the heat capacity depending on the fluid
temperature. Once the fluid temperature is determined, the program will find the
convective coefficient from the rest of the measurements recorded. The data
and results obtained can be exported in a text file format.
Figure 5.18 Image of the results screen
5.6 Conclusions
An experimental installation has been designed, validated and started up
especially designed for the study of mPCM slurries and PCM emulsions. This
installation allows analyzing 1) the technical viability of these fluids when they
flow through typical elements that form a thermal installation, 2) the heat
transfer study by internal convection and 3) the measurement of pressure loss
in the test section.
For the data processing, a program in Labview has been developed which
allows real time processing of the measurements recorded during the
experiments.
The installation has been validated with water. The measurements of the
pressure drop, the heat flux and the wall temperature have been validated. In
CHAPTER 5. Design, start-up and validation of an experimental installation for the study of heat transfer and pressure loss in microencapsulated PCM slurries and PCM emulsions
147
the case of the validation of the wall temperature, slight lags have been
observed between the temperature measured experimentally and the
temperature calculated theoretically, reaching in the most unfavorable cases
differences of the order of 4ºC. To correct these deviations, an empirical model
of correction has been developed, based on the measurements made using
water. This empirical model corrects such deviations, obtaining an average
error in the measurement of the wall temperature of 0.24ºC.
The uncertainty in the measurement of the internal forced convective coefficient
from the experimental installation presented in this chapter is around 5-10%. It
must be taken into account that it will vary for each local position and that it will
depend on the measurement conditions.

Analysis of microencapsulated phase change material slurries and phase change material emulsions as heat transfer fluid and thermal storage material
148
CAPÍTULO 6. Analysis of microencapsulated PCM slurries as heat transfer fluid
149
This chapter describes the results obtained when testing the candidate PCM slurries in the experimental installation described in chapter 5. The suitability of the mPCM slurries for their use as heat transfer fluid is analyzed.
6 Analysis of microencapsulated PCM slurries as heat transfer fluid
Analysis of microencapsulated phase change material slurries and phase change material emulsions as heat transfer fluid and thermal storage material
150
6.1 Aim of the tests
This chapter shows the results obtained in the experimental installation
described in chapter 5 concerning the fluid mechanics and the heat transfer
process in the mPCM slurries considered to be candidates following the
previously described tests determining their thermophysical properties and
stability. The objectives of these tests are the following:
Obtaining the local coefficients of internal forced convection for boundary
conditions of constant heat flux and laminar flow. These convective
coefficients are obtained from the measurements of heat flux, from the
wall temperature, and from the fluid temperature in each position,
according to equation 6.1. Since there is not a sensor in each position
where a thermocouple has been placed for the measurement of the wall
temperature, this fluid temperature will be calculated by equation 6.2.
These convective coefficients are compared to what would be obtained
in the case of water. This analysis is gathered in section 6.2.3 of the
present chapter.
)x,fx,wallx,conv TT(
''qh
(eq. 6.1)
p
x1xx,f1x,f
c·m
D·)·L-L'·('qTT
(eq. 6.2)
Comparison of the measurements of the wall temperature for the
analysis of the mPCM slurries against water. This analysis is undertaken
prior to obtaining the heat transfer coefficients by internal forced
convection. The results are also shown in section 6.2.3.
Pressure drop measurement in the heat transfer section. This study is
described in section 6.2.2.
Observation of how the different mPCM slurries perform when they flow
through the different devices that comprise the installation (measurement
devices, elbows, control valves, tank, etc.). Parts of these results have
already been shown in section 4.1.2. The rest of the results are compiled
in section 6.2.1. Specifically, the energy balance must be checked, to
rule out the possible settlement of PCM microcapsules in the different
devices of the experimental installation.
CAPÍTULO 6. Analysis of microencapsulated PCM slurries as heat transfer fluid
151
6.2 Experimental results
The two samples of candidate mPCM slurries have been tested in the
experimental installation for thermal-fluid-dynamic characterization: the DS
5007 sample with a microcapsule mass fraction of 14, 20 and 30%; and the DS
5045 sample with a microcapsule mass fraction of 20 and 35%. The DS 5007
and DS 5045 slurries with their original mass fraction (42 and 40%,
respectively) were not analyzed because their viscosity was higher than the limit
viscosity of 50 mPa·s according to the technical specifications of the
thermostatic bath. The DS 5045 diluted down to a mass fraction of 35% was
analyzed in spite of exceeding the viscosity limit. However, there were problems
in the temperature control, as will be explained in other sections.
6.2.1 Verification of the energy balance
Firstly, it must be verified that the energy balance is fulfilled to guarantee that
the microcapsules do not adhere on any component of the experimental
installation. If the mPCM slurries are not stable and homogenous, the
microcapsules could be deposited in the different components that make up the
installation. Gschwander and Schossig (2006) already pointed out in their work
that the obstruction risk in small channels and tubes was due to this
phenomenon.
In the corresponding analysis, thermal equilibrium between the PCM
microcapsules and water is assumed. The verification of the fulfillment of the
energy balance was carried out for different mass flows and for different heat
fluxes according to equation 6.3, where fp is the factor of energy losses, ΔU and
I the voltage and current of the heating resistance, m the mass flow of the
flowing PCM slurry and h[Tout] and h[Tin] the enthalpy at the outlet and inlet fluid
temperature, respectively. As discussed in chapter 5, this energy loss factor
was calculated from the heat losses of the test section to the environment, by
the estimation of the heat transfer coefficient.
])T[h]T[h·(mI·U)·f1( inoutp
(eq. 6.3)
DS 5007 sample
Figure 6.1 below shows the Enthalpy-Temperature curves obtained by an
energy balance for the heat transfer section of the experimental installation,
together with their fitting to a sigmoidal curve. The graph also shows the
Enthalpy-Temperature curve previously obtained with the installation of the T-
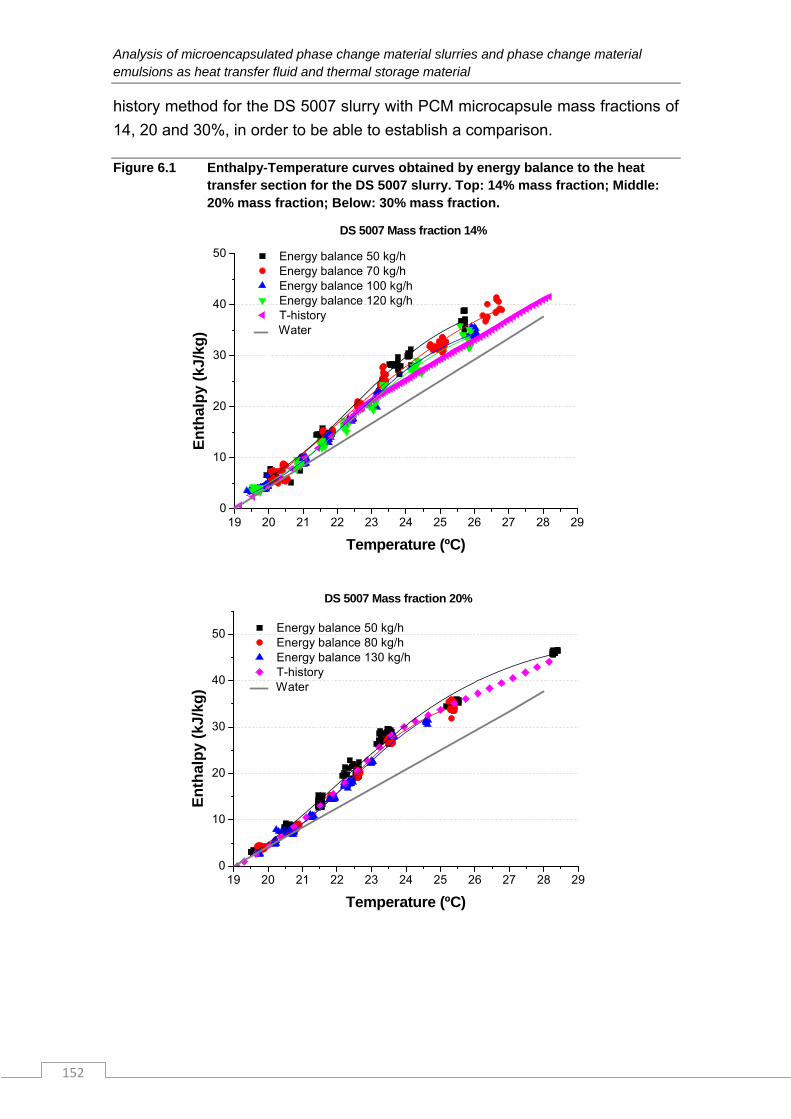
Analysis of microencapsulated phase change material slurries and phase change material emulsions as heat transfer fluid and thermal storage material
152
history method for the DS 5007 slurry with PCM microcapsule mass fractions of
14, 20 and 30%, in order to be able to establish a comparison.
Figure 6.1 Enthalpy-Temperature curves obtained by energy balance to the heat transfer section for the DS 5007 slurry. Top: 14% mass fraction; Middle: 20% mass fraction; Below: 30% mass fraction.
19 20 21 22 23 24 25 26 27 28 290
10
20
30
40
50 Energy balance 50 kg/h Energy balance 70 kg/h Energy balance 100 kg/h Energy balance 120 kg/h T-history
Water
En
thal
py
(kJ/
kg)
Temperature (ºC)
DS 5007 Mass fraction 14%
19 20 21 22 23 24 25 26 27 28 290
10
20
30
40
50 Energy balance 50 kg/h Energy balance 80 kg/h Energy balance 130 kg/h T-history
Water
En
thal
py
(kJ/
kg)
Temperature (ºC)
DS 5007 Mass fraction 20%
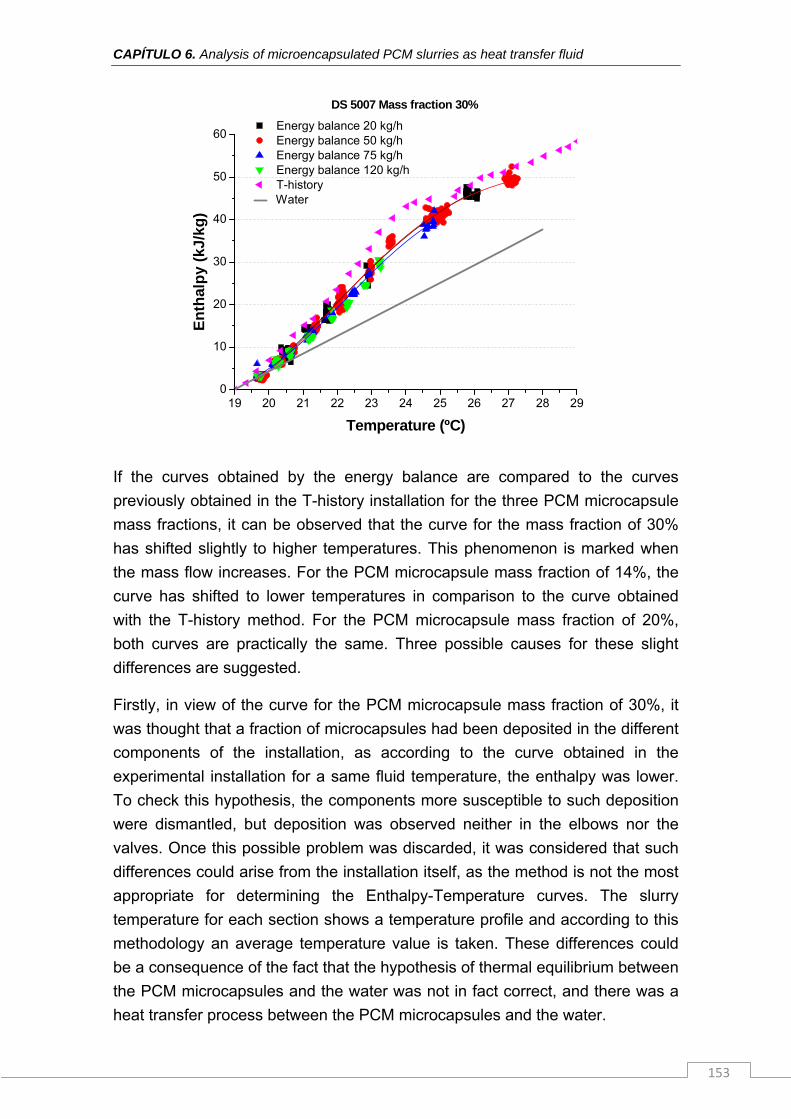
CAPÍTULO 6. Analysis of microencapsulated PCM slurries as heat transfer fluid
153
19 20 21 22 23 24 25 26 27 28 290
10
20
30
40
50
60 Energy balance 20 kg/h Energy balance 50 kg/h Energy balance 75 kg/h Energy balance 120 kg/h T-history
WaterE
nth
alp
y (k
J/kg
)
Temperature (ºC)
DS 5007 Mass fraction 30%
If the curves obtained by the energy balance are compared to the curves
previously obtained in the T-history installation for the three PCM microcapsule
mass fractions, it can be observed that the curve for the mass fraction of 30%
has shifted slightly to higher temperatures. This phenomenon is marked when
the mass flow increases. For the PCM microcapsule mass fraction of 14%, the
curve has shifted to lower temperatures in comparison to the curve obtained
with the T-history method. For the PCM microcapsule mass fraction of 20%,
both curves are practically the same. Three possible causes for these slight
differences are suggested.
Firstly, in view of the curve for the PCM microcapsule mass fraction of 30%, it
was thought that a fraction of microcapsules had been deposited in the different
components of the installation, as according to the curve obtained in the
experimental installation for a same fluid temperature, the enthalpy was lower.
To check this hypothesis, the components more susceptible to such deposition
were dismantled, but deposition was observed neither in the elbows nor the
valves. Once this possible problem was discarded, it was considered that such
differences could arise from the installation itself, as the method is not the most
appropriate for determining the Enthalpy-Temperature curves. The slurry
temperature for each section shows a temperature profile and according to this
methodology an average temperature value is taken. These differences could
be a consequence of the fact that the hypothesis of thermal equilibrium between
the PCM microcapsules and the water was not in fact correct, and there was a
heat transfer process between the PCM microcapsules and the water.
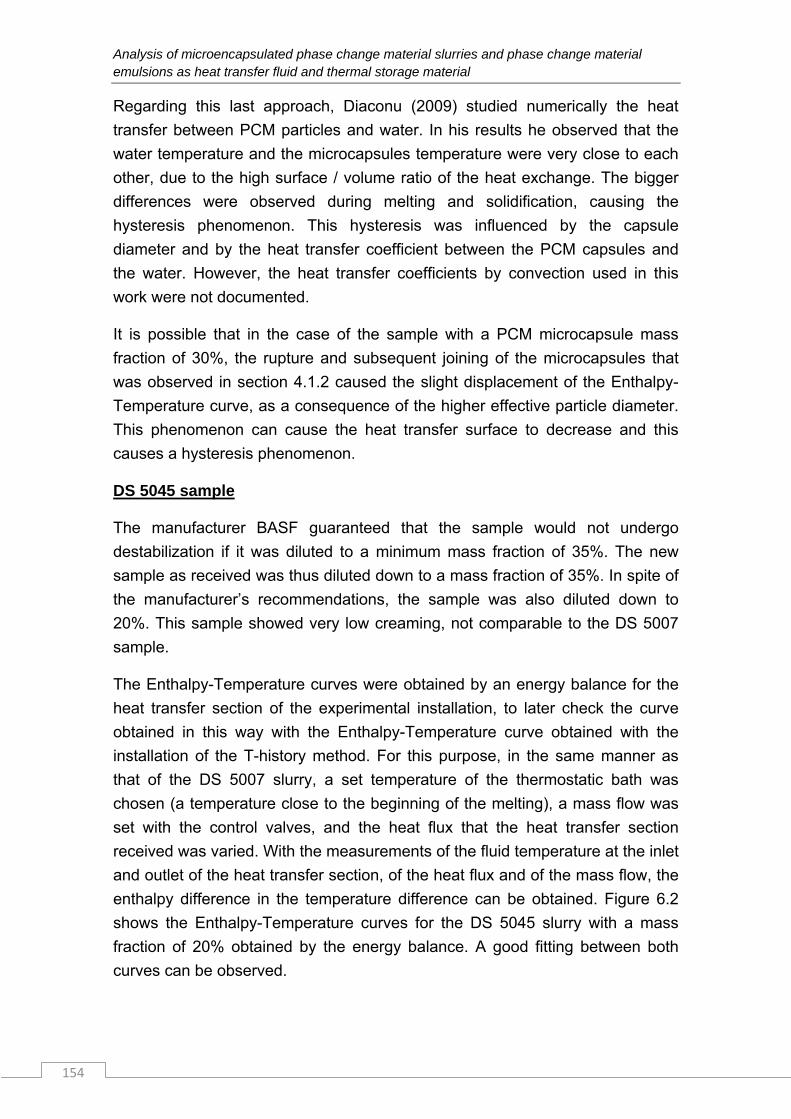
Analysis of microencapsulated phase change material slurries and phase change material emulsions as heat transfer fluid and thermal storage material
154
Regarding this last approach, Diaconu (2009) studied numerically the heat
transfer between PCM particles and water. In his results he observed that the
water temperature and the microcapsules temperature were very close to each
other, due to the high surface / volume ratio of the heat exchange. The bigger
differences were observed during melting and solidification, causing the
hysteresis phenomenon. This hysteresis was influenced by the capsule
diameter and by the heat transfer coefficient between the PCM capsules and
the water. However, the heat transfer coefficients by convection used in this
work were not documented.
It is possible that in the case of the sample with a PCM microcapsule mass
fraction of 30%, the rupture and subsequent joining of the microcapsules that
was observed in section 4.1.2 caused the slight displacement of the Enthalpy-
Temperature curve, as a consequence of the higher effective particle diameter.
This phenomenon can cause the heat transfer surface to decrease and this
causes a hysteresis phenomenon.
DS 5045 sample
The manufacturer BASF guaranteed that the sample would not undergo
destabilization if it was diluted to a minimum mass fraction of 35%. The new
sample as received was thus diluted down to a mass fraction of 35%. In spite of
the manufacturer’s recommendations, the sample was also diluted down to
20%. This sample showed very low creaming, not comparable to the DS 5007
sample.
The Enthalpy-Temperature curves were obtained by an energy balance for the
heat transfer section of the experimental installation, to later check the curve
obtained in this way with the Enthalpy-Temperature curve obtained with the
installation of the T-history method. For this purpose, in the same manner as
that of the DS 5007 slurry, a set temperature of the thermostatic bath was
chosen (a temperature close to the beginning of the melting), a mass flow was
set with the control valves, and the heat flux that the heat transfer section
received was varied. With the measurements of the fluid temperature at the inlet
and outlet of the heat transfer section, of the heat flux and of the mass flow, the
enthalpy difference in the temperature difference can be obtained. Figure 6.2
shows the Enthalpy-Temperature curves for the DS 5045 slurry with a mass
fraction of 20% obtained by the energy balance. A good fitting between both
curves can be observed.
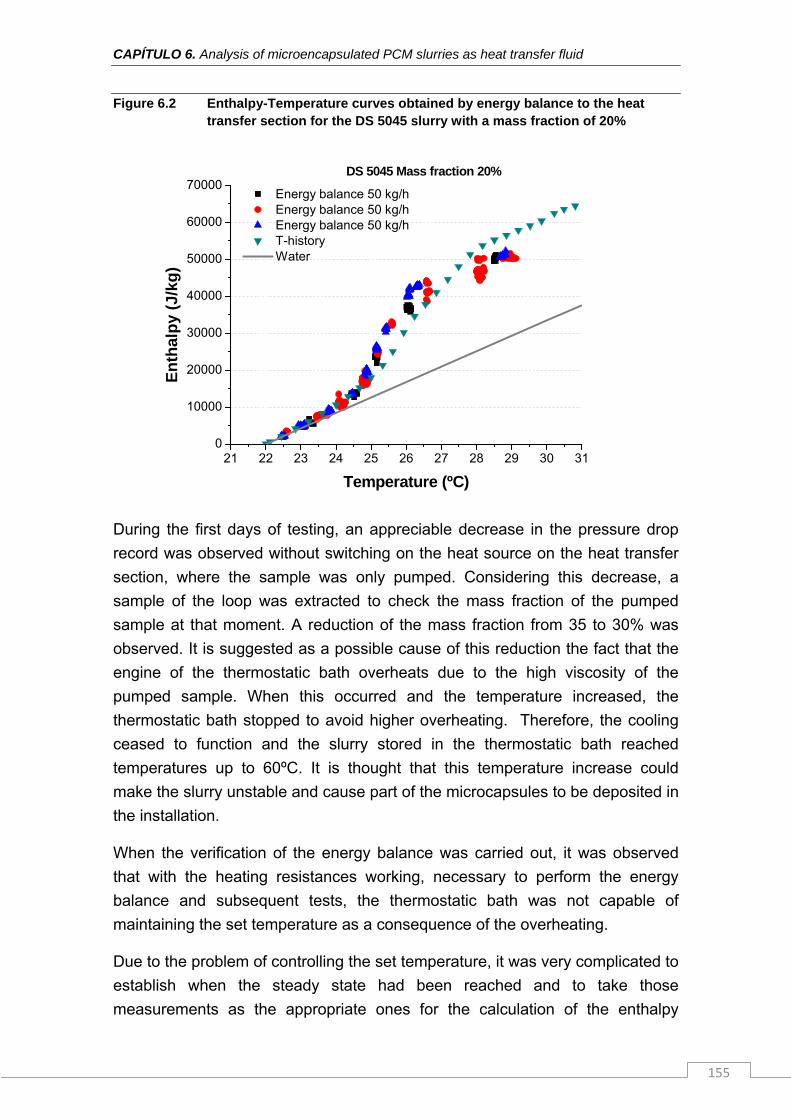
CAPÍTULO 6. Analysis of microencapsulated PCM slurries as heat transfer fluid
155
Figure 6.2 Enthalpy-Temperature curves obtained by energy balance to the heat transfer section for the DS 5045 slurry with a mass fraction of 20%
21 22 23 24 25 26 27 28 29 30 310
10000
20000
30000
40000
50000
60000
70000E
nth
alp
y (J
/kg
)
Temperature (ºC)
Energy balance 50 kg/h Energy balance 50 kg/h Energy balance 50 kg/h T-history Water
DS 5045 Mass fraction 20%
During the first days of testing, an appreciable decrease in the pressure drop
record was observed without switching on the heat source on the heat transfer
section, where the sample was only pumped. Considering this decrease, a
sample of the loop was extracted to check the mass fraction of the pumped
sample at that moment. A reduction of the mass fraction from 35 to 30% was
observed. It is suggested as a possible cause of this reduction the fact that the
engine of the thermostatic bath overheats due to the high viscosity of the
pumped sample. When this occurred and the temperature increased, the
thermostatic bath stopped to avoid higher overheating. Therefore, the cooling
ceased to function and the slurry stored in the thermostatic bath reached
temperatures up to 60ºC. It is thought that this temperature increase could
make the slurry unstable and cause part of the microcapsules to be deposited in
the installation.
When the verification of the energy balance was carried out, it was observed
that with the heating resistances working, necessary to perform the energy
balance and subsequent tests, the thermostatic bath was not capable of
maintaining the set temperature as a consequence of the overheating.
Due to the problem of controlling the set temperature, it was very complicated to
establish when the steady state had been reached and to take those
measurements as the appropriate ones for the calculation of the enthalpy
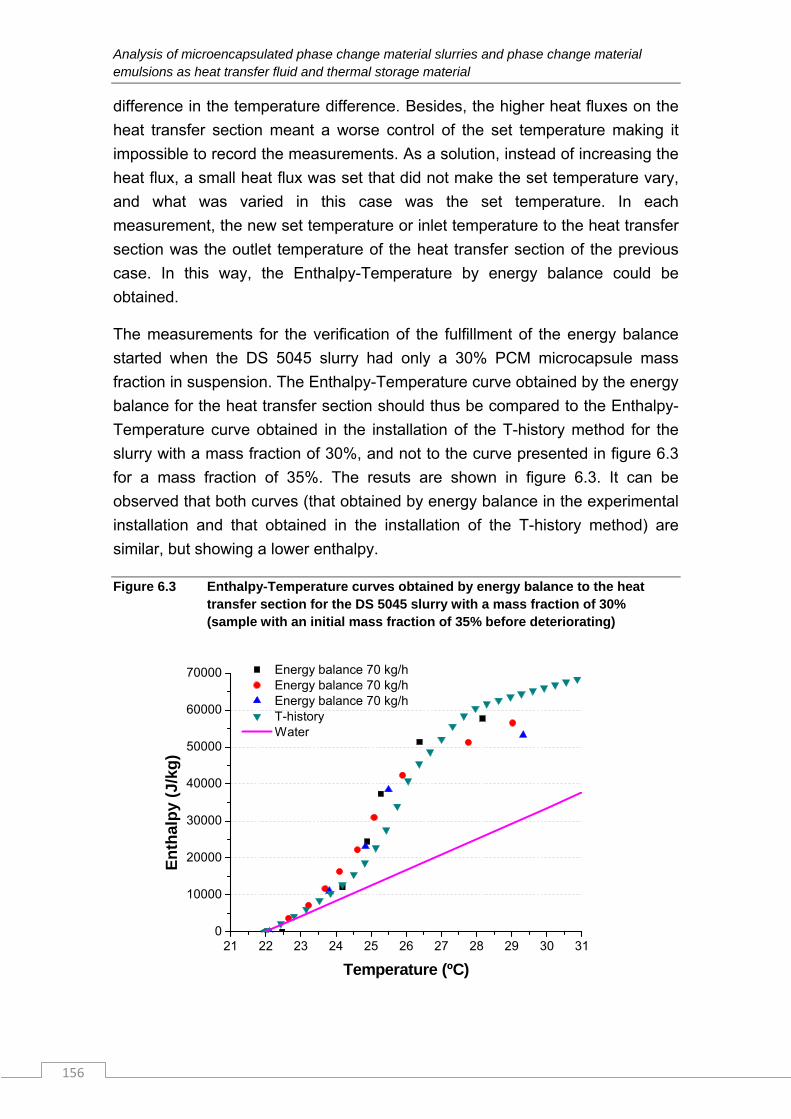
Analysis of microencapsulated phase change material slurries and phase change material emulsions as heat transfer fluid and thermal storage material
156
difference in the temperature difference. Besides, the higher heat fluxes on the
heat transfer section meant a worse control of the set temperature making it
impossible to record the measurements. As a solution, instead of increasing the
heat flux, a small heat flux was set that did not make the set temperature vary,
and what was varied in this case was the set temperature. In each
measurement, the new set temperature or inlet temperature to the heat transfer
section was the outlet temperature of the heat transfer section of the previous
case. In this way, the Enthalpy-Temperature by energy balance could be
obtained.
The measurements for the verification of the fulfillment of the energy balance
started when the DS 5045 slurry had only a 30% PCM microcapsule mass
fraction in suspension. The Enthalpy-Temperature curve obtained by the energy
balance for the heat transfer section should thus be compared to the Enthalpy-
Temperature curve obtained in the installation of the T-history method for the
slurry with a mass fraction of 30%, and not to the curve presented in figure 6.3
for a mass fraction of 35%. The resuts are shown in figure 6.3. It can be
observed that both curves (that obtained by energy balance in the experimental
installation and that obtained in the installation of the T-history method) are
similar, but showing a lower enthalpy.
Figure 6.3 Enthalpy-Temperature curves obtained by energy balance to the heat transfer section for the DS 5045 slurry with a mass fraction of 30% (sample with an initial mass fraction of 35% before deteriorating)
21 22 23 24 25 26 27 28 29 30 310
10000
20000
30000
40000
50000
60000
70000 Energy balance 70 kg/h Energy balance 70 kg/h Energy balance 70 kg/h T-history Water
En
thal
py
(J/k
g)
Temperature (ºC)
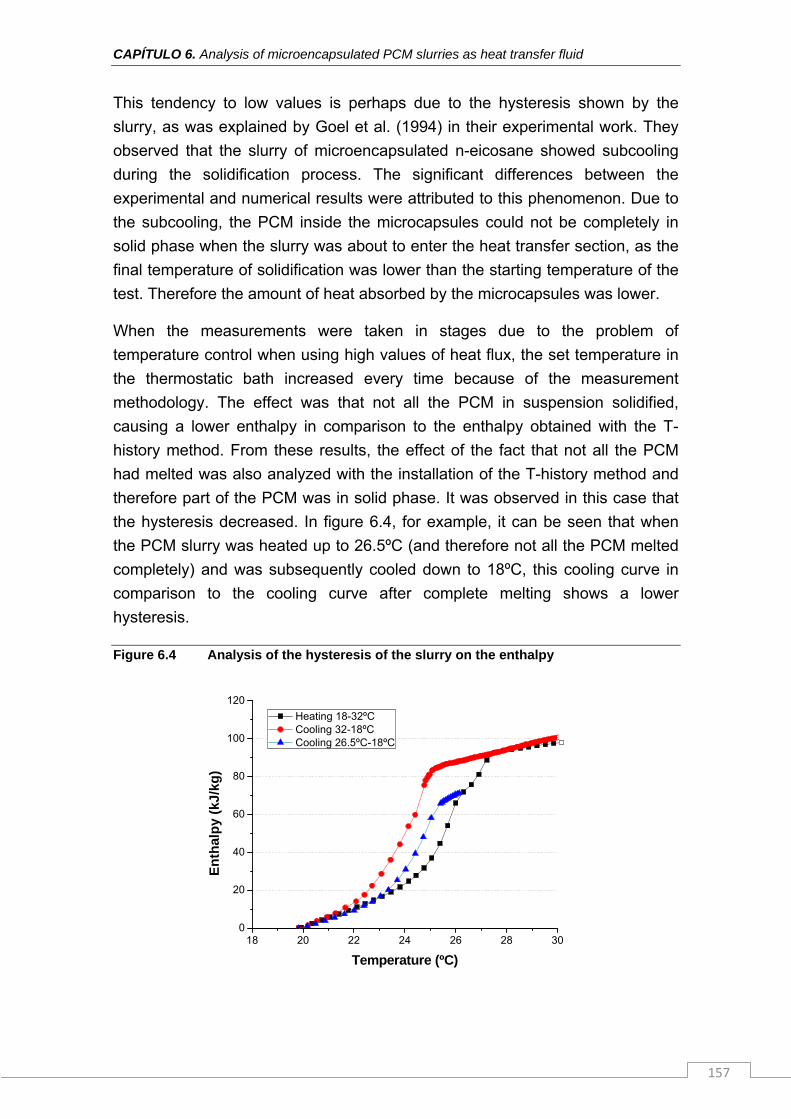
CAPÍTULO 6. Analysis of microencapsulated PCM slurries as heat transfer fluid
157
This tendency to low values is perhaps due to the hysteresis shown by the
slurry, as was explained by Goel et al. (1994) in their experimental work. They
observed that the slurry of microencapsulated n-eicosane showed subcooling
during the solidification process. The significant differences between the
experimental and numerical results were attributed to this phenomenon. Due to
the subcooling, the PCM inside the microcapsules could not be completely in
solid phase when the slurry was about to enter the heat transfer section, as the
final temperature of solidification was lower than the starting temperature of the
test. Therefore the amount of heat absorbed by the microcapsules was lower.
When the measurements were taken in stages due to the problem of
temperature control when using high values of heat flux, the set temperature in
the thermostatic bath increased every time because of the measurement
methodology. The effect was that not all the PCM in suspension solidified,
causing a lower enthalpy in comparison to the enthalpy obtained with the T-
history method. From these results, the effect of the fact that not all the PCM
had melted was also analyzed with the installation of the T-history method and
therefore part of the PCM was in solid phase. It was observed in this case that
the hysteresis decreased. In figure 6.4, for example, it can be seen that when
the PCM slurry was heated up to 26.5ºC (and therefore not all the PCM melted
completely) and was subsequently cooled down to 18ºC, this cooling curve in
comparison to the cooling curve after complete melting shows a lower
hysteresis.
Figure 6.4 Analysis of the hysteresis of the slurry on the enthalpy
18 20 22 24 26 28 300
20
40
60
80
100
120
En
thal
py
(kJ/
kg)
Temperature (ºC)
Heating 18-32ºC Cooling 32-18ºC Cooling 26.5ºC-18ºC
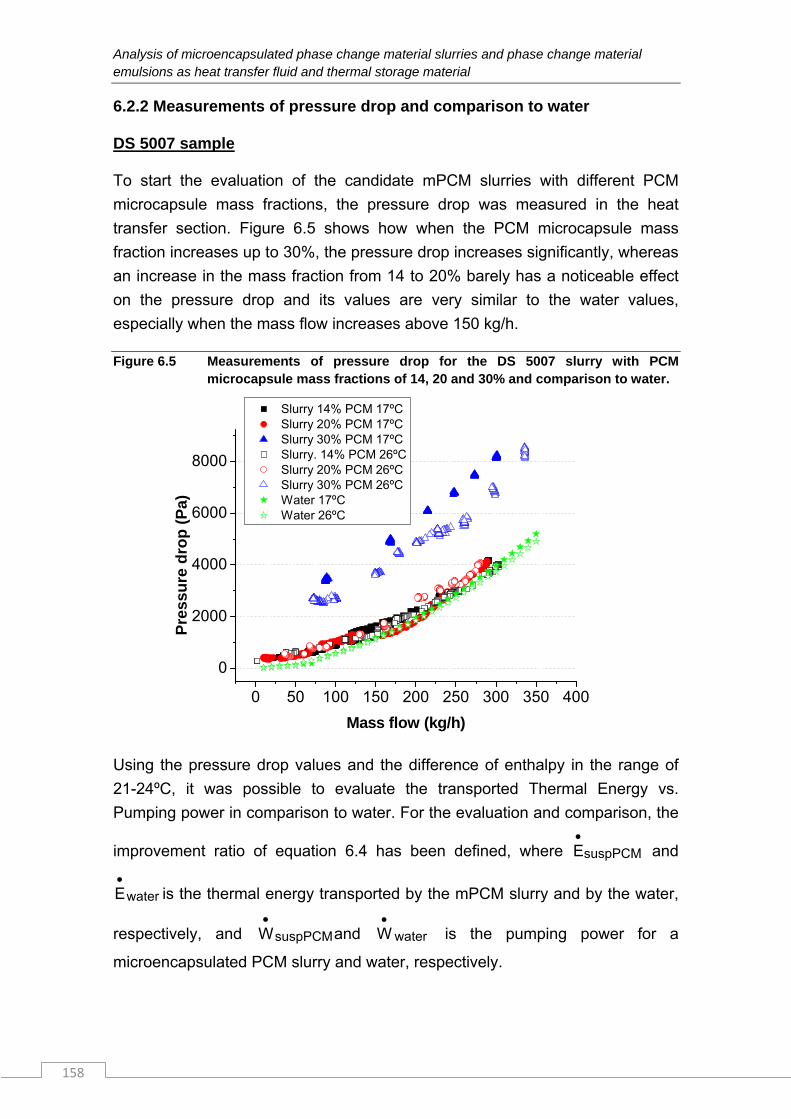
Analysis of microencapsulated phase change material slurries and phase change material emulsions as heat transfer fluid and thermal storage material
158
6.2.2 Measurements of pressure drop and comparison to water
DS 5007 sample
To start the evaluation of the candidate mPCM slurries with different PCM
microcapsule mass fractions, the pressure drop was measured in the heat
transfer section. Figure 6.5 shows how when the PCM microcapsule mass
fraction increases up to 30%, the pressure drop increases significantly, whereas
an increase in the mass fraction from 14 to 20% barely has a noticeable effect
on the pressure drop and its values are very similar to the water values,
especially when the mass flow increases above 150 kg/h.
Figure 6.5 Measurements of pressure drop for the DS 5007 slurry with PCM microcapsule mass fractions of 14, 20 and 30% and comparison to water.
0 50 100 150 200 250 300 350 400
0
2000
4000
6000
8000
Slurry 14% PCM 17ºC Slurry 20% PCM 17ºC Slurry 30% PCM 17ºC Slurry. 14% PCM 26ºC Slurry 20% PCM 26ºC Slurry 30% PCM 26ºC Water 17ºC Water 26ºC
Pre
ssu
re d
rop
(P
a)
Mass flow (kg/h)
Using the pressure drop values and the difference of enthalpy in the range of
21-24ºC, it was possible to evaluate the transported Thermal Energy vs.
Pumping power in comparison to water. For the evaluation and comparison, the
improvement ratio of equation 6.4 has been defined, where suspPCME
and
waterE
is the thermal energy transported by the mPCM slurry and by the water,
respectively, and suspPCMW
and waterW
is the pumping power for a
microencapsulated PCM slurry and water, respectively.
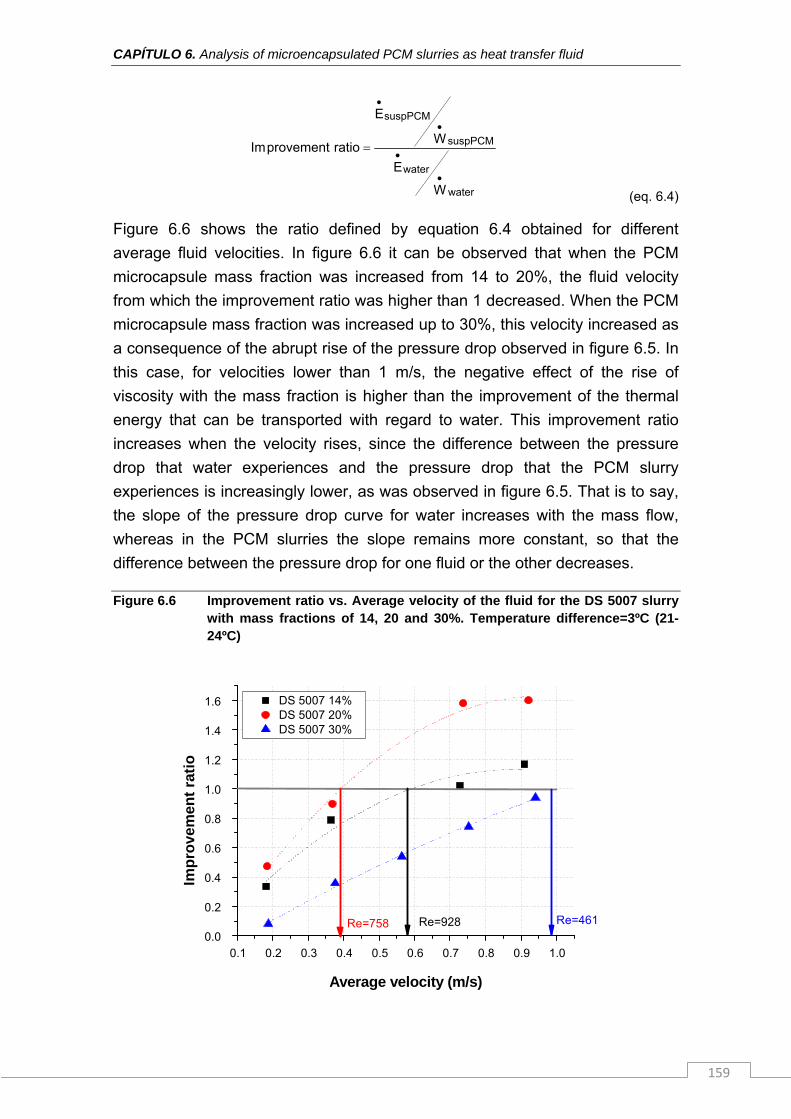
CAPÍTULO 6. Analysis of microencapsulated PCM slurries as heat transfer fluid
159
water
water
suspPCM
suspPCM
W
E
W
E
ratioprovementIm
(eq. 6.4)
Figure 6.6 shows the ratio defined by equation 6.4 obtained for different
average fluid velocities. In figure 6.6 it can be observed that when the PCM
microcapsule mass fraction was increased from 14 to 20%, the fluid velocity
from which the improvement ratio was higher than 1 decreased. When the PCM
microcapsule mass fraction was increased up to 30%, this velocity increased as
a consequence of the abrupt rise of the pressure drop observed in figure 6.5. In
this case, for velocities lower than 1 m/s, the negative effect of the rise of
viscosity with the mass fraction is higher than the improvement of the thermal
energy that can be transported with regard to water. This improvement ratio
increases when the velocity rises, since the difference between the pressure
drop that water experiences and the pressure drop that the PCM slurry
experiences is increasingly lower, as was observed in figure 6.5. That is to say,
the slope of the pressure drop curve for water increases with the mass flow,
whereas in the PCM slurries the slope remains more constant, so that the
difference between the pressure drop for one fluid or the other decreases.
Figure 6.6 Improvement ratio vs. Average velocity of the fluid for the DS 5007 slurry with mass fractions of 14, 20 and 30%. Temperature difference=3ºC (21-24ºC)
0.1 0.2 0.3 0.4 0.5 0.6 0.7 0.8 0.9 1.00.0
0.2
0.4
0.6
0.8
1.0
1.2
1.4
1.6
Re=461
DS 5007 14% DS 5007 20% DS 5007 30%
Imp
rove
men
t ra
tio
Average velocity (m/s)
Re=758 Re=928
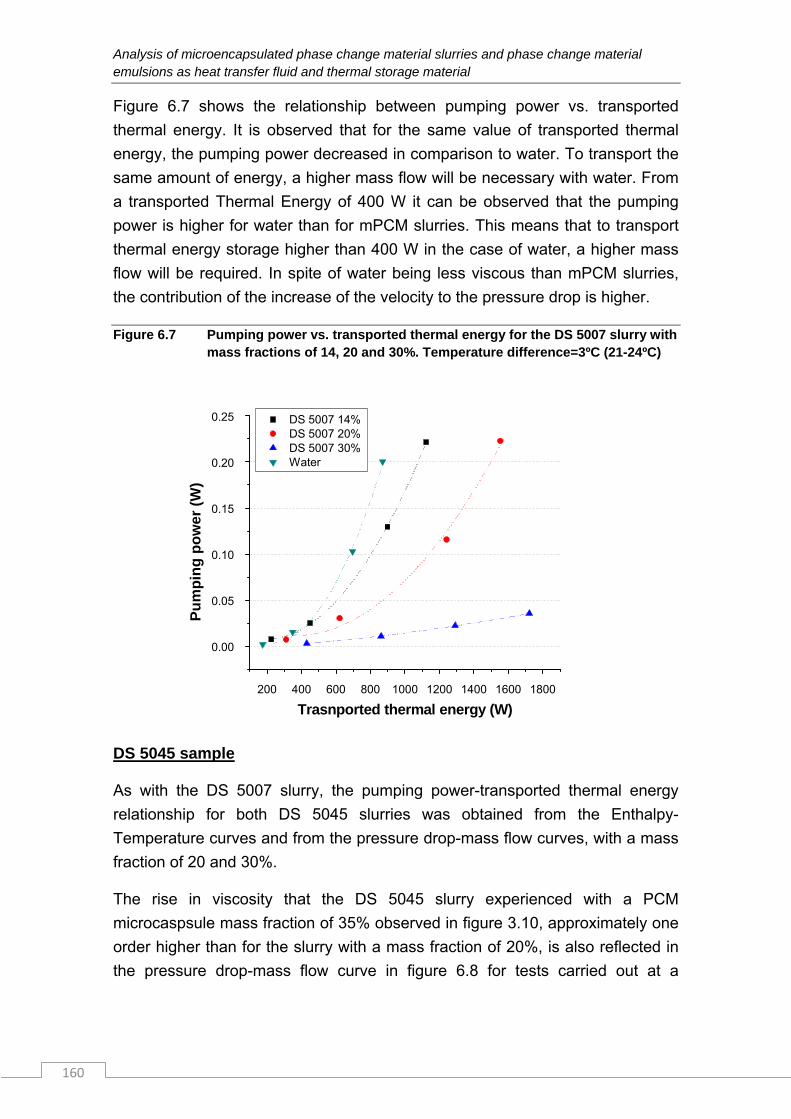
Analysis of microencapsulated phase change material slurries and phase change material emulsions as heat transfer fluid and thermal storage material
160
Figure 6.7 shows the relationship between pumping power vs. transported
thermal energy. It is observed that for the same value of transported thermal
energy, the pumping power decreased in comparison to water. To transport the
same amount of energy, a higher mass flow will be necessary with water. From
a transported Thermal Energy of 400 W it can be observed that the pumping
power is higher for water than for mPCM slurries. This means that to transport
thermal energy storage higher than 400 W in the case of water, a higher mass
flow will be required. In spite of water being less viscous than mPCM slurries,
the contribution of the increase of the velocity to the pressure drop is higher.
Figure 6.7 Pumping power vs. transported thermal energy for the DS 5007 slurry with mass fractions of 14, 20 and 30%. Temperature difference=3ºC (21-24ºC)
200 400 600 800 1000 1200 1400 1600 1800
0.00
0.05
0.10
0.15
0.20
0.25 DS 5007 14% DS 5007 20% DS 5007 30% Water
Pu
mp
ing
po
wer
(W
)
Trasnported thermal energy (W)
DS 5045 sample
As with the DS 5007 slurry, the pumping power-transported thermal energy
relationship for both DS 5045 slurries was obtained from the Enthalpy-
Temperature curves and from the pressure drop-mass flow curves, with a mass
fraction of 20 and 30%.
The rise in viscosity that the DS 5045 slurry experienced with a PCM
microcaspsule mass fraction of 35% observed in figure 3.10, approximately one
order higher than for the slurry with a mass fraction of 20%, is also reflected in
the pressure drop-mass flow curve in figure 6.8 for tests carried out at a
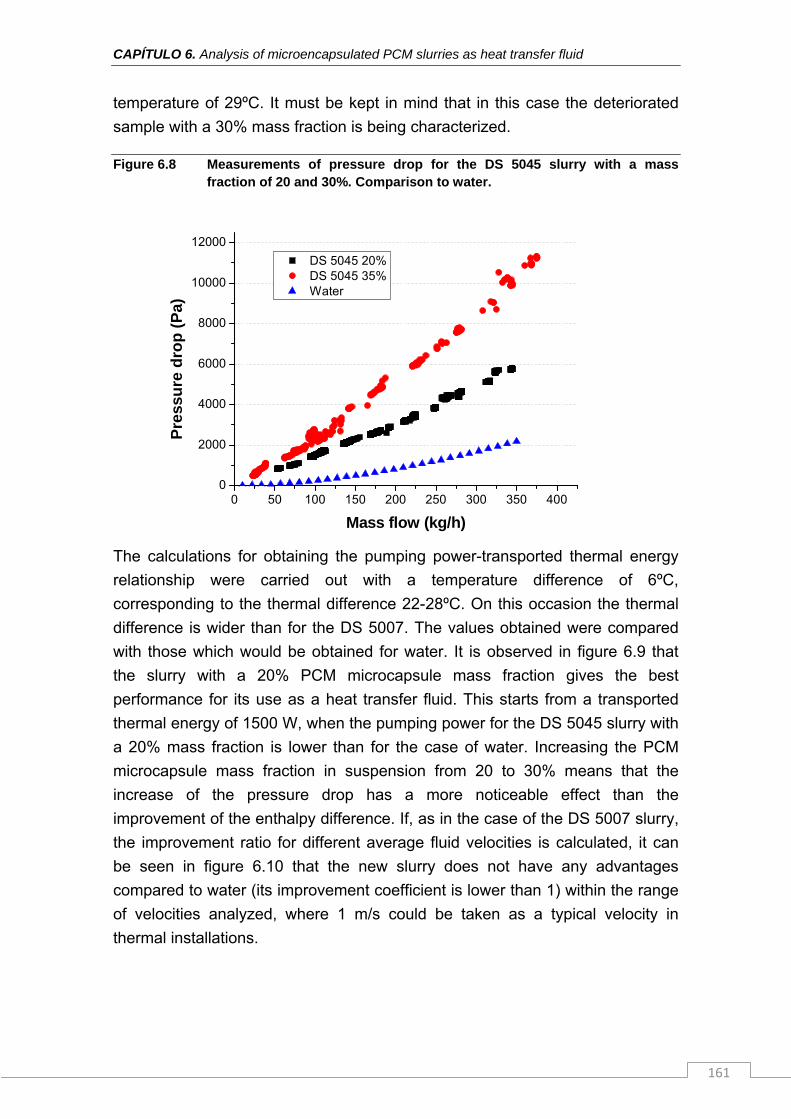
CAPÍTULO 6. Analysis of microencapsulated PCM slurries as heat transfer fluid
161
temperature of 29ºC. It must be kept in mind that in this case the deteriorated
sample with a 30% mass fraction is being characterized.
Figure 6.8 Measurements of pressure drop for the DS 5045 slurry with a mass fraction of 20 and 30%. Comparison to water.
0 50 100 150 200 250 300 350 4000
2000
4000
6000
8000
10000
12000
DS 5045 20% DS 5045 35% Water
Pre
ssu
re d
rop
(P
a)
Mass flow (kg/h)
The calculations for obtaining the pumping power-transported thermal energy
relationship were carried out with a temperature difference of 6ºC,
corresponding to the thermal difference 22-28ºC. On this occasion the thermal
difference is wider than for the DS 5007. The values obtained were compared
with those which would be obtained for water. It is observed in figure 6.9 that
the slurry with a 20% PCM microcapsule mass fraction gives the best
performance for its use as a heat transfer fluid. This starts from a transported
thermal energy of 1500 W, when the pumping power for the DS 5045 slurry with
a 20% mass fraction is lower than for the case of water. Increasing the PCM
microcapsule mass fraction in suspension from 20 to 30% means that the
increase of the pressure drop has a more noticeable effect than the
improvement of the enthalpy difference. If, as in the case of the DS 5007 slurry,
the improvement ratio for different average fluid velocities is calculated, it can
be seen in figure 6.10 that the new slurry does not have any advantages
compared to water (its improvement coefficient is lower than 1) within the range
of velocities analyzed, where 1 m/s could be taken as a typical velocity in
thermal installations.
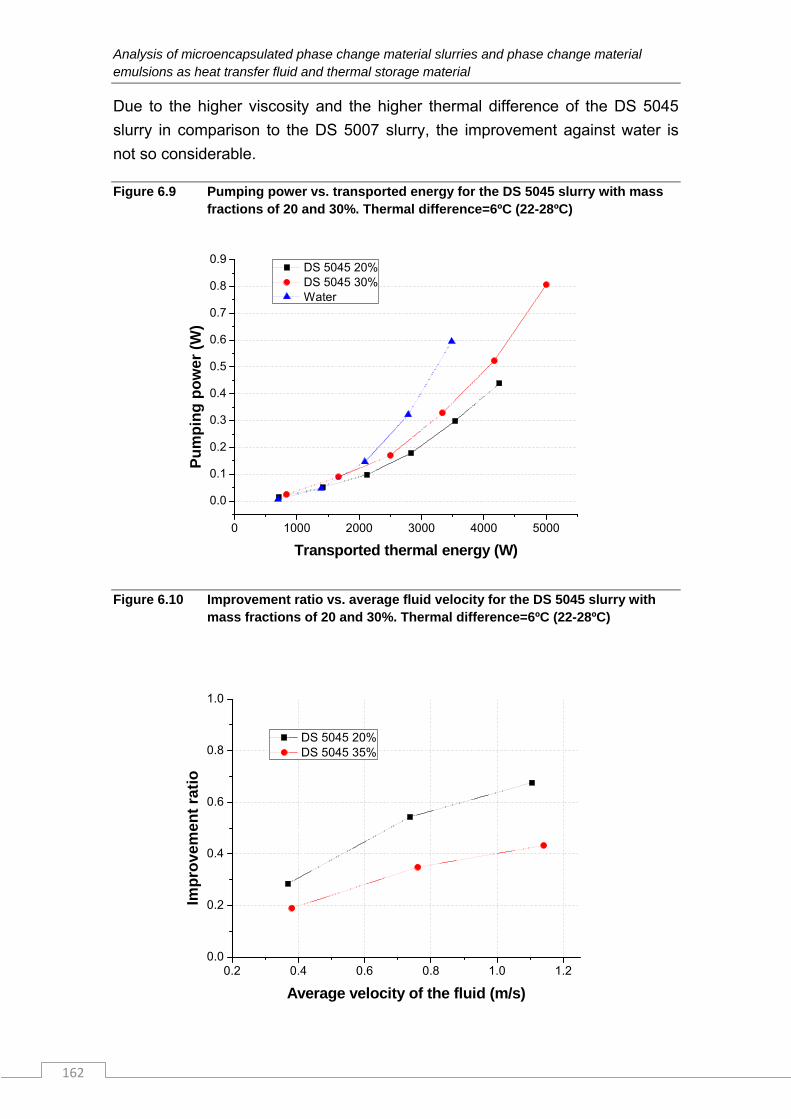
Analysis of microencapsulated phase change material slurries and phase change material emulsions as heat transfer fluid and thermal storage material
162
Due to the higher viscosity and the higher thermal difference of the DS 5045
slurry in comparison to the DS 5007 slurry, the improvement against water is
not so considerable.
Figure 6.9 Pumping power vs. transported energy for the DS 5045 slurry with mass fractions of 20 and 30%. Thermal difference=6ºC (22-28ºC)
0 1000 2000 3000 4000 5000
0.0
0.1
0.2
0.3
0.4
0.5
0.6
0.7
0.8
0.9
Pu
mp
ing
po
wer
(W
)
Transported thermal energy (W)
DS 5045 20% DS 5045 30% Water
Figure 6.10 Improvement ratio vs. average fluid velocity for the DS 5045 slurry with mass fractions of 20 and 30%. Thermal difference=6ºC (22-28ºC)
0.2 0.4 0.6 0.8 1.0 1.20.0
0.2
0.4
0.6
0.8
1.0
Imp
rove
men
t ra
tio
Average velocity of the fluid (m/s)
DS 5045 20% DS 5045 35%
CAPÍTULO 6. Analysis of microencapsulated PCM slurries as heat transfer fluid
163
6.2.3 Measurements of wall temperature and determination of the internal
forced convective coefficient. Comparison with water.
To analyze the heat transfer process, the mass flow and the heat flux on the
heat transfer section has been varied, and the wall temperatures have been
measured. The tests were carried out under the boundary condition of constant
heat flux. The heat transfer section was fully developed hydrodynamically and
the flow was laminar for mass flows from 20 to 50 kg/h. The correction model
already explained in chapter 5 was applied to the measured wall temperatures.
These values were then compared to the calculated values for the case of
water, obtained by the Kays correlation (Kays 1955) for the thermal entry
region. The dependence of the mass flow and of the operation temperature
range on the decrease of the measured wall temperature in comparison to
water has been analyzed.
To carry out this analysis, a parameter named the “Operation temperature
range RTO” has been defined according to equation 6.5, where h[Tout], h[Tm1]
and h[Tm2] are the enthalpy at the outlet temperature of the heat transfer
section, the enthalpy at the beginning of the melting and the enthalpy at the end
of the melting, respectively. All of these are determined by the curve obtained
with the installation of the T-history method.
Operation temperature range=]Th[-]T[h
]Th[-]T[h
mm
mout
12
1 (eq. 6.5)
This parameter shows if the phase change process is adjusted to the heat
transfer section. A RTO parameter equal to 1 would mean that the mPCM slurry
starts to melt just as it enters the heat transfer section, and leaves the section
when the PCM microcapsules have melted completely. A parameter below 1
would mean that the PCM microcapsules in suspension have not melted
completely in the heat transfer section, and a parameter above 1 would mean
that both regions, liquid and phase change, coexist in the heat transfer section.
The parameter was defined taking into account the liquid and phase change
regions, making it possible to attribute different phenomena to each region.
DS 5007 sample
From the wall temperature measurements, the convective coefficients were
obtained for laminar flow. The results showed a significant decrease in the wall
temperatures, in comparison to water, for the three PCM microcapsule mass
fractions. That is to say, they showed a better cooling capacity, as can be
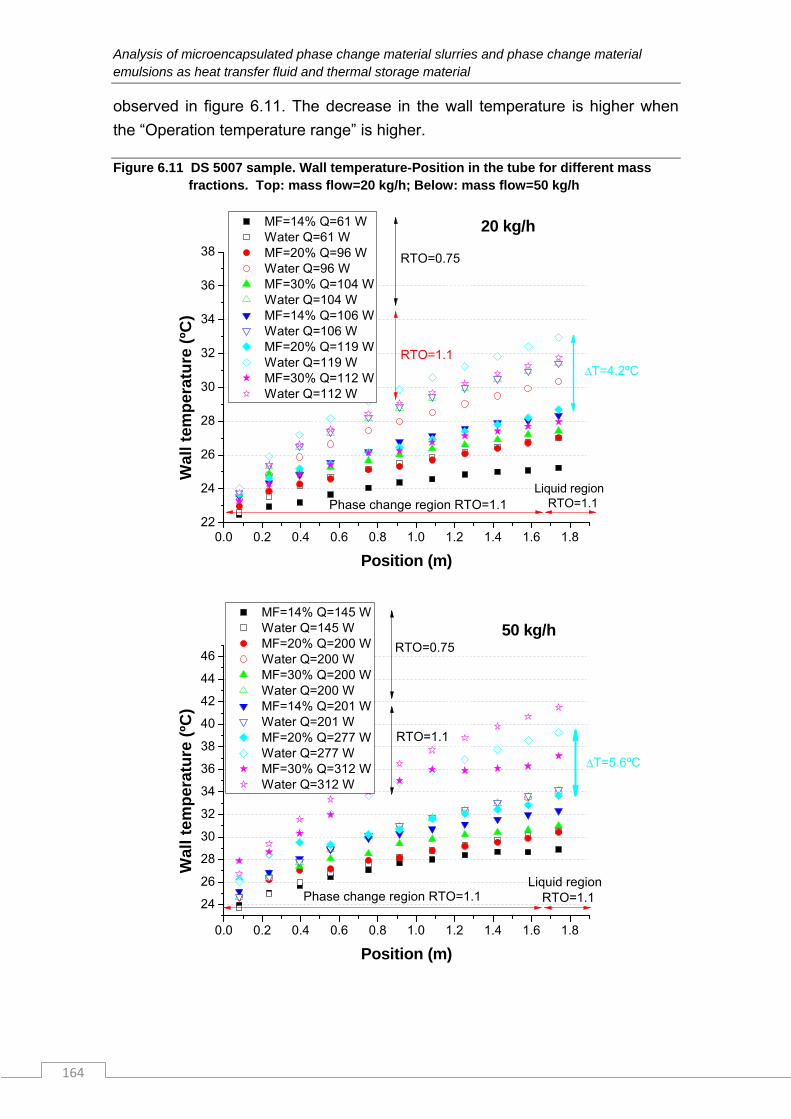
Analysis of microencapsulated phase change material slurries and phase change material emulsions as heat transfer fluid and thermal storage material
164
observed in figure 6.11. The decrease in the wall temperature is higher when
the “Operation temperature range” is higher.
Figure 6.11 DS 5007 sample. Wall temperature-Position in the tube for different mass fractions. Top: mass flow=20 kg/h; Below: mass flow=50 kg/h
0.0 0.2 0.4 0.6 0.8 1.0 1.2 1.4 1.6 1.822
24
26
28
30
32
34
36
38
Liquid region RTO=1.1
RTO=1.1
RTO=0.75
MF=14% Q=61 W Water Q=61 W MF=20% Q=96 W Water Q=96 W MF=30% Q=104 W Water Q=104 W MF=14% Q=106 W Water Q=106 W MF=20% Q=119 W Water Q=119 W MF=30% Q=112 W Water Q=112 W
Wal
l te
mp
erat
ure
(ºC
)
Position (m)
T=4.2ºC
20 kg/h
Phase change region RTO=1.1
0.0 0.2 0.4 0.6 0.8 1.0 1.2 1.4 1.6 1.8
24
26
28
30
32
34
36
38
40
42
44
46
Liquid region RTO=1.1
RTO=1.1
MF=14% Q=145 W Water Q=145 W MF=20% Q=200 W Water Q=200 W MF=30% Q=200 W Water Q=200 W MF=14% Q=201 W Water Q=201 W MF=20% Q=277 W Water Q=277 W MF=30% Q=312 W Water Q=312 W
Wal
l te
mp
erat
ure
(ºC
)
Position (m)
RTO=0.75
T=5.6ºC
50 kg/h
Phase change region RTO=1.1
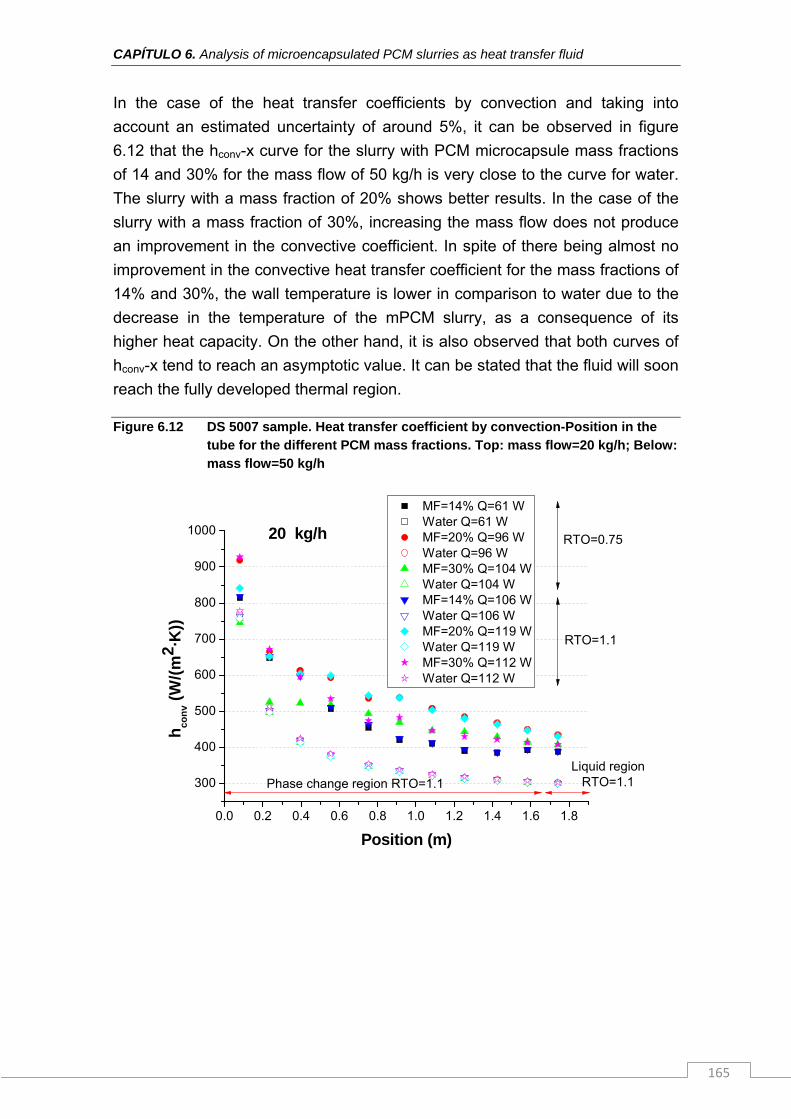
CAPÍTULO 6. Analysis of microencapsulated PCM slurries as heat transfer fluid
165
In the case of the heat transfer coefficients by convection and taking into
account an estimated uncertainty of around 5%, it can be observed in figure
6.12 that the hconv-x curve for the slurry with PCM microcapsule mass fractions
of 14 and 30% for the mass flow of 50 kg/h is very close to the curve for water.
The slurry with a mass fraction of 20% shows better results. In the case of the
slurry with a mass fraction of 30%, increasing the mass flow does not produce
an improvement in the convective coefficient. In spite of there being almost no
improvement in the convective heat transfer coefficient for the mass fractions of
14% and 30%, the wall temperature is lower in comparison to water due to the
decrease in the temperature of the mPCM slurry, as a consequence of its
higher heat capacity. On the other hand, it is also observed that both curves of
hconv-x tend to reach an asymptotic value. It can be stated that the fluid will soon
reach the fully developed thermal region.
Figure 6.12 DS 5007 sample. Heat transfer coefficient by convection-Position in the tube for the different PCM mass fractions. Top: mass flow=20 kg/h; Below: mass flow=50 kg/h
0.0 0.2 0.4 0.6 0.8 1.0 1.2 1.4 1.6 1.8
300
400
500
600
700
800
900
1000
Liquid region RTO=1.1
RTO=1.1
RTO=0.75
MF=14% Q=61 W Water Q=61 W MF=20% Q=96 W Water Q=96 W MF=30% Q=104 W Water Q=104 W MF=14% Q=106 W Water Q=106 W MF=20% Q=119 W Water Q=119 W MF=30% Q=112 W Water Q=112 W
hco
nv (
W/(
m2 ·K
))
Position (m)
20 kg/h
Phase change region RTO=1.1
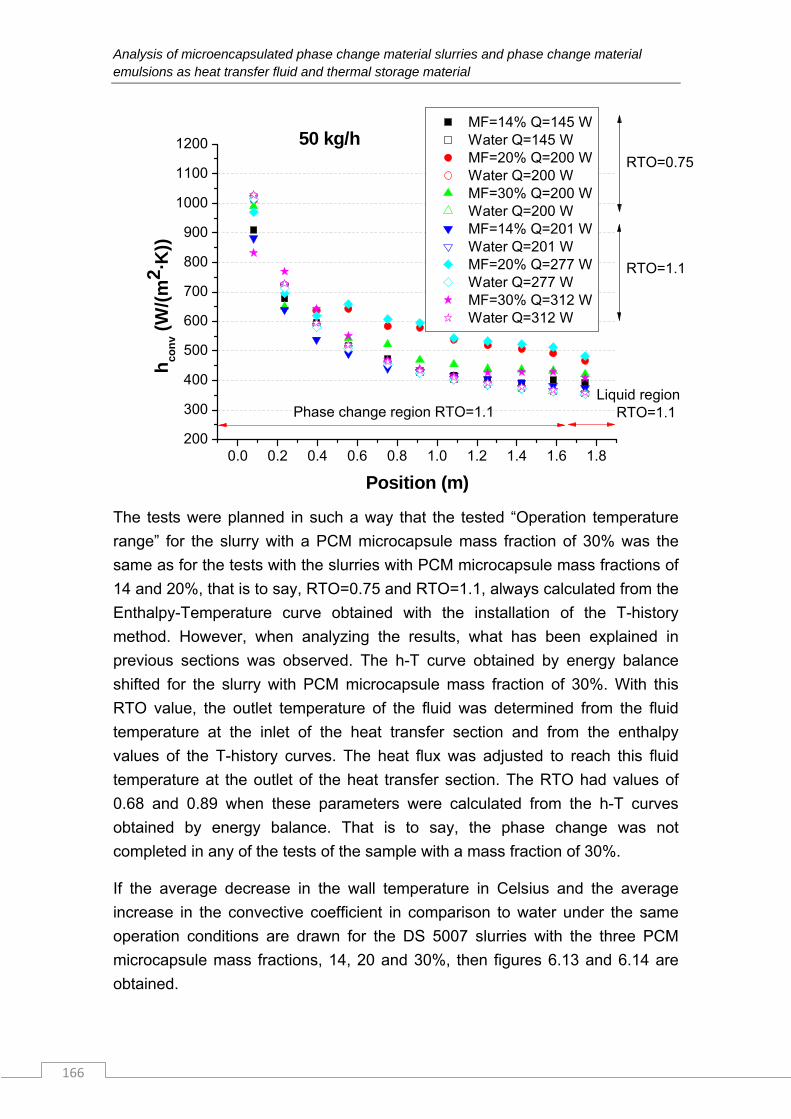
Analysis of microencapsulated phase change material slurries and phase change material emulsions as heat transfer fluid and thermal storage material
166
0.0 0.2 0.4 0.6 0.8 1.0 1.2 1.4 1.6 1.8200
300
400
500
600
700
800
900
1000
1100
1200
Liquid region RTO=1.1
RTO=1.1
RTO=0.75
MF=14% Q=145 W Water Q=145 W MF=20% Q=200 W Water Q=200 W MF=30% Q=200 W Water Q=200 W MF=14% Q=201 W Water Q=201 W MF=20% Q=277 W Water Q=277 W MF=30% Q=312 W Water Q=312 W
hco
nv (
W/(
m2 ·K
))
Position (m)
50 kg/h
Phase change region RTO=1.1
The tests were planned in such a way that the tested “Operation temperature
range” for the slurry with a PCM microcapsule mass fraction of 30% was the
same as for the tests with the slurries with PCM microcapsule mass fractions of
14 and 20%, that is to say, RTO=0.75 and RTO=1.1, always calculated from the
Enthalpy-Temperature curve obtained with the installation of the T-history
method. However, when analyzing the results, what has been explained in
previous sections was observed. The h-T curve obtained by energy balance
shifted for the slurry with PCM microcapsule mass fraction of 30%. With this
RTO value, the outlet temperature of the fluid was determined from the fluid
temperature at the inlet of the heat transfer section and from the enthalpy
values of the T-history curves. The heat flux was adjusted to reach this fluid
temperature at the outlet of the heat transfer section. The RTO had values of
0.68 and 0.89 when these parameters were calculated from the h-T curves
obtained by energy balance. That is to say, the phase change was not
completed in any of the tests of the sample with a mass fraction of 30%.
If the average decrease in the wall temperature in Celsius and the average
increase in the convective coefficient in comparison to water under the same
operation conditions are drawn for the DS 5007 slurries with the three PCM
microcapsule mass fractions, 14, 20 and 30%, then figures 6.13 and 6.14 are
obtained.
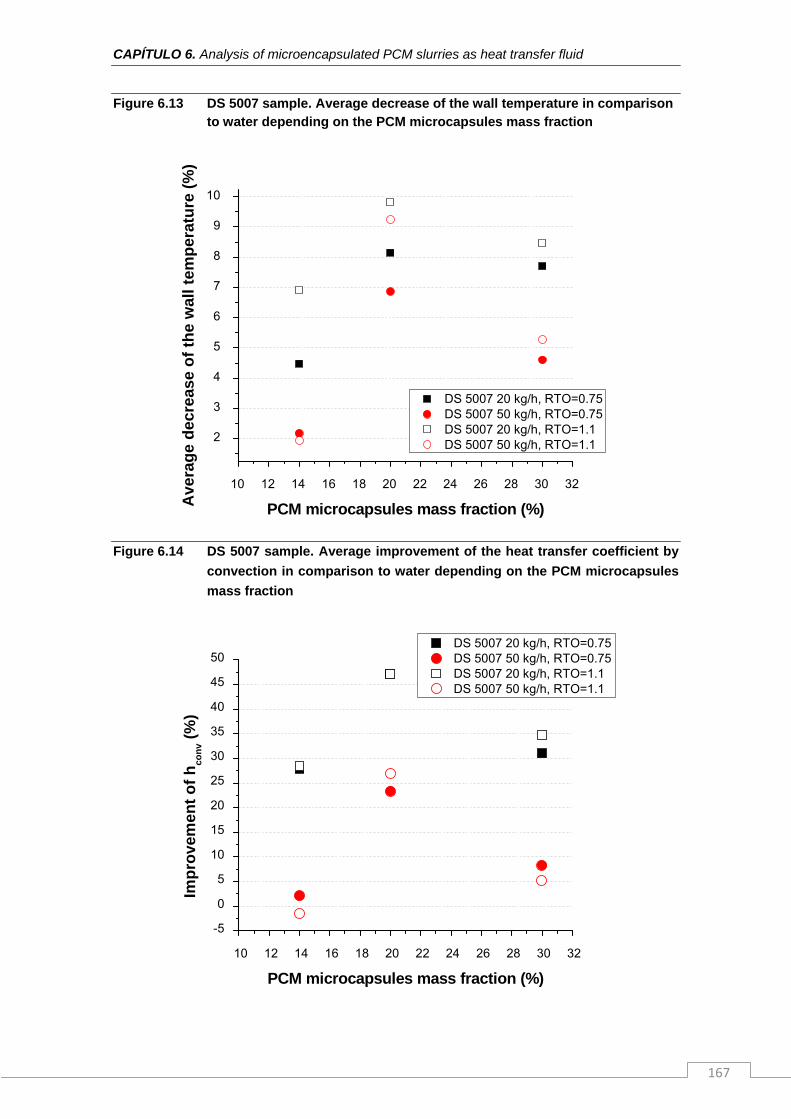
CAPÍTULO 6. Analysis of microencapsulated PCM slurries as heat transfer fluid
167
Figure 6.13 DS 5007 sample. Average decrease of the wall temperature in comparison to water depending on the PCM microcapsules mass fraction
10 12 14 16 18 20 22 24 26 28 30 32
2
3
4
5
6
7
8
9
10
DS 5007 20 kg/h, RTO=0.75 DS 5007 50 kg/h, RTO=0.75 DS 5007 20 kg/h, RTO=1.1 DS 5007 50 kg/h, RTO=1.1
Ave
rag
e d
ecre
ase
of
the
wal
l te
mp
erat
ure
(%
)
PCM microcapsules mass fraction (%)
Figure 6.14 DS 5007 sample. Average improvement of the heat transfer coefficient by
convection in comparison to water depending on the PCM microcapsules
mass fraction
10 12 14 16 18 20 22 24 26 28 30 32
-5
0
5
10
15
20
25
30
35
40
45
50 DS 5007 20 kg/h, RTO=0.75 DS 5007 50 kg/h, RTO=0.75 DS 5007 20 kg/h, RTO=1.1 DS 5007 50 kg/h, RTO=1.1
Imp
rove
me
nt
of
hco
nv (
%)
PCM microcapsules mass fraction (%)
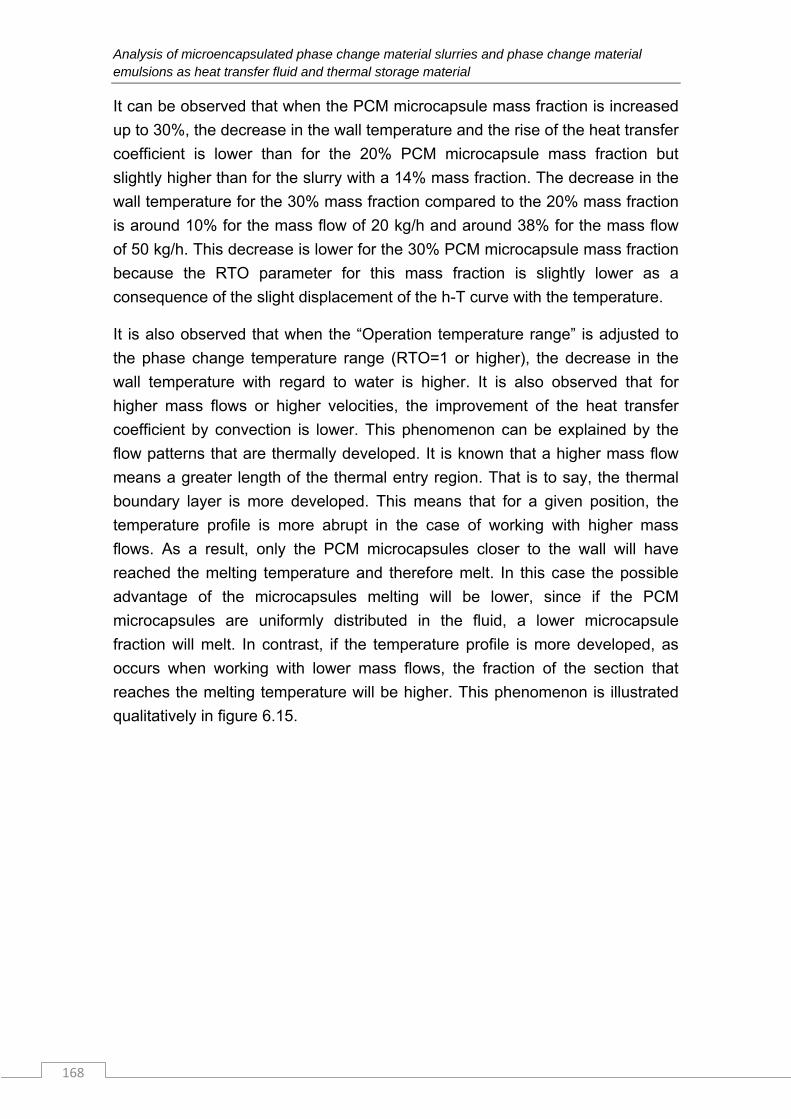
Analysis of microencapsulated phase change material slurries and phase change material emulsions as heat transfer fluid and thermal storage material
168
It can be observed that when the PCM microcapsule mass fraction is increased
up to 30%, the decrease in the wall temperature and the rise of the heat transfer
coefficient is lower than for the 20% PCM microcapsule mass fraction but
slightly higher than for the slurry with a 14% mass fraction. The decrease in the
wall temperature for the 30% mass fraction compared to the 20% mass fraction
is around 10% for the mass flow of 20 kg/h and around 38% for the mass flow
of 50 kg/h. This decrease is lower for the 30% PCM microcapsule mass fraction
because the RTO parameter for this mass fraction is slightly lower as a
consequence of the slight displacement of the h-T curve with the temperature.
It is also observed that when the “Operation temperature range” is adjusted to
the phase change temperature range (RTO=1 or higher), the decrease in the
wall temperature with regard to water is higher. It is also observed that for
higher mass flows or higher velocities, the improvement of the heat transfer
coefficient by convection is lower. This phenomenon can be explained by the
flow patterns that are thermally developed. It is known that a higher mass flow
means a greater length of the thermal entry region. That is to say, the thermal
boundary layer is more developed. This means that for a given position, the
temperature profile is more abrupt in the case of working with higher mass
flows. As a result, only the PCM microcapsules closer to the wall will have
reached the melting temperature and therefore melt. In this case the possible
advantage of the microcapsules melting will be lower, since if the PCM
microcapsules are uniformly distributed in the fluid, a lower microcapsule
fraction will melt. In contrast, if the temperature profile is more developed, as
occurs when working with lower mass flows, the fraction of the section that
reaches the melting temperature will be higher. This phenomenon is illustrated
qualitatively in figure 6.15.
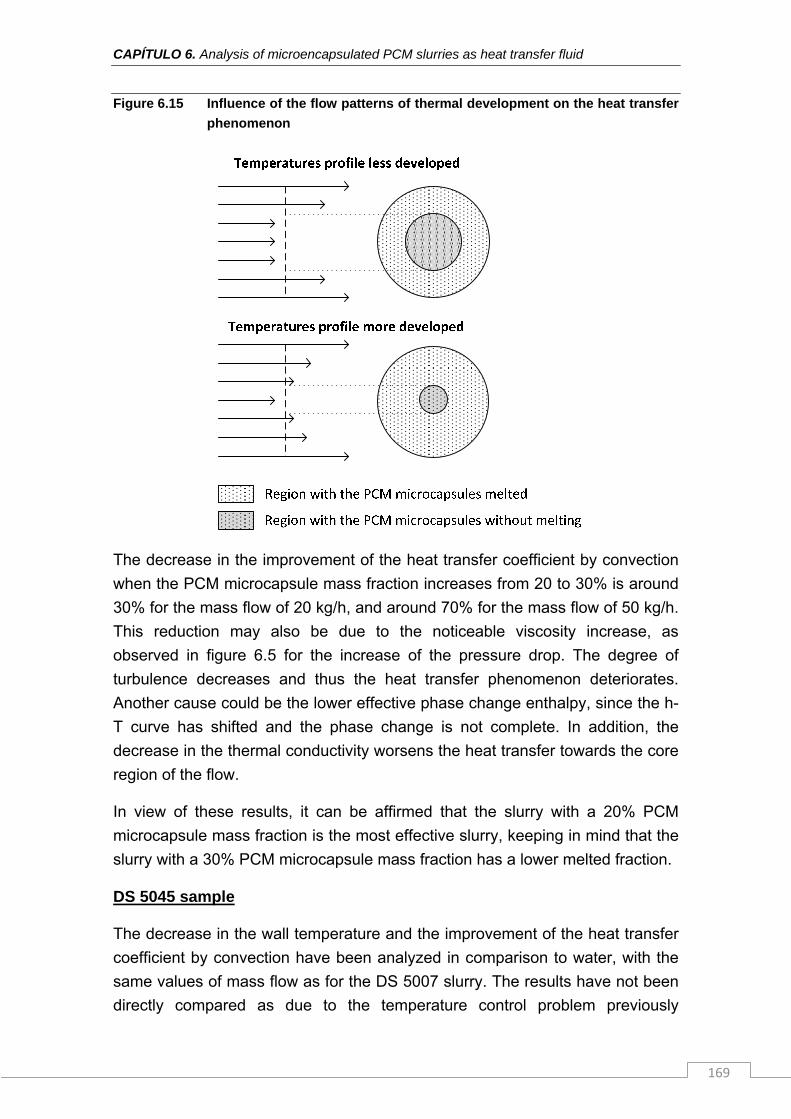
CAPÍTULO 6. Analysis of microencapsulated PCM slurries as heat transfer fluid
169
Figure 6.15 Influence of the flow patterns of thermal development on the heat transfer
phenomenon
The decrease in the improvement of the heat transfer coefficient by convection
when the PCM microcapsule mass fraction increases from 20 to 30% is around
30% for the mass flow of 20 kg/h, and around 70% for the mass flow of 50 kg/h.
This reduction may also be due to the noticeable viscosity increase, as
observed in figure 6.5 for the increase of the pressure drop. The degree of
turbulence decreases and thus the heat transfer phenomenon deteriorates.
Another cause could be the lower effective phase change enthalpy, since the h-
T curve has shifted and the phase change is not complete. In addition, the
decrease in the thermal conductivity worsens the heat transfer towards the core
region of the flow.
In view of these results, it can be affirmed that the slurry with a 20% PCM
microcapsule mass fraction is the most effective slurry, keeping in mind that the
slurry with a 30% PCM microcapsule mass fraction has a lower melted fraction.
DS 5045 sample
The decrease in the wall temperature and the improvement of the heat transfer
coefficient by convection have been analyzed in comparison to water, with the
same values of mass flow as for the DS 5007 slurry. The results have not been
directly compared as due to the temperature control problem previously
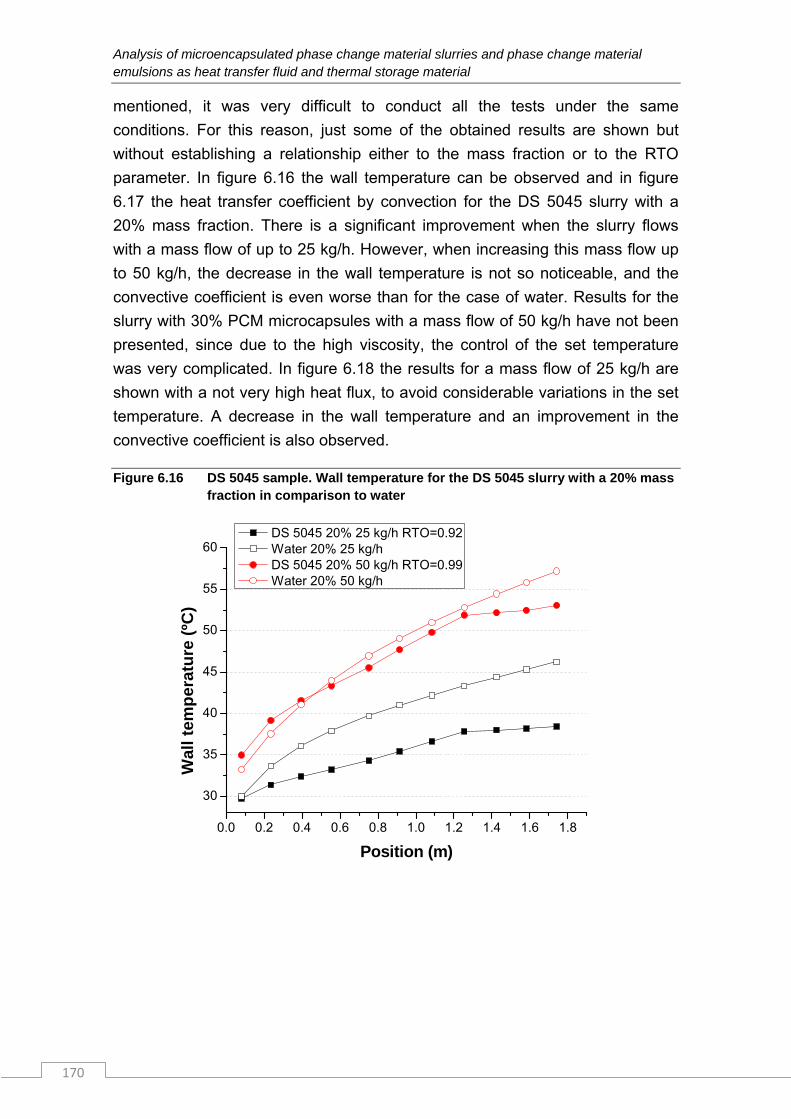
Analysis of microencapsulated phase change material slurries and phase change material emulsions as heat transfer fluid and thermal storage material
170
mentioned, it was very difficult to conduct all the tests under the same
conditions. For this reason, just some of the obtained results are shown but
without establishing a relationship either to the mass fraction or to the RTO
parameter. In figure 6.16 the wall temperature can be observed and in figure
6.17 the heat transfer coefficient by convection for the DS 5045 slurry with a
20% mass fraction. There is a significant improvement when the slurry flows
with a mass flow of up to 25 kg/h. However, when increasing this mass flow up
to 50 kg/h, the decrease in the wall temperature is not so noticeable, and the
convective coefficient is even worse than for the case of water. Results for the
slurry with 30% PCM microcapsules with a mass flow of 50 kg/h have not been
presented, since due to the high viscosity, the control of the set temperature
was very complicated. In figure 6.18 the results for a mass flow of 25 kg/h are
shown with a not very high heat flux, to avoid considerable variations in the set
temperature. A decrease in the wall temperature and an improvement in the
convective coefficient is also observed.
Figure 6.16 DS 5045 sample. Wall temperature for the DS 5045 slurry with a 20% mass fraction in comparison to water
0.0 0.2 0.4 0.6 0.8 1.0 1.2 1.4 1.6 1.8
30
35
40
45
50
55
60
Wal
l te
mp
erat
ure
(ºC
)
Position (m)
DS 5045 20% 25 kg/h RTO=0.92 Water 20% 25 kg/h DS 5045 20% 50 kg/h RTO=0.99 Water 20% 50 kg/h
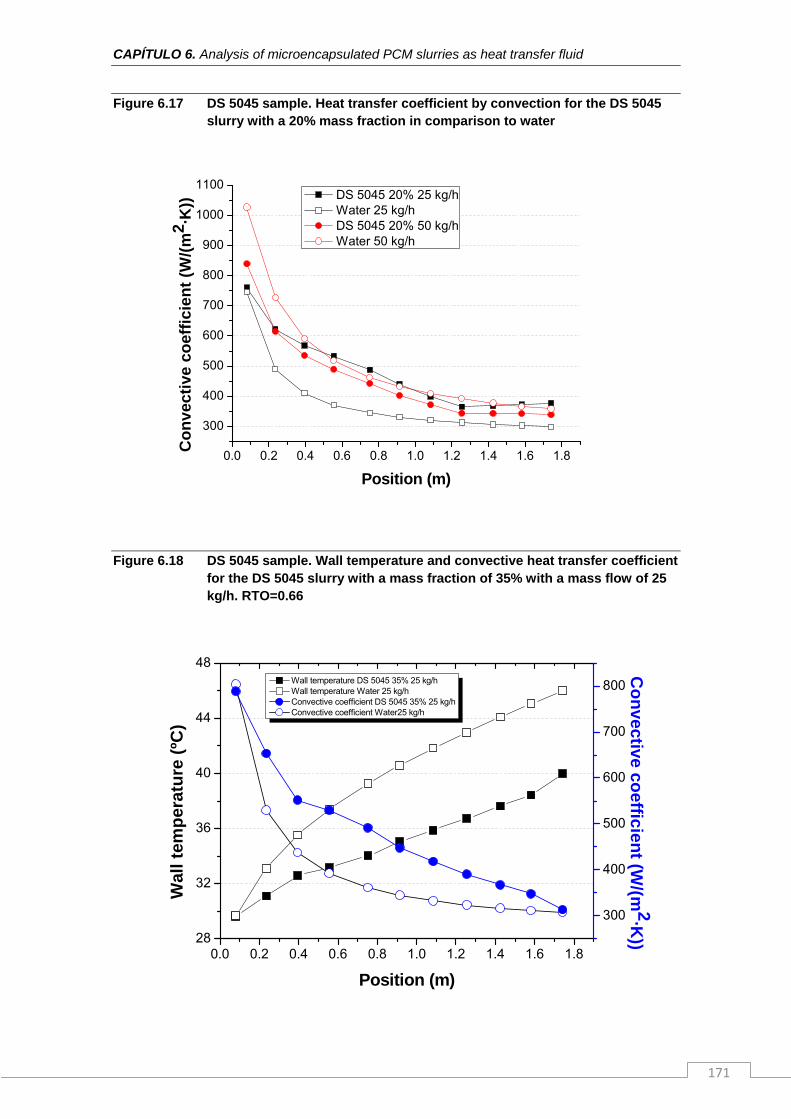
CAPÍTULO 6. Analysis of microencapsulated PCM slurries as heat transfer fluid
171
Figure 6.17 DS 5045 sample. Heat transfer coefficient by convection for the DS 5045 slurry with a 20% mass fraction in comparison to water
0.0 0.2 0.4 0.6 0.8 1.0 1.2 1.4 1.6 1.8
300
400
500
600
700
800
900
1000
1100C
on
vect
ive
coef
fici
ent
(W/(
m2 ·K
))
Position (m)
DS 5045 20% 25 kg/h Water 25 kg/h DS 5045 20% 50 kg/h Water 50 kg/h
Figure 6.18 DS 5045 sample. Wall temperature and convective heat transfer coefficient for the DS 5045 slurry with a mass fraction of 35% with a mass flow of 25 kg/h. RTO=0.66
0.0 0.2 0.4 0.6 0.8 1.0 1.2 1.4 1.6 1.828
32
36
40
44
48 Wall temperature DS 5045 35% 25 kg/h Wall temperature Water 25 kg/h Convective coefficient DS 5045 35% 25 kg/h Convective coefficient Water25 kg/h
Position (m)
Wal
l te
mp
erat
ure
(ºC
)
300
400
500
600
700
800
Co
nvective co
efficient (W
/(m2·K
))
Analysis of microencapsulated phase change material slurries and phase change material emulsions as heat transfer fluid and thermal storage material
172
According to the results obtained, it has been observed that when the mass flow
of the mPCM slurries is increased, these may be non-beneficial in comparison
to the use of water, since the improvement in the internal forced convective
coefficient decreases. In these cases it should be pointed out that although the
convective coefficient is very similar or equal to that when water is used, the
wall temperature is lower as a consequence of the decrease in the PCM slurry
temperature for its higher heating capacity. Countering this argument, working
with higher mass flow of water could be considered decrease its temperature,
and thus decrease the wall temperature.
Under the test operation conditions described in this chapter, it is considered
that the DS 5007 slurry with a mass fraction of 20% would be appropriate for
use as a heat transfer fluid, since it would be able to transport higher thermal
energy and to improve the heat transfer process. However, the pressure drop
under the same mass flow would be higher for the case of the DS 5007 slurry.
In this heat transfer study, it has not been possible to test at higher velocities
than the estimated velocities so that the transported thermal energy vs.
pumping power would be higher for the mPCM slurry than for the water, due to
the limitations of the experimental installation.
It is suggested as future work that the experimental installation could be
redesigned in light of the experience gained during the development of this
thesis in such a way that tests could be carried out at higher velocities and
under turbulent flow conditions.
6.3 Conclusions
The behaviour of two mPCM slurries supplied by BASF, DS 5007 and DS 5045,
with different PCM microcapsule mass fractions has been analyzed.
The analysis procedure is as follows:
1) It is checked that the energy balance is fulfilled, to discard the possible
deposition of PCM microcapsules in the different devices of the
experimental installation.
2) The pressure drop measurements are carried out and the behaviour as
heat transfer fluid is analyzed.
3) The heat transfer phenomenon is analyzed by studying the reduction of
the wall temperature in comparison to water and by estimating the local
heat transfer coefficient by convection.
CAPÍTULO 6. Analysis of microencapsulated PCM slurries as heat transfer fluid
173
It has been observed in the two slurries analyzed, DS 5007 and DS 5045, that
for the same transported thermal energy, the pumping power is lower than for
the case of water from certain values of the transported thermal energy. The
transported thermal energy / pumping power relationship has also been
obtained for each slurry compared to water. The velocity from which this
relationship is higher for the slurry than for water has been determined, thus
establishing which working velocities are suitable.
With regard to the study of heat transfer in the thermal entry region, it has been
observed that to obtain better results than in the case of water, the operating
temperature range of the mPCM slurry must be adjusted to the phase change
temperature range. A decrease in the wall temperature and an improvement in
the heat transfer coefficient by internal forced convection in comparison to water
have been observed. The study was broader for the DS 5007 slurry, since due
to the high viscosity of the DS 5045 slurry, higher than the viscosity limit
recommended by the manufacturer of the thermostatic bath, it was very
complicated to control adequately the temperature of the tests. It has been
observed that the DS 5007 slurry with a 20% PCM microcapsule mass fraction
shows the best thermal behavior for its use as a heat transfer fluid. Therefore it
is concluded that the mass fraction of the mPCM slurries is a variable to be
optimized.
It has also been observed that the improvement in the heat transfer coefficient
by convection is smaller when working with higher mass flows. This
phenomenon has been explained by the flow patterns of thermal development.
A higher mass flow means a longer thermal entry region. So, for a given
position, the fraction of melted PCM microcapsules in this section is lower,
taking less advantage of the latent heat of the melting of the microcapsules in
suspension.
The smaller improvement of the heat transfer phenomenon when increasing the
PCM microcapsule mass fraction from 20 to 30% can also be attributed to the
increase in viscosity and to the thermal conductivity reduction. These factors
cause a decrease in the degree of turbulence and the deterioration of the heat
transfer towards the core region of the flow, respectively.
As in the case of the same mass flow, in some cases a very similar internal
forced convective coefficient has been obtained both for the water and for some
of the PCM slurries under certain operation conditions. However, although this

Analysis of microencapsulated phase change material slurries and phase change material emulsions as heat transfer fluid and thermal storage material
174
coefficient does not improve, a more stable fluid temperature has been
achieved for the PCM slurry and a consequent lower wall temperature in
comparison to water.
As future work, it is proposed to obtain a correlation of the Nusselt number for
the DS 5007 slurry with different mass fractions, since this would involve a
greater number of tests and therefore a greater number of results. For this
purpose, the thermal conductivity values during the phase change should be
determined, since hitherto the thermal conductivity values have been
determined in the single-phase states. Besides, when calculating the
parameters on which the correlation will depend, as will be the case with the
Reynolds number, it will have to be taken into account that these mPCM slurries
are non-Newtonian fluids.
Another suggestion for future work is to redesign the experimental installation in
the light of the experience gained during the development of this thesis in such
a way that tests may be carried out at higher velocities and under turbulent flow
conditions.
CHAPTER 7. Analysis of applications: tanks of PCM slurries. Comparison with other thermal energy storage systems.
175
In this chapter the characteristics of a TES tank with PCM slurries have been compared to a tank with spherical capsules of PCM and to a sensible TES tank with water. This comparison relates to power, energy density and pressure drop.
7 Analysis of applications: tanks of PCM slurries. Comparison with other thermal energy storage systems
Analysis of microencapsulated phase change material slurries and phase change material emulsions as heat transfer fluid and thermal storage material
176
7.1 Introduction
As pointed out in the section on “Motivation, objectives and methodology”, the
present thesis is framed within a R&D project undertaken with a private
company about thermal energy storage with phase change materials and its
application in solar absorption cooling systems. Solar cooling is a very
promising technology due to the fact that solar energy is a widely available
renewable energy source that in some applications coincides in time with the
cooling requirements. However, the intermittent supply of solar energy, the
periods of low radiation, as well as the possible non-overlapping of demand and
production according to the type of buildings are serious problems.
TES systems are essential for addressing the intermittency of solar energy and
the variation of the cooling demand. Such energy could be stored in sensible /
latent heat or by means of thermochemical storage techniques. The choice of
the storage medium depends on the volume of energy to be stored as well as
the temperature range required in the application.
This thermal energy could be stored at high temperatures (~100-200ºC) to be
supplied to the generator of the absorption cycle, or at low temperatures (7-
12ºC), that is to say, the energy produced by the absorption system would be
stored. The temperature necessary for energy storage at high temperatures for
the generator will be different according to the vapor absorption system and to
the working substances. However, in all systems the heat must be supplied to
the generator in a very narrow temperature range of 5-10ºC for a good
performance (Chidambaram et al. 2011). To store an amount of energy in the
form of sensible heat in a very narrow temperature range would require a
storage tank of great volume. In contrast, latent TES systems would solve the
volume problems and would meet the requirements with a charge and
discharge process at a practically constant temperature.
To date there have been few applications of latent TES systems in solar cooling
systems. As mentioned, there are two main storage alternatives in solar
absorption cooling applications: storage at high temperatures for the generator,
or at low temperatures for the storage of the energy produced at low
temperature by the absorption system. However, Helm et al. (2009) in their
experimental work placed the TES system at the inlet of the condenser and
used a dry cooling tower, instead of a wet cooling tower, as shown in the
diagram in figure 7.1 The storage unit allowed more moderate temperatures in
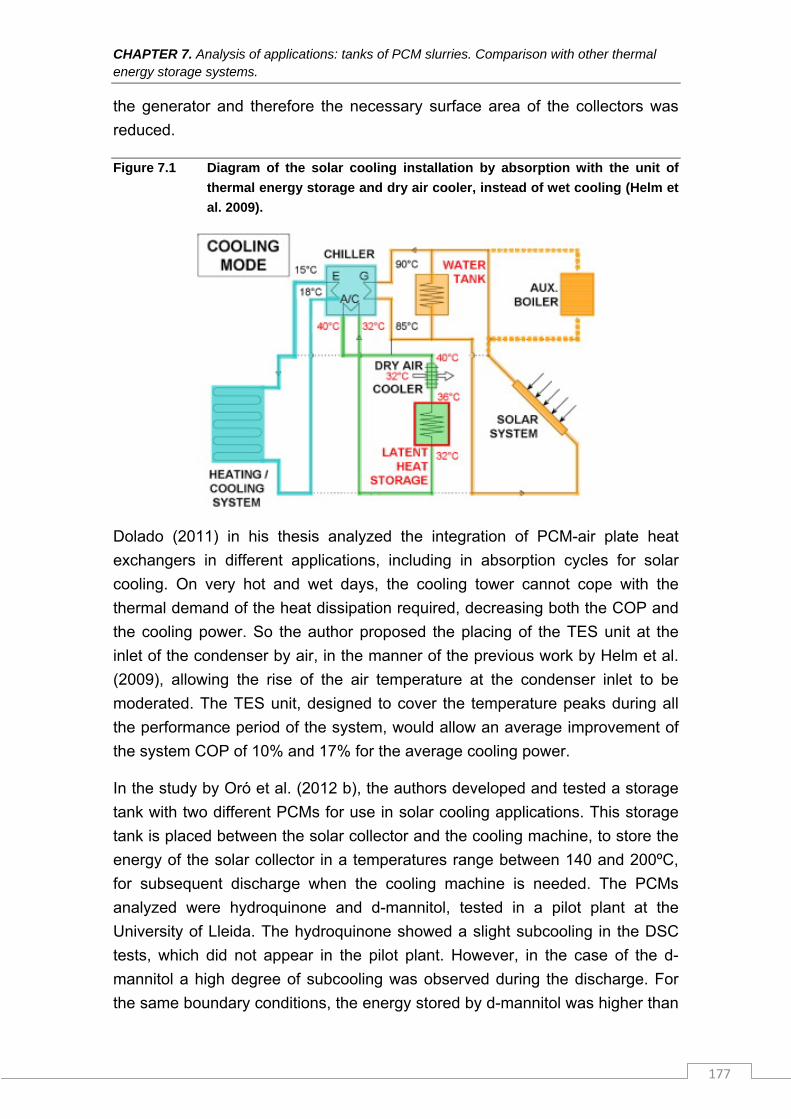
CHAPTER 7. Analysis of applications: tanks of PCM slurries. Comparison with other thermal energy storage systems.
177
the generator and therefore the necessary surface area of the collectors was
reduced.
Figure 7.1 Diagram of the solar cooling installation by absorption with the unit of
thermal energy storage and dry air cooler, instead of wet cooling (Helm et
al. 2009).
Dolado (2011) in his thesis analyzed the integration of PCM-air plate heat
exchangers in different applications, including in absorption cycles for solar
cooling. On very hot and wet days, the cooling tower cannot cope with the
thermal demand of the heat dissipation required, decreasing both the COP and
the cooling power. So the author proposed the placing of the TES unit at the
inlet of the condenser by air, in the manner of the previous work by Helm et al.
(2009), allowing the rise of the air temperature at the condenser inlet to be
moderated. The TES unit, designed to cover the temperature peaks during all
the performance period of the system, would allow an average improvement of
the system COP of 10% and 17% for the average cooling power.
In the study by Oró et al. (2012 b), the authors developed and tested a storage
tank with two different PCMs for use in solar cooling applications. This storage
tank is placed between the solar collector and the cooling machine, to store the
energy of the solar collector in a temperatures range between 140 and 200ºC,
for subsequent discharge when the cooling machine is needed. The PCMs
analyzed were hydroquinone and d-mannitol, tested in a pilot plant at the
University of Lleida. The hydroquinone showed a slight subcooling in the DSC
tests, which did not appear in the pilot plant. However, in the case of the d-
mannitol a high degree of subcooling was observed during the discharge. For
the same boundary conditions, the energy stored by d-mannitol was higher than
Analysis of microencapsulated phase change material slurries and phase change material emulsions as heat transfer fluid and thermal storage material
178
in the case of the hydroquinone. This improvement was around 30% and 20%
for the charge and discharge processes, respectively, in spite of the fact that the
improvement in latent heat was only 10% and 16%, respectively. The reason for
the improvement in the energy stored was not explained in the work.
7.1.1 Review of latent TES systems. Water exchange
For an appropriate performance of latent TES systems in solar absorption
cooling systems it is very important to understand the heat transfer in the
charge and discharge processes (melting and solidification). Many researchers
have carried out both numerical and experimental studies to predict the
transitory response of the systems under different configurations, and for
different operation conditions, where the heat transfer fluid is water. The
geometry, materials and parameters used in some of these experimental and
numerical studies are compiled in Table VII.1.
When selecting the geometry, the following aspects of the TES system must be
taken into account:
Thermal energy stored per volume
Power appropriate for the application
Pressure drop of the heat transfer fluid
Compatibility of the geometry with the PCM
Economic cost and amortization
Mechanical problems: expansion, fatigue, etc.
Environmental impact (life cycle analysis)
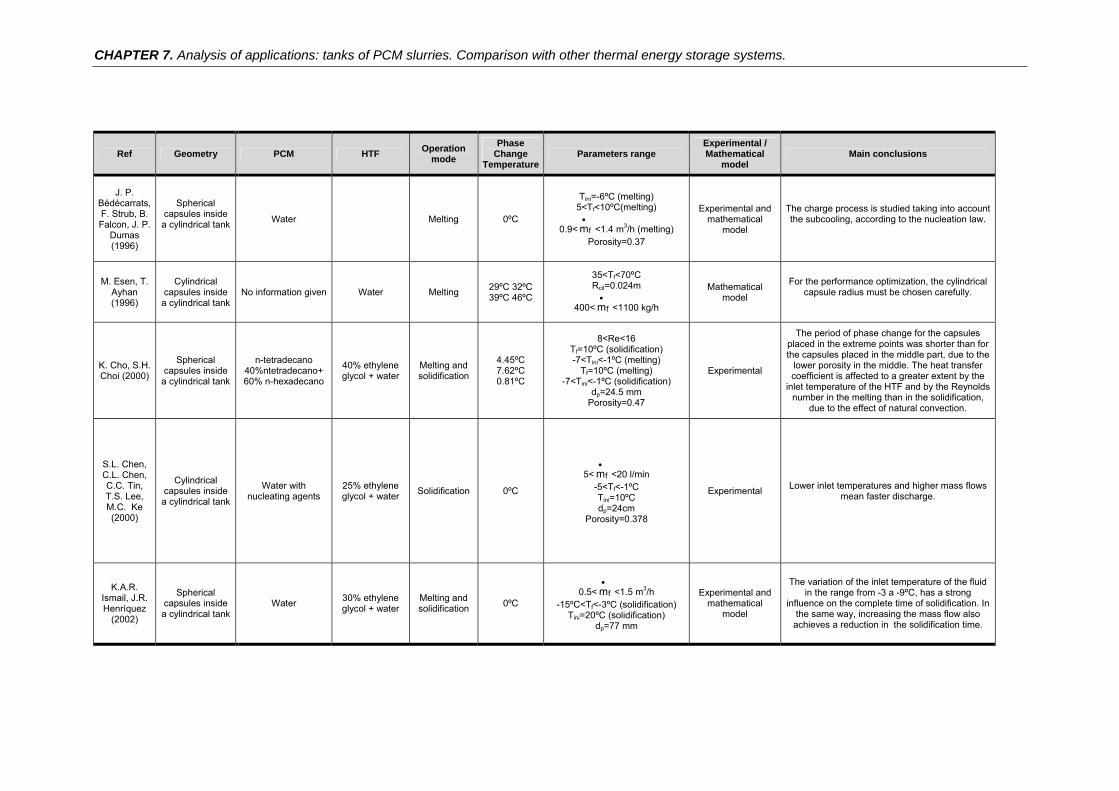
CHAPTER 7. Analysis of applications: tanks of PCM slurries. Comparison with other thermal energy storage systems.
Ref Geometry PCM HTF Operation
mode
Phase Change
TemperatureParameters range
Experimental / Mathematical
model Main conclusions
J. P. Bédécarrats, F. Strub, B. Falcon, J. P.
Dumas (1996)
Spherical capsules inside a cylindrical tank
Water Melting 0ºC
Tini=-6ºC (melting) 5<Tf<10ºC(melting)
0.9< fm
<1.4 m3/h (melting) Porosity=0.37
Experimental and mathematical
model
The charge process is studied taking into account the subcooling, according to the nucleation law.
M. Esen, T. Ayhan (1996)
Cylindrical capsules inside
a cylindrical tank No information given Water Melting
29ºC 32ºC 39ºC 46ºC
35<Tf<70ºC Rcil=0.024m
400< fm
<1100 kg/h
Mathematical model
For the performance optimization, the cylindrical capsule radius must be chosen carefully.
K. Cho, S.H. Choi (2000)
Spherical capsules inside
a cylindrical tank
n-tetradecano 40%ntetradecano+ 60% n-hexadecano
40% ethylene glycol + water
Melting and solidification
4.45ºC 7.62ºC 0.81ºC
8<Re<16 Tf=10ºC (solidification) -7<Tini<-1ºC (melting)
Tf=10ºC (melting) -7<Tini<-1ºC (solidification)
dp=24.5 mm Porosity=0.47
Experimental
The period of phase change for the capsules placed in the extreme points was shorter than for the capsules placed in the middle part, due to the
lower porosity in the middle. The heat transfer coefficient is affected to a greater extent by the
inlet temperature of the HTF and by the Reynolds number in the melting than in the solidification,
due to the effect of natural convection.
S.L. Chen, C.L. Chen, C.C. Tin, T.S. Lee, M.C. Ke (2000)
Cylindrical capsules inside a cylindrical tank
Water with nucleating agents
25% ethylene glycol + water
Solidification 0ºC
5< fm
<20 l/min -5<Tf<-1ºC Tini=10ºC dp=24cm
Porosity=0.378
Experimental Lower inlet temperatures and higher mass flows
mean faster discharge.
K.A.R. Ismail, J.R. Henríquez
(2002)
Spherical capsules inside a cylindrical tank
Water 30% ethylene glycol + water
Melting and solidification
0ºC 0.5< fm
<1.5 m3/h
-15ºC<Tf<-3ºC (solidification) Tini=20ºC (solidification)
dp=77 mm
Experimental and mathematical
model
The variation of the inlet temperature of the fluid in the range from -3 a -9ºC, has a strong
influence on the complete time of solidification. In the same way, increasing the mass flow also
achieves a reduction in the solidification time.
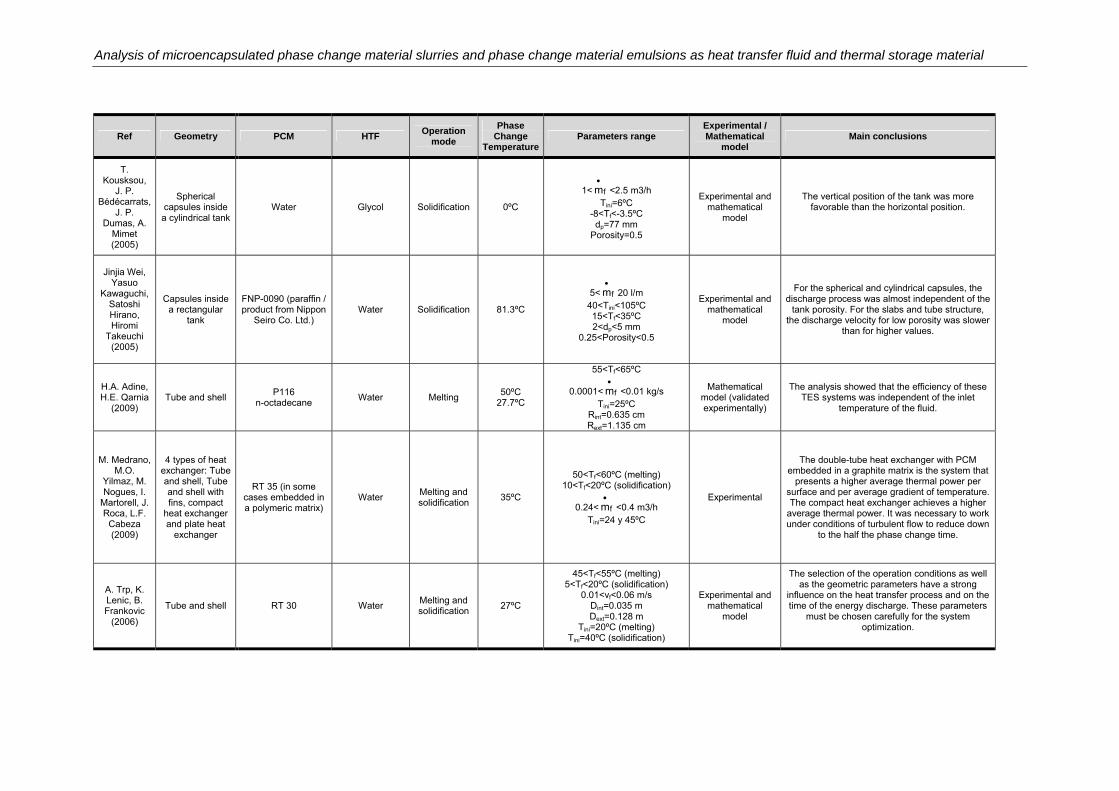
Analysis of microencapsulated phase change material slurries and phase change material emulsions as heat transfer fluid and thermal storage material
Ref Geometry PCM HTF Operation
mode
Phase Change
TemperatureParameters range
Experimental / Mathematical
model Main conclusions
T. Kousksou,
J. P. Bédécarrats,
J. P. Dumas, A.
Mimet (2005)
Spherical capsules inside a cylindrical tank
Water Glycol Solidification 0ºC
1< fm
<2.5 m3/h Tini=6ºC
-8<Tf<-3.5ºC dp=77 mm
Porosity=0.5
Experimental and mathematical
model
The vertical position of the tank was more favorable than the horizontal position.
Jinjia Wei, Yasuo
Kawaguchi, Satoshi Hirano, Hiromi
Takeuchi (2005)
Capsules inside a rectangular
tank
FNP-0090 (paraffin / product from Nippon
Seiro Co. Ltd.) Water Solidification 81.3ºC
5< fm
20 l/m 40<Tini<105ºC 15<Tf<35ºC 2<dp<5 mm
0.25<Porosity<0.5
Experimental and mathematical
model
For the spherical and cylindrical capsules, the discharge process was almost independent of the
tank porosity. For the slabs and tube structure, the discharge velocity for low porosity was slower
than for higher values.
H.A. Adine, H.E. Qarnia
(2009) Tube and shell
P116 n-octadecane
Water Melting 50ºC
27.7ºC
55<Tf<65ºC
0.0001< fm
<0.01 kg/s Tini=25ºC
Rint=0.635 cm Rext=1.135 cm
Mathematical model (validated experimentally)
The analysis showed that the efficiency of these TES systems was independent of the inlet
temperature of the fluid.
M. Medrano, M.O.
Yilmaz, M. Nogues, I.
Martorell, J. Roca, L.F.
Cabeza (2009)
4 types of heat exchanger: Tube and shell, Tube and shell with fins, compact
heat exchanger and plate heat
exchanger
RT 35 (in some cases embedded in a polymeric matrix)
Water Melting and solidification
35ºC
50<Tf<60ºC (melting) 10<Tf<20ºC (solidification)
0.24< fm
<0.4 m3/h Tini=24 y 45ºC
Experimental
The double-tube heat exchanger with PCM embedded in a graphite matrix is the system that
presents a higher average thermal power per surface and per average gradient of temperature. The compact heat exchanger achieves a higher
average thermal power. It was necessary to work under conditions of turbulent flow to reduce down
to the half the phase change time.
A. Trp, K. Lenic, B. Frankovic
(2006)
Tube and shell RT 30 Water Melting and solidification
27ºC
45<Tf<55ºC (melting) 5<Tf<20ºC (solidification)
0.01<vf<0.06 m/s Dint=0.035 m Dext=0.128 m
Tini=20ºC (melting) Tini=40ºC (solidification)
Experimental and mathematical
model
The selection of the operation conditions as well as the geometric parameters have a strong
influence on the heat transfer process and on the time of the energy discharge. These parameters
must be chosen carefully for the system optimization.
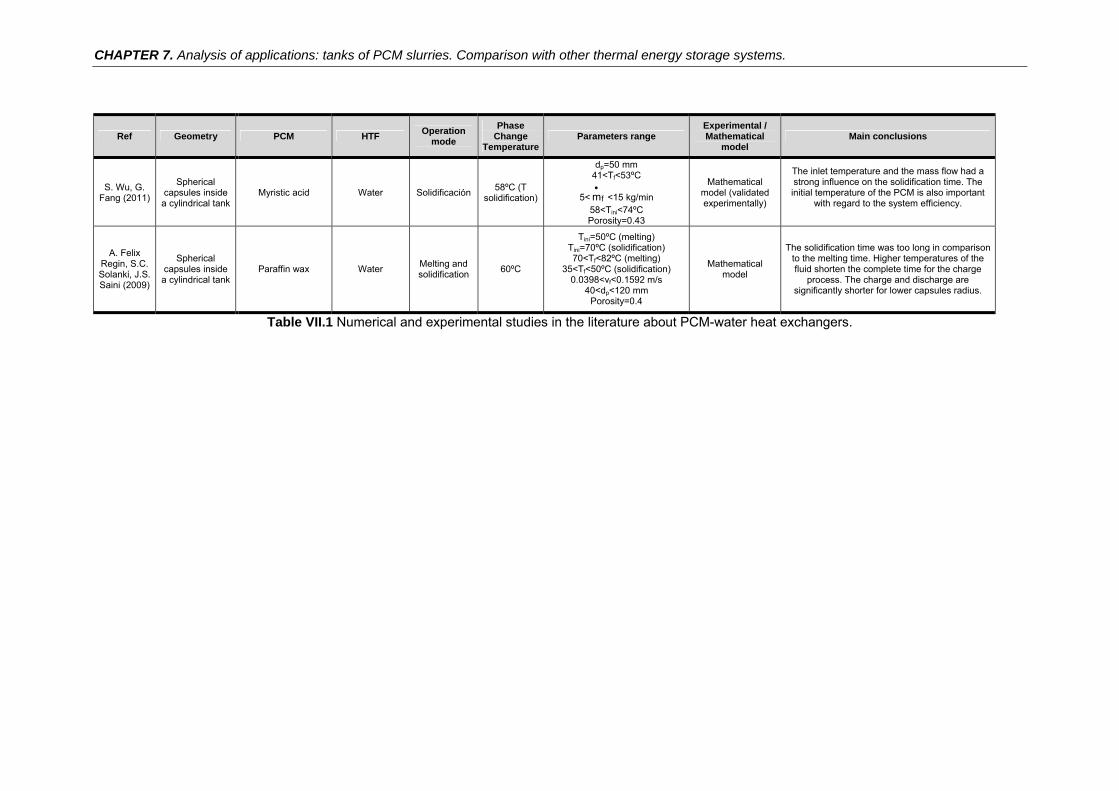
CHAPTER 7. Analysis of applications: tanks of PCM slurries. Comparison with other thermal energy storage systems.
Ref Geometry PCM HTF Operation
mode
Phase Change
TemperatureParameters range
Experimental / Mathematical
model Main conclusions
S. Wu, G. Fang (2011)
Spherical capsules inside a cylindrical tank
Myristic acid Water Solidificación 58ºC (T
solidification)
dp=50 mm 41<Tf<53ºC
5< fm
<15 kg/min 58<Tini<74ºC Porosity=0.43
Mathematical model (validated experimentally)
The inlet temperature and the mass flow had a strong influence on the solidification time. The initial temperature of the PCM is also important
with regard to the system efficiency.
A. Felix Regin, S.C. Solanki, J.S. Saini (2009)
Spherical capsules inside a cylindrical tank
Paraffin wax Water Melting and solidification
60ºC
Tini=50ºC (melting) Tini=70ºC (solidification) 70<Tf<82ºC (melting)
35<Tf<50ºC (solidification) 0.0398<vf<0.1592 m/s
40<dp<120 mm Porosity=0.4
Mathematical model
The solidification time was too long in comparison to the melting time. Higher temperatures of the fluid shorten the complete time for the charge
process. The charge and discharge are significantly shorter for lower capsules radius.
Table VII.1 Numerical and experimental studies in the literature about PCM-water heat exchangers.
Analysis of microencapsulated phase change material slurries and phase change material emulsions as heat transfer fluid and thermal storage material
182
7.1.2 Considerations about heat transfer in latent TES systems
An important question that must be considered in TES systems with PCMs is
that although PCMs have a high thermal energy storage density, they generally
have low thermal conductivity. In TES systems with PCM-Air exchange, it has
been demonstrated how a prototype with a better design of the geometry of the
heat exchanger has better characteristics in spite of having lower thermal
conductivity (Lázaro 2008). However, in PCM-water exchangers, the heat
transfer phenomenon will be influenced to a greater extent by the conduction in
the PCM. Therefore, either the thermal conductivity needs to be improved or
containers with a higher surface /volume ratio are required to improve the heat
transfer.
In the case of PCM microcapsules in suspension, due to their microscopic size
the mPCM slurry or emulsion can be considered as a homogeneous material.
This hypothesis implies that the temperature gradients inside the capsules are
negligible. This condition would be fulfilled if the dominant resistance of the heat
transfer process were the convection around the microcapsule. The fulfillment
of this condition can be analyzed by the Biot number. When the Biot number is
lower than 0.1, the conductive thermal resistance in the microcapsule could be
ignored, and therefore the temperature gradients could be considered
negligible. That is to say, when the PCM is microencapsulated, the low thermal
conductivity of the PCM ceases to be a problem (Streicher et al. 2005). In this
case, attention is focused on the effective thermal conductivity of the PCM
slurry as a homogeneous fluid.
7.1.3 Objetives
As already mentioned, part of this thesis is framed within a R&D project
undertaken with a private company working in the heating and air conditioning
field in Spain. This company develops spherical capsules (manufactured in two
diameters: 77 and 98 mm), so the geometry of the PCM container of the latent
TES systems was limited to this type of container. The research was focused on
the analysis of the thermal behaviour of a tank with spheres, and its comparison
to a tank with mPCM slurry. Spheres of 77 mm were analyzed, since they are
manufactured by the company, and spheres of lower size (44 and 30 mm) have
also been analyzed to examine how the characteristics of the TES system may
improve. Regarding the storage temperature, the results of thermal energy
storage at low temperature are presented, since PCM slurries at high
temperatures have not yet been developed. These slurries would require the
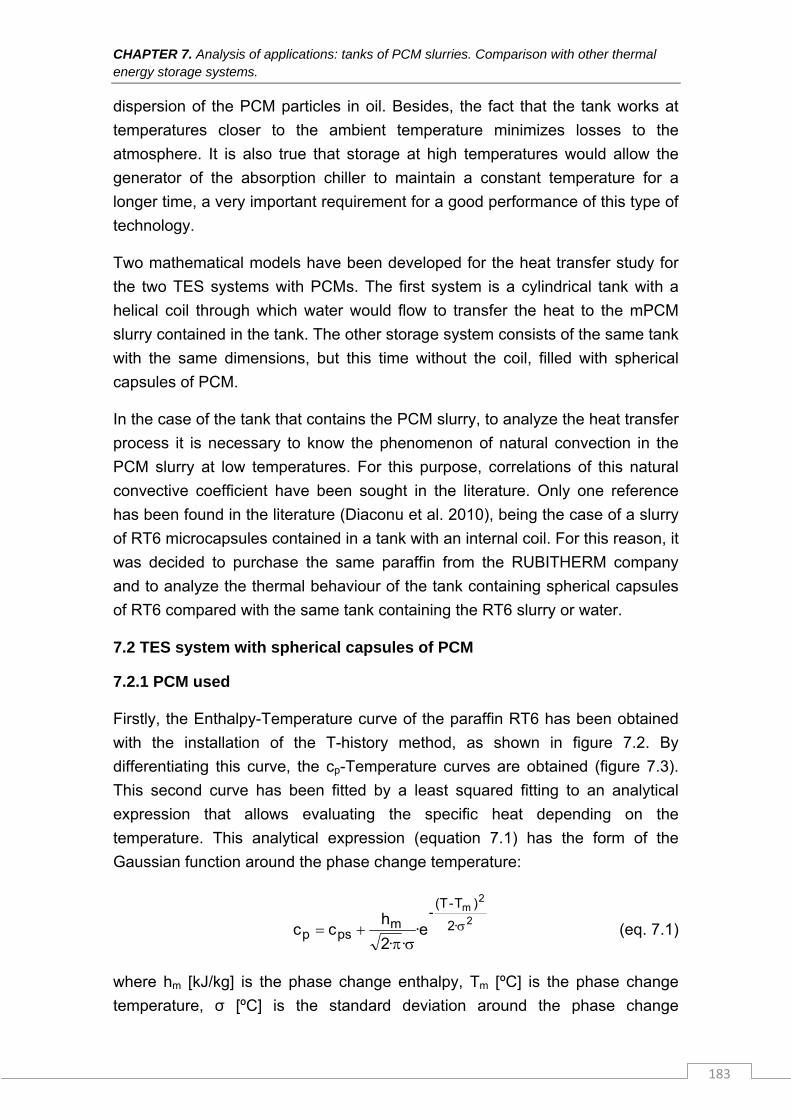
CHAPTER 7. Analysis of applications: tanks of PCM slurries. Comparison with other thermal energy storage systems.
183
dispersion of the PCM particles in oil. Besides, the fact that the tank works at
temperatures closer to the ambient temperature minimizes losses to the
atmosphere. It is also true that storage at high temperatures would allow the
generator of the absorption chiller to maintain a constant temperature for a
longer time, a very important requirement for a good performance of this type of
technology.
Two mathematical models have been developed for the heat transfer study for
the two TES systems with PCMs. The first system is a cylindrical tank with a
helical coil through which water would flow to transfer the heat to the mPCM
slurry contained in the tank. The other storage system consists of the same tank
with the same dimensions, but this time without the coil, filled with spherical
capsules of PCM.
In the case of the tank that contains the PCM slurry, to analyze the heat transfer
process it is necessary to know the phenomenon of natural convection in the
PCM slurry at low temperatures. For this purpose, correlations of this natural
convective coefficient have been sought in the literature. Only one reference
has been found in the literature (Diaconu et al. 2010), being the case of a slurry
of RT6 microcapsules contained in a tank with an internal coil. For this reason, it
was decided to purchase the same paraffin from the RUBITHERM company
and to analyze the thermal behaviour of the tank containing spherical capsules
of RT6 compared with the same tank containing the RT6 slurry or water.
7.2 TES system with spherical capsules of PCM
7.2.1 PCM used
Firstly, the Enthalpy-Temperature curve of the paraffin RT6 has been obtained
with the installation of the T-history method, as shown in figure 7.2. By
differentiating this curve, the cp-Temperature curves are obtained (figure 7.3).
This second curve has been fitted by a least squared fitting to an analytical
expression that allows evaluating the specific heat depending on the
temperature. This analytical expression (equation 7.1) has the form of the
Gaussian function around the phase change temperature:
2
2m
·2
)T-(T-
mpsp e·
··2
hcc
(eq. 7.1)
where hm [kJ/kg] is the phase change enthalpy, Tm [ºC] is the phase change
temperature, σ [ºC] is the standard deviation around the phase change
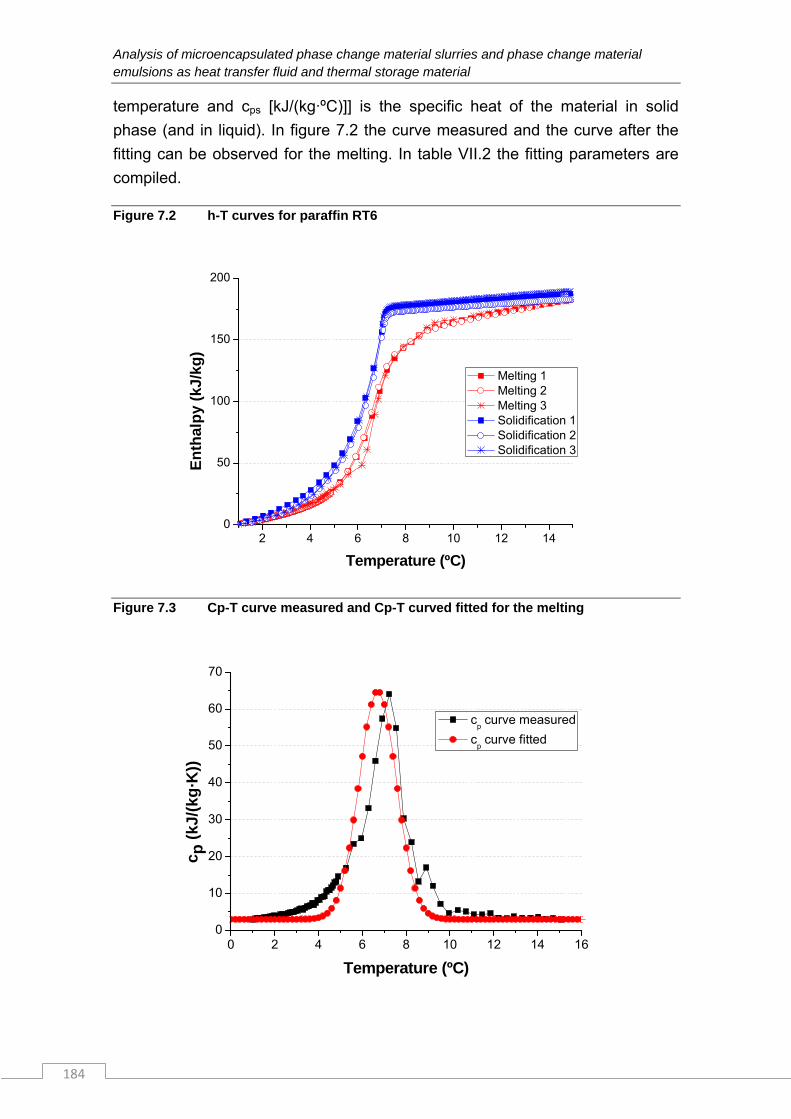
Analysis of microencapsulated phase change material slurries and phase change material emulsions as heat transfer fluid and thermal storage material
184
temperature and cps [kJ/(kg·ºC)]] is the specific heat of the material in solid
phase (and in liquid). In figure 7.2 the curve measured and the curve after the
fitting can be observed for the melting. In table VII.2 the fitting parameters are
compiled.
Figure 7.2 h-T curves for paraffin RT6
2 4 6 8 10 12 140
50
100
150
200
En
thal
py
(kJ/
kg)
Temperature (ºC)
Melting 1 Melting 2 Melting 3 Solidification 1 Solidification 2 Solidification 3
Figure 7.3 Cp-T curve measured and Cp-T curved fitted for the melting
0 2 4 6 8 10 12 14 160
10
20
30
40
50
60
70
c p (
kJ/
(kg
·K))
Temperature (ºC)
cp curve measured
cp curve fitted
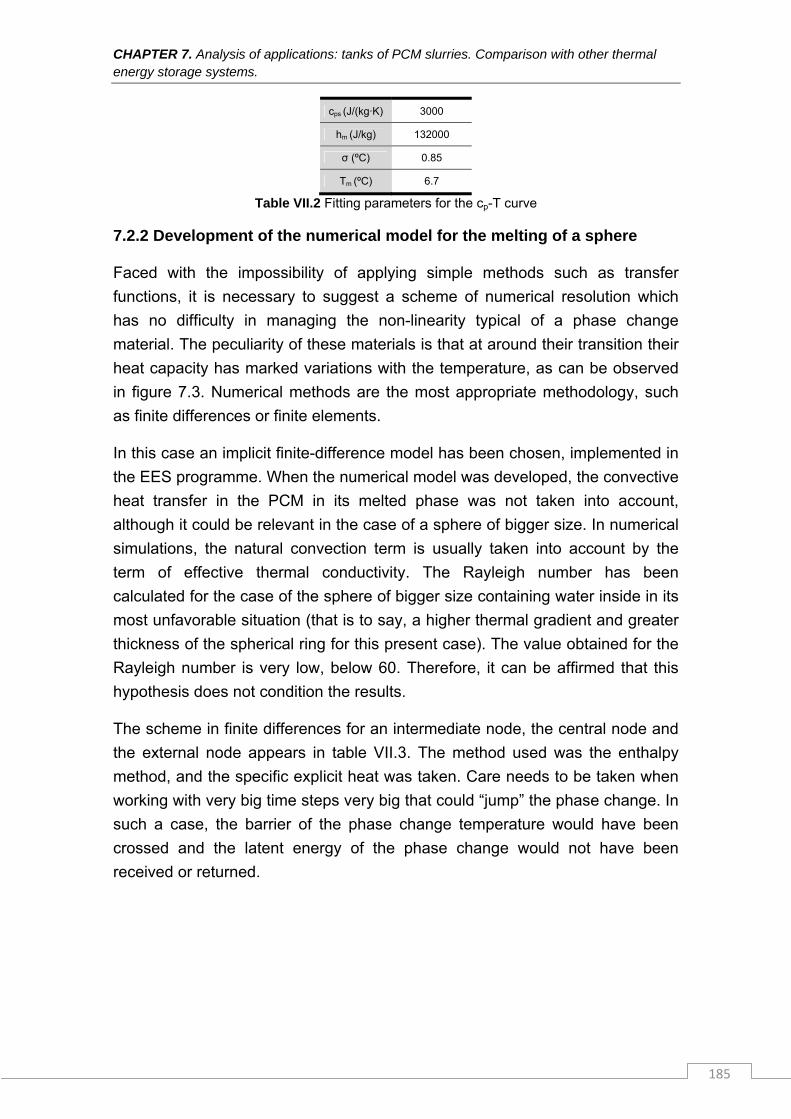
CHAPTER 7. Analysis of applications: tanks of PCM slurries. Comparison with other thermal energy storage systems.
185
cps (J/(kg·K) 3000
hm (J/kg) 132000
σ (ºC) 0.85
Tm (ºC) 6.7
Table VII.2 Fitting parameters for the cp-T curve
7.2.2 Development of the numerical model for the melting of a sphere
Faced with the impossibility of applying simple methods such as transfer
functions, it is necessary to suggest a scheme of numerical resolution which
has no difficulty in managing the non-linearity typical of a phase change
material. The peculiarity of these materials is that at around their transition their
heat capacity has marked variations with the temperature, as can be observed
in figure 7.3. Numerical methods are the most appropriate methodology, such
as finite differences or finite elements.
In this case an implicit finite-difference model has been chosen, implemented in
the EES programme. When the numerical model was developed, the convective
heat transfer in the PCM in its melted phase was not taken into account,
although it could be relevant in the case of a sphere of bigger size. In numerical
simulations, the natural convection term is usually taken into account by the
term of effective thermal conductivity. The Rayleigh number has been
calculated for the case of the sphere of bigger size containing water inside in its
most unfavorable situation (that is to say, a higher thermal gradient and greater
thickness of the spherical ring for this present case). The value obtained for the
Rayleigh number is very low, below 60. Therefore, it can be affirmed that this
hypothesis does not condition the results.
The scheme in finite differences for an intermediate node, the central node and
the external node appears in table VII.3. The method used was the enthalpy
method, and the specific explicit heat was taken. Care needs to be taken when
working with very big time steps very big that could “jump” the phase change. In
such a case, the barrier of the phase change temperature would have been
crossed and the latent energy of the phase change would not have been
received or returned.
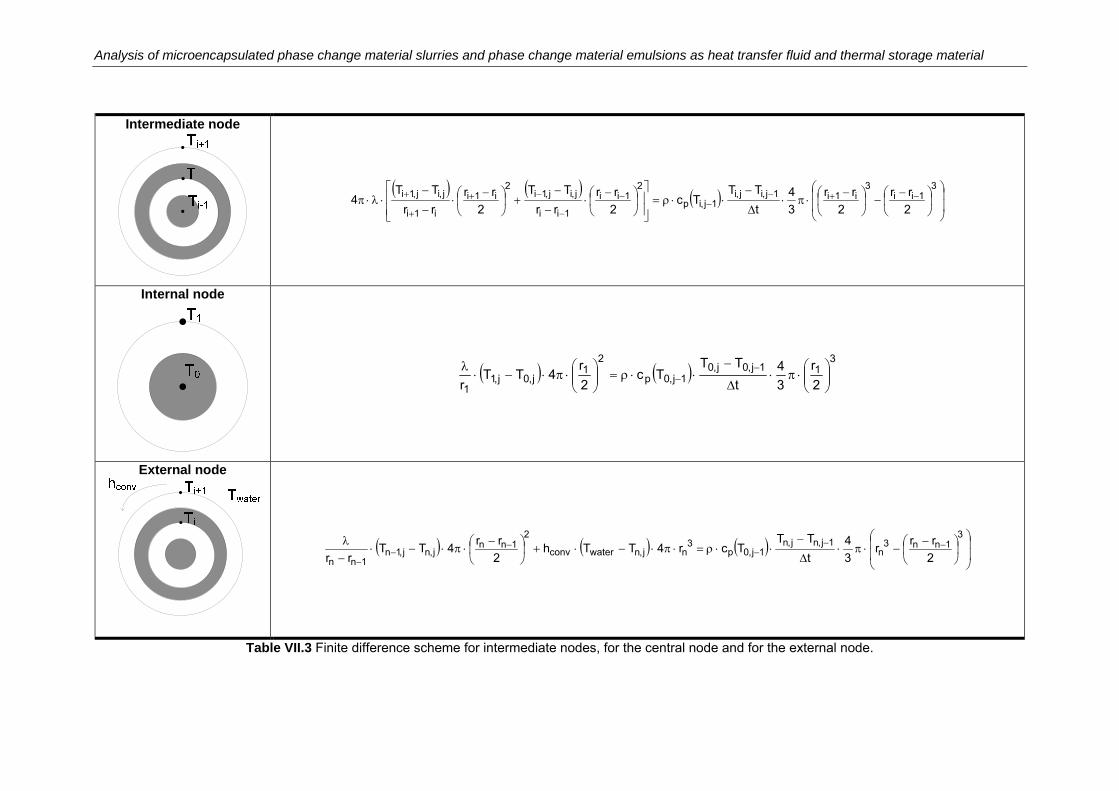
Analysis of microencapsulated phase change material slurries and phase change material emulsions as heat transfer fluid and thermal storage material
Intermediate node
3
1ii3
i1i1j,ij,i1j,ip
21ii
1ii
j,ij,1i2
i1i
i1i
j,ij,1i
2
rr
2
rr
3
4
t
TTTc
2
rr
rr
TT
2
rr
rr
TT4
Internal node
3
11j,0j,01j,0p
21
j,0j,11 2
r
3
4
t
TTTc
2
r4TT
r
External node
31nn3
n1j,nj,n
1j,0p3
nj,nwaterconv
21nn
j,nj,1n1nn 2
rrr
3
4
t
TTTcr4TTh
2
rr4TT
rr
Table VII.3 Finite difference scheme for intermediate nodes, for the central node and for the external node.
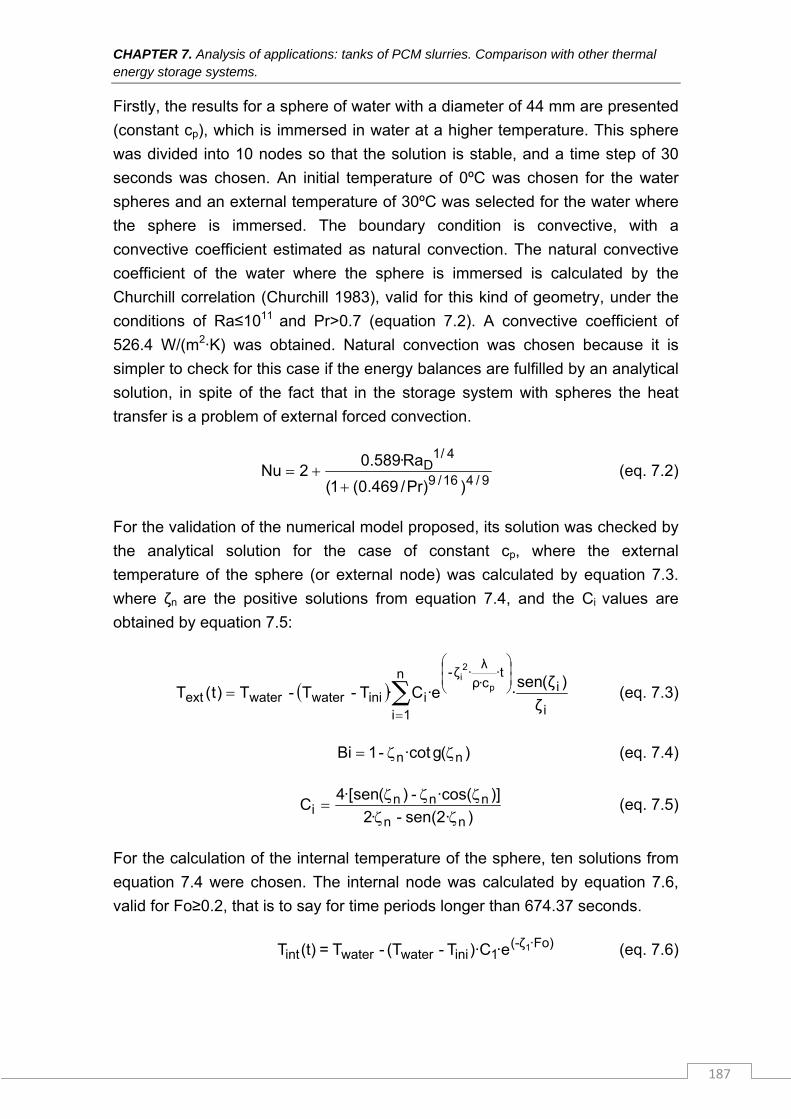
CHAPTER 7. Analysis of applications: tanks of PCM slurries. Comparison with other thermal energy storage systems.
187
Firstly, the results for a sphere of water with a diameter of 44 mm are presented
(constant cp), which is immersed in water at a higher temperature. This sphere
was divided into 10 nodes so that the solution is stable, and a time step of 30
seconds was chosen. An initial temperature of 0ºC was chosen for the water
spheres and an external temperature of 30ºC was selected for the water where
the sphere is immersed. The boundary condition is convective, with a
convective coefficient estimated as natural convection. The natural convective
coefficient of the water where the sphere is immersed is calculated by the
Churchill correlation (Churchill 1983), valid for this kind of geometry, under the
conditions of Ra≤1011 and Pr>0.7 (equation 7.2). A convective coefficient of
526.4 W/(m2·K) was obtained. Natural convection was chosen because it is
simpler to check for this case if the energy balances are fulfilled by an analytical
solution, in spite of the fact that in the storage system with spheres the heat
transfer is a problem of external forced convection.
9/416/9
4/1D
)Pr)/469.0(1(
Ra·589.02Nu
(eq. 7.2)
For the validation of the numerical model proposed, its solution was checked by
the analytical solution for the case of constant cp, where the external
temperature of the sphere (or external node) was calculated by equation 7.3.
where ζn are the positive solutions from equation 7.4, and the Ci values are
obtained by equation 7.5:
i
in
i
t·c·ρ
λ·ζ-
iiniwaterwaterext ζ
)ζ(sen·e·C·T-T-T)t(T p
i
∑1
2
(eq. 7.3)
)(g·cot-1Bi nn (eq. 7.4)
)sen(2·-·2
)]·cos(-)(sen·[4C
nn
nnni
(eq. 7.5)
For the calculation of the internal temperature of the sphere, ten solutions from
equation 7.4 were chosen. The internal node was calculated by equation 7.6,
valid for Fo≥0.2, that is to say for time periods longer than 674.37 seconds.
·Fo)(-ζ1iniwaterwaterint
1·e)·CT-(T-T=(t)T (eq. 7.6)
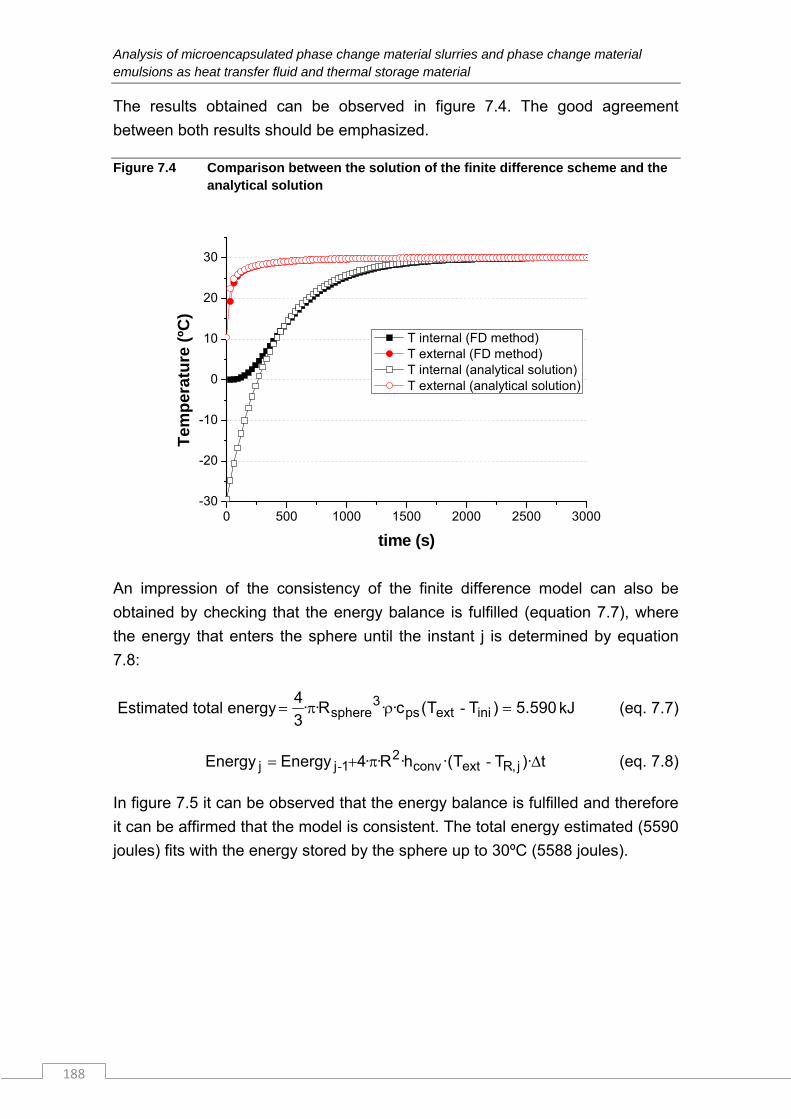
Analysis of microencapsulated phase change material slurries and phase change material emulsions as heat transfer fluid and thermal storage material
188
The results obtained can be observed in figure 7.4. The good agreement
between both results should be emphasized.
Figure 7.4 Comparison between the solution of the finite difference scheme and the analytical solution
0 500 1000 1500 2000 2500 3000-30
-20
-10
0
10
20
30
Tem
per
atu
re (
ºC)
time (s)
T internal (FD method) T external (FD method) T internal (analytical solution) T external (analytical solution)
An impression of the consistency of the finite difference model can also be
obtained by checking that the energy balance is fulfilled (equation 7.7), where
the energy that enters the sphere until the instant j is determined by equation
7.8:
Estimated total energy 590.5)TT(c··R··3
4iniextps
3sphere - kJ (eq. 7.7)
t)·TT·(h·R··4EnergyEnergy j,Rextconv2
1jj -- (eq. 7.8)
In figure 7.5 it can be observed that the energy balance is fulfilled and therefore
it can be affirmed that the model is consistent. The total energy estimated (5590
joules) fits with the energy stored by the sphere up to 30ºC (5588 joules).
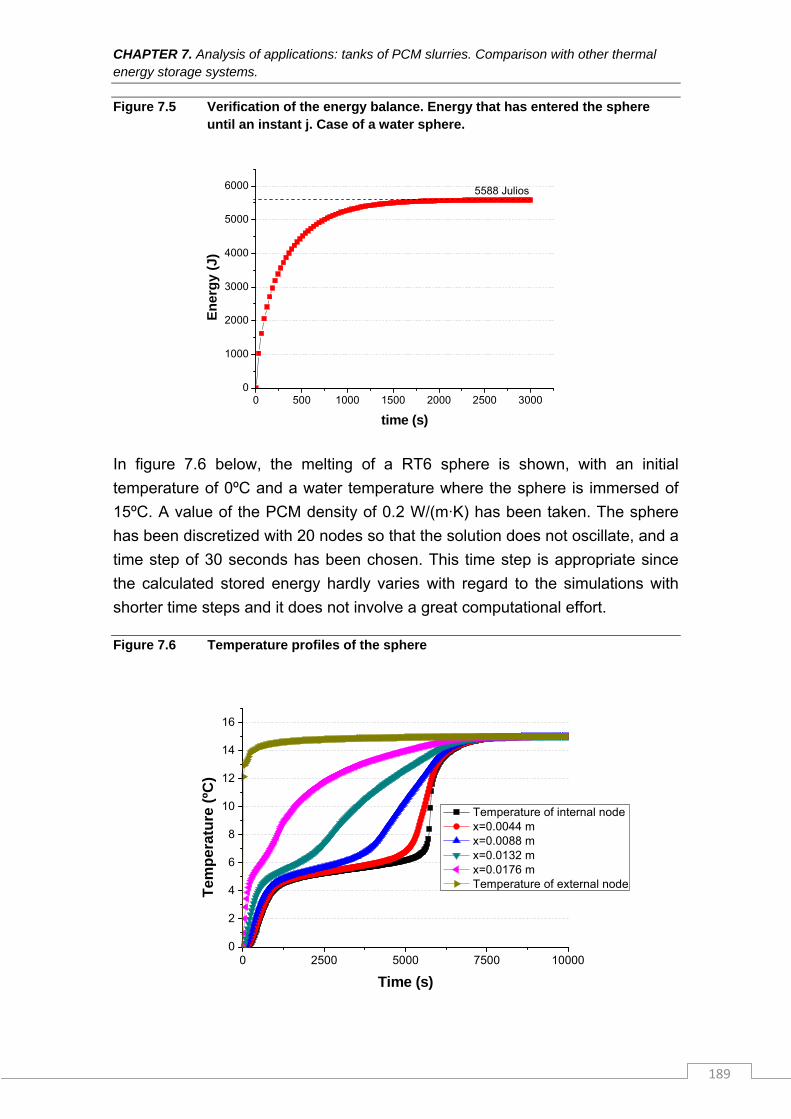
CHAPTER 7. Analysis of applications: tanks of PCM slurries. Comparison with other thermal energy storage systems.
189
Figure 7.5 Verification of the energy balance. Energy that has entered the sphere until an instant j. Case of a water sphere.
0 500 1000 1500 2000 2500 30000
1000
2000
3000
4000
5000
6000
En
erg
y (J
)
time (s)
5588 Julios
In figure 7.6 below, the melting of a RT6 sphere is shown, with an initial
temperature of 0ºC and a water temperature where the sphere is immersed of
15ºC. A value of the PCM density of 0.2 W/(m·K) has been taken. The sphere
has been discretized with 20 nodes so that the solution does not oscillate, and a
time step of 30 seconds has been chosen. This time step is appropriate since
the calculated stored energy hardly varies with regard to the simulations with
shorter time steps and it does not involve a great computational effort.
Figure 7.6 Temperature profiles of the sphere
0 2500 5000 7500 100000
2
4
6
8
10
12
14
16
Tem
per
atu
re (
ºC)
Time (s)
Temperature of internal node x=0.0044 m x=0.0088 m x=0.0132 m x=0.0176 m Temperature of external node
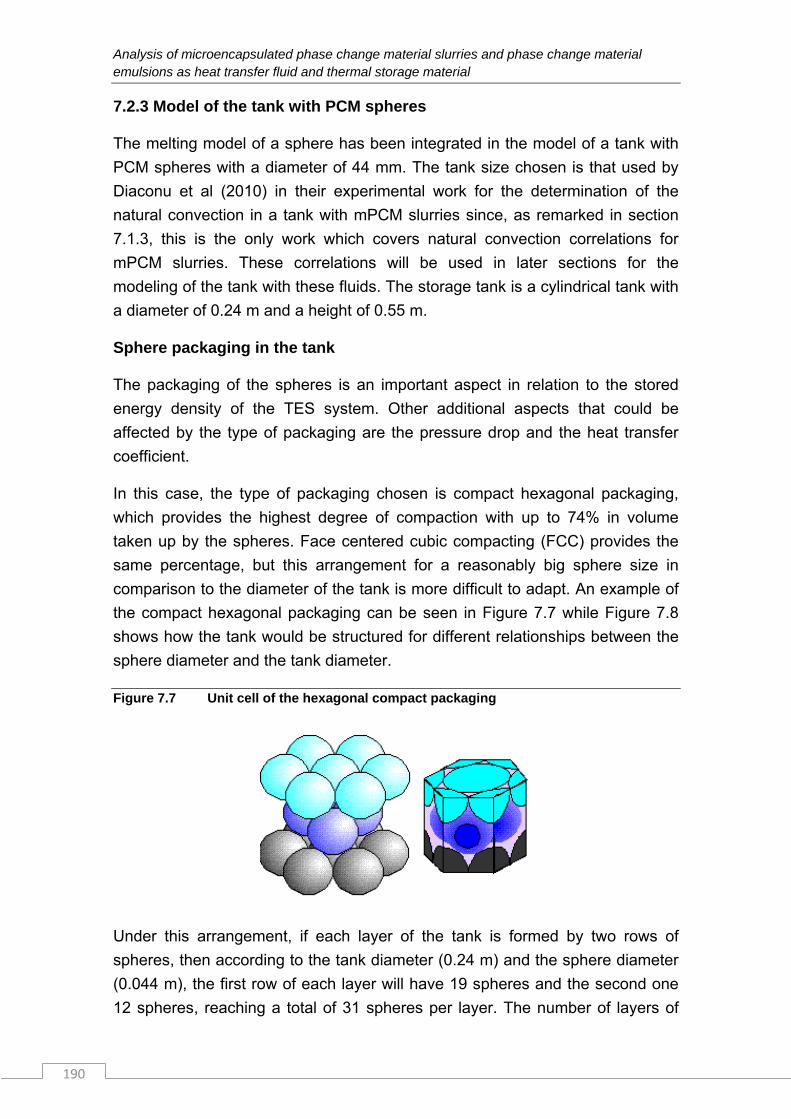
Analysis of microencapsulated phase change material slurries and phase change material emulsions as heat transfer fluid and thermal storage material
190
7.2.3 Model of the tank with PCM spheres
The melting model of a sphere has been integrated in the model of a tank with
PCM spheres with a diameter of 44 mm. The tank size chosen is that used by
Diaconu et al (2010) in their experimental work for the determination of the
natural convection in a tank with mPCM slurries since, as remarked in section
7.1.3, this is the only work which covers natural convection correlations for
mPCM slurries. These correlations will be used in later sections for the
modeling of the tank with these fluids. The storage tank is a cylindrical tank with
a diameter of 0.24 m and a height of 0.55 m.
Sphere packaging in the tank
The packaging of the spheres is an important aspect in relation to the stored
energy density of the TES system. Other additional aspects that could be
affected by the type of packaging are the pressure drop and the heat transfer
coefficient.
In this case, the type of packaging chosen is compact hexagonal packaging,
which provides the highest degree of compaction with up to 74% in volume
taken up by the spheres. Face centered cubic compacting (FCC) provides the
same percentage, but this arrangement for a reasonably big sphere size in
comparison to the diameter of the tank is more difficult to adapt. An example of
the compact hexagonal packaging can be seen in Figure 7.7 while Figure 7.8
shows how the tank would be structured for different relationships between the
sphere diameter and the tank diameter.
Figure 7.7 Unit cell of the hexagonal compact packaging
Under this arrangement, if each layer of the tank is formed by two rows of
spheres, then according to the tank diameter (0.24 m) and the sphere diameter
(0.044 m), the first row of each layer will have 19 spheres and the second one
12 spheres, reaching a total of 31 spheres per layer. The number of layers of
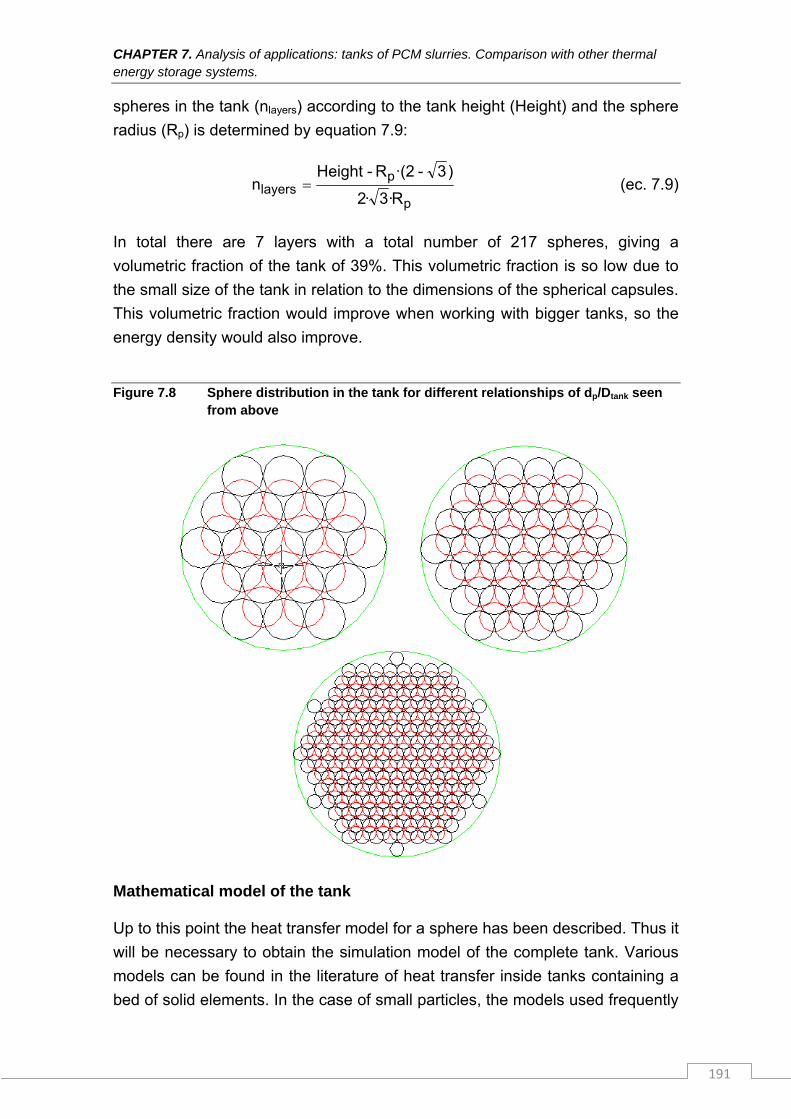
CHAPTER 7. Analysis of applications: tanks of PCM slurries. Comparison with other thermal energy storage systems.
191
spheres in the tank (nlayers) according to the tank height (Height) and the sphere
radius (Rp) is determined by equation 7.9:
p
players
R·3·2
)3-·(2R-eightHn (ec. 7.9)
In total there are 7 layers with a total number of 217 spheres, giving a
volumetric fraction of the tank of 39%. This volumetric fraction is so low due to
the small size of the tank in relation to the dimensions of the spherical capsules.
This volumetric fraction would improve when working with bigger tanks, so the
energy density would also improve.
Figure 7.8 Sphere distribution in the tank for different relationships of dp/Dtank seen from above
Mathematical model of the tank
Up to this point the heat transfer model for a sphere has been described. Thus it
will be necessary to obtain the simulation model of the complete tank. Various
models can be found in the literature of heat transfer inside tanks containing a
bed of solid elements. In the case of small particles, the models used frequently
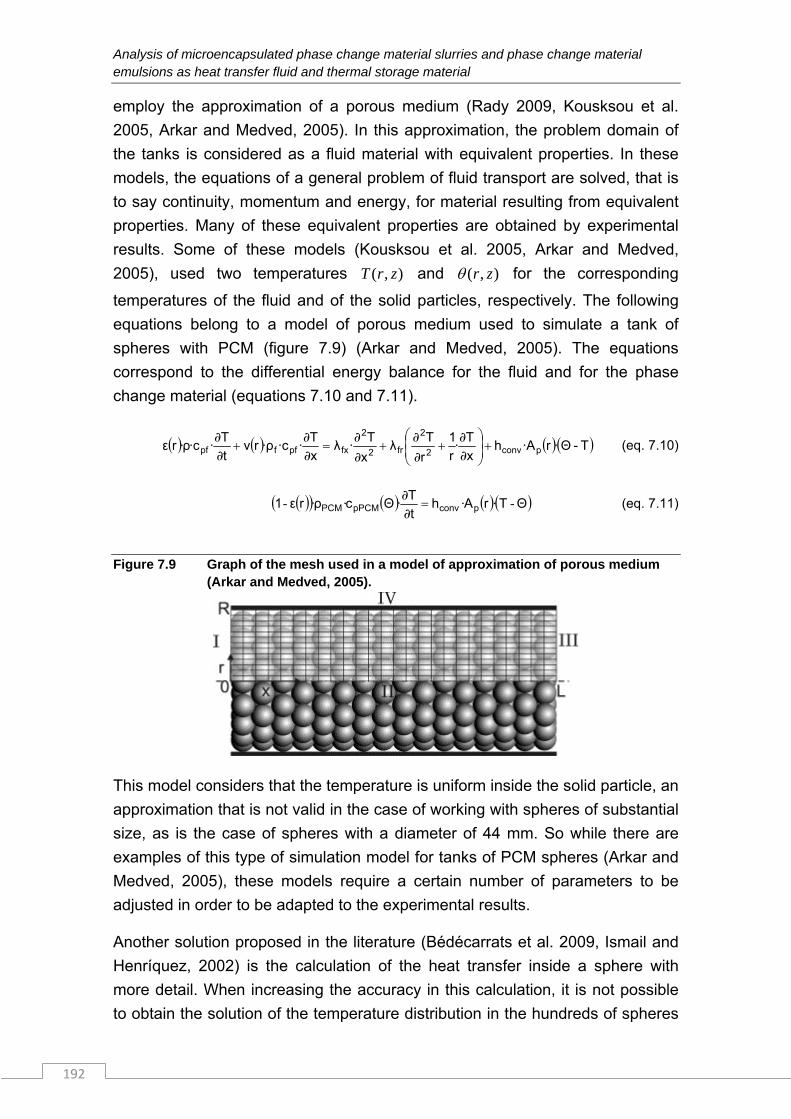
Analysis of microencapsulated phase change material slurries and phase change material emulsions as heat transfer fluid and thermal storage material
192
employ the approximation of a porous medium (Rady 2009, Kousksou et al.
2005, Arkar and Medved, 2005). In this approximation, the problem domain of
the tanks is considered as a fluid material with equivalent properties. In these
models, the equations of a general problem of fluid transport are solved, that is
to say continuity, momentum and energy, for material resulting from equivalent
properties. Many of these equivalent properties are obtained by experimental
results. Some of these models (Kousksou et al. 2005, Arkar and Medved,
2005), used two temperatures ),( zrT and ),( zr for the corresponding
temperatures of the fluid and of the solid particles, respectively. The following
equations belong to a model of porous medium used to simulate a tank of
spheres with PCM (figure 7.9) (Arkar and Medved, 2005). The equations
correspond to the differential energy balance for the fluid and for the phase
change material (equations 7.10 and 7.11).
T-Θ·r·Ahx
T·
r
1
r
Tλ
x
T·λ
x
T··c·ρrv
t
T··cρ·rε pconv2
2
fr2
2
fxpffpf
∂∂
∂∂
∂∂
∂∂
∂∂
(eq. 7.10)
ΘTrAht
T·Θcρ·rε1 pconvpPCMPCM -··∂∂·- (eq. 7.11)
Figure 7.9 Graph of the mesh used in a model of approximation of porous medium (Arkar and Medved, 2005).
This model considers that the temperature is uniform inside the solid particle, an
approximation that is not valid in the case of working with spheres of substantial
size, as is the case of spheres with a diameter of 44 mm. So while there are
examples of this type of simulation model for tanks of PCM spheres (Arkar and
Medved, 2005), these models require a certain number of parameters to be
adjusted in order to be adapted to the experimental results.
Another solution proposed in the literature (Bédécarrats et al. 2009, Ismail and
Henríquez, 2002) is the calculation of the heat transfer inside a sphere with
more detail. When increasing the accuracy in this calculation, it is not possible
to obtain the solution of the temperature distribution in the hundreds of spheres
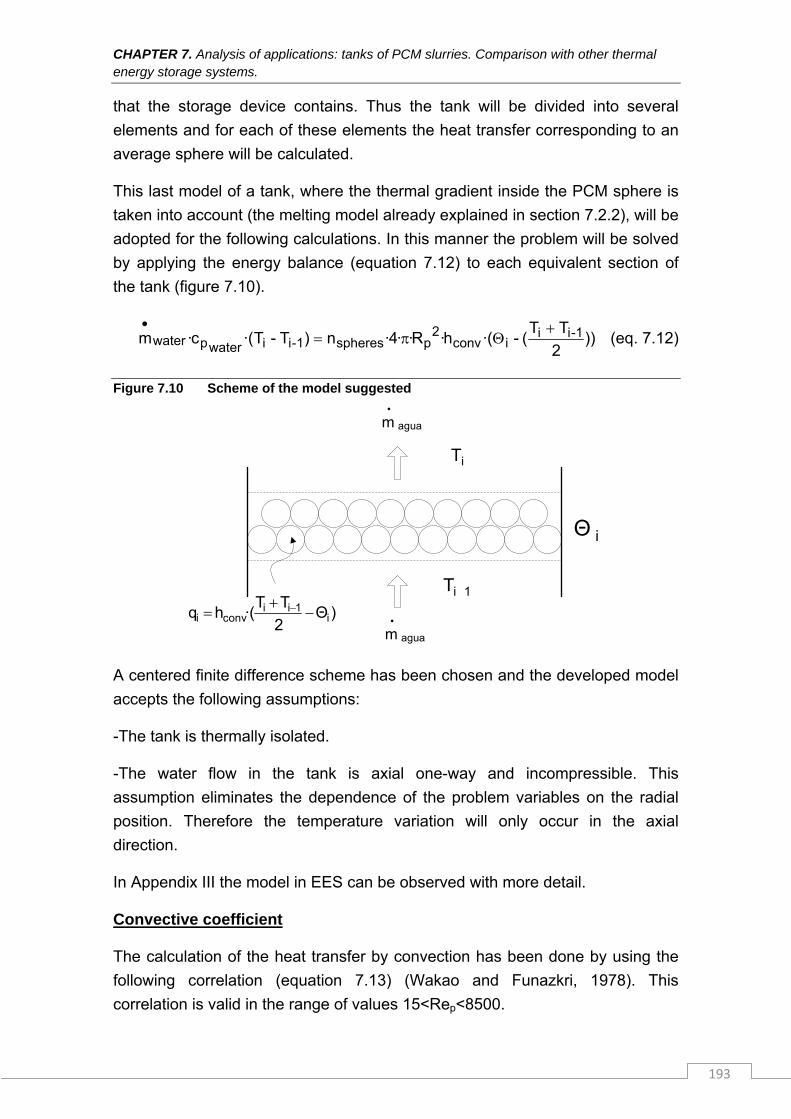
CHAPTER 7. Analysis of applications: tanks of PCM slurries. Comparison with other thermal energy storage systems.
193
that the storage device contains. Thus the tank will be divided into several
elements and for each of these elements the heat transfer corresponding to an
average sphere will be calculated.
This last model of a tank, where the thermal gradient inside the PCM sphere is
taken into account (the melting model already explained in section 7.2.2), will be
adopted for the following calculations. In this manner the problem will be solved
by applying the energy balance (equation 7.12) to each equivalent section of
the tank (figure 7.10).
))2
TT(-·(h·R··4·n)T-T·(c·m 1-ii
iconv2
pspheres1-iiwaterpwater
(eq. 7.12)
Figure 7.10 Scheme of the model suggested
agua
•m
agua
•m
iT
1iT
iΘ
)Θ2
TT·(hq i
1iiconvi
A centered finite difference scheme has been chosen and the developed model
accepts the following assumptions:
-The tank is thermally isolated.
-The water flow in the tank is axial one-way and incompressible. This
assumption eliminates the dependence of the problem variables on the radial
position. Therefore the temperature variation will only occur in the axial
direction.
In Appendix III the model in EES can be observed with more detail.
Convective coefficient
The calculation of the heat transfer by convection has been done by using the
following correlation (equation 7.13) (Wakao and Funazkri, 1978). This
correlation is valid in the range of values 15<Rep<8500.
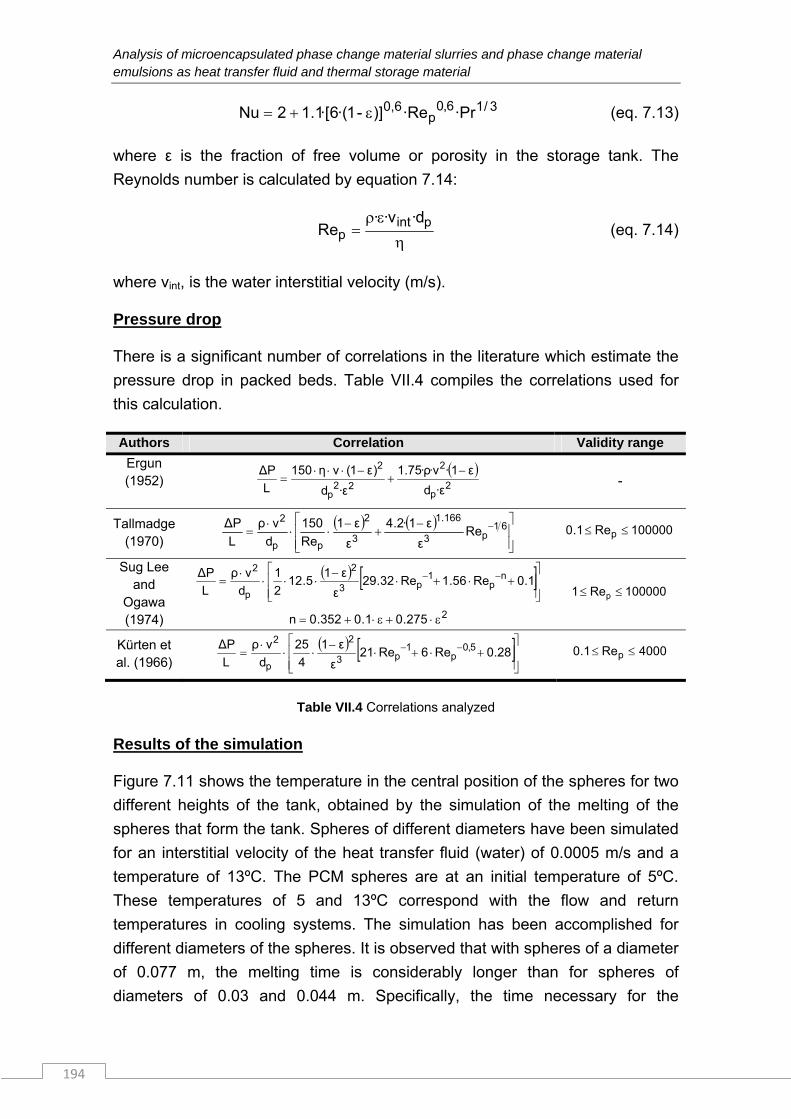
Analysis of microencapsulated phase change material slurries and phase change material emulsions as heat transfer fluid and thermal storage material
194
3/16,0p
0,6 ·Pr·Re)]-1·(6·[1.12Nu (eq. 7.13)
where ε is the fraction of free volume or porosity in the storage tank. The
Reynolds number is calculated by equation 7.14:
pint
pd·v··
Re (eq. 7.14)
where vint, is the water interstitial velocity (m/s).
Pressure drop
There is a significant number of correlations in the literature which estimate the
pressure drop in packed beds. Table VII.4 compiles the correlations used for
this calculation.
Authors Correlation Validity range
Ergun (1952)
2
2
22
2 17511150
ε·d
ε·v·ρ·.
ε·d
)ε(vη
L
PΔ
pp
-
Tallmadge (1970)
61
3
1661
3
22 1241150p
.
ppRe
ε
ε·.
ε
ε
Red
vρ
L
PΔ 100000Re1.0 p
Sug Lee and
Ogawa (1974)
105613229
1512
2
1 13
22.Re.Re.
ε
ε.
d
vρ
L
PΔ npp
p
2275.01.0352.0n
100000Re1 p
Kürten et al. (1966)
280621
1
4
25 5013
22.ReRe
ε
ε
d
vρ
L
PΔ ,pp
p
4000Re1.0 p
Table VII.4 Correlations analyzed
Results of the simulation
Figure 7.11 shows the temperature in the central position of the spheres for two
different heights of the tank, obtained by the simulation of the melting of the
spheres that form the tank. Spheres of different diameters have been simulated
for an interstitial velocity of the heat transfer fluid (water) of 0.0005 m/s and a
temperature of 13ºC. The PCM spheres are at an initial temperature of 5ºC.
These temperatures of 5 and 13ºC correspond with the flow and return
temperatures in cooling systems. The simulation has been accomplished for
different diameters of the spheres. It is observed that with spheres of a diameter
of 0.077 m, the melting time is considerably longer than for spheres of
diameters of 0.03 and 0.044 m. Specifically, the time necessary for the
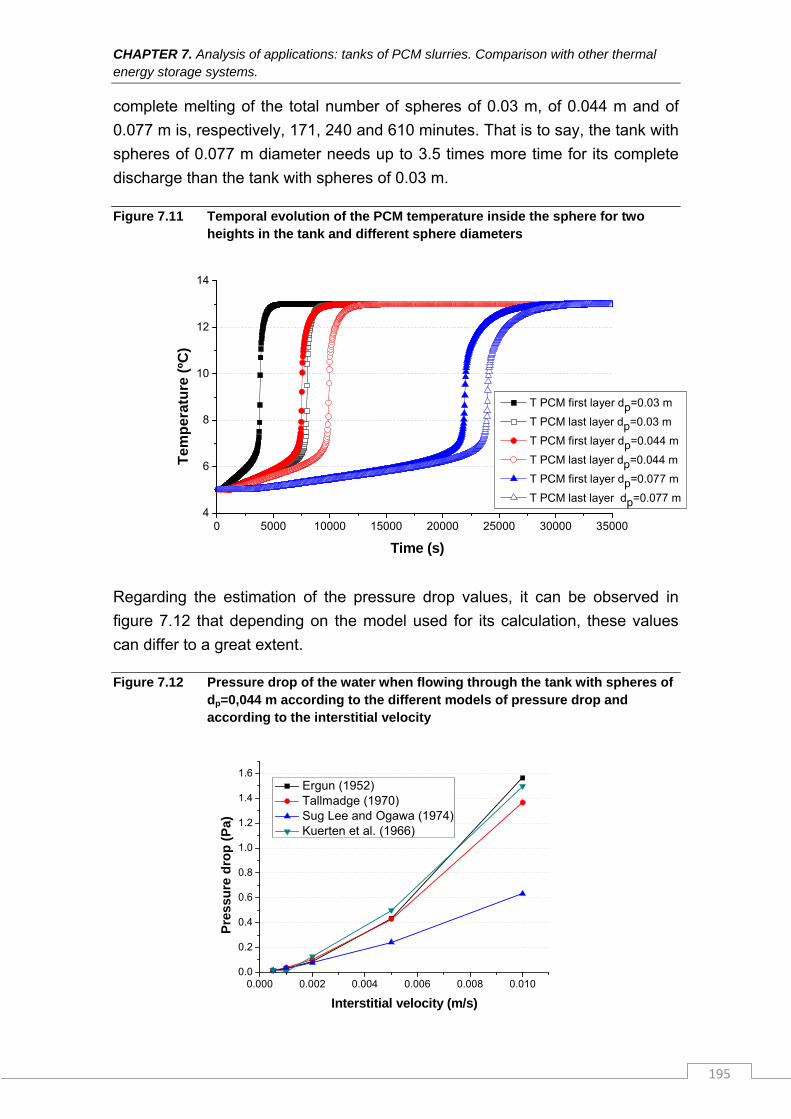
CHAPTER 7. Analysis of applications: tanks of PCM slurries. Comparison with other thermal energy storage systems.
195
complete melting of the total number of spheres of 0.03 m, of 0.044 m and of
0.077 m is, respectively, 171, 240 and 610 minutes. That is to say, the tank with
spheres of 0.077 m diameter needs up to 3.5 times more time for its complete
discharge than the tank with spheres of 0.03 m.
Figure 7.11 Temporal evolution of the PCM temperature inside the sphere for two heights in the tank and different sphere diameters
0 5000 10000 15000 20000 25000 30000 350004
6
8
10
12
14
Tem
per
atu
re (
ºC)
Time (s)
T PCM first layer dp=0.03 m
T PCM last layer dp=0.03 m
T PCM first layer dp=0.044 m
T PCM last layer dp=0.044 m
T PCM first layer dp=0.077 m
T PCM last layer dp=0.077 m
Regarding the estimation of the pressure drop values, it can be observed in
figure 7.12 that depending on the model used for its calculation, these values
can differ to a great extent.
Figure 7.12 Pressure drop of the water when flowing through the tank with spheres of dp=0,044 m according to the different models of pressure drop and according to the interstitial velocity
0.000 0.002 0.004 0.006 0.008 0.0100.0
0.2
0.4
0.6
0.8
1.0
1.2
1.4
1.6
Pre
ssu
re d
rop
(P
a)
Interstitial velocity (m/s)
Ergun (1952) Tallmadge (1970) Sug Lee and Ogawa (1974) Kuerten et al. (1966)
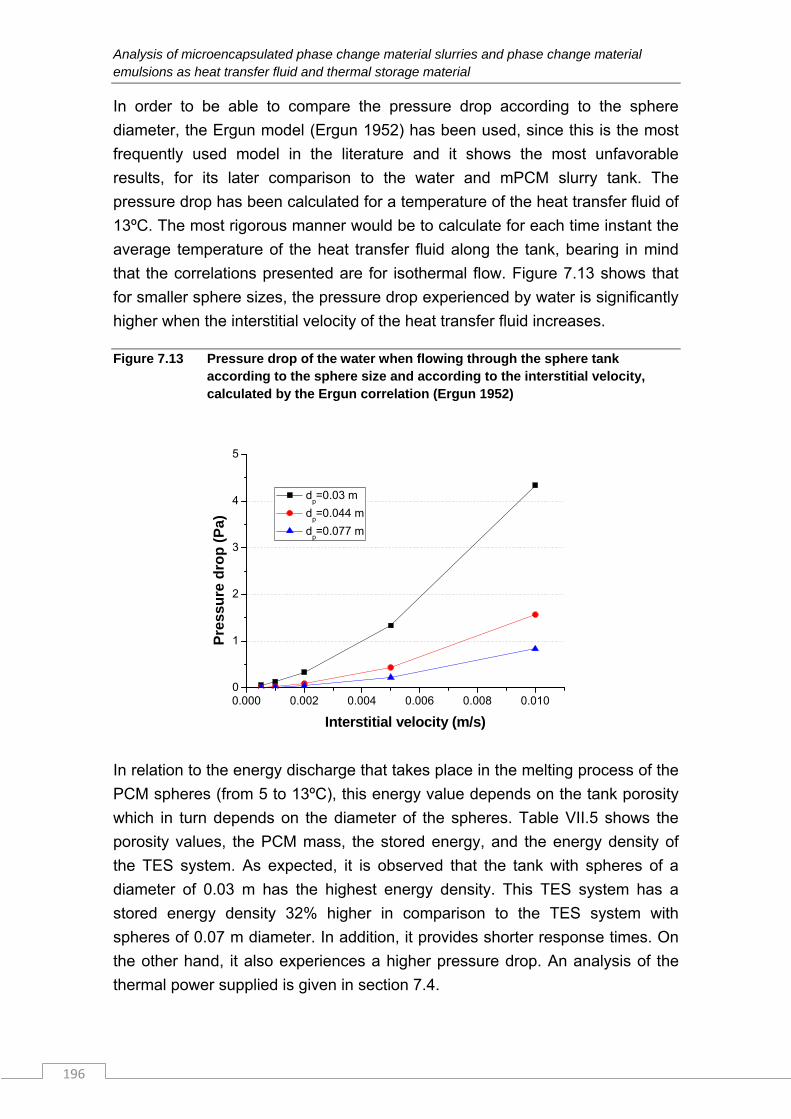
Analysis of microencapsulated phase change material slurries and phase change material emulsions as heat transfer fluid and thermal storage material
196
In order to be able to compare the pressure drop according to the sphere
diameter, the Ergun model (Ergun 1952) has been used, since this is the most
frequently used model in the literature and it shows the most unfavorable
results, for its later comparison to the water and mPCM slurry tank. The
pressure drop has been calculated for a temperature of the heat transfer fluid of
13ºC. The most rigorous manner would be to calculate for each time instant the
average temperature of the heat transfer fluid along the tank, bearing in mind
that the correlations presented are for isothermal flow. Figure 7.13 shows that
for smaller sphere sizes, the pressure drop experienced by water is significantly
higher when the interstitial velocity of the heat transfer fluid increases.
Figure 7.13 Pressure drop of the water when flowing through the sphere tank according to the sphere size and according to the interstitial velocity, calculated by the Ergun correlation (Ergun 1952)
0.000 0.002 0.004 0.006 0.008 0.0100
1
2
3
4
5
Pre
ssu
re d
rop
(P
a)
Interstitial velocity (m/s)
dp=0.03 m
dp=0.044 m
dp=0.077 m
In relation to the energy discharge that takes place in the melting process of the
PCM spheres (from 5 to 13ºC), this energy value depends on the tank porosity
which in turn depends on the diameter of the spheres. Table VII.5 shows the
porosity values, the PCM mass, the stored energy, and the energy density of
the TES system. As expected, it is observed that the tank with spheres of a
diameter of 0.03 m has the highest energy density. This TES system has a
stored energy density 32% higher in comparison to the TES system with
spheres of 0.07 m diameter. In addition, it provides shorter response times. On
the other hand, it also experiences a higher pressure drop. An analysis of the
thermal power supplied is given in section 7.4.
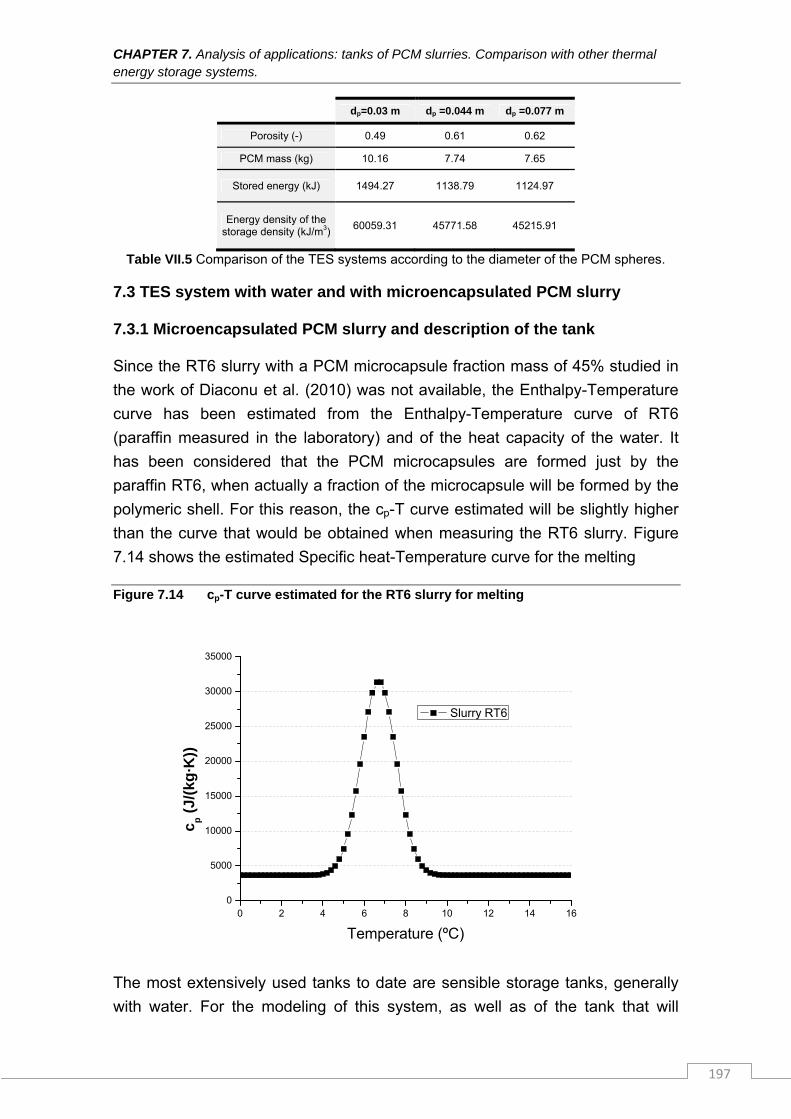
CHAPTER 7. Analysis of applications: tanks of PCM slurries. Comparison with other thermal energy storage systems.
197
dp=0.03 m dp =0.044 m dp =0.077 m
Porosity (-) 0.49 0.61 0.62
PCM mass (kg) 10.16 7.74 7.65
Stored energy (kJ) 1494.27 1138.79 1124.97
Energy density of the storage density (kJ/m3)
60059.31 45771.58 45215.91
Table VII.5 Comparison of the TES systems according to the diameter of the PCM spheres.
7.3 TES system with water and with microencapsulated PCM slurry
7.3.1 Microencapsulated PCM slurry and description of the tank
Since the RT6 slurry with a PCM microcapsule fraction mass of 45% studied in
the work of Diaconu et al. (2010) was not available, the Enthalpy-Temperature
curve has been estimated from the Enthalpy-Temperature curve of RT6
(paraffin measured in the laboratory) and of the heat capacity of the water. It
has been considered that the PCM microcapsules are formed just by the
paraffin RT6, when actually a fraction of the microcapsule will be formed by the
polymeric shell. For this reason, the cp-T curve estimated will be slightly higher
than the curve that would be obtained when measuring the RT6 slurry. Figure
7.14 shows the estimated Specific heat-Temperature curve for the melting
Figure 7.14 cp-T curve estimated for the RT6 slurry for melting
0 2 4 6 8 10 12 14 160
5000
10000
15000
20000
25000
30000
35000
c p (
J/(
kg·K
))
Temperature (ºC)
Slurry RT6
The most extensively used tanks to date are sensible storage tanks, generally
with water. For the modeling of this system, as well as of the tank that will
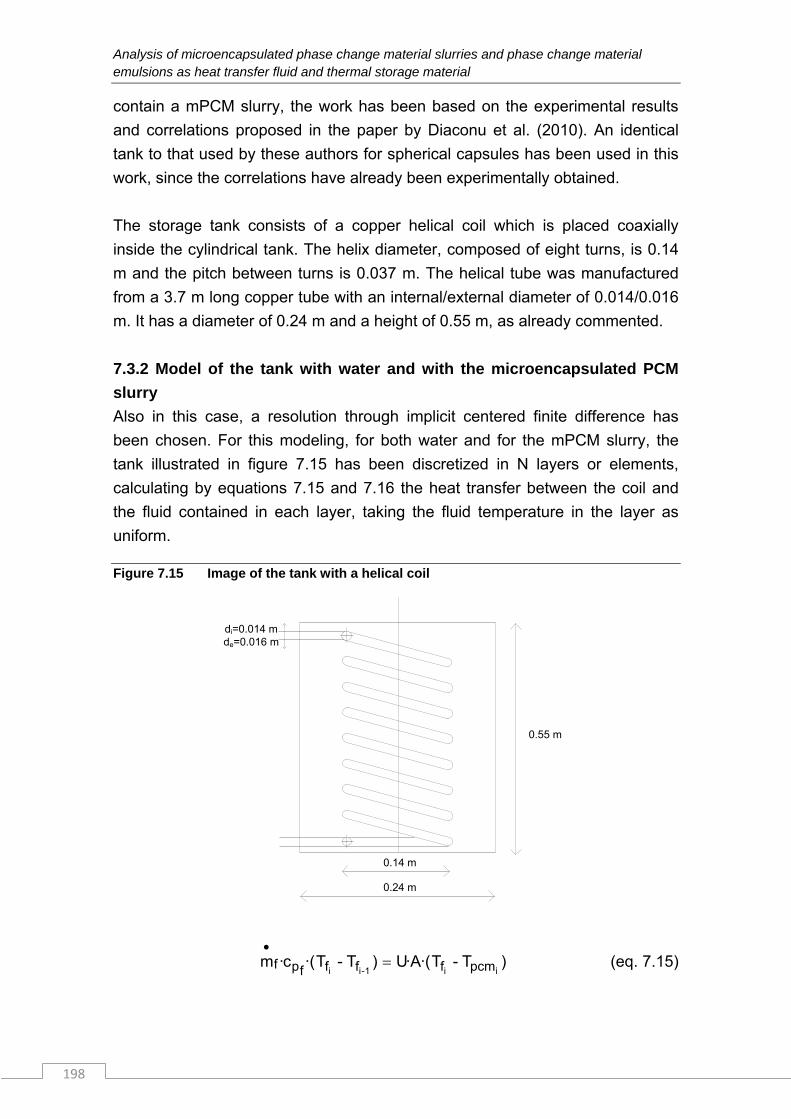
Analysis of microencapsulated phase change material slurries and phase change material emulsions as heat transfer fluid and thermal storage material
198
contain a mPCM slurry, the work has been based on the experimental results
and correlations proposed in the paper by Diaconu et al. (2010). An identical
tank to that used by these authors for spherical capsules has been used in this
work, since the correlations have already been experimentally obtained.
The storage tank consists of a copper helical coil which is placed coaxially
inside the cylindrical tank. The helix diameter, composed of eight turns, is 0.14
m and the pitch between turns is 0.037 m. The helical tube was manufactured
from a 3.7 m long copper tube with an internal/external diameter of 0.014/0.016
m. It has a diameter of 0.24 m and a height of 0.55 m, as already commented.
7.3.2 Model of the tank with water and with the microencapsulated PCM
slurry
Also in this case, a resolution through implicit centered finite difference has
been chosen. For this modeling, for both water and for the mPCM slurry, the
tank illustrated in figure 7.15 has been discretized in N layers or elements,
calculating by equations 7.15 and 7.16 the heat transfer between the coil and
the fluid contained in each layer, taking the fluid temperature in the layer as
uniform.
Figure 7.15 Image of the tank with a helical coil
0.55 m
0.14 m
0.24 m
di=0.014 mde=0.016 m
)T-T·(A·U)T-T·(c·mii-ii pcmffffpf
1 (eq. 7.15)
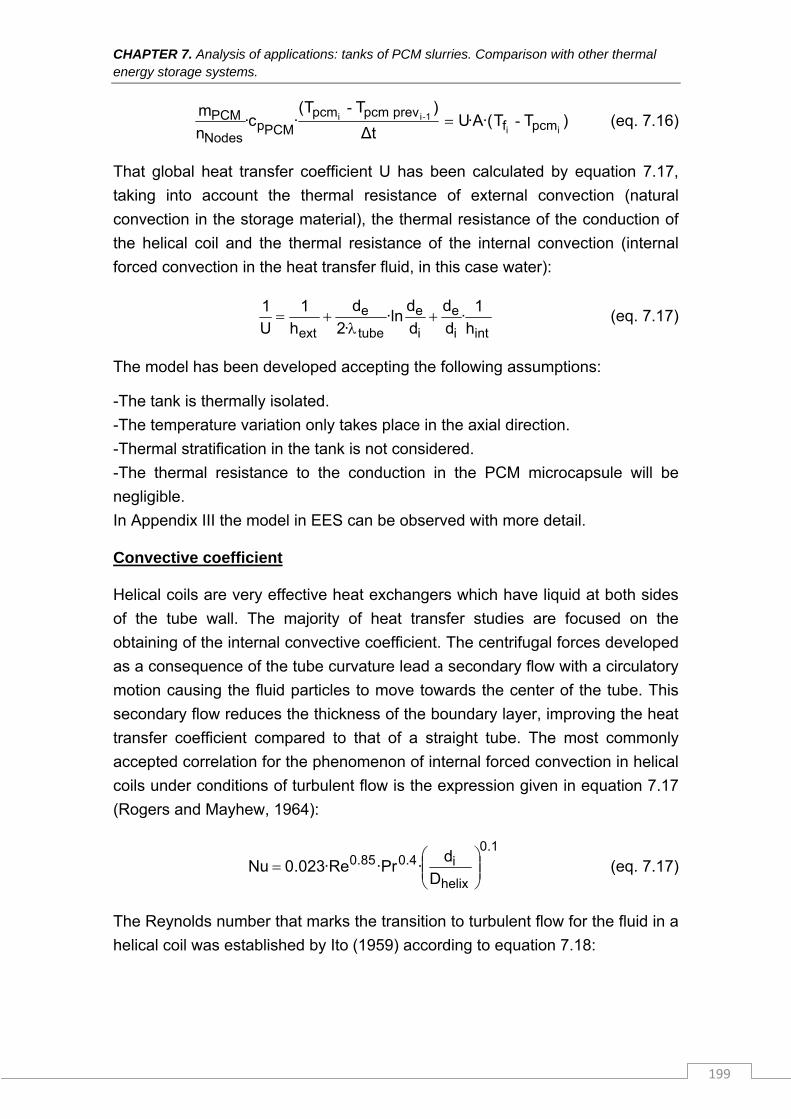
CHAPTER 7. Analysis of applications: tanks of PCM slurries. Comparison with other thermal energy storage systems.
199
)TT·(A·UtΔ
)TT(·c·
n
mii
iipcmf
prevpcmpcmPCMp
Nodes
PCM --
- 1 (eq. 7.16)
That global heat transfer coefficient U has been calculated by equation 7.17,
taking into account the thermal resistance of external convection (natural
convection in the storage material), the thermal resistance of the conduction of
the helical coil and the thermal resistance of the internal convection (internal
forced convection in the heat transfer fluid, in this case water):
inti
e
i
e
tube
e
ext h
1·
d
d
d
d·ln
·2
d
h
1
U
1
(eq. 7.17)
The model has been developed accepting the following assumptions:
-The tank is thermally isolated.
-The temperature variation only takes place in the axial direction.
-Thermal stratification in the tank is not considered.
-The thermal resistance to the conduction in the PCM microcapsule will be
negligible.
In Appendix III the model in EES can be observed with more detail.
Convective coefficient
Helical coils are very effective heat exchangers which have liquid at both sides
of the tube wall. The majority of heat transfer studies are focused on the
obtaining of the internal convective coefficient. The centrifugal forces developed
as a consequence of the tube curvature lead a secondary flow with a circulatory
motion causing the fluid particles to move towards the center of the tube. This
secondary flow reduces the thickness of the boundary layer, improving the heat
transfer coefficient compared to that of a straight tube. The most commonly
accepted correlation for the phenomenon of internal forced convection in helical
coils under conditions of turbulent flow is the expression given in equation 7.17
(Rogers and Mayhew, 1964):
1.0
helix
i4.085.0
D
d··Pr·Re023.0Nu
(eq. 7.17)
The Reynolds number that marks the transition to turbulent flow for the fluid in a
helical coil was established by Ito (1959) according to equation 7.18:
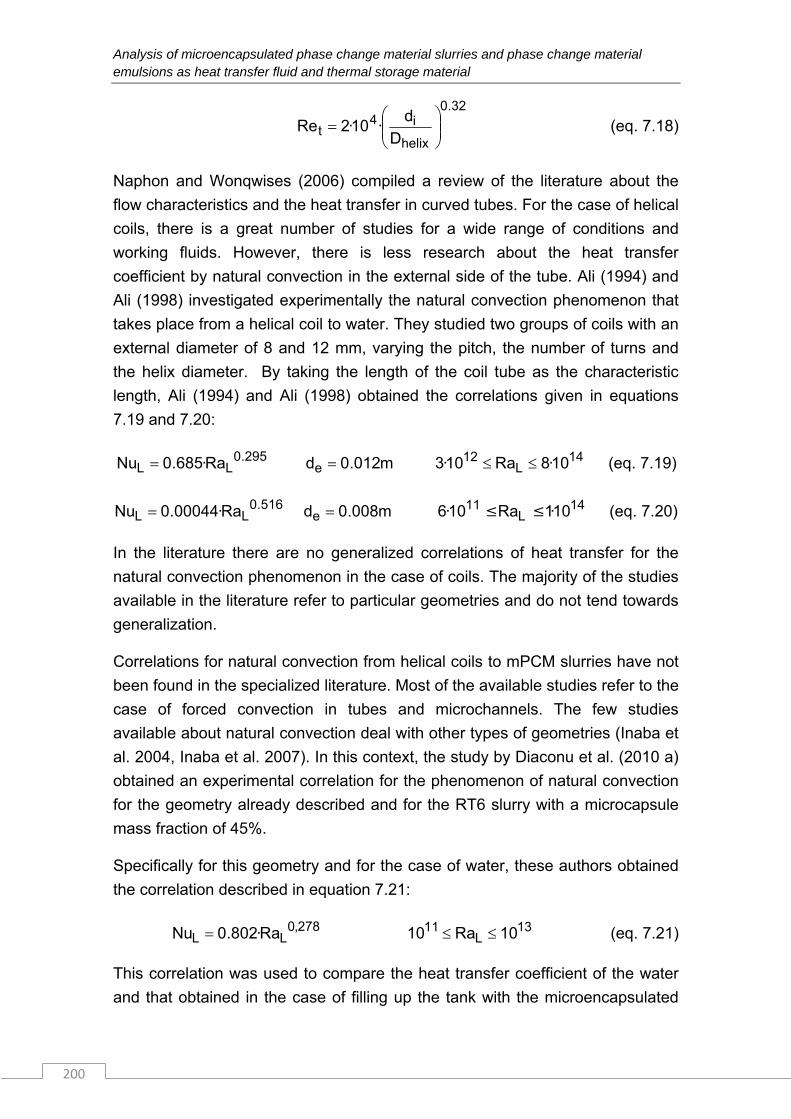
Analysis of microencapsulated phase change material slurries and phase change material emulsions as heat transfer fluid and thermal storage material
200
32.0
helix
i4t D
d·10·2Re
(eq. 7.18)
Naphon and Wonqwises (2006) compiled a review of the literature about the
flow characteristics and the heat transfer in curved tubes. For the case of helical
coils, there is a great number of studies for a wide range of conditions and
working fluids. However, there is less research about the heat transfer
coefficient by natural convection in the external side of the tube. Ali (1994) and
Ali (1998) investigated experimentally the natural convection phenomenon that
takes place from a helical coil to water. They studied two groups of coils with an
external diameter of 8 and 12 mm, varying the pitch, the number of turns and
the helix diameter. By taking the length of the coil tube as the characteristic
length, Ali (1994) and Ali (1998) obtained the correlations given in equations
7.19 and 7.20:
295.0LL Ra·685.0Nu m012.0de 14
L12 10·8Ra10·3 (eq. 7.19)
516.0LL Ra·00044.0Nu m008.0de 14
L11 10·1Ra10·6 ≤≤ (eq. 7.20)
In the literature there are no generalized correlations of heat transfer for the
natural convection phenomenon in the case of coils. The majority of the studies
available in the literature refer to particular geometries and do not tend towards
generalization.
Correlations for natural convection from helical coils to mPCM slurries have not
been found in the specialized literature. Most of the available studies refer to the
case of forced convection in tubes and microchannels. The few studies
available about natural convection deal with other types of geometries (Inaba et
al. 2004, Inaba et al. 2007). In this context, the study by Diaconu et al. (2010 a)
obtained an experimental correlation for the phenomenon of natural convection
for the geometry already described and for the RT6 slurry with a microcapsule
mass fraction of 45%.
Specifically for this geometry and for the case of water, these authors obtained
the correlation described in equation 7.21:
278,0LL Ra·802.0Nu 13
L11 10Ra10 (eq. 7.21)
This correlation was used to compare the heat transfer coefficient of the water
and that obtained in the case of filling up the tank with the microencapsulated
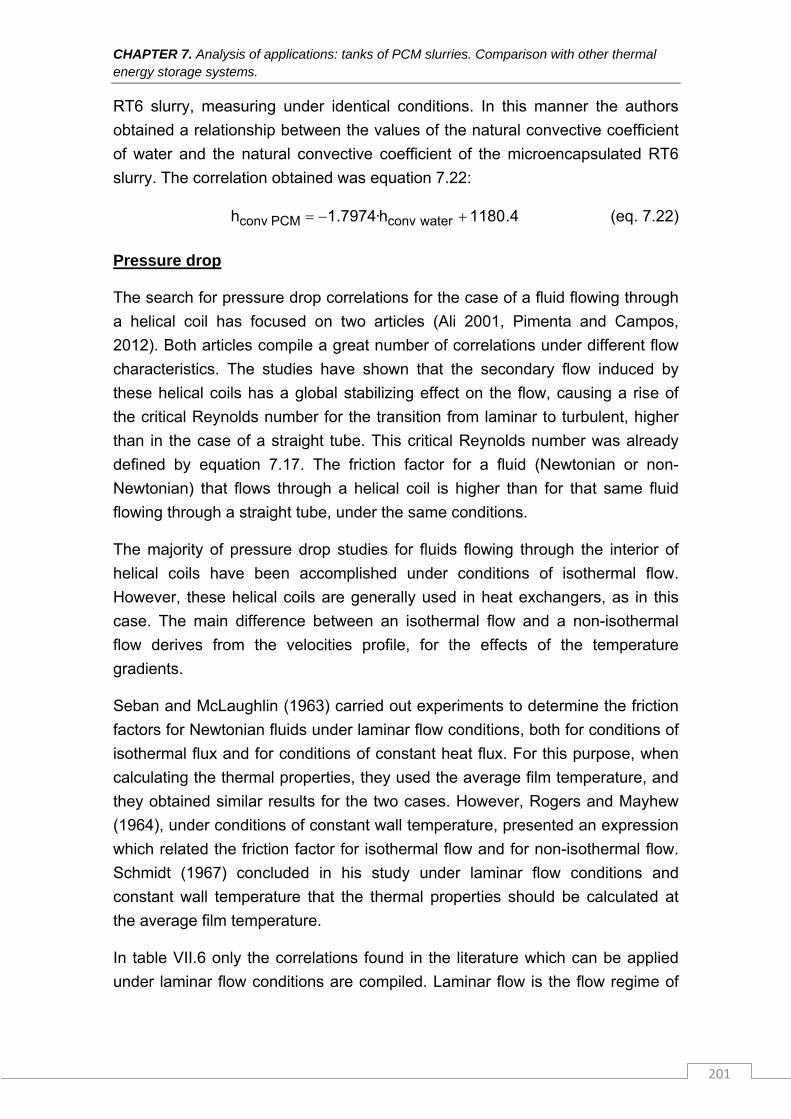
CHAPTER 7. Analysis of applications: tanks of PCM slurries. Comparison with other thermal energy storage systems.
201
RT6 slurry, measuring under identical conditions. In this manner the authors
obtained a relationship between the values of the natural convective coefficient
of water and the natural convective coefficient of the microencapsulated RT6
slurry. The correlation obtained was equation 7.22:
4.1180h·7974.1h waterconvPCMconv (eq. 7.22)
Pressure drop
The search for pressure drop correlations for the case of a fluid flowing through
a helical coil has focused on two articles (Ali 2001, Pimenta and Campos,
2012). Both articles compile a great number of correlations under different flow
characteristics. The studies have shown that the secondary flow induced by
these helical coils has a global stabilizing effect on the flow, causing a rise of
the critical Reynolds number for the transition from laminar to turbulent, higher
than in the case of a straight tube. This critical Reynolds number was already
defined by equation 7.17. The friction factor for a fluid (Newtonian or non-
Newtonian) that flows through a helical coil is higher than for that same fluid
flowing through a straight tube, under the same conditions.
The majority of pressure drop studies for fluids flowing through the interior of
helical coils have been accomplished under conditions of isothermal flow.
However, these helical coils are generally used in heat exchangers, as in this
case. The main difference between an isothermal flow and a non-isothermal
flow derives from the velocities profile, for the effects of the temperature
gradients.
Seban and McLaughlin (1963) carried out experiments to determine the friction
factors for Newtonian fluids under laminar flow conditions, both for conditions of
isothermal flux and for conditions of constant heat flux. For this purpose, when
calculating the thermal properties, they used the average film temperature, and
they obtained similar results for the two cases. However, Rogers and Mayhew
(1964), under conditions of constant wall temperature, presented an expression
which related the friction factor for isothermal flow and for non-isothermal flow.
Schmidt (1967) concluded in his study under laminar flow conditions and
constant wall temperature that the thermal properties should be calculated at
the average film temperature.
In table VII.6 only the correlations found in the literature which can be applied
under laminar flow conditions are compiled. Laminar flow is the flow regime of
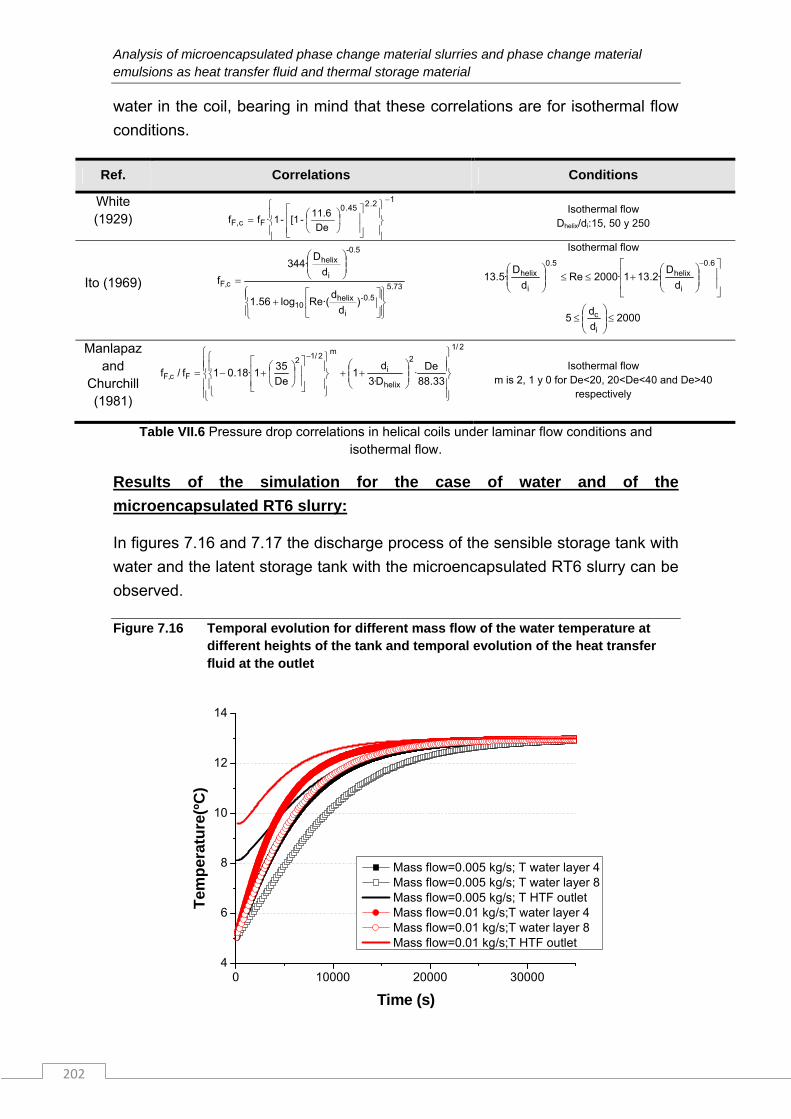
Analysis of microencapsulated phase change material slurries and phase change material emulsions as heat transfer fluid and thermal storage material
202
water in the coil, bearing in mind that these correlations are for isothermal flow
conditions.
Ref. Correlations Conditions
White (1929)
12.245.0
Fc,F De
11.6-[1-1·ff
Isothermal flow Dhelix/di:15, 50 y 250
Ito (1969) 73.5
0.5-
i
helix10
-0.5
i
helix
c,F
)d
dRe·(log1.56
d
D·344
f
Isothermal flow
6.0
i
helix5.0
i
helix
d
D·2.131·2000Re
d
D·5.13
2000d
d5
i
c
Manlapaz and
Churchill (1981)
2/1
2
helix
i
m2/1
2
Fc,F 33.88
De·
D·3
d1
De
351·18.01f/f
Isothermal flow m is 2, 1 y 0 for De<20, 20<De<40 and De>40
respectively
Table VII.6 Pressure drop correlations in helical coils under laminar flow conditions and isothermal flow.
Results of the simulation for the case of water and of the
microencapsulated RT6 slurry:
In figures 7.16 and 7.17 the discharge process of the sensible storage tank with
water and the latent storage tank with the microencapsulated RT6 slurry can be
observed.
Figure 7.16 Temporal evolution for different mass flow of the water temperature at different heights of the tank and temporal evolution of the heat transfer fluid at the outlet
0 10000 20000 300004
6
8
10
12
14
Tem
per
atu
re(º
C)
Time (s)
Mass flow=0.005 kg/s; T water layer 4 Mass flow=0.005 kg/s; T water layer 8 Mass flow=0.005 kg/s; T HTF outlet Mass flow=0.01 kg/s;T water layer 4 Mass flow=0.01 kg/s;T water layer 8 Mass flow=0.01 kg/s;T HTF outlet
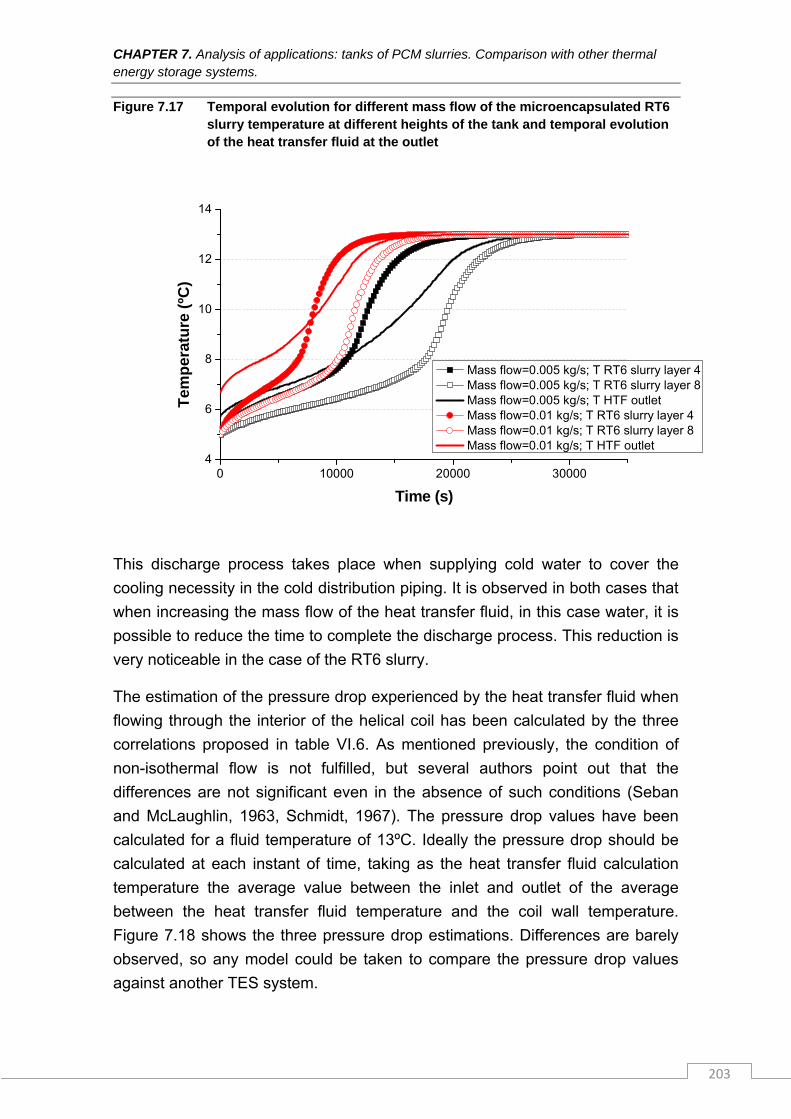
CHAPTER 7. Analysis of applications: tanks of PCM slurries. Comparison with other thermal energy storage systems.
203
Figure 7.17 Temporal evolution for different mass flow of the microencapsulated RT6 slurry temperature at different heights of the tank and temporal evolution of the heat transfer fluid at the outlet
0 10000 20000 300004
6
8
10
12
14
Tem
per
atu
re (
ºC)
Time (s)
Mass flow=0.005 kg/s; T RT6 slurry layer 4 Mass flow=0.005 kg/s; T RT6 slurry layer 8 Mass flow=0.005 kg/s; T HTF outlet Mass flow=0.01 kg/s; T RT6 slurry layer 4 Mass flow=0.01 kg/s; T RT6 slurry layer 8 Mass flow=0.01 kg/s; T HTF outlet
This discharge process takes place when supplying cold water to cover the
cooling necessity in the cold distribution piping. It is observed in both cases that
when increasing the mass flow of the heat transfer fluid, in this case water, it is
possible to reduce the time to complete the discharge process. This reduction is
very noticeable in the case of the RT6 slurry.
The estimation of the pressure drop experienced by the heat transfer fluid when
flowing through the interior of the helical coil has been calculated by the three
correlations proposed in table VI.6. As mentioned previously, the condition of
non-isothermal flow is not fulfilled, but several authors point out that the
differences are not significant even in the absence of such conditions (Seban
and McLaughlin, 1963, Schmidt, 1967). The pressure drop values have been
calculated for a fluid temperature of 13ºC. Ideally the pressure drop should be
calculated at each instant of time, taking as the heat transfer fluid calculation
temperature the average value between the inlet and outlet of the average
between the heat transfer fluid temperature and the coil wall temperature.
Figure 7.18 shows the three pressure drop estimations. Differences are barely
observed, so any model could be taken to compare the pressure drop values
against another TES system.
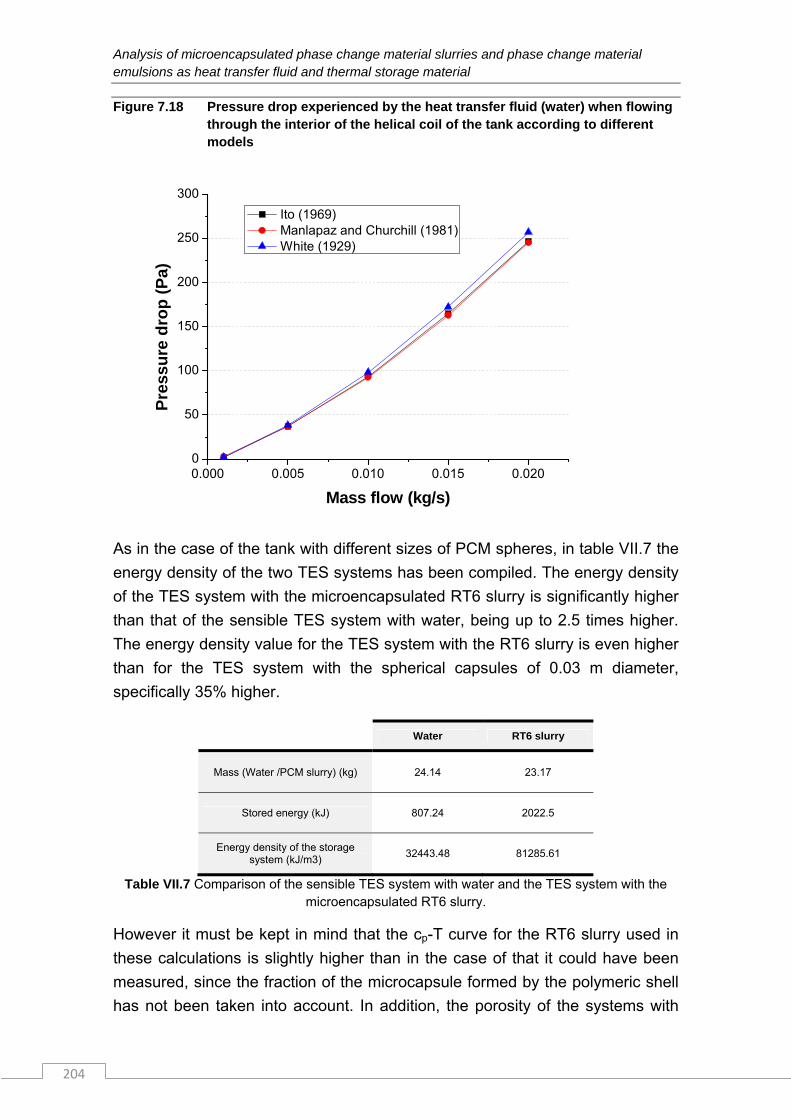
Analysis of microencapsulated phase change material slurries and phase change material emulsions as heat transfer fluid and thermal storage material
204
Figure 7.18 Pressure drop experienced by the heat transfer fluid (water) when flowing through the interior of the helical coil of the tank according to different models
0.000 0.005 0.010 0.015 0.0200
50
100
150
200
250
300
Pre
ssu
re d
rop
(P
a)
Mass flow (kg/s)
Ito (1969) Manlapaz and Churchill (1981) White (1929)
As in the case of the tank with different sizes of PCM spheres, in table VII.7 the
energy density of the two TES systems has been compiled. The energy density
of the TES system with the microencapsulated RT6 slurry is significantly higher
than that of the sensible TES system with water, being up to 2.5 times higher.
The energy density value for the TES system with the RT6 slurry is even higher
than for the TES system with the spherical capsules of 0.03 m diameter,
specifically 35% higher.
Water RT6 slurry
Mass (Water /PCM slurry) (kg) 24.14 23.17
Stored energy (kJ) 807.24 2022.5
Energy density of the storage system (kJ/m3)
32443.48 81285.61
Table VII.7 Comparison of the sensible TES system with water and the TES system with the microencapsulated RT6 slurry.
However it must be kept in mind that the cp-T curve for the RT6 slurry used in
these calculations is slightly higher than in the case of that it could have been
measured, since the fraction of the microcapsule formed by the polymeric shell
has not been taken into account. In addition, the porosity of the systems with
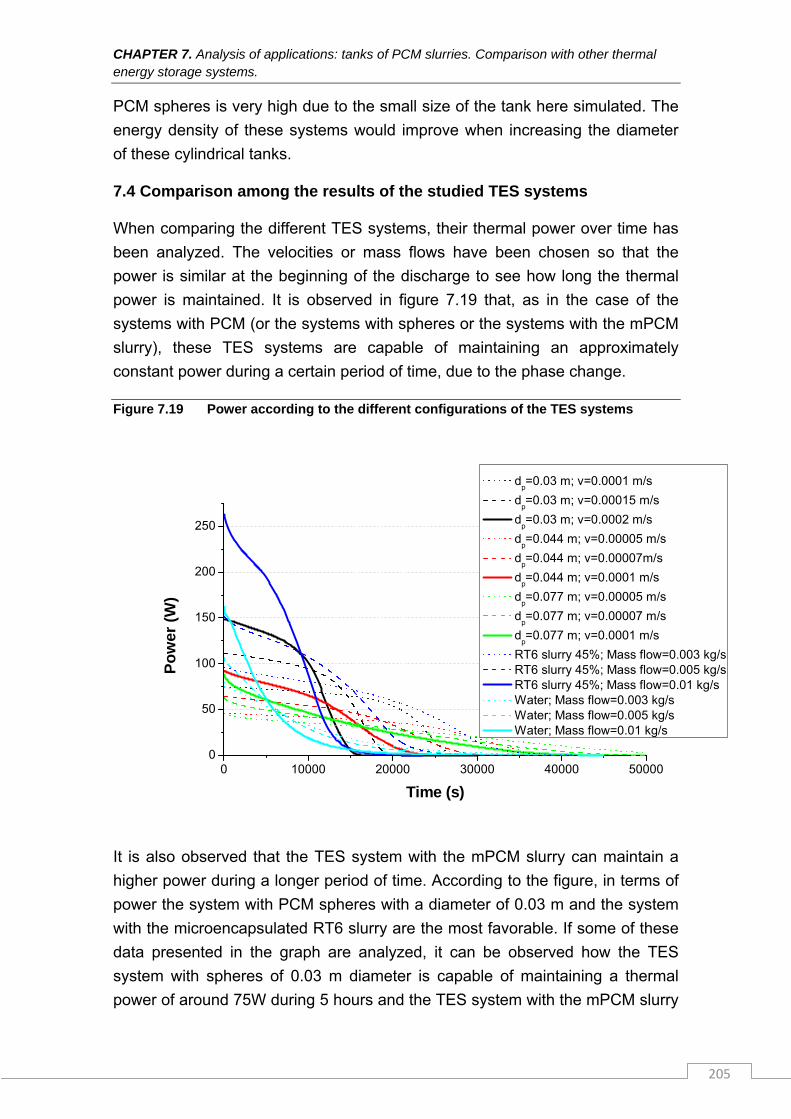
CHAPTER 7. Analysis of applications: tanks of PCM slurries. Comparison with other thermal energy storage systems.
205
PCM spheres is very high due to the small size of the tank here simulated. The
energy density of these systems would improve when increasing the diameter
of these cylindrical tanks.
7.4 Comparison among the results of the studied TES systems
When comparing the different TES systems, their thermal power over time has
been analyzed. The velocities or mass flows have been chosen so that the
power is similar at the beginning of the discharge to see how long the thermal
power is maintained. It is observed in figure 7.19 that, as in the case of the
systems with PCM (or the systems with spheres or the systems with the mPCM
slurry), these TES systems are capable of maintaining an approximately
constant power during a certain period of time, due to the phase change.
Figure 7.19 Power according to the different configurations of the TES systems
0 10000 20000 30000 40000 500000
50
100
150
200
250
Po
wer
(W
)
Time (s)
dp=0.03 m; v=0.0001 m/s
dp=0.03 m; v=0.00015 m/s
dp=0.03 m; v=0.0002 m/s
dp=0.044 m; v=0.00005 m/s
dp=0.044 m; v=0.00007m/s
dp=0.044 m; v=0.0001 m/s
dp=0.077 m; v=0.00005 m/s
dp=0.077 m; v=0.00007 m/s
dp=0.077 m; v=0.0001 m/s
RT6 slurry 45%; Mass flow=0.003 kg/s RT6 slurry 45%; Mass flow=0.005 kg/s RT6 slurry 45%; Mass flow=0.01 kg/s Water; Mass flow=0.003 kg/s Water; Mass flow=0.005 kg/s Water; Mass flow=0.01 kg/s
It is also observed that the TES system with the mPCM slurry can maintain a
higher power during a longer period of time. According to the figure, in terms of
power the system with PCM spheres with a diameter of 0.03 m and the system
with the microencapsulated RT6 slurry are the most favorable. If some of these
data presented in the graph are analyzed, it can be observed how the TES
system with spheres of 0.03 m diameter is capable of maintaining a thermal
power of around 75W during 5 hours and the TES system with the mPCM slurry
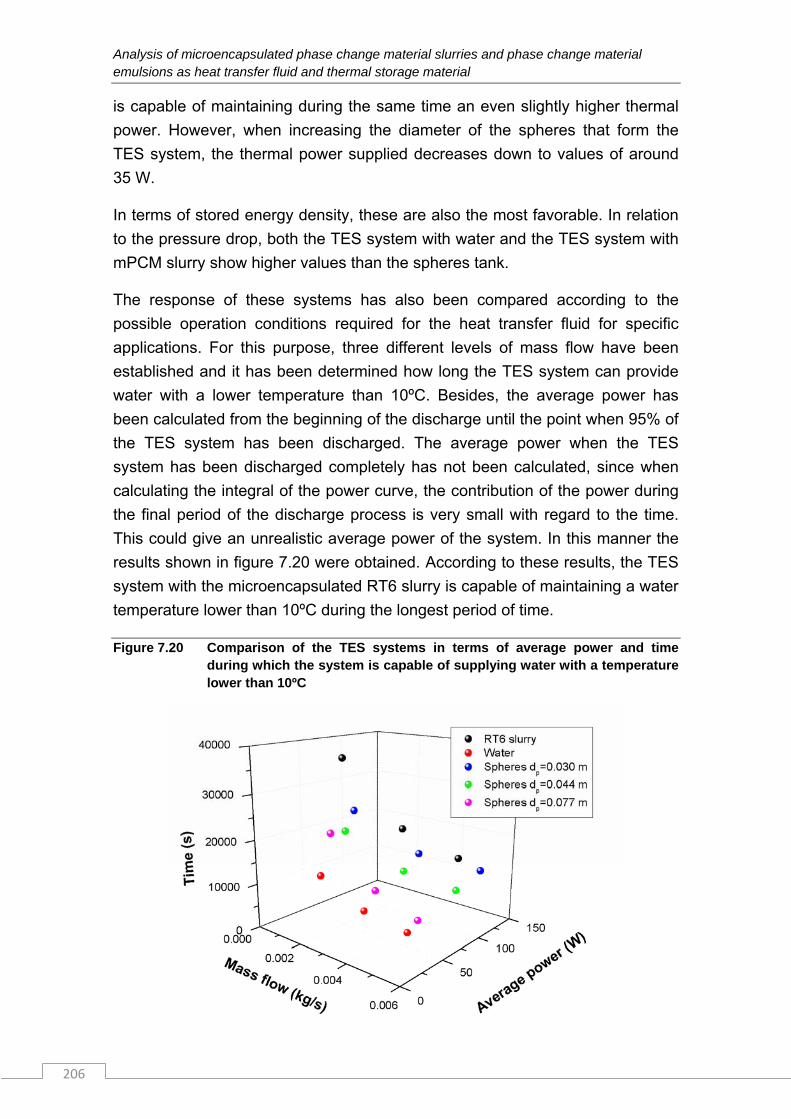
Analysis of microencapsulated phase change material slurries and phase change material emulsions as heat transfer fluid and thermal storage material
206
is capable of maintaining during the same time an even slightly higher thermal
power. However, when increasing the diameter of the spheres that form the
TES system, the thermal power supplied decreases down to values of around
35 W.
In terms of stored energy density, these are also the most favorable. In relation
to the pressure drop, both the TES system with water and the TES system with
mPCM slurry show higher values than the spheres tank.
The response of these systems has also been compared according to the
possible operation conditions required for the heat transfer fluid for specific
applications. For this purpose, three different levels of mass flow have been
established and it has been determined how long the TES system can provide
water with a lower temperature than 10ºC. Besides, the average power has
been calculated from the beginning of the discharge until the point when 95% of
the TES system has been discharged. The average power when the TES
system has been discharged completely has not been calculated, since when
calculating the integral of the power curve, the contribution of the power during
the final period of the discharge process is very small with regard to the time.
This could give an unrealistic average power of the system. In this manner the
results shown in figure 7.20 were obtained. According to these results, the TES
system with the microencapsulated RT6 slurry is capable of maintaining a water
temperature lower than 10ºC during the longest period of time.
Figure 7.20 Comparison of the TES systems in terms of average power and time during which the system is capable of supplying water with a temperature lower than 10ºC
CHAPTER 7. Analysis of applications: tanks of PCM slurries. Comparison with other thermal energy storage systems.
207
Regarding the pressure drop of the different systems, those with the coil (the
TES systems with water and with the mPCM slurry) show a higher pressure
drop compared to the systems with PCM spheres. When working with the same
mass flow in both systems, the velocity in the sphere tank is lower as the
section area is much greater than in the coil. As the pressure drop depends on
the velocity squared, in spite of the fact that the friction factor is higher, the
pressure drop is much lower than in the case of the coil. As an example, if a
mass flow of 0.0035 kg/s is taken for the different TES systems presented, in
the case of the TES systems with water or with the mPCM slurry, the fluid
velocity will be 0.023 m/s, whereas in the tank with spheres of D=0.03 m the
average interstitial velocity will be 0.00016 m/s. In the case of the coil, there will
be a pressure drop of 1.5 Pa, in comparison to 0.017 Pa in the sphere tank
according to the Ergun correlation (Ergun 1952). That is to say, the pressure
drop in the case of the water and microencapsulated PCM slurry tank is around
100 times higher. In spite of being that pressure loss two orders of magnitude
higher, the pumping power is not comparable with the thermal power delivered
by the system. That rise in the pressure loss when working with the systems
with coil would not be so significant.
7.5 Conclusions
The thermal behavior of different low temperature TES systems (of around 6-
8ºC) have been compared by numerical modeling: 1) a system with the PCM
macroencapsulated in spherical capsules, 2) a system with water and 3) a
system with a mPCM slurry.
It has been observed that the tank with the mPCM slurry and the tank with
spherical capsules of lower diameter show greater advantages in terms of
power and energy density. With regard to the estimation of the pressure drop,
the highest values are given by the TES system with water and with the mPCM
slurry.
More specifically, the energy density of the TES system with the RT6 slurry is
35% higher than the energy density of the TES system with PCM spheres with
a diameter of 0.03 m. The TES system with PCM spheres of 0.03 m is capable
of maintaining a thermal power of 75 W during 5 hours. The TES system with
the microencapsulated RT6 slurry is capable of maintaining an even slightly
higher thermal power over the same period of time. The thermal power of the
rest of the systems with spheres of bigger size is less than half, with values of
around 35 W.
Analysis of microencapsulated phase change material slurries and phase change material emulsions as heat transfer fluid and thermal storage material
208
To complete the comparison of the different TES systems, certain operation
conditions were established and the thermal response evaluated. The TES
system with the microencapsulated RT6 slurry was capable of maintaining the
outlet temperature of the heat transfer fluid of the TES system at a temperature
lower than 10ºC for the longest period of time. Under the same operation
conditions, the tank with the mPCM slurry could maintain this temperature
below 10ºC during more than 10 hours, against almost 4 hours of the water tank
or 6 hours of the tank with the spheres of smaller size.
In relation to the pressure drop experienced by the heat transfer fluid of the TES
systems, the systems with a coil had a pressure drop of around two orders of
magnitude higher than that in the TES systems with the sphere geometry.
It must be pointed out that although the tank with the microencapsulated RT6
slurry is clearly advantageous in comparison with a conventional water tank,
other studies such as the study by Heinz and Streicher (2006) and the study by
Huang et al. (2011) with PCM slurries with a phase change temperature
between 60 and 70ºC showed a worse thermal behavior in comparison with
water. Therefore, the natural convection phenomenon should be studied
experimentally for each mPCM slurry or PCM emulsion.

CHAPTER 8. Conclusions and future work
209
To finish this thesis, the contributions and conclusions of the work are summarized. The dissemination of the work is described along with proposals for future research.
8 Conclusions and future work
Analysis of microencapsulated phase change material slurries and phase change material emulsions as heat transfer fluid and thermal storage material
210
8.1 Contributions
The main objective of this thesis comprises a bibliographic review of the state of technology of mPCM slurries and PCM emulsions, the development of methodologies for the correct determination of their thermophysical and rheological properties, and an analysis of the heat transfer phenomenon and fluid mechanics for their use as heat transfer fluids and thermal storage materials in different applications. These contributions are summarized below.
8.1.1 Bibliographic review
As result of this critical review, a summary is provided in the form of a table showing the objective magnitudes when selecting a mPCM slurry or PCM emulsion as a heat transfer fluid and as thermal storage material, as well as the factors that influence these objective magnitudes and the direction of their influence. A lack of experimental works has been revealed, as well as controversy about the results obtained in connection with the heat transfer process. A clear improvement in the performance of these new fluids for their use as heat transfer fluids and thermal storage material has not been demonstrated.
8.1.2 Thermophysical properties
The Enthalpy-Temperature curves of the collected samples have been obtained in the laboratory by means of an installation using the T-history method. Unsuitable samples were discarded at this first stage.
A methodology has been proposed for measuring the thermal diffusivity of mPCM slurries and PCM emulsions using Laser Flash equipment. The analysis showed that the correct measurement of this property requires the following conditions:
-The chamber of the Laser Flash must not be in a vacuum, to avoid the drying of the sample.
-It must be checked that the amount of sample that evaporates is small, with a mass loss of <5%.
-The liquid sampleholder must be filled correctly.
-The calculation time or measurement observation must be as short as possible to avoid the influence of the sampleholder.
CHAPTER 8. Conclusions and future work
211
Taking these recommendations into account, measurements of the thermal diffusivity of two liquids whose value is known, hexadecane and water, have been achieved with errors lower than 8%.
Using this suggested methodology, the thermal diffusivity of samples of candidate mPCM slurries has been measured for different PCM microcapsule mass fractions. As expected, when increasing the PCM microcapsule mass fraction, the thermal conductivity of the mPCM slurries decreased, due to the lower thermal conductivity of paraffin compared to water. As an example, for a 20% PCM microcapsule mass fraction at a temperature of 30ºC, the thermal conductivity of the DS 5007 and DS 5045 slurries decreased by around 30-40% compared to water.
8.1.3 Rheological properties
A model AR-G2 controlled-stress rheometer supplied by TA instruments, located in the thermophysical properties laboratory of the GITSE group, was used for the determination of the rheological properties of PCMs.
The methodology and results of the rheological characterization of the candidate PCM slurries have been presented, obtaining behavior models of these slurries for different PCM microcapsule mass fractions. For a 20% PCM microcapsule mass fraction, both the DS 5007 and DS 5045 slurries reached a viscosity six times higher than that of water in their Newtonian plateau.
In addition, a first approach to a methodology for the viscosity measurement of PCMs during their liquid phase and during the phase transition has been proposed, for implementation in numerical simulations and to be able to take into account the natural convection phenomenon in the melted PCM. This methodology has been established based on measurements carried out with octadecane, using a plate as geometry and a Peltier plate as the temperature control system. For this purpose, both rotational and oscillatory tests have been accomplished, where the influence of the sample size or gap and the heating and cooling rate have been analyzed.
8.1.4 Analysis of stability and compatibility of TES systems with PCMs
The physical stability of the DS 5007 slurry has been analyzed from the oscillatory tests done with the rheometer. As a result of this stability analysis, the relationships have been obtained between the rheological parameters and the visually observed destabilization processes. The proposed methodology enables this type of relationship to be obtained, which could serve as a guide
Analysis of microencapsulated phase change material slurries and phase change material emulsions as heat transfer fluid and thermal storage material
212
for manufacturers to reformulate the slurry and thus improve its physical stability. In the same way, this kind of relationship can predict the period of these destabilization processes without having to wait for complete destabilization.
Specifically, an exponential relationship between the creaming percentage and the elastic module of the mPCM slurries has been obtained. This elastic module should have values higher than 1 Pa to improve the stability. The other relationship obtained is linear and it relates the cohesive energy of the slurry to the creaming percentage. This cohesive energy should have values below 0.01 J/m3 to avoid the destabilization processes.
With an environmental SEM microscope, the rupture of the microcapsules in the DS 5007 sample that had been thermo-mechanically cycled during three weeks was observed (after undergoing approximately 10000 melting-solidification cycles). The microscope observations of the DS 5045 sample were not so conclusive.
With regard to the analysis of possible microbial contamination of the PCM slurries, contamination by fungi and bacteria was found in one of the samples stored in the laboratory. The presence of the Aspergillus fungus and of the Legionella bacterium has been ruled out.
In the case of the TES systems with spherical PCM capsules, the compatibility of different low temperature PCMs with these containers has been analyzed and the mass loss or gain has been quantified. A mass loss through the plastic of the sphere was observed in the case of the organic PCMs. In the inorganic PCM analyzed, a mass gain was observed.
Regarding the corrosion study, none of the analyzed stainless steel specimens was oxidized. Although the aluminum and copper specimens were oxidized, the oxidation was insignificant, being more noticeable in the case of aluminum. However, both materials could be used since they show good corrosion resistance.
8.1.5 Results of heat transfer and fluid mechanics
An experimental installation has been validated and started up, especially designed for the study of mPCM slurries and PCM emulsions. The experimental installation allows the study of the technical viability of these fluids when flowing through typical components of thermal installations, the study of heat transfer by internal convection and the measurement of the pressure drop in the test
CHAPTER 8. Conclusions and future work
213
section. In the validation process, the measurements of pressure drop, heat flux and the wall temperature have been validated. In the case of the validation of the wall temperature measurement, slight differences were observed between the measured temperature and the theoretically calculated temperature. To correct these deviations, an empirical correction model was developed, obtaining a deviation in the wall temperature of 0.24ºC. The experimental installation allows obtaining the local heat transfer coefficients by internal forced convection, with an uncertainty of around 5-10%.
The behavior has been analyzed of two mPCM slurries, DS 5007 and DS 5045, with different PCM microcapsule mass fractions. The analysis procedure was in all cases the same. Firstly, the fulfillment of the energy balance was checked, to discard the possibility that the PCM microcapsules had been deposited in the different components of the installation. Once the fulfillment of the energy balance was verified, the pressure drop measurements were made and the behavior of the slurries as heat transfer fluid was analyzed. It was observed in the two analyzed samples that for the same transported thermal energy, the pumping power was lower than in the case of water. Regarding the heat transfer, it was observed that to obtain better results than for the case of water, the operation temperature range had to be adjusted to the phase change temperature range. A reduction in the wall temperature and an improvement in the internal convective coefficient compared to water was observed. In the case of the DS 5007 slurry, for which it was possible to carry out a deeper analysis, it was observed that the slurry with a 20% mass fraction showed a better thermal performance for its use as a heat transfer fluid, obtaining an improvement in the convective coefficient higher than 45% compared to water.
It has been observed that with higher mass flows or higher velocities, the improvement in the heat transfer coefficient by convection is lower. This phenomenon has been explained by the flow patterns of thermal development. Higher mass flows mean a greater length of the thermal entry region. Therefore, for a given position, the fraction of melted PCM microcapsules in that section is lower, taking less advantage of the latent heat of the melting of the microcapsules in suspension.
The lower enhancement of the heat transfer phenomenon when increasing the PCM microcapsule mass fraction from 20 to 30% (a reduction of 30% and 70% for the mass flows of 20 and 50 kg/h, respectively) can also be attributed to the rise of the viscosity and to the reduction in the thermal conductivity. These
Analysis of microencapsulated phase change material slurries and phase change material emulsions as heat transfer fluid and thermal storage material
214
factors decrease the degree of turbulence and lead to a deterioration in the heat transfer towards the core region of the flow, respectively.
In some cases, as for the same mass flow, under certain operation conditions a very similar internal forced convective coefficient is obtained both for water and for some of the mPCM slurries. However, although this coefficient does not improve, it is possible to maintain a more stable fluid temperature, and consequently a lower wall temperature, in comparison to water.
8.1.6 Thermal and technical behavior of TES systems
By means of numerical simulations, the thermal behavior of different low temperature TES systems has been compared: a system with PCM spheres, a system with a mPCM slurry and a system with water. It has been observed that the tank with the mPCM slurry and the tank with spheres of lower diameter show advantages in terms of power and energy density compared to the water tank and to the system with larger spheres. The tank with the RT6 slurry has the highest energy density, 35% higher than the system with spheres with a diameter of 0.03 m. It is capable of maintaining the outlet temperature of water below 10ºC up to 10 hours, as against 4 or 6 hours of the water system and of the system of spheres with a diameter of 0.03 m, respectively. In relation to the pressure drop, the system with water and the system with the mPCM slurry show a higher pressure loss, up to one hundred times higher than that of the tank with spheres.
8.2 Dissemination of results
During the development of this thesis, significant efforts have been made to attend national and international scientific forums to know the state of the art and to disseminate the most relevant results obtained. The main contributions to the dissemination of the results in this thesis are detailed in table VIII.1, together with those relating to the R&D project in which its development is framed and works completed together with other members of the GITSE group within the research line of TES systems with PCMs.
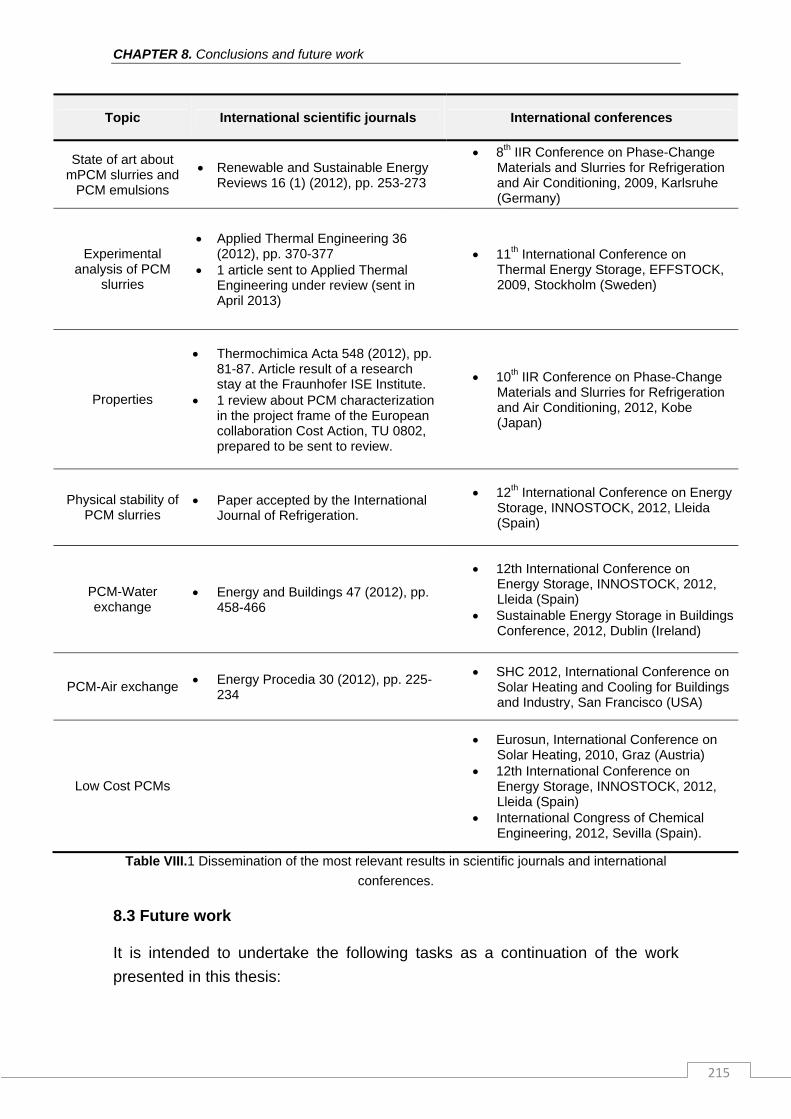
CHAPTER 8. Conclusions and future work
215
Topic International scientific journals International conferences
State of art about mPCM slurries and
PCM emulsions
Renewable and Sustainable Energy Reviews 16 (1) (2012), pp. 253-273
8th IIR Conference on Phase-Change Materials and Slurries for Refrigeration and Air Conditioning, 2009, Karlsruhe (Germany)
Experimental analysis of PCM
slurries
Applied Thermal Engineering 36 (2012), pp. 370-377
1 article sent to Applied Thermal Engineering under review (sent in April 2013)
11th International Conference on Thermal Energy Storage, EFFSTOCK, 2009, Stockholm (Sweden)
Properties
Thermochimica Acta 548 (2012), pp. 81-87. Article result of a research stay at the Fraunhofer ISE Institute.
1 review about PCM characterization in the project frame of the European collaboration Cost Action, TU 0802, prepared to be sent to review.
10th IIR Conference on Phase-Change Materials and Slurries for Refrigeration and Air Conditioning, 2012, Kobe (Japan)
Physical stability of PCM slurries
Paper accepted by the International Journal of Refrigeration.
12th International Conference on Energy Storage, INNOSTOCK, 2012, Lleida (Spain)
PCM-Water exchange
Energy and Buildings 47 (2012), pp. 458-466
12th International Conference on Energy Storage, INNOSTOCK, 2012, Lleida (Spain)
Sustainable Energy Storage in Buildings Conference, 2012, Dublin (Ireland)
PCM-Air exchange Energy Procedia 30 (2012), pp. 225-234
SHC 2012, International Conference on Solar Heating and Cooling for Buildings and Industry, San Francisco (USA)
Low Cost PCMs
Eurosun, International Conference on Solar Heating, 2010, Graz (Austria)
12th International Conference on Energy Storage, INNOSTOCK, 2012, Lleida (Spain)
International Congress of Chemical Engineering, 2012, Sevilla (Spain).
Table VIII.1 Dissemination of the most relevant results in scientific journals and international conferences.
8.3 Future work
It is intended to undertake the following tasks as a continuation of the work presented in this thesis:
Analysis of microencapsulated phase change material slurries and phase change material emulsions as heat transfer fluid and thermal storage material
216
An experimental study of natural convection in a tank with mPCM slurries in the installation developed by Álvaro Campos Celador within the framework of his doctoral thesis on the study of latent TES systems (“Integration of latent thermal energy storage systems in the design and operation of residential cogeneration plants”). This work will be developed within the project funded by the CICYT project of the National Programme of R&D&I ENE2011-28269-C03-01.
Obtaining an experimental correlation of the Nusselt number for the DS 5007 slurry with different mass fractions.
Redesign of the experimental installation described in chapter 5 for heat transfer analysis under turbulent flow conditions.
Collaboration for the start-up of the densimeter and thermomechanical analyzer DM 40 and TMA/STDA841e. Initial approach of a methodology for the obtaining of the Density-Temperature curve in PCMs.
Study of the thermophysical properties, rheological properties, heat transfer phenomenon, fluid mechanics, and physical stability of new samples of mPCM slurries.
Measurement of the viscosity of different PCMs according to the methodology proposed for its implementation in numerical simulations, in applications outside the scope of this thesis.
Viscosity and volumetric expansion coefficient measurements of the PCM RT6 to be able to analyze the effect of natural convection on the numerical simulations presented in chapter 7.
Development of a Research Project for the analysis of mPCM slurries in solar cooling applications and for the leveling of the energy demand curve, taking advantage use of the night-time rate and reduction of the power to install, in cooling installations. Project selected in the call of Grants for the Research in Energy and Environment of 2013 from “Fundación Iberdrola”
Application for a European Project within the Seventh Framework Programme under the call EeB.NMP.2013-1 Nanotechnology for multifunctional lightweight construction materials.

CHAPTER 8. Conclusions and future work
217
Collaboration in the 3-year extension of Task 42 of the International Energy Agency. Responsible for the rheology part of the working group: Test and Characterization.
Study of thermochemical storage systems through involvement in a R&D&I project with the BSH company for applications in electrical appliances.

Analysis of microencapsulated phase change material slurries and phase change material emulsions as heat transfer fluid and thermal storage material
218

CAPÍTULO 8. Conclusiones y trabajo futuro
219
Para finalizar esta tesis se resumen las contribuciones y conclusiones del trabajo presentado. Asimismo, se comenta la difusión que se ha dado al trabajo aquí presentado y se proponen las líneas de investigación que dan continuidad a este trabajo.
8 Conclusiones y trabajo futuro
Análisis de suspensiones y emulsiones de materiales de cambio de fase como fluido caloportador y material de almacenamiento térmico
220
8.1 Aportaciones
El objetivo principal de esta tesis comprende la revisión bibliográfica sobre el estado de la tecnología de suspensiones y emulsiones de PCM, el desarrollo de metodologías para la correcta determinación de sus propiedades termofísicas y reológicas, el análisis del fenómeno de transferencia de calor y la mecánica de fluidos, así como el estudio de su viabilidad técnica, para su uso como fluido caloportador y material de almacenamiento térmico en diversas aplicaciones. De acuerdo con este objetivo, a continuación se resumen las aportaciones conseguidas en cada una de los apartados de esta tesis.
8.1.1 Revisión bibliográfica
Fruto de la revisión crítica llevada a cabo, se ha resumido en forma de tabla cuales son las magnitudes objetivo cuando se selecciona una suspensión o emulsión de PCM como fluido caloportador y como material de almacenamiento térmico, así como los factores que influyen sobre estas magnitudes objetivo, y su dirección de influencia. Se ha evidenciado una carencia de trabajos experimentales, así como una controversia en los resultados obtenidos acerca del proceso de transferencia de calor. No se evidencia una clara mejoría en las prestaciones de estos nuevos fluidos para su uso como fluido caloportador y material de almacenamiento térmico.
8.1.2 Propiedades termofísicas
Se han obtenido las curvas Entalpía-Temperatura de las muestras recopiladas en el laboratorio, a partir de una instalación del método T-history, descartando en esta primera etapa aquellas muestras no idóneas.
Se ha planteado una primera metodología para la medida de la difusividad térmica de suspensiones y emulsiones de PCM con un equipo Láser Flash. En base a los análisis realizados, para una medida correcta de esta propiedad:
- no se debe realizar el vacío en la cámara del equipo Láser Flash, para evitar el secado de la muestra;
-se debe comprobar que la cantidad de muestra que se evapora es pequeña, pérdida de masa<5%;
-se debe llenar correctamente el portamuestras de líquidos;
-se debe seleccionar un tiempo de cálculo u observación de las medidas lo más pequeño posible, para evitar la influencia del portamuestras.
CAPÍTULO 8. Conclusiones y trabajo futuro
221
Teniendo en cuenta estas recomendaciones, se ha conseguido medir con errores menores del 8% la difusividad térmica de dos líquidos cuyo valor resulta conocido: agua y hexadecano.
A partir de la metodología planteada se ha medido la difusividad térmica de las muestras de suspensiones de PCM microencapsulado candidatas, para distintas fracciones másicas de microcápsulas de PCM. Tal como era de esperar, al incrementar la fracción másica de microcápsulas de PCM, la conductividad térmica de las suspensiones ha disminuido, debido a la menor conductividad térmica de la parafina en comparación con el agua. A modo de ejemplo, para una fracción másica de microcápsulas de PCM del 20%, para una temperatura de 30ºC, la conductividad térmica de las suspensiones DS 5007 y DS 5045 ha disminuido en torno a un 30-40% respecto al caso del agua.
8.1.3 Propiedades reológicas
Se ha puesto en marcha en el laboratorio de determinación de propiedades del grupo GITSE un reómetro de esfuerzo controlado, de TA Instruments modelo AR-G2, para la determinación de propiedades reológicas de PCMs.
Se ha presentado la metodología y resultados de la caracterización reológica de las suspensiones de PCM candidatas, obteniendo los modelos de comportamiento de estas suspensiones para distintas fracciones másicas de microcápsulas de PCM. Ambas suspensiones, DS 5007 y DS 5045, para una fracción másica de microcápsulas de PCM del 20%, alcanzan en su plateau Newtoniano una viscosidad seis veces superior a la del agua.
Además se ha propuesto un primer planteamiento de metodología para la medida de la viscosidad de PCMs durante su fase líquida y durante su transición de fase, para su implementación en simulaciones numéricas y poder tener en cuenta el fenómeno de convección natural en el PCM fundido. Esta metodología se ha planteado en base a las medidas realizadas con octadecano, usando un plato como geometría y un plato Peltier como sistema de control de temperatura. Para ello se han llevado a cabo tanto ensayos rotacionales como oscilatorios, donde se ha analizado la influencia del tamaño de muestra o gap y la velocidad de calentamiento y enfriamiento.
Análisis de suspensiones y emulsiones de materiales de cambio de fase como fluido caloportador y material de almacenamiento térmico
222
8.1.4 Análisis de estabilidad y compatibilidad de sistemas de
almacenamiento de energía térmica con PCMs
Se ha analizado la estabilidad física de la suspensión DS 5007 a partir de ensayos oscilatorios con el reómetro. Fruto de este análisis de estabilidad, son las relaciones obtenidas entre los parámetros reológicos y los procesos de desestabilización observados visualmente. La metodología propuesta permite obtener este tipo de relaciones, que pueden servir de guía al fabricante para reformular la suspensión y mejorar así su estabilidad física. Del mismo modo, este tipo de relaciones puede predecir el periodo de estos procesos de desestabilización, sin necesidad de tener que esperar a la completa desestabilización.
Concretamente se ha obtenido una correlación de tipo exponencial entre el porcentaje de cremado y el módulo elástico de las suspensiones de PCM microencapsulado. Este módulo elástico debería tomar valores superiores a 1 Pa para mejorar su estabilidad. La otra relación obtenida es de tipo lineal y relaciona la energía de cohesión de las suspensiones con el porcentaje de cremado. Esta energía de cohesión debería tomar valores por debajo de 0.01 J/m3 para evitar esos procesos de desestabilización.
Con un miscroscopio SEM de tipo ambiental, se ha observado la ruptura de las microcápsulas en la muestra DS 5007 que había sido ciclada termo-mecánicamente durante 3 semanas (habiendo experimentado aproximadamente del orden de 10000 ciclos de fusión-solidificación). En cuanto a la muestra DS 5045, las observaciones al microscopio no resultaron concluyentes.
En cuanto al análisis de una posible contaminación microbiana en las suspensiones de PCM, se ha encontrado en una de las muestras almacenadas en el laboratorio contaminación por hongos y bacterias. Se ha descartado la presencia del hongo Aspergillus y de la bacteria Legionella.
En el caso de sistemas de almacenamiento de energía térmica con cápsulas esféricas de PCM, se ha analizado la compatibilidad de diferentes PCMs de baja temperatura con dichos recipientes contenedores y se ha cuantificado su pérdida o ganancia de masa. Se ha observado una pérdida de masa a través del plástico de la esfera en el caso de los PCMs de carácter orgánico. En el PCM inorgánico analizado se ha observado una ganancia de masa.
CAPÍTULO 8. Conclusiones y trabajo futuro
223
Respecto al estudio de corrosión, ninguna de las probetas de acero inoxidable analizadas se ha oxidado. Si bien las probetas de aluminio y cobre evaluadas en el marco de esta tesis sí que se han oxidado, esta oxidación ha sido poco significativa, siendo más apreciable en el caso del aluminio. Sin embargo ambos materiales podrían ser utilizados puesto que presentan buena resistencia a la corrosión.
8.1.5 Resultados sobre la transferencia de calor y mecánica de fluidos
Se ha diseñado, validado y puesto en marcha una instalación experimental, especialmente diseñada para el estudio de suspensiones y emulsiones de PCM. La instalación experimental permite el estudio de viabilidad técnica de estos fluidos cuando circulan por elementos típicos de instalaciones térmicas, el estudio de transferencia de calor por convección interior y la medida de pérdida de carga en su sección de ensayo. En el proceso de validación, se ha validado la medida de pérdida de carga, la medida del flujo de calor y la medida de la temperatura de pared. En el caso de la validación de la medida de la temperatura de pared, se observaron ligeras diferencias entre la temperatura medida y la temperatura calculada teóricamente. Para corregir estas desviaciones se ha desarrollado un modelo empírico de corrección, obteniendo con este modelo una desviación en la temperatura de pared de 0.24ºC. Así la instalación experimental permite obtener los coeficientes de transferencia de calor por convección forzada interior de tipo local, con una incertidumbre de en torno al 5-10%.
Se ha analizado el comportamiento de dos suspensiones de PCM, DS 5007 y DS 5045, con distintas fracciones másicas de PCM microencapsulado. El procedimiento de análisis fue en todos los casos el mismo. En primer lugar se comprobó que se cumplía el balance de energía, para descartar la posibilidad de que las microcápsulas de PCM se hubiesen depositado por los diferentes componentes de la instalación. Una vez verificado el cumplimiento del balance de energía, se llevaron a cabo las medidas de pérdida de carga y se analizó su comportamiento como fluido caloportador. Se observó en las dos suspensiones analizadas que para una misma energía térmica transportada, el trabajo de bombeo era menor que en el caso del agua. Respecto al estudio de la transferencia de calor, se observó que para obtener mejores resultados que para el caso del agua, el rango de temperaturas de operación se debía ajustar al rango de temperaturas de cambio de fase. Se observó una disminución en la temperatura de pared y una mejora en el coeficiente de convección forzada interior en comparación con el agua. En el caso de la suspensión DS 5007,
Análisis de suspensiones y emulsiones de materiales de cambio de fase como fluido caloportador y material de almacenamiento térmico
224
suspensión con la que se pudo realizar un análisis más profundo, se observó que la suspensión con un 20% es la que presentaba un mejor comportamiento térmico para su uso como fluido caloportador, obteniendo una mejora en el coeficiente de convección mayor del 45% respecto del agua.
Se ha observado que para mayores caudales másicos o mayores velocidades, la mejora del coeficiente de transferencia de calor por convección es menor. Este fenómeno se ha explicado a partir de los patrones de flujo de desarrollo térmico. A mayor caudal másico, mayor es la longitud de la región de entrada térmica, por lo tanto, para una posición dada, la fracción de microcápsulas de PCM fundida en esa sección es menor, aprovechando en menor medida el calor latente de fusión de las microcápsulas en suspensión.
La menor mejora del fenómeno de transferencia de calor al incrementar la concentración de microcápsulas de PCM del 20 al 30% (disminución del 30 y del 70% para los caudales másicos de 20 y 50 kg/h respectivamente) también se puede atribuir al aumento de la viscosidad, y a la disminución de la conductividad térmica, disminuyendo así el grado de turbulencia y deteriorando la transferencia de calor hacia la región del núcleo de flujo respectivamente.
Se ha observado en algunos casos, como para un mismo caudal másico, se obtiene tanto para el agua como para algunas de las suspensiones de PCM bajo ciertas condiciones de operación un coeficiente de convección forzada interior muy similar. Sin embargo aunque este coeficiente no mejora, se logra mantener una temperatura en el fluido más estable, en este caso en la suspensión de PCM, y como consecuencia una temperatura de pared también menor, en comparación con el agua.
8.1.6 Comportamiento térmico y técnico de sistemas de almacenamiento
de energía térmica
A partir de simulaciones numéricas, se ha comparado el comportamiento térmico de diferentes sistemas de almacenamiento térmico de baja temperatura: un sistema con esferas de PCM, un sistema con una suspensión de PCM y un sistema con agua. Se ha observado que el depósito con la suspensión de PCM y el depósito con esferas de menor diámetro presentan ventajas en cuanto a términos de potencia y densidad energética respecto al depósito de agua, y al almacenamiento en esferas de mayor diámetro. El depósito con la suspensión de RT6 es el que presenta una mayor densidad energética, un 35% mayor que la del sistema con esferas de 0.03 m de diámetro. Es capaz de mantener la temperatura de salida del agua por debajo
CAPÍTULO 8. Conclusiones y trabajo futuro
225
de los 10ºC hasta 10 horas, frente a las 4 o 6 horas del sistema con agua y del sistema con esferas de 0.03 m de diámetro, respectivamente. En cuanto a la pérdida de carga, son el sistema de almacenamiento en agua y en suspensión de PCM los que presentan valores más elevados, hasta 100 veces superior al caso del depósito con esferas.
8.2 Difusión de resultados
Durante el desarrollo de esta tesis se ha realizado un esfuerzo importante en acudir a foros científicos nacionales e internacionales para conocer el estado de arte y difundir los resultados más relevantes obtenidos. Se detallan en la tabla VIII.1 las principales contribuciones a la difusión de resultados en esta tesis, así como respecto del proyecto de I+D en el que se enmarca su desarrollo, y trabajos realizados junto con otros miembros del grupo GITSE dentro de la línea de investigación de sistemas de almacenamiento de energía mediante PCMs.
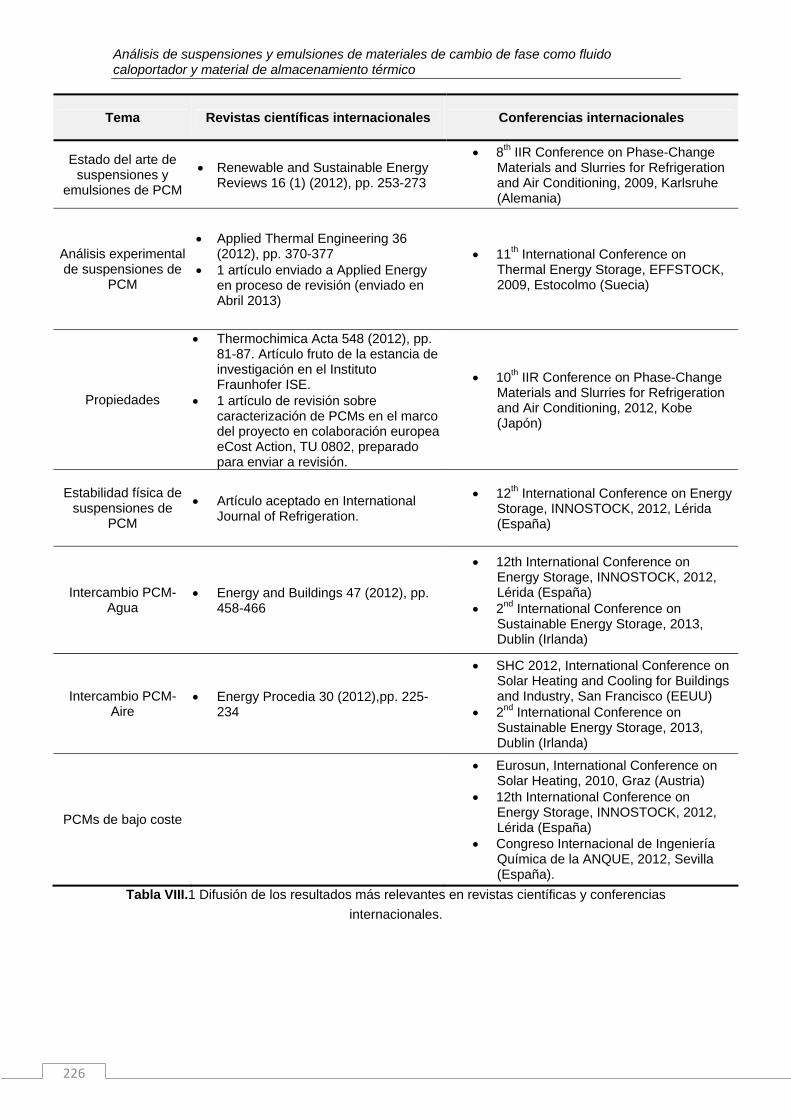
Análisis de suspensiones y emulsiones de materiales de cambio de fase como fluido caloportador y material de almacenamiento térmico
226
Tema Revistas científicas internacionales Conferencias internacionales
Estado del arte de suspensiones y
emulsiones de PCM
Renewable and Sustainable Energy Reviews 16 (1) (2012), pp. 253-273
8th IIR Conference on Phase-Change Materials and Slurries for Refrigeration and Air Conditioning, 2009, Karlsruhe (Alemania)
Análisis experimental de suspensiones de
PCM
Applied Thermal Engineering 36 (2012), pp. 370-377
1 artículo enviado a Applied Energy en proceso de revisión (enviado en Abril 2013)
11th International Conference on Thermal Energy Storage, EFFSTOCK, 2009, Estocolmo (Suecia)
Propiedades
Thermochimica Acta 548 (2012), pp. 81-87. Artículo fruto de la estancia de investigación en el Instituto Fraunhofer ISE.
1 artículo de revisión sobre caracterización de PCMs en el marco del proyecto en colaboración europea eCost Action, TU 0802, preparado para enviar a revisión.
10th IIR Conference on Phase-Change Materials and Slurries for Refrigeration and Air Conditioning, 2012, Kobe (Japón)
Estabilidad física de suspensiones de
PCM
Artículo aceptado en International Journal of Refrigeration.
12th International Conference on Energy Storage, INNOSTOCK, 2012, Lérida (España)
Intercambio PCM-Agua
Energy and Buildings 47 (2012), pp. 458-466
12th International Conference on Energy Storage, INNOSTOCK, 2012, Lérida (España)
2nd International Conference on Sustainable Energy Storage, 2013, Dublin (Irlanda)
Intercambio PCM-Aire
Energy Procedia 30 (2012),pp. 225-234
SHC 2012, International Conference on Solar Heating and Cooling for Buildings and Industry, San Francisco (EEUU)
2nd International Conference on Sustainable Energy Storage, 2013, Dublin (Irlanda)
PCMs de bajo coste
Eurosun, International Conference on Solar Heating, 2010, Graz (Austria)
12th International Conference on Energy Storage, INNOSTOCK, 2012, Lérida (España)
Congreso Internacional de Ingeniería Química de la ANQUE, 2012, Sevilla (España).
Tabla VIII.1 Difusión de los resultados más relevantes en revistas científicas y conferencias internacionales.
CAPÍTULO 8. Conclusiones y trabajo futuro
227
8.3 Líneas futuras
Como continuación del trabajo aquí presentado se pretende desarrollar las siguientes tareas:
Estudio experimental de la convección natural en un depósito con suspensiones de PCM microencapsulado en la instalación desarrollada por Álvaro Campos Celador en el marco de su tesis doctoral para el estudio de sistemas de almacenamiento de energía térmica de tipo latente (“Integration of latent thermal energy storage systems in the design and operation of residential cogeneration plants”). Esta línea se desarrollará en el proyecto financiado por el proyecto CICYT del Plan Nacional de I+D+i ENE2011-28269-C03-01.
Obtención de una correlación experimental del número de Nusselt para la suspensión DS 5007 con distintas fracciones másicas.
Rediseño de la instalación experimental objeto del capítulo 5 para el análisis de transferencia de calor bajo condiciones de flujo turbulento.
Colaboración para la puesta en marcha del densímetro y analizador termomecánico DM 40 y TMA/STDA841e. Planteamiento de una primera metodología para la obtención de la curva Densidad-Temperatura en PCMs.
Estudio de las propiedades termofísicas, propiedades reológicas, fenómeno de transferencia de calor, mecánica de fluidos, estabilidad física de muestras nuevas de suspensiones de PCM microencapsulado.
Medida de la viscosidad según la metodología propuesta de diversos PCMs para su implementación en simulaciones numéricas, en aplicaciones fuera del ámbito de esta tesis.
Medidas de viscosidad y coeficiente de expansión volumétrica del PCM RT6 para poder analizar el efecto del a convección natural en las simulaciones numéricas presentadas en el capítulo 7.
Desarrollo del proyecto de investigación de análisis de suspensiones de PCM microencapsulado en aplicaciones de refrigeración solar y para la nivelación de la curva de demanda energética, aprovechamiento de la tarifa nocturna y disminución de la potencia a instalar, en instalaciones de refrigeración. Seleccionada en la convocatoria de 2013 de las Ayudas
Análisis de suspensiones y emulsiones de materiales de cambio de fase como fluido caloportador y material de almacenamiento térmico
228
a la Investigación en Energía y Medio Ambiente de la Fundación Iberdrola.
Solicitud de un proyecto europeo del VII Programa Marco bajo el call EeB.NMP.2013-1 Nanotechnology for mutifunctional lightweight construction materials.
Participación en la extensión por tres años más de la Task 42 de la Agencia Internacional de la Energía. Encargada de la parte de reología del grupo de caracterización: Test and Characterization.
Estudio de sistemas de almacenamiento termoquímico, mediante la participación en un proyecto de I+D+i con la empresa BSH para aplicaciones en electrodomésticos.
Bibliographic references
229
Bibliographic references
Literature
Adine, H.A. & El Qarnia, H. 2009, "Numerical analysis of the thermal behaviour of a shell-and-tube heat storage unit using phase change materials", Applied Mathematical Modelling, vol. 33, no. 4, pp. 2132-2144.
Ahuja, A.S. 1975, "Augmentation of Heat Transport in Laminar-Flow of Polystyrene Suspensions .1. Experiments and Results", Journal of Applied
Physics, vol. 46, no. 8, pp. 3408-3416.
Ali, M.E. 1998, "Laminar natural convection from constant heat flux helical coiled tubes", International Journal of Heat and Mass Transfer, vol. 41, no. 14, pp. 2175-2182.
Ali, M.E. 1994, "Experimental investigation of natural convection from vertical helical coiled tubes", International Journal of Heat and Mass Transfer, vol. 37, no. 4, pp. 665-671.
Ali, S. 2001, "Pressure drop correlations for flow through regular helical coil tubes", Fluid Dynamics Research, vol. 28, no. 4, pp. 295-310.
Alkan, C., Sarı, A., Karaipekli, A. & Uzun, O. 2009, "Preparation, characterization, and thermal properties of microencapsulated phase change material for thermal energy storage", Solar Energy Materials and
Solar Cells, vol. 93, no. 1, pp. 143-147.
Alvarado, J.L., Marsh, C., Sohn, C., Vilceus, M., Hock, V., Phetteplace, G. & Newell, T. 2006, "Characterization of supercooling suppression of microencapsulated phase change material by using DSC", Journal of
Thermal Analysis and Calorimetry, vol. Volume 86, no. Number 2, pp. 505-509.
Alvarado, J.L., Marsh, C., Sohn, C., Phetteplace, G. & Newell, T. 2007, "Thermal performance of microencapsulated phase change material slurry in turbulent flow under constant heat flux", International Journal of Heat and
Mass Transfer, vol. 50, no. 9-10, pp. 1938-1952.
Arkar, C. & Medved, S. 2005, "Influence of accuracy of thermal property data of a phase change material on the result of a numerical model of a packed
Analysis of microencapsulated phase change material slurries and phase change material emulsions as heat transfer fluid and thermal storage material
230
bed latent heat storage with spheres", Thermochimica Acta, vol. 438, no. 1-2, pp. 192-201.
ASTM G1-03 (2011) Standard Practice for Preparing, Cleaning, and Evaluating Corrosion Test Specimens.
Barnes, H.A. 2000, A handbook of elementary rheology, Institute of Non-Newtonian Fluid Mechanics. University of Wales.
Bathelt, A.G., Viskanta, R. & Leidenfrost, W. 1979, "An experimental investigation of natural convection in the melted region around a heated horizontal cylinder", Journal of Fluid Mechanics, vol. 90, pp. 227-239.
Bédécarrats, J.P., Castaing-Lasvignottes, J., Strub, F. & Dumas, J.P. 2009, "Study of a phase change energy storage using spherical capsules. Part II: Numerical modelling", Energy Conversion and Management, vol. 50, no. 10, pp. 2537-2546.
Bédécarrats, J.P., Strub, F., Falcon, B. & Dumas, J.P. 1996, "Phase-change thermal energy storage using spherical capsules: performance of a test plant", International Journal of Refrigeration, vol. 19, no. 3, pp. 187-196.
Blumm, J. & Opfermann, J. 2002, "Improvement of the mathematical modeling of flash measurements", High Temperatures-High Pressures, vol. 34, no. 5, pp. 515-521.
Blumm, J., Lindemann, A. & Min, S. 2007, "Thermal characterization of liquids and pastes using the flash technique", Thermochimica Acta, vol. 455, no. 1–2, pp. 26-29.
Cabeza, L.F., Illa, J., Roca, J., Badia, F., Mehling, H., Hiebler, S. & Ziegler, F. 2001 a, "Immersion corrosion tests on metal-salt hydrate pairs used for latent heat storage in the 32 to 36ºC temperature range", Materials and
Corrosion, vol. 52, no. 2, pp. 140-146.
Cabeza, L.F., Illa, J., Roca, J., Badia, F., Mehling, H., Hiebler, S. & Ziegler, F. 2001 b, "Middle term immersion corrosion tests on metal-salt hydrate pairs used for latent heat storage in the 32 to 36ºC temperature range", Materials
and Corrosion, vol. 52, no. 10, pp. 748-754.
Bibliographic references
231
Cabeza, L.F., Roca, J., Illa, J., Badia, F., Mehling, H., Hiebler, S. & Ziegler, F. 2001 c, "Corrosion Experiments on Salt Hydrates used as Phase Change Materials in Cold Storage", International Energy Agency (IEA), ECES IA
Annex 17 Workshop, Lleida (Spain).
Cabeza, L.F., Roca, J., Nogués, M. & Mehling, H. 2002, "Immersion corrosion tests on metal-salt hydrate pairs for latent heat storage in the 48 to 58ºC temperature range", Materials and Corrosion, vol. 53, pp. 902-907.
Campos, A. 2012, “Integration of latent thermal energy storage systems in the design and operation of residential cogeneration plants”, Ph.D. Thesis. Universidad del Pais Vasco.
Cape, J.A. & Lehman, G.W. 1963, "Temperature and finite pulse-time effects in the flash method for measuring thermal diffusivity", Journal of Applied
Physics, vol. 34, no. 7, pp. 1909-1917.
Carreau, J.P. 1972, "Rheological Equations from Molecular Network Theories", Transactions of the Society of Rheology, vol. 16, no. 1, pp. 99-127.
Carslaw, H.S. & Jaeger, J.C. 1986, Conduction of Heat in Solids, Oxford Science Publications.
Castellón, C., Martorell, I., Cabeza, L.F., Fernández, A.I. & Manich, A.M. 2011, "Compatibility of plastic with phase change materials (PCM)", International
Journal of Energy Research, vol. 35, no. 9, pp. 765-771.
Charunyakorn, P., Sengupta, S. & Roy, S.K. 1991, "Forced convection heat transfer in microencapsulated phase change material slurries: flow in circular ducts", International Journal of Heat and Mass Transfer, vol. 34, no. 3, pp. 819-833.
Chen, B., Wang, X., Zeng, R., Zhang, Y., Wang, X., Niu, J., Li, Y. & Di, H. 2008, "An experimental study of convective heat transfer with microencapsulated phase change material suspension: Laminar flow in a circular tube under constant heat flux", Experimental Thermal and Fluid Science, vol. 32, no. 8, pp. 1638-1646.
Chen, B., Wang, X., Zhang, Y., Xu, H. & Yang, R. 2006, "Experimental research on laminar flow performance of phase change emulsion", Applied Thermal
Engineering, vol. 26, no. 11-12, pp. 1238-1245.
Analysis of microencapsulated phase change material slurries and phase change material emulsions as heat transfer fluid and thermal storage material
232
Chen, S., Chen, C., Tin, C., Lee, T. & Ke, M. 2000, "An experimental investigation of cold storage in an encapsulated thermal storage tank", Experimental Thermal and Fluid Science, vol. 23, no. 3-4, pp. 133-144.
Chidambaram, L.A., Ramana, A.S., Kamaraj, G. & Velraj, R. 2011, "Review of solar cooling methods and thermal storage options", Renewable and
Sustainable Energy Reviews, vol. 15, no. 6, pp. 3220-3228.
Cho, Y.I., Choi, I. & Lorsch, H.G. 1991, "A novel concept for heat transfer fluids used in district cooling systems", Progress Report. Development of
advanced low-temperature heat transfer fluids for district heating and
cooling. The U.S. Department of Energy.
Cho, K. & Choi, S.H. 2000, "Thermal characteristics of paraffin in a spherical capsule during freezing and melting processes", International Journal of
Heat and Mass Transfer, vol. 43, no. 17, pp. 3183-3196.
Choi, E. 1993, “Forced convection heat transfer with water and phase-change material slurries: turbulent flow in a circular tube”, Ph.D. Thesis. Drexel University
Choi, E., Cho, Y.I. & Lorsch, H.G. 1994, "Forced convection heat transfer with phase-change-material slurries: turbulent flow in a circular tube", International Journal of Heat and Mass Transfer, vol. 37, no. 2, pp. 207.
Choi, E., Cho, Y.I. & Lorsch, H.G. 1991, "Effects of emulsifier on particle size of a phase change material in a mixture with water", International
Communications in Heat and Mass Transfer, vol. 18, no. 6, pp. 759-766.
Choi, M. & Cho, K. 2001, "Effect of the aspect ratio of rectangular channels on the heat transfer and hydrodynamics of paraffin slurry flow", International
Journal of Heat and Mass Transfer, vol. 44, no. 1, pp. 55-61.
Churchill, S.W. 1983, Heat Exchanger Design Handbook. Free convection
around immersed bodies. Hemisphere Publishing Corp., New York.
Clark, L.M. & Taylor, R.E. 1975, "Radiation loss in the flash method for thermal diffusivity", Journal of Applied Physics, vol. 46, no. 2, pp. 714-719.
Bibliographic references
233
Coquard, R. & Panel, B. 2009, "Adaptation of the FLASH method to the measurement of the thermal conductivity of liquids or pasty materials", International Journal of Thermal Sciences, vol. 48, no. 4, pp. 747-760.
Costa, M., Oliva, A. & Pérez-Segarra, C.D. 1997, "Three dimensional numerical study of melting inside an isothermal horizontal cylinder", Numerical Heat
Transfer, Part A: Applications: An International Journal of Computation and
Methodology, vol. 32, no. 5, pp. 531-553.
Costa, M., Oliva, A., Segarra, C.D.F. & Alba, R. 1991, "Numerical simulation of solid-liquid phase change phenomena", Computer Methods in Applied
Mechanics and Engineering, vol. 91, no. 1-3, pp. 1123-1134.
Cowan, R.D. 1963, "Pulse method of measuring thermal diffusivity at high temperatures", Journal of Applied Physics, vol. 34, no. 2, pp. 926-927.
Cox, W.P. & Merz, E.H. 1958, "Correlation of dynamic and steady flow viscosities", Journal of Polymer Science, vol. 28, pp. 619-622.
Cross, M.M. 1965, "Rheology of non-Newtonian fluids: A new flow equation for pseudoplastic systems", Journal of Colloid Science, vol. 20, no. 5, pp. 417-437.
Delgado, M., Lázaro, A., Mazo, J. & Zalba, B. 2012, "Review on phase change material emulsions and microencapsulated phase change material slurries: Materials, heat transfer studies and applications", Renewable and
Sustainable Energy Reviews, vol. 16, no. 1, pp. 253-273.
Diaconu, B.M. 2009, "Transient thermal response of a PCS heat storage system", Energy and Buildings, vol. 41, no. 2, pp. 212-219.
Diaconu, B.M., Varga, S. & Oliveira, A.C. 2010, "Experimental study of natural convection heat transfer in a microencapsulated phase change material slurry", Energy, vol. 35, no. 6, pp. 2688-2693.
Directiva 2009/28/CE del Parlamento Europeo y del Consejo de 23 de abril de 2009, relativa al fomento del uso de energía procedente de fuentes renovable.
Analysis of microencapsulated phase change material slurries and phase change material emulsions as heat transfer fluid and thermal storage material
234
Dolado, P. 2011, Almacenamiento térmico de energía mediante cambio de
fase. Diseño y modelización de equipos de almacenamiento para
intercambio de calor con aire, Ph.D. thesis, Universidad de Zaragoza.
Dutil, Y., Rousse, D.R., Salah, N.B., Lassue, S. & Zalewski, L. 2011, "A review on phase-change materials: Mathematical modeling and simulations", Renewable and Sustainable Energy Reviews, vol. 15, no. 1, pp. 112-130.
Ergun, S. 1952, "Fluid Flow through Packed Columns", Chemical Engineering
Progress, vol. 48, no. 2, pp. 89-94.
Esen, M. & Ayhan, T. 1996, "Development of a model compatible with solar assisted cylindrical energy storage tank and variation of stored energy with time for different phase change materials", Energy Conversion and
Management, vol. 37, no. 12, pp. 1775-1785.
Fan, Y.F., Zhang, X.X., Wu, S.Z. & Wang, X.C. 2005, "Thermal stability and permeability of microencapsulated n-octadecane and cyclohexane", Thermochimica Acta, vol. 429, no. 1, pp. 25-29.
Fang, Y., Kuang, S., Gao, X. & Zhang, Z. 2008, "Preparation and characterization of novel nanoencapsulated phase change materials", Energy Conversion and Management, vol. 49, no. 12, pp. 3704-3707.
Farid, M.M., Hamad, F.A. & Abu-Arab, M. 1998, "Melting and solidification in multi-dimensional geometry and presence of more than one interface", Energy Conversion and Management, vol. 39, no. 8, pp. 809-818.
Farid, M.M. & Husian, R.M. 1990, "An electrical storage heater using the phase-change method of heat storage", Energy Conversion and Management, vol. 30, no. 3, pp. 219-230.
Farrell, A.J., Norton, B. & Kennedy, D.M. 2006, "Corrosive effects of salt hydrate phase change materials used with aluminium and copper", Journal
of Materials Processing Technology, vol. 175, no. 1–3, pp. 198-205.
Felix Regin, A., Solanki, S.C. & Saini, J.S. 2009, "An analysis of a packed bed latent heat thermal energy storage system using PCM capsules: Numerical investigation", Renewable Energy, vol. 34, no. 7, pp. 1765-1773.
Bibliographic references
235
García-Romero, A., Delgado, A., Urresti, A., Martín, K. & Sala, J.M. 2009, "Corrosion behaviour of several aluminium alloys in contact with a thermal storage phase change material based on Glauber’s salt", Corrosion
Science, vol. 51, no. 6, pp. 1263-1272.
Gerbino, P. 2005, Remington: The Science and Practice of Pharmacy,
University of the Sciences in Philadelphia.
Goel, M., Roy, S.K. & Sengupta, S. 1994, "Laminar forced convection heat transfer in microcapsulated phase change material suspensions", International Journal of Heat and Mass Transfer, vol. 37, no. 4, pp. 593-604.
Griffiths, P.W. & Eames, P.C. 2007, "Performance of chilled ceiling panels using phase change material slurries as the heat transport medium", Applied
Thermal Engineering, vol. 27, no. 10, pp. 1756-1760.
Gschwander, S., Schossig, P. & Henning, H.-. 2005, "Micro-encapsulated paraffin in phase-change slurries", Solar Energy Materials and Solar Cells,
vol. 89, no. 2-3, pp. 307-315.
Gschwander, S. & Schossig, P. 2006, “Phase change slurries as heat transfer and storage fluids for cooling applications”, Ecostock Conference, 31th May - 2nd June 2006, New Jersey (USA).
Günther, E., Schmid, T., Mehling, H., Hiebler, S. & Huang, L. 2010, "Subcooling in hexadecane emulsions", International Journal of Refrigeration, vol. 33, no. 8, pp. 1605-1611.
Günther, E., Huang, L., Mehling, H. & Dötsch, C. 2011, "Subcooling in PCM emulsions – Part 2: Interpretation in terms of nucleation theory", Thermochimica Acta, vol. 522, no. 1-2, pp. 199-204.
Hawlader, M.N.A., Uddin, M.S. & Khin, M.M. 2003, "Microencapsulated PCM thermal-energy storage system", Applied Energy, vol. 74, no. 1-2, pp. 195-202.
Heinz, A. & Streicher, W. 2006, "Application of phase change materials and PCM-slurries for thermal energy storage", Ecostock Conference, 31th May - 2nd June 2006, New Jersey (USA).
Analysis of microencapsulated phase change material slurries and phase change material emulsions as heat transfer fluid and thermal storage material
236
Helm, M., Keil, C., Hiebler, S., Mehling, H. & Schweigler, C. 2009, "Solar heating and cooling system with absorption chiller and low temperature latent heat storage: Energetic performance and operational experience", International Journal of Refrigeration, vol. 32, no. 4, pp. 596-606.
Ho, C.J. & Gao, J.Y. 2009, "Preparation and thermophysical properties of nanoparticle-in-paraffin emulsion as phase change material", International
Communications in Heat and Mass Transfer, vol. 36, no. 5, pp. 467-470.
Ho, C.J., Huang, J.B., Tsai, P.S. & Yang, Y.M. 2010, "Preparation and properties of hybrid water-based suspension of Al2O3 nanoparticles and MEPCM particles as functional forced convection fluid", International
Communications in Heat and Mass Transfer, vol. 37, no. 5, pp. 490-494.
Hu, X. & Zhang, Y. 2002, "Novel insight and numerical analysis of convective heat transfer enhancement with microencapsulated phase change material slurries: laminar flow in a circular tube with constant heat flux", International
Journal of Heat and Mass Transfer, vol. 45, no. 15, pp. 3163-3172.
Huang, L., Doetsch, C. & Pollerberg, C. 2010 a, "Low temperature paraffin phase change emulsions", International Journal of Refrigeration, vol. 33, no. 8, pp. 1583-1589.
Huang, L., Günther, E., Doetsch, C. & Mehling, H. 2010 b, "Subcooling in PCM emulsions—Part 1: Experimental", Thermochimica Acta, vol. 509, no. 1-2, pp. 93-99.
Huang, L., Noeres, P., Petermann, M. & Doetsch, C. 2010 c, "Experimental study on heat capacity of paraffin/water phase change emulsion", Energy
Conversion and Management, vol. 51, no. 6, pp. 1264-1269.
Huang, L., Petermann, M. & Doetsch, C. 2009, "Evaluation of paraffin/water emulsion as a phase change slurry for cooling applications", Energy, vol. 34, no. 9, pp. 1145-1155.
Huang, M.J., Eames, P.C., McCormack, S., Griffiths, P. & Hewitt, N.J. 2011, "Microencapsulated phase change slurries for thermal energy storage in a residential solar energy system", Renewable Energy, vol. 36, no. 11, pp. 2932-2939.
Bibliographic references
237
Inaba, H., Dai, C. & Horibe, A. 2004, "Natural convection heat transfer in enclosures with microemulsion phase change material slurry", Heat and
Mass Transfer, vol. 40, no. 3-4, pp. 179-189.
Inaba, H., Zhang, Y., Horibe, A. & Haruki, N. 2007, "Numerical simulation of natural convection of latent heat phase-change-material microcapsulate slurry packed in a horizontal rectangular enclosure heated from below and cooled from above", Heat and Mass Transfer, vol. Volume 43, no. Number 5, pp. 459-470.
Inaba, H. 2000, "New challenge in advanced thermal energy transportation using functionally thermal fluids", International Journal of Thermal Sciences,
vol. 39, no. 9-11, pp. 991-1003.
Incropera, F.P. & DeWitt, D.P. 1996, “Fundamentals of Heat and Mass Transfer”, John Willey & Sons, Inc.
Ismail, K.A.R. & Henríquez, J.R. 2002, "Numerical and experimental study of spherical capsules packed bed latent heat storage system", Applied
Thermal Engineering, vol. 22, no. 15, pp. 1705-1716.
ISO 175:1999 Plastics, Methods of Test Determination of the Effects of Immersion in Liquid Chemicals.
Ito, H. 1969, "Laminar Flow in Curved Pipes", Zamms-zeitschrift für
Angewandte Mathematik und Mechanik, vol. 49, no. 11, pp. 653-663.
Ito, H. 1959, "Friction factors for turbulent flow in curved pipes", ASME Journal
of Basic Engineering, vol. 81, pp. 123-134.
Jegadheeswaran, S. & Pohekar, S.D. 2009, "Performance enhancement in latent heat thermal storage system: A review", Renewable and Sustainable
Energy Reviews, vol. 13, no. 9, pp. 2225-2244.
Jin, Z., Wang, Y., Liu, J. & Yang, Z. 2008, "Synthesis and properties of paraffin capsules as phase change materials", Polymer, vol. 49, no. 12, pp. 2903-2910.
Kasza, K.E. & Chen, M.M. 1985, "Improvement of the performance of solar energy or waste heat utilization systems by using phase-change slurry as
Analysis of microencapsulated phase change material slurries and phase change material emulsions as heat transfer fluid and thermal storage material
238
an enhanced heat-transfer storage fluid", Journal of Solar Energy
Engineering, vol. 107, no. 3, pp. 229-237.
Kays, W.M. 1955, "Numerical Solutions for Laminar-Flow Heat Transfer in Circular Tubes", Transactions of the ASME, vol. 77, pp. 1265-1274.
Kousksou, T., Bédécarrats, J.-., Dumas, J.-. & Mimet, A. 2005, "Dynamic modelling of the storage of an encapsulated ice tank", Applied Thermal
Engineering, vol. 25, no. 10, pp. 1534-1548.
Kuravi, S., Kota, K.M., Du, J. & Chow, L.C. 2009, "Numerical Investigation of Flow and Heat Transfer Performance of Nano-Encapsulated Phase Change Material Slurry in Microchannels", Journal of Heat Transfer-Transactions of
the ASME, vol. 131, no. 6, pp. 062901 (1-9).
Kürten, H., Raasch, J. & Rumpf, H. 1966, "Beschleunigung eines kugelförmigen Festoffteilchens im Strömungsfall konstanter Geschwindigkeit", Chemical
Engineering and Tecnology, vol. 38, no. 12, pp. 941-948.
Lázaro, A., Zalba, B., Bobi, M., Castellón, C. & Cabeza, L.F. 2006, "Experimental study on phase change materials and plastics compatibility", AIChE Journal, vol. 52, no. 2, pp. 804-808.
Lázaro, A., Günther, E., Mehling, H., Hiebler, S., Marín, J.M. & Zalba, B. 2006, “Verification of a T-history installation to measure enthalpy versus temperature curves of phase change materials”, vol. 17, pp. 2168-2174.
Lázaro, A. 2008, Almacenamiento térmico de energía mediante cambio de fase.
Aplicaciones en edificios: Caracterización del comportamiento de los
materiales e instalación de ensayos para prototipos de intercambio de calor
con aire, Ph.D. Thesis, Universidad de Zaragoza.
Li, W., Zhang, X., Wang, X. & Niu, J. 2007, "Preparation and characterization of microencapsulated phase change material with low remnant formaldehyde content", Materials Chemistry and Physics, vol. 106, no. 2-3, pp. 437-442.
Lorsch, H.G., Murali, K., Chandratre, K. & Cho, Y.I. 1997 b, "Improving thermal and flow properties of chilled water-Part 2: Facility Construction and Flow Tests", ASHRAE Transactions, vol. 103, no. 1, pp. 198-212.
Bibliographic references
239
Lorsch, H.G., Murali, K. & Cho, Y.I. 1997 a, "Improving thermal and flow properties of chilled water-Part 1: Material Selection and Instrument Calibration", ASHRAE Transactions, vol. 103, no. 1, pp. 188-197.
Lu, W. & Bai, F. 2004, "A new model for analyzing laminar forced convective enhanced heat transfer in latent functionally thermal fluid", Chinese Science
Bulletin, vol. 49, no. 14, pp. 1457-1463.
Lu, W. & Tassou, S.A. 2012, "Experimental study of the thermal characteristics of phase change slurries for active cooling", Applied Energy, vol. 91, no. 1, pp. 366-374.
Manlapaz, R.L. & Churchill, S.W. 1981, "Fully-developed laminar convection from a helical-coil", Chemical Engineering Communications, vol. 9, no. 1-6, pp. 185-200.
Manual of Handling and storage of polymer dispersions. BASF.
Medrano, M., Yilmaz, M.O., Nogués, M., Martorell, I., Roca, J. & Cabeza, L.F. 2009, "Experimental evaluation of commercial heat exchangers for use as PCM thermal storage systems", Applied Energy, vol. 86, no. 10, pp. 2047-2055.
Mehling, H. & Cabeza, L.F. 2008, Heat and cold storage with PCM. An up to date introduction into basics and applications, Springer, Heat and Mass
Transfer.
Monllor Pérez, P. 2007, Caracterización de microencapsulados aplicados sobre materiales textiles, Ph.D. thesis. Universidad Politécnica de Valencia.
Moreno Botella, R. 2006, Curso de Reología Aplicada. Viscoelasticidad, 23-24 Febrero 2006, Universidad de Zaragoza
Mukhametzyanov, G.K., Usmanov, A.G. & Tarzimanov, A.A. 1963, "Determinations of the thermal conductivity of liquid saturated hydrocarbons", Izv. Vyssh. Ucheb. Zaved. Neft. Gaz, vol. 6, no. 9, pp. 75-79.
Nagano, K., Ogawa, K., Mochida, T., Hayashi, K. & Ogoshi, H. 2004, "Performance of heat charge/discharge of magnesium nitrate hexahydrate and magnesium chloride hexahydrate mixture to a single vertical tube for a
Analysis of microencapsulated phase change material slurries and phase change material emulsions as heat transfer fluid and thermal storage material
240
latent heat storage system", Applied Thermal Engineering, vol. 24, no. 2–3, pp. 209-220.
Naphon, P. & Wongwises, S. 2006, "A review of flow and heat transfer characteristics in curved tubes", Renewable and Sustainable Energy
Reviews, vol. 10, no. 5, pp. 463-490.
Oró, E., Miró, L., Barreneche, C., Martorell, I., Farid, M.M. & Cabeza, L.F. 2012 a, "Corrosion of metal and polymer containers for use in PCM cold storage", Applied Energy, In Press, Corrected Proof.
Oró, E., Gil, A., Miró, L., Peiró, G., Álvarez, S. & Cabeza, L.F. 2012 b, "Thermal Energy Storage Implementation Using Phase Change Materials for Solar Cooling and Refrigeration Applications", Energy Procedia, vol. 30, pp. 947-956.
Otero, E. 1997, “Corrosión y degradación de materiales”, Editorial Síntesis.
Parker, W., Jenkings, R.J., Butler, C.P. & Abbot, G.L. 1961, "Flash Method of Determining Thermal Diffusivity, Heat Capacity, and Thermal Conductivity", Journal of Applied Physics, vol. 32, no. 9, pp. 1679-1684.
Perry, R.H. & Green, D.W. 1997, Perry’s Chemical Engineers’ Handbook, Mc Graw Hill.
Pimenta, T.A. & Campos, J.B.L.M. 2012, "Friction losses of Newtonian and non-Newtonian fluids flowing in laminar regime in a helical coil", Experimental
Thermal and Fluid Science, vol. 36, pp. 194-204.
Pollerberg, C. & Dötsch, C. 2006, "Phase Changing Slurries in cooling and cold supply networks", 10th International Symposium on Disctrict Heating and Cooling, 3-5 September, 2006, Hannover (Germany).
Porisini, F.C. 1988, "Salt hydrates used for latent heat storage: Corrosion of metals and reliability of thermal performance", Solar Energy, vol. 41, no. 2, pp. 193-197.
Rady, M. 2009, "Thermal performance of packed bed thermal energy storage units using multiple granular phase change composites", Applied Energy,
vol. 86, no. 12, pp. 2704-2720.
Bibliographic references
241
Rao, Y., Dammel, F., Stephan, P. & Lin, G. 2007, "Convective heat transfer characteristics of microencapsulated phase change material suspensions in minichannels", Heat and Mass Transfer, vol. Volume 44, no. 2, pp. 175-186.
Rao, Y., Dammel, F., Stephan, P. & Lin, G. 2006, "Flow frictional characteristics of microencapsulated phase change material suspensions flowing through rectangular minichannels", Science in China, vol. 49, no. 4, pp. 445-456.
Rieger, H., Projahn, U., Bareiss, M. & Beer, H. 1983, "Heat transfer during melting inside a horizontal tube", Journal of Heat Transfer, vol. 105, no. 2, pp. 226-234.
Rogers, G.F. & Mayhew, Y.R. 1964, "Heat transfer and pressure loss in helically coiled tubes with turbulent flow", International Journal of Heat and Mass
Transfer, vol. 7, no. 11, pp. 1207-1216.
Roy, S.K. & Avanic, B.L. 1997, "Laminar forced convection heat transfer with phase change material emulsions", International Communications in Heat
and Mass Transfer, vol. 24, no. 5, pp. 653-662.
Roy, S.K. & Avanic, B.L. 2001 a, "Laminar forced convection heat transfer with phase change material suspensions", International Communications in Heat
and Mass Transfer, vol. 28, no. 7, pp. 895-904.
Roy, S.K. & Avanic, B.L. 2001 b, "Turbulent heat transfer with phase change material suspensions", International Journal of Heat and Mass Transfer,
vol. 44, no. 12, pp. 2277-2285.
Royon, L., Perrot, P., Guiffant, G. & Fraoua, S. 1998, "Physical properties and thermorheological behaviour of a dispersion having cold latent heat-storage material", Energy Conversion and Management, vol. 39, no. 15, pp. 1529-1535.
Royon, L. & Guiffant, G. 2008, "Forced convection heat transfer with slurry of phase change material in circular ducts: A phenomenological approach", Energy Conversion and Management, vol. 49, no. 5, pp. 928-932.
Sabbah, R., Farid, M.M. & Al-Hallaj, S. 2009, "Micro-channel heat sink with slurry of water with micro-encapsulated phase change material: 3D-
Analysis of microencapsulated phase change material slurries and phase change material emulsions as heat transfer fluid and thermal storage material
242
numerical study", Applied Thermal Engineering, vol. 29, no. 2-3, pp. 445-454.
Salaün, F., Devaux, E., Bourbigot, S. & Rumeau, P. 2008, "Development of a precipitation method intended for the entrapment of hydrated salt", Carbohydrate Polymers, vol. 73, no. 2, pp. 231-240.
Sarı, A., Alkan, C., Karaipekli, A. & Uzun, O. 2009, "Microencapsulated n-octacosane as phase change material for thermal energy storage", Solar
Energy, vol. 83, no. 10, pp. 1757-1763.
Schalbart, P., Kawaji, M. & Fumoto, K. 2010, "Formation of tetradecane nanoemulsion by low-energy emulsification methods", International Journal
of Refrigeration, vol. 33, no. 8, pp. 1612-1624.
Schmidt, E.F. 1967, "Wärmeübergang und Druckverlust in Rohrschbugen", Chemie Ingenieur Technik, vol. 39, no. 13, pp. 781-789.
Schmidt, M. 2008, "Phase Change Materials-latent heat storage for interior climate control. BASF Micronal" Energiforum Danmark.
Seban, R.A. & McLaughlin, E.F. 1963, "Heat transfer in tube coils with laminar and turbulent flow", International Journal of Heat and Mass Transfer, vol. 6, no. 5, pp. 387-395.
Shibutani, S. 2002, "PCM-micro Capsule Slurry Thermal Storage System for Cooling in Narita Airport", Proceedings of 3rd Experts meeting and Workshop of IEA Annex 17, Tokyo (Japan).
Sparrow, E.M., Schmidt, R.R. & Ramsey, J.W. 1978, "Experiments on the Role of Natural Convection in the Melting of Solids", Journal of Heat Transfer,
vol. 100, no. 1, pp. 11-16.
Streicher, W., Cabeza, L.F. & Heinz, A. 2005, Inventory of Phase Change Materials. A report of IEA Solar Heating and Cooling programme –Task 32 “Advanced storage concepts for solar and low energy buildings” Report C2 of Subtask C.
Su, J., Huang, Z. & Ren, L. 2007 a, "High compact melamine-formaldehyde microPCMs containing n-octadecane fabricated by a two-step coacervation
Bibliographic references
243
method", Colloid & Polymer Science, vol. Volume 285, no. 14, pp. 1581-1591.
Su, J., Ren, L. & Wang, L. 2005, "Preparation and mechanical properties of thermal energy storage microcapsules", Colloid & Polymer Science, vol. 284, no. 2, pp. 224-228.
Su, J., Wang, L. & Ren, L. 2007 b, "Synthesis of polyurethane microPCMs containing n-octadecane by interfacial polycondensation: Influence of styrene-maleic anhydride as a surfactant", Colloids and Surfaces A:
Physicochemical and Engineering Aspects, vol. 299, no. 1-3, pp. 268-275.
Sug Lee, J. & Ogawa, K. 1974, "Pressure drop through packed beds", Journal
of Chemical Engineering of Japan, vol. 27, no. 5, pp. 691-693.
TA Instruments 2011, Seminario de Reología y Viscoelasticidad, 7-8 Junio, Madrid.
Tadros, T. 2004, "Application of rheology for assessment and prediction of the long-term physical stability of emulsions", Advances in Colloid and Interface
Science, vol. 108-109, pp. 227-258.
Tallmadge, J.A. 1970, "Packed bed pressure drop-an extension to higher Reynolds numbers", AIChE Journal, vol. 16, no. 6, pp. 1092-1093.
Tipvarakarnkoon, T., Blochwitz, R. & Senge, B. 2008, "Rheological properties and phase change behaviors of coconut fats and oils", Annual Transactions of the Nordic Rheology Society vol. 16.
Trp, A., Lenic, K. & Frankovic, B. 2006, "Analysis of the influence of operating conditions and geometric parameters on heat transfer in water-paraffin shell-and-tube latent thermal energy storage unit", Applied Thermal
Engineering, vol. 26, no. 16, pp. 1830-1839.
Tumuluri, K., Alvarado, J.L., Taherian, H. & Marsh, C. 2011, “Thermal performance of a novel heat transfer fluid containing multiwalled carbon nanotubes and microencapsulated phase change materials”, International Journal of Heat and Mass Transfer, vol. 54, pp. 5554-5567.
Wakao, N. & Funazkri, T. 1978, "Effect of fluid dispersion coefficients on particle-to-fluid mass transfer coefficients in packed beds: Correlation of
Analysis of microencapsulated phase change material slurries and phase change material emulsions as heat transfer fluid and thermal storage material
244
sherwood numbers", Chemical Engineering Science, vol. 33, no. 10, pp. 1375-1384.
Wang, X. & Niu, J. 2009, "Performance of cooled-ceiling operating with MPCM slurry", Energy Conversion and Management, vol. 50, no. 3, pp. 583-591.
Wang, X., Niu, J., Li, Y., Wang, X., Chen, B., Zeng, R., Song, Q. & Zhang, Y. 2007, "Flow and heat transfer behaviors of phase change material slurries in a horizontal circular tube", International Journal of Heat and Mass
Transfer, vol. 50, no. 13-14, pp. 2480-2491.
Wei, J., Kawaguchi, Y., Hirano, S. & Takeuchi, H. 2005, "Study on a PCM heat storage system for rapid heat supply", Applied Thermal Engineering, vol. 25, no. 17–18, pp. 2903-2920.
White, C.M. 1929, "Streamline flow through curved pipes", Proceedings of the
Royal Society A: Mathematical, physical & Engineering Sciences, vol. 123, pp. 645-663.
World Energy Outlook 2012. International Energy Agency. Executive Summary.
Wu, S. & Fang, G. 2011, "Dynamic performances of solar heat storage system with packed bed using myristic acid as phase change material", Energy and
Buildings, vol. 43, no. 5, pp. 1091-1096.
Xing, K.Q., Tao, Y.X. & Hao, Y.L. 2005, "Performance evaluation of liquid flow with PCM particles in microchannels", Journal of heat transfer, vol. 127, no. 8, pp. 931-940.
Xuan, Y., Huang, Y. & Li, Q. 2009, "Experimental investigation on thermal conductivity and specific heat capacity of magnetic microencapsulated phase change material suspension", Chemical Physics Letters, vol. 479, no. 4-6, pp. 264-269.
Yamagishi, Y., Sugeno, T., Ishige, T., Takeuchi, H. & Pyatenko, T. 1996, "An evaluation of microencapsulated PCM for use in cold energy transportation medium", Energy Conversion Engineering Intersociety Conference-IECEC, vol. 3, pp. 2077-2083.
Bibliographic references
245
Yamagishi, Y., Takeuchi, H., Pyatenko, A.T. & Kayukawa, N. 1999, “Characteristics of Microencapsulated PCM Slurry as a Heat-Transfer Fluid”, AICHe Journal, vol. 45, no. 4, pp. 696-707
Yang, R., Xu, H. & Zhang, Y. 2003, "Preparation, physical property and thermal physical property of phase change microcapsule slurry and phase change emulsion", Solar Energy Materials and Solar Cells, vol. 80, no. 4, pp. 405-416.
Zeng, R., Wang, X., Chen, B., Zhang, Y., Niu, J., Wang, X. & Di, H. 2009, "Heat transfer characteristics of microencapsulated phase change material slurry in laminar flow under constant heat flux", Applied Energy, vol. 86, no. 12, pp. 2661-2670.
Zhang, Y. & Faghri, A. 1995, "Analysis of forced convection heat transfer in microencapsulated phase change material suspensions", Journal of
Thermophysics and Heat Transfer, vol. 9, no. 4, pp. 727-732.
Zhang, G.H. & Zhao, C.Y. 2011, "Thermal and rheological properties of microencapsulated phase change materials", Renewable Energy, vol. 36, no. 11, pp. 2959-2966.
Zhang, P., Ma, Z.W. & Wang, R.Z. 2010, "An overview of phase change material slurries: MPCS and CHS", Renewable and Sustainable Energy
Reviews, vol. 14, no. 2, pp. 598-614.
Zhang, X.X., Fan, Y.F., Tao, X.M. & Yick, K.L. 2004 a, "Fabrication and properties of microcapsules and nanocapsules containing n-octadecane", Materials Chemistry and Physics, vol. 88, no. 2-3, pp. 300-307.
Zhang, X., Fan, Y., Tao, X. & Yick, K. 2005, "Crystallization and prevention of supercooling of microencapsulated n-alkanes", Journal of colloid and
interface science, vol. 281, no. 2, pp. 299-306.
Zhang, X., Xiao-Ming, T., Kit-Lun, Y. & Xue-Chen, W. 2004 b, "Structure and thermal stability of microencapsulated phase-change materials", Colloid &
Polymer Science, vol. 282, no. 4, pp. 330-336.
Zhang, Y., Jiang, Y. & Jiang, Y. 1999, “A simple method, the T-history method, of determining the heat of fusion, specific heat and thermal conductivity of
Analysis of microencapsulated phase change material slurries and phase change material emulsions as heat transfer fluid and thermal storage material
246
phase-change materials”, Measurement Science and Technology, vol. 10, pp. 201-205.
Zhao, Z., Hao, R. & Shi, Y. 2008, "Parametric analysis of enhanced heat transfer for laminar flow of microencapsulated phase change suspension in a circular tube with constant wall temperature", Heat Transfer Engineering,
vol. 29, no. 1, pp. 97-106.
Zou, D., Feng, Z., Xiao, R., Qin, K., Zhang, J., Song, W. & Tu, Q. 2010, "Preparation and flow characteristic of a novel phase change fluid for latent heat transfer", Solar Energy Materials and Solar Cells, vol. 94, no. 12, pp. 2292-2297.
Web sites
Climator (fecha de acceso 8 de marzo de 2013) http://www.climator.com/en/home/ COST Action TU0802 (fecha de acceso 8 de marzo de 2013) http://www.cost.eu/domains_actions/tud/Actions/TU0802 EPS-Environmental Process Systems LTD (fecha de acceso 8 de marzo de 2013) http://www.epsltd.co.uk/pcm.htm
Eurostat. European Commission. Energy production and imports (fecha de acceso 8 de marzo de 2013) http://epp.eurostat.ec.europa.eu/statistics_explained/index.php/Energy_production_and_imports IEA Task Annex 42 24 (fecha de acceso 8 de marzo de 2013) http://task42.iea-shc.org/ Microcápsulas de Microtek Laboratories (fecha de acesso 8 de marzo de 2013) http://www.microteklabs.com/micropcm.html
Micronal PCM website (fecha de acceso 8 de marzo de 2013) http://www.micronal.de/portal/basf/ien/dt.jsp?setCursor=1_290798
National Institute of Standards and Technology website (fecha de acceso 8 de marzo de 2013)

Bibliographic references
247
http://www.nist.gov/index.html Producto Thermusol de Salca BV (fecha de acesso 8 de marzo de 2013) http://www.microteklabs.com/micropcm.html
Rubitherm (fecha de acceso 8 de marzo de 2013) http://www.rubitherm.de/english/index.htm
Sasol Company-Parafol paraffins (fecha de acceso 8 de marzo de 2013) http://www.sasoltechdata.com/MarketingBrochures/PARAFOL.pdf

Analysis of microencapsulated phase change material slurries and phase change material emulsions as heat transfer fluid and thermal storage material
248
APPENDIX I. Handling and storage of PCM slurries
249
APPENDIX I. Handling and storage of PCM dispersions

Analysis of microencapsulated phase change material slurries and phase change material emulsions as heat transfer fluid and thermal storage material
250
APPENDIX I. Handling and storage of PCM slurries
251
The manufacturer of the microencapsulated PCM slurries analyzed in the framework of this thesis provided a manual with recommendations about the handling and storage of these kinds of dispersions. The main recommendations are explained below.
-The storage tanks must be made of corrosion-resistant and easy to clean materials for which disinfection tasks should be possible. All the components of the installation must also be made of corrosion resistant materials. Ferrite blends, copper, brass or bronze can cause galvanic corrosion. Heavy metals soluble in water can also affect the stability of the slurry. Agglomerates can be formed, causing local coagulation phenomena. The use of stainless steel S32100 is recommended. When this material is used, it must be guaranteed that all the welded joints are passivated with acid. Where corrosion products appear, unfavorable changes can originate in the product stored in the tank, such as discoloration and local coagulation phenomena.
The use of glass fiber reinforced polyester tanks is also recommended. The advantage is the transparency of the material so that the contents of the tank can be observed. The disadvantage in comparison to stainless steel is that the surface, less soft than that of the stainless steel, quickly becomes covered with deposits of the dispersion. Besides, the water pressure for cleaning glass fiber reinforced polyester tanks is lower and this complicates effective cleaning and disinfection.
-If the product is stored during a long period of time without circulation, the solids in suspension can gradually become creamed. In these cases, the manufacturer recommends installing a low-speed stirrer (with a rotation velocity at the end point of the blade lower than 1 m/s). The stirrer should be placed far from the center of the tank to prevent the formation of a vortex which can cause air to be trapped. Another possibility is to recirculate the dispersion through a bypass.
-The inappropriate handling and storage of these dispersions can cause changes in their properties. Among the possible phenomena, the manufacturer cites the possible increase of the dispersion concentration due to water evaporation which can cause PCM agglomeration and the formation of a PCM film on the dispersion surface. As the dispersion in question is polymeric, and polymers are generally very resistant to water, the film can not be re-emulsified. The film tends to precipitate to the bottom of the tank, and a new film is formed on the dispersion surface. This affects the operation and causes product waste.
Analysis of microencapsulated phase change material slurries and phase change material emulsions as heat transfer fluid and thermal storage material
252
-The dispersions can also become dry if they are exposed to too much heat. Foam can also be formed when filling the tank and this can subsequently dry the suspension. Pieces of this dry foam tend to float on the dispersion surface or to precipitate to the bottom of the tank. Small particles can appear as specks or spots in the product. To avoid these problems, tanks must be isolated from the surrounding air and ventilated with humid air.
-Dispersions can undergo a reduction in viscosity and coagulate if they are subjected to too high shear rates when they are stirred, transported and pumped. For this reason, the tube diameters and the speed of the pumps and stirrers must be selected so that the shear rate is kept to a minimum.
-Tanks must be installed in interior locations to avoid freezing. Also, dispersion stability decreases when the temperature increases, reducing the useful life of the polymeric capsule (the temperature should not exceed 35ºC).
-These dispersions can also undergo microbial attacks, which can cause bad odours, discoloration, flocculation and changes in the viscosity and pH that make the product unsuitable for various applications. It is essential to carry out a bacteria count to verify if there has been a microbial attack. As these products consist of the dispersion of particles in an aqueous phase, microorganisms can be multiplied in this phase. To prevent this microorganism proliferation, biocides should be added to the dispersions. The biocide dosage at manufacture is selected so that microbial infection is avoided during a period of at least six months. Too high storage temperatures (above 40ºC) can cause biocides to decompose and fail to fulfill their function. Wastes and old contaminated products in the tank, tubes or pumps can cause microbial contamination. In the case of bacterial contamination, hydrogen sulfide is produced which in turn causes the biocide to decompose in a short period of time.
-In relation to the materials of the tube system through which these slurries are pumped, the manufacturers recommend the use of stainless steel S32100, polyethylene and rigid PVC. Copper and copper alloys are not suitable; neither are normal steel nor tubes galvanized inside. Long tubes and sharp bends should be avoided since the rise in the pressure drop could cause particles to be deposited.
-Filters should be installed to eliminate the small deposits of particles which are formed. A stainless steel or polyamide mesh of 0.5 mm is sufficient.

APPENDIX I. Handling and storage of PCM slurries
253
Angle seat valves, ball valves or butterfly valves are suitable for use in the installations. All the surfaces of the components that are in contact with the dispersions must be made of stainless steel or plastic. Aluminum, iron and non-ferrous metals (copper, brass, etc.) are not suitable. All the joints should be free of asbestos and rubber.
-High pressure cleaning with water is advised, although this method can only be used in the case of stainless steel tanks. If deposits of the product remain after high pressure cleaning with water, these should be eliminated by scrubbing with stainless steel brushes and the tank should then be disinfected with biocides.

Analysis of microencapsulated phase change material slurries and phase change material emulsions as heat transfer fluid and thermal storage material
254
APPENDIX II. Technical specifications of the equipments and calibration certificates
255
APPENDIX II. Technical specifications of the equipments and calibration certificates

Analysis of microencapsulated phase change material slurries and phase change material emulsions as heat transfer fluids and thermal storage material
256
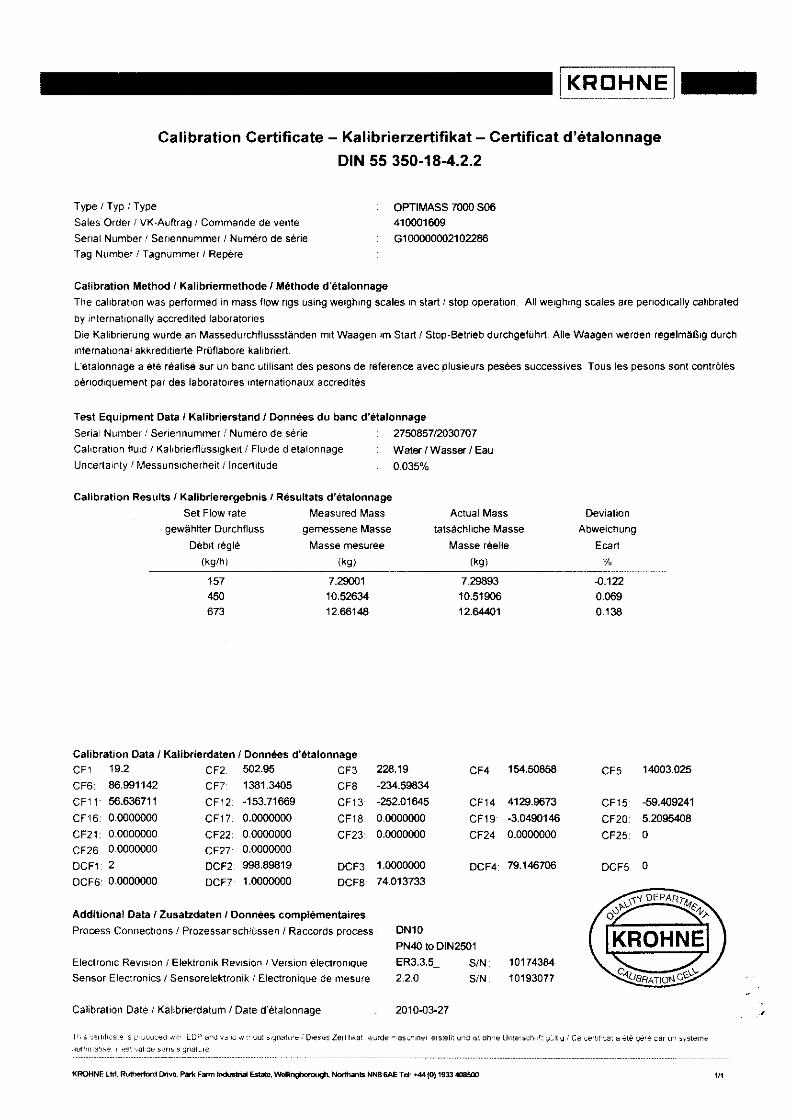
KROHNE
Ca libration Certifi cate - Kalibrier¿ertifikat - Certificat d'éta lonnage
DIN 55 350-18-4.2.2
Type r f yp /Type
Sales Order / VK-A!ftrág / Comñande de venle
Senal Number / Senennumrner / N!méro de sérieTag Nr¡mber / fagnur¡¡mer i ReÉÉre
OPTIMASS TOOO 506410001609c 1 000000021 022m
27ú857t203o707Water/Wasser/Eau0.035%
Cal¡brat¡on Method / Kalibr¡ermethode / Méthod€ d étalonnage
The calrbrahon was perto¡med In mass flow rgs us¡ng werghrng scales |n start / stop operatron All we€hrng sc€¡es are pe¡rodically calrbrated
by l¡ lernationai ly accredited laboratories
Die Kallbrierung wurde an lV!assedurchflussstánde¡ mrl Waagen im Start / Slop-Belrieb durchgefuhd Alle Waagen werden regelmáBrg durch
¡nternal¡on¿l akkredrtene Prüflabofe kalrbriert.
L étalonnage a elé réalisé sur un banc utilisanl des pesons de référence avec plusaeura pesées success¡ves Tous les pesoñs sont contrólés
eéaod|quement par d6s laboratgrres Internatronaux accredrtés
Test Equipment Oata / Kalibr¡erstand / Données du banc d'étalonnage
Serial Number / Serien nummer ,/ ñuméro de sérieCaIbratron flurd / KaIbrierflüssrgkert / Flurde d élalonnagelJncerlarnly 1 Messunsrcherheit / Incerlitude
Calibrat ion Results / Kal¡brierergebnis / Résultats d étalonnage
Set Flow rategewáhtter Ourchfluss
(kg/h)
Measured Massgernessene Masse
Masse mesurée(ks)
ActualMass
tatsáchliche Masse
lflasse réelle
(Kg)
Deviel¡on
Abwe¡chuñg
Ec€ rt
%
1574.50
4.1220.0690.138
723001'10.52634
12.€614€
7.2989310.5190612.64401
Cal¡brat¡on Oata / Kal¡b.ierdaten / Données d'étalonnageCF1 19.2CF6: 86.991142cF11 56.636711CF15: 0.0000000CF21: 0.0000000CF26 0.0000000DCFI 2DCF6 0.0000000
cF2 502.95cF7 1381.3405
cF12 -153.71669
CF17: 0.0000000CF22: 0.0000000cF27 0.0000000
DCF2 998.89819
DCFT 1.0000000
CF3 2m.19cF8 -2u.5B€34
cF13 -252.01645
cF18 0.0000000CF23: 0.0000000
DCF3 1.0000000DCFg 74.013733
CF4 154.50858
cF14 418.9673cF19 -3.0490146
cF24 0.0000000
DCF4 79.1,16706
DNlOPN.lo to D|N25O1ER3.3.5_ s/N: 101743842.2.0 S/N: 10193077
201043-27
CF5 1¡1003.025
CF 1 5 59.,10924'1cF20 5.m93|08CF25: 0
DCFs O
Additional Oata / Zusahdaten / Données complémentairesProcéss Connecirons / Prozessanschlüssen / Raccords process
Eleclronrc Revisroñ / Elektronrk Revtsion / Version électron¡qleSensor Electronics / Sensorelektronik / Electronioue de mesure
Calibrat ion Date / Ka|br¡erdatum / Date d ételonnaoe
¡ rd . r r j1 r . , es i ! ¡ l Je ! ! ¡s s r .á l - . re
KRONNE Lrrl Rurhdlúd ttrv.. Pr* Fñ h.rdfir €s*, ur!¡rñgavq¡g}! ¡¡d0'¡b tJr¡85a8 f¡t. +.¡,tlo) 193 rr)ale

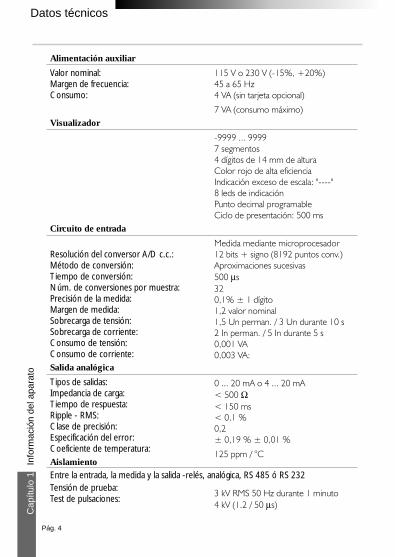
Entre la entrada, la medida y la salida -relés, analógica, RS 485 ó RS 232
Datos técnicos
Pág. 4
Info
rma
ció
n d
el a
pa
rato
Ca
pítu
lo 1
Alimentación auxiliar
Valor nominal:Margen de frecuencia:Consumo:
Visualizador
Resolución del conversor A/D c.c.:Método de conversión:Tiempo de conversión:Núm. de conversiones por muestra:Precisión de la medida:Margen de medida:Sobrecarga de tensión:Sobrecarga de corriente:Consumo de tensión:Consumo de corriente:
Aislamiento
Tensión de prueba:Test de pulsaciones:
-9999 ... 99997 segmentos4 dígitos de 14 mm de alturaColor rojoIndicación exceso de escala: "----"8 leds de indicaciónPunto decimal programableCiclo de presentación: 500 ms
-9999 ... 9999
Circuito de entrada
Salida analógica
Tipos de salidas:Impedancia de carga:Tiempo de respuesta:Ripple - RMS:Clase de precisión:Especificación del error:Coeficiente de temperatura:
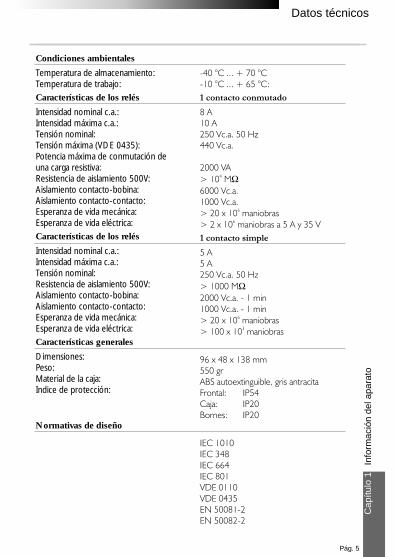
Condiciones ambientales
Características generales
Normativas de diseño
Temperatura de almacenamiento:Temperatura de trabajo:
Características de los relés
Intensidad nominal c.a.:Intensidad máxima c.a.:Tensión nominal:Tensión máxima (VDE 0435):Potencia máxima de conmutación de una carga resistiva:Resistencia de aislamiento 500V:Aislamiento contacto-bobina:Aislamiento contacto-contacto:Esperanza de vida mecánica:Esperanza de vida eléctrica:
Características de los relés
Intensidad nominal c.a.:Intensidad máxima c.a.:Tensión nominal:Resistencia de aislamiento 500V:Aislamiento contacto-bobina:Aislamiento contacto-contacto:Esperanza de vida mecánica:Esperanza de vida eléctrica:
Dimensiones:Peso:Material de la caja:Indice de protección:
:
D
Datos técnicos
Pág. 5
Info
rma
ció
n d
el a
pa
rato
Ca
pítu
lo 1
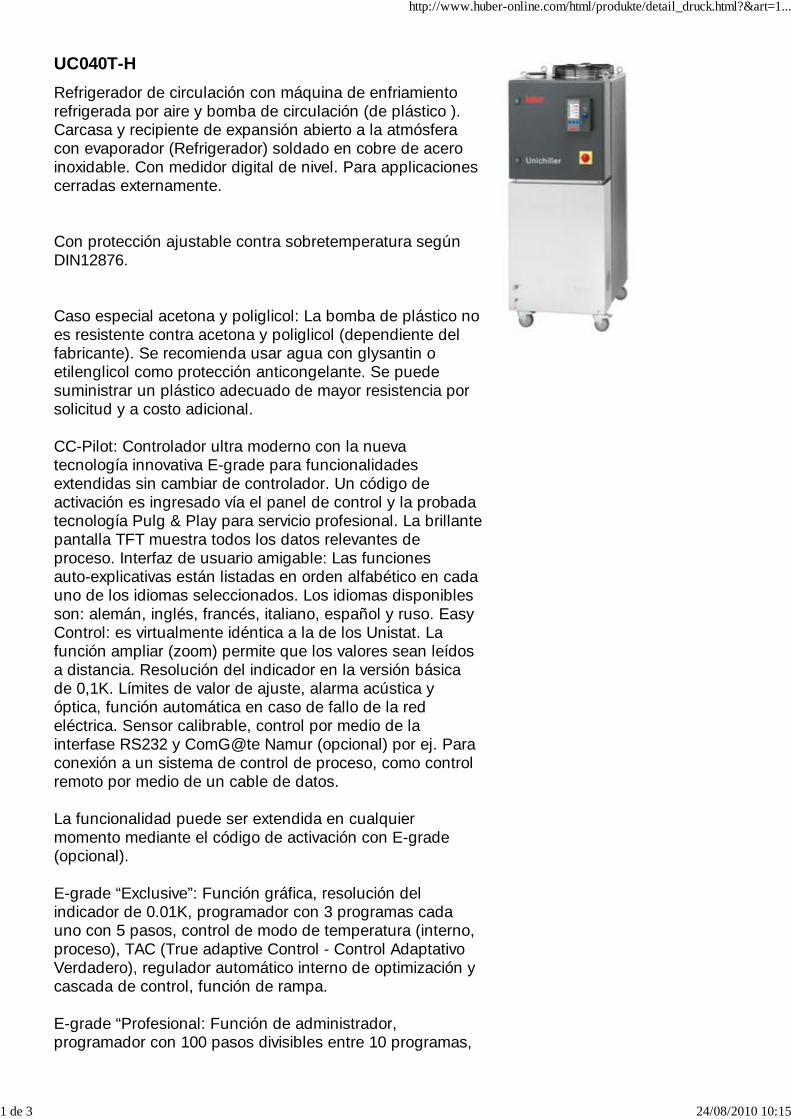
UC040T-H
Refrigerador de circulación con máquina de enfriamientorefrigerada por aire y bomba de circulación (de plástico ).Carcasa y recipiente de expansión abierto a la atmósferacon evaporador (Refrigerador) soldado en cobre de aceroinoxidable. Con medidor digital de nivel. Para applicacionescerradas externamente.
Con protección ajustable contra sobretemperatura segúnDIN12876.
Caso especial acetona y poliglicol: La bomba de plástico noes resistente contra acetona y poliglicol (dependiente delfabricante). Se recomienda usar agua con glysantin oetilenglicol como protección anticongelante. Se puedesuministrar un plástico adecuado de mayor resistencia porsolicitud y a costo adicional.
CC-Pilot: Controlador ultra moderno con la nuevatecnología innovativa E-grade para funcionalidadesextendidas sin cambiar de controlador. Un código deactivación es ingresado vía el panel de control y la probadatecnología Pulg & Play para servicio profesional. La brillantepantalla TFT muestra todos los datos relevantes deproceso. Interfaz de usuario amigable: Las funcionesauto-explicativas están listadas en orden alfabético en cadauno de los idiomas seleccionados. Los idiomas disponiblesson: alemán, inglés, francés, italiano, español y ruso. EasyControl: es virtualmente idéntica a la de los Unistat. Lafunción ampliar (zoom) permite que los valores sean leídosa distancia. Resolución del indicador en la versión básicade 0,1K. Límites de valor de ajuste, alarma acústica yóptica, función automática en caso de fallo de la redeléctrica. Sensor calibrable, control por medio de lainterfase RS232 y ComG@te Namur (opcional) por ej. Paraconexión a un sistema de control de proceso, como controlremoto por medio de un cable de datos.
La funcionalidad puede ser extendida en cualquiermomento mediante el código de activación con E-grade(opcional).
E-grade “Exclusive”: Función gráfica, resolución delindicador de 0.01K, programador con 3 programas cadauno con 5 pasos, control de modo de temperatura (interno,proceso), TAC (True adaptive Control - Control AdaptativoVerdadero), regulador automático interno de optimización ycascada de control, función de rampa.
E-grade “Profesional: Función de administrador,programador con 100 pasos divisibles entre 10 programas,
http://www.huber-online.com/html/produkte/detail_druck.html?&art=1...
1 de 3 24/08/2010 10:15
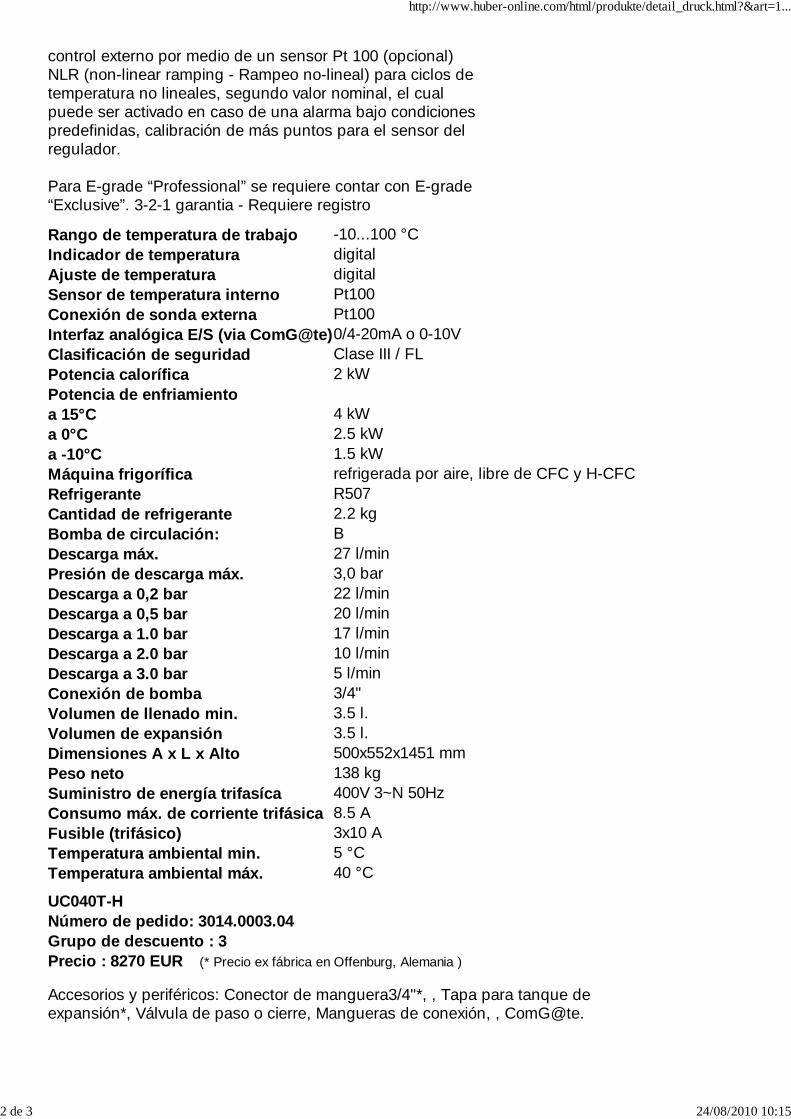
Rango de temperatura de trabajo -10...100 °C
Indicador de temperatura digital
Ajuste de temperatura digital
Sensor de temperatura interno Pt100
Conexión de sonda externa Pt100
Interfaz analógica E/S (via ComG@te)0/4-20mA o 0-10V
Clasificación de seguridad Clase III / FL
Potencia calorífica 2 kW
Potencia de enfriamiento
a 15°C 4 kW
a 0°C 2.5 kW
a -10°C 1.5 kW
Máquina frigorífica refrigerada por aire, libre de CFC y H-CFC
Refrigerante R507
Cantidad de refrigerante 2.2 kg
Bomba de circulación: B
Descarga máx. 27 l/min
Presión de descarga máx. 3,0 bar
Descarga a 0,2 bar 22 l/min
Descarga a 0,5 bar 20 l/min
Descarga a 1.0 bar 17 l/min
Descarga a 2.0 bar 10 l/min
Descarga a 3.0 bar 5 l/min
Conexión de bomba 3/4"
Volumen de llenado min. 3.5 l.
Volumen de expansión 3.5 l.
Dimensiones A x L x Alto 500x552x1451 mm
Peso neto 138 kg
Suministro de energía trifasíca 400V 3~N 50Hz
Consumo máx. de corriente trifásica 8.5 A
Fusible (trifásico) 3x10 A
Temperatura ambiental min. 5 °C
Temperatura ambiental máx. 40 °C
control externo por medio de un sensor Pt 100 (opcional)NLR (non-linear ramping - Rampeo no-lineal) para ciclos detemperatura no lineales, segundo valor nominal, el cualpuede ser activado en caso de una alarma bajo condicionespredefinidas, calibración de más puntos para el sensor delregulador.
Para E-grade “Professional” se requiere contar con E-grade“Exclusive”. 3-2-1 garantia - Requiere registro
UC040T-HNúmero de pedido: 3014.0003.04Grupo de descuento : 3Precio : 8270 EUR (* Precio ex fábrica en Offenburg, Alemania )
Accesorios y periféricos: Conector de manguera3/4"*, , Tapa para tanque deexpansión*, Válvula de paso o cierre, Mangueras de conexión, , ComG@te.
http://www.huber-online.com/html/produkte/detail_druck.html?&art=1...
2 de 3 24/08/2010 10:15

* equipo estándarLecturas de salida válidas con temperatura ambiente de 20°C
Nos reservamos el derecho de cambios técnicos y de errores sin previo avisoÚltima actualización : 24-08-2010
http://www.huber-online.com/html/produkte/detail_druck.html?&art=1...
3 de 3 24/08/2010 10:15

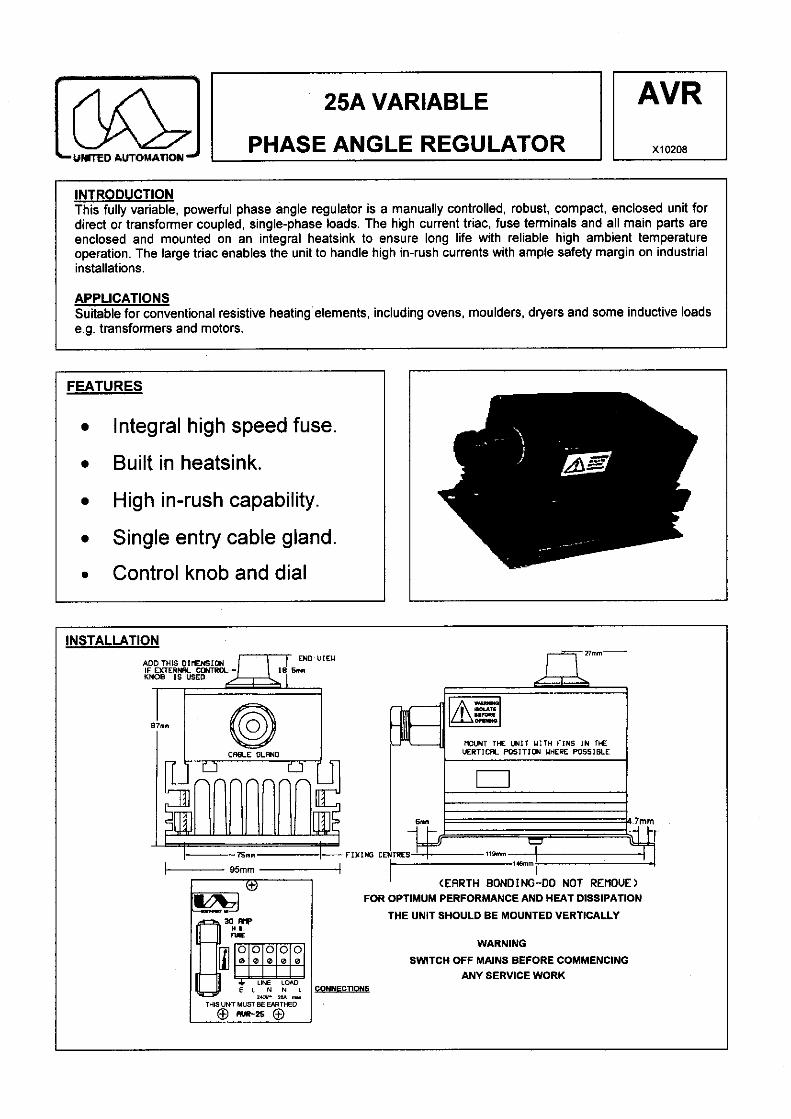
I e f f l l zsAvARTABLE l l AVRI=ortoto* ll -,.,,, I
INTRODUCTIONThis fully variable, powerful phase angle regulator is a manually conlrolled, robust, compact, enclosed unit ford¡rect or transformer coupled, s¡ngle-phase loads. The h¡gh current triac, fuse terminals and all main parls areenclosed and mounted on an integral heatsink to ensure long life with reliable high ambient temperatureoperation. The large triac enables the un¡t to handle h¡gh in-rush currents with ample safety margin on ¡nduslrialinstallations.
APPLICATIONSSu¡table for conventional resist¡ve heating elements, including ovens, moulders, dryers and some inductive loadse.g. transformers and motors.
FEAÍURES
o Integral high speed fuse.
. Built in heatsink.
. High in-rush capability.
. Single entry cable gland.
. Control knob and dial
INSTALLATION
WARNIÑG
SWTCH OFF MAINS BEFORE COMMENCINGANY SERVICE WORK
ñdJ¡¡T fHE UN¡f I¡]fH ¡IT¡S IN fl{r.|e¡tlcfu P05¡f¡t i¡ !r']aRE Poss¡BtE
(EBRTH BONDING-DO NOf RENOUE )FOR OPTIMUM PERFORMANCE AND HEAT DBSIPAfION
fHE UNIT SHOULD BE MOUNTED VERTICALLYml l lU
an-z¡ 6)
SPE!E!9AI!9N:Mains voltage
Min. Load currentMax. RMS currentMain control
Peak one cycle surgeHeats¡nkMax operating temp
110o r230Vac +1oo/o @ 50/60 Hz
200mA¿JA.
Integral 220K pot.
2504'l .3oCMatt0-650c
lsolationClassificationlsolation voltagel't for SCR fusingOffstate dv/dtReplacement Fuse
Storage temp.Max. Cable entryMin. Level set
Class l l
2500V rms250A2s500V/ us3OA 66OV SCRtype-20oC to +85oC2.5mm20-5070 via integratcenñet
\cót) ¿ ) i ) > \
FUSINGIt is recommended to use semiconductor (fast acting) type fuses or circu¡t breakers (Sem¡conductor -
MCB) for unit protection. Integral fuse included. (See SRA Datasheet for further information).
CE MARKINGfn¡s pro¿uct tamily carries a "CE marking". These phase angle controllers need a su¡table remote filter.For information see recommendation Section and contact our sales desk. (See Declaratioñ ofConformity)
RECOMMENDATIONOthér documents available on request, which may be appropriate for your applicat¡ons.
CODE IDENTIW DESCRIPTIONX1O229 RFI Filtering recommendations - address¡ng the EMC Directive
X10213 ITA Interact¡on, uses for phase angle and for burst fire control.
X10255 SRA Safety requirements - addressing the Low Voltage Directive (LVD)
including: - Thermal data/cooling; "L¡ve" parts warning & Earthing
requirements; Fus¡ng recommendat¡ons.
AP02l4 COS UAL Conditions of sale
NOIE lt is recommended that ¡nstallat¡on and maintenance of this equipment should be done withreference to cunent edition of the LE.E. w¡ring regulations (857671) by su¡tably qualified/trainedpersonnel. The regulations contain impoñant requirements regarding safety of electrical equiprñent.(For International standards refer to l.E.C d¡rect¡ve IEC 950).
ORDER CODE State pañ number AVR + (Mains supply voltage)Optional extras include F-series Filter.Nofej When ordering a filter, the current the AVR is to be used at will be required
UNITED AUTOMATION LIMITEDI Southport Bus¡ness Palk Tel: 00,{4 (0) 1704 - 516500 Ma¡nKew Tel: 0014 (0) '1704 - 5165f6 SalesSouthport, PR8 ,lHQ Fax 00,{4 (0} 1704 - 5'16501ENGLANO Enqu¡ry@un¡ted-autorñation.cortl
Page No. 2 ot 2 lssue 3 Date 2Ml99
C €
C./ Ca n’Alzamora, 34 - 36 08191 - Rubí - Barcelona - EspañaTel. 93 586 00 45 Fax 93 586 00 48www.electricfor.com [email protected] nº 62
RESISTENCIAS FLEXIBLES DE SILICONA + FIBRA DE VIDRIO DE Øext2’7 mm, GAMA FORMEC-FLEX
Aplicaciones usuales• Calefacción de tuberías de conducción y
depósitos, conteniendo fluidos pesados talescomo aceites combustibles, grasas, pinturas,ceras y otros productos químicos.
• Descongelación en cámaras: juntas, puertas,bandejas, tubos de desagüe, antivaho, vidrios, etc.
• Calentamiento de vasos para reactivos y aparatosde destilación.
• Protección contra la congelación en tuberías deconducción de agua y válvulas
• Para evitar la formación de condensaciones deagua en armarios de conexiones.
• Mantener a cierta temperatura tierras agrícolas apequeña escala.
• Instalaciones para calefacción del suelo en localesdestinados a albergar animales (granjas,cobertizos, etc.)
• Mallas calefactoras
Código Longituden mm
W/m Watiostotales
PesoEn Kg
PVSFF1 1000 17 16,5 0,006
PVSFF1,5 1500 15 22,5 0,012
PVSFF2 2000 17 33 0,018
PVSFF2,5 2500 15 37 0,024
PVSFF3 3000 15 46 0,030
PVSFF3,5 3500 14 50 0,036
PVSFF4 4000 14 57,5 0,042
PVSFF4,5 4500 14 64 0,048
PVSFF5 5000 14 71 0,054
PVSFF5,5 5500 14 77 0,060
PVSFF6 6000 15 92 0,066
PVSFF7 7000 15 105 0,078
PVSFF8 8000 15 122 0,090
PVSFF9 9000 16 140 0,10
PVSFF10 10000 17 170 0,11
PVSFF12 12000 15 184 0,13
Características generales• Diámetro aproximado para todas las longitudes 2,7 mm.• Funda flexible compuesta por capa de silicona + capa extra fibra de vidrio. La
aportación de la capa extra de fibra de vidrio confiere a la resistencia unmayor resistencia mecánica, disminuyendo los riesgos de rotura delelemento por roces o cortes sobre la silicona.
• Tolerancia general en longitud: ±1%
• Acabadas con borne tubular cobreado y cables conductores de silicona de150 mm de longitud.
• Temperatura máxima del elemento: 180 °C.• Tensión normalizada ~230 V• Bajo pedido otras longitudes, acabados y voltajes.
Código Longituden mm
W/m Watiostotales
PesoEn Kg
PPVSFF2 2000 10 20 0,011
PPVSFF2,5 2500 10 25 0,016
PPVSFF3 3000 10 30 0,022
PPVSFF3,5 3500 10 35 0,028
PPVSFF4 4000 10 40 0,034
PPVSFF4,5 4500 10 45 0,040
PPVSFF5 5000 10 50 0,046
PPVSFF5,5 5500 10 55 0,052
PPVSFF6 6000 10 60 0,058
PPVSFF8 8000 10 80 0,064
PPVSFF9 9000 10 90 0,070
PPVSFF10 10000 10 100 0,076
PPVSFF15 15000 10 150 0,12
Gama 10 W/m Gama 14 W/m a 17 W/m
Características generales• Diámetro aproximado para todas las longitudes 2,8
mm.
• Acabadas con borne tubular de acero inoxidable ycables conductores de fibra de vidrio y níquel de 250mm de longitud.
• Temperatura máxima del elemento: 350 °C.
• Tolerancia general en longitud: ±1%
• Tensión normalizada ~230 V.
• Bajo pedido otras longitudes, acabados y voltajes.
Código Longituden mm
W/m Watiostotales
PesoEn Kg
VFF1 1000 46 46 0,016
VFF1,5 1500 78 117 0,024
PVFF1,5 1500 20 30 0,024
VFF2 2000 44 88 0,032
VFF2,5 2500 144 360 0,040
PVFF2,5 2500 28 70 0,040
VFF3 3000 100 300 0,048
VFF3,5 3500 73 256 0,056
VFF4 4000 56 224 0,064
VFF4,5 4500 44 198 0,072
VFF5 5000 36 180 0,080
VFF5,5 5500 30 165 0,088
VFF6 6000 25 150 0,096
RESISTENCIAS FLEXIBLES FIBRA DE VIDRIO DE Øext2’8 mm, GAMA VFF
Los reptiles son animales de “sangre fría” que dependen del calor del medio ambiente para sobrevivir. Cadaespecie tiene sus necesidades particulares, y es un factor de carácter vital para la supervivencia de dichosanimales en cautiverio. El principal objetivo al acondicionar un terrario es el de responder a las necesidadesde los animales que van ha habitarlo, por eso debemos diseñar el equipamiento adecuado para satisfacer losrequerimientos de cada animal.Para obtener un gradiente térmico en el terrario, hay que crear una zona caliente y una zona fresca, para quepuedan regular su temperatura interna en función de sus necesidades mudándose de una zona a otra. Estose consigue poniendo el cable térmico sobre un tercio de la superficie del terrario.
PVSFF / PPVSFF GRUPO 4 - Resistencias flexibles4.6 - Resistencias de silicona + fibra de vidrio FORMEC-FLEX
Características generales• Aislamiento de silicona. Diámetro aproximado para
todas las longitudes Ø5 mm.• Capuchón vulcanizado Ø9x30mm en un extremo.
• Acabadas con clavija de conexión bipolar• Tensión normalizada ~230 V.• Bajo pedido otras longitudes, acabados y voltajes.
Dimensiones en mmCódigo
Long total Long Calefactora Zona inactivaVoltios Watios totales
CFR001 3260 2330 930 ~ 230 V 15
CFR002 4260 3330 930 ~ 230 V 25
CFR003 5860 4930 930 ~ 230 V 50
VFF GRUPO 4 - Resistencias flexibles4.7 - Resistencias de fibra de vidrio
CFR GRUPO 4 - Resistencias flexibles4.8 - Cable calefactor flexible para terrarios


DIFFERENTIAL PRESSURETRANSMITTERFor liquids and goses
O DIFFERENflAI PRESSURE WET /WET
a OUTPUT SIGNAI 4...20 mA / 2 wlRE
a PERMISSIBLE OVERPRESSURE: 4 X NOMINALPRESSURE ON EACH SIDE
a AccuRAcY ACC. TO IEC ó0770 0,5% FSO
. COMPACT DESIGN
. HIGH RESISTANCE AGAINST ELECIRICAI. FAUTTSINCORRECT WIRING, SHORI.CIRCUITOVERVOITAGE
. RUGGED AND REI.IABLE UNDER MOSTCONDITIONS
C (
The TPD-lE is diíerentiol pressure troñsmiller for universolindustriol usoge. Pressure con be opplied on boih sideswith fluids ond goses, which ore compolible with stoinlesssteel, L4571 or 1.44&l ond FKM.With pfessurizolion. the IPD-18 creoles the difference ofpressure belween the positive ond negolive side. whichthen is converted into o signollhol is propo¡iionol to thediferentiol pressure.
As co¡"ple'nenr. we monuloclüre o wrde ronqe ofmeosuring ond conlrol insiruments io use with the TPD-lEtronsmilters Th¡s instÍuments ore configuroble 4-20 mAinput copobil l ly.
a Coñtroliers 85-2000, LS-3000 ond HS-7000 Series
a Indicotors: BS-2000, tS-3000 ond HS-7000 Sedes
a Loop powered field hdicotorsPM-3ó50 ond PM-óó70
a Power supply devices 24 Vdc outpút, I AFAC'24l1000
a Doto ocqu sition ond conirol systemsDAS-8000 ond HS-7000
@ 127.59

TPo- l8 Differeñtiol pressure.0 - 0.02 to 0 - 1ó bor ronges.
- Speciolronges
Weight: oppr. 0.250 kg
Av. Frederic Rohoto,49 - 08032 BARCELONA (Spo n)Te (+34) 93 358 ó01I - Fox (+34) 93 357 ó85O
e-mo l:[email protected] - hito:/ /www desin com TPD-r8 llRMtrlesin-lnst,rurr:tenüst
É
3
=
!.i-t.!-
o=
, :-::-:-:.--
:--_-_: : .
l-=.\
. --:'.-
--l
\
APPENDIX III. Numerical models of simulation in EES of TES systems
271
APPENDIX III. Numerical models of simulation in EES of TES systems

Analysis of microencapsulated phase change material slurries and phase change material emulsions as heat transfer fluid and thermal storage material
272
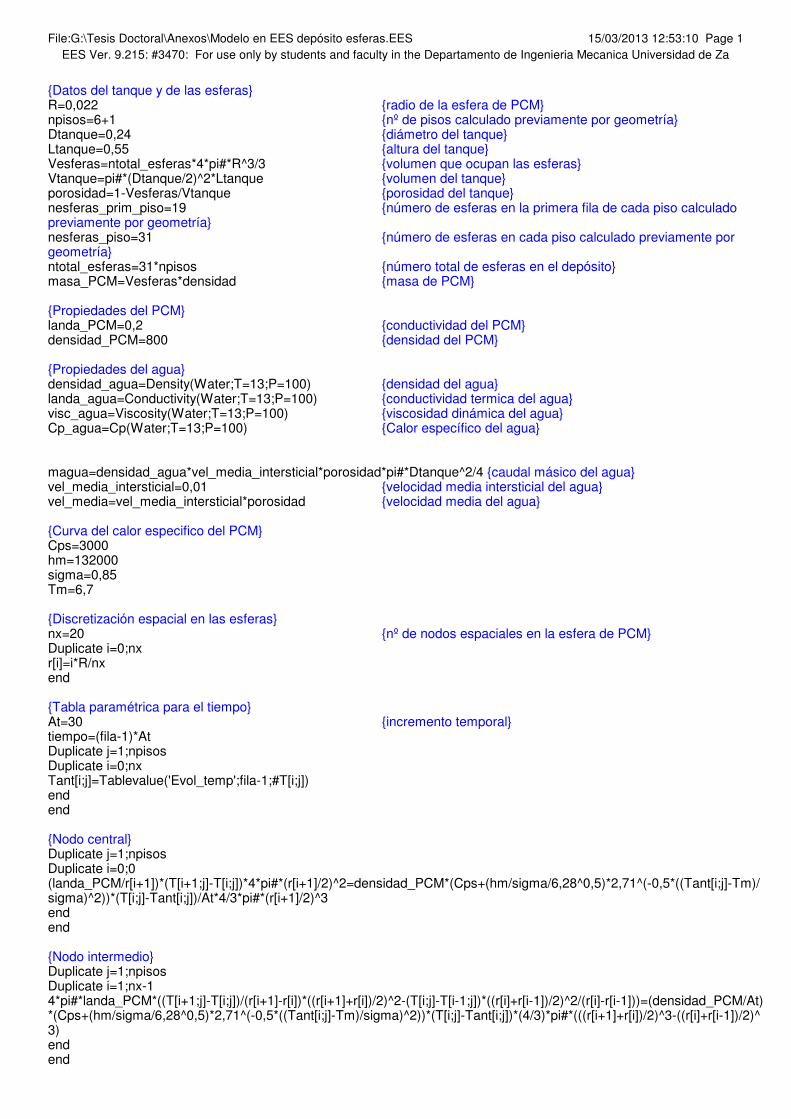
File:G:\Tesis Doctoral\Anexos\Modelo en EES depósito esferas.EES 15/03/2013 12:53:10 Page 1
EES Ver. 9.215: #3470: For use only by students and faculty in the Departamento de Ingenieria Mecanica Universidad de Za
{Datos del tanque y de las esferas}R=0,022 {radio de la esfera de PCM}npisos=6+1 {nº de pisos calculado previamente por geometría}Dtanque=0,24 {diámetro del tanque}Ltanque=0,55 {altura del tanque}Vesferas=ntotal_esferas*4*pi#*R^3/3 {volumen que ocupan las esferas}Vtanque=pi#*(Dtanque/2)^2*Ltanque {volumen del tanque}porosidad=1-Vesferas/Vtanque {porosidad del tanque}nesferas_prim_piso=19 {número de esferas en la primera fila de cada piso calculado previamente por geometría}nesferas_piso=31 {número de esferas en cada piso calculado previamente por geometría}ntotal_esferas=31*npisos {número total de esferas en el depósito}masa_PCM=Vesferas*densidad {masa de PCM}
{Propiedades del PCM}landa_PCM=0,2 {conductividad del PCM}densidad_PCM=800 {densidad del PCM}
{Propiedades del agua}densidad_agua=Density(Water;T=13;P=100) {densidad del agua}landa_agua=Conductivity(Water;T=13;P=100) {conductividad termica del agua}visc_agua=Viscosity(Water;T=13;P=100) {viscosidad dinámica del agua}Cp_agua=Cp(Water;T=13;P=100) {Calor específico del agua}
magua=densidad_agua*vel_media_intersticial*porosidad*pi#*Dtanque^2/4 {caudal másico del agua}vel_media_intersticial=0,01 {velocidad media intersticial del agua}vel_media=vel_media_intersticial*porosidad {velocidad media del agua}
{Curva del calor especifico del PCM}Cps=3000hm=132000sigma=0,85Tm=6,7
{Discretización espacial en las esferas}nx=20 {nº de nodos espaciales en la esfera de PCM}Duplicate i=0;nxr[i]=i*R/nxend
{Tabla paramétrica para el tiempo}At=30 {incremento temporal}tiempo=(fila-1)*AtDuplicate j=1;npisosDuplicate i=0;nxTant[i;j]=Tablevalue('Evol_temp';fila-1;#T[i;j])endend
{Nodo central}Duplicate j=1;npisosDuplicate i=0;0(landa_PCM/r[i+1])*(T[i+1;j]-T[i;j])*4*pi#*(r[i+1]/2)^2=densidad_PCM*(Cps+(hm/sigma/6,28^0,5)*2,71^(-0,5*((Tant[i;j]-Tm)/sigma)^2))*(T[i;j]-Tant[i;j])/At*4/3*pi#*(r[i+1]/2)^3endend
{Nodo intermedio}Duplicate j=1;npisosDuplicate i=1;nx-14*pi#*landa_PCM*((T[i+1;j]-T[i;j])/(r[i+1]-r[i])*((r[i+1]+r[i])/2)^2-(T[i;j]-T[i-1;j])*((r[i]+r[i-1])/2)^2/(r[i]-r[i-1]))=(densidad_PCM/At)*(Cps+(hm/sigma/6,28^0,5)*2,71^(-0,5*((Tant[i;j]-Tm)/sigma)^2))*(T[i;j]-Tant[i;j])*(4/3)*pi#*(((r[i+1]+r[i])/2)^3-((r[i]+r[i-1])/2)^3)endend

File:G:\Tesis Doctoral\Anexos\Modelo en EES depósito esferas.EES 15/03/2013 12:53:10 Page 2
EES Ver. 9.215: #3470: For use only by students and faculty in the Departamento de Ingenieria Mecanica Universidad de Za
{Nodo exterior}Duplicate j=1;npisosDuplicate i=nx;nx-4*pi#*landa_PCM*(T[nx;j]-T[nx-1;j])*(((r[nx]+r[nx-1])/2)^2)/(r[nx]-r[nx-1])+hconv*(Tagua[j]-T[nx;j])*4*pi#*r[nx]^2=(densidad_PCM*(Cps+(hm/sigma/6,28^0,5)*2,71^(-0,5*((Tant[i;j]-Tm)/sigma)^2))*(T[nx;j]-Tant[nx;j])/At)*(4/3)*pi#*(r[nx]^3-((r[nx]+r[nx-1])/2)^3)endend
{Cálculo del coeficiente de convección esfera - agua}Rep=densidad_agua*vel_media_intersticial*porosidad*2*R/visc_aguaPr=Prandtl(Water;T=13;P=100)Nu=2+1,1*(6*(1-porosidad))^0,6*Rep^0,6*Pr^(1/3)Nu=hconv*2*R/landa_agua
{Balance de energía}Duplicate j=1;npisosnesferas_piso_calculo[j]=if(j;npisos;31;31;31)-magua*Cp_agua*(Tagua[j]-Tagua[j-1])=nesferas_piso_calculo[j]*hconv*(Tagua[j]-T[nx;j])*4*pi#*R^2q[j]=nesferas_piso_calculo[j]*hconv*(Tagua[j]-T[nx;j])*4*pi#*R^2end
potencia=sum(q[j];j=1;npisos)
{Cálculo de la pérdida de carga por unidad de longitud según distintas correlaciones}AP_ergun/Ltanque=(150*0,001*vel_media*(1-porosidad)^2/(2*R)^2/porosidad^3)+1,75*1000*vel_media^2*(1-porosidad)/(2*R)/porosidad^3AP_tallmadge/Ltanque=1000*vel_media^2/(2*R)*((150*(1-porosidad)^2/Rep/porosidad^3)+4,2*(1-porosidad)^1,166*Rep^(-1/6)/porosidad^3)AP_sug_lee_ogawa/Ltanque=1000*vel_media^2/(2*R)*(6,25*(1-porosidad)^2/porosidad^3*(29,32*Rep^(-1)+1,56*Rep^(-n)+0,1))n=0,352+0,1*porosidad+0,275*porosidad^2AP_kuerten/Ltanque=1000*vel_media^2/(2*R)*(25/4*(1-porosidad)^2/porosidad^3*(21*Rep^(-1)+6*Rep^(-0,5)+0,28))

File:G:\Tesis Doctoral\Anexos\Modelo en EES depósito suspensión.EES 15/03/2013 13:21:40 Page 1
EES Ver. 9.215: #3470: For use only by students and faculty in the Departamento de Ingenieria Mecanica Universidad de Za
{Datos del tanque}h_tanque=0,55 {altura del tanque}Dtanque=0,24 {diámetro del tanque}Vtanque=pi#*(Dtanque/2)^2*h_tanque {volumen del tanque}m_PCM=densidad_PCM*Vtanque_pcm {masa de suspensión de PCM}densidad_PCM=960 {densidad de la suspensión de PCM}Vserpentin=pi#*(Dserp/2)^2*Lserp {volumen del serpentin}Vtanque_pcm=Vtanque-Vserpentin {volumen del tanque ocupado por la suspensión de PCM}
densidad_fluido=1000 {densidad del agua}caudal_fluido=0,003 {caudal másico de agua}Asecciontubo=pi#*(Dserp_int/2)^2 {sección del tubo}caudal_fluido=v_fluido*densidad_fluido*Asecciontubo {velocidad media del agua}
Dserp=0,016 {diámetro exterior del serpentín}Lserp=3,7 {longitud del serpentín}Dserp_int=0,014 {diámetro interior del serpentín}Dhelice=0,14 {diámetro de la helice}
{Curva del calor específico de la suspensión de PCM}Cps=3649hm=59400sigma=0,85Tm=6,7
Nodos_x=8 {número de nodos de discretización del tanque}Ax=h_tanque/Nodos_x
A=pi#*Dserp*(Lserp/Nodos_x) {área de transferencia de calor del serpentín}Rcond=(Dserp/2/k_('Copper'; 30))*ln(Dserp/Dserp_int) {resistencia de conducción del cobre}
{Tabla paramétrica para el tiempo}tiempo=(fila-1)*AtAt=30 {incremento temporal}Duplicate i=1;Nodos_xTpcm_ant[i]=Tablevalue('Evol_temp';fila-1;'Tpcm[i]')Tfluido_ant[i]=Tablevalue('Evol_temp';fila-1;'Tfluido[i]')end
{Balance de energía}Duplicate i=1;Nodos_x-caudal_fluido*Cp_fluido[i]*(Tfluido[i]-Tfluido[i-1])=Uext[i]*A*(Tfluido[i]-Tpcm[i])(m_PCM/Nodos_x)*(Cps+(hm/sigma/6,28^0,5)*2,71^(-0,5*((Tpcm_ant[i]-Tm)/sigma)^2))*(Tpcm[i]-Tpcm_ant[i])/At=Uext[i]*A*(Tfluido[i]-Tpcm[i])q[i]=Uext[i]*A*(Tfluido[i]-Tpcm[i]) {calor intercambiado en cada piso del tanque}
{Coeficiente de convección natural (a partir de los datos del agua)}Cp_agua[i]=1000*Cp(Water;T=Tpcm_ant[i];P=100)densidad_agua[i]=Density(Water;T=Tpcm_ant[i];P=100)dif_agua[i]=Conductivity(Water;T=Tpcm_ant[i];P=100)/densidad_agua[i]/Cp_agua[i]visc_cin_agua[i]=Viscosity(Water;T=Tpcm_ant[i];P=100)/Density(Water;T=Tpcm_ant[i];P=100)coef_vol[i]=VolExpCoef(Water;T=Tpcm_ant[i];P=100)Ra_fluido[i]=9,81*coef_vol[i]*(Tfluido_ant[i]-Tpcm_ant[i])*Lserp^3/dif_agua[i]/visc_cin_agua[i]Nu_ext[i]=0,802*(Ra_fluido[i])^0,278Nu_ext[i]=hconv_ext[i]*Lserp/Conductivity(Water;T=Tpcm_ant[i];P=100)hconv_ext_pcm[i]=-1,7974*hconv_ext[i]+1180,4Rconv_ext_PCM[i]=1/hconv_ext_pcm[i]
{Coeficiente de convección interior}Cp_fluido[i]=1000*Cp(Water;T=Tfluido_ant[i];P=100)Re_fluido[i]=4*caudal_fluido/pi#/Dserp_int/Viscosity(Water;T=Tfluido_ant[i];P=100)Pr_fluido[i]=Prandtl(Water;T=Tfluido_ant[i];P=100)Nu_int[i]=(2,153+0,318*Dean[i]^0,643)*Pr_fluido[i]^0,177 {Valida para De entre 20 y 200; Pr entre 0,7 y 175; relación entre Dserp/Dhel entre 0,0267 y 0,0884}Dean[i]=Re_fluido[i]*((Dserp)/(Dhelice))^0,5Nu_int[i]=hconv_int[i]*Dserp_int/Conductivity(Water;T=Tfluido_ant[i];P=100)

File:G:\Tesis Doctoral\Anexos\Modelo en EES depósito suspensión.EES 15/03/2013 13:21:40 Page 2
EES Ver. 9.215: #3470: For use only by students and faculty in the Departamento de Ingenieria Mecanica Universidad de Za
Rconv_int[i]=1/hconv_int[i]
{Coeficiente global de TQ}1/Uext[i]=Rconv_ext_PCM[i]+Rcond+Rconv_int[i]*Dserp/Dserp_intend
potencia=sum(q[i];i=1;Nodos_x) {potencia intercambiada}
{Cálculo de la pérdida de carga}Re=(4*caudal_fluido/3,14/Dserp_int/Viscosity(Water;T=13;P=100)) {Reynolds calculado para una temperatura del agua de 13ºC}De=Re*(Dserp_int/Dhelice)^0,5 {número de Dean}f=16/Re {Factor de fricción en tubos rectos}Re_transicion=20000*(Dserp_int/Dhelice)^0,32 {Reynolds de transición de laminar a turbulento}AP/Lserp=f_ito*1000*v_fluido^2/2/Dserp_int {Pérdida de carga}
{Factor de fricción en régimen laminar en serpentines}{Correlación White para laminar e isotermo}f_white=f*(1-(1-(11,6/De)^0,45)^2,2)^(-1)
{Correlación Ito para laminar e isotermo}f_ito=num_ito/den_itonum_ito=344*(Dhelice/Dserp_int)^(-0,5)den_ito=(1,56+log10(Re*(Dhelice/Dserp_int)^(-0,5)))^5,73Re_ito_min=13,5*(Dhelice/Dserp_int)^0,5Re_ito_max=2000*(1+13,2*(Dhelice/Dserp_int)^(-0,6))
{Correlación Manlapaz and Churchill para laminar e isotermo. Exponente 0 depende del número de Dean}sum1=(1-0,18*(1+(35/He)^2)^(-0,5))^0sum2=((1+(Dserp_int)/(3*Dhelice))^2)*He/88,33f_manlapaz_churchill/f=(sum1+sum2)^0,5He=De/(1+(pitch/3,14/Dhelice)^2)^0,5pitch=0,037

APPENDIX IV. Substances analyzed
277
APPENDIX IV. Substances analyzed

Analysis of microencapsulated phase change material slurries and phase change material emulsions as heat transfer fluid and thermal storage material
278
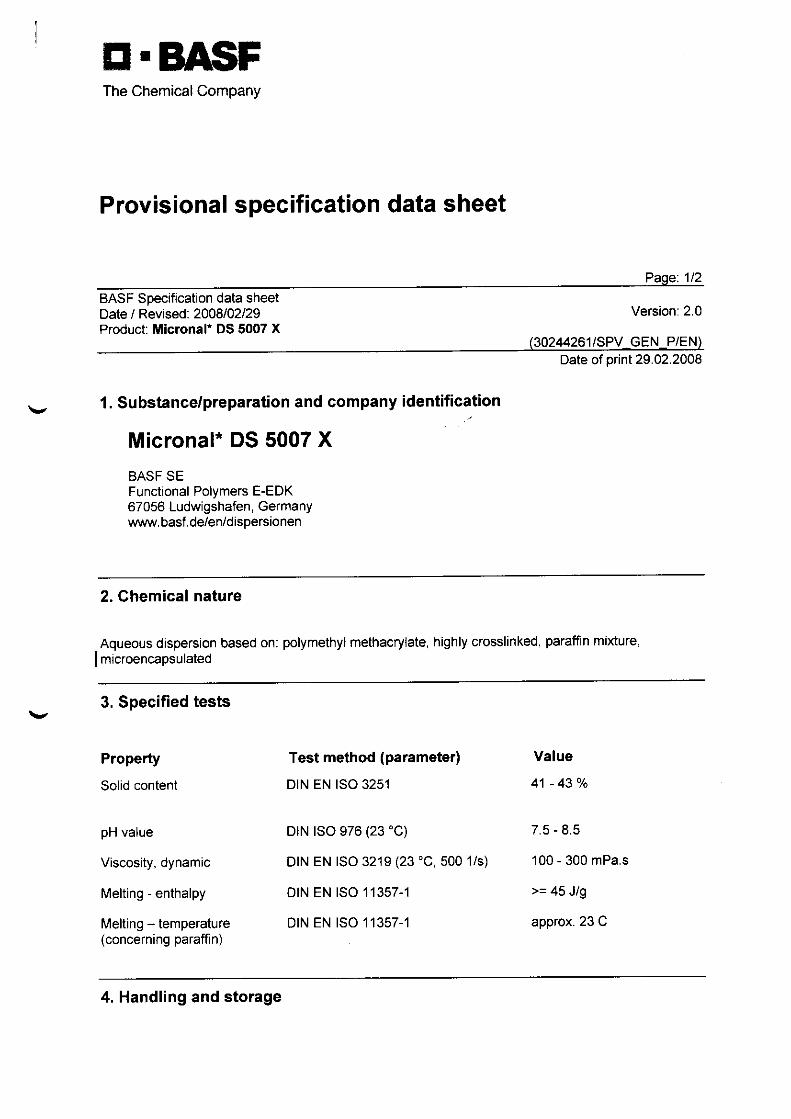
tr. B'\SFThe Chemical Company
Provisional specification data sheet
BASF Specification data sheetDate / Revised: 2008102129Product: M¡cronaf DS 5007 x
Version: 2.0
(30244261 /SPV_GE N_P/E N)Date of orint 29.02.2008
1. Substance/preparation and company identification
Micronal* DS 5007 X
EAüI- Dtr
Functional Polymers E-EDK67056 Ludwigshafen, Germanywww. basf . de/en/disDersionen
2. Chemical nature
Aqueous dispersion based on: polymethyl methacrylate, highly crosslinked, paraff¡n mixture,I microencapsulated
3. Specified tests
Property
Solid content
pH value
Viscosity, dynamic
Melt¡ng - enthalpy
Melting - temperature(concerning paraffin)
Test method (parametef)
DIN EN ISO 3251
DrN rso 976 (23 "C)
DIN EN ISO 3219 (23'C, 500 1/s)
DtN EN tSO I 1357-1
DrN EN tSO 11357-1
Value
41 - 43 o/o
/ . c - ó . c
100 - 300 mPa.s
>= 45 J/9
approx. 23 C
4. Handling and storage
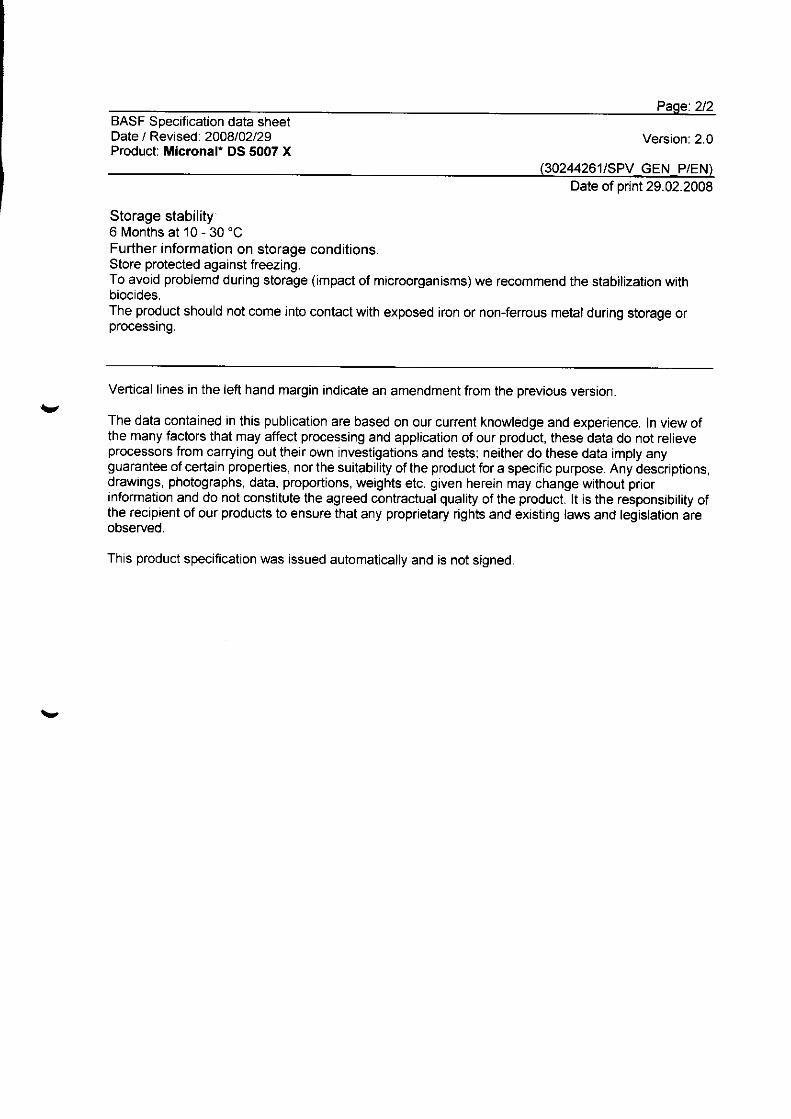
BASF Specifcation data sheetDate / Revised: 2008102129Product: Micronaf DS 5007 X
Version: 2.0
(30244261/SPV_GEN P/EN)Date of orint 29.02.2008
Storage stability'6 Months at 10 - 30 'C
Further information on storage conditions.Store protected against freezing.To avoid problemd during storage (impact of m¡croorganisms) we recommend the stabilizat¡on withbiocides.The product should not come rnto contact with exposed iron or non-ferrous metal during storage orprocessing.
vVert¡cal lines in the left hand margin indicate an amendment from the previous version.
The data contained in th¡s publicat¡on are based on our current knowledge and experience. In view ofthe many factors that may affect process¡ng and application ofour product, these data do not relieveprocessors from carrying out their own invest¡gations and tests; ne¡ther do these data imply anyguarantee of certain properties, nor the suitability of the product for a specific purpose. Any descriptrons,drawings, photographs, data, proportions, weights etc. g¡ven here¡n may change without priorinformat¡on and do not constitute the agreed contractual quality of the product. lt is the responsib¡lity ofthe recipient of our products to ensure that any proprietary r¡ghts and ex¡st¡ng laws and legislat¡on areobserved.
This product specitication was ¡ssued automat¡cally and is not signed.
Ch em i c a l N a t u r e
Aqueous dispersion of a paraffin mix-
ture, microencapsulated with highly
crosslinked polymethyl methacrylate;
formaldehyde-free
Te c h n i c a l D a t a
Solids content 42–44% in water
pH 6.0–8.0
Viscosity, dyn. 200–1500 mPas
Density ca. 0.98 g/cm³
Peak melting range ca. 26 °C–28 °C
Melting enthalpy(emulsion, liquid)
ca. 70 kJ/kg
Total capacity(20–35 °C, liquid)
ca. 120 kJ/kg
Melting enthalpy(active solid content)
min. 160 kJ/kg
Total capacity(20–35 °C,active solid content)
ca. 192 kJ/kg
Total capacity(20–35 °C at 35%)
ca. 108 kJ/kg(slurry with 35%solids content)
Storage capacitycompared with water(20–35 °C)
ca. +70%(35% solids content)
Capsule size ca. diameter 1–3 µm
MiscellaneousReduced creamingstabilized for ½ yearwith biocide
The exact specifications can be found
in the specification data sheet.
A r e a s o f a p p l i c a t i o n
Micronal DS 5045 X (aqueous dispersion
of a microencapsulated phase-change
material) owes its excellent heat absorp-
tion capacity to the physical process of
melting and solidifying. The product con-
sists of microscopically small polymer
spheres, which contain a core of high-
purity paraffin waxes. When the wax in
the microcapsules melts, a considerable
amount of energy is stored; conversely,
this energy is released again when the
wax solidifies. The “hidden” heat stored
in this phase change is known as “latent
heat.” It can be used to transport larger
quantities of heat at a given volume flow
rate, or to reduce the volume flow rate
when heat needs to be transferred from
A to B.
Micronal DS 5045 X was developed for
use as a heat transfer fluid (slurry) in hea-
ting systems such as decentralized
PCM-based ventilation equipment. The
increased heat storage capacity is used
mainly to increase the use of environ-
mental energy (e.g. low nighttime tempe-
ratures) in the cooling of indoor spaces
during the day. This can be done in cen-
tralized or decentralized systems. A re-
duction in the output and size of pumps
helps to minimize the auxiliary energy of
such units.
The distinguishing feature of
Micronal DS 5045 X is that it is free of
formaldehyde on account of the special
microencapsulation process. Further-
more, the capsule diameter of 1–3 µm is
optimized for the requirements of heat
transfer fluids. Creaming is prevented to
a very large extent.
Micronal DS 5045 X is frequently used in
façade/sill units. Here, heat is removed
from warm air that enters the building at
the height of summer and the air is thus
cooled to a tolerable level. The relatively
high working temperature allows reacti-
vation during the night even if there is
moderate cooling of the nighttime air.
The product can also be used as a heat
transfer medium in various system confi-
gurations that use this temperature ran-
ge. Compared with water, an approxi-
mately 70% higher total storage
capacity can be achieved with a 35%
slurry in the range 20–35 °C.
P r o c e s s i n g I
When Micronal DS 5045 X is used as a
heat transfer fluid, its long-term behav-
ior and cycle stability are dependent on
numerous constraints that we cannot
cover in full in our tests. Therefore, users
must carry out their own careful tests.
Micronal DS 5045 X should be stirred
once again before use. It is available in
drums, IBCs or as bulk product in a tank
truck.
P r o v i s i o n a l Te c h n i c a l I n f o rm a t i o n
Micronal® DS 5045 XPolymer Dispersions for Construction
Page 1 of 2
inzelne Mikrokapseln, Kapselgröße 1-3µmOptical micrograph: individualmicrocapsules, capsule diameter 1–3 μm.
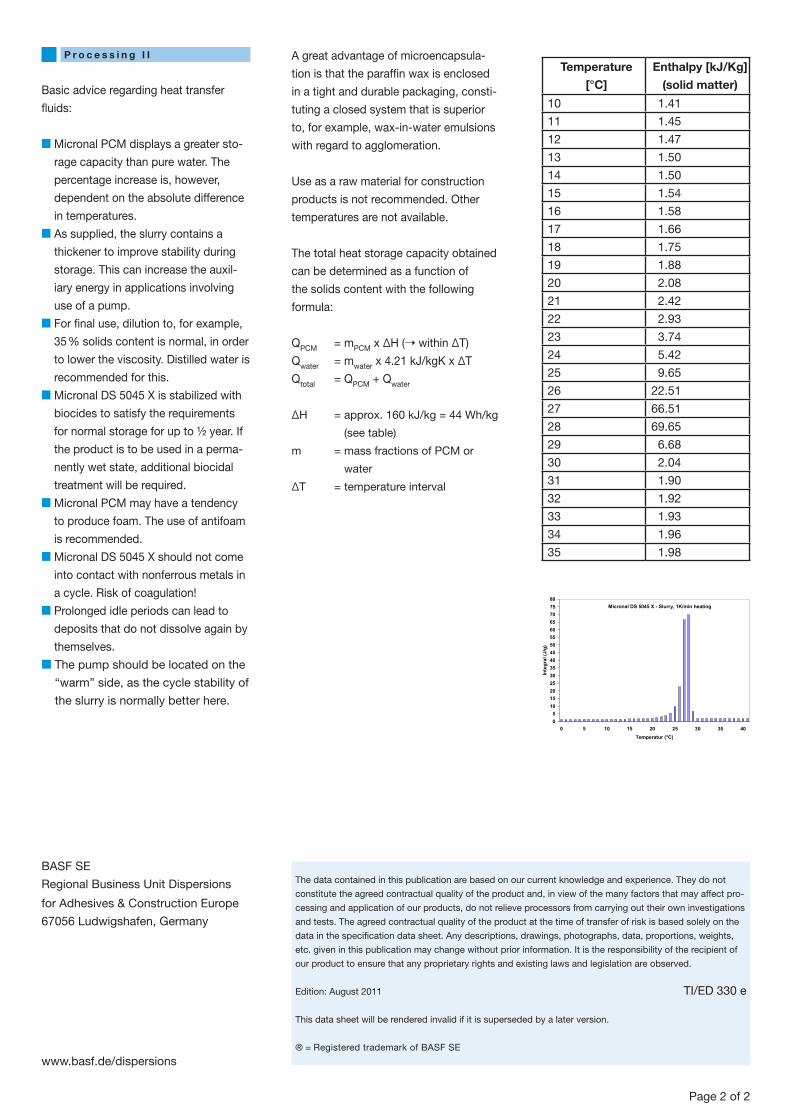
BASF SE
Regional Business Unit Dispersions
for Adhesives & Construction Europe
67056 Ludwigshafen, Germany
www.basf.de/dispersions
Page 2 of 2
P r o c e s s i n g I I
Basic advice regarding heat transfer
fluids:
■ Micronal PCM displays a greater sto-
rage capacity than pure water. The
percentage increase is, however,
dependent on the absolute difference
in temperatures.
■ As supplied, the slurry contains a
thickener to improve stability during
storage. This can increase the auxil-
iary energy in applications involving
use of a pump.
■ For final use, dilution to, for example,
35% solids content is normal, in order
to lower the viscosity. Distilled water is
recommended for this.
■ Micronal DS 5045 X is stabilized with
biocides to satisfy the requirements
for normal storage for up to ½ year. If
the product is to be used in a perma-
nently wet state, additional biocidal
treatment will be required.
■ Micronal PCM may have a tendency
to produce foam. The use of antifoam
is recommended.
■ Micronal DS 5045 X should not come
into contact with nonferrous metals in
a cycle. Risk of coagulation!
■ Prolonged idle periods can lead to
deposits that do not dissolve again by
themselves.
■ The pump should be located on the
“warm” side, as the cycle stability of
the slurry is normally better here.
A great advantage of microencapsula-
tion is that the paraffin wax is enclosed
in a tight and durable packaging, consti-
tuting a closed system that is superior
to, for example, wax-in-water emulsions
with regard to agglomeration.
Use as a raw material for construction
products is not recommended. Other
temperatures are not available.
The total heat storage capacity obtained
can be determined as a function of
the solids content with the following
formula:
QPCM = mPCM x ΔH (➝ within ΔT)
Qwater = mwater x 4.21 kJ/kgK x ΔT
Qtotal = QPCM + Qwater
ΔH = approx. 160 kJ/kg = 44 Wh/kg
(see table)
m = mass fractions of PCM or
water
ΔT = temperature interval
Temperature
[°C]
Enthalpy [kJ/Kg]
(solid matter)
10 1.41
11 1.45
12 1.47
13 1.50
14 1.50
15 1.54
16 1.58
17 1.66
18 1.75
19 1.88
20 2.08
21 2.42
22 2.93
23 3.74
24 5.42
25 9.65
26 22.51
27 66.51
28 69.65
29 6.68
30 2.04
31 1.90
32 1.92
33 1.93
34 1.96
35 1.98
05101520253035404550556065707580
0 5 10 15 20 25 30 35 40Temperatur (°C)
Integral(J/g)
Micronal DS 5045 X - Slurry, 1K/min heating
The data contained in this publication are based on our current knowledge and experience. They do not
constitute the agreed contractual quality of the product and, in view of the many factors that may affect pro-
cessing and application of our products, do not relieve processors from carrying out their own investigations
and tests. The agreed contractual quality of the product at the time of transfer of risk is based solely on the
data in the specification data sheet. Any descriptions, drawings, photographs, data, proportions, weights,
etc. given in this publication may change without prior information. It is the responsibility of the recipient of
our product to ensure that any proprietary rights and existing laws and legislation are observed.
Edition: August 2011 TI/ED 330 e
This data sheet will be rendered invalid if it is superseded by a later version.
® = Registered trademark of BASF SE
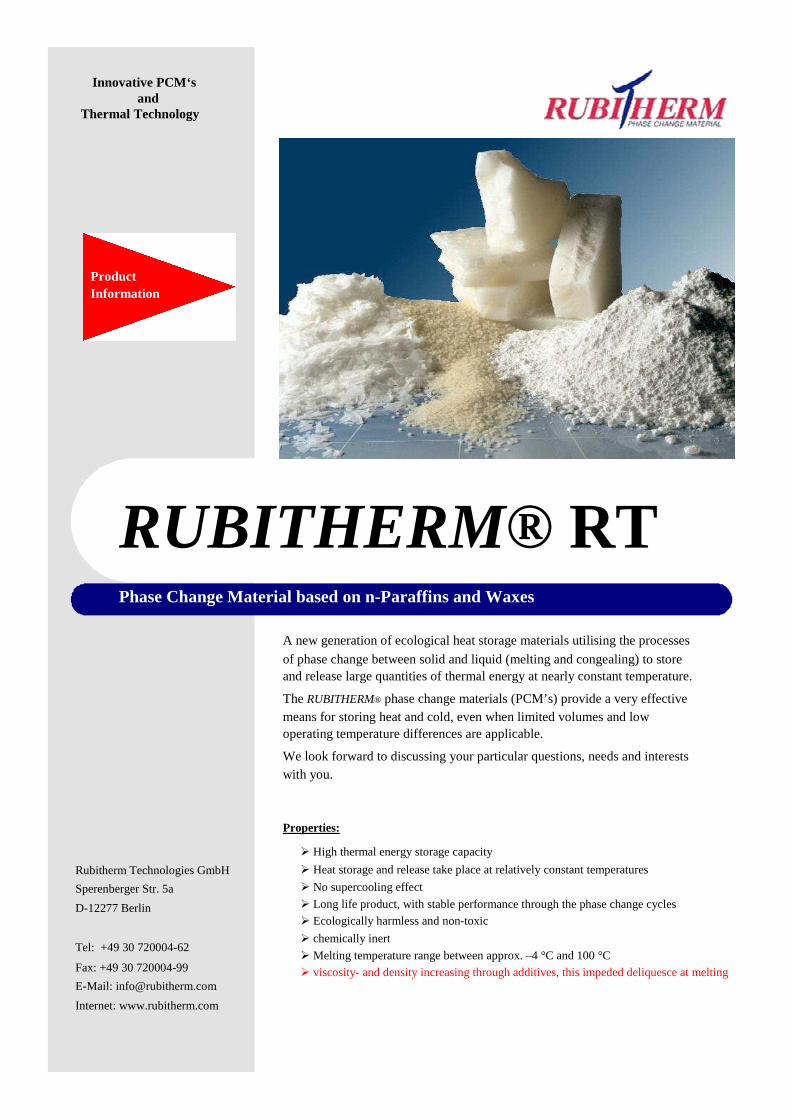
Innovative PCM‘s and
Thermal Technology
Product Information
RUBITHERM® RT
Phase Change Material based on n-Paraffins and Waxes
A new generation of ecological heat storage materials utilising the processes
of phase change between solid and liquid (melting and congealing) to store and release large quantities of thermal energy at nearly constant temperature.
The RUBITHERM® phase change materials (PCM’s) provide a very effective means for storing heat and cold, even when limited volumes and low operating temperature differences are applicable.
We look forward to discussing your particular questions, needs and interests with you.
Properties:
� High thermal energy storage capacity
Rubitherm Technologies GmbH
Sperenberger Str. 5a
D-12277 Berlin
Tel: +49 30 720004-62
Fax: +49 30 720004-99
E-Mail: [email protected]
Internet: www.rubitherm.com
� Heat storage and release take place at relatively constant temperatures
� No supercooling effect
� Long life product, with stable performance through the phase change cycles
� Ecologically harmless and non-toxic
� chemically inert
� Melting temperature range between approx. –4 °C and 100 °C
� viscosity- and density increasing through additives, this impeded deliquesce at melting
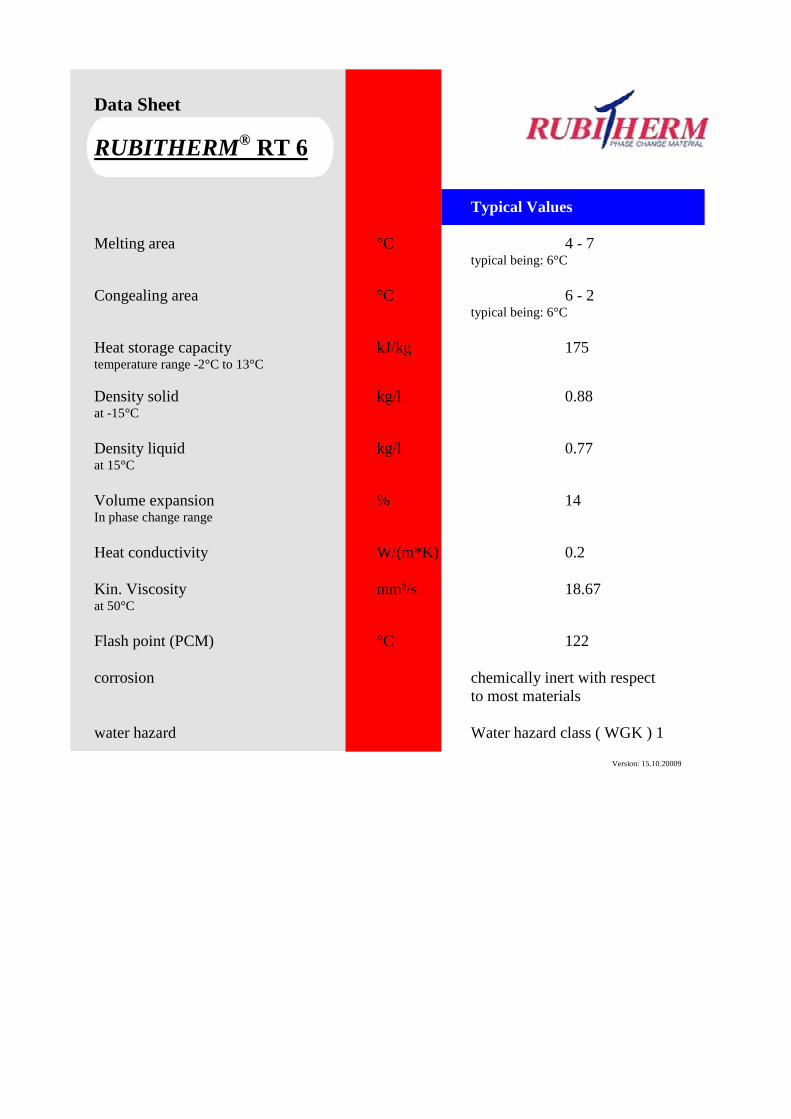
Data Sheet
RUBITHERM® RT 6
Typical Values Melting area °C 4 - 7 typical being: 6°C Congealing area °C 6 - 2 typical being: 6°C Heat storage capacity kJ/kg 175 temperature range -2°C to 13°C Density solid kg/l 0.88 at -15°C Density liquid kg/l 0.77 at 15°C Volume expansion % 14 In phase change range Heat conductivity W/(m*K) 0.2 Kin. Viscosity mm²/s 18.67 at 50°C Flash point (PCM) °C 122 corrosion chemically inert with respect
to most materials water hazard Water hazard class ( WGK ) 1
Version: 15.10.20009