measurement of α-particle quenching in lab based
TRANSCRIPT
Eur. Phys. J. C (2016) 76:109DOI 10.1140/epjc/s10052-016-3959-2
Regular Article - Experimental Physics
Measurement of α-particle quenching in LAB based scintillatorin independent small-scale experiments
B. von Krosigk1,2,a, M. Chen3, S. Hans4,5, A. R. Junghans6, T. Kögler1,6, C. Kraus3,7, L. Kuckert1,8, X. Liu3,R. Nolte9, H. M. O’Keeffe3,10, H. Wan Chan Tseung11,12, J. R. Wilson13, A. Wright3, M. Yeh4, K. Zuber1
1 Institut für Kern- und Teilchenphysik, Technische Universität Dresden, 01069 Dresden, Germany2 Department of Physics and Astronomy, University of British Columbia, Vancouver, BC V6T 1Z1, Canada3 Department of Physics, Engineering Physics and Astronomy, Queen’s University, Kingston, ON K7L 3N6, Canada4 Brookhaven National Laboratory, Upton, NY 11973, USA5 Bronx Community College, Bronx, NY 10453, USA6 Helmholtz-Zentrum Dresden-Rossendorf, 01314 Dresden, Germany7 Laurentian University, 935 Ramsey Lake Road, Sudbury, ON P3E 2C6, Canada8 Institut für Experimentelle Kernphysik, Karlsruher Institut für Technologie, 76131 Karlsruhe, Germany9 Physikalisch-Technische Bundesanstalt, Bundesallee 100, 38116 Braunschweig, Germany
10 Physics Department, Lancaster University, Lancaster LA1 4YB, UK11 Department of Physics, Center for Experimental Nuclear Physics and Astrophysics, University of Washington, Seattle, WA 98195, USA12 Department of Radiation Oncology, Mayo Clinic, Rochester, MN 55905, USA13 School of Physics and Astronomy, Queen Mary, University of London, London E1 4NS, UK
Received: 4 October 2015 / Accepted: 19 February 2016 / Published online: 29 February 2016© The Author(s) 2016. This article is published with open access at Springerlink.com
Abstract The α-particle light response of liquid scintil-lators based on linear alkylbenzene (LAB) has been mea-sured with three different experimental approaches. In thefirst approach, α-particles were produced in the scintilla-tor via 12C(n,α)9Be reactions. In the second approach, thescintillator was loaded with 2 % of natSm providing an α-emitter, 147Sm, as an internal source. In the third approach,a scintillator flask was deployed into the water-filled SNO+detector and the radioactive contaminants 222Rn, 218Po and214Po provided the α-particle signal. The behavior of theobserved α-particle light outputs are in agreement witheach case successfully described by Birks’ law. The result-ing Birks parameter kB ranges from (0.0066 ± 0.0016) to(0.0076 ± 0.0003) cm/MeV. In the first approach, the α-particle light response was measured simultaneously withthe light response of recoil protons produced via neutron–proton elastic scattering. This enabled a first time a directcomparison of kB describing the proton and the α-particleresponse of LAB based scintillator. The observed kB valuesdescribing the two light response functions deviate by morethan 5σ . The presented results are valuable for all currentand future detectors, using LAB based scintillator as target,since they depend on an accurate knowledge of the scintilla-tor response to different particles.
a e-mail: [email protected]
1 Introduction
Over the last decades, liquid scintillation detectors gainedgreat importance in neutrino and astroparticle physics. Thisis due to their capability to detect the charged secondary par-ticles of neutrino interactions down to energies of a few keVin realtime and due to the easy scaling to large target masses.The scintillation light output L scales with the energy ofthe charged particle, providing valuable kinematic informa-tion. In addition, the observed light output of the scintillatorat a certain particle energy decreases with increasing ion-ization density. This effect, known as ionization quenching,allows to discriminate heavily ionizing particles, like pro-tons and α-particles, from electrons. The energy dependent,quenched scintillation light output can be described analyti-cally by Birks law [1,2],
L(E) = S ·∫ E
0
dE
1 + kB( dE
dx
) , (1)
where dE/dx is the specific energy loss. kB denotes Birks’parameter and S is a scaling parameter, which is associatedwith the scintillation efficiency. For fast electrons, which havea small dE/dx , Eq. 1 approximates the proportionality
Le(E) = S · E, (2)
where the index e refers to electrons [2]. For many of thestandard organic liquid and plastic scintillators, a linear elec-
123
109 Page 2 of 13 Eur. Phys. J. C (2016) 76 :109
tron scintillation light response has been observed down toabout 100 keV [3–7]. This includes also LAB based scin-tillators [6,7]. At lower energies, dE/dx is increased withrespect to fast electrons and L rises non-linearly with E . Thesmall non-linearity results in an energy offset, if Eq. 2 is usedto describe the electron light output function. This offset wasexperimentally determined to be �5 keV [4,6,8]. This quasi-linear behavior of scintillation light induced by electrons istypically taken advantage of in order to calibrate the lightoutput scale in ionization quenching measurements. Oftena scale in units of electron-equivalent energy is chosen andthus S = 1. This scale is used throughout this article for L .
With the evolution of both, detector technology and under-standing of the scintillator properties, experiments usingscintillation detectors grew in the second half of the lastcentury from small-scale to multi-tonne detectors. Severallarge-scale liquid scintillator detectors with up to 1 kt scin-tillator mass are currently operational worldwide and multi-kilotonne devices are being designed. However, despite thegreat progress in understanding the mechanisms of liquidscintillation, some fundamental questions still remain unan-swered. One of these questions is whether the same value ofkB can describe the light response of a certain organic scintil-lator to different ions [9], a question that was raised alreadyin the original works by Birks [2] upon the observation ofkB(proton) �= kB(α). However, since no consistent behav-ior was observed, no conclusive answer was found at thattime. And also to date, this question still remains unresolved.As already discussed in the seminal work of Birks [1,2],the increased complexity of the reaction kinetics in multi-component liquid scintillators compared with organic plasticscintillators or inorganic scintillators makes a unique answerto this question impossible. Therefore, individual investiga-tions are crucial for the wide range of operational and futurelarge-scale liquid scintillator detectors like Daya Bay [10],RENO [11], SNO+ [12], JUNO [13], RENO-50 [14], LENS[15] and HANOHANO [16]. All of these experiments use,or consider to use, LAB based scintillator.
Section 2 of this article describes the measurement andanalysis of α-particle quenching in LAB based scintillatorsusing fast neutrons. This experiment is referred to as the“neutron beam experiment”. The measurements were car-ried out at the PTB1 Ion Accelerator Facility (PIAF) [17,18],which provides a neutron beam with a continuous energy dis-tribution. The individual neutron energies are derived fromtime-of-flight (TOF) measurements. α-particles are producedinside the scintillator through (n,α) reactions and outgoingα-particles with an energy known from kinematic calcula-tions are identified within the data. The obtained quenchingresults are compared to the results of the proton quenchingmeasurements published in [19], which make use of n–p
1 Physikalisch-Technische Bundesanstalt.
elastic scattering in the scintillator. Both measurements weretaken simultaneously and with the same scintillation detector.
Section 3 presents the second α-quenching experiment,which uses samarium-loaded LAB based scintillator, referredto as the “samarium experiment”. The scintillator was loadedfor this experiment with 2 % natSm at BNL2 and the mea-surement was carried out at HZDR.3 The isotope 147Sm is anα-emitter with a Q-value of 2.3105(11) MeV [20], providingan internal α-source.
Section 4 describes the third measurement of α-particlequenching in LAB based scintillator, referred to as the“bucket source experiment”. In this case, the results wereobtained from a 1 l sample deployed within an acrylic con-tainer, the bucket, into the water-filled SNO+ detector. Con-taminations of the scintillator by the α-emitters 222Rn, 218Poand 214Po are used as internal α-sources with particle ener-gies of 5.49, 6.00 and 7.69 MeV, respectively.
All three independent experiments were conducted withsmall liquid scintillator volumes, using charged particles pro-duced in the scintillator itself. Furthermore all three exper-iments had a comparable sensitivity to UV light. This isimportant because a small fraction of Cherenkov light isalways emitted in addition to the scintillation light, whenan electron with an energy above the Cherenkov thresholdof about 166 keV traverses the LAB based scintillator. Inreferences [6,7] it is shown that the additional Cherenkovlight slightly changes the gradient of the linear relationbetween electron energy and light output and thus the cal-ibration to electron-equivalent energy. Throughout this arti-cle, the observed pulse-height PH is calibrated in units ofelectron-equivalent energies, including the scintillation andCherenkov photons.
The scintillator consists of the solvent LAB, the primaryfluor 2,5-diphenyloxazole (PPO) and the secondary fluor,if any, p-bis-(o-methylstyryl)-benzene (bis-MSB). Bis-MSBacts as a wavelength shifter to achieve a better match of thespectral distribution of the scintillation light and the sensi-tivity of the photocathode. The LAB solvent was obtainedfrom Petresa Canada Inc. [21] with an average stoichiomet-ric composition of C17.1H28.3.
A direct comparison of the α-particle quenching mea-surement results from these three experiments is presentedin Sect. 5. Section 6 provides a direct comparison of thequenching parameters kB for protons and α-particles, deter-mined in a simultaneous measurement using neutron-inducedreactions in the scintillator. The proton quenching data werealready published earlier [19]. A summary of the article andan outlook is given in Sect. 7.
2 Brookhaven National Laboratory.3 Helmholtz-Zentrum Dresden-Rossendorf.
123
Eur. Phys. J. C (2016) 76 :109 Page 3 of 13 109
2 Measurements of α-particle quenching using fastneutrons
In the neutron beam experiment, the α-particle quenching intwo deoxygenated, ternary LAB based scintillators is deter-mined from the same data sets used for the proton quench-ing analysis [19]. The respective scintillator samples areLAB + 2 g/l PPO + 15 mg/l bis-MSB and LAB + 3 g/lPPO + 15 mg/l bis-MSB. The only difference in these twosamples is the PPO concentration. The analysis of the α-particle quenching has higher demands on the PH resolu-tion than the one of the proton quenching because structurescaused by α-particles from (n,α) reactions have to be dis-criminated from those resulting from other reactions. Thusthe additional two binary LAB based scintillators withoutbis-MSB, used in [19], cannot be used for the analysis ofthe α-particle quenching because they show a lower resolu-tion than the ternary scintillators. The experimental setup,data acquisition and calibration is described in detail in [19].Therefore only details specifically relevant for the analysisof the α-particle quenching are discussed here.
2.1 Experimental setup and data extraction
The beam of fast neutrons was produced by bombarding a3 mm Beryllium target with 19 MeV protons from the CV28cyclotron at PIAF. The neutrons resulting from 9Be(p,nx)reactions have a continuous kinetic energy distribution fromabout 1 to 17 MeV and are observed together with promptγ -rays produced in inelastic interactions. The individual neu-tron energy En is deduced from a measurement of the neutronTOF relative to the centroid TOF value of the prompt γ -peaktogether with the flight distance from the target to the scin-tillator volume.
The scintillation detector had an active volume of about100 ml. It was observed by an XP2020Q PMT, which has anincreased UV light sensitivity. All materials between scintil-lator and photocathode were UV transparent. An integratedand amplified charge signal was derived from the 9th dyn-ode out of 12, avoiding a non-linear PMT gain and its pulseheight PH was measured using a peak sensing analog-to-digital converter (ADC).
The high-voltage applied to the PMT, and thus the PMTgain, was increased for the α-particle quenching and lowenergy proton quenching measurements, compared to theproton quenching measurements at energies above about5 MeV [19]. This achieves a better resolution of low PHsignals, which is especially important for the analysis of thehighly quenchedα-particle light pulses. This mode is referredto as high gain (HG) mode.
The data are stored in a PH versus TOF matrix. Fromthis matrix, PH spectra are extracted by selecting a smallTOF window around the TOF of interest and by projection
of the selected events on the PH axis. The PH scale iscalibrated with γ -ray sources yielding L in units of electron-equivalent energy. The TOF, and thus En , window is alwaysmade smaller than the En window corresponding to the lightoutput resolution �L at the respective particle energy.
2.2 Calibration
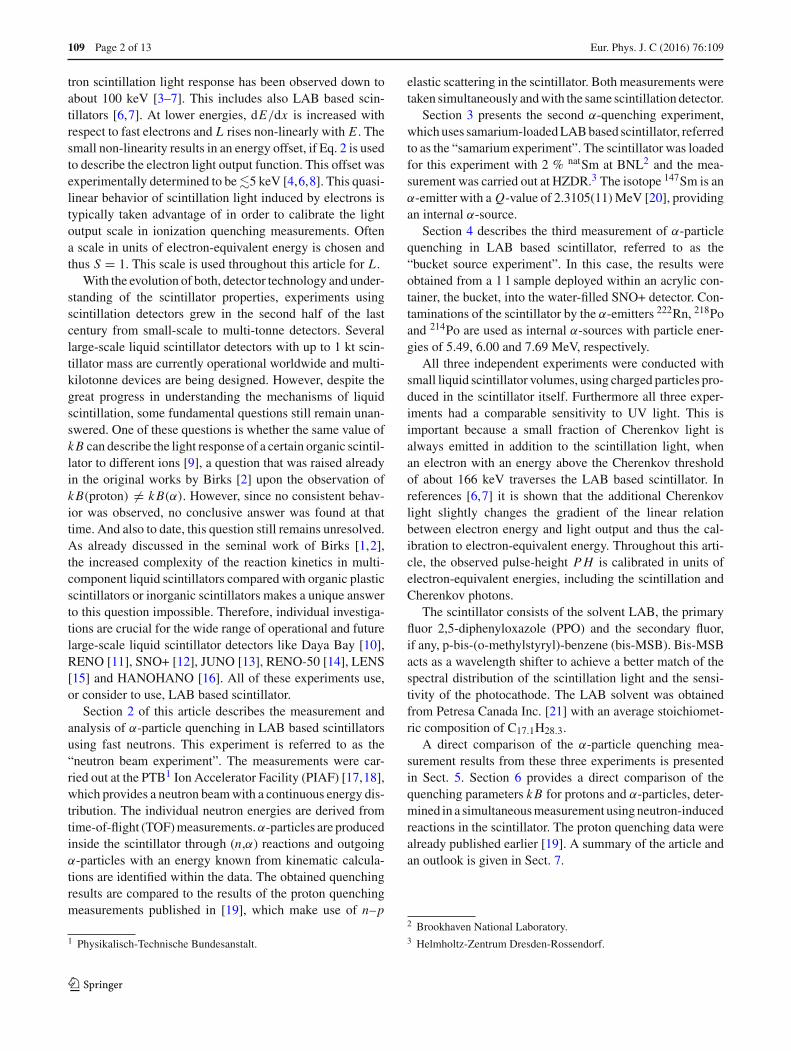
Three γ -ray sources were used for calibration: 137Cs, 22Naand 207Bi. They provide in total six γ -rays with differentenergies. Figure 1 shows the observed PH distribution of207Bi as an example. The three 207Bi γ -rays lead to threesharp edges at which the Compton electrons have the max-imum energy E . Since this energy is precisely known, therelation between PH and electron energy is determined byfitting the simulated PH distributions in the region aroundthe Compton edges to the measured ones [19]. The simulationis performed with the code gresp7 [22]. Despite small devi-ations at lower pulse-heights, the region around the Comptonedges is very well described by the simulation. The devia-tions result mainly from a simplified description of surfaceeffects within the gresp7 simulation.
The described procedure yields six data points PHi =PH(Ei ), where i = 1−6. A linear fit to these data points,with
PH(E) = m · E + a, (3)
results in the two calibration parameters m = (343.4 ±1.1) channels/MeV and a = (−9.0 ± 2.0) channels forLAB + 2 g/l PPO + 15 mg/l bis-MSB. Using insteadLAB + 3 g/l PPO + 15 mg/l bis-MSB results in the param-
[ch]PH
Cou
nts
/ ch
0
2000
4000
6000
8000
dataMC w/ resolutionMC w/o resolution
0 200 400 600
400 500 6000
20406080
100
Fig. 1 Distribution of the pulse-height PH measured in ADC chan-nels with a 207Bi calibration source. The data were taken with LAB +2 g/l PPO + 15 mg/l bis-MSB. Also shown is the Monte Carlo (MC)distribution before and after folding it with the detector resolution func-tion. The third Compton edge at high PH is shown enlarged in the inset
123
109 Page 4 of 13 Eur. Phys. J. C (2016) 76 :109
eter values m = (350.5 ± 0.7) channels/MeV and a =(−11.1 ± 2.1) channels.
The light output in units of electron-equivalent energy isfinally obtained from Eqs. 2 and 3 and thus
L(E) = PH − a
m. (4)
2.3 Determination of the α-particle response
2.3.1 Reactions producing α-particles
The beam neutrons reaching the sensitive volume mostlyelastically scatter off protons in the scintillator producing arecoil proton energy distribution [19]. Neutrons that exceeda threshold energy of 6.19 MeV can furthermore produceα-particles via the reaction
12C(n, α) 9Be(g.s.) (5)
with scintillator intrinsic 12C nuclei. The maximum possibleenergy of the single α-particle in the final state is unam-biguously related to the energy En of the incoming neutron.Above En = 8.81 and 8.29 MeV, respectively, two furtherreactions contribute to the production of α-particles:
12C(n, α′) 9Be∗ → n + 8Be (6)
↓2α,
12C(n, n′) 12C∗ → α + 8Be (7)
↓2α.
These reactions have more than one α-particle in the finalstate and it is not possible to identify α-particles of knownenergy. They thus contribute to the background spectrum.
Natural background, for instance from ambient γ -radia-tion and scintillator internal impurities, was measured in theabsence of calibration sources and beam neutrons and sub-tracted from data.
2.3.2 Monte Carlo simulations
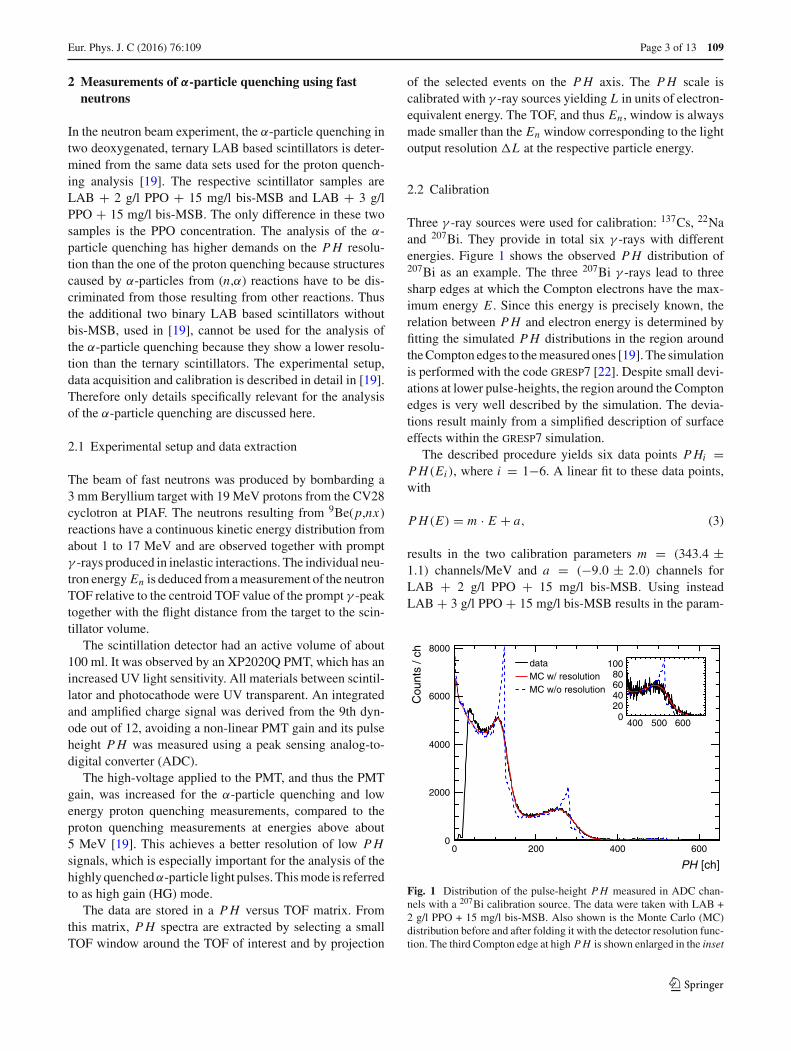
The simulation of light yield distributions resulting fromincoming neutrons is performed with the Monte Carlo (MC)code nresp7 [23]. The non-linearly rising light output fromdifferent charged particles is simulated using a set of prede-fined light output functions, which are stored in an externalfile and iteratively adapted to the data. nresp7 describes theα-particle light output function by two analytic expressions:
Lα(E) = c0Ec1 E < 6.76 MeV, (8)
Lα(E) = c2 + c3E E ≥ 6.76 MeV. (9)
[MeV]E
0 2 4 6 8
[MeV
]L
0.0
0.2
0.4
0.6
0.8
1.0
1.2NRESP7 light output function2 g/l PPO + 15 mg/l bis-MSB3 g/l PPO + 15 mg/l bis-MSB
Fig. 2 Light output L as function of kinetic energy E used in nresp7to simulate α-particle events in LAB + 2 g/l PPO + 15 mg/l bis-MSBand LAB + 3 g/l PPO + 15 mg/l bis-MSB. The two functions shownresult from iterative adaptations of the simulated to the measured lightyield distributions
The parameter values resulting from the last iteration arec0 = 0.030, c1 = 1.640, c2 = −0.518, c3 = 0.179for LAB + 2 g/l PPO + 15 mg/l bis-MSB and c0 =0.031, c1 = 1.689, c2 = −0.505, c3 = 0.190 forLAB + 3 g/l PPO + 15 mg/l bis-MSB. The respective func-tions are shown in Fig. 2.
The determination of the proton light output function ispossible without the knowledge of the specific α-particlelight output function, which is not the case vice versa. Thereason is that the individual regions of interest used for theproton analysis nearly exclusively contain proton events [19].Instead, the regions of interest for the α-particle analysisare not dominated by α-particle, but also by proton events.Hence, the proton analysis was conducted first.
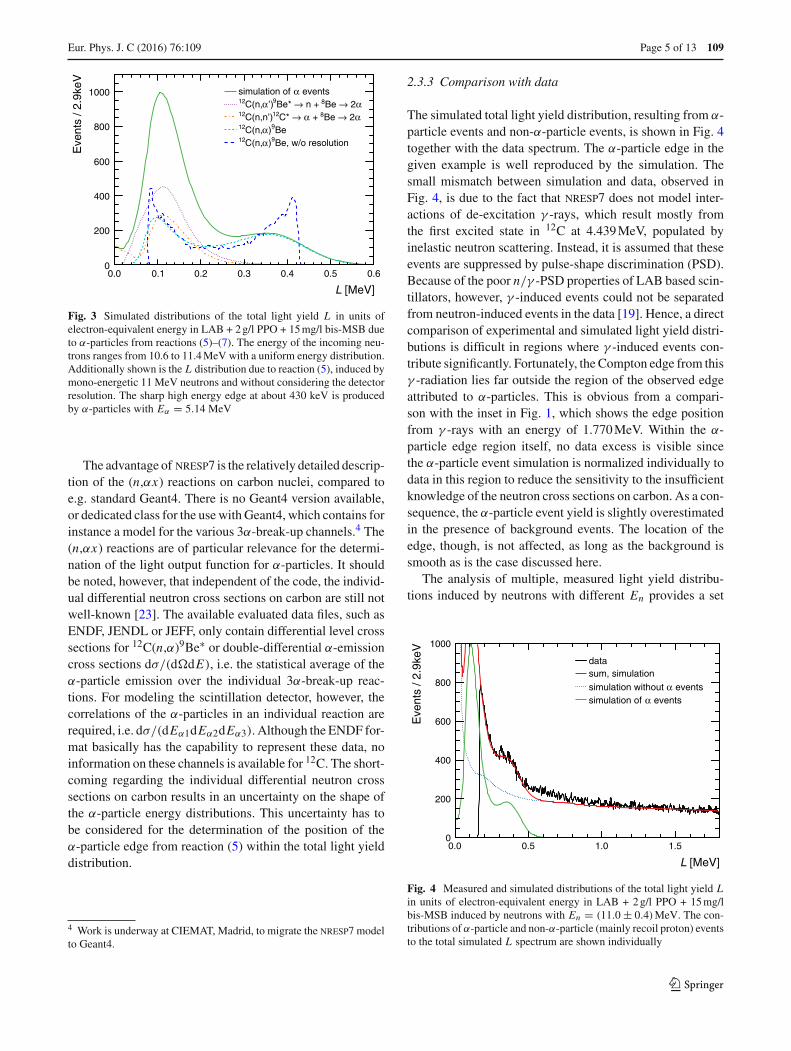
Figure 3 shows the simulated light yield distributionsresulting from the reactions (5)–(7) as well as their sum. Thecalibration parameters for LAB + 2 g/l PPO + 15 mg/l bis-MSB (see Sect. 2.2) are considered and an incoming neutronenergy of En = (11.0 ± 0.4) MeV is assumed. The widthof the rectangular neutron energy distribution correspondsto the TOF window width used for the extraction of therespective data spectrum. The edge visible around 430 keVresults from α-particles which are produced in the reaction(5) and emitted at forward angles. The corresponding α-particle energy can be calculated using simple two-particlekinematics, assuming 12C being at rest. For the given examplewith En = 11.0 MeV, the α-particle energy is 5.14 MeV. InFig. 3 the high energy edge lies outside the region covered byevents from the break-up reactions (6) and (7). This enablesa precise assignment of a known α-particle energy to a par-ticular value of L .
123
Eur. Phys. J. C (2016) 76 :109 Page 5 of 13 109
[MeV]L
0.0 0.1 0.2 0.3 0.4 0.5 0.6
Eve
nts
/ 2.9
keV
0
200
400
600
800
1000 eventsαsimulation of α 2→Be 8 n + →Be* 9’)αC(n,12
α 2→Be 8 + α→C* 12C(n,n’)12
Be9)αC(n,12
Be, w/o resolution9)αC(n,12
Fig. 3 Simulated distributions of the total light yield L in units ofelectron-equivalent energy in LAB + 2 g/l PPO + 15 mg/l bis-MSB dueto α-particles from reactions (5)–(7). The energy of the incoming neu-trons ranges from 10.6 to 11.4 MeV with a uniform energy distribution.Additionally shown is the L distribution due to reaction (5), induced bymono-energetic 11 MeV neutrons and without considering the detectorresolution. The sharp high energy edge at about 430 keV is producedby α-particles with Eα = 5.14 MeV
The advantage of nresp7 is the relatively detailed descrip-tion of the (n,αx) reactions on carbon nuclei, compared toe.g. standard Geant4. There is no Geant4 version available,or dedicated class for the use with Geant4, which contains forinstance a model for the various 3α-break-up channels.4 The(n,αx) reactions are of particular relevance for the determi-nation of the light output function for α-particles. It shouldbe noted, however, that independent of the code, the individ-ual differential neutron cross sections on carbon are still notwell-known [23]. The available evaluated data files, such asENDF, JENDL or JEFF, only contain differential level crosssections for 12C(n,α)9Be∗ or double-differential α-emissioncross sections dσ/(d�dE), i.e. the statistical average of theα-particle emission over the individual 3α-break-up reac-tions. For modeling the scintillation detector, however, thecorrelations of the α-particles in an individual reaction arerequired, i.e. dσ/(dEα1dEα2dEα3). Although the ENDF for-mat basically has the capability to represent these data, noinformation on these channels is available for 12C. The short-coming regarding the individual differential neutron crosssections on carbon results in an uncertainty on the shape ofthe α-particle energy distributions. This uncertainty has tobe considered for the determination of the position of theα-particle edge from reaction (5) within the total light yielddistribution.
4 Work is underway at CIEMAT, Madrid, to migrate the nresp7 modelto Geant4.
2.3.3 Comparison with data
The simulated total light yield distribution, resulting from α-particle events and non-α-particle events, is shown in Fig. 4together with the data spectrum. The α-particle edge in thegiven example is well reproduced by the simulation. Thesmall mismatch between simulation and data, observed inFig. 4, is due to the fact that nresp7 does not model inter-actions of de-excitation γ -rays, which result mostly fromthe first excited state in 12C at 4.439 MeV, populated byinelastic neutron scattering. Instead, it is assumed that theseevents are suppressed by pulse-shape discrimination (PSD).Because of the poor n/γ -PSD properties of LAB based scin-tillators, however, γ -induced events could not be separatedfrom neutron-induced events in the data [19]. Hence, a directcomparison of experimental and simulated light yield distri-butions is difficult in regions where γ -induced events con-tribute significantly. Fortunately, the Compton edge from thisγ -radiation lies far outside the region of the observed edgeattributed to α-particles. This is obvious from a compari-son with the inset in Fig. 1, which shows the edge positionfrom γ -rays with an energy of 1.770 MeV. Within the α-particle edge region itself, no data excess is visible sincethe α-particle event simulation is normalized individually todata in this region to reduce the sensitivity to the insufficientknowledge of the neutron cross sections on carbon. As a con-sequence, the α-particle event yield is slightly overestimatedin the presence of background events. The location of theedge, though, is not affected, as long as the background issmooth as is the case discussed here.
The analysis of multiple, measured light yield distribu-tions induced by neutrons with different En provides a set
[MeV]L
0.0 0.5 1.0 1.5
Eve
nts
/ 2.9
keV
0
200
400
600
800
1000
datasum, simulation
eventsαsimulation without eventsαsimulation of
Fig. 4 Measured and simulated distributions of the total light yield Lin units of electron-equivalent energy in LAB + 2 g/l PPO + 15 mg/lbis-MSB induced by neutrons with En = (11.0 ± 0.4)MeV. The con-tributions of α-particle and non-α-particle (mainly recoil proton) eventsto the total simulated L spectrum are shown individually
123
109 Page 6 of 13 Eur. Phys. J. C (2016) 76 :109
of data points Li . This is, of course, only possible if theα-particle edge is identified within the total light yield dis-tribution, which is dominated by recoil proton events. The12C(n,α)9Be reaction leads to an observable structure in theL spectra (see Fig. 4), as soon as the α-particle light out-put is high enough to overcome the detector threshold. Thisis the case for En � 9.5 MeV in the investigated data sets.At En � 11.5 MeV the two additional reactions, (6) and(7), dominate the PH spectrum resulting from all α-particleevents. The α-particle edge with known energy can not belocated anymore until En ≈ 14 MeV. At these high neu-tron energies, the maximum α-particle energy resulting fromreaction (5) is high enough to induce a light output well out-side the light yield distributions from the other two reac-tions. Finally, the number of light yield distributions with anobservable α-particle edge also depends on the PH resolu-tion.
The sources of systematic uncertainties are the PH cal-ibration, the TOF measurement, the PMT gain and the MCsimulations. The uncertainties on the calibration parametersm and a are given in Sect. 2.2. These uncertainties, as well asall uncertainties on the TOF measurement and the PMT gain,are the same as for the measurement of the light productionby protons and are discussed in [19]. The MC uncertainty,however, differs and is significantly larger for α-particles. Itresults mainly from the uncertainty on the differential (n,αx)cross sections for carbon, the effect of photon induced eventsnot covered by the simulation and the residual uncertaintyon the determined proton light output function. These uncer-tainties within the MC manifest in the dependence of theα-particle edge position on the L interval chosen for the fitof the MC to data. For this reason, the L interval aroundthe edge position is systematically varied and the averageedge position is determined. The maximum deviation fromthe average position observed in all analyzed light yield dis-tributions is ±26 keV.
2.3.4 Results
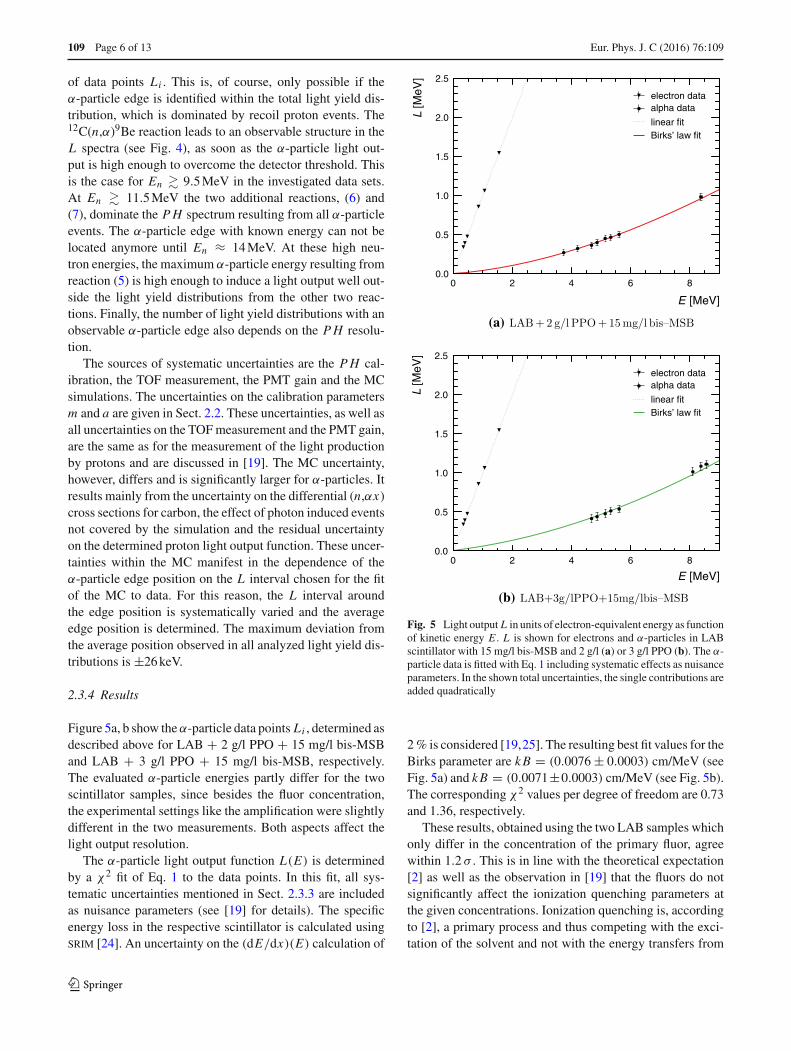
Figure 5a, b show the α-particle data points Li , determined asdescribed above for LAB + 2 g/l PPO + 15 mg/l bis-MSBand LAB + 3 g/l PPO + 15 mg/l bis-MSB, respectively.The evaluated α-particle energies partly differ for the twoscintillator samples, since besides the fluor concentration,the experimental settings like the amplification were slightlydifferent in the two measurements. Both aspects affect thelight output resolution.
The α-particle light output function L(E) is determinedby a χ2 fit of Eq. 1 to the data points. In this fit, all sys-tematic uncertainties mentioned in Sect. 2.3.3 are includedas nuisance parameters (see [19] for details). The specificenergy loss in the respective scintillator is calculated usingsrim [24]. An uncertainty on the (dE/dx)(E) calculation of
[MeV]E
[MeV
]L
0.0
0.5
1.0
1.5
2.0
2.5
electron dataalpha data
linear fitBirks’ law fit
(a) LAB+2 g/l PPO+15mg/l bis–MSB
[MeV]E
0 2 4 6 8
0 2 4 6 8
[MeV
]L
0.0
0.5
1.0
1.5
2.0
2.5
electron dataalpha data
linear fitBirks’ law fit
(b) LAB+3g/lPPO+15mg/lbis–MSB
Fig. 5 Light output L in units of electron-equivalent energy as functionof kinetic energy E . L is shown for electrons and α-particles in LABscintillator with 15 mg/l bis-MSB and 2 g/l (a) or 3 g/l PPO (b). The α-particle data is fitted with Eq. 1 including systematic effects as nuisanceparameters. In the shown total uncertainties, the single contributions areadded quadratically
2 % is considered [19,25]. The resulting best fit values for theBirks parameter are kB = (0.0076 ± 0.0003) cm/MeV (seeFig. 5a) and kB = (0.0071±0.0003) cm/MeV (see Fig. 5b).The corresponding χ2 values per degree of freedom are 0.73and 1.36, respectively.
These results, obtained using the two LAB samples whichonly differ in the concentration of the primary fluor, agreewithin 1.2 σ . This is in line with the theoretical expectation[2] as well as the observation in [19] that the fluors do notsignificantly affect the ionization quenching parameters atthe given concentrations. Ionization quenching is, accordingto [2], a primary process and thus competing with the exci-tation of the solvent and not with the energy transfers from
123
Eur. Phys. J. C (2016) 76 :109 Page 7 of 13 109
the solvent to the solute, which are referred to as secondaryprocesses.
3 Measurement of α-particle quenching usingsamarium-loaded scintillator
While the α-particle kinetic energy corresponding to anobserved light output is laborious to access in the neutronbeam experiment presented in Sect. 2, its determination isstraight forward observing the peak from an α-source withknown α-particle energy. This requires the use of an internalα-source to avoid energy losses within the source carrier andthe escape of scintillation light produced near the scintillatorsurface. For this reason, LAB with 2 g/l PPO was loaded atBNL with 2 % mass fraction of natSm which contains the α-emitter 147Sm with a natural abundance of 14.99(18) %. Thisisotope decays into 143Nd with a half-life of 1.06 × 10¹¹ y[20]. The kinetic energy of the α-particles is 2.248 MeV,which is lower than the energies accessible by 12C(n,α)9Bereactions. The samarium experiment is thus complementaryto the previously described measurement. The fact that onlyone α-particle energy is observable enhances the sensitivityto the respective energy compared to the situation with mul-tiple energy peaks overlapping in the visible spectrum. Toensure that no background resulting from the radioactivityof the detector and environment fakes an α-peak, an inde-pendent measurement with unloaded LAB + 2 g/l PPO wasconducted.
The high concentration of Sm increases the density of thefull liquid scintillator cocktail to about 0.99 g/cm3. As nodirect measurement of the density was done at the time, itwas calculated assuming a LAB density of 0.86 g/cm3 forthe LAB cocktail [21] and a Sm density of 7.54 g/cm3 [26].
3.1 Experimental setup
To measure the α-particle light output, the liquid scintilla-tor was filled into a UV transparent cylindrical fused silicacuvette5 with a length of 100 mm and a diameter of 19 mm.The cuvette can thus hold about 28 ml Sm-loaded LAB.To avoid oxygen in the cuvette, the filling was performedin a nitrogen atmosphere. The LAB solution itself was de-oxygenated by bubbling it for 30 min with gaseous nitro-gen. The filled cuvette was covered with Teflon (PTFE) tapeto improve the reflectivity at the cuvette walls. Each frontof the cuvette was coupled to an R2059-01 PMT using UVtransparent Baysilone M 200.000 silicon grease. This type ofphototube is equipped with a fused silica window and pro-vides an increased UV sensitivity. An active voltage dividerguaranteeing long term stability in gain was used for the
5 Hellma Analytics.
high voltage supply of the PMTs [27]. The setup with twoPMTs operating in coincidence mode enabled the suppres-sion of thermal noise and improves the position dependentresolution. The cuvette was covered with aluminum foil anda heat-shrink tube, to screen it from light, and was tested tobe light tight.
The signal of each PMT was split. One signal was directedto a fast Acqiris DC-282 digitizer, the other one was fedinto an Ortec 584 constant fraction discriminator (CFD). TheCFD threshold was set close to the electronic noise level, toallow the detection also of small pulses. The signals from theCFD were fed into a fast coincidence unit with a coincidencetime window of 50 ns. In case the coincidence condition wasfulfilled, data taking was triggered and the time dependent,digitalized pulse was stored. The coincidence events werestored event-by-event. Each stored pulse was subsequentlyintegrated, providing the PH of the event in arbitrary units(arb.u.). The PH scale is calibrated with standard γ -raysources.
3.2 Calibration
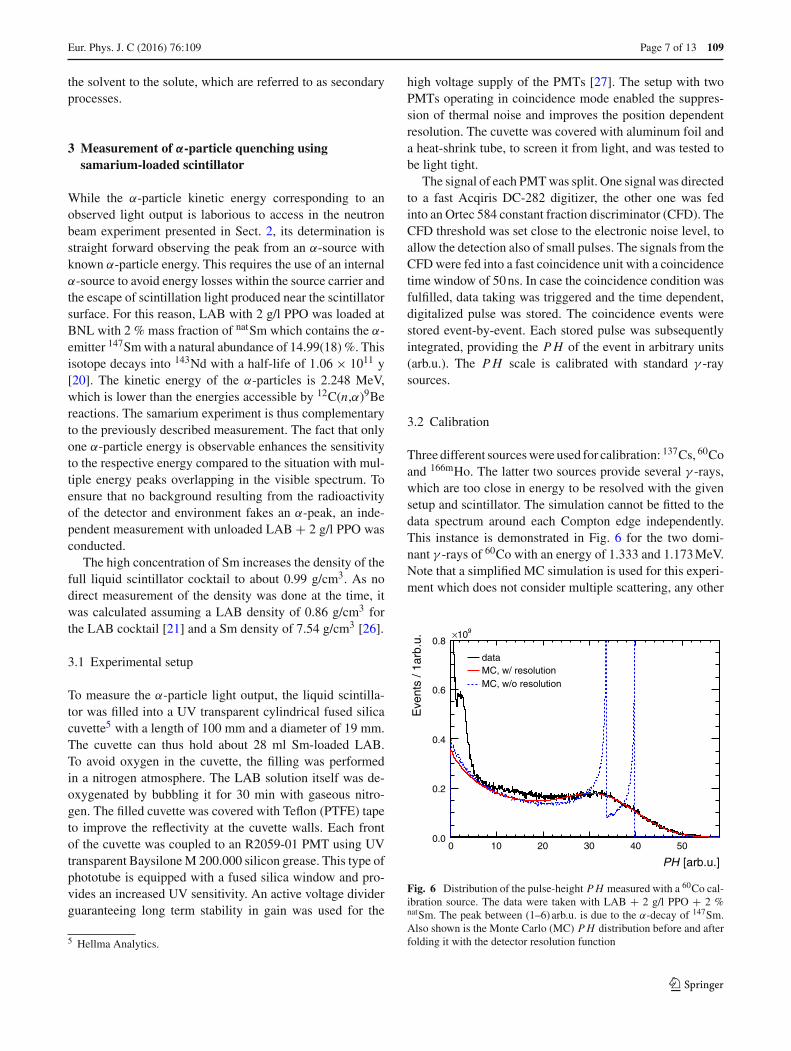
Three different sources were used for calibration: 137Cs, 60Coand 166mHo. The latter two sources provide several γ -rays,which are too close in energy to be resolved with the givensetup and scintillator. The simulation cannot be fitted to thedata spectrum around each Compton edge independently.This instance is demonstrated in Fig. 6 for the two domi-nant γ -rays of 60Co with an energy of 1.333 and 1.173 MeV.Note that a simplified MC simulation is used for this experi-ment which does not consider multiple scattering, any other
[arb.u.]PH
0 10 20 30 40 50
Eve
nts
/ 1ar
b.u.
0.0
0.2
0.4
0.6
0.8910×
dataMC, w/ resolutionMC, w/o resolution
Fig. 6 Distribution of the pulse-height PH measured with a 60Co cal-ibration source. The data were taken with LAB + 2 g/l PPO + 2 %natSm. The peak between (1–6) arb.u. is due to the α-decay of 147Sm.Also shown is the Monte Carlo (MC) PH distribution before and afterfolding it with the detector resolution function
123

109 Page 8 of 13 Eur. Phys. J. C (2016) 76 :109
interaction than Compton scattering, secondary photons orsurface effects. The only detector effect considered is thePH resolution. This treatment does not fully reproduce thedata below the Compton edges including the distinct peakbetween (1–6) arb.u. from the α-decay of 147Sm. However,the region of interest for the calibration is the region aroundthe Compton edges, which is well-described by this calcula-tion.
As a consequence of the unresolved single Comptonedges, only the weighted mean value of the γ -energiesis used per source, i.e. Eγ = 1.041 MeV for 60Co andEγ = 0.571 MeV for 166mHo. In total three calibrationdata points PHi are thus accessible. A fit of Eq. 3 tothese data points results in the calibration parameters m =(38.1 ± 1.8)arb.u./MeV and a = (−2.8 ± 1.2)arb.u. usingSm-loaded LAB and m = (60.0 ± 9.6)arb.u./MeV anda = (−2.7 ± 0.4)arb.u. using unloaded LAB.
3.3 Determination of the 147Sm α-peak position
The calibrated background distribution measured withunloaded LAB is shown in Fig. 7. It is expected to mainlyconsist of events induced by β-particles and γ -rays of thenatural 238U and 232Th decay chains. This natural back-ground reveals no distinct peak structure and has a rate of(13.76 ± 0.02)1/s, observed over the full dynamic measure-ment range. The background rate above 75 keV, the detec-tion threshold within the measurement with Sm-loaded LAB,amounts to (8.91 ± 0.01)1/s.
The light yield distribution measured with Sm-loadedLAB is shown in Fig. 8. The observed event rate is (75.80 ±0.04)1/s before subtraction of the natural background and
[MeV]L
0.0 0.1 0.2 0.3
Eve
nts
/ 1.7
keV
0
10
20
30
40
50
310×
data
Fig. 7 Distribution of the total light yield L in units of electron-equivalent energy of background events measured with LAB + 2 g/lPPO. The background is dominated by β and γ events from the naturalradioactivity of the detector material and from ambient γ -radiation
[MeV]L
0.0 0.1 0.2 0.3
Eve
nts
/ 1ke
V
0
10
20
30
40
50
60310×
datadata without
backgroundγ-βfit
Fig. 8 Distribution of the total light yield L in units of electron-equivalent energy measured with LAB + 2 g/l PPO + 2 % natSm beforeand after background subtraction. This background was measured withunloaded LAB. The peak results from the α-decay of 147Sm and is fittedwith an asymmetric Gaussian distribution
(66.89±0.04)1/s after subtraction of the natural background.The 147Sm activity in 28 ml of 2% natSm-loaded LAB is about69.7 Bq. The observed 147Sm decay rate is lower than the147Sm activity mainly due to a finite detection efficiency.
Note that the bin widths in Figs. 7 and 8 vary due tothe different calibration parameters. The difference has beenaccounted for within the background subtraction. The incom-plete background reduction in Fig. 8 is expected, since theloaded LAB cocktail is expected to have a higher level ofimpurities from the U and Th chain. Though natSm itself alsocontains another unstable isotope, 148Sm, with an abundancesimilar to the one of 147Sm, it does not significantly contributeto the measurement, since its half-life of 7 × 10¹⁵ y is nearlyfour orders of magnitude larger [20]. The chemical purity6 ofthe natSm used is ≥99 % and no further rare Earth elementsare expected to contribute to the background spectrum. Notethat despite the residual natural background, a distinct α-peakdue to the decays of 147Sm isotopes is clearly visible.
The value of L corresponding to an α-particle energy of2.248 MeV is obtained by locating the 147Smα-peak in Fig. 8.Due to the residual background the peak is not fully Gaus-sian, but slightly asymmetric. Thus a generalization of theGaussian distribution function,
f (L) = e− (L−ξ)2
2ω2
√2πω
× erfc
[− s(L − ξ)√
2ω
], (10)
is used, which allows for non-zero skewness [28,29]. Thefunction “erfc(x)” is the complementary Gauss error func-tion, which equals one if the distribution is symmetric. In
6 ACS grade from Sigma-Aldrich.
123
Eur. Phys. J. C (2016) 76 :109 Page 9 of 13 109
this case, the shape parameter s is zero. The parameters ξ
and ω approximate the mean value and standard deviationof the distribution as it approximates a normal distribution.The best fit of Eq. 10 is used instead of a centroid calcu-lation, since it revealed to be more robust and furthermorereproduces the peak region well, as shown in Fig. 8.
The χ2 value of the best fit distribution over the num-ber of degrees of freedom amounts to 337/83. The posi-tion of the maximum of this distribution corresponds tothe value of L at 2.248 MeV and is determined to beL = (0.157 ± 0.032) MeV. The given total uncertainty isobtained by error propagation, considering the uncertaintyon the PMT gain, the uncertainty on the calibration parame-ters m and a (see Sect. 3.2) and the fit uncertainty. The PMTgain variations are measured to be less than ±1 %. The fituncertainty is 1 × 10⁻⁴ MeV. According to the presentedmeasurement, the α-particle light output at E = 2.248 MeVis quenched by a factor of 14.3 ± 2.9 compared to elec-trons. A χ2 fit of Birks’ law Eq. 1 to the obtained data pointyields kB = (0.0066 ± 0.0016) cm/MeV. Also in this case,(dE/dx)(E) is calculated using srim. This fit is only pos-sible, since L(0 MeV) = 0 MeV, which fixes the fit at thispoint. The given total uncertainty on kB is the quadratic sumof the individual contributions and includes a 10 % uncer-tainty on the calculated Sm-LAB density. This uncertainty ischosen arbitrarily large and amounts to ±0.0007 cm/MeV.Thus, an accurate measurement of the density can reduce thetotal uncertainty to 0.0014 cm/MeV. The data point and bestfit function is presented and discussed in Sect. 5.
4 Measurement of α-particle quenching usingscintillator internal radioactivity and the SNO+detector
The third experiment discussed here is the bucket sourceexperiment. It was conducted in 2008 during the transitionphase from the SNO [30] to the SNO+ [12] experiment. Inthis phase, the entire SNO/SNO+ detector was filled withwater. The results are presented here by courtesy of the SNO+collaboration.
4.1 Experimental setup
The SNO+ detector is installed in a barrel-shaped 34 m deepand ≤22 m wide cavity. The center of the detector is formedfrom a 12 m diameter acrylic vessel (AV) of 5 cm thick-ness, connected to the deck area via a cylindrical neck andsupported by a hanging rope system. It is surrounded by aPMT support structure (PSUP), a 17.8 m diameter geodesicstainless steel frame holding more than 9400 Hamamatsu8′′-R1408-PMTs. Each PMT is equipped with a reflectivecollar. This configuration yields a solid angle coverage of
about 54 % [30]. The former SNO detector was a Cherenkovdetector, optimized for the detection of UV photons.
The bucket source measurement used a cylindrical UVtransparent acrylic flask, the so-called bucket, housing about1 l of liquid scintillator. It was deployed into the water insidethe AV. The investigated scintillator is raw LAB with 2 g/lPPO.
The number Nhit of PMTs firing in an event is used as ameasure of PH . This number is corrected, accounting for thenumber of non-working PMTs and the number of PMTs thatwere hit more than once during one event. One event refersto a trigger window of 400 ns. The PH scale is calibratedusing an americium-beryllium (AmBe) source.
4.2 Calibration
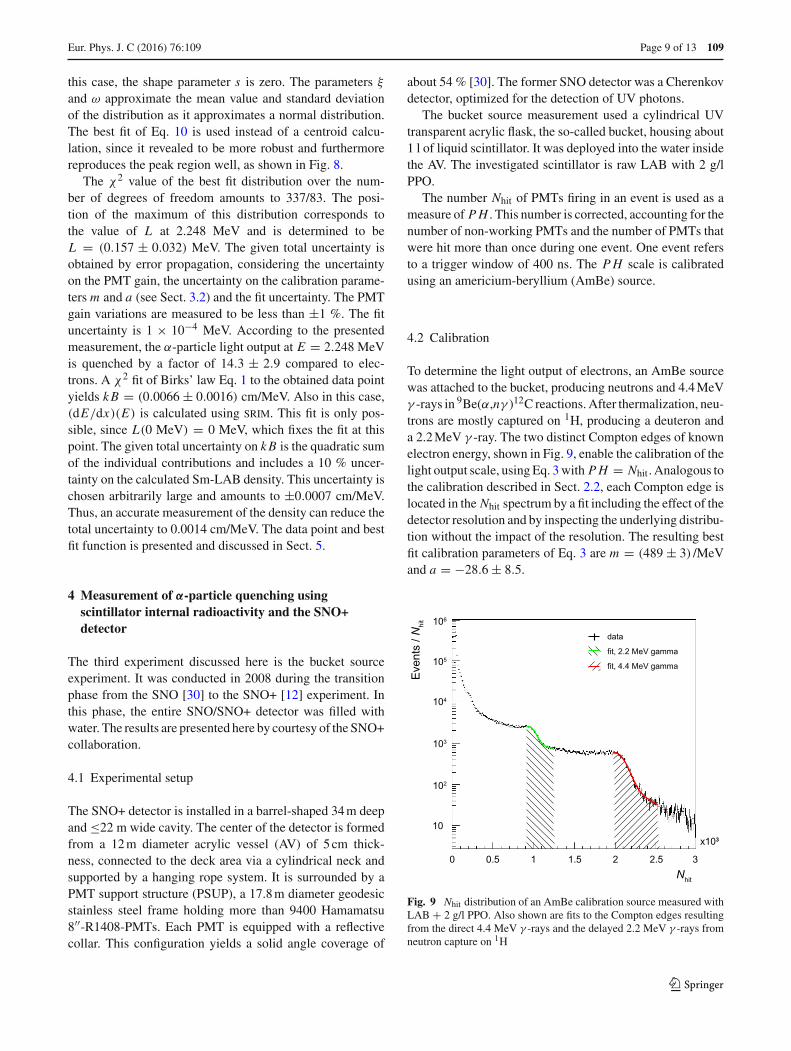
To determine the light output of electrons, an AmBe sourcewas attached to the bucket, producing neutrons and 4.4 MeVγ -rays in 9Be(α,nγ )12C reactions. After thermalization, neu-trons are mostly captured on 1H, producing a deuteron anda 2.2 MeV γ -ray. The two distinct Compton edges of knownelectron energy, shown in Fig. 9, enable the calibration of thelight output scale, using Eq. 3 with PH = Nhit. Analogous tothe calibration described in Sect. 2.2, each Compton edge islocated in the Nhit spectrum by a fit including the effect of thedetector resolution and by inspecting the underlying distribu-tion without the impact of the resolution. The resulting bestfit calibration parameters of Eq. 3 are m = (489 ± 3) /MeVand a = −28.6 ± 8.5.
Fig. 9 Nhit distribution of an AmBe calibration source measured withLAB + 2 g/l PPO. Also shown are fits to the Compton edges resultingfrom the direct 4.4 MeV γ -rays and the delayed 2.2 MeV γ -rays fromneutron capture on 1H
123
109 Page 10 of 13 Eur. Phys. J. C (2016) 76 :109
4.3 Determination of the α-particle response
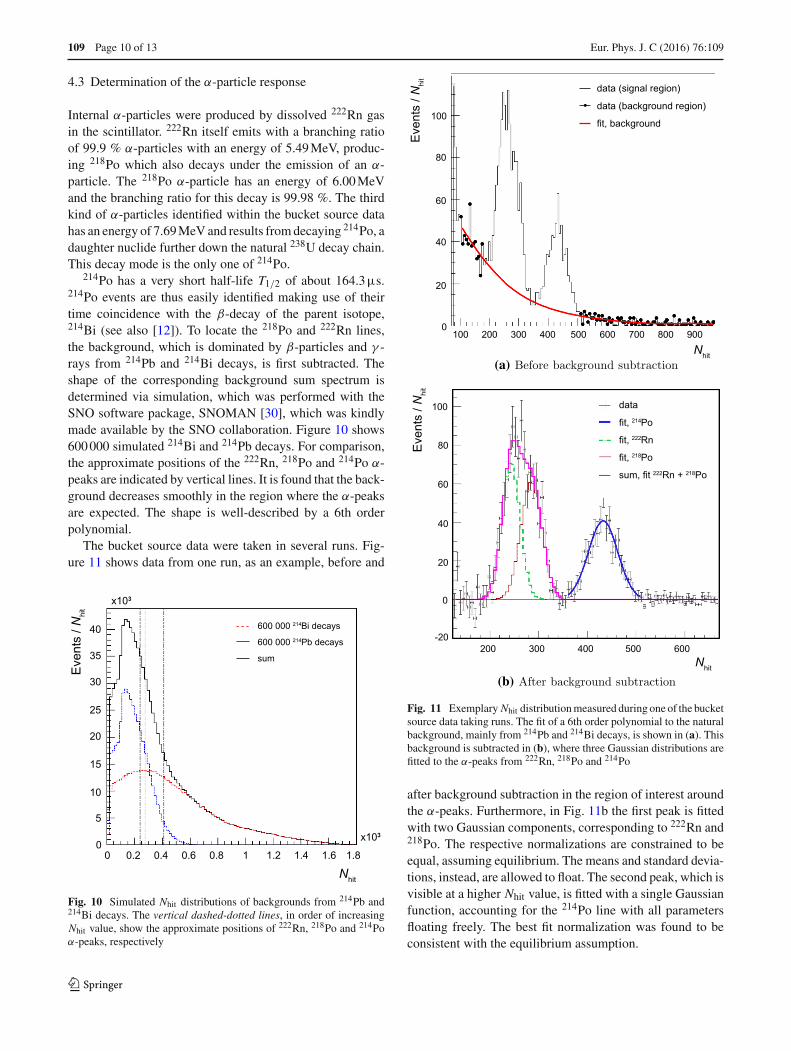
Internal α-particles were produced by dissolved 222Rn gasin the scintillator. 222Rn itself emits with a branching ratioof 99.9 % α-particles with an energy of 5.49 MeV, produc-ing 218Po which also decays under the emission of an α-particle. The 218Po α-particle has an energy of 6.00 MeVand the branching ratio for this decay is 99.98 %. The thirdkind of α-particles identified within the bucket source datahas an energy of 7.69 MeV and results from decaying 214Po, adaughter nuclide further down the natural 238U decay chain.This decay mode is the only one of 214Po.
214Po has a very short half-life T1/2 of about 164.3µs.214Po events are thus easily identified making use of theirtime coincidence with the β-decay of the parent isotope,214Bi (see also [12]). To locate the 218Po and 222Rn lines,the background, which is dominated by β-particles and γ -rays from 214Pb and 214Bi decays, is first subtracted. Theshape of the corresponding background sum spectrum isdetermined via simulation, which was performed with theSNO software package, SNOMAN [30], which was kindlymade available by the SNO collaboration. Figure 10 shows600 000 simulated 214Bi and 214Pb decays. For comparison,the approximate positions of the 222Rn, 218Po and 214Po α-peaks are indicated by vertical lines. It is found that the back-ground decreases smoothly in the region where the α-peaksare expected. The shape is well-described by a 6th orderpolynomial.
The bucket source data were taken in several runs. Fig-ure 11 shows data from one run, as an example, before and
Fig. 10 Simulated Nhit distributions of backgrounds from 214Pb and214Bi decays. The vertical dashed-dotted lines, in order of increasingNhit value, show the approximate positions of 222Rn, 218Po and 214Poα-peaks, respectively
(a) Before background subtraction
(b) After background subtraction
Fig. 11 Exemplary Nhit distribution measured during one of the bucketsource data taking runs. The fit of a 6th order polynomial to the naturalbackground, mainly from 214Pb and 214Bi decays, is shown in (a). Thisbackground is subtracted in (b), where three Gaussian distributions arefitted to the α-peaks from 222Rn, 218Po and 214Po
after background subtraction in the region of interest aroundthe α-peaks. Furthermore, in Fig. 11b the first peak is fittedwith two Gaussian components, corresponding to 222Rn and218Po. The respective normalizations are constrained to beequal, assuming equilibrium. The means and standard devia-tions, instead, are allowed to float. The second peak, which isvisible at a higher Nhit value, is fitted with a single Gaussianfunction, accounting for the 214Po line with all parametersfloating freely. The best fit normalization was found to beconsistent with the equilibrium assumption.
123

Eur. Phys. J. C (2016) 76 :109 Page 11 of 13 109
Table 1 Mean Nhit values measured at an α-particle energy Eα andlight output L in units of electron-equivalent energy after calibration.The uncertainty on L results from error propagation of the uncertaintieson Nhit and the calibration parameters m and a. The scintillator used isLAB + 2 g/l PPO
α-Emitter Eα [MeV] Nhit L [MeV]
222Rn 5.49 246.4 ± 2.2 0.56 ± 0.02218Po 6.00 284.2 ± 2.1 0.64 ± 0.02214Po 7.69 422.2 ± 2.6 0.92 ± 0.02
The best fit values of the Gaussian mean and the respe-ctive uncertainties provide the three data points listed inTable 1. Also listed are the values of the resulting light outputL in units electron-equivalent energy. The uncertainty of Lis obtained by propagating the uncertainties of the calibra-tion parameters and the observed Nhit value. A fit of Birks’law Eq. 1 to the three values of L yields kB = (0.0072 ±0.0003)cm/MeV. Also in this analysis, (dE/dx)(E) is cal-culated using srim. The best fit function is presented togetherwith the bucket source data points in the next section.
5 Comparison of the results from the three independentα-particle quenching experiments
All light output data points, measured with the three pre-sented experiments, are shown in Fig. 12. For better visibility,the results from the two LAB samples used for the neutronbeam experiment are compared to the other two experimentsindividually in Fig. 12a, b. Additionally shown are the indi-vidual best fit light output functions, parameterized by Birks’law Eq. 1. The corresponding best fit values are summarizedin Table 2.
The best fit to the 147Sm data reveals an overly smallreduced χ2 value due to the fact that only a single data pointexists which additionally has a large uncertainty. Further-more, the obtained best fit kB value has the largest uncer-tainty and is smaller than the results from the neutron beamand bucket source experiments. The large uncertainty on kBresults mainly from the uncertainty on the calibration param-eters. It could be reduced in a future experiment by the useof an additional fluor, like bis-MSB, to improve the lightoutput resolution and by the use of a greater variety of cali-bration sources with at best well-separated Compton edges. Itis important to note, though, that all best fit kB values, deter-mined in the three different experiments, agree well withintheir total uncertainties.
The neutron beam data, observed with LAB + 3 g/l PPO +15 mg/l bis-MSB, is in excellent agreement with the bucketsource data (see Fig. 12b) and also the fitted light outputfunctions agree remarkably well. A slight tension among
[MeV]E0 2 4 6 8
[MeV
]L
0.0
0.2
0.4
0.6
0.8
1.0
1.2 neutron beam data (2 g/l PPO)bucket source data
Sm data147
Birks’ law, fit to beam dataBirks’ law, fit to bucket data
Sm data147Birks’ law, fit to
(a) Neutron beam sample:2 g/l PPO+15mg/l bis–MSB
[MeV]E
0 2 4 6 8
[MeV
]L
0.0
0.2
0.4
0.6
0.8
1.0
1.2 neutron beam data (3 g/l PPO)bucket source data
Sm data147
Birks’ law, fit to beam dataBirks’ law, fit to bucket data
Sm data147Birks’ law, fit to
(b) Neutron beam sample:3 g/l PPO+15mg/l bis–MSB
Fig. 12 Light output L of α-particles in units of electron-equivalentenergy as a function of the kinetic energy E . The LAB scintillator usedfor the data taken with the neutron beam contained 2 g/l PPO + 15 mg/lbis-MSB (a) or 3 g/l PPO + 15 mg/l bis-MSB (b). For an easier compar-ison, the same data from the bucket source and the samarium experimentis shown in both panels. The LAB scintillators used for these experi-ments contained 2 g/l PPO as the only fluor. Also shown is a fit of Birks’law Eq. 1 to each set of data points
data is observed in Fig. 12a though, where LAB + 2 g/l PPO+ 15 mg/l bis-MSB was used in the neutron beam experi-ment. The neutron beam measurement is dominated by sys-tematic uncertainties [19], where the systematic effects aremostly correlated. The correlations have been taken care ofby including all sources of systematics as nuisance parame-ters in the χ2 fit, as discussed in [19]. Inspecting the individ-ual pulls of the systematics revealed that the main contribu-tion to the χ2 is due to the prompt γ -peak centroid position inthe TOF spectrum and the slight non-linearity of the time-to-amplitude converter (TAC) used for the TOF measurement.Thus the small tension among data is due to a systematic
123
109 Page 12 of 13 Eur. Phys. J. C (2016) 76 :109
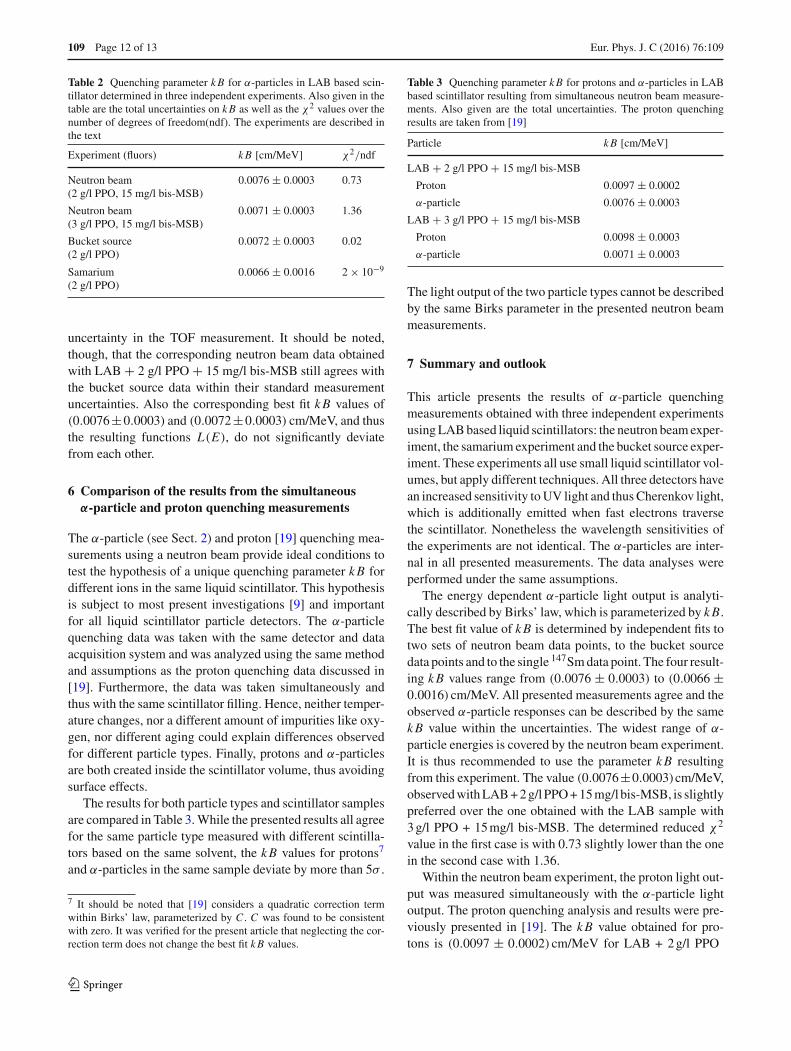
Table 2 Quenching parameter kB for α-particles in LAB based scin-tillator determined in three independent experiments. Also given in thetable are the total uncertainties on kB as well as the χ2 values over thenumber of degrees of freedom(ndf). The experiments are described inthe text
Experiment (fluors) kB [cm/MeV] χ2/ndf
Neutron beam(2 g/l PPO, 15 mg/l bis-MSB)
0.0076 ± 0.0003 0.73
Neutron beam(3 g/l PPO, 15 mg/l bis-MSB)
0.0071 ± 0.0003 1.36
Bucket source(2 g/l PPO)
0.0072 ± 0.0003 0.02
Samarium(2 g/l PPO)
0.0066 ± 0.0016 2 × 10⁻⁹
uncertainty in the TOF measurement. It should be noted,though, that the corresponding neutron beam data obtainedwith LAB + 2 g/l PPO + 15 mg/l bis-MSB still agrees withthe bucket source data within their standard measurementuncertainties. Also the corresponding best fit kB values of(0.0076±0.0003) and (0.0072±0.0003) cm/MeV, and thusthe resulting functions L(E), do not significantly deviatefrom each other.
6 Comparison of the results from the simultaneousα-particle and proton quenching measurements
The α-particle (see Sect. 2) and proton [19] quenching mea-surements using a neutron beam provide ideal conditions totest the hypothesis of a unique quenching parameter kB fordifferent ions in the same liquid scintillator. This hypothesisis subject to most present investigations [9] and importantfor all liquid scintillator particle detectors. The α-particlequenching data was taken with the same detector and dataacquisition system and was analyzed using the same methodand assumptions as the proton quenching data discussed in[19]. Furthermore, the data was taken simultaneously andthus with the same scintillator filling. Hence, neither temper-ature changes, nor a different amount of impurities like oxy-gen, nor different aging could explain differences observedfor different particle types. Finally, protons and α-particlesare both created inside the scintillator volume, thus avoidingsurface effects.
The results for both particle types and scintillator samplesare compared in Table 3. While the presented results all agreefor the same particle type measured with different scintilla-tors based on the same solvent, the kB values for protons7
and α-particles in the same sample deviate by more than 5σ .
7 It should be noted that [19] considers a quadratic correction termwithin Birks’ law, parameterized by C . C was found to be consistentwith zero. It was verified for the present article that neglecting the cor-rection term does not change the best fit kB values.
Table 3 Quenching parameter kB for protons and α-particles in LABbased scintillator resulting from simultaneous neutron beam measure-ments. Also given are the total uncertainties. The proton quenchingresults are taken from [19]
Particle kB [cm/MeV]
LAB + 2 g/l PPO + 15 mg/l bis-MSB
Proton 0.0097 ± 0.0002
α-particle 0.0076 ± 0.0003
LAB + 3 g/l PPO + 15 mg/l bis-MSB
Proton 0.0098 ± 0.0003
α-particle 0.0071 ± 0.0003
The light output of the two particle types cannot be describedby the same Birks parameter in the presented neutron beammeasurements.
7 Summary and outlook
This article presents the results of α-particle quenchingmeasurements obtained with three independent experimentsusing LAB based liquid scintillators: the neutron beam exper-iment, the samarium experiment and the bucket source exper-iment. These experiments all use small liquid scintillator vol-umes, but apply different techniques. All three detectors havean increased sensitivity to UV light and thus Cherenkov light,which is additionally emitted when fast electrons traversethe scintillator. Nonetheless the wavelength sensitivities ofthe experiments are not identical. The α-particles are inter-nal in all presented measurements. The data analyses wereperformed under the same assumptions.
The energy dependent α-particle light output is analyti-cally described by Birks’ law, which is parameterized by kB.The best fit value of kB is determined by independent fits totwo sets of neutron beam data points, to the bucket sourcedata points and to the single 147Sm data point. The four result-ing kB values range from (0.0076 ± 0.0003) to (0.0066 ±0.0016)cm/MeV. All presented measurements agree and theobserved α-particle responses can be described by the samekB value within the uncertainties. The widest range of α-particle energies is covered by the neutron beam experiment.It is thus recommended to use the parameter kB resultingfrom this experiment. The value (0.0076±0.0003) cm/MeV,observed with LAB + 2 g/l PPO + 15 mg/l bis-MSB, is slightlypreferred over the one obtained with the LAB sample with3 g/l PPO + 15 mg/l bis-MSB. The determined reduced χ2
value in the first case is with 0.73 slightly lower than the onein the second case with 1.36.
Within the neutron beam experiment, the proton light out-put was measured simultaneously with the α-particle lightoutput. The proton quenching analysis and results were pre-viously presented in [19]. The kB value obtained for pro-tons is (0.0097 ± 0.0002)cm/MeV for LAB + 2 g/l PPO
123
Eur. Phys. J. C (2016) 76 :109 Page 13 of 13 109
+15 mg/l bis-MSB and (0.0098 ± 0.0003)cm/MeV for LAB+ 3 g/l PPO + 15 mg/l bis-MSB. These proton kB values devi-ate from the corresponding α-particle kB values by 6.4 σ
and 5.8 σ , respectively. Hence, the proton and the α-particlelight responses cannot be reproduced with the same kB value.This observation is fundamental for current and future large-scale liquid scintillator detectors, like SNO+, which requirea precise modeling of the signal and background light yielddistribution over several MeV of electron-equivalent energy,induced by different kinds of particles. A reliable backgroundmodel is crucial for e.g. the development of most efficientbackground rejection techniques.
This article demonstrates that the results obtained withthe neutron beam experiment are transferable to the SNO+experiment, despite non-identical wavelength sensitivities.This finding is very important, since it enables the transferof also the proton quenching results [19] to the SNO+ MCmodel. It furthermore allows to examine further LAB basedscintillators ex situ, which are of interest for SNO+, like Te-loaded LAB [12].
In future laboratory experiments, the influence of thewavelength sensitivity of the detector, particularly in the UVlight region, should be systematically examined. This depen-dence is of interest for all liquid scintillator experiments ingeneral. Besides this, the observed difference in the protonand α-particle quenching parameters motivates systematicmeasurements using heavier ions under identical measure-ment conditions in order to investigate the dependence of kBon ion properties like the mass. Though this investigationis of limited practical relevance for typical liquid scintilla-tor experiments, it is of fundamental interest for the theoryof liquid scintillation and the dependence of kB on the iontype. This kind of measurement is only possible at acceleratorfacilities, where ion beams of sufficiently high energies canbe produced to induce an observable amount of scintillationlight.
Acknowledgments We acknowledge provision of the bucket sourcedata by the SNO+ collaboration and software tools by the SNO collab-oration. We further thank the mechanical workshop of the TU Dresdenfor the production of the scintillator cell as well as Kai Tittelmeier,the accelerator staff of the PTB and Andreas Hartmann from HZDRfor their support. We give thanks to Arnd Sörensen for confirming theR2059-01 PMT gain stability. The LAB solvent was provided by PetresaCanada Inc., Bécancour QC. This work has been in part supported bythe Deutsche Forschungsgemeinschaft (DFG), Germany (Grant no. ZU-123/5), in part by the Science and Technology Facilities Council (STFC)of the United Kingdom (Grants No. ST/J001007/1, ST/K001329/1 andST/M00001X/1) and in part by the U.S. Department of Energy underContract No. DE-SC0012704.
OpenAccess This article is distributed under the terms of the CreativeCommons Attribution 4.0 International License (http://creativecommons.org/licenses/by/4.0/), which permits unrestricted use, distribution,and reproduction in any medium, provided you give appropriate creditto the original author(s) and the source, provide a link to the Creative
Commons license, and indicate if changes were made.Funded by SCOAP3.
References
1. J.B. Birks, Proc. Phys. Soc. A 64, 874 (1951). doi:10.1088/0370-1298/64/10/303
2. J.B. Birks, The Theory and Practice of Scintillation Counting(Pergamon, New York, 1964)
3. E. Brannon, G.L. Olde, Radiat. Res. 16, 1 (1962)4. C. Aberle, C. Buck, F.X. Hartmann, S. Schönert, S. Wagner, JINST
6, P11006 (2011). doi:10.1088/1748-0221/6/11/P110065. T. Novotný, PTB Report PTB-N-28 (1997)6. H. Wan Chan Tseung, J. Kaspar, N. Tolich, Nucl. Instrum. Methods
A 654, 318 (2011). doi:10.1016/j.nima.2011.06.0957. T. Kögler et al., Nucl. Instrum. Methods A 701, 285 (2013). doi:10.
1016/j.nima.2012.10.0598. T. Novotný, L. Büermann, S. Guldbakke, H. Klein, Nucl. Instrum.
Methods A 400, 356 (1997). doi:10.1016/S0168-9002(97)00904-29. V.I. Tretyak, EPJ Web Conf. 65, 02002 (2014). doi:10.1051/
epjconf/20136502002, doi:10.1051/epjconf/2014650200210. The Daya Bay Collaboration, Phys. Rev. Lett. 108, 171803 (2012).
doi:10.1103/PhysRevLett.108.17180311. The RENO Collaboration, Phys. Rev. Lett. 108, 191802 (2012).
doi:10.1103/PhysRevLett.108.19180212. The SNO+ Collaboration, Adv. High Energy Phys. 2016, 6194250
(2015). doi:10.1155/2016/619425013. L. Zhan, Nucl. Phys. Proc. Suppl. B 237–238, 114 (2013). doi:10.
1016/j.nuclphysbps.2013.04.07114. S.-B. Kim, Nucl. Part. Phys. Proc. 265–266, 93–98 (2015).
arXiv:1412.219915. The LENS Collaboration, Phys. At. Nucl. 65, 2161 (2002). doi:10.
1134/1.153029416. B. Cicenas, N. Solomey, Phys. Proced. 37, 1324 (2012). doi:10.
1016/j.phpro.2012.02.47017. H.J. Brede et al., Nucl. Instrum. Methods 169, 349 (1980). doi:10.
1016/0029-554X(80)90928-318. H. Klein, H.J. Barrenscheen, G. Dietze, B.R.L. Siebert, W. Bret-
feld, Nucl. Instrum. Methods 169, 359 (1980). doi:10.1016/0029-554X(80)90929-5
19. B. von Krosigk, L. Neumann, R. Nolte, S. Röttger, K. Zuber, Eur.Phys. J. C 73, 2390 (2013). doi:10.1140/epjc/s10052-013-2390-1
20. L.P. Ekström, R.B. Firestone, WWW Table of Radioactive Iso-topes, database version 2/28/99. http://ie.lbl.gov/toi/. Accessed 22April 2015
21. Petresa Canada Inc., Linear Alkylbenzene, Petrelab 500-Q (P 500-Q) (2009). MSDS
22. G. Dietze, H. Klein, Nucl. Instrum. Methods 193, 549 (1982).doi:10.1016/0029-554X(82)90249-X
23. G. Dietze, H. Klein (1982). PTB Report PTB-ND-2224. J.F. Ziegler, SRIM-2012 computer program. http://www.srim.org/.
Accessed 16 Jan 201325. J.F. Ziegler, J. Appl. Phys. 85, 1249 (1999). doi:10.1063/1.36984426. N.N. Greenwood, A. Earnshaw,Chemie derElemente (VCH, Wein-
heim, 1988)27. R. Beyera et al., Nucl. Instrum. Methods A 575, 449 (2007). doi:10.
1109/NSSMIC.2008.477462528. B.C. Arnold, R.J. Beaver, Test 11, 7 (2002)29. A. Azzalini, The Skew-Normal and Related Families (Cambridge
University Press, Cambridge, 2014). Part of Inst. of Math. Stat.Monographs
30. The SNO Collaboration, Nucl. Instrum. Methods A 449, 172(2000). doi:10.1016/S0168-9002(99)01469-2
123