crecimiento del retail chileno encolombia
DESCRIPTION
Jaime Zawadzki - Gerente General Easy ColombiaTRANSCRIPT
CrecimientodelRetailChilenoenColombia
Mayo2012
1
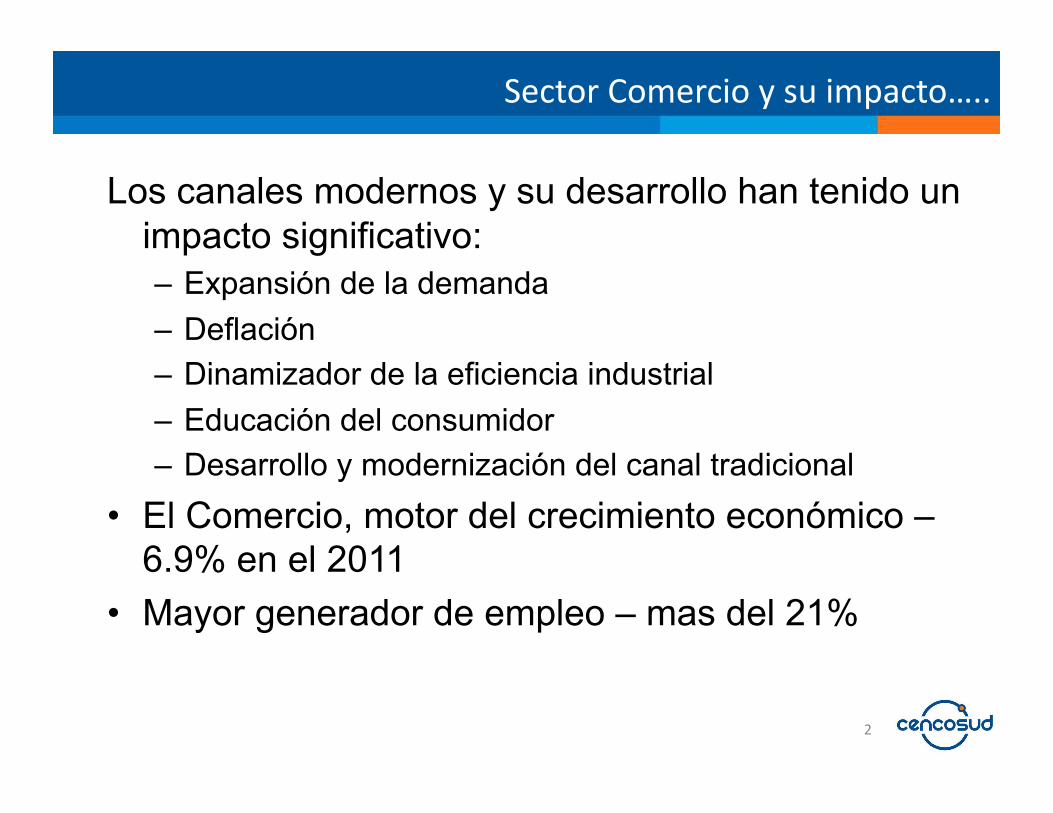
SectorComercioysuimpacto…..
Los canales modernos y su desarrollo han tenido un impacto significativo: – Expansión de la demanda – Deflación – Dinamizador de la eficiencia industrial – Educación del consumidor – Desarrollo y modernización del canal tradicional
• El Comercio, motor del crecimiento económico – 6.9% en el 2011
• Mayor generador de empleo – mas del 21%
2
ResumendelaEmpresa
3
Supermarkets 189
29
35
9
262
269
48
-
14
331
152
-
-
-
152
74
-
-
2
76
-
4
-
-
4
684
81
35
25
825
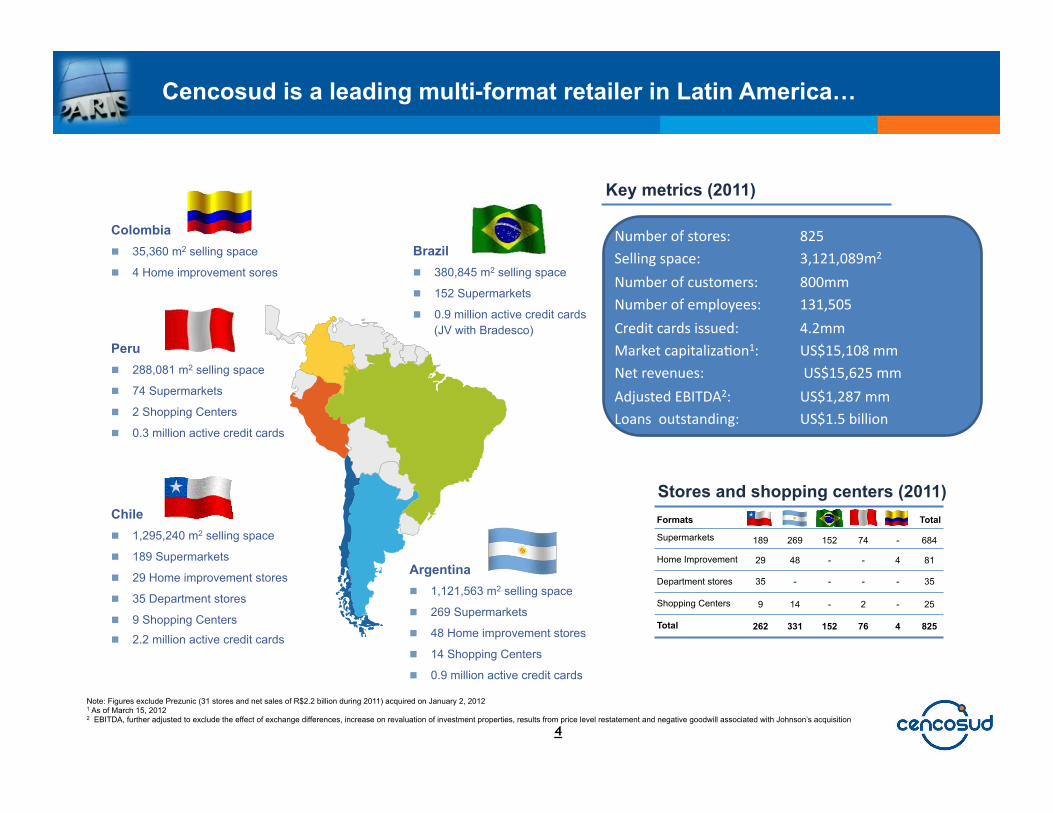
Cencosud is a leading multi-format retailer in Latin America…
Chile 1,295,240 m2 selling space
189 Supermarkets
29 Home improvement stores
35 Department stores
9 Shopping Centers
2.2 million active credit cards
Argentina 1,121,563 m2 selling space
269 Supermarkets
48 Home improvement stores
14 Shopping Centers
0.9 million active credit cards
Brazil 380,845 m2 selling space
152 Supermarkets
0.9 million active credit cards (JV with Bradesco)
Colombia 35,360 m2 selling space
4 Home improvement sores
Peru 288,081 m2 selling space
74 Supermarkets
2 Shopping Centers
0.3 million active credit cards
Note: Figures exclude Prezunic (31 stores and net sales of R$2.2 billion during 2011) acquired on January 2, 2012 1 As of March 15, 2012 2 EBITDA, further adjusted to exclude the effect of exchange differences, increase on revaluation of investment properties, results from price level restatement and negative goodwill associated with Johnson’s acquisition
4
Numberofstores: 825Sellingspace: 3,121,089m2
Numberofcustomers: 800mmNumberofemployees: 131,505
Creditcardsissued: 4.2mmMarketcapitalizaIon1: US$15,108mmNetrevenues: US$15,625mm
AdjustedEBITDA2: US$1,287mmLoansoutstanding: US$1.5billion
Key metrics (2011)
Stores and shopping centers (2011)
Home Improvement
Department stores
Shopping Centers
Total
Formats Total
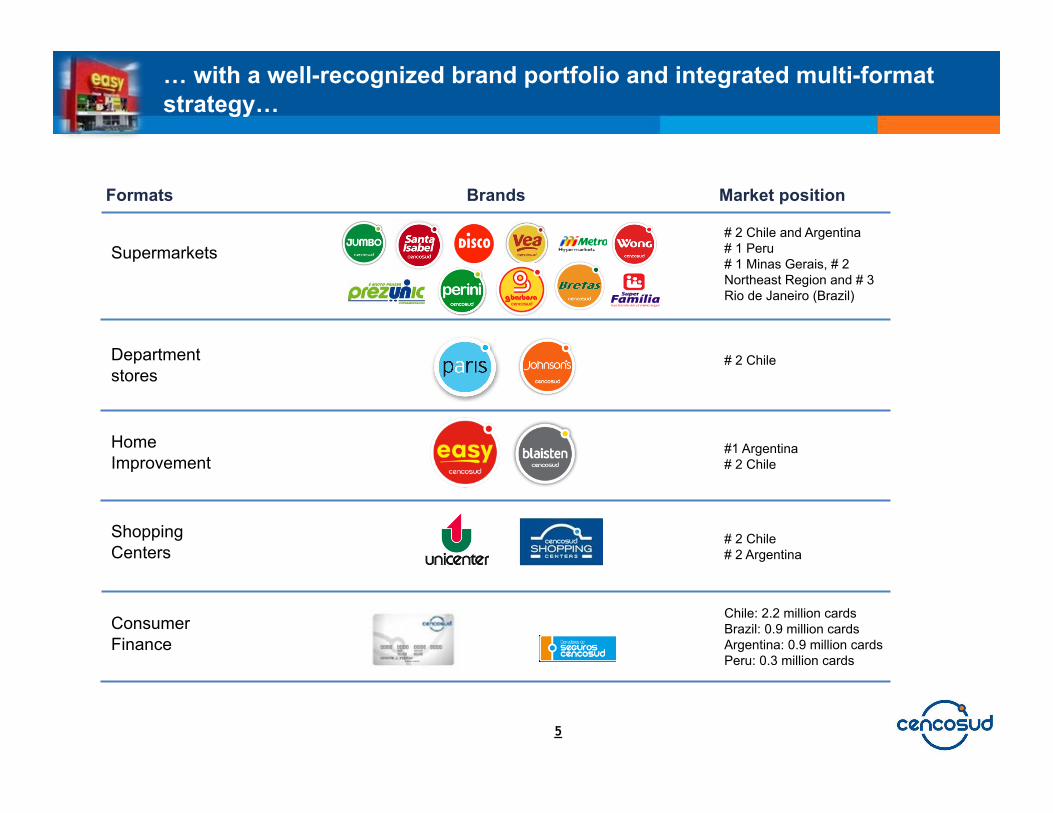
… with a well-recognized brand portfolio and integrated multi-format strategy…
Formats
Supermarkets
Department stores
Home Improvement
Shopping Centers
Consumer Finance
Brands Market position
# 2 Chile and Argentina # 1 Peru # 1 Minas Gerais, # 2 Northeast Region and # 3 Rio de Janeiro (Brazil)
# 2 Chile
#1 Argentina # 2 Chile
# 2 Chile # 2 Argentina
Chile: 2.2 million cards Brazil: 0.9 million cards Argentina: 0.9 million cards Peru: 0.3 million cards
5
2007
2006
2005
2004
2003
2002
2000
1993
1988
1982
1976
2008
2009
Source: Cencosud, Factset Note: Figures exclude Prezunic (31 stores and net sales of R$2.2 billion during 2011) acquired on January 2, 2012 1 EBITDA, further adjusted to exclude the effect of exchange differences, increase on revaluation of investment properties, results from price level restatement and negative goodwill associated with Johnson’s
acquisition 2 As of December 31, 2011
2010
Opened the first supermarket
IPO in the Santiago Stock
Exchange
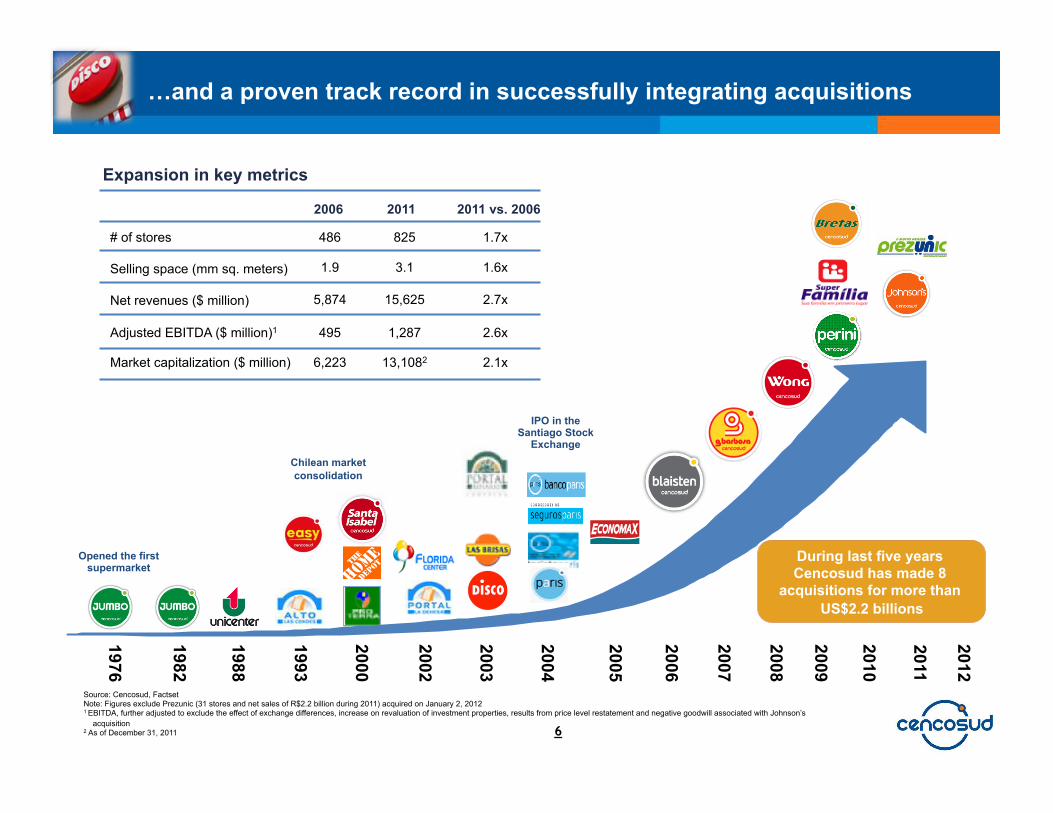
…and a proven track record in successfully integrating acquisitions
And a new cycle of growth has began
6
2011
2012
2006 2011
# of stores
2011 vs. 2006
Selling space (mm sq. meters)
Net revenues ($ million)
Adjusted EBITDA ($ million)1
486
1.9
5,874
495
825
3.1
15,625
1,287
1.7x
1.6x
2.7x
2.6x
Expansion in key metrics
Market capitalization ($ million) 6,223 13,1082 2.1x
Chilean market consolidation
During last five years Cencosud has made 8
acquisitions for more than US$2.2 billions
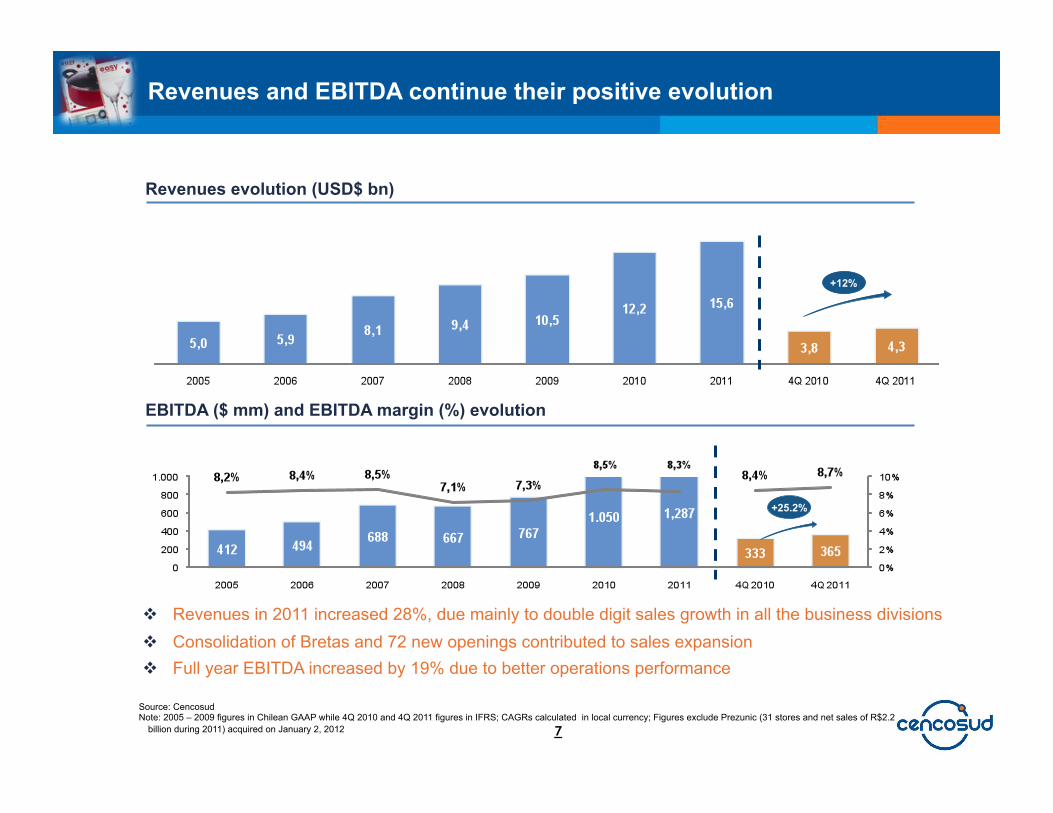
Revenues in 2011 increased 28%, due mainly to double digit sales growth in all the business divisions Consolidation of Bretas and 72 new openings contributed to sales expansion Full year EBITDA increased by 19% due to better operations performance
Revenues evolution (USD$ bn)
EBITDA ($ mm) and EBITDA margin (%) evolution
Revenues and EBITDA continue their positive evolution
Source: Cencosud Note: 2005 – 2009 figures in Chilean GAAP while 4Q 2010 and 4Q 2011 figures in IFRS; CAGRs calculated in local currency; Figures exclude Prezunic (31 stores and net sales of R$2.2
billion during 2011) acquired on January 2, 2012 7
+12%
+25.2%
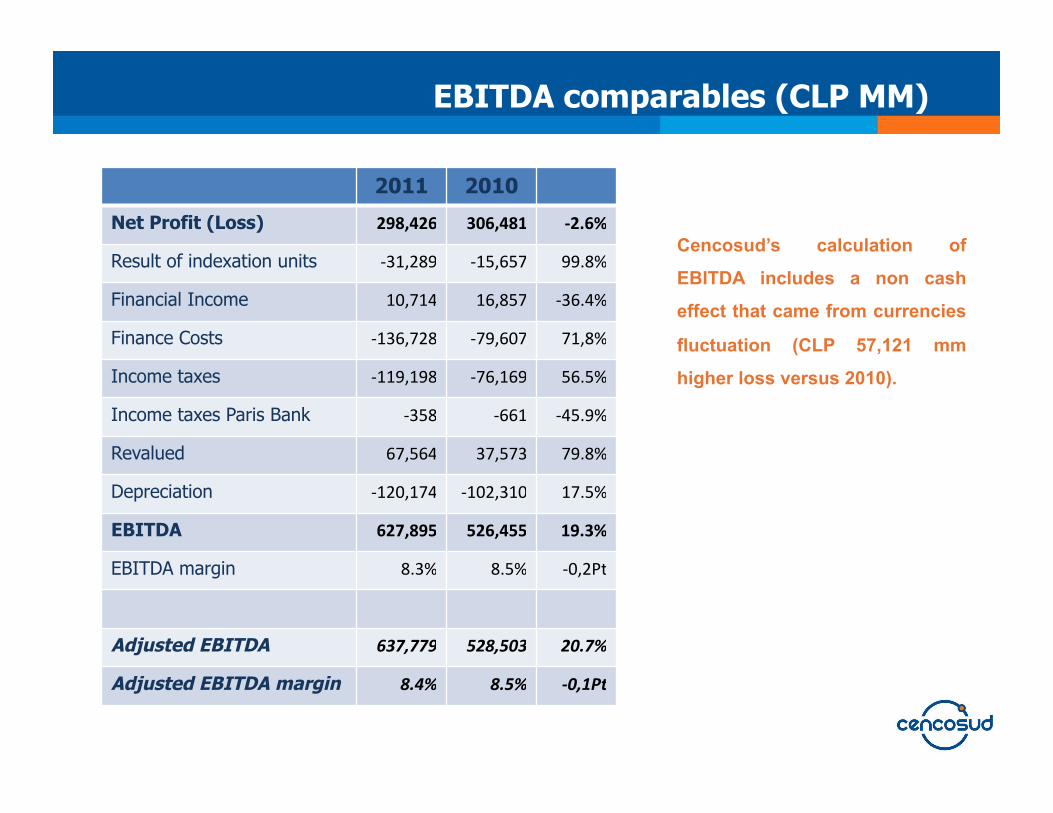
2011 2010
Net Profit (Loss) 298,426 306,481 ‐2.6%
Result of indexation units ‐31,289 ‐15,657 99.8%
Financial Income 10,714 16,857 ‐36.4%
Finance Costs ‐136,728 ‐79,607 71,8%
Income taxes ‐119,198 ‐76,169 56.5%
Income taxes Paris Bank ‐358 ‐661 ‐45.9%
Revalued 67,564 37,573 79.8%
Depreciation ‐120,174 ‐102,310 17.5%
EBITDA 627,895 526,455 19.3%
EBITDA margin 8.3% 8.5% ‐0,2Pt
Adjusted EBITDA 637,779 528,503 20.7%
Adjusted EBITDA margin 8.4% 8.5% ‐0,1Pt
EBITDA comparables (CLP MM)
Cencosud’s calculation of
EBITDA includes a non cash
effect that came from currencies
fluctuation (CLP 57,121 mm
higher loss versus 2010).
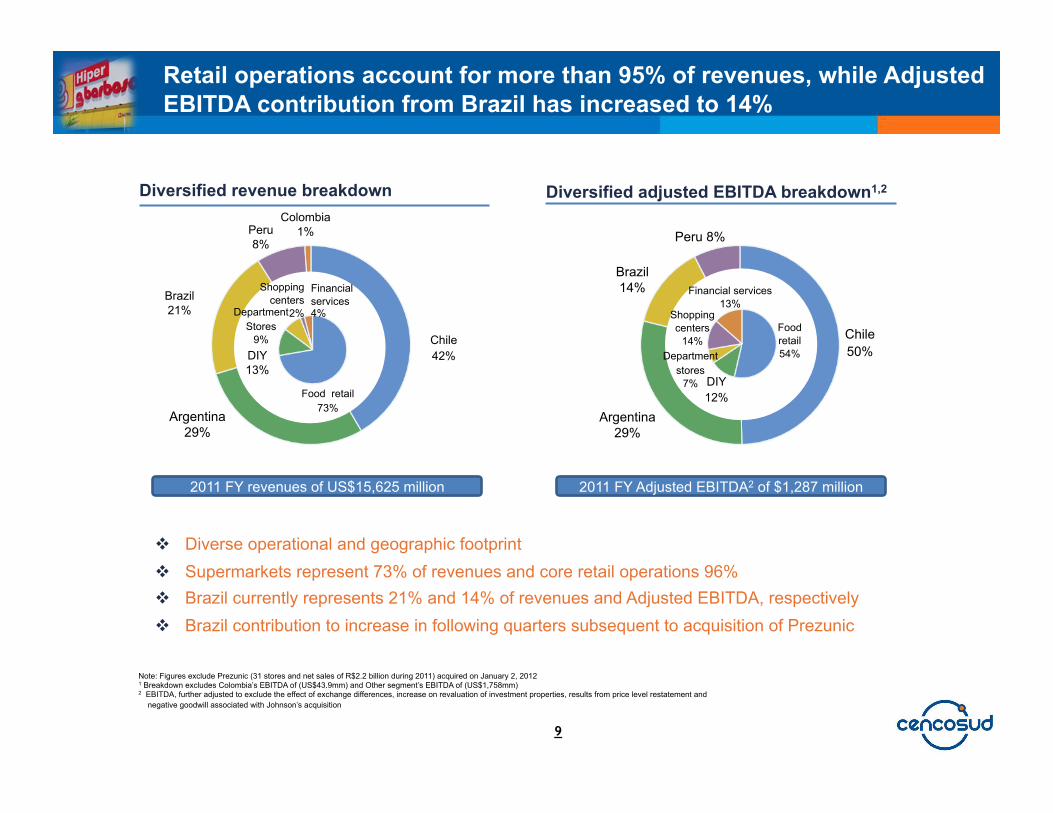
Retail operations account for more than 95% of revenues, while Adjusted EBITDA contribution from Brazil has increased to 14%
Diversified revenue breakdown Diversified adjusted EBITDA breakdown1,2
2011 FY revenues of US$15,625 million
9
2011 FY Adjusted EBITDA2 of $1,287 million
Note: Figures exclude Prezunic (31 stores and net sales of R$2.2 billion during 2011) acquired on January 2, 2012 1 Breakdown excludes Colombia’s EBITDA of (US$43.9mm) and Other segment’s EBITDA of (US$1,758mm) 2 EBITDA, further adjusted to exclude the effect of exchange differences, increase on revaluation of investment properties, results from price level restatement and
negative goodwill associated with Johnson’s acquisition
Diverse operational and geographic footprint Supermarkets represent 73% of revenues and core retail operations 96% Brazil currently represents 21% and 14% of revenues and Adjusted EBITDA, respectively Brazil contribution to increase in following quarters subsequent to acquisition of Prezunic
Chile 42%
Argentina 29%
Brazil 21%
Peru 8%
Colombia 1%
Chile 50%
Argentina 29%
Brazil 14%
Peru 8%
Food retail 54%
DIY 12%
Department stores
7%
Shopping centers
14%
Financial services 13%
Food retail 73%
DIY 13%
Department Stores
9%
Shopping centers
2%
Financial services 4%

FinancialHighlights
10
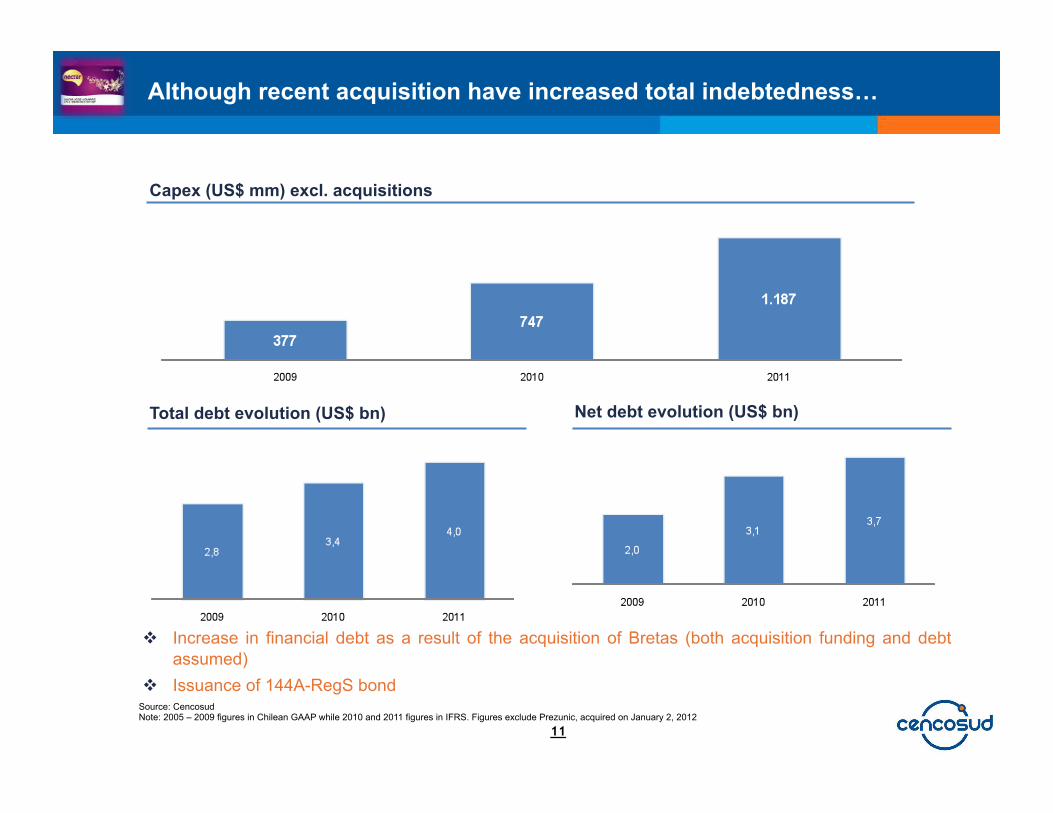
Although recent acquisition have increased total indebtedness…
Total debt evolution (US$ bn) Net debt evolution (US$ bn)
Capex (US$ mm) excl. acquisitions
Source: Cencosud Note: 2005 – 2009 figures in Chilean GAAP while 2010 and 2011 figures in IFRS. Figures exclude Prezunic, acquired on January 2, 2012
Increase in financial debt as a result of the acquisition of Bretas (both acquisition funding and debt assumed)
Issuance of 144A-RegS bond
11
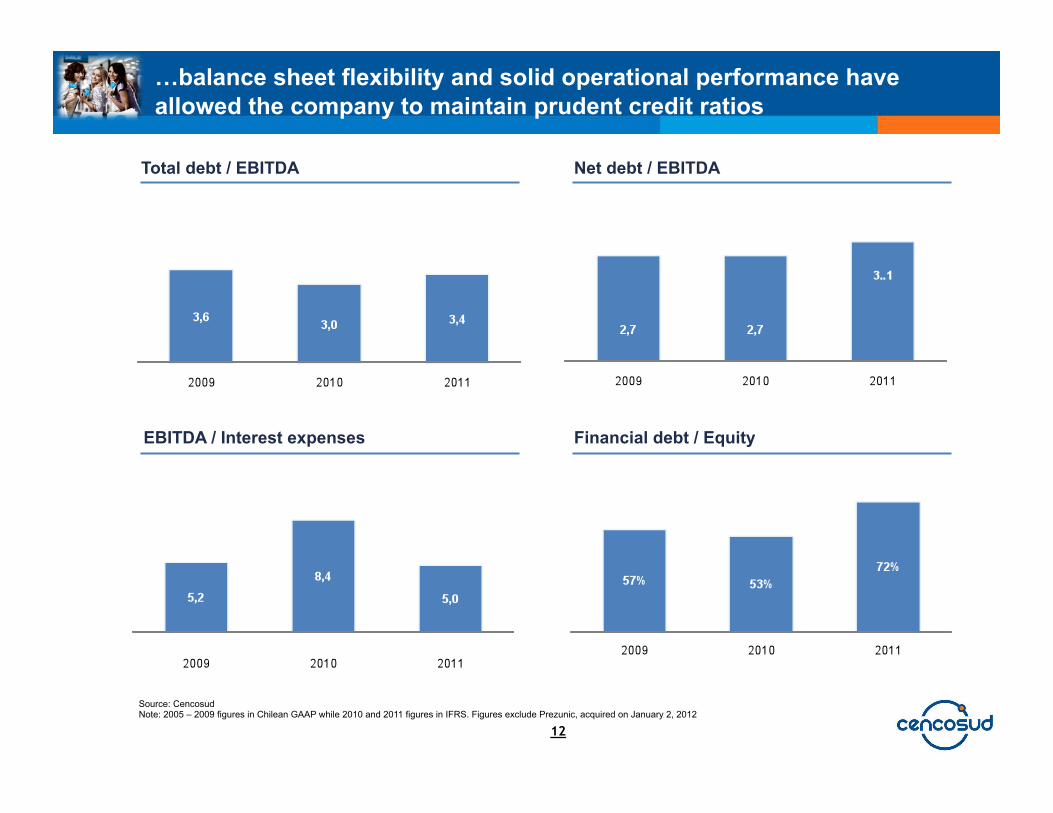
…balance sheet flexibility and solid operational performance have allowed the company to maintain prudent credit ratios
Net debt / EBITDA
Financial debt / Equity
Total debt / EBITDA
EBITDA / Interest expenses
12
Source: Cencosud Note: 2005 – 2009 figures in Chilean GAAP while 2010 and 2011 figures in IFRS. Figures exclude Prezunic, acquired on January 2, 2012
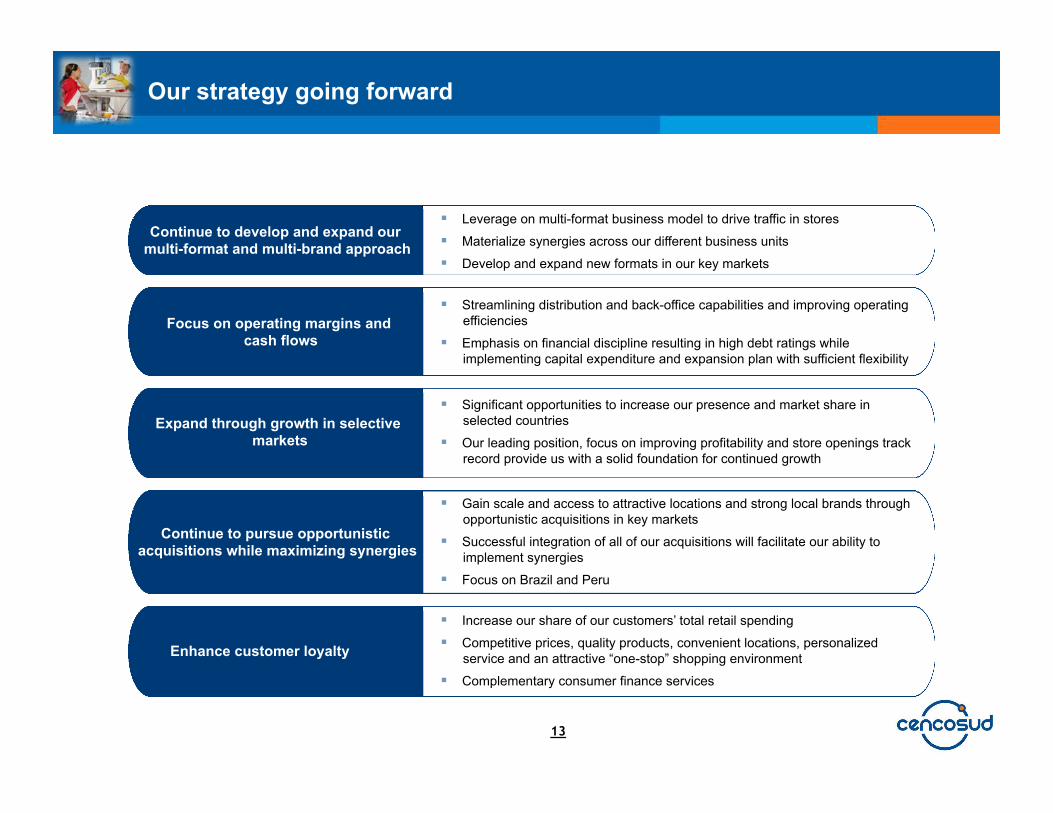
Our strategy going forward
Leverage on multi-format business model to drive traffic in stores
Materialize synergies across our different business units
Develop and expand new formats in our key markets
Continue to develop and expand our multi-format and multi-brand approach
Focus on operating margins and cash flows
Expand through growth in selective markets
Continue to pursue opportunistic acquisitions while maximizing synergies
Enhance customer loyalty
13
Streamlining distribution and back-office capabilities and improving operating efficiencies
Emphasis on financial discipline resulting in high debt ratings while implementing capital expenditure and expansion plan with sufficient flexibility
Significant opportunities to increase our presence and market share in selected countries
Our leading position, focus on improving profitability and store openings track record provide us with a solid foundation for continued growth
Gain scale and access to attractive locations and strong local brands through opportunistic acquisitions in key markets
Successful integration of all of our acquisitions will facilitate our ability to implement synergies
Focus on Brazil and Peru
Increase our share of our customers’ total retail spending
Competitive prices, quality products, convenient locations, personalized service and an attractive “one-stop” shopping environment
Complementary consumer finance services
PrincipalesdetallesdelNegocio
14
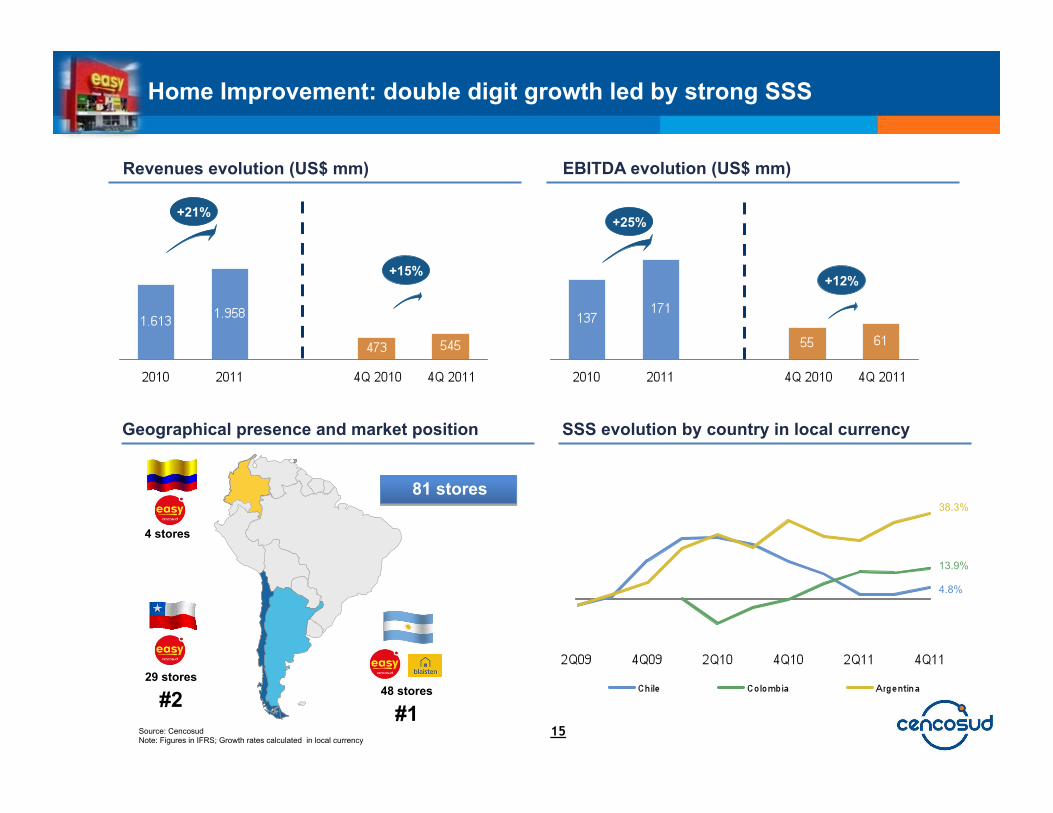
Geographical presence and market position
EBITDA evolution (US$ mm) Revenues evolution (US$ mm)
29 stores
#2
4 stores
48 stores
#1
81 stores
SSS evolution by country in local currency
Home Improvement: double digit growth led by strong SSS
15
+21%
+15%
+25%
+12%
Source: Cencosud Note: Figures in IFRS; Growth rates calculated in local currency
4.8%
13.9%
38.3%
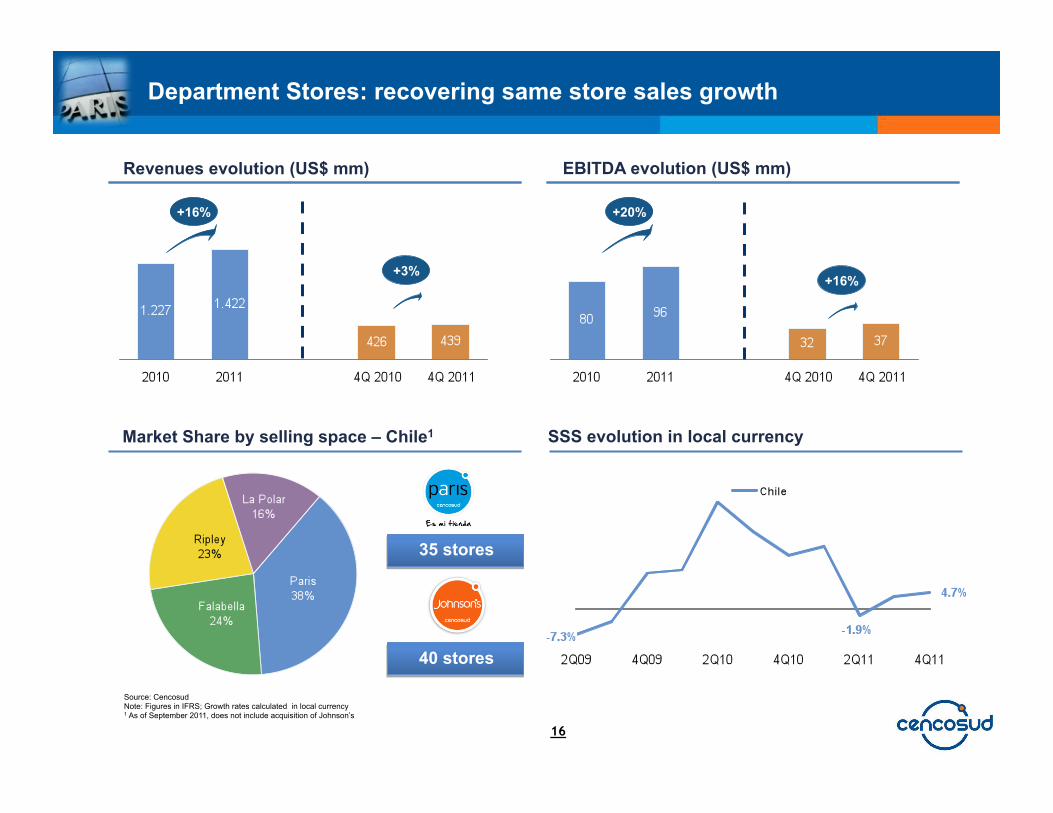
Source: Cencosud Note: Figures in IFRS; Growth rates calculated in local currency 1 As of September 2011, does not include acquisition of Johnson’s
SSS evolution in local currency
Department Stores: recovering same store sales growth
35 stores
16
EBITDA evolution (US$ mm) Revenues evolution (US$ mm)
+16%
+3%
+20%
+16%
40 stores
Market Share by selling space – Chile1
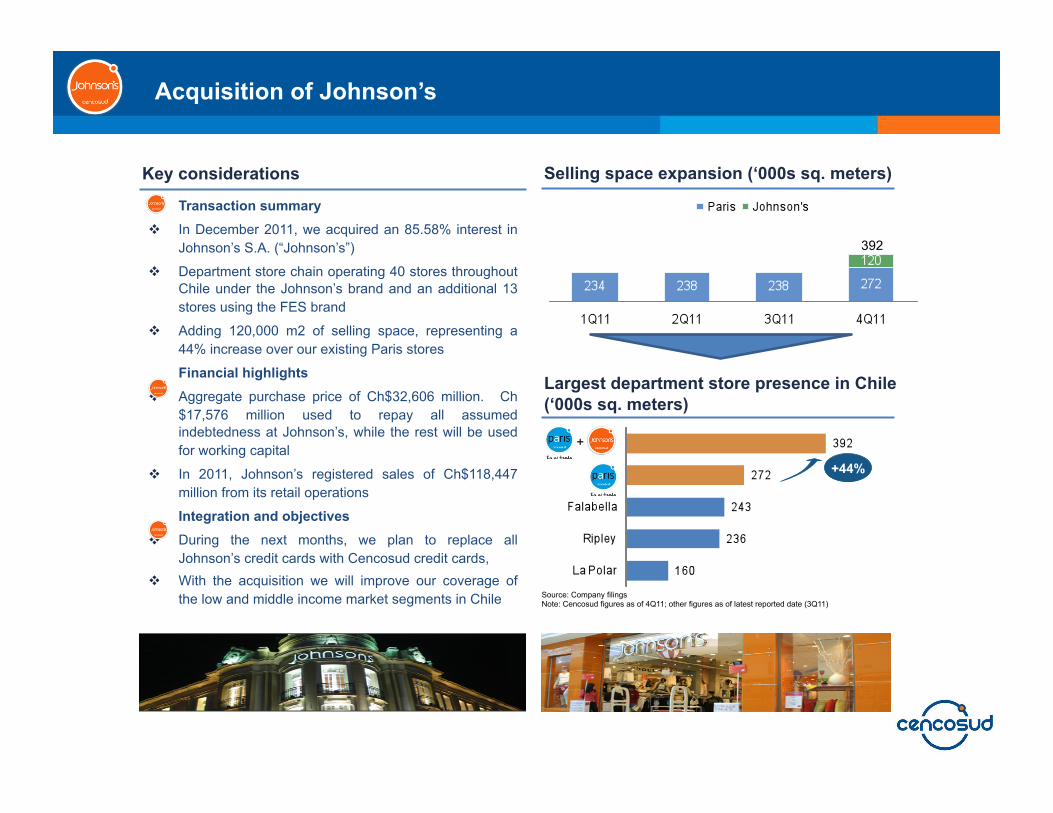
Acquisition of Johnson’s
Transaction summary In December 2011, we acquired an 85.58% interest in
Johnson’s S.A. (“Johnson’s”)
Department store chain operating 40 stores throughout Chile under the Johnson’s brand and an additional 13 stores using the FES brand
Adding 120,000 m2 of selling space, representing a 44% increase over our existing Paris stores
Financial highlights Aggregate purchase price of Ch$32,606 million. Ch
$17,576 million used to repay all assumed indebtedness at Johnson’s, while the rest will be used for working capital
In 2011, Johnson’s registered sales of Ch$118,447 million from its retail operations
Integration and objectives During the next months, we plan to replace all
Johnson’s credit cards with Cencosud credit cards, With the acquisition we will improve our coverage of
the low and middle income market segments in Chile
Key considerations Selling space expansion (‘000s sq. meters)
392
Largest department store presence in Chile (‘000s sq. meters)
+44%
Source: Company filings Note: Cencosud figures as of 4Q11; other figures as of latest reported date (3Q11)
+
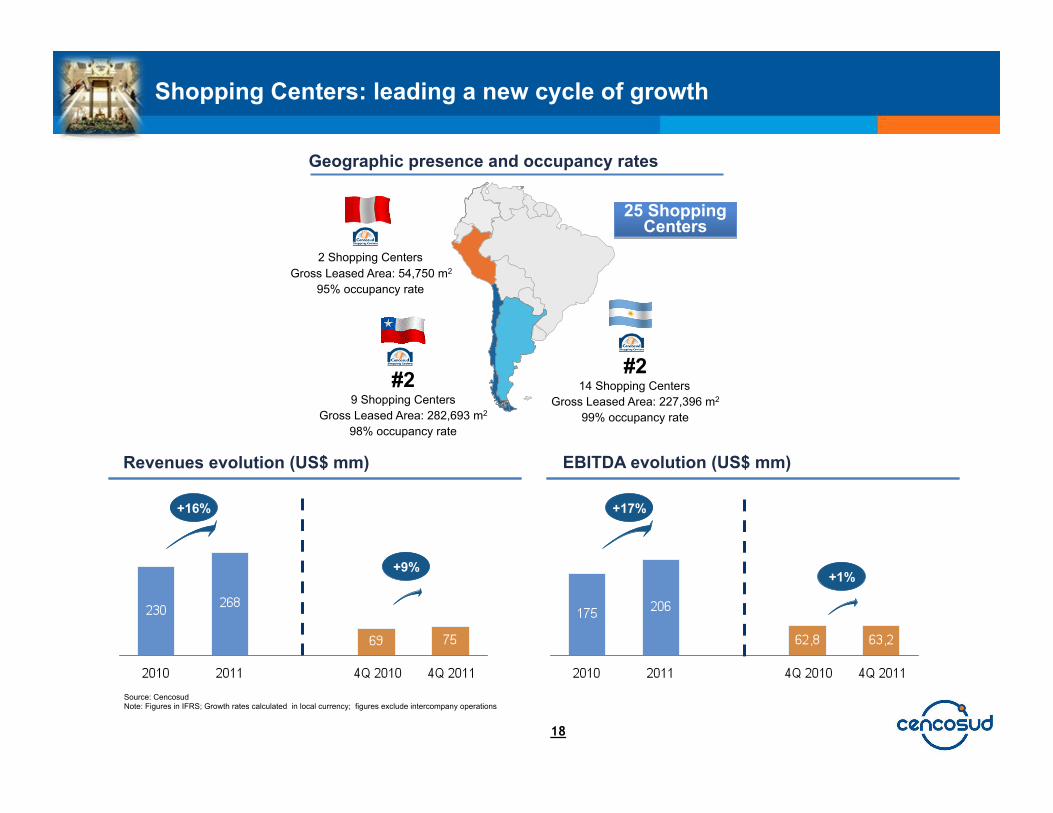
Geographic presence and occupancy rates
#2 14 Shopping Centers
Gross Leased Area: 227,396 m2
99% occupancy rate
#2 9 Shopping Centers
Gross Leased Area: 282,693 m2
98% occupancy rate
2 Shopping Centers Gross Leased Area: 54,750 m2
95% occupancy rate
25 Shopping Centers
Shopping Centers: leading a new cycle of growth
18
EBITDA evolution (US$ mm) Revenues evolution (US$ mm)
+16%
+9%
+17%
+1%
Source: Cencosud Note: Figures in IFRS; Growth rates calculated in local currency; figures exclude intercompany operations
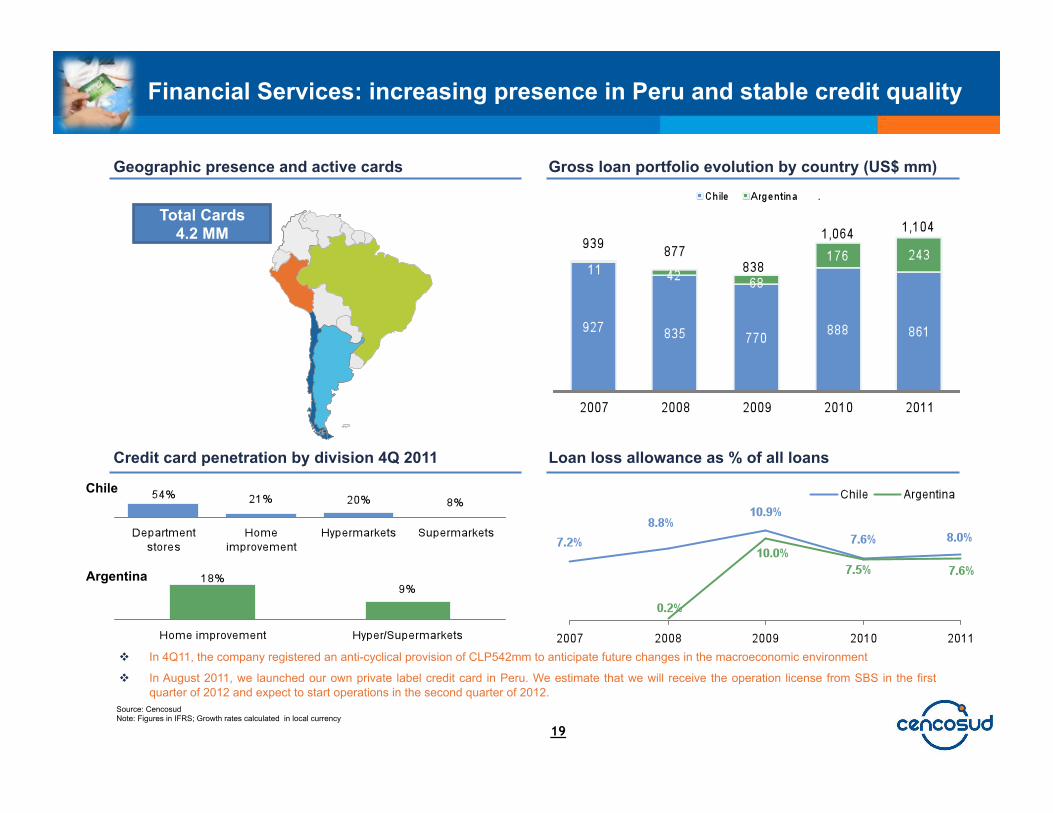
In 4Q11, the company registered an anti-cyclical provision of CLP542mm to anticipate future changes in the macroeconomic environment
In August 2011, we launched our own private label credit card in Peru. We estimate that we will receive the operation license from SBS in the first quarter of 2012 and expect to start operations in the second quarter of 2012.
Credit card penetration by division 4Q 2011
Source: Cencosud Note: Figures in IFRS; Growth rates calculated in local currency
Geographic presence and active cards
Total Cards 4.2 MM
Financial Services: increasing presence in Peru and stable credit quality
Loan loss allowance as % of all loans
Gross loan portfolio evolution by country (US$ mm)
19
Chile
Argentina
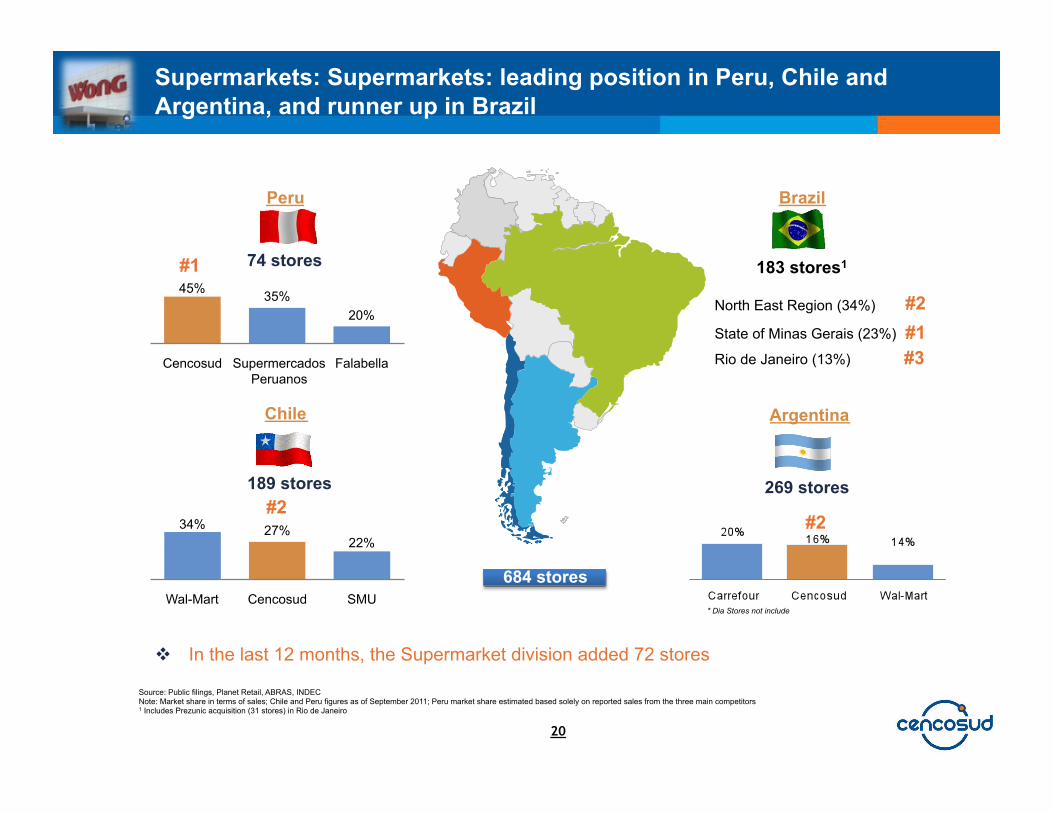
Source: Public filings, Planet Retail, ABRAS, INDEC Note: Market share in terms of sales; Chile and Peru figures as of September 2011; Peru market share estimated based solely on reported sales from the three main competitors 1 Includes Prezunic acquisition (31 stores) in Rio de Janeiro
269 stores
183 stores1
#2
North East Region (34%)
State of Minas Gerais (23%)
Rio de Janeiro (13%) #3
684 stores
74 stores #1
189 stores #2
* Dia Stores not include
#1
In the last 12 months, the Supermarket division added 72 stores
#2
Supermarkets: Supermarkets: leading position in Peru, Chile and Argentina, and runner up in Brazil
Peru
Chile
Brazil
Argentina
45% 35% 20%
Cencosud Supermercados Peruanos
Falabella
20
34% 27% 22%
Wal-Mart Cencosud SMU
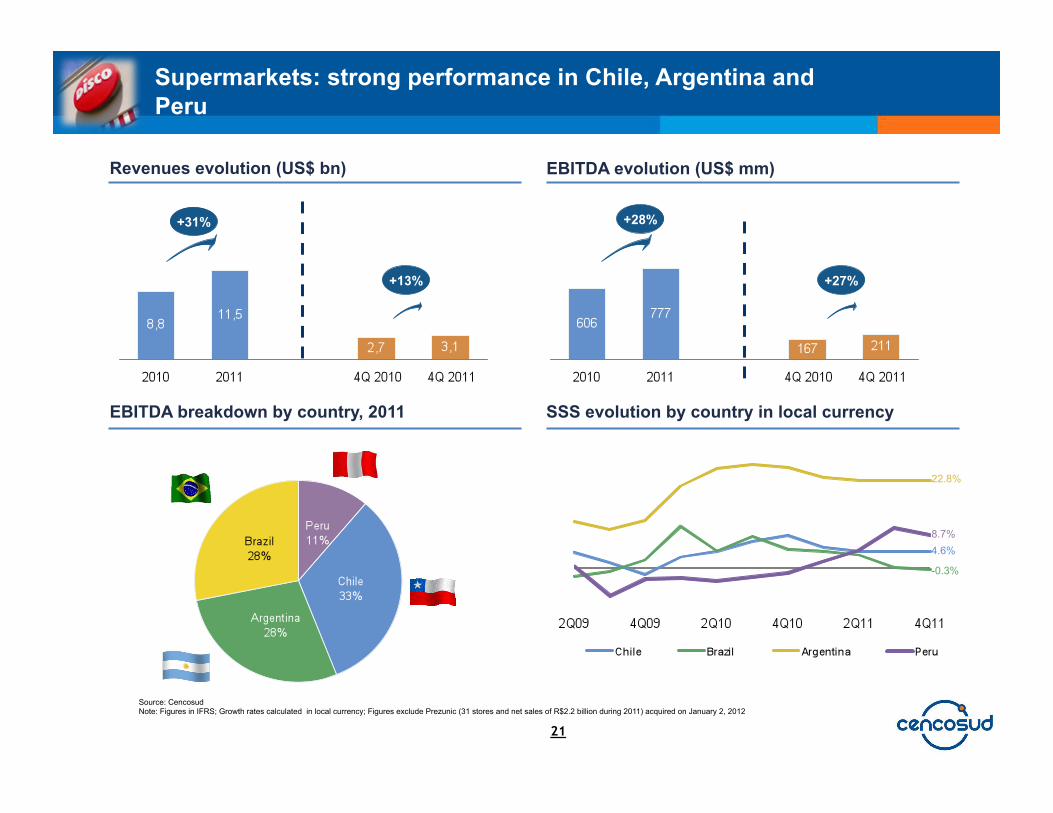
EBITDA breakdown by country, 2011
Revenues evolution (US$ bn) EBITDA evolution (US$ mm)
Source: Cencosud Note: Figures in IFRS; Growth rates calculated in local currency; Figures exclude Prezunic (31 stores and net sales of R$2.2 billion during 2011) acquired on January 2, 2012
SSS evolution by country in local currency
Supermarkets: strong performance in Chile, Argentina and Peru
21
+31%
+13% +27%
+28%
4.6%
-0.3%
8.7%
22.8%
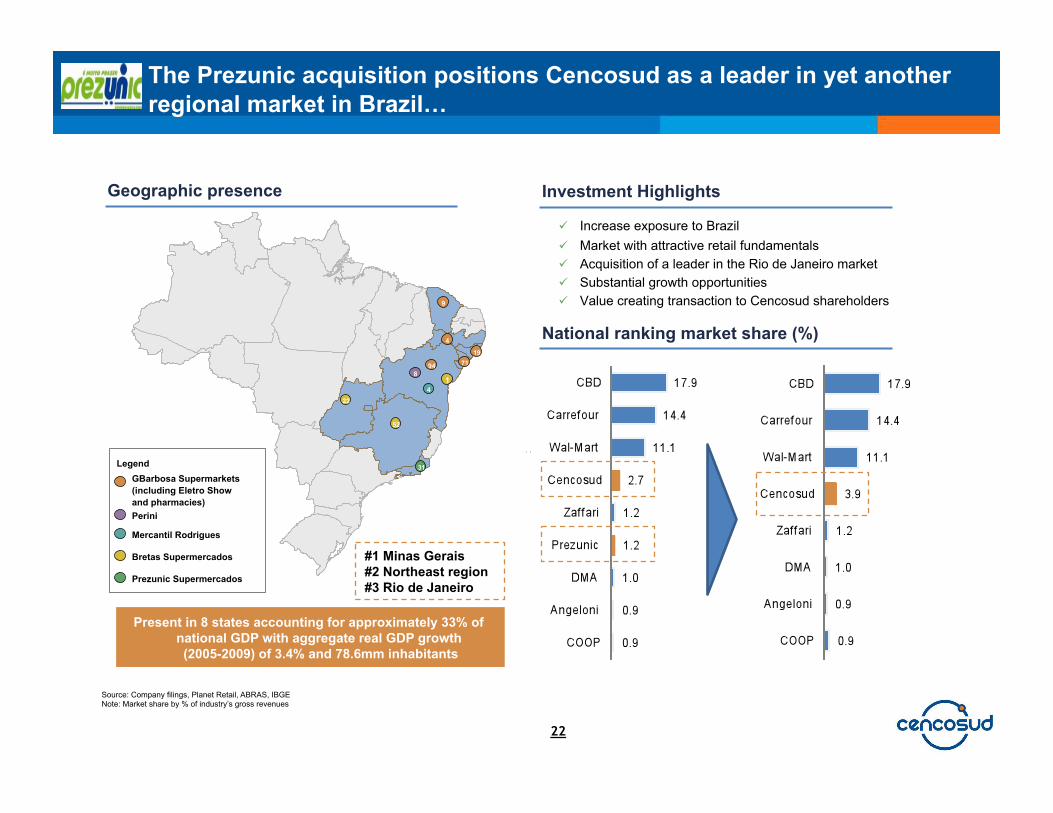
The Prezunic acquisition positions Cencosud as a leader in yet another regional market in Brazil…
Geographic presence
22
National ranking market share (%)
Source: Company filings, Planet Retail, ABRAS, IBGE Note: Market share by % of industry’s gross revenues
9
4
19
8 94
4 1
22
52
31
71
GBarbosa Supermarkets (including Eletro Show and pharmacies) Perini
Legend
Mercantil Rodrigues
Bretas Supermercados
Prezunic Supermercados
#1 Minas Gerais #2 Northeast region #3 Rio de Janeiro
Increase exposure to Brazil Market with attractive retail fundamentals Acquisition of a leader in the Rio de Janeiro market Substantial growth opportunities Value creating transaction to Cencosud shareholders
Investment Highlights
Present in 8 states accounting for approximately 33% of national GDP with aggregate real GDP growth (2005-2009) of 3.4% and 78.6mm inhabitants
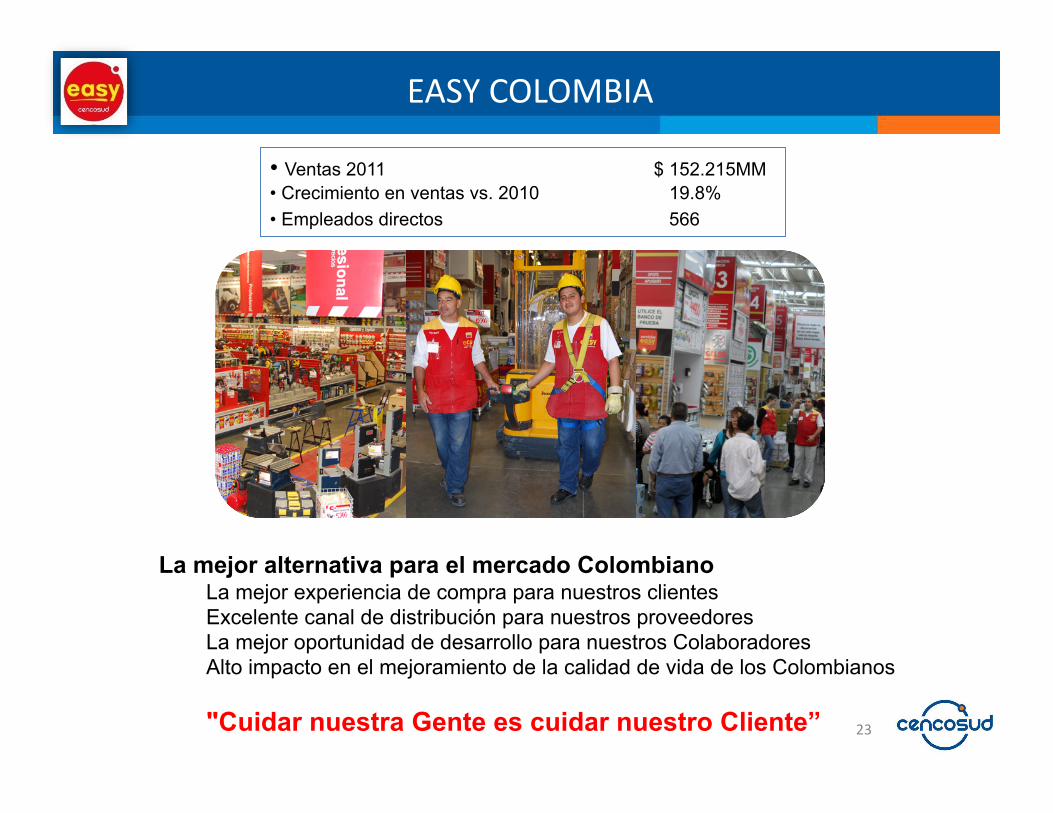
EASYCOLOMBIA
23
• Ventas 2011 $ 152.215MM • Crecimiento en ventas vs. 2010 19.8% • Empleados directos 566
La mejor alternativa para el mercado Colombiano La mejor experiencia de compra para nuestros clientes Excelente canal de distribución para nuestros proveedores La mejor oportunidad de desarrollo para nuestros Colaboradores Alto impacto en el mejoramiento de la calidad de vida de los Colombianos
"Cuidar nuestra Gente es cuidar nuestro Cliente”