control fw) mannitol sorbitol 1 · a a a a a b 0 0.2 0.4 0.6 0.8 1 1.2 1.4 1.6 rd29a bam1 bam3 amy3...
TRANSCRIPT

A
B0
0.5
1
1.5
2
2.5
3
3.5
4
0h 2h 4h
Star
ch (m
g g-1
FW)
ControlMannitolSorbitol
0
10
20
30
40
50
60
0h 2h 4h
Mal
tose
(μg
g-1FW
)
ControlMannitolSorbitol
a a
b
c
d
e
e
aa
bb
c
d
bd
Supplemental Data. Thalmann et al. Plant Cell (2016) 10.1105/tpc.16.00143
Supplemental Figure 1. Starch and maltose levels in WTplants upon mannitol or sorbitol treatment.Leaf starch (A) and maltose (B) content in WT Arabidopsis plantstreated with 300 mM mannitol or 300 mM sorbitol for 4 h comparedwith controls. Each value is the mean ± SE (n = 6). FW, freshweight. Statistical significances determined by unpaired two-tailedStudent’s t tests: different letters denote p < 0.05.

Supplemental Figure 2. Starch and maltose levels in WT andpgm mutant plants upon mannitol treatment.Leaf starch (A) and maltose (B) content in WT and pgmArabidopsis mutant plants treated with 300 mM mannitol for 4 hcompared with controls. Each value is the mean ± SE (n = 6). FW,fresh weight. Statistical significances determined by unpaired two-tailed Student’s t tests: different letters denote p < 0.05.
0
10
20
30
40
50
60
0h 2h 4h 0h 2h 4h
Mal
tose
(µg
g-1FW
)
ControlMannitol
0
1
2
3
4
5
6
7
8
9
0h 2h 4h 0h 2h 4h
Star
ch (µ
g g-1
FW
)ControlMannitol
WT pgm
a
b
c
add
a
b
c
aa
de
ee e
A
B
Supplemental Data. Thalmann et al. Plant Cell (2016) 10.1105/tpc.16.00143

A
WT bam1 amy3 bam3
EoD
EoN
amy3 bam1
0
2
4
6
8
10
12
14
Col bam1 amy3 amy3 bam1 bam3
Star
ch c
onte
nt (m
g g-1
FW)
End of day End of night
B
WT bam1 amy3 amy3 bam1
bam3
*
*
Supplemental Figure 3. Impact of simultaneous loss of BAM1 andAMY3 on starch metabolism in plants grown under controlconditions.(A) Photographs of iodine-stained WT, bam1, amy3, amy3 bam1 and bam3rosettes harvested at the end of the day (EoD) and at the end of the night(EoN) after 4 weeks of growth.Bar = 1 cm.(B) Starch content at the end of the day and at the end of the night in WT,bam1, amy3, amy3 bam1 and bam3 leaves. Values are means ± SE (n =8). FW, fresh weight. Statistical significances determined by unpaired two-tailed Student’s t tests: * denotes p < 0.05 for the indicated comparison.
Supplemental Data. Thalmann et al. Plant Cell (2016) 10.1105/tpc.16.00143
0
2
4
6
8
10
12
14
16
18
Col-0 bam3
Fold
cha
nge
(Rel
ativ
e to
con
trol)
ControlMannitol
bam3WT
**
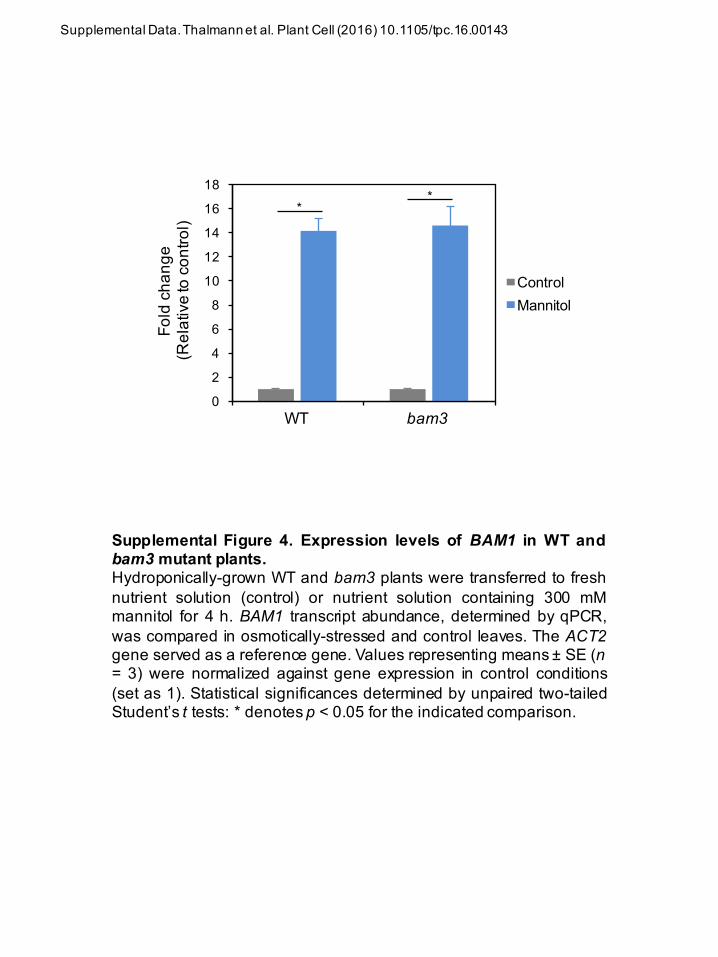
Supplemental Figure 4. Expression levels of BAM1 in WT andbam3 mutant plants.Hydroponically-grown WT and bam3 plants were transferred to freshnutrient solution (control) or nutrient solution containing 300 mMmannitol for 4 h. BAM1 transcript abundance, determined by qPCR,was compared in osmotically-stressed and control leaves. The ACT2gene served as a reference gene. Values representing means ± SE (n= 3) were normalized against gene expression in control conditions(set as 1). Statistical significances determined by unpaired two-tailedStudent’s t tests: * denotes p < 0.05 for the indicated comparison.
Supplemental Data. Thalmann et al. Plant Cell (2016) 10.1105/tpc.16.00143
B
A
0
400
800
1200
1600
2000
3 5 7
Rel
ativ
e ex
pres
sion
Hours of light
BAM1AMY3
C C ABA C ABA C ABA95
0h 2h 4h 0h 8h
WT bam1
ßAMY3C ABA
8h
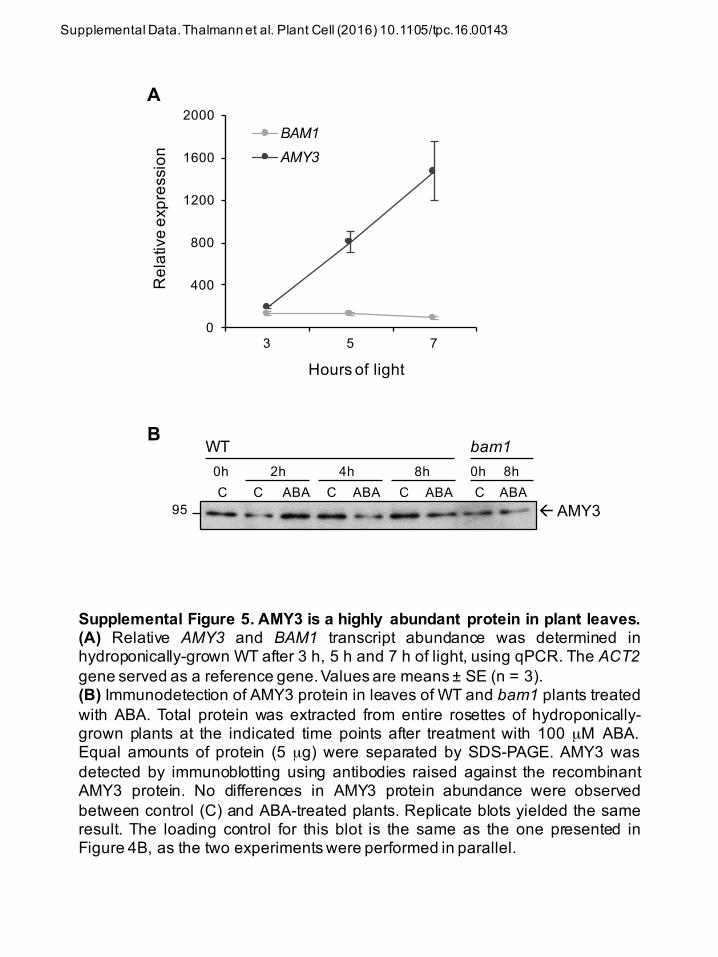
Supplemental Figure 5. AMY3 is a highly abundant protein in plant leaves.(A) Relative AMY3 and BAM1 transcript abundance was determined inhydroponically-grown WT after 3 h, 5 h and 7 h of light, using qPCR. The ACT2gene served as a reference gene.Values are means ± SE (n = 3).(B) Immunodetection of AMY3 protein in leaves of WT and bam1 plants treatedwith ABA. Total protein was extracted from entire rosettes of hydroponically-grown plants at the indicated time points after treatment with 100 µM ABA.Equal amounts of protein (5 µg) were separated by SDS-PAGE. AMY3 wasdetected by immunoblotting using antibodies raised against the recombinantAMY3 protein. No differences in AMY3 protein abundance were observedbetween control (C) and ABA-treated plants. Replicate blots yielded the sameresult. The loading control for this blot is the same as the one presented inFigure 4B, as the two experiments were performed in parallel.
Supplemental Data. Thalmann et al. Plant Cell (2016) 10.1105/tpc.16.00143

Supplemental Figure 6. Water absorption by WT and amy3bam1 plants in response to mannitol stress.The volume of water absorbed by plants in a nutrient solutionsupplemented with 300 mM mannitol is shown as a percentage ofwater absorbed by plants in a solution without mannitol (control,set as 100%). Values were corrected for water loss due to theevaporation from the liquid surface. Values are means ± SE (n =6). Statistical significances determined by unpaired two-tailedStudent’s t tests: * denotes p < 0.05 for the indicated comparison;n.s. = not significant for the indicated comparison.
**
n.s.
0
20
40
60
80
100
120
-0.5 0 0.5 1 1.5 2 2.5 3 3.5
Abso
rbed
wat
er(%
of c
ontro
l)
Time (h)
Col-0amy3bam1
0 21 3
amy3 bam1WT
Supplemental Data. Thalmann et al. Plant Cell (2016) 10.1105/tpc.16.00143
0
1
2
3
4
5
6
0h 2h 4h 0h 2h 4h
Pro
line
(µm
olg-
1FW
)
A
WT amy3 bam1
WT amy3 bam1
WT amy3 bam1
C
0
0.1
0.2
0.3
0.4
0.5
0h 2h 4h 0h 2h 4h
Fruc
tose
(mg
g-1
FW)
WT amy3 bam1
B*
* *
*n.s.
*n.s.
*n.s.
*
**
n.s.
*
*
*
*
*
0
0.5
1
1.5
2
2.5
3
0h 2h 4h 0h 2h 4h
Suc
rose
(mg
g-1
FW)
Control Mannitol
0
0.2
0.4
0.6
0.8
1
0h 2h 4h 0h 2h 4h
Glu
cose
(mg
g-1
FW)
D
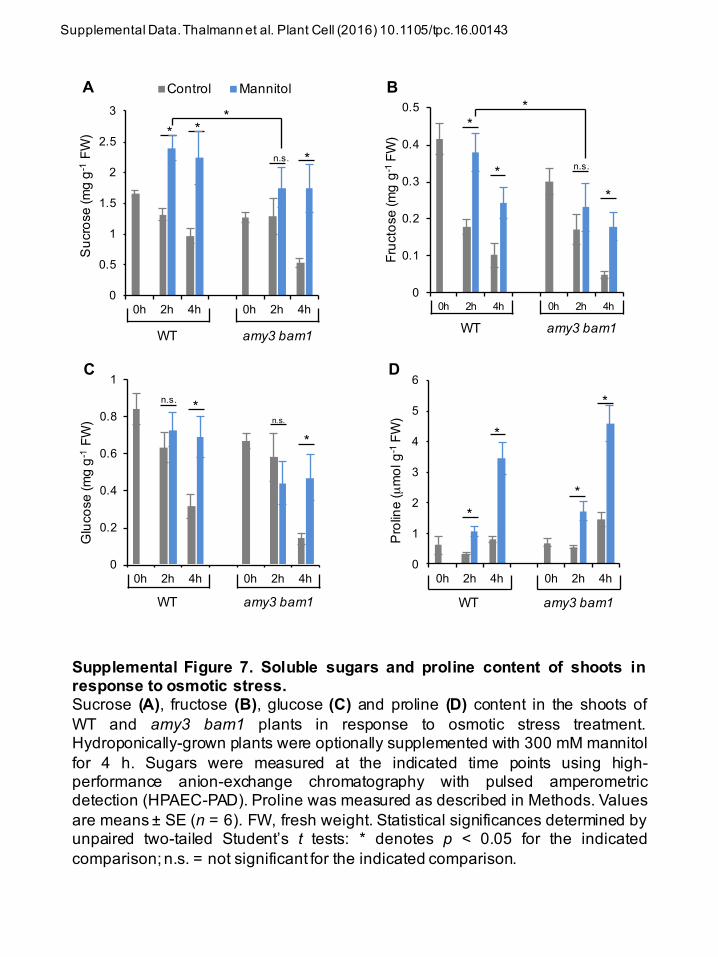
Supplemental Figure 7. Soluble sugars and proline content of shoots inresponse to osmotic stress.Sucrose (A), fructose (B), glucose (C) and proline (D) content in the shoots ofWT and amy3 bam1 plants in response to osmotic stress treatment.Hydroponically-grown plants were optionally supplemented with 300 mM mannitolfor 4 h. Sugars were measured at the indicated time points using high-performance anion-exchange chromatography with pulsed amperometricdetection (HPAEC-PAD). Proline was measured as described in Methods. Valuesare means ± SE (n = 6). FW, fresh weight. Statistical significances determined byunpaired two-tailed Student’s t tests: * denotes p < 0.05 for the indicatedcomparison;n.s. = not significant for the indicated comparison.
Supplemental Data. Thalmann et al. Plant Cell (2016) 10.1105/tpc.16.00143

0
10
20
30
40
50
60
-0.2 0 0.2 0.4 0.6 0.8 1 1.2 1.4 1.6 1.8 2 2.2 2.4 2.6 2.8 3 3.2 3.4 3.6 3.8 4 4.2
ABA
(ng
g-1FW
)
Time (h)
Col-0 controlamy3 bam1 controlCol-0 mannitolamy3 bam1 mannitol
0 1 2 3 4
WT controlamy3 bam1 control
amy3 bam1 mannitolWT mannitol
Supplemental Figure 8. Accumulation of endogenous ABA inresponse to mannitol treatment.ABA levels in rosette of hydroponically-grown WT and amy3 bam1 plantssubject to 300 mM mannitol stress for 4 h were determined at the indicatedtime points as described in Methods. Values are means ± SE (n = 4). FW,fresh weight.
Supplemental Data. Thalmann et al. Plant Cell (2016) 10.1105/tpc.16.00143
00.5
11.5
22.5
33.5
44.5
0h 2h 4h 8h
BAM
1 ba
nd in
tens
ity(R
elat
ive
to T
0)
ControlABA
a
ab
a a
b
b
a
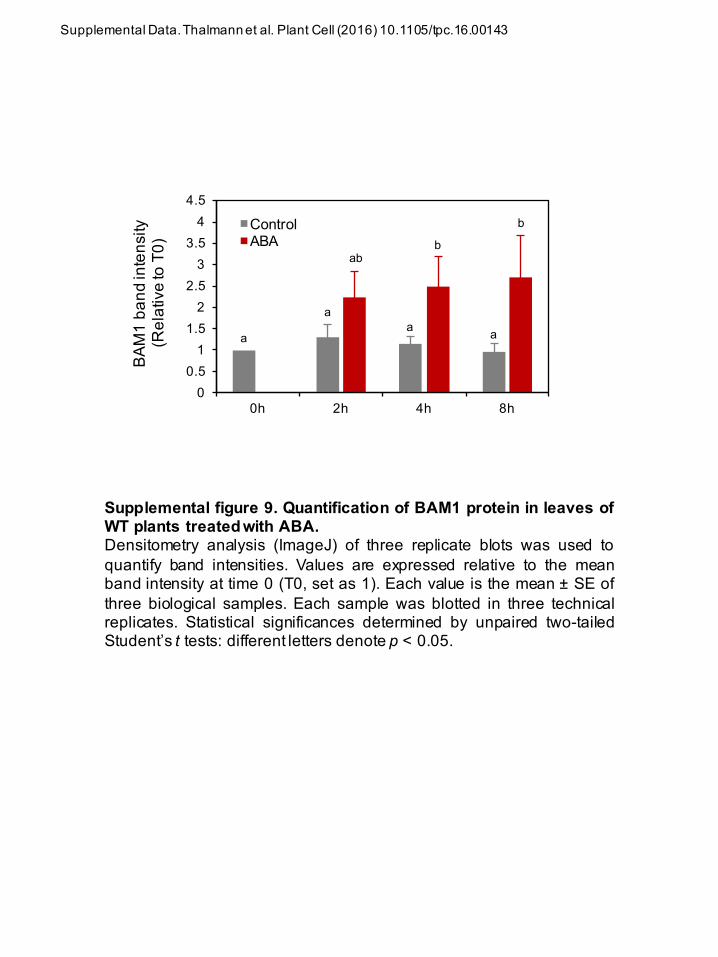
Supplemental figure 9. Quantification of BAM1 protein in leaves ofWT plants treated with ABA.Densitometry analysis (ImageJ) of three replicate blots was used toquantify band intensities. Values are expressed relative to the meanband intensity at time 0 (T0, set as 1). Each value is the mean ± SE ofthree biological samples. Each sample was blotted in three technicalreplicates. Statistical significances determined by unpaired two-tailedStudent’s t tests: different letters denote p < 0.05.
Supplemental Data. Thalmann et al. Plant Cell (2016) 10.1105/tpc.16.00143
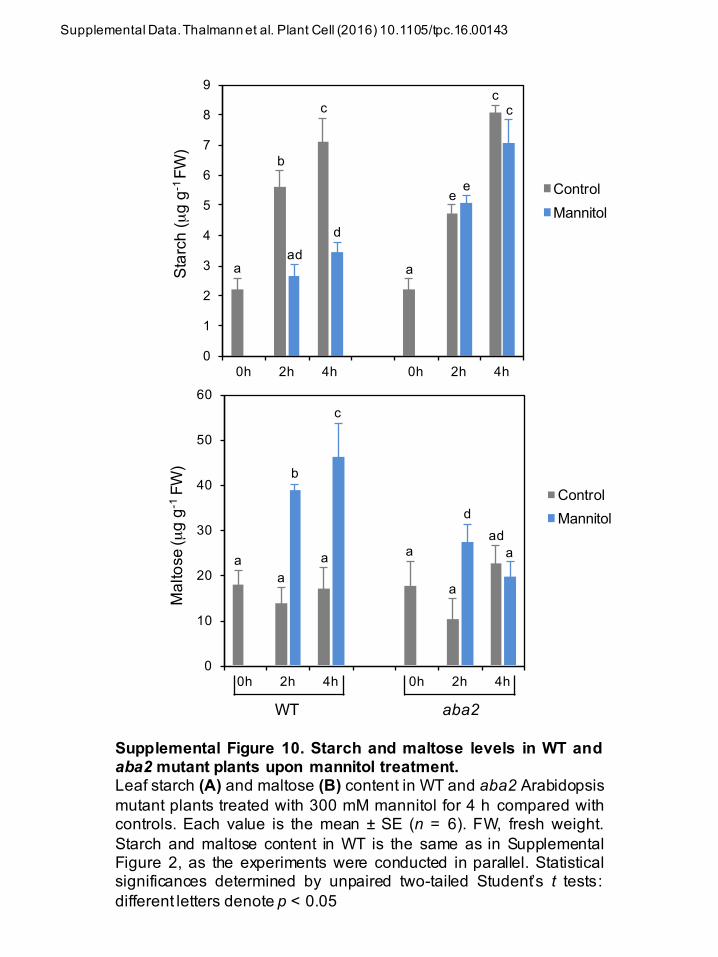
Supplemental Figure 10. Starch and maltose levels in WT andaba2 mutant plants upon mannitol treatment.Leaf starch (A) and maltose (B) content in WT and aba2 Arabidopsismutant plants treated with 300 mM mannitol for 4 h compared withcontrols. Each value is the mean ± SE (n = 6). FW, fresh weight.Starch and maltose content in WT is the same as in SupplementalFigure 2, as the experiments were conducted in parallel. Statisticalsignificances determined by unpaired two-tailed Student’s t tests:different letters denote p < 0.05
0
1
2
3
4
5
6
7
8
9
0h 2h 4h 0h 2h 4h
Star
ch (µ
g g-1
FW
)ControlMannitol
0
10
20
30
40
50
60
0h 2h 4h 0h 2h 4h
Mal
tose
(µg
g-1FW
)
ControlMannitol
WT aba2
a
b
c
add
a
ee
cc
a
b
c
aa a
dad
a
a
Supplemental Data. Thalmann et al. Plant Cell (2016) 10.1105/tpc.16.00143

0
1
2
3
4
5
6
0h 2h 4h 0h 2h 4h 0h 2h 4h
Star
ch (m
g g-1
FW)
Control 300 mM Mannitol ABA 300mM Manntiol+ABA
WT amy3bam1
nced3
*** *
**
** *
*
Supplemental Figure 11. Starch levels in response to mannitol,ABA or a combination of mannitol and ABA treatment.Leaf starch in WT, amy3 bam1 and nced3 plants treated with 300 mMmannitol, 100 µM ABA or 300 mM mannitol + 100 µM ABA for 4 h,compared with controls. Values are means ± SE (n = 6). FW, freshweight. Statistical significances determined by unpaired two-tailedStudent’s t tests: * denotes p < 0.05 for the indicated comparison.
Supplemental Data. Thalmann et al. Plant Cell (2016) 10.1105/tpc.16.00143
0
0.2
0.4
0.6
0.8
1
1.2
1.4
1.6
RD29A BAM1 BAM3 AMY3
Fold
cha
nge
(Rel
ativ
e to
WT)
A
a
aa
a
B
0
0.2
0.4
0.6
0.8
1
1.2
1.4
1.6
RD29A BAM1 BAM3 AMY3
Fold
cha
nge
(Rel
ativ
e to
WT)
a
a
a a
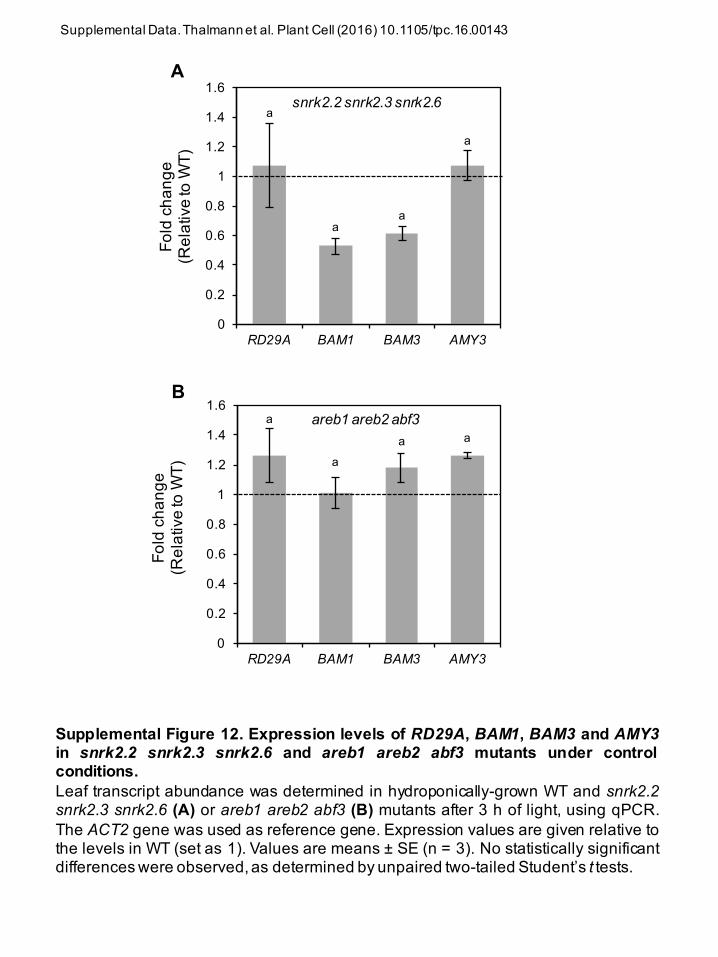
Supplemental Figure 12. Expression levels of RD29A, BAM1, BAM3 and AMY3in snrk2.2 snrk2.3 snrk2.6 and areb1 areb2 abf3 mutants under controlconditions.Leaf transcript abundance was determined in hydroponically-grown WT and snrk2.2snrk2.3 snrk2.6 (A) or areb1 areb2 abf3 (B) mutants after 3 h of light, using qPCR.The ACT2 gene was used as reference gene. Expression values are given relative tothe levels in WT (set as 1). Values are means ± SE (n = 3). No statistically significantdifferences were observed,as determined by unpaired two-tailed Student’s t tests.
snrk2.2 snrk2.3 snrk2.6
areb1 areb2 abf3
Supplemental Data. Thalmann et al. Plant Cell (2016) 10.1105/tpc.16.00143

0
2
4
6
8
10
12
0 0.5 1 3 6 12 24
Fold
cha
nge
(rel
ativ
e to
con
trol)
Time (h)
BAM1BAM3
0
1
2
3
4
5
0 0.5 1 3 6 12 24
Fold
cha
nge
(rel
ativ
e to
con
trol)
Time (h)
BAM1BAM3
0
1
2
3
4
5
0 0.5 1 3 6 12 24
Fold
cha
nge
(rel
ativ
e to
con
trol)
Time (h)
BAM1BAM3
0
2
4
6
8
10
12
0 0.5 1 3 6 12 24
Fold
cha
nge
(rel
ativ
e to
con
trol)
Time (h)
BAM1
BAM3
Osmotic stress (300 mM mannitol) Drought stress (rapid dehydration)
Salt stress (150 mM NaCl) Cold stress (4 °C continuous )
Supplemental Figure 13. BAM1 and BAM3 are differentially regulatedby abiotic stresses.Comparison of expression profiles of BAM1 and BAM3 in response tovarious abiotic stresses (drought, salt, cold and osmotic stress). Data wereretrieved from the public eFP browser microarray dataset ‘Abiotic Stress’(http://www.bar.utoronto.ca/efp/cgi-bin/efpWeb.cgi).
Supplemental Data. Thalmann et al. Plant Cell (2016) 10.1105/tpc.16.00143
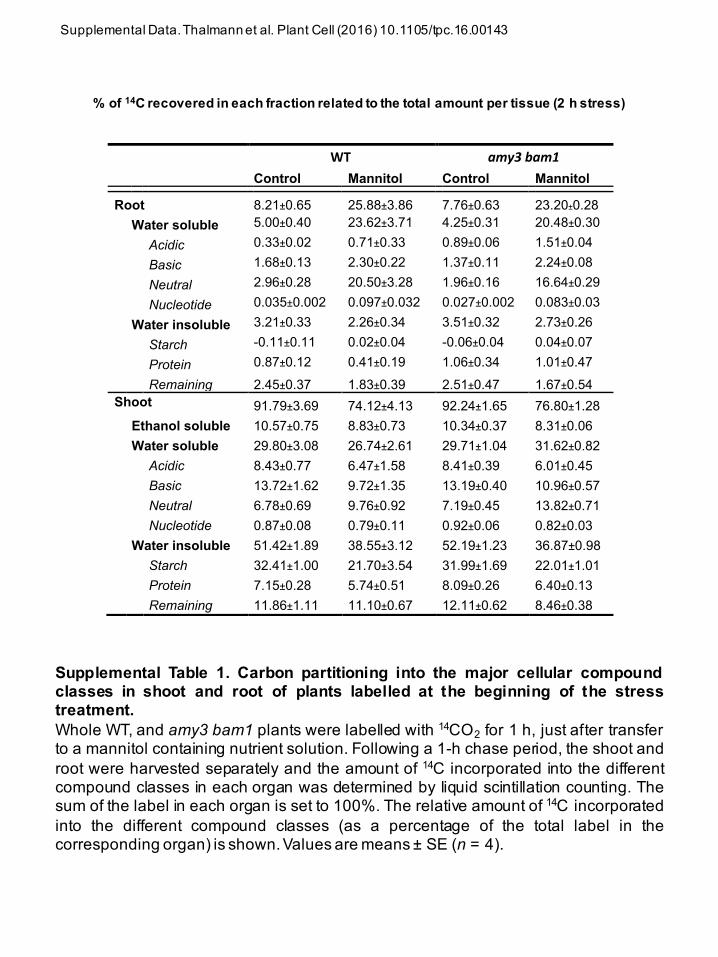
Supplemental Table 1. Carbon partitioning into the major cellular compoundclasses in shoot and root of plants labelled at the beginning of the stresstreatment.Whole WT, and amy3 bam1 plants were labelled with 14CO2 for 1 h, just after transferto a mannitol containing nutrient solution. Following a 1-h chase period, the shoot androot were harvested separately and the amount of 14C incorporated into the differentcompound classes in each organ was determined by liquid scintillation counting. Thesum of the label in each organ is set to 100%. The relative amount of 14C incorporatedinto the different compound classes (as a percentage of the total label in thecorresponding organ) is shown.Values are means ± SE (n = 4).
% of 14C recovered in each fraction related to the total amount per tissue (2 h stress)
WT amy3bam1
Control Mannitol Control Mannitol
Root 8.21±0.65 25.88±3.86 7.76±0.63 23.20±0.28
Water soluble 5.00±0.40 23.62±3.71 4.25±0.31 20.48±0.30
Acidic 0.33±0.02 0.71±0.33 0.89±0.06 1.51±0.04
Basic 1.68±0.13 2.30±0.22 1.37±0.11 2.24±0.08
Neutral 2.96±0.28 20.50±3.28 1.96±0.16 16.64±0.29
Nucleotide 0.035±0.002 0.097±0.032 0.027±0.002 0.083±0.03
Water insoluble 3.21±0.33 2.26±0.34 3.51±0.32 2.73±0.26
Starch -0.11±0.11 0.02±0.04 -0.06±0.04 0.04±0.07
Protein 0.87±0.12 0.41±0.19 1.06±0.34 1.01±0.47
Remaining 2.45±0.37 1.83±0.39 2.51±0.47 1.67±0.54
Shoot 91.79±3.69 74.12±4.13 92.24±1.65 76.80±1.28
Ethanol soluble 10.57±0.75 8.83±0.73 10.34±0.37 8.31±0.06
Water soluble 29.80±3.08 26.74±2.61 29.71±1.04 31.62±0.82
Acidic 8.43±0.77 6.47±1.58 8.41±0.39 6.01±0.45
Basic 13.72±1.62 9.72±1.35 13.19±0.40 10.96±0.57
Neutral 6.78±0.69 9.76±0.92 7.19±0.45 13.82±0.71
Nucleotide 0.87±0.08 0.79±0.11 0.92±0.06 0.82±0.03
Water insoluble 51.42±1.89 38.55±3.12 52.19±1.23 36.87±0.98
Starch 32.41±1.00 21.70±3.54 31.99±1.69 22.01±1.01
Protein 7.15±0.28 5.74±0.51 8.09±0.26 6.40±0.13
Remaining 11.86±1.11 11.10±0.67 12.11±0.62 8.46±0.38
Supplemental Data. Thalmann et al. Plant Cell (2016) 10.1105/tpc.16.00143

% of 14C recovered in each fraction related to the total amount per tissue (4 h stress)
Supplemental Table 2. Carbon partitioning into the major cellular compoundclasses in shoot and root of plants labelled in the middle of the stresstreatment.Whole WT and amy3 bam1 plants were labelled with 14CO2 for 1 h, in the middle ofthe stress treatment. Following a 1-h chase period, the shoot and root wereharvested separately and the amount of 14C incorporated into the differentcompound classes in each organ was determined by liquid scintillation counting. Thesum of the label in each organ is set to 100%. The relative amount of 14Cincorporated into the different compound classes (as a percentage of the total labelin the corresponding organ) is shown.Values are means ± SE (n = 4).
WT amy3 bam1
Control Mannitol Control Mannitol
Root 7.01±0.25 16.52±1.56 8.65±1.88 9.44±1.37
Water soluble 4.31±0.23 14.86±1.41 4.21±0.67 8.09±1.25
Acidic 1.21±0.05 1.00±0.10 1.43±0.21 0.88±0.15
Basic 0.94±0.12 1.01±0.14 1.10±0.20 1.03±0.19
Neutral 2.13±0.14 12.83±1.24 1.65±0.26 6.17±0.94
Nucleotide 0.015±0.002 0.014±0.001 0.027±0.006 0.013±0.002
Water insoluble 2.71±0.09 1.66±0.17 3.58±0.47 1.34±0.17
Starch 0.06±0.06 0.09±0.04 0.00±0.01 0.03±0.02
Protein 0.60±0.05 0.30±0.07 0.61±0.09 0.36±0.05
Remaining 2.05±0.12 1.27±0.18 2.96±0.48 0.95±0.18
Shoot 92.99±2.80 83.48±2.01 91.35±2.65 90.56±2.86 Ethanol soluble 8.29±0.30 6.77±0.03 8.11±0.68 6.57±0.29
Water soluble 29.27±2.15 34.36±1.72 32.34±1.06 38.11±1.93
Acidic 14.85±1.46 11.33±0.63 14.74±0.50 15.07±0.96
Basic 6.29±0.45 5.24±0.24 8.54±0.45 6.86±0.31
Neutral 7.18±0.45 17.10±1.75 8.02±1.19 15.42±2.15
Nucleotide 0.95±0.06 0.69±0.03 1.04±0.02 0.76±0.04
Water insoluble 55.42±1.76 42.35±1.03 50.91±2.33 45.89±2.09
Starch 38.83±1.75 30.90±0.96 36.17±1.82 34.93±1.84
Protein 7.36±0.12 5.91±0.11 6.78±0.65 5.32±0.14
Remaining 9.24±0.41 5.54±0.25 7.96±1.47 5.64±2.77
Supplemental Data. Thalmann et al. Plant Cell (2016) 10.1105/tpc.16.00143

Chlorophyll a fluorescence parameters of Col-0 and amy3 bam1 plants subject to osmotic stress
Supplemental Table 3. Chlorophyll a fluorescence parameters of Col-0 and amy3 bam1 plants subject to osmotic stress.The chlorophyll fluorescence transients Fv/Fm and ΦPSII were measured at theindicated time points in Col-0 and amy3 bam1 plants subject to 300 mM mannitolstress or kept in control nutrient solution, using a FluorCam. The plants were darkadapted for about 15 min prior to each measurement. Values are means ± SE of fourindependent determinations. Asterisks indicate statistically significant differencesbetween control and osmotic-stressed plants for each genotype, determined byStudent’s t tests (*P value < 0.05). No statistically significant differences wereobserved between Col-0 and amy3 bam1 mutant plants.The maximum quantum efficiency of PSII photochemistry (Fv/Fm) was reduced inboth genotypes at a similar level after 2 h (0.767±0.010 and 0.767±0.011 for amy3bam1 and wild-type plants, respectively). A reduction was also observed in the PSIIoperating efficiency (ΦPSII), indicating a decrease in the relative quantum yield oflinear electron transfer through the photosystems. This suggests that osmotic stressled to transient negative effects on PSII efficiency, but to a similar extent in the twogenotypes.
Fv/Fm ΦPSII Control Mannitol Control Mannitol
WT 0 h 0.817±0.003 0.658±0.003 2 h 0.815±0.002 0.767±0.011* 0.647±0.002 0.602±0.010* 4 h
24 h 0.817±0.002 0.807±0.003
0.802±0.002 0.811±0.003
0.648±0.002 0.640±0.001
0.635±0.004 0.649±0.004
amy3 bam1 0 h 0.818±0.003 0.655±0.003 2 h 0.811±0.003 0.767±0.010* 0.644±0.003 0.602±0.011*
4 h 24 h
0.813±0.003 0.810±0.006
0.802±0.004 0.813±0.002
0.648±0.005 0.635±0.005
0.637±0.005 0.651±0.002
Supplemental Data. Thalmann et al. Plant Cell (2016) 10.1105/tpc.16.00143
Primer Sequence
PrimersusedforgenotypingT-DNAinsertionlinesbam1(Salk_039895)BAM1Salk_fw CCATTGTGGAAATCCAAGTGBAM1Salk_rev ACGAGTACTTATCATAGCACTGSalkLBb1.3 ATTTTGCCGATTTCGGAACamy3(Sail_613D12)AMY3Sail_fw GGTTCCTCTTGTAGACGATGTTCCAMY3Sail_rev CCGACCTTGTGAAATTTCTTCACTGSailLBb GCCTTTTCAGAAATGGATAAATAGCCTTGCTTCCnced3(GABI_129B08) NCED3GABI_fw GTCAGCCACGAGAAGCTACACNCED3GABI_rev ACAGAGGCTCTCCTCCGTAACGABILBb ATATTGACCATCATACTCATTGC
PrimersusedforqPCRBAM1(AT3G23920)BAM1RT_fw CCATTGTGGAAATCCAAGTGBAM1RT_rev ACGAGTACTTATCATAGCACTGAMY3(AT1G69830)AMY3RT_fw TGCTTACATCCTAACTCATCCAMY3RT_rev CTCTTGTCTATATTCACCTCACTCBAM3(AT4G17090)BAM3RT_fw TGATTCTGTGCCTGTCCTBAM3RT_rev GAATTTCCGCAATAACTCCTCRD29A(AT5G52310)RD29ART_fw CCCACCAAAGAAGAAACTGGARD29ART_rev TTCAAATTGTCCTGGCTTCTGActin2(AT3G18780)ActinRT_fw TGGAATCCACGAGACAACCTAActinRT_rev TTCTGTGAACGATTCCTGGAC
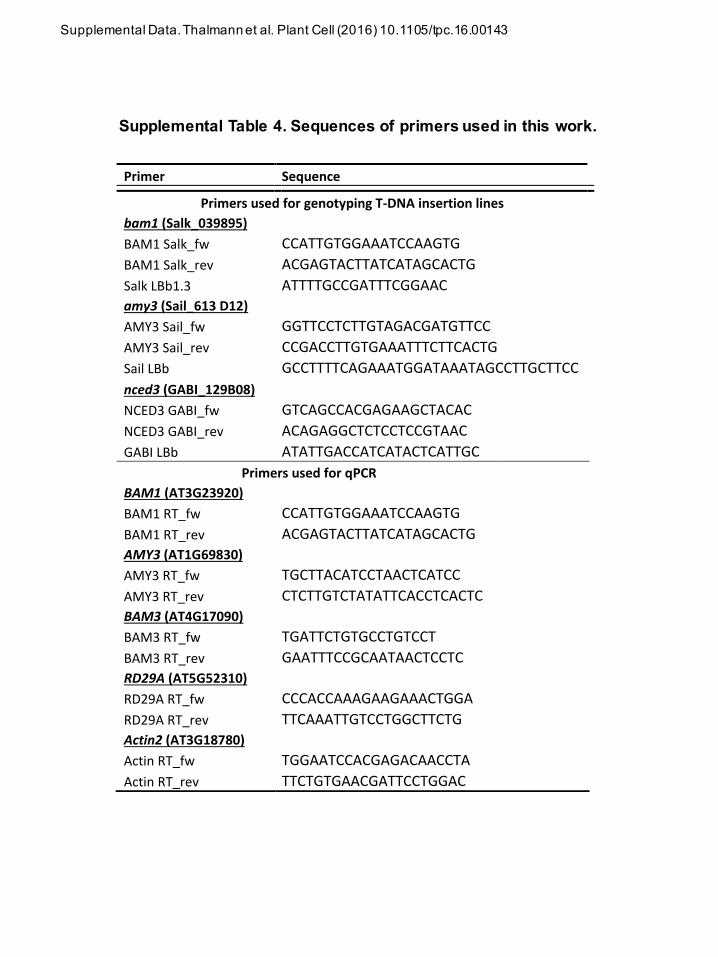
Supplemental Table 4. Sequences of primers used in this work.
Supplemental Data. Thalmann et al. Plant Cell (2016) 10.1105/tpc.16.00143