ciencia de redes (humanas y sociales) - instituto de cálculo · los 7 puentes de kÖnigsberg...
TRANSCRIPT
®
Ciencia de Redes (Humanas y Sociales)
#1C
Carlos SarrauteInstituto de Cálculo, Abril-Junio 2019

Los 7 puentes de Königsberg

Se pueden cruzar los 7 puentes, sin caminar dos
veces por el mismo puente?
LOS 7 PUENTES DE KÖNIGSBERG
Leonard Euler

LOS 7 PUENTES DE KÖNIGSBERG
Se pueden cruzar los 7 puentes, sin caminar dos
veces por el mismo puente?

Network Science: Graph Theory
LOS 7 PUENTES DE KÖNIGSBERG

LOS 7 PUENTES DE KÖNIGSBERG
1735: Teorema de Euler:
a) Si un grafo tiene más de dos nodos de grado impar, no hay ruta.
b) Si un grafo es conexo y no tiene nodos de grados impares, tiene al menos una ruta.
Se pueden cruzar los 7 puentes, sin caminar dos
veces por el mismo puente?

PODER DE LA REPRESENTACIÓN MATEMÁTICA
Redes y grafos

COMPONENTES DE UN SISTEMA COMPLEJO
§ componentes: nodos, vertices N
§ interacciones: vínculos, enlaces, aristas L
§ sistema: red, grafo (N,L)

red se refiere en general al sistema real• www, • red social• red metabolica
Lenguaje: (Red, nodos, vínculos)
grafo: representación matemática de una red• Grafo de la web, • Grafo social (por ejemplo de Facebook)
Lenguaje: (Grafo, vertices, aristas)
En la mayoría de los casos se utilizan los dos términos de manera intercambiable.
REDES O GRAFOS?
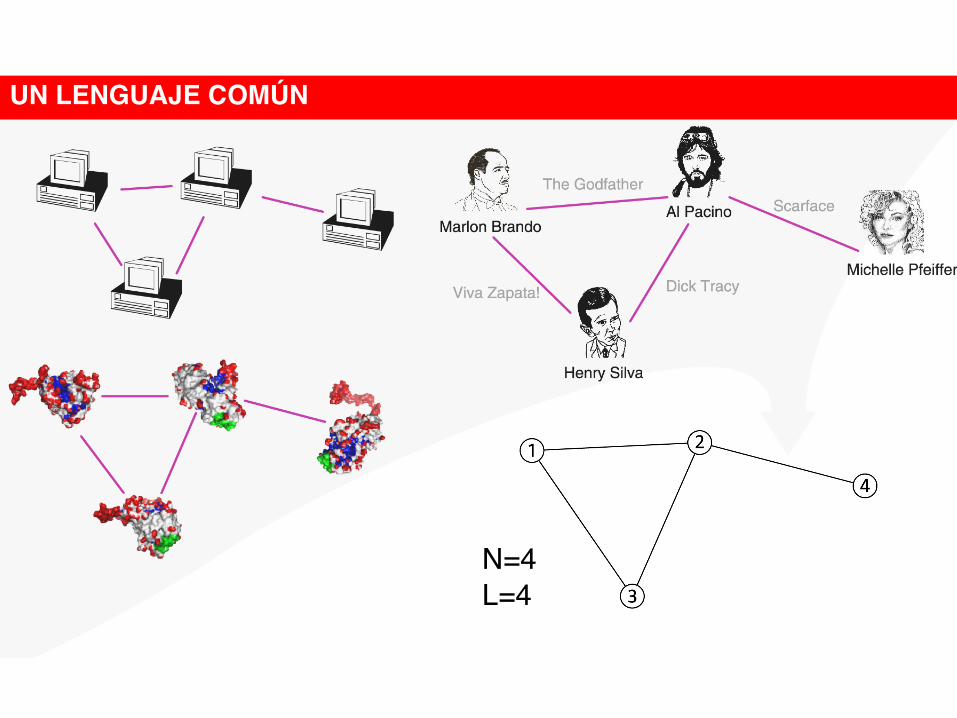
UN LENGUAJE COMÚN
N=4L=4

La elección de la representación como grafo adecuada determina nuestra capacidad para utilizar la teoría de red con éxito.
En algunos casos hay una representación única e inequívoca.En otros casos, la representación no es de ninguna manera única.
Ejemplo: como pasar de registros de llamados a un grafo?
ELEGIR LA REPRESENTACIÓN COMO GRAFO
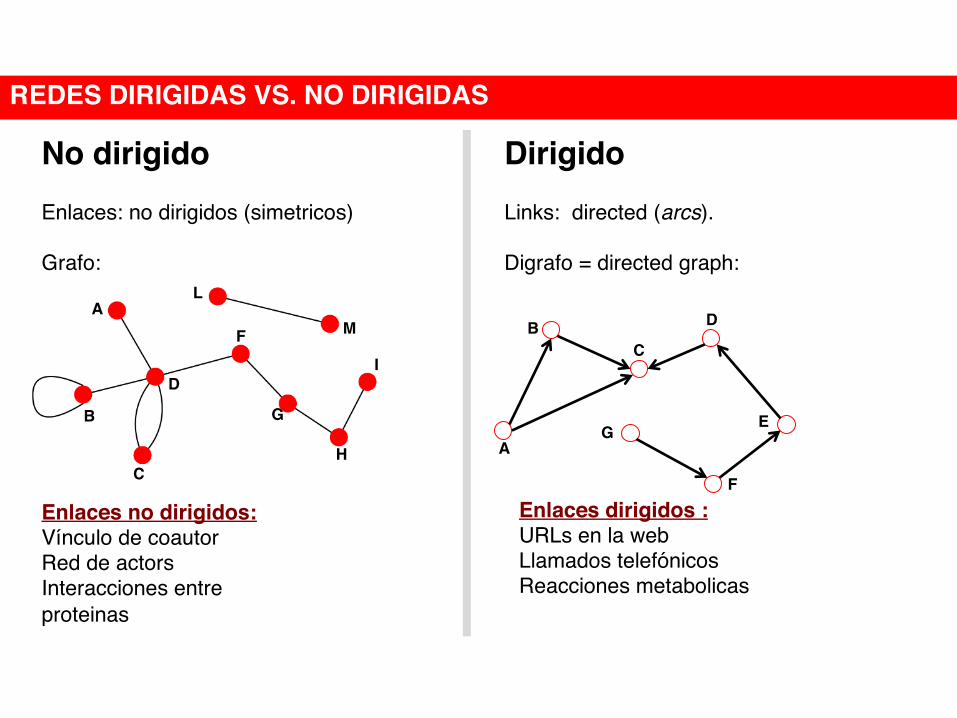
Enlaces: no dirigidos (simetricos)
Grafo:
Enlaces dirigidos :URLs en la webLlamados telefónicosReacciones metabolicas
REDES DIRIGIDAS VS. NO DIRIGIDAS
No dirigido Dirigido
A
B
D
C
L
MF
G
H
I
Links: directed (arcs).
Digrafo = directed graph:
Enlaces no dirigidos:Vínculo de coautorRed de actorsInteracciones entre proteinas
AG
F
BC
D
E

Reference Networks
NETWORK NODES LINKS N L kDIRECTEDUNDIRECTED
WWW
Power Grid
Mobile Phone Calls
Science Collaboration
Actor Network
Citation Network
E. Coli Metabolism
Protein Interactions
Webpages
Power plants, transformers
Subscribers
Email addresses
Scientists
Actors
Paper
Metabolites
Proteins
Links
Cables
Calls
Emails
Co-authorship
Co-acting
Citations
Chemical reactions
Binding interactions
Directed
Undirected
Directed
Directed
Undirected
Undirected
Directed
Directed
Undirected
325,729
4,941
36,595
57,194
23,133
702,388
449,673
1,039
2,018
1,497,134
6,594
91,826
103,731
93,439
29,397,908
4,689,479
5,802
2,930
Internet Routers Internet connections Undirected 192,244 609,066 6.33
4.60
2.67
2.51
1.81
8.08
83.71
10.43
5.58
2.90
http://networksciencebook.com/translations/en/resources/data.html

Grado, grado promedio, distribución de grafos

Grado del nodo: cantidad de enlaces que conectan con el nodo
�
kB = 4
GRADO DE UN NODO
No
dirig
ido
En los grafos dirigidos se puede definir un in-degree y out-
degree. El grado (total) es la suma de in- y out-degree.
Source: nodo con kin= 0; Sink: nodo con kout= 0.
2k inC = 1koutC = 3=Ck
Diri
gido
AG
F
BC
D
E
A
B
�
kA =1

N = cantidad de nodos en el grafo
L = cantidad de enlaces / vínculos
å=
ºN
iikN
k1
1
GRADO PROMEDIO
No
dirig
ido
j
i
= ?

å=
ºN
iikN
k1
1
�
k ≡ 2LN
GRADO PROMEDIO
No
dirig
ido
j
i

å=
ºN
iikN
k1
1
outinN
1i
outi
outN
1i
ini
in kk ,kN1k ,k
N1k =ºº åå
==
�
k ≡ 2LN
GRADO PROMEDIO
No
dirig
ido
Diri
gido
A
F
BC
D
E
j
i

å=
ºN
iikN
k1
1
outinN
1i
outi
outN
1i
ini
in kk ,kN1k ,k
N1k =ºº åå
==
�
k ≡ 2LN
�
k ≡ LN
GRADO PROMEDIO
No
dirig
ido
Diri
gido
A
F
BC
D
E
j
i

Grado promedio
NETWORK NODES LINKS N L kDIRECTEDUNDIRECTED
WWW
Power Grid
Mobile Phone Calls
Science Collaboration
Actor Network
Citation Network
E. Coli Metabolism
Protein Interactions
Webpages
Power plants, transformers
Subscribers
Email addresses
Scientists
Actors
Paper
Metabolites
Proteins
Links
Cables
Calls
Emails
Co-authorship
Co-acting
Citations
Chemical reactions
Binding interactions
Directed
Undirected
Directed
Directed
Undirected
Undirected
Directed
Directed
Undirected
325,729
4,941
36,595
57,194
23,133
702,388
449,673
1,039
2,018
1,497,134
6,594
91,826
103,731
93,439
29,397,908
4,689,479
5,802
2,930
Internet Routers Internet connections Undirected 192,244 609,066 6.33
4.60
2.67
2.51
1.81
8.08
83.71
10.43
5.58
2.90
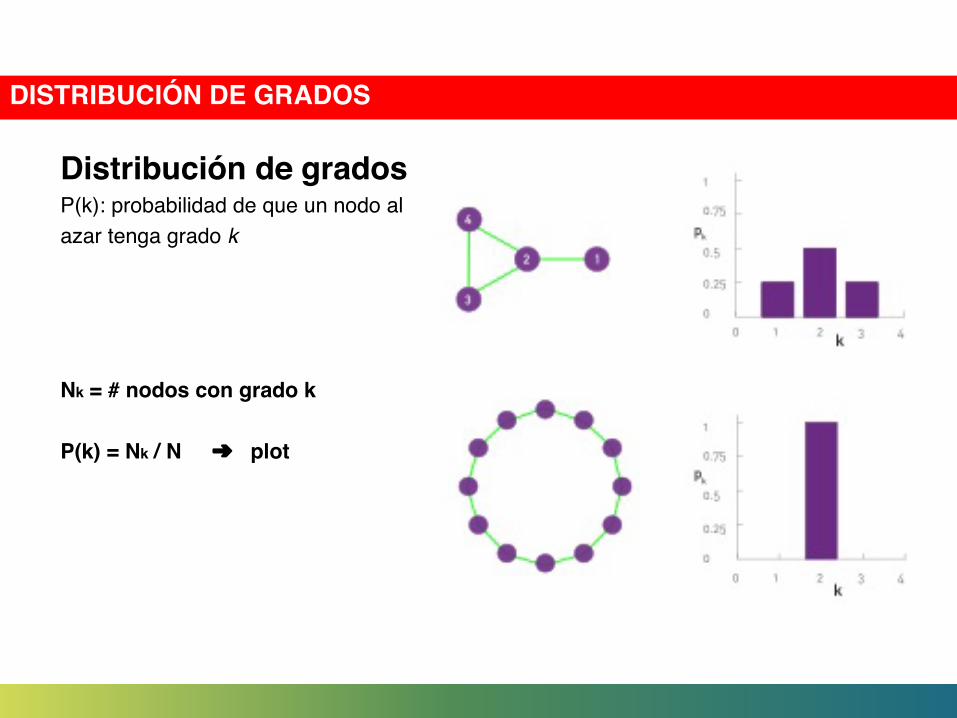
Distribución de gradosP(k): probabilidad de que un nodo al azar tenga grado k
Nk = # nodos con grado k
P(k) = Nk / N ➔ plot
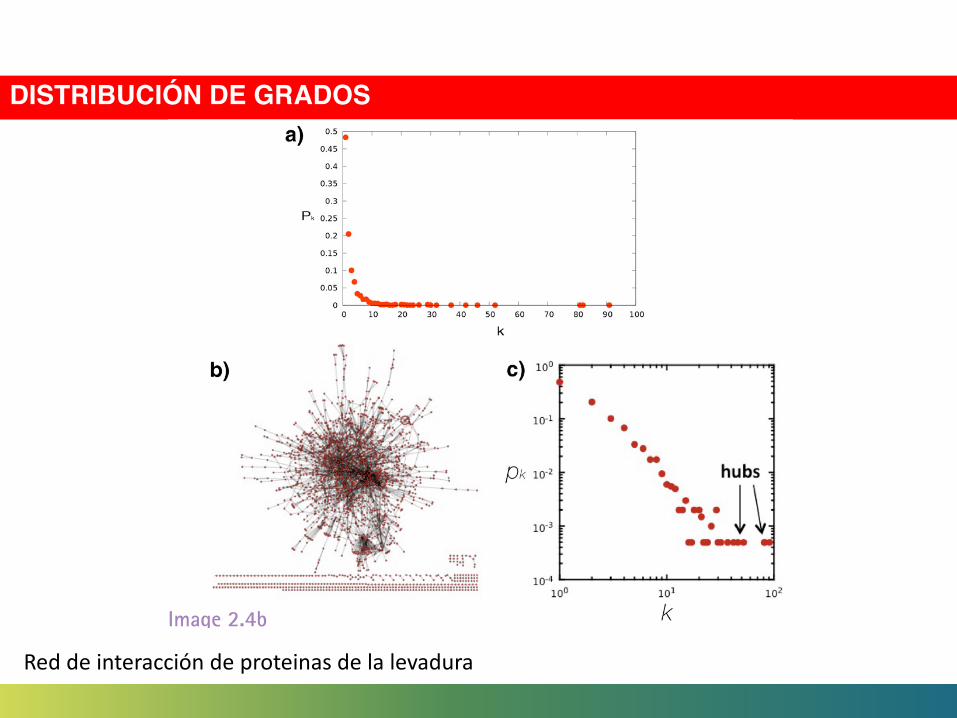
DISTRIBUCIÓN DE GRADOS
DISTRIBUCIÓN DE GRADOS
The degree distribution has taken a central role in net-work theory following the discovery of scale-free networks (Barabási & Albert, 1999). Another reason for its impor-tance is that the calculation of most network properties re-quires us to know pk. For example, the average degree of a network can be written as
We will see in the coming chapters that the precise func-tional form of pk determines many network phenomena, from network robustness to the spread of viruses.
∑==
∞
k kpkk 0
Image 2.4aDegree distribution.
The degree distribution is defined as the pk = Nk /N ratio, where Nk denotes the number of k-degree nodes in a network. For the network in (a) we have N = 4 and p1 = 1/4 (one of the four nodes has degree k1 = 1), p2 = 1/2 (two nodes have k3 = k4 = 2), and p3 = 1/4 (as k2 = 3). As we lack nodes with degree k > 3, pk = 0 for any k > 3. Panel (b) shows the degree distri-bution of a one dimensional lattice. As each node has the same degree k = 2, the degree distribution is a Kronecker’s delta function pk = H(k - 2).
Image 2.4b
In many real networks, the node degree can vary considerably. For exam-ple, as the degree distribution (a) indicates, the degrees of the proteins in the protein interaction network shown in (b) vary between k=0 (isolated nodes) and k=92, which is the degree of the largest node, called a hub. There are also wide differences in the number of nodes with different degrees: as (a) shows, almost half of the nodes have degree one (i.e. p1=0.48), while there is only one copy of the biggest node, hence p92 = 1/N=0.0005. (c) The degree distribution is often shown on a so-called log-log plot, in which we either plot log pk in function of log k, or, as we did in (c), we use logarithmic axes.
DEGREE, AVERAGE DEGREE, AND DEGREE DISTRIBUTION | 29
Red de interacción de proteinas de la levadura

TOPOLOGÍA DE INTERNET
On power-law relationships of the Internet topologyMichalis Faloutsos, Petros Faloutsos, Christos Faloutsoshttps://doi.org/10.1145/316194.316229

Próximas clases• 1. Introducción.• 2. Teoría de Grafos: Redes y grafos.• 3. Redes aleatorias y modelos de redes.• 4. La propiedad "libre de escala".• 5. Comunidades. Modularidad.• 6. Difusión en redes.• 7. Inferencias en grafos sociales.• 8. Redes socio - económicas.• 9. Movilidad geográfica y redes sociales.