barberán et al 2014 microbios obicuos otros
TRANSCRIPT
LETTER Why are some microbes more ubiquitous than others?
Predicting the habitat breadth of soil bacteria
Albert Barber�an,1 Kelly S.
Ramirez,3 Jonathan W. Leff,1,2
Mark A. Bradford,4 Diana H. Wall3
and Noah Fierer1,2*
1Cooperative Institute for Research
in Environmental Sciences Univer-
sity of Colorado Boulder, USA2Department of Ecology and
Evolutionary Biology University of
Colorado Boulder, USA3School of Global Environmental
Sustainability and Department of
Biology Colorado State University
Fort Collins, USA4School of Forestry and Environ-
mental Studies Yale University New
Haven, CT 06511, USA
*Correspondence:
E-mail: [email protected]
Abstract
Identifying the traits that determine spatial distributions can be challenging when studying organ-isms, like bacteria, for which phenotypic information is limited or non-existent. However, genomicdata provide another means to infer traits and determine the ecological attributes that account fordifferences in distributions. We determined the spatial distributions of ~124 000 soil bacterial taxaacross a 3.41 km2 area to determine whether we could use phylogeny and/or genomic traits toexplain differences in habitat breadth. We found that occupancy was strongly correlated withenvironmental range; taxa that were more ubiquitous were found across a broader range of soilconditions. Across the ~500 taxa for which genomic information was available, genomic traitswere more useful than phylogeny alone in explaining the variation in habitat breadth; bacteriawith larger genomes and more metabolic versatility were more likely to have larger environmentaland geographical distributions. Just as trait-based approaches have proven to be so useful forunderstanding the distributions of animals and plants, we demonstrate that we can use genomicinformation to infer microbial traits that are difficult to measure directly and build trait-basedpredictions of the biogeographical patterns exhibited by microbes.
Keywords
Bacteria, functional traits, genome size, geographical distribution, habitat breadth, microbial ecol-ogy, phylogeny, soil.
Ecology Letters (2014)
INTRODUCTION
Like plants and animals, not all microbial taxa are foundeverywhere. Some microbial taxa can thrive, or at leasttolerate, a broad range of environmental conditions and aremore likely to be ubiquitous. In contrast, other taxa can onlypersist under a very specific set of environmental conditionsand subsequently have far more restricted ranges and a highdegree of endemicity. However, the factors that explain thesedifferences in environmental and/or geographical distributionsacross microbial taxa remain unresolved. These types ofquestions have been asked for decades by ecologists seeking tounderstand which ecological, phylogenetic, or life-history attri-butes lead to some plant and animal taxa having larger distri-butions than others (Brown et al. 1996). The answers to thesequestions often remain elusive and dependent on the taxon inquestion, with recent work highlighting that the factors deter-mining range size are often not well understood even for thoseorganisms that have been well-studied (Lester et al. 2007).In general, two factors might explain variation in geographi-
cal distributions across different taxa: shared evolutionaryhistory or shared functional traits. Although these two factorsare not necessarily independent (Losos 2008), we candetermine the relative importance of each factor in predictingan ecological attribute of interest. If evolutionary history ismore important, we would expect closely related taxa to havemore similar distributions. We know from research on plantsand animals that evolutionary history is often not a good pre-dictor of observed differences in range sizes given that rangesize can vary considerably between closely related plant andanimal species (Brown et al. 1996; Webb & Gaston 2003). We
do not know if this holds true for bacteria where evolutionaryhistory may be more useful for predicting bacterial distribu-tions given that some key ecological attributes appear to beconserved across major bacterial lineages (e.g. Philippot et al.2010). However, we would expect that the decoupling of eco-logical attributes from phylogeny to be more conspicuous inmicrobes for several reasons. First, since the domain Bacteriacomprises high levels of phylogenetic diversity, taxa within thesame genus or family may have very different ecological roles.Evolutionary processes have generated a remarkable amountof bacterial metabolic and functional diversity and thus, manyoptimal ecological strategies exist that could lead to some bac-teria having larger environmental and geographical distribu-tions than other bacteria. Second, microbes can rapidly gainand lose genes via horizontal gene transfer, thus introducinggenetic connections among distantly related taxa (Cordero &Hogeweg 2009) and promoting a high degree of functionalplasticity or functional convergence in disparate lineages(Tettelin et al. 2008).Functional traits provide an alternative explanation for the
variation in environmental and geographical breadth acrosstaxa. Taxa that share similar range sizes may not have sharedevolutionary histories, but they could share similar functionaltraits. Such functional trait-based explanations have beenwidely used by ecologists to identify the phenotypic characteris-tics of organisms that predict distribution patterns (McGillet al. 2006). For example, while dispersal ability is oftenclaimed to be the main determinant of a species’ range (Brownet al. 1996; Lester et al. 2007), other traits like body size orfecundity have also been shown to influence range size (Laubeet al. 2013). Such trait-based approaches are less frequently
© 2014 John Wiley & Sons Ltd/CNRS
Ecology Letters, (2014) doi: 10.1111/ele.12282

applied to microbial communities because their phenotypiccharacteristics often remain undetermined, but recent work hasdemonstrated how a trait-based framework can be used tounderstand bacterial community assembly (e.g. Burke et al.2011; Barber�an et al. 2012) and to explain shifts in microbialcommunity composition across environmental gradients(Edwards et al. 2013). To apply a trait-based perspective tocomplex microbial communities, one must first identify whichtraits to investigate and how the relevant traits can be mea-sured. These tasks are arguably far more difficult to do withmicrobes than with plants or animals for several reasons. First,sampling individual microorganisms to estimate intraspecifictrait variation is often not feasible, particularly in environmentslike soil where cells cannot be readily separated from the sur-rounding matrix. For example, even simple traits like cell sizeare difficult to measure for individual cells of a given soil micro-bial taxon (Portillo et al. 2013). Moreover, measuring traits ofuncultured microorganisms is also a challenging task given theirextraordinary phenotypic diversity and the preponderance ofnovel metabolic pathways. Even for the small minority ofmicrobial taxa that can be readily cultured and studied in thelab, the phenotypic traits they exhibit in culture may bear littleresemblance to the traits they exhibit when growing in the envi-ronment (Lennon et al. 2012). Perhaps most importantly,microbial ecologists often lack a fundamental understanding ofwhich characteristics or specific traits are most strongly linkedto the performance of microbes (Green et al. 2008). Unlikeplants, where a handful of leaf traits have proven useful fordescribing their ecological strategies (Wright et al. 2004), weoften do not know what traits are important in differentiatingmicrobial taxa or how to effectively measure those traits.Genomic information provides a tractable starting point for
identifying and quantifying relevant ecological traits of micro-organisms when phenotypic information is missing. As somegenomic traits are shared across the entire tree of life, theycan be used to understand the trade-offs associated with par-ticular strategies that contribute to eco-evolutionary adapta-tion (Gudelj et al. 2010; Verberk et al. 2013). Recent studieswith microbial communities have shown a closer relationshipbetween ecology and genomic functional potential thanbetween ecology and phylogeny (Burke et al. 2011; Barber�anet al. 2012). Furthermore, there are associations betweengenomic traits and general microbial lifestyles (Garcia et al.2008), trophic strategies in marine bacteria (Lauro et al.2009), microbial growth rates (Vieira-Silva & Rocha 2010)and the successional status of human gut symbionts (Lozu-pone et al. 2012).Here we investigated how information on phylogeny or
traits (inferred from genomic data) can be used to explainthe degree of ubiquity (i.e. habitat breadth) of microbial taxaliving in soil, an environment which houses large amounts ofnovel and understudied microbial diversity (Torsvik et al.1990; Fierer et al. 2007). To do so, we collected 596 soilsamples from a 3.41-km2 landscape (Central Park in NewYork City) and deeply sequenced a portion of the 16SrRNA gene to identify bacterial taxa and measured thebreadth of habitats across which each taxon could be found(measured as occupancy and environmental range size). Wethen matched the identified bacterial taxa to those with fully
sequenced genomes to: (1) assess whether phylogenetic relat-edness and/or genomic traits explain why some soil bacterialtaxa can persist in a wide range of soil habitats, while othersare far more restricted in their distributions; and (2) deter-mine which genomic traits, if any, predict habitat breadth.Given that the degree of similarity between genomes is notindependent from evolutionary history (Snel et al. 1999), weconstructed a model to (3) estimate how phylogenetic relat-edness and genomic traits can together be used to predictthe environmental and geographical distribution of soilmicroorganisms.
MATERIALS AND METHODS
Data set, sampling and molecular analyses
Central Park (New York City, USA) was established in 1857and is a 3.41 km2, 0.80 km wide by 4.02 km long, urbanpark. The park is a useful site for our examination of micro-bial environmental and geographical breadth given that it hasclearly defined boundaries yet the landscape within the urbanpark is highly heterogeneous, ranging from large lawns todense forests. Although climatic conditions are essentiallyinvariant across Central Park, soil edaphic characteristics arehighly variable (Fig. S1). For example, soil pH values acrossCentral Park range from 3.86 to 8.35, organic carbon concen-trations (C) range from 1.19 mg g�1 soil to 139.1 mg g�1 soiland organic nitrogen concentrations (N) range from0.06 mg g�1 soil to 4.91 mg g�1 soil, ranges in soil edaphiccharacteristics that match ranges observed across a broadarray of soil types collected from across North and SouthAmerica (Fierer & Jackson 2006).We collected soils from 596 locations within the park with a
sample collected nearly every 50 m2 of land surface across theentire park. At each of the 596 sampling locations, four soilcores (2.54 cm diameter by 5 cm depth) were compositedtogether to yield one soil sample per sampling location. Geno-mic DNA was extracted using the MoBio PowerSoil DNAextraction kit as described previously (Fierer et al. 2012) withthe DNA from each soil sample amplified and sequenced onan Illumina HiSeq2000 following standard protocols(Caporaso et al. 2012). The V4–V5 region of the 16S rRNAgene was amplified in triplicate using the F515 and R806 pri-mer set. This primer set has few biases against specific taxa(Walters et al. 2011) and the sequenced gene region has beenshown to provide accurate taxonomic and phylogenetic infor-mation for bacteria (Liu et al. 2007).
16S rRNA gene analyses
The raw sequence data were processed using the UPARSE pipe-line (Edgar 2013). Sequences were truncated to 150 bp andquality filtered sequences were clustered into operational taxo-nomic units (OTUs) using the consensus ≥97% 16S rRNA geneidentity as a threshold, and unique sequences (i.e. singletons)were removed. Taxonomic assignment was carried out with theRibosomal Database Project (RDP) classifier (Wang et al.2007) against the March 2013 version of the Greengenes refer-ence database (McDonald et al. 2012). As raw counts can vary
© 2014 John Wiley & Sons Ltd/CNRS
2 A. Barber�an et al. Letter
by orders of magnitude from the same sequencing run, commu-nities were rarefied to 40 000 sequences per sample yielding atotal of ~124 000 bacterial OTUs identified across the park. Wecalculated the occupancy (i.e. the number of sites out of 596where a particular OTU was found) and the environmentalrange (i.e. the average of the range in soil edaphic factorsreported in Fig. S1 standardised from 0 to 1) for each OTU.
Matching 16S rRNA genes to sequenced genomes
For most of the ~124 000 bacterial OTUs, no genomic informa-tion was available as there were no closely related taxa forwhich whole-genome sequence data are available. However,some of these OTUs were closely related to representatives withsequenced bacterial genomes. To identify those OTUs forwhich genomic information was available to determine genomictraits, we matched the 16S rRNA representative sequences fromCentral Park soils against a subset of the Ribosomal DatabaseProject (RDP; Cole et al. 2009) derived from representatives ofsequenced bacterial genomes (~2000 complete 16S rRNA genes)using UCLUST (Edgar 2010) at ≥ 99% identity (i.e. allowingjust one base mismatch between subject and query sequences).For all the OTUs and for that subset of OTUs for whichgenomic information was available, the range of mean abun-dances, the range in occupancy levels and the relationshipbetween abundance and occupancy were very similar (Fig. S2)indicating that the OTUs for which we had genomic trait datadid not represent a biased subset of taxa as far as the variationin environmental and geographical distribution was concerned.For the ~500 OTUs for which genomic information was
available, we determined structural genomic characteristics(genome size, number of genes, guanine-cytosine (G+C) con-tent, number of rRNA genes, % of coding DNA sequence, %of signal peptides, % of transmembrane proteins) and theabundance of different protein families’ functional domains(~8000 Pfam domains in total; Finn et al. 2008) by download-ing this information from the Integrated Microbial Genomes(IMG) database (Markowitz et al. 2012).
Phylogenetic analyses
To infer the evolutionary relationships between the ~124 000OTUs identified from Central Park and the ~500 OTUs forwhich genomic information was available, we aligned the 16SrRNA gene sequences using PyNAST (Caporaso et al. 2010)with the Greengenes database (McDonald et al. 2012) as atemplate. The resulting multiple sequence alignment wassubsequently trimmed to remove non-informative positions(i.e. positions which are gaps in every sequence). Phylogenieswere reconstructed with the FastTree approximate maximum-likelihood algorithm (Price et al. 2010) using the mid-pointmethod for rooting.
Functional (genomic) analyses
To identify which protein families (Pfam) tended to be over- orunder-represented in genomes that had larger occupancy (moreubiquitous taxa) compared to those taxa with smaller rangesizes, we used Mann–Whitney tests corrected for multiple
comparisons by False Discovery Rate (FDR; Benjamini &Hochberg 1995). Pfam domains were mapped to KEGG(Kyoto Encyclopedia of Genes and Genomes) Orthology (KO)pathway groups, and then the KO pathways were grouped intomore general functional categories using the BRITE hierarchy(Kanehisa et al. 2012). As the same Pfam domain can matchseveral KO pathways, we used MinPath to yield a more conser-vative estimation of the biological pathways present (Ye &Doak 2009). Given a set of protein domains (Pfam) that can bemapped to one or more pathways (KO), the MinPath parsi-mony algorithm attempts to find the minimum number of path-ways that can explain the presence of all protein domains.
Path model
We explored the relationships between evolutionary history(phylogenetic relatedness), genomic traits and habitat breadth(occupancy and environmental range) using Partial LeastSquares Path Modeling (PLS-PM). PLS-PM is a statisticalmethod for studying cause and effect relationships amongobserved and latent variables, and is particularly useful when atheoretical understanding of the relationships between variablesis scarce because it does not impose any distributional assump-tion (Tenenhaus et al. 2005). Since PLS-PM does not rely onany distributional assumptions, we ran the path model using1000 bootstraps to validate the estimates of path coefficientsand the coefficients of determination (R2). Path coefficients (i.e.standardised partial regression coefficients) represent the direc-tion and strength of the linear relationships between variables(direct effects). Indirect effects are the multiplied path coeffi-cients between a predictor and a response variable, adding theproduct of all possible paths excluding the direct effect.We selected observed variables based on collinearity and pre-
dictability power. Five latent variables were used: phylogeny(the first two non-metric multidimensional axes of the cophe-netic matrix derived from the phylogenetic tree constructedfrom complete sequences of 16S rRNA genes of sequencedgenomes), functional potential (the number of different Pfamdomains and the first non-metric multidimensional axis of thePfam domain categories table), genome structure (genome size,% G+C content, % coding DNA sequence and % signalpeptides), genomic traits (a combination of the first principalcomponent analysis score for functional potential and genomicstructure) and habitat breadth (occupancy and environmentalrange). Models with different structures were evaluated usingthe Goodness of Fit (GoF) statistic, a measure of their overallpredictive power. The R package plspm (Sanchez & Trinchera2012) was used to construct the model.
RESULTS AND DISCUSSION
Environmental range size correlates with occupancy
We observed a strong correlation between occupancy (thenumber of sites where a taxon is present) and environmentalrange (the breadth of environmental conditions where a taxonis present). This correlation between occupancy and environ-mental range was observed when we considered all of theOTUs (Spearman’s q = 0.95, P < 0.0001) or just the subset of
© 2014 John Wiley & Sons Ltd/CNRS
Letter Microbial genomes and habitat breadth 3
OTUs for which genomic information was available (q = 0.97,P < 0.0001; Fig. 1). Essentially, those bacterial taxa that werefound in more samples were also those taxa that persistedunder a wider range of soil environmental conditions. Forsmaller organisms like bacteria, geographical range size canbe more difficult to measure than the range sizes of plantsand animals (Brown et al. 1996; Slatyer et al. 2013) given thatit is often difficult to know the appropriate spatial scale(s) tosample and because the high diversity of bacterial communi-ties make it difficult to determine whether a given taxon istruly absent from a sample. Nevertheless, given the close cor-respondence between occupancy and environmental range inour data, we can assume that occupancy is a reasonable proxyfor habitat breadth (i.e. how generalised or specialised a bio-logical entity is in its habitat requirements).
Evolutionary history cannot explain differences in occupancy
For both total OTUs and those OTUs with sequenced ge-nomes, occupancy showed a similar highly skewed distribu-tion with relatively few taxa present in most of the sites(Fig. 2a). For example, only 2% of all OTUs were found in>300 of the 596 soils that were collected from Central Parkand 58% of all OTUs were restricted in their distribution (i.e.defined as being found in <10 of the soils). The differencesobserved in the distribution of occupancy values between allOTUs and for those with sequenced genomes (Fig. 2a) werelikely a product of differences in sample size (~124 000 and~500 respectively) rather than any underlying ecological pro-cess. Given these patterns, we then set out to determine whysome taxa were found across a broader set of environmentalconditions than other taxa. We started by determining if evo-
lutionary patterns can explain the occupancy patterns shownin Fig. 2a. We expected that evolutionary history, expressedas phylogenetic relatedness, may explain differences in habitatbreadth for soil bacteria because general ecological attributesare often conserved across major bacterial lineages (Fiereret al. 2007; Philippot et al. 2010). However, we did notobserve any relationship between 16S rRNA phylogenetic dis-tance and pairwise differences in occupancy for all OTUs andfor that subset of OTUs with sequenced genomes (Mantel’srM = �0.05 in both cases; Fig. 2b and c respectively). Further-more, the non-association between phylogeny and occupancyis evident from the observation that OTUs affiliated with agiven phylum typically had a wide range of occupancy values(Fig. 2a). Thus, we can conclude that phylogenetic related-ness, by itself, is not a good predictor of habitat breadth,despite expectations that environmental conditions may limitthe types of microorganisms that inhabit a certain soil habitat(Fierer et al. 2007) and that some bacterial phyla have con-served ecological features (Philippot et al. 2010).For plants and animals, geographical range sizes can vary
considerably between closely related species (Brown et al.1996), even though those morphological, physiological orlife-history traits that might determine range size tend to bephylogenetically conserved (Webb & Gaston 2003). Formicroorganisms, this decoupling might be more prominentdue to their high phylogenetic and metabolic diversity, andtheir high degree of functional plasticity (Tettelin et al.2008). In addition, those ecological attributes that do tend tobe conserved within bacterial phyla (e.g. oxygenic photosyn-thesis or methanogenesis; Martiny et al. 2013) may not nec-essarily be relevant for predicting occupancy patterns. Giventhat phylogeny does not help us predict occupancy patterns,
(a) (b)
Figure 1 Correlation between occupancy and environmental range (where environmental range is calculated as the average of the range in soil edaphic
factors standardised from 0 to 1) for the ~124 000 OTUs (a) and for that subset of OTUs (~500) for which genomic information was available (b).
© 2014 John Wiley & Sons Ltd/CNRS
4 A. Barber�an et al. Letter

we then asked if we could use functional traits (gleaned fromgenomic information) to better explain the differences inhabitat breadth.
Genomic traits can partially explain differences in occupancy
We hypothesised that habitat breadth of individual bacterialtaxa would be better predicted by incorporating information on
genomic traits instead of phylogeny alone, a poor predictor ofrange size (Fig. 2). Recent studies on microbial communitieshave shown that genomic functional potential rather than taxo-nomic composition tends to correlate better with biogeographi-cal patterns (Burke et al. 2011; Barber�an et al. 2012). Forexample, Barber�an et al. (2012) showed that 16S rRNA gene-based taxonomic community structure failed to differentiateamong marine habitats, while community patterns based on
(a)
(b) (c)
Figure 2 Distribution of occupancy for the total number of OTUs (in red) and the subset of sequences that matched sequenced bacterial genomes (in blue)
(a). Relationship between 16S rRNA phylogenetic distance and pairwise differences in occupancy for all of the OTUs in red (b), and for that subset of
OTUs for which genomic information was available in blue (c). Note that the range of phylogenetic distances for all of the OTUs is larger than for that
subset of OTUs for which genome sequence data were available.
© 2014 John Wiley & Sons Ltd/CNRS
Letter Microbial genomes and habitat breadth 5
genomic traits could better discriminate among those habitats.Just as trait-based analyses have been used by plant and animalecologists to predict distribution patterns that are not well-explained by taxonomy or phylogeny alone (e.g. Laube et al.2013), we hypothesised that genomic traits could be used to pre-dict why some soil bacteria are more ubiquitous than others.We observed significant relationships between individual
genomic traits and occupancy (as one surrogate of habitatbreadth, Fig. 1). Genome size (a basic structural characteris-tic) and the number of different protein family (Pfam)domains (a measure of the genomic functional richness) wereboth positively correlated with occupancy (Fig. 3). That is,bacteria with larger genomes and more metabolic and func-tional capabilities (both attributes that were highly co-corre-lated; q = 0.80, P < 0.0001) tended to occur across more ofthe samples than bacteria with smaller genomes. Formicrobes, genome size is a product of vertical inheritance,horizontal gene transfer and gene duplications and losses(Koonin & Wolf 2008). Thus, microbial genome size at leastpartially reflects an adaptation to the external complexityimposed by the organism’s lifestyle and ecology (Konstantini-dis & Tiedje 2004). That is, organisms inhabiting variable,heterogeneous environments, such as free-living microorgan-isms in soil, tend to have larger and more versatile genomesthan organisms thriving in a constant or more stable habitat,such as parasites living inside a host (Guieysse & Wuertz2012). In addition, larger genomes tend to be more susceptibleto horizontal gene transfer from distantly related organisms,leading to the hypothesis that there is a correlation betweengenome size and environmental heterogeneity: more diversecommunities living in complex environments increase thedemand for larger gene repertoires, which are expanded byincreased uptake of genes from phylogenetically distant organ-
isms interacting in the same environment (Cordero &Hogeweg 2009). Although this hypothesis has not yet beenvalidated, it is worth noting that many of the largest micro-bial genomes are from soil-associated microbes, includingMyxobacteria, Pseudomonas, Bradyrhizobium and Streptomyces(Konstantinidis & Tiedje 2004), suggesting that environmentslike soil with a high degree of phylogenetic diversity (Torsviket al. 1990) may select for organisms with larger genome sizes.The presence of specific functional gene categories (based on
Pfam domains) was significantly correlated with different levelsof occupancy (Mann–Whitney test, P < 0.001 after FDR cor-rection) (Fig. 4). For example, a number of protein familieswere more common in those taxa with large range sizes, includ-ing the phosphotransferase enzyme involved in antibiotic resis-tance (PF01636; Fig. 4a), the conserved domain containing thecatalytic phosphorylation function of protein kinases(PF00069; Fig. 4b), the cytochrome P450 which catalyses theoxidation of organic substance such as xenobiotics (PF00067;Fig. 4c), and the transglycosylase domain found in secretionsystems (PF01464; Fig. 4d). Overall, we observed that thefunctions present in more ubiquitous taxa tended to be involvedin a higher proportion of pathways related to amino acidmetabolism and xenobiotics biodegradation compared to thepathways predicted by pooling all the analysed taxa together(Fig. 4e, Figs S3 and S4 for the detailed cases of amino acidand xenobiotics metabolism). These functional differences ingenome properties agree with our finding that ubiquitous soilbacteria tended to have bigger and more versatile genomes(Fig. 3). Konstantinidis & Tiedje (2004) showed that bacteriawith larger genomes preferentially accumulated regulatory andsecondary metabolism-related genes (Metabolism categories inFig. 4e), while being depleted in informational and DNAmetabolism-related genes (Genetic information categories in
0
200
400
600
< 2.5 2.5 – 5 5 – 7.5 > 7.5Genome size (Mb)
Occ
up
ancy
(n
um
ber
of
site
s)
< 1250 1250 – 1750 1750 – 2250 > 2250Number of different Pfam domains
(a) (b)Spearman’s ρ = 0.44, P < 0.0001 Spearman’s ρ = 0.33, P < 0.0001
Figure 3 Relationship between occupancy and the genomic traits of genome size (a) and number of different protein families (Pfam) domains (b).
© 2014 John Wiley & Sons Ltd/CNRS
6 A. Barber�an et al. Letter
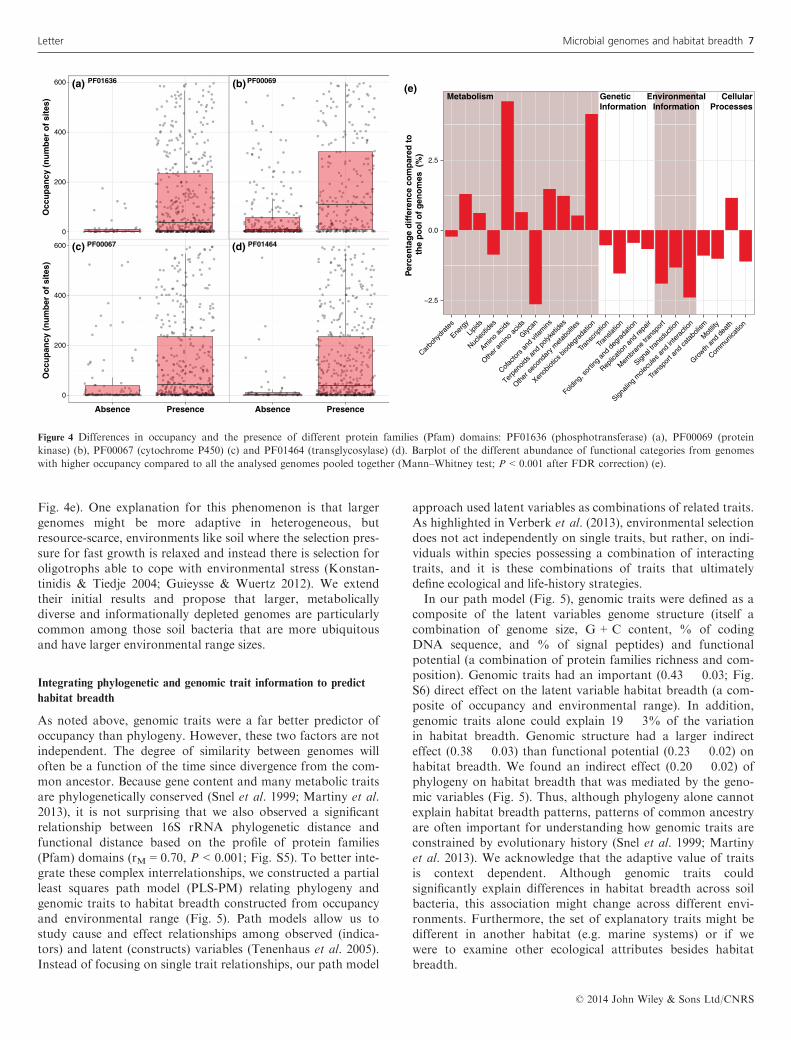
Fig. 4e). One explanation for this phenomenon is that largergenomes might be more adaptive in heterogeneous, butresource-scarce, environments like soil where the selection pres-sure for fast growth is relaxed and instead there is selection foroligotrophs able to cope with environmental stress (Konstan-tinidis & Tiedje 2004; Guieysse & Wuertz 2012). We extendtheir initial results and propose that larger, metabolicallydiverse and informationally depleted genomes are particularlycommon among those soil bacteria that are more ubiquitousand have larger environmental range sizes.
Integrating phylogenetic and genomic trait information to predict
habitat breadth
As noted above, genomic traits were a far better predictor ofoccupancy than phylogeny. However, these two factors are notindependent. The degree of similarity between genomes willoften be a function of the time since divergence from the com-mon ancestor. Because gene content and many metabolic traitsare phylogenetically conserved (Snel et al. 1999; Martiny et al.2013), it is not surprising that we also observed a significantrelationship between 16S rRNA phylogenetic distance andfunctional distance based on the profile of protein families(Pfam) domains (rM = 0.70, P < 0.001; Fig. S5). To better inte-grate these complex interrelationships, we constructed a partialleast squares path model (PLS-PM) relating phylogeny andgenomic traits to habitat breadth constructed from occupancyand environmental range (Fig. 5). Path models allow us tostudy cause and effect relationships among observed (indica-tors) and latent (constructs) variables (Tenenhaus et al. 2005).Instead of focusing on single trait relationships, our path model
approach used latent variables as combinations of related traits.As highlighted in Verberk et al. (2013), environmental selectiondoes not act independently on single traits, but rather, on indi-viduals within species possessing a combination of interactingtraits, and it is these combinations of traits that ultimatelydefine ecological and life-history strategies.In our path model (Fig. 5), genomic traits were defined as a
composite of the latent variables genome structure (itself acombination of genome size, G + C content, % of codingDNA sequence, and % of signal peptides) and functionalpotential (a combination of protein families richness and com-position). Genomic traits had an important (0.43 � 0.03; Fig.S6) direct effect on the latent variable habitat breadth (a com-posite of occupancy and environmental range). In addition,genomic traits alone could explain 19 � 3% of the variationin habitat breadth. Genomic structure had a larger indirecteffect (0.38 � 0.03) than functional potential (0.23 � 0.02) onhabitat breadth. We found an indirect effect (0.20 � 0.02) ofphylogeny on habitat breadth that was mediated by the geno-mic variables (Fig. 5). Thus, although phylogeny alone cannotexplain habitat breadth patterns, patterns of common ancestryare often important for understanding how genomic traits areconstrained by evolutionary history (Snel et al. 1999; Martinyet al. 2013). We acknowledge that the adaptive value of traitsis context dependent. Although genomic traits couldsignificantly explain differences in habitat breadth across soilbacteria, this association might change across different envi-ronments. Furthermore, the set of explanatory traits might bedifferent in another habitat (e.g. marine systems) or if wewere to examine other ecological attributes besides habitatbreadth.
−2.5
0.0
2.5
Carbo
hydr
ates
Energ
y
Lipids
Nucleo
tides
Amino
acid
s
Other
am
ino a
cids
Glycan
Cofacto
rs a
nd vi
tam
ins
Terpe
noids
and
poly
ketid
es
Other
seco
ndar
y met
aboli
tes
Xenob
iotics
biod
egra
datio
n
Trans
cript
ion
Trans
lation
Foldi
ng, s
ortin
g an
d de
grad
ation
Replic
ation
and
repa
ir
Mem
bran
e tra
nspo
rt
Signal
trans
ducti
on
Signali
ng m
olecu
les a
nd in
tera
ction
Trans
port
and
cata
bolis
m
Mot
ility
Growth
and
dea
th
Comm
unica
tion
Per
cen
tag
e d
iffe
ren
ce c
om
par
ed t
o
the
po
ol o
f g
eno
mes
(%
)
Metabolism GeneticInformation
EnvironmentalInformation
CellularProcesses
Occ
up
ancy
(n
um
ber
of
site
s)
0
200
400
600
Absence Presence
Occ
up
ancy
(n
um
ber
of
site
s)
Absence Presence
(e)PF00069
PF00067 PF01464
0
200
400
600 (a) (b)
(c) (d)
PF01636
Figure 4 Differences in occupancy and the presence of different protein families (Pfam) domains: PF01636 (phosphotransferase) (a), PF00069 (protein
kinase) (b), PF00067 (cytochrome P450) (c) and PF01464 (transglycosylase) (d). Barplot of the different abundance of functional categories from genomes
with higher occupancy compared to all the analysed genomes pooled together (Mann–Whitney test; P < 0.001 after FDR correction) (e).
© 2014 John Wiley & Sons Ltd/CNRS
Letter Microbial genomes and habitat breadth 7

CONCLUDING REMARKS
The distributions of taxa across space and the ability of taxato cope with different environmental conditions are funda-mental ecological attributes of both microbial and ‘macro’-bial organisms (Brown et al. 1996; Slatyer et al. 2013), yet thetraits that determine them are not well understood even fororganisms whose life-history characteristics are reasonablywell known (Lester et al. 2007). For bacteria in the soil envi-ronment, we show that genomic traits can be used to predictwhy some microbial taxa are more ubiquitous than others.Habitat breadth was positively correlated with genome sizeand genes associated with specific functional capabilities,including secondary metabolic pathways. This ability topredict occupancy patterns from genomic traits is surprisinggiven that it is the phenotypic traits that directly impact howbacteria interact with their environment. However, since wedo not have phenotypic information for most soil bacteria,even for many of those bacterial taxa that have been culturedand sequenced, we have to rely on genomic traits asphenotypic information is often scarce or collected inconsis-tently across taxa, making direct phenotypic characterisationdifficult. Therefore, this work highlights the potential forusing genomic information to begin building a trait-basedunderstanding of microbial ecology that has proven so usefulfor comprehending the distributions of animals and plants.
ACKNOWLEDGEMENTS
We thank Antonio Fern�andez-Guerra for advice on the use ofMinPath, and Elise S. Gornish and the students from the‘Genomes and Traits’ seminar at the University of Colorado forhelpful comments. We also thank the Central Park Conservancyand the American Museum of Natural History for logisticalassistance and Jessica Henley, Scott Bates, Jason Betley, Tho-mas Crowther, Eugene Kelly, Emily Oldfield, Ashley Shaw, andChris Steenbock for their help with the sample collection andanalyses. AB is supported by a James S. McDonnell (JSMF)Postdoctoral Fellowship. Funding for this study was providedto NF from the National Science Foundation (DEB0953331).
AUTHORSHIP
All authors were involved in the study design and contributedto the writing of the manuscript. JWL processed the 16SrRNA sequence data; KSR, MAB, DHW and NF led thesample collection; AB analysed the data and, along with NF,led the writing of the manuscript.
REFERENCES
Barber�an, A., Fern�andez-Guerra, A., Bohannan, B.J.M. & Casamayor,
E.O. (2012). Exploration of community traits as ecological markers in
microbial metagenomes. Mol. Ecol., 21, 1909–1917.Benjamini, Y. & Hochberg, Y. (1995). Controlling the false discovery
rate: a practical and powerful approach to multiple testing. J. R. Stat.
Soc. Series B, 57, 289–300.Brown, J.H., Stevens, G.C. & Kaufman, D.M. (1996). The geographic
range: size, shape, boundaries, and internal structure. Annu. Rev. Ecol.
Syst., 27, 597–623.Burke, C., Steinberg, P., Rusch, D., Kjelleberg, S. & Thomas, T. (2011).
Bacterial community assembly based on functional genes rather than
species. Proc. Natl. Acad. Sci. U S A, 108, 14288–14293.Caporaso, J.G., Bittinger, K., Bushman, F.D., DeSantis, T.Z., Andersen,
G.L. & Knight, R. (2010). PyNAST: a flexible tool for aligning
sequences to a template alignment. Bioinformatics, 26, 266–267.Caporaso, J.G., Lauber, C.L., Walters, W.A., Berg-Lyons, D., Huntley, J.,
Fierer, N. et al. (2012). Ultra-high-throughput microbial community
analysis on the Illumina HiSeq and MiSeq platforms. ISME J., 6, 1621–1624.
Cole, J.R., Wang, Q., Cardenas, E., Fish, J., Chai, B., Farris, R.J. et al.
(2009). The Ribosomal Database Project: improved alignments and new
tools for rRNA analysis. Nucleic Acids Res., 37, D141–D145.
Cordero, O.X. & Hogeweg, P. (2009). The impact of long-distance
horizontal gene transfer on prokaryotic genome size. Proc Natl Acad
Sci U S A, 106, 21748–21753.Edgar, R.C. (2010). Search and clustering orders of magnitude faster than
BLAST. Bioinformatics, 26, 2460–2461.Edgar, R.C. (2013). UPARSE: highly accurate OTU sequences from
microbial amplicon reads. Nat. Methods, 10, 996–998.Edwards, K.F., Litchman, E. & Klausmeier, C.A. (2013). Functional
traits explain phytoplankton responses to environmental gradients
across lakes of the United States. Ecology, 94, 1626–1635.Fierer, N. & Jackson, R.B. (2006). The diversity and biogeography of soil
bacterial communities. Proc Natl Acad Sci U S A, 103, 626–631.
Phylogeny
Genom.StrucR2 = 0.16±0.04
Habitat BreadthR2 = 0.19±0.03
0.83Func.PotentialR2 = 0.57±0.02
Genom.Traits
0.40±0.05
0.22±0.04
Phylo.NMDS1
Phylo.NMDS2
Pfam.richness Pfam.NMDS1
GenomeSize
GC
CDS
SignalPeptide
Occupancy
0.68
0.79
0.84
0.72
0.82
0.970.96
0.96
0.96
0.68
Env.range
0.64±0.03
0.53±0.01
0.55±0.01
0.43±0.03
Figure 5 Directed graph of the Partial Least Squares Path Model (PLS-PM). Observed (i.e. measured) variables are represented in a rectangular form, while
latent variables (i.e. constructs) are represented in an elliptical form. Indicated are the loadings (the correlations between a latent variable and its observed
variables), the path coefficients and the coefficients of determination (R2) calculated after 1000 bootstraps. Models with different structures were assessed
using the Goodness of Fit (GoF) statistic, a measure of the overall prediction performance. For the best model represented here, the GoF was 0.59.
© 2014 John Wiley & Sons Ltd/CNRS
8 A. Barber�an et al. Letter
Fierer, N., Bradford, M.A. & Jackson, R.B. (2007). Toward an ecological
classification of soil bacteria. Ecology, 88, 1354–1364.Fierer, N., Lauber, C.L., Ramirez, K.S., Zaneveld, J., Bradford, M.A. &
Knight, R. (2012). Comparative metagenomic, phylogenetic and
physiological analyses of soil microbial communities. ISME J., 6, 1007–1017.
Finn, R.D., Tate, J., Mistry, J., Coggill, P.C., Sammut, S.J., Hotz, H.R.
et al. (2008). The Pfam protein families database. Nucleic Acids Res.,
36, D281–D288.
Garcia, J.A.L., Bartumeus, F., Roche, D., Giraldo, J., Stanley, H.E. &
Casamayor, E.O. (2008). Ecophysiological significance of scale-
dependent patterns in prokaryotic genomes unveiled by a combination
of statistic and genometric analyses. Genomics, 91, 538–543.Green, J.L., Bohannan, B.J.M. & Whitaker, R.J. (2008). Microbial
biogeography: from taxonomy to traits. Science, 320, 1039–1043.Gudelj, I., Weitz, J.S., Ferenci, T., Horner-Devine, M.C., Marx, C.J.,
Meyer, J.R. et al. (2010). An integrative approach to understanding
microbial diversity: from intracellular mechanisms to community
structure. Ecol. Lett., 13, 1073–1084.Guieysse, B. & Wuertz, S. (2012). Metabolically versatile large-genome
prokaryotes. Curr. Opin. Biotechnol., 23, 467–473.Kanehisa, M., Goto, S., Sato, Y., Furumichi, M. & Tanabe, M. (2012).
KEGG for integration and interpretation of large-scale molecular data
sets. Nucleic Acids Res., 40, D109–D114.
Konstantinidis, K.T. & Tiedje, J.M. (2004). Trends between gene content
and genome size in prokaryotic species with larger genomes. Proc Natl
Acad Sci U S A, 101, 3160–3165.Koonin, E.V. & Wolf, Y.I. (2008). Genomics of Bacteria and Archaea:
the emerging dynamic view of the prokaryotic world. Nucleic Acids
Res., 36, 6688–6719.Laube, I., Korntheuer, H., Schwager, M., Trautmann, S., Rahbek, C. &
B€ohning-Gaese, K. (2013). Towards a more mechanistic understanding
of traits and range sizes. Glob. Ecol. Biogeogr., 22, 233–241.Lauro, F.M., McDougald, D., Thomas, T., Williams, T.J., Egan, S., Rice,
S. et al. (2009). The genomic basis of trophic strategy in marine
bacteria. Proc Natl Acad Sci U S A, 106, 15527–15533.Lennon, J.T., Aanderud, Z.T., Lehmkuhl, B.K. & Schoolmaster, D.R. Jr
(2012). Mapping the niche space of soil microorganisms using
taxonomy and traits. Ecology, 93, 1867–1879.Lester, S.E., Ruttenberg, B.I., Gaines, S.D. & Kinlan, B.P. (2007). The
relationship between dispersal ability and geographic range size. Ecol.
Lett., 10, 745–758.Liu, Z., Lozupone, C., Hamady, M., Bushman, F.D. & Knight, R.
(2007). Short pyrosequencing reads suffice for accurate microbial
community analysis. Nucleic Acids Res., 35, e120.
Losos, J.B. (2008). Phylogenetic niche conservatism, phylogenetic signal
and the relationship between phylogenetic relatedness and ecological
similarity among species. Ecol. Lett., 11, 995–1003.Lozupone, C., Faust, K., Raes, J., Faith, J., Frank, D.N., Zaneveld, J.
et al. (2012). Identifying genomic and metabolic features that can
underlie early successional and opprtunistic lifestyles of human gut
symbionts. Genome Res., 22, 1974–1984.Markowitz, V.M., Chen, I.A., Palaniappan, K., Chu, K., Szeto, E.,
Grechkin, Y. et al. (2012). IMG: the integrated microbial genomes
database and comparative analysis system. Nucleic Acids Res., 40,
D115–D122.
Martiny, A.C., Treseder, K. & Pusch, G. (2013). Phylogenetic conservatism
of functional traits in microorganisms. ISME J., 7, 830–838.McDonald, D., Price, M.N., Goodrich, J., Nawrocki, E.P., DeSantis,
T.Z., Probst, A. et al. (2012). An improved Greengenes taxonomy with
explicit ranks for ecological and evolutionary analyses of bacteria and
archaea. ISME J., 6, 610–618.
McGill, B.J., Enquist, B.J., Weiher, E. & Westoby, M. (2006). Rebuilding
community ecology from functional traits. Trends Ecol. Evol., 21, 178–185.
Philippot, L., Andersson, S.G.E., Battin, T.J., Prosser, J.I., Schimel, J.P.,
Whitman, W.B. et al. (2010). The ecological coherence of high bacterial
taxonomic ranks. Nat. Rev. Microbiol., 8, 523–529.Portillo, M.C., Leff, J.W., Lauber, C.L. & Fierer, N. (2013). Cell size
distributions of soil bacterial and archaeal taxa. Appl. Environ.
Microbiol., 79, 7610–7617.Price, M.N., Dehal, P.S. & Arkin, A.P. (2010). FastTree 2–approximately
maximum-likelihood trees for large alignments. PLoS ONE, 5, e9490.
Sanchez, G. & Trinchera, L. (2012). Plspm: partial least squares data
analysis methods. R package. http://cran.r-project.org/web/packages/
plspm
Slatyer, R.A., Hirst, M. & Sexton, J.P. (2013). Niche breadth predicts
geographical range size: a general ecological pattern. Ecol. Lett., 16,
1104–1114.Snel, B., Bork, P. & Huynen, M.A. (1999). Genome phylogeny based on
gene content. Nat. Genet., 21, 108–110.Tenenhaus, M., Esposito Vinzi, V., Chatelin, Y.M. & Lauro, C. (2005).
PLS path modeling. Comput. Stat. Data Anal., 48, 159–205.Tettelin, H., Riley, D., Cattuto, C. & Medini, D. (2008). Comparative
genomics: the bacterial pan-genome. Curr. Opin. Microbiol., 11, 472–477.Torsvik, V., Goksoyr, J. & Daae, F.L. (1990). High diversity in DNA of
soil bacteria. Appl. Environ. Microbiol., 56, 782–787.Verberk, W., van Noordwijk, C.G.E. & Hildrew, A.G. (2013). Delivering on
a promise: integrating species traits to transform descriptive community
ecology into a predictive science. Freshwater Science, 32, 531–547.Vieira-Silva, S. & Rocha, E.P.C. (2010). The systemic imprint of growth
and its uses in ecological (meta)genomics. PLoS Genet., 6, e1000808.
Walters, W.A., Caporaso, J.G., Lauber, C.L., Berg-Lyons, D., Fierer, N.
& Knight, R. (2011). PrimerProspector: de nove design and taxonomic
analysis of barcoded polymerase chain reaction primers. Bioinformatics,
27, 1159–1161.Wang, Q., Garrity, G.M., Tiedje, J.M. & Cole, J.R. (2007). Na€ıve
Bayesian Classifier for rapid assessment of rRNA sequences into the
new bacterial taxonomy. Appl. Environ. Microbiol., 73, 5261–5267.Webb, T.J. & Gaston, K.J. (2003). On the heritability of geographic
range sizes. Am. Nat., 161, 553–566.Wright, I.J., Reich, P.B., Westoby, M., Ackerly, D.D., Baruch, Z.,
Bongers, F. et al. (2004). The worldwide leaf economics spectrum.
Nature, 428, 821–827.Ye, Y. & Doak, T.G. (2009). A parsimony approach to biological
pathway reconstruction/inference for genomes and metagenomes. PLoS
Comput. Biol., 5, e1000465.
SUPPORTING INFORMATION
Additional Supporting Information may be downloaded viathe online version of this article at Wiley Online Library(www.ecologyletters.com).
Editor, John KlironomosManuscript received 13 January 2014First decision made 22 February 2014Second decision made 12 March 2014Third decision made 19 March 2014Manuscript accepted 22 March 2014
© 2014 John Wiley & Sons Ltd/CNRS
Letter Microbial genomes and habitat breadth 9