ruth loos-lo último en obesidad
TRANSCRIPT
The genetics of obesityGoing beyond common variants and common
phenotypes
Ruth LoosProfessor, Preventive Medicine
Director, Genetics of Obesity and Related Metabolic Traits ProgramCharles Bronfman Institute for Personalized Medicine
Mindich Child Health and Development InstituteIcahn School of Medicine at Mount Sinai
18th Annual International Symposium of the Universite Laval Obesity Research Chair, Montreal, Canada, November 13 2015

Obesity is heritable
Borjeson Acta Paed Scand 1976
DZ
MZTwin studies
Family studies
h2 = 40-70%
Candidate gene studies
Linkage studies
Outline
• Common variation and common adiposity phenotypes
• Common variation and more refined adiposity phenotypes
• Low-frequency variation and common adiposity phenotypes
Waist-to-Hip Ratio
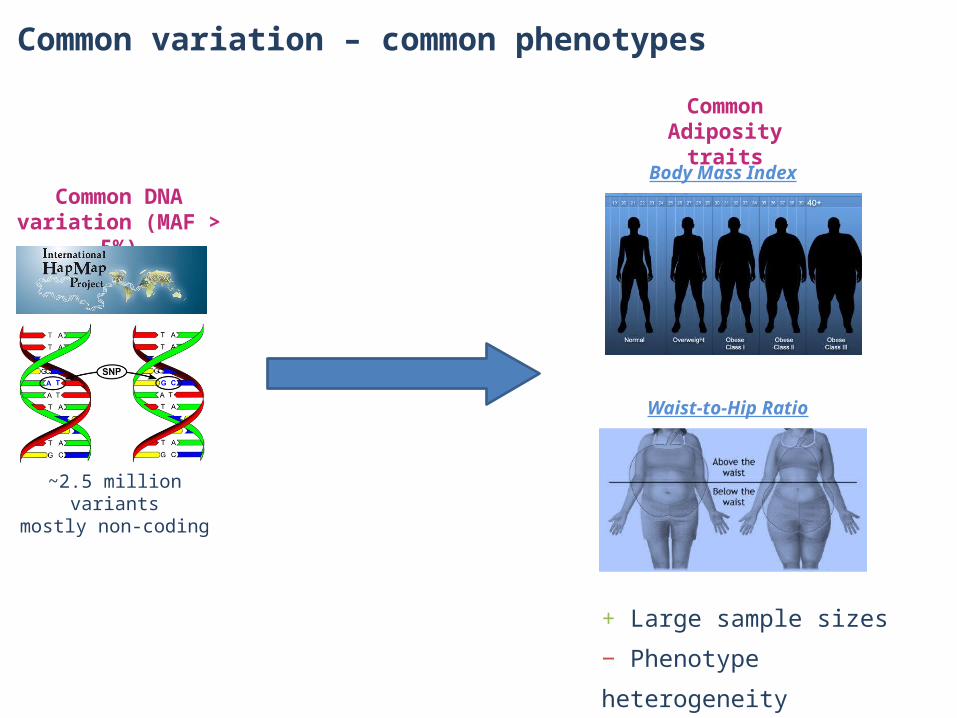
Common variation – common phenotypes
Common DNA variation (MAF >
5%)
Common Adiposity
traits
~2.5 million variantsmostly non-coding
Body Mass Index
+ Large sample sizes− Phenotype heterogeneity
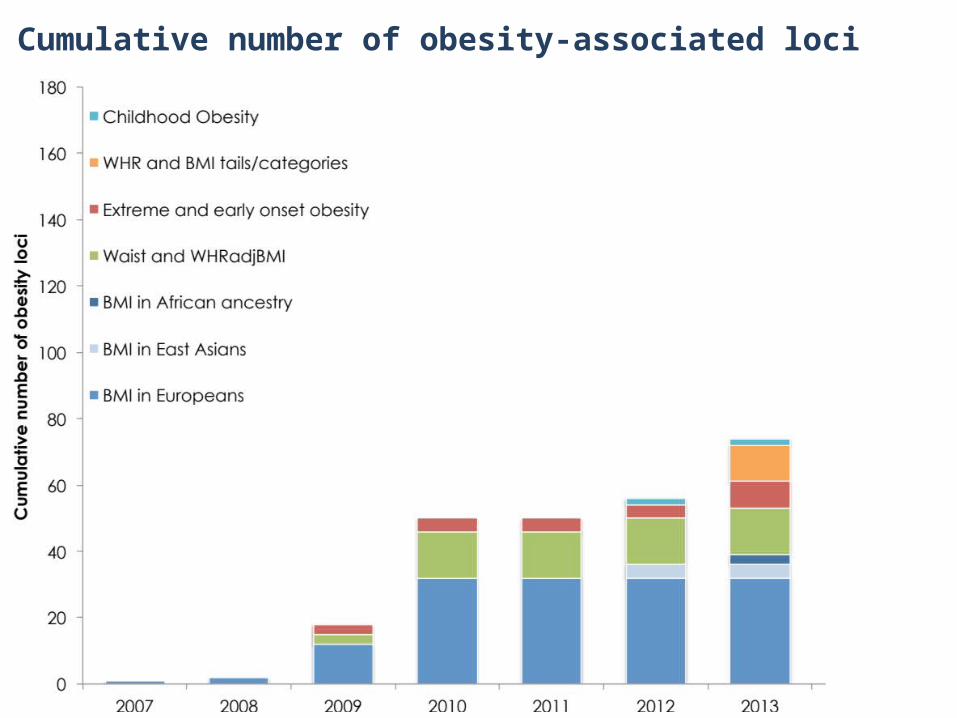
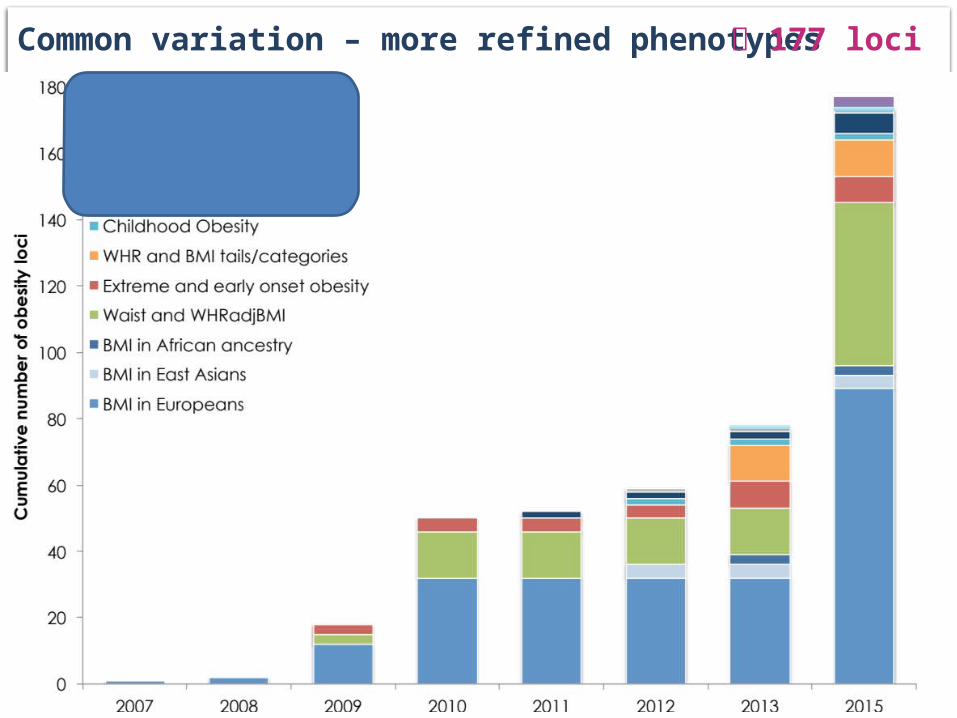
Cumulative number of obesity-associated loci
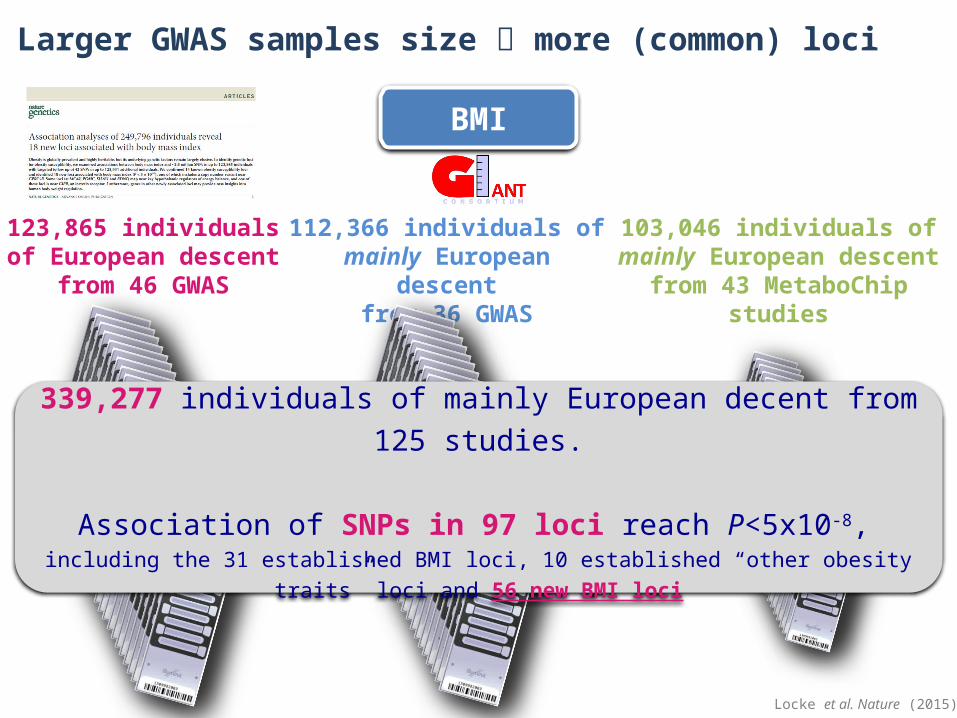
Larger GWAS samples size more (common) loci
123,865 individuals of European descent
from 46 GWAS
103,046 individuals of mainly European descent
from 43 MetaboChip studies
112,366 individuals of mainly European descent
from 36 GWAS
339,277 individuals of mainly European decent from 125 studies.
Association of SNPs in 97 loci reach P<5x10⁻⁸,
including the 31 established BMI loci, 10 established “other obesity traits” loci and 56 new BMI loci
BMI
Locke et al. Nature (2015)

Larger GWAS samples size more (common) loci
BMI
Locke et al. Nature (2015)
FTO
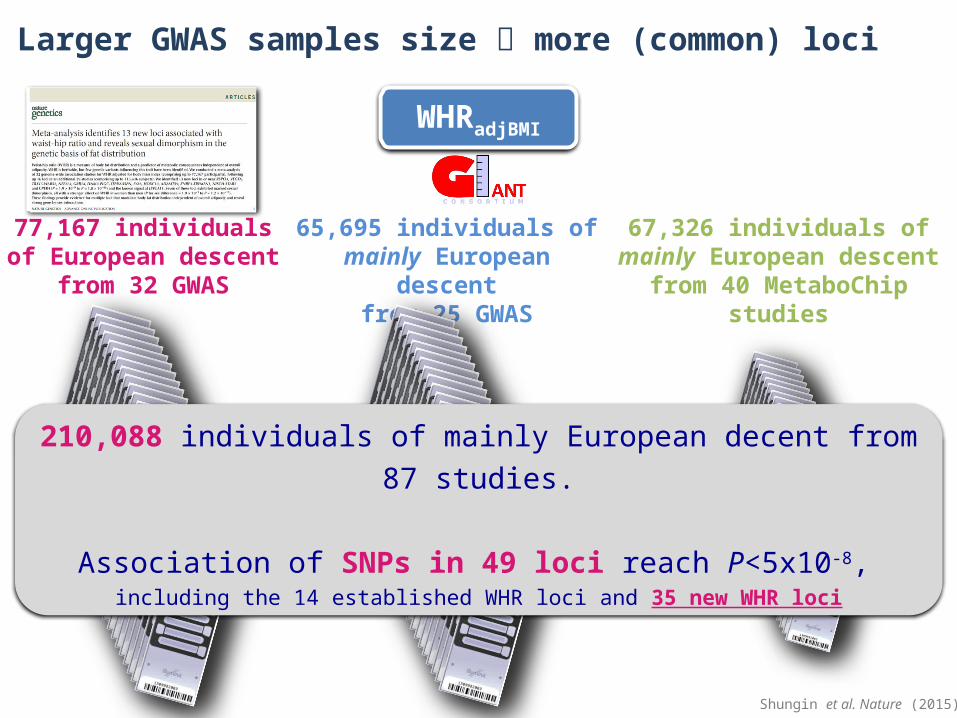
77,167 individuals of European descent
from 32 GWAS
67,326 individuals of mainly European descent
from 40 MetaboChip studies
65,695 individuals of mainly European descent
from 25 GWAS
210,088 individuals of mainly European decent from 87 studies.
Association of SNPs in 49 loci reach P<5x10⁻⁸,
including the 14 established WHR loci and 35 new WHR loci
WHRadjBMI
Larger GWAS samples size more (common) loci
Shungin et al. Nature (2015)
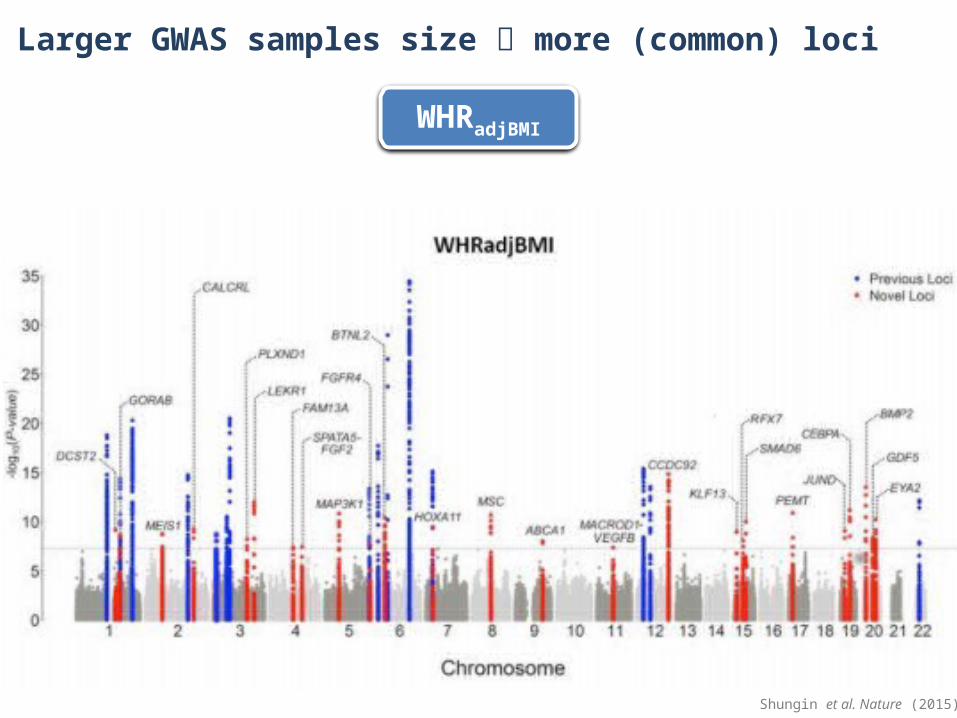
WHRadjBMI
Larger GWAS samples size more (common) loci
Shungin et al. Nature (2015)

GIANT BMI meta-analysis:N=339,247
56 new BMI loci
GIANT WHR meta-analysis:N=211,221
35 new WHR loci
Common variation – common phenotypes 166 loci

Locke et al. Nature (In press)
0% 10% 20% 30% 40% 50% 60% 70% 80% 90% 100%0.000
0.200
0.400
0.600
0.800
1.000
1.200
BMI increasing allele
Effec
t on
wei
ght
(kg)
/ pe
r BM
I-in
crea
sing
alle
leAll variants are common and have modest effects
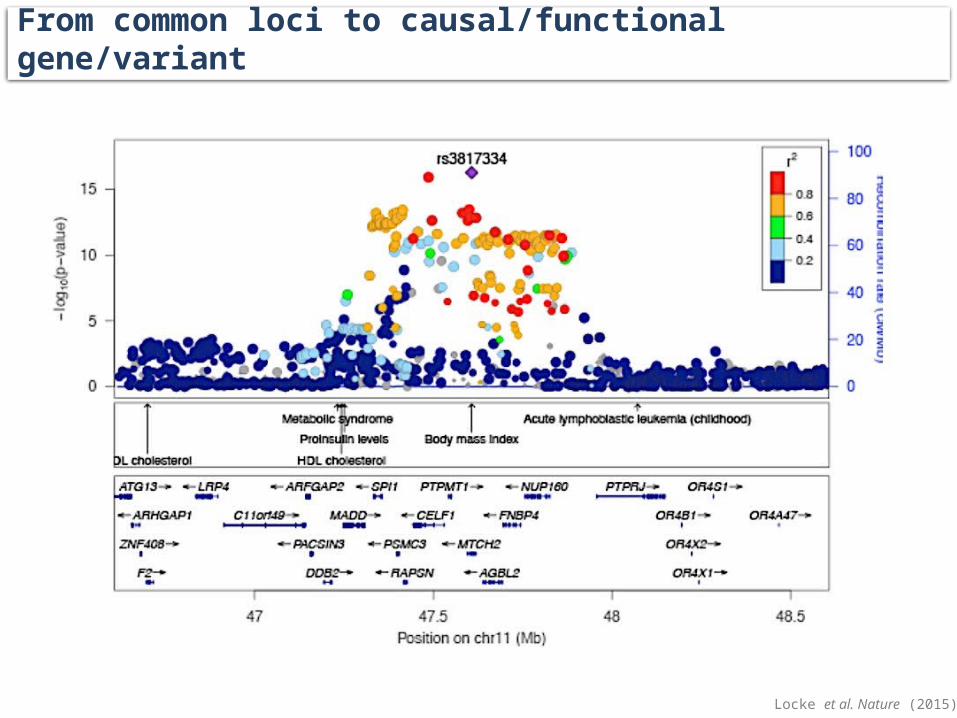
From common loci to causal/functional gene/variant
Locke et al. Nature (2015)

Analyses to decipher each locus
• Cross-phenotype associations with cardiometabolic traits and diseases
• Cross-ancestry associations
• Fine-mapping analyses
• eQTL analyses for cis-association
• ENCODE annotation to identify regulatory marks
• Pathway analyses (MAGENTA and DEPICT)
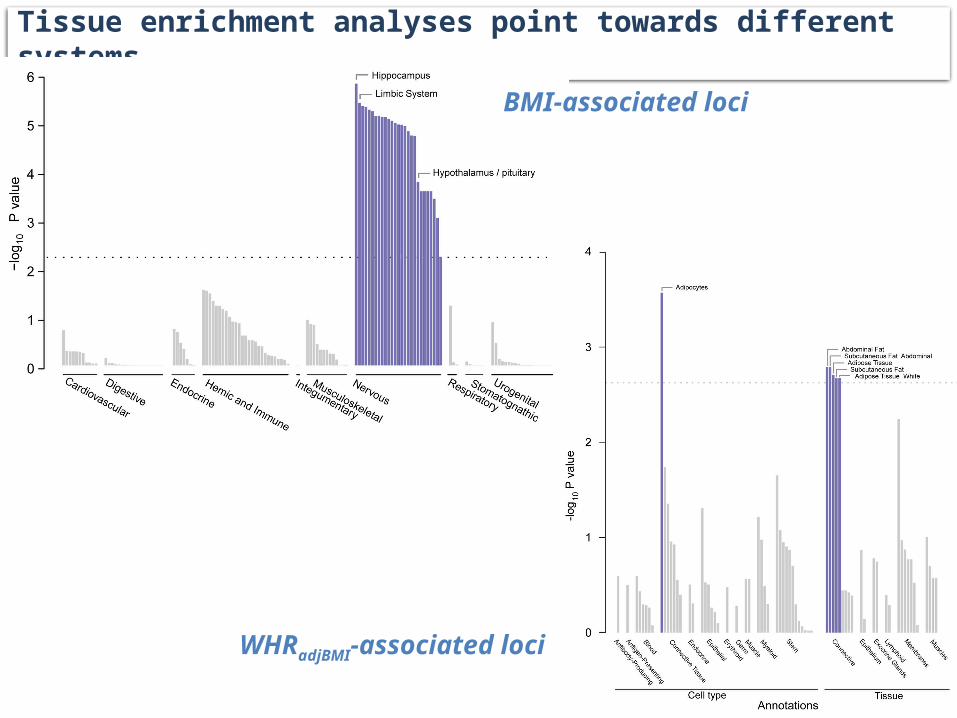
Tissue enrichment analyses point towards different systems
BMI-associated loci
WHRadjBMI-associated loci
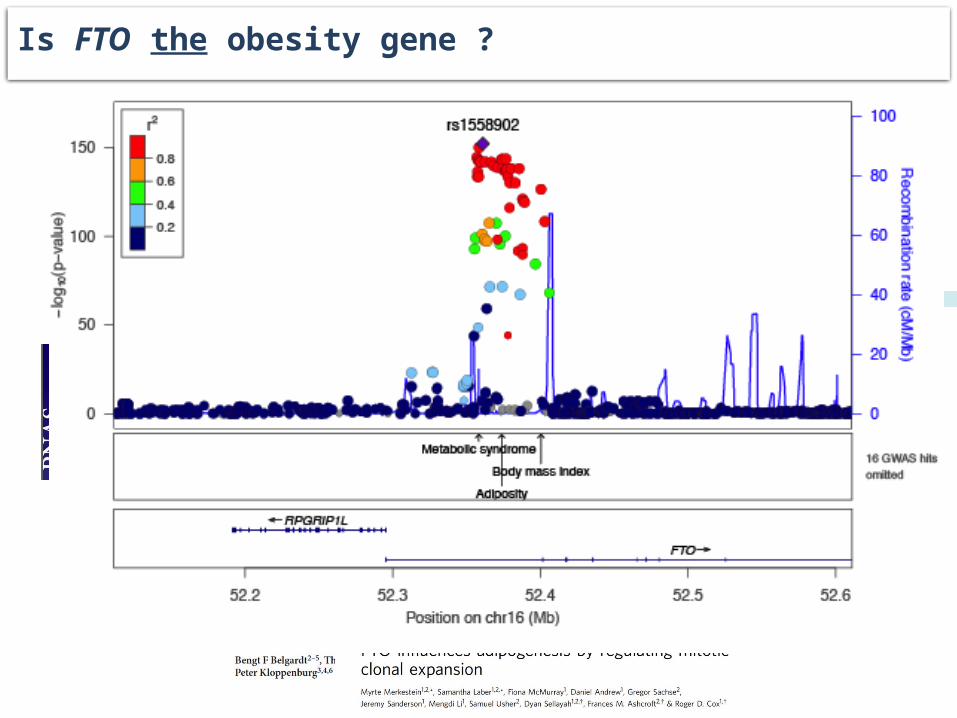
Is FTO the obesity gene ?
AdiposityER- breast cancer
FTO
Melanoma
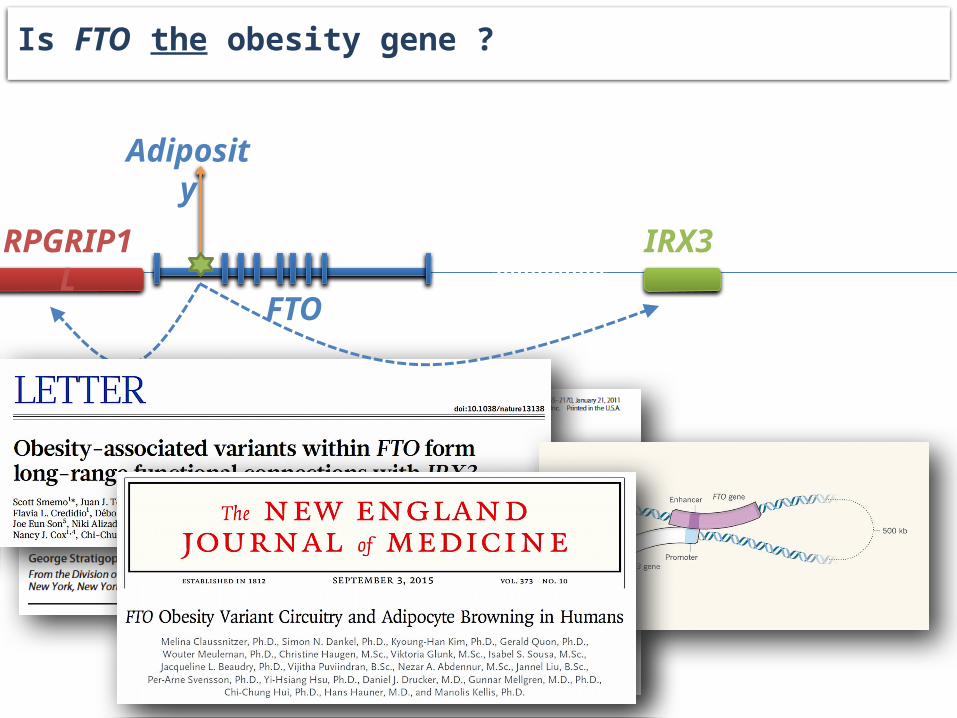
Adiposity
FTO
RPGRIP1L IRX3
Is FTO the obesity gene ?

Common variation – More refined phenotypes
Common DNA variation (MAF >
5%)
~2.5 million variantsmostly non-coding Leptin levels
Refined adiposity
traits
Body Fat %
- Smaller sample sizes+ More accurate phenotype
Visceral and subcutaneous fat
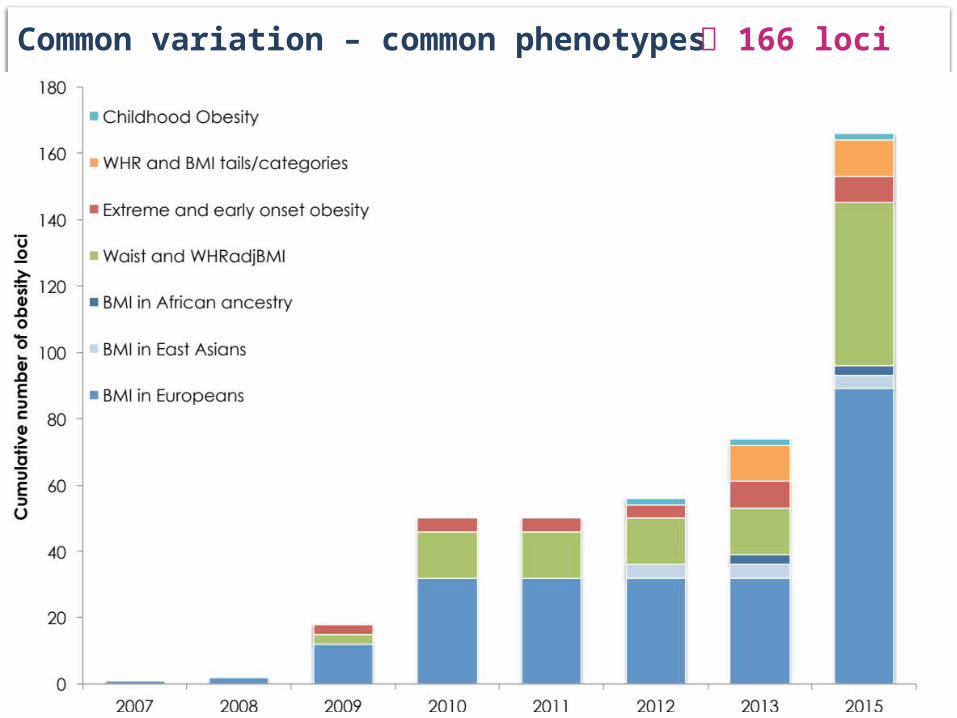
Common variation – common phenotypes 166 loci
GIANT BMI meta-analysis:N=339,247
56 new BMI loci
GIANT WHR meta-analysis:N=211,221
35 new WHR loci
Common variation – more refined phenotypes 177 loci

Body fat percentage more accurately assesses adiposity

24,582 individuals of 13 MetaboChip studies
37,562 individuals of from 28 new GWAS
100,706 individuals of mainly European decent from 56 studies.
Association of SNPs in 12 loci reach P<5x10⁻⁸,
including the 2 established BF% loci, 6 established BMI loci and 4 new BF% loci
38,562 individuals from 15 GWAS used
previously
Common variation for body fat percentage
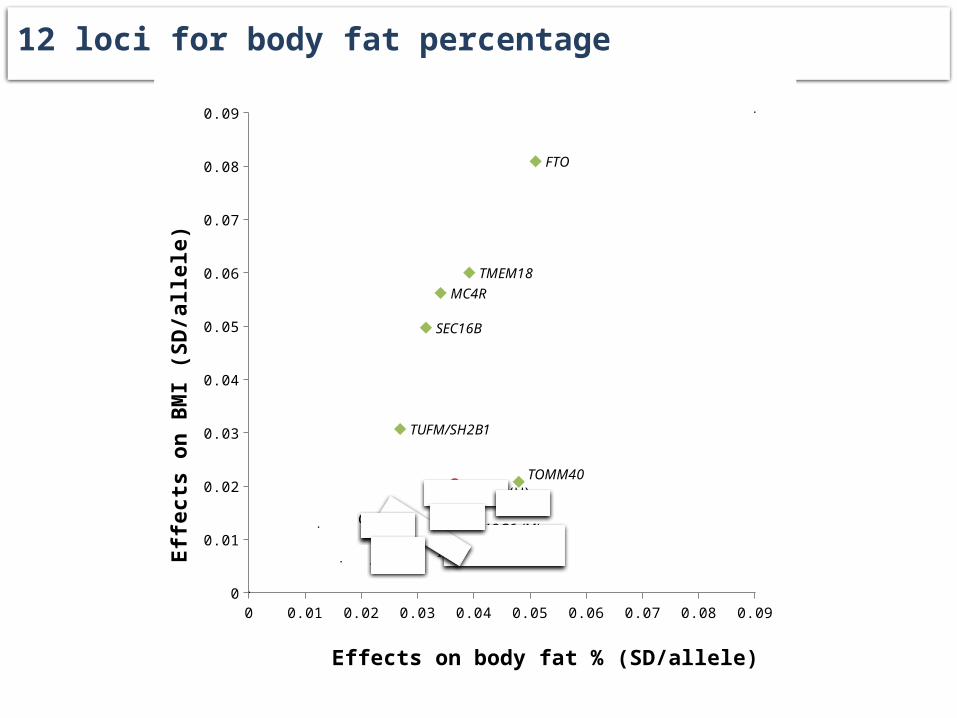
12 loci for body fat percentage
0 0.01 0.02 0.03 0.04 0.05 0.06 0.07 0.08 0.090
0.01
0.02
0.03
0.04
0.05
0.06
0.07
0.08
0.09
CRTC1 (W)
FTO
IRS1
MC4RTMEM18
COBLL1
SPRY2
TOMM40
TUFM/SH2B1
IGF2BP1
SEC16B
PLA2G6 (M)
Effects on body fat % (SD/allele)
Effe
cts
on B
MI (
SD/a
llele
)
0.8
0.9
1
1.1
1.2All Men Women
Per-
alle
le c
hang
e in
risk
(O
R)
0.8
0.9
1
1.1
1.2All Men Women
-0.25
-0.2
-0.15
-0.1
-0.05
0All Men Women
Per-
alle
le c
hang
e in
bod
y fa
t (%
)
-0.15
-0.1
-0.05
0
0.05
0.1All Men Women
Per-
alle
le c
hang
e in
BM
I (k
g/m
2)
-0.1
0
0.1
0.2
0.3
0.4All Men Women
Per-
alle
le c
hang
e in
WH
R
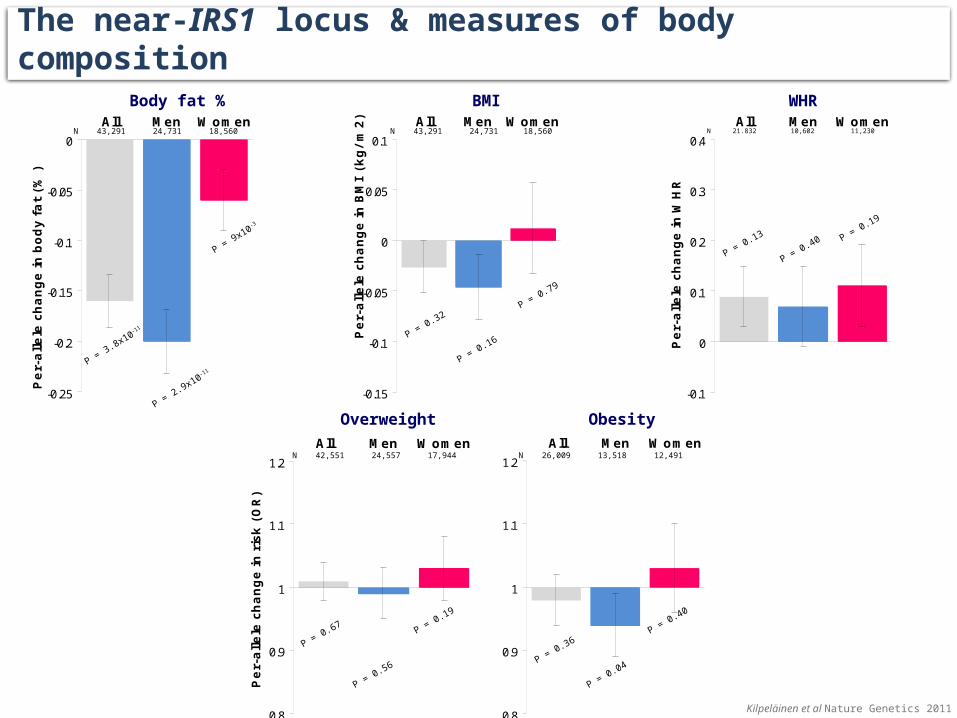
The near-IRS1 locus & measures of body composition
P = 3.8x10⁻¹¹
P = 2.9x10⁻¹¹
P = 9x10⁻³
P = 0.32
P = 0.16
P = 0.79
P = 0.13
P = 0.40 P = 0.19
N 43,291 24,731 18,560 N 21.832 10,602 11,230N 43,291 24,731 18,560
N 42,551 24,557 17,944 N 26,009 13,518 12,491
P = 0.67
P = 0.56
P = 0.19
P = 0.36
P = 0.04
P = 0.40
Body fat % BMI WHR
Overweight Obesity
Kilpeläinen et al Nature Genetics 2011
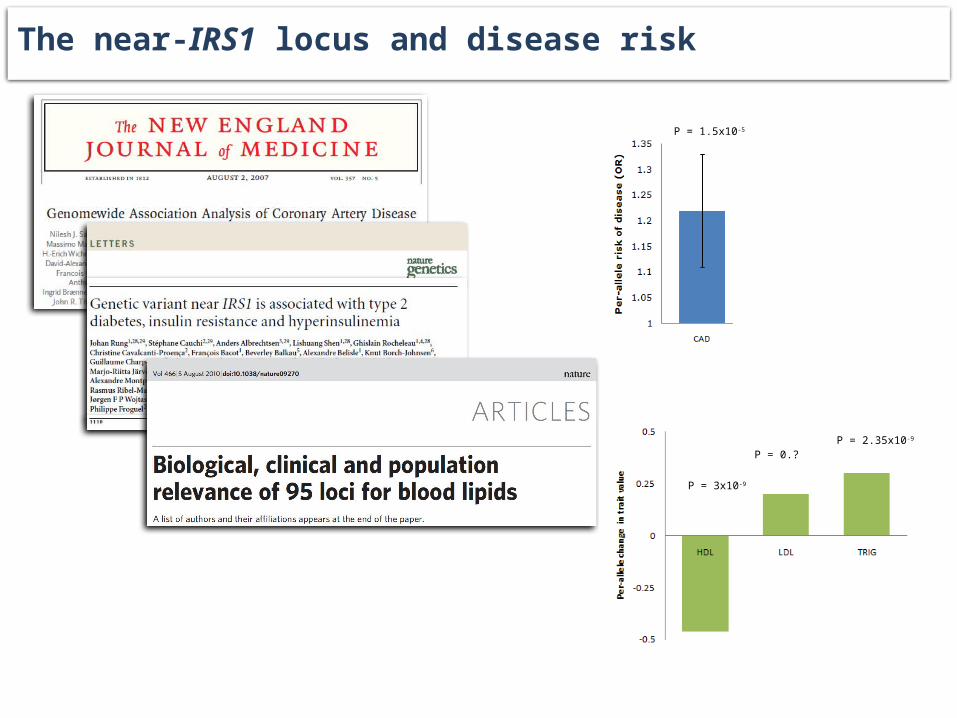
The near-IRS1 locus and disease risk
P = 1.5x10⁻⁵
P = 9.3x10⁻¹²
P = 3x10⁻⁹
P = 0.?P = 2.35x10⁻⁹
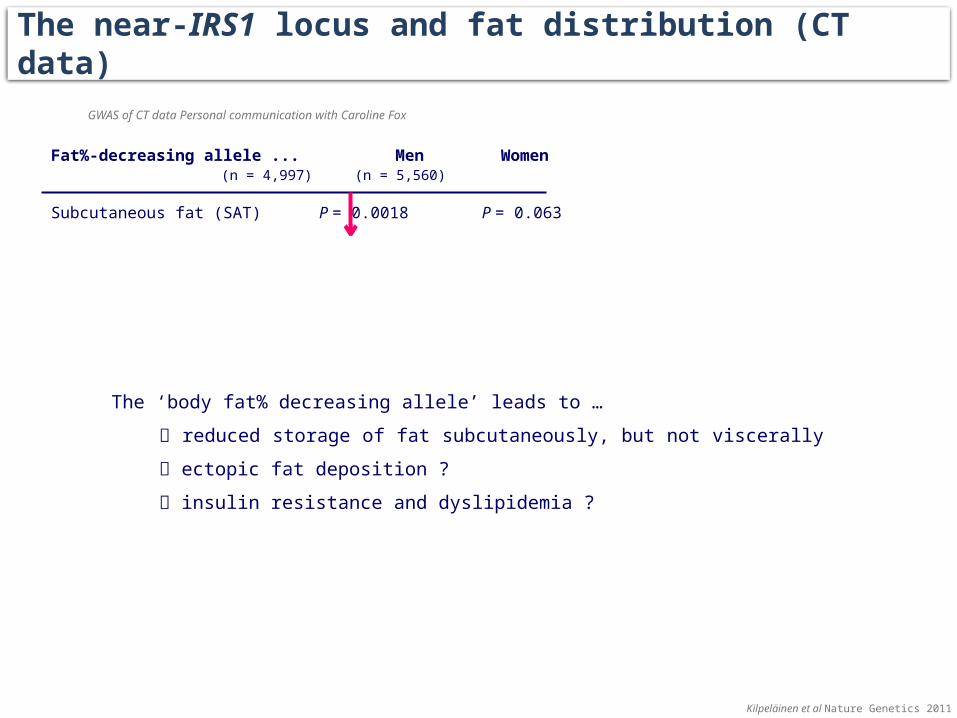
The near-IRS1 locus and fat distribution (CT data)
Fat%-decreasing allele ... Men Women (n = 4,997) (n = 5,560)
Subcutaneous fat (SAT) P = 0.0018 P = 0.063
Visceral fat (VAT) P = 0.95 P = 0.63
VAT/SAT P = 6.1x10⁻⁶ P = 0.31
GWAS of CT data Personal communication with Caroline Fox
The ‘body fat% decreasing allele’ leads to … reduced storage of fat subcutaneously, but not viscerally ectopic fat deposition ? insulin resistance and dyslipidemia ?
Kilpeläinen et al Nature Genetics 2011
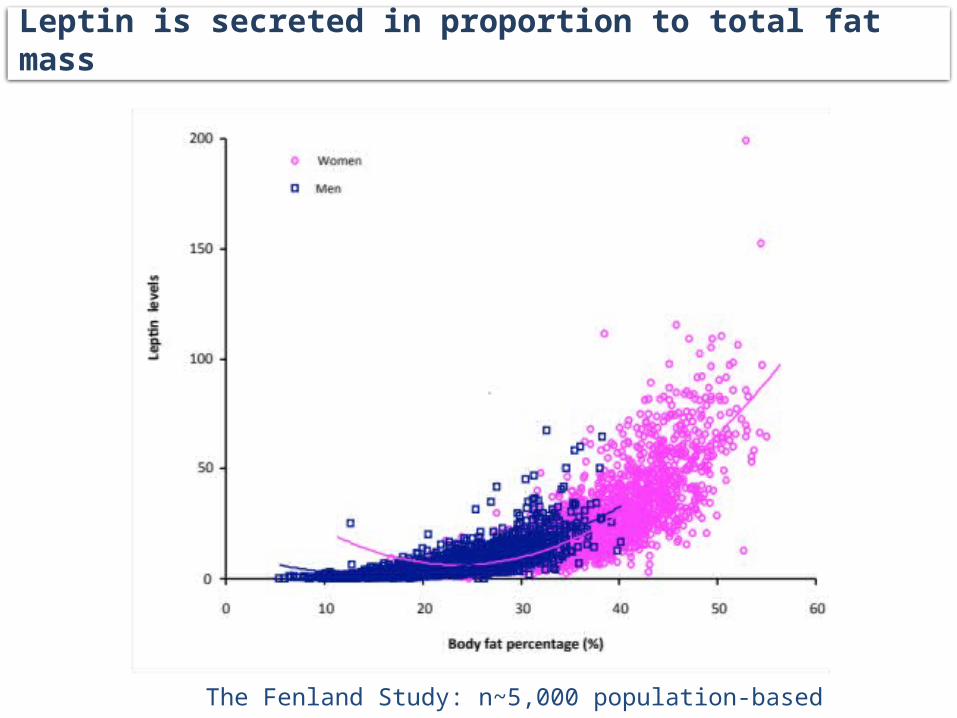
Leptin is secreted in proportion to total fat mass
The Fenland Study: n~5,000 population-based
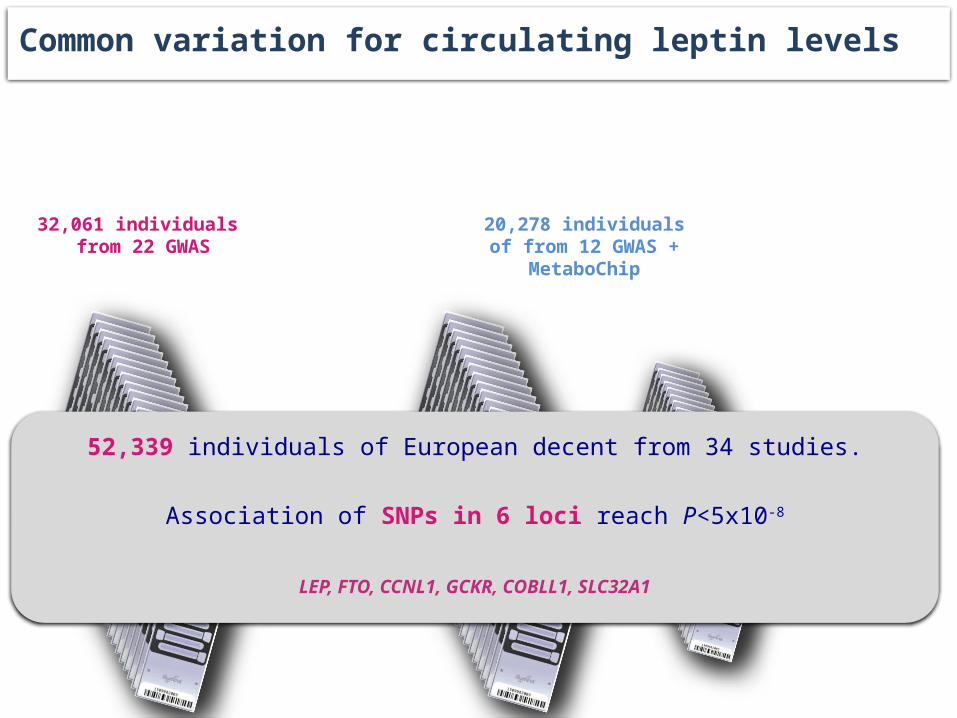
20,278 individuals of from 12 GWAS +
MetaboChip
52,339 individuals of European decent from 34 studies.
Association of SNPs in 6 loci reach P<5x10⁻⁸
LEP, FTO, CCNL1, GCKR, COBLL1, SLC32A1
32,061 individuals from 22 GWAS
Common variation for circulating leptin levels
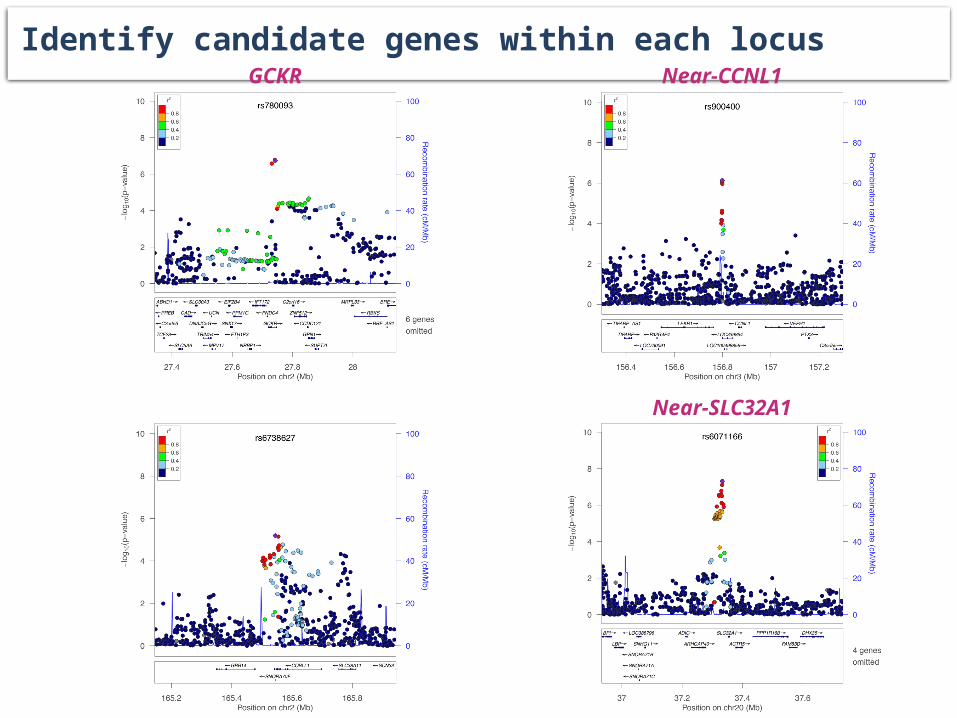
GCKRIdentify candidate genes within each locus
Near-CCNL1
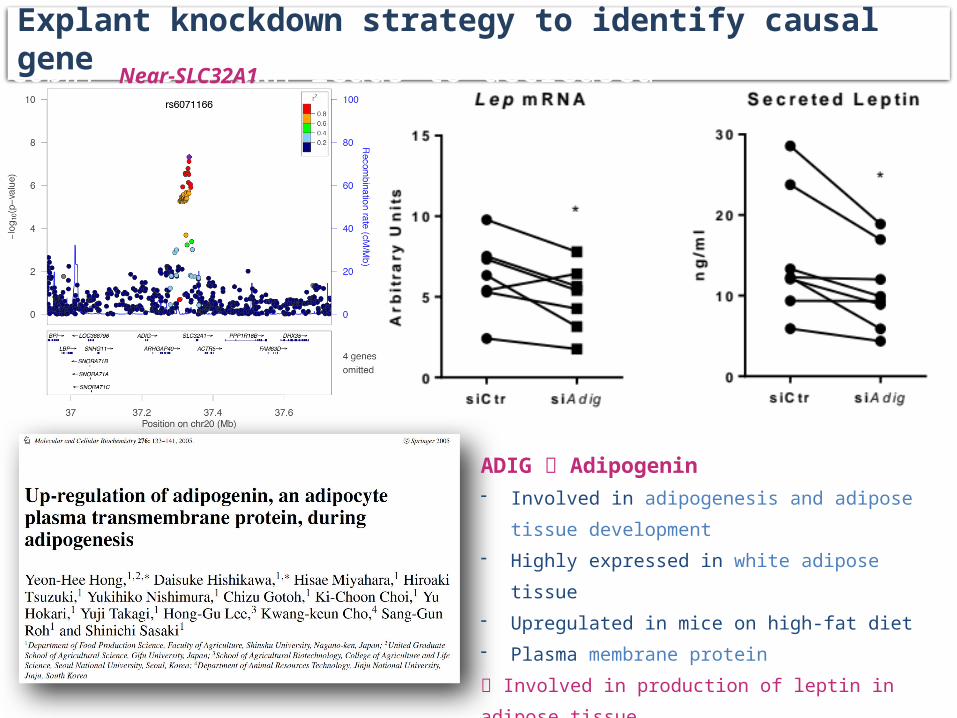
Near-SLC32A1
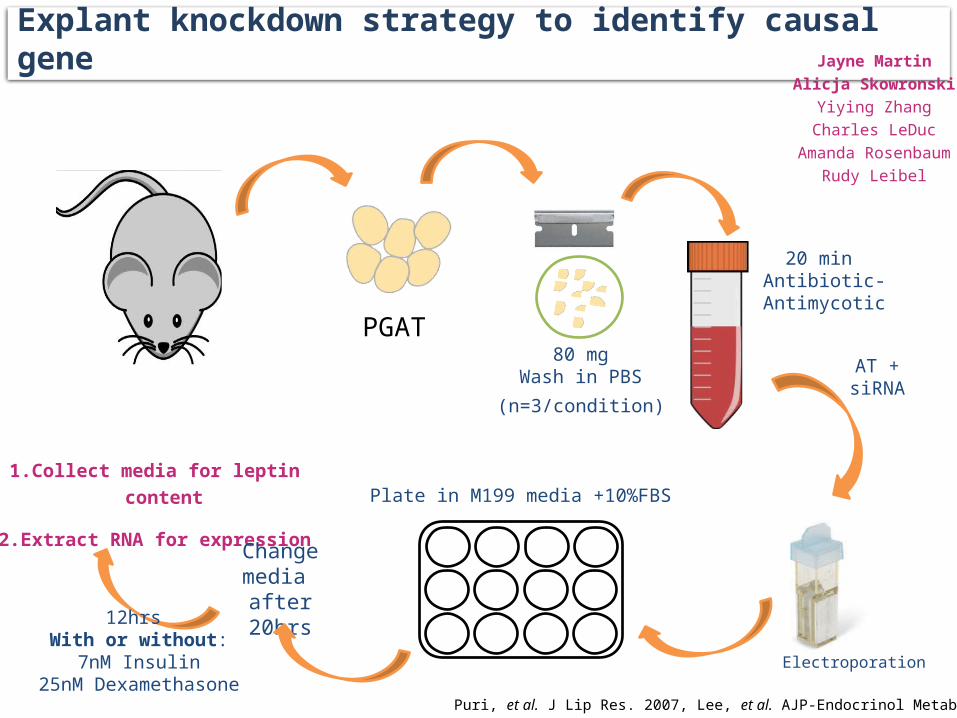
Explant knockdown strategy
80 mgWash in PBS AT +
siRNA
Plate in M199 media +10%FBS1.Collect media for leptin
content
2.Extract RNA for expression
12hrs With or without:
7nM Insulin25nM Dexamethasone
20 min Antibiotic-
AntimycoticPGAT
Change media
after 20hrs
Electroporation
(n=3/condition)
Puri, et al. J Lip Res. 2007, Lee, et al. AJP-Endocrinol Metab. 2007
Explant knockdown strategy to identify causal gene Jayne Martin
Alicja SkowronskiYiying Zhang
Charles LeDucAmanda Rosenbaum
Rudy Leibel
Cobll1 knockdown leads to decreased insulin/dexamethasone-stimulated Lep secretion
Near-SLC32A1
Explant knockdown strategy to identify causal gene
ADIG Adipogenin- Involved in adipogenesis and adipose tissue
development- Highly expressed in white adipose tissue- Upregulated in mice on high-fat diet- Plasma membrane protein Involved in production of leptin in adipose tissue
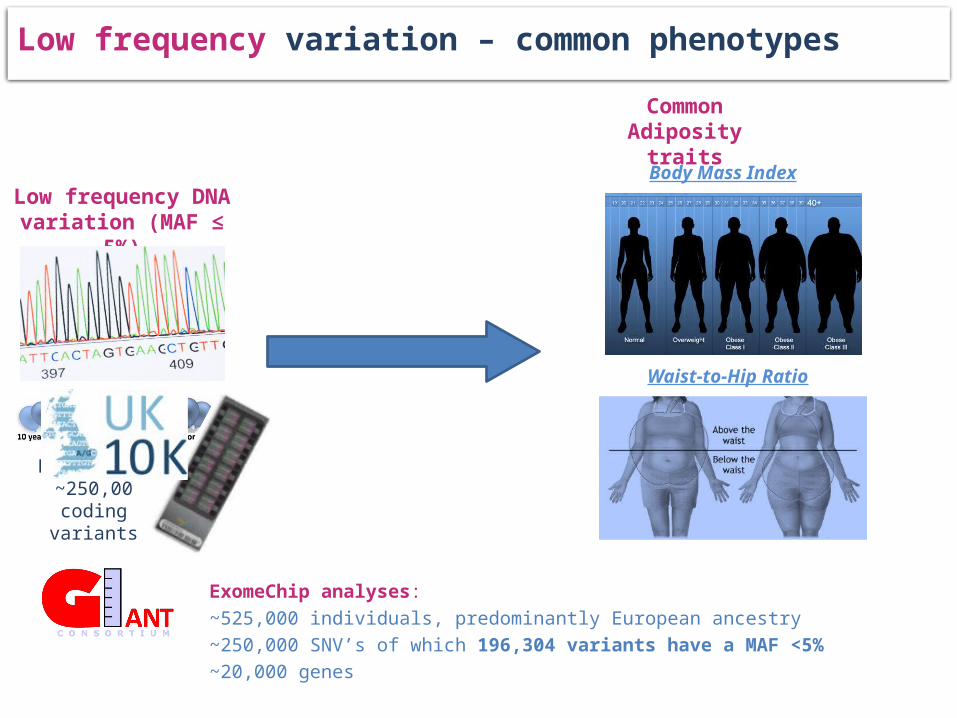
Waist-to-Hip Ratio
Low frequency variation – common phenotypesCommon Adiposity
traitsBody Mass Index
Low frequency DNA variation (MAF ≤ 5%)
ExomeChip ~250,00
coding variants
ExomeChip analyses: ~525,000 individuals, predominantly European ancestry~250,000 SNV’s of which 196,304 variants have a MAF <5%~20,000 genes
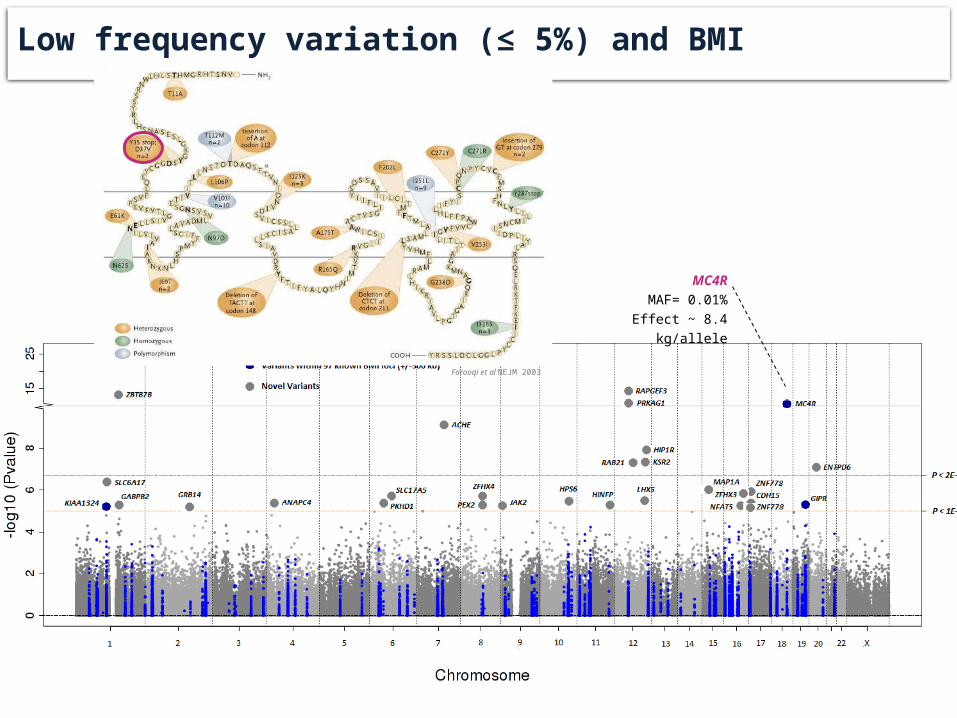
Low frequency variation (≤ 5%) and BMI
MC4RMAF= 0.01%
Effect ~ 8.4 kg/allele
Farooqi et al NEJM 2003

Low frequency variation (≤ 5%) and BMI
GPR61MAF= 3%Effect ~ 850g/allele
- Highly expressed in the brain- KO mice gain weight faster and eat more
RAPGEF3 (EPAC1)MAF= 1 %Effect ~ 1 kg/allele
- KO mice develop diet-induced obesity, hyperglycemia, b-cell dysfunction, and other metabolic defects.
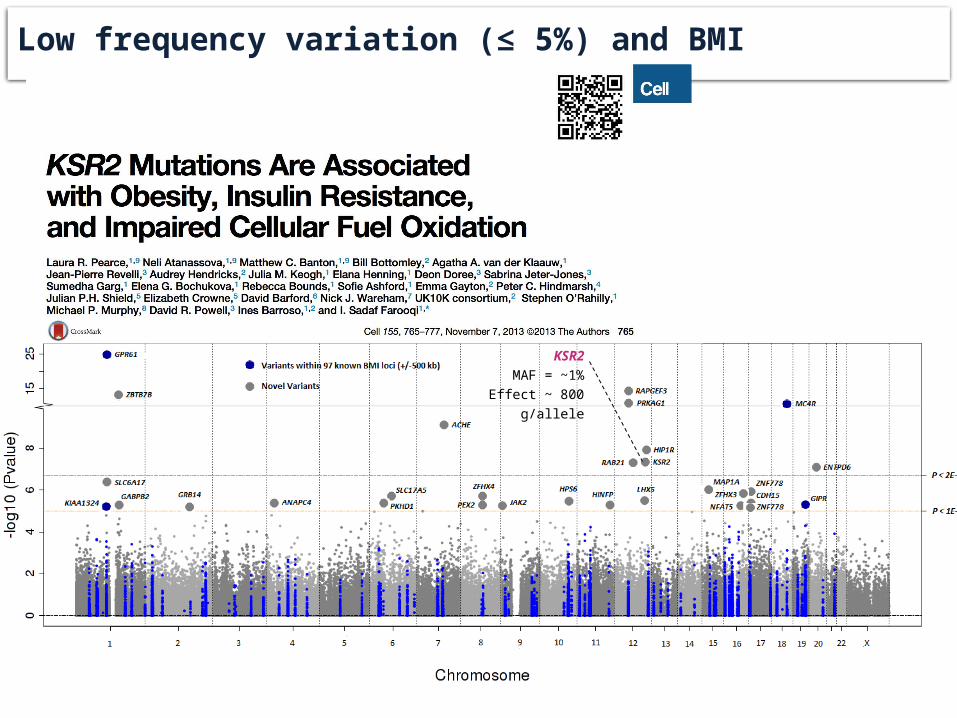
Low frequency variation (≤ 5%) and BMI
KSR2MAF = ~1%
Effect ~ 800 g/allele
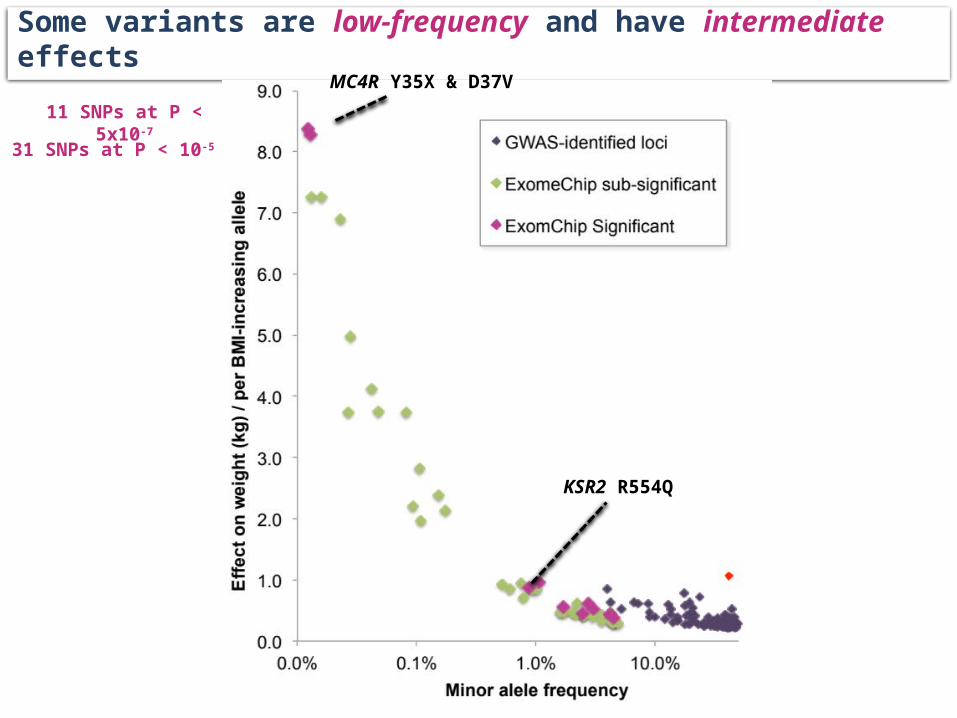
Some variants are low-frequency and have intermediate effects
11 SNPs at P < 5x10⁻⁷
31 SNPs at P < 10-5
MC4R Y35X & D37V
KSR2 R554Q

• GWAS has been successful in identifying >170 genetic variants associated
with adiposity traits. However, identifying the causal genes proves to be
challenging, because
• The vast majority of variants locate in intergenic and intronic regions.
• The majority of adiposity phenotypes studies represent heterogeneous
outcomes.
Conclusions & near future directions
Follow-up analyses aim at identifying regulatory regions that target the “causal” gene, requires accurate annotation of the whole genome at a tissue-specific level.
Maybe first focussing on the exome only provides an easier way “in”.
These heterogeneous phenotypes are the result of a diverse range of biological causes
Phenotypes that are more refined and closer to the “biology” of the outcome might help point towards the causal gene
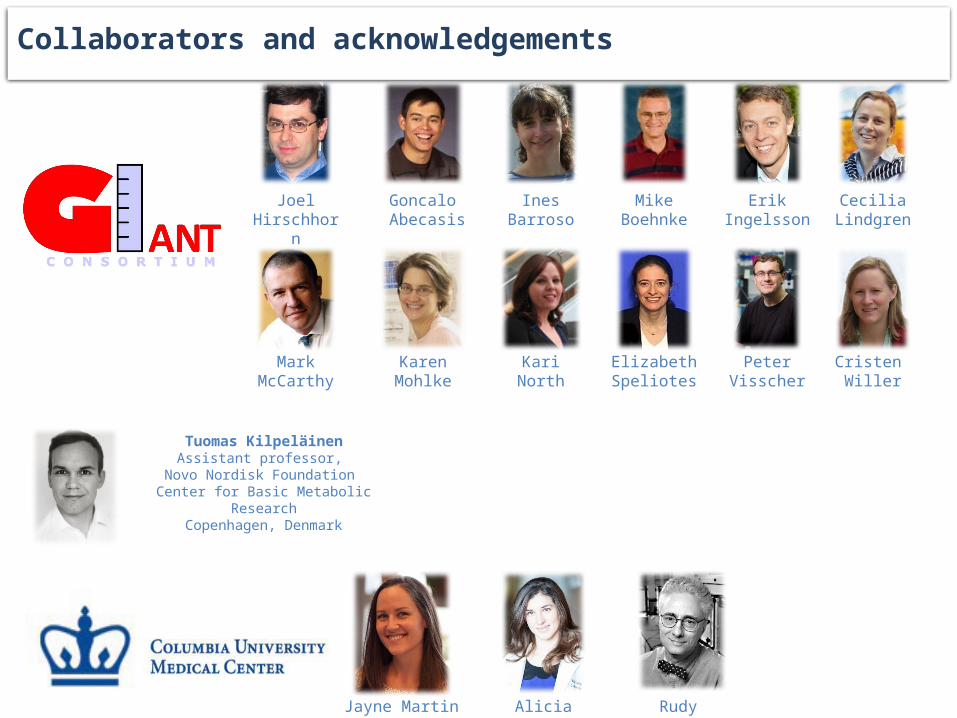
Collaborators and acknowledgements
Erik Ingelsson
Kari North
Cecilia Lindgren
JoelHirschhorn
Karen Mohlke
Mike Boehnke
Ines Barroso
Cristen Willer
Peter Visscher
Goncalo Abecasis
Elizabeth Speliotes
Mark McCarthy
Tuomas KilpeläinenAssistant professor,
Novo Nordisk Foundation Center for Basic Metabolic Research
Copenhagen, Denmark
Rudy LeibelAlicia Skowronski
Jayne Martin