pre-outbreak determinants of perceived risks of corona ... › content › medrxiv › early ›...
TRANSCRIPT

1
Pre-outbreak determinants of perceived risks of corona infection and
preventive measures taken. A prospective population-based study
Perceived risks and preventive measures corona outbreak
Peter G. van der Velden12, Miquelle Marchand1, Boukje Cuelenaere1, Marcel Das1,3
1 CentERdata, Tilburg, The Netherlands
2 Tilburg University’s Network on Health and Behavior (Nethlab), Tilburg, The
Netherlands
3 Tilburg School of Economics and Management, Tilburg University, the Netherlands.
* Corresponding author
E-mail: [email protected] or [email protected]
2
ABSTRACT
Objectives. Assess how people perceive the risks of coronavirus infection, whether
people take preventive measures, and which (pre-outbreak) factors contribute to the
perceived risks and measures taken, such as (pre-outbreak) respiratory problems, heart
problems, diabetes, anxiety and depression symptoms, loneliness, age, gender, marital
status and education level.
Methods. Data were collected in the longitudinal LISS panel, based on a random
sample of the Dutch population. The coronavirus survey started on March 2, and the
data collection ended on March 17 2020. Data were linked with surveys on health and
social integration conducted at the end of 2019 (Nstudy sample=3,540).
Results. About 15% perceived the risk of infection as high, and 11% the risk
becoming ill when infected. Multivariate logistic regression analyses showed the
following. Older age-groups perceived the risk for coronavirus infection as lower (all
adjusted Odd Ratio’s [aOR] ≤ .058). In total, 43.8% had taken preventive measures,
especially females (aOR=1.47, 95% CI=1.27-1.69). Those with lower education levels
less often used preventive measures (aOR=0.56, 95% CI=0.46-0.69). Those with pre-
outbreak respiratory problems (aOR=2.89, 95% CI=2.24-3.73), heart problems
(aOR=2.17, 95% CI=1.49-3.16) and diabetes (aOR=3.10, 95% CI=2.02-4.74)
perceived the risk becoming ill when infected as higher than others. However,
respondents with pre-outbreak respiratory problems and diabetes did not more often
take preventive measures.
Conclusions. Vulnerable patients more often recognize that they are at risk becoming
ill when infected by the coronavirus, but many do not take preventive measures.
Interventions to stimulate the use of preventive measures should pay additional
attention to physically vulnerable patients, men and those with lower education levels.

3
Keywords
Corona virus; COVID-19; SARS-CoV-2); Risk perception, Preventive measures;
Respiratory problems; Heart problems; Diabetes; Anxiety and depression symptoms;
Loneliness
4
Introduction
On December 31 2019, the WHO China Country Office was informed of cases of
pneumonia with a then unknown etiology. The Chinese authorities identified the
etiology: a new type of corona virus (COVID-19 or SARS-CoV-2) which was isolated
on January 7 [1]. In the first two months after the first report, 79,968 persons in China
were infected by the virus (confirmed cases [2]. The number of confirmed cases
across the globe on March 1 2020 was raised to 87,137. With respect to the spectrum
of the disease, Wu and McGoogan [3] reported that, based on the 44,415 confirmed
cases in China, 81% was mild, 14% severe and 5% critical. The overall case-fatality
rate (CFR) in China was 2.3% (among 44,472 confirmed cases). Meanwhile, the
corona virus outbreak also severely affects the production facilities, transport, the
global economy and financial markets.
To prevent and reduce infection by the new coronavirus (COVID-19 or SARS-
CoV-2) health organizations such as the WHO, governmental health agencies and
journals offer information about possible preventive measures [1-5]. To target and
implement interventions to stimulate preventive behaviour against infection, more
insight is needed in how people perceive the risks of being infected by this new
coronavirus, if they use of preventive measures, and especially which (pre-outbreak)
factors determine the perceived risks and measures taken [6]. However, to the best of
our knowledge to date peer-reviewed population-based studies assessing the perceived
risks of corona infection, measures and their determinants are absent. Aim of the
present population-based study conducted is to shed light on this gap of scientific
knowledge.
5
With respect to perceived risks, we made a distinction between risk for
infection and risk of becoming ill when infected [9]. With respect to potential
determinants, we first focused on pre-outbreak respiratory, heart problems and
diabetes because they increase the risk for severe health problems when infected [8].
We furthermore assessed pre-outbreak anxiety and depression symptoms, and
loneliness because they may impact the perceived threat of infection and perceived
likelihood to become ill when infected [9-12]. We finally assessed demographics such
as age because older people are more at risk to become ill [6], and sex and education
level. This study is conducted in the Netherlands and during the data collection period
(March 2- March 17, 2020), the number of confirmed cases in the Netherlands
increased rapidly from 10 to 1715 and 43 infected people died until March 17.
Materials and methods
Procedures and participants
The study was conducted using the Dutch Longitudinal Internet studies for the Social
Sciences (LISS) panel [13]. The LISS-panel started in 2007 and is based on a large
traditional probability sample drawn from the Dutch population. The Netherlands
Organization for Scientific Research funded the set-up of LISS. Panel members
receive an incentive of €15 per hour for their participation and those who do not have
a computer and/or Internet access are provided with the necessary equipment at home.
Further information about all conducted surveys and regulations for free
access to the data can be found at www.lissdata.nl (in English). The LISS panel has
received the international Data Seal of Approval (see
https://www.datasealofapproval.org/en/). Data on corona-related questions
6
will be added to the open access data archive soon.
The data collection with respect to the coronavirus started on March 2 2020
(T2). Because of the rapid developments of the corona outbreak, we choose to use the
data collected until March 17 2020 11.00 AM (Ninvited=6,735, response=70.1%). A
reminder was send on the 10th day.
Data on physical and mental health problems and loneliness of the respondents
before the corona outbreak were extracted from two surveys conducted at the end of
2019. These are Social Integration and Leisure survey (T1a; conducted in October-
November 2019, Ninvited=5,929, response=84.2%) and the Health survey (T1b;
conducted in November-December 2019, Ninvited=5,954, response=86.4%). The data
of the three surveys were linked and in total 3,540 adult respondents participated in all
three surveys.
We furthermore assessed 16 exclusive demographic profiles among the total
adult Dutch population 2019 (N2019=13,926,066), based on data of Statistics
Netherlands. The 16 profiles were constructed using the following demographic
characteristics: sex (2 categories), age categories (4 categories) and marital status (2
categories) totalling 2*4*2=16 exclusive demographic profiles. In case a profile in our
study sample differed from the general population, a weighting factor was computed
and applied. All results are based on the weighted sample.
Ethical approval and informed consent
According to the Dutch Medical Research Involving Human Subjects Act (WMO) the
present study did not require ethical approval. In accordance with the General Data
Protection Regulation, participants gave explicit consent for the use of the collected
data for scientific and policy relevant research.

7
Measures
Perceived risk Corona infection
The Corona survey (T2) started with the following brief introduction “The next
question are about the new corona virus. There is currently an outbreak of this virus in
China. Now, also people in the Netherland and in other countries have become ill”.
We administered two questions, developed for this study, to gain insight in
how adults perceived the risks of the coronavirus. Respondents were asked: What do
you think is the chance that you … in the next two months?: 1.) become infected with
this coronavirus, and 2.) get severely ill, if you become infected with this coronavirus.
Both questions had a 7-points answer scales (see Table 2).
Preventive measures against Corona
After completing these questions, respondents were asked “In the past two months did
you do things to prevent infection by this coronavirus as much as possible? (1= yes,
2=no)”. In case respondents answered “yes”, they were asked to indicate what they
exactly did. The answer categories were (partly) based on WHO recommendations
((1=the purchase of mouth masks, 2=wash hand more often and longer, 3= not going
to certain (busy) places, 4= cancelled a journey, 5=otherwise, namely, (open answer
category)). When respondents answered “no”, they were asked why not (1=because I
do not know what I should do, 2=but maybe I will do this still, 3=because I have not
thought about it yet, 4=because I find it nonsense, 5= because, namely; open answer
category). For both questions respondents could choose for more than one answer.
8
Pre-outbreak physical health problems
The Health survey (T1b) assessed several Physician-diagnosed Diseases (PD) in the
past year (1= yes, 2=no) and Health Problems (HP) respondents regularly suffer from
(1=yes, 0=no). For the present study we focused on reported: 1.) respiratory problems
((PD=chronic lung disease such as chronic bronchitis or emphysema or asthma) or
(HP=short of breath, problems with breathing, or coughing, a stuffy nose or flu-
related complaints)); 2.) heart problems ((PD=angina, pain in the chest a heart attack
including infarction or coronary thrombosis or another heart problem including heart
failure) or (HP =heart complaints or angina, pain in the chest due to exertion); and 3.)
diabetes (PD=diabetes or a too high blood sugar level).
Pre-outbreak loneliness
Loneliness at T1a was assessed using the six-item De Jong Gierveld Loneliness Scale
(Cronbach’s Alpha=.85)[14]. Respondents are asked to rate items such as ‘I often feel
deserted’ and ‘there are enough people I can count on in case of a misfortune’ on
three-point Likert scales (1 = yes, 2 = more or less, 3 = no). We calculated the total
score after recoding the three negative formulated items and lower scores reflect more
loneliness. For the present study we dichotomized scores into low (≥ 15) and high
loneliness (≤ 14). About 20% of the respondents have scores of 14 or lower (two
lowest percentiles).
Pre-outbreak anxiety and depression symptoms
Anxiety and depressive symptoms in the past months were examined at T1b using the
5-item Mental Health Index or Inventory (MHI-5) [15, 16]. The MHI-5 ask
respondents to rate the presence of symptoms during the past month on 6-point Likert
9
scales (1 = never to 6 = continuously). A cut-off of ≤ 59 was used to identify
respondents with moderate to high anxiety and depression-symptom levels
(Cronbach’s Alpha=.86) [17].
Elapsed time
We monitored when respondents completed the corona questions.
Data analyses
Chi-square tests and multivariable logistic regression analyses were conducted with
pre-outbreak medical health problems, symptoms, loneliness, demographics and time
elapsed as predictors, and perceived risks and measures taken as dependent variables.
The elapsed time was recoded into 1=0-4 days, 2=5-9 days, and 3=10-15 days. Due to
low cell counts in the extremes of perceived risks (see Table 1), we recoded the
perceived risks into the following three categories. To optimize readability, hereafter
we label these three categories of perceived risks as low (no to small chance), medium
(between small and big chance) and high (big chance to absolute certain). After this
recoding we assessed to what extent the predictors were associated with the perceived
medium and high risk.
A similar strategy was used to assess which factors were associated with
whether respondents took preventive measures
People may perceive the risks as high and therefore take measures, but the
opposite may also be true. People may perceive the risk as lower because they take
measures. Since the perceived risks and preventive measures taken were assessed at
10
the same time, we therefore did not add the perceived risk to the list of predictors in
the multivariable logistic regression analyses predicting preventive measures taken.
All analyses were conducted with IBM SPSS version 26.
Results
Characteristics respondents
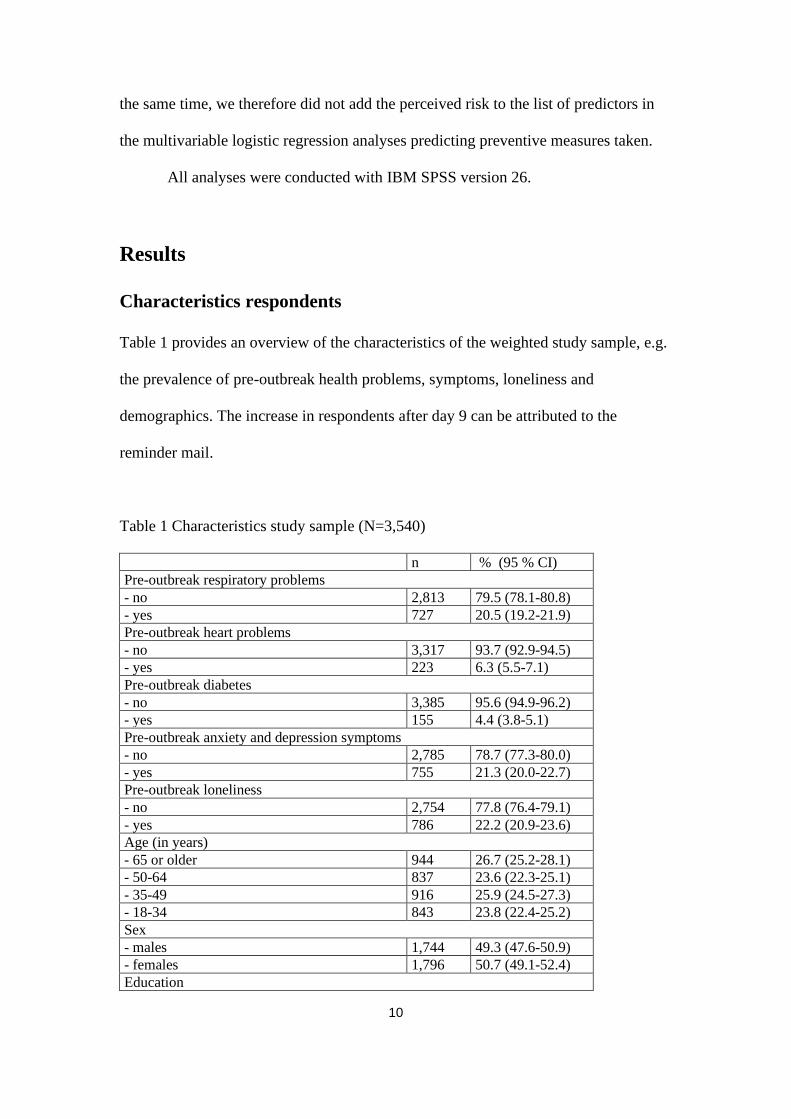
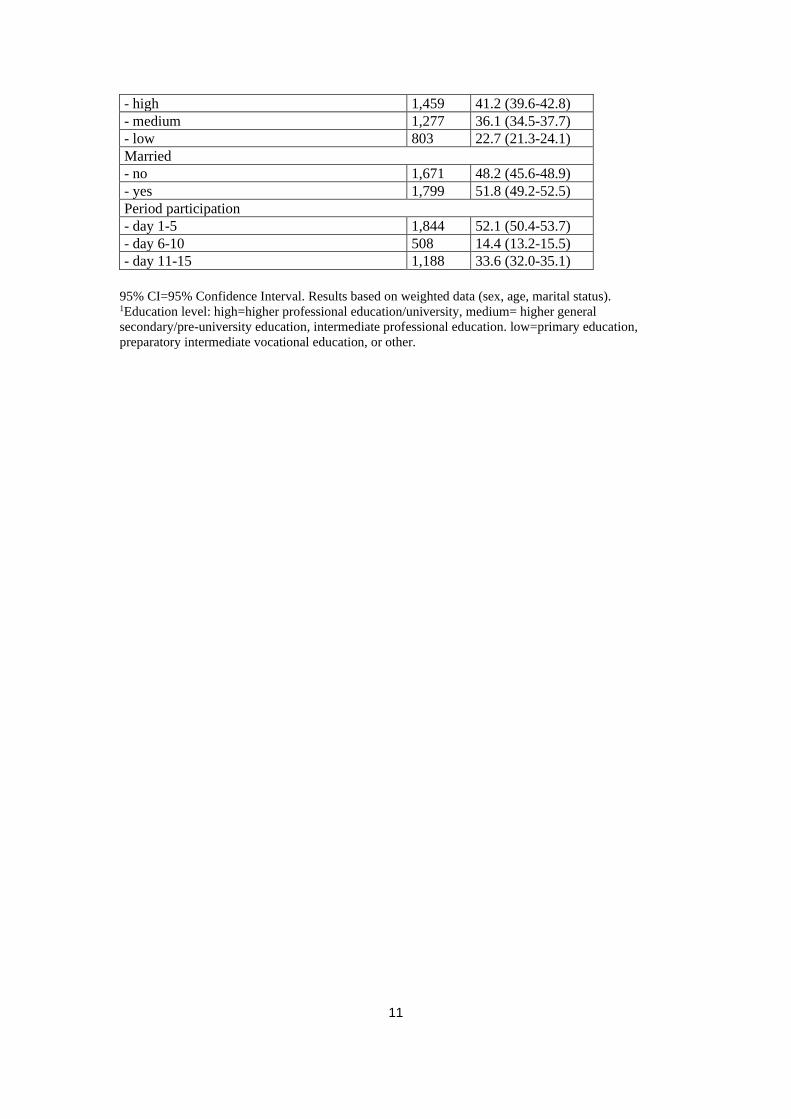
Table 1 provides an overview of the characteristics of the weighted study sample, e.g.
the prevalence of pre-outbreak health problems, symptoms, loneliness and
demographics. The increase in respondents after day 9 can be attributed to the
reminder mail.
Table 1 Characteristics study sample (N=3,540)
n % (95 % CI)
Pre-outbreak respiratory problems
- no 2,813 79.5 (78.1-80.8)
- yes 727 20.5 (19.2-21.9)
Pre-outbreak heart problems
- no 3,317 93.7 (92.9-94.5)
- yes 223 6.3 (5.5-7.1)
Pre-outbreak diabetes
- no 3,385 95.6 (94.9-96.2)
- yes 155 4.4 (3.8-5.1)
Pre-outbreak anxiety and depression symptoms
- no 2,785 78.7 (77.3-80.0)
- yes 755 21.3 (20.0-22.7)
Pre-outbreak loneliness
- no 2,754 77.8 (76.4-79.1)
- yes 786 22.2 (20.9-23.6)
Age (in years)
- 65 or older 944 26.7 (25.2-28.1)
- 50-64 837 23.6 (22.3-25.1)
- 35-49 916 25.9 (24.5-27.3)
- 18-34 843 23.8 (22.4-25.2)
Sex
- males 1,744 49.3 (47.6-50.9)
- females 1,796 50.7 (49.1-52.4)
Education
11
- high 1,459 41.2 (39.6-42.8)
- medium 1,277 36.1 (34.5-37.7)
- low 803 22.7 (21.3-24.1)
Married
- no 1,671 48.2 (45.6-48.9)
- yes 1,799 51.8 (49.2-52.5)
Period participation
- day 1-5 1,844 52.1 (50.4-53.7)
- day 6-10 508 14.4 (13.2-15.5)
- day 11-15 1,188 33.6 (32.0-35.1)
95% CI=95% Confidence Interval. Results based on weighted data (sex, age, marital status). 1Education level: high=higher professional education/university, medium= higher general
secondary/pre-university education, intermediate professional education. low=primary education,
preparatory intermediate vocational education, or other.

12
Perceived risk of infection and illness
In Table 2 shows that a minority (15.0%) perceived the risk of being infected as high.
A somewhat lower proportion perceived the risk for becoming ill when infected as
high (10.6%). On the other hand, very few respondents perceived the risk of infection
and becoming ill as zero (4.4% and 5.5% respectively).
Table 2 Perceived risks and preventive measures regarding coronavirus (N=3,540)
n % (95 % CI)
Perceived risk infected by corona next 2 months
- no chance 156 4.4 (3.8-5.1)
- very small chance 768 21.7 (20.4-23.1)
- small chance 1,064 30.1 (28.6-31.6)
- between small and large chance 1,018 28.8 (27.3-30.3)
- large chance 393 11.1 (10.1-12.2)
- very large chance 115 3.2 (2.7-3.9)
- absolutely certain 26 0.7 (0.5-1.1)
Perceived risk will become ill when infected by corona in next 2 months
- no chance 195 5.5 (4.8-6.3)
- very small chance 996 28.1 (26.7-29.6)
- small chance 1,222 34.5 (33.0-36.1)
- between small and large chance 756 21.3 (20.0-22.7)
- large chance 271 7.7 (6.8-8.6)
- very large chance 73 2.1 (1.6-2.6)
- absolutely certain 28 0.8 (0.5-1.1)
Taken measures to prevent corona infection
- no 1,988 56.2 (54.5-57.8)
- yes 1,552 43.8 (42.2-45.5)
95% CI = 95% Confidence Interval. Results based on weighted data (sex, age, marital status).
13
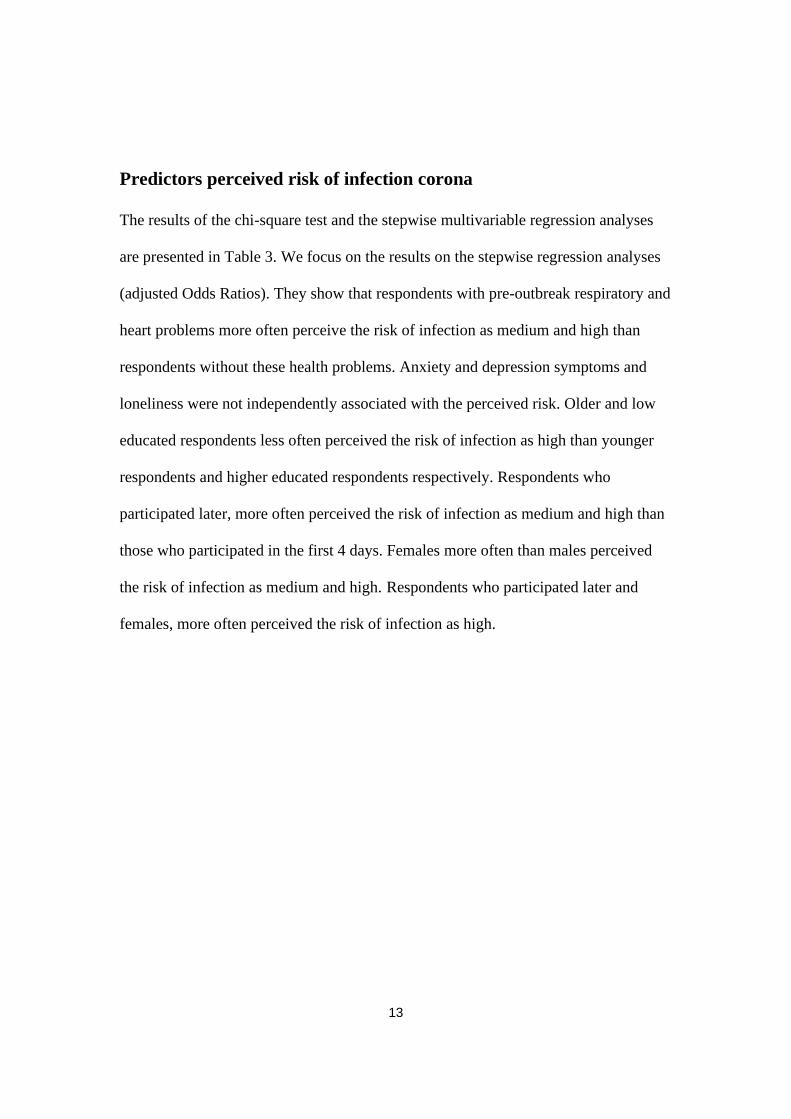
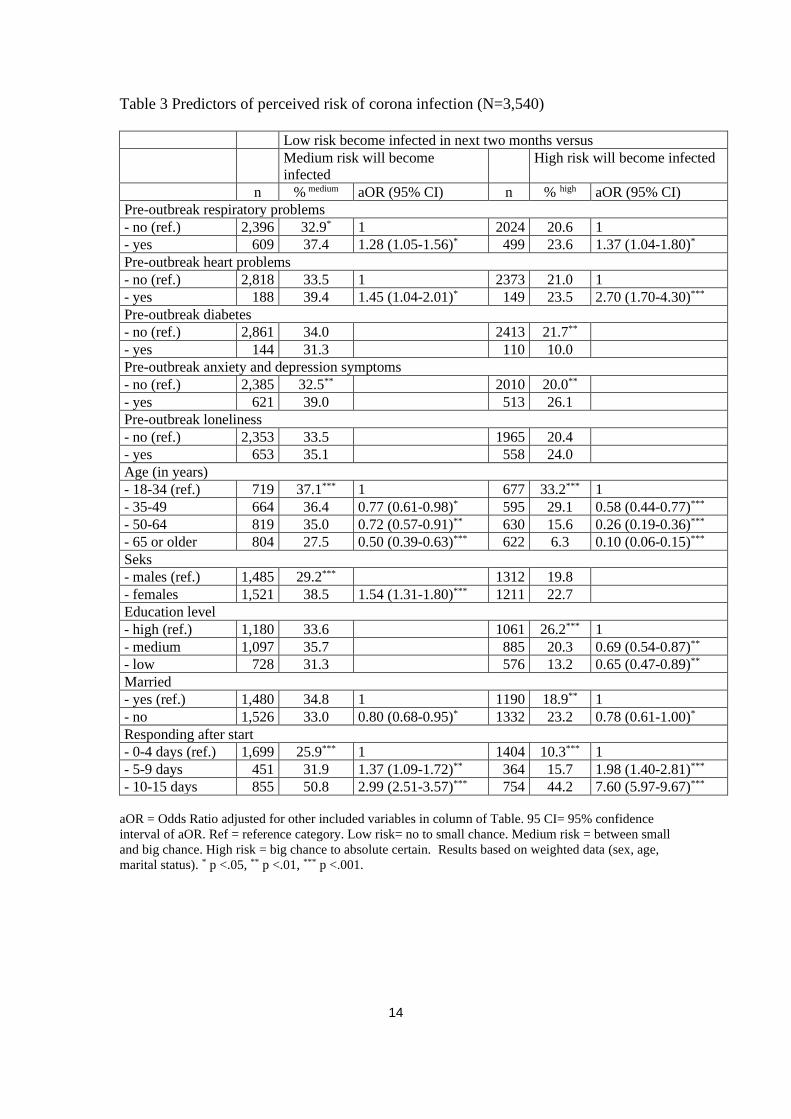
Predictors perceived risk of infection corona
The results of the chi-square test and the stepwise multivariable regression analyses
are presented in Table 3. We focus on the results on the stepwise regression analyses
(adjusted Odds Ratios). They show that respondents with pre-outbreak respiratory and
heart problems more often perceive the risk of infection as medium and high than
respondents without these health problems. Anxiety and depression symptoms and
loneliness were not independently associated with the perceived risk. Older and low
educated respondents less often perceived the risk of infection as high than younger
respondents and higher educated respondents respectively. Respondents who
participated later, more often perceived the risk of infection as medium and high than
those who participated in the first 4 days. Females more often than males perceived
the risk of infection as medium and high. Respondents who participated later and
females, more often perceived the risk of infection as high.
14
Table 3 Predictors of perceived risk of corona infection (N=3,540)
Low risk become infected in next two months versus
Medium risk will become
infected
High risk will become infected
n % medium aOR (95% CI) n % high aOR (95% CI)
Pre-outbreak respiratory problems
- no (ref.) 2,396 32.9* 1 2024 20.6 1
- yes 609 37.4 1.28 (1.05-1.56)* 499 23.6 1.37 (1.04-1.80)*
Pre-outbreak heart problems
- no (ref.) 2,818 33.5 1 2373 21.0 1
- yes 188 39.4 1.45 (1.04-2.01)* 149 23.5 2.70 (1.70-4.30)***
Pre-outbreak diabetes
- no (ref.) 2,861 34.0 2413 21.7**
- yes 144 31.3 110 10.0
Pre-outbreak anxiety and depression symptoms
- no (ref.) 2,385 32.5** 2010 20.0**
- yes 621 39.0 513 26.1
Pre-outbreak loneliness
- no (ref.) 2,353 33.5 1965 20.4
- yes 653 35.1 558 24.0
Age (in years)
- 18-34 (ref.) 719 37.1*** 1 677 33.2*** 1
- 35-49 664 36.4 0.77 (0.61-0.98)* 595 29.1 0.58 (0.44-0.77)***
- 50-64 819 35.0 0.72 (0.57-0.91)** 630 15.6 0.26 (0.19-0.36)***
- 65 or older 804 27.5 0.50 (0.39-0.63)*** 622 6.3 0.10 (0.06-0.15)***
Seks
- males (ref.) 1,485 29.2*** 1312 19.8
- females 1,521 38.5 1.54 (1.31-1.80)*** 1211 22.7
Education level
- high (ref.) 1,180 33.6 1061 26.2*** 1
- medium 1,097 35.7 885 20.3 0.69 (0.54-0.87)**
- low 728 31.3 576 13.2 0.65 (0.47-0.89)**
Married
- yes (ref.) 1,480 34.8 1 1190 18.9** 1
- no 1,526 33.0 0.80 (0.68-0.95)* 1332 23.2 0.78 (0.61-1.00)*
Responding after start
- 0-4 days (ref.) 1,699 25.9*** 1 1404 10.3*** 1
- 5-9 days 451 31.9 1.37 (1.09-1.72)** 364 15.7 1.98 (1.40-2.81)***
- 10-15 days 855 50.8 2.99 (2.51-3.57)*** 754 44.2 7.60 (5.97-9.67)***
aOR = Odds Ratio adjusted for other included variables in column of Table. 95 CI= 95% confidence
interval of aOR. Ref = reference category. Low risk= no to small chance. Medium risk = between small
and big chance. High risk = big chance to absolute certain. Results based on weighted data (sex, age,
marital status). * p <.05, ** p <.01, *** p <.001.
15
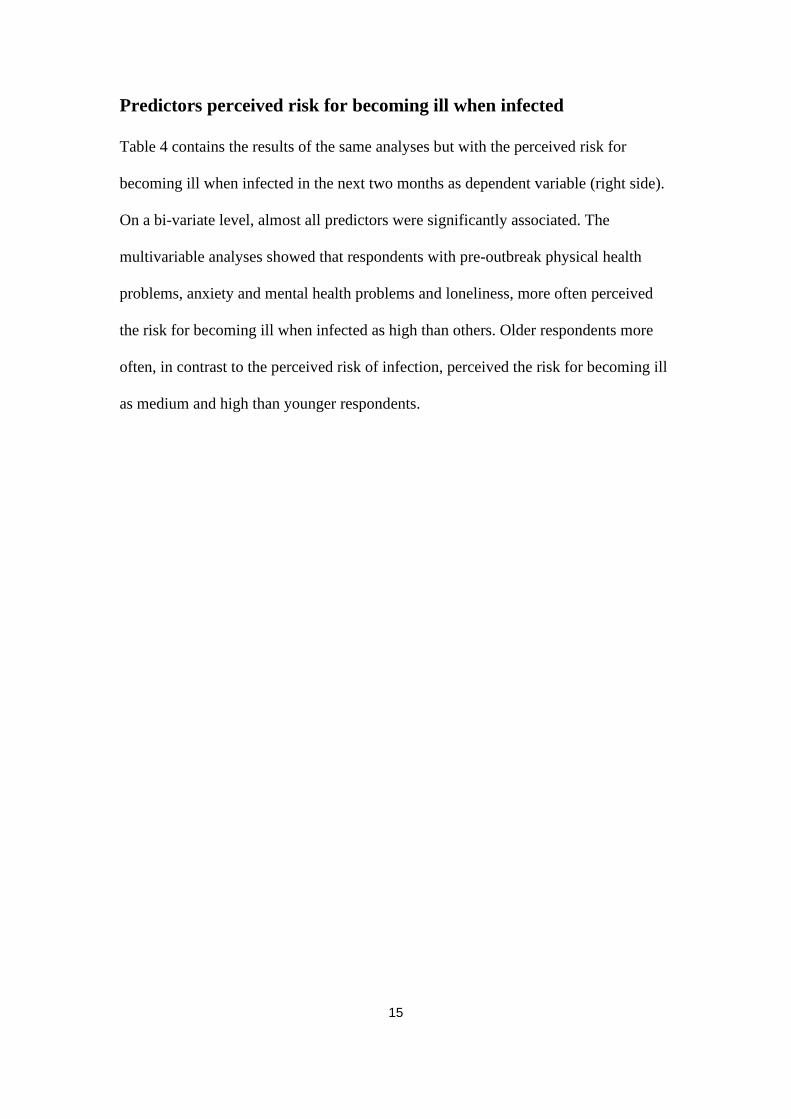
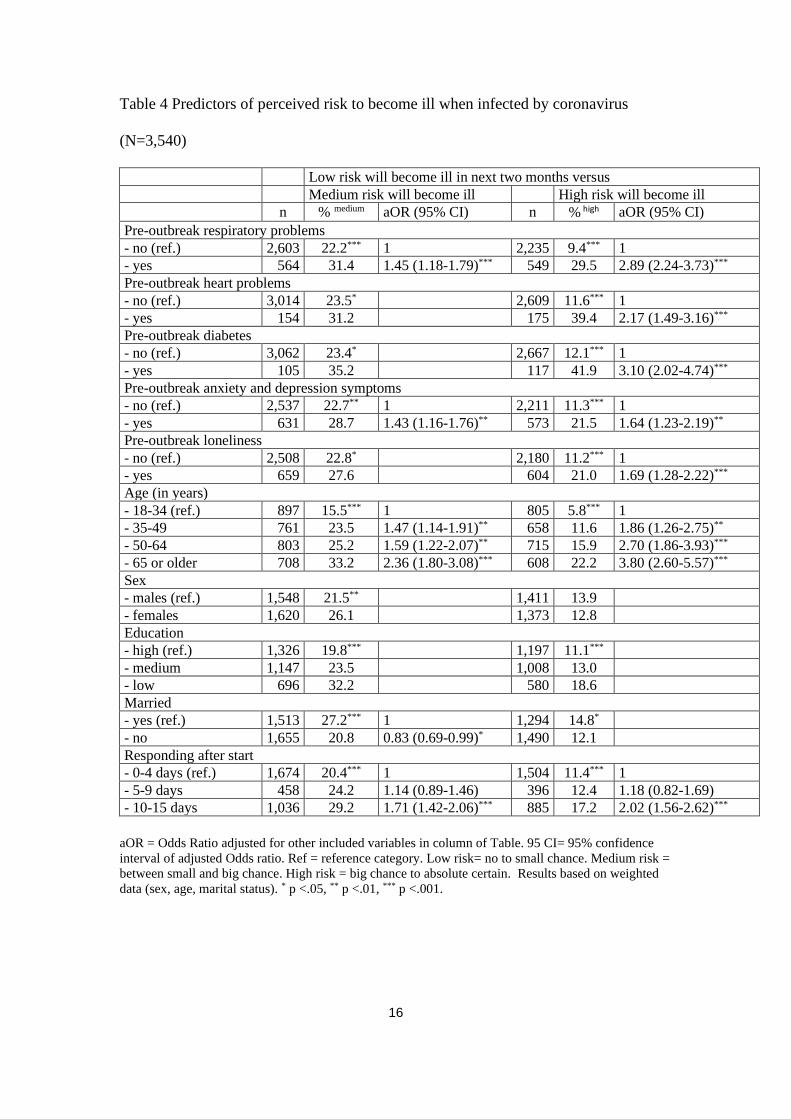
Predictors perceived risk for becoming ill when infected
Table 4 contains the results of the same analyses but with the perceived risk for
becoming ill when infected in the next two months as dependent variable (right side).
On a bi-variate level, almost all predictors were significantly associated. The
multivariable analyses showed that respondents with pre-outbreak physical health
problems, anxiety and mental health problems and loneliness, more often perceived
the risk for becoming ill when infected as high than others. Older respondents more
often, in contrast to the perceived risk of infection, perceived the risk for becoming ill
as medium and high than younger respondents.
16
Table 4 Predictors of perceived risk to become ill when infected by coronavirus
(N=3,540)
Low risk will become ill in next two months versus
Medium risk will become ill High risk will become ill
n % medium aOR (95% CI) n % high aOR (95% CI)
Pre-outbreak respiratory problems
- no (ref.) 2,603 22.2*** 1 2,235 9.4*** 1
- yes 564 31.4 1.45 (1.18-1.79)*** 549 29.5 2.89 (2.24-3.73)***
Pre-outbreak heart problems
- no (ref.) 3,014 23.5* 2,609 11.6*** 1
- yes 154 31.2 175 39.4 2.17 (1.49-3.16)***
Pre-outbreak diabetes
- no (ref.) 3,062 23.4* 2,667 12.1*** 1
- yes 105 35.2 117 41.9 3.10 (2.02-4.74)***
Pre-outbreak anxiety and depression symptoms
- no (ref.) 2,537 22.7** 1 2,211 11.3*** 1
- yes 631 28.7 1.43 (1.16-1.76)** 573 21.5 1.64 (1.23-2.19)**
Pre-outbreak loneliness
- no (ref.) 2,508 22.8* 2,180 11.2*** 1
- yes 659 27.6 604 21.0 1.69 (1.28-2.22)***
Age (in years)
- 18-34 (ref.) 897 15.5*** 1 805 5.8*** 1
- 35-49 761 23.5 1.47 (1.14-1.91)** 658 11.6 1.86 (1.26-2.75)**
- 50-64 803 25.2 1.59 (1.22-2.07)** 715 15.9 2.70 (1.86-3.93)***
- 65 or older 708 33.2 2.36 (1.80-3.08)*** 608 22.2 3.80 (2.60-5.57)***
Sex
- males (ref.) 1,548 21.5** 1,411 13.9
- females 1,620 26.1 1,373 12.8
Education
- high (ref.) 1,326 19.8*** 1,197 11.1***
- medium 1,147 23.5 1,008 13.0
- low 696 32.2 580 18.6
Married
- yes (ref.) 1,513 27.2*** 1 1,294 14.8*
- no 1,655 20.8 0.83 (0.69-0.99)* 1,490 12.1
Responding after start
- 0-4 days (ref.) 1,674 20.4*** 1 1,504 11.4*** 1
- 5-9 days 458 24.2 1.14 (0.89-1.46) 396 12.4 1.18 (0.82-1.69)
- 10-15 days 1,036 29.2 1.71 (1.42-2.06)*** 885 17.2 2.02 (1.56-2.62)***
aOR = Odds Ratio adjusted for other included variables in column of Table. 95 CI= 95% confidence
interval of adjusted Odds ratio. Ref = reference category. Low risk= no to small chance. Medium risk =
between small and big chance. High risk = big chance to absolute certain. Results based on weighted
data (sex, age, marital status). * p <.05, ** p <.01, *** p <.001.

17
Preventive measures taken and predictors
Of the total study sample, 43.8% took preventive measures (see Table 2) such as
washing hands more often and longer (92.2%), not going to work of avoid certain
(busy) places (53.6%), purchase of mouth masks (5.9%) and cancelled a journey
(8.2%). Of the respondents who did not take preventive measures, 42.5% reported that
they find it nonsense or useless, 24.9% that maybe will do this still, 20.4% have not
thought about it yet, and 15.4% that they do not know what they should do.
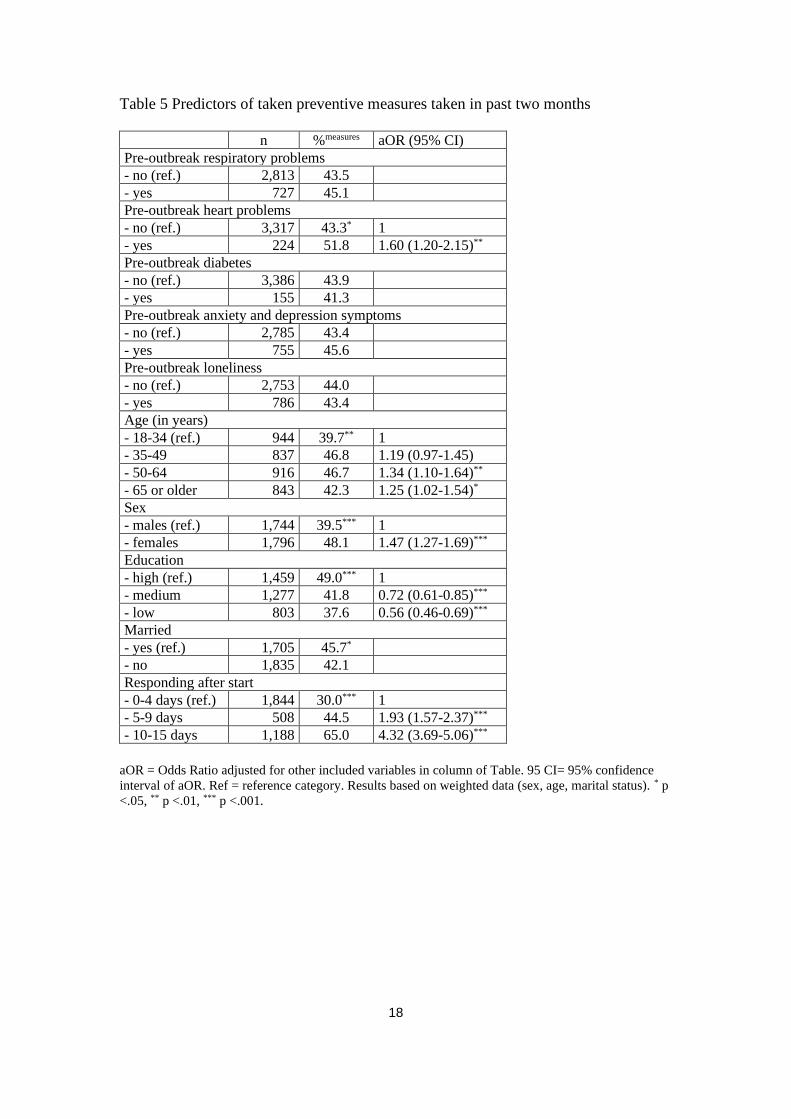
Table 5 shows which factors predicted the use of preventive measures against
infection by the coronavirus. With respect to pre-outbreak physical health problems:
only respondents with heart problems took preventive measures more often. Females
more often took preventive measures, and medium and high educated respondents
more often than low educated respondents. Finally, respondents who filled in the
survey more recently, more often took preventive measures.
We repeated the regression analyses among those who participated 10-15 days
after the start of the corona survey, showing almost similar results. Having heart
problems was no longer significantly associated with preventive measures.
18
Table 5 Predictors of taken preventive measures taken in past two months
n %measures aOR (95% CI)
Pre-outbreak respiratory problems
- no (ref.) 2,813 43.5
- yes 727 45.1
Pre-outbreak heart problems
- no (ref.) 3,317 43.3* 1
- yes 224 51.8 1.60 (1.20-2.15)**
Pre-outbreak diabetes
- no (ref.) 3,386 43.9
- yes 155 41.3
Pre-outbreak anxiety and depression symptoms
- no (ref.) 2,785 43.4
- yes 755 45.6
Pre-outbreak loneliness
- no (ref.) 2,753 44.0
- yes 786 43.4
Age (in years)
- 18-34 (ref.) 944 39.7** 1
- 35-49 837 46.8 1.19 (0.97-1.45)
- 50-64 916 46.7 1.34 (1.10-1.64)**
- 65 or older 843 42.3 1.25 (1.02-1.54)*
Sex
- males (ref.) 1,744 39.5*** 1
- females 1,796 48.1 1.47 (1.27-1.69)***
Education
- high (ref.) 1,459 49.0*** 1
- medium 1,277 41.8 0.72 (0.61-0.85)***
- low 803 37.6 0.56 (0.46-0.69)***
Married
- yes (ref.) 1,705 45.7*
- no 1,835 42.1
Responding after start
- 0-4 days (ref.) 1,844 30.0*** 1
- 5-9 days 508 44.5 1.93 (1.57-2.37)***
- 10-15 days 1,188 65.0 4.32 (3.69-5.06)***
aOR = Odds Ratio adjusted for other included variables in column of Table. 95 CI= 95% confidence
interval of aOR. Ref = reference category. Results based on weighted data (sex, age, marital status). * p
<.05, ** p <.01, *** p <.001.
19
Discussion
Main results of this prospective population based-study are that during the 2-week
study period (March 2 to March 17 2020) the number of respondents who perceived
the risk of being infected by the coronavirus as high, increased sharply (10% to 44%).
Multivariable logistic regression analyses showed that respondents with pre-outbreak
respiratory and heart problems, diabetes, anxiety and depression symptoms and
loneliness, and older respondents more often perceived the risk becoming ill when
infected as high. In line with the increased perceived risk to be infected, the number of
respondents who took preventive measures increase too. However, respondents with
pre-outbreak respiratory and heart problems did not more often take preventive
measures than others. In addition, analyses of respondents who participated 10-15
after the the start of the study showed that respondents with respiratory and heart
problems and diabetes did not differ in the proportion of people who took preventive
measures.
Our findings are somewhat similar to the results of a study reported by the
WHO Regional Office for Europe [6]. This serial cross-sectional study conducted in
Germany in almost the same period as our study (week 10 and 11 2020) showed that
the prevalence of respondents who perceived the risk to be infected by the coronavirus
as high, increased from 16.8% to 21.4%. They furthermore reported, like us, that older
respondents (60+) felt less likely be infected. Importantly, in our study the effects of
other factors that are associated with the perceived risk of corona infection were
controlled for such as pre-outbreak respiratory and heart problems, and education
level. Asmundson and Taylor [18] reported that, according to polls, in the US 56%

20
was very concerned about the spread of the virus and in that Canada 7% was very
concerned about becoming infected.
To date many studies on our research topic are initiated and conducted.
However, when finalizing this study we were not aware of any peer-reviewed
population-based studies on perceived risks, the use of preventive measures and their
pre-outbreak determinants, to compare our findings with.
Strengths and limitations
Strength of the present study are the use of a large traditional probability based
sample drawn from the Dutch population, the prospective study-design, data on pre-
outbreak physician-diagnosed diseases, and use of well validated instruments on
anxiety and depression symptoms, and loneliness.
We deliberately choose to use the data that was collected in the first two
weeks of the survey (response was 70.1%), to be able to share our results rapidly
given the threatening global developments. However, although we distinguished three
subsequent periods during these two weeks suggesting an increase in preventive
measures taken, we do not know from this study if and when all respondents have
taken preventive measures. In addition, we do not know from this study to what extent
respondents who have taken preventive measures, will continue to comply with
protection guidelines from governmental health agencies. Another limitation is that
we not were able to include children. It is unknown to what extent children’s
perceptions of the risks and the measures they taken resembles those of adults and
especially parents and other family members. We did not systematically examine
whether respondents were in quarantine, e.g. were separated and restricted in
movement because they had been potentially infected by the coronavirus and their
21
effects on perceived risks [19]. The present study does not provide information on this
topic, nor how quarantine affects post-quarantine preventive behaviour.
Nevertheless, we believe that our results are also of relevance for future
outbreaks.
Future research
Future research on the perceived risks and preventive measures should, among many
other important questions, focus on to what extent people continue to take the
proposed or required preventive measures. Which physical, psychological, financial,
and societal factors do influence compliance to (possible new) preventive measures on
the medium and long term? Which interventions to stimulate constant preventive
behaviour are most effective? These questions are highly relevant because to date
there are no indications that this pandemic will end soon. Furthermore, taken
preventive measures should be assessed more in detail, and self-reports on measures
taken should be complemented with peer-reports. In addition, future studies should
pay special attention towards children and how they perceive the risks for coronavirus
infection and if and how they protect themselves.
Conclusions
The results of this study, based on a random sample of the general adult population,
are partly reassuring and positive, and partly negative. Positive is the finding that the
number of respondents who have taken preventive measures during the brief 2-weeks
study period increased, while taking other significant predictors of the use of
preventive measures into account. It is very likely that the daily stream of information
22
about the pandemic and advice on this matter provided by Dutch governmental health
agencies, physicians and media, contributed to this finding. A negative finding is that
respondents with respiratory problems and diabetes, who are considered groups at
severe risk for complicated health problems when infected, did not take preventive
measures more often than others. In addition, we found no indications that people
took preventive measures irrespective of their education level and sex. The last
findings suggest that specific education level and sex-related interventions should be
developed and offered to increase preventive behavior among men and those with a
lower education level.

References
1. WHO (2020). Novel Coronavirus (2019-nCoV) SITUATION REPORT-1, 21
JANUARY 2020. https://www.who.int/emergencies/diseases/novel-coronavirus-
2019/situation-reports/ (accessed March 17, 2020).
2. WHO (2020). Novel Coronavirus (2019-nCoV) SITUATION REPORT-41, 3
MARCH 2020. https://www.who.int/emergencies/diseases/novel-coronavirus-
2019/situation-reports/ (accessed March 17, 2020).
3. Wu Z, McGoogan J. Characteristics of and Important Lessons From the Coronavirus
Disease 2019 (COVID-19) Outbreak in China: Summary of a Report of 72 314 Cases
From the Chinese Center for Disease Control and Prevention. JAMA. 2020. doi:
10.1001/jama.2020.2648.
4. World Health Organisation (WHO). Coronavirus outbreak (COVID-19).
https://www.who.int/emergencies/diseases/novel-coronavirus-2019 (accessed Mar 16,
2020).
5. Dalton CB, Corbett SJ, Katelaris AL. Pre-emptive low cost social distancing and
enhanced hygiene implemented before local COVID-19 transmission could decrease
the number and severity of cases. Med J Aust 2020. (Preprint, accessed Mar 18 2020).
6. WHO Regional Office for Europe. Guidance and protocol. Rapid, simple, flexible,
cost effective behavioural insights on COVID-19. Copenhagen, 2020 (accessed Mar
18).
7. Brewer NT, Chapman GB, Gibbons FX, Gerrard M, McCaul KD, Weinstein, ND.
Meta-analysis of the relationship between risk perception and health behavior: the
example of vaccination. Health Psychol. 2007; 26; 136-145.
8. CDC (2020). If You Are at Higher Risk. https://www.cdc.gov/coronavirus/2019-
ncov/specific-groups/high-risk-complications.html (accessed March 19, 2020).
9. Lee KS, Feltner FJ, Bailey AL, Lennie TA, Chung ML, Smalls BL, Schuman DL,
Moser DK. The relationship between psychological states and health perception in
individuals at risk for cardiovascular disease. Psychol Res Behav Manag. 2019;
12:317-324.
10. Santini ZI, Jose PE, York Cornwell E, Koyanagi A, Nielsen L, Hinrichsen C,
Meilstrup C, Madsen KR, Koushede V. Social disconnectedness, perceived isolation,
and symptoms of depression and anxiety among older Americans (NSHAP): a
longitudinal mediation analysis. Lancet Public Health. 2020, e62-e70.
11. Takebayashi Y, Lyamzina Y, Suzuki Y, Murakami M. Risk Perception and Anxiety
Regarding Radiation after the 2011 Fukushima Nuclear Power Plant Accident: A
Systematic Qualitative Review. Int J Environ Res Public Health. 2017;14. pii: E1306.
12. Wang C, Pan R, Wan X, Tan Y, Xu L, Ho CS, Ho RC. Immediate Psychological
Responses and Associated Factors during the Initial Stage of the 2019 Coronavirus
Disease (COVID-19) Epidemic among the General Population in China. Int J Environ
Res Public Health. 2020; 17(5). pii: E1729.
13. Scherpenzeel A, Das M. True longitudinal and probability based internet panels:
evidence from The Netherlands. In: Das M, Ester P, Kaczmirek L, editors. Social and
behavioral research and the internet: advances in applied methods and research
strategies. Taylor & Francis, New York, 2011, 77–104.
14. de Jong Gierveld J, van Tilburg TG. A 6-item scale for overall, emotional, and social
loneliness confirmatory tests on survey data. Res Aging. 2006; 28:582–598.
15. Means-Christensen AJ, Arnau RC, Tonidandel AM, Bramson R, Meagher MW. An
efficient method of identifying major depression and panic disorder in primary care. J
Behav Med. 2005; 28:565–572.
16. Ware JE, Sherbourne CD. The MOS 36-item short-form health survey, SF-36:
conceptual framework and item selection. Med Care. 1992 30:473–483.
17. Driessen M. Een beschrijving van de MHI-5 in de gezondheidsmodule van het
Permanent Onderzoek Leefsituatie [A Description of the MHI-5 in the Health Module
of Permanent Research of Living Conditions, POLS]. Den Haag, Statistics
Netherlands, 2011.
18. Asmundson GJG, Taylor S. Coronaphobia: Fear and the 2019-nCoV outbreak. J
Anxiety Disord. 2020; 70:102196.
19. Brooks SK, Webster RK, Smith LE, Woodland L, Wessely S, Greenberg N, Rubin
GJ. The psychological impact of quarantine and how to reduce it: rapid review of the
evidence. Lancet. 2020; 395: 912-920.