microbiologíaarea de microbiología alimentaria juan antonio ordóñez, departamento de higiene y...
TRANSCRIPT
PUBLICACIÓN DE LA SOCIEDAD ESPAÑOLA DE MICROBIOLOGÍA
Microbiología
Volumen 1, N. 1 y 2 Septiembre 1985
MICROBIOLOGÍA Publicación de la Sociedad Española de Microbiología
CONSEJO EDITORIAL
Editor-Coordinador
Rubens López, Instituto de Inmunología y Biología Microbiana, Velazquez, 144, 28006 Madrid.
Area de Bioquímica y Fisiología Microbianas
Germán Larriba, Departamento de Microbiología, Facultad de Biología, Universidad de Extremadura, Badajoz.
Area de Ecología Microbiana
Ricardo Guerrero, Departamento de Microbiología e Instituto de Biología Fundamental, Universidad Autónoma de Barcelona, Bellaterra, Barcelona.
Area de Genética Microbiana
Ernesto García, Instituto de Inmunología y Biología Microbiana, Velazquez, 144, 28006 Madrid.
Area de Microbiología Alimentaria
Juan Antonio Ordóñez, Departamento de Higiene y Microbiología de los Alimentos, Facultad de Veterinaria, Universidad Complutense, 28040 Madrid.
Area de Microbiología Clínica
Miguel Gobernado, Servicio de Microbiología, Hospital La Fe, Valencia.
Area de Microbiología Industrial
María Josefa Elena Fernandez, Instituto de Fermentaciones Industriales, Arganda del Rey, Ctra. de Valencia, km. 24,400, Madrid.
Area de Morfología y Ultraestructura
Manuel Benjamín Manzanal, Departamento Interfacultativo de Microbiología, Facultad de Medicina, Universidad de Oviedo.
Area de Taxonomía Bacteriana
Antonio Ventosa, Departamento de Microbiología, Facultad de Farmacia, Universidad de Sevilla, Sevilla.
Area de Virología
Esteban Domingo, Instituto de Biología Molecular (C.S.I.C./U.A.M.), Canto Blanco, 28049 Madrid.
IMPRIME: COIMPRES, S. A. DEPOSITO LEGAL: M-30455-1985

«MICROBIOLOGÍA» (PUBLICACIÓN DE LA S.E.M.) ACEPTARA LA INCLUSION
DE INSERCIONES PUBLICITARIAS DE ANUNCIANTES, EMPRESAS U ORGANISMOS, CUYO ÁMBITO
DE ACTIVIDAD SEA DE INTERÉS PARA MICROBIÓLOGOS
INTERESADOS DIRIGIRSE A: SOCIEDAD ESPAÑOLA DE MICROBIOLOGÍA c/ Vitrubio, 8 28006 Madrid SPAIN
SOCIEDAD ESPAÑOLA DE
MICROBIOLOGÍA Fundada en 1946
Miembro de: FEDERATION OF EUROPEAN MICROBIOLOGY SOCIETIES (FEMS) INTERNATIONAL UNION OF MICROBIOLOGICAL SOCIETIES (lUMS)
Representada en numerosos Comités Internacionales relacionados con la especialidad
Agrupa a los interesados en cualquier faceta científica o profesional, relacionada con los microorganismos.
Grupos Especializados Grupos Regionales
Virología Noroeste de España Micología Aragón, Rioja, Navarra Microbiología Clínica y Soria Microbiología Industrial Microbiología de Alimentos Publicaciones Taxonomía Bacteriana n i ' T r •
Boletín Informativo Revista MICROBIOLOGÍA
Actividades:
— Congresos generales de carácter bianual. — Reuniones y Congresos de temáticas específicas o ámbito geográfico más restringido. — Colaboración con la Administración española en asesofamientos, consultas,
comisiones de expertos, tribunales, etc.
Inscripciones, dirigirse a:
Sociedad Española de Microbiología c/ Vitrubio, 8 28006 Madrid SPAIN

C O N T E N T S
Editorial _Page_ C Nombela 3
Preliminary characterization of two glucan synthetase preparations and their reaction products from Candida albicans. Andaluz, E., Guillen, A, Cáceres, P. and Larriba, G. (*) 5
Role of cellular homogenization on the preparation of Candida utilis plasma membranes. Pérez Cabo, A., Novaes-Ledieu, M. and Garcia Mendoza, C (*) 19
Isolation of methanogenic bacteria able to grow in high salt concentration. Pérez-Fillol, M. (*), Rodriguez- Valera, F. and Ferry, J.G. 29
Phenotypic correction of Streptococcus pneumoniae treated with an amidase induced by bacteriophage Dp-1. Garcia, P. {*), Garcia, E., Ronda, C and López, K 35
Hyperproductionof I^proline in 5c/zenc/z/a CO/z. Garcia, J.L. (*), González de Buitrago, G. and Barbero, J.L 43
A survey of buoyant density of microorganisms in pure cultures and natural samples. Guerrero, R. (*), Cedros-Alió, C, Schmidt, T.M. and Mas, J 53
Carbohydrate stability during ageing m Pénicillium expansum cell wall. Gómez-Miranda, B. (*) and Leal, J. A 67
Expression of the SOS genes of Escherichia coli in Salmonella typhimurium. Barbé, J. f*). Vericat, J. A., Llagostera, M. and Guerrero, R 77
Isolation and characterization of moderately hallophilic nonmotile rods from different saline habitats. Quesada, E. (*), Béjar, V., Valderrama, M.J:; Veñtos^7A:r SLUU Ramos Cormenzana, A , 89
Campylobacter in gastric pathology. López-Brea, M. {*\-Jiménez, M.L., Blanco^ M. and Pajares, J. M. 97
(*) Corresponding author.
I N D I C E Página
Presentación C. Nombela 3
Caracterización preliminar de dos preparaciones de glucan-sintetasas y de sus productos de reacción obtenidos de Candida utilis. Andaluz, E, Guillen, A, Cáceres, P y Larriba, G (*).. 5
Importancia de la homogeneización celular en la obtención posterior de las membranas plasmáticas de la levadura Candida utilis. Pérez Cabo, A, Novaes-Ledieu, M. y Garda Mendoza, C. (V 19
Aislamiento de bacterias metanogénicas capaces de multiplicarse a altas concentraciones salinas. Pérez-Fillol, M. (*), Rodríguez-Valera, F. y Ferry, J.G. 29
Curación fenotípica de Streptococcus pneumoniae tratado con amidasa inducida por el bacteriófago Dp-1. Garda, P. (*), Garda, E., Ronda, C. y López, R ^5
Hiperproducción de L-prolina en Escherichia coli. Garda, J.L. (*) González de Buitrago, G. y Barbero, J.L 43
Estudio de la densidad de flotación de microorganismos en cultivos puros y en ambientes naturales. Guerrero, R. ('*), Pedros-Alió, C, Schmidt, T.M. y Mas, J. 53
Estabilidad de los carbohidratos durante el envejecimiento de la pared celular de Pénicillium expansum. Gómez-Miranda, B. (*) y Leal, J.A 67
Expresión de los genes SOS de Escherichia coli en Salmonella typhimurium. Barbé, J. (*), Vericat, JA., Llagostera, M. y Guerrero, R ' ^
Aislamiento y caracterización de bacilos inmóviles halófilos moderados, a partir de diversos habitats salinos. Quesada, E. (*) Béjar, V, Valderrama, M.J., Ventosa, A. y Ramos Cormenzana, A 89
Campylobacter en patología gástrica. López-Brea, M. (*), Jiménez, M. L, Blanco, M. y Pajares, J.M. 97
(*) A quien debe dirigirse la correspondencia.
Presentación
Con este número ve la luz la revista MICROBIOLOGÍA, primera publicación periódica que la Sociedad Española de Microbiología (SEM) edita con sus propios medios y bajo su exclusiva responsabilidad. Confiamos en que, con periodicidad asegurada, esta revista lleve al lector trabajos y contenidos del mayor interés. En este primer número, que sale ya gracias al esfuerzo y dedicación de un grupo de competentes microbiólogos españoles, creemos que está justificado incluir unas breves líneas de presentación.
Después de unas cuatro décadas de existencia, la SEM constituye una realidad vigorosa tanto por el número de socios que agrupa como por la cantidad y calidad de sus actividades, que abarcan todas las facetas de la Microbiología. Amplias y variadas han sido las experiencias acumuladas por nuestra Sociedad, durante años de colaboración con el Instituto Jaime Ferrán de Microbiología. Amplia y variada ha sido, asimismo, la gama de opiniones y posturas de nuestros socios, sobre la conveniencia y características de una publicación o posible publicación de la SEM.
En el momento actual, y dejando aparte las lógicas controversias en este sentido, nos ha parecido que lo mejor para interpretar los deseos y aspiraciones del conjunto de nuestros socios, era realmente ponerse a trabajar e iniciar esta publicación con unas pocas ideas directrices. En primer lugar, está claro que en estos momentos la SEM no puede sino aspirar a publicar una revista cuya gestión y responsabilidad le correspondan en exclusiva. No nos olvidamos tampoco de que una parte muy significativa de los microbiólogos españoles publica sus trabajos en revistas internacionales del máximo y bien ganado prestigio, y que incluso bastantes de ellos colaboran en el trabajo editorial y de evaluación de calidad que esas revistas llevan a cabo. Eso es positivo y pensamos que se mantendrá y potenciará como es deseable. En cualquier caso aspiramos a que nuestra revista pueda representar un vehículo válido y adecuado para la difusión de una parte de la producción científica, de calidad, relacionada con estudios de microorganismos y de procedencia no exclusivamente española. Creemos que en estos momentos de crecimiento explosivo de la literatura científica, aquellas publicaciones gestionadas por sociedades científicas pueden, en algún sentido, ser las más competitivas desde el punto de vista de la calidad, ya que pueden prescindir de cualquier otra preocupación.
Para lograr estos fines también tenemos muy claro que hay dos requisitos imprescindibles. Primero, la realización de un riguroso control de calidad antes de aceptar los trabajos, basado en la evaluación por expertos, cuyo nombre no se revelará al autor, así como en la agilidad en la toma de decisiones cuya responsabilidad corresponderá a un consejo editorial competente. Para nadie es un secreto que no existe otra vía para garantizar unos mínimos de coherencia y calidad en los contenidos de una publicación de trabajos originales. Segundo, admitir que los trabajos se publiquen en inglés o en español. Aspirando a que nuestra revista tenga la máxima difusión posible en el mundo, es obligado permitir que el autor elija presentarlos de forma que puedan ser entendidos por el número mayor posible de científicos.
En nombre de la SEM pedimos la colaboración de todos con la revista MICROBIOLOGÍA, enviando trabajos, aceptando las críticas y sugerencias de los encargados de su valoración y aportando cuantas propuestas puedan contribuir a su perfeccionamiento. Todos seremos beneficiarios de que nuestra Sociedad publique una revista cada vez mejor.
Es obligado, asimismo, que la SEM exprese su reconocimiento a los compañeros del Consejo Editorial y, en especial a su máximo responsable el Dr. Rubens López, por asimiir estas tareas que conllevan enorme esñierzo así como por el logro que supone el que el número uno sea ya una realidad. El día en que se alcance una periodicidad fija y nivel importante, como esperamos, habrá que recordar de nuevo que eso ftie posible gracias al esfiíerzo de este equipo de trabajo.
Septiembre, 1985 César Nombela Cano Presidente de la SEM

Microbiología 1 (1985), 5-17 SEM
Preliminary characterization of two glucan synthetase preparations and their reaction products from
Candida albicans
Encarna Andaluz, Antonio Guillen, Pilar Cáceres, and Germán Larriba*
Departamento de Microbiología. Facultad de Ciencias. Universidad de Extremadura, 06071 Badajoz - Spain.
Summary
Two glucan synthetase preparations from Candida albicans were obtained by lysis of regenerating protoplasts (enzyme A) or mechanical breakage of yeast cells (enzyme B). Enzyme A was insensitive to EDTA or GTP but it was stimulated by a combination of both agents. Enzyme B was inhibited by EDTA, this inhibition being released by increasing the concentration of the chelating agent or by addition of GTP to the assay mixtures. Enzyme A was further activated by glycerol and sodium fluoride.
The reaction products were characterized as linear jS-l,3-linked glucans on the basis of their resistance to periodate and susceptibility to jS-glucanases. In both cases the «in vitro» synthesized radioactive chains were added to the non-reducing end of cold, preformed glucan or to and acceptor other than glucan. At least, part of the preformerd glucan chains of enzyme A, but no those of enzyme B, showed a free reducing terminal. On the basis of the origin of both enzyme preparations it is suggested that glucan molecules are synthesized while bound to an acceptor of a different nature which is subsequently excised. Key words: Glucan synthetase, cell wall Candida albicans
Resumen
Dos preparaciones particuladas de células de Candida albicans (fase levaduriforme), obtenidas por lisis de protoplastos (enzima A) o rotura mecánica de las células (enzima B), presentaron diferente respuesta a EDTA y GTP. La enzima A no respondió a ninguno de estos agentes por separado pero fiíe activada por una combinación de ambos. La enzima B fue insensible al GTP pero fue inhibida por EDTA. Esta inhibición fue revertida por GTP, el cual restauró los niveles de actividad originales. La enzima A fue además estimulada por glicerol y fluoruro, siendo esta estimulación aditiva a la producida por EDTA más GTP.
Los pohmeros sintetizados se caracterizaron como j3-l,3-glucanos lineales en base a su resistencia al peryodato y susceptibilidad a jS-glucanasas. Ninguno de ambos glucanos
* Corresponding author.
se sintetizó «de novo» sino que se adicionaron a cadenas preformadas o a un aceptor de diferente naturaleza. Parte al menos de las cadenas preformadas presentes en la enzima B, poseían su extremo reductor libre. En base al origen de ambas preparaciones se sugiere que las cadenas de glucano se sintetizan unidas a un aceptor de diferente naturaleza que es posteriormente escindido.
Introduction
The analysis of the structure and biosynthesis of the wall of Candida albicans, a human dimorphic pathogenic fungus, has become a field of growing interest in the last few years. The fungal wall represents the most obvious difference between the pathogen and the host cell and hence, it is an important target for antifungal agents.
As in Saccharómyces cerevisiae mannans and glucans (containing both j3-l,3 and j5-l,6 linkages) constitute at least 80 % of the wall of C albicans, and some form of the second appears to be the structural component responsible for cell shape and the maintenance of cell wall integrity. By analogy with S. cerevisiae, and alkali-insoluble fraction which is enriched in jS-1,3 linkages (4) may well fit into such a role.
«In vitro» syntesis of C. albicans glucan has recently been described by Orlean (12) using a combination of conditions previously reported for the preparation of highly efficient particulate fraction in S. cerevisiae. These conditions included either lysis of protoplasts In EDTA (15) or mechanical breakage of cells in the presence of 1 M sucrose (7). Both Saccharómyces enzymes were further activated, although to a variable extent, by EDTA and GTP (8, 15). However, whereas the former was activated by glycerol and by ATP, which did not modify or were deletereous for the second enzyme (7), the second was strongly activated by NaF, which in turn did not modify the activity of the former (Cabib, personal communication). In both cases the reaction products were characterized as jS-l,3-linked glucans. However, whereas Shematek et al (15) found that hte reducing end came from the substrate and concluded that the polymer was synthesized «de novo». Larriba et al (7) failed to detect a free reducing terminal and suggested that the glucan synthesized by their preparations was bound to an acceptor of a different nature.
In the present work we describe the influence of several exogenous effectors in similar enzyme preparations derived from yeast cells of C albicans. We have also analyzed and compared the reaction products of both enzymes.
Materials and Methods
Organisms and culture conditions Candida albicans strain 3153, serotype A was obtained from the Pasteur Institute
and used throughout this work. Yeast cells were prepared from a liquid culture, inoculated at a density of 25000 cells/ml in 500 ml flasks containing 150 ml of YED (2 % glucose, 1 % yeast extract) and grown at 28°C in a rotatory shaker. Mid-exponential phase cells (OD—2) were harvested and washed by centrifugation.
ciadosporium resinae was grown as described by Walter and Hare (19) to provide optimal yields of a-l,3-glucanase. Sporotrichum dimorphosphorum (Basidiomycete QM 806) was grown as described by Reese and Mandéis (14) for 12 days. By that time the culture medium contained high levels of exo-j8-l,3-D-glucanase.
Purification of enzymes
Purification of a-glucanase was carried out essentially as described by Walker and Hare (19) except that the electrofocusing step was substituted by two cycles of gel filtration through a Sephacryl S-200 column (90 x 2 cm) equilibrated with phosphate buffer (50 mM, pH 6). The purified enzyme did not show any appreciable activity on laminarin or starch. Culture fluids from Basidiomycete QM 806 were dialyzed against acetate buffer (50 mM, pH 5.5) and the exoglucanase partially purified by gel filtration on the same Sephacryl column equilibrated with acetate buffer. This step completely removed a contaminant j5-glucosidase from the exoglucanase. During purification hydrolases were assayed with a-1,3 glucan (obtained from Schizosaccharomycespombe according to Manners and Meyer (10) or laminarin as substrates by measuring the liberation of reducing power. One unit of glucosidase liberates one /xmol of glucose or reducing power, expressed as glucose equivalents, per minute at 37°C.
P^l,3-glucan synthetase preparations
Two methods for the preparation of j3-l,3-glucan synthetase were used. Enzyme A was obtained by a modification of the method described by Shematek et al. (15) for S, cerevisiae. Protoplasts were prepared from yeast cells by using Zymolyase 5000 (6). They were regenerated in osmotically stabilized (1 M sorbitol) YED medium for 30 min and then lysed at 4°C in 4 mM EDTA in 50 mM Tris/HCl buff'er, pH 7.8 (unless otherwise indicated), and homogenized at the same temperature in a glass homogenizer. The whole homogenate was centrifuged at 4°C for 1 h at 50000xg and the pellet resuspended in cold 5 mM EDTA-containing Tris/HCl buffer, homogenized and referred as enzyme A.
Enzyme B was prepared according to the method of Larriba et al. (7). Cells were resuspended in Tris/HCl buffer containing 1 M sucrose, mixed with glass beads (0.45-0.5 mm) and disrupted in a Braun homogenizer (Braun Melsungen, West Germany). Residual whole cells and cell walls were sedimented by centrifugation at 3000xg for 5 min and this supernatant was centrifuged at 50000xg for 1 h. The final pellet was resuspended in the disrupting buffer, homogenized and used as a source of enzyme B.
Polymers synthesized by enzymes A and B will be referred to as glucans A and B respectively.
Glucan synthetase assay and large scale preparation of glucan «in vitro »
For glucan A the standard reaction mixture contained (final volume 125 jixl) 0.4 M UDP-(U-iC) glucose (0.22 Ci/mol), 20 jug/ml «-amylase, 50 mM Tris/HCl (pH 7.8) and enzyme fraction (100-500 fxg protein). For glucan B the reaction mixture was as above except that it also contained 0.8 M sucrose. Reaction mixtures were
incubated at 24°C for 30 min. Then two volumes of 10 % TCA were added and the whole mixture was filtrated through glass-fibre filters (Whatman GF/C). The filters and retained material were washed with 10 ml each 5 % TCA and 66 % ethanol and then dried and radioactivity determined.
For large scale preparation of radioactive polymers, the standard reaction mixtures, supplemented with 5mMEDTA, 100 juM GTP and 8 % glycerol (enzyme A) or 20 mM EDTA and 400 /xM GTP (enzyme B), were scaled up 50 fold. After 1 h of incubation two volumes of absolute ethanol were added and the suspension centrifuged at 12000xg for 20 min at 4°C. The pellet was washed several times with distilled water (until supematants were devoid of radioactivity) and then treated with 1 % SDS for 5 min at 50°C. This treatment solubilized addiotional label. After a new centrifugation followed by two washes with water the pellet was resuspended in distilled water and kept at -20°C.
Modified Smith degradation of the «in vitro» synthesized polymers
Samples of glucan were incubated with 50 jumol of metaperiodate in the dark for 15 h at room temperature. The mixture was centrifuged at 12000xg for 6 min and the pellet washed twice with distilled water and finally resuspended in 1 ml of 0.1 N NaBH4 in 0.1 N NaOH. After 1 h at room temperature, the mixture was acidified with glacial acetic acid and taken to a small volume under reduced pressure. Five ml of ethanol were added and the operation repeated three times and the sample was finally taken to dyness. The residue was resuspended in 0.5 ml of 4 N HCl and placed in a boiling water bath for three hours. After cooling the sample was passed through a 10 ml column of Amberlite MB-3 resin and the column washed with four volumes of distilled water. The eluate was taken to dryness, resuspended in the appropiate amount of distilled water and analyzed by paper chromatography. The recovery of the radioactivity before paper chromatography was 75 %.
Labeling of the reducing terminus
Samples of glucans A and B of known specific activity were reduced in 0.1 N NaBH4 or either water (taken to pH 9 with the help of a drop of amonium hydroxide) or 0.1 N NaOH in glass-stoppered test tubes (final volume 200 /xl). When indicated 3H-NaBH4(5 mCi, s.a. 466 mCi/mmol) was used a reducing agent. After 18 h at room temperature the reaction was stopped by adding 200 /xl of glacial acetic acid and glucan pelleted by centrifugation, washed three times with distilled water and hydrolyzed in 4 N HCl at 100°C for two hours. The cooled hydrolysate was applied to a column of Amberlite MB-3 resin and the column washed as above. The eluate was taken to dryness, resuspended in water and analyzed by paper chromatography in solvent B. Authentic ^'C-sorbitol and ^'C-mannitol were prepared by reduction of the corresponding ^C-aldoses with NaBH,.
General Paper chromatography was performed on Whatman nP 1 paper in solvents A (n-
butanol/pyridine/water, 6:4:3 v/v) orB (methyl-ethyl-ketone/boric acid-saturated water/acetic acid, 10:1:1 v/v). Cold sugars and poly alcohols were detected with silver
nitrate reagent (18). Radioactive spots in chromatograms were located by cutting strips of paper in 1 cm portions and determining the radioactivity associated to each one.
Sugars in solution were determined by the phenol sulphuric method (2) and protein according to Lowry et al (9). Reducing sugars were measured by the method of Somogyi (16).
Gel filtration for analysis of sugars was performed in a Bio-Gel P-2 column (196x1 cm) using water as an eluent at a flow rate of 0.2 mil/min.Fractions of 1 ml were collected.
Radioactivity was determined in a Beckman LS lOOC scintillation spectrometer. Samples containing both ^K2 and ^ were counted in the appropiate channels and values were corrected by use of a standard quench calibration curve.
Results
Effect of exogenous factors on glucan synthetase preparations.
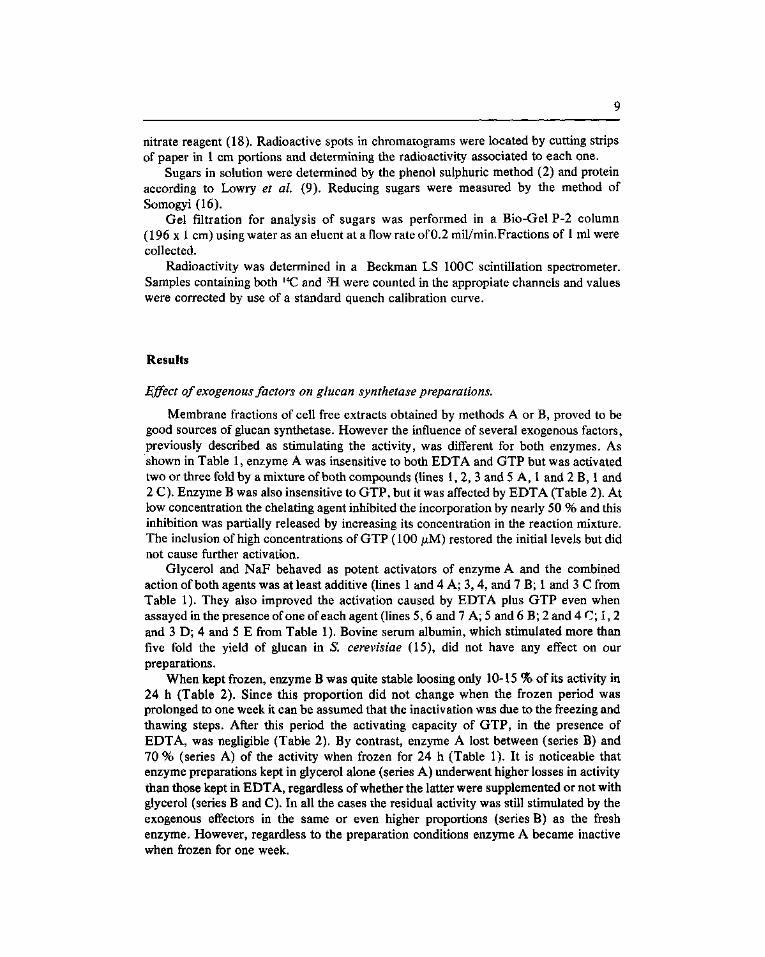
Membrane fractions of cell free extracts obtained by methods A or B, proved to be good sources of glucan synthetase. However the influence of several exogenous factors, previously described as stimulating the activity, was different for both enzymes. As shown in Table 1, enzyme A was insensitive to both EDTA and GTP but was activated two or three fold by a mixture of both compounds (lines 1, 2, 3 and 5 A, 1 and 2 B, 1 and 2 C). Enzyme B was also insensitive to GTP, but it was affected by EDTA (Table 2). At low concentration the chelating agent inhibited the incorporation by nearly 50 % and this inhibition was partially released by increasing its concentration in the reaction mixture. The inclusion of high concentrations of GTP (100 juM) restored the initial levels but did not cause further activation.
Glycerol and NaF behaved as potent activators of enzyme A and the combined action of both agents was at least additive (lines 1 and 4 A; 3, 4, and 7 B; 1 and 3 C from Table 1). They also improved the activation caused by EDTA plus GTP even when assayed in the presence of one of each agent (lines 5,6 and 7 A; 5 and 6 B; 2 and 4 C; 1, 2 and 3 D; 4 and 5 E from Table 1). Bovine serum albumin, which stimulated more than five fold the yield of glucan in S. cerevisiae (15), did not have any effect on our preparations.
When kept frozen, enzyme B was quite stable loosing only 10-15 % of its activity in 24 h (Table 2). Since this proportion did not change when the frozen period was prolonged to one week it can be assumed that the inactivation was due to the freezing and thawing steps. After this period the activating capacity of GTP, in the presence of EDTA, was negligible (Table 2). By contrast, enzyme A lost between (series B) and 70 % (series A) of the activity when frozen for 24 h (Table 1). It is noticeable that enzyme preparations kept in glycerol alone (series A) underwent higher losses in activity than those kept in EDTA, regardless of whether the latter were supplemented or not with glycerol (series B and C). In all the cases the residual activity was still stimulated by the exogenous effectors in the same or even higher proportions (series B) as the fresh enzyme. However, regardless to the preparation conditions enzyme A became inactive when frozen for one week.
10
TABLE 1
EFFECT OF DIFFERENT FACTORS ON ENZYME A
Additions to Tris/HCl Additions to assay mixtures
Lysis of Resuspension protoplasts of membranes
A: 20 % Glycerol^ 20 % Glycerol 1 — 2EDTA 3GTP 4NaF 5 EDTA+GTP 6 NaF+GTP 7 EDTA+GTP+NaF
B: 5 mM EDTA^ , 5mM EDTA 1 — 2GTP 3 Glycerol 4NaF 5 GTP+glycerol 6 GTP+NaF 7 NaF+glycerol
C: 5 mM EDTA': 5mM EDTA+ 20 % glycerol 1 —
2GTP BNaF 4 GTP+NaF
Incorporation I
pmol glucose/min/mg protein
Fresh enzyme After 24 h.
214 206 202 534 494 589 860
34 102 132 172 234 325 472
100 399 532 702
(1.00) (0.96) (0.94) (2.50) (2.30) (2.75) (4.02)
(1.00) (3.00) (3.88) (5.05) (6.88) (9.55)
(13.88)
(1.00) (3.99) (5.32) (7.02)
frozen
69 66 64
191
214
17 65 96 86
185 281 583
51 167 267 540
(1.00) (0.96) (0.93)
— (2.77)
— (3.10)
(1.00) (3.82) (5.64) (5.06)
(10.88) (16.52) (34.30)
(1.00) (3.27) (5.23)
(10.58)
Residual activity after 24 h. frozen
%
32 32 32
— 39 — 25
50 64 73 50 79 86
124
51 42 50 77
Lysis of protoplats and resuspension of the particulate fractions were performed in Tris/HCl buffer supplemented as indicated. Glucan syntaetase activity was determined in standard reaction mixtures containing the indicated efector(s). Final concentrations were: EDTA, 10 mM; glycerol, 8 %, GTP, 10 ¡JLM; NaF, 100 mM.
^ Protoplasts were in Tris/HCl buffer and glycerol was inmediately added. Assay mixtures contained 8 % glycerol. b Assay mixtures of series B contained 2 mM EDTA. ^ Assay mixtures of series C contained 2 mM EDTA and 8 % glycerol.
TABLE 2
EFFECT OF EDTA AND GTP IN ASSAY MIXTURES OF ENZYME A
Additions to (final
EDTA (mM)
5 10 20 10 10 10
assay mixtures concentration)
GTP (MM)
— — —
5 40
100
Fresh enzyme
111 52 66 72 78 97
106
Incorporation (pmol glucose/min/mg protein)
After 24 h. frozen
80 47 59 65 61 66 69
After frozer
one week I
89 51 55 73 60 68 75
Enzyme B was obtained as indicated in Materials and Methods. Final sucrose concentration in assay mixtures was 0.4 M.

11
Chemical characterization of the reaction products
Two glucan preparations named A and B were synthesized for chemical and enzymatic analysis. The products synthesized by enzymes A and B were insoluble in water, ethanol and acid (5 % TCA or 0.5 N acetic acid). About 70 % of them were solubilized in 0.3 N NaOH. In this case, acidification of the medium with acetic acid reprecipitated the bulk of the radioactivity.
Polymers A and B were characterized as 1,3-linked glucans on the base of their resistance to periodate oxidation. After periodate treatment, reduction with sodium borohydride, acid hydrolysis and paper chromatography (solvent A) almost all the radiactivity cochromatographed with glucose but a small amount of label was detected in the glycerol area (Fig. 1). On the base of the glycerol/glucose ratio and assuming only
5t
2+
o
E u
> o
.g o
24
erythritol
M^ÊUÊmÊÊl • i f t ^ ^ i ' * ^ i a i i i i - t i lâtâsMia
B
imi i i^ i i i i i i i ••••• i i i i i I ma
6 24 Distance from origin (cm)
Fig. 1. Paper chromatography (solvent A) of the products of Smith degradation of glucans A and B.
12
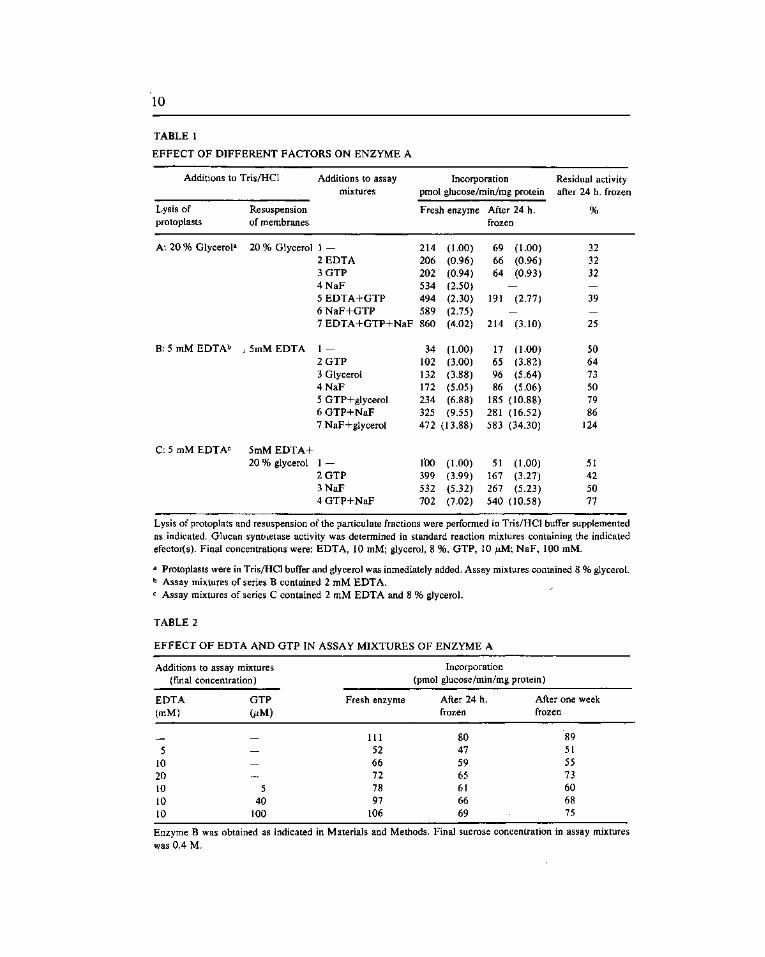
one non-reducing end per molecule (see below), average chain lengths of 15.83 radiac-tive glucosyl units for glucan A and 12 for glucan B were estimated (Table 3).
The specific activities of glucans A and B (cpm//xg of glucose) were 1.9 and 45 respectively (Table 3). Since the specific activity of the substrate was about 2333 it follows that both enzyme preparations, but specially enzyme A, contained high levels of cold glucan synthesized prior to the addition of exogenous substrate.
TABLE 3
CHEMICAL ANALYSIS OF GLUCANS A AND B.
Sample Specific activity Percentage of Smith Length of radioactive cpm/jLtg glucose degradation products chains
Glucose Glycerol
Glucan A 3 89 3 15.83 Glucan B 45 88 4 12.00
Enzymatic analysis
Treatment of the reaction products with exogenous glucanases indicated that under standard enzyme concentration and incubation periods shown effective in degrading glucan synthesized by membrane fractions of S. cerevisiae (7), only glucan B was degraded to the expected from the above results. No more than 50 60 % of the radioactivity associated with glucan A was solubilized by partially purified exoglucanase, Zymolyase or a combination of these together or in sequence (Table 4). Addition of chitinase or protease to exoglucanase treated glucan, or vice versa, did not significantly improved the amount of label solubihzed (not shown). On the other hand both polymers were completely resistant to a-amylase and to a-l,3-glucanase.
In order to further analyze the apparent inability of the exoglucanase to hydrolyze glucan A, a sample of this polymer was subjected to repeated additions of higher amounts of enzyme. Each addition was followed by incubation and separation of the soluble products by centrifugation. Although several incubations were needed the polymer was completely degraded by the exoglucanase under these conditions, indicating that most, if not all the linkages were of the j5-l,3 type (not shown).
Since the exoglucanase used breaks all j5-l,3 bonds without affecting j5-l,6 linkages (11) it was used to investigate the presence of j5-l,6 ramifications. Samples of glucans A and B containing 40000 cpm each were treated exhaustively with exoglucanase till no more radioactivity was solubilized, the soluble products were concentrated, desalted in a MB-3 resin column, and filtrated through a Bio-Gel P-2 column. In both cases only one radiactive peak, further identified as glucose by paper chromatography, eluted from the column.

13
2+
'LiaÉlWHlilliffir'^'f I ^ ^^-m.m.M.^.»M.m^m.»^.mM,^
O
o
glucose mçnni ol
sorbitol a
kiî i i t tut i i i i
, A
••l#i-iiilMfciii»liitt 13 26
Distance from origin (cm)
Fig. 2. Paper chromatography (solvent B) of the hydrolysis products of reduced glucans A (a, b, c) and B (d). Reduction was performed as indicated under Materials and Methods in alkali (a, c, d,) or in water (b) with NaBH4 (a) or (3H)NaBH4 (b, c, d).

14
TABLE 4
EFFECT OF SPECIFIC GLUCOSIDASES IN THE REACTION PRODUCTS OF ENZYMES A AND B
Treatment Glucan A (cpm) Glucan B (cpm)
Water Exo-j3-glucanase^' ^ Zymolyase*'' ^ a-amylase'^' ^ a-glucanase'^' ^
Supernatant
89 4615 4120
126 132
Pellet
6115 2315 2168 6312 6203
Supernatant
199 7726 6435
205 —
Pellet
7804 76
1807 7181 —
Samples of glucans A and B were precipitated with TCA, washed with water and incubated for 24 h with the indicated enzymes in a final volume of 100 ¡u. Reaction mixtures were then centrifuged and radioactivity in super-natans and pellets determined.
M 30 mU. M mU. ' 50 U. ^ 10 mU. ^Acetate buffer (50 mM, pH 5.5). f Citrate buffer (50 mM, pH 5.2).
Analysis of the reducing end
Treatment of glucan A with sodium borohydride in water pH 9 or alkali (0.1 N NaOH) followed by total hydrolysis yielded only ^^-glucose (Fig. 2A). The absence of "HZ -sorbitol argues against the «de novo» synthesis of glucan A unless the reducing terminal was bound to an acceptor of a different nature through an alkali resistant bond. However when the reduction step was carried out in tritiated sodium borohydride, in addition to ^"C-glucose, tritiated sorbitol was produced in the subsequet hydrolysis, indicating that at least some molecules of cold glucan A have free reducing ends (Fig. 2B). The sorbitol/glucose ratio increased two to three fold when the reduction step was carried out in 0.1 N NaOH (Fig. 2C). This result may point to the existence of an alkali labile bond between the reducing terminals of some glucan chains and another component. However, it is more likely to be a reflection of either the solubility of glucan or the stability of NaBH^ in alkaU.
When glucan A was reduced ant then hydrolyzed no traces of 'Kü-or ^H-sorbitol were detected under any of the conditions described above (Fig. 2D). We conclude that glucan B was not synthesized «de novo» either (unless it was bound to and acceptor other than glucan) and that the cold glucan present in enzyme B was bound to an acceptor through an alkali stable bond.
Discussion
Two methods for the preparation of glucan synthetase from C albicans as well as the effect of several exogenous factors, previously shown to stimulate glucan synthetase from other sources have been described.
EDTA, which has been reported to enhance one to five fold glucan synthetase from

15
S. cereviae (8,15), did not have, at the same concentration, any effect on enzyme A from C. albicans. Moreover, when assayed on enzyme B it displayed a marked inhibition at low concentrations, this effect being partially released by a higher concentration of the chelator. EDTA was, however, necessary to reveal the stimulatory effect of GTP on both enzymes, thus confirming previous results in S. cerevisiae (15) and a group of taxonomically diverse fungi (17). The lack of action of GTP on enzyme B (as compared to the control) contrasts with the strong stimulation produced by the nucleotide in similar enzyme preparations from S. cerevisiae (Leal and Larriba, unpublished observations) and may be ascribed to the inhibitory effect of EDTA in these preparations. A similar lack of action of GTP has recently been reported in Aphanomyces astaci ( 1 ) and Neuros-pora crassa (13). In addition, glucan synthetases from Saprolegnia monoica lost the property of being stimulated by GTP upon solubilization. In this case it was suggested that the nucleotide could exert its action by increasing the permeability of the membranes, thus increasing the accesibility of the substrate (3). Since no evidence for a direct binding of GTP to the enzyme has been reported, further research is needed to explain these results. .
In agreement with the finding of Shematech et al. (15) in S. cerevisiae, glycerol behaved as a powerful stimulator of enzyme A. However, in contrast with their results, it was deleterous for the stability of the frozen enzyme. NaF activated enzymes A and B in a similar or greater extend than that described for the Saccharomyces synthetase (7, 8) and this stimulation was additive to that produced by EDTA plus GTP, glycerol or both. These results may indicate that these agents activate the enzyme by different mechanisms. However this may not be the case. The high concentrations of glycerol (8 %) and NaF (150 mM) needed to enhance the activity suggest that these substances act in a rather indirect way by modifying in some manner the membrane environment where the enzyme is located and recall the stabilization of the Saccharomyces synthetase by 1 M sucrose. One possibility is that all three agents exert their action by decreasing the water activity in the reaction mixture.
The polysaccharides synthesized by enzymes A and B were identified as linear j5-l,3-linked glucans. The absence of erythritol between the products of Smith degradation as well as the resistance of the reaction products to a-amylase indicated that no glycogen was synthesized by any of the enzymes. On the other hand, the j3-l,3 linkage was deduced from their resistance to periodate and susceptibility to j3-glucanases. The apparent resistance of glucan A to the exoglucanase used may be ascribed to the high amounts of cold glucan present in enzyme A preparations. Finally, since no radioactive gentiobiose was solubilized by the exoglucanase we conclude that no j5-l,6 linkages were synthesized.
The absence of 'C-sorbitol following reduction and hydrolysis of glucans A and B indicates that the newly formed chains are bound to either cold glucan or to and acceptor of a different nature. In the case they must be bound though an alkali resistant linkage since reduction in the presence of alkali also failed to yield "CI-sorbitol. On the other hand, at least part of the glucan chains associated with enzyme A have free reducing ends since they could be labeled with tritiated borohydride. It does not, however, exclude the possibility that the polysaccharide is initially formed while bound to an acceptor other than glucan. Thus, we were unable to detect free reducing ends in glucan B in spite of the fact that enzyme B also contained (although to a lesser extent than glucan A) high levels

16
of cold glucan. Accordingly enzyme B preparations appear to contain exclusively or, at least, be enriched in glucan molecules bound to an acceptor. The complex would in turn be able to accept glucosyl residues from exogenous UDP-glucose.
The nature of the enzyme preparations used may help to rationalize the results presented in this work. As described for 5. cerevisiae (15), the bulk of active glucan synthetase of C albicans regenerating protoplasts may be attached to the plasma membrane giving rise to a glucan net (5) which would become incorporated into enzyme A preparations. Part of the chains could remain associated to the synthetase after lysis of protoplasts and continue their elongation upon the addition of exogenous substrate, whereas others probably represent finished products. By contrast, during the preparations of enzyme B mature glucan molecules are eliminated with the cell wall fraction and the membrane associated glucan probably represent molecules that are being synthesized while bound to an acceptor. During normal cell growth or protoplast regeneration the acceptor could serve as a signal for the processing of glucan molecules by glucanases associated to the cell wall or glucan net respectively. This process would result in the appearance of glucan chains with free reducing ends as those observed in glucan A preparations.
Acknowledgements
This work was supported by grants n. 1315/82 from CAYCIT and 83/868 from FIS to G. L. We thank L. Franco for technical assistance.
References
1. Cerenius, L. and Soderhall, K. ( 1984) Isolation and properties of ^-glucan synthetase from the aquatic fungus, Aphanomyces astaci. Physiol. Plant. 60, 247-252.
2. Dubois, M., Gilles, K.A,, Hamilton, J.K., Revers, P.A. and Smith, F. (1956) Colorimetric method for determination of sugars and related substances. Anal. Chem. 28, 350-356.
3. Fèvre, M. (1984) ATP and GTP stimulate membrane-bound but not digitonin-solubilized j3-glucan synthases from Saprolegnia monoica. J. Gen. Microbiol. 130, 3279-3284.
4. Gopal, P.K., Shepherd, M.G. and Sullivan P. A. (1984a) Analysis of wall glucans from yeast, hyphal and germ-tube forming cells of Candida albicans. J. Gen. Microbiol. 130, 3295-3301.
5. Gopal, P.K., Sullivan, P.A. and Shepherd, M.G. (1984b) Isolation and structure of glucan from regenerating "pvoiopXdiSi 0Ï Candida albicans. J. Gen. Microbiol. 130, 1217-1225.
6. Hernández, L.M., Olivero, O. and Larriba, G. (1983) Detection of inactive precursors of ^-glucanases in Saccharomyces cerevisiae. FEBS Lett. 161, 190-194.
7. Larriba, G., Morales, M. and Ruiz-Herrera J. (1981) Biosynthesis of /3-glucan microfibrils by cell free extracts from Saccharomyces cerevisiae. J. Gen. Microbiol. 124, 375-383.
8. Leal, F., Ruiz-Herrera, J., Villanueva, J.R. and Larriba, G. (1984) An examination of factors affecting the inestability oí Saccharomyces cerevisiae glucan synthetase in cell free extract. Arch. Microbiol. 137, 209-214.
9. Lowry, O.H., Rosebrough, N.J., Farr, A.L. and Randall, R.J. (1951) Protein measurement with the Folin phenol reagent. J. Biol. Chem. 193, 265-275.
10. Manners, D.J. and Meyer, M.T. (1977)The molecular structure of some glucans from the cell wall of Schizosaccharomyces pombe. Carbohydr. Res. 57, 189-203.
11. Nelson, T.E., Johnson, J., Jantzen, E. and Kirkwood, S. (1969) Action pattern and specificity of an exo-p-(l-3)-D-glucanase from Basidiomycete species QM 806. J. Biol Chem. 244, 5972-5980.
12. Orlean, P.A. (1982) ^-(l-3)-D-glucan synthase from budding and filamentous cultures of the dimorphic fungus Candida albicans. Eur. J. Biochem. 127, 397-403.
17
13. Quigley, D.R. and Siletrennikoff, C.P. (1984) ^-(1,3)-Glucan synthase activity from Neurospora crassa: stabilization and partial characterization. Exp. Mycol. 8, 202-214.
14. Reese, E.T. and Mandéis, M. (1959) ^-D-1,3 glucanases in fungi. Can. J. Microbiol. 5, 173-185. 15. Shematek, E.M., Braatz, J.A. and Cabib, E. (1980) Biosynthesis of the yeast cell wall. I Preparation and
properties of/5-(l-3)-glucan synthetase. J. Biol. Chem. 255, 868-894. 16. Somogyi, M. (1952) Notes on sugar determination. J. Biol. Chem. 195, 19-23. 17. Szaniszlo, P.J., Kang, M.S. and Cabib, E. (1985) Stimulation of/3-(l-3)-glucan synthetase of varius fungi
by nucleoside triphosphates: generalized regulatory mechanism for cell wall biosynthesis. J. Bacteriol. 161, 1188-1194.
18. Trevelyan, W.E., Procter, D.P. and Harrisson, J.S. (1950) Detection of sugars in paper chromatograms. Nature 166, 444-445.
19. Walker, G.J. and Hare, M.D. (1977) Metabohsm of the polysaccharides of human dental plaque. Carbohydr. Res. 58, 415-432.
Microbiología 1 (1985), 19-87 SEM
Importancia de la homogeneización celular en la obtención posterior de las membranas plasmáticas de la levadura
Candida utilis
Amelia Pérez Cabo, Monique Novaes-Ledieu, y Concepción García Mendoza (*)
Instituto de Microbiología "Jaime Ferràn", C.LSJ.C., Joaquín Costa, 32. Madrid 28006 - España.
Summary
Candida utilis plasma membranes were isolated from different homogenized, either whole cells or spheroplasts, by centrifugation and aggregation of mitocondrial and internal membranes at pH 4.0. As judged by electron microscopy, chemical analysis, disc electrophoresis and enzymatic assays, membrane preparations with different degrees of purity were obtained. The purest plasma membranes were those prepared by homoge-nization of spheroplasts in the Omnimixer Sorvall followed aggregation at mitocondrial isoelectric point as described above.
Key words: Plasma membranes isolation, Candida utilis
Resumen
Se aislaron membranas plasmáticas de Candida utilis di partir de células enteras o esferoplastos homogeneizados por diferentes métodos, seguido de centrifugación y agregación de las membranas no plasmáticas a pH 4,0. De acuerdo con los criterios de microscopía electrónica, análisis químico, electroforesis de disco y valoraciones enzima-ticas se obtuvieron preparaciones de membranas con diferente grado de pureza. Las membranas plasmáticas más puras fueron las obtenidas por homogeneización de esferoplastos en el Omnimixer Sorvall seguida de agregación de las membranas no plasmáticas a su pH isoeléctrico.
Introducción
El aislamiento de membranas plasmáticas de levadura ha sido objeto de estudio de numerosos investigadores (1,2,4, 5, 8, 9,11, 13,15,17,19, 20, 23, 27) pero en muchos
* A quién se dirigirá la correspondencia.
20
casos las preparaciones de membranas obtenidas han mostrado poseer un cierto grado de contaminación con otros materiales membranosos intracelulares o particulados.
Basándose en las diferentes propiedades de superficie de las membranas plasmáticas e internas, Fuhrmann y cois. (9) describieron un método de purificación de membranas plasmáticas, en el que sometiendo un homogeneizado celular a un pH de 4,3-4,7 (punto isoeléctrico mitocondrial) conseguían agregar dichas membranas internas, mientras que las membranas plasmáticas cargadas más negativamente (pH isoeléctrico inferior a 3) permanecían suspendidas en el sobrenadante. Seguidamente mediante centrifugación y filtración de estos sobrenadantes se obtenían membranas plasmáticas de Saccharomyces cerevisiae con un elevado grado de pureza, deducido de los diferentes marcadores utilizados al respecto.
Este método por su relativa sencillez, frente a los ya tradicionales de centrifugación con gradientes de densidad, ha sido utilizado con algunas modificaciones a lo largo del presente trabajo p ara la obtención de membranas plasmáticas de la levadura Candida utilis.
Materiales y métodos
Organismo y condiciones de cultivo
Candida utilis CECT 1061 se creció aeróbicamente en medio Winge (glucosa 2 % y extracto de levadura 0,3 %).
Las células en estado logarítmico de crecimiento se recogieron por centrifugación a 3.000 xg durante 5 min y se lavaron dos veces con agua destilada.
Preparación de esferoplastos
Las células lavadas con mercaptoetanol 50 mM se sometieron a la acción de la heli-casa (L'-Industrie Biologique Française) en concentración de 1 mg/5 mg de peso seco celular en presencia de Trís-CIH 50 mM (pH 7,6) conteniendo mercaptoetanol 10 mM y manitol 800 mM a 30°C. La digestión enzimática se siguió mediante observación microscópica y después de 1 hora prácticamente todas las células se habían convertido en esferoplastos. El enzima se ehminó lavando los esferoplastos con el mismo tapón conteniendo igual concentración de manitol.
Rotura celular
Para la obtención de homogeneizados celulares, bien a partir de células enteras o esferoplastos, se utiUzaron diferentes procedimientos que tras numerosas experiencias resultaron ser los más apropiados.
En la homogeneización a partir de células enteras se utilizaron el fraccionador celular de Ribi y el homogeneizador de Braun. En el primero de los casos las células resuspendidas a una concentración de 25-50 mg peso seco/ml de tampon que contenía trietanolamina 20 mM, Cl K 400 mM y Cl2Mg 1 mM a pH 4,0 se sometieron a la acción del aparato de Ribi a una presión de 35.000 libras/pulg. cuadr. en frío.
En el segundo de los casos las células resuspendidas de igual forma en el tampon de trietanolamina y con polvo de vidrio como intermedio (B. Braun 0,25-0,30 mm diámetro)

21
se sometieron a la acción del homogeneizador de Braun durante 2 ó 3 minutos a la máxima velocidad y en frío.
Cuando se utilizaron esferoplastos el homogeneizado de los mismos se efectuó mediante el desintegrador ultrasónico o con el Omnimixer Sorvall. En el primero de los casos los esferoplastos se sometieron durante 1 ó 2 minutos a sonicación a 150 w, en frío, resuspendidos en el mismo tampon de trietanolamina ya que la concentración iónica de este tampon mantiene a los esferoplastos estabilizados. Por último, los esferoplastos resuspendidos en el citado tampon se sometieron también a la acción del Omnimixer Sorvall a la mínima velocidad durante 15-20 min e igualmente en frío. En todos los casos expuestos la rotura celular se controló por observación microscópica, haciendo actuar a lo largo de todos los procesos DNasa a una concentración de 1 mg/ml.
Purificación de las membranas plasmáticas
La rotura celular, bien a partir de células enteras o esferoplastos produjo una subida de pH del tampon, inicialmente de 4,0 hasta pH 5,6-6,0. Para rebajar este pH nuevamente a 4,0 se utilizó el mismo tampon de trietanolamina pero ajustado a pH 1,2.
La suspensión homogeneizada se dejó en reposo durante 20 min con lo que se produjo una agregación de las membranas mitocondriales e internas en el fondo del recipiente, y las membranas plasmáticas que permanecían en suspensión se pipetearon cuidadosamente, y seguidamente se recogieron por centrifugación y lavados sucesivos.
Microscopía electrónica
Las muestras de membranas plasmáticas se fijaron con glutaraldehido al 3 % en tampon de citrato-fosfato sódico 100 mM (pH 6,8) a 4°C durante 1 hora. Después de lavar las muestras con agua destilada se volvieron a fijar con tetróxido de osmio al 2 % en tampon veronal-acetato (14) durante 2 horas en la oscuridad. Seguidamente se lavaron las muestras varias veces para eliminar el fijador, y se deshidrataron gradualmente con acetona, se contrastaron con acetato de uranilo al 2 % y se embebieron en araldita (Fluka, Suiza). Las muestras se cortaron con un ultramicrotomo Reichert Omu 2 y las preparaciones teñidas con citrato de plomo se examinaron en un microscopio electrónico Siemens Elmiskop L
Análisis químico
Se efectuaron las siguientes valoraciones químicas en las preparaciones de membranas plasmáticas obtenidas: carbohidratos totales neutros (6), proteinas (18), lípidos (16) y ácidos nucleicos (3, 10).
Análisis electroforético de proteínas
La electroforesis- sobre geles de poliacrilamida de las proteínas de las membranas plasmáticas de C utilis en presencia de SDS se efectuaron siguiendo el método descrito por García Mendoza y Novaes-Ledieu (12). La tinción de las bandas de glicoproteínas se llevó a cabo mediante el método de Keyser (15), y la determinación de pesos moleculares se realizó según el método de Shapiro y cois. (29).
22
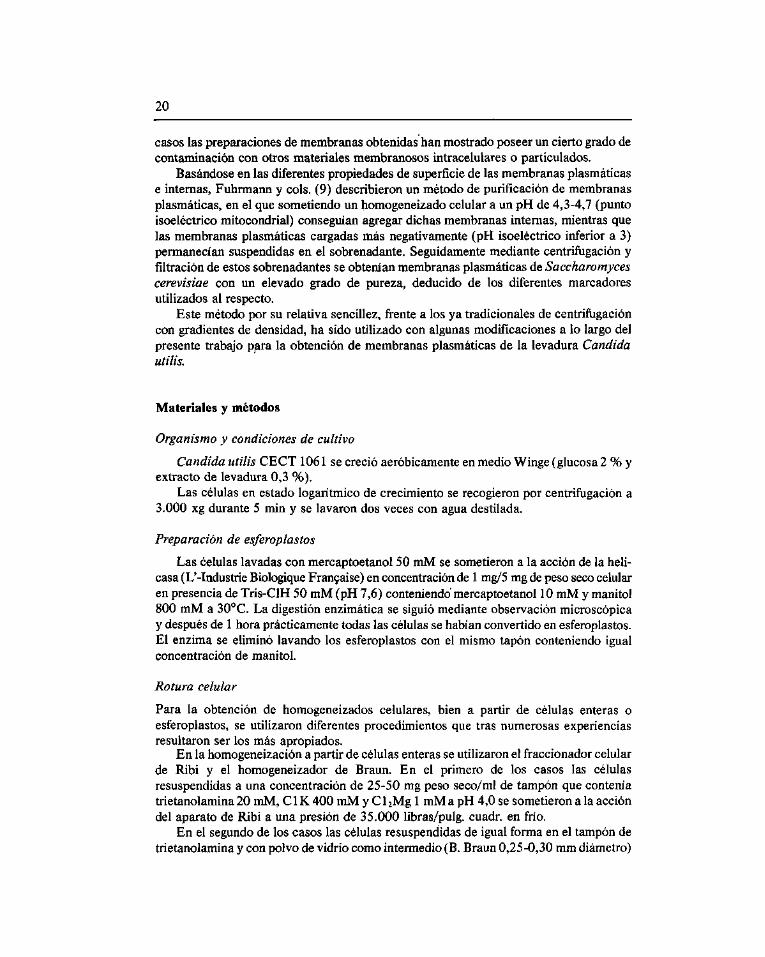
Fig. 1. Cortes finos de las membranas plasmáticas de C. utilis obtenidas utilizando diferentes tipos de rotura: a) homogeneización en el fraccionador de Ribi (x39.800), b) en el homogeneizador de Braun (x49.100), c) en el desintegrador ultrasónico (x55.400), d) en el Omnimixer Sorvall (x44.600). Se observan membranas plasmáticas parcialmente vesiculadas en a, b, y c, con escaso nivel de contaminación particulada, mientras que en d, aparecen las membranas plasmáticas abiertas, de mayor tamaño y prácticamente libres de contaminación particulada, observándose en su superficie la presencia de «pelos».
23
Análisis enzimático
La valoración de las actividades ATPasa, succínico deshidrogenasa y NADPH-citocromo C reductasa se llevó a cabo mediante los métodos de Serrano (28), Marriot(19) y Dow et al. (7) respectivamente.
Resultados
Los métodos utilizados para el aislamiento de las membranas plasmáticas de la levadura C. utilis son el resultado de una serie de experimentos previos con objeto de obtener condiciones óptimas. Las Figuras la y b muestran las preparaciones de membranas plasmáticas obtenidas mediante rotura mecánica de células enteras con los aparatos de Ribi y Braun seguida de purificación de estas membranas por agregación de las membranas no plasmáticas a su pH isoeléctrico. Se observa que las membranas plasmáticas están parcialmente vesiculadas, pero no aparecen vestigios de membranas mitocondriales. Algunas vesículas contienen algún material particulado en su interior y posiblemente citoplásmico soluble. Las Figuras le y d muestran las preparaciones de membranas plasmáticas obtenidas por homogeneización de esferoplastos mediante ultrasonidos y en el Omnimixer Sorvall respectivamente, apreciándose entre ellas claras diferencias. En el caso de utilizar la homogeneización ultrasónica las membranas aparecen igualmente vesiculadas en parte y con ligera contaminación particulada y/o soluble pero cuando se utiliza el Omnimixer Sorvall las membranas plasmáticas muestran una apariencia bien distinta. Dichas membranas se encuentran completamente abiertas, de gran tamaño y consecuentemente con mayor grado aparente de pureza. Se observa en su superficie la presencia de estructuras semejantes a «pelos», no observados con los anteriores métodos de.ruptura, y descritas por otros investigadores (24, 26).
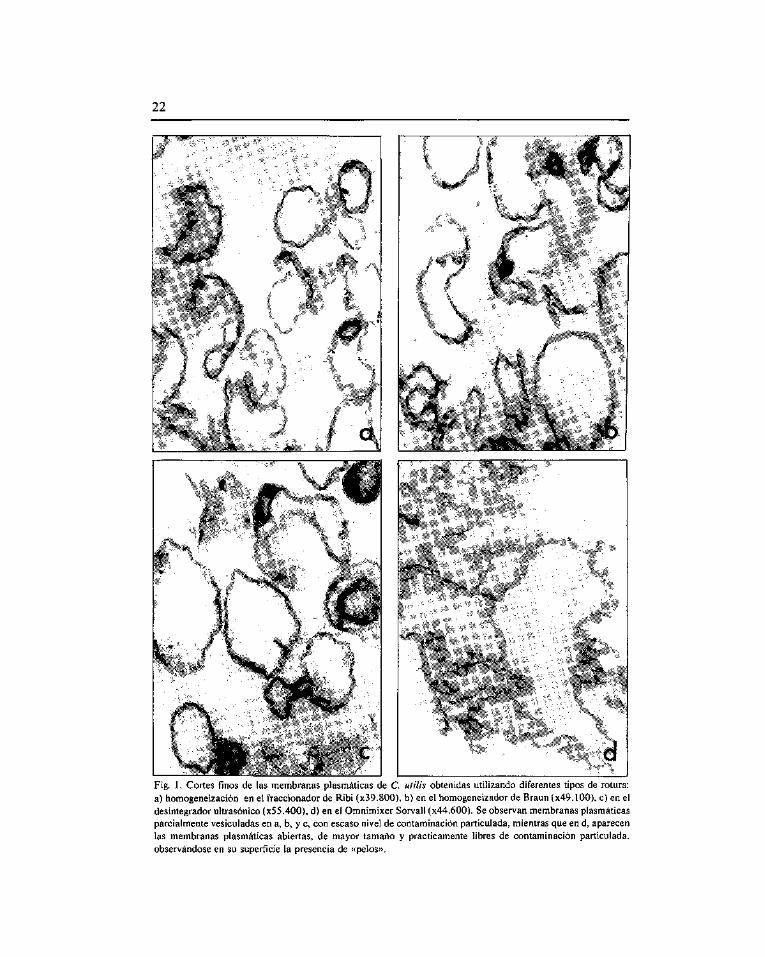
Los análisis químicos realizados en estas preparaciones de membranas muestran que los componentes mayoritarios son proteínas y lípidos, con variable proporción de carbohidratos y pequeñas cantidades de ácidos nucleicos (Tabla 1). Los valores de proteínas próximos a 40 % pueden ser debidos a una ligera contaminación de material
TABLA 1
ANÁLISIS Q U Í M I C O DE LAS MEMBRANAS PLASMÁTICAS DE C utilis UTILIZANDO DIFERENTES CONDICIONES DE HOMOGENEIZACIÓN
Componentes
' % en peso seco
a partir de células enteras
Fraccionador Ribi Homogeneizador Braun
a partir de esferoplastos
Desintegr. Ultrasónico Omnimixer Sorvall
Proteínas Lípidos Carbohidratos ARN ADN
38,3 ± 3,50 35,0 ±3,50 19,9+1,50
1,3 ±0,10 0,5 ± 0,05
39,0+3,50 34,0 ± 3,00 20,4 ± 2,00
1,3 ±0,10 0,7 ±0,10
39,0 ± 3,50 33,5 ± 3,00 16,0 ± 1,50
1,1 ±0,10 0,3 ± 0,05
33,0 ± 3,00 37,0 ± 3,50 17,0 ±1,50 0,8 ±0,10 0,2 ± 0,05
24
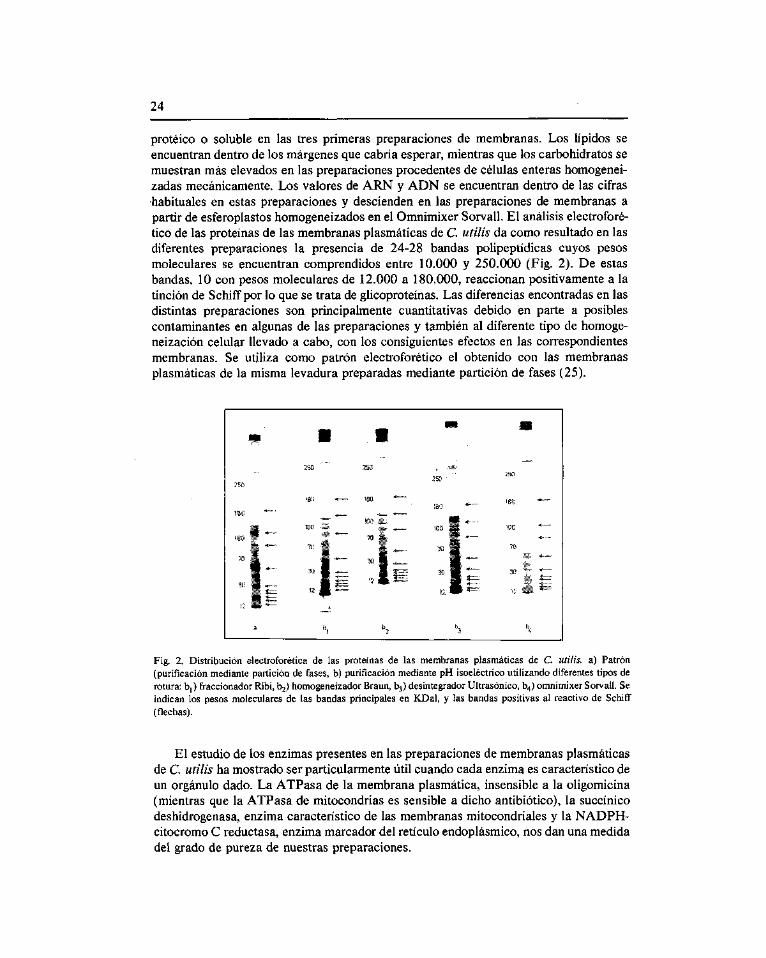
proteico o soluble en las tres primeras preparaciones de membranas. Los lípidos se encuentran dentro de los márgenes que cabría esperar, mientras que los carbohidratos se muestran más elevados en las preparaciones procedentes de células enteras homogenei-zadas mecánicamente. Los valores de ARN y ADN se encuentran dentro de las cifras habituales en estas preparaciones y descienden en las preparaciones de membranas a partir de esferoplastos homogeneizados en el Omnimixer Sorvall. El análisis electroforé-tico de las proteínas de las membranas plasmáticas de C. utilis da como resultado en las diferentes preparaciones la presencia de 24-28 bandas polipeptídicas cuyos pesos moleculares se encuentran comprendidos entre 10.000 y 250.000 (Fig. 2). De estas bandas, 10 con pesos moleculares de 12.000 a 180.000, reaccionan positivamente a la tinción de Schiff por lo que se trata de glicoproteínas. Las diferencias encontradas en las distintas preparaciones son principalmente cuantitativas debido en parte a posibles contaminantes en algunas de las preparaciones y también al diferente tipo de homoge-neización celular llevado a cabo, con los consiguientes efectos en las correspondientes membranas. Se utiliza como patrón electroforético el obtenido con las membranas plasmáticas de la misma levadura preparadas mediante partición de fases (25).
Fig. 2. Distribución electroforética de las proteínas de las membranas plasmáticas de C utilis. a) Patrón (purificación mediante partición de fases, b) purificación mediante pH isoeléctrico utilizando diferentes tipos de rotura: bj) fraccionador Ribi, b2) homogeneizador Braun, b3) desintegrador Ultrasónico, b4) omnimixer Sorvall. Se indican los pesos moleculares de las bandas principales en KDal, y las bandas positivas al reactivo de Schiff (flechas).
El estudio de los enzimas presentes en las preparaciones de membranas plasmáticas de C. utilis ha mostrado ser particularmente útil cuando cada enzima es característico de un orgánulo dado. La ATPasa de la membrana plasmática, insensible a la oligomicina (mientras que la ATPasa de mitocondrias es sensible a dicho antibiótico), la succínico deshidrogenasa, enzima característico de las membranas mitocondriales y la NADPH-citocromo C reductasa, enzima marcador del retículo endoplásmico, nos dan una medida del grado de pureza de nuestras preparaciones.

25
La Tabla 2 muestra cómo las preparaciones de membranas plasmáticas presentan altos niveles de ATPasa insensible a oligomicina mientras que las actividades succínico deshidrogenasa y NADPH-citocromo C reductasa están prácticamente ausentes en nuestras preparaciones. La ligera inhibición que muestra la oligomicina sobre la ATPasa de membranas plasmáticas ha sido igualmente descrita porptros investigadores (1, 10, 20, 23, 28) por lo que no se considera debido a contaminación mitocondríal.
TABLA 2. ACTIVIDADES ENZIMATICAS ESPECIFICAS DE LAS MEMBRANAS PLASMÁTICAS DE C utilis UTILIZANDO DIFERENTES TIPOS DE ROTURA
Membranas plasmáticas ATPasa
- oligomicina + oligomicina Succínico
deshidrogenasa NADPH-citocromo
C reductasa
a partir de células enteras
Fraccionador Ribi Homogeneizador Braun
a partir de es- Desintegrador Ultrasónico feroplastos lOmnimixer Sorvall
1,16 1,17
1,15 1,15
0,99 1,00
1,01 1,03
0,13 0,15
0,10 0,05
0,011 0,010
0,010 0,009
Las actividades se expresan en /¿moles de sustrato transformado/min/mg proteína. La oligomicina fue utilizada a una concentración de 10 /xg/ml.
Discusión
Los diferentes métodos descritos en la literatura para la obtención de membranas plasmáticas de levadura (1, 2, 4, 5, 8, 9, 11, 13, 15, 17, 19,20, 23, 27) en muchos casos han mostrado suministrar preparaciones con cierto grado de contaminación citoplásmica. El método descrito por Fuhrmann y cois. (10) basado en la agregación de membranas mitocondriales e internas a su pH isoeléctrico permite la preparación de membranas plasmáticas con aceptable grado de pureza dependiente de diferentes factores a considerar.
Cuando se utiliza homogeneización (en el fraccionador de Ribi o en el homogeneizador de Braun) a partir de células enteras de C utilis y se purifican por agregación de las otras membranas a su pH isoeléctrico, se obtienen preparaciones de membranas plasmáticas de un aceptable grado de pureza deducido de los diferentes marcadores utilizados al efecto.
Cuando se utilizan esferoplastos de C. utilis homogeneizados en el desintegrador ultrasónico y purificados de igual modo, se obtienen preparaciones semejantes a las anteriormente descritas por cuanto en todas ellas existe mayor o menor grado de vesiculación y por tanto de posible contaminación. En el caso de homogeneización de esferoplastos en el Omnimixer Sorvall, por tratarse de una rotura más suave y controlada las membranas plasmáticas se mantienen abiertas y de mayor tamaño con lo que se evita prácticamente que el material citoplásmico quede englobado en el interior de las mismas. Por otra parte, el hecho de que estas preparaciones de membranas hayan mostrado la presencia de estructuras superficiales semejantes a «pelos» ya descritas anteriormente por otros investigadores (24, 26) y que pueden corresponder a glicoproteínab y polisacáridos transportados a través de la membrana, reafirma una vez más la importan-

26
cia de la homogeneización suave que permite que estructuras muy lábiles permanezcan unidas a dicha membrana lo que no ocurre con los otros tipos de rotura celular más drástica. Considerando que en todos los casos la purificación de las membranas plasmáticas ha sido la misma, es decir la agregación de las membranas no plasmáticas en presencia del mismo tampon protector, se puede resaltar, a la luz de los diferentes resultados obtenidos mediante microscopía electrónica, la importancia de la homogeneización celular previa a dicha purificación.
Los demás marcadores utilizados para definir el grado de pureza de nuestras preparaciones: análisis químico, perfiles electroforéticos de proteínas y actividades enzimáticas confirman los resultados obtenidos por microscopía electrónica.
Por ello, sin descartar otros métodos de preparación de membranas plasmáticas de C utilis, se puede concluir que la homogeneización suave de esferoplastos constituye el factor más importante en la obtención de preparaciones de estas membranas, no sólo en cuanto al mayor grado de pureza sino también en cuanto a su tamaño e integridad.
Bibliografía
1. Ahlers, J., Ahr. E. y Seifarth, A. (1978) Kinetic characterization of plasma membrane ATPase from Sacchawmyces cerevisiae. Mol Cell. Biochem. 22, 39-49.
2. Boulton, A. A. (1965) Some observations on the chemistry and morphology of the membranes released from yeast protoplasts by osmotic shock. Exp. Cell. Res. 37, 343-357.
3. Burton, K. (1965) A study of the conditions and mechanism of the diphenylamine reaction for the colorimetric estimation of deoxyribonucleic acid. Biochem, J. 62, 315-323.
4. Bussey, H., Saville, D., Chevalier, M.R. y Rank, G.H. (1979) Yeast plasma membrane ghosts. An analysis of proteins by two-dimensional gel electrophoresis. Biochim. Biophys. Acta. 553, 185-196.
5. Christensen, M.S. y Cirillo, V.P. (1972) Yeast membrane vesicles: Isolation and general characterization. J. Bacteriol. 110, 1190-1205.
6. Chung. C.N. y Nickerson, W.J. (1954) Polysaccharide synthesis in growing yeasts. J. Biol. Chem. 208, 395-407.
7. Dow, J.M., Carreon, R.R. y Villa, V.D. (1981) Roleof membranes of mycelial Mwcorrowx//in synthesis and secretion of cell wall matrix polymers. J. Bacteriol. 145, 272-279.
8. Dube, J., Setterfield, G., Kiss, G. y Lusena, C.V. (1973) Fate of the plasma membrane oï Sacchawmyces cerevisiae during cell rupture. Can. J. Microbiol. 19, 185-290.
9. Duran, A., Bowers, B. y Cabib, E. (1975) Chitin synthetase zymogen is attached to the plasma membrane. Proc. Nat. Acad. Sci. 72, 3952-3955.
10. Fuhrmann, G.F., Boehm, C. y Theuvenet, A.P.R. (1976) Sugar transport and potassium permeabihty in yeast plasma membrane vesicles. Biochim. Biophys. Acta 443, 583-596.
11. Garcia Mendoza, C. y Villanueva, J.R. (1963) The isolation of cytoplasmic membranes from yeast protoplasts. Can. J. Microbiol. 9, 900-902.
12. Garcia Mendoza, C. y Novaes-Ledieu, M. (1975) Membrane protein synthesis m Micrococcus lysodeikticus and selective effect of chloranphenicol. Can. J. Biochem. 53, 615-622.
13. Hossack, J. A. y Rose, A.H. (1976) Fragility of plasma membranes in Saccharomyces cerevisiae enriched with different sterols. J. Bacteriol. 127, 67-75.
14. Kellemberger, E., Ryter, A. y Sechaud, J. (1958) Electron microscope study of DNA-containing plasms. Vegetative and mature phage DNA as compared with normal bacterial nucleoids in different physiological states. J. Biophys. Biochem. Cytol. 4, 671-676.
15. Keyser, J.W. (1964) Staining of serum glycoproteins after electrophoretic separation in acrylamide gels. Anal. Biochem. 9, 249-252.
16. Letters, R. (1962) Chromatography of yeast lipids on silicic acid. J. Inst. Brew. 68, 318-321. 17. Longley, R.P., Rose, A.H. y Knights, B.A. (1968) Composition of the protoplast membrane from Saccharo
myces cerevisiae. Biochem. J. 108, 401-412. 18. Lowry, O.H., Rosebrough, N.J., Farr, A.L. y Randall, R.J. (1951) Protein measurement with the Folin
phenol reagent. J. Biol. Chem. 193, 265-275.
27
19. Marriot, M.S. (1975) Isolation and chemical characterization of plasma membranes from the yeast and mycelial forms of Candida albicans. J. Gen. Microbiol. 86, 115-133.
20. Matile, P.H., Moor, H. y Muhlethaler, J. (1967) Isolation and properties of the plasmalemma in yeast. Arch. Microbiol. 58, 201-211.
21. Mejbaum, W. ( 1939) Uber die bestimmung kleiner pentosemengen insbesondere in derivaten du adenylsaüre. Hoppe-Seyler's Z. Physiol. Chem. 258, 117-120.
22. Merkel, G.K., Naider, F. y Becker, J.M. (1980) Amino acid uptake by Sacharomyces cerevisiae plasma membrane vesicles. Biochim. Biophys. Acta 595, 109-120.
23. Nurminen. T., Oura, E. y Soumalainen, H. (1970) The enzymic composition of the isolated cell wall and plasma membrane of baker's yeast. Biochem. J. 116, 61-69.
24. Pérez Cabo, A., Novaes-Ledieu, M. y García Mendoza, C. (1983) Highly purified Candida utilis plasma membranes by phase partition. FEMS Microbiol. Lett. 18, 7-10.
25. Pérez Cabo, A. (1984) Estudio de las propiedades de las membranas plasmáticas de Candida utilis obtenidas por diferentes procedimientos. Tesis Doctoral, Universidad Complutense de Madrid.
26. Santos, E., Villanueva, J.R. y Sentandreu, R. (1978) The plasma membrane oí Sccharomyces cerevisiae. Isolation and some properties. Biochim. Biophys. Acta 508, 39-54.
27. Schibeci, A., Rattray, J.B.M. y Kidby, D.K. (1973) Isolation and identification of yeast plasma membrane. Biochim. Biophys. Acta 311, 15-25.
28. Serrano. R. (1978) Characterization of the plasma membrane ATPase oí Saccharomyces cerevisiae. Mol. Cell. Biochem. 22, 51-63.
29. Shapiro, A.L., Vihuela, E. y Maizel, J.V. (1967) Molecular weight estimation of polypeptide chain by electrophoresis in SDS-polyacrilamide gels. Biochem. Biophys. Res. Comm. 28, 815-820.
Microbiología 1 (1985), 29-33 SEM
Isolation of methanogenic bacteria able to grow in high salt concentration
Miguel Pérez-FilloP^, Francisco Rodriguez-Valera^*, James G. Ferry'*
' Marine Laboratory, Woods Hole, Massachusetts 02543 - USA. 2 Departamento de Microbiología, Facultad de Medicina, Alicante - Spain.
Summary
A new obligate halophilic methane-producing bacterium has been isolated from the sediment of solar salt ponds. This isolate was unable to grow at or below 12% salt concentration and used H2 /CO2 (80/20) as energy and carbon source. No growth or methanogenesis was observed with other reduced substrates. This is, to our knowledge, the first obligately halophilic methanogenic bacteria described. Since the phylogenetic nexus between methanogenic and halobacteria seem to be relatively close, the study of this organism could help to understand the relations between these two groups of archae-bacteria.
Key words: Archaebacteria, halophilic methane-producing bacteria.
Resumen
Una nueva bacteria productora de metano y halófila obligada ha sido aislada a partir del sedimento de una salina solar. Este microorganismo fue capaz de multiplicarse a concentraciones salinas del 12 % o inferiores y utilizaba H2/CO, (80/20) como fuente de energía y carbono. Con otros substratos reducidos no se observó ni multiplicación celular ni metanogénesis. Este es el primer caso de bacterias metanogénicas, halófilas obligadas descrito hasta la fecha. Dado que las bacterias halófilas y metanogénicas parecen estar filogeñeticamente bastante relacionadas entre sí, el estudio de este microorganismo podría ayudar a comprender las relaciones existentes entre dos grupos de arquebacterias.
Introduction
Archaebacteria are composed basically of three groups: methane-producing bacteria, thermoacidophilic bacteria and halobacteria which usually live in extreme habitats. The first group is able to grow in a reduced atmosphere using very reduced substrates to form
+ Present adress: Departamento de Microbilogía, Facultad de Medicina, Alicante, Spain. s Present adress: Departament of anaerobic Microbiology, Virginia. Polytechnic Institute, Blacksburg, Virginia 24061, USA. * Corresponding author.
30
CH4 under strictly anaerobic conditions (11). Most of the members of the second group habe been isolated from continental volcanic areas and grow optimally between 70°C or above (8). The last group grows optimally between 25 % and 30 % salt concentration at 40°C (2). Phylogenetically, there are more similarities between methanogens and halobacteria than either of these two groups have with thermoacidophilic bacteria (10).
Very few attempts have been made to isolate halophilic methane-producing bacteria, in spite of the existence of abundant anaerobic populations in highly hypersaline environments (7). Zhilina (13) characterized a halotolerant methanogen isolated from cyano-bacterial mats in Australia. In the present work we have isolated an obligately halophilic methanogen from the anaerobic sediment below the gypsum crust of a multi-pond saltern. Some characteristics of the isolate are described.
Materials and Methods
The samples were collected in sterile hermetical containers from 20 cm under the sediment surface in a multi-pond saltern (Alicante, Spain), the water of the two ponds sampled contained 27 % and 30 % (w/v) total salts, as was shown by weighing the remaining salt after drying the water. The samples were spurged with N2 to maintain anaerobic conditions during their transport. Aliquots of ca. 1 cm^ of the sediment from the bottom of the sample containers were transferred to serum vials (Wheaton Scientific, Millville, N.J.) with 25 ml of the following medium (w/v): NaCl 23.4 %, MgCl21.95 %, MgS04 2.9%, CaCl2 0.11 %, KCl 0.06%, NaHC03 0.02%, NaBr 0.08%. The atmosphere of the vials was H2/CO2(80/20) and they were incubated at 37°C. Methane production was detected by gas chromatography in a Carle 9500. From the vials where methane was detected after incubation, 5 ml were transferred to 160 ml serum vials that contained 45 ml of enrichment medium (w/v): salts as above, 0.02 % yeast extract (Difco), 1 % mineral mix (1) and 0.0001 % resarzurin. All compounds were dissolved and the pH adjusted to 6.5. The medium was boiled prior to inoculation to remove O 2. The vials were incubated at 37°C and checked twice a day for methane production. To isolate pure cultures, serial dilutions were carried out from 10'' to 10" and colonies were isolated by the roll-tube technique (3) with the same medium as in the enrichment supplemented also with vancomycin (100 mg/L) to inhibit the growth of non-methanogenic organisms, and agar 2 % (w/v). Colonies were picked with a bent, sterile Pasteur pipette. The plugs of agar containing the colonies were transferred to 50 ml liquid media of the same composition. Part of the colony was examined with a Zeiss Universal Microscope equipped with an epi-illuminant ultraviolet lamp and a xlOO Neofluor objetive lens to detect the F 420 coenzyme (4). Aliquots 2 ml of the liquid culture were transferred to 4 serum vials with 0.02 % (w/v) yeast extract, 1 % (w/v) mineral mix, 0.0001 % (w/v) resarzurin and NjS 0.025 % (w/v) containing: 50 mM trimethylamine, 50 mM sodium formate or 50 mM sodium acetate (Sigma) under N2/CO2 (80/20) atmosphere and H2/CO2 (80/20). All the substrates were tested with a total salt concentration of 30 %. Different salt concentrations (12 %, 17 %, 25 %, 30 %) were assayed with a medium containing (w/v): 0.02 % yeast extract, 1 % mineral mix, 0.0001 % resarzurin, 0.025 % Na2S and H2/CO2 (80/20) incubated at 40°C. Diferent temperatures (20°, 30°, 37°, 40°) were also assayed with a medium containing (w/v): 0.02 % yeast extract, 1 %
31
mineral mix, 0.0001 % resarzurin, 0.025 % Na2S, 30 % salt concentration and H2/CO2 <80/20).
The growth was followed measuring the total protein content (9) in a Beckman DU-7 spectrophotometer and measuring also the increase of methane.
For scanning electron microscopy examination of the cells, they were collected on polycarbonate membrane filters and fixed with 2 % glutaraldehyde. The specimen was then placed in a small vial and with a Pasteur pipette all the liquid was removed and replaced with ca. 2 ml of acidulated 2,2-dimethoxypropane for 5 minutes. The 2,2-dimethoxypropane was replaced with 100 % ethanol dried over anhydrous CuS04then the ethanol was replaced with liquid CO 2. The filter was then placed on a stub and observed in a Philips P-SEM scanning microscope.
Results and discussion
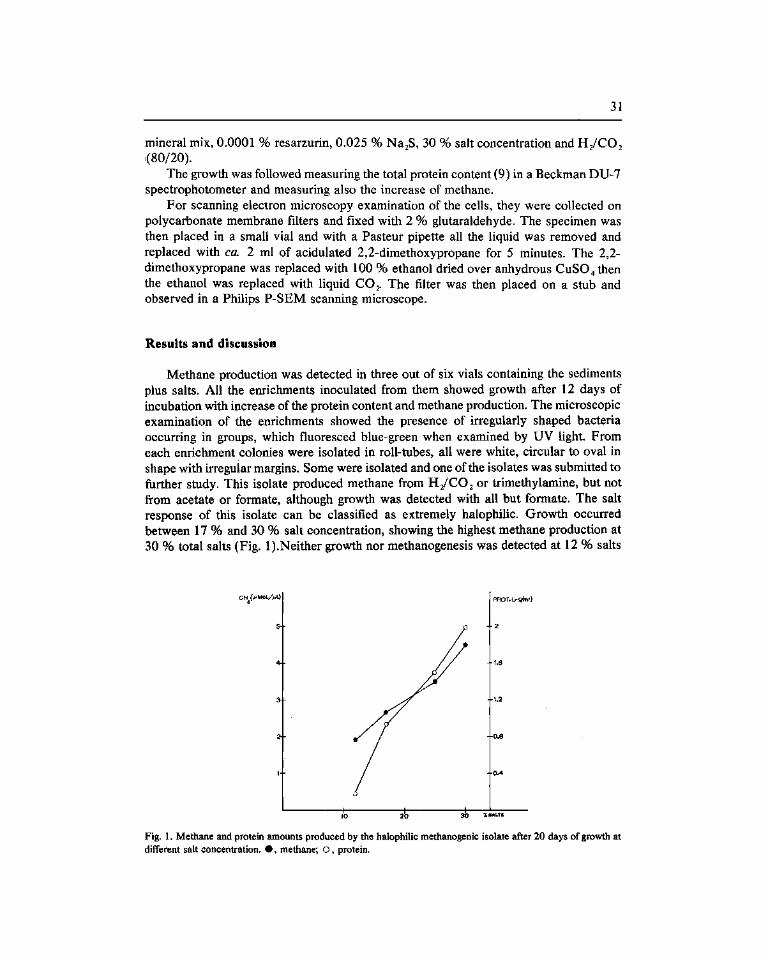
Methane production was detected in three out of six vials containing the sediments plus salts. All the enrichments inoculated from them showed growth after 12 days of incubation with increase of the protein content and methane production. The microscopic examination of the enrichments showed the presence of irregularly shaped bacteria occurring in groups, which fluoresced blue-green when examined by UV light. From each enrichment colonies were isolated in roll-tubes, all were white, circular to oval in shape with irregular margins. Some were isolated and one of the isolates was submitted to fiirther study. This isolate produced methane from H2/CO2 or trimethy lamine, but not from acetate or formate, although growth was detected with all but formate. The salt response of this isolate can be classified as extremely halophilic. Growth occurred between 17 % and 30 % salt concentration, showing the highest methane production at 30 % total salts (Fig. 1).Neither growth nor methanogenesis was detected at 12 % salts
CH f/'MOl./a.) PROT.(/^ml)
Fig. 1. Methane and protein amounts produced by the halophilic methanogenic isolate after 20 days of growth at different salt concentration. • , methane; O, protein.

32
or below. Optimal growth and methane production occurred at 40°C (Fig. 2), although production of methane was also detected at the other temperatures tested. Under all circumstances, growth was relatively slow compared with other methanogenic bacteria.
CH4(^mo^^L)
5+
3 6 9 12 15 18 21 t{days)
Fig. 2. Methane production at different temperatures of the halophihc methanogenic isolate. • , 40°C; O, 37 C; D, 30°C; • , 2 0 ° C .
Fig. 3. Clumps of the halophilic methanogenic isolate attached to a piece of agar.
Morphologically this organism has been shown to be very pleomorphic forming clumps of cells (Fig. 3) which were very small, being in general under 1 /xm. Fluorescence microscopy showed the presence of F 420 in the cells, which is an unique characteristic in methanogens (4).
33
Very little is known about the anaerobic microflora of hypersaline environments, although it is clear that up to considerably high concentrations there exist abundant anaerobic populations in the sediments of hypersaline ponds and lakes (5, 7, 12). The presence of methanogens was also to be expected. However, the existence of halophilic methanogens represents an interesting finding from a phylogenetic point of view. It has been proposed that halobacteria are related to methanogens (10), therefore our isolates could belong to a group with certain intermediate characteristics.
Our results leave little doubt that our isolate is an extremely halophilic methanogenic bacterium. Studies are under way to obtain a proper taxonomic description.
Bibliografía
1. Balch, W.E.; Fox, G.E.; Magrum, C.J.; Woese, C.R., and Wolfe, R.S. (1979) Réévaluation of unique biological group. Microbiol. Rev. 43, 260-296.
2. Gibbons, N.E, (1969) Isolation, growth and requirements of halophilic bacteria. In: J.R. Norris and D.V . Ribbons (eds.). Methods in Microbiology.vol. 4B, pp. 169-183. Academic Press, New York.
3. Hungate, R.E. (1969) A roll tube method for cultivation of strict anaerobes. In: J.R. Norris and D.W. Ribbons (eds.). Methods in Microbiology, vol. 3B. pp. 117-132 Academic Press, New York.
4. Mink, R.W. and Dugan, P.R. (1977) Tentative identification of methanogenic bacteria by fluorescence microscopy. Appl. Environ. Microbiol. 33, 713-717.
5. Oren, A. (1983) Clostridium lortetii, sp. nov., a halophilic obHgatory anaerobic bacterium producing endospores with attached gas vacuoles. Arch. Microbiol. 136, 42-48.
6. Rodriguez-Vaiera, F.; Ruiz-Berraquero, F., and Ramos-Cormenzana, A. (1981) Characteristic of the heterotrophic bacterial populations in hypersaline environments of diffefent salt concentrations. Microb. Ecol. 7, 235-243.
7. Rodriguez-Vaiera, F.; Ventosa, A.; Juez, G., and Imhoff, J.F. (1985) Variation of environmental features and microbial population with salt concentrations in a multi-pond salterns. Microb. Ecol. 11. (in press).
8. Stetter, K.O. ( 1982) Ultrathin mycelia-forming organisms from submarine volcanic areas having an optimum growth temperature of 105°C. Nature 300, 258-260.
9. Vernon, F.; Kalb, J.R., and Bernlohr, R.W. (1977) A new spectrophotometric assay for protein in cell extracts. Anal. Biochem. 82, 362-371.
10. Woese, C.R. (1982) Archaebacteria and cellular origins: An overview. Zbl. Bakt. I. Abt. Orig. C3, 1-17. 11. Zeikus, J.G. (1977) The Biology of methanogenic bacteria. Bacteriol. Rev. 41, 514-541. 12. Zeikus, J.G.; Hegge, P.W.; Thompson, T.E.; Phelps, T.J., and Lagworthy, T.A. (1983) Isolation and
description oï Haloanaerobium praevaleus gen. an sp. nov., and obligately anaerobic halophile common to Great Salt Lake sediments. Current Microbiol. 9, 225-235.
13. Zhilina. T.N. (1983) New obligate halophilic methane-producing bacterium (In Russian, with EngUsh summary). Microbiology 32. 375-382.
Microbiologia 1 (1985), 35-41 SEM
Curación fenotípica de Streptococcus pneumoniae tratado con amidasa inducida por el bacteriófago Dp-1
Pedro García*, Ernesto García, Concepción Ronda y Rubens López
Instituto de Inmunología y Biología Microbiana, Velazquez, 144 - 28006 Madrid - España
Summary
A phage-associated murein hydrolase activity (PAL) induced in an autolysis-defective mutant oï Streptococcus pneumoniae infected with the bacteriophage Dp-1 has been recently isolated and purified to electrophoretic homogeneity as well as biochemically characterized as an e«¿/o-N-acetyl-muramyl-l^alanine amidase (1 ,3 , 4). The PAL and the inactive form (E-form) of the host cell autolysin show a remarkable biochemical similarity, although they differ in their immunological characteristics. The PAL was adsorbed onto a live, defective mutant of pneumococcus (cwl) and such cells reverted to the wild type phenotype («cured» cells) in some important characteristics present in the wild type strain (R6), as: i) lysis of the culture in the stationary phase, ii) protoplast formation by hypertonic sucrose, and iii) bacteriolytic response against the penicillin in contrast with the bacteriostatic response of the «non-cured» cwl. The adsorbed enzyme segregates during growth of the «cured» cells. Our results demonstrate that PAL acts in the phenotypically «cured» cells in a similar way to that previously described for the host enzyme, and also confirm the finding that the autolysins play a direct role in the irreversible effects produced in S. pneumoniae by the betalactamic antibiotics.
Key words: Phage-induced amidase, pneumococcus, phenotypical curing.
Resumen
La PAL es una enzima lítica inducida por el bacteriófago Dp-1 en un mutante de Streptococcus pneumoniae. Esta enzima ha sido recientemente aislada, purificada a homogeneidad electrorética y caracterizada bioquímicamente como una endo N-acetil-muramil-L-alanil amidasa (1, 3, 4). La PAL posee una gran semejanza bioquímica con la autolisina de la célula huésped (forma E) pero se pueden diferenciar entre sí inmunológicamente. La PAL, al igual que la amidasa de neumococo, se adsorbe a un mutante de neumococo (cwl) que carece de autolisina y las células así tratadas (células «curadas») revierten al fenotipo de la cepa salvaje (R6) en una serie de propiedades tales como: i) lisis del cultivo en la fase estacionaria, ii) formación de protoplastos cuando las células se resuspenden en presencia de altas concentraciones de sacarosa y iii) recuperación de la respuesta lítica frente a la penicilina. La enzima adsorbida a la célula se
A quién se dirigirá la correspondencia.
36
segrega en la descendencia celular durante la multiplicación del cultivo. Los resultados demuestran que la enzima inducida por el bacteriófago Dp-1 se comporta en las células fenotípicamente «curadas» de forma similar a la enzima E y se confirma, de forma directa, el papel de las autolisinas en los procesos irreversibles inducidos en neumococo por los antibióticos beta-lactámicos.
Introducción
Las autolisinas son enzimas que se encuentran ampliamente distribuidas en la naturaleza, que hidrolizan uniones específicas de los peptidoglicanos de la pared celular. En Streptococcus pneumoniae se ha descrito y purificado a homogeneidad electroforética (5) una sola autolisina, la N-acetil-muramil-L^alanil amidasa, que interviene en una serie de interesantes fenómenos biológicos como son la lisis bacteriana al final de la fase estacionaria de multiplicación, los procesos irreversibles (lisis y muerte celular) que se desencadenan al tratar estos microorganismos con antibióticos beta-lactámicos, la transformación bacteriana, etc. (14). Sin embargo, aunque se ha postulado que la autolisina de neumococo interviene en la separación de las células hijas, mutantes que carecen casi por completo de autolisina (lyt") o células en las cuales se ha reemplazado la colina por etanolamina en su pared celular y que carecen totalmente de autolisina en su forma activa (forma C) son capaces de multiplicarse sin presentar aparentemente grandes cambios en su desarrollo fisiológico. De aquí que recientemente se haya puesto en discusión el papel de las autolisinas en células que se multiplican en medios normales (15). En 1977, se demostró que la amidasa de neumococo (11) también interviene en la liberación de la descendencia fágica en células infectadas con el bacteriófago Dp-1. El hecho de que en mutantes lyt" infectados con Dp-1 también se podían dar ciclos líticos productivos nos llevó al aislamiento y purificación de una nueva amidasa (PAL) que ha sido recientemente purificada a homogeneidad electroforética (1, 3). Asimismo, hemos demostrado que la forma inactiva (forma E) de la autolisina de neumococo y la PAL son muy similares desde el punto de vista de su composición química pero que se pueden diferenciar entre sí por criterios inmunológicos y por ciertas propiedades químicas (4), como es el hecho de que la actividad de la PAL se estimula en presencia de agentes reductores.
Por otra parte se ha visto que la autoUsina purificada de la célula huésped podía dar lugar en células lyt" a un interesante fenómeno denominado «curación fenotípica» que hace que tales mutantes «reviertan» temporalmente al fenotipo salvaje (16, 17). Con el fin de contribuir a un mejor conocimiento de la actividad de las autolisinas en neumococo en el presente trabajo investigamos si la amidasa inducida durante la infección fágica puede desempeñar en los mutantes lyt~ un papel semejante al de la enzima E.
Materiales y Métodos
Bacterias, bacteriófagos y medios de cultivo. S. pneumoniae cepa R6 procede de la cepa R36 A, cepa salvaje, de la colección de la
Universidad Rockefeller. Cwl es un mutante de R6 defectivo en la autolisina presente en la cepa salvaje (7). El bacteriófago Dp-1 ha sido descrito en trabajos anteriores (8), así como la obtención y purificación de la enzima PAL (1,3). El medio sintético (medio C) empleado para cultivar S. pneumoniae ha sido descrito anteriormente al igual que la preparación de la autolisina (5, 13).
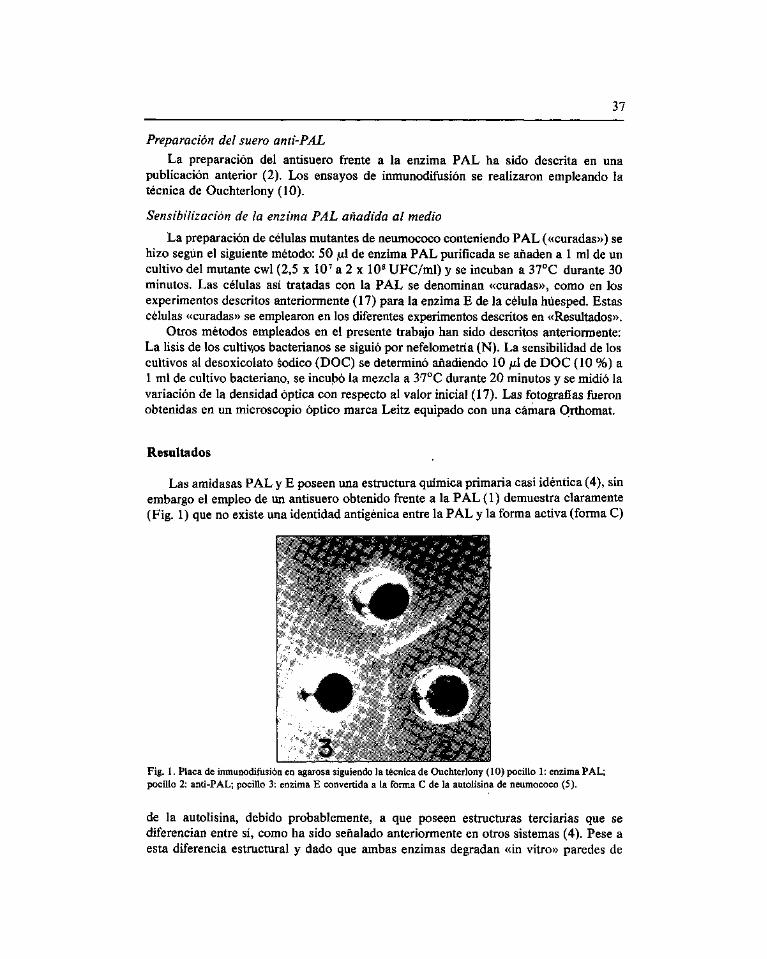
37
Preparación del suero anti-PAL
La preparación del antisuero frente a la enzima PAL ha sido descrita en una publicación anterior (2). Los ensayos de inmunodifusión se realizaron empleando la técnica de Ouchterlony (10).
Sensibilización de la enzima PAL añadida al medio
La preparación de células mutantes de neumococo conteniendo PAL («curadas») se hizo según el siguiente método: 50 /xl de enzima PAL purificada se añaden a 1 mi de un cultivo del mutante cwl (2,5 x 10^ a 2 x 10« UFC/ml) y se incuban a 37°C durante 30 minutos. Las células así tratadas con la PAL se denominan «curadas», como en los experimentos descritos anteriormente (17) para la enzima E de la célula huésped. Estas células «curadas» se emplearon en los diferentes experimentos descritos en «Resultados».
Otros métodos empleados en el presente trabajo han sido descritos anteriormente: La lisis de los cultiyos bacterianos se siguió por nefelometría (N). La sensibilidad de los cultivos al desoxicolato sódico (DOC) se determinó añadiendo 10 jitl de DOC (10 %) a 1 mi de cultivo bacteriano, se incubó la mezcla a 37°C durante 20 minutos y se midió la variación de la densidad óptica con respecto al valor inicial (17). Las fotografías fueron obtenidas en un microscopio óptico marca Leitz equipado con una cámara Orthomat.
Resultados
Las amidasas PAL y E poseen una estructura química primaria casi idéntica (4), sin embargo el empleo de un antisuero obtenido frente a la PAL (1) demuestra claramente (Fig. 1) que no existe una identidad antigénica entre la PAL y la forma activa (forma C)
•;¥'^://
w ^Hf Fig. 1. Placa de inmunodifusión en agarosa siguiendo la técnica de Ouchterlony (10) pocilio 1: enzima PAL; pocilio 2: anti-PAL; pocilio 3: enzima E convertida a la forma C de la autolisina de neumococo (5).
de la autolisina, debido probablemente, a que poseen estructuras terciarias que se diferencian entre sí, como ha sido señalado anteriormente en otros sistemas (4). Pese a esta diferencia estructural y dado que ambas enzimas degradan «in vitro» paredes de
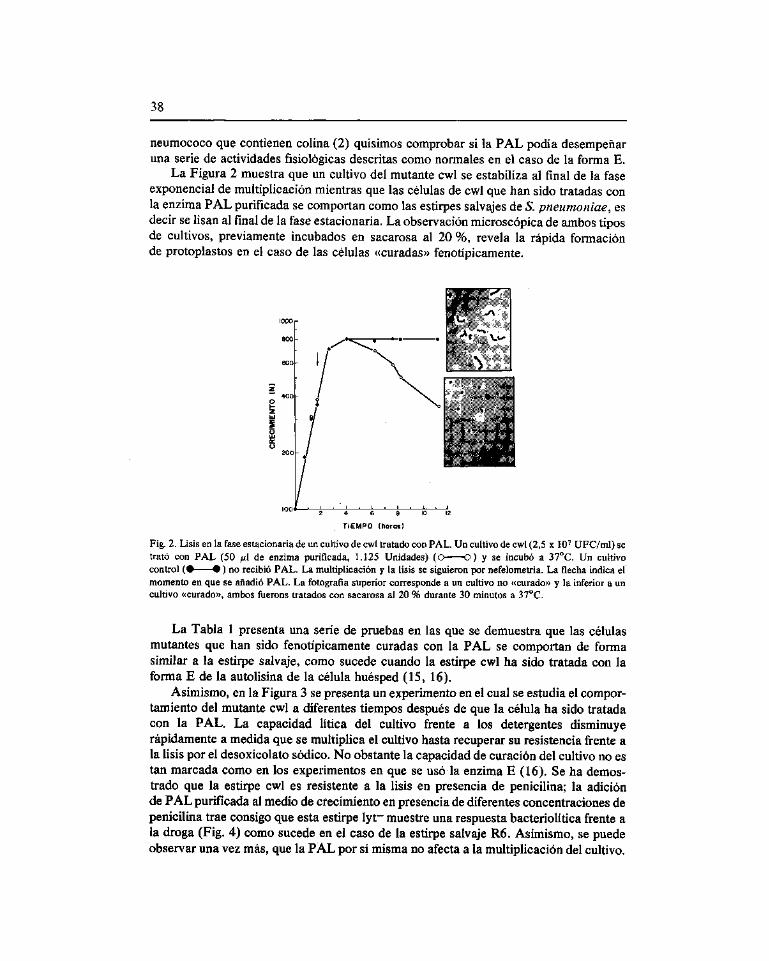
38
neumococo que contienen colina (2) quisimos comprobar si la PAL podía desempeñar una serie de actividades fisiológicas descritas como normales en el caso de la forma E.
La Figura 2 muestra que un cultivo del mutante cwl se estabiliza al final de la fase exponencial de multiplicación mientras que las células de cwl que han sido tratadas con la enzima PAL purificada se comportan como las estirpes salvajes de S. pneumoniae, es decir se lisan al final de la fase estacionaria. La observación microscópica de ambos tipos de cultivos, previamente incubados en sacarosa al 20 %, revela la rápida formación de protoplastos en el caso de las células «curadas» fenotípicamente.
TIEMPO (horas)
Fig. 2. Lisis en la fase estacionaria de un cultivo de cwl tratado con PAL. Un cultivo de cwl (2,5 x lO'' UFC/ml) se trató con PAL (50 /xl de enzima purificada, 1.125 Unidades) (O O) y se incubó a 37°C. Un cultivo control ( • • ) no recibió PAL. La multiplicación y la lisis se siguieron por nefelometría. La flecha indica el momento en que se añadió PAL. La fotografía superior corresponde a un cultivo no «curado» y la inferior a un cultivo «curado», ambos fuerons tratados con sacarosa al 20 % durante 30 minutos a 37°C.
La Tabla 1 presenta una serie de pruebas en las que se demuestra que las células mutantes que han sido fenotípicamente curadas con la PAL se comportan de forma similar a la estirpe salvaje, como sucede cuando la estirpe cwl ha sido tratada con la forma E de la autolisina de la célula huésped (15, 16).
Asimismo, en la Figura 3 se presenta un experimento en el cual se estudia el comportamiento del mutante cwl a diferentes tiempos después de que la célula ha sido tratada con la PAL. La capacidad lítica del cultivo frente a los detergentes disminuye rápidamente a medida que se multiplica el cultivo hasta recuperar su resistencia frente a la lisis por el desoxicolato sódico. No obstante la capacidad de curación del cultivo no es tan marcada como en los experimentos en que se usó la enzima E (16). Se ha demostrado que la estirpe cwl es resistente a la lisis en presencia de penicilina; la adición de PAL purificada al medio de cíecimiento en presencia de diferentes concentraciones de penicilina trae consigo que esta estirpe lyt* muestre una respuesta bacteríolítica frente a la droga (Fig. 4) como sucede en el caso de la estirpe salvaje R6. Asimismo, se puede observar una vez más, que la PAL por sí misma no afecta a la multiplicación del cultivo.
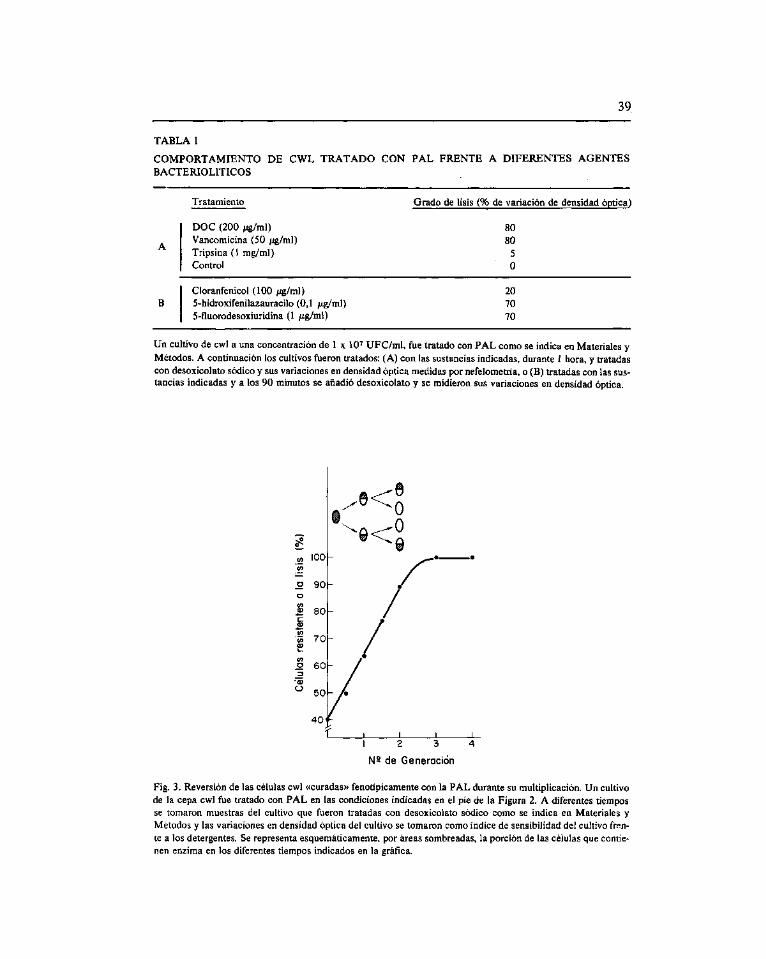
39
TABLA 1
COMPORTAMIENTO DE CWL TRATADO CON PAL FRENTE A DIFERENTES AGENTES BACTERIOLITICOS
Tratamiento Grado de lisis (% de variación de densidad óptica)
DOC (200 jug/ml) Vancomicina (50 jug/ml) Tripsina (1 mg/ml) Control
80 80
5 O
Cloranfenicol (100 jug/ml) 5-hidroxifenilazauracilo (0,1 /xg/ml) 5-fluorodesoxiuridina (1 ju-g/ml)
20 70 70
Un cultivo de cwl a una concentración de 1 x 10^ UFC/ml, fue tratado con PAL como se indica en Materiales y Métodos. A continuación los cultivos fueron tratados: (A) con las sustancias indicadas, durante 1 hora, y tratadas con desoxicolato sódico y sus variaciones en densidad óptica medidas por nefelometría, o (B) tratadas con las sustancias indicadas y a los 90 minutos se añadió desoxicolato y se midieron sus variaciones en densidad óptica.
1 2 3 4
H- de Generación
Fig. 3. Reversión de las células cwl «curadas» fenotípicamente con la PAL durante su multiplicación. Un cultivo de la cepa cwl fue tratado con PAL en las condiciones indicadas en el pie de la Figura 2. A diferentes tiempos se tomaron muestras del cultivo que fueron tratadas con desoxicolato sódico como se indica en Materiales y Métodos y las variaciones en densidad óptica del cultivo se tomaron como índice de sensibilidad del cultivo frente a los detergentes. Se representa esquemáticamente, por áreas sombreadas, la porción de las células que contienen enzima en los diferentes tiempos indicados en la gráfica.
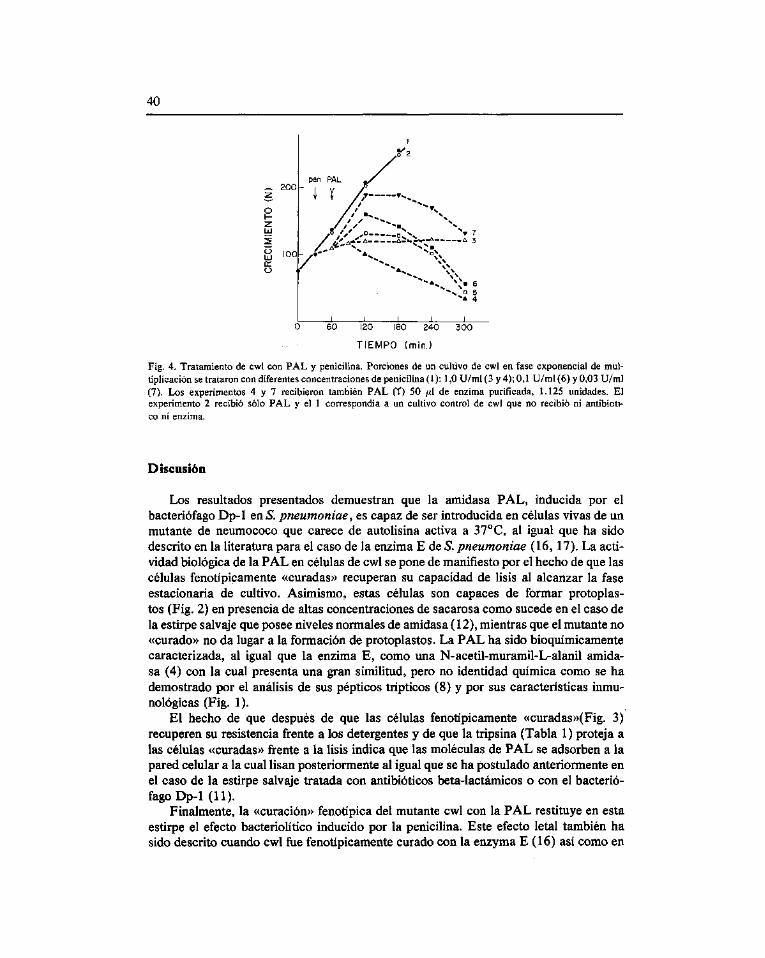
40
o f -
ÍT O
100
N 7 — A 3
\ s a 5
^A 4
60 120 180 240 300
TIEMPO (min.)
Fig. 4. Tratamiento de ewl con PAL y penicilina. Porciones de un cultivo de cwl en fase exponencial de multiplicación se trataron con diferentes concentraciones de penicilina (1 ): 1,0 U/ml (3 y 4); 0,1 U/ml (6) y 0,03 U/ml (7). Los experimentos 4 y 7 recibieron también PAL ff) 50 jul de enzima purificada, 1.125 unidades. El experimento 2 recibió sólo PAL y el 1 correspondía a un cultivo control de cwl que no recibió ni antibióti
co ni enzima.
Discusión
Los resultados presentados demuestran que la amidasa PAL, inducida por el bacteriófago Dp-1 QÍIS. pneumoniae, es capaz de ser introducida en células vivas de un mutante de neumococo que carece de autolisina activa a 37°C, al igual que ha sido descrito en la literatura para el caso de la enzima E de S. pneumoniae (16, 17). La actividad biológica de la PAL en células de cwl se pone de manifiesto por el hecho de que las células fenotípicamente «curadas» recuperan su capacidad de lisis al alcanzar la fase estacionaria de cultivo. Asimismo, estas células son capaces de formar protoplas-tos (Fig. 2) en presencia de altas concentraciones de sacarosa como sucede en el caso de la estirpe salvaje que posee niveles normales de amidasa (12), mientras que el mutante no «curado» no da lugar a la formación de protoplastos. La PAL ha sido bioquímicamente caracterizada, al igual que la enzima E, como una N-acetil-muramil-I^alanil amidasa (4) con la cual presenta una gran similitud, pero no identidad química como se ha demostrado por el anáhsis de sus pépticos trípticos (8) y por sus características inmu-nológicas (Fig. 1).
El hecho de que después de que las células fenotípicamente «curadas»(Fig. 3) recuperen su resistencia frente a los detergentes y de que la tripsina (Tabla 1) proteja a las células «curadas» frente a la lisis indica que las moléculas de PAL se adsorben a la pared celular a la cual lisan posteriormente al igual que se ha postulado anteriormente en el caso de la estirpe salvaje tratada con antibióticos beta-lactámicos o con el bacteriófago Dp-1 (11).
Finalmente, la «curación» fenotípica del mutante cwl con la PAL restituye en esta estirpe el efecto bacteriolítico inducido por la penicilina. Este efecto letal también ha sido descrito cuando cwl fue fenotípicamente curado con la enzyma E (16) así como en
41
S, sanguis tratado con una murein hidrolasa obtenida del bacteriófago Cl (6). Al igual que en este último caso, la principal conclusión que se puede desprender de este tipo de experimentos es que bacterias «tolerantes» a la penicilina adquieren la capacidad de responder frente a estas drogas, como lo hace la estirpe salvaje que contiene niveles normales de amidasa, por la simple «curación» empleando una amidasa de origen fágico. Una vez más estos resultados confirman la participación directa de las enzimas líticas en los procesos irreversibles inducidos por los antibióticos beta-lactámicos (15).
Bibliografia
1. García, P.; García, E.; Ronda, C , and Tomasz, A. (1983) A phage-associated murein hydrolase in Streptococcus pneumoniae infected with bacteriophage Dp-1. J. Gen. Microbiol. 129, 489-497.
2. Garcia, P.; Garcia, E.; Ronda, C; Tomasz, A., and López, R. (1983) Inhibition of lysis by antibody against phage-associated lysin and requirement of choline residues in the cell wall for progeny phage release in Streptococcus pneumoniae. Curr. Microbiol. 8, 137-140.
3. Garcia, P.; López, R.; Ronda, C; Garcia, E., and Tomasz, A. (1983) Mechanism of phage-induced lysis in pneumococci. J. Gen. Microbiol. 129, 479-487.
4. Garcia, P.; Méndez, E.; Garcia, E.; Ronda, C , and López, R. (1984) Biochemical characterization of a murein hydrolase induced by bacteriophage Dp-1 in Streptococcus pneumoniae: Comparative study between bacteriophage-associated lysin and the host amidase. J. Bacteriol. 159, 793-796.
5. Holtje, J.v., and Tomasz, A. (1976) Purification of the pneumococcal N-acetyl-muramyl-I^alanine amidase to biochemical homogeneity. J. Biol. Chem. 251, 4199-4207. •
6. Home, D., and Tomasz, A. (1980) Lethal effect of a heterologous murein hydrolase on penicillin-treated Streptococcus sanguis. Antimicrob. Agents. Chemother. 17, 235-246.
7. Lacks, S. (1970) Mutants of Diplococcus pneumoniae that lack deoxyribonucleases and other activities possibly pertinent to genetic transformation. J. Bacteriol. 101, 373-383.
8. López, R.; Méndez, E.; Garcia, E.; Ronda, C, and Garcia, P. (1984) Autolysins in Streptococcus pneumoniae Host and phage-associated amidases. In: C. Nombela (ed.) Microbial cell wall synthesis and autolysis, pp. 187-194, Elsevier Science Pub. B.V. Amsterdam.
9. López, R.; Ronda, C; Portóles, A., and Tomasz, A. (1977) Properties of «Diplophage»: A lipid-containing bacteriophage. J. Virol. 24, 201-210.
10. Ouchterlony, O., and Nilsson, L.A. (1978) Immunodiffusion and Immunoelectrophoresis. In: D.M. Weir (ed.) Handbook of Experimental Immunology, vol. 1. Blackwell Scientific Publications.
11. Ronda-Lain, C; López, R.; Tapia, A., and Tomasz, A. (1977) Role of the pneumococcal autolysin (murein hydrolase) in the release of progeny bacteriophage and in the bacteriophage-induced lysis of the host cells. J. Virol. 21, 366-374.
12. Seto, H.; López, R., and Tomasz, A. (1975) Cell surface located deoxyribonucleic acid receptors in transformable pneumococci. J. Bacteriol. 122, 1339-1350.
13. Tomasz, A. (1970) Cellular metabolism in genetic transformation of pneumococci: requirement for protein synthesis during induction of competence. J. Bacteriol. 101, 860-871.
14. Tomasz, A. (1979) The mechanism of the irreversible antimicrobial effects of penicillins: how the beta-lactam antibiotics kill and lyse bacteria. Ann. Rev. Microbiol. 33, 113-137.
15. Tomasz, A. (1984) Building and breaking in the cell wall of bacteria - The role for autolysins. In: C. Nombela (ed.) Microbial Cell Wall Synthesis and Autolysis, pp. 3-12. Elsevier Science Pub. B.V. Amsterdam.
16. Tomasz, A., and Waks, S. (1975a) Mechanism of action of penicillin: Triggering of the pneumococcal autolytic enzyme by inhibitors of cell wall synthesis. Proc. Natl. Acad. Sci. USA 72, 4162-4166.
17. Tomasz, A., and Waks, S. ( 1975b) Enzyme replacement in a bacterium: Phenotypic correction by the experimental introduction of the wild type enzyme into a live enzyme defective mutant pneumococcus. Biochem. Biophys. Res. Commun. 65, 1311-1319.
Microbiología 1 (1985), 43-51 SEM
Hiperproducción de L^prolina en Escherichia coli
José Luis García*, Gonzalo González de Buitrago y José Luis Barbero
Departamento de Genética Molecular, Antibióticos, S. A; Bravo Murillo, 38; 28015 Madrid- España.
Summary
The pro A SináproB genes from Escherichia coli have been cloned using the plasmids pBR322 and pBR325 as vectors. The episome F128 (proAB, lac) was used as cloning DNA source. Both genes were firstly located within a 10 kilobases EcoBJ DNA fragment ot the episome. Subcloning experiments showed that both proteins were coded by a 3 kilobases Pstl DNA fragment. Although, the recombinant plasmids containing the proA SLiidproB genes were able to complement the Pro~ phenotype of different .E. coli strains, bacteria harboring these plasmids did not excrete L-proline to the culture medium. Nevertheless, an operon,proAB, able to confer toE. coli cells the property of excreting I^proline, was isolated from an UV-mutant of^l coli E5014 [F'(proAB, lac)] resistant to the L-proline analogue, thioproline. E. coli HBlOl cells transformed with the plasmid pJABP (UV) carrying the mutated proAB operon excreted up to 5 g/1 of I^proline, after 40 hours of fermentation at 37° C in a modified M63 minimal medium. The production of I^proline was not increased when the pro C gene was inserted in the plasmid pJABP (UV). Key words: L-proline biosynthesis, molecular cloning, E. coli.
Resumen
Los genesproA yproB de Escherichia coli han sido clonados en los vectores pBR322 y pBR325. A partir de un mutante - UV de E. coli E5013 [F' (proAB, lac)] resistente a tioprolina, se ha aislado un operón^ro^i? capaz de conferir por transformación a otras células áeE. coli un fenotipo excretor de L-prolina. Las células de^. coli HBIOI transformadas con el plásmido pHABP (UV) excretan al medio de cultivo hasta 5 g/1 de I^prolina. La inclusión del genproC en este plásmido no parece contribuir a la mejora de la producción de I^prolina en estas células.
Introducción
La producción de aminoácidos por fermentación ocupa en la actualidad un importante sector dentro del campo de la biotecnología. Las técnicas clásicas de mutación y selección han constituido durante mucho tiempo las únicas vías de acceso para la mejora
A quien se dirigirá la correspondencia.
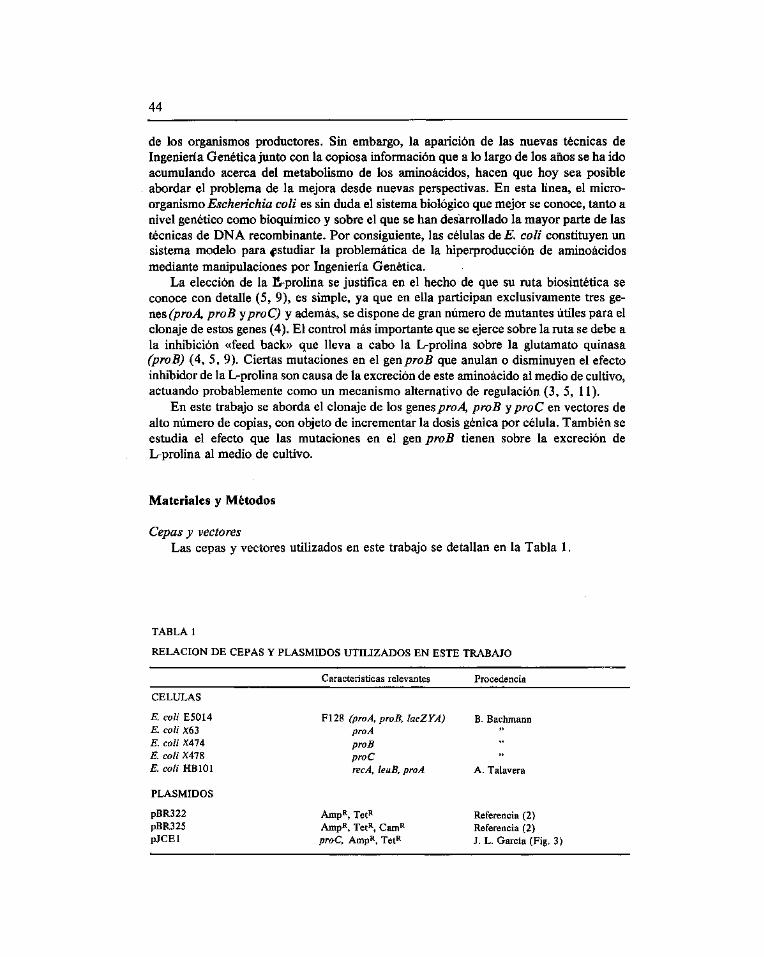
44
de los organismos productores. Sin embargo, la aparición de las nuevas técnicas de Ingeniería Genética junto con la copiosa información que a lo largo de los años se ha ido acumulando acerca del metabolismo de los aminoácidos, hacen que hoy sea posible abordar el problema de la mejora desde nuevas perspectivas. En esta línea, el microorganismo Escherichia coli es sin duda el sistema biológico que mejor se conoce, tanto a nivel genético como bioquímico y sobre el que se han desarrollado la mayor parte de las técnicas de DNA recombinante. Por consiguiente, las células de E. coli constituyen un sistema modelo para |ístudiar la problemática de la hiperproducción de aminoácidos mediante manipulaciones por Ingeniería Genética.
La elección de la E-proHna se justifica en el hecho de que su ruta biosintética se conoce con detalle (5, 9), es simple, ya que en ella participan exclusivamente tres genes (proA proB yproC) y además, se dispone de gran número de mutantes útiles para el clonaje de estos genes (4). El control más importante que se ejerce sobre la ruta se debe a la inhibición «feed back» que lleva a cabo la I^proHna sobre la glutamato quinasa (proB) (4, 5, 9). Ciertas mutaciones en el genproB que anulan o disminuyen el efecto inhibidor de la I^prolina son causa de la excreción de este aminoácido al medio de cultivo, actuando probablemente como un mecanismo alternativo de regulación (3, 5, 11).
En este trabajo se aborda el clonaje de los genes pro A, proB y proC en vectores de alto número de copias, con objeto de incrementar la dosis génica por célula. También se estudia el efecto que las mutaciones en el gen proB tienen sobre la excreción de I^prolina al medio de cultivo.
Materiales y Métodos
Cepas y vectores Las cepas y vectores utilizados en este trabajo se detallan en la Tabla 1.
TABLA 1
RELACIÓN DE CEPAS Y PLASMIDOS UTILIZADOS EN ESTE TRABAJO
Características relevantes Procedencia
CÉLULAS
E. coli E5014 F128 (proA, proB, lacZYA) B. Bachmann E. coli X63 proA E. coli X474 proB E. coli X478 proC E. coli HBIOI recA, leuB, pro A A. Talavera
PLASMIDOS
pBR322 AmpR, Tet^ Referencia (2) pBR325 AmpR, Tet^, Cam^ Referencia (2) PJCEI proC, AmpR, Tet^ J. L. García (Fig. 3)
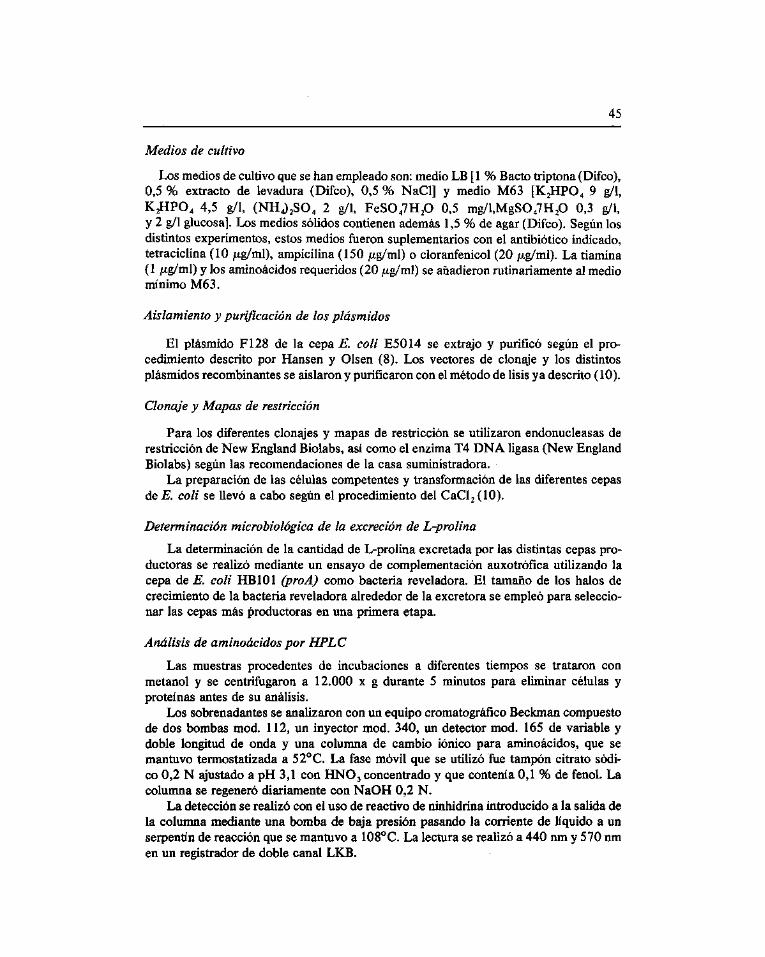
45
Medios de cultivo
Los medios de cultivo que se han empleado son: medio LB [1 % Bacto tríptona (Difco), 0,5 % extracto de levadura (Difco), 0,5 % NaCl] y medio M63 [K2HPO4 9 g/1, K2HPO4 4,5 g/1, (NH4)2S04 2 g/1, FeS047Hp 0,5 mg/l,MgS047Hp 0,3 g/1, y 2 g/1 glucosa]. Los medios sólidos contienen además 1,5 % de agar (Difco). Según los distintos experimentos, estos medios fueron suplementarios con el antibiótico indicado, tetraciclina (10 jug/ml), ampicilina (150 jug/ml) o cloranfenicol (20 /xg/ml). La tiamina (1 /xg/ml) y los aminoácidos requeridos (20 ¡ig/mX) se añadieron rutinariamente al medio mínimo M63.
Aislamiento y purificación de los plásmidos
El plásmido F128 de la cepa E, coli E5014 se extrajo y purificó según el procedimiento descrito por Hansen y Olsen (8). Los vectores de clonaje y los distintos plásmidos recombinantes se aislaron y purificaron con el método de lisis ya descrito (10).
Clonaje y Mapas de restricción
Para los diferentes clonajes y mapas de restricción se utilizaron endonucleasas de restricción de New England Biolabs, así como el enzima T4 DNA ligasa (New England Biolabs) según las recomendaciones de la casa suministradora.
La preparación de las células competentes y transformación de las diferentes cepas de E. coli se llevó a cabo según el procedimiento del CaCl2 (10).
Determinación microbiológica de la excreción de L-prolina
La determinación de la cantidad de L^prolina excretada por las distintas cepas productoras se realizó mediante un ensayo de complementación auxotrófica utilizando la cepa de E, coli HBIOI (proA) como bacteria reveladora. El tamaño de los halos de crecimiento de la bacteria reveladora alrededor de la excretora se empleó para seleccionar las cepas más productoras en una primera etapa.
Análisis de aminoácidos por HPLC
Las muestras procedentes de incubaciones a diferentes tiempos se trataron con metanol y se centrifugaron a 12.000 x g durante 5 minutos para eliminar células y proteínas antes de su análisis.
Los sobrenadantes se analizaron con un equipo cromatográfico Beckman compuesto de dos bombas mod. 112, un inyector mod. 340, un detector mod. 165 de variable y doble longitud de onda y una columna de cambio iónico para ammoácidos, que se mantuvo termostatizada a 52°C. La fase móvil que se utilizó fue tampon citrato sódico 0,2 N ajustado a pH 3,1 con HNO3 concentrado y que contenía 0,1 % de fenol. La columna se regeneró diariamente con NaOH 0,2 N.
La detección se realizó con el uso de reactivo de ninhidrina introducido a la salida de la columna mediante una bomba de baja presión pasando la corriente de líquido a un serpentín de reacción que se mantuvo a 108°C. La lectura se realizó a 440 nm y 570 nm en un registrador de doble canal LKB.
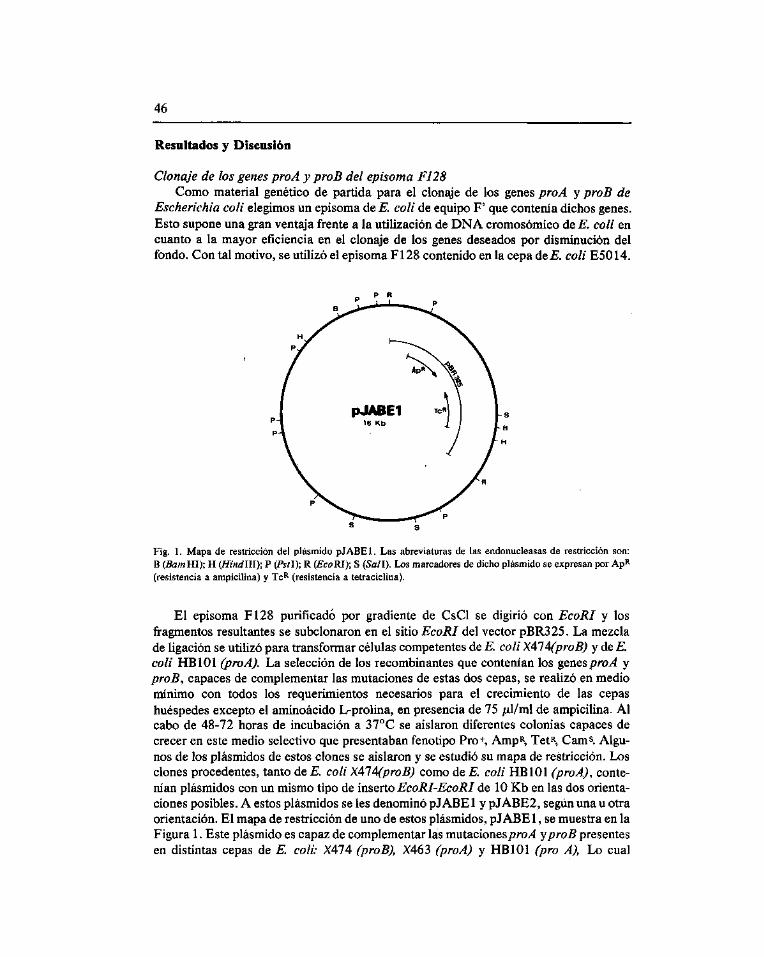
46
Resultados y Discusión
Clonaje de los genes pro A y proB del episoma F128 Como material genético de partida para el clonaje de los genes pro A y proB de
Escherichia coli elegimos un episoma de^". coli de equipo F' que contenía dichos genes. Esto supone una gran ventaja frente a la utilización de DNA cromosómico áeE. coli en cuanto a la mayor eficiencia en el clonaje de los genes deseados por disminución del fondo. Con tal motivo, se utilizó el episoma F128 contenido en la cepa áeE. coli E5014.
Fig. 1. Mapa de restricción del plásmido pJABEl. Las abreviaturas de las endonucleasas de restricción son: B (BamHÍ); H (Hindlll); P (Pstl); R (EcoRI); S (Sail). Los marcadores de dicho plásmido se expresan por Ap^ (resistencia a ampicilina) y Tc^ (resistencia a tetraciclina).
El episoma F128 purificado por gradiente de CsCl se digirió con EcoRI y los fragmentos resultantes se subclonaron en el sitio EcoRI del vector pBR325. La mezcla de ligación se utilizó para transformar células competentes de E. coli X414(proB) y de E. coli HBIOI (pro A). La selección de los recombinantes que contenían los genes pro A y proB, capaces de complementar las mutaciones de estas dos cepas, se realizó en medio mínimo con todos los requerimientos necesarios para el crecimiento de las cepas huéspedes excepto el aminoácido L-prolina, en presencia de 75 jixl/ml de ampicilina. Al cabo de 48-72 horas de incubación a 37°C se aislaron diferentes colonias capaces de crecer en este medio selectivo que presentaban fenotipo Pro+, AmpR, Tet^ Cams. Algunos de los plásmidos de estos clones se aislaron y se estudió su mapa de restricción. Los clones procedentes, tanto de E. coli X414(proB) como de E. coli HBIOI (proA), contenían plásmidos con un mismo tipo de inserto EcoRI-EcoRI de 10 Kb en las dos orientaciones posibles. A estos plásmidos se les denominó pJABEl y pJABE2, según una u otra orientación. El mapa de restricción de uno de estos plásmidos, pJABEl, se muestra en la Figura 1. Este plásmido es capaz de complementar las mutaciones/?roy4 yproB presentes en distintas cepas de E. coli: X474 (proB), X463 (proA) y HBIOI (pro A), Lo cual
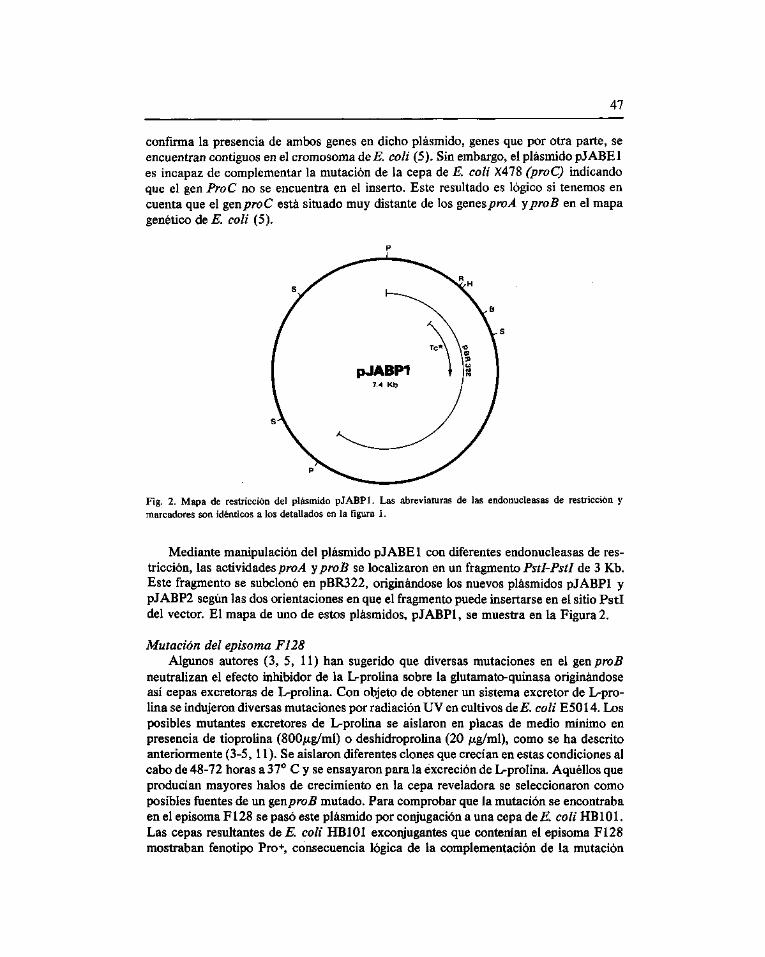
47
confirma la presencia de ambos genes en dicho plásmido, genes que por otra parte, se encuentran contiguos en el cromosoma deiS". coli (5). Sin embargo, el plásmido pJABEl es incapaz de complementar la mutación de la cepa de E. coli X478 (proC) indicando que el gen ProC no se encuentra en el inserto. Este resultado es lógico si tenemos en cuenta que el gen pro C está situado muy distante de los genes ;7ro^ yproB en el mapa genético de^*. coli (5).
Fig. 2. Mapa de restricción del plásmido pJABPl. Las abreviaturas de las endonucleasas de restricción y marcadores son idénticos a los detallados en la figura 1.
Mediante manipulación del plásmido pJABEl con diferentes endonucleasas de restricción, las actividades/?roy4 yproB se locaHzaron en un fragmento Pstl-Pstl de 3 Kb. Este fragmento se subclonó en pBR322, originándose los nuevos plásmidos pJABPl y pJABP2 según las dos orientaciones en que el fragmento puede insertarse en el sitio Pstl del vector. El mapa de uno de estos plásmidos, pJABPl, se muestra en la Figura2.
Mutación del episoma F128 Algunos autores (3, 5, 11) han sugerido que diversas mutaciones en el gen proB
neutralizan el efecto inhibidor de la I^prolina sobre la glutamato-quinasa originándose así cepas excretoras de I^prolina. Con objeto de obtener un sistema excretor de I^pro-lina se indujeron diversas mutaciones por radiación UV en cultivos deE. coli E5014. Los posibles mutantes excretores de I^prolina se aislaron en placas de medio mínimo en presencia de tioprolina (800/xg/ml) o deshidroprolina (20 /xg/ml), como se ha descrito anteriormente (3-5, 11). Se aislaron diferentes clones que crecían en estas condiciones al cabo de 48-72 horas a 37° C y se ensayaron para la excreción de I^prolina. Aquéllos que producían mayores halos de crecimiento en la cepa reveladora se seleccionaron como posibles fuentes de un genproB mutado. Para comprobar que la mutación se encontraba en el episoma F128 se pasó este plásmido por conjugación a una cepa deE. coli HBIOI. Las cepas resultantes de E. coli HBIOI exconjugantes que contenían el episoma F128 mostraban fenotipo Pro+, consecuencia lógica de la complementación de la mutación

48
proA por parte del episoma y además se comportaban como excretoras de I^prolina, lo cual demostraba la suposición anterior.
A continuación, se aisló el plásmido mutado F128 (UV) y el opQvón pro A-pro B se subclonó, empleando las endonucleasas de restricción EcoBJ o Pstl en pBR322 y pBR325. Se transformaron las cepas áeE. coli X463 (proA) yE. coli X414(proB) y los recombinantes se seleccionaron como se ha descrito anteriormente. Se obtuvieron los plásmidos pJABE (UV) y pJABP (UV) en ambas orientaciones cuyos mapas son similares a los de la Figuras 1 y 2, pero en este caso los plásmidos conferían a las cepas receptoras la posibilidad de excretar grandes cantidades de L-prolina. Esto parece indicar que una mutación, probablemente en el genproB, es la causa de la desregulación metabólica en la biosíntesis del aminoácido.
Mutagenizando con radiación UV las cepas no excretoras que contenían los plásmidos pJABE o pJABP y seleccionando las cepas resistentes a tioprolina o deshidro-prolina, se obtuvieron idénticos resultados en cuanto a la excreción de prolina.
Construcción de un plásmido con los genes pro A, proB y proC Con objeto de estudiar cual podría ser el efecto de la hiperproducción de L-prolina si
los tres genes de su ruta biosintética,/7ro^, proB yproC, se clonaban en el mismo vector, se construyó un plásmido de tales características.
Fig. 3. Mapa de restricción del plásmido pJCEl. Las abreviaturas de las endonucleasas de restricción y los marcadores son idénticos a los detallados en la figura 1, junto con los nuevos símbolos: X {Xhol); He {Hindi)', K {Kpniy
Se disponía en nuestro laboratorio de un plásmido denominado pJCEl (Fig. 3) que contiene el gen proC de Klebsiella pneumoniae. El mapa de restricción del inserto EcoBl-Eco^ de 10 Kb es idéntico al que se ha descrito para la región que contiene el gen pro C del cromosoma de E. coli (1, 6, 7). Por otra parte, este plásmido es capaz de complementar el fenotipo Pro- de la cepa E. coli X478 (proC) pero no el de las cepas con mutaciones en los genes pro A oproB. Por todo ésto, se puede considerar que este gen proC es perfectamente funcional enE. coli.

49
Para construir el plásmido que contiene los tres genes se insertó el fragmento BamHl-BamUl de 4.3 Kb del plásmido pJACEl (Fig. 3) en el sitio Bamlll del plásmido pJABPl (UV) (Fig. 2). Así resultó el plásmido pJABC (Fig. 4) que es capaz de complementar las mutaciones en los gQviQS proA, proB y proC en las cepas correspondientes de^". coli. Además el plásmido pJABC confiere a estas cepas la propiedad de excretar L-prolina ya que se ha construido a partir del plásmido pJABPl (UV), el cual, como ya se ha comentado anteriormente, poseía esta propiedad.
Fig. 4. Mapa de restricción el plásmido pJABC conteniendo los genes pro A, proB (UV) de^". coli y el genproC de Klebsiella pneumoniae. Las abreviaturas de las endonucleasas de restricción y marcadores son idénticas a las detalladas en las figuras 1 y 3.
Valoración cuantitativa de la excreción de L-prolina Además del método microbiológico se realizó la valoración de L-prolina excretada al
medio de cultivo mediante un método basado en su separación por HPLC. Dicho procedimiento permite además cuantificar la excreción de L-glutamato, que es en definitiva el metabolito primario en la síntesis de I^prolina.
Se observó que la excreción de L-prolina es absolutamente dependiente del tipo de medio de cultivo utilizado en la fermentación, ya que la cantidad de L-prolina excretada en medios de cultivo complejos, como LB, es prácticamente despreciable y a medida que la complejidad del medio disminuye, la cantidad de L-prolina excretada aumenta. Por tanto, además de los factores habituales de control, pH, aireación, temperatura, etc., parece ser una condición indispensable multipHcar las cepas excretoras en medios mínimos, a los cuales se les puede adicionar pequeñas cantidades de fuentes de carbono y nitrógeno orgánico como extracto de levadura y casaminoácidos para aumentar la capacidad de multipHcación bacteriana En la Tabla 2 se reflejan las cantidades excretadas de I^prolina que se han obtenido con distintas cepas y diferentes plásmidos a las 40 horas de fermentación a 37°C en un medio que contenía glucosa 40 g/1, (NH4)2S04 30 g/1, KH2PO4 4,5 g/1, K2HPO4 9 g/1, MgS04 mp 0,3 g/1, FeS04 H^O 0,5 mg/1, extracto de levadura 0,5 g/1, tiamina 1 mg/1, tamponado con tris-maleato 0,1M pH 7,5.
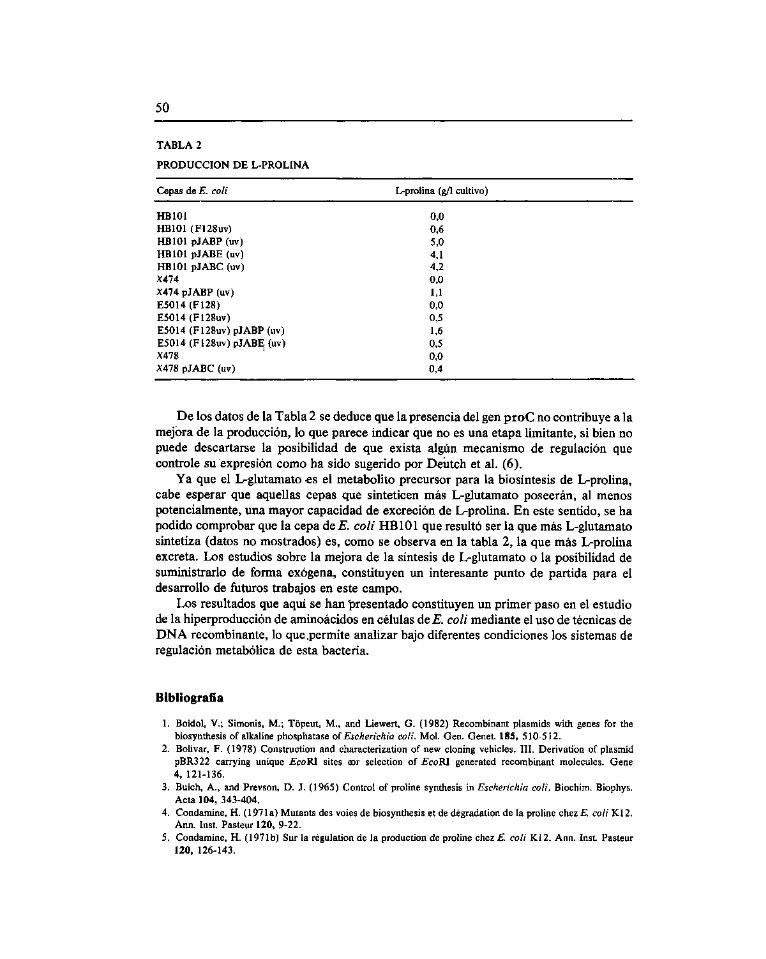
50
TABLA 2
PRODUCCIÓN DE L-PROLINA
Cepas de E. coli L-prolina (g/1 cultivo)
HBIOI 0,0 HBIOI (F128uv) 0,6 HBIOI pJABP (uv) 5,0 HBIOI pJABE (uv) 4,1 HBIOI pJABC (uv) 4,2 X474 0,0 X474 pJABP (uv) 1,1 E5014(F128) 0,0 E5014(F128uv) 0,5 E5014 (F128uv) pJABP (uv) 1,6 E5014 (F128uv) pJABE (uv) 0,5 X478 ' 0,0 X478 pJABC (uv) 0,4
De los datos de la Tabla 2 se deduce que la presencia del gen proC no contribuye a la mejora de la producción, lo que parece indicar que no es una etapa limitante, si bien no puede descartarse la posibilidad de que exista algún mecanismo de regulación que controle su expresión como ha sido sugerido por Deiitch et al. (6).
Ya que el I^glutamato es el metaboHto precursor para la biosíntesis de L-prolina, cabe esperar que aquellas cepas que sinteticen más L-glutamato poseerán, al menos potencialmente, una mayor capacidad de excreción de L-prolina. En este sentido, se ha podido comprobar que la cepa áeE. coli HBIOI que resultó ser la que más L-glutamato sintetiza (datos no mostrados) es, como se observa en la tabla 2, la que más L-prolina excreta. Los estudios sobre la mejora de la síntesis de L-glutamato o la posibilidad de suministrarlo de forma exógena, constituyen un interesante punto de partida para el desarrollo de futuros trabajos en este campo.
Los resultados que aquí se han 'presentado constituyen un primer paso en el estudio de la hiperproducción de aminoácidos en células áeE. coli mediante el uso de técnicas de DNA recombinante, lo que .permite anaUzar bajo diferentes condiciones los sistemas de regulación metabólica de esta bacteria.
Bibliografía
1. Boidol, V.; Simonis, M.; Tópeut, M., and Liewert, G. (1982) Recombinant plasiîiids with genes for the biosynthesis of alkaline phosphatase of Escherichia coli. Mol. Gen. Genet. 185, 510-512.
2. Bolivar, F. (1978) Construction and characterization of new cloning vehicles. III. Derivation of plasmid pBR322 carrying unique EcoBJ sites eor selection of EcoKl generated recombinant molecules. Gene 4, 121-136.
3. Buich, A., and Prevson, D. J. (1965) Control of proline synthesis in Escherichia coli. Biochim. Biophys. Acta 104, 343-404.
4. Condamine, H. (1971a) Mutants des voies de biosynthesis et de dégradation de la proline chezE. coli Kl2. Ann. Inst. Pasteur 120, 9-22.
5. Condamine, H. (1971b) Sur la régulation de la production de proline chez E. coli Kl 2. Ann. Inst. Pasteur 120, 126-143.
51
6. Deutch, A. H.; Smith, C. J.; Roshlow, K. E., and Kretschemer, P. J. (1982) Escherichia coli Ai-proline-4 carboxylate: gene sequence, protein overproduction and purification. Nucleic Acid Research 10, 7701-7714.
7. Hadley, R. G.; Mu, M.; Timmons, M.; Yun, K., and Deonier, R. C. (1983) A partial restriction map of the proA-purE region of the Escherichia coli K12 chromosome. Gene 22, 281-287.
8. Hansen, J. B., and Olsen, R. H. (1978) Isolation of large bacterial plasmids and characterization of the P2 incompatibility group plasmid pMGl and pMG5. J. Bacteriol. 135, 227-238.
9. Hayner, D. J., and Leisinger, T. H. (1980) The gene-enzyme relationships of proline biosynthesis in Escherichia coli. J. Gen. Microbiol. 118, 287-293.
10. Maniatis, T.; Fritsch, E. F., and Sambrook, J. (1982) Molecular cloning. A laboratory manual. Cold Spring Harbor laboratory. Cold Spring Harbor. New York.
11. Tristram, H., and Thurston, C. F. (1966) Control of proline biosynthesis by proline and proline analogues. Nature 212, 74-75.
Microbiología 1 (1985), 53-65 SEM
A survey of buoyant density of microorganisms in pure cultures and natural samples
Ricardo Guerrero i*, Carlos Pedrós-Alió i, Thomas M. Schmidt2, and Jordi Mas^
^ Department of Microbiology and Institute for Fundamental Biology, Autonomous University of Barcelona, Bellaterra (Barcelona) - Spain.
^ Department of Microbiology, Ohio State University, Columbus, Ohio 43210 - U.S.A.
Summary
Values of buoyant density of microorganisms reported in literature are widely divergent because of techniques used. Many of these involve centrifugation in density gradients formed by substances with high osmolarity which dehydrate the cells. In order to better understand the ranges of variation of density of microbial cells several approaches were taken. Firstly, samples from several natural aquatic habitats were taken and the densities of the microorganisms present determined. Secondly, experiments were performed with selected microorganisms to maximize density changes by forcing them to accumulate intracytoplasmic inclusions of dense materials or to loose their capsules. Finally, the relevant literature was reviewed. It could be demonstrated that most microorganisms have a density around 1.080 pg jitm- when measured in low osmolarity media such as Percoll. However, many species are able to modify their density by as much as 7 % (for instance, from 1.097 to 1.022 pg /xm- in Thiocapsa roseopersicina, and similar variations in other bacteria), by incorporating substances into inclusions (sulfur, carbon, phosphorous storage materials, etc.), or by making capsules and/or gas vesicles. The relevance of buoyant density determinations for several aspects of microbial ecology and physiology is discussed. Key words: Buoyant density, gradient centrifugation, microbial ecology.
Resumen
Los valores de densidad de flotación que pueden encontrarse en la bibliografía referentes a distintos microorganismos abarcan un ampho espectro. Ello se debe principalmente a la diversidad de técnicas utilizadas. La mayoría de éstas implican centrifugaciones en gradientes de densidad formados por substancias de elevada osmolaridad, que deshidratan en mayor o menor grado las células. Con el fin de profundizar en el conocimiento de los márgenes de variación de la densidad en las células microbianas, se plantearon tres enfoques distintos. En primer lugar, se midió la densidad de organismos en distintas muestras procedentes de habitats acuáticos naturales. En segundo lugar, se realizaron experimentos con algunos microorganismos con el fin de forzarlos a variar su densidad mediante la acumulación de inclusiones intracitoplasmáticas de materiales
* Corresponding author.
54
densos o mediante la pérdida de sus cápsulas. Por último, se hizo una revisión de la bibliografía pertinente. Se pudo demostrar que casi todos los microorganismos tienen densidades próximas a 1.080 pg ixm-\ siempre que se mida ésta en medios de baja osmo-laridad como el Percoll. En cambio, dentro de una misma especie la densidad puede variar hasta un 7 % (por ejemplo, desde 1.097 a 1.022 pg ¡im-^ en Thiocapsa roseoper-sicina, y variaciones comparables en otras especies) cuando se incorporan materiales densos en forma de inclusiones (materiales de reserva de fósforo, carbono, azufre, etc.) o cuando se fabrican cápsulas y vesículas de gas. Finalmente, se discute la importancia que tienen las determinaciones de la densidad de flotación en diversos aspectos de la ecología y de la fisiología microbianas.
Introduction
Density is an important property of microorganisms which until now has not received much attention. All the available information has been gathered mostly in the last ten years. The values reported range from a minumum of 1.035 pg jum- in some soil bacterial isolates (5) to a maximum of 1.300 pg /xm- ior Arthrobacterglobiformis (34). However, the substantial number of different treatments used in density determinations suggests that the wide range of densities found is not due to real differences among species.
Aside from a few gravimetric or theoretical calculations (27), most techniques rely on centrifugation in density gradients. Centrifugations in high osmolarity ionic media, such as cesium chloride or sodium bromide, are likely to produce dehydration of the cells and, as a consequence, an increase in their density. Media such as sucrose or sodium metrizoate, which have lower osmolarities, will probably produce a less dramatic effect, but the values of buoyant density obtained with these compounds will still be too high to be representative of the actual density of the cells.
On the other hand, when results obtained with a single technique are compared, the range of variation is very narrow. Especially, after the introduction of centrifugation media with low ionic strength and osmolarity (colloidal silica, high molecular weight carbohydrates) the range has been reduced to a narrow interval spanning approximately from 1.07 pgiLim-3to 1.11 pgiitm-3(17, 19, 24, 37).
We contend that this apparent homogeneity, however, cannot be considered as representative of the real range of densities of microorganisms in natural habitats, since most of the experiments have ^een performed under laboratory conditions not favouring large changes in buoyant density.
The present study is an attempt to clarify this matter. First we measured, with the best available technique, densities of microorganisms from several environments to find out the range of variation in nature. Second, we used pure cultures of a variety of microorganisms to ascertain variability of density within a single species under physiologically different conditions. Finally, we pooled avaüable information on density of microorganisms scattered in all the relevant literature and tried to discern patterns of densities among the diverse techniques, authors, and organisms used.
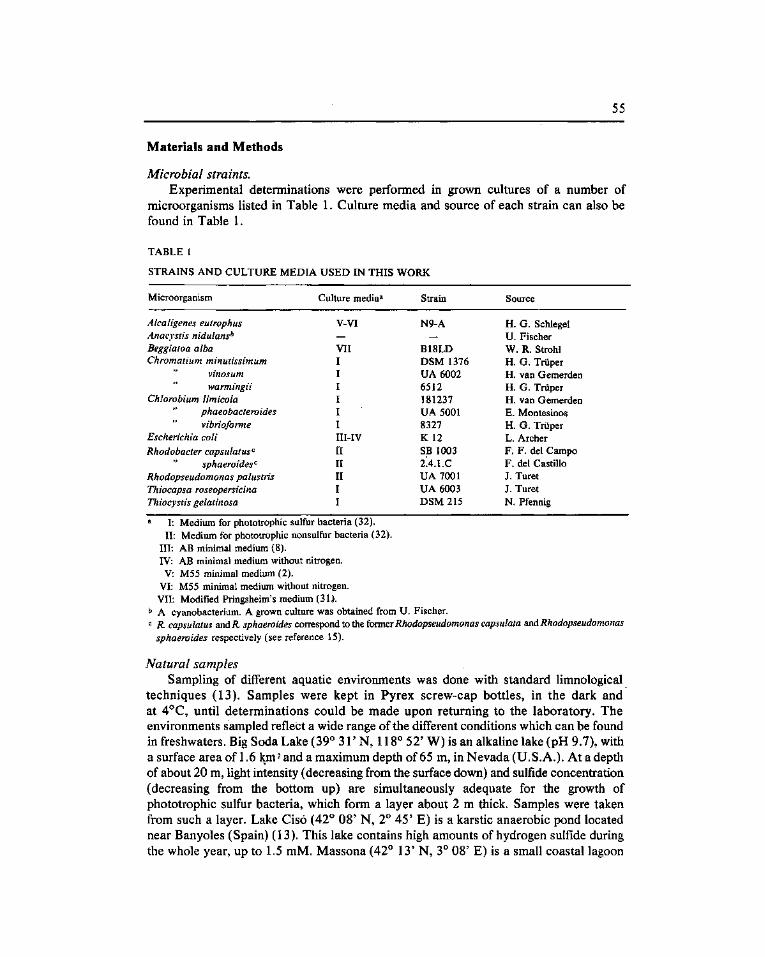
55
Materials and Methods
Microbial straints. Experimental determinations were performed in grown cultures of a number of
microorganisms listed in Table 1. Culture media and source of each strain can also be found in Table 1.
TABLE 1
STRAINS AND CULTURE MEDIA USED IN THIS WORK
Microorganism
Alcaligenes eutrophus Anacvstis nidulans^ Beggiatoa alba Chromatium minutissimum
vinosum warmingii
Chlorobium limicola phaeobacteroides vibrioforme
Escherichia coli Rhodobacter capsulatus^
sphaeroides'^ Rhodopseudomonas palustris Thiocapsa roseopersicina Thiocystis gelatinosa
Culture media^
V-VI
VII I I I I I I III-IV II II II I I
Strain
N9-A
B18LD DSM 1376 UA 6002 6512 181237 UA 5001 8327 K 12 SB 1003 2'.4.LC UA 7001 UA 6003 DSM 215
Source
H. G. Schlegel U. Fischer W. R. Strohl H. G. Triiper H. van Gemerden H. G. Triiper H. van Gemerden E. Montesinos H. G. Triiper L. Archer F. F. del Campo F. del Castillo J. Turet J. Turet N. Pfennig
a I: Medium for phototrophic sulfur bacteria (32). II: Medium for phototrophic nonsulfur bacteria (32).
Ill: AB minimal medium (8). IV: AB minimal medium without nitrogen. V: M55 minimal medium (2).
VT. M55 minimal medium without nitrogen. Vir. Modified Pringsheim's medium (31).
b A cyanobacterium. A grown culture was obtained from U. Fischer. c K capsulatus and i l sphaeroides correspond to the former Rhodopseudomonas capsulata and Rhodopseudomonas
sphaeroides respectively (see reference 15).
Natural samples Sampling of different aquatic environments was done with standard limnological
techniques (13). Samples were kept in Pyrex screw-cap bottles, in the dark and at 4°C, until determinations could be made upon returning to the laboratory. The environments sampled reflect a wide range of the difl'erent conditions which can be found in freshwaters. Big Soda Lake (39° 31' N, 118° 52' W) is an alkaline lake (pH 9.7), with a surface area of 1.6 km^ and a maximum depth of 65 m, in Nevada (U.S.A.). At a depth of about 20 m, light intensity (decreasing from the surface down) and sulfide concentration (decreasing from the bottom up) are simultaneously adequate for the growth of phototrophic sulfur bacteria, which form a layer about 2 m thick. Samples were taken from such a layer. Lake Cisó (42° 08' N, 2° 45' E) is a karstic anaerobic pond located near Banyoles (Spain) (13). This lake contains high amounts of hydrogen sulfide during the whole year, up to 1.5 mM. Massona (42° 13' N, 3° 08' E) is a small coastal lagoon

56
located in the marshes of rivers Muga and Fluvià (northeastern Spain) which has a semiestuarine regime. Irregular sea water intrusions allow a permanent salty hypolimnion and a freshwater epilimnion which do not mix (3). The bottom layer becomes anaerobic most of the year and phototrophic sulfur bacteria develop in the hypolimnion. Lake Estanya (42° 02' N, 0° 32' E) is a small karstic lake in the province of Huesca (Spain). It develops an anaerobic hypolimnion during the summer and mixes throughout during the winter (4). Some samples were taken from the Palo Alto salt marshes in the San Francisco Bay (CaUfomia, U.S.A.). In a few cases sampling was done in a small stream at Alum Rock Park, near San Jose (CaUfomia, U.S.A.).
Density measurements. Buoyant density of microorganisms was measured in preformed Percoll gradients
calibrated with density marker beads (Pharmacia), using the technique described by Guerrero et al (12). Fig. 1 shows the usual shape of one such gradient, with a high resolution zone in the central part and steep variation at both ends. Throughout this paper we give the value of density in pg iim-\ which are units more appropriate for the dimensions of the microbial cells we are considering, and which are identical to the values in g cm- used elsewhere. With respect to terminology, the widely used expression «cell density» should not be used to mean optical density of a culture or a population, but as a synonym of specific cell density, which is cell weight (as a measure of mass) divided by cell volume. The specific cell density measured by buoyancy in a given medium capable of forming density gradients is referred to as buoyant density. To indicate the concentration of cells in a given culture, we suggest using the expression «population density».
E
izn t=L
00 cz cu
c C3 >^ O Z3
ÛÛ
10 Distance
20 from the
30 meniscus
Fig. 1. Plot of density versus distance from the meniscus for a typical Percoll gradient, showing a zone of high resolution in the center and zones of rapid change in density at both ends. A tube with the different bands formed by the density marker: beads is shown for illustration.
57
Results
Buoyant density of cells in natural environments Buoyant density determinations of microorganisms in samples from natural
environments are shown in Table 2, along with the place where they were taken. Lowest values were found in the alga Oocystis sp. and in the cyanobacterium Synechocystis sp. (1.017 and 1.020 pg jum- respectively) and in the purple sulfur bacteria (i.e., Chromatiaceae) Thiocystis gelatinosa and Thiocapsa roseopersicina (1.020 and 1.022 pg ¡xm-^ respectively). At the other end of the range, the cyanobacterium Oscillatoria sp. presented a density of 1.119 pg jum-3, and the purple sulfur bacteria Chromatium sp. showed the highest values with densities up to 1.150 pg jum- . The average of all densities found in natural samples was 1.073 pg /xm- , a value which is very close to that of 1.070 pg jicm- , proposed on theoretical grounds by Doetsch and Cook (9).
TABLE 2
DENSITY OF DIFERENT MICROORGANISMS TAKEN FROM NATURAL ENVIRONMENTS
Microorganism Buoyant Density (pg ixm.-^} Sampling Site
Chromatium sp.^ Chromatium sp.^ Ectothiorhodospira sp.^ Lamprocystis sp.^ Oocystis sp.'' Oscillatoria sp.' Prosthecochloris sp.^ Synechocystis sp.^ Thiocapsa roseopersicina^ Thiocystis gelatinosa^
L140-L150 L034-L080e 1.055 1.017 1.119 1.045 1.020 1.022 1.020-1.030^
Lake Cisó Lake Estanya Big Soda Lake Lake Cisó Big Soda Lake Alum Rock Park Palo Alto salt marsh Alum Rock Park Massona lagoon Big Soda Lake
^ Purple sulfur bacteria. ^ Green alga. ^ Cyanobacteria. ^ Green sulfur bacteria. ® Two bands, one of cells without sulfur, and one of cells with sulfur (extracellular in Ectothiorhodospira and
intracellular in Thiocystis), were observed in natural populations of these bacteria.
Buoyant density of cells in pure cultures Table 3 shows results of buoyant densities determined in several pure cultures
of bacteria in the laboratory. Values range from 1.040 to 1.119 pg jutm- , the lowest one corresponding to Thiocystis gelatinosa, an organism which also showed low values in field samples. The highest value was found for the cyanobacterium ^«ÍZCJÍ'Í/S' nidulans. The average density of all determinations was 1.085 pg jLtm-3, somewhat higher than the value found for natural samples.
Factors affecting buoyant density. From both field and laboratory results, an average density for a representative microbe would be 1.080 pg jitm-3(l .073 from field results and 1.085 from laboratory results). Such density is the consequence of the weight of the cell material (fundamentally macromolecules and water) being enclosed within a given cell volume. Deviations from such an «ideal» value would be caused by changes in the

58
TABLE 3
DENSITY OF DIFERENT MICROORGANISMS IN PURE CULTURE
Microorganism Buoyant Density (pg ¡im^^) Group of bacteria
Alcaligenes eutrophus L110 Anacystis nidulans L119 Chromatium minutissimum L078 Chromatium vinosum L087 Chromatium warmingii L089 Chlorobium limicola L094 Chlorobium phaeobacteroides 1.072 Chlorobium vibrioforme LI00 Escherichia coli L095 Pseudomonas aeruginosa L075 Rhodobacter capsulatus 1.074 Rhodobacter sphaeroides LOSS Rhodopseudomonas palustris 1.095 Thiocapsa roseopersicina L054 Thiocystis gelatinosa 1.040
Hydrogen oxidizer Cyanobacteria Purple sulfur
Green sulfur
Facultative heterotroph Aerobic heterotroph Purple nonsulfur
Purple sulfur
composition of the cell material, especially the accumulation of substances with densities higher or lower than 1.080 pg ¡xml For example, accumulation of polymers in inclusions is likely to increase density, whereas the presence of loosely associated compounds forming capsules and slime layers is likely to reduce density. In order to test such ideas, we performed esperiments in which buoyant density was determined in several microorganisms, with and without subitances potentially affecting density. Results from such experiments are shown in Table 4. Those compounds forming intracellular inclusions had a substantial effect on density, causing increases from 1.44 % in the case of glycogen accumulation in Escherichia coli, to 5.84 % in the case of sulfur accumulation in Chromatium vinosum. The case of sulfur in Chlorobium limicola, a green sulfur bacterium (i.e., Chlorobiaceae), merits some attention. Since the organism reduces sulfide to sulfur releasing it to the medium, the fact that there is an influence of sulfur on its cellular density means that sulfur is somehow associated externally to the cell wall of the organism. The presence of capsules had the opposite effect on density, lowering it by 6.84 % in Thiocapsa roseopersicina. Both the presence of capsules and of intracellular inclusions could account for the range of densities found in nature and in cultures (see Tables 2 and 3).
Discussion
From the data presented above, it can be concluded that density of microorganisms changes as much as 7 % around an average value of 1.080 pg iim-\ Realizing such a range of values exists, is important for several reasons. First, buoyant density is used in ecological studies in order to estimate biomass from biovolume. Such calculations accumulate errors in cell counting, volume measurement, and uncertainties about cell
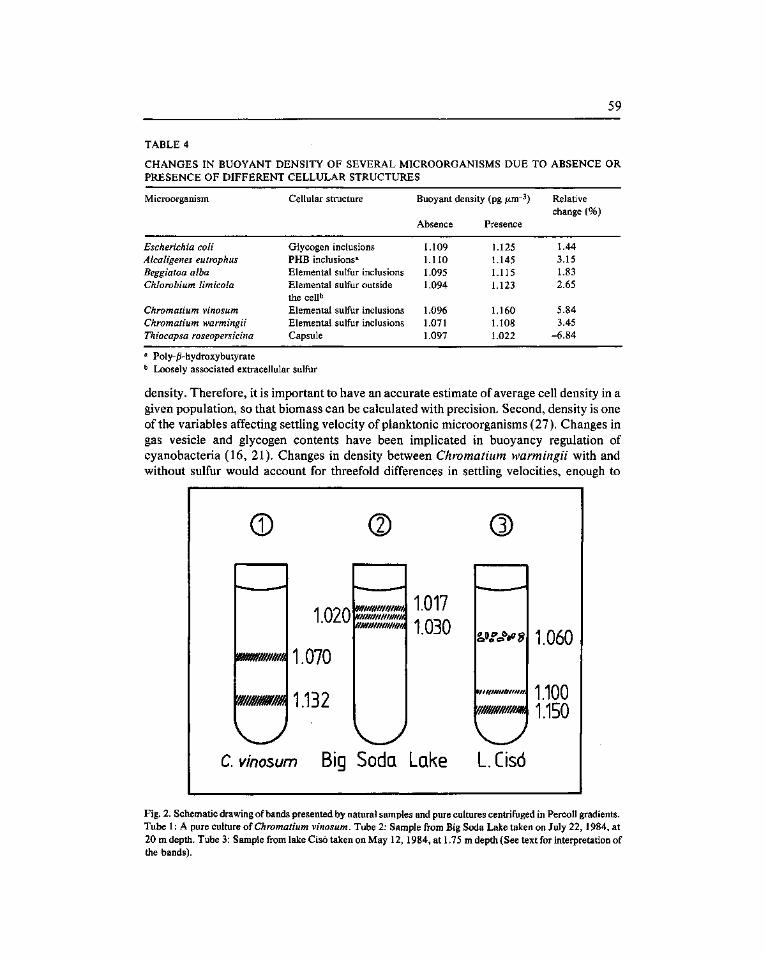
59
TABLE 4
CHANGES IN BUOYANT DENSITY OF SEVERAL MICROORGANISMS DUE TO ABSENCE OR PRESENCE OF DIFFERENT CELLULAR STRUCTURES
Microorganism
Escherichia coli Alcaligenes eutrophus Beggiatoa alba Chlorobium limicola
Chromatium vinosum Chromatium warmingii Thiocapsa roseopersicina
Cellular structure
Glycogen inclusions PHB inclusions^ Elemental sulfur inclusions Elemental sulfur outside the cell*' Elemental sulfur inclusions Elemental sulfur inclusions Capsule
Buoyant
Absence
1.109 1.110 1.095 1.094
1.096 1.071 1.097
density (pg jum- )
Presence
1.125 1.145 1.115 1.123
1.160 1.108 1.022
Relative change (%)
1.44 3.15 1.83 2.65
5.84 3.45
-6.84
^ Poly-^-hydroxybutyrate ^ Loosely associated extracellular sulfur
density. Therefore, it is important to have an accurate estimate of average cell density in a given population, so that biomass can be calculated with precision. Second, density is one of the variables affecting settling velocity of planktonic microorganisms (27). Changes in gas vesicle and glycogen contents have been implicated in buoyancy regulation of cyanobacteria (16, 21). Changes in density between Chromatium warmingii with and without sulfur would account for threefold differences in settling velocities, enough to
© (2)
wmiiiiiiim.
wmmm.
1.020
1.070
1.132
witii/tmmm fHitimtmtimti m/titn/tft/mtK
1.017 1.030
w v_y c. vinosum Big Soda Lake
®
S.Oi'oV?
f/ft/f//tf/tifittt,
w//////mm
1.060
1.100 1.150
^ 1 L.Cisó
Fig. 2. Schematic drawing of bands presented by natural samples and pure cultures centrifuged in PercoU gradients. Tube 1: A pure culture oïChromatium vinosum. Tube 2: Sample from Big Soda Lake taken on July 22, 1984, at 20 m depth. Tube 3: Sample from lake Cisó taken on May 12, 1984, at 1.75 m depth (See text for interpretation of the bands).
60
affect significantly sedimentation of the cells in nature (12). Thus, knowledge of density and the factors affecting it bear high significance for ecology of planktonic microorganisms. Finally, knowledge of the densities of particular microorganisms or of physiologically diverse populations within one species, would allow separation of them by density gradient centrifugation. This has been tried out in an unsystematic way (25, 29, 30), but further studies clarifying the physiological reasons underlaying differences in density are needed, in order to make such techniques useful in microbiology. A few examples of such sort of application of density and gradient centrifugation have been schematized in Figure 2. Tube 1 shows two bands from a culture of Chromatium vinosum, one in which cells are loaded with sulfur (higher density) and one in which cells, probably inactive, had been incapable of accumulating sulfur, thus illustrating how differences in physiology within a population can be made apparent by such a technique. The next two tubes correspond to natural samples from Big Soda Lake (Tube 2, Fig. 2) and from Lake Cisó (Tube 3, Fig. 2). Both illustrate how different species can be isolated from a mixed natural community. In the tube from Big Soda Lake, the green alga Oocystis sp. forms a light band, whereas the purple sulfur bacterium Thiocystis gelatinosa presents two bands, corresponding to actively sulfur accumulating cells and inactive cells within the same natural population. In the sample from Lake Cisó, three bands can be appreciated. The lightest band is formed by the aggregate-forming purple sulfur bacterium Lamprocystis sp. Results from laboratory experiments allow us to conclude that the thick slime layer surrounding the aggregates and the possession of gas vesicles are the causes of its low density. The next band is formed by the unicellular alga Cryptomonas sp., and the lowest band consists of Chromatium minus loaded with sulfur (again, the cause of its higher density).
Data from literature have been summarized in Table 5 for microorganisms and in Table 6 for cell organelles. Data for eubacteria (Table 5) show that, with respect to density, they can be divided in two groups: one with high densities (L18 to 1.29 pg/xm- ) and one with low densities (L06 to 1.09 pgjutm- ). These two groups correspond to the gradient media used. High densities are obtained with high osmolarity media such as sucrose, cesium chloride or renografin, whereas low densities are obtained with media which have physiological osmolarities, such as FicoU, Ludox or PercoU. In the case of eukaryonts (Table 5) densities for algae and fungi are very close to those of bacteria in similar centrifugation media. Only diatoms show high densities in Percoll, as could be expected from their silica frustules.
Cell organelles (Table 6) show approximately the same ranges of densities when measured in the same medium. But, except in Percoll, all have densities higher than those of microorganisms (Table 5). The difficulties iîi isolating intact and clean organelles, and the different protocols used make comparisons unreHable. However, it is suggestive that densities in Percoll are the same as those for microorganisms.
The fact that differences in density among published values are mostly due to the osmolarity of the centrifugation media is clearly demonstrated in Figure 3. Values of density from our work and from the literature (Tables 2 to 6) have been pooled together and separated according to the medium used in their determination. It can be seen that the osmolarity of the medium determined the range of densities obtained regardless of the organism being considered. In accordance with such observations, density has been proven to change in a given microorganisms at different ionic strengths (6). This was
61
TABLE 5
BUOYANT DENSITY OF DIFFERENT MICROORGANISMS, MEASURED USING A VARIETY OF TECHNIQUES
Microorganism Buoyant density (pg ju,m- ) Technique^ Reference
PROKARYOTES
Alcaligenes eutrophus Arthrobacter globiformis Desulfovibrio sp. Enterobacter aerogenes Escherichia coli
Methanosarcina sp. Methanothrix soehngenii Microcystis aeruginosa Microcystis sp.' Salmonella typhimurium Soil bacteria (9 isolates) Thiobacillus acidophilus
ferrooxidans
1.261-1.297 1.300 1.120 1.200 1.081-1.101 1.094-1.114 1.080
1.040 1.090 1.002 (±0.002) 1.013-1.032 1.063-1.087 1.035-1.093 1.190-1.184 1.186-1.175
Sucrose Cesium chloride PercoU Cesium chloride Percoll Ludox-PVPb Ficoll Percoll
" Calculation Percoll Ludox-PVPb Ludox Renografin
"
22 34 29 34 37 19 17 29 29 26 16 14 5
18 18
EUKARYOTES
Asterionella formosa " "
Biddulphia aurita sinensis
Ceratulina berganii Chlorella vulgaris Chlorococcum sp. Clavariadelphus ligula Clitocybe candicans Collybia butyracea Cyclotella meneghiniana Cyclotella praeterissima Ditylum brightwellii
" " " "
Fragilaria crotonensis " " " "
Marasimus androsaceus Microphale perforans Mortiella sp. Mycena epipterygia
metata ro sella
Peridinium sp. Phaeodactylum tricornutum
" " Rhizosolenia delicatula Rhodomonas sp.
"
1.151-1.254 1.130 1.180-1.230 1.030-1.080 1.030-1.060 1.095 (±0.007) 1.069 (±0.026) 1.095 1.075-1.080 1.077-1.095 1.110 (±0.090) 1.196 (±0.013) 1.070-1.130 1.040-1.090 1.040 1.198 (±0.082) 1.196 (±0.013) 1.282 (±0.182) 1.060 1.060 1.054 1.033-1.095 1.027-1.105 1.036-1.100 1.080-1.120 1.060-1.090 1.080 1.040-1.090 1.040-1.130 1.100
Ficoll Gravimetric Percoll
" " " "
Ludox " "
Percoll " "
Calculation "
Gravimetric Percoll Calculation Ludox
" " " " "
Percoll
" Metrizamide Percoll
" Metrizamide
36 27 33 33 33 20 20
5 5 5
20 20 33 10 1
27 27 * 5 5 5 5 5' 5
33 33 33 33 33 33
62
TABLE 5 (continued)
Microorganism
Saccharomyces cerevisiae Skeletonema costatum Streptotheca thamensis Stephanodiscus astraea Svnedra acus
" " Tabellaira flocculosa Thalassiosira fluviatilis
nordenskioldii rotula
" " Trichoderma viride Trichoderma sp.
Buoyant density (pg jitm- )
1.107-1.117 1.120-1.170 1.040-1.090 1.091 (±0.013) 1.100 (±0.033) 1.115 (±0.023) 1.142 (±0.014) 1.121 1.240-1.280 1.050-1.110 1.040-1.110 1.081 1.074
Technique^
Percoll " "
Gravimetric "
Percoll "
Gravimetric Percoll
" Calculation Ludox
"
Reference
6 33 33 27 27 27 27 35 33 33 10 5 5
^ For the composition of the media for gradient centrifugation, see legend to Fig. 3. ^ Polyvinvylpyrrolidone. ^ Gas vesicles had been collapsed prior to centriftigation. * Einsele and Grim (1938), cited in reference 27.
TABLE 6
BUOYANT DENSITIES OF SEVERAL CELL ORGANELLES, CENTRIFUGATION MEDIA
MEASURED IN DIFFERENT
Centrifugation
Metrizamide Sucrose
Nycodenz Ficoll Ludox Percoll
medium Mitochondria
1.145-1.250b 1.180-1.210<='d
1.160-1.190d i.ne^
1.040-1.100'=
Chloroplasts
1.210-1.220^
1.151-1.167d
1.100-1.120<=
Cell organelle
Lysosomes
1.145-1.250b 1.200-1.220'=
1.140-1.170d
1.060-1.090^
Others^
P 1.230b P1.230<= G 1.200-1.220'=
G1.055-1.076«
^ P: Peroxisomes, G: Glyoxisomes. b See reference 28 for specific authors. '= See reference 7 for specific authors. d See reference 11. ^ See reference 23 for specific authors.
particularly dramatic in the cells of Alcaligenes eutrophus with and without PHB inclusions. When cells were centrifuged in sucrose, PHB-less cells were denser than cells without PHB, and the reverse was true when centrifuged in Percoll (22).
What can be concluded from this literature review, is that average densities of most microorganisms and cell organelles have values approximately around 1.080 pg jum-l Thus, there do not seem to be significant differences in average density among microorganisms. On the other hand, microorganisms can change their density as much as 7 %, under different physiological and/or environmental conditions, as we have seen in the experiments in Table 4.
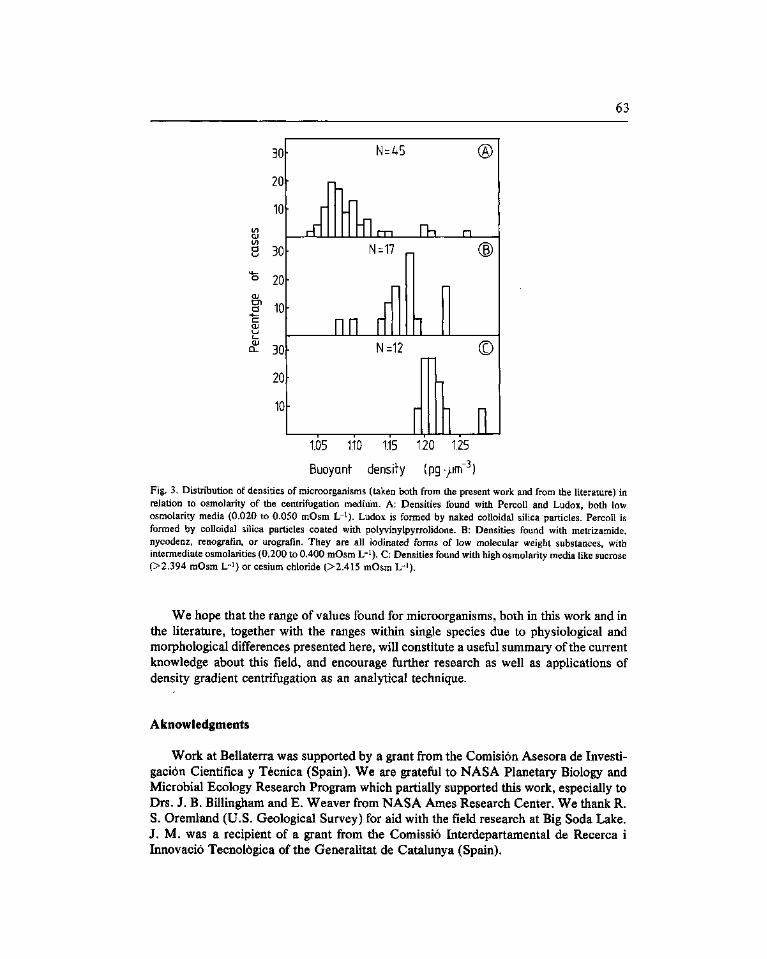
63
OJ en a Cl OJ (_) cu
CL
30
20
10
30
20
10
30
20
10
N=45 ®
n
n rrlll
r—1
l l r T I m m n
N=17
n
nn m h N=12
-
(-
(D
n
©
h h r
1.05 1.10 1.15 1.20 1.25
Buoyant density (pg-;jm"^)
Fig. 3. Distribution of densities of microorganisms (taken both from the present work and from the literature) in relation to osmolarity of the centrifugation medium. A: Densities found with PercoU and Ludox, both low osmolarity media (0.020 to 0.050 mOsm L-i). Ludox is formed by naked colloidal silica particles. PercoU is formed by colloidal silica particles coated with polyvinylpyrrolidone. B: Densities found with metrizamide, nycodenz, renografm, or urografin. They are all iodinated forms of low molecular weight substances, with intermediate osmolarities (0.200 to 0.400 mOsm L-^). C: Densities found with high osmolarity media like sucrose (>2.394 mOsm L-i) or cesium chloride (>2.415 mOsm Ir^).
We hope that the range of values found for microorganisms, both in this work and in the literature, together with the ranges within single species due to physiological and morphological differences presented here, will constitute a useful summary of the current knowledge about this field, and encourage further research as well as applications of density gradient centrifugation as an analytical technique.
Aknowledgments
Work at Bellaterra was supported by a grant from the Comisión Asesora de Investigación Científica y Técnica (Spain). We are grateful to NASA Planetary Biology and Microbial Ecology Research Program which partially supported this work, especially to Drs. J. B. Billingham and E. Weaver from NASA Ames Research Center. We thank R. S. Oremland (U.S. Geological Survey) for aid with the field research at Big Soda Lake. J. M. was a recipient of a grant from the Comissió Interdepartamental de Recerca i Innovado Tecnológica of the Generalitat de Catalunya (Spain).
64
References
1. Anderson, L. W. J., and Sweeney, B. M. (1978) Role of inorganic ions in controlling sedimentation rate of a marine centric diatom Ditylum brightwellii. J. Phycol. 14, 204-214.
2. Aragno, M., and Schlegel, H. G. (1981) The hydrogenoxidizing bacteria. In: M. P. Starr, H. Stolp, H. G. Triiper, A. Balows, and H. G. Schlegel (eds.). The Prokaryotes. pp. 865-893. Springer Verlag, Berlin.
3. Armengol, J.; Comin, F. A., and López, P. (1981) Balance térmico anual de la laguna de La Massona (Alt Empordá, Girona). In: N. Prats (éd.). Actas I Congreso Español de Limnología, p. 7. Barcelona.
4. Avila, A.; Burrell, J. L.; Domingo, A.; Fernández, E.; Godall, J., and Llopart, J. M. (1984) Limnología del Lago Grande de Estanya (Huesca). Oecol. aquat. 7, 3-24.
5. Bakken, L. R., and Olsen, R. A. O. (1983) Buoyant density and dry matter contents of microorganisms: conversion of a measured biovolume into biomass. Appl. Environ. Microbiol. 45, 1188-1195.
6. Baldwin, W. W., and Kubitscheck, H. E. (1984) Evidence for osmoregulation of cell growth and buoyant density in Escherichia coli. J. Bacteriol. 159, 393-394.
7. Birnie, G. D., and Rickwood, D. (1978) Centrifugal separations in molecular and cell biology. Butterworths, London.
8. Clark, D. J., and Maaloe, O. ( 1967) DNA replication and the division cycle oí Escherichia coli. J. Mol. Biol. 23, 99-112.
9. Doetsch, R. N., and Cook, T. M. (1973) Introduction to bacteria and their ecobiology. Medical and Technical Pub. Co. Ltd., Lancaster.
10. Eppley, R. W., Holmes, R. W., and Strickland, J. D. (1967) Sinking rates of marine phytoplankton measured with a fluorimeter. J. Exp. Mar. Ecol. 1, 191-208.
11. Ford, T. C; Rickwood, D., and Graham, J. (1983) Buoyant densities of macromolecules, macromolecular complexes, and cell organelles in Nycodenz gradients. Anal. Biochem. 128, 232-239.
12. Guerrero, R.; Mas, J., and Pedrós-AHó, C. (1984) Buoyant density changes due to intracellular content of sulfur in Chromatium warmingii and Chromadum vinosum. Arch. Microbiol. 137, 350-356.
13. Guerrero, R.; Montesinos, E.; Pedrós-Alió, C; Esteve, L; Mas, J.; van Gemerden, H.; Hofman, P. A. G., and Bakker, J. F. (1985) Physiological ecology of phototrophic sulfur bacteria in two Spanish karstic lakes. Limnol. Oceanogr. (in press).
14. Herrero, E.; Aldea, M.; Ros, J.; Monfort, J. M., and Guerrero, R. (1982) Regulation of cellular division in Salmonella typhimurium. Effect of RNA accumulation and cellular density. In: A. Jiménez-Sánchez and R. Guerrero (eds.). Bacterial molecular genetics, pp. 265-283. Ed. Reverte, Barcelona (In Spanish).
15. Imhoff, J. F.; Triiper, H. G., and Pfennig, N. (1984) Rearrangement of the species and genera of the phototrophic «purple nonsulfur bacteria». Int. J. Syst. Bacteriol. 34, 340-343.
16. Kromkamp, J. C , and Mur, L. R. (1984) Buoyant density changes in the cyanobacterium Microcystis aeruginosa due to changes in the cellular carbohydrate content. FEMS Microbiol. Lett. 25, 105-109.
17. Kubitscheck, H. E.; Baldwin, W. W., and Graetzer, E. (1983). Buoyant density constancy during the cell cycle OÏEscherichia coli. J. Bacteriol. 155, 1027-1032.
18. Martin, P. A. W.; Dugan, P. R., and Tuovinen, O. H. (1981) Differentiation of acidophilic thiobacilli by cell density in renografm gradients. Curr. Microbiol. 6, 81-84.
19. Martínez-Salas, E.; Martin, J. A., and Vicente, M. ( 1981 ) Relationships oí Escherichia coli density to growth rate and cell age. J. Bacteriol. 147, 97-100.
20. Oliver, R. L.; Kinnear, A. J., and Ganf, G. G. (1981) Measurement of cell density of three freshwater phyto-plankters by density gradient centrifugation. Limnol. Oceanogr. 26, 285-294.
21. Oliver, R. L., and Walsby, A. E. (1984) Direct evidence for the role of light-mediated gas vesicle collapse in the buoyancy regulation oí Anabaena flos-aquae. (Cyanobacteria). Limnol. Oceanogr. 29, 879-886.
22. Pedrós-Alió, C; Mas, J., and Guerrero, R. (1985) The influence of poly-j3-hydroxybutyrate accumulation on cell volume and buoyant density in Alcaligenes eutrophus. Arch. Microbiol, (in press).
23. Percoll. Methodology and applications. Density marker beads for calibration of gradients of PercoU. Pharmacia Fine Chemicals, Uppsala. 64 pp.
24. Pertoft, H.; Laurent, T. C ; Llls, T., and Kâjedal, L. (1978) Density gradients prepared from colloidal silica particles coated with polyvinylpyrrolidone (Percoll). Anal. Biochem. 88, 271-282.
25. Price, C. A.; Reardon, E. M., and Guillard, R. R. L. (1978) Collection of dinoflagellates and other marine microalgae by centrifugation in density gradients of a modified silica sol. Limnol. Oceanogr. 23, 548-553.
65
26. Reynolds, C. S.; Jaworski, G. H. M.; Cmiech, H. A., and Leedale, G. F. (1981) On the annual cycle of the blue green alga Microcystis aeruginosa Kiitz. emend. Eleukin. Philos. Trans. Royal Soc, London, B 293, 419-477.
27. Reynolds, C. S. (1984) The ecology of freshwater phytoplankton. Cambridge Univ. Press, Cambridge, U. K. 28. Rickwood, D. (compiler). (1976) Metrizamide. A gradient medium for centrifugation studies. Nygaard & Co.
Ass., Oslo. 29. Scherer, P. (1983) Separation of bacteria from a methanogenic wastewater population by utilizing a self-
generating Percoll gradient. J. appl. Bacteriol. 55, 481-486. 30. Schlegel, H. G.; Lafferty, R., and Krauss, I. (1970) The isolation of mutants not accumulating poly-/3-hydro-
xybutyric acid. Arch. Microbiol. 71, 283-294. 31. Strohl, W. R., and Schmidt, T. M. (1984) Mixotrophy of the colorless, sulfide-oxidizing, gliding bacteria
Beggiatoa and Thiothrix. In: W. R. Strohl and O. H. Tuovinen (eds.). Microbial chemoautotrophy. pp. 79-95. Ohio Univ. Press, Columbus,,Ohio.
32. Van Gemerden, H., and Beeftink, H. H. (1983) Ecology of phototrophic bacteria. In: J. G. Ormerod (éd.). The Phototrophic Bacteria: Anaerobic life in the light pp. 146-185. Blackwell Sci. Pub., Oxford.
33. Van lerland, E. T., and Peperzak, L. (1984) Separation of marine seston and density determination of marine diatoms by density gradient centrifugation. J. Plankton Res. 6, 29-44.
34. Van Veen, J. A., and Paul, E. A. (1979) Conversion of biovolume measurements of soil organisms, grown under various moisture tensions, to biomass and their nutrient content. Appl. Environ. Microbiol. 37, 686-692.
35. Walsby, A. E., and Xypolyta, A. (1977) The form resistance of chitan fibers attached to the cells of Thalassiosira fluviatilis Hustedt. British phycol. J. 12, IIS-IIZ.
36. Wiseman, S. W.; Jaworski, G. H. M., and Reynolds, C. S. (1983) Variability in sinking rate of the freshwater diatom Asterionellaformosa Hass.: the influence of excess density of colonies. British phycol. J. 18, 425-432.
37. Woldringh, C. L.; Binnerts, J. S., and Mans, A. (1981) Variation in Escherichia coli buoyant density measured in Percoll gradients. J. Bacteriol. 148, 58-63.
Microbiología 1 (1985), 67-75 SEM
Carbohydrate stability during ageing in Pénicillium expansum cell wall
Begoña Gómez-Miranda* and J. Antonio Leal
C.S.L C. Instituto de Inmunología y Bilogía Microbiana. Velazquez, 144 - 28006 Madrid - Spain.
Summary
Cell walls were obtained from Pénicillium expansum mycelia of different ages. The yield of walls increased up to the 13th day of incubation and then remained almost constante. Cell walls from 13 day-old mycelia consisted of neutral sugars (65 %), chitin (10 %) and protein (10 %). The neutral sugars released by hydrolysis of the cell wall, identified and quantified by gas-liquid chromatography were mannose (3-4 %), galactose (3-4 %), glucose (37 %) and trace amounts of arabinose and xylose. The contents of chitin remained constant during ageing. Alkali treatment at 20 «C of the cell wall released and a-glucan amounting to about 30 % leaving an insoluble residue formed by chitin and a j5-glucan containing mannose and galactose.
Key words: Cell wall, carbohydrates, Pénicillium expansum.
Resumen
Se han obtenido paredes celulares de micelio ÚQ Pénicillium expansum de diferentes edades. La cantidad de paredes recolectadas aumentó hasta los 13 días de incubación, manteniéndose constante en días sucesivos. Las paredes celulares aisladas del micelio de 13 días contienen azúcares neutros (65 %), quitina (10 %) y proteína (10 %). Los azúcares neutros liberados por hidróHsis de la pared celular, identificados y evaluados mediante cromatografía de gases fueron: mañosa (3-4 %), galactosa (3-4 %), glucosa 37 % y trazas de arabinosa y xilosa. El contenido de quitina permaneció constante durante todo el período de incubación. Tratamiento con álcali de la pared solubilizó un a-glucano, alrededor del 30 %, dejando un residuo insoluble formado por quitina y un /3-glucano conteniendo mañosa y galactosa.
Introduction
The effect of culture age on cell wall polysaccharides of fungi has been Httle studied. Changes in cell wall composition have been reported during germination of conidia of
* Corresponding author.

68
Pénicillium notatum (14) and in ageing of mycelium oí Cunninghamella japónica (6), and that oí Pénicillium allahabadense (7). The cell wall oí Aspergillus clavatus was not affected during ageing (4).
The purpose of this work was to study the changes in wall composition oí Pénicillium expans um during ageing. Polysaccharidic wall fractions obtained at various points of the growth curve were examined and the chemical composition of cell walls derived from 13 day-old mycelium is reported.
Materials and Methods
Organism and growth conditions
Pénicillium expansum Link ex Gray emend Thom, strain 229.38 was obtained from the Centraalbureau voor Schimmelcultures, Baam. The organism was maintained on slants of Bacto potato dextrose agar (Difco). The basal medium for mycelium production contained: KH2PO4,0.5 g; MgS04.7H20,0.5 g; FeS04.7H20,0.5 mg; ZnS04.7H20, 0.5 mg; CUSO4.5H2O, 0.002 mg; MnCl2.4H20, 0.02 mg; Na2Mo04.2H20, 0.02 mg; thiamine hydrochoride, 1 mg; D-glucose, 15 g; yeast extract (Difco), 1 g; casamino-acids (Difco), 3 g; and water to make one litre. The medium was adjusted to pH 6.5, dispensed in 1 1 portions into 2 1 Erlenmeyer flasks and autoclaved at 120°C for for 15 min. Suspensions of conidida (1 ml) from 10 day-old agar slants in 10 ml of sterile water were used as inocula. The cultures were incubated at 25°C- 1°C at 120 rev/min in an orbital incubator Gallenkamp IH-465.
Cell wall preparation and extraction procedures
At different incubation periods, two flasks were harvested. The mycelium, separated from the culture fluids by filtration through cheese-cloth, was freeze-dried. Afterwards it was desintegrated in a Sorvall omnimixer at full speed for 2 min followed by ultrasonic treatment (MSE model MK2, 150 W) for 21 min at 3 min intervals and washed by repeated centrifugation with distilled water until the wall material was completely clean as determined by phase-contrast microscopic examination and did not stain with Coomasie Blue. The walls were washed with 50 % ethanol, 96 % ethanol and acetone, dried at 80°C and stored desiccated.
Dry cell wall material (1 g) was extracted (5 to 6 times) with IM NaOH (100 ml) at 20°C during 30 min. (Fraction 1). The residue from the previous treatment was left overnight at —25°C and extracted twice with IM NaOH (100 ml) for 30 min at 20°C (Fraction 2). The residue from fraction 2 was extracted (3 to 4 times) with 100 ml of 1M NaOH at 70°C for 30 min (Fraction 3). The cell wall residue, insoluble in alkali, constituted Fraction 4.
Fraction 4 (300 mg) was submitted to hydrolysis with 20 ml of IN H 2 SO 4 at 90°C for 16 h, obtaining Fraction 4a (acid-soluble). The residue from Fraction 4a was extracted

69
twice with 20 ml of IM NaOH at 20°C for 30 min obtaining Fraction 4b (alkali-soluble) and Fraction 4c (acid and alkali-insoluble).
All the extractions described above were continued until no precipitate was formed when one volume of ethanol was added to the supernatant. The precipitates were pooled together, washed with 50 % ethanol until the supernatant was freee from alkali, and then with 96 % ethanol and acetone. Fraction 4b was dialyzed against water, and freeze-dried. Fraction 4 and 4c were washed with distilled water until the supernatant was free from alkali and with ethanol and acetone, and stored desiccated.
Dry cell wall material was also treated with 1 N H2SO4 at 90°C for 16 th. The supernatant (Fraction I) was neutralized with BaCOs. The insoluble residue was extracted with IM NaOH at 20°C as described above yielding an alkali-soluble material (Fraction II) and an alkali-insoluble material (Fraction III).
Chemical analysis
For hexosamines analysis the cell wall or its fractions were hydrolyzed with 6N HCl for 4 hours at 100°C. Aliquots of the hydrolysates were used for colorimetric determination (16) or for identification and quantification with a Biotronik amino acid analyzer LC 7000. Phosphate ion was determined in 2N HCl hydrolysates according to Rand et al. (15). Cell wall protein was extracted overnight with IM NaOH and measured by the method of Lowry et al. (12) with bovine serum albumin as standard. Neutral sugars were determined by the anthrone procedure (5) with glucose as standard. For analysis of neutral sugars the cell wall and its plysaccharides were hydrolyzed with H 2 SO 4 of different concentrations at 100°C and for different periods of time in sealed evacuated tubes, and neutralized with barium carbonate. The neutral sugars, converted into the corresponding alditol acetates (10) were identified and quantified by gas-liquid chromatography (GLC) on 3 % SP-2340 on 100-120 Supelcoport. A 2m x 2mm glass column was used at 200 to 230°C with a temperature rise of 10°/min, a 3 min initial hold and a final temperature time of 14 min. The N2 flow rate was 30 hil/min. A flame ionization detector, sensitivity 10""^ , sample size 3 ¡xl was used in a Perkin-Elmer 10 and Sigma 3 chromatograph. Peaks were identified on the basis of sample coincidence with the relative retention times of standards. Inositol was used as internal standard. For ash determination 100 mg of the wall material was ashed to constant weight. Volatile matter was determined by heating 100 mg of cell wall at 100°C until constant weight.
Infrared (IR) spectra were obtained by the KBr technique on a Perkin-Elmer 457 infrared spectrophotometer.
Results
Cell wall production
The production of mycelium and cell wall during the incubation period is shown in Fig. 1. The mycelial dry weight increased up to the 6th day and then decreased, while the cell wall increased up to the 13th day and remained almost constant (from 2.5 g/1 the 13 th day to 2 g/1 the 34th day of the experiment).
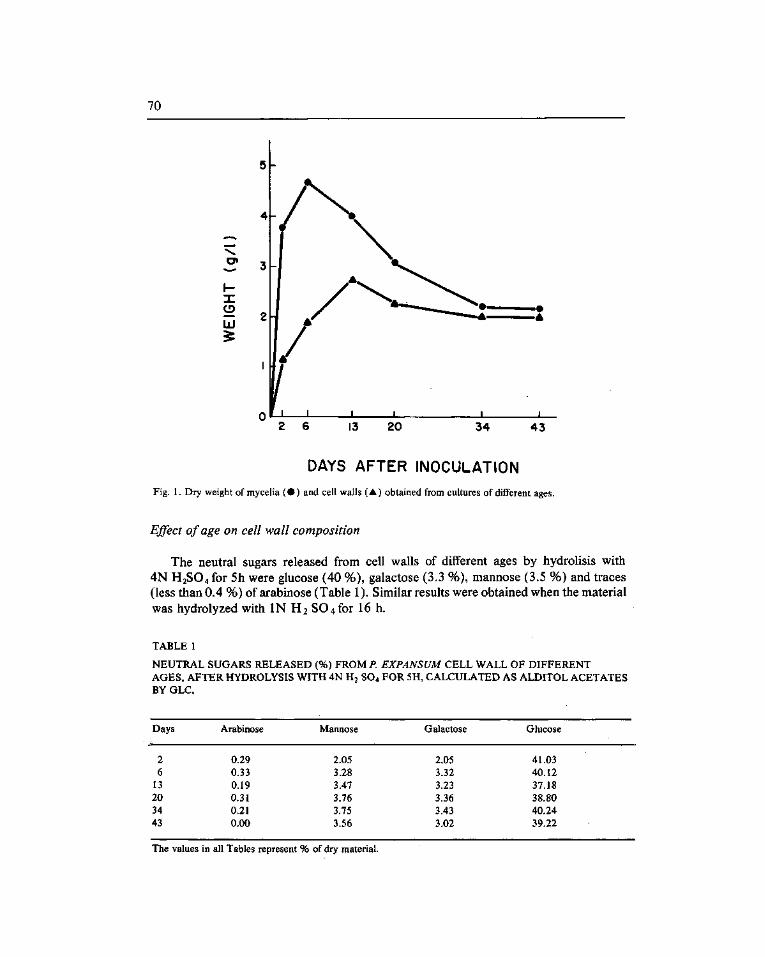
70
DAYS AFTER INOCULATION Fig. I. Dry weight of mycelia ( • ) and cell walls (A) obtained from cultures of different ages.
Effect of age on cell wall composition
The neutral sugars released from cell walls of different ages by hydrolisis with 4N H2SO4 for 5h were glucose (40 %), galactose (3.3 %), mannose (3.5 %) and traces (less than 0.4 %) of arabinose (Table 1 ). Similar results were obtained when the material was hydrolyzed with IN H2 SO4 for 16 h.
TABLE 1
NEUTRAL SUGARS RELEASED (%) FROM P. EXPANSUM CELL WALL OF DIFFERENT AGES, AFTER HYDROLYSIS WITH 4N H2 SO4 FOR 5H, CALCULATED AS ALDITOL ACETATES BYGLC.
Days
2 6
13 20 34 43
Arabinose
0.29 0.33 0.19 0.31 0.21 0.00
Mannose
2.05 3.28 3.47 3.76 3.75 3.56
Galactose
2.05 3.32 3.23 3.36 3.43 3.02
Glucose
41.03 40.12 37.18 38.80 40.24 39.22
The values in all Tables represent % of dry material.
71
The yield of fractions F l , F2, F3 and F4 obtained by successive treatments with alkali from cell walls of different ages is shown in Table 2. Fractions Fl and F4 were the most abundant. Since age did not affect the yield of fractions or the neutral sugars released by hydrolysis, the composition of cell walls and their fractions was studied in 13 day-old cell walls.
TABLE 2.
YIELD (%) OF FRACTIONS F-1, F-2, F-3 AND F-4 OBTAINED FROM CELL WALLS OF DIFFERENT AGES.
Days
Fraction 1 Fraction 2 Fraction 3 Fraction 4
2
3L96 2.60 4.81
39.00
6
28.66 2.18 5.60
42.40
13
26.18 3.14 4.84
37.12
20
29.09 2.49 4.30
39.00
34
29.46 2.67 4.26
41.65
• 43
31.37 3.22 4.76
37.00
All values are the average of three determinations.
Cell wall composition
The chemical composition of cell walls obtained from 13 day-old cultures is shown in Table 3. Chitin (anhydro N-acetyl-D-glucosamine residues) was calculated from the content of glucosamine in 6N HCl hydrolysates. Its value coincides with the dry weight of fraction Fill .
TABLE 3 •
CHEMICAL COMPOSITION (%) OF P. EXPANSUM CELL WALL (13d)
Neutral sugars 64.70 Chitin 10.20 Protein 10.25 Phosphate ion 1.36 Volatile matter 9.53 Ash 1.68
Fraction composition
The neutral sugars released from the different fractions of 13 day-old cell walls by hydrolysis with 4N H 2 SO 4 for 5h is presented in Table 4. Similar results were obtained

72
with IN H2SO4 for 16 h. Glucose was the main component in all fractions except fraction F4c which contained mainly glucosamine. In fractions F2, F3 and F4 about 4 % of galactose and mannose were released. Fraction F3 contained 6.6 % of xylose. Glucosamine was detected in fractions F2, F4 and F4c hydrolysed with 6N HCl for 4 h.
TABLE 4
NEUTRAL SUGARS RELEASED (%) FROM P. EXPANSUM (13 DAY-OLD) CELL WALL FRACTIONS AFTER HYDROLYSIS WITH 4N H2SO4 FOR 5h, CALCULATED AS ALDITOL ACETATES BY GLC.
Fraction 1 Fraction 2 Fraction 3 Fraction 4 Fraction 4b Fraction 4c
Arabinose
0.48 0.0 1.05 0.0 0.20 0.0
Xylose
0.0 0.0 6.59 0.0 0.0 0.79
Mannose
1.12 4.68 4.07 4.41 0.77 0.0
Galactose
0.0 4.09 2.47 3.66 0.0 0.0
Glucose
89.0 41.92 41.04 31.32 62.55
0.54
Chitin*
0.0 22.17 0.0
32.79 0.0
99.0
*Chitin was determined in 6N HCl hydrolysates. All the values are average of three determinations
The neutral sugars released from cell walls by treatment with IN H2SO4 16h at 90°C (FI) and from fractions FII and Fill hydrolysed with 4N H2SO4 for 5h are reported in Table 5. The yields of FII and Fil l amounted to 7 and 10 % of the cell wall respectively.
TABLE 5
SUGARS RELEASED (%) FROM 13 DAY-OLD CELL WALL (FI) AND FRACTIONS FII AND Fill
F-I F-II F-III
Arabinose
0.26 0.19 0.0
Mannose
3.46 0.16 0.0
Galactose
3.22 0.0 0.0
Glucose
37.18 32.82 0.0
Chitin
0.0 0.0
99.0
FII and Fill were hydrolysed by 4N H2SO4 for 5h. The neutral sugars were calculated as alditol acetates by GLC. Fill was hydrolyzed by 6N HCl for 4h to determine chitin. All the values are average of three determinations.
Characterization of the fractions
The IR spectra of the different fractions are showh in Fig. 2. The spectrum of FI showed a band at 850 cm"^ characteristic of a-linked glucans. Fractions F2 and F4 showed an absorption band at 890 cm"" and lacked the band at 850 cm~^ which is
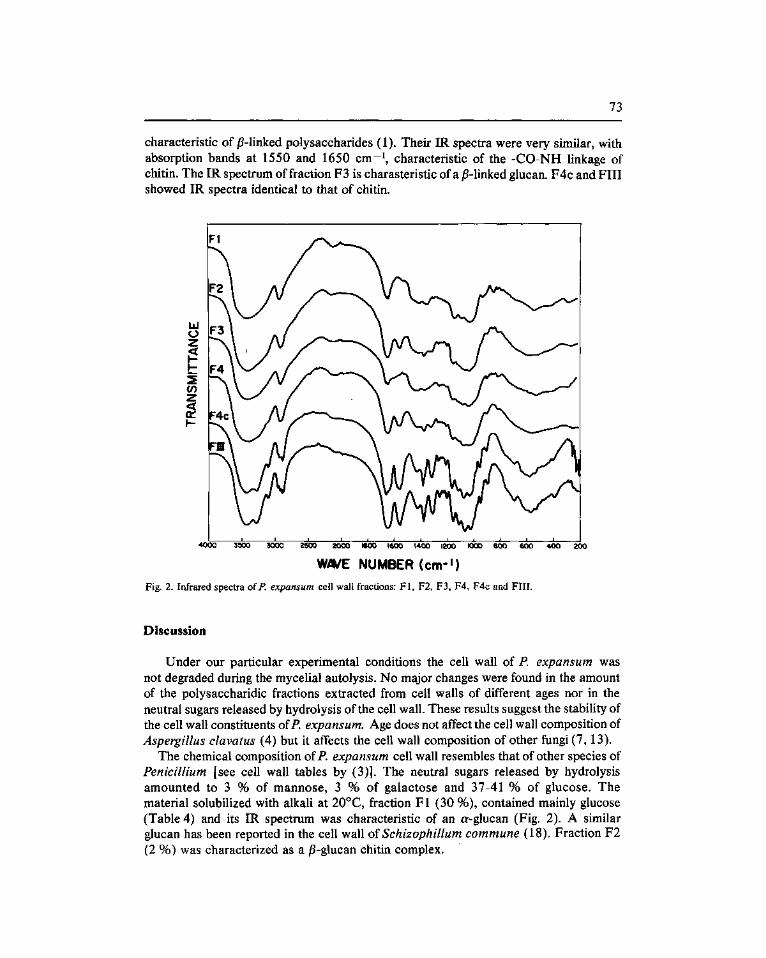
73
characteristic of ^-Hnked polysaccharides (1). Their IR spectra were very similar, with absorption bands at 1550 and 1650 cm~\ characteristic of the -CO-NH linkage of chitin. The IR spectrum of fraction F3 is charasteristic of a j5-linked glucan. F4c and FIJI showed IR spectra identical to that of chitin.
2000 1800 1600 1400 1200 1000 800 600 400
W/VE NUMBER (cm-') Fig. 2. Infrared spectra of P. expansum cell wall fractions: F l , F2, F3, F4, F4c and Fill.
Discussion
Under our particular experimental conditions the cell wall of P. expansum was not degraded during the mycelial autolysis. No major changes were found in the amount of the polysaccharidic fractions extracted from cell walls of different ages nor in the neutral sugars released by hydrolysis of the cell wall. These results suggest the stability of the cell wall constituents of P. expansum. Age does not affect the cell wall composition of Aspergillus clavatus (4) but it affects the cell wall composition of other fungi (7,13).
The chemical composition of P. expansum cell wall resembles that of other species of Pénicillium [see cell wall tables by (3)]. The neutral sugars released by hydrolysis amounted to 3 % of mannose, 3 % of galactose and 37-41 % of glucose. The material solubilized with alkali at 20°C, fraction Fl (30 %), contained mainly glucose (Table 4) and its IR spectrum was characteristic of an a-glucan (Fig. 2). A similar glucan has been reported in the cell wall of Schizophillum commune (18). Fraction F2 (2 %) was characterized as a )5-glucan chitin complex.
74
Since its composition is similar to fraction F4, which is insoluble in alkali at 20 and 70° C, we do not know whether it is a different fraction or it is fraction F4 partially solubilized by the effect of the low temperature (—25°C). Fraction F3 (3 %) was characterized as a j5-glucan, rather resistant to hydrolysis, contained arabinose (1.05 %) and xylose (7 %) in addition to mannose and galactose. Xylose (2.1 %) has been reported in the cell wall of P. chrysogenum (9) and in trace amounts in P. digitatum and P. italicum (8). The presence of xylose in cell walls has been more often reported in Basidiomycetes (2, 17) but its presence in other taxonomical groups can not be ruled out. Fractions F4c and Fill contained 99 % of chitin. Both fractions were formed by glucosamine identified with the amino acid analyzer, and their IR spectra were similar to that of chitin.
The polysaccharidic fraction obtained by IN NaOH extraction, after treatment with H2SO4 , from cell wall (FII) or from Fraction 4 (Fraction F4b) was a j5-glucan containing traces of arabinose and mannose.
The chemical composition of P. expansum cell walls differs from P. allahabadense cell walls (7) indicating that in the genus Pénicillium there are at least two chemotaxonomic groups in agreement with the results of Leal et al. (11).
We thank Dr J. Bellanato of the Instituto de Optica Daza de Valdés for the infrared analysis, and the Consejo Superior de Investigaciones Científicas for the fellowship granted to Dr. B. Gómez-Miranda. This investigation was supported by a grant from the CAICYT.
References
1. Barker, S. A., Bourne, E. J. and Whiffen, D. H. (1956) Use of infrared analysis in the determination of carbohydrate structure. Methods Biochem. Anal. 3, 213-245.
2. Bartnicki-Garcia, S. (1968) Cell wall chemistry, morphogenesis, and taxonomy of fungi. Ann. Rev. Microbiol. 22,87-108.
3. Bartnicki-Garcia, S. and Lippman, E. (1982) Fungal cell wall composition. In: A. I. Laskin and H. Lechevalier (eds.) CRC Handbook of Microbiology, 2nd edition Vol. IV. pp. 229-252, CRC Press, Inc.
4. Corina, D. L. and Munday, K. A. (1971) The metabolic stability of carbohydrates in walls of hyphae of Aspergillus clavatus. J. Gen. Microbiol. 65, 253-257.
5. Dreywood, R. (1946) Qualitative test for carbohydrate material. Industrial and Engineering Chemistry, Anal. ed. 18, 499.
6. Feofilova, E. P. & Tereshina, B. M. (1980) Age-related change in the composition of the cell wall oï Cun-ninghamella japónica. Mikrobiologiya 49, 756-760.
7. Gómez-Miranda, B., Guerrero, C. & Leal, J. A. (1984) Effect of culture age on cell wall polysaccharides of Pénicillium allahabadense. Exp. Mycol. 8, 298-303.
8. Grisaro, V., Sharon, N. and Barkai-Golan, R. (1968) The chemical composition of the cell walls of Pénicillium digitatum Sacc and Pénicillium italicum Whem. J. Gen. Microbiol. 54, 145-150.
9. Hamilton, P. B. and Knight, S. G. (1962) An analysis of the cell walls of Penicilliumn chrysogenum. Arch. Biochem. Biophys. 99, 282-287.
10. Laine, R. A., Esselman, W. J. and Sweeley, C. C. (1972) Gas-liquid chromatography of carbohydrates. Methods Enzymol. 28, 159-167.
11. Leal, J. A., Moya, A., Gómez-Miranda, B., Rupérez, P. and Guerrero, C. (1984) Differences in cell wall polysaccharides in some species of Pénicillium. In: C. Nombela (ed.) Microbial Cell Wall Synthesis and Autolysis, pp. 149-155. Elsevier Science Publishers. B. V. Amsterdan.
75
12. Lowry, O. H., Rosebrough, N. J., Farr, A. L. and Randall, R. J. (1951) Protein measurement with the Folin phenol reagent. J. Biol. Chem. 193, 265-275.
13. Malowitz, R. and Pisano, M. A. (1982) Changes in cell wall carbohydrates composition of Paecilomvces persicinus p-10 M. 1 during growth and Cephalosporin C production. Appl. Environ. Microbiol. 46, 13-16.
14. Martin, J. F., Nicolas, G. and Villanueva, J. R. (1973) Chemical changes in the cell wall of conidia of Pénicillium notatum during germination. Canad. J. Microbiol. 19, 789-796.
15. Rand, M. C , Greenberg, A. E. and Taras, M. J. (1975) Phosphate ascorbic acid method. In: Standard methods for the examination of water and wastewater 14th edition, pp. 481-483.
16. Rondle, C. J. M. and Morgan, W. T. J. (1955) The determination of glucosamine and galactosamine. Biochem. J. 61, 586-589.
17. Weijman, A. C. M. (1979) Carbohydrate composition and taxonomy oí Geotrichum, Trichosporum and allied genera. A.van Leeuwen. 45, 119-127.
18. Wessels, J. G. H., Kreger, D. R., Marchant, R., Regensburg, B. A. and De Vries, O. M. H. (1972) Chemical and morphological characterization of the hyphal wall surface of the basidiomycete Schizophyllum commune. Biochim. Biophys. Acta 273, 346-358.
Microbiología 1 (1985), 77-87 SEM
Expression of the SOS genes oí Escherichia coli in Salmonella typhimurium
Jordi Barbé*, Joan-Albert Vericat, Montserrat Llagostera and Ricardo Guerrero.
Department of Microbiology and Institute for Fundamental Biology, Autonomous University of
Barcelona, Bellaterra. Barcelona - Spain.
Summary
To lysogenize Salmonella typhimurium by Lambda phage, a region of 10.2 kb of Escherichia coli DNA carrying the nus A gene was cloned in a S. typhimurium strain containing a F' l 12 plasmid which codifies for the lamB region of JE coli. The strain oiS. typhimurium obtained in this way, was lysogenized by Aclnd^~ bacteriophage harboring either a fusion between r^c^i ovsfiA genes of ". coli with lacZ gene. Likewise, pSE143 plasmid with a umu C::lacZ fusion was introduced in S. typhimurium. Afterwards, induction of these SOS genes was studied. Results obtained show that the basal transcription of both recA and sjïA genes of ". coli was higher inS. typhimurium than in E. coli. Nevertheless, induction of recA and sJîA genes by UV-irradiation and mitomycin C was higher^in^l coli than in S. typhimurium. On the other hand, umuC gene of ". coli presents the same basal level of transcription in bothK coli and 5. typhimurium species, although induction of this gene by UV-irradiation and mitomycin C was higher in S. typhimurium than in E. coli. Therefore, the plasmid pUA25 constructed in this work may be used to introduce, using the Lambda phage as a vector, the SOS genes ofE. coli in other bacterial species which may be useful to study the relationship between their respective SOS systems. Key words: SOS system, plasmid construction, Lamdda in Salmonella, repair in Enterobacteriaceae, mutagenesis and repair.
Resumen
Se ha subclonado en una cepa de Salmonella typhimurium portadora del plásmido F'l 12 con la region lamB de Escherichia coli, un fragmento de 10.2 kb de DNA de E. coli en el que se encuentra localizado el gen nus A. De esta forma, se ha conseguido que la cepa UA1436 de S. typhimurium sea sensible a la infección por el bacteriófago Lambda. Ello ha permitido, la Hsogenizacion de S. typhimurium por los bacteriófagos Xclnd~ recA::lacZ y \cl\nd~sfiA..lacZ portadores de las fusiones génicas recA::lacZ y
Corresponding author.
78
sflA-.'lacZ de E. coli. Asimismo, se ha introducido en S. typhimurium el plásmido pSE143 portador de una fusión entre el gen umuC de E. coli y el gen lacZ. Una vez obtenidas las cepas de S. typhimurium portadoras de las fusiones génicas citadas, se ha estudiado la expresión de éstas como consecuencia del tratamiento con diferentes agentes inductores del sistema SOS. Los resultados obtenidos demuestran que la transcripción basal de los genes recAy sJíA de E. coli es mayor en S. typhimurium que en su especie de origen. También se ha comprobado que la inducción de estos dos genes por la radiación ultravioleta y la mitomicina C es menor en S. typhimurium que en E. coli. Por el contrario, el gen umuC de E. coli presenta el mismo nivel basal de transcripción en ambas especies, siendo no obstante su tasa de inducción por la radiación ultravioleta y la mitomicina C mayor en S. typhimurium que en E. coli. Por otra parte, utilizando el bacteriófago Lambda y el plásmido pUA25 construido en este trabajo se pueden introducir los genes SOS de E. coli en otras especies bacterianas, lo que facilitará el estudio de las relaciones existentes entre los sistemas de reparación de diferentes géneros bacterianos.
Introduction
In Escherichia coli damage to DNA induces a group of cellular activities called SOS functions (30). This SOS response includes inhibition of cell division, error-prone repair, induction and reactivation of prophages, cessation of respiration, and massive synthesis of RecA protein (Table 1). Nevertheless, expression of the SOS system is not an all-or-nothing process, since some SOS functions may be induced by some treatments but not by others (2, 19). However, all of these SOS functions depend on the recA, lexA and ssb genes. Biochemical studies on the RecA protein have shown that it can act as a specific «protease, after activation by some signal such as single strand DNA fragments generated by DNA damage, cleaving the repressor that controls phage induction (26). It also cleaves the LexA protein, which in normal conditions represses the recA gene along with the other genes involved in the SOS réponse (9, 22). This derepression leads to the formation of large amounts of RecA protein, which, upon activation, cleaves the LexA protein that controls the target genes and causes the induced system to become functional. In a surviving cell, DNA repair decreases generation of the signal for RecA protein activation so that the protease level decreases, repressors accumulate, and all induced genes become repressed. Recently, it has been shown that the UV-mediated induction of SOS system depends on the RecBC-exonuclease activity, in both generation of single strand regions in the DNA and ATP production which is used in vivo as a cofactor to LexA repressor cleavage by RecA protease (3, 4). Likewise, SOS system expression may be stimulated by increasing intracellular ATP concentration by addition of adenine (8, 20). Furthermore, a number of bacteria have been shown to induce physiological responses or new proteins or both, in the presence of agents such as UV-radiation which induce the SOS réponse in E. coli The list of such bacteria includes S. typhimurium (14), Proteus mirabilis (15), Haemophilus influenzae (25), Efacteroides fragilis (28), Bacillus subtilis (13) and Rhodobacter capsulatus (Barbé et al, submitted). Nevertheless, some bacteria related ioE. coli such as S. typhimurium or P. mirabilis present an increased UV-sensitivity in comparason toE. coli (16, 21). For this

79
reason, and to determine the possible causes of this behaviour of S. typhimurium, we have studied the expression of three SOS genes ofE. coli (i. e. recA, sJiA and umuC) in S, typhimurium using respectively a Lambda bacteriophage with either recA'dacZ or sJîA'.'lacZ fusions and a plasmid with a umuC::lacZ fusion. Due to the fact that Lambda bacteriophage cannot replicate in Salmonella spp as these bacteria lack a host function needed for Lambda growth (6), we have constructed a plasmid with the nusA gene ofE. coli which when introduced in Salmonella sensitizes the later to Lambda phage.
Materials and Methods
Bacteria, Bacteriophage and Plasmids
Bacterial strains used are listed in Table 2. The phage used was Xvir from our collection. Plasmids pEH28 and pMC874 were provided by E. H. Holowachuk and M. Casadaban, respectively.
TABLE 1.
GENES OF ESCHERICHIA COLI REGULATED BY THE Lex A REPRESSOR*
Gene Map location Function (min)
recA lexA uvrA uvrB umuC sfiA him A dinA dinB dinD dinF
Plasmid genes muc on pKMlOl colEl on pColEl
* Modified of (24).
Media and growth conditions
All treatments (UV-irradiation, and mitomycin C or bleomycin addition) were applied to cultures growing at 37°C with shaking in liquidai minimal medium AB (11) supplemented with thiamine (10 /xg ml-i), glucose (0.2 %, w/v) and casaminoacids (0.4 w/v). When necessary, LB (24) was used as a rich medium. Cells treated with mitomycin C were grown in AB medium adjusted to pH 5.5 since this pH is optimal for the action of this compound (24). Mitomycin C (spec. act. 4 %) and 5-bromo-4-chloro-3-indolyl j3-D~galactopyranoside (X-Gal) were obtained from Sigma, bleomycin from Laboratorios Almirall (Barcelona, Spain), and o-nitrophenil-/5-D-galactopyranoside from Fluka. Aminoacids, vitamins and mineral salts were purchased from Merck and tryptone, yeast extract and agar from Oxoid. Ampicillin, streptomycin and kanamycin were a generous gift from Antibióticos, S. A. (León, Spain).
58 91 92 17 25 22 38
2 8
80-85 91
_ —
General recombination, protease SOS repressor Excision repair Excision repair Mutagenesis Cell division inhibitor Site-specifíc recombination Unknown Unknown Unknown Unknown
Mutagenesis Synthesis of coHcin El
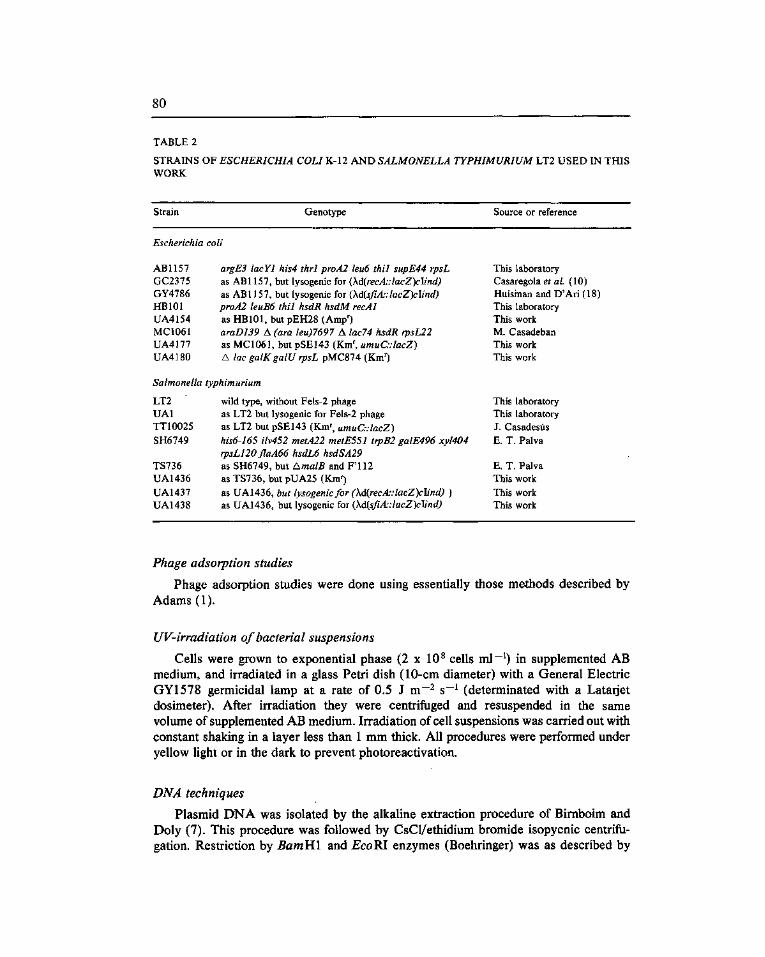
80
TABLE 2
STRAINS OF ESCHERICHIA COLI K-12 AND SALMONELLA TYPHIMURIUM LT2 USED IN THIS WORK
Strain Genotype Source or reference
Escherichia col i
AB1157 argE3 lacYl his4 thrl proA2 leu6 thil supE44 rpsL GC2375 as ABl 157, but lysogenic for {\direcA::lacZ)clind) GY4786 as ABl 157, but lysogenic for {\á{sfiA::lacZ)c\ind) HBlOl proA2 leuB6 thil hsdR hsdM recAl UA4154 as HBlOl, but pEH28 (Amp"") MC1061 araD139 A (ara leu)7697 A lac74 hsdR rpsL22 UA4177 as MC1061, but pSE143 (Km^ umuC::lacZ) UA4180 A lac galK galU rpsL pMC874 (KmO
Salmonella typhimurium
LT2 wild type, without Fels-2 phage UAl as LT2 but lysogenic for Fels-2 phage TT10025 as LT2 but pSE143 (Km , umuC::lacZ) SH6749 his6-165 ilv452 metA22 metE551 trpB2 galE496 xyl404
rpsL120 flaA66 hsdL6 hsdSA29 TS736 as SH6749, but AmalB and F'112 UAl436 as TS736, but pUA25 (Km--) UA1437 as UA1436, but lysogenic for (\á{recA::lacZ)clind) ) UA1438 as UA1436, but lysogenic for {\á{sfiA::lacZ)c\ind)
This laboratory Casaregola ef a/. (10) Huisinan and D'Ari (18) This laboratory This work M. Casadeban This work This work
This laboratory This laboratory J. Casadesús E. T. Palva
E. T. Palva This work This work This work
Phage adsorption studies
Phage adsorption studies were done using essentially those methods described by Adams (1).
UV-irradiation of bacterial suspensions
Cells were grown to exponential phase (2 x 10^ cells ml"~0 in supplemented AB medium, and irradiated in a glass Petri dish (10-cm diameter) with a General Electric GY1578 germicidal lamp at a rate of 0.5 J m~^ s~^ (determinated with a Latarjet dosimeter). After irradiation they were centrifuged and resuspended in the same volume of supplemented AB medium. Irradiation of cell suspensions was carried out with constant shaking in a layer less than 1 mm thick. All procedures were performed under yellow light or in the dark to prevent photoreactivation.
DNA techniques
Plasmid DNA was isolated by the alkaline extraction procedure of Birnboim and Doly (7). This procedure was followed by CsCl/ethidium bromide isopycnic centrifu-gation. Restriction by BamHl and EcoKl enzymes (Boehringer) was as described by
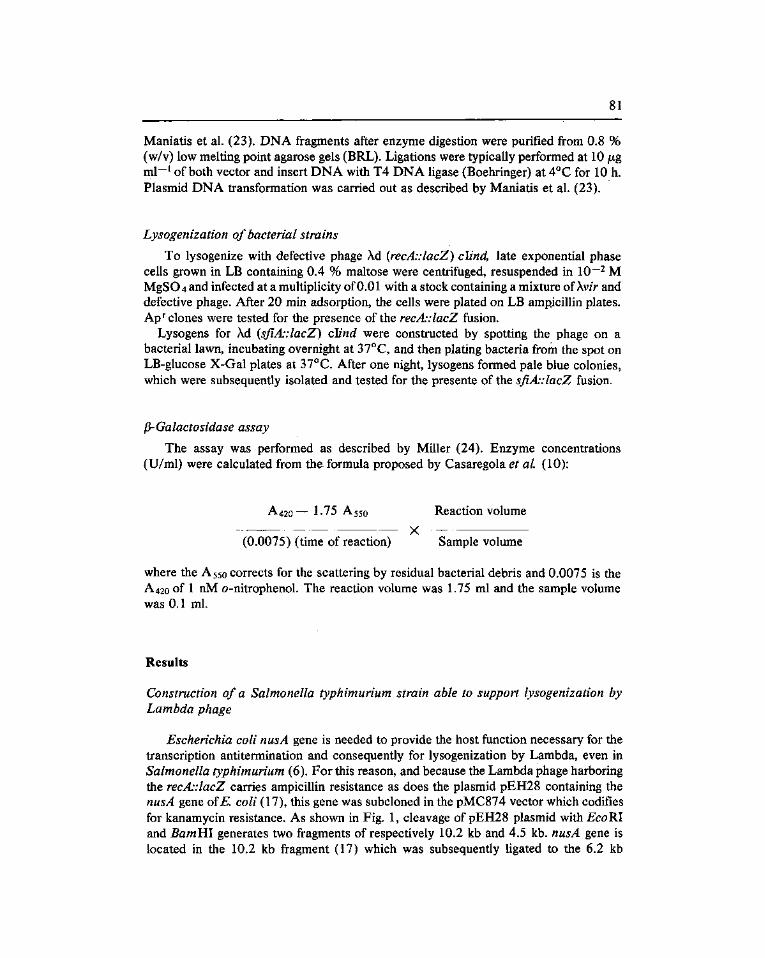
Maniatis et al. (23). DNA fragments after enzyme digestion were purified from 0.8 % (w/v) low melting point agarose gels (BRL). Ligations were typically performed at 10 jixg ml~^ of both vector and insert DNA with T4 DNA ligase (Boehringer) at 4°C for 10 h. Plasmid DNA transformation was carried out as described by Maniatis et al. (23).
Lysogenization of bacterial strains
To lysogenize with defective phage Ad {recA::lacZ) clind, late exponential phase cells grown in LB containing 0.4 % maltose were centrifuged, resuspended in 10 "- M MgSO 4 and infected at a multiplicity of 0.01 with a stock containing a mixture of Xv/r and defective phage. After 20 min adsorption, the cells were plated on LB ampicillin plates. Ap* clones were tested for the presence of the recA':lacZ fusion.
Lysogens for Xd (sJIA'dacZ) clind were constructed by spotting the phage on a bacterial lawn, incubating overnight at 37°C, and then plating bacteria from the spot on LB-glucose X-Gal plates at 37°C. After one night, lysogens formed pale blue colonies, which were subsequently isolated and tested for the presente of the sfiA-:lacZ fusion.
p-Galactosidase assay
The assay was performed as described by Miller (24). Enzyme concentrations (U/ml) were calculated from the formula proposed by Casaregola et ai (10):
A420— 1-75 A550 Reaction volume
X ^ (0.0075) (time of reaction) Sample volume
where the A550 corrects for the scattering by residual bacterial debris and 0.0075 is the A420 of 1 nM o-nitrophenol. The reaction volume was 1.75 ml and the sample volume was 0.1 ml.
Results
Construction of a Salmonella typhimurium strain able to support lysogenization by Lambda phage
Escherichia coli nus A gene is needed to provide the host function necessary for the transcription antitermination and consequently for lysogenization by Lambda, even in Salmonella typhimurium (6). For this reason, and because the Lambda phage harboring the recA::lacZ carries ampicillin resistance as does the plasmid pEH28 containing the nusA gene oïE. coli (17), this gene was subcloned in the pMC874 vector which codifies for kanamycin resistance. As shown in Fig. 1, cleavage of pEH28 plasmid WiihEcoKl and BamHl generates two fragments of respectively 10.2 kb and 4.5 kb. nusA gene is located in the 10.2 kb fragment (17) which was subsequently hgated to the 6.2 kb

82
.Eco RI EœRI
92kb
Kam nus A
T4 DNA Ligase ECQRI
Kam
BamHI Hiûdin
nus A
Fig. 1. Cloning of the chromosomal nusA region of Escherichia coli from plasmid pEH28 into pHC873. Both plasmids were cleaved with EcoRI and BamHI enzymes and the largest fragment of each plasmid was then ligated to the other to obtain plasmid pUA25 thus harboring both the nusA gene and the kanamycin resistance.
fragment of the plasmid pMC874 obtained after double digestion of this plasmid by EcoBJ and BamBI enzymes (Fig. 1). The plasmid obtained, pUA25, was used to transform strain TS736 (a strain carrying the F'l 12 plasmid which has the lamB region of E. coli necessary for Lambda adsorption) selecting for kanamycin-resistant clones. The ability of the resulting strain, UA1436, to support both Lambda adsorption and growth was tested. Fig. 2 shows that X phage can adsorb to the Salmonella strain UA1436 as efficiently as toE. coli strain. On the contrary, there was no adsorption to the S. typhimurium SH6749 control straing. Furthermore, the efficiency of plating of Xvir phage on UA1436 and E. coli AB1157 was practically the same, whereas this same phage was unable to produce any plaque when strain TS736 of 5. typhimurium was used as an indicator, showing that plasmid pUA25 sensitizes S. typhimurium to Lambda.
Induction of SOS genes of Escherichia coli in Salmonella typhimurium.
It has been described (21) that Salmonella typhimurium LT2 is more sensitive to UV-irradiation than^. coli. Nevertheless, this increased UV-sensitivity of AS. typhimurium can not be attributed to the presence of prophages, because strains of this bacterium which have lost these prophages (27) already show a higher sensitivity than JEI coli (Fig. 3A). Futhermore, S. typhimurium and E. coli show the same resistance to both mitomycin C and bleomycin (Fig. 3B) which are two strong prophage-inducing compounds.
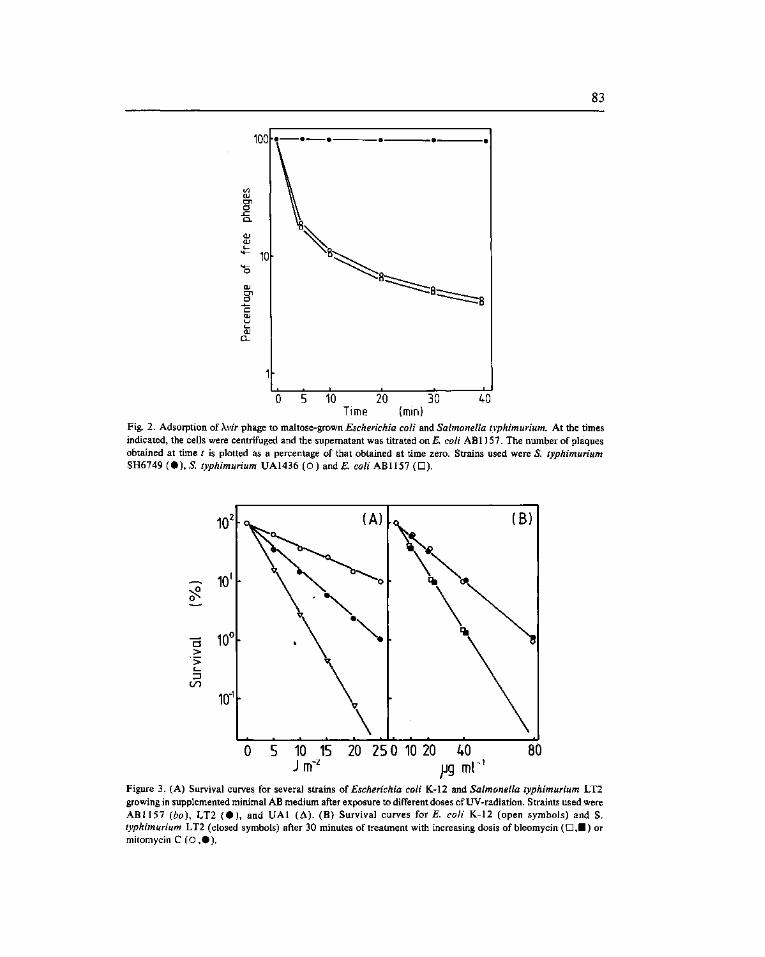
83
5 10 20 30 40 Time (min)
Fig. 2. Adsorption of Xvir phage to maltose-grown Escherichia coli and Salmonella typhimurium. At the times indicated, the cells were centrifuged and the supernatant was titrated onE. coli AB1157. The number of plaques obtained at time t is plotted as a percentage of that obtained at time zero. Strains used were S. typhimurium SH6749 ( • ) , S typhimurium UA1436 {0)anáE. coli AB1157 (D).
10
^ 10'
^ 10° > >
c/)
10"
0 5 10 15 20 25 0 10 20 40 80
Figure 3. (A) Survival curves for several strains of Escherichia coli K-12 and Salmonella typhimurium LT2 growing in supplemented minimal AB medium after exposure to different doses of UV-radiation. Straints used were ABUS? (bo), LT2 ( • ) , and UAl (A). (B) Survival curves for E. coli K-12 (open symbols) and S. typhimurium LT2 (closed symbols) after 30 minutes of treatment with increasing dosis of bleomycin (D,B) or mitomycin C (O , • ) .
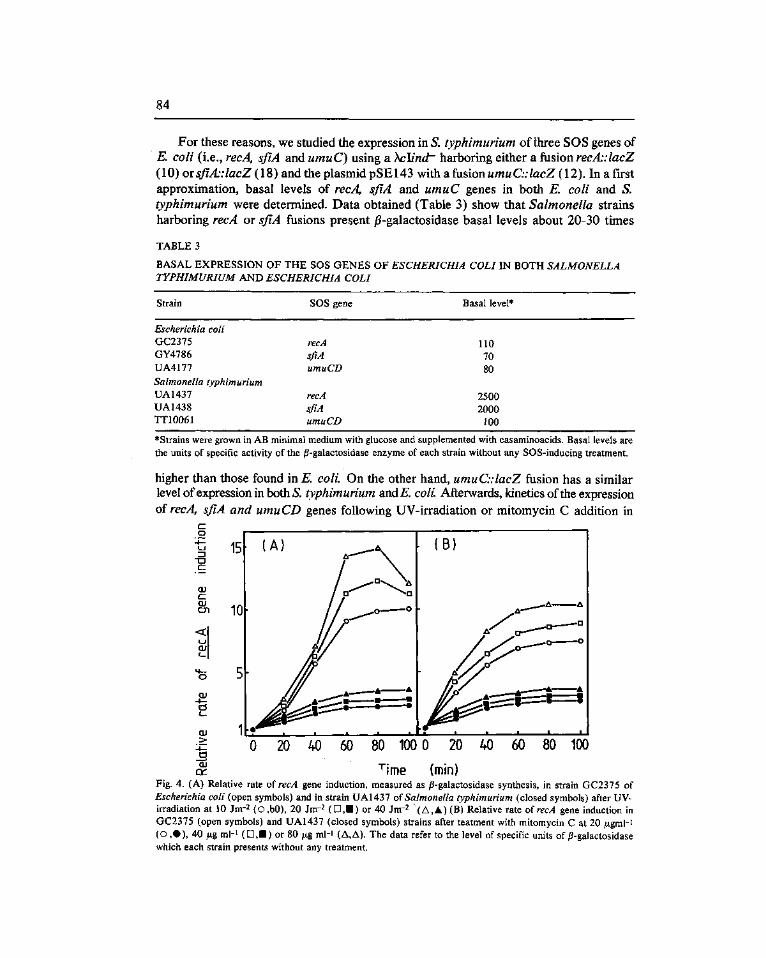
84
For these reasons, we studied the expression in S. typhimurium of three SOS genes of E. coli (i.e., recA, sJïA and umuC) using a }\clind~ harboring either a fusion recA':lacZ (10) orsJîA-.'lacZ (IS) and the plasmid pSE143 with a fusion umuC::lacZ (12). In a first approximation, basal levels of recA sJiA and umuC genes in both E. coli and S. typhimurium were determined. Data obtained (Table 3) show that Salmonella strains harboring recA or sflA fusions present jS-galactosidase basal levels about 20-30 times
TABLE 3
BASAL EXPRESSION OF THE SOS GENES OF ESCHERICHIA COLI IN BOTH SALMONELLA TYPHIMURIUM AND ESCHERICHIA COLI
Strain SOS gene Basal level*
Escherichia coli GC2375 GY4786 UA4177 Salmonella typhimurium UA1437 UA1438 TT10061
recA sfiA umuCD
recA sfiA umuCD
110 70 80
2500 2000
100
*Strains were grown in AB minimal medium with glucose and supplemented with casaminoacids. Basal levels are the units of specific activity of the j3-galactosidase enzyme of each strain without any SOS-inducing treatment.
higher than those found inE. coli. On the other hand, umuC::lacZ fusion has a similar level ofexpression in both *S. typhimurium einúE. coli. Afterwards, kinetics of the expression of recA, sfiA and umuCD genes following UV-irradiation or mitomycin C addition in
O
CLI C
CJI
<
CLI
CU >
CU Tir Mme (min) Fig. 4. (A) Relative rate oï recA gene induction, measured as ^-galactosidase synthesis, in strain GC2375 of Escherichia coli (open symbols) and in strain UA1437 oí Salmonella typhimurium (closed symbols) after UV-irradiation at 10 Jm-^ (o ,bO), 20 Jm~2 (D,H) or 40 Jm-2 (A,A) (B) Relative rate of recA gene induction in GC2375 (open symbols) and UA1437 (closed symbols) strains after teatment with mitomycin C at 20 /xgml-i (O , • ) , 40 jLig ml-i (D,B) or 80 ¡xg ml-i (A,A). The data refer to the level of specific units of/3-galactosidase which each strain presents without any treatment.
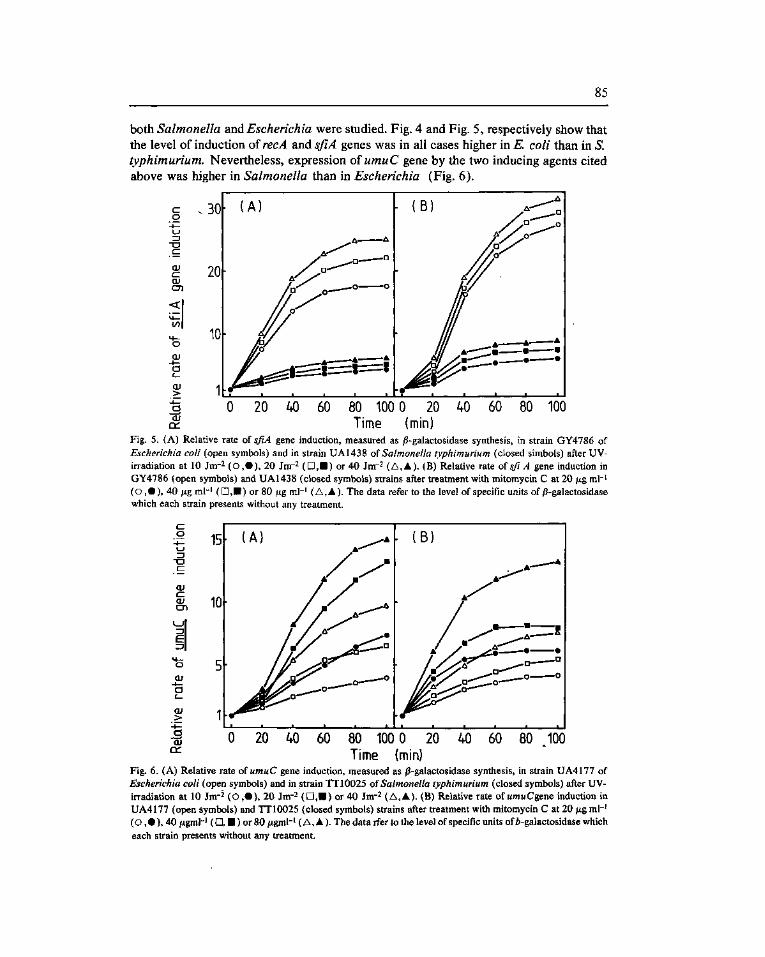
85
both Salmonella and Escherichia were studied. Fig. 4 and Fig. 5, respectively show that the level of induction of recA and sJïA genes was in all cases higher in E. coli than in S. typhimurium. Nevertheless, expression oiumuC gene by the two inducing agents cited above was higher in Salmonella than in Escherichia (Fig. 6).
-a
cu
o QJ
c_
OU
> cu
ce
80 100 0 20 Time (min)
Fig. 5. (A) Relative rate of sfiA gene induction, measured as ^-galactosidase synthesis, in strain GY4786 of Escherichia coli (open symbols) and in strain UA1438 of Salmonella typhimurium (closed simbols) after UV-irradiation at 10 Jm-2 (O ,# ) , 20 Jm-^ (D,B) or 40 Jm-2 (A,A). (B) Relative rate of sfi A gene induction in GY4786 (open symbols) and UA1438 (closed symbols) strains after treatment with mitomycin C at 20 /xg mh' (O , • ) , 40 jLtg mh' ( • , • ) or 80 jUg mi- (A,A). The data refer to the level of specific units of jS-galactosidase which each strain presents without any treatment.
cu 20 40 60 40 60 80 100 80 100 0 20 Time (min)
Fig. 6. (A) Relative rate of umuC gene induction, measured as ^-galactosidase synthesis, in strain UA4177 of Escherichia coli (open symbols) and in strain TT10025 of Salmonella typhimurium (closed symbols) after UV-irradiation at 10 Jm-2 (o , • ) , 20 Jm-2 (D,B) or 40 Jm-^ (A,A). (B) Relative rate of wmwCgene induction in UA4177 (open symbols) and TT10025 (closed symbols) strains after treatment with mitomycin C at 20 /xg mh^ (O , • ) , 40 jLtgmh (D, • ) or 80 figmt^ ( A, A ). The data rfer to the level of specific units of Z)-galactosidase which each strain presents without any treatment.
86
Discussion
Results presented in this work show that the expression oirecA, sfiA and umuC genes oí Escherichia coli may be triggered in Salmonella typhimurium by the two SOS-inducing agents UV-irradiation and mitomycin C. Furthermore, the basal level of transcription of both recA and sfiA genes was higher in S. typhimurium than in E. coli showing that the LexA repressor oí Salmonella is able to block the expression of these genes, although with a lower specificity than in E. coli.
Nevertheless, umuC gene presents the same level of basal expression in both bacterial species, suggesting that the specificity of LexA repressor is different for the several SOS genes, and at least in E, coli and S. typhimurium this specificity is very similar in some SOS genes such as umuC. In relation to this, it has been shown that umuC gene is not triggered by weak SOS-inducing agents such as nalidixic acid (4) or 5-azacytidine (5), although both compounds are able to induce other SOS genes, likQsJîA. AU these results give support to the idea that the LexA repressor binding specificity is different for each SOS gene. Therefore, this factor could explain the previously reported discriminated induction of the several SOS functions in relation to the inducing treatment and the extension of the SOS-inducing signal generated (2, 5). Moreover, and with independence of the basal transcription of the three genes studied, these genes showed a different level of induction in S. typhimurium and inE. coli when both were treated with either UV-radiation or mitomycin C. Thus, expression oirecA and sfiA genes was lower in Salmonella than in Escherichia (Fig. 4 and Fig. 5). These results could explain the higher sensitivity of & typhimurium to UV-radiation in comparison toE. coli. Nevertheless, the answer to the question why induction oiumuC gene was higher in Salmonella than in Escherichia (Fig. 6) is so far unknown and requires further study. Finally, the system described in this paper to introduce XrecA::lacZ and XsJlA'.'lacZ phages in Salmonella is quite easy to perform and may also be successfully apphed to other bacteria to study the existence of SOS genes as well as to determine the relationship between these genes in different bacterial species.
Acknowledgements
We thanks Drs. M. Blanco, J. Casadesús, M. Casadaban, R. D'Ari, E. W. Holowachuk and E.T. Palva for their generous gifts of several bacterial strains or plasmids, and J. M. Cuartero for drawing the figures. This work was supported by a grant of the Comisión Asesora de Investigación Científica y Técnica, Spain.
References
1. Adams, M. H. (1959) Bacteriophages. Interscience Publishers. Inc., New York. 2. Barbé, J., Vericat, J. A. and Guerrero, R. ( 1983) Discriminated induction of SOS functions in Escherichia coli
by alkylating agents. J. Gen. Microbiol. 129, 2079-2089. 3. Barbé, J., Villaverde, A. and Guerrero, R. (1983) Evolution of celular ATP concentration after UV-mediated
induction of SOS system in Escherichia coli. Biochem. Biophys. Res. Commun. 117, 556-561.
87
' 4. Barbe, J., Vericat, J. A., Cairo, J. and Guerrero, R. (1985) Further characterization of SOS system induction in recBC mutants of Escherichia coli. Mutation Res. 146, 23-32.
5. Barbé, J., Gibert, I. and Guerrero, R. (1985) 5-azacytidine: survival and induction of SOS system in Escherichia coli K12. Mutation Res. (in press).
6. Barón, L. S., Ryman, I. R., Johnson, E. M. and Gemski, P. (1972) Lytic replication of coliphage lambda in Salmonella typhosa hybrids. J. Bacteriol. 110, 1022-1031.
7. Bimboim, H. C. and Doly, J. (1979) A rapid alkahne extraction procedure for screening recombinant plasmid DNA. Nucl. Acids Res. 7, 1513-2524.
8. Blanco, M., Herrera, G., Collado, P. Rebollo, J. E. and Botella, M. L. (1982) Influence of RecA protein on induced mutagenesis. Biochimie 64, 633-636.
9. Brent, R. and Ptashne, M. (1981) Mechanism of action of the lexA gene product. Proc. Natl. Acad. Sci. USA 78, 4204-4208.
10. Casaregola, S., D'Ari, R. and Huisman, O. (1982) Quantitative evaluation oï recA gene expression in Escherichia coli. Mol. Gen. Genet. 185, 430-439.
11. Clark, D. J. and Maaloe, O. (1967) DNA replication and the division cycle oï Escherichia coli. J. Mol. Biol. 23,99-112.
12. Elledge, S. J. and Walker, G. (1983) Proteins required for ultraviolet light and chemical mutagenesis in Escherichia coli: identification of the products of the umuC locus. J. Mol. Biol. 164, 175-192.
13. Fields, P. L and Yasbin, R. E. (1983) DNA repair in Bacillus subtilis: an inducible dimer specific W-reactivation system. Mol. Gen. Genet. 190, 475-480.
14. Guerrero R. and Barbé, J. (1982) Expression oïrecA-gQViQ dependent SOS functions in Salmonella typhimu-rium. Ant. van Leeuw. 48, 159-167.
15. Hofemeister, J. (1977) DNA repair in Proteus mirabilis. Mol. Gen. Genet. 154, 35-41. 16. Hofemeister, J. and Bohme, H. (1975) DNA repair mProteus mirabilis. IIL Survival, dimer excision and UV-
reactivation in comparison with Escherichia coli K-12. Mol. Gen. Genet. 141, 147-161. 17. Holowachuk, E. W. and Friesen J. D. (1982) Isolation of a recombinant Lambda phage carrying A?«5.4 and
surrounding region of the Escherichia coli K-12 chromosome. Mol. Gen. Genet. 187, 248-253. 18. Huisman, O. and D'Ari, R. (1983) Effect of supressors of SOS-mediated filamentation on sfiA operon
expression in Escherichia coli. J. Bacteriol. 153, 169175. 19. Hutchinson, T. and Stein, J. (1980) Mutagenesis of ultraviolet-irradiated lambda phage by host cell irradiation:
induction of Weigle mutagenesis is not an all-or-none process. Mol. Gen. Genet. 177, 207-211. 20. Llagostera, M., Guerrero, R., Villaverde, A. and Barbé, J. (1985) Effect of adenine, cytidine and guanosine on
the expression of the SOS system in Escherichia coli. J. Gen. Microbiol. 131, 113-118. 21. Kondratiev, Y. S., Brukhansky, G. V., Andreeva, I. V. and Skavronskaya, A. G. (1977) UV-sensitivity and
repair of UV-damages in Salmonella of wild type. Mol. Gen. Genet. 158, 211-214. 22. Little, J. W., Mount, D. W. and Yanislf-Perron, C. (1981) Purified/ex^ protein is a repressor of the recA and
lexA genes. Proc. Natl. Acad. Sci. USA 78, 4199-4203. 23. Maniatis, T., Fritsch, E. F. and Sambrook, J. (1982) Molecular cloning. A Laboratory Manual. Cold Spring
Harbor Laboratory, New York. 24. Miller, J. H. (1972) Experiments in Molecular Genetics. Cold Spring Harbor Laboratory, New York. 25. Notani, N. K. and Setlow, J. E. (1980) Inducible repair system in Haemophilus influenzae. J. Bacteriol.
143, 516-519. 26. Roberts, J. W., Roberts, C. W. and Craig, N. L. (1978) Escherichia coli recA gene product inactivates phage
\ repressor. Proc. Natl. Acad. Sci. USA 75, 4714-1718. 27. Sanderson, K. A. and Hartman, P. E. (1978) Linkage map of Salmonella typhimurium, edition V. Microbiol.
Rev. 42, 471-519. 28. Schumann, J. P., Jones, D. T. and Woods, D. R. (1982) UV-light induction of proteins in Bacteroides frágil is
under anaerobic conditions. J. Bacteriol. 151, 44-47. 29. Walker, G. (1984) Mutagenesis and inducible responses to deoxyribonucleic acid damage in Escherichia coli.
Microbiol. Rev. 48, 60-93. 30. Witkin, E. M. (1976) Ultraviolet mutagenesis and inducible DNA repair in Escherichia coli. Bacteriol. Rev.
40, 869-907.
Microbiología 1 (1985), 89-96 SEM
Isolation and characterization of moderately halophilic nonmotile rods from different saline habitats
Emilia Quesadai, Victoria Bejari, Maria José Valderrama^, Antonio Ventosa^, and Alberto Ramos Cormenzanai*
1 Departament of Microbiology, Faculty of Pharmacy, University of Granada, Granada - Spain.
2 Departament of Microbiology, Faculty of Pharmacy, University of Sevilla, Sevilla - Spain.
Summary
A total of 736 strains were isolated from samples taken from three different saline habitats: solar saltern, saline soils and the sea, near Alicante (Spain). For a further study 60 moderately halophilic nonmotile rods were selected and studied for 57 phenotypic characteristics. The highest proportion of moderately halophilic nonmotile rods were isolated from saHne soils and in media with 10 or 20 % salts, being very scarce in sea water samples. All were Gram-negative rods and were included in two groups: 33 oxidase positive strains could be assigned to the genus Flavobacterium and 24 oxidase negative strains to the genus Acinetobacter,
Key words: Halophilic bacteria, Flavobacterium, Acinetobacter
Resumen
Se aislaron un total de 736 cepas de muestras tomadas de diferentes habitats salinos: salina solar, suelos salinos y mar, en la provincia de AHcante (España). Posteriormente se seleccionaron 60 bacilos inmóviles halófilos moderados a los que se les reahzó un estudio taxonómico de 57 caracteres fenotípicos. La mayor proporción de estas cepas procedían de las muestras de suelos salinos y fueron aisladas en los medios que contenían 10 ó 20 % de sales. Sin embargo, en las muestras de agua de mar se seleccionó un número muy pequeño de estos microorganismos. Todos ellos eran bacilos Gram negativos halófilos moderados y se incluyeron en dos grupos: 33 cepas oxidasa positivas fueron asignadas al género Flavobacterium y 27 cepas oxidasa negativas al género Acinetobacter.
Introduction
Moderately halophilic bacteria are defined as those which can grow optimally in media containing 3-15 % NaCl (9). They are widely distributed in different saline habitats: solar saltern (17, 20), hypersaline lakes (10), saline soils (14,15) and sea water (4, 22). Taxonomically they are a very heterogeneous group, including both Gram-positive and Gram-negative bacteria. Whereas the Gram-positive are better defined
Corresponding author.

90
(2, 11, 12, 21), the Gram-negative moderately halophilic bacteria, the most abundant group in the habitat studied, are represented only by Vibrio costicola (8) and Deleya halophila (16). Other species reported as «Flavobacterium halmophilum» and «Pseudomonas halosaccharolytica» are not considered validly published (8).
We have previously studied the aerobic and facultatively anaerobic motile, moderately halophilic rods, from saltern and sahne soils (15, 16, 20). The purpose of this paper has been to isolate and characterize the nonmotile moderately halophilic rods from three different saline habitats: solar saltern, saline soils and sea. We have also determined the distribution of these bacteria in the different habitats and some physico-chemical parameters of the samples.
Materials and Methods
Sample collection and physico-chemical determinations Samples were collected from three different places: the water samples were taken
from the solar saltern «Bras de Port» and from the Mediterranean coast, and soil samples from an abandoned solar saltern, all of them located near Alicante (Spain). The description of these places has been made previously (14, 20). Two samplings were effectuated on July 1984 and January 1985, getting twenty samples from the solar saltern, ten samples from the sahne soils and six samples from sea water. The methods for the sampHng and physico-chemical determinations (pH, % total salts and % CI" content) have been described previously (14, 20).
Isolation and selection of the strains Isolation media contained: yeast extract (Difco), 1 %; proteose-peptone n^. 3
(Difco), 0.5 %; glucose, 0.1 %; Bactoagar (Difco), 2 %, supplemented with a balanced mixture of seasalt, according to Subow (19), giving the following final concentrations: 0.5, 5, 10, 20 and 25 %. In the case of the samples from solar saltern, the isolation media used were modified according to Ventosa et al (20). Isolation conditions have been described previously (14, 15, 20). A few colonies were randomly selected per plate up to a total of 736 and successively subcultured on the same medium to ensure purity. For further study, the motility and the salt response of the strains were determined, and 60 nonmotile moderately halophilic rods were selected. The range of growth of the isolates at different salt concentrations was determined on the above isolation medium with 0, 0.5, 3, 5, 7.5, 10, 12.5, 15, 20, 25 or 30 % total salts. The optimun concentration was considered to be that in which a visible growth appeared first.
Reference strains For comparison the following strains from culture collections were used: Deleya
halophila CCM 3662, Vibrio costicola NCMB 701, «Chromobacterium marismortui» ATCC 17056 and «Pseudomonas halosaccharolytica» CCM 2851. Quotation marks indicate those species which are not in the «Approved Lists of Bacterial Names» (18).
Maintenance medium The strains were mantained on agar slants of a medium containing 7.5 % total salts.
91
The final composition of this medium was (%): NaCl, 6.07; MgCl2, 0.5; MgSo4, 0.74; CaCl2,0.027; KCl, 0.15; NaC03H, 0.0045; NaBr, 0.0019, supplemented with nutrients as in the isolation medium.
Characterization of the isolates The 60 selected strains were examined for 57 phenotypic characteristics, according to
previous studies (15, 16, 20) and following the recommendations of the Bergey's Manual (8), Holmes et al (5, 6, 7) and Yabuuchi et al (23). The tests were carried out in media with 7.5 % total salts and the pH was adjusted to 7.2. The incubation temperature was 32°C.
The phenotypic tests investigated were: Gram reaction, catalase, oxidase, anaerobic growth, Hugh-Leifson test, growth at pH 5, 6, 7, 8, 9 or 10 and at 5, 15, 25, 32, 37, 40 or 45°C, acid production from L^arabinose, D-cellobiose, D-fructose, D-galactose, D-glucose, me^o-inositol, lactose, maltose, D-mannitol, D-mannose, salicin, sucrose, and D-xylose, nitrate and nitrite reduction, H2S production, indole, methyl-red, Voges-Proskauer, urease hydrolysis, selenite reduction, gluconate oxidation, phenylalanine deaminase, growth on KCN, cetrimide-agar and Mac Conkey agar, casein, gelatin, starch, Tween 20, Tween 80, esculin and tyrosine hydrolysis, haemolysis, phosphatase, DNAase and lecithinase production and piocianin and fluorescein pigments production.
Results
Physico-chemical parameters Table 1 shows the results of the physico-chemical characteristics of the different
samples studied, corresponding to the sampling carried out on July 1984. The data of these parameters were very similar in the second sampling, and therefore have been omited. It is remarkable the neutral or slightly alkaline pH, and the wide range of salinities of the samples. There was a correlation between the percentage of CI" and the total salt content in all samples, except in those from saline soils, where the NaCl is not the most important salt.
Bacterial biota The results of the bacterial counts, corresponding to the sampling on July 1984 of the
three habitats studied isolated in media with different salt concentrations are shown in Figure 1. In this figure is expressed the logarithm of the number of colony forming units, per milliliter of water or gram of soil. Those results correspond to the average of all the samples of each habitat studied for the same saline concentration used in the isolation media, because the standard deviation was very low. The results of the sampling of January 1985 were very similar to those showed in Figure 1. This fact can be explained because of the climatic characteristic of this region and in fact this homogeneity has been observed in a previous study (14).

92
TABLE 1
PHYSICO-CHEMICAL PARAMETERS IN THE SAMPLES OF THE THREE SALINE HABITATS STUDIED
Sample pH Total salt content (%) CI content (%)
X Y Z
Soil A B C D E
Solar saltern 0 1. 2 3 4. 5 6 7 8 9
8.0 8.2 8.3
8.4 8.2 7.9 8.1 7.9
8.1 7.7 7.6 7.6 7.2 7.2 7.2 7.5 7.0 7.5
4.5 4.9 4.9
33.0 35.3 29.7 42.2 14.3
28.7 35.3 37.2 39.0 45.1 35.3 43.2 41.7 48.6 41.2
2.3 2.3 2.2
2.4 3.3 4.0 5.1 5.9
14.7 21.9 20.9 22.1 23.2 21.6 22.6 22.7 24.4 23.2
O S
o s m
i u. O 2
(/) I-z D O ü
g QC UJ
5
9 o o 0.5 % SAITS IN
10 20 ISOLATION MEDIA
25
Fig. 1. Histogram showing the average number of viable bacterial counts in media with different salt concentrations (0.5, 5, 10, 20 and 25 % salts) for the three habitats studied (D = sea; • = saline soil; D = solar saltern).
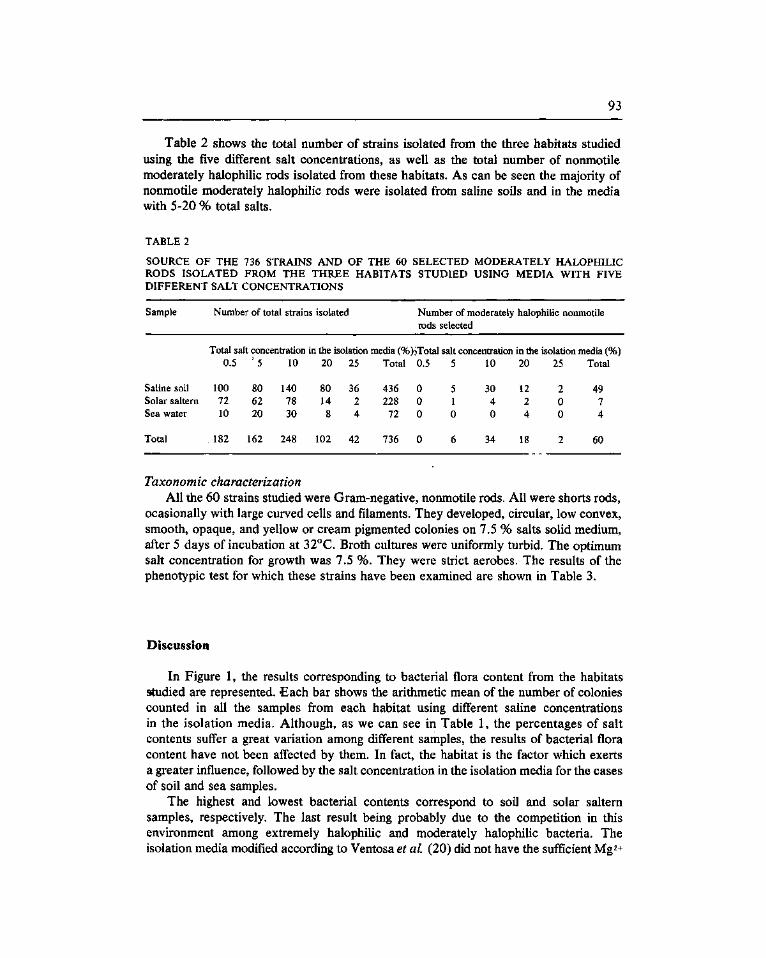
93
Table 2 shows the total number of strains isolated from the three habitats studied using the five different salt concentrations, as well as the total number of nonmotile moderately halophilic rods isolated from these habitats. As can be seen the majority of nonmotile moderately halophilic rods were isolated from saline soils and in the media with 5-20 % total salts.
TABLE 2
SOURCE OF THE 736 STRAINS AND OF THE 60 SELECTED MODERATELY HALOPHILIC RODS ISOLATED FROM THE THREE HABITATS STUDIED USING MEDIA WITH FIVE DIFFERENT SALT CONCENTRATIONS
Sample Number of total strains isolated Number of moderately halophilic nonmotile rods selected
Total salt concentration in the isolation media (%)}Total salt concentration in the isolation media (%) 0.5 ' 5 10 20 25 Total 0.5 5 10 20 25 Total
Saline soil Solar saltern Sea water
Total
100 72 10
182
80 62 20
162
140 78 30
248
80 14 8
102
36 2 4
42
436 228
72
736
0 0 0
0
5 1 0
6
30 4 0
34
12 2 4
18
2 0 0
2
49 7 4
60
Taxonomic characterization All the 60 strains studied were Gram-negative, nonmotile rods. All were shorts rods,
ocasionally with large curved cells and filaments. They developed, circular, low convex, smooth, opaque, and yellow or cream pigmented colonies on 7.5 % salts solid medium, after 5 days of incubation at 32°C. Broth cultures were uniformly turbid. The optimum salt concentration for growth was 7.5 %. They were strict aerobes. The results of the phenotypic test for which these strains have been examined are shown in Table 3.
Discussion
In Figure 1, the results corresponding to bacterial flora content from the habitats studied are represented. Each bar shows the arithmetic mean of the number of colonies counted in all the samples from each habitat using different saline concentrations in the isolation media. Although, as we can see in Table 1, the percentages of salt contents suffer a great variation among different samples, the results of bacterial flora content have not been affected by them. In fact, the habitat is the factor which exerts a greater influence, followed by the salt concentration in the isolation media for the cases of soil and sea samples.
The highest and lowest bacterial contents correspond to soil and solar saltern samples, respectively. The last result being probably due to the competition in this environment among extremely halophilic and moderately halophilic bacteria. The isolation media modified according to Ventosa et al (20) did not have the sufficient Mg2+
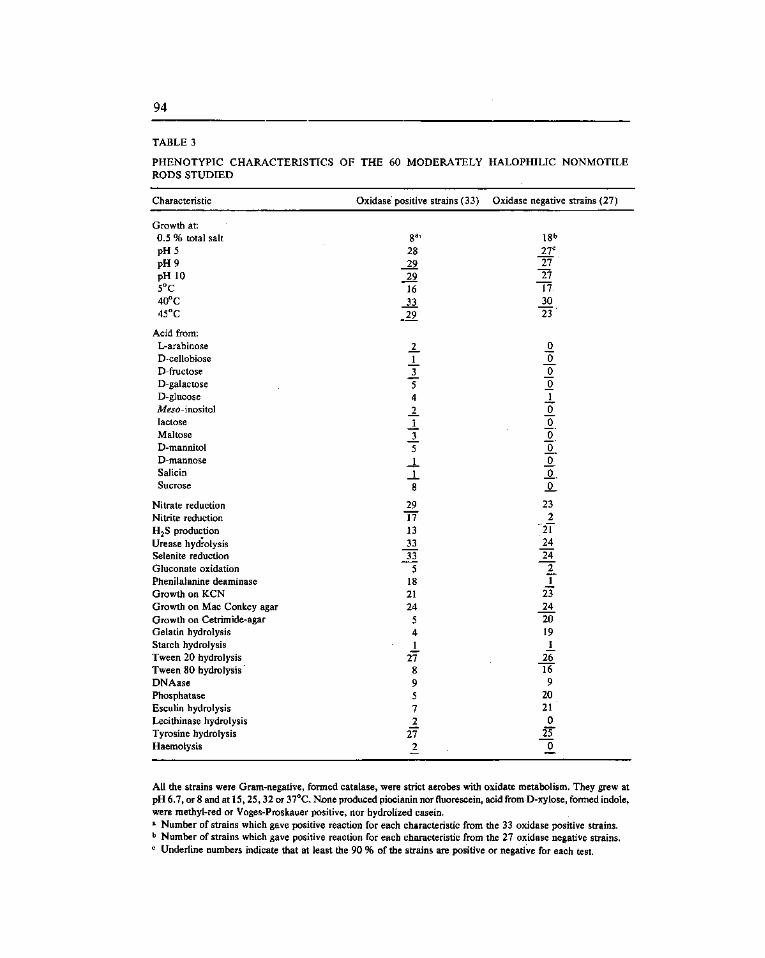
94
TABLE 3
PHENOTYPIC CHARACTERISTICS OF THE 60 MODERATELY HALOPHILIC NONMOTILE RODS STUDIED
Characteristic Oxidase positive strains (33) Oxidase negative strains (27)
Growth at 0.5 % total salt pH5 pH9 pH 10 5°C 40°C 45°C
Acid from: I^arabinose D-cellobiose D-fructose D-galactose D-glucose Me50-inositol lactose Maltose D-mannitol D-mannose Salicin Sucrose
Nitrate reduction Nitrite reduction H2S production Urease hydrolysis Selenite reduction Gluconate oxidation Phenilalanine deaminase Growth on KCN Growth on Mac Conkey agar Growth on Cetrimide-agar Gelatin hydrolysis Starch hydrolysis Tween 20 hydrolysis Tween 80 hydrolysis DNAase Phosphatase Esculin hydrolysis Lecithinase hydrolysis Tyrosine hydrolysis Haemolysis
28 29 29 16 33
-29.
_2_ J_ J_ 5 4
J_ J_ J_ 5
J_
8
21 17 13 33 33 5
18 21 24
5 4 J_ 27 8 9 5 7
A 27 2
18b 27"
27 17 30 2 3 '
0^ _0_ _0 _0 ± _0 _0 jo' _0
A
o_. 23
2_ 21 24 24
i. 23 24 20 19
J_ 26 16 9
20 21 _0
_25 0
All the strains were Gram-negative, formed catalase, were strict aerobes with oxidate metabolism. They grew at pH 6.7, or 8 and at 15,25,32 or 37°C. None produced piocianin nor fluorescein, acid from D-xylose, formed indole, were methyl-red or Voges-Proskauer positive, nor hydrolized casein. « Number of strains which gave positive reaction for each characteristic from the 33 oxidase positive strains. ^ Number of strains which gave positive reaction for each characteristic from the 27 oxidase negative strains. '^ Underline numbers indicate that at least the 90 % of the strains are positive or negative for each test.
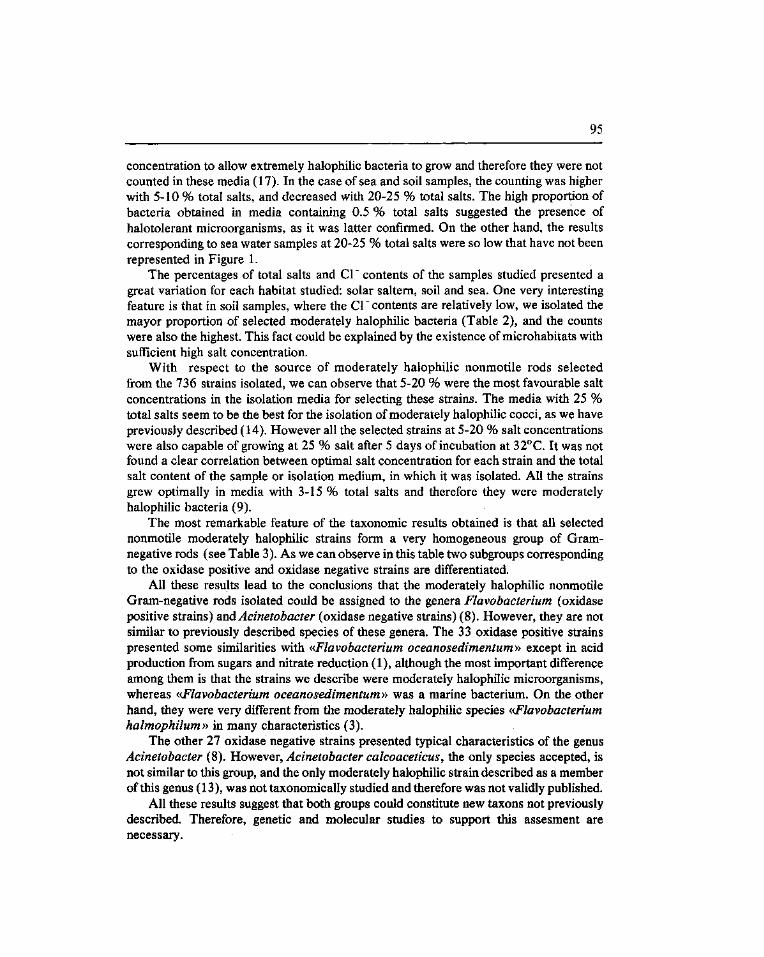
95
concentration to allow extremely halophilic bacteria to grow and therefore they were not counted in these media (17). In the case of sea and soil samples, the counting was higher with 5-10 % total salts, and decreased with 20-25 % total salts. The high proportion of bacteria obtained in media containing 0.5 % total salts suggested the presence of halotolerant microorganisms, as it was latter confirmed. On the other hand, the results corresponding to sea water samples at 20-25 % total salts were so low that have not been represented in Figure 1.
The percentages of total salts and CV contents of the samples studied presented a great variation for each habitat studied: solar saltern, soil and sea. One very interesting feature is that in soil samples, where the CI " contents are relatively low, we isolated the mayor proportion of selected moderately halophilic bacteria (Table 2), and the counts were also the highest. This fact could be explained by the existence of microhabitats with sufficient high salt concentration.
With respect to the source of moderately halophilic nonmotile rods selected from the 736 strains isolated, we can observe that 5-20 % were the most favourable salt concentrations in the isolation media for selecting these strains. The media with 25 % total salts seem to be the best for the isolation of moderately halophilic cocci, as we have previously described (14). However all the selected strains at 5-20 % salt concentrations were also capable of growing at 25 % salt after 5 days of incubation at 32°C. It was not found a clear correlation between optimal salt concentration for each strain and the total salt content of the sample or isolation medium, in which it was isolated. All the strains grew optimally in media with 3-15 % total salts and therefore they were moderately halophilic bacteria (9).
The most remarkable feature of the taxonomic results obtained is that all selected nonmotile moderately halophilic strains form a very homogeneous group of Gram-negative rods (see Table 3). As we can observe in this table two subgroups corresponding to the oxidase positive and oxidase negative strains are differentiated.
All these results lead to the conclusions that the moderately halophilic nonmotile Gram-negative rods isolated could be assigned to the genera Flavobacterium (oxidase positive strains) ana Acinetobacter (oxidase negative strains) (8). However, they are not similar to previously described species of these genera. The 33 oxidase positive strains presented some similarities with «Flavobacterium oceanosedimentum» except in acid production from sugars and nitrate reduction (1), although the most important difference among them is that the strains we describe were moderately halophilic microorganisms, whereas «Flavobacterium oceanosedimentum» was a marine bacterium. On the other hand, they were very different from the moderately halophilic species «Flavobacterium halmophilum» in many characteristics (3).
The other 27 oxidase negative strains presented typical characteristics of the genus Acinetobacter (8). However, Acinetobacter calcoaceticus, the only species accepted, is not similar to this group, and the only moderately halophilic strain described as a member of this genus (13), was not taxonomically studied and therefore was not validly published.
All these results suggest that both groups could constitute new taxons not previously described. Therefore, genetic and molecular studies to support this assesment are necessary.
96
References
1. Carty, C. E., and Lichfield, C. D. (1978) Characterization of a new marine sedimentary bacterium as Flavobacterium oceanosedimentum sp. nov. Int. J. Syst. Bacteriol. 28, 561-566.
2. Claus, D.; Fahmy, F.; Rolf, H. J., and Tosonoglu, N. (1983) Sporosarcina halophila sp. nov., a salt dependent bacterium from salt-marsh soils. System. Appl. Microbiol. 4, 496-506.
3. Elazari-Volcani, B. (1940) Studies on the microflora of the Dead sea. Ph. D. Thesis. Hebrew University. Jerusalem.
4. Forsyth, M .P.; Shindler, D. B.; Gochnauer, M. B., and Kushner, D. J. (1971) Salt tolerance of intertidal marine bacteria. Can. J. Microbiol. 17, 825-828.
5. Holmes, B.; Owen, R. J., and Weaver, R. E. {19SI) Flavobacterium multivorum, a new species isolated from human clinical specimens and previously known as group II K, byotipe 2. Int. J. Syst. Bacteriol. 31, 21-34.
6. Holmes, B.; Hollis, D. G., Steigerwalt, M. G.; Pickett, M. J., and Brenner, D. J. (1983) Flavobacterium thalpophilum, a new species recovered from human clinical material. Int. J. Syst. Bacteriol. 33, 677-682.
7. Holmes, B.; Owen, R. J.; Steigerwalt, M. G., and Brenner, D. J. (1984) Flavobacterium gleum, a new species found in human clinical specimens. Int. J. Syst. Bacteriol. 3, 21-25.
8. Krieg, N. R. (ed.) (1984) Bergey's Manual of Systematic Bacteriology. Vol. I. Willians and Wilkins Co., Baltimore.
9. Kushner, D. J. (1978) Life in high salt and solute concentrations: Halophilic Bacteria. In: D. J. Kushner (éd.). Microbial life in extreme environments, pp. 317-368. Academic Press, London.
10. Larsen, H. (1980) Ecology of hypersaline environments. In: A. Nissenbaum (éd.). Developments in sedimentology. Hypersaline brines and evaporitic environments, pp. 23-39. Elsevier, Amsterdam.
11. Novistky, T. J., and Kushner, D. J. (176) Planococcus halophilus sp. nov., a facultatively halophilic coccus. Int. J. Syst. Bacteriol. 26, 53-57.
12. Onishi, H., and Kamekura, N. (1972) Micrococcus halobius sp. n. Int. J. Syst. Bacteriol. 22, 233-236. 13. Onishi, H., and Hidaka, O. (1978) Purification and properties of amylase produced by a moderately
h^àophiWc Acinetobacter sp. Can. J. Microbiol. 24, 1017-1023. 14. Quesada, E.; Ventosa, A.; Rodriguez-Valera, F., and Ramos-Cormenzana, A. (1982) Types and properties of
some bacteria isolated from hypersaline soils. J. Appl. Bacteriol. 53, 155-161. 15. Quesada, E.; Ventosa, A.; Rodriguez-Valera, F.; Megias, L., and Ramos-Cormenzana, A. (1983) Numerical
taxonomy of moderately halophilic Gram-negative bacteria from hypersaline soils. J. Gen. Microbiol. 129, 2649-2657.
16. Quesada, E.; Ventosa, A.; Ruiz-Berraquero, F., and Ramos-Cormenzana, A. (1984) Deleya halophila. a new species of moderately halophilic bacteria. Int. J. Syst. Bacteriol. 34, 287-292.
17. Rodriguez-Valera, F.; Ruiz-Berraquero, F., and Ramos-Cormenzana, A. ( 1981 ) Characteristics of the heterotrophic bacterial populations in hypersaline environments of difi'erent salt concentrations. Microbiol. Ecol. 7, 235-243.
18. Skerman, V. B. D.; Mc Gowan, V., and Sneath, P. H. A. (1980) Approved Lists of Bacterial Names. Int. J. Syst. Bacteriol. 30, 225-420.
19. Subow, N. N. (1931) Oceanographical tables. USSR. Ocean Inst. Hydrometeorol. Comm., Moscow. 20. Ventosa, A.; Quesada, E.; Rodriguez-Valera, F.; Ruiz-Berraquero, F., and Ramos-Cormenzana, A. (1982)
Numerical taxonomy of moderately halophilic Gram-negative rods. J. Gen. Microbiol. 128, 1959-1969. 21. Ventosa, A.; Ramos-Cormenzana, A., and Kocur, M. (1983) Moderately halophilic Gram-negative cocci from
hypersaline environments. System. Appl. Microbiol. 4, 564-570. 22. Ventosa, A.; Rodriguez-Valera, F.; Poixdenter, J. S., and Reznikoff, W. S. (1984) Selection for moderately
halophilic bacteria by gradual salinity increases. Can. J. Microbiol. 30, 1279-1282. 23. Yabuuchi, E.; Kaneko, T.; Jano, I.; Moss, C. W., and Migoshi, N. (1983) Sphingobacterium gen. nov.:
Sphingobacterium spiritivorum comb, nov., Sphingobacterium multivorum comb. nov. Sphingobacterium mizutae sp. nov., and Flavobacterium indologenes sp. nov.: Glucose non fermenting Gram-negative rods in CDC Groups II K-2 and lib. Int. J. Syst. Bacteriol. 33, 580-598.
Microbiología 1 (1985), 97-99 NOTAS
Campylobacter en patología gástrica
Manuel López-Brea*, María Luisa Jiménez, Manuel Blanco, José María Pajares
Servicio de Microbiología y Servicio de Medicina Interna-Digestivo. Hospital de la Princesa, Facultad de Medicina, Universidad Autónoma de Madrid, Diego de León, 62, 28006 Madrid - España
Summary
The incidence of Campylobacter pyloridis in the stomach of patients with chronic gastritis, peptic ulceration and in normal subjects, has been studied. Seventy-one biopsy specimens were taken from affected and normal gastric mucosa of 61 patients and 10 normal subjects, respectively. In 54 (88,5 %) outof the 61 patients and in 1 (10 %) outof the 10 normal subjects, C pyloridis was observed. In addition, in 39 samples this microorganism was successfully cultured.
Key words: Campylobacter, C. pyloridis, gastric pathology
Resumen
Se ha realizado un estudio sobre la incidencia de Campylobacter pyloridis en muestras de biopsia gástrica, procedentes de 71 sujetos (33 enfermos con gastritis crónica, 28 con úlcera gástrica y 10 sujetos normales). De las 61 muestras de biopsia estudiadas de enfermos con patología gástrica, se observaron bacilos curvados, Gram negativos, compatibles con Campylobacter, en 54 ocasiones (88,5 %) y se cultivaron en 39 (63,9 %) . De las 10 muestras de biopsia procedentes de sujetos normales, se pudo observar células de Campylobacter solamente en una ocasión, pero sin conseguirse su cultivo.
El género Campylobacter está constituido por bacterias Gram negativas microaeró-filas y vibrioides. La importancia de este microorganismo como agente causal de cuadros diarreicos, ha sido ampliamente destacada (9). Marshall y Warren (7) observaron, por vez primera, la presencia de microorganismos espirales o curvados en forma de bacilo, relacionados con el género Campylobacter. Estos microorganismos que se encuentran en biopsias gástricas procedentes de enfermos con gastritis crónica, úlcera duodenal o úlcera gástrica, se denominan «organismos tipo Campylobacter» {CampylobacterAike organisms). En 1983, Skirrow(Skirrow, M. B. 1983. Proc. II Intern. Workshop on Campylobacter infections, p. 36) propuso el nombre de C. pyloridis, para aquellas bacterias tipo
A quien se dirigirá la correspondencia.
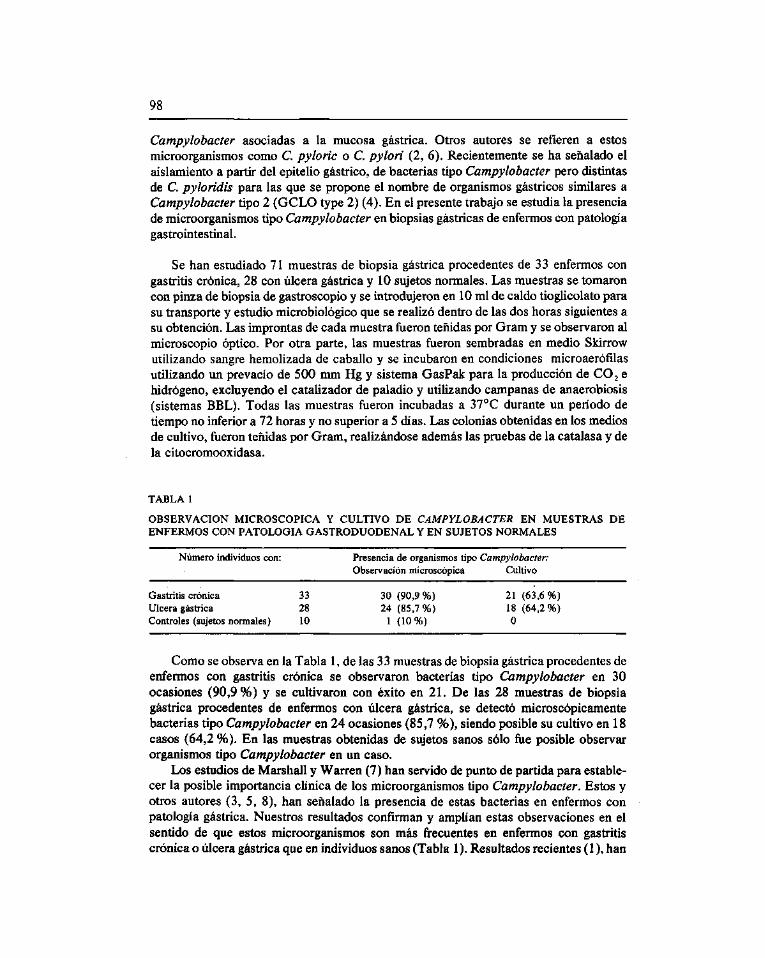
98
Campylobacter asociadas a la mucosa gástrica. Otros autores se refieren a estos microorganismos como C. pyloric o C. pylori (2, 6). Recientemente se ha señalado el aislamiento a partir del epitelio gástrico, de bacterias tipo Campylobacter pero distintas de C. pyloridis para las que se propone el nombre de organismos gástricos similares a Campylobacter tipo 2 (GCLO type 2) (4). En el presente trabajo se estudia la presencia de microorganismos tipo Campylobacter en biopsias gástricas de enfermos con patología gastrointestinal.
Se han estudiado 71 muestras de biopsia gástrica procedentes de 33 enfermos con gastritis crónica, 28 con úlcera gástrica y 10 sujetos normales. Las muestras se tomaron con pinza de biopsia de gastroscopio y se introdujeron en 10 mi de caldo tiogUcolato para su transporte y estudio microbiológico que se realizó dentro de las dos horas siguientes a su obtención. Las improntas de cada muestra fueron teñidas por Gram y se observaron al microscopio óptico. Por otra parte, las muestras fueron sembradas en medio Skirrow utilizando sangre hemoHzada de caballo y se incubaron en condiciones microaerófilas utilizando un prevacío de 500 mm Hg y sistema GasPak para la producción de CO 2 e hidrógeno, excluyendo el catalizador de paladio y utilizando campanas de anaerobiosis (sistemas BBL). Todas las muestras fueron incubadas a 37°C durante un período de tiempo no inferior a 72 horas y no superior a 5 días. Las colonias obtenidas en los medios de cultivo, fueron teñidas por Gram, realizándose además las pruebas de la catalasa y de la citocromooxidasa.
TABLA 1
OBSERVACIÓN MICROSCÓPICA Y CULTIVO DE CAMPYLOBACTER EN MUESTRAS DE ENFERMOS CON PATOLOGÍA GASTRODUODENAL Y EN SUJETOS NORMALES
Número individuos con: Presencia de organismos tipo Campylobacter: Observación microscópica Cultivo
Gastritis crónica 33 30(90,9%) 21(63,6%) Ulcera gástrica 28 24 (85,7%) 18 (64,2%) Controles (sujetos normales) 10 1 (10%) O
Como se observa en la Tabla 1, de las 33 muestras de biopsia gástrica procedentes de enfermos con gastritis crónica se observaron bacterias tipo Campylobacter en 30 ocasiones (90,9%) y se cultivaron con éxito en 21. De las 28 muestras de biopsia gástrica procedentes de enfermos con úlcera gástrica, se detectó microscópicamente bacterias tipo Campylobacter en 24 ocasiones (85,7 %), siendo posible su cultivo en 18 casos (64,2 %). En las muestras obtenidas de sujetos sanos sólo fue posible observar organismos tipo Campylobacter en un caso.
Los estudios de Marshall y Warren (7) han servido de punto de partida para establecer la posible importancia clínica de los microorganismos tipo Campylobacter. Estos y otros autores (3, 5, 8), han señalado la presencia de estas bacterias en enfermos con patología gástrica. Nuestros resultados confirman y amplían estas observaciones en el sentido de que estos microorganismos son más frecuentes en enfermos con gastritis crónica o úlcera gástrica que en individuos sanos (Tabla 1). Resultados recientes (1 ), han
99
señalado que los enfermos que padecen úlcera gástrica muestran títulos de anticuerpos IgG frente a C. pyloridis más elevados que los individuos sanos. Es de esperar que un mejor conocimiento de la biología de los Campylobacter aislados de biopsias gástricas contribuirá a dilucidar el papel de estos microorganismos en la patogénesis de las enfermedades gástricas.
Bibliografía
1. Kaldor, J.; Tee, V.; Me Carthy, P.; Watson, J., and Duyer, B. (1985) Immune response to Campylobacter pyloridis in patients with peptic ulceration. The Lancet i, 921.
2. Kasper, G., and Dickgiesser, N. (1984a) Antibiotic sensivity oí «Campylobacter pylori». Eur. J. Clin. Microbiol. 3, 444.
3. Kasper, G., and Dickgiesser, N. (1984b) Isolation of Campylobacter-like bacteria from gastric epithelim. Infection 12, 179-180.
4. Kasper, G. and Dickgiesser, N. (1985) Isolation from gastric epithelium of Campylobacter-like bacteria that are distinct from «Campylobacter pyloridis». The Lancet i, 111-112.
5. Langenberg, M. L.; Tytgat, G. N. J.; Shipper, M. E. I.; Rietra, P. J. G., and Zanzen, H. C. (1984) Campylobacter-like organisms in the stomach of patients and healthy inviduals. The Lancet i, 1348-1350.
6. Marshall, B.J.; Mc Gechie, D.B.; Francis, G.H., and Utley, P.J. (1984) Pyloric Campylobacter Serology. The Lancet il, 281.
7. Marshall, B.J., and Warren, J.R. (1984) Unidentified curved bacilU in the stomach of patients with gastritis and peptic ulceration. The Lancet i, 1311-1314.
8. Rolason, T.P.; Stone, J.; Rhodes, J.M. (1984) Spiral organisms in endoscopic biopsies of the human stomach. J. Clin. Path. 34, 23-26.
9. Smibert, R.M. (1984) Genus Campylobacter. In: A.R. Krieg (ed.) Bergey's Manual of Systematic Bacteriology. Vol. 1. pp. 111-118. Williams and Wilkins. Baltimore.
Guidelines to authors
«Microbiología» (PubUshed by the Spanish Society for Microbiology) publishes original research papers, research Notes and occasionally reviews covering all aspects of Microbiology. All submissions should be written in Spanish or in English. The decision to accept manuscripts is made by the Editorial Board.
Submission of a paper to this Journal is understood to imply that it has not previously been published and that it is not being considered for pubhcation elsewhere. Consent is given for reproducing publication of this Journal if acredited as the source.
ORGANIZATION AND FORMAT OF THE MANUSCRIPTS. Type every portion of the manuscript double-space with a wide margin at the left on UNE A-4 format sheets. Only one side of the sheet should be used and the pages should be numbered sequentially. Papers must be restricted to a maximum of 15 printed pages including figures and tables (this corresponds to approximately 25 typewritten pages).
The front page should include title, name (s) of the author (s), institution affiliation (s) and complete address (es). Three to five keywords would also be included.
Papers should be divided into: Abstracts in EngHsh and in Spanish (not exceeding 250 words), Introduction, Materials and Methods, Results, Discussion, Acknowledgments and References. Results and Discussion can be combined.
Abbreviations and symbols should follow the recommendations of the lUPAC-IUB Commission and the Metric System is to be used throughout.
Cite each listed reference by numbers in the text. References should be numbered and arranged in alphabetical order as indicated in the following examples:
Miller, J.H. (1972) Experiments in molecular genetics. Cold Spring Harbor Laboratory, Cold Spring Harbor, N.Y.
Seeberg, E., Nissen-Meyer, J. and Strike, P. (1976) den V gene of bacteriophage T4 determines a DNA glycosilate specific for pyrimidine dimers in DNA. J. Virol. 35, 790-797.
Tomasz, A. (1984) Building and breaking in the cell wall of bacteria - The role for autolysins. In: C. Nombela (ed.) Microbial Cell Wall Synthesis and Autolysis, pp. 3-12. Elsevier Science Pub. B. V. Amsterdam.
References to thesis, manuscripts not accepted for publication or Meetings should be indicated in the text as follows: (Garcia, P. et al 1985. in preparation), (Smith, T. 1985.
102
Ph. D. thesis, University of Colorado, Colorado) or (Suárez, A. y González, F. 1975. V Congr. Nac. Microbiol, P. 1845).
Only those photographs which are strictly necessary for the understanding of the paper should be submitted. Fotoprints must be of sufficient quality to ensure good reproduction. They should be numbered on the back and identified with the first author's name written in pencil. Legends for line-drawings and photoprints must be typed double-spaced on a separate sheet. The size of the photographs should not exceed the printing area (13 x 20 cm). All elements in the drawing should be prepared to withstand reductions. Drawings and line figures should be drawn in black ink on tracing paper and should be prepared as indicated for the photographs. Colored illustrations are not accepted.
Tables should be compiled on separate sheets with a descriptive title and numbered independently of the figures using Arabic numerals.
Please indicate with a soft pencil the approximate location of tables and figures in the left margin of the page.
NOTES. Notes should be restricted to 6 typewritten pages and are intended to present experimental observations and descriptions of techniques or methodological changes of interest. They should be written according to the guidelines given for papers, but without the heading divisions, and their abstracts should not exceed 50 words. Figures and tables should be restricted to a maximum of 2 figures and 1 table or vice versa.
REVIEWS. Review articles should deal with microbiological subjects of broad interest. Specialists will be called upon to write them. Instead of an abstract, they will contain a list of contents.
PROOFS. On acceptance of the paper, one galley proof will be sent to the nominated author to check for typesetting accuracy. The corrected proofs should be duly returned within one week's time. If delays were observed, the proofs will be corrected by the editorial staff and pubHshed. Broader changes implying recomposition of the text will be at the author's expense. Twenty-five offeprints of each paper are supplied free of charge. Additional reprints will be billed at cost price if requested upon returning the corrected galley proofs.
Papers must be submitted, in duplicate, to «Microbiología» (Publicación de la SEM). c/ Vitrubio, 8. 28006 Madrid - Spain or to one of the Editors according to the discipline represented.
Normas para los autores
«Microbiología» (Publicación de la SEM) acepta trabajos y Notas de investigación originales dentro del campo de la Microbiología y, ocasionalmente, artículos de revisión. Textos en castellano o en inglés. La aceptación corresponde al Consejo Editorial.
Sólo se admitirán trabajos inéditos que no estén pendientes de publicación en cualquier otra revista. Los originales publicados en «Microbiología» podrán ser reproducidos siempre que se indique su origen.
PRESENTACIÓN DE LOS MANUSCRITOS. Los trabajos, por duplicado, estarán escritos a máquina, a doble espacio, en hojas UNE A-4 por una sola cara, numeradas correlativamente y con un amplio margen en la parte izquierda y no deberán exceder de 15 páginas impresas incluyendo tablas y figuras (lo que corresponde aproximadamente a 25 hojas mecanografiadas).
Los trabajos incluirán una primera página en la que se indicará por este orden: Título del trabajo, nombre y apellido del autor o autores, centro en el que se ha realizado el trabajo y dirección completa del mismo así como de tres a cinco palabras clave. En los artículos en castellano se deberá incluir una versión inglesa del título.
Los trabajos constarán de: Resúmenes en inglés y en castellano (de no más de 250 palabras). Introducción, Materiales y Métodos, Resultados, Discusión, Agradecimientos y Bibliografía. Las secciones de Resultados y Discusión se podrán fiasionar en una sola.
Las abreviaturas deberán seguir las recomendaciones de la Comisión ILTPAC-IUB sobre nomenclatura bioquímica. Las unidades de medida serán las correspondientes al Sistema Métrico Decimal.
La bibliografía será citada en el texto mediante números y se preparará numerada y en orden alfabético de acuerdo con los ejemplos que se ofrecen a continuación:
Miller, J.H. (1972) Experiments in molecular genetics. Cold Spring Harbor Laboratory, Cold Spring Harbor, N.Y.
Seeberg. E., Nissen-Meyer, J. and Strike, P. (1976) den V gene of bacteriophage T4 determines a DNA glycosilate specific for pyrimidine dimers in DNA. J. Virol. 35, 790-797.
Tomasz, A. (1984) Building and breaking in the cell wall of bacteria - The role for autolysins. In: C. Nombela (ed.) Microbial Cell Wall Synthesis and Autolysis, pp. 3-12. Elsevier Science Pub. B.V. Amsterdam.
Las referencias a tesis doctorales, manuscritos no aceptados y comunicaciones presentadas a Congresos, deben incluirse en el texto del trabajo de acuerdo con los siguientes ejemplos: (García, P. et al. 1985. in preparation), (Smith, T. 1985. Ph. D. thesis. University of Colorado, Colorado) or (Suárez, A. y González, F. 1975. Res. V Congr. Nac. Microbiol, p. 1845).
Las fotografías, que deberán estar preparadas para su reproducción directa, se limitarán a las estrictamente necesarias para la comprensión del trabajo y serán de calidad suficiente para asegurar una buena reproducción. Deberán estar numeradas al dorso indicando el apellido del primer autor a lápiz. Los textos de las mismas irán mecanografiados a doble espacio y en hoja aparte. En los trabajos en castellano las figuras incluirán
104
asimismo un texto en inglés. El tamaño de las fotografías no excederá de 13 x 20 cm. Las dimensiones de los rótulos deberán ser las adecuadas para ser legibles en caso de que se reduzca la fotografía. La presentación de dibujos en tinta china y papel vegetal seguirá las mismas normas. No se admitirán fotografías en color.
Las tablas se enviarán en hojas aparte, numeradas independientemente de las figuras, con números arábigos y deberán llevar el correspondiente título explicativo.
Los autores deberán indicar a lápiz en el margen la situación aproximada en donde deben aparecer las tablas y figuras.
NOTAS. Las Notas, que no deberán exceder de seis páginas mecanografiadas incluyendo figuras y tablas, tienen por objeto la presentación de observaciones experimentales, descripción de técnicas o modificaciones metodológicas de interés. Su redacción se efectuará ateniéndose a las Normas previamente descritas para los trabajos, pero suprimiendo las divisiones con encabezamiento y con resúmenes no superiores a 50 palabras. Sólo incluirán, como máximo, dos figuras y una tabla o viceversa.
A R T Í C U L O S D E REVISION. Los artículos de revisión versarán sobre temas de microbiología de gran interés, y su redacción se solicitará a especialistas. Incluirán, en lugar de Resumen un índice de contenido.
PRUEBAS. Los autores recibirán pruebas que deberán devolver en plazo no superior a una semana. Transcurrido dicho plazo sin devolución de las pruebas, éstas serán corregidas por la revista y publicado el trabajo. Las correcciones se limitarán a errores tipográficos, gramaticales o de datos incorrectos. Modificaciones más importantes que impliquen recomposición del texto, deberán ser abonadas por el autor. Se enviarán 25 separatas gratuitas por artículo; si se desearan más, deberá indicarse por escrito cuando se devuelvan las pruebas corregidas. Las separatas adicionales serán facturadas a precio de coste.
Dos copias de cada manuscrito se enviarán a: «Microbiología» (Publicación de la SEM), c/ Vitrubio, 8. 28006 Madrid o al Editor de la Revista que esté más relacionado con el contenido del trabajo.