ifd: instituciones financieras de desarrollo - finanzas ... · responsabilidad este proceso de...
TRANSCRIPT
1IFD: INSTITUCIONES FINANCIERAS DE DESARROLLO - FINANZAS PARA EL DESARROLLO CON VISIÓN SOCIAL

EDITORIAL
Instituciones Financieras de Desarrollo en el marco del Desarrollo NacionalA partir del mes de marzo de 2008 producto del trabajo coordinado de FINRURAL con sus asociadas y en el marco del programa de Autorregulación, se pudo llegar a concebir la normativa que incorporó a las Asociaciones y Fundaciones Civiles sin fines lucro Financieras, al ámbito de la regulación promovida por la ASFI bajo la denominación de Instituciones Financieras de Desarrollo (IFD).
Este proceso que lleva a la fecha más de tres años y medio ha sido una experiencia conjunta tanto para la Autoridad de Supervisión del Sistema Financiera (ASFI) como para las propias IFD. Asimismo, ha requerido un enorme esfuerzo de parte de las IFD para alcanzar los estándares requeridos por la ASFI, y poder obtener la Licencia de Funcionamiento. Por otra parte, la ASFI ha tenido que reconocer la naturaleza particular de las operaciones de las IFD, teniendo que comprender y desarrollar normativa regulatoria adecuada a los servicios que prestan estas entidades. Muestra de ello es el desarrollo de normativas referidas a Banca Comunal, Reglamento de operaciones para IFD, Reglamento de Cartera Productiva, etc. Estas nuevas normativas son el producto del trabajo de la ASFI por cambiar la visión de financiamiento y también del conocimiento de las operaciones principalmente rurales y de apoyo al sector productivo de las IFD que se encuentran enmarcadas en el Plan de Desarrollo Nacional del actual Gobierno. Pero lo más importante en relación al proceso de regulación de las IFD es el reconocimiento de la figura de Institución Financiera sin fines de Lucro y el hecho de que estas entidades no sólo prestan servicios financieros sino también servicios no financieros de desarrollo económico, empresarial y social. Éstas características hacen del modelo de IFD un modelo de institución nuevo en la regulación financiera boliviana conocida por ser muy estricta al haber sido concebida como una regulación especializada en Banca Corporativa y que hizo que los Bancos y FFP especializados en Microfinanzas tuvieran que seguir normativas para bancos y no con una visión de Desarrollo.
Bajo el enfoque del actual Gobierno, esta línea de regulación está cambiando dado
que paradójicamente la normativa actual incluso limita algunas operaciones del Banco de Desarrollo Productivo (Banco de 2do Piso del Estado), en tal sentido la actual gestión gubernamental se encuentra trabajando entre otras en cuatro líneas de trabajo para el sector financiero que fueron manifestadas por las autoridades nacionales:
1. Promover el acceso al crédito en condiciones de fomento, solidaridad e inclusión y mejorar las condiciones para la captación de ahorros del público.
2. Incentivar el Crédito Productivo y la bolivianización de las operaciones.
3. Apoyar al desarrollo del sector productivo. 4. Profundizar las operaciones financieras
en zonas no atendidas por la banca tradicional.
Considerando que las IFD han trabajando en estas cuatro áreas de trabajo en los últimos años con excepción de la captación de recursos del público, esta figura institucional ha sido bien recibida por parte de la ASFI y el Ministerio de Economía y Finanzas Públicas las cuales están apoyando en gran medida a la generación de normativas innovadoras e incluyentes entre las que se encuentra en proyecto una nueva Ley Bancos y Entidades Financieras bajo el concepto de considerar bajo un mismo marco normativo a las Finanzas Comerciales Tradicionales y las Finanzas para el Desarrollo. Bajo esta segunda línea de la próxima Ley de Bancos se definirán normas y se promovería el financiamiento productivo a través de las instituciones con vocación de trabajo en dichos sectores entre las cuales se encuentran las IFD, Cooperativas, FFP y algunos Bancos especializados.
Finalmente, vale la pena mencionar que por iniciativa de la ASFI se ha convocado a conformar mesas de trabajo con los distintos gremios del sistema financiero a fin de desarrollar propuestas normativas consensuadas para que las mismas puedan ser posteriormente incorporadas al sistema normativo.
DESEMPEÑO FINANCIERO
A nivel de indicadores financieros, al mes de Julio de 2011, la cartera de las IFD alcanzó a
INSTITUCIONES FINANCIERAS DE DESARROLLO
ANEDAsociación Nacional Ecuménica de Desarrollo
C. Rosendo Gutierrez Nº 679Telf: (591 2) 2418716
www.aned.orgLa Paz – Bolivia
CIDRECentro de Investigación y Desarrollo Regional
C. Juan de la Cruz Torrez Nº 1674Telf: (591 4) 4233077
www.cidre.org.boCochabamba – Bolivia
CRECERCrédito con Educación Rural
C. Presbítero Medina Nº 2931Telf: (591 2) 2114040
www.crecer.org.boLa Paz - Bolivia
FRIF DIACONIAFondo Rotatorio de Inversión y Fomento
DIACONIAAv. Juan Pablo II, Esq. Calle Sbtte. Eulert Nº 125
Telf. (591 2) 2844299www.diaconia-frif.org
La Paz – Bolivia
EMPRENDEREmprender IMF
C. Presbítero Medina Pasaje Tal Tal N° 570Telf: (591 2) 2152390www.emprender.org.bo
La Paz - Bolivia
FONDECOFondo de Desarrollo Comunal
C. Pico de Monte Nº 121Telf: (591 3) 3520740
www.fondeco.orgSanta Cruz – Bolivia
FUNBODEMFundación Boliviana para el
Desarrollo de la MujerIndependencia 475
Telf: 591 3 3352101www.funbodem.org
La Paz – Bolivia
FONCRESOLFondo de Crédito SolidarioC. Quintín Barrios Nº 768
Telf: 591 2 2412472www.peap-foncresol.org
La Paz – Bolivia
FUBODEFundación Boliviana para el Desarrollo
C. Crisóstomo Carrillo No 858Telf: 591 4 4525579 (80)
www.fubode.orgCochabamba - Bolivia
IDEPROInstituto para el Desarrollo de la Pequeña
Unidad ProductivaC. Campos Nº 132
Telf: (591 2) 2430615 – 2430725 www.idepro.orgLa Paz – Bolivia
IMPROCalle Manuel Ergueta Nº 1741,
Zona TembladeraniTelf: (591 2) 2484616 - 2483081
www.improbolivia.orgLa Paz – Bolivia
PROMUJERAv. Hernando Siles Nº. 5411 Esq. Calle 8,
Edificio Ignacio de Loyola II ObrajesTelf: (591 2) 2916321 | 2114914
www.pro-mujer.orgLa Paz – Bolivia
SARTAWICalle Pedro Salazar Nº 509
Telf: (591 2) 2419252www.sembrarsartawi.org
La Paz – Bolivia
3IFD: INSTITUCIONES FINANCIERAS DE DESARROLLO - FINANZAS PARA EL DESARROLLO CON VISIÓN SOCIAL
más de 1.877 millones de bolivianos, de los cuales han sido colocados aproximadamente 44% en zonas rurales y 56% en zonas urbanas y periurbanas. A nivel de clientes, las IFD aglutinan a más de 353 mil clientes de los cuales el 38% son clientes rurales y el 62% entre urbanos y periurbanos. Cabe aclarar también que en las zonas urbanas el promedio de colocaciones alcanzó aproximadamente a Bs4.500 mientras que en zonas rurales a Bs6.000. Otro aspecto importante de mencionar es el acceso a financiamiento que se le dio a la mujer ya que se llegó a financiar a más de 275 mil mujeres en todo el país.
A nivel de mora, para el mes de julio las IFD alcanzaron al 1.4% en promedio, misma que se encuentra 0.1% por encima de lo alcanzado a diciembre de 2010, sin embargo, resulta ser mínimo comparado con otras gestiones como la del 2004 donde las IFD tenían una mora superior al 8%. Es de destacar también que pese al 1.4% de mora que tienen las IFD, la misma se encuentra previsionada en más de 200% lo que permite concluir que las IFD están cumpliendo satisfactoriamente la norma, incluso por encima de los montos mínimos exigidos.
Otro tema importante de destacar es la calificación que tienen los clientes de las IFD, de acuerdo a la normativa de ASFI, ya que el 96% de ellos tienen una calificación categoría “A” lo que significa que estos tienen la capacidad de cumplir con sus obligaciones sin ningún riesgo de no pago, y adicionalmente indica una importante gestión de riesgos, por parte de las IFD, para alcanzar niveles de morosidad muy bajos.
DESEMPEÑO SOCIAL
Pero en el caso de las IFD, éstas no sólo han trabajado en los últimos años en tener importantes indicadores financieros sino también en cumplir su misión social bajo la cual fue concebida cada una de ellas a través de la Gestión del Desempeño Social o GDS. Es este punto y con el objetivo de diferenciar los conceptos, debemos entender a la responsabilidad social como el compromiso de los “Stakeholders” (IMFs, redes asociadas, accionistas, donantes) a tener que responder por sus acciones y garantizar que las actividades no tengan efectos negativos en los socios (personal, clientes, comunidad) o el medioambiente. El concepto de desempeño social va un paso más adelante en la medida que las IFD se esfuercen en cumplir con la misión social que traerá beneficios económicos y sociales para los clientes y sus familias.
Entre algunos de los principales resultados de desempeño social de las IFD en la última gestión tenemos:
• Enpromedio,el74%deloscréditosotorgadosen la modalidad de crédito individual está respaldado por garantías sociales e intangibles.
• Losdosprincipalestiposdemicrosegurosqueseofrecen son el del Vida y el de Gastos Funerarios.
En este análisis no se toma en cuenta el seguro de desgravamen.
• El total de las instituciones reinvierten el 80%de sus excedentes en la prestación de servicios financieros, el restante 20% de los recursos se invierten en mejorar la capacidad operativa y en ampliar puntos de atención.
• Aproximadamenteel1.3%deltotaldelgastodelas entidades es destinado a Inversión Social en Clientes y Comunidad a través de servicios no financieros de desarrollo humano y empresarial.
• Aproximadamente el 0.5% del total del gastode las entidades es destinado a Capacitación al Personal.
• En promedio, el 70% de los clientes de lasinstituciones son mujeres. En la institución que más clientas mujeres tiene, se encuentra que el 94% de sus clientes son mujeres.
• El83%delasinstitucionestienecarteracolocadaen el área rural.
• Enpromedio,el44%delacarteratotaldetodaslas instituciones está colocada en área rural y el 12% de la cartera está colocada en áreas identificadas como de alta vulnerabilidad.
• El66%delasentidadesutilizametodologíasdecrédito que promueven la generación de capital social.
• El 58% de las entidades poseen créditos quepromueven la creación de capital o patrimonio entre sus clientes.
• El14%delacarteradetodaslasentidadesestácolocado en préstamos destinados a incrementar los activos fijos de los clientes.
Finalmente indicar que las IFD han tomado con mucha responsabilidad este proceso de adecuación a la regulación la cual incluso ha tenido el apoyo del Banco Interamericano de Desarrollo (BID) que implementó un Proyecto para apoyar a las IFD en el cumplimiento de los requisitos técnicos y operativos requeridos por la regulación, esto se ha traducido en la contratación de consultores en diversas áreas para que apoyen a las IFD en el logro de los diversos requisitos definidos por ésta. Asimismo se tiene previsto un programa de capacitación para los Directivos, Ejecutivos y demás funcionarios de las IFD con el objetivo de mejorar los conocimientos sobre la normativa financiera vigente y desarrollar los mecanismos de monitoreo del Desempeño Social y Financiero considerando su naturaleza y misión social.
En este sentido y para finalizar podemos indicar que las IFD se encuentran preparadas para ingresar al mercado financiero regulado con mejores servicios para sus clientes y con la misión social de apoyar al desarrollo productivo del país principalmente en zonas rurales y periurbanas donde muchas entidades aún no han llegado con servicios financieros.
Néstor Castro QuintelaGerente General
FINRURAL
4 ASOCIACIÓN DE INSTITUCIONES FINANCIERAS DE DESARROLLO
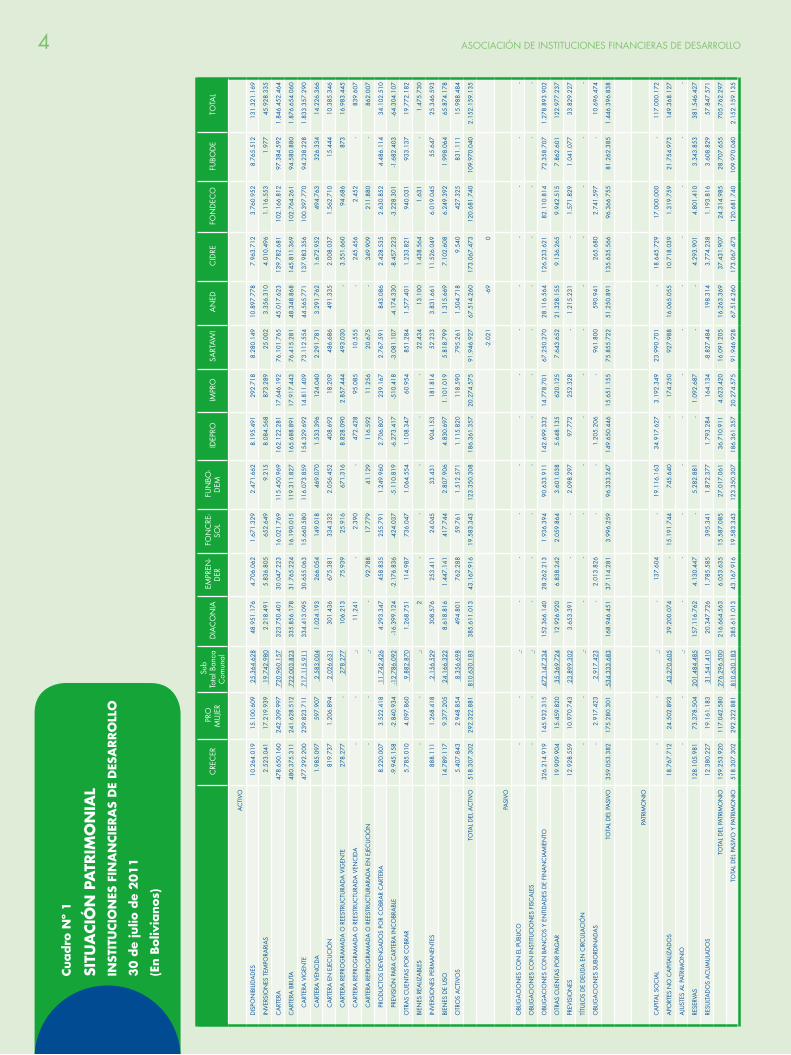
Cuadro
Nº
1
SITU
ACIÓ
N P
ATR
IMO
NIA
LIN
STIT
UCIO
NES
FIN
AN
CIE
RA
S D
E D
ESA
RRO
LLO
30
de
julio
de
20
11
(En B
oliv
ianos)
C
REC
ER
PRO
M
UJE
R
Sub
To
tal B
anca
C
omun
al
DIA
CO
NIA
E
MPR
EN-
DER
F
ON
CRE
-SO
L F
UN
BO-
DEM
ID
EPRO
IM
PRO
S
ART
AWI
AN
ED
CID
RE
FO
ND
ECO
F
UBO
DE
TO
TAL
AC
TIVO
DIS
PON
IBILI
DA
DES
1
0.26
4.01
9 1
5.10
0.60
9 2
5.36
4.62
8 4
8.95
1.17
6 4
.706
.062
1
.671
.329
2
.471
.662
8
.195
.491
2
92.7
18
8.2
80.1
49
10.
897.
778
7.9
63.7
12
3.7
60.9
52
8.7
65.5
12
131
.321
.169
INVE
RSIO
NES
TEM
PORA
RIA
S 2
.523
.041
1
7.21
9.93
9 1
9.74
2.98
0 2
.218
.491
5
.836
.805
6
52.6
49
9.2
15
8.0
84.5
68
873
.289
2
5.00
2 3
.356
.310
4
.010
.496
1
.116
.553
1
.977
4
5.92
8.33
5
CA
RTER
A
478
.650
.160
2
42.3
09.9
97
720
.960
.157
3
23.7
50.4
01
30.
047.
223
16.
021.
769
115
.450
.969
1
62.1
22.2
81
17.
646.
192
76.
101.
765
45.
017.
623
139
.782
.681
1
02.1
66.8
12
97.
384.
592
1.8
46.4
52.4
64
CA
RTER
A B
RUTA
4
80.3
75.3
11
241
.628
.512
7
22.0
03.8
23
335
.856
.178
3
1.76
5.22
4 1
6.19
0.01
5 1
19.3
11.8
27
165
.688
.891
1
7.91
7.44
3 7
6.41
5.28
1 4
8.34
8.86
8 1
45.8
11.3
69
102
.764
.261
9
4.58
0.88
0 1
.876
.654
.060
CA
RTER
A V
IGEN
TE
477
.292
.200
2
39.8
23.7
11
717
.115
.911
3
34.4
13.0
95
30.
655.
063
15.
660.
580
116
.073
.859
1
54.3
29.6
92
14.
811.
409
73.
112.
554
44.
565.
771
137
.983
.356
1
00.3
97.7
70
94.
238.
228
1.8
33.3
57.2
90
CA
RTER
A V
ENC
IDA
1
.985
.097
5
97.9
07
2.5
83.0
04
1.0
24.1
93
266
.054
1
49.0
18
469
.070
1
.533
.396
1
24.0
40
2.2
91.7
81
3.2
91.7
62
1.6
72.9
52
494
.763
3
26.3
34
14.
226.
366
CA
RTER
A E
N E
JEC
UC
IÓN
8
19.7
37
1.2
06.8
94
2.0
26.6
31
301
.436
6
75.3
81
334
.332
2
.056
.452
4
08.6
92
18.
209
486
.686
4
91.3
35
2.0
08.0
37
1.5
62.7
10
15.
444
10.
385.
346
CA
RTER
A R
EPRO
GRA
MA
DA
O R
EEST
RUC
TURA
DA
VIG
ENTE
2
78.2
77
- 2
78.2
77
106
.213
7
5.93
9 2
5.91
6 6
71.3
16
8.8
28.0
90
2.8
57.4
44
493
.030
-
3.5
51.6
60
94.
686
873
1
6.98
3.44
5
CA
RTER
A R
EPRO
GRA
MA
DA
O R
EEST
RUC
TURA
DA
VEN
CID
A
- -
- 1
1.24
1 -
2.3
90
- 4
72.4
28
95.
085
10.
555
- 2
45.4
56
2.4
52
- 8
39.6
07
CA
RTER
A R
EPRO
GRA
MA
DA
O R
EEST
RUC
TURA
RAD
A E
N E
JEC
UC
IÓN
-
- -
- 9
2.78
8 1
7.77
9 4
1.12
9 1
16.5
92
11.
256
20.
675
- 3
49.9
09
211
.880
-
862
.007
PRO
DU
CTO
S D
EVEN
GA
DO
S PO
R C
OBR
AR
CA
RTER
A
8.2
20.0
07
3.5
22.4
18
11.
742.
426
4.2
93.3
47
458
.835
2
55.7
91
1.2
49.9
60
2.7
06.8
07
239
.167
2
.767
.591
8
43.0
86
2.4
28.5
35
2.6
30.8
52
4.4
86.1
14
34.
102.
510
PRE
VISI
ÓN
PA
RA C
ART
ERA
INC
OBR
ABL
E -9
.945
.158
-2
.840
.934
-1
2.78
6.09
2 -1
6.39
9.12
4 -2
.176
.836
-4
24.0
37
-5.1
10.8
19
-6.2
73.4
17
-510
.418
-3
.081
.107
-4
.174
.330
-8
.457
.223
-3
.228
.301
-1
.682
.403
-6
4.30
4.10
7
OTR
AS
CU
ENTA
S PO
R C
OBR
AR
5.7
85.0
10
4.0
97.8
60
9.8
82.8
70
1.2
68.7
51
114
.987
7
36.0
47
1.0
64.5
54
1.1
08.3
47
60.
954
851
.284
1
.577
.401
1
.233
.821
9
40.0
31
933
.137
1
9.77
2.18
2
BIE
NES
REA
LIZA
BLES
-
- -
2
- -
- -
- 2
2.43
4 1
3.10
0 1
.438
.564
1
.631
-
1.4
75.7
30
INVE
RSIO
NES
PER
MA
NEN
TES
888
.111
1
.268
.418
2
.156
.529
3
08.5
76
253
.411
2
4.04
5 3
3.43
1 9
04.1
53
181
.814
5
2.23
3 3
.831
.661
1
1.52
6.04
9 6
.019
.045
5
5.64
7 2
5.34
6.59
3
BIE
NES
DE
USO
1
4.78
9.11
7 9
.377
.205
2
4.16
6.32
2 8
.618
.816
1
.447
.141
4
17.7
44
2.8
07.9
06
4.8
30.6
97
1.1
01.0
19
5.8
18.7
99
1.3
15.6
69
7.1
02.6
08
6.2
49.3
92
1.9
98.0
64
65.
874.
178
OTR
OS
AC
TIVO
S 5
.407
.843
2
.948
.854
8
.356
.698
4
94.8
01
762
.288
5
9.76
1 1
.512
.571
1
.115
.820
1
18.5
90
795
.261
1
.504
.718
9
.540
4
27.3
25
831
.111
1
5.98
8.48
4
TO
TAL
DEL
AC
TIVO
5
18.3
07.3
02
292
.322
.881
8
10.6
30.1
83
385
.611
.013
4
3.16
7.91
6 1
9.58
3.34
3 1
23.3
50.3
08
186
.361
.357
2
0.27
4.57
5 9
1.94
6.92
7 6
7.51
4.26
0 1
73.0
67.4
73
120
.681
.740
1
09.9
70.0
40
2.1
52.1
59.1
35
-2.0
21
-69
0
PA
SIVO
OBL
IGA
CIO
NES
CO
N E
L PÚ
BLIC
O
- -
- -
- -
- -
- -
- -
- -
-
OBL
IGA
CIO
NES
CO
N IN
STIT
UC
ION
ES F
ISC
ALE
S -
- -
- -
- -
- -
- -
- -
- -
OBL
IGA
CIO
NES
CO
N B
AN
CO
S Y
ENTI
DA
DES
DE
FIN
AN
CIA
MIE
NTO
3
26.2
14.9
19
145
.932
.315
4
72.1
47.2
34
152
.366
.140
2
8.26
2.21
3 1
.936
.394
9
0.63
3.91
1 1
42.6
99.3
32
14.
778.
701
67.
250.
270
28.
116.
564
126
.233
.621
8
2.11
0.81
4 7
2.35
8.70
7 1
.278
.893
.902
OTR
AS
CU
ENTA
S PO
R PA
GA
R 1
9.90
9.90
4 1
5.45
9.82
0 3
5.36
9.72
4 1
2.92
6.92
0 6
.838
.242
2
.059
.864
3
.601
.038
5
.648
.135
6
20.1
25
7.6
43.6
52
21.
328.
155
9.1
36.2
65
9.9
42.5
15
7.8
62.6
01
122
.977
.237
PRE
VISI
ON
ES
12.
928.
559
10.
970.
743
23.
899.
302
3.6
53.3
91
- -
2.0
98.2
97
97.
772
252
.328
-
1.2
15.2
31
- 1
.571
.829
1
.041
.077
3
3.82
9.22
7
TÍT
ULO
S D
E D
EUD
A E
N C
IRC
ULA
CIÓ
N
- -
- -
- -
- -
- -
- -
- -
-
OBL
IGA
CIO
NES
SU
BORD
INA
DA
S -
2.9
17.4
23
2.9
17.4
23
- 2
.013
.826
-
- 1
.205
.206
-
961
.800
5
90.9
41
265
.680
2
.741
.597
-
10.
696.
474
TO
TAL
DEL
PA
SIVO
3
59.0
53.3
82
175
.280
.301
5
34.3
33.6
83
168
.946
.451
3
7.11
4.28
1 3
.996
.259
9
6.33
3.24
7 1
49.6
50.4
46
15.
651.
155
75.
855.
722
51.
250.
891
135
.635
.566
9
6.36
6.75
5 8
1.26
2.38
5 1
.446
.396
.838
PAT
RIM
ON
IO
CA
PITA
L SO
CIA
L -
- -
- 1
37.6
04
- 1
9.11
6.16
3 3
4.91
7.62
7 3
.192
.349
2
3.99
0.70
1 -
18.
645.
729
17.
000.
000
- 1
17.0
00.1
72
APO
RTES
NO
CA
PITA
LIZA
DO
S 1
8.76
7.71
2 2
4.50
2.89
3 4
3.27
0.60
5 3
9.20
0.07
4 -
15.
191.
744
745
.640
-
174
.250
9
27.9
88
16.
065.
055
10.
718.
039
1.3
19.7
59
21.
754.
973
149
.368
.127
AJU
STES
AL
PATR
IMO
NIO
-
- -
- -
- -
- -
- -
- -
- -
RES
ERVA
S 1
28.1
05.9
81
73.
378.
504
201
.484
.485
1
57.1
16.7
62
4.1
30.4
47
- 5
.282
.881
-
1.0
92.6
87
- -
4.2
93.9
01
4.8
01.4
10
3.3
43.8
53
381
.546
.427
RES
ULT
AD
OS
AC
UM
ULA
DO
S 1
2.38
0.22
7 1
9.16
1.18
3 3
1.54
1.41
0 2
0.34
7.72
6 1
.785
.585
3
95.3
41
1.8
72.3
77
1.7
93.2
84
164
.134
-8
.827
.484
1
98.3
14
3.7
74.2
38
1.1
93.8
16
3.6
08.8
29
57.
847.
571
TO
TAL
DEL
PAT
RIM
ON
IO
159
.253
.920
1
17.0
42.5
80
276
.296
.500
2
16.6
64.5
63
6.0
53.6
35
15.
587.
085
27.
017.
061
36.
710.
911
4.6
23.4
20
16.
091.
205
16.
263.
369
37.
431.
907
24.
314.
985
28.
707.
655
705
.762
.297
TO
TAL
DEL
PA
SIVO
Y P
ATRI
MO
NIO
5
18.3
07.3
02
292
.322
.881
8
10.6
30.1
83
385
.611
.013
4
3.16
7.91
6 1
9.58
3.34
3 1
23.3
50.3
07
186
.361
.357
2
0.27
4.57
5 9
1.94
6.92
8 6
7.51
4.26
0 1
73.0
67.4
73
120
.681
.740
1
09.9
70.0
40
2.1
52.1
59.1
35
5IFD: INSTITUCIONES FINANCIERAS DE DESARROLLO - FINANZAS PARA EL DESARROLLO CON VISIÓN SOCIAL
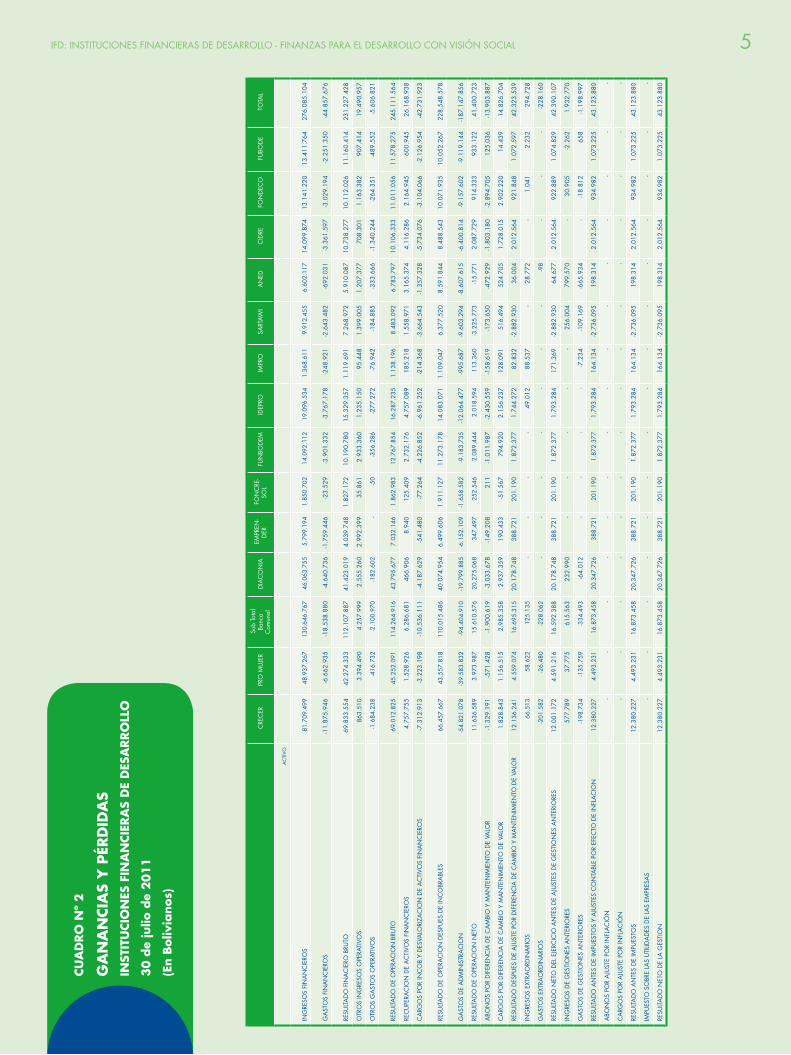
CU
AD
RO
Nº
2
GA
NA
NCIA
S Y
PÉR
DID
AS
INST
ITU
CIO
NES
FIN
AN
CIE
RA
S D
E D
ESA
RRO
LLO
30
de
julio
de
20
11
(En B
oliv
ianos)
C
REC
ER
PRO
MU
JER
Sub
Tot
al
Banc
a
Com
unal
D
IAC
ON
IA
EM
PREN
-D
ER
FO
NC
RE-
SOL
FU
NBO
DEM
ID
EPRO
IM
PRO
S
ART
AWI
AN
ED
CID
RE
FO
ND
ECO
F
UBO
DE
TO
TAL
AC
TIVO
ING
RESO
S FI
NA
NC
IERO
S 8
1.70
9.49
9 4
8.93
7.26
7 1
30.6
46.7
67
46.
063.
755
5.7
99.1
94
1.8
50.7
02
14.
092.
112
19.
096.
534
1.3
68.6
11
9.9
12.4
55
6.6
02.1
17
14
.099
.874
13.1
41.2
20
13.
411.
764
276
.085
.104
GA
STO
S FI
NA
NC
IERO
S -1
1.87
5.94
6 -6
.662
.935
-1
8.53
8.88
0 -4
.640
.736
-1.7
59.4
46
-23.
529
-3.9
01.3
32
-3.7
67.1
78
-248
.921
-2
.643
.482
-6
92.0
31
-3.3
61.5
97
-3.0
29.1
94
-2.2
51.3
50
-44.
857.
676
RESU
LTA
DO
FIN
AC
IERO
BRU
TO 6
9.83
3.55
4 4
2.27
4.33
3 1
12.1
07.8
87
41.
423.
019
4.0
39.7
48
1.
827.
172
10.
190.
780
15.
329.
357
1.
119.
691
7.2
68.9
72
5.9
10.0
87
10
.738
.277
10.1
12.0
26
11.
160.
414
231
.227
.428
OTR
OS
ING
RESO
S O
PERA
TIVO
S 8
63.5
10
3.3
94.4
90
4.2
57.9
99
2.5
55.2
60
2.9
92.3
99
35.
861
2.9
33.3
60
1.2
35.1
50
95.
448
1.3
99.0
05
1.2
07.3
77
708
.301
1
.163
.382
9
07.4
14
19.
490.
957
OTR
OS
GA
STO
S O
PERA
TIVO
S -1
.684
.238
-4
16.7
32
-2.1
00.9
70
-182
.602
-
-50
-356
.286
-2
77.2
72
-76.
942
-184
.885
-3
33.6
66
-1.3
40.2
44
-264
.351
-4
89.5
52
-5.6
06.8
21
RESU
LTA
DO
DE
OPE
RAC
ION
BRU
TO 6
9.01
2.82
5 4
5.25
2.09
1 1
14.2
64.9
16
43.
795.
677
7.0
32.1
46
1.8
62.9
83
12.
767.
854
16.
287.
235
1.1
38.1
96
8.4
83.0
92
6.7
83.7
97
10
.106
.333
11.0
11.0
56
11.
578.
275
245
.111
.564
REC
UPE
RAC
ION
DE
AC
TIVO
S FI
NA
NC
IERO
S 4
.757
.755
1
.528
.926
6
.286
.681
4
66.9
06
8.9
40
125
.409
2
.732
.176
4
.757
.089
1
85.2
18
1.5
58.9
71
3.1
65.3
74
4.1
16.2
86
2.1
64.9
45
600
.945
2
6.16
8.93
8
CA
RGO
S PO
R IN
CO
B.Y
DES
VALO
RIZA
CIO
N D
E A
CTI
VOS
FIN
AN
CIE
ROS
-7.3
12.9
13
-3.2
23.1
98
-10.
536.
111
-4.1
87.6
29
-541
.480
-7
7.26
4 -4
.226
.852
-6
.961
.252
-2
14.3
68
-3.6
64.5
43
-1.3
57.3
28
-5.7
34.0
76
-3.1
04.0
66
-2.1
26.9
54
-42.
731.
923
RESU
LTA
DO
DE
OPE
RAC
ION
DES
PUES
DE
INC
OBR
ABL
ES 6
6.45
7.66
7 4
3.55
7.81
8 1
10.0
15.4
86
40.
074.
954
6.4
99.6
06
1.
911.
127
11.
273.
178
14.
083.
071
1.
109.
047
6.3
77.5
20
8.5
91.8
44
8.4
88.5
43
10
.071
.935
1
0.05
2.26
7 2
28.5
48.5
78
GA
STO
S D
E A
DM
INIS
TRA
CIO
N -5
4.82
1.07
8 -3
9.58
3.83
2 -9
4.40
4.91
0 -1
9.79
9.88
5
-6.1
52.1
09
-1
.658
.582
-9
.183
.735
-12.
064.
477
-995
.687
-9
.603
.294
-8
.607
.615
-6
.400
.814
-9
.157
.602
-9
.119
.144
-187
.147
.856
RESU
LTA
DO
DE
OPE
RAC
ION
NET
O 1
1.63
6.58
9 3
.973
.987
1
5.61
0.57
6 2
0.27
5.06
8 3
47.4
97
252
.546
2
.089
.444
2
.018
.594
1
13.3
60
-3.2
25.7
73
-15.
771
2.0
87.7
29
914
.333
9
33.1
22
41.
400.
723
ABO
NO
S PO
R D
IFER
ENC
IA D
E C
AM
BIO
Y M
AN
TEN
IMIE
NTO
DE
VALO
R -1
.329
.191
-5
71.4
28
-1.9
00.6
19
-3.0
33.6
78
-149
.208
2
11
-1.0
11.9
87
-2.4
30.5
59
-158
.619
-1
73.6
50
-472
.929
-1
.803
.180
-2
.894
.705
1
25.0
36
-13.
903.
887
CA
RGO
S PO
R D
IFER
ENC
IA D
E C
AM
BIO
Y M
AN
TEN
IMIE
NTO
DE
VALO
R 1
.828
.843
1
.156
.515
2
.985
.358
2
.937
.359
1
90.4
33
-51.
567
794
.920
2
.156
.237
1
28.0
91
516
.494
5
24.7
05
1.7
28.0
15
2.9
02.2
20
14.
439
14.
826.
704
RESU
LTA
DO
DES
PUES
DE
AJU
STE
POR
DIF
EREN
CIA
DE
CA
MBI
O Y
MA
NTE
NIM
IEN
TO D
E VA
LOR
12.
136.
241
4.5
59.0
74
16.
695.
315
20.
178.
748
388
.721
2
01.1
90
1.8
72.3
77
1.7
44.2
72
82.
832
-2.8
82.9
30
36.
004
2.0
12.5
64
921
.848
1
.072
.597
4
2.32
3.53
9
ING
RESO
S EX
TRA
ORD
INA
RIO
S 6
6.51
3 5
8.62
2 1
25.1
35
- -
- -
49.
012
88.
537
- 2
8.77
2 -
1.0
41
2.2
32
294
.728
GA
STO
S EX
TRA
ORD
INA
RIO
S -2
01.5
82
-26.
480
-228
.062
-
- -
- -
- -
-98
- -
- -2
28.1
60
RESU
LTA
DO
NET
O D
EL E
JERC
ICIO
AN
TES
DE
AJU
STES
DE
GES
TIO
NES
AN
TERI
ORE
S 1
2.00
1.17
2 4
.591
.216
1
6.59
2.38
8 2
0.17
8.74
8 3
88.7
21
201
.190
1
.872
.377
1
.793
.284
1
71.3
69
-2.8
82.9
30
64.
677
2.0
12.5
64
922
.889
1
.074
.829
4
2.39
0.10
7
ING
RESO
S D
E G
ESTI
ON
ES A
NTE
RIO
RES
577
.789
3
7.77
5 6
15.5
63
232
.990
-
- -
- -
256
.004
7
99.5
70
- 3
0.90
5 -2
.262
1
.932
.770
GA
STO
S D
E G
ESTI
ON
ES A
NTE
RIO
RES
-198
.734
-1
35.7
59
-334
.493
-6
4.01
2 -
- -
- -7
.234
-1
09.1
69
-665
.934
-
-18.
812
658
-1
.198
.997
RESU
LTA
DO
AN
TES
DE
IMPU
ESTO
S Y
AJU
STES
CO
NTA
BLE
POR
EFEC
TO D
E IN
FLA
CIO
N 1
2.38
0.22
7 4
.493
.231
1
6.87
3.45
8 2
0.34
7.72
6 3
88.7
21
201
.190
1
.872
.377
1
.793
.284
1
64.1
34
-2.7
36.0
95
198
.314
2
.012
.564
9
34.9
82
1.0
73.2
25
43.
123.
880
ABO
NO
S PO
R A
JUST
E PO
R IN
FLA
CIÓ
N -
- -
- -
- -
- -
- -
- -
- -
CA
RGO
S PO
R A
JUST
E PO
R IN
FLA
CIÓ
N -
- -
- -
- -
- -
- -
- -
- -
RESU
LTA
DO
AN
TES
DE
IMPU
ESTO
S 1
2.38
0.22
7 4
.493
.231
1
6.87
3.45
8 2
0.34
7.72
6 3
88.7
21
201
.190
1
.872
.377
1
.793
.284
1
64.1
34
-2.7
36.0
95
198
.314
2
.012
.564
9
34.9
82
1.0
73.2
25
43.
123.
880
IMPU
ESTO
SO
BRE
LAS
UTI
LIDA
DES
DE
LAS
EMPR
ESA
S -
- -
- -
- -
- -
- -
- -
- -
RESU
LTA
DO
NET
O D
E LA
GES
TIO
N 1
2.38
0.22
7 4
.493
.231
1
6.87
3.45
8 2
0.34
7.72
6 3
88.7
21
201
.190
1
.872
.377
1
.793
.284
1
64.1
34
-2.7
36.0
95
198
.314
2
.012
.564
9
34.9
82
1.0
73.2
25
43.
123.
880
6 ASOCIACIÓN DE INSTITUCIONES FINANCIERAS DE DESARROLLO
CU
AD
RO
Nº
3
IND
ICA
DO
RES
FIN
AN
CIE
RO
SIN
STIT
UCIO
NES
FIN
AN
CIE
RA
S D
E D
ESA
RRO
LLO
30
de
julio
de
20
11
(En p
orc
enta
jes)
C
REC
ER
PRO
MU
JER
Sub
Tot
al
Banc
a C
omun
al
DIA
CO
NIA
E
MPR
END
ER
FO
NC
RESO
L F
UN
BOD
EM
IDEP
RO
IMPR
O
SA
RTAW
I A
NED
C
IDRE
F
ON
DEC
O
FU
BOD
E T
OTA
L
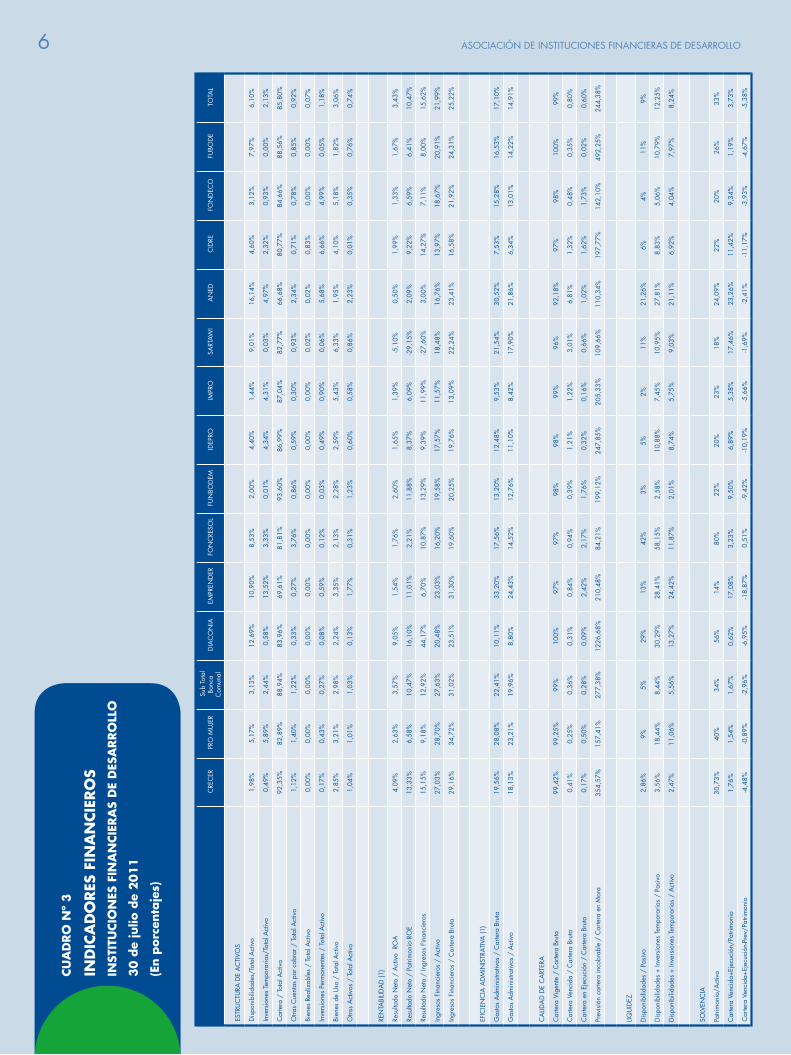
ESTR
UC
TURA
DE
AC
TIVO
S
Dis
poni
bilid
ades
/Tot
al A
ctiv
o1,
98%
5,17
%3,
13%
12,6
9%10
,90%
8,53
%2,
00%
4,40
%1,
44%
9,01
%16
,14%
4,60
%3,
12%
7,97
%6,
10%
Inve
rsio
nes
Tem
pora
rias/
Tota
l Act
ivo
0,49
%5,
89%
2,44
%0,
58%
13,5
2%3,
33%
0,01
%4,
34%
4,31
%0,
03%
4,97
%2,
32%
0,93
%0,
00%
2,13
%
Car
tera
/ T
otal
Act
ivo
92,3
5%82
,89%
88,9
4%83
,96%
69,6
1%81
,81%
93,6
0%86
,99%
87,0
4%82
,77%
66,6
8%80
,77%
84,6
6%88
,56%
85,8
0%
Otra
s C
uent
as p
or c
obra
r / T
otal
Act
ivo
1,12
%1,
40%
1,22
%0,
33%
0,27
%3,
76%
0,86
%0,
59%
0,30
%0,
93%
2,34
%0,
71%
0,78
%0,
85%
0,92
%
Bien
es R
ealiz
able
s /
Tota
l Act
ivo
0,00
%0,
00%
0,00
%0,
00%
0,00
%0,
00%
0,00
%0,
00%
0,00
%0,
02%
0,02
%0,
83%
0,00
%0,
00%
0,07
%
Inve
rsio
nes
Perm
anen
tes
/ To
tal A
ctiv
o0,
17%
0,43
%0,
27%
0,08
%0,
59%
0,12
%0,
03%
0,49
%0,
90%
0,06
%5,
68%
6,66
%4,
99%
0,05
%1,
18%
Bien
es d
e U
so /
Tot
al A
ctiv
o2,
85%
3,21
%2,
98%
2,24
%3,
35%
2,13
%2,
28%
2,59
%5,
43%
6,33
%1,
95%
4,10
%5,
18%
1,82
%3,
06%
Otro
s A
ctiv
os /
Tot
al A
ctiv
o1,
04%
1,01
%1,
03%
0,13
%1,
77%
0,31
%1,
23%
0,60
%0,
58%
0,86
%2,
23%
0,01
%0,
35%
0,76
%0,
74%
REN
TABI
LIDA
D (1
)
Resu
ltado
Net
o /
Act
ivo
RO
A4,
09%
2,63
%3,
57%
9,05
%1,
54%
1,76
%2,
60%
1,65
%1,
39%
-5,1
0%0,
50%
1,99
%1,
33%
1,67
%3,
43%
Resu
ltado
Net
o /
Patri
mon
io R
OE
13,3
3%6,
58%
10,4
7%16
,10%
11,0
1%2,
21%
11,8
8%8,
37%
6,09
%-2
9,15
%2,
09%
9,22
%6,
59%
6,41
%10
,47%
Resu
ltado
Net
o /
Ingr
esos
Fin
anci
eros
15,1
5%9,
18%
12,9
2%44
,17%
6,70
%10
,87%
13,2
9%9,
39%
11,9
9%-2
7,60
%3,
00%
14,2
7%7,
11%
8,00
%15
,62%
Ingr
esos
Fin
anci
eros
/ A
ctiv
o 27
,03%
28,7
0%27
,63%
20,4
8%23
,03%
16,2
0%19
,58%
17,5
7%11
,57%
18,4
8%16
,76%
13,9
7%18
,67%
20,9
1%21
,99%
Ingr
esos
Fin
anci
eros
/ C
arte
ra B
ruta
29,1
6%34
,72%
31,0
2%23
,51%
31,3
0%19
,60%
20,2
5%19
,76%
13,0
9%22
,24%
23,4
1%16
,58%
21,9
2%24
,31%
25,2
2%
EFIC
IEN
CIA
AD
MIN
ISTR
ATIV
A (1
)
Gas
tos
Adm
inis
trativ
os /
Car
tera
Bru
ta19
,56%
28,0
8%22
,41%
10,1
1%33
,20%
17,5
6%13
,20%
12,4
8%9,
53%
21,5
4%30
,52%
7,53
%15
,28%
16,5
3%17
,10%
Gas
tos
Adm
inis
trativ
os /
Act
ivo
18,1
3%23
,21%
19,9
6%8,
80%
24,4
3%14
,52%
12,7
6%11
,10%
8,42
%17
,90%
21,8
6%6,
34%
13,0
1%14
,22%
14,9
1%
CA
LIDA
D D
E C
ART
ERA
Car
tera
Vig
ente
/ C
arte
ra B
ruta
99,4
2%99
,25%
99%
100%
97%
97%
98%
98%
99%
96%
92,1
8%97
%98
%10
0%99
%
Car
tera
Ven
cida
/ C
arte
ra B
ruta
0,41
%0,
25%
0,36
%0,
31%
0,84
%0,
94%
0,39
%1,
21%
1,22
%3,
01%
6,81
%1,
32%
0,48
%0,
35%
0,80
%
Car
tera
en
Ejec
ució
n /
Car
tera
Bru
ta0,
17%
0,50
%0,
28%
0,09
%2,
42%
2,17
%1,
76%
0,32
%0,
16%
0,66
%1,
02%
1,62
%1,
73%
0,02
%0,
60%
Prev
isió
n ca
rtera
inco
brab
le /
Car
tera
en
Mor
a35
4,57
%15
7,41
%27
7,38
%12
26,6
8%21
0,48
%84
,21%
199,
12%
247,
85%
205,
33%
109,
66%
110,
34%
197,
77%
142,
10%
492,
25%
244,
38%
LIQU
IDEZ
Dis
poni
bilid
ades
/ P
asiv
o2,
86%
9%5%
29%
13%
42%
3%5%
2%11
%21
,26%
6%4%
11%
9%
Dis
poni
bilid
ades
+ In
vers
ione
s Te
mpo
raria
s /
Pasi
vo3,
56%
18,4
4%8,
44%
30,2
9%28
,41%
58,1
5%2,
58%
10,8
8%7,
45%
10,9
5%27
,81%
8,83
%5,
06%
10,7
9%12
,25%
Dis
poni
bilid
ades
+ In
vers
ione
s Te
mpo
raria
s /
Act
ivo
2,47
%11
,06%
5,56
%13
,27%
24,4
2%11
,87%
2,01
%8,
74%
5,75
%9,
03%
21,1
1%6,
92%
4,04
%7,
97%
8,24
%
SOLV
ENC
IA
Patri
mon
io/A
ctiv
o30
,73%
40%
34%
56%
14%
80%
22%
20%
23%
18%
24,0
9%22
%20
%26
%33
%
Car
tera
Ven
cida
+Eje
cuci
ón/P
atrim
onio
1,76
%1,
54%
1,67
%0,
62%
17,0
8%3,
23%
9,50
%6,
89%
5,38
%17
,46%
23,2
6%11
,42%
9,34
%1,
19%
3,73
%
Car
tera
Ven
cida
+Eje
cuci
ón-P
rev/
Patri
mon
io-4
,48%
-0,8
9%-2
,96%
-6,9
5%-1
8,87
%0,
51%
-9,4
2%-1
0,19
%-5
,66%
-1,6
9%-2
,41%
-11,
17%
-3,9
3%-4
,67%
-5,3
8%
7IFD: INSTITUCIONES FINANCIERAS DE DESARROLLO - FINANZAS PARA EL DESARROLLO CON VISIÓN SOCIAL
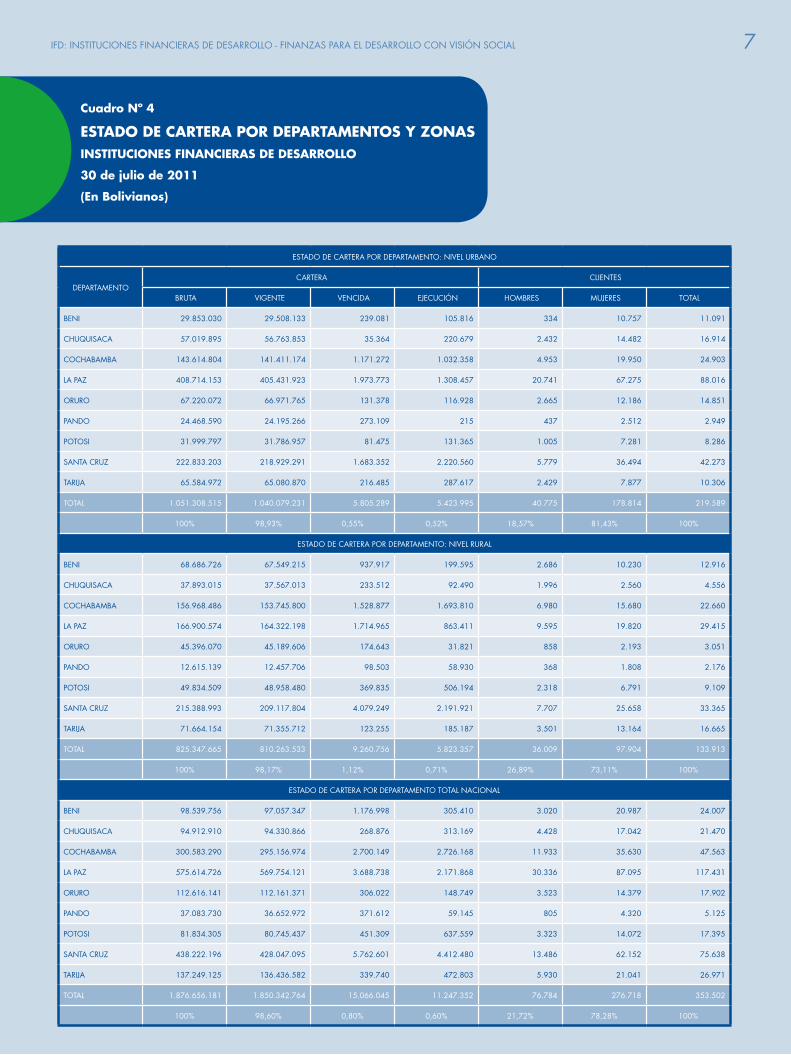
Cuadro Nº 4
ESTADO DE CARTERA POR DEPARTAMENTOS Y ZONASINSTITUCIONES FINANCIERAS DE DESARROLLO
30 de julio de 2011
(En Bolivianos)
ESTADO DE CARTERA POR DEPARTAMENTO: NIVEL URBANO
DEPARTAMENTO CARTERA CLIENTES
BRUTA VIGENTE VENCIDA EJECUCIÓN HOMBRES MUJERES TOTAL
BENI 29.853.030 29.508.133 239.081 105.816 334 10.757 11.091
CHUQUISACA 57.019.895 56.763.853 35.364 220.679 2.432 14.482 16.914
COCHABAMBA 143.614.804 141.411.174 1.171.272 1.032.358 4.953 19.950 24.903
LA PAZ 408.714.153 405.431.923 1.973.773 1.308.457 20.741 67.275 88.016
ORURO 67.220.072 66.971.765 131.378 116.928 2.665 12.186 14.851
PANDO 24.468.590 24.195.266 273.109 215 437 2.512 2.949
POTOSI 31.999.797 31.786.957 81.475 131.365 1.005 7.281 8.286
SANTA CRUZ 222.833.203 218.929.291 1.683.352 2.220.560 5.779 36.494 42.273
TARIJA 65.584.972 65.080.870 216.485 287.617 2.429 7.877 10.306
TOTAL 1.051.308.515 1.040.079.231 5.805.289 5.423.995 40.775 178.814 219.589
100% 98,93% 0,55% 0,52% 18,57% 81,43% 100%
ESTADO DE CARTERA POR DEPARTAMENTO: NIVEL RURAL
BENI 68.686.726 67.549.215 937.917 199.595 2.686 10.230 12.916
CHUQUISACA 37.893.015 37.567.013 233.512 92.490 1.996 2.560 4.556
COCHABAMBA 156.968.486 153.745.800 1.528.877 1.693.810 6.980 15.680 22.660
LA PAZ 166.900.574 164.322.198 1.714.965 863.411 9.595 19.820 29.415
ORURO 45.396.070 45.189.606 174.643 31.821 858 2.193 3.051
PANDO 12.615.139 12.457.706 98.503 58.930 368 1.808 2.176
POTOSI 49.834.509 48.958.480 369.835 506.194 2.318 6.791 9.109
SANTA CRUZ 215.388.993 209.117.804 4.079.249 2.191.921 7.707 25.658 33.365
TARIJA 71.664.154 71.355.712 123.255 185.187 3.501 13.164 16.665
TOTAL 825.347.665 810.263.533 9.260.756 5.823.357 36.009 97.904 133.913
100% 98,17% 1,12% 0,71% 26,89% 73,11% 100%
ESTADO DE CARTERA POR DEPARTAMENTO TOTAL NACIONAL
BENI 98.539.756 97.057.347 1.176.998 305.410 3.020 20.987 24.007
CHUQUISACA 94.912.910 94.330.866 268.876 313.169 4.428 17.042 21.470
COCHABAMBA 300.583.290 295.156.974 2.700.149 2.726.168 11.933 35.630 47.563
LA PAZ 575.614.726 569.754.121 3.688.738 2.171.868 30.336 87.095 117.431
ORURO 112.616.141 112.161.371 306.022 148.749 3.523 14.379 17.902
PANDO 37.083.730 36.652.972 371.612 59.145 805 4.320 5.125
POTOSI 81.834.305 80.745.437 451.309 637.559 3.323 14.072 17.395
SANTA CRUZ 438.222.196 428.047.095 5.762.601 4.412.480 13.486 62.152 75.638
TARIJA 137.249.125 136.436.582 339.740 472.803 5.930 21.041 26.971
TOTAL 1.876.656.181 1.850.342.764 15.066.045 11.247.352 76.784 276.718 353.502
100% 98,60% 0,80% 0,60% 21,72% 78,28% 100%
8 ASOCIACIÓN DE INSTITUCIONES FINANCIERAS DE DESARROLLO
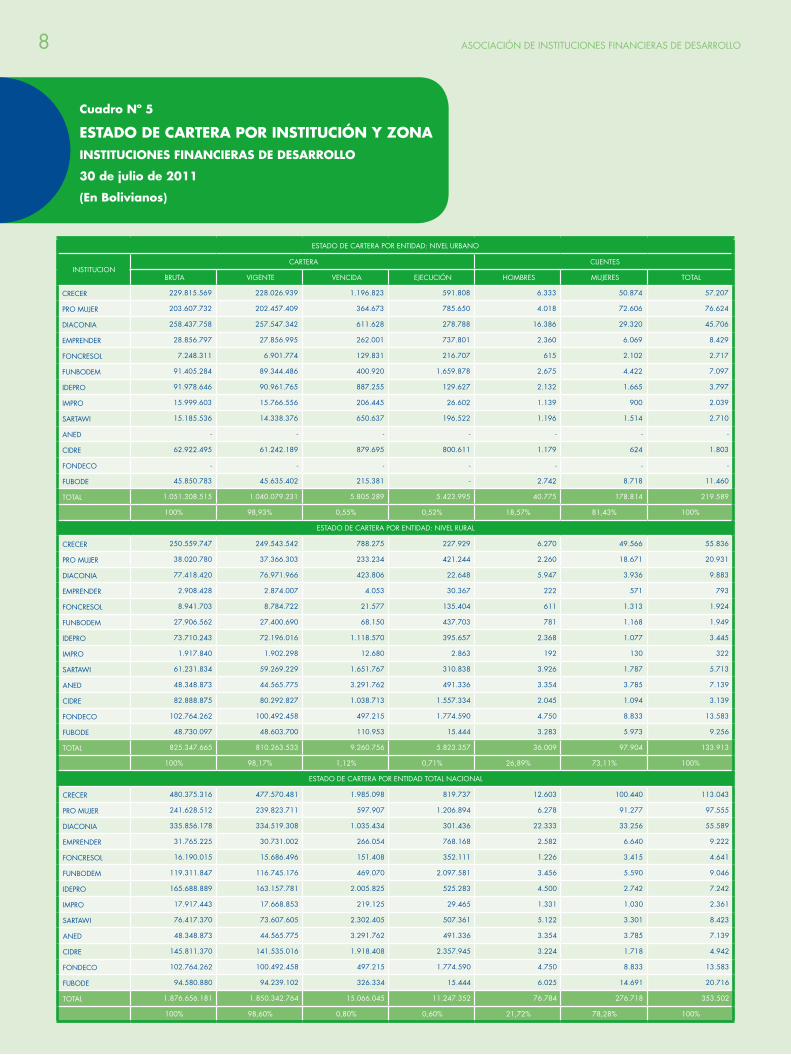
Cuadro Nº 5
ESTADO DE CARTERA POR INSTITUCIÓN Y ZONAINSTITUCIONES FINANCIERAS DE DESARROLLO
30 de julio de 2011
(En Bolivianos)
ESTADO DE CARTERA POR ENTIDAD: NIVEL URBANO
INSTITUCION CARTERA CLIENTES
BRUTA VIGENTE VENCIDA EJECUCIÓN HOMBRES MUJERES TOTAL
CRECER 229.815.569 228.026.939 1.196.823 591.808 6.333 50.874 57.207
PRO MUJER 203.607.732 202.457.409 364.673 785.650 4.018 72.606 76.624
DIACONIA 258.437.758 257.547.342 611.628 278.788 16.386 29.320 45.706
EMPRENDER 28.856.797 27.856.995 262.001 737.801 2.360 6.069 8.429
FONCRESOL 7.248.311 6.901.774 129.831 216.707 615 2.102 2.717
FUNBODEM 91.405.284 89.344.486 400.920 1.659.878 2.675 4.422 7.097
IDEPRO 91.978.646 90.961.765 887.255 129.627 2.132 1.665 3.797
IMPRO 15.999.603 15.766.556 206.445 26.602 1.139 900 2.039
SARTAWI 15.185.536 14.338.376 650.637 196.522 1.196 1.514 2.710
ANED - - - - - - -
CIDRE 62.922.495 61.242.189 879.695 800.611 1.179 624 1.803
FONDECO - - - - - - -
FUBODE 45.850.783 45.635.402 215.381 - 2.742 8.718 11.460
TOTAL 1.051.308.515 1.040.079.231 5.805.289 5.423.995 40.775 178.814 219.589
100% 98,93% 0,55% 0,52% 18,57% 81,43% 100%
ESTADO DE CARTERA POR ENTIDAD: NIVEL RURAL
CRECER 250.559.747 249.543.542 788.275 227.929 6.270 49.566 55.836
PRO MUJER 38.020.780 37.366.303 233.234 421.244 2.260 18.671 20.931
DIACONIA 77.418.420 76.971.966 423.806 22.648 5.947 3.936 9.883
EMPRENDER 2.908.428 2.874.007 4.053 30.367 222 571 793
FONCRESOL 8.941.703 8.784.722 21.577 135.404 611 1.313 1.924
FUNBODEM 27.906.562 27.400.690 68.150 437.703 781 1.168 1.949
IDEPRO 73.710.243 72.196.016 1.118.570 395.657 2.368 1.077 3.445
IMPRO 1.917.840 1.902.298 12.680 2.863 192 130 322
SARTAWI 61.231.834 59.269.229 1.651.767 310.838 3.926 1.787 5.713
ANED 48.348.873 44.565.775 3.291.762 491.336 3.354 3.785 7.139
CIDRE 82.888.875 80.292.827 1.038.713 1.557.334 2.045 1.094 3.139
FONDECO 102.764.262 100.492.458 497.215 1.774.590 4.750 8.833 13.583
FUBODE 48.730.097 48.603.700 110.953 15.444 3.283 5.973 9.256
TOTAL 825.347.665 810.263.533 9.260.756 5.823.357 36.009 97.904 133.913
100% 98,17% 1,12% 0,71% 26,89% 73,11% 100%
ESTADO DE CARTERA POR ENTIDAD TOTAL NACIONAL
CRECER 480.375.316 477.570.481 1.985.098 819.737 12.603 100.440 113.043
PRO MUJER 241.628.512 239.823.711 597.907 1.206.894 6.278 91.277 97.555
DIACONIA 335.856.178 334.519.308 1.035.434 301.436 22.333 33.256 55.589
EMPRENDER 31.765.225 30.731.002 266.054 768.168 2.582 6.640 9.222
FONCRESOL 16.190.015 15.686.496 151.408 352.111 1.226 3.415 4.641
FUNBODEM 119.311.847 116.745.176 469.070 2.097.581 3.456 5.590 9.046
IDEPRO 165.688.889 163.157.781 2.005.825 525.283 4.500 2.742 7.242
IMPRO 17.917.443 17.668.853 219.125 29.465 1.331 1.030 2.361
SARTAWI 76.417.370 73.607.605 2.302.405 507.361 5.122 3.301 8.423
ANED 48.348.873 44.565.775 3.291.762 491.336 3.354 3.785 7.139
CIDRE 145.811.370 141.535.016 1.918.408 2.357.945 3.224 1.718 4.942
FONDECO 102.764.262 100.492.458 497.215 1.774.590 4.750 8.833 13.583
FUBODE 94.580.880 94.239.102 326.334 15.444 6.025 14.691 20.716
TOTAL 1.876.656.181 1.850.342.764 15.066.045 11.247.352 76.784 276.718 353.502
100% 98,60% 0,80% 0,60% 21,72% 78,28% 100%
9IFD: INSTITUCIONES FINANCIERAS DE DESARROLLO - FINANZAS PARA EL DESARROLLO CON VISIÓN SOCIAL
CA
RTER
A P
OR
ENTI
DA
D: N
IVEL
URB
AN
O
INST
ITU
CIO
NSE
CTO
R EC
ON
OM
ICO
A
gric
ultu
ra y
G
anad
ería
Caz
a, S
ilvic
ul-
tura
y P
esca
Extra
cció
n de
pet
role
o cr
udo
y ga
s na
tura
l
Min
eral
es
met
álic
os y
no
met
álic
os
Indu
stria
M
anuf
actu
rera
Prod
ucci
ón
y di
strib
u-ci
ón d
e en
ergí
a el
éctri
ca,
gas
y ag
ua
Con
stru
cció
nVe
nta
al p
or
may
or y
men
orH
otel
es y
Re
stau
rant
es
Tran
spor
te,
alm
acen
amie
n-to
y c
omun
i-ca
ción
Inte
rme-
diac
ión
finan
cier
a
Serv
icio
s in
mob
iliar
ios,
em
pres
aria
les
y de
alq
uile
r
Adm
inis
tra-
ción
púb
lica,
de
fens
a y
segu
ridad
so
cial
ob
ligat
oria
Educ
ació
nSe
rvic
ios
soci
a-le
s, c
omun
ales
y
pers
onal
es
Serv
icio
de
hoga
res
priv
ados
que
co
ntra
tan
serv
icio
do
més
tico
Serv
icio
s de
org
ani-
zaci
ones
y
órga
nos
extra
terr
ito-
riale
s
Act
ivid
ades
at
ípic
asTO
TAL
CRE
CER
20.
860.
939
- -
- -
- -
182
.898
.659
-
- -
- -
- 2
6.05
5.97
0 -
- -
229
.815
.569
PRO
MU
JER
- -
- -
18.
383.
320
- -
163
.851
.316
9
.729
.261
6
.230
.210
-
- -
- -
- -
5.4
13.6
24
203
.607
.732
DIA
CO
NIA
1.9
55.8
80
112
.987
-
796
.293
1
4.75
0.85
4 5
9.83
8 7
4.41
6.61
2 8
4.34
9.04
5 2
.050
.254
5
0.81
9.07
0
4.71
5.46
7 1
7.37
9.08
7 4
19.5
22
1.3
67.3
42
5.1
27.3
22
40.
170
5.0
00
73.
015
258
.437
.758
EMPR
END
ER -
- -
- 3
.775
.550
-
- 1
9.77
2.26
6 3
.559
.562
1
.749
.419
-
- -
- -
- -
- 2
8.85
6.79
7
FON
CRE
SOL
149
.202
-
- -
544
.561
-
428
.154
4
.838
.430
-
- -
- -
- 1
.129
.733
-
- 1
58.2
31
7.2
48.3
11
FUN
BOD
EM 4
25.5
87
19.
200
- -
10.
455.
856
- 3
15.2
75
14.
046.
815
4.7
45.2
97
30.
700.
927
33.
810
1.8
15.0
06
158
.897
2
17.8
54
28.
470.
760
- -
- 9
1.40
5.28
4
IDEP
RO 3
.320
.185
3
.691
.383
-
68.
800
12.
064.
801
- 2
.608
.361
2
9.03
1.81
6 8
.162
.998
2
1.66
0.97
0 -
3.9
65.9
70
- 8
71.5
68
4.8
15.1
98
82.
582
- 1
.634
.015
9
1.97
8.64
6
IMPR
O -
- -
- 2
.719
.799
-
3.9
93.3
28
1.5
47.3
36
- -
- 7
10.1
10
- 5
98.1
24
6.4
30.9
06
- -
- 1
5.99
9.60
3
SART
AWI
4.0
81.4
42
41.
321
- 8
7.90
6 1
.444
.106
1
.288
1
.177
.848
5
.449
.444
5
28.9
80
1.1
44.9
29
25.
991
835
.354
7
2.39
6 5
9.11
6 2
10.4
33
11.
731
- 1
3.25
2 1
5.18
5.53
6
AN
ED -
- -
- -
- -
- -
- -
- -
- -
- -
- -
CID
RE 6
.083
.987
6
19.6
58
11.
450
499
.495
5
.484
.939
1
0.30
5 1
1.19
0.02
2 1
1.10
1.60
7 1
.186
.461
1
3.53
0.24
1 4
14.8
77
9.3
57.1
62
630
.849
4
20.1
31
2.2
26.1
88
50.
613
- 1
04.5
13
62.
922.
495
FON
DEC
O -
- -
- -
- -
- -
- -
- -
- -
- -
- -
FUBO
DE
1.6
19.1
74
6.9
26
- 5
3.31
3 2
.965
.738
-
6.8
13.1
15
26.
433.
720
3.8
51.0
70
3.4
50.2
60
- 6
8.38
6 -
31.
425
553
.390
-
- 4
.264
4
5.85
0.78
3
TOTA
L 3
8.49
6.39
6 4
.491
.474
1
1.45
0 1
.505
.807
7
2.58
9.52
3 7
1.43
1 1
00.9
42.7
14
543
.320
.454
3
3.81
3.88
4 1
29.2
86.0
26
5.
190.
146
34.
131.
076
1.2
81.6
64
3.5
65.5
61
75.
019.
900
185
.095
5
.000
7
.400
.915
1
.051
.308
.515
3,
66%
0,43
%0,
00%
0,14
%6,
90%
0,01
%9,
60%
51,6
8%3,
22%
12,3
0%0,
49%
3,25
%0,
12%
0,34
%7,
14%
0,02
%0,
00%
0,70
%10
0%
CA
RTER
A P
OR
ENTI
DA
D: N
IVEL
RU
RAL
CRE
CER
37.
239.
199
- -
- -
- -
190
.207
.651
-
- -
- -
- 2
3.11
2.89
7 -
- -
250
.559
.746
PRO
MU
JER
- -
- -
2.2
05.7
06
- -
33.
021.
697
1.3
81.9
93
825
.704
-
- -
- -
- -
585
.679
3
8.02
0.78
0
DIA
CO
NIA
20.
535.
788
1.2
95.9
87
3.4
06
646
.112
3
.778
.920
1
49.4
72
16.
183.
692
17.
084.
094
1.6
65.6
80
10.
983.
904
139
.291
3
.477
.776
1
23.4
23
369
.000
9
14.1
97
18.
865
- 4
8.81
2 7
7.41
8.42
0
EMPR
END
ER 2
.908
.428
-
- -
- -
- -
- -
- -
- -
- -
- -
2.9
08.4
28
FON
CRE
SOL
2.1
90.5
83
- -
- 1
.126
.315
-
260
.500
4
.953
.812
-
- -
- -
- 3
16.2
10
- -
94.
283
8.9
41.7
03
FUN
BOD
EM 6
.799
.769
1
0.99
2 -
8.2
93
829
.965
-
101
.627
1
.701
.109
7
39.8
16
10.
472.
163
- 6
0.72
2 1
8.63
0 6
9.95
2 7
.093
.525
-
- -
27.
906.
562
IDEP
RO 3
5.13
5.40
9 7
.141
.456
-
170
.659
5
.296
.661
-
1.4
96.1
01
10.
885.
995
2.6
50.3
79
7.3
84.8
48
- 1
.376
.428
-
522
.302
1
.363
.183
3
.500
2
9.77
0 2
53.5
50
73.
710.
243
IMPR
O -
- -
- 1
.557
.827
-
103
.471
7
1.85
8 -
- -
- -
3.4
26
181
.259
-
- -
1.9
17.8
40
SART
AWI
47.
507.
028
22.
362
- 2
3.72
9 6
37.0
07
25.
259
2.4
92.4
33
6.0
66.5
86
886
.805
1
.753
.925
8
2.76
0 9
48.1
43
140
.914
3
24.6
35
274
.217
2
3.50
3 -
22.
529
61.
231.
834
AN
ED 1
1.98
5.09
0 1
1.27
8.88
3 -
105
.359
1
.011
.511
-
- 9
.636
.685
6
96.8
96
3.6
57.1
68
- 9
.417
.744
-
130
.329
2
19.6
15
- -
209
.593
4
8.34
8.87
3
CID
RE 5
0.30
8.54
1 4
55.0
02
29.
579
1.5
31.5
19
4.5
12.9
60
- 4
.956
.230
4
.352
.622
6
48.1
65
8.7
58.9
75
330
.408
5
.793
.978
2
28.0
45
173
.288
7
57.7
52
44.
082
- 7
.729
8
2.88
8.87
5
FON
DEC
O 4
9.48
3.77
2 -
- -
2.4
22.7
58
- 1
4.83
8.39
8 3
.156
.548
-
11.
610.
111
- -
- -
- -
- 2
1.25
2.65
8 1
02.7
64.2
45
FUBO
DE
14.
181.
600
27.
500
- 8
84.7
70
3.9
04.3
89
236
.212
8
.811
.056
1
4.06
0.18
6 3
.464
.721
2
.487
.411
-
50.
280
- 2
6.85
3 5
72.0
66
- -
23.
053
48.
730.
097
TOTA
L 2
78.2
75.2
06
20.
232.
183
32.
985
3.3
70.4
41
27.
284.
020
410
.943
4
9.24
3.50
8 2
95.1
98.8
43
12.
134.
456
57.
934.
210
552
.459
2
1.12
5.07
2 5
11.0
12
1.6
19.7
86
34.
804.
920
89.
949
29.
770
22.
497.
886
825
.347
.647
33
,72%
2,45
%0,
00%
0,41
%3,
31%
0,05
%5,
97%
35,7
7%1,
47%
7,02
%0,
07%
2,56
%0,
06%
0,20
%4,
22%
0,01
%0,
00%
2,73
%10
0%
CA
RTER
A P
OR
ENTI
DA
D: T
OTA
L N
AC
ION
AL
CRE
CER
58.
100.
138
- -
- -
- -
373
.106
.310
-
- -
- -
- 4
9.16
8.86
7 -
- -
480
.375
.315
PRO
MU
JER
- -
- -
20.
589.
026
- -
196
.873
.014
1
1.11
1.25
5 7
.055
.914
-
- -
- -
- -
5.9
99.3
03
241
.628
.512
DIA
CO
NIA
22.
491.
668
1.4
08.9
74
3.4
06
1.4
42.4
05
18.
529.
774
209
.310
9
0.60
0.30
3 1
01.4
33.1
39
3.7
15.9
35
61.
802.
974
4.
854.
758
20.
856.
863
542
.945
1
.736
.342
6
.041
.518
5
9.03
4 5
.000
1
21.8
28
335
.856
.178
EMPR
END
ER 2
.908
.428
-
- -
3.7
75.5
50
- -
19.
772.
266
3.5
59.5
62
1.7
49.4
19
- -
- -
- -
- -
31.
765.
225
FON
CRE
SOL
2.3
39.7
84
- -
- 1
.670
.876
-
688
.654
9
.792
.242
-
- -
- -
- 1
.445
.944
-
- 2
52.5
14
16.
190.
015
FUN
BOD
EM 7
.225
.356
3
0.19
2 -
8.2
93
11.
285.
821
- 4
16.9
02
15.
747.
924
5.4
85.1
13
41.
173.
090
33.
810
1.8
75.7
29
177
.527
2
87.8
06
35.
564.
285
- -
- 1
19.3
11.8
47
IDEP
RO 3
8.45
5.59
4 1
0.83
2.83
9 -
239
.459
1
7.36
1.46
2 -
4.1
04.4
63
39.
917.
810
10.
813.
377
29.
045.
818
- 5
.342
.399
-
1.3
93.8
70
6.1
78.3
82
86.
082
29.
770
1.8
87.5
65
165
.688
.889
IMPR
O -
- -
- 4
.277
.626
-
4.0
96.7
98
1.6
19.1
94
- -
- 7
10.1
10
- 6
01.5
50
6.6
12.1
64
- -
- 1
7.91
7.44
3
SART
AWI
51.
588.
470
63.
683
- 1
11.6
35
2.0
81.1
13
26.
547
3.6
70.2
80
11.
516.
030
1.4
15.7
84
2.8
98.8
54
108
.752
1
.783
.497
2
13.3
10
383
.751
4
84.6
49
35.
234
- 3
5.78
1 7
6.41
7.37
0
AN
ED 1
1.98
5.09
0 1
1.27
8.88
3 -
105
.359
1
.011
.511
-
- 9
.636
.685
6
96.8
96
3.6
57.1
68
- 9
.417
.744
-
130
.329
2
19.6
15
- -
209
.593
4
8.34
8.87
3
CID
RE 5
6.39
2.52
8 1
.074
.660
4
1.02
9 2
.031
.014
9
.997
.899
1
0.30
5 1
6.14
6.25
2 1
5.45
4.22
9 1
.834
.625
2
2.28
9.21
6 7
45.2
85
15.
151.
139
858
.894
5
93.4
19
2.9
83.9
39
94.
695
- 1
12.2
41
145
.811
.369
FON
DEC
O 4
9.48
3.77
2 -
- -
2.4
22.7
58
- 1
4.83
8.39
8 3
.156
.548
-
11.
610.
111
- -
- -
- -
- 2
1.25
2.65
8 1
02.7
64.2
45
FUBO
DE
15.
800.
774
34.
426
- 9
38.0
83
6.8
70.1
27
236
.212
1
5.62
4.17
1 4
0.49
3.90
6 7
.315
.791
5
.937
.671
-
118
.667
-
58.
278
1.1
25.4
56
- -
27.
318
94.
580.
881
TOTA
L 3
16.7
71.6
02
24.
723.
657
44.
434
4.8
76.2
48
99.
873.
544
482
.374
1
50.1
86.2
21
838
.519
.297
4
5.94
8.34
0 1
87.2
20.2
36
5.
742.
605
55.
256.
148
1.7
92.6
76
5.1
85.3
46
109
.824
.820
2
75.0
45
34.
770
29.
898.
801
1.8
76.6
56.1
63
16
,88%
1,32
%0,
00%
0,26
%5,
32%
0,03
%8,
00%
44,6
8%2,
45%
9,98
%0,
31%
2,94
%0,
10%
0,28
%5,
85%
0,01
%0,
00%
1,59
%10
0%
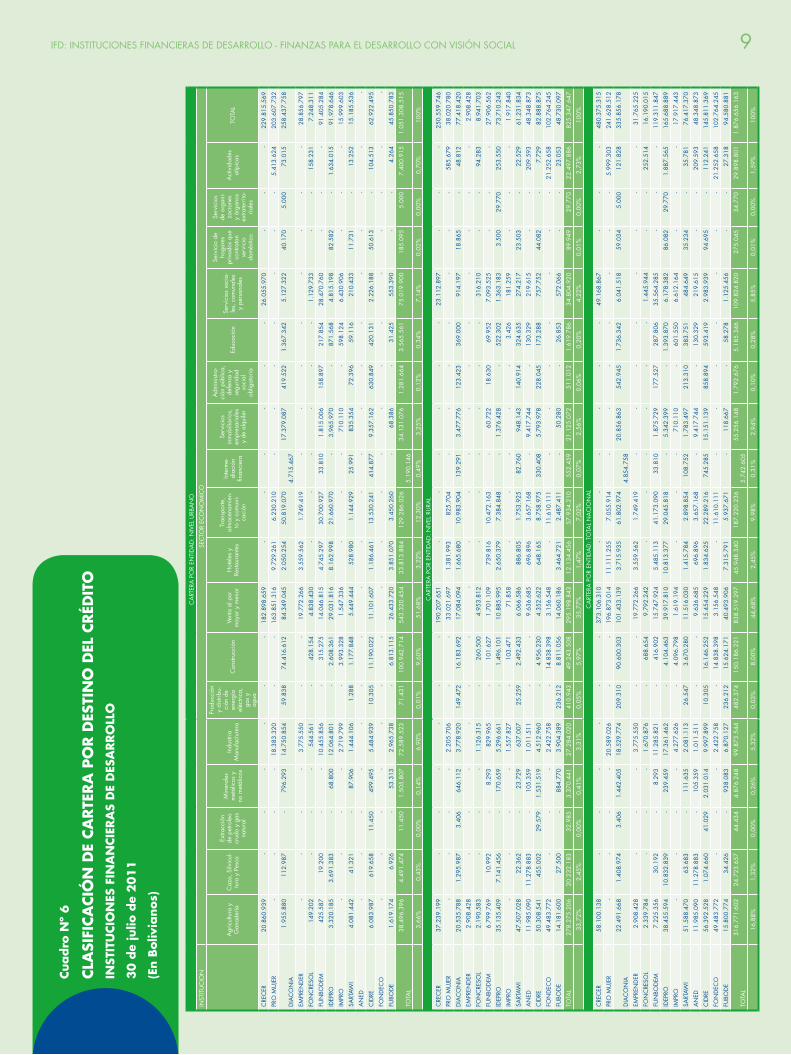
Cuadro
Nº
6
CLA
SIFI
CA
CIÓ
N D
E CA
RTE
RA
PO
R D
ESTI
NO
DEL
CRÉD
ITO
INST
ITU
CIO
NES
FIN
AN
CIE
RA
S D
E D
ESA
RRO
LLO
30
de
julio
de
20
11
(En B
oliv
ianos)
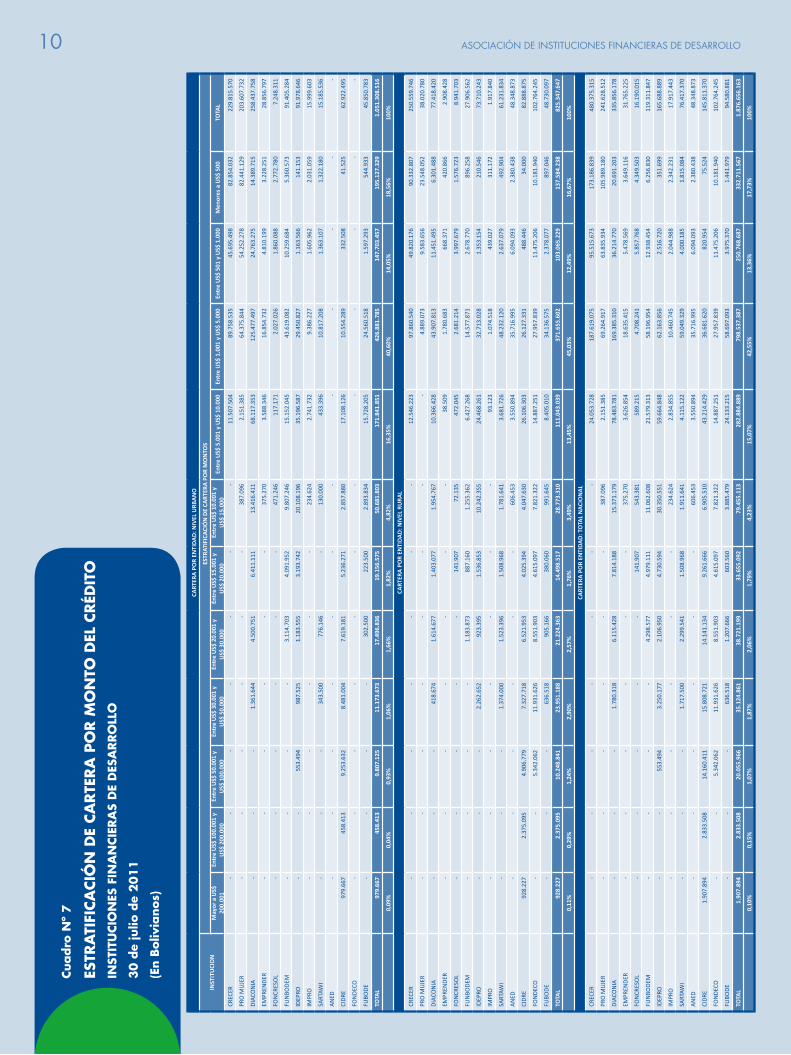
10 ASOCIACIÓN DE INSTITUCIONES FINANCIERAS DE DESARROLLO
Cuadro
Nº
7
ESTR
ATI
FICA
CIÓ
N D
E CA
RTE
RA
PO
R M
ON
TO D
EL C
RÉD
ITO
INST
ITU
CIO
NES
FIN
AN
CIE
RA
S D
E D
ESA
RRO
LLO
30
de
julio
de
20
11
(En B
oliv
ianos)
CART
ERA
PO
R EN
TID
AD
: NIV
EL U
RBA
NO
INST
ITU
CIO
NES
TRAT
IFIC
ACI
ÓN
DE
CART
ERA
PO
R M
ON
TOS
May
or a
US$
20
0.00
1En
tre
US$
100
.001
y
US$
200
.000
Entr
e U
S$ 5
0.00
1 y
US$
100
.000
Entr
e U
S$ 3
0.00
1 y
US$
50.
000
Entr
e U
S$ 2
0.00
1 y
US$
30.
000
Entr
e U
S$ 1
5.00
1 y
US$
20.
000
Entr
e U
S$ 1
0.00
1 y
US$
15.
000
Entr
e U
S$ 5
.001
y U
S$ 1
0.00
0En
tre
US$
1.0
01 y
US$
5.0
00En
tre
US$
501
y U
S$ 1
.000
Men
ores
a U
S$ 5
00TO
TAL
CREC
ER -
- -
- -
- -
11.
507.
504
89.
758.
535
45.
695.
498
82.
854.
032
229
.815
.570
PRO
MU
JER
- -
- -
- -
387
.096
2
.151
.385
6
4.37
5.84
4 5
4.25
2.27
8 8
2.44
1.12
9 2
03.6
07.7
32
DIA
CON
IA -
- -
1.3
61.6
44
4.5
00.7
51
6.4
11.1
11
13.
416.
411
68.
117.
353
125
.477
.497
2
4.76
3.27
5 1
4.38
9.71
5 2
58.4
37.7
58
EMPR
END
ER -
- -
- -
- 3
75.2
70
3.5
88.3
46
16.
854.
732
4.8
10.1
99
3.2
28.2
51
28.
856.
797
FON
CRES
OL
- -
- -
- -
471
.246
1
17.1
71
2.0
27.0
26
1.8
60.0
88
2.7
72.7
80
7.2
48.3
11
FUN
BOD
EM -
- -
- 3
.114
.703
4
.091
.952
9
.807
.246
1
5.15
2.04
5 4
3.61
9.08
2 1
0.25
9.68
4 5
.360
.573
9
1.40
5.28
4
IDEP
RO -
- 5
53.4
94
987
.525
1
.183
.555
3
.193
.742
2
0.10
8.19
6 3
5.19
6.58
7 2
9.45
0.82
7 1
.163
.566
1
41.1
53
91.
978.
646
IMPR
O -
- -
- -
- 2
34.6
24
2.7
41.7
32
9.3
86.2
27
1.6
05.9
62
2.0
31.0
59
15.
999.
603
SART
AWI
- -
- 3
43.5
00
776
.146
-
130
.000
4
33.3
96
10.
817.
208
1.3
63.1
07
1.3
22.1
80
15.
185.
536
AN
ED -
- -
- -
- -
- -
- -
-
CID
RE 9
79.6
67
458
.413
9
.253
.632
8
.481
.004
7
.619
.181
5
.236
.271
2
.857
.880
1
7.10
8.12
6 1
0.55
4.28
9 3
32.5
08
41.
525
62.
922.
495
FON
DEC
O -
- -
- -
- -
- -
- -
-
FUBO
DE
- -
- -
302
.500
2
23.5
00
2.8
93.8
34
15.
728.
205
24.
560.
518
1.5
97.2
93
544
.933
4
5.85
0.78
3
TOTA
L 9
79.6
67
458
.413
9
.807
.125
1
1.17
3.67
3 1
7.49
6.83
6 1
9.15
6.57
5 5
0.68
1.80
3 1
71.8
41.8
51
426
.881
.785
1
47.7
03.4
57
195
.127
.329
1
.051
.308
.516
0,
09%
0,04
%0,
93%
1,06
%1,
66%
1,82
%4,
82%
16,3
5%40
,60%
14,0
5%18
,56%
100%
CART
ERA
PO
R EN
TID
AD
: NIV
EL R
URA
L
CREC
ER -
- -
- -
- -
12.
546.
223
97.
860.
540
49.
820.
176
90.
332.
807
250
.559
.746
PRO
MU
JER
- -
- -
- -
- -
4.8
89.0
73
9.5
83.6
56
23.
548.
052
38.
020.
780
DIA
CON
IA -
- -
418
.674
1
.614
.677
1
.403
.077
1
.954
.767
1
0.36
6.42
8 4
3.90
7.81
3 1
1.45
1.49
5 6
.301
.488
7
7.41
8.42
0
EMPR
END
ER -
- -
- -
- -
38.
509
1.7
80.6
83
668
.371
4
20.8
66
2.9
08.4
28
FON
CRES
OL
- -
- -
- 1
41.9
07
72.
135
472
.045
2
.681
.214
3
.997
.679
1
.576
.723
8
.941
.703
FUN
BOD
EM -
- -
- 1
.183
.873
8
87.1
60
1.2
55.3
62
6.4
27.2
68
14.
577.
871
2.6
78.7
70
896
.258
2
7.90
6.56
2
IDEP
RO -
- -
2.2
62.6
52
923
.395
1
.536
.853
1
0.24
2.35
5 2
4.46
8.26
1 3
2.71
3.02
8 1
.353
.154
2
10.5
46
73.
710.
243
IMPR
O -
- -
- -
- -
93.
123
1.0
74.5
18
439
.027
3
11.1
72
1.9
17.8
40
SART
AWI
- -
- 1
.374
.000
1
.523
.396
1
.508
.968
1
.781
.641
3
.681
.726
4
8.23
2.12
0 2
.637
.079
4
92.9
04
61.
231.
834
AN
ED -
- -
- -
- 6
06.4
53
3.5
50.8
94
35.
716.
995
6.0
94.0
93
2.3
80.4
38
48.
348.
873
CID
RE 9
28.2
27
2.3
75.0
95
4.9
06.7
79
7.3
27.7
18
6.5
21.9
53
4.0
25.3
94
4.0
47.6
30
26.
106.
303
26.
127.
331
488
.446
3
4.00
0 8
2.88
8.87
5
FON
DEC
O -
- 5
.342
.062
1
1.93
1.62
6 8
.551
.903
4
.615
.097
7
.821
.322
1
4.88
7.25
1 2
7.95
7.83
9 1
1.47
5.20
6 1
0.18
1.94
0 1
02.7
64.2
45
FUBO
DE
- -
- 6
36.5
18
905
.166
3
80.0
60
991
.645
8
.405
.010
3
4.13
6.57
5 2
.378
.077
8
97.0
46
48.
730.
097
TOTA
L 9
28.2
27
2.3
75.0
95
10.
248.
841
23.
951.
188
21.
224.
363
14.
498.
517
28.
773.
310
111
.043
.039
3
71.6
55.6
02
103
.065
.229
1
37.5
84.2
38
825
.347
.647
0,
11%
0,29
%1,
24%
2,90
%2,
57%
1,76
%3,
49%
13,4
5%45
,03%
12,4
9%16
,67%
100%
CART
ERA
PO
R EN
TID
AD
: TO
TAL
NA
CIO
NA
L
CREC
ER -
- -
- -
- -
24.
053.
728
187
.619
.075
9
5.51
5.67
3 1
73.1
86.8
39
480
.375
.315
PRO
MU
JER
- -
- -
- -
387
.096
2
.151
.385
6
9.26
4.91
7 6
3.83
5.93
4 1
05.9
89.1
80
241
.628
.512
DIA
CON
IA -
- -
1.7
80.3
18
6.1
15.4
28
7.8
14.1
88
15.
371.
179
78.
483.
781
169
.385
.310
3
6.21
4.77
0 2
0.69
1.20
3 3
35.8
56.1
78
EMPR
END
ER -
- -
- -
- 3
75.2
70
3.6
26.8
54
18.
635.
415
5.4
78.5
69
3.6
49.1
16
31.
765.
225
FON
CRES
OL
- -
- -
- 1
41.9
07
543
.381
5
89.2
15
4.7
08.2
41
5.8
57.7
68
4.3
49.5
03
16.
190.
015
FUN
BOD
EM -
- -
- 4
.298
.577
4
.979
.111
1
1.06
2.60
8 2
1.57
9.31
3 5
8.19
6.95
4 1
2.93
8.45
4 6
.256
.830
1
19.3
11.8
47
IDEP
RO -
- 5
53.4
94
3.2
50.1
77
2.1
06.9
50
4.7
30.5
94
30.
350.
551
59.
664.
848
62.
163.
856
2.5
16.7
20
351
.699
1
65.6
88.8
89
IMPR
O -
- -
- -
- 2
34.6
24
2.8
34.8
55
10.
460.
745
2.0
44.9
88
2.3
42.2
31
17.
917.
443
SART
AWI
- -
- 1
.717
.500
2
.299
.541
1
.508
.968
1
.911
.641
4
.115
.122
5
9.04
9.32
9 4
.000
.185
1
.815
.084
7
6.41
7.37
0
AN
ED -
- -
- -
- 6
06.4
53
3.5
50.8
94
35.
716.
995
6.0
94.0
93
2.3
80.4
38
48.
348.
873
CID
RE 1
.907
.894
2
.833
.508
1
4.16
0.41
1 1
5.80
8.72
1 1
4.14
1.13
4 9
.261
.666
6
.905
.510
4
3.21
4.42
9 3
6.68
1.62
0 8
20.9
54
75.
524
145
.811
.370
FON
DEC
O -
- 5
.342
.062
1
1.93
1.62
6 8
.551
.903
4
.615
.097
7
.821
.322
1
4.88
7.25
1 2
7.95
7.83
9 1
1.47
5.20
6 1
0.18
1.94
0 1
02.7
64.2
45
FUBO
DE
- -
- 6
36.5
18
1.2
07.6
66
603
.560
3
.885
.479
2
4.13
3.21
5 5
8.69
7.09
3 3
.975
.370
1
.441
.979
9
4.58
0.88
1
TOTA
L 1
.907
.894
2
.833
.508
2
0.05
5.96
6 3
5.12
4.86
1 3
8.72
1.19
9 3
3.65
5.09
2 7
9.45
5.11
3 2
82.8
84.8
89
798
.537
.387
2
50.7
68.6
87
332
.711
.567
1
.876
.656
.163
0,
10%
0,15
%1,
07%
1,87
%2,
06%
1,79
%4,
23%
15,0
7%42
,55%
13,3
6%17
,73%
100%
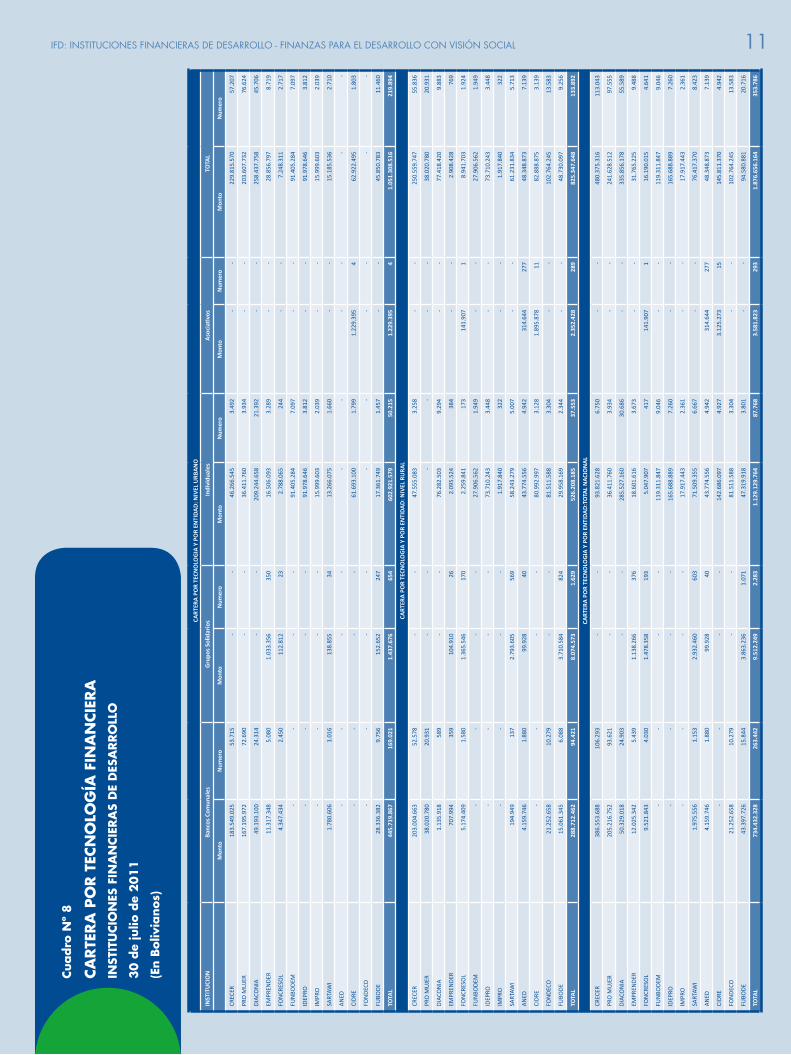
11IFD: INSTITUCIONES FINANCIERAS DE DESARROLLO - FINANZAS PARA EL DESARROLLO CON VISIÓN SOCIAL
CART
ERA
PO
R EN
TID
AD
: NIV
EL U
RBA
NO
INST
ITU
CIO
NES
TRAT
IFIC
ACI
ÓN
DE
CART
ERA
PO
R M
ON
TOS
May
or a
US$
20
0.00
1En
tre
US$
100
.001
y
US$
200
.000
Entr
e U
S$ 5
0.00
1 y
US$
100
.000
Entr
e U
S$ 3
0.00
1 y
US$
50.
000
Entr
e U
S$ 2
0.00
1 y
US$
30.
000
Entr
e U
S$ 1
5.00
1 y
US$
20.
000
Entr
e U
S$ 1
0.00
1 y
US$
15.
000
Entr
e U
S$ 5
.001
y U
S$ 1
0.00
0En
tre
US$
1.0
01 y
US$
5.0
00En
tre
US$
501
y U
S$ 1
.000
Men
ores
a U
S$ 5
00TO
TAL
CREC
ER -
- -
- -
- -
11.
507.
504
89.
758.
535
45.
695.
498
82.
854.
032
229
.815
.570
PRO
MU
JER
- -
- -
- -
387
.096
2
.151
.385
6
4.37
5.84
4 5
4.25
2.27
8 8
2.44
1.12
9 2
03.6
07.7
32
DIA
CON
IA -
- -
1.3
61.6
44
4.5
00.7
51
6.4
11.1
11
13.
416.
411
68.
117.
353
125
.477
.497
2
4.76
3.27
5 1
4.38
9.71
5 2
58.4
37.7
58
EMPR
END
ER -
- -
- -
- 3
75.2
70
3.5
88.3
46
16.
854.
732
4.8
10.1
99
3.2
28.2
51
28.
856.
797
FON
CRES
OL
- -
- -
- -
471
.246
1
17.1
71
2.0
27.0
26
1.8
60.0
88
2.7
72.7
80
7.2
48.3
11
FUN
BOD
EM -
- -
- 3
.114
.703
4
.091
.952
9
.807
.246
1
5.15
2.04
5 4
3.61
9.08
2 1
0.25
9.68
4 5
.360
.573
9
1.40
5.28
4
IDEP
RO -
- 5
53.4
94
987
.525
1
.183
.555
3
.193
.742
2
0.10
8.19
6 3
5.19
6.58
7 2
9.45
0.82
7 1
.163
.566
1
41.1
53
91.
978.
646
IMPR
O -
- -
- -
- 2
34.6
24
2.7
41.7
32
9.3
86.2
27
1.6
05.9
62
2.0
31.0
59
15.
999.
603
SART
AWI
- -
- 3
43.5
00
776
.146
-
130
.000
4
33.3
96
10.
817.
208
1.3
63.1
07
1.3
22.1
80
15.
185.
536
AN
ED -
- -
- -
- -
- -
- -
-
CID
RE 9
79.6
67
458
.413
9
.253
.632
8
.481
.004
7
.619
.181
5
.236
.271
2
.857
.880
1
7.10
8.12
6 1
0.55
4.28
9 3
32.5
08
41.
525
62.
922.
495
FON
DEC
O -
- -
- -
- -
- -
- -
-
FUBO
DE
- -
- -
302
.500
2
23.5
00
2.8
93.8
34
15.
728.
205
24.
560.
518
1.5
97.2
93
544
.933
4
5.85
0.78
3
TOTA
L 9
79.6
67
458
.413
9
.807
.125
1
1.17
3.67
3 1
7.49
6.83
6 1
9.15
6.57
5 5
0.68
1.80
3 1
71.8
41.8
51
426
.881
.785
1
47.7
03.4
57
195
.127
.329
1
.051
.308
.516
0,
09%
0,04
%0,
93%
1,06
%1,
66%
1,82
%4,
82%
16,3
5%40
,60%
14,0
5%18
,56%
100%
CART
ERA
PO
R EN
TID
AD
: NIV
EL R
URA
L
CREC
ER -
- -
- -
- -
12.
546.
223
97.
860.
540
49.
820.
176
90.
332.
807
250
.559
.746
PRO
MU
JER
- -
- -
- -
- -
4.8
89.0
73
9.5
83.6
56
23.
548.
052
38.
020.
780
DIA
CON
IA -
- -
418
.674
1
.614
.677
1
.403
.077
1
.954
.767
1
0.36
6.42
8 4
3.90
7.81
3 1
1.45
1.49
5 6
.301
.488
7
7.41
8.42
0
EMPR
END
ER -
- -
- -
- -
38.
509
1.7
80.6
83
668
.371
4
20.8
66
2.9
08.4
28
FON
CRES
OL
- -
- -
- 1
41.9
07
72.
135
472
.045
2
.681
.214
3
.997
.679
1
.576
.723
8
.941
.703
FUN
BOD
EM -
- -
- 1
.183
.873
8
87.1
60
1.2
55.3
62
6.4
27.2
68
14.
577.
871
2.6
78.7
70
896
.258
2
7.90
6.56
2
IDEP
RO -
- -
2.2
62.6
52
923
.395
1
.536
.853
1
0.24
2.35
5 2
4.46
8.26
1 3
2.71
3.02
8 1
.353
.154
2
10.5
46
73.
710.
243
IMPR
O -
- -
- -
- -
93.
123
1.0
74.5
18
439
.027
3
11.1
72
1.9
17.8
40
SART
AWI
- -
- 1
.374
.000
1
.523
.396
1
.508
.968
1
.781
.641
3
.681
.726
4
8.23
2.12
0 2
.637
.079
4
92.9
04
61.
231.
834
AN
ED -
- -
- -
- 6
06.4
53
3.5
50.8
94
35.
716.
995
6.0
94.0
93
2.3
80.4
38
48.
348.
873
CID
RE 9
28.2
27
2.3
75.0
95
4.9
06.7
79
7.3
27.7
18
6.5
21.9
53
4.0
25.3
94
4.0
47.6
30
26.
106.
303
26.
127.
331
488
.446
3
4.00
0 8
2.88
8.87
5
FON
DEC
O -
- 5
.342
.062
1
1.93
1.62
6 8
.551
.903
4
.615
.097
7
.821
.322
1
4.88
7.25
1 2
7.95
7.83
9 1
1.47
5.20
6 1
0.18
1.94
0 1
02.7
64.2
45
FUBO
DE
- -
- 6
36.5
18
905
.166
3
80.0
60
991
.645
8
.405
.010
3
4.13
6.57
5 2
.378
.077
8
97.0
46
48.
730.
097
TOTA
L 9
28.2
27
2.3
75.0
95
10.
248.
841
23.
951.
188
21.
224.
363
14.
498.
517
28.
773.
310
111
.043
.039
3
71.6
55.6
02
103
.065
.229
1
37.5
84.2
38
825
.347
.647
0,
11%
0,29
%1,
24%
2,90
%2,
57%
1,76
%3,
49%
13,4
5%45
,03%
12,4
9%16
,67%
100%
CART
ERA
PO
R EN
TID
AD
: TO
TAL
NA
CIO
NA
L
CREC
ER -
- -
- -
- -
24.
053.
728
187
.619
.075
9
5.51
5.67
3 1
73.1
86.8
39
480
.375
.315
PRO
MU
JER
- -
- -
- -
387
.096
2
.151
.385
6
9.26
4.91
7 6
3.83
5.93
4 1
05.9
89.1
80
241
.628
.512
DIA
CON
IA -
- -
1.7
80.3
18
6.1
15.4
28
7.8
14.1
88
15.
371.
179
78.
483.
781
169
.385
.310
3
6.21
4.77
0 2
0.69
1.20
3 3
35.8
56.1
78
EMPR
END
ER -
- -
- -
- 3
75.2
70
3.6
26.8
54
18.
635.
415
5.4
78.5
69
3.6
49.1
16
31.
765.
225
FON
CRES
OL
- -
- -
- 1
41.9
07
543
.381
5
89.2
15
4.7
08.2
41
5.8
57.7
68
4.3
49.5
03
16.
190.
015
FUN
BOD
EM -
- -
- 4
.298
.577
4
.979
.111
1
1.06
2.60
8 2
1.57
9.31
3 5
8.19
6.95
4 1
2.93
8.45
4 6
.256
.830
1
19.3
11.8
47
IDEP
RO -
- 5
53.4
94
3.2
50.1
77
2.1
06.9
50
4.7
30.5
94
30.
350.
551
59.
664.
848
62.
163.
856
2.5
16.7
20
351
.699
1
65.6
88.8
89
IMPR
O -
- -
- -
- 2
34.6
24
2.8
34.8
55
10.
460.
745
2.0
44.9
88
2.3
42.2
31
17.
917.
443
SART
AWI
- -
- 1
.717
.500
2
.299
.541
1
.508
.968
1
.911
.641
4
.115
.122
5
9.04
9.32
9 4
.000
.185
1
.815
.084
7
6.41
7.37
0
AN
ED -
- -
- -
- 6
06.4
53
3.5
50.8
94
35.
716.
995
6.0
94.0
93
2.3
80.4
38
48.
348.
873
CID
RE 1
.907
.894
2
.833
.508
1
4.16
0.41
1 1
5.80
8.72
1 1
4.14
1.13
4 9
.261
.666
6
.905
.510
4
3.21
4.42
9 3
6.68
1.62
0 8
20.9
54
75.
524
145
.811
.370
FON
DEC
O -
- 5
.342
.062
1
1.93
1.62
6 8
.551
.903
4
.615
.097
7
.821
.322
1
4.88
7.25
1 2
7.95
7.83
9 1
1.47
5.20
6 1
0.18
1.94
0 1
02.7
64.2
45
FUBO
DE
- -
- 6
36.5
18
1.2
07.6
66
603
.560
3
.885
.479
2
4.13
3.21
5 5
8.69
7.09
3 3
.975
.370
1
.441
.979
9
4.58
0.88
1
TOTA
L 1
.907
.894
2
.833
.508
2
0.05
5.96
6 3
5.12
4.86
1 3
8.72
1.19
9 3
3.65
5.09
2 7
9.45
5.11
3 2
82.8
84.8
89
798
.537
.387
2
50.7
68.6
87
332
.711
.567
1
.876
.656
.163
0,
10%
0,15
%1,
07%
1,87
%2,
06%
1,79
%4,
23%
15,0
7%42
,55%
13,3
6%17
,73%
100%
Cuadro
Nº
8
CA
RTE
RA
PO
R T
ECN
OLO
GÍA
FIN
AN
CIE
RA
INST
ITU
CIO
NES
FIN
AN
CIE
RA
S D
E D
ESA
RRO
LLO
30
de
julio
de
20
11
(En B
oliv
ianos)
CART
ERA
PO
R TE
CNO
LOG
IA Y
PO
R EN
TID
AD
: NIV
EL U
RBA
NO
INST
ITU
CIO
NBa
ncos
Com
unal
esG
rupo
s So
lidar
ios
Indi
vidu
ales
Asociati
vos
TOTA
L
M
onto
N
umer
oM
onto
N
umer
oM
onto
N
umer
oM
onto
N
umer
oM
onto
N
umer
o
CREC
ER 1
83.5
49.0
25
53.
715
- -
46.
266.
545
3.4
92
- -
229
.815
.570
5
7.20
7
PRO
MU
JER
167
.195
.972
7
2.69
0 -
- 3
6.41
1.76
0 3
.934
-
- 2
03.6
07.7
32
76.
624
DIA
CON
IA 4
9.19
3.10
0 2
4.31
4 -
- 2
09.2
44.6
58
21.
392
- -
258
.437
.758
4
5.70
6
EMPR
END
ER 1
1.31
7.34
8 5
.080
1
.033
.356
3
50
16.
506.
093
3.2
89
- -
28.
856.
797
8.7
19
FON
CRES
OL
4.3
47.4
34
2.4
50
112
.812
2
3 2
.788
.065
2
44
- -
7.2
48.3
11
2.7
17
FUN
BOD
EM -
- -
- 9
1.40
5.28
4 7
.097
-
- 9
1.40
5.28
4 7
.097
IDEP
RO -
- -
- 9
1.97
8.64
6 3
.812
-
- 9
1.97
8.64
6 3
.812
IMPR
O -
- -
- 1
5.99
9.60
3 2
.039
-
- 1
5.99
9.60
3 2
.039
SART
AWI
1.7
80.6
06
1.0
16
138
.855
3
4 1
3.26
6.07
5 1
.660
-
- 1
5.18
5.53
6 2
.710
AN
ED -
- -
- -
- -
- -
-
CID
RE -
- -
- 6
1.69
3.10
0 1
.799
1
.229
.395
4
6
2.92
2.49
5 1
.803
FON
DEC
O -
- -
- -
- -
- -
-
FUBO
DE
28.
336.
382
9.7
56
152
.652
2
47
17.
361.
749
1.4
57
- -
45.
850.
783
11.
460
TOTA
L 4
45.7
19.8
67
169
.021
1
.437
.676
6
54
602
.921
.579
5
0.21
5 1
.229
.395
4
1
.051
.308
.516
2
19.8
94
CART
ERA
PO
R TE
CNO
LOG
IA Y
PO
R EN
TID
AD
: NIV
EL R
URA
L
CREC
ER 2
03.0
04.6
63
52.
578
- -
47.
555.
083
3.2
58
- -
250
.559
.747
5
5.83
6
PRO
MU
JER
38.
020.
780
20.
931
- -
- -
- -
38.
020.
780
20.
931
DIA
CON
IA 1
.135
.918
5
89
- -
76.
282.
503
9.2
94
- -
77.
418.
420
9.8
83
EMPR
END
ER 7
07.9
94
359
1
04.9
10
26
2.0
95.5
24
384
-
- 2
.908
.428
7
69
FON
CRES
OL
5.1
74.4
09
1.5
80
1.3
65.5
46
170
2
.259
.841
1
73
141
.907
1
8
.941
.703
1
.924
FUN
BOD
EM -
- -
- 2
7.90
6.56
2 1
.949
-
- 2
7.90
6.56
2 1
.949
IDEP
RO -
- -
- 7
3.71
0.24
3 3
.448
-
- 7
3.71
0.24
3 3
.448
IMPR
O -
- -
- 1
.917
.840
3
22
- -
1.9
17.8
40
322
SART
AWI
194
.949
1
37
2.7
93.6
05
569
5
8.24
3.27
9 5
.007
-
- 6
1.23
1.83
4 5
.713
AN
ED 4
.159
.746
1
.880
9
9.92
8 4
0 4
3.77
4.55
6 4
.942
3
14.6
44
277
4
8.34
8.87
3 7
.139
CID
RE -
- -
- 8
0.99
2.99
7 3
.128
1
.895
.878
1
1 8
2.88
8.87
5 3
.139
FON
DEC
O 2
1.25
2.65
8 1
0.27
9 -
- 8
1.51
1.58
8 3
.304
-
- 1
02.7
64.2
45
13.
583
FUBO
DE
15.
061.
345
6.0
88
3.7
10.5
84
824
2
9.95
8.16
9 2
.344
-
- 4
8.73
0.09
7 9
.256
TOTA
L 2
88.7
12.4
62
94.
421
8.0
74.5
73
1.6
29
526
.208
.185
3
7.55
3 2
.352
.428
2
89
825
.347
.648
1
33.8
92
CART
ERA
PO
R TE
CNO
LOG
IA Y
PO
R EN
TID
AD
:TO
TAL
NA
CIO
NA
L
CREC
ER 3
86.5
53.6
88
106
.293
-
- 9
3.82
1.62
8 6
.750
-
- 4
80.3
75.3
16
113
.043
PRO
MU
JER
205
.216
.752
9
3.62
1 -
- 3
6.41
1.76
0 3
.934
-
- 2
41.6
28.5
12
97.
555
DIA
CON
IA 5
0.32
9.01
8 2
4.90
3 -
- 2
85.5
27.1
60
30.
686
- -
335
.856
.178
5
5.58
9
EMPR
END
ER 1
2.02
5.34
2 5
.439
1
.138
.266
3
76
18.
601.
616
3.6
73
- -
31.
765.
225
9.4
88
FON
CRES
OL
9.5
21.8
43
4.0
30
1.4
78.3
58
193
5
.047
.907
4
17
141
.907
1
1
6.19
0.01
5 4
.641
FUN
BOD
EM -
- -
- 1
19.3
11.8
47
9.0
46
- -
119
.311
.847
9
.046
IDEP
RO -
- -
- 1
65.6
88.8
89
7.2
60
- -
165
.688
.889
7
.260
IMPR
O -
- -
- 1
7.91
7.44
3 2
.361
-
- 1
7.91
7.44
3 2
.361
SART
AWI
1.9
75.5
56
1.1
53
2.9
32.4
60
603
7
1.50
9.35
5 6
.667
-
- 7
6.41
7.37
0 8
.423
AN
ED 4
.159
.746
1
.880
9
9.92
8 4
0 4
3.77
4.55
6 4
.942
3
14.6
44
277
4
8.34
8.87
3 7
.139
CID
RE -
- -
- 1
42.6
86.0
97
4.9
27
3.1
25.2
73
15
145
.811
.370
4
.942
FON
DEC
O 2
1.25
2.65
8 1
0.27
9 -
- 8
1.51
1.58
8 3
.304
-
- 1
02.7
64.2
45
13.
583
FUBO
DE
43.
397.
726
15.
844
3.8
63.2
36
1.0
71
47.
319.
918
3.8
01
- -
94.
580.
881
20.
716
TOTA
L 7
34.4
32.3
28
263
.442
9
.512
.249
2
.283
1
.129
.129
.764
8
7.76
8 3
.581
.823
2
93
1.8
76.6
56.1
64
353
.786
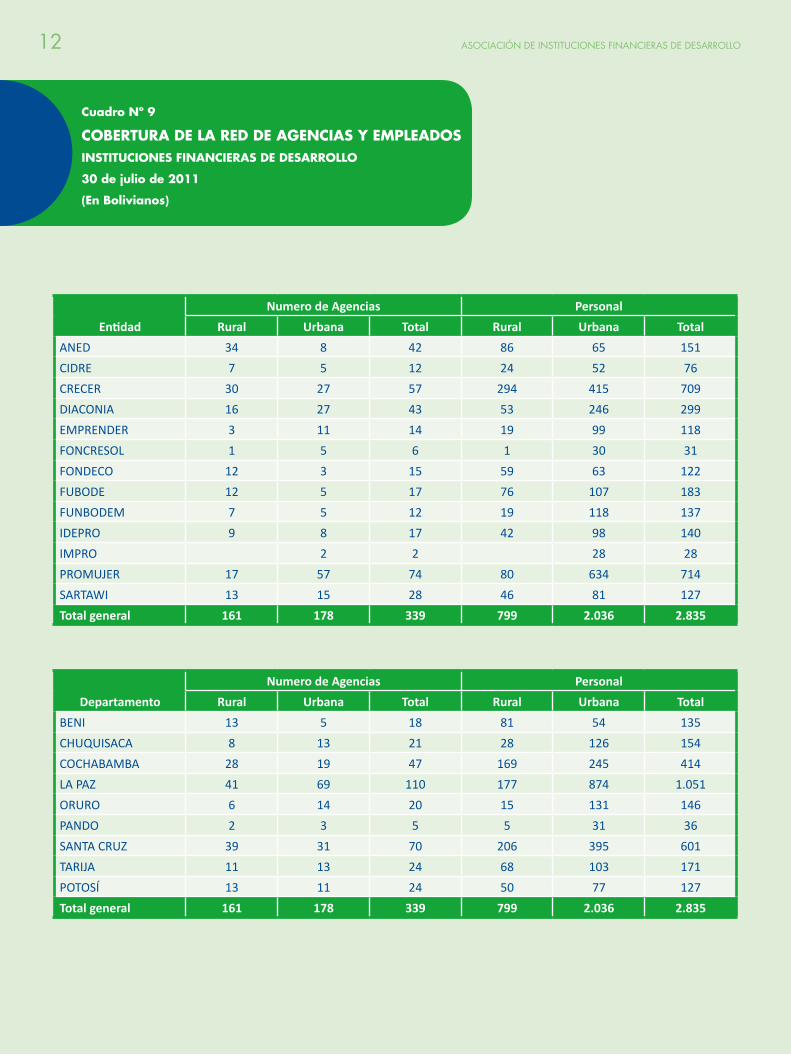
12 ASOCIACIÓN DE INSTITUCIONES FINANCIERAS DE DESARROLLO
Cuadro Nº 9
COBERTURA DE LA RED DE AGENCIAS Y EMPLEADOSINSTITUCIONES FINANCIERAS DE DESARROLLO
30 de julio de 2011
(En Bolivianos)
Entidad
Numero de Agencias Personal
Rural Urbana Total Rural Urbana Total
ANED 34 8 42 86 65 151
CIDRE 7 5 12 24 52 76
CRECER 30 27 57 294 415 709
DIACONIA 16 27 43 53 246 299
EMPRENDER 3 11 14 19 99 118
FONCRESOL 1 5 6 1 30 31
FONDECO 12 3 15 59 63 122
FUBODE 12 5 17 76 107 183
FUNBODEM 7 5 12 19 118 137
IDEPRO 9 8 17 42 98 140
IMPRO 2 2 28 28
PROMUJER 17 57 74 80 634 714
SARTAWI 13 15 28 46 81 127
Total general 161 178 339 799 2.036 2.835
Departamento
Numero de Agencias Personal
Rural Urbana Total Rural Urbana Total
BENI 13 5 18 81 54 135
CHUQUISACA 8 13 21 28 126 154
COCHABAMBA 28 19 47 169 245 414
LA PAZ 41 69 110 177 874 1.051
ORURO 6 14 20 15 131 146
PANDO 2 3 5 5 31 36
SANTA CRUZ 39 31 70 206 395 601
TARIJA 11 13 24 68 103 171
POTOSÍ 13 11 24 50 77 127
Total general 161 178 339 799 2.036 2.835
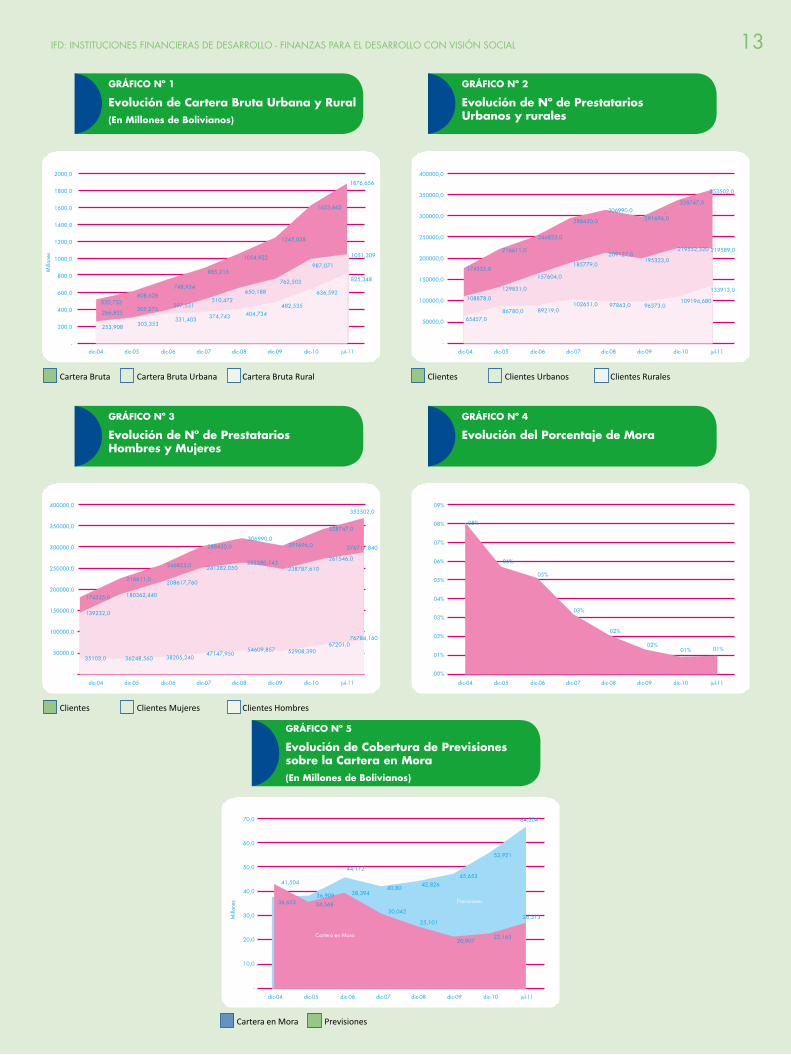
13IFD: INSTITUCIONES FINANCIERAS DE DESARROLLO - FINANZAS PARA EL DESARROLLO CON VISIÓN SOCIAL
GRÁFICO Nº 1
Evolución de Cartera Bruta Urbana y Rural(En Millones de Bolivianos)
GRÁFICO Nº 3
Evolución de Nº de Prestatarios Hombres y Mujeres
GRÁFICO Nº 2
Evolución de Nº de Prestatarios Urbanos y rurales
GRÁFICO Nº 4
Evolución del Porcentaje de Mora(En Millones de Bolivianos)
GRÁFICO Nº 5
Evolución de Cobertura de Previsiones sobre la Cartera en Mora(En Millones de Bolivianos)
Cartera Bruta Cartera Bruta Urbana Cartera Bruta Rural Clientes Clientes Urbanos Clientes Rurales
Clientes Clientes Mujeres Clientes Hombres
Cartera en Mora Previsiones
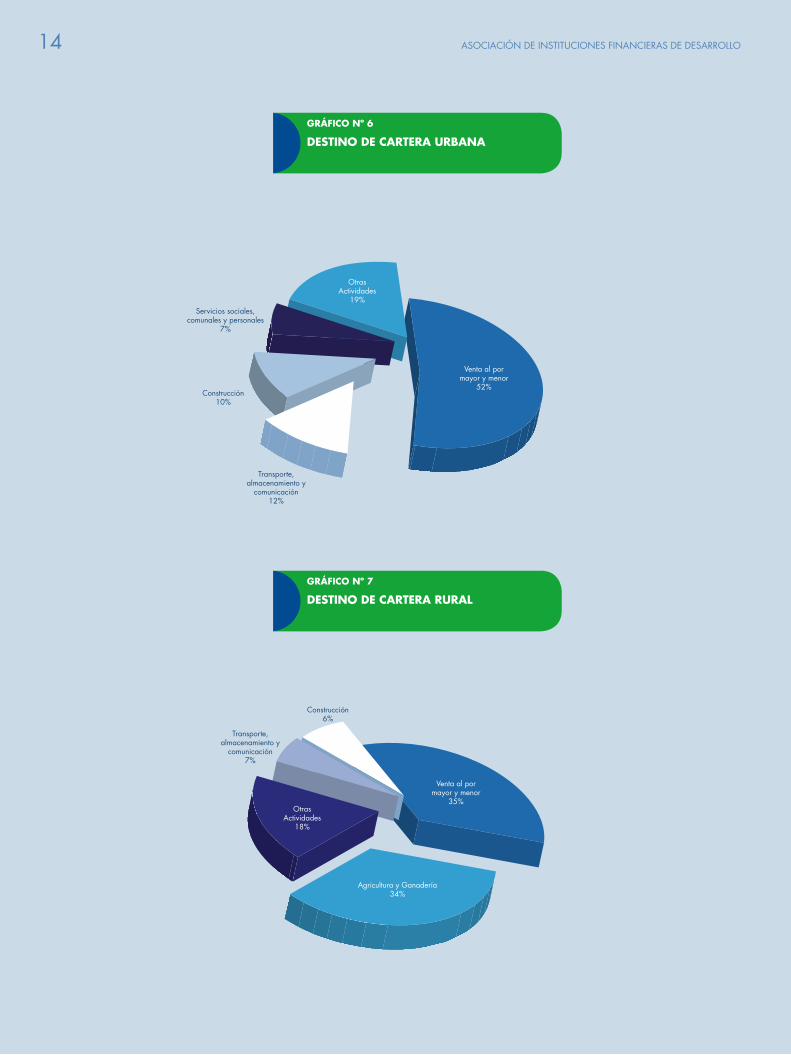
14 ASOCIACIÓN DE INSTITUCIONES FINANCIERAS DE DESARROLLO
Venta al por mayor y menor
52%
OtrasActividades
19%Servicios sociales,
comunales y personales7%
Construcción10%
Transporte, almacenamiento y
comunicación12%
GRÁFICO Nº 6
DESTINO DE CARTERA URBANA(En Millones de Bolivianos)
Construcción6%
Venta al por mayor y menor
35%
Agricultura y Ganadería34%
Transporte, almacenamiento y
comunicación7%
OtrasActividades
18%
GRÁFICO Nº 7
DESTINO DE CARTERA RURAL(En Millones de Bolivianos)
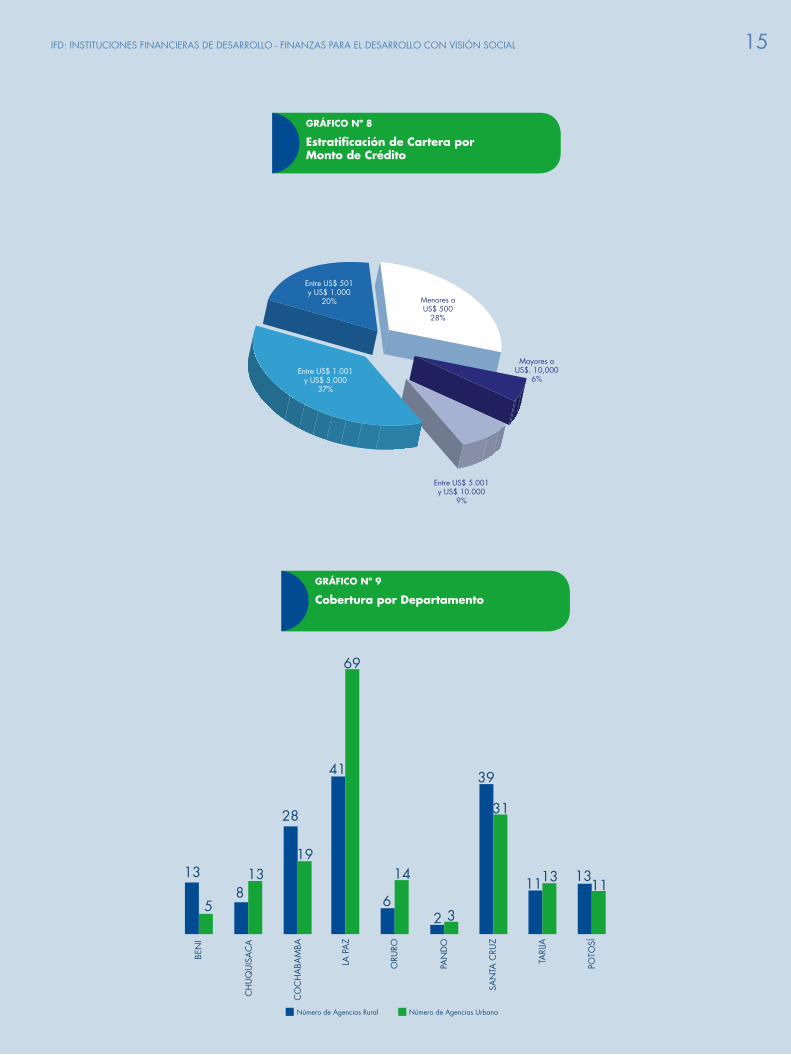
15IFD: INSTITUCIONES FINANCIERAS DE DESARROLLO - FINANZAS PARA EL DESARROLLO CON VISIÓN SOCIAL
Entre US$ 1.001 y US$ 5.000
37%
Entre US$ 501 y US$ 1.000
20% Menores a US$ 500
28%
Entre US$ 5.001 y US$ 10.000
9%
Mayores a US$. 10,000
6%
GRÁFICO Nº 8
Estratificación de Cartera por Monto de Crédito
13 13
28
19
41
6
14
39
31
11 1113 13
2 3
69
5
BEN
I
CH
UQ
UIS
AC
A
CO
CH
ABA
MBA
LA P
AZ
ORU
RO
PAN
DO
SAN
TA C
RUZ
TARI
JA
POTO
SÍ
8
Número de Agencias Rural Número de Agencias Urbana
GRÁFICO Nº 9
Cobertura por Departamento(En Millones de Bolivianos)

16 ASOCIACIÓN DE INSTITUCIONES FINANCIERAS DE DESARROLLO