europe and central asia (eca) affected capital loss...
TRANSCRIPT
A L B A N I A
B U L G A R I A
F Y R O F M A C E D O N I A
T U R K E Y
Anatoliki Makedonia Kai Thraki
Attiki
Dytiki Ellada
Dytiki Makedonia
Ionioi Nisoi
Ipeiros
Kentriki Makedonia
Kriti
Peloponnisos
Sterea Ellada
Thessalia
Voreio Aigaio
Notio Aigaio
Athens
B L A C K S E A
M E D I T E R R A N E A N S E A
2.8 6.38.1 26 90
GDP (billions of $)
FLOOD
EARTHQUAKE
Negligible
Annual Average of Affected GDP (%)
4
1
There is a high correlation(r=0.95) between the
population and GDP of a province.
TOP AFFECTED PROVINCES
FLOOD EARTHQUAKEANNUAL AVERAGE OF AFFECTED GDP (%)
ANNUAL AVERAGE OF AFFECTED GDP (%)
Anatoliki Makedonia Kai ThrakiThessaliaIpeirosKentriki MakedoniaDytiki ElladaPeloponnisosDytiki MakedoniaSterea ElladaAttikiIonioi Nisoi
1
111100000
Dytiki ElladaIpeirosVoreio AigaioIonioi NisoiKentriki MakedoniaAnatoliki Makedonia Kai ThrakiSterea ElladaThessaliaPeloponnisosAttiki
432222
2221
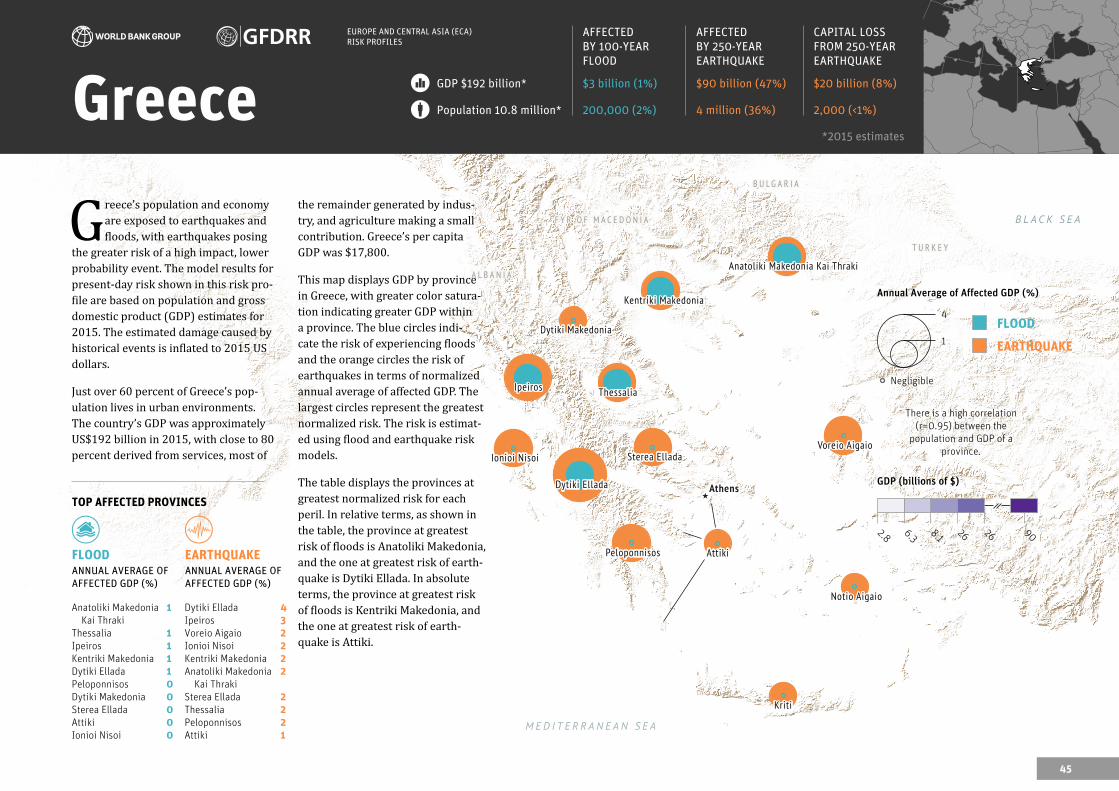
Greece’s population and economy are exposed to earthquakes and floods, with earthquakes posing
the greater risk of a high impact, lower probability event. The model results for present-day risk shown in this risk pro-file are based on population and gross domestic product (GDP) estimates for 2015. The estimated damage caused by historical events is inflated to 2015 US dollars.
Just over 60 percent of Greece’s pop-ulation lives in urban environments. The country’s GDP was approximately US$192 billion in 2015, with close to 80 percent derived from services, most of
GreeceEUROPE AND CENTRAL ASIA (ECA) RISK PROFILES
GDP $192 billion*
Population 10.8 million*
AFFECTED BY 100-YEAR FLOOD
AFFECTED BY 250-YEAR EARTHQUAKE
CAPITAL LOSS FROM 250-YEAR EARTHQUAKE
$3 billion (1%)
200,000 (2%)
$90 billion (47%)
4 million (36%)
$20 billion (8%)
2,000 (<1%)
*2015 estimates
the remainder generated by indus-try, and agriculture making a small contribution. Greece’s per capita GDP was $17,800.
This map displays GDP by province in Greece, with greater color satura-tion indicating greater GDP within a province. The blue circles indi-cate the risk of experiencing floods and the orange circles the risk of earthquakes in terms of normalized annual average of affected GDP. The largest circles represent the greatest normalized risk. The risk is estimat-ed using flood and earthquake risk models.
The table displays the provinces at greatest normalized risk for each peril. In relative terms, as shown in the table, the province at greatest risk of floods is Anatoliki Makedonia, and the one at greatest risk of earth-quake is Dytiki Ellada. In absolute terms, the province at greatest risk of floods is Kentriki Makedonia, and the one at greatest risk of earth-quake is Attiki.
26
45
A L B A N I A
B U L G A R I A
F Y R O F M A C E D O N I A
T U R K E Y
Anatoliki Makedonia Kai Thraki
Attiki
Dytiki Ellada
Dytiki Makedonia
Ionioi Nisoi
Ipeiros
Kentriki Makedonia
Kriti
Peloponnisos
Sterea Ellada
Thessalia
Voreio Aigaio
Notio Aigaio
Athens
B L A C K S E A
M E D I T E R R A N E A N S E A
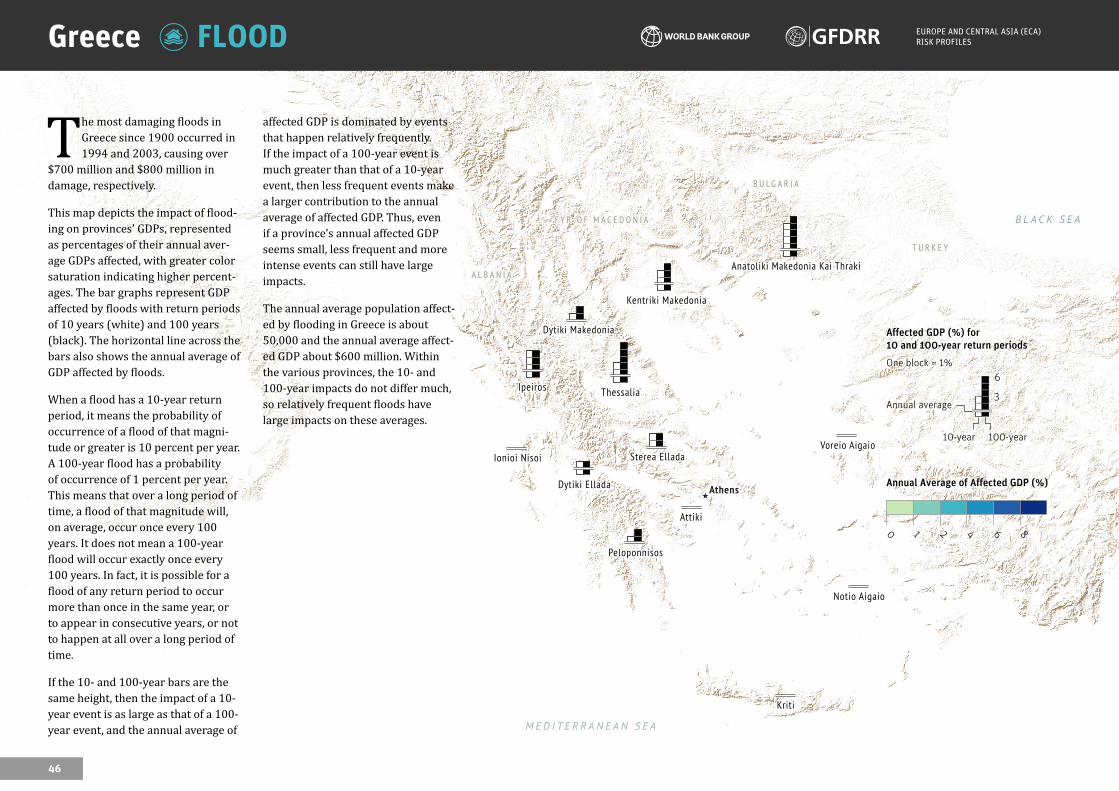
The most damaging floods in Greece since 1900 occurred in 1994 and 2003, causing over
$700 million and $800 million in damage, respectively.
This map depicts the impact of flood-ing on provinces’ GDPs, represented as percentages of their annual aver-age GDPs affected, with greater color saturation indicating higher percent-ages. The bar graphs represent GDP affected by floods with return periods of 10 years (white) and 100 years (black). The horizontal line across the bars also shows the annual average of GDP affected by floods.
When a flood has a 10-year return period, it means the probability of occurrence of a flood of that magni-tude or greater is 10 percent per year. A 100-year flood has a probability of occurrence of 1 percent per year. This means that over a long period of time, a flood of that magnitude will, on average, occur once every 100 years. It does not mean a 100-year flood will occur exactly once every 100 years. In fact, it is possible for a flood of any return period to occur more than once in the same year, or to appear in consecutive years, or not to happen at all over a long period of time.
If the 10- and 100-year bars are the same height, then the impact of a 10-year event is as large as that of a 100-year event, and the annual average of
affected GDP is dominated by events that happen relatively frequently. If the impact of a 100-year event is much greater than that of a 10-year event, then less frequent events make a larger contribution to the annual average of affected GDP. Thus, even if a province’s annual affected GDP seems small, less frequent and more intense events can still have large impacts.
The annual average population affect-ed by flooding in Greece is about 50,000 and the annual average affect-ed GDP about $600 million. Within the various provinces, the 10- and 100-year impacts do not differ much, so relatively frequent floods have large impacts on these averages.
EUROPE AND CENTRAL ASIA (ECA) RISK PROFILESFLOODGreece
0 1 2 4 8
Annual Average of Affected GDP (%)
6
6
3
Affected GDP (%) for
10 and 100-year return periods
Annual average
10-year 100-year
One block = 1%
46

A L B A N I A
B U L G A R I A
F Y R O F M A C E D O N I A
T U R K E Y
Anatoliki Makedonia Kai Thraki
Attiki
Dytiki Ellada
Dytiki Makedonia
Ionioi Nisoi
Ipeiros
Kentriki Makedonia
Kriti
Peloponnisos
Sterea Ellada
Thessalia
Voreio Aigaio
Notio Aigaio
Athens
B L A C K S E A
M E D I T E R R A N E A N S E A
A L B A N I A
B U L G A R I A
T U R K E Y
Anatoliki Makedonia Kai Thraki
Attiki
Dytiki Ellada
Dytiki Makedonia
Ionioi Nisoi
Ipeiros
Kentriki Makedonia
Kriti
Peloponnisos
Sterea Ellada
Thessalia
Voreio Aigaio
Notio Aigaio
Athens
B L A C K S E A
M E D I T E R R A N E A N S E A
Greece’s worst earthquake since 1900, with a magni-tude of 7.2, took place in
1953 in Kefalonia and caused over 450 fatalities. Many people left the island after the event, reducing its population to a mere 20 percent of its size before the disaster. The same region was also hit by earth-quakes in 1867 and 2011. A 1999 earthquake in Athens caused close to 150 deaths and over $6 billion in damage. More recently, in 2014, an earthquake in southern Greece caused three fatalities and almost $500 million in damage.
This map depicts the impact of earthquakes on provinces’ GDPs, represented as percentages of their annual average GDPs affected, with greater color saturation indicat-ing higher percentages. The bar graphs represent GDP affected by earthquakes with return periods of 10 years (white) and 100 years (black). The horizontal line across the bars also shows the annual average of GDP affected by earth-quakes.
When an earthquake has a 10-year return period, it means the prob-ability of occurrence of an earth-quake of that magnitude or greater is 10 percent per year. A 100-year earthquake has a probability of occurrence of 1 percent per year. This means that over a long period
of time, an earthquake of that mag-nitude will, on average, occur once every 100 years. It does not mean a 100-year earthquake will occur exactly once every 100 years. In fact, it is possible for an earthquake of any return period to occur more than once in the same year, or to appear in consecutive years, or not to happen at all over a long period of time.
If the 10- and 100-year bars are the same height, then the impact of a 10-year event is as large as that of a 100-year event, and the annual average of affected GDP is dominated by events that happen relatively frequently. If the impact of a 100-year event is much greater than that of a 10-year event, then less frequent events make larger contributions to the annual average of affected GDP. Thus, even if a province’s annual affected GDP seems small, less frequent and more intense events can still have large impacts.
The annual average population affected by earthquakes in Greece is about 200,000 and the annual av-erage affected GDP about $3 billion. The annual averages of fatalities and capital losses caused by earth-quakes are about 50 and about $700 million, respectively. The fatalities and capital losses caused by more intense, less frequent
EUROPE AND CENTRAL ASIA (ECA) RISK PROFILESEARTHQUAKEGreece
0 1 2 4 8
Annual Average of Affected GDP (%)
6
60
30
Affected GDP (%) for
10 and 100-year return periods
Annual average
10-year 100-year
One block = 10%
47
events can be substantially larger than the annual averages. For exam-ple, an earthquake with a 0.4 percent annual probability of occurrence (a 250-year return period event) could cause nearly 2,000 fatalities and $20 billion in capital loss (about 8 percent of GDP).
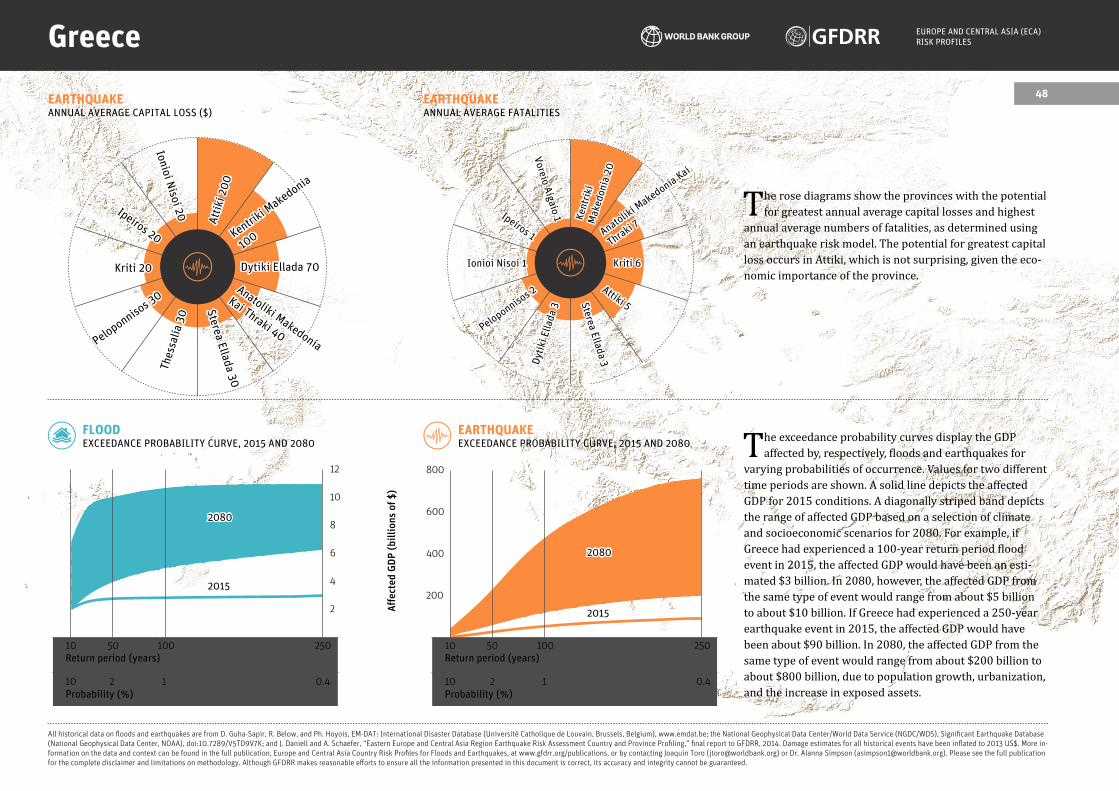
The rose diagrams show the provinces with the potential for greatest annual average capital losses and highest
annual average numbers of fatalities, as determined using an earthquake risk model. The potential for greatest capital loss occurs in Attiki, which is not surprising, given the eco-nomic importance of the province.
EUROPE AND CENTRAL ASIA (ECA) RISK PROFILESGreece
EARTHQUAKEEXCEEDANCE PROBABILITY CURVE, 2015 AND 2080
FLOODEXCEEDANCE PROBABILITY CURVE, 2015 AND 2080 The exceedance probability curves display the GDP
affected by, respectively, floods and earthquakes for varying probabilities of occurrence. Values for two different time periods are shown. A solid line depicts the affected GDP for 2015 conditions. A diagonally striped band depicts the range of affected GDP based on a selection of climate and socioeconomic scenarios for 2080. For example, if Greece had experienced a 100-year return period flood event in 2015, the affected GDP would have been an esti-mated $3 billion. In 2080, however, the affected GDP from the same type of event would range from about $5 billion to about $10 billion. If Greece had experienced a 250-year earthquake event in 2015, the affected GDP would have been about $90 billion. In 2080, the affected GDP from the same type of event would range from about $200 billion to about $800 billion, due to population growth, urbanization, and the increase in exposed assets.
All historical data on floods and earthquakes are from D. Guha-Sapir, R. Below, and Ph. Hoyois, EM-DAT: International Disaster Database (Université Catholique de Louvain, Brussels, Belgium), www.emdat.be; the National Geophysical Data Center/World Data Service (NGDC/WDS), Significant Earthquake Database (National Geophysical Data Center, NOAA), doi:10.7289/V5TD9V7K; and J. Daniell and A. Schaefer, “Eastern Europe and Central Asia Region Earthquake Risk Assessment Country and Province Profiling,” final report to GFDRR, 2014. Damage estimates for all historical events have been inflated to 2013 US$. More in-formation on the data and context can be found in the full publication, Europe and Central Asia Country Risk Profiles for Floods and Earthquakes, at www.gfdrr.org/publications, or by contacting Joaquin Toro ([email protected]) or Dr. Alanna Simpson ([email protected]). Please see the full publication for the complete disclaimer and limitations on methodology. Although GFDRR makes reasonable efforts to ensure all the information presented in this document is correct, its accuracy and integrity cannot be guaranteed.
Aff
ecte
d G
DP
(b
illi
on
s o
f $
)
EARTHQUAKEANNUAL AVERAGE FATALITIES
EARTHQUAKEANNUAL AVERAGE CAPITAL LOSS ($)
Dytiki Ellada 70 Kriti 20
Kentriki M
akedonia
100
Peloponnisos 3
0
Atti
ki 2
00
Thes
salia
30
Anatoliki Makedonia
Kai Thraki 40
Ipeiros 20
Sterea Ellada 30
Ionioi Nisoi 20
Kriti 6Ionioi Nisoi 1
Anatoliki M
akedonia Kai
Thraki 7
Peloponnisos 2
Kent
riki
Mak
edon
ia 2
0
Dyti
ki E
llada
3
Attiki 5
Ipeiros 1
Sterea Ellada 3
Voreio Aigaio 1
Return period (years)
Probability (%)
10
10
250
0.4
50
2
100
1
200
400
800
600
2080
2015
Return period (years)
Probability (%)
10
10
250
0.4
50
2
100
1
2
4
12
6
8
10
2080
2015
48