Datos para el Debate 6
Foro de Debate Nº6Tendencias en la relación entre la
estructura del empleo no agrario y laeducación de los ocupados
Buenos Aires, Julio de 2006
Presentación
Uno de los cambios sociales más significativos de las últimas décadas
remite a la crisis de los mecanismos tradicionales de integración y cohesión social
y al corrimiento del Estado de su función de garante de la seguridad y el
bienestar social. Este cambio afecta de un modo específico a las sociedades
latinoamericanas en las que la integración a través de la educación o el mercado
de trabajo sólo alcanzó niveles relativamente altos en algunos países de la región
mientras que en otros las desigualdades étnicas y de género operaron como telón
de fondo aun en las décadas en que el Estado de bienestar alcanzó mayor
desarrollo.
El presente debate se concentra precisamente en los cambios ocurridos
desde inicios de los años ’90 a la actualidad en la relación entre la estructura del
empleo no agrario y la educación de la población ocupada.
Varios especialistas coinciden en la agudización de la heterogeneidad
estructural de las economías latinoamericanas a partir de la aparición, por un
lado, de un sector de empresas de alta productividad ligadas al mercado
internacional y, por otro, de la expansión del sector informal de la economía, el
aumento de la precariedad del empleo asalariado y -en varios países de la región-
del desempleo y la subocupación.
A su vez, en esos años se produjo un aumento del promedio de los años
de escolarización que, por los cambios en la estructura del empleo, no se habría
traducido ni en la disminución de los niveles de pobreza, ni en mayores niveles de
equidad en la distribución del ingreso.
Para este debate nos planteamos las siguientes preguntas: ¿qué
transformaciones se registran en la estructura del empleo en los distintos países
de la región?, ¿qué implicancias tuvo el aumento del nivel educativo alcanzado
por los ocupados en su inserción en el mercado laboral?, ¿el mercado laboral
produce actualmente mayores niveles de desigualdad salarial que la que se
registraba a inicios de los años ‘90?, ¿los ocupados de qué nivel educativo
resultaron más beneficiados o más perjudicados con los cambios en la estructura
del empleo y en la distribución salarial por sector?, ¿en qué sectores de la
economía la variabilidad del salario es mayor?, ¿qué perfil tienen los ocupados
más afectados por la subocupación?, ¿cuáles son las tendencias de género
significativas?
2Pág. Sistema de Información de Tendencias Educativas en América latina http://www.siteal.iipe-oei.org
Datos para el debate
Las tablas seleccionadas toman como referencia a la población urbana
ocupada de 25 a 65 años en los sectores secundario -integrado por las
Industrias manufactureras, el suministro de electricidad, gas y agua y la
construcción – y terciario integrado por el comercio y los servicios. Los ocupados
en el sector primario (Agricultura, ganadería, pesca y explotación de minas y
canteras) fueron excluidos de los tabulados seleccionados.
Se consideró como integrando el sector informal de la economía a:
• Los trabajadores por cuenta propia con ingresos horarios en el
30% más bajo en la distribución de ingresos horarios conformada
exclusivamente por los trabajadores por cuenta propia, los trabajadores
familiares que no perciben una remuneración monetaria por su
trabajo y el servicio doméstico.
• Los asalariados y patrones en establecimientos de hasta 5
ocupados.
Dentro del sector formal se distinguieron las siguientes condiciones:
• Los ocupados en la administración pública.
• Los ocupados en empresas medianas y grandes (de más de 5 ocupados)
del sector secundario.
• Los ocupados en empresas medianas y grandes del sector terciario.
Indicadores seleccionados:
• Distribución de la población de referencia según sector económico
y nivel educativo alcanzado. Es la distribución de la población a nivel
del total de la tabla lo que permite conocer la situación en los últimos años
y los cambios en la estructura de la economía.
• Distribución de la población de referencia por sector económico
según nivel educativo alcanzado. Es la distribución de la población de
cada nivel educativo en los sectores diferenciados de la economía, lo que
permite comparar la situación ocupacional de la población en función de su
educación formal.
3Pág. Sistema de Información de Tendencias Educativas en América latina http://www.siteal.iipe-oei.org
• Ingreso horario promedio según sector económico y nivel
educativo alcanzado. Los ingresos horarios corresponden a los ingresos
laborales en moneda corriente expresados por hora de trabajo. A los
ocupados con más de una ocupación se les computaron los ingresos
laborales y las horas trabajadas en todas sus ocupaciones, aunque fueron
localizados en la estructura económica de acuerdo a su ocupación
principal, es decir aquella en la que trabaja un mayor número de horas o
en la que percibe ingresos mayores. Sólo se consideraron para el cálculo
de este indicador a los ocupados que perciben ingresos.
• Desviación standard del ingreso horario promedio según sector
económico y nivel educativo alcanzado. Expresa la variabilidad
promedio de los ingresos de los ocupados respecto al promedio que es el
valor correspondiente al indicador anterior.
• Tasa de subocupación horaria según sector económico y nivel
educativo alcanzado. Es el porcentaje de ocupados que trabaja menos
de 35 horas semanales y estarían dispuestos a trabajar más horas. Este
indicador permite analizar las tasas de uso diferenciales de los ocupados.
La población de referencia se agregó en cuatro categorías de acuerdo a su
nivel educativo.
• Ocupados con nivel educativo hasta primario incompleto
• Ocupados con primario completo o secundario incompleto
• Ocupados con secundario completo o terciario ó universitario incompleto
• Ocupados con educación terciaria o universitaria completa.
Todos los indicadores se presentan para el total de la población de referencia
y fueron desagregados por sexo.
4Pág. Sistema de Información de Tendencias Educativas en América latina http://www.siteal.iipe-oei.org
Distribución de los ocupados según sector económico y nivel educativo alcanzado
ducativo alcanzado
Población de referencia: Ocupados urbanos del sector secundario y terciario que tienen entre 25 y 65 años
Países y años:
- Argentina: 1993 y 2003
000
0
PE UNESCO sede regional Buenos Aires-OEI
• • Distribución de los ocupados por sector económico según nivel educativo alcanzado • Ingreso horario promedio según sector económico y nivel educativo alcanzado • Desvío standard del ingreso horario promedio según sector económico y nivel e
- Brasil: 1990 y 2001 - Chile: 1990 y 2000 - Costa Rica: 1991 y 2- El Salvador: 1997 y 2003- México: 1992 y 2002 - Paraguay: 1990 y 200
II
Tendencias en la relación entre la estructura del empleo no agrario y la educación de los ocupados
5

Instituto Nacional de ca y Censos (INDEC)
IIPE - UNESCO, Sede Regional Buenos Aires - OEI
Julio de 2006
ARGENTINA 1993-2003
Estadísti
6
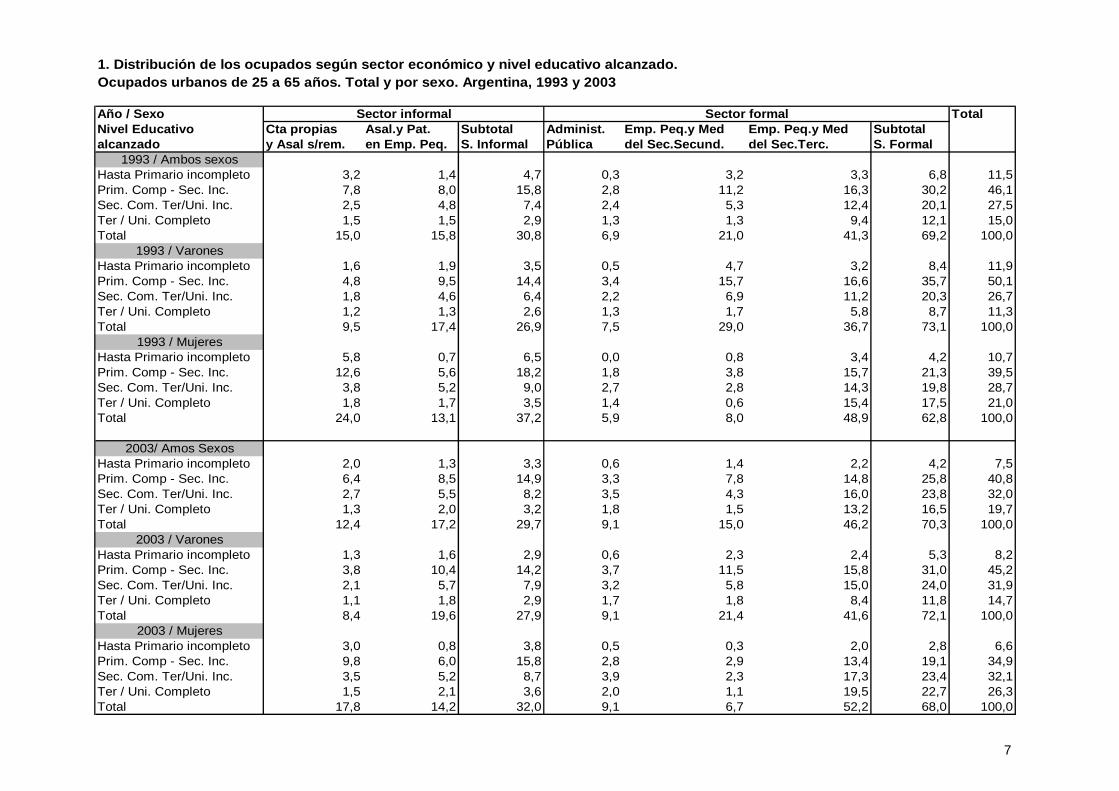
1. Distribución de los ocupados según sector económico y nivel educativo alcanzado.Ocupados urbanos de 25 a 65 años. Total y por sexo. Argentina, 1993 y 2003
Año / Sexo TotalNivel Educativo Cta propias Asal.y Pat. Subtotal Administ. Emp. Peq.y Med Emp. Peq.y Med Subtotalalcanzado y Asal s/rem. en Emp. Peq. S. Informal Pública del Sec.Secund. del Sec.Terc. S. Formal
1993 / Ambos sexosHasta Primario incompleto 3,2 1,4 4,7 0,3 3,2 3,3 6,8 11,5Prim. Comp - Sec. Inc. 7,8 8,0 15,8 2,8 11,2 16,3 30,2 46,1Sec. Com. Ter/Uni. Inc. 2,5 4,8 7,4 2,4 5,3 12,4 20,1 27,5Ter / Uni. Completo 1,5 1,5 2,9 1,3 1,3 9,4 12,1 15,0Total 15,0 15,8 30,8 6,9 21,0 41,3 69,2 100,0
1993 / VaronesHasta Primario incompleto 1,6 1,9 3,5 0,5 4,7 3,2 8,4 11,9Prim. Comp - Sec. Inc. 4,8 9,5 14,4 3,4 15,7 16,6 35,7 50,1Sec. Com. Ter/Uni. Inc. 1,8 4,6 6,4 2,2 6,9 11,2 20,3 26,7Ter / Uni. Completo 1,2 1,3 2,6 1,3 1,7 5,8 8,7 11,3Total 9,5 17,4 26,9 7,5 29,0 36,7 73,1 100,0
1993 / MujeresHasta Primario incompleto 5,8 0,7 6,5 0,0 0,8 3,4 4,2 10,7Prim. Comp - Sec. Inc. 12,6 5,6 18,2 1,8 3,8 15,7 21,3 39,5Sec. Com. Ter/Uni. Inc. 3,8 5,2 9,0 2,7 2,8 14,3 19,8 28,7Ter / Uni. Completo 1,8 1,7 3,5 1,4 0,6 15,4 17,5 21,0Total 24,0 13,1 37,2 5,9 8,0 48,9 62,8 100,0
2003/ Amos SexosHasta Primario incompleto 2,0 1,3 3,3 0,6 1,4 2,2 4,2 7,5Prim. Comp - Sec. Inc. 6,4 8,5 14,9 3,3 7,8 14,8 25,8 40,8Sec. Com. Ter/Uni. Inc. 2,7 5,5 8,2 3,5 4,3 16,0 23,8 32,0Ter / Uni. Completo 1,3 2,0 3,2 1,8 1,5 13,2 16,5 19,7Total 12,4 17,2 29,7 9,1 15,0 46,2 70,3 100,0
2003 / VaronesHasta Primario incompleto 1,3 1,6 2,9 0,6 2,3 2,4 5,3 8,2Prim. Comp - Sec. Inc. 3,8 10,4 14,2 3,7 11,5 15,8 31,0 45,2Sec. Com. Ter/Uni. Inc. 2,1 5,7 7,9 3,2 5,8 15,0 24,0 31,9Ter / Uni. Completo 1,1 1,8 2,9 1,7 1,8 8,4 11,8 14,7Total 8,4 19,6 27,9 9,1 21,4 41,6 72,1 100,0
2003 / MujeresHasta Primario incompleto 3,0 0,8 3,8 0,5 0,3 2,0 2,8 6,6Prim. Comp - Sec. Inc. 9,8 6,0 15,8 2,8 2,9 13,4 19,1 34,9Sec. Com. Ter/Uni. Inc. 3,5 5,2 8,7 3,9 2,3 17,3 23,4 32,1Ter / Uni. Completo 1,5 2,1 3,6 2,0 1,1 19,5 22,7 26,3Total 17,8 14,2 32,0 9,1 6,7 52,2 68,0 100,0
Sector informal Sector formal
7

2. Distribución de los ocupados por sector económico según nivel educativo alcanzado.Ocupados urbanos de 25 a 65 años. Total y por sexo. Argentina, 1993 y 2003
Año / Sexo TotalNivel Educativo Cta propias Asal.y Pat. Subtotal Administ. Emp. Peq.y Med Emp. Peq.y Med Subtotalalcanzado y Asal s/rem. en Emp. Peq. S. Informal Pública del Sec.Secund. del Sec.Terc. S. Formal
1993 / Ambos sexosHasta Primario incompleto 28,2 12,4 40,6 3,0 27,9 28,5 59,4 100,0Prim. Comp - Sec. Inc. 16,9 17,4 34,3 6,1 24,3 35,3 65,7 100,0Sec. Com. Ter/Uni. Inc. 9,2 17,6 26,9 8,7 19,5 45,0 73,1 100,0Ter / Uni. Completo 9,8 9,7 19,5 9,0 8,5 63,0 80,5 100,0Total 15,0 15,8 30,8 6,9 21,0 41,3 69,2 100,0
1993 / VaronesHasta Primario incompleto 13,8 15,9 29,7 4,5 39,3 26,5 70,3 100,0Prim. Comp - Sec. Inc. 9,7 19,0 28,7 6,9 31,3 33,1 71,3 100,0Sec. Com. Ter/Uni. Inc. 6,7 17,3 24,0 8,3 25,9 41,9 76,0 100,0Ter / Uni. Completo 11,1 11,6 22,7 11,5 14,7 51,1 77,3 100,0Total 9,5 17,4 26,9 7,5 29,0 36,7 73,1 100,0
1993 / MujeresHasta Primario incompleto 54,3 6,1 60,4 0,4 7,0 32,1 39,6 100,0Prim. Comp - Sec. Inc. 31,9 14,1 46,0 4,5 9,6 39,8 54,0 100,0Sec. Com. Ter/Uni. Inc. 13,1 18,1 31,2 9,3 9,8 49,7 68,8 100,0Ter / Uni. Completo 8,7 8,1 16,8 6,7 3,1 73,4 83,2 100,0Total 24,0 13,1 37,2 5,9 8,0 48,9 62,8 100,0
2003/ Amos SexosHasta Primario incompleto 27,2 16,7 44,0 7,3 19,2 29,5 56,0 100,0Prim. Comp - Sec. Inc. 15,7 20,9 36,6 8,0 19,1 36,3 63,4 100,0Sec. Com. Ter/Uni. Inc. 8,5 17,2 25,7 10,8 13,4 50,0 74,3 100,0Ter / Uni. Completo 6,3 10,0 16,3 9,2 7,6 66,8 83,7 100,0Total 12,4 17,2 29,7 9,1 15,0 46,2 70,3 100,0
2003 / VaronesHasta Primario incompleto 16,3 19,3 35,6 7,2 27,9 29,3 64,4 100,0Prim. Comp - Sec. Inc. 8,5 23,0 31,5 8,1 25,4 35,0 68,5 100,0Sec. Com. Ter/Uni. Inc. 6,7 18,0 24,7 9,9 18,3 47,1 75,3 100,0Ter / Uni. Completo 7,2 12,5 19,7 11,5 12,1 56,7 80,3 100,0Total 8,4 19,6 27,9 9,1 21,4 41,6 72,1 100,0
2003 / MujeresHasta Primario incompleto 45,0 12,6 57,6 7,6 5,1 29,7 42,4 100,0Prim. Comp - Sec. Inc. 28,0 17,3 45,3 8,0 8,3 38,4 54,7 100,0Sec. Com. Ter/Uni. Inc. 11,0 16,2 27,1 12,0 7,1 53,8 72,9 100,0Ter / Uni. Completo 5,7 8,1 13,8 7,6 4,4 74,3 86,2 100,0Total 17,8 14,2 32,0 9,1 6,7 52,2 68,0 100,0
Sector informal Sector formal
8

3. Ingreso horario promedio según sector económico y nivel educativo alcanzado.Ocupados urbanos perceptores de ingresos de 25 a 65 años. Total y por sexo. Argentina, 1993 y 2003
Año / Sexo TotalNivel Educativo Cta propias Asal.y Pat. Subtotal Administ. Emp. Peq.y Med Emp. Peq.y Med Subtotalalcanzado y Asal s/rem. en Emp. Peq. S. Informal Pública del Sec.Secund. del Sec.Terc. S. Formal
1993 / Ambos sexosHasta Primario incompleto 0,6 0,6 0,6 0,7 0,7 0,7 0,7 0,7Prim. Comp - Sec. Inc. 0,5 0,8 0,7 0,8 0,8 0,8 0,8 0,7Sec. Com. Ter/Uni. Inc. 0,3 1,0 0,9 1,0 1,2 1,0 1,1 1,0Ter / Uni. Completo 0,0 1,5 1,1 1,1 2,0 1,3 1,3 1,3Total 0,5 0,9 0,7 0,9 0,9 1,0 0,9 0,9
1993 / VaronesHasta Primario incompleto 0,3 0,7 0,6 0,7 0,7 0,7 0,7 0,7Prim. Comp - Sec. Inc. 0,2 0,8 0,7 0,8 0,8 0,8 0,8 0,8Sec. Com. Ter/Uni. Inc. 0,1 1,1 1,0 0,9 1,2 1,1 1,1 1,1Ter / Uni. Completo 0,0 1,6 1,1 1,1 2,0 1,5 1,5 1,4Total 0,2 0,9 0,8 0,9 0,9 1,0 0,9 0,9
1993 / MujeresHasta Primario incompleto 0,7 0,5 0,7 0,6 0,6 0,7 0,7 0,7Prim. Comp - Sec. Inc. 0,6 0,6 0,6 0,8 0,6 0,7 0,7 0,7Sec. Com. Ter/Uni. Inc. 0,4 0,9 0,8 1,0 1,0 1,0 1,0 0,9Ter / Uni. Completo 0,0 1,4 1,0 1,2 1,8 1,2 1,2 1,2Total 0,6 0,8 0,7 1,0 0,9 0,9 0,9 0,8
2003/ Amos SexosHasta Primario incompleto 0,4 0,5 0,4 0,5 0,6 0,6 0,6 0,5Prim. Comp - Sec. Inc. 0,3 0,6 0,5 0,7 0,7 0,7 0,7 0,6Sec. Com. Ter/Uni. Inc. 0,2 0,7 0,6 1,0 1,0 0,9 0,9 0,8Ter / Uni. Completo 0,0 1,0 0,6 1,7 1,5 1,4 1,5 1,3Total 0,3 0,7 0,5 1,0 0,9 1,0 0,9 0,8
2003 / VaronesHasta Primario incompleto 0,1 0,4 0,3 0,6 0,7 0,6 0,6 0,5Prim. Comp - Sec. Inc. 0,1 0,6 0,5 0,7 0,7 0,7 0,7 0,6Sec. Com. Ter/Uni. Inc. 0,0 0,8 0,6 1,0 1,1 0,9 1,0 0,9Ter / Uni. Completo 0,0 1,1 0,7 1,9 1,7 1,6 1,6 1,4Total 0,1 0,7 0,5 1,0 0,9 0,9 0,9 0,8
2003 / MujeresHasta Primario incompleto 0,6 0,5 0,6 0,5 0,5 0,6 0,6 0,6Prim. Comp - Sec. Inc. 0,5 0,6 0,5 0,6 0,6 0,6 0,6 0,6Sec. Com. Ter/Uni. Inc. 0,3 0,6 0,5 1,1 0,7 0,9 0,9 0,8Ter / Uni. Completo 0,1 0,9 0,5 1,6 1,2 1,3 1,3 1,2Total 0,4 0,6 0,5 1,0 0,7 1,0 1,0 0,8
Sector informal Sector formal
9

4. Desviación standard del ingreso horario promedio según sector económico y nivel educativo alcanzado.Ocupados urbanos perceptores de ingresos de 25 a 65 años. Total y por sexo. Argentina, 1993 y 2003
Año / Sexo TotalNivel Educativo Cta propias Asal.y Pat. Subtotal Administ. Emp. Peq.y Med Emp. Peq.y Med Subtotalalcanzado y Asal s/rem. en Emp. Peq. S. Informal Pública del Sec.Secund. del Sec.Terc. S. Formal
1993 / Ambos sexosHasta Primario incompleto 0,4 0,4 0,4 0,5 0,4 0,5 0,4 0,4Prim. Comp - Sec. Inc. 0,4 0,6 0,6 0,6 0,5 0,5 0,5 0,5Sec. Com. Ter/Uni. Inc. 0,4 0,9 0,9 0,7 0,8 0,8 0,8 0,8Ter / Uni. Completo 0,1 1,1 1,2 0,9 1,1 1,0 1,1 1,1Total 0,4 0,8 0,7 0,7 0,7 0,8 0,7 0,7
1993 / VaronesHasta Primario incompleto 0,3 0,4 0,4 0,6 0,4 0,5 0,4 0,4Prim. Comp - Sec. Inc. 0,2 0,7 0,5 0,6 0,5 0,5 0,5 0,6Sec. Com. Ter/Uni. Inc. 0,1 0,9 0,8 0,8 0,8 0,8 0,8 0,8Ter / Uni. Completo 0,0 1,2 1,2 0,9 1,1 1,3 1,2 1,2Total 0,2 0,8 0,8 0,7 0,7 0,8 0,8 0,8
1993 / MujeresHasta Primario incompleto 0,4 0,3 0,4 0,2 0,4 0,4 0,4 0,4Prim. Comp - Sec. Inc. 0,4 0,4 0,4 0,5 0,4 0,5 0,5 0,5Sec. Com. Ter/Uni. Inc. 0,5 0,8 0,7 0,6 0,8 0,7 0,7 0,7Ter / Uni. Completo 0,1 1,0 1,0 0,9 1,1 0,9 0,9 0,9Total 0,4 0,7 0,6 0,7 0,7 0,7 0,7 0,7
2003/ Amos SexosHasta Primario incompleto 0,6 0,3 0,5 0,4 0,4 0,5 0,5 0,5Prim. Comp - Sec. Inc. 0,4 0,5 0,5 0,5 0,5 0,5 0,5 0,5Sec. Com. Ter/Uni. Inc. 0,4 0,7 0,6 0,7 0,8 0,7 0,7 0,7Ter / Uni. Completo 0,1 1,0 0,9 1,3 1,3 1,1 1,2 1,2Total 0,4 0,6 0,6 0,9 0,7 0,9 0,8 0,8
2003 / VaronesHasta Primario incompleto 0,1 0,3 0,3 0,4 0,5 0,5 0,5 0,4Prim. Comp - Sec. Inc. 0,2 0,5 0,5 0,5 0,5 0,6 0,5 0,5Sec. Com. Ter/Uni. Inc. 0,1 0,8 0,8 0,7 0,8 0,8 0,8 0,8Ter / Uni. Completo 0,0 1,2 1,1 1,4 1,3 1,3 1,4 1,4Total 0,1 0,7 0,7 0,9 0,7 0,9 0,9 0,8
2003 / MujeresHasta Primario incompleto 0,6 0,4 0,6 0,3 0,2 0,5 0,5 0,5Prim. Comp - Sec. Inc. 0,5 0,4 0,4 0,3 0,4 0,4 0,4 0,4Sec. Com. Ter/Uni. Inc. 0,4 0,5 0,5 0,7 0,7 0,7 0,7 0,7Ter / Uni. Completo 0,2 0,6 0,6 1,1 1,0 1,0 1,0 1,0Total 0,5 0,5 0,5 0,8 0,6 0,8 0,8 0,7
Sector informal Sector formal
10

5. Tasa de subocupación abierta según sector económico y nivel educativo alcanzado.Ocupados urbanos perceptores de ingresos de 25 a 65 años. Total y por sexo. Argentina, 1993 y 2003
Año / Sexo TotalNivel Educativo Cta propias Asal.y Pat. Subtotal Administ. Emp. Peq.y Med Emp. Peq.y Med Subtotalalcanzado y Asal s/rem. en Emp. Peq. S. Informal Pública del Sec.Secund. del Sec.Terc. S. Formal
1993 / Ambos sexosHasta Primario incompleto 50,2 30,7 44,2 69,3 33,4 42,6 39,7 41,5Prim. Comp - Sec. Inc. 39,7 25,3 32,4 56,7 30,6 37,6 36,8 35,3Sec. Com. Ter/Uni. Inc. 39,3 29,8 33,1 60,9 30,9 41,8 41,2 39,0Ter / Uni. Completo 40,5 43,0 41,8 51,8 27,5 56,0 52,5 50,4Total 42,0 28,8 35,2 57,8 30,9 43,5 41,1 39,3
1993 / VaronesHasta Primario incompleto 28,5 29,6 29,1 70,5 32,9 24,4 32,1 31,2Prim. Comp - Sec. Inc. 20,6 20,9 20,8 49,5 28,5 25,5 29,1 26,7Sec. Com. Ter/Uni. Inc. 26,7 16,6 19,4 49,1 29,6 27,0 30,3 27,7Ter / Uni. Completo 26,8 23,8 25,2 43,7 26,5 35,4 34,9 32,7Total 24,0 20,9 22,0 49,8 29,4 27,4 30,5 28,2
1993 / MujeresHasta Primario incompleto 60,2 36,2 57,7 45,3 37,9 70,1 64,1 60,2Prim. Comp - Sec. Inc. 51,7 37,4 47,3 79,4 44,2 58,4 57,7 52,9Sec. Com. Ter/Uni. Inc. 49,0 48,9 49,0 76,7 35,9 60,8 59,4 56,1Ter / Uni. Completo 55,9 67,1 61,3 63,8 31,5 68,6 66,8 65,9Total 53,7 45,7 50,9 74,2 39,7 63,1 61,2 57,3
2003/ Amos SexosHasta Primario incompleto 55,5 46,5 52,1 87,5 44,5 58,9 57,7 55,2Prim. Comp - Sec. Inc. 50,7 32,5 40,3 66,6 29,0 40,7 40,5 40,4Sec. Com. Ter/Uni. Inc. 50,0 30,7 37,1 45,9 20,0 33,3 32,7 33,9Ter / Uni. Completo 40,9 21,6 29,1 22,0 9,9 43,4 38,0 36,5Total 50,4 31,7 39,5 51,1 26,0 39,8 38,3 38,7
2003 / VaronesHasta Primario incompleto 41,5 29,9 35,2 81,7 39,5 47,6 48,0 43,4Prim. Comp - Sec. Inc. 35,5 24,2 27,2 55,7 25,3 25,0 28,8 28,3Sec. Com. Ter/Uni. Inc. 36,2 22,4 26,1 33,2 17,2 20,2 21,2 22,4Ter / Uni. Completo 16,8 5,1 9,4 12,2 4,2 23,4 18,9 17,0Total 34,3 22,3 25,9 41,5 22,9 24,3 26,0 26,0
2003 / MujeresHasta Primario incompleto 63,8 87,5 69,0 96,3 87,8 76,9 81,7 74,4Prim. Comp - Sec. Inc. 58,6 51,5 55,9 85,5 47,8 65,0 65,4 61,1Sec. Com. Ter/Uni. Inc. 61,0 42,9 50,2 59,5 29,5 48,3 48,3 48,8Ter / Uni. Completo 63,2 40,3 49,7 33,1 21,4 54,7 51,1 50,9Total 60,3 48,8 55,2 63,8 39,1 56,1 55,5 55,4
Sector informal Sector formal
11
BRASIL 1990 - 2001
IBGE, Pesquisa Nacional por Amostra de Domicilios
IIPE - UNESCO, Sede Regional Buenos Aires - OEI
Julio de 2006
12
13
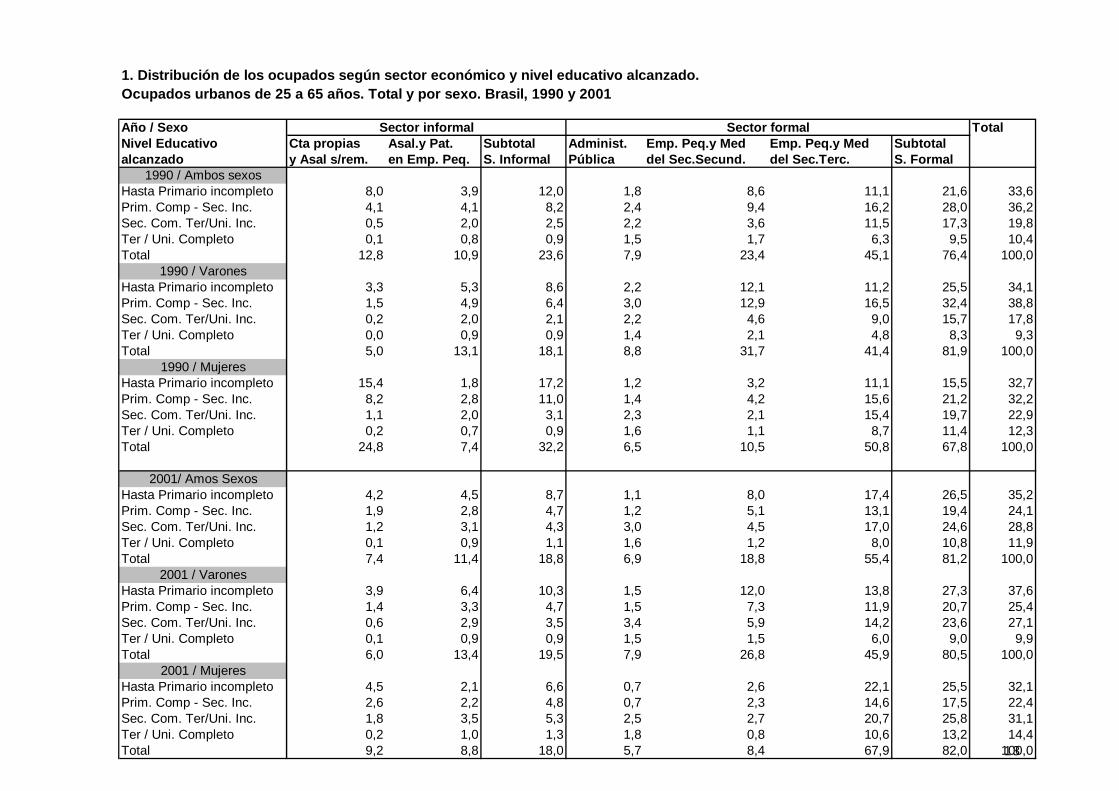
1. Distribución de los ocupados según sector económico y nivel educativo alcanzado.Ocupados urbanos de 25 a 65 años. Total y por sexo. Brasil, 1990 y 2001
Año / Sexo TotalNivel Educativo Cta propias Asal.y Pat. Subtotal Administ. Emp. Peq.y Med Emp. Peq.y Med Subtotalalcanzado y Asal s/rem. en Emp. Peq. S. Informal Pública del Sec.Secund. del Sec.Terc. S. Formal
1990 / Ambos sexosHasta Primario incompleto 8,0 3,9 12,0 1,8 8,6 11,1 21,6 33,6Prim. Comp - Sec. Inc. 4,1 4,1 8,2 2,4 9,4 16,2 28,0 36,2Sec. Com. Ter/Uni. Inc. 0,5 2,0 2,5 2,2 3,6 11,5 17,3 19,8Ter / Uni. Completo 0,1 0,8 0,9 1,5 1,7 6,3 9,5 10,4Total 12,8 10,9 23,6 7,9 23,4 45,1 76,4 100,0
1990 / VaronesHasta Primario incompleto 3,3 5,3 8,6 2,2 12,1 11,2 25,5 34,1Prim. Comp - Sec. Inc. 1,5 4,9 6,4 3,0 12,9 16,5 32,4 38,8Sec. Com. Ter/Uni. Inc. 0,2 2,0 2,1 2,2 4,6 9,0 15,7 17,8Ter / Uni. Completo 0,0 0,9 0,9 1,4 2,1 4,8 8,3 9,3Total 5,0 13,1 18,1 8,8 31,7 41,4 81,9 100,0
1990 / MujeresHasta Primario incompleto 15,4 1,8 17,2 1,2 3,2 11,1 15,5 32,7Prim. Comp - Sec. Inc. 8,2 2,8 11,0 1,4 4,2 15,6 21,2 32,2Sec. Com. Ter/Uni. Inc. 1,1 2,0 3,1 2,3 2,1 15,4 19,7 22,9Ter / Uni. Completo 0,2 0,7 0,9 1,6 1,1 8,7 11,4 12,3Total 24,8 7,4 32,2 6,5 10,5 50,8 67,8 100,0
2001/ Amos SexosHasta Primario incompleto 4,2 4,5 8,7 1,1 8,0 17,4 26,5 35,2Prim. Comp - Sec. Inc. 1,9 2,8 4,7 1,2 5,1 13,1 19,4 24,1Sec. Com. Ter/Uni. Inc. 1,2 3,1 4,3 3,0 4,5 17,0 24,6 28,8Ter / Uni. Completo 0,1 0,9 1,1 1,6 1,2 8,0 10,8 11,9Total 7,4 11,4 18,8 6,9 18,8 55,4 81,2 100,0
2001 / VaronesHasta Primario incompleto 3,9 6,4 10,3 1,5 12,0 13,8 27,3 37,6Prim. Comp - Sec. Inc. 1,4 3,3 4,7 1,5 7,3 11,9 20,7 25,4Sec. Com. Ter/Uni. Inc. 0,6 2,9 3,5 3,4 5,9 14,2 23,6 27,1Ter / Uni. Completo 0,1 0,9 0,9 1,5 1,5 6,0 9,0 9,9Total 6,0 13,4 19,5 7,9 26,8 45,9 80,5 100,0
2001 / MujeresHasta Primario incompleto 4,5 2,1 6,6 0,7 2,6 22,1 25,5 32,1Prim. Comp - Sec. Inc. 2,6 2,2 4,8 0,7 2,3 14,6 17,5 22,4Sec. Com. Ter/Uni. Inc. 1,8 3,5 5,3 2,5 2,7 20,7 25,8 31,1Ter / Uni. Completo 0,2 1,0 1,3 1,8 0,8 10,6 13,2 14,4Total 9,2 8,8 18,0 5,7 8,4 67,9 82,0 100,0
Sector informal Sector formal

14
2. Distribución de los ocupados por sector económico según nivel educativo alcanzado.Ocupados urbanos de 25 a 65 años. Total y por sexo. Brasil, 1990 y 2001
Año / Sexo TotalNivel Educativo Cta propias Asal.y Pat. Subtotal Administ. Emp. Peq.y Med Emp. Peq.y Med Subtotalalcanzado y Asal s/rem. en Emp. Peq. S. Informal Pública del Sec.Secund. del Sec.Terc. S. Formal
1990 / Ambos sexosHasta Primario incompleto 24,0 11,7 35,7 5,4 25,6 33,2 64,3 100,0Prim. Comp - Sec. Inc. 11,4 11,4 22,7 6,5 26,0 44,7 77,3 100,0Sec. Com. Ter/Uni. Inc. 2,7 10,1 12,7 11,1 18,2 58,0 87,3 100,0Ter / Uni. Completo 0,8 7,9 8,7 14,4 16,5 60,4 91,3 100,0Total 12,8 10,9 23,6 7,9 23,4 45,1 76,4 100,0
1990 / VaronesHasta Primario incompleto 9,6 15,6 25,2 6,5 35,6 32,7 74,8 100,0Prim. Comp - Sec. Inc. 3,8 12,7 16,5 7,8 33,1 42,6 83,5 100,0Sec. Com. Ter/Uni. Inc. 1,0 11,0 12,0 12,1 25,6 50,3 88,0 100,0Ter / Uni. Completo 0,3 9,9 10,2 15,3 23,0 51,5 89,8 100,0Total 5,0 13,1 18,1 8,8 31,7 41,4 81,9 100,0
1990 / MujeresHasta Primario incompleto 47,1 5,5 52,6 3,8 9,7 34,0 47,4 100,0Prim. Comp - Sec. Inc. 25,4 8,8 34,2 4,3 12,9 48,5 65,8 100,0Sec. Com. Ter/Uni. Inc. 4,7 9,0 13,6 9,9 9,3 67,2 86,4 100,0Ter / Uni. Completo 1,4 5,6 7,0 13,4 9,0 70,6 93,0 100,0Total 24,8 7,4 32,2 6,5 10,5 50,8 67,8 100,0
2001/ Amos SexosHasta Primario incompleto 11,8 12,9 24,8 3,3 22,6 49,4 75,2 100,0Prim. Comp - Sec. Inc. 8,1 11,6 19,7 4,9 21,2 54,2 80,3 100,0Sec. Com. Ter/Uni. Inc. 4,0 10,9 14,9 10,4 15,7 59,0 85,1 100,0Ter / Uni. Completo 1,1 7,9 9,0 13,6 10,3 67,1 91,0 100,0Total 7,4 11,4 18,8 6,9 18,8 55,4 81,2 100,0
2001 / VaronesHasta Primario incompleto 10,4 17,1 27,4 3,9 32,0 36,6 72,6 100,0Prim. Comp - Sec. Inc. 5,5 12,9 18,4 6,0 28,7 46,9 81,6 100,0Sec. Com. Ter/Uni. Inc. 2,4 10,7 13,1 12,6 21,9 52,5 86,9 100,0Ter / Uni. Completo 0,7 8,6 9,3 14,7 15,6 60,4 90,7 100,0Total 6,0 13,4 19,5 7,9 26,8 45,9 80,5 100,0
2001 / MujeresHasta Primario incompleto 14,1 6,6 20,7 2,2 8,2 68,9 79,3 100,0Prim. Comp - Sec. Inc. 11,8 9,8 21,6 3,2 10,1 65,1 78,4 100,0Sec. Com. Ter/Uni. Inc. 5,9 11,1 17,0 7,9 8,6 66,5 83,0 100,0Ter / Uni. Completo 1,6 7,2 8,8 12,5 5,6 73,1 91,2 100,0Total 9,2 8,8 18,0 5,7 8,4 67,9 82,0 100,0
Sector informal Sector formal

3. Ingreso horario promedio según sector económico y nivel educativo alcanzado.Ocupados urbanos perceptores de ingresos de 25 a 65 años. Total y por sexo. Brasil, 1990 y 2001
Año / Sexo TotalNivel Educativo Cta propias Asal.y Pat. Subtotal Administ. Emp. Peq.y Med Emp. Peq.y Med Subtotalalcanzado y Asal s/rem. en Emp. Peq. S. Informal Pública del Sec.Secund. del Sec.Terc. S. Formal
1990 / Ambos sexosHasta Primario incompleto 38,6 73,9 49,9 73,6 93,7 92,5 91,3 76,2Prim. Comp - Sec. Inc. 43,9 98,1 69,5 110,9 115,0 110,0 111,7 101,5Sec. Com. Ter/Uni. Inc. 44,1 105,7 92,4 133,5 134,5 129,2 130,7 125,1Ter / Uni. Completo 41,5 134,5 126,4 153,6 153,6 154,6 154,3 150,4Total 40,4 89,4 60,6 103,3 107,1 109,6 108,2 94,9
1990 / VaronesHasta Primario incompleto 40,5 77,6 62,5 79,6 98,0 100,0 97,2 88,2Prim. Comp - Sec. Inc. 44,1 104,7 88,0 116,4 121,2 118,2 119,2 113,6Sec. Com. Ter/Uni. Inc. 42,0 113,7 104,1 140,3 139,9 138,8 139,3 134,4Ter / Uni. Completo 37,8 141,9 139,1 160,2 153,6 155,6 155,9 152,5Total 41,6 92,7 75,6 106,2 111,3 115,0 112,6 104,7
1990 / MujeresHasta Primario incompleto 38,0 58,4 40,2 57,9 69,9 81,8 77,3 57,9Prim. Comp - Sec. Inc. 43,8 82,2 53,7 95,7 91,9 98,7 97,1 82,5Sec. Com. Ter/Uni. Inc. 44,9 98,7 83,8 126,7 124,0 123,6 123,9 118,0Ter / Uni. Completo 42,2 126,1 113,9 149,7 153,6 154,1 153,6 149,3Total 40,0 81,4 48,8 97,6 90,8 103,4 100,7 81,5
2001/ Amos SexosHasta Primario incompleto 0,6 2,0 1,3 2,4 2,4 2,3 2,3 2,1Prim. Comp - Sec. Inc. 0,6 2,9 1,9 3,6 3,3 3,2 3,2 3,0Sec. Com. Ter/Uni. Inc. 0,5 4,0 3,1 6,1 5,4 5,0 5,2 4,9Ter / Uni. Completo 0,4 9,6 8,3 12,2 12,7 10,0 10,6 10,4Total 0,6 3,3 2,2 6,2 3,9 4,3 4,4 4,0
2001 / VaronesHasta Primario incompleto 0,7 2,0 1,5 2,5 2,5 2,8 2,7 2,4Prim. Comp - Sec. Inc. 0,8 3,1 2,4 3,9 3,5 3,8 3,7 3,5Sec. Com. Ter/Uni. Inc. 0,7 4,7 3,9 6,7 5,9 6,0 6,1 5,8Ter / Uni. Completo 1,0 10,9 10,0 13,2 13,8 12,0 12,5 12,3Total 0,7 3,3 2,5 6,3 4,1 5,1 4,9 4,4
2001 / MujeresHasta Primario incompleto 0,5 1,7 0,9 2,1 1,9 1,8 1,8 1,6Prim. Comp - Sec. Inc. 0,5 2,4 1,4 2,6 2,4 2,5 2,5 2,2Sec. Com. Ter/Uni. Inc. 0,4 3,3 2,3 5,0 4,0 4,2 4,2 3,9Ter / Uni. Completo 0,2 8,4 6,8 11,2 10,1 8,6 9,1 8,9Total 0,5 3,2 1,8 6,1 3,4 3,7 3,8 3,4
Sector informal Sector formal
15
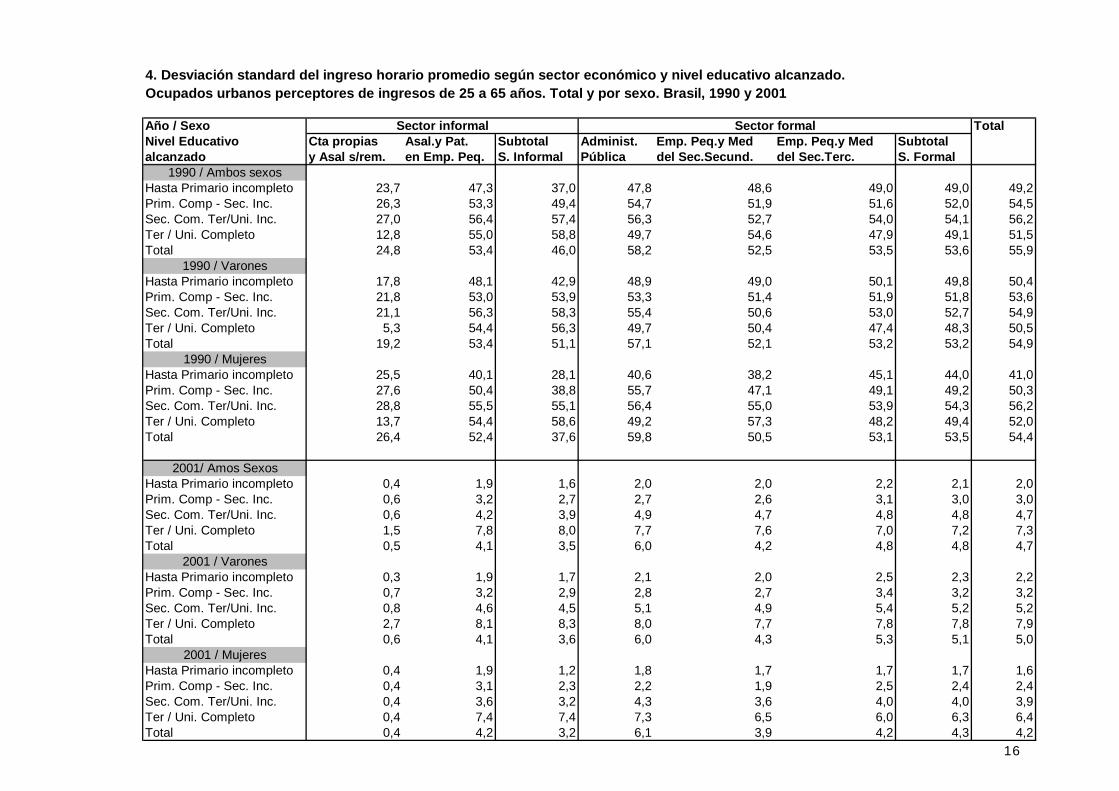
4. Desviación standard del ingreso horario promedio según sector económico y nivel educativo alcanzado.Ocupados urbanos perceptores de ingresos de 25 a 65 años. Total y por sexo. Brasil, 1990 y 2001
Año / Sexo TotalNivel Educativo Cta propias Asal.y Pat. Subtotal Administ. Emp. Peq.y Med Emp. Peq.y Med Subtotalalcanzado y Asal s/rem. en Emp. Peq. S. Informal Pública del Sec.Secund. del Sec.Terc. S. Formal
1990 / Ambos sexosHasta Primario incompleto 23,7 47,3 37,0 47,8 48,6 49,0 49,0 49,2Prim. Comp - Sec. Inc. 26,3 53,3 49,4 54,7 51,9 51,6 52,0 54,5Sec. Com. Ter/Uni. Inc. 27,0 56,4 57,4 56,3 52,7 54,0 54,1 56,2Ter / Uni. Completo 12,8 55,0 58,8 49,7 54,6 47,9 49,1 51,5Total 24,8 53,4 46,0 58,2 52,5 53,5 53,6 55,9
1990 / VaronesHasta Primario incompleto 17,8 48,1 42,9 48,9 49,0 50,1 49,8 50,4Prim. Comp - Sec. Inc. 21,8 53,0 53,9 53,3 51,4 51,9 51,8 53,6Sec. Com. Ter/Uni. Inc. 21,1 56,3 58,3 55,4 50,6 53,0 52,7 54,9Ter / Uni. Completo 5,3 54,4 56,3 49,7 50,4 47,4 48,3 50,5Total 19,2 53,4 51,1 57,1 52,1 53,2 53,2 54,9
1990 / MujeresHasta Primario incompleto 25,5 40,1 28,1 40,6 38,2 45,1 44,0 41,0Prim. Comp - Sec. Inc. 27,6 50,4 38,8 55,7 47,1 49,1 49,2 50,3Sec. Com. Ter/Uni. Inc. 28,8 55,5 55,1 56,4 55,0 53,9 54,3 56,2Ter / Uni. Completo 13,7 54,4 58,6 49,2 57,3 48,2 49,4 52,0Total 26,4 52,4 37,6 59,8 50,5 53,1 53,5 54,4
2001/ Amos SexosHasta Primario incompleto 0,4 1,9 1,6 2,0 2,0 2,2 2,1 2,0Prim. Comp - Sec. Inc. 0,6 3,2 2,7 2,7 2,6 3,1 3,0 3,0Sec. Com. Ter/Uni. Inc. 0,6 4,2 3,9 4,9 4,7 4,8 4,8 4,7Ter / Uni. Completo 1,5 7,8 8,0 7,7 7,6 7,0 7,2 7,3Total 0,5 4,1 3,5 6,0 4,2 4,8 4,8 4,7
2001 / VaronesHasta Primario incompleto 0,3 1,9 1,7 2,1 2,0 2,5 2,3 2,2Prim. Comp - Sec. Inc. 0,7 3,2 2,9 2,8 2,7 3,4 3,2 3,2Sec. Com. Ter/Uni. Inc. 0,8 4,6 4,5 5,1 4,9 5,4 5,2 5,2Ter / Uni. Completo 2,7 8,1 8,3 8,0 7,7 7,8 7,8 7,9Total 0,6 4,1 3,6 6,0 4,3 5,3 5,1 5,0
2001 / MujeresHasta Primario incompleto 0,4 1,9 1,2 1,8 1,7 1,7 1,7 1,6Prim. Comp - Sec. Inc. 0,4 3,1 2,3 2,2 1,9 2,5 2,4 2,4Sec. Com. Ter/Uni. Inc. 0,4 3,6 3,2 4,3 3,6 4,0 4,0 3,9Ter / Uni. Completo 0,4 7,4 7,4 7,3 6,5 6,0 6,3 6,4Total 0,4 4,2 3,2 6,1 3,9 4,2 4,3 4,2
Sector informal Sector formal
16
17
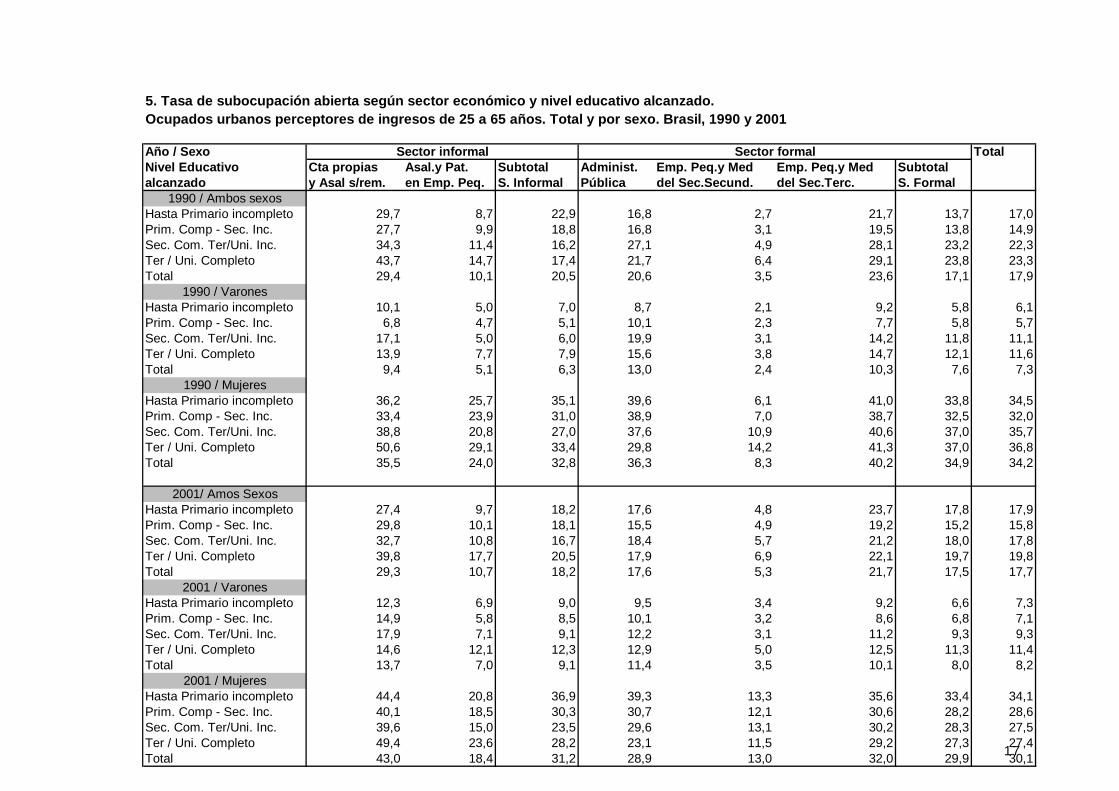
5. Tasa de subocupación abierta según sector económico y nivel educativo alcanzado.Ocupados urbanos perceptores de ingresos de 25 a 65 años. Total y por sexo. Brasil, 1990 y 2001
Año / Sexo TotalNivel Educativo Cta propias Asal.y Pat. Subtotal Administ. Emp. Peq.y Med Emp. Peq.y Med Subtotalalcanzado y Asal s/rem. en Emp. Peq. S. Informal Pública del Sec.Secund. del Sec.Terc. S. Formal
1990 / Ambos sexosHasta Primario incompleto 29,7 8,7 22,9 16,8 2,7 21,7 13,7 17,0Prim. Comp - Sec. Inc. 27,7 9,9 18,8 16,8 3,1 19,5 13,8 14,9Sec. Com. Ter/Uni. Inc. 34,3 11,4 16,2 27,1 4,9 28,1 23,2 22,3Ter / Uni. Completo 43,7 14,7 17,4 21,7 6,4 29,1 23,8 23,3Total 29,4 10,1 20,5 20,6 3,5 23,6 17,1 17,9
1990 / VaronesHasta Primario incompleto 10,1 5,0 7,0 8,7 2,1 9,2 5,8 6,1Prim. Comp - Sec. Inc. 6,8 4,7 5,1 10,1 2,3 7,7 5,8 5,7Sec. Com. Ter/Uni. Inc. 17,1 5,0 6,0 19,9 3,1 14,2 11,8 11,1Ter / Uni. Completo 13,9 7,7 7,9 15,6 3,8 14,7 12,1 11,6Total 9,4 5,1 6,3 13,0 2,4 10,3 7,6 7,3
1990 / MujeresHasta Primario incompleto 36,2 25,7 35,1 39,6 6,1 41,0 33,8 34,5Prim. Comp - Sec. Inc. 33,4 23,9 31,0 38,9 7,0 38,7 32,5 32,0Sec. Com. Ter/Uni. Inc. 38,8 20,8 27,0 37,6 10,9 40,6 37,0 35,7Ter / Uni. Completo 50,6 29,1 33,4 29,8 14,2 41,3 37,0 36,8Total 35,5 24,0 32,8 36,3 8,3 40,2 34,9 34,2
2001/ Amos SexosHasta Primario incompleto 27,4 9,7 18,2 17,6 4,8 23,7 17,8 17,9Prim. Comp - Sec. Inc. 29,8 10,1 18,1 15,5 4,9 19,2 15,2 15,8Sec. Com. Ter/Uni. Inc. 32,7 10,8 16,7 18,4 5,7 21,2 18,0 17,8Ter / Uni. Completo 39,8 17,7 20,5 17,9 6,9 22,1 19,7 19,8Total 29,3 10,7 18,2 17,6 5,3 21,7 17,5 17,7
2001 / VaronesHasta Primario incompleto 12,3 6,9 9,0 9,5 3,4 9,2 6,6 7,3Prim. Comp - Sec. Inc. 14,9 5,8 8,5 10,1 3,2 8,6 6,8 7,1Sec. Com. Ter/Uni. Inc. 17,9 7,1 9,1 12,2 3,1 11,2 9,3 9,3Ter / Uni. Completo 14,6 12,1 12,3 12,9 5,0 12,5 11,3 11,4Total 13,7 7,0 9,1 11,4 3,5 10,1 8,0 8,2
2001 / MujeresHasta Primario incompleto 44,4 20,8 36,9 39,3 13,3 35,6 33,4 34,1Prim. Comp - Sec. Inc. 40,1 18,5 30,3 30,7 12,1 30,6 28,2 28,6Sec. Com. Ter/Uni. Inc. 39,6 15,0 23,5 29,6 13,1 30,2 28,3 27,5Ter / Uni. Completo 49,4 23,6 28,2 23,1 11,5 29,2 27,3 27,4Total 43,0 18,4 31,2 28,9 13,0 32,0 29,9 30,1
Sector informal Sector formal

CHILE 1990-2000
Instituto Nacional de Estadística (INE)
IIPE - UNESCO, Sede Regional Buenos Aires - OEI
Julio de 2006
18

1. Distribución de los ocupados según sector económico y nivel educativo alcanzado.Ocupados urbanos de 25 a 65 años. Total y por sexo. Chile, 1990 y 2000
Año / Sexo TotalNivel Educativo Cta propias Asal.y Pat. Subtotal Administ. Emp. Peq.y Med Emp. Peq.y Med Subtotalalcanzado y Asal s/rem. en Emp. Peq. S. Informal Pública del Sec.Secund. del Sec.Terc. S. Formal
1990 / Ambos sexosHasta Primario incompleto 7,0 2,4 9,4 0,3 7,8 6,9 15,0 24,3Prim. Comp - Sec. Inc. 4,9 3,4 8,3 0,9 8,5 9,8 19,2 27,6Sec. Com. Ter/Uni. Inc. 2,3 3,4 5,6 1,8 7,6 14,9 24,3 30,0Ter / Uni. Completo 0,3 1,2 1,4 0,8 3,0 12,9 16,7 18,1Total 14,5 10,3 24,8 3,8 26,9 44,5 75,2 100,0
1990 / VaronesHasta Primario incompleto 2,9 2,8 5,7 0,4 10,5 7,9 18,8 24,4Prim. Comp - Sec. Inc. 2,3 4,0 6,3 1,4 11,2 11,5 24,2 30,5Sec. Com. Ter/Uni. Inc. 1,2 3,0 4,3 2,1 9,4 14,4 25,9 30,1Ter / Uni. Completo 0,1 1,0 1,0 0,6 3,6 9,7 13,9 14,9Total 6,5 10,8 17,3 4,4 34,8 43,5 82,7 100,0
1990 / MujeresHasta Primario incompleto 14,0 1,7 15,7 0,0 3,0 5,4 8,5 24,2Prim. Comp - Sec. Inc. 9,3 2,4 11,7 0,1 4,0 6,9 10,9 22,6Sec. Com. Ter/Uni. Inc. 4,1 3,9 8,0 1,4 4,5 15,8 21,7 29,7Ter / Uni. Completo 0,6 1,5 2,2 1,2 2,0 18,2 21,4 23,6Total 28,0 9,5 37,5 2,7 13,5 46,3 62,5 100,0
2000/ Amos SexosHasta Primario incompleto 3,6 1,1 4,7 0,3 3,1 3,2 6,6 11,3Prim. Comp - Sec. Inc. 6,6 3,0 9,6 0,7 7,8 10,8 19,3 29,0Sec. Com. Ter/Uni. Inc. 3,8 4,1 7,9 2,7 9,0 21,3 33,0 40,9Ter / Uni. Completo 0,4 1,6 1,9 1,1 2,9 12,8 16,9 18,8Total 14,5 9,7 24,2 4,9 22,8 48,2 75,8 100,0
2000 / VaronesHasta Primario incompleto 1,7 1,3 3,0 0,4 4,6 3,5 8,6 11,6Prim. Comp - Sec. Inc. 2,9 3,3 6,2 0,9 11,0 12,2 24,2 30,4Sec. Com. Ter/Uni. Inc. 1,9 3,7 5,7 3,4 11,9 20,4 35,7 41,4Ter / Uni. Completo 0,2 1,6 1,8 1,0 3,6 10,1 14,8 16,6Total 6,7 10,0 16,7 5,8 31,2 46,2 83,3 100,0
2000 / MujeresHasta Primario incompleto 6,5 0,8 7,3 0,2 0,8 2,7 3,7 10,9Prim. Comp - Sec. Inc. 12,2 2,5 14,6 0,4 2,9 8,8 12,1 26,8Sec. Com. Ter/Uni. Inc. 6,7 4,6 11,3 1,6 4,8 22,6 29,0 40,2Ter / Uni. Completo 0,6 1,4 2,1 1,3 1,8 16,9 20,0 22,1Total 26,0 9,3 35,3 3,5 10,2 51,0 64,7 100,0
Sector informal Sector formal
19
20
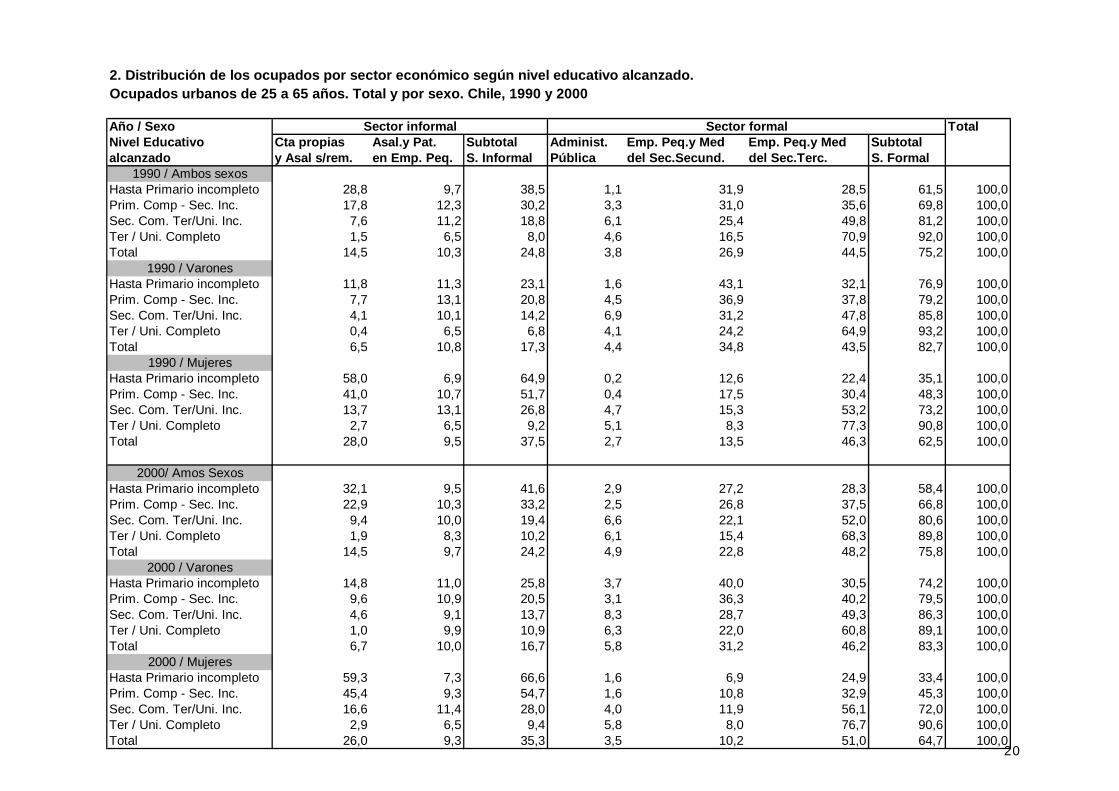
2. Distribución de los ocupados por sector económico según nivel educativo alcanzado.Ocupados urbanos de 25 a 65 años. Total y por sexo. Chile, 1990 y 2000
Año / Sexo TotalNivel Educativo Cta propias Asal.y Pat. Subtotal Administ. Emp. Peq.y Med Emp. Peq.y Med Subtotalalcanzado y Asal s/rem. en Emp. Peq. S. Informal Pública del Sec.Secund. del Sec.Terc. S. Formal
1990 / Ambos sexosHasta Primario incompleto 28,8 9,7 38,5 1,1 31,9 28,5 61,5 100,0Prim. Comp - Sec. Inc. 17,8 12,3 30,2 3,3 31,0 35,6 69,8 100,0Sec. Com. Ter/Uni. Inc. 7,6 11,2 18,8 6,1 25,4 49,8 81,2 100,0Ter / Uni. Completo 1,5 6,5 8,0 4,6 16,5 70,9 92,0 100,0Total 14,5 10,3 24,8 3,8 26,9 44,5 75,2 100,0
1990 / VaronesHasta Primario incompleto 11,8 11,3 23,1 1,6 43,1 32,1 76,9 100,0Prim. Comp - Sec. Inc. 7,7 13,1 20,8 4,5 36,9 37,8 79,2 100,0Sec. Com. Ter/Uni. Inc. 4,1 10,1 14,2 6,9 31,2 47,8 85,8 100,0Ter / Uni. Completo 0,4 6,5 6,8 4,1 24,2 64,9 93,2 100,0Total 6,5 10,8 17,3 4,4 34,8 43,5 82,7 100,0
1990 / MujeresHasta Primario incompleto 58,0 6,9 64,9 0,2 12,6 22,4 35,1 100,0Prim. Comp - Sec. Inc. 41,0 10,7 51,7 0,4 17,5 30,4 48,3 100,0Sec. Com. Ter/Uni. Inc. 13,7 13,1 26,8 4,7 15,3 53,2 73,2 100,0Ter / Uni. Completo 2,7 6,5 9,2 5,1 8,3 77,3 90,8 100,0Total 28,0 9,5 37,5 2,7 13,5 46,3 62,5 100,0
2000/ Amos SexosHasta Primario incompleto 32,1 9,5 41,6 2,9 27,2 28,3 58,4 100,0Prim. Comp - Sec. Inc. 22,9 10,3 33,2 2,5 26,8 37,5 66,8 100,0Sec. Com. Ter/Uni. Inc. 9,4 10,0 19,4 6,6 22,1 52,0 80,6 100,0Ter / Uni. Completo 1,9 8,3 10,2 6,1 15,4 68,3 89,8 100,0Total 14,5 9,7 24,2 4,9 22,8 48,2 75,8 100,0
2000 / VaronesHasta Primario incompleto 14,8 11,0 25,8 3,7 40,0 30,5 74,2 100,0Prim. Comp - Sec. Inc. 9,6 10,9 20,5 3,1 36,3 40,2 79,5 100,0Sec. Com. Ter/Uni. Inc. 4,6 9,1 13,7 8,3 28,7 49,3 86,3 100,0Ter / Uni. Completo 1,0 9,9 10,9 6,3 22,0 60,8 89,1 100,0Total 6,7 10,0 16,7 5,8 31,2 46,2 83,3 100,0
2000 / MujeresHasta Primario incompleto 59,3 7,3 66,6 1,6 6,9 24,9 33,4 100,0Prim. Comp - Sec. Inc. 45,4 9,3 54,7 1,6 10,8 32,9 45,3 100,0Sec. Com. Ter/Uni. Inc. 16,6 11,4 28,0 4,0 11,9 56,1 72,0 100,0Ter / Uni. Completo 2,9 6,5 9,4 5,8 8,0 76,7 90,6 100,0Total 26,0 9,3 35,3 3,5 10,2 51,0 64,7 100,0
Sector informal Sector formal
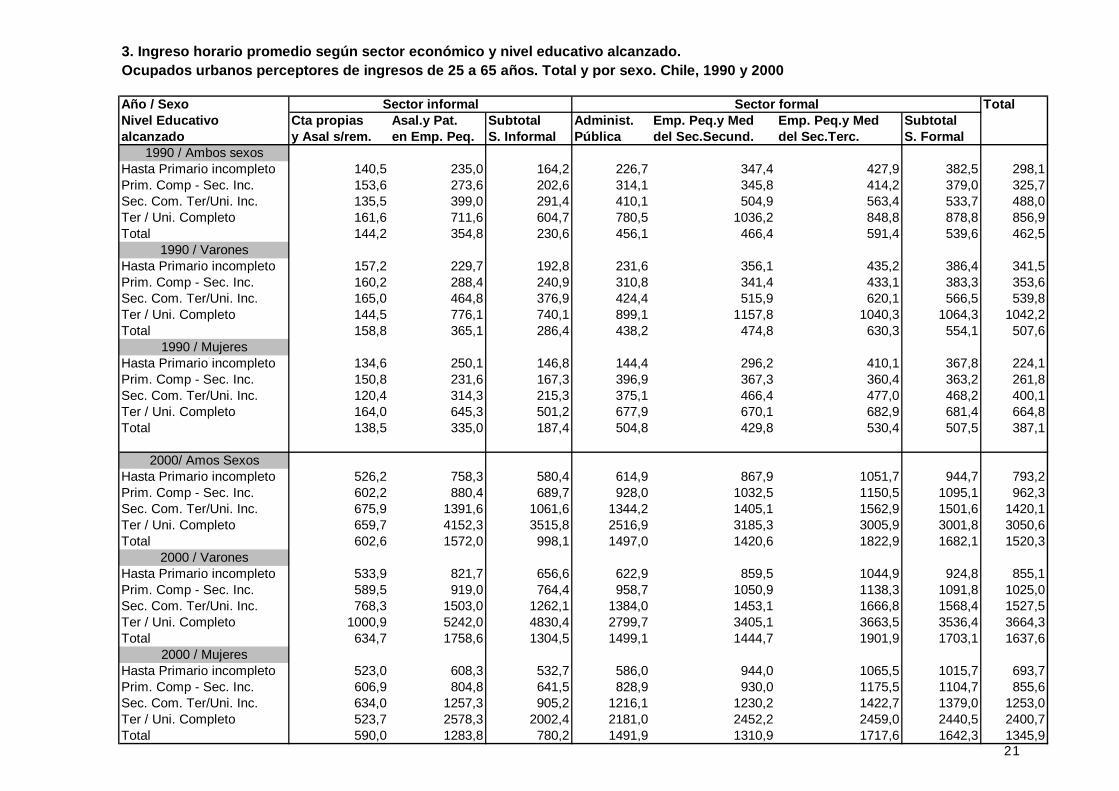
3. Ingreso horario promedio según sector económico y nivel educativo alcanzado.Ocupados urbanos perceptores de ingresos de 25 a 65 años. Total y por sexo. Chile, 1990 y 2000
Año / Sexo TotalNivel Educativo Cta propias Asal.y Pat. Subtotal Administ. Emp. Peq.y Med Emp. Peq.y Med Subtotalalcanzado y Asal s/rem. en Emp. Peq. S. Informal Pública del Sec.Secund. del Sec.Terc. S. Formal
1990 / Ambos sexosHasta Primario incompleto 140,5 235,0 164,2 226,7 347,4 427,9 382,5 298,1Prim. Comp - Sec. Inc. 153,6 273,6 202,6 314,1 345,8 414,2 379,0 325,7Sec. Com. Ter/Uni. Inc. 135,5 399,0 291,4 410,1 504,9 563,4 533,7 488,0Ter / Uni. Completo 161,6 711,6 604,7 780,5 1036,2 848,8 878,8 856,9Total 144,2 354,8 230,6 456,1 466,4 591,4 539,6 462,5
1990 / VaronesHasta Primario incompleto 157,2 229,7 192,8 231,6 356,1 435,2 386,4 341,5Prim. Comp - Sec. Inc. 160,2 288,4 240,9 310,8 341,4 433,1 383,3 353,6Sec. Com. Ter/Uni. Inc. 165,0 464,8 376,9 424,4 515,9 620,1 566,5 539,8Ter / Uni. Completo 144,5 776,1 740,1 899,1 1157,8 1040,3 1064,3 1042,2Total 158,8 365,1 286,4 438,2 474,8 630,3 554,1 507,6
1990 / MujeresHasta Primario incompleto 134,6 250,1 146,8 144,4 296,2 410,1 367,8 224,1Prim. Comp - Sec. Inc. 150,8 231,6 167,3 396,9 367,3 360,4 363,2 261,8Sec. Com. Ter/Uni. Inc. 120,4 314,3 215,3 375,1 466,4 477,0 468,2 400,1Ter / Uni. Completo 164,0 645,3 501,2 677,9 670,1 682,9 681,4 664,8Total 138,5 335,0 187,4 504,8 429,8 530,4 507,5 387,1
2000/ Amos SexosHasta Primario incompleto 526,2 758,3 580,4 614,9 867,9 1051,7 944,7 793,2Prim. Comp - Sec. Inc. 602,2 880,4 689,7 928,0 1032,5 1150,5 1095,1 962,3Sec. Com. Ter/Uni. Inc. 675,9 1391,6 1061,6 1344,2 1405,1 1562,9 1501,6 1420,1Ter / Uni. Completo 659,7 4152,3 3515,8 2516,9 3185,3 3005,9 3001,8 3050,6Total 602,6 1572,0 998,1 1497,0 1420,6 1822,9 1682,1 1520,3
2000 / VaronesHasta Primario incompleto 533,9 821,7 656,6 622,9 859,5 1044,9 924,8 855,1Prim. Comp - Sec. Inc. 589,5 919,0 764,4 958,7 1050,9 1138,3 1091,8 1025,0Sec. Com. Ter/Uni. Inc. 768,3 1503,0 1262,1 1384,0 1453,1 1666,8 1568,4 1527,5Ter / Uni. Completo 1000,9 5242,0 4830,4 2799,7 3405,1 3663,5 3536,4 3664,3Total 634,7 1758,6 1304,5 1499,1 1444,7 1901,9 1703,1 1637,6
2000 / MujeresHasta Primario incompleto 523,0 608,3 532,7 586,0 944,0 1065,5 1015,7 693,7Prim. Comp - Sec. Inc. 606,9 804,8 641,5 828,9 930,0 1175,5 1104,7 855,6Sec. Com. Ter/Uni. Inc. 634,0 1257,3 905,2 1216,1 1230,2 1422,7 1379,0 1253,0Ter / Uni. Completo 523,7 2578,3 2002,4 2181,0 2452,2 2459,0 2440,5 2400,7Total 590,0 1283,8 780,2 1491,9 1310,9 1717,6 1642,3 1345,9
Sector informal Sector formal
21

22
4. Desviación standard del ingreso horario promedio según sector económico y nivel educativo alcanzado.Ocupados urbanos perceptores de ingresos de 25 a 65 años. Total y por sexo. Chile, 1990 y 2000
Año / Sexo TotalNivel Educativo Cta propias Asal.y Pat. Subtotal Administ. Emp. Peq.y Med Emp. Peq.y Med Subtotalalcanzado y Asal s/rem. en Emp. Peq. S. Informal Pública del Sec.Secund. del Sec.Terc. S. Formal
1990 / Ambos sexosHasta Primario incompleto 114,8 257,7 168,0 108,5 336,1 417,5 376,2 330,2Prim. Comp - Sec. Inc. 153,7 367,6 269,4 188,1 333,0 424,8 379,5 359,1Sec. Com. Ter/Uni. Inc. 94,3 499,4 409,8 272,4 501,0 556,1 524,9 514,0Ter / Uni. Completo 118,9 752,7 711,7 551,8 819,9 717,7 733,4 735,5Total 126,3 479,4 338,3 378,9 505,4 596,7 559,5 530,4
1990 / VaronesHasta Primario incompleto 57,0 206,4 154,4 109,6 346,6 401,5 370,1 342,6Prim. Comp - Sec. Inc. 59,5 405,6 329,6 177,1 316,2 447,9 382,4 376,5Sec. Com. Ter/Uni. Inc. 105,4 581,9 511,1 286,2 513,0 604,6 556,5 554,3Ter / Uni. Completo 50,2 753,4 746,2 550,1 863,2 807,7 815,0 814,6Total 69,9 498,1 406,6 359,0 520,8 642,3 586,4 568,4
1990 / MujeresHasta Primario incompleto 128,4 366,0 173,5 29,6 260,3 454,2 398,2 293,5Prim. Comp - Sec. Inc. 179,5 222,0 191,7 359,0 404,4 345,4 367,9 306,4Sec. Com. Ter/Uni. Inc. 84,1 349,2 269,5 231,5 454,6 459,4 447,9 422,8Ter / Uni. Completo 125,6 746,3 665,9 532,4 523,5 580,4 572,8 584,3Total 142,0 440,7 265,9 424,7 430,6 511,2 493,0 449,8
2000/ Amos SexosHasta Primario incompleto 451,2 924,8 604,6 341,0 705,8 925,7 817,0 757,8Prim. Comp - Sec. Inc. 574,2 1033,3 760,6 671,9 922,2 1088,1 1013,7 957,5Sec. Com. Ter/Uni. Inc. 630,0 1802,3 1435,6 982,9 1332,7 1608,9 1496,2 1495,0Ter / Uni. Completo 1026,4 3673,6 3611,9 1545,5 2395,0 2402,6 2356,9 2507,8Total 574,6 2243,8 1573,5 1226,6 1495,6 1896,0 1757,6 1740,3
2000 / VaronesHasta Primario incompleto 635,0 1027,0 837,5 357,2 680,4 898,2 776,0 801,1Prim. Comp - Sec. Inc. 385,2 1070,2 839,4 697,1 952,2 1059,2 1001,1 979,2Sec. Com. Ter/Uni. Inc. 866,9 1703,4 1521,7 1030,8 1366,0 1729,1 1562,7 1560,8Ter / Uni. Completo 1858,6 3908,7 3963,1 1559,0 2520,7 2828,4 2690,7 2868,1Total 683,1 2443,7 2012,9 1240,3 1540,5 2076,6 1855,3 1887,9
2000 / MujeresHasta Primario incompleto 350,3 592,6 386,3 272,9 899,8 978,5 945,6 670,4Prim. Comp - Sec. Inc. 629,5 952,5 700,9 572,3 724,5 1144,7 1049,8 909,3Sec. Com. Ter/Uni. Inc. 480,5 1906,1 1344,1 796,5 1186,9 1419,0 1357,2 1369,8Ter / Uni. Completo 178,2 2594,0 2388,2 1459,7 1725,3 1806,0 1780,7 1848,5Total 525,0 1857,4 1114,4 1191,8 1266,2 1618,3 1555,2 1477,1
Sector informal Sector formal

23
5. Tasa de subocupación abierta según sector económico y nivel educativo alcanzado.Ocupados urbanos perceptores de ingresos de 25 a 65 años. Total y por sexo. Chile, 1990 y 2000
Año / Sexo TotalNivel Educativo Cta propias Asal.y Pat. Subtotal Administ. Emp. Peq.y Med Emp. Peq.y Med Subtotalalcanzado y Asal s/rem. en Emp. Peq. S. Informal Pública del Sec.Secund. del Sec.Terc. S. Formal
1990 / Ambos sexosHasta Primario incompleto 20,7 14,5 19,1 1,7 11,4 25,8 17,9 18,4Prim. Comp - Sec. Inc. 19,2 9,0 15,0 3,1 7,5 13,3 10,2 11,7Sec. Com. Ter/Uni. Inc. 16,2 11,2 13,2 1,0 7,7 12,4 10,1 10,7Ter / Uni. Completo 27,7 12,9 15,7 4,1 4,3 21,0 17,2 17,0Total 19,6 11,4 16,2 2,2 8,4 17,2 13,3 14,0
1990 / VaronesHasta Primario incompleto 13,4 12,6 13,0 1,8 9,8 22,2 14,8 14,4Prim. Comp - Sec. Inc. 11,9 8,1 9,5 3,2 5,5 12,3 8,6 8,8Sec. Com. Ter/Uni. Inc. 11,8 8,5 9,4 1,1 5,4 9,7 7,4 7,7Ter / Uni. Completo 13,8 6,7 7,1 3,7 2,3 13,4 10,1 9,9Total 12,9 9,2 10,6 2,1 6,5 13,6 10,0 10,1
1990 / MujeresHasta Primario incompleto 23,3 19,7 22,9 0,0 21,0 34,6 29,6 25,2Prim. Comp - Sec. Inc. 22,4 11,6 20,1 0,0 17,3 16,0 16,4 18,3Sec. Com. Ter/Uni. Inc. 18,4 14,9 16,7 0,8 15,6 16,7 15,4 15,8Ter / Uni. Completo 29,7 19,4 22,5 4,4 10,5 27,9 25,0 24,7Total 22,3 15,7 20,6 2,3 16,7 23,0 20,8 20,7
2000/ Amos SexosHasta Primario incompleto 25,9 14,1 23,2 10,5 9,4 24,3 16,7 19,4Prim. Comp - Sec. Inc. 24,4 9,5 19,8 11,8 9,3 15,1 12,7 15,0Sec. Com. Ter/Uni. Inc. 22,5 12,8 17,5 3,7 6,1 11,3 9,3 10,9Ter / Uni. Completo 22,5 17,5 18,4 6,0 5,4 20,0 16,6 16,7Total 24,1 12,8 19,6 5,9 7,6 15,4 12,4 14,2
2000 / VaronesHasta Primario incompleto 18,2 14,2 16,5 5,8 8,1 18,7 12,4 13,4Prim. Comp - Sec. Inc. 13,9 6,2 9,9 9,4 6,5 10,2 8,5 8,8Sec. Com. Ter/Uni. Inc. 8,2 8,1 8,2 2,4 4,7 7,5 6,1 6,3Ter / Uni. Completo 26,0 19,0 19,6 4,8 1,0 12,6 9,1 10,3Total 13,7 10,3 11,7 4,2 5,4 10,1 8,0 8,6
2000 / MujeresHasta Primario incompleto 29,0 14,0 27,3 28,1 21,2 35,0 31,8 28,8Prim. Comp - Sec. Inc. 28,2 15,9 26,1 19,7 25,4 25,3 25,1 25,7Sec. Com. Ter/Uni. Inc. 28,6 18,5 24,5 7,7 11,1 16,6 15,2 17,8Ter / Uni. Completo 21,2 14,9 16,9 7,4 19,0 26,6 24,7 24,0Total 28,1 16,8 25,1 10,2 17,5 22,4 21,0 22,4
Sector informal Sector formal

COSTA RICA 1991-2000
Instituto Nacional de Estadística y Censos
IIPE - UNESCO, Sede Regional Buenos Aires - OEI
Julio de 2006
24
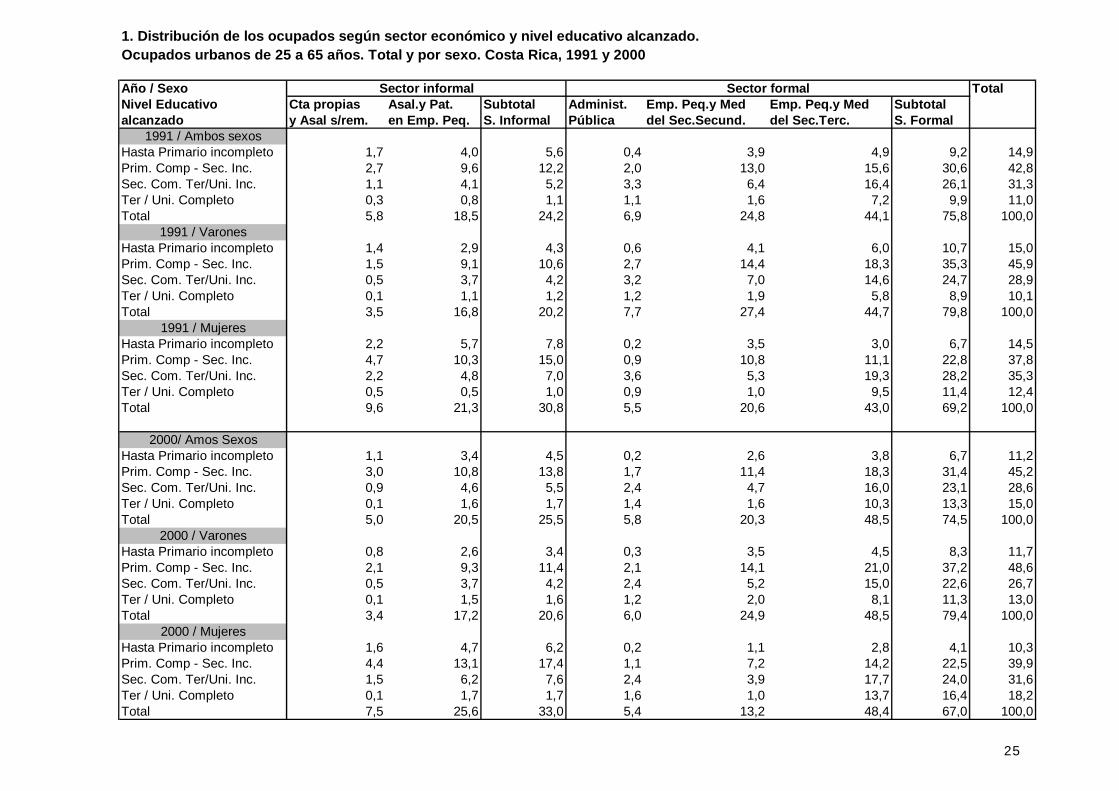
1. Distribución de los ocupados según sector económico y nivel educativo alcanzado.Ocupados urbanos de 25 a 65 años. Total y por sexo. Costa Rica, 1991 y 2000
Año / Sexo TotalNivel Educativo Cta propias Asal.y Pat. Subtotal Administ. Emp. Peq.y Med Emp. Peq.y Med Subtotalalcanzado y Asal s/rem. en Emp. Peq. S. Informal Pública del Sec.Secund. del Sec.Terc. S. Formal
1991 / Ambos sexosHasta Primario incompleto 1,7 4,0 5,6 0,4 3,9 4,9 9,2 14,9Prim. Comp - Sec. Inc. 2,7 9,6 12,2 2,0 13,0 15,6 30,6 42,8Sec. Com. Ter/Uni. Inc. 1,1 4,1 5,2 3,3 6,4 16,4 26,1 31,3Ter / Uni. Completo 0,3 0,8 1,1 1,1 1,6 7,2 9,9 11,0Total 5,8 18,5 24,2 6,9 24,8 44,1 75,8 100,0
1991 / VaronesHasta Primario incompleto 1,4 2,9 4,3 0,6 4,1 6,0 10,7 15,0Prim. Comp - Sec. Inc. 1,5 9,1 10,6 2,7 14,4 18,3 35,3 45,9Sec. Com. Ter/Uni. Inc. 0,5 3,7 4,2 3,2 7,0 14,6 24,7 28,9Ter / Uni. Completo 0,1 1,1 1,2 1,2 1,9 5,8 8,9 10,1Total 3,5 16,8 20,2 7,7 27,4 44,7 79,8 100,0
1991 / MujeresHasta Primario incompleto 2,2 5,7 7,8 0,2 3,5 3,0 6,7 14,5Prim. Comp - Sec. Inc. 4,7 10,3 15,0 0,9 10,8 11,1 22,8 37,8Sec. Com. Ter/Uni. Inc. 2,2 4,8 7,0 3,6 5,3 19,3 28,2 35,3Ter / Uni. Completo 0,5 0,5 1,0 0,9 1,0 9,5 11,4 12,4Total 9,6 21,3 30,8 5,5 20,6 43,0 69,2 100,0
2000/ Amos SexosHasta Primario incompleto 1,1 3,4 4,5 0,2 2,6 3,8 6,7 11,2Prim. Comp - Sec. Inc. 3,0 10,8 13,8 1,7 11,4 18,3 31,4 45,2Sec. Com. Ter/Uni. Inc. 0,9 4,6 5,5 2,4 4,7 16,0 23,1 28,6Ter / Uni. Completo 0,1 1,6 1,7 1,4 1,6 10,3 13,3 15,0Total 5,0 20,5 25,5 5,8 20,3 48,5 74,5 100,0
2000 / VaronesHasta Primario incompleto 0,8 2,6 3,4 0,3 3,5 4,5 8,3 11,7Prim. Comp - Sec. Inc. 2,1 9,3 11,4 2,1 14,1 21,0 37,2 48,6Sec. Com. Ter/Uni. Inc. 0,5 3,7 4,2 2,4 5,2 15,0 22,6 26,7Ter / Uni. Completo 0,1 1,5 1,6 1,2 2,0 8,1 11,3 13,0Total 3,4 17,2 20,6 6,0 24,9 48,5 79,4 100,0
2000 / MujeresHasta Primario incompleto 1,6 4,7 6,2 0,2 1,1 2,8 4,1 10,3Prim. Comp - Sec. Inc. 4,4 13,1 17,4 1,1 7,2 14,2 22,5 39,9Sec. Com. Ter/Uni. Inc. 1,5 6,2 7,6 2,4 3,9 17,7 24,0 31,6Ter / Uni. Completo 0,1 1,7 1,7 1,6 1,0 13,7 16,4 18,2Total 7,5 25,6 33,0 5,4 13,2 48,4 67,0 100,0
Sector informal Sector formal
25

26
2. Distribución de los ocupados por sector económico según nivel educativo alcanzado.Ocupados urbanos de 25 a 65 años. Total y por sexo. Costa Rica, 1991 y 2000
Año / Sexo TotalNivel Educativo Cta propias Asal.y Pat. Subtotal Administ. Emp. Peq.y Med Emp. Peq.y Med Subtotalalcanzado y Asal s/rem. en Emp. Peq. S. Informal Pública del Sec.Secund. del Sec.Terc. S. Formal
1991 / Ambos sexosHasta Primario incompleto 11,3 26,7 38,0 2,9 26,2 32,9 62,0 100,0Prim. Comp - Sec. Inc. 6,3 22,3 28,6 4,7 30,4 36,4 71,4 100,0Sec. Com. Ter/Uni. Inc. 3,7 13,1 16,8 10,6 20,3 52,3 83,2 100,0Ter / Uni. Completo 2,3 7,7 10,0 9,9 14,5 65,6 90,0 100,0Total 5,8 18,5 24,2 6,9 24,8 44,1 75,8 100,0
1991 / VaronesHasta Primario incompleto 9,1 19,6 28,7 4,0 27,3 40,0 71,3 100,0Prim. Comp - Sec. Inc. 3,2 19,8 23,0 5,9 31,3 39,8 77,0 100,0Sec. Com. Ter/Uni. Inc. 1,8 12,7 14,4 10,9 24,2 50,5 85,6 100,0Ter / Uni. Completo 1,4 10,4 11,7 11,9 19,2 57,2 88,3 100,0Total 3,5 16,8 20,2 7,7 27,4 44,7 79,8 100,0
1991 / MujeresHasta Primario incompleto 14,9 38,9 53,8 1,2 24,3 20,7 46,2 100,0Prim. Comp - Sec. Inc. 12,5 27,2 39,7 2,3 28,5 29,5 60,3 100,0Sec. Com. Ter/Uni. Inc. 6,2 13,7 19,9 10,3 15,0 54,8 80,1 100,0Ter / Uni. Completo 3,7 4,1 7,7 7,2 8,2 76,8 92,3 100,0Total 9,6 21,3 30,8 5,5 20,6 43,0 69,2 100,0
2000/ Amos SexosHasta Primario incompleto 9,8 30,5 40,3 2,1 23,3 34,3 59,7 100,0Prim. Comp - Sec. Inc. 6,6 23,9 30,4 3,8 25,2 40,6 69,6 100,0Sec. Com. Ter/Uni. Inc. 3,1 16,2 19,3 8,4 16,4 56,0 80,7 100,0Ter / Uni. Completo 0,4 10,7 11,1 9,3 10,9 68,7 88,9 100,0Total 5,0 20,5 25,5 5,8 20,3 48,5 74,5 100,0
2000 / VaronesHasta Primario incompleto 6,8 22,4 29,2 2,2 30,2 38,4 70,8 100,0Prim. Comp - Sec. Inc. 4,2 19,2 23,5 4,4 29,0 43,2 76,5 100,0Sec. Com. Ter/Uni. Inc. 1,9 13,7 15,6 8,9 19,5 56,0 84,4 100,0Ter / Uni. Completo 0,4 11,9 12,4 9,6 15,6 62,5 87,6 100,0Total 3,4 17,2 20,6 6,0 24,9 48,5 79,4 100,0
2000 / MujeresHasta Primario incompleto 15,0 45,0 60,1 1,8 11,0 27,1 39,9 100,0Prim. Comp - Sec. Inc. 11,0 32,7 43,7 2,9 17,9 35,5 56,3 100,0Sec. Com. Ter/Uni. Inc. 4,6 19,5 24,1 7,7 12,2 56,0 75,9 100,0Ter / Uni. Completo 0,3 9,3 9,6 9,0 5,7 75,6 90,4 100,0Total 7,5 25,6 33,0 5,4 13,2 48,4 67,0 100,0
Sector informal Sector formal

27
3. Ingreso horario promedio según sector económico y nivel educativo alcanzado.Ocupados urbanos perceptores de ingresos de 25 a 65 años. Total y por sexo. Costa Rica, 1991 y 2000
Año / Sexo TotalNivel Educativo Cta propias Asal.y Pat. Subtotal Administ. Emp. Peq.y Med Emp. Peq.y Med Subtotalalcanzado y Asal s/rem. en Emp. Peq. S. Informal Pública del Sec.Secund. del Sec.Terc. S. Formal
1991 / Ambos sexosHasta Primario incompleto 40,8 80,6 68,6 120,8 120,8 137,9 129,8 106,6Prim. Comp - Sec. Inc. 32,1 102,0 86,5 140,4 117,5 137,0 128,9 116,8Sec. Com. Ter/Uni. Inc. 28,2 163,9 134,6 178,2 188,8 192,3 189,6 180,4Ter / Uni. Completo 15,5 210,7 165,6 262,3 310,2 299,4 297,0 284,7Total 33,0 113,6 94,6 174,7 146,2 181,4 169,0 150,7
1991 / VaronesHasta Primario incompleto 40,3 89,1 73,6 137,8 125,2 130,7 129,0 112,9Prim. Comp - Sec. Inc. 30,5 107,8 96,8 140,8 118,5 133,2 127,8 120,7Sec. Com. Ter/Uni. Inc. 37,1 178,4 162,8 187,8 205,6 187,7 192,8 188,5Ter / Uni. Completo , 194,9 181,2 273,4 332,6 275,2 287,6 275,6Total 34,8 122,6 108,0 177,4 153,2 166,3 162,8 151,5
1991 / MujeresHasta Primario incompleto 41,3 73,0 63,9 23,3 112,6 161,0 132,0 95,9Prim. Comp - Sec. Inc. 32,9 93,7 74,7 138,3 115,1 147,5 131,7 108,9Sec. Com. Ter/Uni. Inc. 25,3 146,3 108,2 164,6 152,8 197,9 185,0 169,6Ter / Uni. Completo 19,4 271,9 135,6 240,5 248,4 321,1 307,9 295,7Total 32,0 102,0 80,4 168,4 131,0 206,3 180,6 149,5
2000/ Amos SexosHasta Primario incompleto 215,4 475,1 415,5 456,0 491,2 670,4 592,0 519,5Prim. Comp - Sec. Inc. 177,5 512,1 443,3 608,8 581,8 670,3 633,3 574,5Sec. Com. Ter/Uni. Inc. 200,5 771,9 696,3 877,1 908,7 993,1 964,2 914,1Ter / Uni. Completo 191,9 1184,7 1158,5 1731,6 1634,4 1531,4 1564,6 1522,1Total 190,7 608,8 530,7 997,2 713,1 957,9 891,8 798,6
2000 / VaronesHasta Primario incompleto 233,8 541,6 465,6 451,3 518,7 665,3 595,3 556,0Prim. Comp - Sec. Inc. 199,3 563,5 494,3 585,5 608,7 699,6 657,1 617,6Sec. Com. Ter/Uni. Inc. 206,2 928,9 827,9 946,9 986,1 1051,2 1025,0 993,6Ter / Uni. Completo 191,9 1326,6 1277,1 1847,7 1882,1 1721,2 1762,5 1702,8Total 209,3 697,8 609,9 1009,9 754,1 970,1 901,9 839,2
2000 / MujeresHasta Primario incompleto 196,3 417,6 370,3 465,2 354,8 683,6 581,4 453,5Prim. Comp - Sec. Inc. 158,3 457,1 390,8 661,3 498,6 607,2 574,8 495,1Sec. Com. Ter/Uni. Inc. 194,5 626,9 572,7 768,8 746,5 919,5 877,4 809,3Ter / Uni. Completo , 975,6 975,6 1588,0 976,8 1366,1 1362,8 1329,9Total 173,0 516,5 450,0 976,6 591,1 939,8 873,5 736,1
Sector informal Sector formal
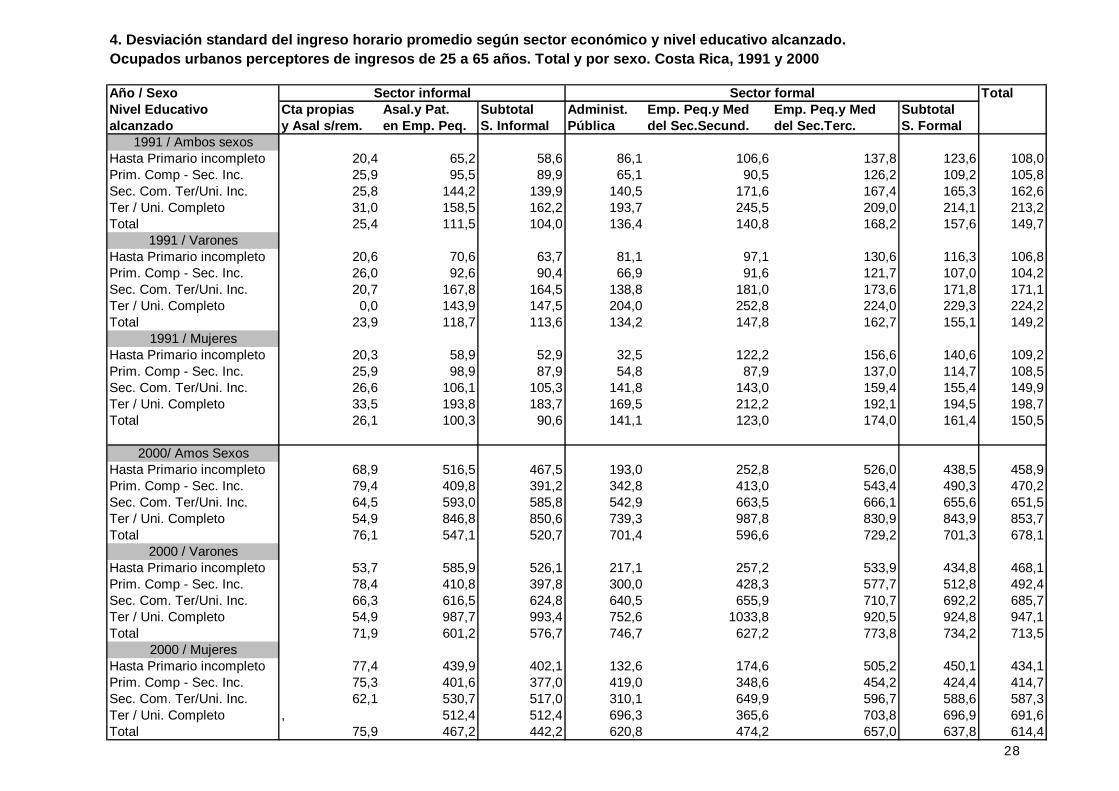
4. Desviación standard del ingreso horario promedio según sector económico y nivel educativo alcanzado.Ocupados urbanos perceptores de ingresos de 25 a 65 años. Total y por sexo. Costa Rica, 1991 y 2000
Año / Sexo TotalNivel Educativo Cta propias Asal.y Pat. Subtotal Administ. Emp. Peq.y Med Emp. Peq.y Med Subtotalalcanzado y Asal s/rem. en Emp. Peq. S. Informal Pública del Sec.Secund. del Sec.Terc. S. Formal
1991 / Ambos sexosHasta Primario incompleto 20,4 65,2 58,6 86,1 106,6 137,8 123,6 108,0Prim. Comp - Sec. Inc. 25,9 95,5 89,9 65,1 90,5 126,2 109,2 105,8Sec. Com. Ter/Uni. Inc. 25,8 144,2 139,9 140,5 171,6 167,4 165,3 162,6Ter / Uni. Completo 31,0 158,5 162,2 193,7 245,5 209,0 214,1 213,2Total 25,4 111,5 104,0 136,4 140,8 168,2 157,6 149,7
1991 / VaronesHasta Primario incompleto 20,6 70,6 63,7 81,1 97,1 130,6 116,3 106,8Prim. Comp - Sec. Inc. 26,0 92,6 90,4 66,9 91,6 121,7 107,0 104,2Sec. Com. Ter/Uni. Inc. 20,7 167,8 164,5 138,8 181,0 173,6 171,8 171,1Ter / Uni. Completo 0,0 143,9 147,5 204,0 252,8 224,0 229,3 224,2Total 23,9 118,7 113,6 134,2 147,8 162,7 155,1 149,2
1991 / MujeresHasta Primario incompleto 20,3 58,9 52,9 32,5 122,2 156,6 140,6 109,2Prim. Comp - Sec. Inc. 25,9 98,9 87,9 54,8 87,9 137,0 114,7 108,5Sec. Com. Ter/Uni. Inc. 26,6 106,1 105,3 141,8 143,0 159,4 155,4 149,9Ter / Uni. Completo 33,5 193,8 183,7 169,5 212,2 192,1 194,5 198,7Total 26,1 100,3 90,6 141,1 123,0 174,0 161,4 150,5
2000/ Amos SexosHasta Primario incompleto 68,9 516,5 467,5 193,0 252,8 526,0 438,5 458,9Prim. Comp - Sec. Inc. 79,4 409,8 391,2 342,8 413,0 543,4 490,3 470,2Sec. Com. Ter/Uni. Inc. 64,5 593,0 585,8 542,9 663,5 666,1 655,6 651,5Ter / Uni. Completo 54,9 846,8 850,6 739,3 987,8 830,9 843,9 853,7Total 76,1 547,1 520,7 701,4 596,6 729,2 701,3 678,1
2000 / VaronesHasta Primario incompleto 53,7 585,9 526,1 217,1 257,2 533,9 434,8 468,1Prim. Comp - Sec. Inc. 78,4 410,8 397,8 300,0 428,3 577,7 512,8 492,4Sec. Com. Ter/Uni. Inc. 66,3 616,5 624,8 640,5 655,9 710,7 692,2 685,7Ter / Uni. Completo 54,9 987,7 993,4 752,6 1033,8 920,5 924,8 947,1Total 71,9 601,2 576,7 746,7 627,2 773,8 734,2 713,5
2000 / MujeresHasta Primario incompleto 77,4 439,9 402,1 132,6 174,6 505,2 450,1 434,1Prim. Comp - Sec. Inc. 75,3 401,6 377,0 419,0 348,6 454,2 424,4 414,7Sec. Com. Ter/Uni. Inc. 62,1 530,7 517,0 310,1 649,9 596,7 588,6 587,3Ter / Uni. Completo , 512,4 512,4 696,3 365,6 703,8 696,9 691,6Total 75,9 467,2 442,2 620,8 474,2 657,0 637,8 614,4
Sector informal Sector formal
28

29
5. Tasa de subocupación abierta según sector económico y nivel educativo alcanzado.Ocupados urbanos perceptores de ingresos de 25 a 65 años. Total y por sexo. Costa Rica, 1991 y 2000
Año / Sexo TotalNivel Educativo Cta propias Asal.y Pat. Subtotal Administ. Emp. Peq.y Med Emp. Peq.y Med Subtotalalcanzado y Asal s/rem. en Emp. Peq. S. Informal Pública del Sec.Secund. del Sec.Terc. S. Formal
1991 / Ambos sexosHasta Primario incompleto 39,9 26,4 30,4 0,0 25,9 29,5 26,6 28,0Prim. Comp - Sec. Inc. 49,3 25,6 30,8 0,0 15,1 15,9 14,5 19,2Sec. Com. Ter/Uni. Inc. 52,8 16,6 24,5 2,9 9,9 17,1 13,5 15,4Ter / Uni. Completo 49,9 25,4 31,2 7,9 5,4 27,6 21,8 22,8Total 47,7 23,7 29,3 2,6 14,6 20,0 16,6 19,7
1991 / VaronesHasta Primario incompleto 19,3 7,0 10,9 0,0 16,6 23,5 19,5 17,1Prim. Comp - Sec. Inc. 18,9 11,9 12,9 0,0 8,2 11,3 9,2 10,0Sec. Com. Ter/Uni. Inc. 27,2 6,7 9,2 5,0 1,3 9,2 6,4 6,8Ter / Uni. Completo 100,0 26,2 34,8 11,4 0,0 14,8 11,2 13,9Total 23,5 11,3 13,3 3,8 7,0 13,3 10,2 10,8
1991 / MujeresHasta Primario incompleto 61,3 43,1 48,1 0,0 43,6 49,5 45,1 46,8Prim. Comp - Sec. Inc. 64,7 45,6 51,6 0,0 30,1 28,5 28,1 37,5Sec. Com. Ter/Uni. Inc. 62,5 29,0 39,5 0,0 28,6 26,9 23,8 26,9Ter / Uni. Completo 25,0 22,7 23,8 0,0 22,3 40,3 35,6 34,7Total 62,0 40,0 46,7 0,0 31,3 31,4 28,9 34,4
2000/ Amos SexosHasta Primario incompleto 15,4 26,2 23,6 0,0 7,3 29,8 20,0 21,4Prim. Comp - Sec. Inc. 22,6 21,0 21,4 5,3 7,5 15,8 12,2 15,0Sec. Com. Ter/Uni. Inc. 25,2 13,7 15,5 3,1 6,0 14,7 11,7 12,4Ter / Uni. Completo 58,5 13,3 14,9 0,0 13,1 16,2 14,1 14,2Total 21,8 19,8 20,2 2,8 7,5 16,6 13,0 14,9
2000 / VaronesHasta Primario incompleto 7,2 10,2 9,5 0,0 2,7 18,8 11,3 10,8Prim. Comp - Sec. Inc. 11,7 9,0 9,5 3,3 3,8 11,2 8,0 8,3Sec. Com. Ter/Uni. Inc. 4,3 4,9 4,8 0,0 2,7 7,9 5,8 5,7Ter / Uni. Completo 29,4 3,9 4,8 0,0 15,5 9,6 9,6 9,0Total 9,5 8,2 8,4 1,2 4,3 10,6 7,9 8,0
2000 / MujeresHasta Primario incompleto 22,1 40,3 35,7 0,0 29,9 57,4 47,2 40,3Prim. Comp - Sec. Inc. 30,5 34,5 33,5 11,0 18,8 26,4 23,2 27,7Sec. Com. Ter/Uni. Inc. 36,4 21,9 24,6 7,8 13,0 23,7 20,3 21,4Ter / Uni. Completo 100,0 26,8 29,4 0,0 6,1 22,3 19,0 20,0Total 30,6 32,2 31,9 5,7 16,9 25,9 22,5 25,6
Sector informal Sector formal

EL SALVADOR 1997-2003
Dirección General de Estadística y Censos
IIPE - UNESCO, Sede Regional Buenos Aires - OEI
Julio de 2006
30
31
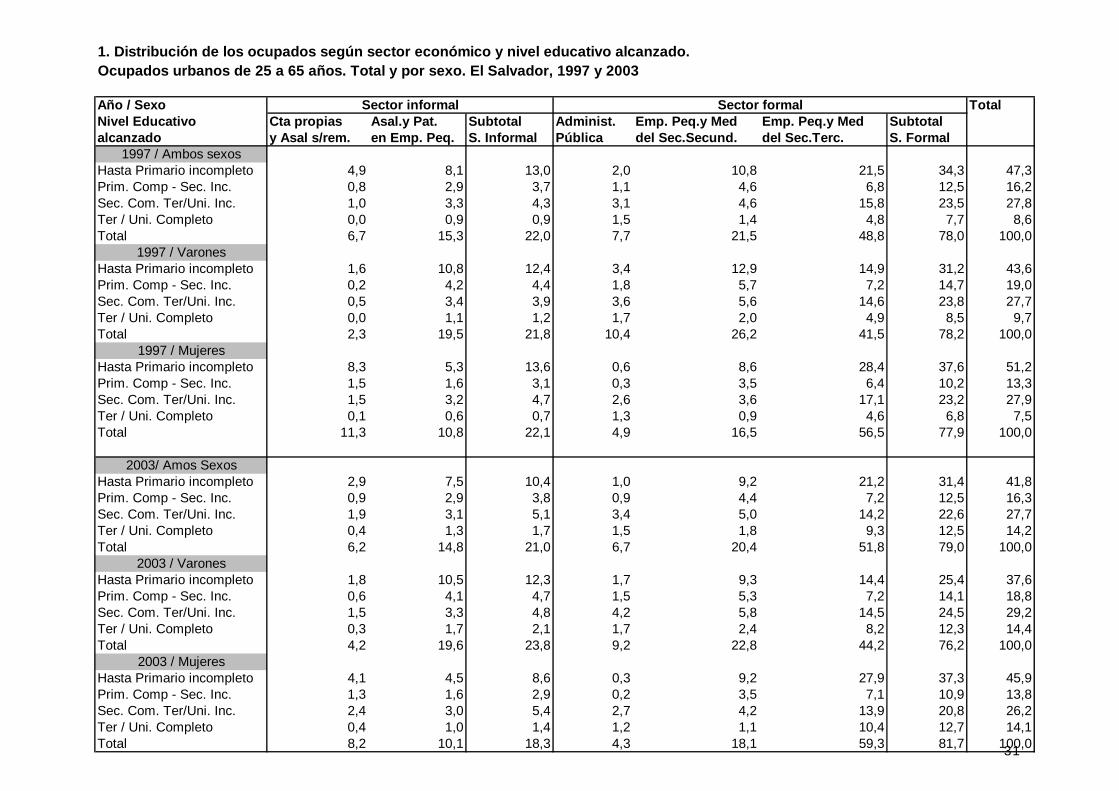
1. Distribución de los ocupados según sector económico y nivel educativo alcanzado.Ocupados urbanos de 25 a 65 años. Total y por sexo. El Salvador, 1997 y 2003
Año / Sexo TotalNivel Educativo Cta propias Asal.y Pat. Subtotal Administ. Emp. Peq.y Med Emp. Peq.y Med Subtotalalcanzado y Asal s/rem. en Emp. Peq. S. Informal Pública del Sec.Secund. del Sec.Terc. S. Formal
1997 / Ambos sexosHasta Primario incompleto 4,9 8,1 13,0 2,0 10,8 21,5 34,3 47,3Prim. Comp - Sec. Inc. 0,8 2,9 3,7 1,1 4,6 6,8 12,5 16,2Sec. Com. Ter/Uni. Inc. 1,0 3,3 4,3 3,1 4,6 15,8 23,5 27,8Ter / Uni. Completo 0,0 0,9 0,9 1,5 1,4 4,8 7,7 8,6Total 6,7 15,3 22,0 7,7 21,5 48,8 78,0 100,0
1997 / VaronesHasta Primario incompleto 1,6 10,8 12,4 3,4 12,9 14,9 31,2 43,6Prim. Comp - Sec. Inc. 0,2 4,2 4,4 1,8 5,7 7,2 14,7 19,0Sec. Com. Ter/Uni. Inc. 0,5 3,4 3,9 3,6 5,6 14,6 23,8 27,7Ter / Uni. Completo 0,0 1,1 1,2 1,7 2,0 4,9 8,5 9,7Total 2,3 19,5 21,8 10,4 26,2 41,5 78,2 100,0
1997 / MujeresHasta Primario incompleto 8,3 5,3 13,6 0,6 8,6 28,4 37,6 51,2Prim. Comp - Sec. Inc. 1,5 1,6 3,1 0,3 3,5 6,4 10,2 13,3Sec. Com. Ter/Uni. Inc. 1,5 3,2 4,7 2,6 3,6 17,1 23,2 27,9Ter / Uni. Completo 0,1 0,6 0,7 1,3 0,9 4,6 6,8 7,5Total 11,3 10,8 22,1 4,9 16,5 56,5 77,9 100,0
2003/ Amos SexosHasta Primario incompleto 2,9 7,5 10,4 1,0 9,2 21,2 31,4 41,8Prim. Comp - Sec. Inc. 0,9 2,9 3,8 0,9 4,4 7,2 12,5 16,3Sec. Com. Ter/Uni. Inc. 1,9 3,1 5,1 3,4 5,0 14,2 22,6 27,7Ter / Uni. Completo 0,4 1,3 1,7 1,5 1,8 9,3 12,5 14,2Total 6,2 14,8 21,0 6,7 20,4 51,8 79,0 100,0
2003 / VaronesHasta Primario incompleto 1,8 10,5 12,3 1,7 9,3 14,4 25,4 37,6Prim. Comp - Sec. Inc. 0,6 4,1 4,7 1,5 5,3 7,2 14,1 18,8Sec. Com. Ter/Uni. Inc. 1,5 3,3 4,8 4,2 5,8 14,5 24,5 29,2Ter / Uni. Completo 0,3 1,7 2,1 1,7 2,4 8,2 12,3 14,4Total 4,2 19,6 23,8 9,2 22,8 44,2 76,2 100,0
2003 / MujeresHasta Primario incompleto 4,1 4,5 8,6 0,3 9,2 27,9 37,3 45,9Prim. Comp - Sec. Inc. 1,3 1,6 2,9 0,2 3,5 7,1 10,9 13,8Sec. Com. Ter/Uni. Inc. 2,4 3,0 5,4 2,7 4,2 13,9 20,8 26,2Ter / Uni. Completo 0,4 1,0 1,4 1,2 1,1 10,4 12,7 14,1Total 8,2 10,1 18,3 4,3 18,1 59,3 81,7 100,0
Sector informal Sector formal

32
2. Distribución de los ocupados por sector económico según nivel educativo alcanzado.Ocupados urbanos de 25 a 65 años. Total y por sexo. El Salvador, 1997 y 2003
Año / Sexo TotalNivel Educativo Cta propias Asal.y Pat. Subtotal Administ. Emp. Peq.y Med Emp. Peq.y Med Subtotalalcanzado y Asal s/rem. en Emp. Peq. S. Informal Pública del Sec.Secund. del Sec.Terc. S. Formal
1997 / Ambos sexosHasta Primario incompleto 10,3 17,2 27,5 4,3 22,9 45,4 72,5 100,0Prim. Comp - Sec. Inc. 4,9 18,1 23,0 6,7 28,5 41,8 77,0 100,0Sec. Com. Ter/Uni. Inc. 3,4 12,0 15,4 11,2 16,6 56,8 84,6 100,0Ter / Uni. Completo 0,5 10,4 10,9 17,4 16,8 55,0 89,1 100,0Total 6,7 15,3 22,0 7,7 21,5 48,8 78,0 100,0
1997 / VaronesHasta Primario incompleto 3,7 24,7 28,4 7,8 29,6 34,2 71,6 100,0Prim. Comp - Sec. Inc. 0,9 22,0 22,9 9,4 30,0 37,6 77,1 100,0Sec. Com. Ter/Uni. Inc. 1,7 12,4 14,1 13,1 20,3 52,6 85,9 100,0Ter / Uni. Completo 0,3 11,7 12,1 17,1 20,4 50,5 87,9 100,0Total 2,3 19,5 21,8 10,4 26,2 41,5 78,2 100,0
1997 / MujeresHasta Primario incompleto 16,2 10,4 26,6 1,2 16,8 55,5 73,4 100,0Prim. Comp - Sec. Inc. 10,9 12,3 23,2 2,5 26,2 48,1 76,8 100,0Sec. Com. Ter/Uni. Inc. 5,3 11,5 16,8 9,3 12,7 61,1 83,2 100,0Ter / Uni. Completo 0,7 8,5 9,2 17,9 11,8 61,1 90,8 100,0Total 11,3 10,8 22,1 4,9 16,5 56,5 77,9 100,0
2003/ Amos SexosHasta Primario incompleto 7,0 17,9 24,9 2,3 22,1 50,7 75,1 100,0Prim. Comp - Sec. Inc. 5,8 17,6 23,4 5,4 27,2 44,1 76,6 100,0Sec. Com. Ter/Uni. Inc. 7,0 11,3 18,4 12,4 18,1 51,1 81,6 100,0Ter / Uni. Completo 2,7 9,4 12,0 10,2 12,4 65,3 88,0 100,0Total 6,2 14,8 21,0 6,7 20,4 51,8 79,0 100,0
2003 / VaronesHasta Primario incompleto 4,7 27,9 32,6 4,5 24,6 38,3 67,4 100,0Prim. Comp - Sec. Inc. 3,1 22,0 25,1 8,1 28,4 38,4 74,9 100,0Sec. Com. Ter/Uni. Inc. 5,1 11,2 16,3 14,4 19,8 49,5 83,7 100,0Ter / Uni. Completo 2,4 11,8 14,3 12,1 16,9 56,8 85,7 100,0Total 4,2 19,6 23,8 9,2 22,8 44,2 76,2 100,0
2003 / MujeresHasta Primario incompleto 8,9 9,8 18,7 0,6 20,0 60,7 81,3 100,0Prim. Comp - Sec. Inc. 9,4 11,8 21,1 1,6 25,5 51,7 78,9 100,0Sec. Com. Ter/Uni. Inc. 9,2 11,5 20,6 10,3 16,2 52,9 79,4 100,0Ter / Uni. Completo 2,9 6,9 9,8 8,3 7,9 74,0 90,2 100,0Total 8,2 10,1 18,3 4,3 18,1 59,3 81,7 100,0
Sector informal Sector formal

33
3. Ingreso horario promedio según sector económico y nivel educativo alcanzado.Ocupados urbanos perceptores de ingresos de 25 a 65 años. Total y por sexo. El Salvador, 1997 y 2003
Año / Sexo TotalNivel Educativo Cta propias Asal.y Pat. Subtotal Administ. Emp. Peq.y Med Emp. Peq.y Med Subtotalalcanzado y Asal s/rem. en Emp. Peq. S. Informal Pública del Sec.Secund. del Sec.Terc. S. Formal
1997 / Ambos sexosHasta Primario incompleto 1,5 10,2 6,9 11,4 9,1 8,4 8,8 8,3Prim. Comp - Sec. Inc. 1,0 12,5 9,9 12,2 10,4 11,8 11,3 11,0Sec. Com. Ter/Uni. Inc. 0,7 17,2 13,3 18,2 15,3 19,0 18,2 17,3Ter / Uni. Completo 1,3 37,2 35,3 32,6 38,8 30,1 32,1 32,4Total 1,4 13,6 9,7 18,1 12,5 14,3 14,2 13,2
1997 / VaronesHasta Primario incompleto 1,5 10,9 9,6 11,6 9,7 11,1 10,6 10,3Prim. Comp - Sec. Inc. 1,1 14,4 13,9 12,5 11,7 13,0 12,4 12,8Sec. Com. Ter/Uni. Inc. 0,1 19,3 16,9 18,4 16,1 19,8 18,7 18,4Ter / Uni. Completo 0,0 38,5 37,3 33,5 39,7 33,3 34,8 35,1Total 1,2 14,6 13,1 17,3 13,5 17,1 15,9 15,3
1997 / MujeresHasta Primario incompleto 1,6 8,9 4,4 9,8 8,3 6,9 7,3 6,5Prim. Comp - Sec. Inc. 1,0 7,0 4,0 10,9 8,1 10,3 9,6 8,3Sec. Com. Ter/Uni. Inc. 0,9 14,7 10,2 17,9 13,9 18,3 17,6 16,2Ter / Uni. Completo 2,0 34,7 31,7 31,2 36,2 26,6 28,6 28,6Total 1,4 11,7 6,3 19,8 10,6 12,2 12,4 11,0
2003/ Amos SexosHasta Primario incompleto 0,3 11,3 8,0 13,8 10,0 10,7 10,6 10,0Prim. Comp - Sec. Inc. 0,2 14,1 10,5 18,4 13,9 11,9 13,0 12,4Sec. Com. Ter/Uni. Inc. 0,1 16,8 10,0 21,8 15,5 18,9 18,6 16,9Ter / Uni. Completo 0,1 26,5 19,4 39,4 35,4 32,8 33,9 32,0Total 0,2 14,2 9,8 23,3 13,9 16,5 16,4 14,9
2003 / VaronesHasta Primario incompleto 0,3 12,0 10,2 14,3 12,3 12,6 12,6 11,8Prim. Comp - Sec. Inc. 0,1 15,2 13,2 18,9 15,6 13,1 14,6 14,3Sec. Com. Ter/Uni. Inc. 0,0 19,4 12,9 20,6 17,9 20,1 19,7 18,4Ter / Uni. Completo 0,0 27,3 21,5 43,2 32,3 34,8 35,6 33,4Total 0,1 15,0 12,2 22,9 16,2 18,6 18,4 16,8
2003 / MujeresHasta Primario incompleto 0,4 9,6 5,1 9,9 7,9 9,7 9,3 8,5Prim. Comp - Sec. Inc. 0,2 11,4 6,3 14,2 11,2 10,9 11,1 10,0Sec. Com. Ter/Uni. Inc. 0,1 14,0 7,5 23,4 12,4 17,7 17,4 15,2Ter / Uni. Completo 0,2 25,1 16,5 33,1 41,4 31,4 32,3 30,6Total 0,3 12,5 6,8 24,3 11,2 15,0 14,6 13,1
Sector informal Sector formal

34
4. Desviación standard del ingreso horario promedio según sector económico y nivel educativo alcanzado.Ocupados urbanos perceptores de ingresos de 25 a 65 años. Total y por sexo. El Salvador, 1997 y 2003
Año / Sexo TotalNivel Educativo Cta propias Asal.y Pat. Subtotal Administ. Emp. Peq.y Med Emp. Peq.y Med Subtotalalcanzado y Asal s/rem. en Emp. Peq. S. Informal Pública del Sec.Secund. del Sec.Terc. S. Formal
1997 / Ambos sexosHasta Primario incompleto 1,2 11,2 9,8 5,2 6,1 6,8 6,6 7,7Prim. Comp - Sec. Inc. 1,1 12,7 12,2 5,4 6,2 8,3 7,4 8,8Sec. Com. Ter/Uni. Inc. 1,1 13,5 13,7 8,4 11,7 12,7 12,1 12,5Ter / Uni. Completo 1,0 19,9 20,9 13,1 21,0 16,0 16,9 17,5Total 1,2 14,1 13,0 11,2 11,5 12,5 12,2 12,5
1997 / VaronesHasta Primario incompleto 1,1 11,1 10,8 5,2 5,7 7,9 6,8 8,2Prim. Comp - Sec. Inc. 1,2 14,0 14,0 5,6 6,5 7,5 6,9 9,1Sec. Com. Ter/Uni. Inc. 0,5 14,3 14,8 9,8 9,6 13,0 11,9 12,4Ter / Uni. Completo 0,0 17,1 18,1 12,0 20,8 17,2 17,5 17,6Total 1,2 14,3 14,2 11,1 11,4 13,4 12,6 13,0
1997 / MujeresHasta Primario incompleto 1,2 11,3 8,0 4,5 6,7 5,7 5,9 6,7Prim. Comp - Sec. Inc. 1,1 4,6 4,5 3,7 4,8 8,8 7,7 7,5Sec. Com. Ter/Uni. Inc. 1,2 12,1 11,9 6,0 14,6 12,4 12,3 12,6Ter / Uni. Completo 0,0 24,1 24,8 14,4 21,3 13,8 15,3 16,6Total 1,2 13,3 10,6 11,2 11,4 11,3 11,5 11,6
2003/ Amos SexosHasta Primario incompleto 0,5 12,0 11,2 6,7 7,5 10,0 9,3 9,9Prim. Comp - Sec. Inc. 0,4 12,2 12,1 13,1 14,0 10,6 12,2 12,3Sec. Com. Ter/Uni. Inc. 0,3 16,6 15,2 10,3 12,6 16,0 14,7 15,2Ter / Uni. Completo 0,3 26,2 25,3 21,4 22,4 18,2 19,3 20,8Total 0,5 15,2 14,2 15,4 13,5 15,5 15,2 15,2
2003 / VaronesHasta Primario incompleto 0,5 12,3 12,1 6,8 9,1 11,4 10,4 11,0Prim. Comp - Sec. Inc. 0,2 11,7 12,0 13,7 15,7 10,3 13,2 12,9Sec. Com. Ter/Uni. Inc. 0,2 20,5 19,0 11,1 14,8 16,0 15,0 16,0Ter / Uni. Completo 0,0 26,5 26,0 22,6 19,8 20,3 20,8 22,3Total 0,4 15,9 15,4 16,6 14,6 16,5 16,1 16,1
2003 / MujeresHasta Primario incompleto 0,6 11,1 9,2 4,0 4,7 9,1 8,3 8,6Prim. Comp - Sec. Inc. 0,5 13,0 11,1 4,7 10,5 10,7 10,6 10,9Sec. Com. Ter/Uni. Inc. 0,4 10,3 10,2 8,9 7,7 16,0 14,3 14,1Ter / Uni. Completo 0,4 25,6 23,9 17,6 25,8 16,4 17,7 19,1Total 0,5 13,8 11,8 12,5 11,4 14,6 14,1 14,0
Sector informal Sector formal

35
5. Tasa de subocupación abierta según sector económico y nivel educativo alcanzado.Ocupados urbanos perceptores de ingresos de 25 a 65 años. Total y por sexo. El Salvador, 1997 y 2003
Año / Sexo TotalNivel Educativo Cta propias Asal.y Pat. Subtotal Administ. Emp. Peq.y Med Emp. Peq.y Med Subtotalalcanzado y Asal s/rem. en Emp. Peq. S. Informal Pública del Sec.Secund. del Sec.Terc. S. Formal
1993 / Ambos sexosHasta Primario incompleto 19,2 11,7 14,5 0,7 12,4 18,6 15,6 15,3Prim. Comp - Sec. Inc. 19,9 10,8 12,7 0,6 6,7 9,5 7,7 8,9Sec. Com. Ter/Uni. Inc. 21,7 9,8 12,4 0,0 4,9 18,4 13,3 13,3Ter / Uni. Completo 0,0 22,5 21,5 0,0 3,6 10,4 7,1 8,6Total 19,5 11,7 14,1 0,3 9,0 16,4 12,8 13,1
1993 / VaronesHasta Primario incompleto 24,7 10,9 12,7 0,8 5,9 10,2 7,4 9,0Prim. Comp - Sec. Inc. 0,0 11,4 11,0 0,7 7,1 3,6 4,6 6,1Sec. Com. Ter/Uni. Inc. 22,0 7,3 9,1 0,0 3,3 14,5 9,7 9,5Ter / Uni. Completo 0,0 11,5 11,2 0,0 2,5 7,4 4,8 5,6Total 21,9 10,4 11,6 0,4 5,4 10,2 7,3 8,2
1993 / MujeresHasta Primario incompleto 18,1 13,3 16,2 0,0 22,8 23,2 22,7 21,0Prim. Comp - Sec. Inc. 22,5 9,1 15,4 0,0 6,2 16,5 12,5 13,1Sec. Com. Ter/Uni. Inc. 21,5 12,6 15,4 0,0 7,5 22,0 17,3 17,2Ter / Uni. Completo 0,0 43,1 39,8 0,0 6,0 13,9 10,1 12,8Total 19,0 14,2 16,7 0,0 15,1 21,3 18,6 18,3
2003/ Amos SexosHasta Primario incompleto 19,8 19,9 19,8 8,0 18,5 26,3 23,4 22,6Prim. Comp - Sec. Inc. 18,5 18,1 18,2 2,2 11,6 16,9 14,0 15,0Sec. Com. Ter/Uni. Inc. 20,0 17,8 18,7 1,5 12,0 15,2 12,4 13,6Ter / Uni. Completo 18,2 15,1 15,8 4,4 2,0 23,8 18,4 18,1Total 19,6 18,7 18,9 3,1 14,1 21,5 18,0 18,2
2003 / VaronesHasta Primario incompleto 27,0 19,8 20,8 9,3 12,6 22,6 18,0 19,0Prim. Comp - Sec. Inc. 13,9 18,9 18,3 2,5 11,8 11,5 10,7 12,6Sec. Com. Ter/Uni. Inc. 12,8 16,8 15,5 0,8 9,9 12,3 9,7 10,7Ter / Uni. Completo 4,9 7,6 7,1 4,5 2,0 20,7 14,7 13,7Total 18,3 18,0 18,1 3,4 10,6 17,1 13,5 14,6
2003 / MujeresHasta Primario incompleto 16,6 20,1 18,4 0,0 24,5 28,2 27,1 25,4Prim. Comp - Sec. Inc. 20,5 16,0 18,0 0,0 11,3 22,2 18,2 18,2Sec. Com. Ter/Uni. Inc. 24,5 19,0 21,4 2,5 14,8 18,2 15,5 16,7Ter / Uni. Completo 29,5 28,2 28,6 4,1 2,0 26,1 22,0 22,6Total 20,2 19,9 20,0 2,6 18,4 24,8 22,2 21,8
Sector informal Sector formal
MEXICO 1992-2002
Instituto Nacional de Estadística, Geografía e informática (INEGI)
IIPE - UNESCO, Sede Regional Buenos Aires - OEI
Julio de 2006
36

37
1. Distribución de los ocupados según sector económico y nivel educativo alcanzado.Ocupados urbanos de 25 a 65 años. Total y por sexo. México, 1992 y 2002
Año / Sexo TotalNivel Educativo Cta propias Asal.y Pat. Subtotal Administ. Emp. Peq.y Med Emp. Peq.y Med Subtotalalcanzado y Asal s/rem. en Emp. Peq. S. Informal Pública del Sec.Secund. del Sec.Terc. S. Formal
1992 / Ambos sexosHasta Primario incompleto 3,7 8,9 12,6 0,9 5,3 6,5 12,6 25,2Prim. Comp - Sec. Inc. 2,2 7,9 10,1 1,2 6,5 10,2 17,9 28,0Sec. Com. Ter/Uni. Inc. 1,4 7,4 8,8 1,8 7,5 17,4 26,6 35,4Ter / Uni. Completo 0,2 1,7 1,9 0,7 2,0 6,8 9,5 11,4Total 7,5 25,9 33,4 4,5 21,3 40,8 66,6 100,0
1992 / VaronesHasta Primario incompleto 1,5 8,0 9,5 1,2 6,8 6,4 14,4 23,9Prim. Comp - Sec. Inc. 0,9 8,6 9,5 1,4 7,8 10,5 19,7 29,1Sec. Com. Ter/Uni. Inc. 0,8 7,5 8,3 2,1 9,1 15,9 27,1 35,4Ter / Uni. Completo 0,1 1,8 1,9 0,8 2,6 6,3 9,7 11,6Total 3,4 25,8 29,2 5,5 26,2 39,1 70,8 100,0
1992 / MujeresHasta Primario incompleto 7,9 10,9 18,7 0,1 2,5 6,6 9,2 27,9Prim. Comp - Sec. Inc. 4,7 6,5 11,3 0,8 4,0 9,5 14,3 25,6Sec. Com. Ter/Uni. Inc. 2,5 7,2 9,7 1,4 4,2 20,2 25,8 35,5Ter / Uni. Completo 0,4 1,5 1,8 0,4 0,9 7,8 9,1 11,0Total 15,5 26,0 41,5 2,7 11,6 44,1 58,5 100,0
2002/ Amos SexosHasta Primario incompleto 3,5 6,3 9,8 0,4 3,3 4,0 7,7 17,5Prim. Comp - Sec. Inc. 6,3 13,5 19,8 2,5 11,4 18,9 32,8 52,5Sec. Com. Ter/Uni. Inc. 0,8 3,1 3,8 1,9 2,8 9,3 14,0 17,8Ter / Uni. Completo 0,3 1,5 1,8 1,3 1,6 7,5 10,4 12,2Total 10,9 24,3 35,2 6,0 19,1 39,7 64,8 100,0
2002 / VaronesHasta Primario incompleto 2,1 5,5 7,5 0,5 4,4 4,0 9,0 16,5Prim. Comp - Sec. Inc. 3,2 14,2 17,4 2,7 13,3 18,5 34,5 51,9Sec. Com. Ter/Uni. Inc. 0,5 3,5 4,0 1,8 3,6 9,1 14,6 18,6Ter / Uni. Completo 0,2 1,8 2,0 1,5 2,3 7,2 11,0 12,9Total 6,0 24,9 30,9 6,5 23,6 39,0 69,1 100,0
2002 / MujeresHasta Primario incompleto 5,6 7,5 13,1 0,1 1,7 4,0 5,8 19,0Prim. Comp - Sec. Inc. 10,7 12,5 23,2 2,1 8,6 19,4 30,2 53,4Sec. Com. Ter/Uni. Inc. 1,1 2,4 3,5 2,0 1,6 9,6 13,1 16,6Ter / Uni. Completo 0,5 1,0 1,5 1,0 0,7 7,9 9,5 11,0Total 18,0 23,4 41,4 5,2 12,5 40,9 58,6 100,0
Sector informal Sector formal
38
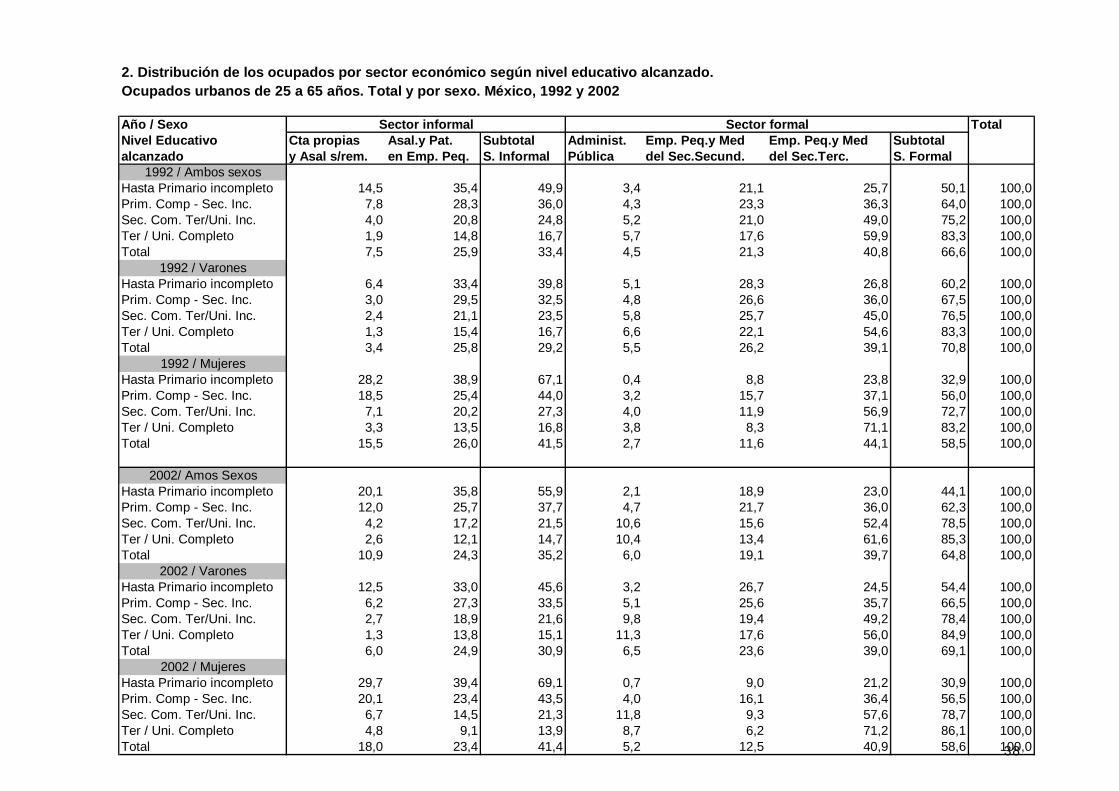
2. Distribución de los ocupados por sector económico según nivel educativo alcanzado.Ocupados urbanos de 25 a 65 años. Total y por sexo. México, 1992 y 2002
Año / Sexo TotalNivel Educativo Cta propias Asal.y Pat. Subtotal Administ. Emp. Peq.y Med Emp. Peq.y Med Subtotalalcanzado y Asal s/rem. en Emp. Peq. S. Informal Pública del Sec.Secund. del Sec.Terc. S. Formal
1992 / Ambos sexosHasta Primario incompleto 14,5 35,4 49,9 3,4 21,1 25,7 50,1 100,0Prim. Comp - Sec. Inc. 7,8 28,3 36,0 4,3 23,3 36,3 64,0 100,0Sec. Com. Ter/Uni. Inc. 4,0 20,8 24,8 5,2 21,0 49,0 75,2 100,0Ter / Uni. Completo 1,9 14,8 16,7 5,7 17,6 59,9 83,3 100,0Total 7,5 25,9 33,4 4,5 21,3 40,8 66,6 100,0
1992 / VaronesHasta Primario incompleto 6,4 33,4 39,8 5,1 28,3 26,8 60,2 100,0Prim. Comp - Sec. Inc. 3,0 29,5 32,5 4,8 26,6 36,0 67,5 100,0Sec. Com. Ter/Uni. Inc. 2,4 21,1 23,5 5,8 25,7 45,0 76,5 100,0Ter / Uni. Completo 1,3 15,4 16,7 6,6 22,1 54,6 83,3 100,0Total 3,4 25,8 29,2 5,5 26,2 39,1 70,8 100,0
1992 / MujeresHasta Primario incompleto 28,2 38,9 67,1 0,4 8,8 23,8 32,9 100,0Prim. Comp - Sec. Inc. 18,5 25,4 44,0 3,2 15,7 37,1 56,0 100,0Sec. Com. Ter/Uni. Inc. 7,1 20,2 27,3 4,0 11,9 56,9 72,7 100,0Ter / Uni. Completo 3,3 13,5 16,8 3,8 8,3 71,1 83,2 100,0Total 15,5 26,0 41,5 2,7 11,6 44,1 58,5 100,0
2002/ Amos SexosHasta Primario incompleto 20,1 35,8 55,9 2,1 18,9 23,0 44,1 100,0Prim. Comp - Sec. Inc. 12,0 25,7 37,7 4,7 21,7 36,0 62,3 100,0Sec. Com. Ter/Uni. Inc. 4,2 17,2 21,5 10,6 15,6 52,4 78,5 100,0Ter / Uni. Completo 2,6 12,1 14,7 10,4 13,4 61,6 85,3 100,0Total 10,9 24,3 35,2 6,0 19,1 39,7 64,8 100,0
2002 / VaronesHasta Primario incompleto 12,5 33,0 45,6 3,2 26,7 24,5 54,4 100,0Prim. Comp - Sec. Inc. 6,2 27,3 33,5 5,1 25,6 35,7 66,5 100,0Sec. Com. Ter/Uni. Inc. 2,7 18,9 21,6 9,8 19,4 49,2 78,4 100,0Ter / Uni. Completo 1,3 13,8 15,1 11,3 17,6 56,0 84,9 100,0Total 6,0 24,9 30,9 6,5 23,6 39,0 69,1 100,0
2002 / MujeresHasta Primario incompleto 29,7 39,4 69,1 0,7 9,0 21,2 30,9 100,0Prim. Comp - Sec. Inc. 20,1 23,4 43,5 4,0 16,1 36,4 56,5 100,0Sec. Com. Ter/Uni. Inc. 6,7 14,5 21,3 11,8 9,3 57,6 78,7 100,0Ter / Uni. Completo 4,8 9,1 13,9 8,7 6,2 71,2 86,1 100,0Total 18,0 23,4 41,4 5,2 12,5 40,9 58,6 100,0
Sector informal Sector formal

39
3. Ingreso horario promedio según sector económico y nivel educativo alcanzado.Ocupados urbanos perceptores de ingresos de 25 a 65 años. Total y por sexo. México, 1992 y 2002
Año / Sexo TotalNivel Educativo Cta propias Asal.y Pat. Subtotal Administ. Emp. Peq.y Med Emp. Peq.y Med Subtotalalcanzado y Asal s/rem. en Emp. Peq. S. Informal Pública del Sec.Secund. del Sec.Terc. S. Formal
1992 / Ambos sexosHasta Primario incompleto 1217,8 3625,9 3044,7 3803,5 4244,9 5832,7 5020,0 4063,3Prim. Comp - Sec. Inc. 1168,6 4679,6 4124,8 6109,6 5006,0 6323,0 5828,3 5238,5Sec. Com. Ter/Uni. Inc. 1368,1 7334,6 6773,7 7260,0 8348,3 9231,1 8837,6 8350,3Ter / Uni. Completo 2083,3 16006,0 15962,6 15542,4 22330,8 15226,8 16716,5 16600,0Total 1226,5 5768,4 5018,4 7467,6 7479,2 8904,5 8342,6 7273,9
1992 / VaronesHasta Primario incompleto 1431,8 3804,3 3454,5 3874,9 4227,0 6178,7 5061,3 4429,5Prim. Comp - Sec. Inc. 1723,6 4786,4 4578,6 6450,4 5222,9 6511,0 6000,0 5545,2Sec. Com. Ter/Uni. Inc. 1791,1 7533,2 7149,9 7473,5 8801,8 9346,6 9016,0 8588,6Ter / Uni. Completo 2083,3 18129,4 18056,6 15763,8 23883,2 17074,2 18730,5 18626,7Total 1580,8 6136,5 5725,9 7613,3 7908,8 9248,0 8622,1 7790,1
1992 / MujeresHasta Primario incompleto 1116,4 3367,8 2589,7 2186,3 4343,9 5142,8 4887,5 3389,4Prim. Comp - Sec. Inc. 952,8 4402,1 3273,0 4934,7 4177,5 5900,5 5353,6 4501,8Sec. Com. Ter/Uni. Inc. 998,1 6918,6 6052,6 6627,4 6439,3 9041,3 8451,8 7849,4Ter / Uni. Completo , 11356,1 11356,1 14457,0 12065,8 12137,2 12221,6 12086,7Total 1050,8 5048,0 3924,6 6866,6 5544,5 8274,0 7645,7 6179,6
2002/ Amos SexosHasta Primario incompleto 17,8 44,9 36,3 52,2 55,7 70,0 62,9 48,4Prim. Comp - Sec. Inc. 22,1 60,6 51,7 63,5 65,2 77,7 72,3 65,1Sec. Com. Ter/Uni. Inc. 20,9 91,4 83,6 106,5 129,7 128,2 125,5 117,2Ter / Uni. Completo 23,7 180,6 171,2 177,5 181,0 190,8 187,6 185,5Total 20,3 67,5 56,4 100,4 82,4 109,9 100,9 86,3
2002 / VaronesHasta Primario incompleto 20,9 47,4 40,4 55,8 56,1 71,2 62,8 52,6Prim. Comp - Sec. Inc. 24,5 64,1 57,6 60,7 68,9 77,5 72,9 67,9Sec. Com. Ter/Uni. Inc. 22,8 92,1 86,9 97,5 139,8 125,9 125,9 117,7Ter / Uni. Completo 18,9 177,3 172,0 184,8 181,0 200,5 194,4 191,2Total 23,0 72,3 64,0 98,0 87,8 110,5 101,5 90,1
2002 / MujeresHasta Primario incompleto 15,7 42,2 32,5 30,3 54,4 68,2 63,3 42,7Prim. Comp - Sec. Inc. 20,4 54,9 43,7 68,6 56,8 78,0 71,3 60,8Sec. Com. Ter/Uni. Inc. 19,3 90,0 77,1 118,5 94,8 131,3 125,0 116,4Ter / Uni. Completo 26,7 188,6 169,3 161,9 181,0 178,3 176,8 176,0Total 18,6 60,0 46,7 104,7 67,8 109,1 99,9 80,3
Sector informal Sector formal
40
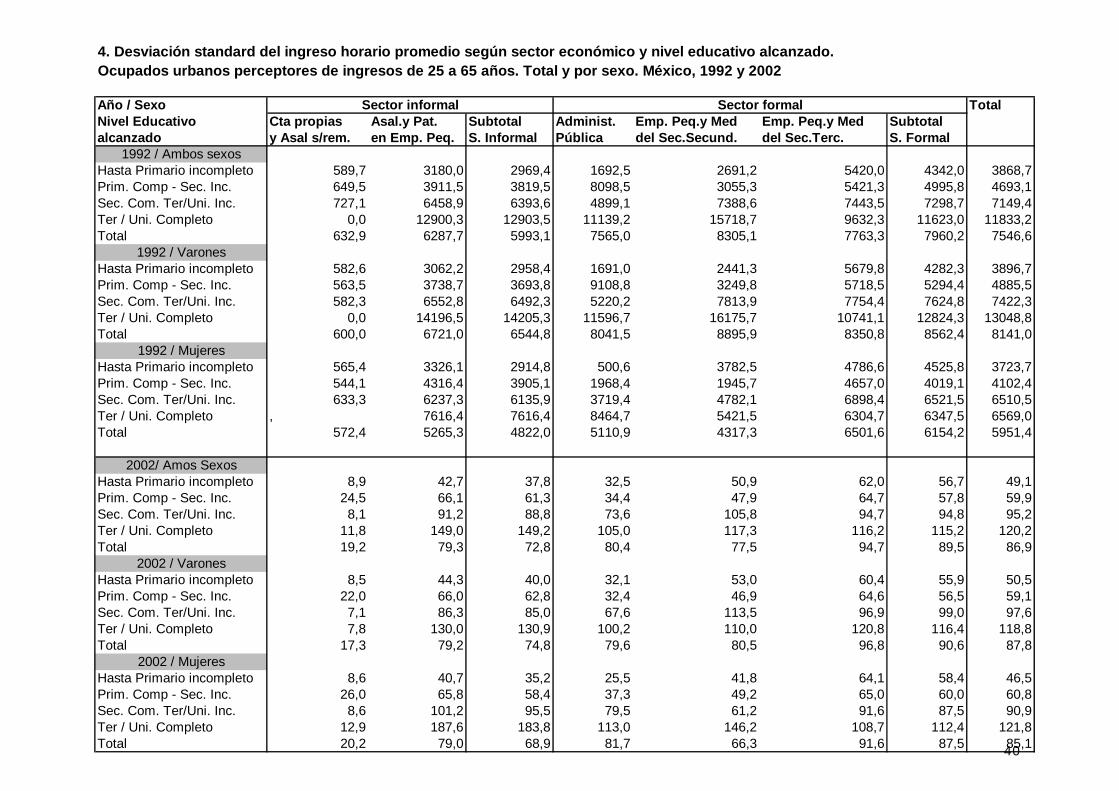
4. Desviación standard del ingreso horario promedio según sector económico y nivel educativo alcanzado.Ocupados urbanos perceptores de ingresos de 25 a 65 años. Total y por sexo. México, 1992 y 2002
Año / Sexo TotalNivel Educativo Cta propias Asal.y Pat. Subtotal Administ. Emp. Peq.y Med Emp. Peq.y Med Subtotalalcanzado y Asal s/rem. en Emp. Peq. S. Informal Pública del Sec.Secund. del Sec.Terc. S. Formal
1992 / Ambos sexosHasta Primario incompleto 589,7 3180,0 2969,4 1692,5 2691,2 5420,0 4342,0 3868,7Prim. Comp - Sec. Inc. 649,5 3911,5 3819,5 8098,5 3055,3 5421,3 4995,8 4693,1Sec. Com. Ter/Uni. Inc. 727,1 6458,9 6393,6 4899,1 7388,6 7443,5 7298,7 7149,4Ter / Uni. Completo 0,0 12900,3 12903,5 11139,2 15718,7 9632,3 11623,0 11833,2Total 632,9 6287,7 5993,1 7565,0 8305,1 7763,3 7960,2 7546,6
1992 / VaronesHasta Primario incompleto 582,6 3062,2 2958,4 1691,0 2441,3 5679,8 4282,3 3896,7Prim. Comp - Sec. Inc. 563,5 3738,7 3693,8 9108,8 3249,8 5718,5 5294,4 4885,5Sec. Com. Ter/Uni. Inc. 582,3 6552,8 6492,3 5220,2 7813,9 7754,4 7624,8 7422,3Ter / Uni. Completo 0,0 14196,5 14205,3 11596,7 16175,7 10741,1 12824,3 13048,8Total 600,0 6721,0 6544,8 8041,5 8895,9 8350,8 8562,4 8141,0
1992 / MujeresHasta Primario incompleto 565,4 3326,1 2914,8 500,6 3782,5 4786,6 4525,8 3723,7Prim. Comp - Sec. Inc. 544,1 4316,4 3905,1 1968,4 1945,7 4657,0 4019,1 4102,4Sec. Com. Ter/Uni. Inc. 633,3 6237,3 6135,9 3719,4 4782,1 6898,4 6521,5 6510,5Ter / Uni. Completo , 7616,4 7616,4 8464,7 5421,5 6304,7 6347,5 6569,0Total 572,4 5265,3 4822,0 5110,9 4317,3 6501,6 6154,2 5951,4
2002/ Amos SexosHasta Primario incompleto 8,9 42,7 37,8 32,5 50,9 62,0 56,7 49,1Prim. Comp - Sec. Inc. 24,5 66,1 61,3 34,4 47,9 64,7 57,8 59,9Sec. Com. Ter/Uni. Inc. 8,1 91,2 88,8 73,6 105,8 94,7 94,8 95,2Ter / Uni. Completo 11,8 149,0 149,2 105,0 117,3 116,2 115,2 120,2Total 19,2 79,3 72,8 80,4 77,5 94,7 89,5 86,9
2002 / VaronesHasta Primario incompleto 8,5 44,3 40,0 32,1 53,0 60,4 55,9 50,5Prim. Comp - Sec. Inc. 22,0 66,0 62,8 32,4 46,9 64,6 56,5 59,1Sec. Com. Ter/Uni. Inc. 7,1 86,3 85,0 67,6 113,5 96,9 99,0 97,6Ter / Uni. Completo 7,8 130,0 130,9 100,2 110,0 120,8 116,4 118,8Total 17,3 79,2 74,8 79,6 80,5 96,8 90,6 87,8
2002 / MujeresHasta Primario incompleto 8,6 40,7 35,2 25,5 41,8 64,1 58,4 46,5Prim. Comp - Sec. Inc. 26,0 65,8 58,4 37,3 49,2 65,0 60,0 60,8Sec. Com. Ter/Uni. Inc. 8,6 101,2 95,5 79,5 61,2 91,6 87,5 90,9Ter / Uni. Completo 12,9 187,6 183,8 113,0 146,2 108,7 112,4 121,8Total 20,2 79,0 68,9 81,7 66,3 91,6 87,5 85,1
Sector informal Sector formal
41
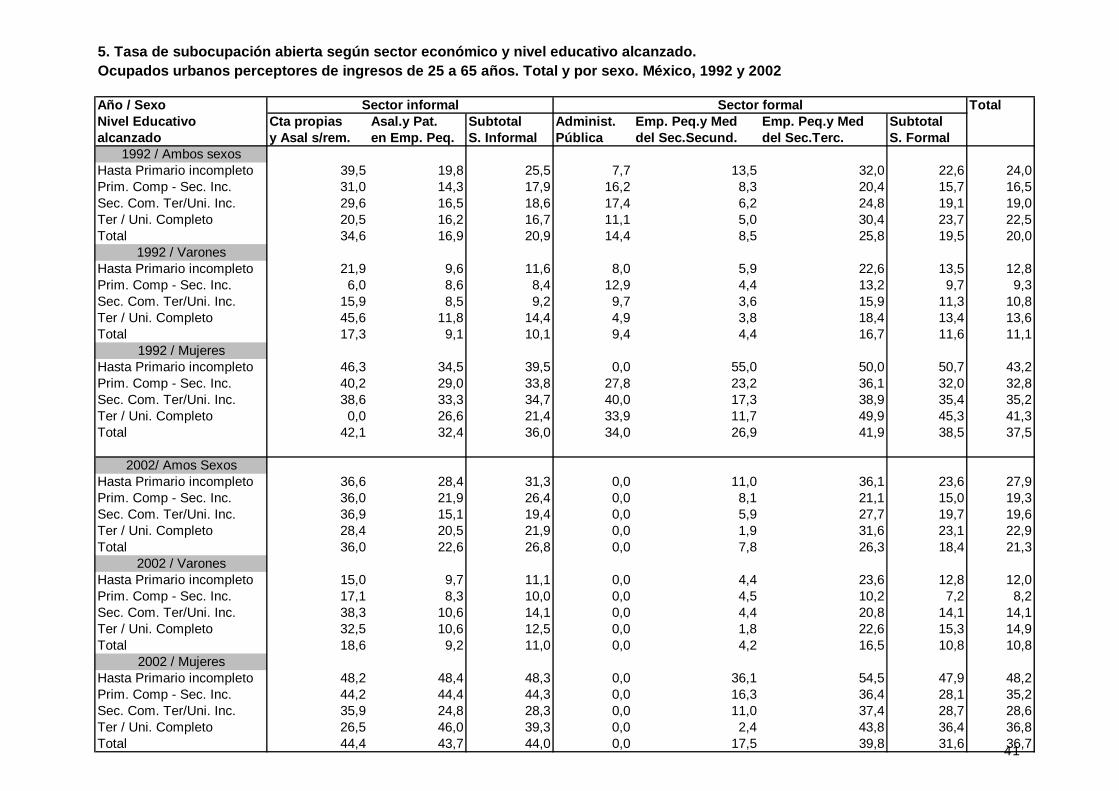
5. Tasa de subocupación abierta según sector económico y nivel educativo alcanzado.Ocupados urbanos perceptores de ingresos de 25 a 65 años. Total y por sexo. México, 1992 y 2002
Año / Sexo TotalNivel Educativo Cta propias Asal.y Pat. Subtotal Administ. Emp. Peq.y Med Emp. Peq.y Med Subtotalalcanzado y Asal s/rem. en Emp. Peq. S. Informal Pública del Sec.Secund. del Sec.Terc. S. Formal
1992 / Ambos sexosHasta Primario incompleto 39,5 19,8 25,5 7,7 13,5 32,0 22,6 24,0Prim. Comp - Sec. Inc. 31,0 14,3 17,9 16,2 8,3 20,4 15,7 16,5Sec. Com. Ter/Uni. Inc. 29,6 16,5 18,6 17,4 6,2 24,8 19,1 19,0Ter / Uni. Completo 20,5 16,2 16,7 11,1 5,0 30,4 23,7 22,5Total 34,6 16,9 20,9 14,4 8,5 25,8 19,5 20,0
1992 / VaronesHasta Primario incompleto 21,9 9,6 11,6 8,0 5,9 22,6 13,5 12,8Prim. Comp - Sec. Inc. 6,0 8,6 8,4 12,9 4,4 13,2 9,7 9,3Sec. Com. Ter/Uni. Inc. 15,9 8,5 9,2 9,7 3,6 15,9 11,3 10,8Ter / Uni. Completo 45,6 11,8 14,4 4,9 3,8 18,4 13,4 13,6Total 17,3 9,1 10,1 9,4 4,4 16,7 11,6 11,1
1992 / MujeresHasta Primario incompleto 46,3 34,5 39,5 0,0 55,0 50,0 50,7 43,2Prim. Comp - Sec. Inc. 40,2 29,0 33,8 27,8 23,2 36,1 32,0 32,8Sec. Com. Ter/Uni. Inc. 38,6 33,3 34,7 40,0 17,3 38,9 35,4 35,2Ter / Uni. Completo 0,0 26,6 21,4 33,9 11,7 49,9 45,3 41,3Total 42,1 32,4 36,0 34,0 26,9 41,9 38,5 37,5
2002/ Amos SexosHasta Primario incompleto 36,6 28,4 31,3 0,0 11,0 36,1 23,6 27,9Prim. Comp - Sec. Inc. 36,0 21,9 26,4 0,0 8,1 21,1 15,0 19,3Sec. Com. Ter/Uni. Inc. 36,9 15,1 19,4 0,0 5,9 27,7 19,7 19,6Ter / Uni. Completo 28,4 20,5 21,9 0,0 1,9 31,6 23,1 22,9Total 36,0 22,6 26,8 0,0 7,8 26,3 18,4 21,3
2002 / VaronesHasta Primario incompleto 15,0 9,7 11,1 0,0 4,4 23,6 12,8 12,0Prim. Comp - Sec. Inc. 17,1 8,3 10,0 0,0 4,5 10,2 7,2 8,2Sec. Com. Ter/Uni. Inc. 38,3 10,6 14,1 0,0 4,4 20,8 14,1 14,1Ter / Uni. Completo 32,5 10,6 12,5 0,0 1,8 22,6 15,3 14,9Total 18,6 9,2 11,0 0,0 4,2 16,5 10,8 10,8
2002 / MujeresHasta Primario incompleto 48,2 48,4 48,3 0,0 36,1 54,5 47,9 48,2Prim. Comp - Sec. Inc. 44,2 44,4 44,3 0,0 16,3 36,4 28,1 35,2Sec. Com. Ter/Uni. Inc. 35,9 24,8 28,3 0,0 11,0 37,4 28,7 28,6Ter / Uni. Completo 26,5 46,0 39,3 0,0 2,4 43,8 36,4 36,8Total 44,4 43,7 44,0 0,0 17,5 39,8 31,6 36,7
Sector informal Sector formal

PARAGUAY 1990-2000
Dirección General de Estadísticas, Encuestas y Censos
IIPE - UNESCO, Sede Regional Buenos Aires - OEI
Julio de 2006
42
43
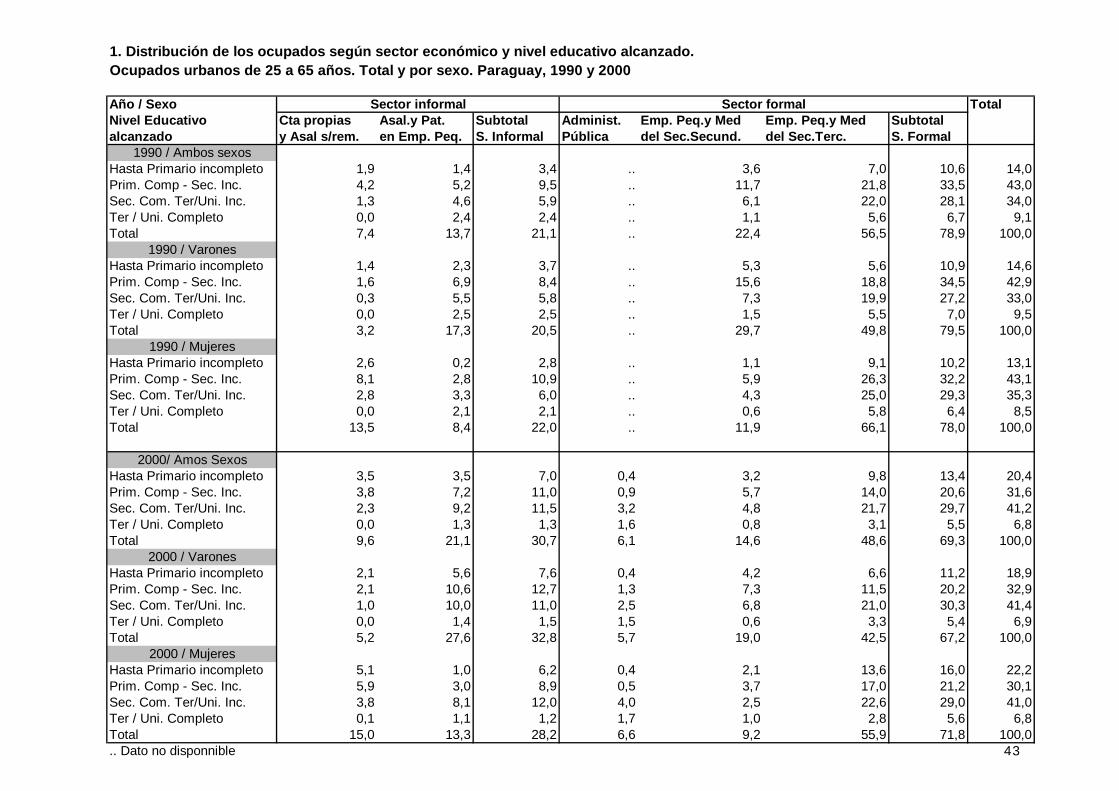
1. Distribución de los ocupados según sector económico y nivel educativo alcanzado.Ocupados urbanos de 25 a 65 años. Total y por sexo. Paraguay, 1990 y 2000
Año / Sexo TotalNivel Educativo Cta propias Asal.y Pat. Subtotal Administ. Emp. Peq.y Med Emp. Peq.y Med Subtotalalcanzado y Asal s/rem. en Emp. Peq. S. Informal Pública del Sec.Secund. del Sec.Terc. S. Formal
1990 / Ambos sexosHasta Primario incompleto 1,9 1,4 3,4 .. 3,6 7,0 10,6 14,0Prim. Comp - Sec. Inc. 4,2 5,2 9,5 .. 11,7 21,8 33,5 43,0Sec. Com. Ter/Uni. Inc. 1,3 4,6 5,9 .. 6,1 22,0 28,1 34,0Ter / Uni. Completo 0,0 2,4 2,4 .. 1,1 5,6 6,7 9,1Total 7,4 13,7 21,1 .. 22,4 56,5 78,9 100,0
1990 / VaronesHasta Primario incompleto 1,4 2,3 3,7 .. 5,3 5,6 10,9 14,6Prim. Comp - Sec. Inc. 1,6 6,9 8,4 .. 15,6 18,8 34,5 42,9Sec. Com. Ter/Uni. Inc. 0,3 5,5 5,8 .. 7,3 19,9 27,2 33,0Ter / Uni. Completo 0,0 2,5 2,5 .. 1,5 5,5 7,0 9,5Total 3,2 17,3 20,5 .. 29,7 49,8 79,5 100,0
1990 / MujeresHasta Primario incompleto 2,6 0,2 2,8 .. 1,1 9,1 10,2 13,1Prim. Comp - Sec. Inc. 8,1 2,8 10,9 .. 5,9 26,3 32,2 43,1Sec. Com. Ter/Uni. Inc. 2,8 3,3 6,0 .. 4,3 25,0 29,3 35,3Ter / Uni. Completo 0,0 2,1 2,1 .. 0,6 5,8 6,4 8,5Total 13,5 8,4 22,0 .. 11,9 66,1 78,0 100,0
2000/ Amos SexosHasta Primario incompleto 3,5 3,5 7,0 0,4 3,2 9,8 13,4 20,4Prim. Comp - Sec. Inc. 3,8 7,2 11,0 0,9 5,7 14,0 20,6 31,6Sec. Com. Ter/Uni. Inc. 2,3 9,2 11,5 3,2 4,8 21,7 29,7 41,2Ter / Uni. Completo 0,0 1,3 1,3 1,6 0,8 3,1 5,5 6,8Total 9,6 21,1 30,7 6,1 14,6 48,6 69,3 100,0
2000 / VaronesHasta Primario incompleto 2,1 5,6 7,6 0,4 4,2 6,6 11,2 18,9Prim. Comp - Sec. Inc. 2,1 10,6 12,7 1,3 7,3 11,5 20,2 32,9Sec. Com. Ter/Uni. Inc. 1,0 10,0 11,0 2,5 6,8 21,0 30,3 41,4Ter / Uni. Completo 0,0 1,4 1,5 1,5 0,6 3,3 5,4 6,9Total 5,2 27,6 32,8 5,7 19,0 42,5 67,2 100,0
2000 / MujeresHasta Primario incompleto 5,1 1,0 6,2 0,4 2,1 13,6 16,0 22,2Prim. Comp - Sec. Inc. 5,9 3,0 8,9 0,5 3,7 17,0 21,2 30,1Sec. Com. Ter/Uni. Inc. 3,8 8,1 12,0 4,0 2,5 22,6 29,0 41,0Ter / Uni. Completo 0,1 1,1 1,2 1,7 1,0 2,8 5,6 6,8Total 15,0 13,3 28,2 6,6 9,2 55,9 71,8 100,0.. Dato no disponnible
Sector informal Sector formal
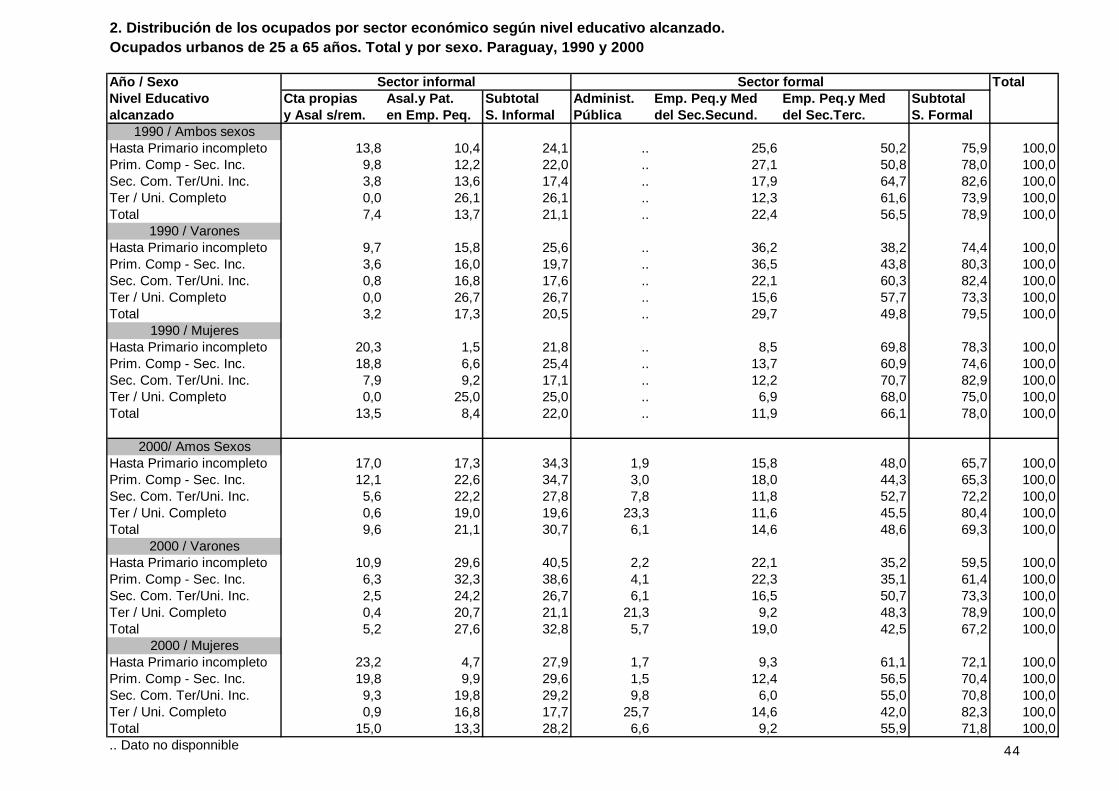
44
2. Distribución de los ocupados por sector económico según nivel educativo alcanzado.Ocupados urbanos de 25 a 65 años. Total y por sexo. Paraguay, 1990 y 2000
Año / Sexo TotalNivel Educativo Cta propias Asal.y Pat. Subtotal Administ. Emp. Peq.y Med Emp. Peq.y Med Subtotalalcanzado y Asal s/rem. en Emp. Peq. S. Informal Pública del Sec.Secund. del Sec.Terc. S. Formal
1990 / Ambos sexosHasta Primario incompleto 13,8 10,4 24,1 .. 25,6 50,2 75,9 100,0Prim. Comp - Sec. Inc. 9,8 12,2 22,0 .. 27,1 50,8 78,0 100,0Sec. Com. Ter/Uni. Inc. 3,8 13,6 17,4 .. 17,9 64,7 82,6 100,0Ter / Uni. Completo 0,0 26,1 26,1 .. 12,3 61,6 73,9 100,0Total 7,4 13,7 21,1 .. 22,4 56,5 78,9 100,0
1990 / VaronesHasta Primario incompleto 9,7 15,8 25,6 .. 36,2 38,2 74,4 100,0Prim. Comp - Sec. Inc. 3,6 16,0 19,7 .. 36,5 43,8 80,3 100,0Sec. Com. Ter/Uni. Inc. 0,8 16,8 17,6 .. 22,1 60,3 82,4 100,0Ter / Uni. Completo 0,0 26,7 26,7 .. 15,6 57,7 73,3 100,0Total 3,2 17,3 20,5 .. 29,7 49,8 79,5 100,0
1990 / MujeresHasta Primario incompleto 20,3 1,5 21,8 .. 8,5 69,8 78,3 100,0Prim. Comp - Sec. Inc. 18,8 6,6 25,4 .. 13,7 60,9 74,6 100,0Sec. Com. Ter/Uni. Inc. 7,9 9,2 17,1 .. 12,2 70,7 82,9 100,0Ter / Uni. Completo 0,0 25,0 25,0 .. 6,9 68,0 75,0 100,0Total 13,5 8,4 22,0 .. 11,9 66,1 78,0 100,0
2000/ Amos SexosHasta Primario incompleto 17,0 17,3 34,3 1,9 15,8 48,0 65,7 100,0Prim. Comp - Sec. Inc. 12,1 22,6 34,7 3,0 18,0 44,3 65,3 100,0Sec. Com. Ter/Uni. Inc. 5,6 22,2 27,8 7,8 11,8 52,7 72,2 100,0Ter / Uni. Completo 0,6 19,0 19,6 23,3 11,6 45,5 80,4 100,0Total 9,6 21,1 30,7 6,1 14,6 48,6 69,3 100,0
2000 / VaronesHasta Primario incompleto 10,9 29,6 40,5 2,2 22,1 35,2 59,5 100,0Prim. Comp - Sec. Inc. 6,3 32,3 38,6 4,1 22,3 35,1 61,4 100,0Sec. Com. Ter/Uni. Inc. 2,5 24,2 26,7 6,1 16,5 50,7 73,3 100,0Ter / Uni. Completo 0,4 20,7 21,1 21,3 9,2 48,3 78,9 100,0Total 5,2 27,6 32,8 5,7 19,0 42,5 67,2 100,0
2000 / MujeresHasta Primario incompleto 23,2 4,7 27,9 1,7 9,3 61,1 72,1 100,0Prim. Comp - Sec. Inc. 19,8 9,9 29,6 1,5 12,4 56,5 70,4 100,0Sec. Com. Ter/Uni. Inc. 9,3 19,8 29,2 9,8 6,0 55,0 70,8 100,0Ter / Uni. Completo 0,9 16,8 17,7 25,7 14,6 42,0 82,3 100,0Total 15,0 13,3 28,2 6,6 9,2 55,9 71,8 100,0.. Dato no disponnible
Sector informal Sector formal
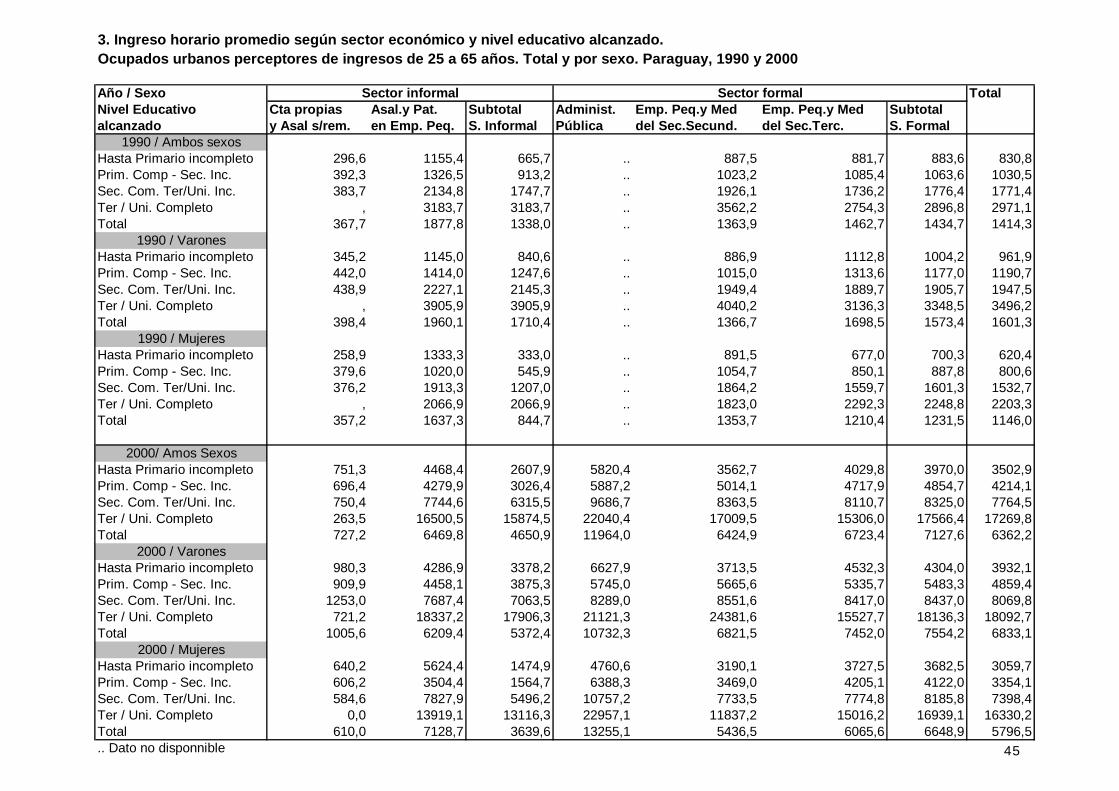
45
3. Ingreso horario promedio según sector económico y nivel educativo alcanzado.Ocupados urbanos perceptores de ingresos de 25 a 65 años. Total y por sexo. Paraguay, 1990 y 2000
Año / Sexo TotalNivel Educativo Cta propias Asal.y Pat. Subtotal Administ. Emp. Peq.y Med Emp. Peq.y Med Subtotalalcanzado y Asal s/rem. en Emp. Peq. S. Informal Pública del Sec.Secund. del Sec.Terc. S. Formal
1990 / Ambos sexosHasta Primario incompleto 296,6 1155,4 665,7 .. 887,5 881,7 883,6 830,8Prim. Comp - Sec. Inc. 392,3 1326,5 913,2 .. 1023,2 1085,4 1063,6 1030,5Sec. Com. Ter/Uni. Inc. 383,7 2134,8 1747,7 .. 1926,1 1736,2 1776,4 1771,4Ter / Uni. Completo , 3183,7 3183,7 .. 3562,2 2754,3 2896,8 2971,1Total 367,7 1877,8 1338,0 .. 1363,9 1462,7 1434,7 1414,3
1990 / VaronesHasta Primario incompleto 345,2 1145,0 840,6 .. 886,9 1112,8 1004,2 961,9Prim. Comp - Sec. Inc. 442,0 1414,0 1247,6 .. 1015,0 1313,6 1177,0 1190,7Sec. Com. Ter/Uni. Inc. 438,9 2227,1 2145,3 .. 1949,4 1889,7 1905,7 1947,5Ter / Uni. Completo , 3905,9 3905,9 .. 4040,2 3136,3 3348,5 3496,2Total 398,4 1960,1 1710,4 .. 1366,7 1698,5 1573,4 1601,3
1990 / MujeresHasta Primario incompleto 258,9 1333,3 333,0 .. 891,5 677,0 700,3 620,4Prim. Comp - Sec. Inc. 379,6 1020,0 545,9 .. 1054,7 850,1 887,8 800,6Sec. Com. Ter/Uni. Inc. 376,2 1913,3 1207,0 .. 1864,2 1559,7 1601,3 1532,7Ter / Uni. Completo , 2066,9 2066,9 .. 1823,0 2292,3 2248,8 2203,3Total 357,2 1637,3 844,7 .. 1353,7 1210,4 1231,5 1146,0
2000/ Amos SexosHasta Primario incompleto 751,3 4468,4 2607,9 5820,4 3562,7 4029,8 3970,0 3502,9Prim. Comp - Sec. Inc. 696,4 4279,9 3026,4 5887,2 5014,1 4717,9 4854,7 4214,1Sec. Com. Ter/Uni. Inc. 750,4 7744,6 6315,5 9686,7 8363,5 8110,7 8325,0 7764,5Ter / Uni. Completo 263,5 16500,5 15874,5 22040,4 17009,5 15306,0 17566,4 17269,8Total 727,2 6469,8 4650,9 11964,0 6424,9 6723,4 7127,6 6362,2
2000 / VaronesHasta Primario incompleto 980,3 4286,9 3378,2 6627,9 3713,5 4532,3 4304,0 3932,1Prim. Comp - Sec. Inc. 909,9 4458,1 3875,3 5745,0 5665,6 5335,7 5483,3 4859,4Sec. Com. Ter/Uni. Inc. 1253,0 7687,4 7063,5 8289,0 8551,6 8417,0 8437,0 8069,8Ter / Uni. Completo 721,2 18337,2 17906,3 21121,3 24381,6 15527,7 18136,3 18092,7Total 1005,6 6209,4 5372,4 10732,3 6821,5 7452,0 7554,2 6833,1
2000 / MujeresHasta Primario incompleto 640,2 5624,4 1474,9 4760,6 3190,1 3727,5 3682,5 3059,7Prim. Comp - Sec. Inc. 606,2 3504,4 1564,7 6388,3 3469,0 4205,1 4122,0 3354,1Sec. Com. Ter/Uni. Inc. 584,6 7827,9 5496,2 10757,2 7733,5 7774,8 8185,8 7398,4Ter / Uni. Completo 0,0 13919,1 13116,3 22957,1 11837,2 15016,2 16939,1 16330,2Total 610,0 7128,7 3639,6 13255,1 5436,5 6065,6 6648,9 5796,5.. Dato no disponnible
Sector informal Sector formal
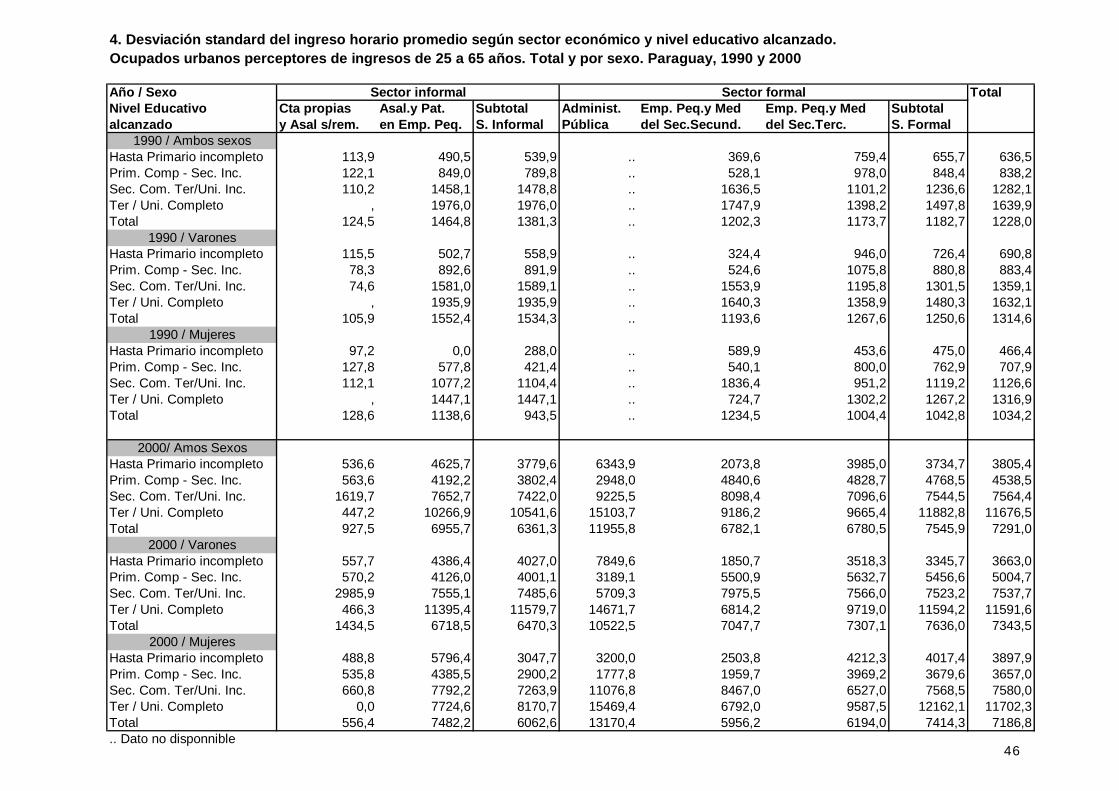
46
4. Desviación standard del ingreso horario promedio según sector económico y nivel educativo alcanzado.Ocupados urbanos perceptores de ingresos de 25 a 65 años. Total y por sexo. Paraguay, 1990 y 2000
Año / Sexo TotalNivel Educativo Cta propias Asal.y Pat. Subtotal Administ. Emp. Peq.y Med Emp. Peq.y Med Subtotalalcanzado y Asal s/rem. en Emp. Peq. S. Informal Pública del Sec.Secund. del Sec.Terc. S. Formal
1990 / Ambos sexosHasta Primario incompleto 113,9 490,5 539,9 .. 369,6 759,4 655,7 636,5Prim. Comp - Sec. Inc. 122,1 849,0 789,8 .. 528,1 978,0 848,4 838,2Sec. Com. Ter/Uni. Inc. 110,2 1458,1 1478,8 .. 1636,5 1101,2 1236,6 1282,1Ter / Uni. Completo , 1976,0 1976,0 .. 1747,9 1398,2 1497,8 1639,9Total 124,5 1464,8 1381,3 .. 1202,3 1173,7 1182,7 1228,0
1990 / VaronesHasta Primario incompleto 115,5 502,7 558,9 .. 324,4 946,0 726,4 690,8Prim. Comp - Sec. Inc. 78,3 892,6 891,9 .. 524,6 1075,8 880,8 883,4Sec. Com. Ter/Uni. Inc. 74,6 1581,0 1589,1 .. 1553,9 1195,8 1301,5 1359,1Ter / Uni. Completo , 1935,9 1935,9 .. 1640,3 1358,9 1480,3 1632,1Total 105,9 1552,4 1534,3 .. 1193,6 1267,6 1250,6 1314,6
1990 / MujeresHasta Primario incompleto 97,2 0,0 288,0 .. 589,9 453,6 475,0 466,4Prim. Comp - Sec. Inc. 127,8 577,8 421,4 .. 540,1 800,0 762,9 707,9Sec. Com. Ter/Uni. Inc. 112,1 1077,2 1104,4 .. 1836,4 951,2 1119,2 1126,6Ter / Uni. Completo , 1447,1 1447,1 .. 724,7 1302,2 1267,2 1316,9Total 128,6 1138,6 943,5 .. 1234,5 1004,4 1042,8 1034,2
2000/ Amos SexosHasta Primario incompleto 536,6 4625,7 3779,6 6343,9 2073,8 3985,0 3734,7 3805,4Prim. Comp - Sec. Inc. 563,6 4192,2 3802,4 2948,0 4840,6 4828,7 4768,5 4538,5Sec. Com. Ter/Uni. Inc. 1619,7 7652,7 7422,0 9225,5 8098,4 7096,6 7544,5 7564,4Ter / Uni. Completo 447,2 10266,9 10541,6 15103,7 9186,2 9665,4 11882,8 11676,5Total 927,5 6955,7 6361,3 11955,8 6782,1 6780,5 7545,9 7291,0
2000 / VaronesHasta Primario incompleto 557,7 4386,4 4027,0 7849,6 1850,7 3518,3 3345,7 3663,0Prim. Comp - Sec. Inc. 570,2 4126,0 4001,1 3189,1 5500,9 5632,7 5456,6 5004,7Sec. Com. Ter/Uni. Inc. 2985,9 7555,1 7485,6 5709,3 7975,5 7566,0 7523,2 7537,7Ter / Uni. Completo 466,3 11395,4 11579,7 14671,7 6814,2 9719,0 11594,2 11591,6Total 1434,5 6718,5 6470,3 10522,5 7047,7 7307,1 7636,0 7343,5
2000 / MujeresHasta Primario incompleto 488,8 5796,4 3047,7 3200,0 2503,8 4212,3 4017,4 3897,9Prim. Comp - Sec. Inc. 535,8 4385,5 2900,2 1777,8 1959,7 3969,2 3679,6 3657,0Sec. Com. Ter/Uni. Inc. 660,8 7792,2 7263,9 11076,8 8467,0 6527,0 7568,5 7580,0Ter / Uni. Completo 0,0 7724,6 8170,7 15469,4 6792,0 9587,5 12162,1 11702,3Total 556,4 7482,2 6062,6 13170,4 5956,2 6194,0 7414,3 7186,8.. Dato no disponnible
Sector informal Sector formal

5. Tasa de subocupación abierta según sector económico y nivel educativo alcanzado.Ocupados urbanos perceptores de ingresos de 25 a 65 años. Total y por sexo. Paraguay, 1990 y 2000
Año / Sexo TotalNivel Educativo Cta propias Asal.y Pat. Subtotal Administ. Emp. Peq.y Med Emp. Peq.y Med Subtotalalcanzado y Asal s/rem. en Emp. Peq. S. Informal Pública del Sec.Secund. del Sec.Terc. S. Formal
1990 / Ambos sexosHasta Primario incompleto 8,0 16,1 11,5 6,3 22,1 16,7 15,5Prim. Comp - Sec. Inc. 17,8 8,8 12,8 9,8 18,7 15,6 15,0Sec. Com. Ter/Uni. Inc. 23,8 13,6 15,8 11,4 31,6 27,2 25,2Ter / Uni. Completo , 16,6 16,6 6,6 38,0 32,8 28,6Total 17,0 12,5 14,1 9,5 26,0 21,3 19,8
1990 / VaronesHasta Primario incompleto 0,0 11,2 6,9 7,2 21,3 14,4 12,5Prim. Comp - Sec. Inc. 0,0 7,5 6,1 2,5 15,5 9,6 8,9Sec. Com. Ter/Uni. Inc. 0,0 4,7 4,5 5,4 19,3 15,6 13,6Ter / Uni. Completo , 10,7 10,7 8,4 39,1 32,6 26,7Total 0,0 7,5 6,3 4,3 20,6 14,5 12,8
1990 / MujeresHasta Primario incompleto 14,2 100,0 20,1 0,0 22,8 20,3 20,3Prim. Comp - Sec. Inc. 22,8 13,2 20,3 38,0 22,1 25,0 23,8Sec. Com. Ter/Uni. Inc. 27,1 35,5 31,6 26,1 45,8 42,9 41,0Ter / Uni. Completo , 26,9 26,9 0,0 36,5 33,2 31,6Total 23,0 27,3 24,6 28,3 32,0 31,5 30,0
2000/ Amos SexosHasta Primario incompleto 15,1 18,2 16,7 35,9 20,4 38,5 34,1 28,1Prim. Comp - Sec. Inc. 14,4 9,6 11,2 33,8 17,4 26,9 24,6 20,0Sec. Com. Ter/Uni. Inc. 18,4 19,0 18,9 36,7 14,9 24,0 23,9 22,5Ter / Uni. Completo 0,0 22,0 21,3 41,0 10,3 32,2 31,6 29,6Total 15,5 15,7 15,7 37,3 16,8 28,2 26,6 23,2
2000 / VaronesHasta Primario incompleto 7,1 13,6 11,9 35,3 7,6 23,9 18,2 15,7Prim. Comp - Sec. Inc. 6,2 8,0 7,7 23,5 7,8 14,2 12,5 10,6Sec. Com. Ter/Uni. Inc. 29,5 13,8 15,3 33,4 7,4 16,5 15,9 15,7Ter / Uni. Completo 0,0 20,0 19,6 38,5 9,1 25,3 26,9 25,4Total 11,2 11,7 11,6 32,5 7,6 17,7 16,1 14,6
2000 / MujeresHasta Primario incompleto 19,0 48,4 23,9 36,8 51,6 47,2 47,6 41,0Prim. Comp - Sec. Inc. 17,8 16,2 17,3 70,0 40,3 37,5 38,7 32,3Sec. Com. Ter/Uni. Inc. 14,7 26,8 23,0 39,2 40,2 32,5 34,0 30,8Ter / Uni. Completo 0,0 25,0 23,8 43,5 11,3 42,2 37,1 34,8Total 17,4 26,0 21,4 42,2 39,7 37,9 38,5 33,7
Sector informal Sector formal
47

¿Qué es el SITEAL? El Sistema de Información de Tendencias Educativas en América Latina (SITEAL) es un programa que desarrollan en forma conjunta el Instituto Internacional de Planeamiento de la Educación - Buenos Aires (IIPE - UNESCO, Sede Regional Buenos Aires) y la Organización de Estados Iberoamericanos para la Educación, la Ciencia y la Cultura (OEI).
La misión del SITEAL es hacer un análisis de tendencias que muestran los problemas de la inequidad en el acceso a la educación, profundizando en el estudio de la relación entre educación y sociedad, indagando el impacto que tienen en el sistema educativo los diferentes escenarios económicos y sociales de la región, y señalando los efectos de la educación en la calidad de vida de las familias y en la dinámica social. Para lograr este objetivo, el Programa se propone: - Analizar tendencias a partir del seguimiento de un conjunto de indicadores
representativos de las principales dimensiones de la cuestión social y educativa. - Captar la complejidad de los diversos escenarios sociales que se van conformando en
la región, destacando la heterogeneidad de contextos en los que debe operar el sistema educativo.
- Identificar nuevos fenómenos sociales y educativos, a partir de una exploración permanente de la información.
- Plantear con fundamento hipótesis de escenarios futuros que orienten la toma de decisiones educativas en el mediano y largo plazo.
La estrategia elegida por el SITEAL para el logro de estos objetivos es la sistematización y la transferencia de información cuantitativa producida por diversos organismos públicos de los países de América Latina, así como del conocimiento elaborado a partir de ella.
Sistema de Información de Tendencias Educativas en América latina http://www.siteal.iipe-oei.org
Pág. 48


