cf1129 service-life assessment of existing precast
TRANSCRIPT
CF1129
Service-Life Assessment of Existing Precast-Concrete Structure Exposed to
Severe Marine Conditions
I. Segura1, S. Cavalaro2, A. de la Fuente3, A. Aguado4, and V. Alegre5
1Ph.D., Juan de la Cierva Postdoctoral Researcher, Department of Construction Engineering, Universitat Politècnica de Catalunya - Barcelona Tech, Barcelona, Spain. Carrer Jordi Girona 1-3, Edifico C1, despacho 202. E-08034 Barcelona. SPAIN. Email: [email protected]. Tel.: +34-93-401-65-30. Fax: +34-93-405-41-35 2Visiting Professor, Department of Construction Engineering, Universitat Politècnica de Catalunya - Barcelona Tech, Barcelona, Spain. [email protected] 3Associate Professor, Department of Construction Engineering, Universitat Politècnica de Catalunya - Barcelona Tech, Barcelona, Spain. [email protected] 4Full Professor, Department of Construction Engineering, Universitat Politècnica de Catalunya - Barcelona Tech, Barcelona, Spain. [email protected] 5Collaborator, Department of Construction Engineering, Universitat Politècnica de Catalunya - Barcelona Tech, Barcelona, Spain. [email protected]
Abstract The overall performance of a concrete structure is considered to be a key issue when determining
its service life. The widespread use of precast concrete and consideration of durability as a
design parameter in most of the international codes have the goal of achieving concrete
structures with better durability. Nevertheless, the early deterioration of concrete is still common
in a large number of concrete structures, which reduces the service life. This paper presents a
case study of an existing precast concrete cooling tower for a thermal power station subjected to
severe marine exposure conditions, which showed symptoms of serious deterioration after
operating for three years. The main goal of this study was to clarify the origin of the accelerated
deterioration of the structure. Wetting–drying cycles were identified as the main cause of the
early deterioration of the structure. Furthermore, estimations on its remaining service life were
made considering the accelerating effect of the wetting–drying cycles. Finally, the variation in
the safety factor of the main structural elements was evaluated.
Keywords: Marine structures; concrete structures; durability; structural analysis; service life
Introduction
The corrosion of steel reinforcement is considered to be the most important issue affecting the
service life of concrete structures. Among the various sources, chloride-induced corrosion is
considered to be the most significant threat to the existing reinforced concrete infrastructure. In
most situations, corrosion is initiated by chloride contamination, often in conjunction with an
inadequate cover thickness or poor quality concrete. Early signs of deteriorations can be found in
many structures. The main reasons for the inadequate performance of concrete structures are
poor workmanship and a lack of knowledge concerning the relevant deterioration mechanisms,
which results in insufficient planning and incorrect estimations of the environmental effects
(Costa and Appleton, 2002).
To produce durable structures, durability must be considered in every step of the project,
i.e., design, execution, and operation. The most recent version of the Model Code (fib, 2010)
discusses the verification of the limit states associated with durability, considering several
degradation phenomena, including chloride-induced corrosion. Although many different codes
and standards have introduced durability as a design parameter, there are many structures
currently in operation that were built with no or insufficient consideration given to durability. In
addition, the use of precast concrete structural elements has increased in recent years. This has
made it possible to achieve a more homogeneous and durable concrete quality, and thus more
durable structures, which reduces the costs and associated construction times. It is generally
assumed that precast elements are more durable than similar elements made from ordinary cast-
in-place concrete. Nevertheless, the suitability of placing a given material under a given
exposure condition should always be considered.
Most of the research done on chloride-induced corrosion involves laboratory studies or
accelerated experiments simulating real conditions. Actually, an increasing number of studies are
being conducted on chloride-induced corrosion in real structures (Costa and Appleton, 2002;
Medeiros et al., 2013; Shekarchi et al., 2011; Papé and Melchers, 2011; Melchers and Li, 2009).
The results of these studies have been very valuable for validating the usefulness of the
developed mathematical models and determining the factors that affect the service life of a real
structure. This paper presents a case study of a precast concrete structure subjected to severe
marine exposure conditions, which exhibited clear signs of reinforcement corrosion after being
in service for three years. The main aim of this study was to clarify the origin of the accelerated
deterioration of the structure, estimate its remaining service life using the models available in
structural codes, and analyze the variation in the safety factor of the structure. Three precast
elements of the structure were analyzed: a canal beam, main girder, and roof girder. These
elements were selected based on their importance in ensuring both the safety and serviceability
of the structure. First, the structural elements are described. Second, the measured chloride
penetration profiles are presented, and the degradation process is analyzed. Lastly, a structural
analysis is conducted to obtain the safety factor for each element considered, thus estimating its
remaining service life.
Research significance
The research significance of this work is derived from the combined analysis of the durability
and structural safety of the structure. The durability analysis provided insights on the origin of
the premature deterioration of the structure. Furthermore, this analysis made it possible to
estimate the effect of wetting–drying cycles on the magnitude of the chloride diffusion
coefficient. The structural analysis allowed safety factors to be obtained for each structural
element, considering the effect of the reinforcement corrosion on the constitutive materials. To
this end, several constitutive equations provided within the scientific literature to simulate the
loss of mechanical properties of the reinforcing were considered in this analysis. Furthermore,
these results were used to estimate the remaining service life of the structure.
All of the above is of vital importance for the managers of the structure, in terms of
decision making related to future investments or payback of the power plant. First, it makes it
possible to identify the causes of the early deterioration and thus allows the selection of adequate
repair strategies. Second, it allows the repair investment to be prioritized, taking into account the
remaining service life of each element. Ultimately, the analysis performed in this paper provides
a valuable example regarding the need to include the durability in the design of a structure under
severe exposure conditions. The study showed that simplified models are valuable tools for
assessing potential problems that might arise during the service life.
Description of case study
The concrete structure considered in this case study was the cooling tower of a thermal power
station plant, made up of precast concrete elements. The structure is located in a region of intense
winds from the northeast and east. The sea is located in the southeast direction and is less than
500 m away from the structure. There are two cooling towers, consisting of several two-story
rooms acting as a heat exchanger; hot water is transferred to the upper part of the cooling tower
by a canal beam, where it falls and is cooled by a counter-current. The complete cooling system
of the power station uses seawater as a coolant. A small amount of sodium hypochlorite is added
to the coolant to prevent the growth of algae and microorganisms.
The structure is a bi-directional lattice composed of precast reinforced concrete girders
and columns. The columns have a maximum height of 19.2 m, with an average separation of 3.3
m, forming a uniform mesh in both directions. The columns have corbels halfway along their
height to support the girders, which form horizontal structures at different levels. There are four
different girder levels: the anti-noise level (-0.7 m), filling level (+7.7 m), distribution level
(+11.6), and roof level (+19.2 m). The roof is composed of a 0.1-m-thick cast-in-site reinforced
concrete slab. The internal and external walls of the plant modules are composed of precast
concrete panels, with a medium length of 7.5 m and various heights depending on the level of the
structure.
The construction of this structure was completed by the end of 2006, and its
commissioning was finished by the middle of 2007. The design service life of the structure was
established to be 25 years. After three years of service, the structure showed symptoms of serious
deterioration both inside and outside the cooling tower. Together with damage to the external
panels, cracks with widths of up to 0.8 mm were found in the columns, canal beam, and bottom
sides of the girders. Furthermore, spalling of the concrete cover due to corrosion of the
reinforcement steel was observed in some elements. The details of some of the damage seen in
this structure are shown in figure 1. The damage was more serious in the rooms with a south–
southeast orientation, where the company offices are located.
In 2009, the structure was investigated and repaired for the first time. At that time, a thorough
study was also conducted by characterizing drilled concrete cores obtained from the external
panels and canal beam. Cores were taken from one side to the other of both elements. Thus, both
the inside and outside concrete surfaces could be analyzed. This study made it possible to obtain
the compressive strength, water permeability, and chloride penetration profiles. The analysis of
the structure and samples did not show any evidence of other deleterious reactions in addition to
the alkali-aggregate reaction.
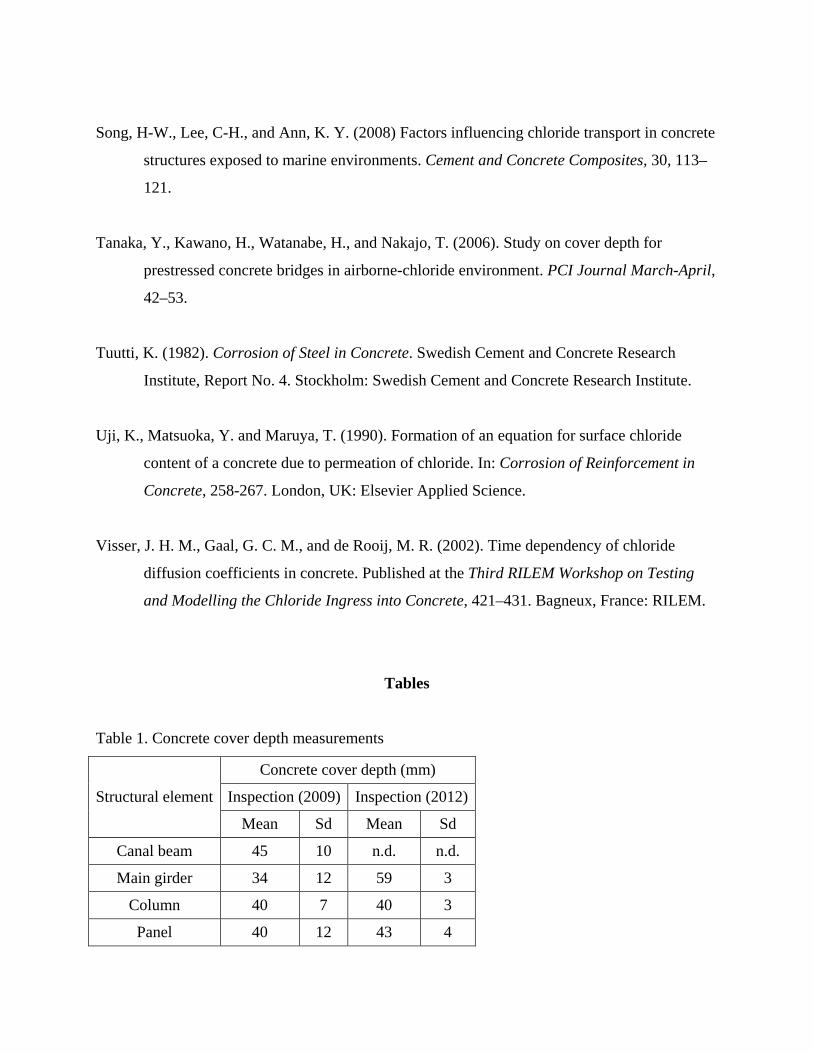
Additionally, the concrete cover was measured in some of the elements using the eddy
current method during investigations of the structure in 2009 and 2012. The measurements of the
concrete cover depth in 2009 were made on cracks identified in each of the elements, although
no search for secondary bars was made. The mean values of both measurements are listed in
table 1, along with the standard deviations. More than 20 observations were made in the 2009
inspection, with six in the 2012 inspection. There was a large variation in the concrete cover
measurements made in 2009. In addition to evidencing variations in the real concrete cover,
these variations could also be related to the measurement procedure.
It is important to note that an extensive characterization of the structure and the extraction of
samples were not possible at most points because of the operation regime of the plant. Therefore,
the information for the analysis was limited to the existing results from previous studies obtained
from tests of a limited number of samples. In situations where it is possible, more information
regarding the characteristic of the concrete and the ongoing corrosion process should be
evaluated to provide a more accurate assessment of the condition of the structure. For instance,
given the nature of the degradation process, it would be advisable to appraise the pH and
chloride content that promotes the corrosion acceleration.
Description of the structural elements
The structural elements considered in the case study are shown in figure 2, and their design
parameters are presented in table 2. The XS3 and XA2 exposure classes were chosen for the
precast concrete elements of the cooling tower, based on the anticipated exposure conditions of
the structure. The precast concrete elements were made using cement type CEM I 52.5N/SR
(sulfate resisting Portland cement) and crushed limestone aggregates. Furthermore, commercial
plasticizer and superplasticizer additives were used. Plain steel reinforcement was used in all the
structural elements. All the concrete components were in agreement with the current Spanish
Code for Structural Concrete (Ministerio de Fomento, 1998).
The canal beams are U-shaped precast reinforced concrete elements with a height of 2700 mm,
width of 1900 mm, and thickness of 200 mm. These elements act as water transport channels,
transferring hot water from the heat exchanger to the upper part of the cooling tower to be
cooled. Three canal beams are located at each side of the cooling tower. They were fabricated
using concrete with a characteristic compressive strength (fck) of 35 N/mm2 and steel type B500S
(fyk = 500 N/mm2 and Es = 200000 N/mm2) for the steel reinforcement. During service
operations, a water level of 500 mm is permanently maintained. The reinforcement elements
considered in the analysis are bars with diameters of 10, 12, 16, and 20 mm, and a minimum
design concrete cover of 40 mm.
The main girders are straight beams with a rectangular cross-section consisting of precast
reinforced concrete. The length of these elements is 7550 mm, with a variable section height
along the length (ranging from 645 mm to 700 mm). The main girders were fabricated using
concrete with fck = 35 N/mm2 and steel type B500S for the steel reinforcement. These elements
are located in the intermediate level of the cooling tower. They are directly in contact with hot
water and are supposed to be constantly wet. The reinforcement elements considered in the
analysis are bars with diameters of 8, 25, and 32 mm, and a design concrete cover of 40 mm.
The roof girders are straight beams with a rectangular cross section composed of
prestressed and reinforced precast concrete. The length of these elements is 8050 mm, with a
change in geometry to support a hoop. The roof girders support the weight of the rotors located
on the roof. These elements were fabricated using concrete with fck = 50 N/mm2; Y1860-S7-type
steel (fyk = 1860 N/mm2 and Es = 190000 N/mm2) was used for the prestressed steel
reinforcement, with the B500S type used for the plain steel reinforcement. The roof girders are
located on the top level of the cooling tower, and are continuously in contact with the water
vapor emitted by the cooling system. The reinforcement elements considered in the analysis are
bars with diameters of 8, 10, and 25 mm for the plain steel reinforcement, and strands of seven
wires with a diameter of 0.6” (15.24 mm) for the prestressing steel reinforcement; the design
concrete cover is 40 mm for the plain steel reinforcement and 80 mm for the prestressed steel
reinforcement.
Characterization of drilled concrete cores
Several core samples were drilled from different structural elements of the cooling tower. The
cooling tower is divided into two different modules, related to the different turbines of the
thermal power station: rooms 1 to 8 belong to module 1, and rooms 9 to 16 belong to module 2.
As mentioned in the description of the case study, drilled concrete cores were obtained from the
external panels and canal beams. Cores were extracted from both elements, extending from the
inside to the outside surfaces. The mean diameter and length of the cores were 99 mm and 187
mm, respectively. This study allowed to obtain the compressive strength (UNE-EN according
with the 12390-3), the water permeability (according with EN 12390-8), and chloride penetration
profiles (following the NT BUILD 443 standard). The results are shown in table 3.
The compressive strength obtained do not evidence shortcomings in the concrete quality
that can explain the differences observed in the deterioration extent between different parts of the
structure, complying with the minimum mechanical requirements established in the Spanish
instruction and in the project specifications. Furthermore, the depth of water penetration
evidences a high quality concrete as defined in the Spanish Instruction, which prescribes that the
material should present maximum and average values below 50 mm and 30 mm, respectively.
Regarding the chloride penetration profiles, details on the location and type of element in each
sample are given in table 4; during the sample coring process, no evidence of macro- and
microcracking was reported. The general procedure employed to obtain the chloride penetration
profiles is described in the NT BUILD 443 standard (Nordic Innovation, 1995). For each core
sample, seven to nine different depth intervals were analyzed. Because all the elements are
exposed to a chloride environment both inside and outside, chloride penetration profiles were
assessed for each side of every sample.
A mathematical analysis of the chloride penetration profiles was performed using the
accepted analytical solution of Fick’s 2nd law derived by Crank (Crank, 1975), and described by
equation (1). This equation defines the variation in the chloride-ion content (expressed in terms
of a percentage over cement weight) as a function of the depth and exposure time. In equation (1)
, Cs is the chloride content at the exposed concrete surface (percentage over cement weight), C0
is the initial chloride content of the concrete (percentage over cement weight), d is the depth
from the concrete surface (m), D is the apparent chloride diffusion coefficient (m2/s), t is the
exposure time (s), and erf is an error function.
( ) 0, ( )4s s
dC x t C C C erfD t
= − − ⋅ ⋅ ⋅ (1)
The adjustment of the experimental data to equation (1) was done considering the following data
for the exposure time and cement content. The exposure time was fixed at 18.5 months, based on
the times for the structure commissioning (July 2007) and extraction of the core samples
(January 2009). The cement content was estimated to be 400 kg/m3 according to the strength of
the precast concrete (fck = 35 N/mm2) and considering the applicable codes. Because the chloride
ion content is usually expressed as a percentage of the concrete weight, the cement content is
needed to obtain the equivalent percentage by cement weight using equation (2), provided in the
Spanish Instruction for Structural Concrete (Ministerio de Fomento, 2008). Furthermore, the
initial chloride content was assumed to be equal to zero.
( ) ( )%, conc%, cem
, 2300,
C x tC x t
Cem⋅
= (2)
The different chloride profiles obtained for each element and side are shown in figure 3, as well
as the experimental data curves fitted to equation (1). Some of the points were identified as
outliers and were not considered in the analysis. The first outliers present in the profiles were the
surface points in most of the samples. The chloride content at the surface of the samples was
usually affected by several phenomena such as carbonation, washing out, and composition
differences (Ann et al., 2009; de Vera et al., 2014). Therefore, the first points of the chloride
profiles were not considered in the analysis, as recommended by the standards (Nordic
Innovation, 1995). Furthermore, some of the samples showed the presence of humps in their
chloride profiles at larger depths. Although the presence of these humps may be related to
several phenomena, the most feasible are the presence of wetting–drying cycles (de Vera et al.,
2014) and the precipitation of Friedel’s salt (Baroghel-Bouny et al., 2009). The humps observed
at larger depths in samples 6SI and 6SE may be related to the presence of wetting–drying cycles,
because this phenomenon allows the chloride content to increase because of water absorption.
For estimation porpoises, these data were considered as outliers and not taken into account in the
analysis. Furthermore, samples from similar structural elements were considered to correspond
to the same type of concrete. The model parameters obtained from the analysis are listed in table
4.
The data shown in figure 3 and listed in table 4 give evidence of different exposure conditions, as
indicated by the value of Cs. Such variations may be related to different environmental
conditions (predominant winds or structure orientation). This situation is clearly seen in sample
3SE, where the influence of the wind direction is obvious. Furthermore, the data in table 4 show
a pattern in the variation of the apparent chloride diffusion coefficient D, distinguishing two
different exposure zones in the cooling tower:
• Exposure zone 1–E1: related to the external parts of all the samples (excluding sample 3SE,
because of its particular exposure condition), as well as the internal parts of the samples from
module 1. The values for this exposure condition are 12 2E1 7.32 10 m /s−= ⋅D and s,E1 2.9%=C .
• Exposure zone 2–E2: related to the internal parts of the samples from module 2. The values for
this exposure condition are 12 2E2 36.1 10 m /s−= ⋅D and s,E2 1.8%=C .
The data obtained from the experimental analysis were compared with the D and Cs values
reported in the literature (see table 5); these data correspond to the structures of ordinary
Portland cement (OPC) concretes with water-to-binder (w/b) ratios ranging from 0.4 to 0.6. The
experimental values obtained for exposure condition E1 were in good agreement with the data
corresponding to aerated conditions in the literature, as well as to values reported in the literature
for precast concrete (Hooton and Titherington, 2004). Furthermore, similar values for D are
provided in the Spanish Code for Structural Concrete for concretes made with CEM I and a w/b
ratio of 0.45 (Ministerio de Fomento, 2008). Moreover, assuming that all the elements were
fabricated under similar conditions and with the same mix ingredients and dosage, the different
values obtained for D must be attributed to differences in the exposure conditions. Three possible
phenomena can explain these variations: leaching effects, temperature variations, and the
presence of wetting–drying cycles.
The presence of a leaching phenomenon for either calcium or hydroxide ions may explain the
differences between exposure zones E1 and E2. Nevertheless, the pH of the water in the cooling
system was close to a value of six, thus excluding an accelerated calcium leaching process.
Considering the leaching of OH- ions, the neutral pH value of the cooling water could result in a
drastic pH reduction of the concrete in the surface layer from 13 to 6, which would lead to a
reduction in the chloride binding capacity. However, because the cooling water is the same
throughout the structure, this leaching phenomenon would be generalized and cannot explain the
differences observed in the value of D.
The temperature could also have a strong effect on the diffusion coefficient. The mean
environmental temperature at the location of the cooling tower is about 17°C. In addition, the
water in the cooling tower is normally between 22.3°C and 36.2°C, with an average service
temperature of 33°C. The influence of the temperature on D can be assessed by adopting the
Arrhenius equation, described by equation (3). In this equation, DT is the diffusion coefficient
(m2/s) for each temperature T (K), D294 K is the diffusion coefficient at the normal temperature
(5.9 × 10⁻¹² m2/s), and Ea is the activation energy for chloride diffusion (40 kJ/mol). Thus, the
effect of the temperature on D can be analyzed for the exposure conditions by applying equation
(3).
294 K1 1exp
294 294a
TETD DR T
= ⋅ ⋅ − − (3)
The service temperature may have a marked effect on the variation of D (see figure 4). However,
an average service temperature higher than 40°C is needed to justify the differences observed
between the exposure zones (E1 and E2). Furthermore, the effect of the temperature must be the
same for all the rooms of the cooling tower, and thus may increase the value of D in all the
elements.

Therefore, the presence of wetting–drying cycles inside the cooling tower will be
considered. Wetting–drying cycles can accelerate chloride penetration because capillary suction
increases the penetration of chloride ions (Hong and Hooton, 1999; Marchand and Samson,
2009). Likewise, the effects increase as long as the wetting–drying cycles exist. The power
station has 12 technical stopovers programmed throughout the year, each one lasting 4 or 5 days.
During these stopovers, the cooling systems are still operating, with the exception of the rooms
orientated to the company offices. The cooling systems in the rooms with a south–southeast
orientation are shut down during these periods in order to prevent the corrosion of the metallic
structures in the offices, thus producing several wetting–drying cycles in these rooms.
Safety assessment of structure
The corrosion of the steel rebar leads to a reduction in the structural response of the affected
concrete sections, mainly due to decreases in the mechanical properties of the steel. These
aspects must be considered when assessing the global safety of the structural elements. In this
research, structural and sectional analyses following the criteria suggested in the Model Code
(fib, 2010) were performed. The main aim was to analyze the mechanical response of the
structural elements considering different levels of material damage. Therefore, the maximum
steel section losses were determined to meet the requirements for the service limit state (SLS)
and ultimate limit state (ULS).
The representative elements considered in the structural analysis were the main and roof
girders previously described. The design bending and shear laws for both girders were obtained
using the SAP2000® software, considering their support conditions and the service loads
gathered in the project. The most unfavorable sections were analyzed, and a global safety
coefficient Fs was derived as a function of time, considering different damage levels due to
reinforcement corrosion. The Fs value was obtained by dividing the ultimate capacity of the
section (ultimate bending moment Mu, for instance) by the design external load (design bending
moment, Md).
Sectional analysis strategy
The sectional analysis was performed using the results of the analysis of the evolutionary
sections (AES) model previously published in the literature (de la Fuente et al., 2012). The AES
model is capable of modeling the non-linear responses of sections made of different materials
(concrete, steel, and fibers). This model was used to determine the ultimate bending moment
capacity (Mu), stress–strain state of the constitutive materials, and damage due to the
reinforcement corrosion in the studied cross sections under service conditions.
In this model, the internal stresses are integrated using a sectional discretization that
considers area elements (dAc) with a constant thickness for the concrete and concentrated area
elements to simulate the steel rebars (see figure 5a). Constitutive equations are defined for each
of the materials to simulate its uniaxial behavior under a defined load state (N, M). The
concrete’s compressive response is modeled using the law proposed in MC-2010 (see figure 5b).
In addition, the uniaxial behavior of the plain steel reinforcing is modeled using a bi-linear
constitutive equation with perfect hardening (see figure 5c), whereas the prestressing steel
reinforcement is modeled using the Ramberg–Osgood law.
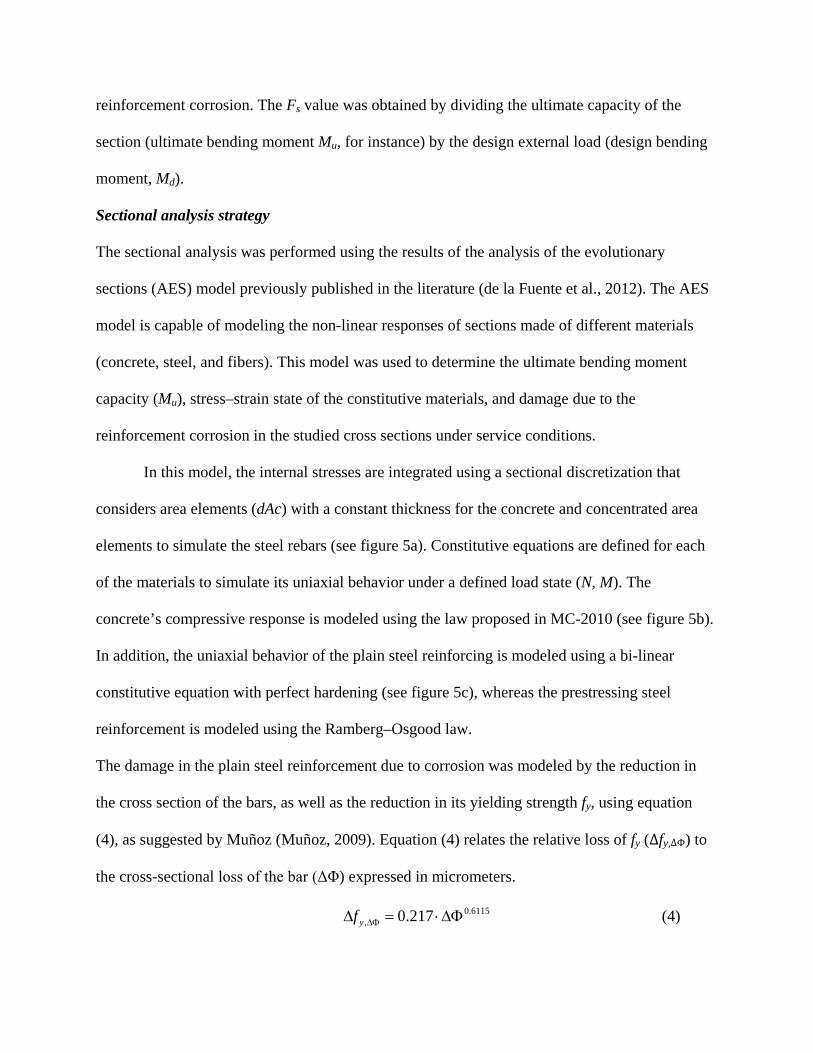
The damage in the plain steel reinforcement due to corrosion was modeled by the reduction in
the cross section of the bars, as well as the reduction in its yielding strength fy, using equation
(4), as suggested by Muñoz (Muñoz, 2009). Equation (4) relates the relative loss of fy (Δfy,ΔΦ) to
the cross-sectional loss of the bar (ΔΦ) expressed in micrometers.
0.6115, 0.217yf ∆Φ∆ = ⋅∆Φ (4)

The model was calibrated using the experimental results published in the literature (Almusallam,
2001; Apostolopoulos et al., 2005; Chen et al., 2005) for the elastic limit reduction in reinforced
steel with different compositions, manufacturing processes, and exposure conditions. The main
hypotheses considered in the modeling of the sectional behavior were as follows:
• There is perfect adherence between the materials.
• Plane sections remain plane after load application.
• Distortion due to shear is neglected.
The assumption of perfect adherence might be debatable because other researchers (Coronelli
and Gambarova, 2004) stated that corrosion could lead to a severe reduction in the bond–slip
strength. Therefore, this reduction would be of major relevance in the case of the cracking SLS,
and the failure of the anchorages (Sarveswaran et al., 2000; Plizzari et al., 1996); in both cases,
the critical limit is the bond resistant mechanism. However, the structural elements that were
analyzed showed the critical performance in terms of bending, which was analyzed at the
sectional level. Hence, both the cross-sectional reduction of the reinforcement and the yielding
strength of the steel were considered to simulate the corrosion process.
The σ–ε state of a concrete cross section subjected to a couple of N and M design loads
could be obtained after discretization by solving the non-linear system resulting from applying
the equilibrium and compatibility conditions defined in equations (5) to (7). This system of
equations is solved using a Newton–Raphson iterative method.
( ) ( ), , ,1
s
c
n
c c c s i s i s iiA
N dA As ε s ε=
= ⋅ + ⋅∑∫∫ (5)
( ) ( ), , , ,1
s
c
n
cdg c c c c s i s i s i s iiA
M Ny y dA y As ε s ε=
+ = ⋅ ⋅ + ⋅ ⋅∑∫∫ (6)
( ) 0c c cy yε ε c= + ⋅ (7)
Finally, the considerations related to the structural safety and reliability, as well as the partial
safety factors of both the loads and materials, were those defined in MC-2010 (fib, 2010).
Reliability analysis
Only the reliability analysis of the main girder is described in detail. The results obtained for the
roof girder are provided to assess the global reliability of the structure.
Description
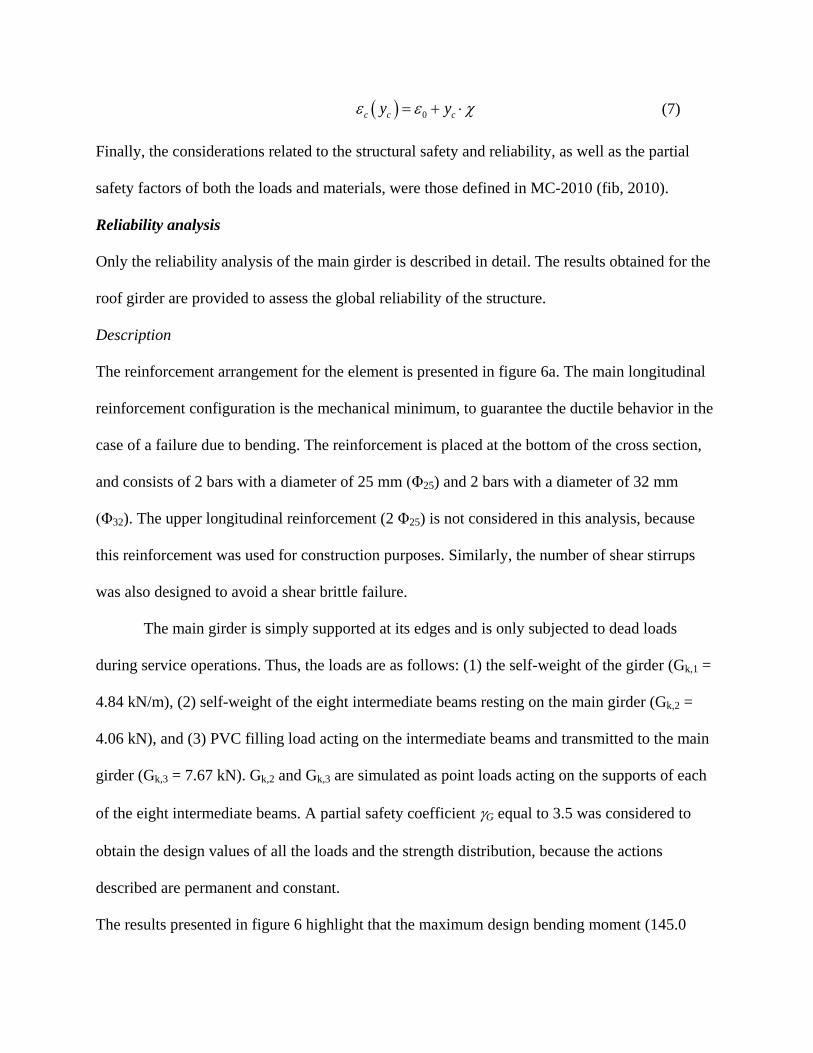
The reinforcement arrangement for the element is presented in figure 6a. The main longitudinal
reinforcement configuration is the mechanical minimum, to guarantee the ductile behavior in the
case of a failure due to bending. The reinforcement is placed at the bottom of the cross section,
and consists of 2 bars with a diameter of 25 mm (Φ25) and 2 bars with a diameter of 32 mm
(Φ32). The upper longitudinal reinforcement (2 Φ25) is not considered in this analysis, because
this reinforcement was used for construction purposes. Similarly, the number of shear stirrups
was also designed to avoid a shear brittle failure.
The main girder is simply supported at its edges and is only subjected to dead loads
during service operations. Thus, the loads are as follows: (1) the self-weight of the girder (Gk,1 =
4.84 kN/m), (2) self-weight of the eight intermediate beams resting on the main girder (Gk,2 =
4.06 kN), and (3) PVC filling load acting on the intermediate beams and transmitted to the main
girder (Gk,3 = 7.67 kN). Gk,2 and Gk,3 are simulated as point loads acting on the supports of each
of the eight intermediate beams. A partial safety coefficient γG equal to 3.5 was considered to
obtain the design values of all the loads and the strength distribution, because the actions
described are permanent and constant.
The results presented in figure 6 highlight that the maximum design bending moment (145.0
kNm) is reduced compared to the dimensions of the cross section and placed reinforcement
(ultimate resistant bending moment Mu = 627.0 kNm for the midspan section).
Response under bending moment
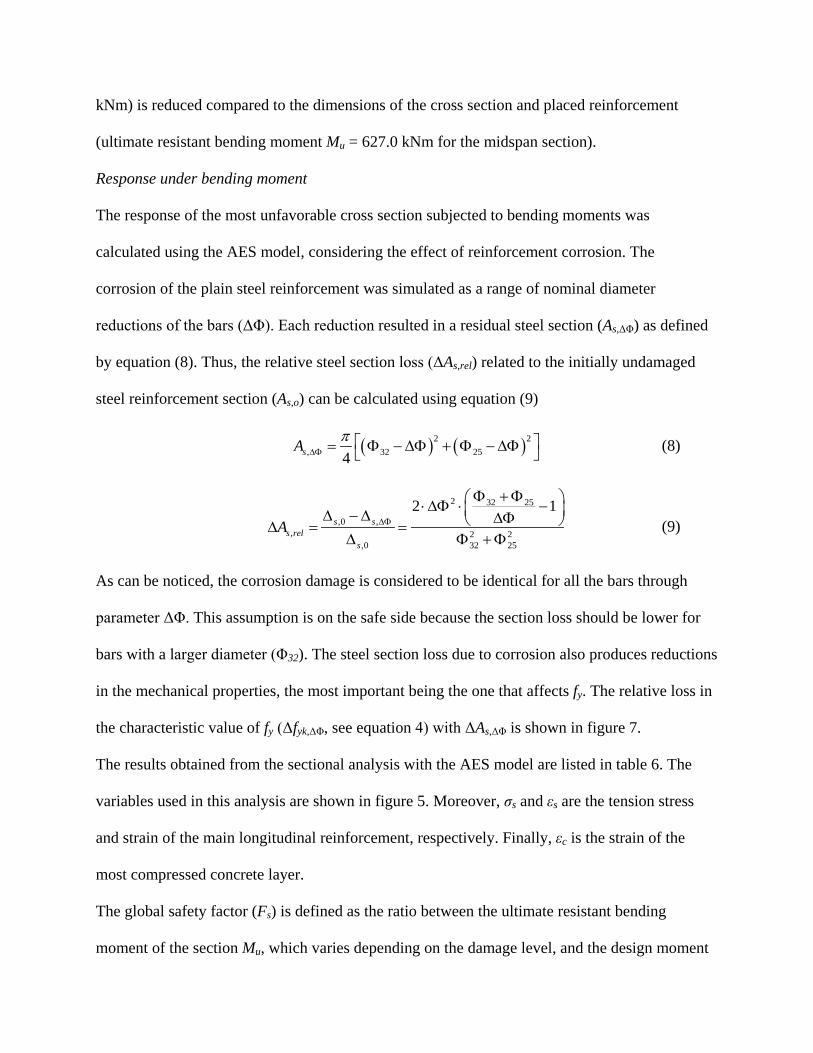
The response of the most unfavorable cross section subjected to bending moments was
calculated using the AES model, considering the effect of reinforcement corrosion. The
corrosion of the plain steel reinforcement was simulated as a range of nominal diameter
reductions of the bars (ΔΦ). Each reduction resulted in a residual steel section (As,ΔΦ) as defined
by equation (8). Thus, the relative steel section loss (ΔAs,rel) related to the initially undamaged
steel reinforcement section (As,o) can be calculated using equation (9)
( ) ( )2 2, 32 254sA π∆Φ
= Φ −∆Φ + Φ −∆Φ (8)
2 32 25
,0 ,, 2 2
,0 32 25
2 1s s
s rels
A ∆Φ
Φ +Φ ⋅∆Φ ⋅ − ∆ −∆ ∆Φ ∆ = =∆ Φ +Φ
(9)
As can be noticed, the corrosion damage is considered to be identical for all the bars through
parameter ΔΦ. This assumption is on the safe side because the section loss should be lower for
bars with a larger diameter (Φ32). The steel section loss due to corrosion also produces reductions
in the mechanical properties, the most important being the one that affects fy. The relative loss in
the characteristic value of fy (Δfyk,ΔΦ, see equation 4) with ΔAs,ΔΦ is shown in figure 7.
The results obtained from the sectional analysis with the AES model are listed in table 6. The
variables used in this analysis are shown in figure 5. Moreover, σs and εs are the tension stress
and strain of the main longitudinal reinforcement, respectively. Finally, εc is the strain of the
most compressed concrete layer.
The global safety factor (Fs) is defined as the ratio between the ultimate resistant bending
moment of the section Mu, which varies depending on the damage level, and the design moment

Md (145.0 kNm for the most unfavorable cross section, see figure 6). It must be emphasized that
Fs is not strictly a safety factor, but a safety margin for the girder when facing normal loads in
the ULS. Values of Fs > 1 indicate an excess amount of reinforcing steel in the structural element
(over-reinforced), and values of Fs < 1 indicate an unsafe situation for the structure (under-
reinforced). The obtained results showed that the main girder was over-reinforced, because the
value of Fs was 4.3 in the case of the full integrity of the cross section. In this hypothetical
situation, the failure of the cross section would be ductile (εs = 5.0 mm/m > εyd = fyk/(γs*Es) =
500/(1.15*200000) = 2.17 mm/m) due to the excessive compression strain of the concrete (εc =
εcu = -3.5 mm/m).
However, corrosion may even affect the failure mode, which can vary from the failure of
the concrete (εc = -3.5‰) for values of ΔAs,ΔΦ smaller than 13.3%, to an excessive steel tension
strain mode (εs = 10.0 mm/m) for larger values of ΔAs,ΔΦ. Values of ΔAs,ΔΦ close to 50% are
needed to reduce Fs to unity (Md = Mu), as can be seen in figure 8. It should be taken into account
that the analysis assumed perfect adherence between the steel and concrete. This hypothesis can
be adopted until certain corrosion levels are achieved. The value of ΔAs,ΔΦ that produces a
relevant loss of adherence between the steel and concrete mainly depends on the confinement. In
the literature, 20% is reported as a common value for ΔAs,ΔΦ to produce a loss of adherence (as a
safe-side consideration). In this analysis, this value was related to an Fs value that was slightly
larger than 2.5.
Response under shear forces
The shear forces expected to appear are minor given the transversal section dimensions (see
figure 6). Assuming, on the safe side, that not all of the longitudinal plain steel reinforcement is
effective, the minimum shear strength capacity of the cross section, Vu2,min, can be calculated

according to equation (10), provided by the Spanish Instruction for Structural Concrete
(Ministerio de Fomento, 2008). In this equation, γc is the partial safety coefficient of concrete for
the ULS (1.5), ξ is a shape factor (1.641), fcv is the effective shear strength of the concrete fcv = fck
= 35 N/mm2, σ’cd is the axial average stress in the gravity center of the cross section (which is
equal to zero because there is neither an external compressive strain nor prestressing steel
reinforcement), bo is the minimum width of the cross section (300 mm), and ds is the nominal
height (487 mm).
3/2 1/2 '2,min 0
0.075 0.15u cv cd sc
V f b dξ sγ
= ⋅ ⋅ + ⋅ ⋅ ⋅
(10)
With these considerations, Vu2,min = 90.8 kN, which is larger than the design effective shear load
(71.7 kN, see figure 6b). Thus, the concrete cross section can resist the design shear load with no
need for additional transversal reinforcement, using the minimum amount required to avoid
fragile shear failure. Such a minimum reinforcement can be calculated using equation (11),
where fctm is the average tensile strength of the concrete, which can be considered to be 0.3·∛fck2
and therefore 3.2 N/mm2 (Ministerio de Fomento, 2008).
,min 07.5ctm
styd
fA bf
= ⋅⋅
(11)
The value of fyd may change as a consequence of the reinforcement section loss, which will
increase Ast,min. Thus, this Ast,min is a function of ΔΦ (Ast,min,ΔΦ), and can be calculated using
equations 11 and 4. Such an evaluation shall be performed by solving the non-linear equation
Ast,ΔΦ ≤ Ast,min,ΔΦ. In this case, Ast,ΔΦ is calculated using equation (12). The results of the calculus
are listed in table 7.
( ) ( )2 2, 6 83stA π∆Φ
= ⋅ Φ −∆Φ + Φ −∆Φ (12)

The value of Ast,min,ΔΦ increases with the damage level of the reinforcement, as seen in figure 9.
A ΔAst,ΔΦ value of 63% is needed to contradict the requirement for ductile failure in the ULS.
Nevertheless, a maximum ΔAst,ΔΦ value of 30% is utilized during the service life of the structure,
because the adherence between the steel and concrete cannot be ensured for larger values.
Similar results were obtained in the reliability analysis of the roof girder. This element is
described in figure 10, along with the design bending moments and shear forces. Because the
roof girder is a prestressed concrete element, no corrosion is allowed, and no damage can be
considered. The calculus is a classic verification problem. The total long-term loss of the
prestressing force is 15% of P0, the value of Mu is 482.2 kNm, and the global safety factor is
2.38. Therefore, for normal loads under the ULS, the roof girder is over-reinforced. Furthermore,
the cracking moment was calculated to determine whether the critical cross section exceeded the
ultimate loosening state. Considering the exposure conditions, the decompression risk was small,
because Mfis ≈ 2Mk.
Durability assessment and remaining service life estimation
The remaining service life of the structure was assessed based on the results of the analysis of the
chloride penetration profiles and safety assessment of the structure. First, the ability of the
structure to reach the design service life was analyzed considering the chloride-ion penetration in
the absence of wetting–drying cycles. Second, the remaining service life of the structure was
estimated considering the effect of wetting–drying cycles. This durability assessment considered
the hypotheses listed below, along with the main parameters listed in table 8.
• Exposure zone E1 is representative of the structure commissioning, except for the prestressed-
reinforced elements. The estimation of D0 was performed using equation (13), which was
proposed by Visser (Visser et al., 2002). D0 is the apparent chloride diffusion coefficient (m2/s)
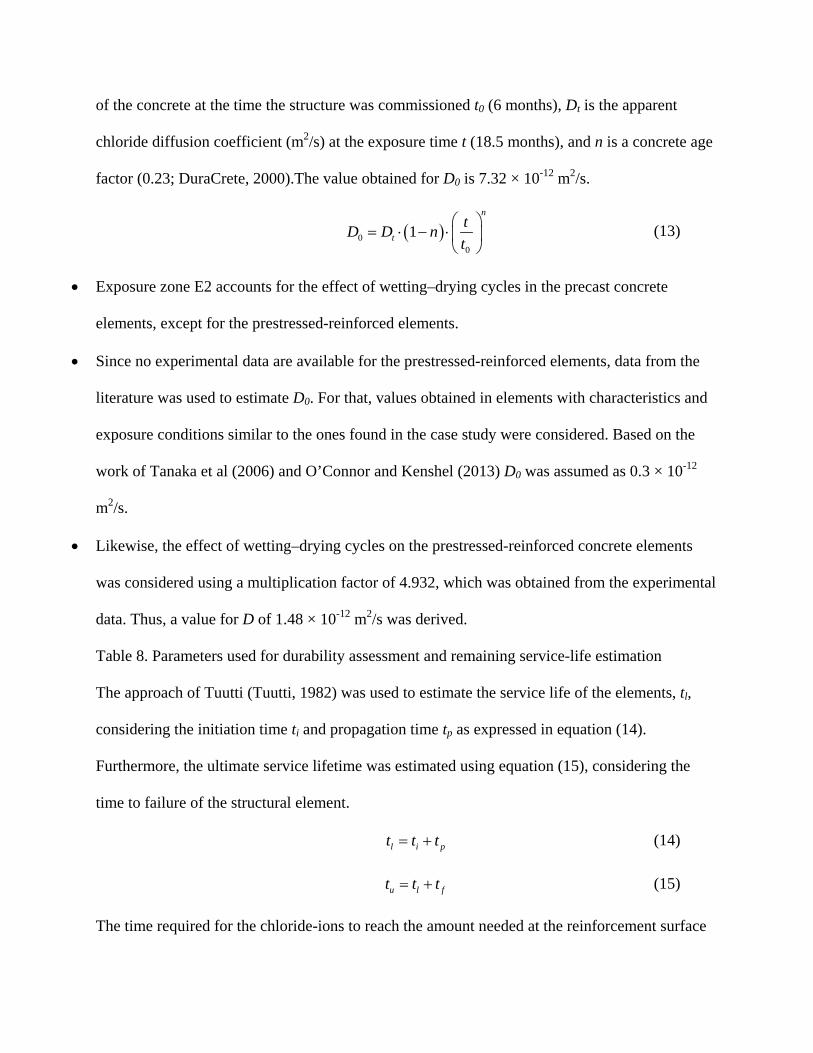
of the concrete at the time the structure was commissioned t0 (6 months), Dt is the apparent
chloride diffusion coefficient (m2/s) at the exposure time t (18.5 months), and n is a concrete age
factor (0.23; DuraCrete, 2000).The value obtained for D0 is 7.32 × 10⁻¹² m2/s.
( )00
1n
ttD D nt
= ⋅ − ⋅
(13)
• Exposure zone E2 accounts for the effect of wetting–drying cycles in the precast concrete
elements, except for the prestressed-reinforced elements.
• Since no experimental data are available for the prestressed-reinforced elements, data from the
literature was used to estimate D0. For that, values obtained in elements with characteristics and
exposure conditions similar to the ones found in the case study were considered. Based on the
work of Tanaka et al (2006) and O’Connor and Kenshel (2013) D0 was assumed as 0.3 × 10⁻¹²
m2/s.
• Likewise, the effect of wetting–drying cycles on the prestressed-reinforced concrete elements
was considered using a multiplication factor of 4.932, which was obtained from the experimental
data. Thus, a value for D of 1.48 × 10⁻¹² m2/s was derived.
Table 8. Parameters used for durability assessment and remaining service-life estimation
The approach of Tuutti (Tuutti, 1982) was used to estimate the service life of the elements, tl,
considering the initiation time ti and propagation time tp as expressed in equation (14).
Furthermore, the ultimate service lifetime was estimated using equation (15), considering the
time to failure of the structural element.
l i pt t t= + (14)
u l ft t t= + (15)
The time required for the chloride-ions to reach the amount needed at the reinforcement surface
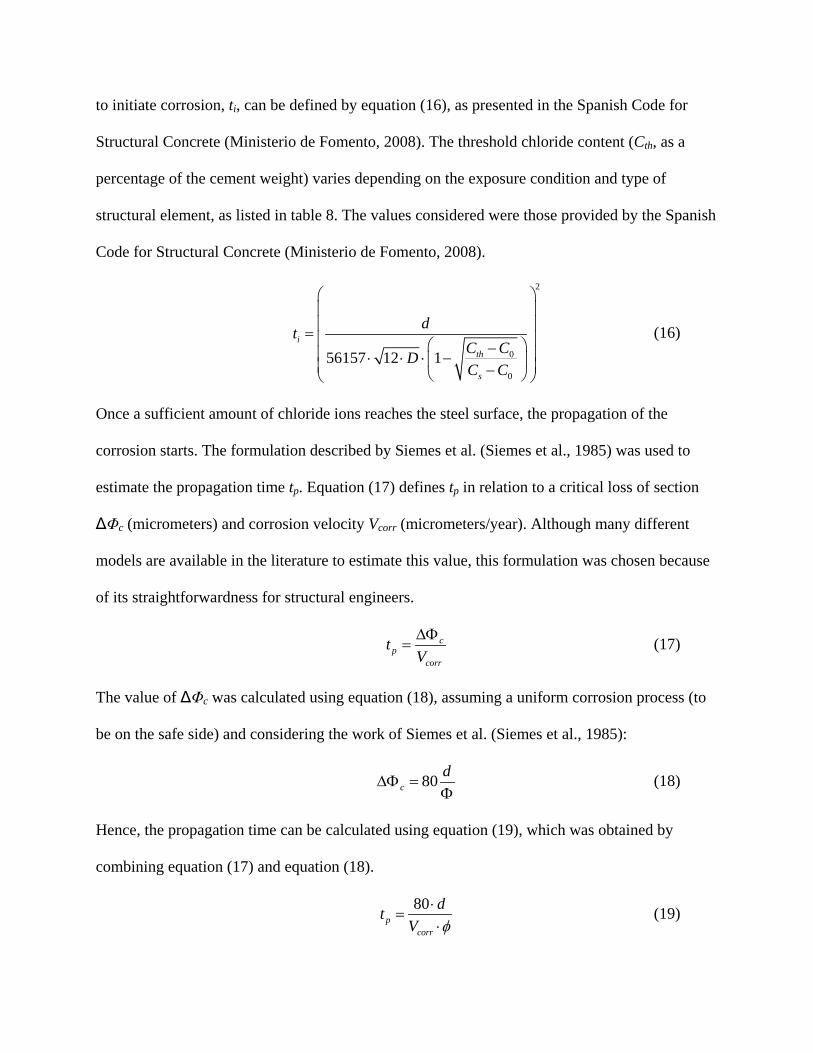
to initiate corrosion, ti, can be defined by equation (16), as presented in the Spanish Code for
Structural Concrete (Ministerio de Fomento, 2008). The threshold chloride content (Cth, as a
percentage of the cement weight) varies depending on the exposure condition and type of
structural element, as listed in table 8. The values considered were those provided by the Spanish
Code for Structural Concrete (Ministerio de Fomento, 2008).
2
0
0
56157 12 1i
th
s
dtC CDC C
= − ⋅ ⋅ ⋅ − −
(16)
Once a sufficient amount of chloride ions reaches the steel surface, the propagation of the
corrosion starts. The formulation described by Siemes et al. (Siemes et al., 1985) was used to
estimate the propagation time tp. Equation (17) defines tp in relation to a critical loss of section
ΔΦc (micrometers) and corrosion velocity Vcorr (micrometers/year). Although many different
models are available in the literature to estimate this value, this formulation was chosen because
of its straightforwardness for structural engineers.
cp
corr
tV∆Φ
= (17)
The value of ΔΦc was calculated using equation (18), assuming a uniform corrosion process (to
be on the safe side) and considering the work of Siemes et al. (Siemes et al., 1985):
80cd
∆Φ =Φ
(18)
Hence, the propagation time can be calculated using equation (19), which was obtained by
combining equation (17) and equation (18).
80p
corr
dtV φ
⋅=
⋅ (19)

The formulation presented in equation (19) requires the measurement or estimation of the steel
corrosion velocity Vcorr. The inspection of the structure in 2009 also involved the measurement of
steel corrosion rates. These measurements were made at the outer side of the external walls using
a GECOR 6 corrosimeter. The measured value of icorr was 4.40 μm/cm2, which indicated a high
corrosion state (Otieno et al., 2012). This measurement was carefully considered in relation to
the following:
• First, corrosion rate measurements are strongly dependent on environmental conditions. Because
the field measurements were made on the external sides of the closure panels, they were not
representative of the structural elements located in the internal part of the structure.
• Second, corrosion rate measurements are punctual measurements and can be affected by
variability and many uncertainties, as pointed out by Otieno et al. (Otieno et al., 2012). They
reported differences between the results of three icorr assessment techniques (gravimetric, 3LP,
and GECOR) larger than an order of magnitude.
• Last, but not least, icorr must be converted to corrosion velocity values using a corrosion model,
which can be either a uniform and constant corrosion rate or localized or non-uniform corrosion.
Because the aim of this work was to determine the real effect of the wetting–drying cycles in the
structure, the estimations were made using the values of Vcorr presented in the literature. We used
the values provided for Vcorr by Sarja and Vesikari (Sarja and Vesikari, 1996). They considered
values varying from 35 µm/year to 122 µm/year based on exposure conditions XS1 and XS3,
respectively. These values are considered in most of the current structural codes, specifically the
Spanish one (Ministerio de Fomento, 2008).
Last, the failure time of the structure was estimated based on the results of the structural
analysis presented in section 4. The failure time tf was calculated using equation (20), where Pmax

(micrometers) is the maximum corrosion depth, and Vcorr,f is the corrosion velocity at cracks.
Pmax can be estimated using equation (21), considering the value of ΔAs,rel provided by the
structural analysis (0.2).
max
2fcorr
PtV
=⋅
(20)
( )
max 3
1 1
2 10sA
Pφ
−
⋅ − − ∆=
⋅ (21)
Once the propagation time has passed, cracks will appear in the concrete element. Therefore, a
Vcorr value of 100 µm/year at cracks was considered (Sarja and Vesikari, 1996). Furthermore, to
verify the suitability of the durability design of the structure, the chloride diffusion coefficient
required to reach the designed service life was estimated using equation (22), which could be
obtained using equation (16) and replacing ti with the service life of the element and subtracting
the propagation period described by equation (19).
2
2
0
0
8012 25 56157 1calc
th
corr s
dDC Cd
V C Cφ
= −⋅
⋅ − ⋅ ⋅ − ⋅ −
(22)
The durability estimations for the canal beam were performed using a value of Cth = 0.6% and a
value of Vcorr = 122 µm/year. The service life estimations considering the structure
commissioning are shown in figure 11a. The results show that this element will never reach the
design service life based on the initial design considerations. The different durability data
obtained from the estimations are listed in table 9. The main factor affecting the service life of
the element is the initiation time ti, which is around 2 years. Such a low value for the initiation
time demonstrates an inadequate durability consideration for this structural element. Because of
the severe exposure conditions, the use of cement with pozzolanic additions should have been
considered, as well as the use of protection systems for the concrete surface.
Furthermore, the service life of the element was halved because of the wetting–drying cycles
(see figure 11b). All the estimations were in very good agreement with the experimental
observations. Furthermore, the estimations made for the canal beam (see table 9) show that if no
maintenance is given to the structural elements, the time to failure will be less than 10 years. To
achieve the designed service life, a concrete with an apparent chloride diffusion coefficient of
about 1·10-13 m2/s should have been used. Such values for D are related to high-performance
concrete.
The durability estimations for the main girder were performed in a manner similar to those for
the canal beam. The results obtained for the structure commissioning are shown in figure 12. The
variations are quite similar to those obtained for the canal beam, evidencing an inadequate
durability consideration during the design of some of the elements of the structure. The data
obtained from the durability estimations of the main girder are listed in table 10.
The durability estimations for the roof girder were slightly different because of the active
reinforcement. The exposure conditions were similar. However, a value of Cth = 0.3% is taken
into account because it is a prestressed element. The propagation stage was only considered for
the passive reinforcement. The service life estimations are shown in figure 13. Even if an
element can reach the design service life, the effect of the wetting–drying cycles should be
considered, because these cause a huge reduction in the service life. The data obtained from the
durability estimations of the main girder are listed in table 11. Furthermore, the passive
reinforcement may be affected by corrosion. The propagation of corrosion may enable the
appearance of cracks in the element, thus accelerating the ingress of chloride ions to the active
reinforcement.
The durability assessment presented above clearly reflects the effect of the wetting-drying cycles
in the service life of the structure. The results presented for all the elements studied have shown
that the wetting-drying cycles reduce the estimated service life since they accelerate the chloride
penetration, diminishing mainly the initiation period. The wetting-drying cycles mainly affect to
the initiation period, since allow the entrance of a larger amount of chlorides by water
absorption. The service life of all the elements is reduced, the by a factor related with the
depending on the type of element. For instance, the reduction in the precast reinforced element
varies from a factor of 2 to 1.34, depending on the type of steel bar considered. This situation is
more dramatic for the prestressed precast reinforced elements, which present presenting a
reduction factor in their service life around 4.7.
Concluding remarks
The analysis of the degradation of the structure showed a preferential orientation in the
degradation of the elements. The damages were higher in the part of the structure with a south–
southeast orientation, where the company offices are located. The operating conditions in the
south–southeast part of the cooling tower were different, favoring the appearance of wetting–
drying cycles. The chloride diffusion coefficients obtained from drilled core samples extracted at
these locations were three times larger than the ones obtained at other locations. These results
showed the marked effect of wetting–drying cycles on the chloride ion penetration, justifying the
accelerated degradation phenomena observed in the structure.
The results obtained highlight that a consideration of the durability is mandatory for
elements subjected to severe exposure conditions. As shown here, the use of simplified models
could contribute to the early detection of problems and to a better design, despite the
assumptions made in the simulation of the degradation process.
The structural safety assessments for the main structural elements–the main girder and
roof girder–showed that these elements are over-reinforced. The global safety coefficients
obtained for the loads considered were 2.55 and 2.38, respectively. The results of the analyses
showed that the corrosion of the passive reinforcement was related to huge reductions in the
global safety parameter Fs. The structural study fixed the maximum loss of a reinforcement
section at 20%, to avoid a significant reduction in the global safety coefficient.
The service life was estimated based on the results of both the structural analysis and
chloride ion penetration analysis. The results of our study showed that most of the structural
elements would not have reached the design service life of 25 years. Furthermore, the presence
of wetting–drying cycles worsens this situation. The ultimate service life of the elements is 6–10
years for the precast reinforced concrete elements and around 20 years for the passive
reinforcement of the prestressed elements. These results give evidence of an inadequate
durability strategy because the precast concrete elements were not able to withstand the
prevailing exposure conditions.
Acknowledgements
The authors wish to thank the company that owns the thermal power station for providing access
to the installations and all the information. Dr. I. Segura is supported by the postdoctoral Juan de
la Cierva programme of the Spanish Ministry of Economy and Competitiveness.
References
AENOR–Spanish Association for Normalization (2009) UNE-EN 12390-8:2009 Testing
hardened concrete–Part 8: Depth of penetration of water under pressure. AENOR,
Madrid. Spain.
Akgüll, F., and Frangopol, D. M. (2004) Lifetime performance analysis of existing prestressed
concrete bridge superstructures. Journal of Structural Engineering, 130, 1889–1903.
Almusallam, A. A. (2001) Effect of degree of corrosion on the properties of reinforcing steel
bars. Construction and Building Materials, 15 (8), 361–368.
Ann, K. Y., Ahn, J. H., and Ryou, J. S. (2009). The importance of chloride content at the
concrete surface in assessing the time to corrosion of steel in concrete structures.
Construction and Building Materials, 23 (1), 239–245.
Apostolopoulos, C. A., Papalopoulos, M. P., and Pantelakis, S. P. (2005) Tensile behaviour of
corroded reinforcing steel bars BSt 500S. Construction and Building Materials, 20 (9),
782–789.
Baroghel-Bouny, V., Nguyen, T. Q., and Danglab, P. (2009) Assessment and prediction of RC
structure service life by means of durability indicators and physical/chemical models.
Cement and Concrete Composites, 31, 522–534.
Chen, Y. Y., Tzeng, H. J., Wei, L. I., and Shih, H. C. (2005). Mechanical properties and
corrosion resistance of low-alloy steels in atmospheric conditions containing chloride.
Materials Science and Engineering, 398 (1-2), 47–59.
Coronelli, D., and Gambarova, P. (2004). Structural assessment of corroded reinforced concrete
beams: Modelling guidelines. Journal of Structural Engineering, 130 (8), 1214–1224.
Costa, A., and Appleton, J. (2002) Case studies of concrete deterioration in a marine
environment in Portugal. Cement and Concrete Composites, 24 (1), 169–179.
Crank, J. (1975). The Mathematics of Diffusion. Oxford: Clarendon-Press
de la Fuente, A., Aguado, A., Molins, C., and Armengou, J. (2012). Numerical model for the
analysis up to failure of precast concrete sections. Computers and Structures, 106–107,
105–114.
de Vera, G., Climent, M. A., Viqueira, E., Antón, C., and López, M. P. (2014) Chloride
penetration prediction in concrete through an empirical model based on constant flux
diffusion. Journal of Materials in Civil Engineering, 10.1061/(ASCE)MT.1943-
5533.0001173, 04014231.
DuraCrete–Final Technical Report. (2000). General Guidelines for Durability Design and
Redesign. The European Union–Brite Euram III.
Funahashi, M. (1990) Predicting corrosion free service life of a concrete structure in a chloride
environment. ACI Materials Journal, 87, 581–587.
Hong, K., and Hooton, R. D. (1999). Effects of cyclic chloride exposure on penetration of
concrete cover. Cement and Concrete Research, 29, 1379–1386.
Hooton, R. D., and Titherington, M. P. (2004). Chloride resistance of high-performance
concretes subjected to accelerated curing. Cement and Concrete Research, 34 (9), 1561–
1567.
International Federation for Structural Concrete–fib (2010). Model Code 2010. Lausanne:
International Federation for Structural Concrete. 2010.
Kudoh, K., Hirotani, A., Moriwake, A., and Yasuda, M. (1991) Study on durability of a repaired
concrete structure in Tokyo bay. In: Evaluation and rehabilitation of concrete structures
and innovations in design. ACI 128. 1293–1307. Hong Kong: ACI.
Liam, K. C., Roy, S. K., and Northwood, D. O. (1992) Chloride ingress measurements and
corrosion potential mapping study of a 24-year-old reinforced concrete jetty structure in a
tropical marine environment. Magazine of Concrete Research, 44, 205–215.
Marchand, J., and Samson, E. (2009). Predicting the service-life of concrete structures–
Limitations of simplified models. Cement and Concrete Composites, 31, 515–521.
Medeiros, M. H. F., Gobbi, A., Réus, G. C., and Helene P. (2013) Reinforced concrete in marine
environment: Effect of wetting and drying cycles, height and positioning in relation to the
seashore. Construction and Building Materials, 44, 452–457.
Melchers, R. E., and Li, C. Q. (2009). Reinforcement corrosion initiation and activation times in
concrete structures exposed to severe marine environments. Cement and Concrete
Research, 39 (11), 1068–1076.
Ministerio de Fomento. (1998) Spanish Code for Structural Concrete–EHE-98. Ministerio de
Fomento, Madrid. Spain (in Spanish).
Ministerio de Fomento. (2008) Spanish Code for Structural Concrete–EHE-08. Ministerio de
Fomento, Madrid. Spain (in Spanish).
Morinaga, S. (1992) Life prediction of reinforced concrete structure in hot and salt-laden
environments. In: Concrete in Hot Climates. 155-164. E&FN SPON.
Muñoz, A. (2009). Behavior of hyperstatic reinforced concrete beams corroded and repaired with
mortar. Loss of mechanical properties in the steel reinforcement and cracking of concrete
cover due to the corrosion process. PhD Thesis. Defended at the School of Civil
Engineering of Madrid. Madrid, Spain (in Spanish).
Nordic Innovation (1995) Concrete, hardened: Accelerated chloride penetration (NT BUILD
443). Oslo: Nordic Innovation.
O’Connor, A. J., and Kenshel, O. (2013) Experimental evaluation of the scale of fluctuation for
spatial variability modeling of chloride-induced reinforced concrete corrosion. Journal of
Bridge Engineering, 18, 3–14.
Otieno, M., Beushausen, H., and Alexander, M. (2012) Prediction of corrosion rate in reinforced
concrete structures–a critical review and preliminary results. Materials and Corrosion,
63, 777–790.
Papé, T. M., and Melchers, R. E. (2011) The effects of corrosion on 45-year-old pre-stressed
concrete bridge beams. Structure and Infrastructure Engineering, 7 (1–2), 101–108.
Peterman R. J., Ramirez J. A., and Poston, R. W. (1999) Durability assessment of bridges with
full-span prestressed concrete form panels. ACI Materials Journal, 96, 11–19.
Plizzari, G. A., Marchina, E., and Giuriani, E. (1996). Experimental study of splitting and
flexural cracks in an R/C beam with overlapped splices. Materials and Structures, 29,
19–27.
Sarja, A., and Vesikari, E. (1996). Durability models. pp 69 in Durability Design of Concrete
Structures–RILEM report 14. London: E & F Spon.
Sarveswaran, V., Roberts, M. B., and Ward, J. A. (2000). Reliability assessment of deteriorating
reinforced concrete beams. Proceedings of the Institution of Civil Engineers-Structures
and Buildings, 140 (3), 239–247.
Shekarchi, M., Moradi-Marani, F., and Pargar, F. (2011). Corrosion damage of a reinforced
concrete jetty structure in the Persian Gulf: A case study. Structure and Infrastructure
Engineering, 7 (9), 701–713.
Siemes, A. J. M., Vrouwenvelder, A. C. W. M., and van den Beukel, A. (1985). Durability of
buildings: A reliability analysis. Heron 30 (3).
Song, H-W., Lee, C-H., and Ann, K. Y. (2008) Factors influencing chloride transport in concrete
structures exposed to marine environments. Cement and Concrete Composites, 30, 113–
121.
Tanaka, Y., Kawano, H., Watanabe, H., and Nakajo, T. (2006). Study on cover depth for
prestressed concrete bridges in airborne-chloride environment. PCI Journal March-April,
42–53.
Tuutti, K. (1982). Corrosion of Steel in Concrete. Swedish Cement and Concrete Research
Institute, Report No. 4. Stockholm: Swedish Cement and Concrete Research Institute.
Uji, K., Matsuoka, Y. and Maruya, T. (1990). Formation of an equation for surface chloride
content of a concrete due to permeation of chloride. In: Corrosion of Reinforcement in
Concrete, 258-267. London, UK: Elsevier Applied Science.
Visser, J. H. M., Gaal, G. C. M., and de Rooij, M. R. (2002). Time dependency of chloride
diffusion coefficients in concrete. Published at the Third RILEM Workshop on Testing
and Modelling the Chloride Ingress into Concrete, 421–431. Bagneux, France: RILEM.
Tables
Table 1. Concrete cover depth measurements
Structural element
Concrete cover depth (mm)
Inspection (2009) Inspection (2012)
Mean Sd Mean Sd
Canal beam 45 10 n.d. n.d.
Main girder 34 12 59 3
Column 40 7 40 3
Panel 40 12 43 4
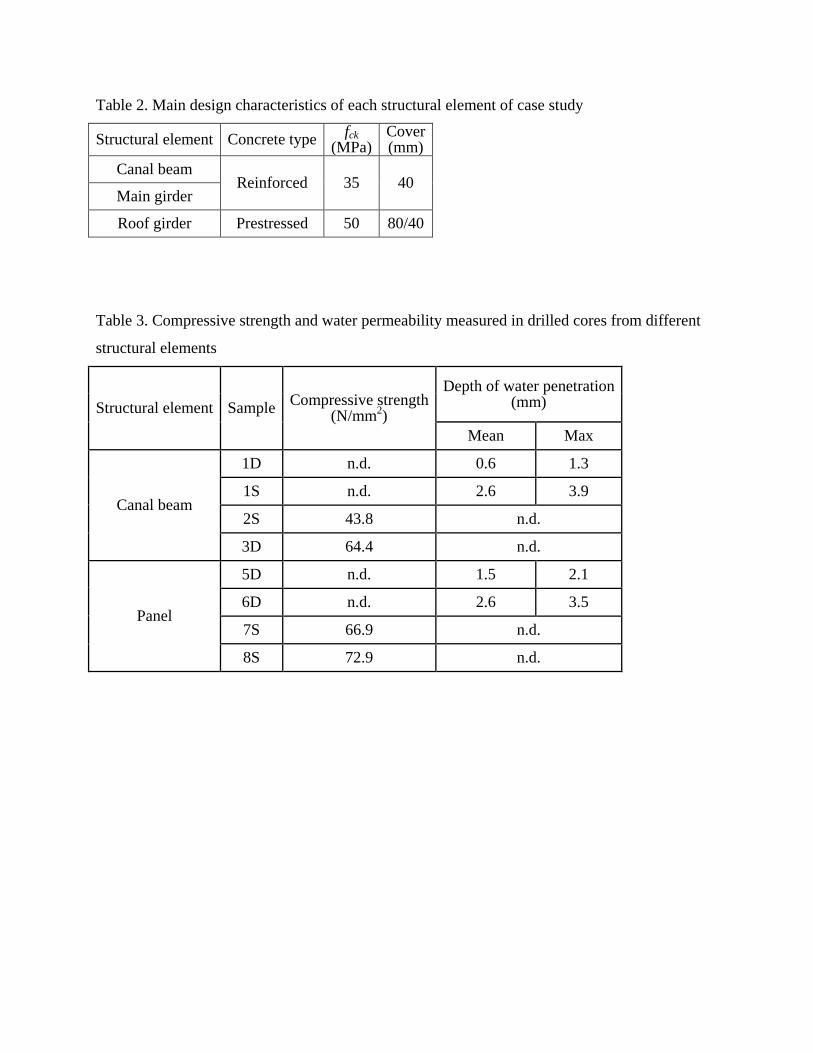
Table 2. Main design characteristics of each structural element of case study
Structural element Concrete type fck (MPa)
Cover (mm)
Canal beam Reinforced 35 40
Main girder
Roof girder Prestressed 50 80/40
Table 3. Compressive strength and water permeability measured in drilled cores from different
structural elements
Structural element Sample Compressive strength (N/mm2)
Depth of water penetration (mm)
Mean Max
Canal beam
1D n.d. 0.6 1.3
1S n.d. 2.6 3.9
2S 43.8 n.d.
3D 64.4 n.d.
Panel
5D n.d. 1.5 2.1
6D n.d. 2.6 3.5
7S 66.9 n.d.
8S 72.9 n.d.
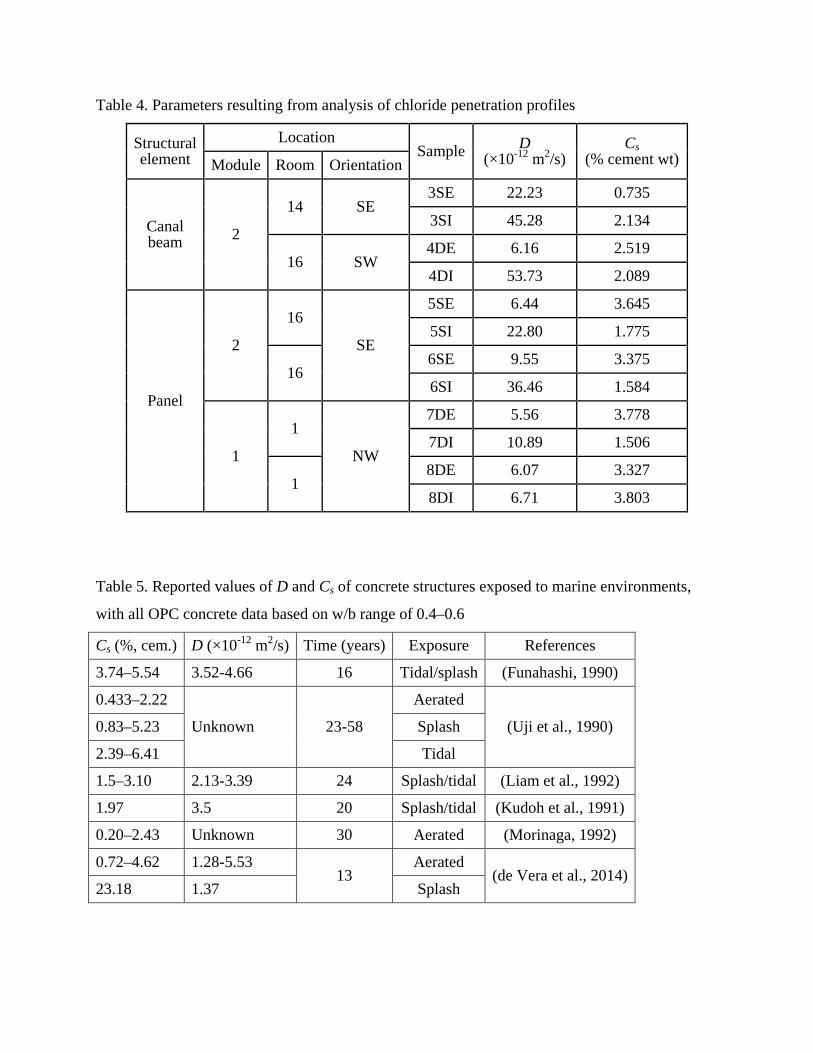
Table 4. Parameters resulting from analysis of chloride penetration profiles
Structural element
Location Sample D
(×10-12 m2/s) Cs
(% cement wt) Module Room Orientation
Canal beam 2
14 SE 3SE 22.23 0.735
3SI 45.28 2.134
16 SW 4DE 6.16 2.519
4DI 53.73 2.089
Panel
2
16
SE
5SE 6.44 3.645
5SI 22.80 1.775
16 6SE 9.55 3.375
6SI 36.46 1.584
1
1
NW
7DE 5.56 3.778
7DI 10.89 1.506
1 8DE 6.07 3.327
8DI 6.71 3.803
Table 5. Reported values of D and Cs of concrete structures exposed to marine environments,
with all OPC concrete data based on w/b range of 0.4–0.6
Cs (%, cem.) D (×10-12 m2/s) Time (years) Exposure References
3.74–5.54 3.52-4.66 16 Tidal/splash (Funahashi, 1990)
0.433–2.22
Unknown 23-58
Aerated
(Uji et al., 1990) 0.83–5.23 Splash
2.39–6.41 Tidal
1.5–3.10 2.13-3.39 24 Splash/tidal (Liam et al., 1992)
1.97 3.5 20 Splash/tidal (Kudoh et al., 1991)
0.20–2.43 Unknown 30 Aerated (Morinaga, 1992)
0.72–4.62 1.28-5.53 13
Aerated (de Vera et al., 2014)
23.18 1.37 Splash
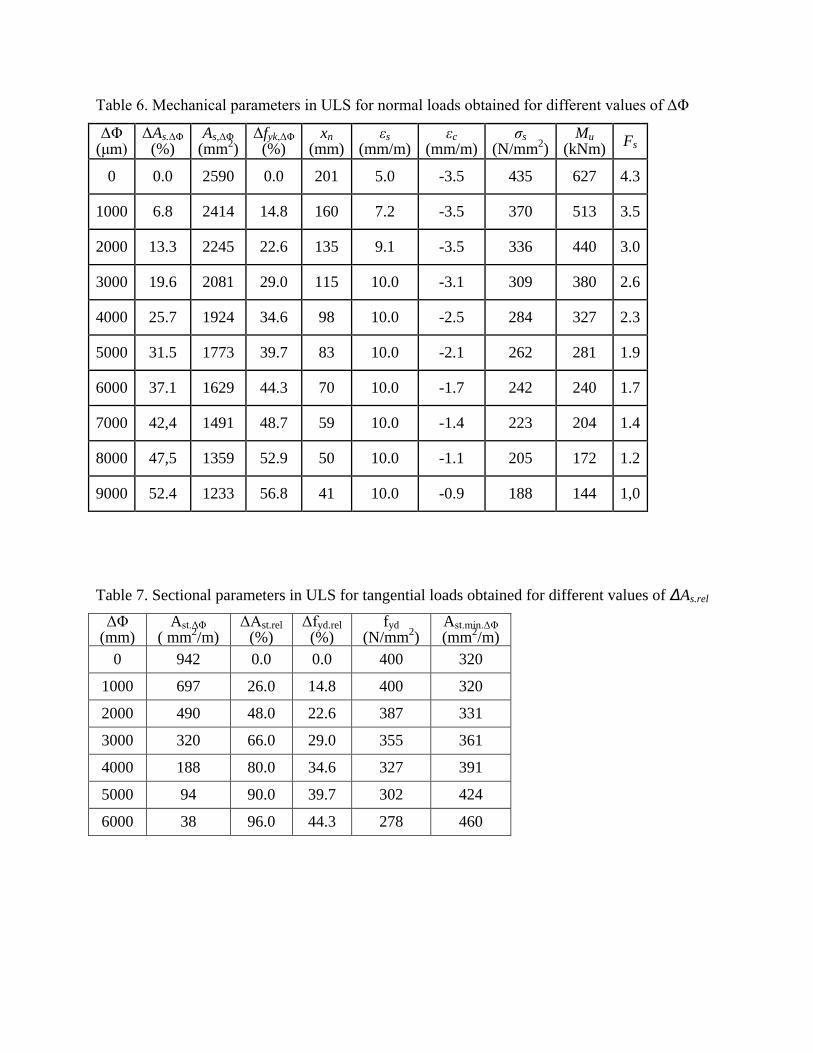
Table 6. Mechanical parameters in ULS for normal loads obtained for different values of ΔΦ
ΔΦ (μm)
ΔAs.ΔΦ (%)
As,ΔΦ (mm2)
Δfyk,ΔΦ (%)
xn (mm)
εs (mm/m)
εc (mm/m)
σs (N/mm2)
Mu (kNm) Fs
0 0.0 2590 0.0 201 5.0 -3.5 435 627 4.3
1000 6.8 2414 14.8 160 7.2 -3.5 370 513 3.5
2000 13.3 2245 22.6 135 9.1 -3.5 336 440 3.0
3000 19.6 2081 29.0 115 10.0 -3.1 309 380 2.6
4000 25.7 1924 34.6 98 10.0 -2.5 284 327 2.3
5000 31.5 1773 39.7 83 10.0 -2.1 262 281 1.9
6000 37.1 1629 44.3 70 10.0 -1.7 242 240 1.7
7000 42,4 1491 48.7 59 10.0 -1.4 223 204 1.4
8000 47,5 1359 52.9 50 10.0 -1.1 205 172 1.2
9000 52.4 1233 56.8 41 10.0 -0.9 188 144 1,0
Table 7. Sectional parameters in ULS for tangential loads obtained for different values of ΔAs.rel
ΔΦ (mm)
Ast.ΔΦ ( mm2/m)
ΔAst.rel (%)
Δfyd.rel (%)
fyd (N/mm2)
Ast.min.ΔΦ (mm2/m)
0 942 0.0 0.0 400 320
1000 697 26.0 14.8 400 320
2000 490 48.0 22.6 387 331
3000 320 66.0 29.0 355 361
4000 188 80.0 34.6 327 391
5000 94 90.0 39.7 302 424
6000 38 96.0 44.3 278 460
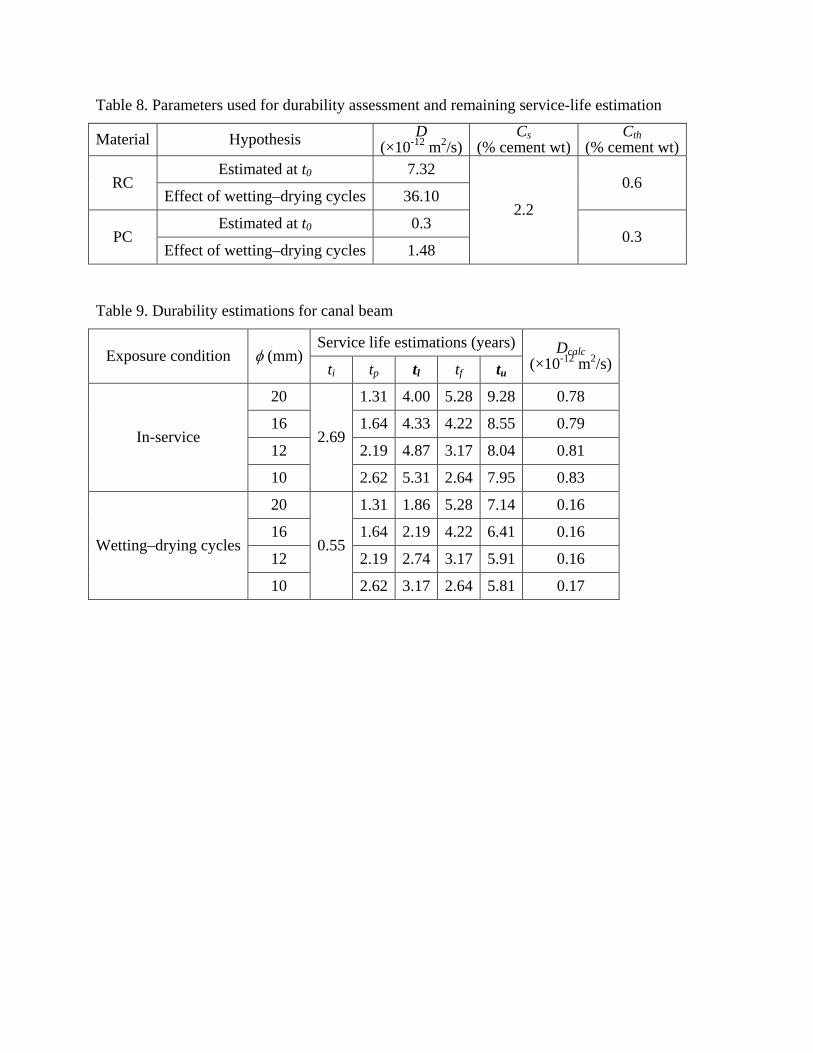
Table 8. Parameters used for durability assessment and remaining service-life estimation
Material Hypothesis D (×10-12 m2/s)
Cs (% cement wt)
Cth (% cement wt)
RC Estimated at t0 7.32
2.2
0.6 Effect of wetting–drying cycles 36.10
PC Estimated at t0 0.3
0.3 Effect of wetting–drying cycles 1.48
Table 9. Durability estimations for canal beam
Exposure condition φ (mm) Service life estimations (years) Dcalc
(×10-12 m2/s) ti tp tl tf tu
In-service
20
2.69
1.31 4.00 5.28 9.28 0.78
16 1.64 4.33 4.22 8.55 0.79
12 2.19 4.87 3.17 8.04 0.81
10 2.62 5.31 2.64 7.95 0.83
Wetting–drying cycles
20
0.55
1.31 1.86 5.28 7.14 0.16
16 1.64 2.19 4.22 6.41 0.16
12 2.19 2.74 3.17 5.91 0.16
10 2.62 3.17 2.64 5.81 0.17
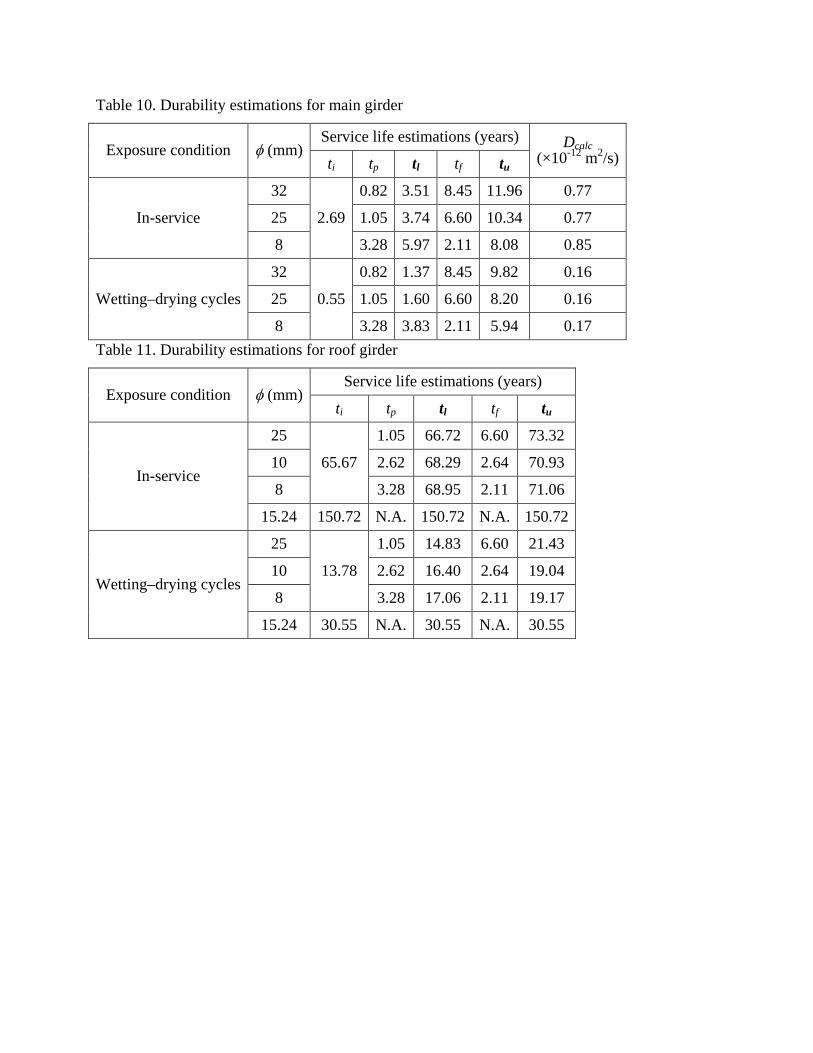
Table 10. Durability estimations for main girder
Exposure condition φ (mm) Service life estimations (years) Dcalc
(×10-12 m2/s) ti tp tl tf tu
In-service
32
2.69
0.82 3.51 8.45 11.96 0.77
25 1.05 3.74 6.60 10.34 0.77
8 3.28 5.97 2.11 8.08 0.85
Wetting–drying cycles
32
0.55
0.82 1.37 8.45 9.82 0.16
25 1.05 1.60 6.60 8.20 0.16
8 3.28 3.83 2.11 5.94 0.17 Table 11. Durability estimations for roof girder
Exposure condition φ (mm) Service life estimations (years)
ti tp tl tf tu
In-service
25
65.67
1.05 66.72 6.60 73.32
10 2.62 68.29 2.64 70.93
8 3.28 68.95 2.11 71.06
15.24 150.72 N.A. 150.72 N.A. 150.72
Wetting–drying cycles
25
13.78
1.05 14.83 6.60 21.43
10 2.62 16.40 2.64 19.04
8 3.28 17.06 2.11 19.17
15.24 30.55 N.A. 30.55 N.A. 30.55