calidad de sedimentos - noaa
DESCRIPTION
Calidad de SedimentosTRANSCRIPT
7/21/2019 Calidad de Sedimentos - NOAA
http://slidepdf.com/reader/full/calidad-de-sedimentos-noaa 1/12
7/21/2019 Calidad de Sedimentos - NOAA
http://slidepdf.com/reader/full/calidad-de-sedimentos-noaa 2/12

7/21/2019 Calidad de Sedimentos - NOAA
http://slidepdf.com/reader/full/calidad-de-sedimentos-noaa 3/12
7/21/2019 Calidad de Sedimentos - NOAA
http://slidepdf.com/reader/full/calidad-de-sedimentos-noaa 4/12
7/21/2019 Calidad de Sedimentos - NOAA
http://slidepdf.com/reader/full/calidad-de-sedimentos-noaa 5/12
7/21/2019 Calidad de Sedimentos - NOAA
http://slidepdf.com/reader/full/calidad-de-sedimentos-noaa 6/12
7/21/2019 Calidad de Sedimentos - NOAA
http://slidepdf.com/reader/full/calidad-de-sedimentos-noaa 7/12
0
20
40
60
80
100
nd
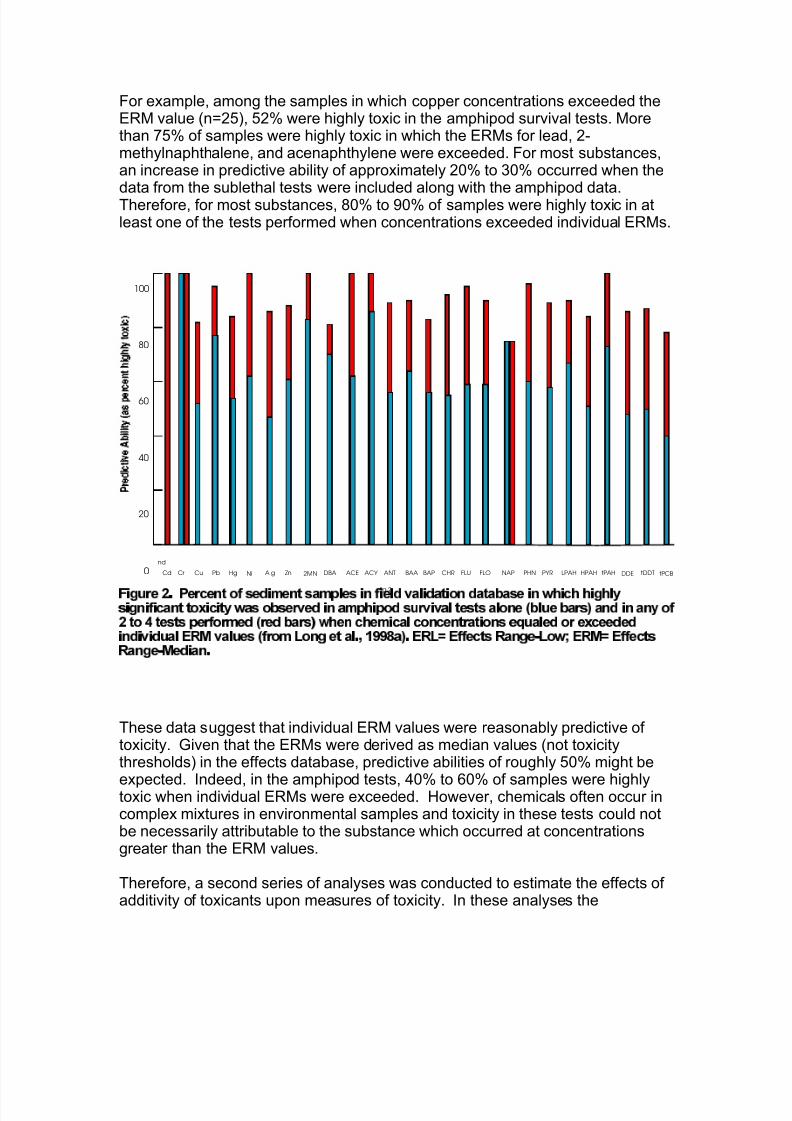
Cd Cr Cu Pb Hg Ni A g Zn 2MN tPCBtDDTDDEtPAHHPAHLPAHPYRPHNNAPFLOFLUCHRBAPBAAANTACYACEDBA
fig.2

7/21/2019 Calidad de Sedimentos - NOAA
http://slidepdf.com/reader/full/calidad-de-sedimentos-noaa 8/12
7/21/2019 Calidad de Sedimentos - NOAA
http://slidepdf.com/reader/full/calidad-de-sedimentos-noaa 9/12
7/21/2019 Calidad de Sedimentos - NOAA
http://slidepdf.com/reader/full/calidad-de-sedimentos-noaa 10/12
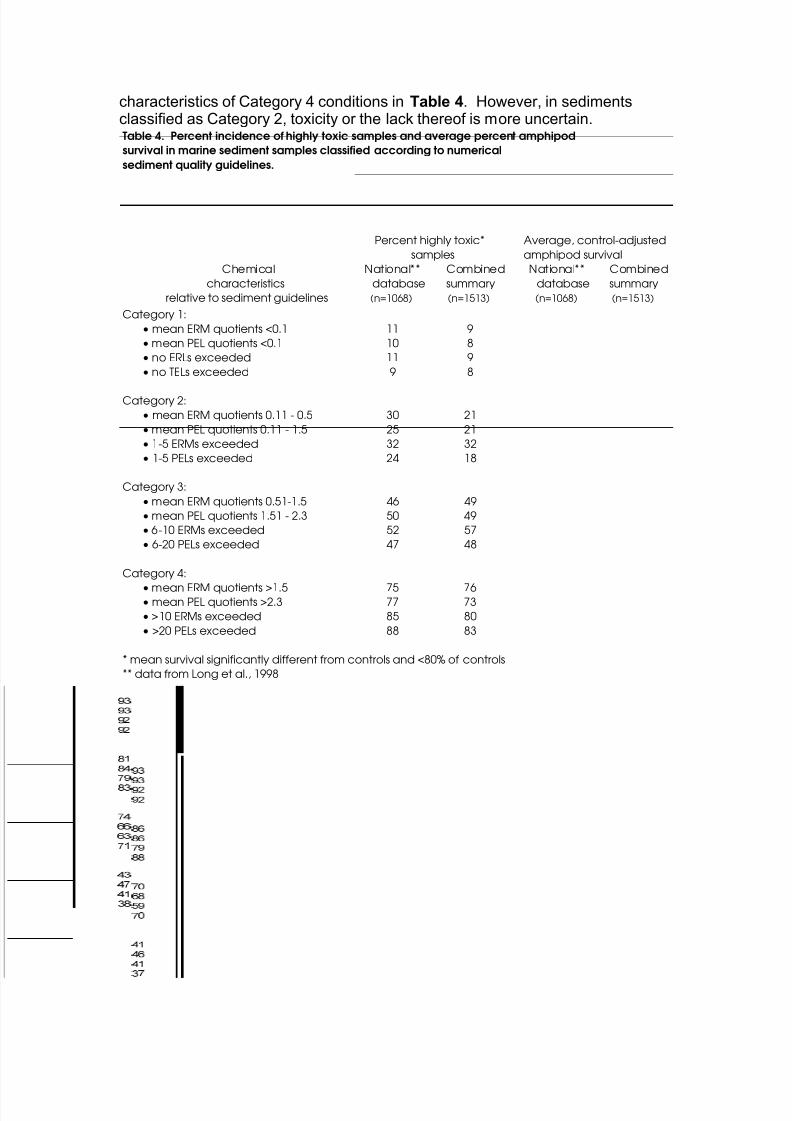
Table 4. Percent incidence of highly toxic samples and average percent amphipod
survival in marine sediment samples classified according to numerical
sediment quality guidelines.
Percent highly toxic* Average, control-adjusted
samples amphipod survival
Chemical National** Combined National** Combined
characteristics database summary database summary
relative to sediment guidelines (n=1068) (n=1513) (n=1068) (n=1513)
Category 1:
mean ERM quotients <0.1 11 9
• mean PEL quotients <0.1 10 8
• no ERLs exceeded 11 9
• no TELs exceeded 9 8
Category 2:
• mean ERM quotients 0.11 - 0.5 30 21
• mean PEL quotients 0.11 - 1.5 25 21
• 1-5 ERMs exceeded 32 32
• 1-5 PELs exceeded 24 18
Category 3:
• mean ERM quotients 0.51-1.5 46 49
• mean PEL quotients 1.51 - 2.3 50 49
• 6-10 ERMs exceeded 52 57
• 6-20 PELs exceeded 47 48
Category 4:
• mean ERM quotients >1.5 75 76
• mean PEL quotients >2.3 77 73
• >10 ERMs exceeded 85 80
• >20 PELs exceeded 88 83
* mean survival significantly different from controls and <80% of controls
** data from Long et al., 1998
7/21/2019 Calidad de Sedimentos - NOAA
http://slidepdf.com/reader/full/calidad-de-sedimentos-noaa 11/12
7/21/2019 Calidad de Sedimentos - NOAA
http://slidepdf.com/reader/full/calidad-de-sedimentos-noaa 12/12