advertiment. lʼaccés als continguts dʼaquesta tesi ... · trobat que el deme sensible t6,...
TRANSCRIPT

ADVERTIMENT. Lʼaccés als continguts dʼaquesta tesi queda condicionat a lʼacceptació de les condicions dʼúsestablertes per la següent llicència Creative Commons: http://cat.creativecommons.org/?page_id=184
ADVERTENCIA. El acceso a los contenidos de esta tesis queda condicionado a la aceptación de las condiciones de usoestablecidas por la siguiente licencia Creative Commons: http://es.creativecommons.org/blog/licencias/
WARNING. The access to the contents of this doctoral thesis it is limited to the acceptance of the use conditions setby the following Creative Commons license: https://creativecommons.org/licenses/?lang=en
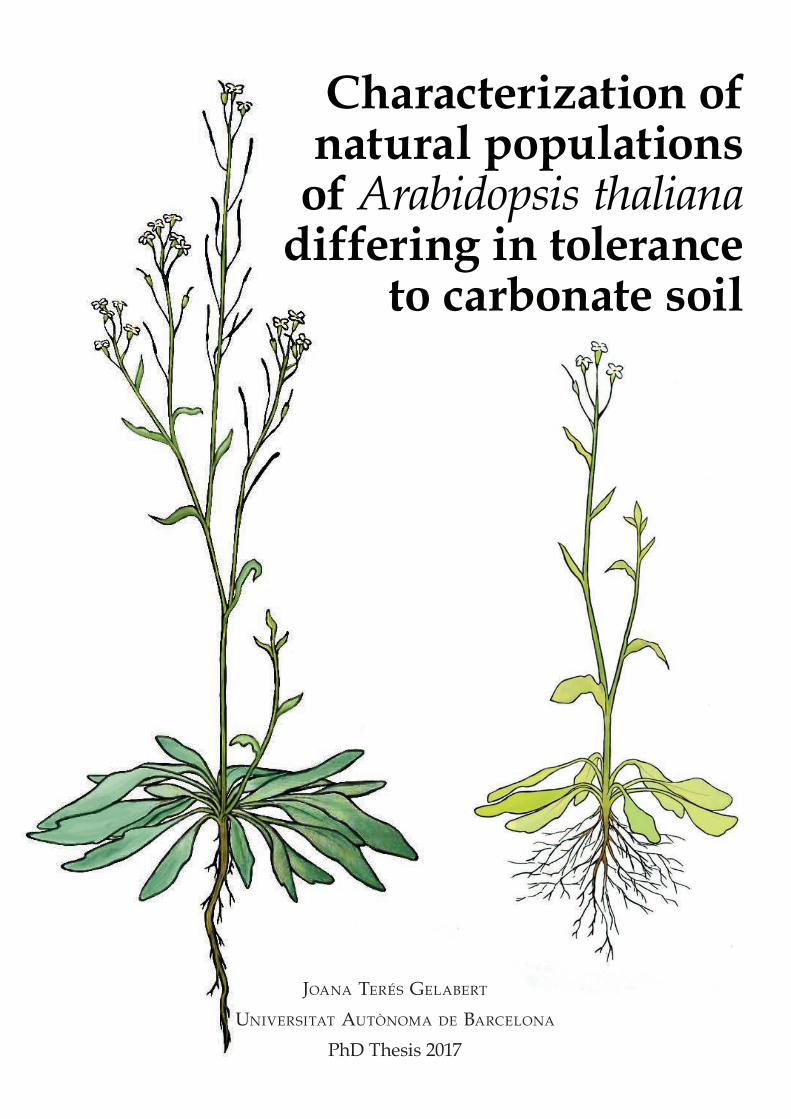
Characterization ofnatural populations
of Arabidopsis thalianadiffering in tolerance
to carbonate soil
joana Terés GelaberT
UniversiTaT aUTònoma de barcelona
PhD Thesis 2017


An expert is a man who has made all the mistakes which can be made, in a narrow field.
Niels Bohr, 1930


Agraïments
En primer lloc voldria agrair a les meves directores de Tesis Charlotte Poschenrieder, Roser
Tolrà i al director David Salt, la oportunitat de fer un doctorat a la unitat de fisiologia vegetal.
Infinites gràcies als tots els companys del departament i la secretaria del BABVE, a la Sole per
tants consells acadèmics i morals, a la Maite per l’excel∙lent companyia, a la Rosa per les
xarrades de primera hora, en especial a la Laura i a la Laia que m’han ajudat sense condicions
en tot, i que entre cafè i cafè han fet que el darrer tram d’aquesta etapa fos menys feixuc, al
Miquel pel seu bon humor constant i a la Silvia, que des del principi fins al final m’ha fet costat,
m’ha acollit a casa i ha suportat amb molta paciència els meus micro‐drames.
També vull donar les gracies als companys dels laboratoris de fora, especialment al XinYuan
per la seva professionalitat i l’Edu, per la seva ajuda al lab i per obrir‐me les portes de casa
seva, a l’Adrián i l’Ana per fer que la meva estada a Zaragoza fos 100% profitosa tant a nivell
acadèmic com gastronòmic, a la Cata i en Jaume per facilitar‐me sòl de Mallorca i els anàlisis
corresponents i a la Imelda per crear una convivència tan agradable a Aberdeen.
Gràcies a la Fiona i a la Simone per les correccions gramaticals i preparar‐me per la
presentació. I a la Laura per tota la composició artística que vesteix aquesta tesis.
M’agradaria donar les gràcies a la família, al meu pare per tota la ajuda moral i tecnològica
aportada des de sempre i la seva implicació en la redacció d’aquesta tesis i al Mamut per
cuidar‐me infinit en tots els aspectes. A la Júlia per no dubtar quan li he demanat ajuda i fer‐
me riure tantíssimes vegades. A la padrina i a la iaia per les seves trucades de “i això quant
s’acaba?”. Al iaio i al padrí també els hauria agradat veure’m arribar fins aquí.
Estic molt agraïda al Toni, per ser‐hi sempre, i seguir la tesis amb màxima implicació d’inici a
final. Per ajudar‐me quan ho he necessitat i mimar‐me quan potser no m’ho mereixia.
Gràcies a la Marta i a la Cèlia, per la seva amistat incondicional, per fer de la nostra casa la
millor del món, per escoltar amb ganes les meves presentacions i suportar els meus dies de
mal humor.
Als amics i amigues per la seva alegria, per donar‐me suport i obligar‐me a sortir de casa a fer
el vermut, en especial gràcies a la Laura, a la Lara, a l’Anna, al David, a la Neus i al Holger.
A la Charlotte i en Joan, per confiar en mi, molt abans de que jo ho fes, i brindar‐me la
possibilitat de sentir‐me part de la seva família, ajudar‐me en tot moment, tenir la porta
sempre oberta a més preguntes i encoratjar‐me en situacions crítiques, gràcies per fer‐me
sentir tan estimada.
Per últim, vull esmentar que el doctorat ha estat finançat amb una beca PIF (personal
investigador en formació); les estades a l’estranger es va rebre el suport econòmic de la beca
de mobilitat de la UAB. Aquest doctorat s’emmarca dins dels projectes MICINN (BFU2013‐
42839‐R i BFU2016‐75176‐R) sense els quals no hauria estat possible.


Resum
S’han investigat les poblacions naturals d’Arabidopsis thaliana de Catalunya per identificar
mecanismes d’adaptació local als sòls carbonatats. Després de caracteritzar les propietats
químiques dels sòls natius, petits rodals de poblacions biològiques d' A. thaliana (que
anomenem “demes”), es van realitzar experiments anuals de camp, en parcel∙les amb
diferents nivells de carbonats al sòl, per avaluar l’aptitud diferencial entre els “demes”. La
progènie d’aquests demes va mostrar una millor aptitud en el sòl control, sense carbonats. Les
diferencies en l’aptitud dels demes per créixer l sòl carbonatat està associada amb el
percentatge de CaCO3 dels sòls natius. Aquest fet confirma que el nivell de carbonats al sòl és
el factor limitant per a l’adaptació local.
Els demes contrastants A1 (moderadament tolerant) i T6 (sensible) es varen seleccionar per
analitzar les característiques fisiològiques. Quan creixen bé en presencia de carbonats o bé
amb deficiència de ferro s’observen diferencies en el contingut de clorofil∙les, l’activitat de
SOD i el perfil de compostos fenòlics exsudats per les arrels.
El deme tolerant A1 presenta l’al∙lel AtFPN2 com el genotip de referència Col.0. Per contra s’ha
trobat que el deme sensible T6, presenta la seqüència de l’al∙lel com Ts‐1. La presencia de
l’al∙lel dèbil de AtFPN2 de Ts‐1 podria justificar l’elevada acumulació de metalls divalents a la
fulla del deme sensible T6.
Creuaments realitzats entre demes tolerants i sensibles revelen l’herència d’aquests trets. En
la F3 es van seleccionar famílies tolerants i sensibles per fer l’anàlisi de “bulk‐segregation”, que
encara esta en procés de realització.
Per tal d’identificar gens candidats per a l’adaptació als sòls carbonatats, s’ha utilitzat una
col∙lecció HAP‐MAP provinent de NASK. Aquestes accessions van ser plantades en sol
carbonatat i sòl control i es va dur a terme un seguiment del creixement i un anàlisis ionòmic
de la part aèria. El Genome wide association analysis (GWAS) ens ha proporcionat una llista de
gens potencialment relacionats amb la tolerància als sòls carbonatats.
En conclusió, els nostres resultats demostren que les plantes d’A. thaliana que tenen com a
habitat natural sòl amb concentracions moderades o baixes de carbonat són més tolerants als
carbonats que les plantes que viuen en sòls sense carbonats. Aquesta “tolerància” és heretable
i el GWAS ha revelat múltiples gens candidats a ser els responsables d’aquesta tolerància al sòl
carbonat. Els resultats que s’obtindran amb el BSA‐seq anàlisis proporcionaran informació útil i
addicional per a la identificació dels gens clau involucrats en aquesta tolerància.
Arabidopsis thaliana vs. Tolerance to Carbonate Soil
Abstract
ii
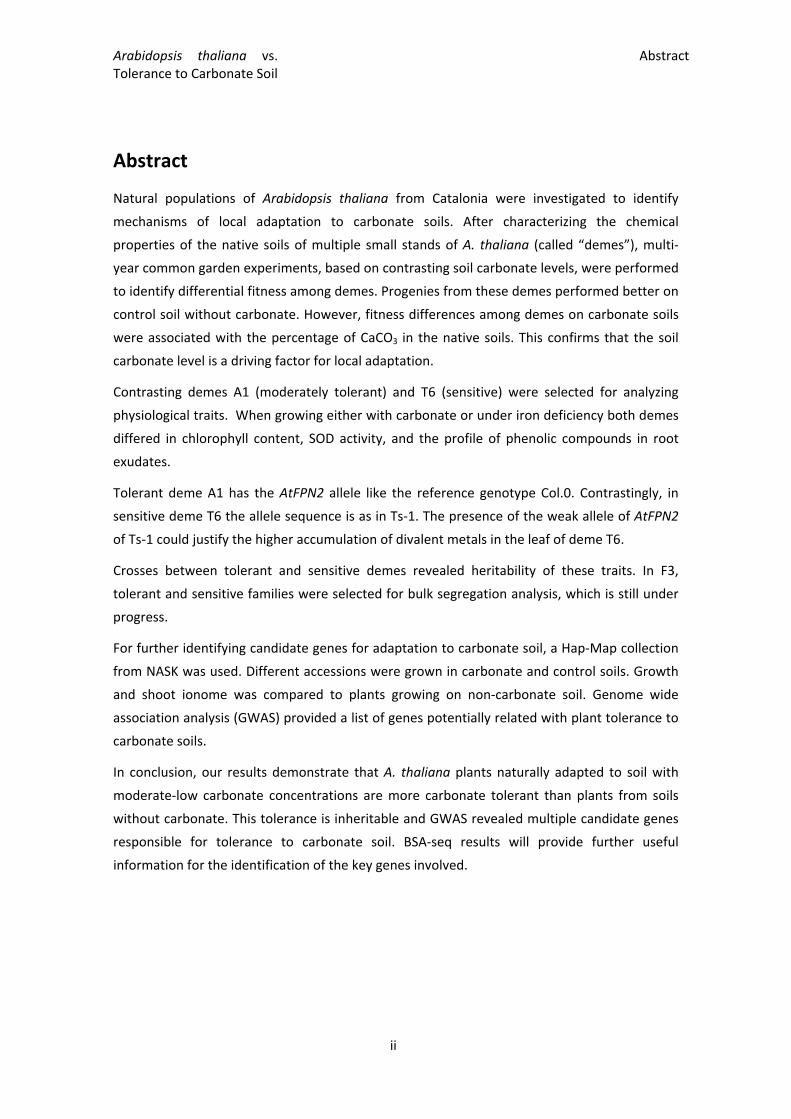
Abstract
Natural populations of Arabidopsis thaliana from Catalonia were investigated to identify
mechanisms of local adaptation to carbonate soils. After characterizing the chemical
properties of the native soils of multiple small stands of A. thaliana (called “demes”), multi‐
year common garden experiments, based on contrasting soil carbonate levels, were performed
to identify differential fitness among demes. Progenies from these demes performed better on
control soil without carbonate. However, fitness differences among demes on carbonate soils
were associated with the percentage of CaCO3 in the native soils. This confirms that the soil
carbonate level is a driving factor for local adaptation.
Contrasting demes A1 (moderately tolerant) and T6 (sensitive) were selected for analyzing
physiological traits. When growing either with carbonate or under iron deficiency both demes
differed in chlorophyll content, SOD activity, and the profile of phenolic compounds in root
exudates.
Tolerant deme A1 has the AtFPN2 allele like the reference genotype Col.0. Contrastingly, in
sensitive deme T6 the allele sequence is as in Ts‐1. The presence of the weak allele of AtFPN2
of Ts‐1 could justify the higher accumulation of divalent metals in the leaf of deme T6.
Crosses between tolerant and sensitive demes revealed heritability of these traits. In F3,
tolerant and sensitive families were selected for bulk segregation analysis, which is still under
progress.
For further identifying candidate genes for adaptation to carbonate soil, a Hap‐Map collection
from NASK was used. Different accessions were grown in carbonate and control soils. Growth
and shoot ionome was compared to plants growing on non‐carbonate soil. Genome wide
association analysis (GWAS) provided a list of genes potentially related with plant tolerance to
carbonate soils.
In conclusion, our results demonstrate that A. thaliana plants naturally adapted to soil with
moderate‐low carbonate concentrations are more carbonate tolerant than plants from soils
without carbonate. This tolerance is inheritable and GWAS revealed multiple candidate genes
responsible for tolerance to carbonate soil. BSA‐seq results will provide further useful
information for the identification of the key genes involved.

Arabidopsis thaliana vs. Tolerance to Carbonate Soil
Contents
iii
Contents
Resum ............................................................................................................................................. i
Abstract ......................................................................................................................................... ii
Contents ....................................................................................................................................... iii
Acronyms ...................................................................................................................................... vi
GLOBAL INTRODUCTION ............................................................................................................... 1
Work context and Introduction ................................................................................................. 1
Document presentation ............................................................................................................ 5
Chapter I. FIELD EXPERIMENTS .................................................................................................. 7
Introduction .............................................................................................................................. 9
Calcareous soils ..................................................................................................................... 9
Problems associated with carbonated soils ........................................................................ 10
Calcicole and Calcifuge plants ............................................................................................. 12
Natural populations of Arabidopsis thaliana ...................................................................... 13
Geology of Catalonia ........................................................................................................... 14
Specific Objectives ................................................................................................................... 15
Materials and methods ........................................................................................................... 15
Soil analysis ......................................................................................................................... 15
Plants analysis ..................................................................................................................... 16
Garden experiments ............................................................................................................ 16
Results & Discussion ................................................................................................................ 17
Characterization of the driving factor for enhanced tolerance to carbonate soils ............. 17
Reciprocal transplant experiment ....................................................................................... 19
Natural habitat .................................................................................................................... 24
Conclusions ............................................................................................................................. 26
Chapter II. PHYSIOLOGICAL TRAITS ....................................................................................... 27
Introduction ............................................................................................................................ 29
Iron in plants ....................................................................................................................... 29
Iron deficiency ..................................................................................................................... 31
Oxidative stress and defence .............................................................................................. 32
Phenolic compounds in root exudates ................................................................................ 36
Objectives ................................................................................................................................ 36
Arabidopsis thaliana vs. Tolerance to Carbonate Soil
Contents
iv
Materials and methods ........................................................................................................... 36
Plant Culture and Experimental Design .............................................................................. 36
Ferric‐reductase .................................................................................................................. 38
Enzyme extract preparation ................................................................................................ 38
Catalase assay ..................................................................................................................... 38
SOD‐assay ............................................................................................................................ 38
Chlorophyll concentration ................................................................................................... 39
Genotyping (PCR) AtFPN2 ................................................................................................... 39
Soil analysis ......................................................................................................................... 39
Phenolic Compounds........................................................................................................... 39
Results and Discussion ............................................................................................................ 41
Results ................................................................................................................................. 41
Phenolic compounds in roots and root exudates ............................................................... 45
Discussion ............................................................................................................................ 47
FPN2 .................................................................................................................................... 52
Conclusions ............................................................................................................................. 54
Chapter III. GENETIC TRAITS ................................................................................................... 55
Introduction ............................................................................................................................ 57
Objectives ................................................................................................................................ 59
Materials and methods ........................................................................................................... 59
Plant culture ........................................................................................................................ 59
Sequencing of parental lines: A1 and T6 ............................................................................. 60
Results ..................................................................................................................................... 61
F1 selection ......................................................................................................................... 61
F2 selection ......................................................................................................................... 64
F3 selection ......................................................................................................................... 65
Parental Sequencing ............................................................................................................ 66
Discussion ................................................................................................................................ 66
Conclusions ............................................................................................................................. 68
Chapter IV. GWAS ................................................................................................................... 69
Introduction ............................................................................................................................ 71
GWAS................................................................................................................................... 71
Objectives ................................................................................................................................ 72
Materials and methods ........................................................................................................... 72

Arabidopsis thaliana vs. Tolerance to Carbonate Soil
Contents
v
Plant Culture and Experimental Design .............................................................................. 72
Plant analysis ....................................................................................................................... 73
Soils ..................................................................................................................................... 73
Genome‐wide association (GWA) analysis .......................................................................... 73
Results & Discussion ................................................................................................................ 74
Soil analysis ......................................................................................................................... 74
Extreme Selection ............................................................................................................... 76
GWAS................................................................................................................................... 76
Conclusions ............................................................................................................................. 81
Concluding Remarks .................................................................................................................... 83
BIBLIOGRAPHY ............................................................................................................................. 85
References ............................................................................................................................... 85
Web Pages & Programmes .................................................................................................... 104
ANNEXES ................................................................................................................................... 105
Annex 1. Siliques statistics for years 2013‐2015 .................................................................. 107
Annex 2. Ionomic analysis of soil from common garden experiment. Statistics for years
2013‐2015 109
Annex 3. Ionomic analysis in leaf of demes grown in LP and SCF. Statistics for years 2013‐
2015 111
Annex 4. Ionomic analysis in soils from natural habitat. Statistics for years 2013‐2015 ..... 115
Annex 5. Ionomic analysis in Mallorca soils ......................................................................... 117
Annex 6. List of genes differing from A1 and T6 demes ...................................................... 118
Annex 7. GWAs results ......................................................................................................... 122

Arabidopsis thaliana vs. Tolerance to Carbonate Soil
Acronyms
vi
Acronyms
ANOVA Analysis of variance
BSA Bulk Segregation Analysis
DNA Deoxyribonucleic acid
FCR Ferric Chelate Reductase
GWAS Genome wide association Study
ICP‐MS Inductively Coupled Plasma Mass Spectrometry
LD linkage disequilibrium
LP Les Planes d’Hostoles
O.M. Organic Matter
PS I/II Photosystem I/II
QTLs Quantitative trait locus
QTGs Quantitative trait genes
ROS Reactive oxygen species
SDM Species Distribution Model
SCF Santa Coloma de Farners
WHC Water Hold capacity
GLOBAL INTRODUCTION
Work context and Introduction
A major challenge for biologists is to understand the mechanisms, which enable a plant to
adapt to its environment and to perform optimally under a range of conditions as broad as
possible. A complete understanding is only obtained by the integration of distinct levels of
research from ecology, over physiology to the molecular biology and functionality of individual
genes (Malcolm, 2001)
In addition, the analysis of natural variation in wild species has begun to elucidate the
molecular bases of phenotypic differences related to plant adaptation in distinct natural
environments and to determine the ecological and evolutionary processes that maintain this
variation (Mitchell‐Olds et al., 2007).
Studies on local adaptation in plants are of great value to conservation biologists and climate
change researchers (Leimu and Fischer, 2008), and such studies are beneficial in examining
how gene flow and other drivers of evolution impact natural selection (Kawecki and Ebert,
2004). In the planning of restoration projects research on local adaptation provides valuable
information. Plants used in restoration projects can be more carefully selected if it is known
how introduced plants will adapt to a new location. Plants most suitable for restoration are
usually collected locally or from areas of similar habitats (McKay et al., 2005).
Some experts believe that adaptation does not always have to be reciprocal; fitness reaction
norms do not always have to cross to demonstrate local adaptation (Wright and Station, 2011).
Most studies on local adaptation in plants typically use reciprocal transplant experiments in
the field and test fitness traits of two or more plant groups transplanted into their home and
away sites. Fitness can be estimated with floral, vegetative, and survival measurements.
Flowering time is an important measure because differences in the maturation of reproductive
structures can lead to changes in pollination, herbivory, and reproductive success (Levin,
2006). The experiment of Yang et al., 2010 demonstrated that two accessions that differ in

GLOBAL INTRODUCTION Work context and Introduction
2
their flowering time surprisingly respond to Fe deficiency in a similar way. In turn, both biotic
and abiotic stress may influence the flowering time.
Both drought and salinity are well‐known to affect flowering time in Arabidopsis. Drought is an
abiotic stress factor that affects many regions of the world. Drought causes an early arrest of
floral development and leads to sterility (Su et al., 2013). To ensure survival during drought
stress, plants often accelerate the flowering process, and this response is known as ‘drought
escape’ (Sherrard and Maherali, 2006; Franks et al., 2007; Bernal et al. 2011; Franks, 2011).
The related concept ‘drought avoidance’ refers to the condition where the plant reduces water
loss to prevent dehydration (Kooyers, 2015).
Salinity substantially delays flowering time in Arabidopsis (Kim et al., 2007), and several
flowering regulators that mediate this response have been identified. Salt delays flowering in a
process dependent on DELLA proteins acting as negative regulators of GA signalling and the
plant hormone ethylene (Achard et al., 2006). Salt stress suppresses the expression of CO and
FT, contributing to the delay in flowering (Kim et al., 2007; Li et al., 2007). In addition, the
salinity‐induced delay in flowering time appears to be dependent on the floral repressor
BROTHER OF FT AND TFL1 (BFT), as the delay observed in wild‐type plants was not evident in
bft mutants (Ryu et al., 2011).
Biotic stress factors such as attack by pests and pathogens can have a significant effect on
plant development, including flowering. In Arabidopsis, pathogen infection alters flowering
time in response to infection with the vascular wilt fungal pathogen Fusarium oxysporum
(Lyons et al., 2015), and the bacterial pathogen Pseudomonas syringae (Korves and Bergelson,
2003).
Wallace (1858) recognized that plant adaptation to different soil types is evidence of the
strong natural selection imposed by ecological discontinuities. Plants need elements present in
the soil. However, both deficiency or toxicity of some of these elements represent a stress for
the plant. Most nutrients that plants require for growth and development are supplied as
mineral ions to the roots, and they are classified as macronutrients (Ca, K, Mg, N, P, and S) or
micronutrients (B, Cl, Fe, Mn, Co, Cu, Mo, Ni, and Zn) depending on the necessary quantities.
The composition of mineral nutrients and trace elements (i.e., the inorganic component of an
organism) is now referred to as the ionome (Salt et al., 2008). There is substantial natural
variation for mineral use efficiency, root uptake, translocation from roots to shoots, and
accumulation in the seed as storage and supply for the germinating seedling. This variation has
been reported in many species, leading to breeding programs such as those aiming to improve
zinc and iron status of cereal grains or tuber crops (www.harvestplus.org).
Detailed analyses of the ionome in A. thaliana have shown considerable variation for leaf
mineral concentrations under various mineral/metal supply conditions (Salt et al., 2008). QTLs
GLOBAL INTRODUCTION Work context and Introduction
3
have been identified for accumulation of different elements (Ca, Cu, Fe, K, Mg, Mn, Na, P, S,
and Zn) in seeds, siliques, leaves, and roots under different growth conditions (Vreugdenhil et
al., 2004; Waters and Grusak, 2008; Ghandilyan et al., 2009)
In addition, A. thaliana QTL analyses have been focused on accumulation of specific minerals,
including N (as nitrate; Loudet et al., 2003; Harada et al., 2004), K (Harada and Leigh, 2006), Cu
(Kobayashi et al., 2008), Mo (Baxter et al., 2008), and Na (Rus et al., 2006). These studies have
led to the isolation of three genes underlying large‐effect QTLs, which also encode different
mineral transport components. A root copper tolerance locus corresponds to the HMA5 gene
encoding a Cu‐transporting ATPase. Several natural alleles differing in missense mutations in
conserved motifs show lower activity and Cu translocation to the shoot (Kobayashi et al.,
2008). A mitochondrial molybdenum transporter encoded by the nuclear MOT1 gene underlies
shoot Mo concentration QTL. The absence of the MOT1 promoter region has been associated
with low gene expression and low shoot Mo concentration, suggesting that this regulatory
mutation is the causal nucleotide polymorphism (Baxter et al., 2008). Finally, HKT1 encodes a
Na+ transporter for which two loss‐of function alleles associated with promoter deletions
produce lower root expression and enhanced shoot Na+ levels in two coastal accessions (Rus et
al., 2006; Busoms et al., 2015).
Importantly, the molecular analysis of natural genetic variation has not only led to the
correlation of allelic variation of known genes with phenotypic variation, but also to the
discovery of novel genes. This identification of genes that account for natural phenotypic
variation is and will remain one of the principal goals in this field. However, beyond this goal,
the analysis of natural genetic variation also offers an excellent opportunity to overcome the
often‐perceived dichotomy between molecular and organismal biology (Shindo et al., 2007).
Gene functions involved in plant survival and adaptation can partially be identified by induced
mutant analyses of different wild genotypes, where mutants with reduced fitness are easily
selected. However, current mutant collections have been obtained using a limited number of
laboratory strains, which harbour only a small portion of A. thaliana natural variation.
Interestingly, Clark et al., (2007) showed that 9.4% of A. thaliana protein‐coding genes are
naturally absent or knocked out in wild accessions, limiting the mutant spectra that can be
obtained from each accession. Therefore, natural variation provides a relevant complementary
resource to discover novel gene functions, as well as those allelic variants that specifically
interact with the genetic background and/or the environment or alleles showing small effects
on phenotype, particularly for traits related to plant adaptation (Benfey and Mitchell‐Olds,
2008)
Genetic analyses of natural variation in plants are mainly performed by QTL mapping, often
called linkage mapping, in which phenotypic variation is associated with allelic variation at
molecular markers segregating in experimental mapping populations derived from directed

GLOBAL INTRODUCTION Work context and Introduction
4
crosses (Doerge, 2002). Thus, genomic regions accounting for trait variation are located in
large physical intervals containing the causal QTLs. Further analyses of these regions, with a
combination of functional strategies, allows the final identification of QTGs and nucleotide
polymorphisms altering the function of those genes (reviewed in Koornneef et al., 2004;
Alonso‐Blanco et al., 2005; Weigel and Nordborg, 2005; González‐Martínez et al., 2006).
Association mapping, which involves looking for phenotype‐genotype associations in a general
population of individuals whose degree of relatedness or pedigree is unknown, is also
becoming more popular and useful in plant systems. Improvements in statistical and analytical
tools and in gene sequencing technology are being crucial for progress in this field (see Myles
et al., 2009).
The wide geographical and environmental distribution of A. thaliana, combined with its small
genome and the availability of unprecedented genetic and genome resources, have strongly
facilitated the molecular analysis of this species in the last decade.
Arabidopsis thaliana (L.) Heyhn commonly known as wild thale or mouse ear cress, belongs to
the mustard family (Brassicaceae, formerly Cruciferae). The genus Arabidopsis comprises nine
species and eight subspecies (Al‐Shehbaz and O’Kane, 2002). Among them, A. thaliana can be
distinguished by morphological characteristics such as fruit and seed shape. The nine species
of the genus Arabidopsis are mainly found in Europe. Two species are also found in Asia and
North America, but only A. thaliana has a worldwide distribution. In fact, A. thaliana can be
found in diverse habitats, for instance in open or disturbed habitats, on sandy soils or on river
banks, at sea level or at high altitude (Al‐Shehbaz and O’Kane, 2002). The rapid expansion of
habitat colonization by A. thaliana implies that this species has a huge capacity to adapt to a
wide range of ecological niches.
The high capacity of Arabidopsis to colonize a broad geographical spectrum is probably
connected to its life cycle strategy, especially the timing of seed germination and flowering
initiation. In Europe, Arabidopsis accessions generally flower in spring and early summer, and
the mature seeds are available from May to July, occasionally also in late summer up to early
autumn (Lawrence, 1976; Koornneef et al., 2004).
In general, accessions from Southern Europe are either winter‐ or summer‐annual types,
whereas most Northern European accessions are typically winter‐annual.
It is commonly assumed that Arabidopsis is a completely, or nearly completely, self‐fertilizing
species, owing to its characteristic flowering morphology, which is typical for inbreeding
plants: the flowers are small, lack strong scent and the anthers are positioned close to the
stigmata (Charlesworth and Vekemans, 2005). Indeed, the selfing rate in natural environments
has been estimated in some studies to be greater than 95 % (Abbott and Gomes, 1989;
Charlesworth and Vekemans, 2005; Stenøien et al., 2005). Thus, local Arabidopsis populations
are generally regarded to consist of a single inbred sibship. However, despite inbreeding, an
GLOBAL INTRODUCTION Document presentation
5
unexpected amount of genetic variation has been found within local populations (Nordborg et
al., 2005; Bakker et al., 2006b), suggesting gene flow between populations, which might be
facilitated through exchange of pollen rather than by seed dispersal (Bakker et al., 2006b).
Arabidopsis accessions show an extraordinarily wide phenotypic variation. Thus far, significant
natural variation has been reported for every phenotypic trait investigated (Koonneef et al.,
2004). Some developmental traits, such as flowering time or seed dormancy, have drawn
special attention, partly because they are of applied interest to crop breeding, and partly
because they are easy to investigate. In addition to visually obvious phenotypes, natural
variation has also been observed in genetic mechanisms such as cytosine methylation (Riddle
and Richards, 2002). Moreover, assays of metabolite profiles by large‐scale unbiased
metabolomic methods have uncovered natural variation at the level of small molecules,
suggesting that they reflect physiological phenotypes that could be selected in nature
(Keurentjes et al., 2006).
Finally, the natural variation resources of Arabidopsis are complemented by the annotated
genome sequence, which enables high‐density genotyping, and by collections of knockout
mutants, which provide a powerful tool to verify the prospective roles of genes involved in
natural trait variation by independent means.
Thus, A. thaliana has provided the largest number of genes and nucleotide polymorphisms
underlying natural variation of any plant species (Alonso‐Blanco et al., 2005). However, the
specific ecological niche and life history of A. thaliana limits the plant traits and processes that
can be approached in a single species. Therefore, new plant models phylogenetically related to
A. thaliana (e.g., Arabidopsis lyrata; Clauss and Koch, 2006) as well as unrelated species, e.g.,
of the genera Aquilegia (Kramer, 2009), Mimulus (Wu et al., 2007), Ipomoea (Clegg and Durbin,
2003), and Helianthus (Rieseberg et al., 2003), are beginning to be used in studies of natural
variation and speciation.
Document presentation
To structure the presentation of this doctoral work and related results, this thesis has been
divided into four chapters not completely independent but with a clear common target and
trajectory. The first chapter is devoted to present the field experiments with natural
populations of A. thaliana. The plant localization, its behaviour, characterization and
classification as well as the used methods and materials and related results are addressed and
discussed. Next two chapters (II and III) are more focused on laboratory activities and
protocols, being the central topics of study the physiological and genetic traits for two demes
previously selected due to its extreme behaviour in front of carbonated soils. To corroborate
the observed phenotypic variations among two demes from Catalonia we carried out a

GLOBAL INTRODUCTION Document presentation
6
genomic analysis using the Genome Wide Association Analysis (GWA) tools and this topic plus
related results are reported in chapter IV.
All PhD work has been done under the support, facilities and resources of Unitat Fisiologia
Vegetal ‐ Universitat Autònoma de Barcelona. Ionomic and genetic analyses were made in
collaboration with Prof. David Salt in the University of Aberdeen (https://www.abdn.ac.uk/)
facilities during several stages. Finally, the phenolic analyses were made at Estación
Experimental Aula Dei, Zaragoza (http://www.eead.csic.es/web/guest/home) in cooperation
with Prof. Ana Álvarez‐Fernández. The statistical analyses presented in this work were
performed using the JMP software (https://www.jmp.com/en_us/home.html).

Chapter IField experiments


FIELD EXPERIMENTS Introduction
9
Introduction
Calcareous soils
Calcareous soils occur naturally in arid and semi‐arid regions because of relatively little
leaching (Brady and Weil, 1999). They also can develop in humid and semiarid zones under
certain conditions: parent material rich in CaCO3, (e.g. limestone, shells or calcareous glacial
tills), that is relatively young and has undergone little weathering.
Calcareous soils often contain more than 15% CaCO3 that may occur in various forms
(powdery, nodules, crusts etc.). Soils with high CaCO3 belong to the calcisols and related calcic
subgroups of other soils. They are relatively widespread in the drier areas of the earth (Figure
I‐1).
Figure I‐1: Map of Calcisol distribution in the world from FAO
Some soils originated from calcareous parent materials can be calcareous throughout their
profile. This will generally occur in the arid regions where precipitation is scarce. In other soils,
CaCO3 has been leached from the upper horizons, and accumulated in B or C horizons. These
lower CaCO3 layers can be brought to the surface after deep soil cultivation (Brady and Weil,
1999).
In some soils, the CaCO3 deposits are concentrated into layers that may be very hard and
impermeable to water. These caliche layers are formed by rainfall leaching the salts to a depth
in the soil at which water content is so low that carbonates precipitate (Jackson and Erie,
1973).
Soils can also become calcareous through long periods of irrigation with water containing
dissolved CaCO3 (Hagin and Tucker, 1982).
Calcareous soils are alkaline because of the presence of CaCO3, which dominates their
chemistry. The carbonates are characterized by a relatively high solubility, reactivity, and
FIELD EXPERIMENTS Introduction
10
alkaline nature; their dissolution results in a high solution bicarbonate (HCO3‐) concentration
which buffers the soil in the pH range of 7.5 to 8.5:
CaCO3 + H2O Ca2+ + HCO3‐ + OH‐
Usually, the pH does not exceed 8.5 regardless of the CaCO3 concentration, unless a significant
quantity of sodium is present (Lindsay, 1979). Calcareous soils have 100% base saturation and
calcium is the dominant cation in the exchange complex and in the soil solution (Loeppert and
Suarez, 1996).
Problems associated with carbonated soils
Calcareous soils cover more than 30% of the earth’s land surface (Chen and Barak; 1982) and
their CaCO3 content varies from a few percent to 95% (Marschner, 1995).
The carbonate minerals, due to their relatively high solubility, reactivity, and alkaline
character, act as pH buffers; the pH values of most calcareous soils are within the range of 7.5
to 8.5. It is because of these properties that carbonates play an important role in pedogenic,
chemical and rhizosphere processes in the soil (Loeppert and Suarez, 1996).
Pedogenetic processes can be characterized by the dynamics of the most soluble elements on
the specific alteration conditions of the site. In areas of low rainfall, calcium carbonate is the
characteristic mineral and its dynamics describe the pedogenesis. Moreover, the existence of
alkaline carbonate controlling the chemical environment of the soil through its buffering action
determines the availability of many nutrients, the humidification, the flocculation of colloids
and, in general, restrains other chemical evolutions of the soil (Vallejo, 1986).
Calcareous soils in the Mediterranean area are expected to favour metal immobilization
because of the presence of CaCO3, a high pH, and the climatic conditions (low rainfall, high
evapotranspiration), which favour the accumulation of metals in the soil’s surface layer. In
such conditions, metal bioavailability patterns are difficult to predict, being modulated by the
action of carbonates and interactions with other reactive soil phases such as organic matter or
oxides. Recent work on microbial properties in metal‐contaminated calcareous agricultural
soils has reported such complex interactions (Calvarro et al., 2014).
Mediterranean soils often show relatively high values of pH and carbonate content which
confers a high metal sorption capacity and therefore a low risk of metal toxicity. Nevertheless,
previous works have shown that there is a significant fraction of potentially available metals in
calcareous Mediterranean soils (Santiago‐Martin et al., 2013)
According to Frische et al., (2003), bioavailability can be defined as a complex process of mass
transfer and uptake of contaminants into soil‐living organisms, depending on substance
properties, soil properties, the biology of the organisms, and climatic influences. The dynamics
of bioavailability comprise 2 phases: a physico‐chemically driven desorption process and a
physiologically driven uptake process by a specific biotic organism (Peijnenbur, 2003)

FIELD EXPERIMENTS Introduction
11
Metal availability patterns in calcareous soils cannot be explained by neither the pH value nor
the carbonate content alone, but must be viewed in combination with the content and
composition of organic matter (OM) and the fine mineral fraction, thus highlighting the need
for further study of these soil fractions and their role in the metal (bio) availability (Santiago‐
Martin et al., 2013)
Reported symptoms of impaired nutrition in calcareous soils are chlorosis and stunted growth.
This is attributed to the high pH and reduced nutrient availability, as direct toxicity of
bicarbonate ions (HCO3‐) to physiological and biochemical systems are much less likely
(Pearce et al., 1999). Nonetheless, excess HCO3‐ can be harmful for crop growth due to the
inhibition of protein synthesis and respiration and decreased nutrient absorption (Alhendawi,
1997).
The presence of CaCO3 directly or indirectly affects the chemistry and availability of nitrogen,
phosphorus, magnesium, potassium, manganese, zinc, copper and iron (Marschner, 1995;
Obreza et al., 1993).
Zinc (Zn) is an essential microelement for plant growth in all kinds of soils. It influences many
biological processes, including carbohydrate metabolism, cell proliferation and phosphorus‐Zn
interactions (Rengel, 2015; Rehman et al., 2012). Excess HCO3‐ or Zn deficiency inhibits
photosynthesis and PS II, which influences photosynthetic and chlorophyll fluorescence
parameters (Mohsenian, 2015). HCO3‐, which is considered the key factor that influences Fe
deficiency chlorosis and Zn deficiency in many plant species (McCray, 1992) is the major anion
found in calcareous soils in karst regions.
Iron chlorosis is frequent in dicot (Strategy I) plants, mainly in calcareous soils (Römeld,
1986a). In these soils, Fe bioavailability can be severely limited because of the low solubility of
iron oxides and hydroxides at high pH (Hell, 2003). Moreover, the elevated bicarbonate
concentration of these soils, besides its effect on pH, can inhibit the Fe uptake mechanisms
(Lucena, 2007). The high demand for Fe in the soil together with its low availability in soils
leads to a competition between plant and other living organisms, being particularly strong in
alkaline soils (Colombo, 2014)
Nitrogen fertilizers should be incorporated into calcareous soils to prevent ammonium‐N
volatilization. The availability of phosphorus and molybdenum is reduced by the high levels of
calcium and magnesium that are associated with carbonates. In addition, iron, boron, zinc, and
manganese deficiencies are common in soils that have a high CaCO3 due to reduced solubility
at alkaline pH values (Marschner, 1995; Brady and Weil, 1999).
Calcium carbonate provides a reactive surface for adsorption and precipitation reactions, for
example, of phosphate, trace metals and organic acids (Talibudeen and Arambarri, 1964;
Amer et al., 1985). Carbonate reactivity influences the rate of volatilization of ammonia
(Ryan et al., 1981). Carbonate affects also rhizosphere processes, especially those processes in

FIELD EXPERIMENTS Introduction
12
which acidification is an important factor. For example, the Fe‐deficiency response of
dicotyledons involves the exudation of protons and acidification of the rhizosphere. The
effectiveness of Fe‐deficiency stress response is therefore negatively influenced by the
neutralization of plant‐produced acidity, which is influenced by the reactivity of the carbonate
phase (Loeppert et al., 1988; Morris et al., 1990).
Calcicole and Calcifuge plants
Soils differ greatly in their pH and Ca concentration, particularly in non‐cultivated soils. During
evolution, plant species have adapted to these variations of pH and Ca conditions. For this
reason, there are large differences between plant species and even between varieties of a
single species in terms of tolerance. Plant species are therefore divided into calcicoles and
calcifuges, depending on their level of tolerance (Lee et al., 1998)
The calcifuge plants are unable to develop efficient responses mechanisms to the deficiency of
Fe, P, Zn and other micronutrients. Calcifuges struggle to solubilize these elements from the
sparely soluble sources in calcareous soils and to keep them metabolically active in sufficient
quantities in their tissues when growing on calcareous soils. In contrast, calcicoles have
developed numerous mechanisms for mobilizing nutrients from different forms. Especially
relevant is the ability to make iron available, since in the limestone soils the exchangeable and
soluble Fe concentrations are much lower than those required for adequate plant growth
(Lindsay, 1984).
There are clear differences in the metabolism of Ca2+ between the two groups of plants. Many
calcareous species contain high levels of intracellular Ca2+ and high concentrations of malate.
Contrastingly, calcifuges are usually poor in soluble Ca2+and precipitate Ca in the form of
calcium oxalate. Species and even cultivars can considerably differ in this capacity to form
crystals of calcium oxalate or other crystals that contain calcium (Bangerth, 1979). To satisfy
their demand for Fe, plants adapted to high‐pH soils exude mainly compounds that help to
increase iron availability, such as citric acid; this forms a soluble Fe‐citrate chelate which is
more available for uptake. Grasses (Poaceae) have the additional power of solubilizing Fe by
exuding phytosiderophors (Marschner and Kissel, 1986), and this exudation may be related to
calcicole/calcifuge behaviour (Gries and Runge, 1992, 1995).
However, a main and most puzzling problem of species richness in relation to
calcicole/calcifuge behaviour is the question why the calcifuge plants have "lost" their ability to
develop in calcareous soil and to compete successfully for survival on slightly acid soils. It
seems like the development of tolerance to strongly acid conditions and the ability to detoxify
or avoid uptake of Al ions is in some way related to their loss of ability to process the critical
nutrients available in high pH soils. Some calcifuges may respond to a "signal'' of Al at their
root surfaces by exuding compounds that may be similar or identical to compounds exuded by
calcicoles at nutrient deficiency; e.g. organic acids like citrate, malate or oxalate (Jones, 1998;
Schötteldreier et al., 2001). This would mean that calcifuges and calcicoles respond to different

FIELD EXPERIMENTS Introduction
13
types of "signals" with a similar reaction, which forms the real basis of calcicole and calcifuge
behaviour. Detailed studies comparing organic acid exudation under Al toxicity and P
deficiency revealed differences in both time frame and sites of exudation patterns (Kochian et
al., 2004).
Germund Tyler (2003) propose that the response to the "deficiency signal" is a primary
reaction of plants, whereas the response to an "ion toxicity signal" would be a secondary
evolutionary property. This secondary property may take evolutionary time to develop, which
would be an additional explanation of the fact that we have fewer calcifuge plants. It is not
easy to prove such a hypothesis experimentally.
Natural populations of Arabidopsis thaliana
The analysis of natural variation in wild species has begun to elucidate the molecular bases of
phenotypic differences related to plant adaptation to distinct natural environments and to
determine the ecological and evolutionary processes that maintain this variation (Mitchell‐
Olds et al., 2007). The model plant A. thaliana shows a wide range of genetic and trait
variation among wild‐type lines collected in the field. In addition, because of the unparalleled
availability of genomic resources, the potential of A. thaliana for studies of natural genetic
variation is increasingly recognized (Shindo et al., 2006).
When different Arabidopsis accessions are grown together and compared under similar
environmental conditions, genetic variation can be observed in many traits. Phenotypic
variation in morphological and physiological traits is abundant and enables almost every A.
thaliana accession to be distinguished from other accessions collected at different locations.
This variation is of interest from two general points of view. First, analysing this natural
variation makes it possible to identify the function of individual genes. Second, analysis of
natural variation has an increasing interest from an ecological and evolutionary perspective
(Kliebenstein et al., 2001; Remington & Purugganan, 2003). Thus, the patterns of phenotypic
and molecular variation observed are analysed with the aim of inferring the mechanisms
generating and maintaining this variation, and to identify which allelic variants are adaptive
under specific environmental conditions (Koornneef et al., 2004).
A large‐scale sampling by SDM (Species Distribution Model) throughout Catalonia located new
wild populations of A. thaliana thaliana (Busoms et al., 2015a). The systems that characterize
adjacent inland areas where A. thaliana grows in Catalonia are the Catalan Costal depression
and Catalan Pre‐Coastal Range. In the northern half of Catalan Coast A. thaliana can be found
only in two specific areas: (1) Cap de Creus and Golf de Roses and (2) Serra Litoral (Busoms,
2015a) (Figure I‐2)
FIELD EXPERIMENTS Introduction
14
Geology of Catalonia
Catalonia has a Mediterranean climate, except for the Val d’Aran, which has an oceanic
climate; this valley is orientated and open to the Cantabrian Sea (www.meteo.cat). The
Mediterranean climate is characterized by mild winters and short, hot, dry summers;
precipitation is rare and seasonal (spring and autumn). However, there is some variation in the
interior climate zones, which can experience more extreme temperatures, lower humidity and
less rainfall. This is due to the distance from the sea; on the coast and areas near the coast, the
sea has a more moderating effect on the climate.
The Catalan region consists of three areas or units: Pyrenees, located north of Catalonia, is a
mountainous formation that connects the Iberian Peninsula with the European mainland; the
Central Depression, a structural unit forming the eastern sector of the Ebro Valley; and the
Catalan Mediterranean system, also called Catalan Coastal Ranges, alternating hills and plains
parallel to the coast.
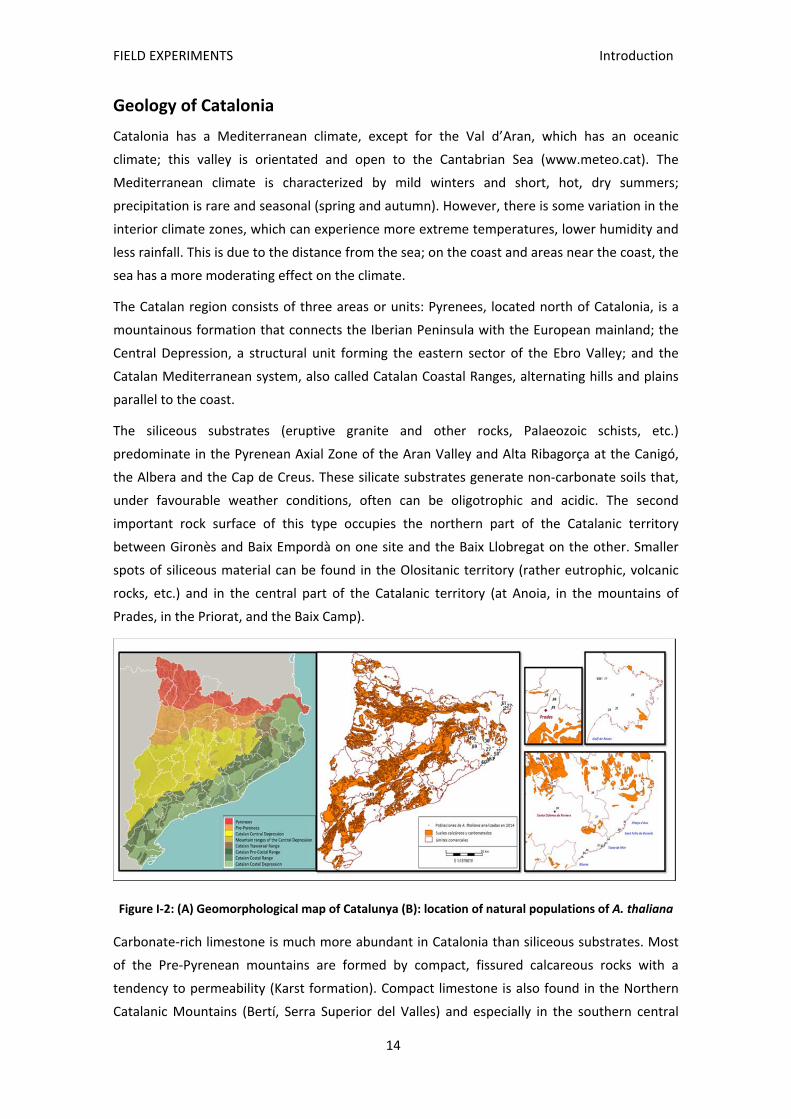
The siliceous substrates (eruptive granite and other rocks, Palaeozoic schists, etc.)
predominate in the Pyrenean Axial Zone of the Aran Valley and Alta Ribagorça at the Canigó,
the Albera and the Cap de Creus. These silicate substrates generate non‐carbonate soils that,
under favourable weather conditions, often can be oligotrophic and acidic. The second
important rock surface of this type occupies the northern part of the Catalanic territory
between Gironès and Baix Empordà on one site and the Baix Llobregat on the other. Smaller
spots of siliceous material can be found in the Olositanic territory (rather eutrophic, volcanic
rocks, etc.) and in the central part of the Catalanic territory (at Anoia, in the mountains of
Prades, in the Priorat, and the Baix Camp).
Figure I‐2: (A) Geomorphological map of Catalunya (B): location of natural populations of A. thaliana
Carbonate‐rich limestone is much more abundant in Catalonia than siliceous substrates. Most
of the Pre‐Pyrenean mountains are formed by compact, fissured calcareous rocks with a
tendency to permeability (Karst formation). Compact limestone is also found in the Northern
Catalanic Mountains (Bertí, Serra Superior del Valles) and especially in the southern central
FIELD EXPERIMENTS Specific Objectives
15
part of the range, where the karst and limestone massifs predominate, from Garraf to
Penyagolosa (Bolòs et al.,1993).
Specific Objectives
Characterization of soils able to support natural populations of A. thaliana in Catalonia
Evaluation of soil proprieties to see whether there are limiting factors related to plant
tolerance to carbonate soils.
Classification of natural accessions into different groups according to their tolerance to
carbonate soils.
Materials and methods
Soil analysis
For three years, soil was collected from the original sites of natural populations of A. thaliana
in Catalonia. Rhizosphere soils were sampled to analyse their physical and chemical properties.
Three independent soil analyses per site were performed: pH, water‐holding capacity, and
texture were measured using fresh soil following the methods described by Carter & Gregorich
(2006). Organic matter and carbonate content were analysed following the procedures
described by Black et al., (1965) and Loeppert et al., (1996). Sulphate concentrations were
determined per Rehm & Caldwell (1968) and chloride concentrations were measured with a
chloride ion‐selective Electrode (Crison Instruments, Barcelona).
Ionomic analysis of soils were made in collaboration with Aberdeen University. To characterize
the elemental composition of the soils, analyses were performed on the 2‐mm fraction
samples. Soil samples (5g) were dried for 42h at 60°C in 50‐mL Falcon tubes. The extraction
method, adapted from Soltanpour and Schwab (1977) consisted of a digestion with 20 mL of 1
M NH4HCO3, 0,005 M diaminetriaminepentaacetic acid, and 5 mL of pure water during 1h of
shaking on a rotary shaker at low speed. Each sample was gravity filtered through qualitative
filter papers until obtaining approximately 5 mL of filtrate, which was transferred into Pyrex
tubes; 0.7 mM trace grade HNO3 was added and digested at 115°C for 4,5 h. Each sample was
diluted to 6.0 mL with 18 MV water and analysed for As, B, Ca, Cd, Co, Cu, Fe, K, Li, Mg, Mn,
Mo, Na, Ni, P, Rb, S, Se, Sr and Zn content (ppb) on an Elan DRCe ICP‐MS (PerkinElmer Sciex).
National Institute of Standards and Technology traceable calibration standards
(ULTRAScientific, North Kingstown RI, USA) were used for the calibration.
FIELD EXPERIMENTS Materials and methods
16
Plants analysis
Ionomic analysis of leaf tissue were made in collaboration with Aberdeen University.
Plants from the common garden experiments were sampled by removing 2–3 leaves (1–5 mg
dry weight) and washed with 18 MΩ water before placing into Pyrex digestion tubes. Sampled
plant material was dried for 42h at 60 ºC, and weighed before open‐air digestion in Pyrex
tubes using 0,7 mL concentrated HNO3 (Mallinckrodt AR select grade) at 110 ºC for 5 h. Each
sample was diluted to 6.0 mL with 18 MΩ water and analysed for As, B, Ca, Cd, Co, Cu, Fe, K, Li,
Mg, Mn, Mo, Na, Ni, P, Rb, S, Se, Sr and Zn content (ppm) on an Elan DRCe ICP‐MS
(PerkinElmer Sciex). NIST traceable calibration standards (ULTRAScientific, North Kingstown RI)
were used for the calibration.
Garden experiments
To detect local adaptation to carbonate soil common garden experiments were conducted at
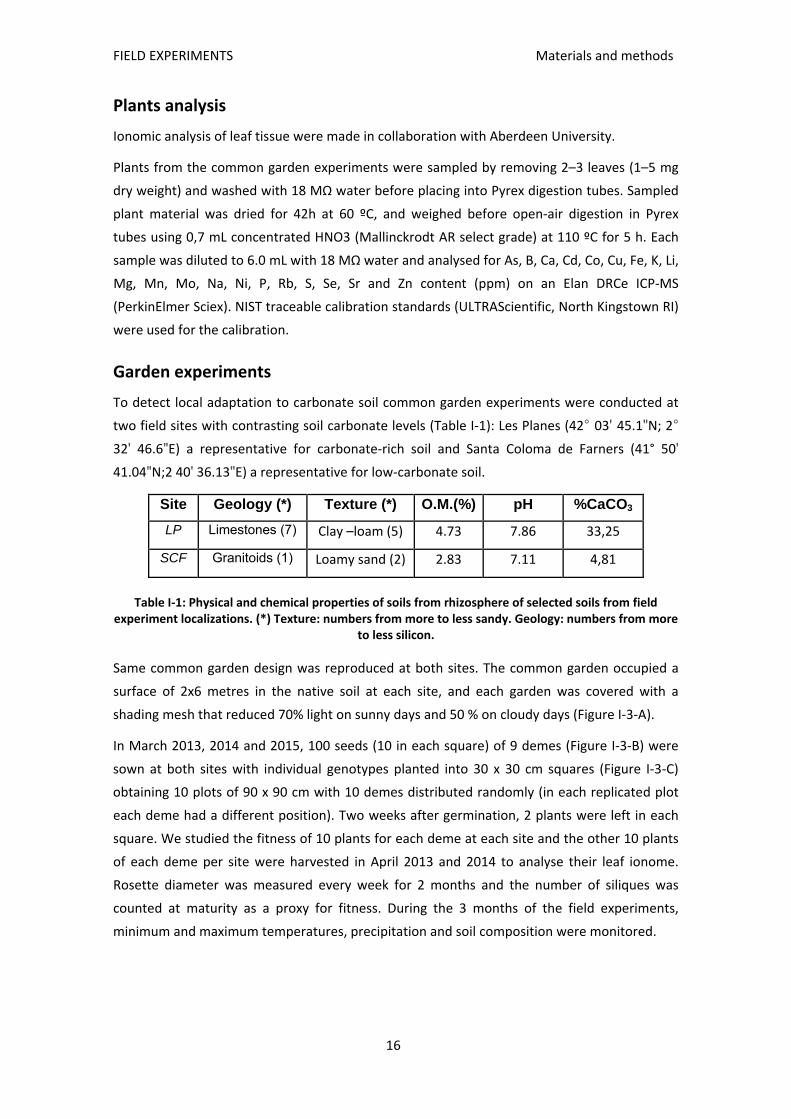
two field sites with contrasting soil carbonate levels (Table I‐1): Les Planes (42° 03ʹ 45.1ʺN; 2°
32ʹ 46.6ʺE) a representative for carbonate‐rich soil and Santa Coloma de Farners (41° 50ʹ
41.04ʺN;2 40ʹ 36.13ʺE) a representative for low‐carbonate soil.
Site Geology (*) Texture (*) O.M.(%) pH %CaCO3
LP Limestones (7) Clay –loam (5) 4.73 7.86 33,25
SCF Granitoids (1) Loamy sand (2) 2.83 7.11 4,81
Table I‐1: Physical and chemical properties of soils from rhizosphere of selected soils from field experiment localizations. (*) Texture: numbers from more to less sandy. Geology: numbers from more
to less silicon.
Same common garden design was reproduced at both sites. The common garden occupied a
surface of 2x6 metres in the native soil at each site, and each garden was covered with a
shading mesh that reduced 70% light on sunny days and 50 % on cloudy days (Figure I‐3‐A).
In March 2013, 2014 and 2015, 100 seeds (10 in each square) of 9 demes (Figure I‐3‐B) were
sown at both sites with individual genotypes planted into 30 x 30 cm squares (Figure I‐3‐C)
obtaining 10 plots of 90 x 90 cm with 10 demes distributed randomly (in each replicated plot
each deme had a different position). Two weeks after germination, 2 plants were left in each
square. We studied the fitness of 10 plants for each deme at each site and the other 10 plants
of each deme per site were harvested in April 2013 and 2014 to analyse their leaf ionome.
Rosette diameter was measured every week for 2 months and the number of siliques was
counted at maturity as a proxy for fitness. During the 3 months of the field experiments,
minimum and maximum temperatures, precipitation and soil composition were monitored.

FIELD EXPERIMENTS Results & Discussion
17
Figure I‐3: (A) Pictures of common garden plots used in a transplant experiment in LP and SCF. (B) Demes associates to classifications: %CaCo3, pH level, %O.M, in yellow demes selected to do the
transplant experiments. (C) Schema‐Representation of each plant distribution inside plots.
Results & Discussion
Characterization of the driving factor for enhanced tolerance to carbonate soils
To test which the most relevant agent is driving the divergent selection of differential
tolerance to carbonate soils in natural populations of A. thaliana, the demes were ordered
according to the increasing values of the following soil parameters found in their original
habitat: concentration of carbonates, soil pH, and soil organic matter. The resulting series from
lowest to highest value were divided into 3 groups, each containing the same number of
demes (Figure I‐4).

FIELD EXPERIMENTS Results & Discussion
18
Figure I‐4: Classification of 24 demes in relation to (A) CaCO3%, (B) pH level, (C) Organic Matter% in the original soils for 3 years.
FIELD EXPERIMENTS Results & Discussion
19
Reciprocal transplant experiment
Fitness analysis
For assaying carbonate tolerance in soil, a total of 9 demes were selected, with
representations of demes from each group, and sown in both common gardens.
Fitness based on siliqua production was a more reliable parameter than rosette diameter. The
number of siliqua is a parameter directly related to the adaptability and survival of a plant,
while its vegetative size can be variable and a non‐indicative trait of carbonate tolerance.
Therefore, siliqua number per plant, not rosette diameter, was used for a proxy of fitness.
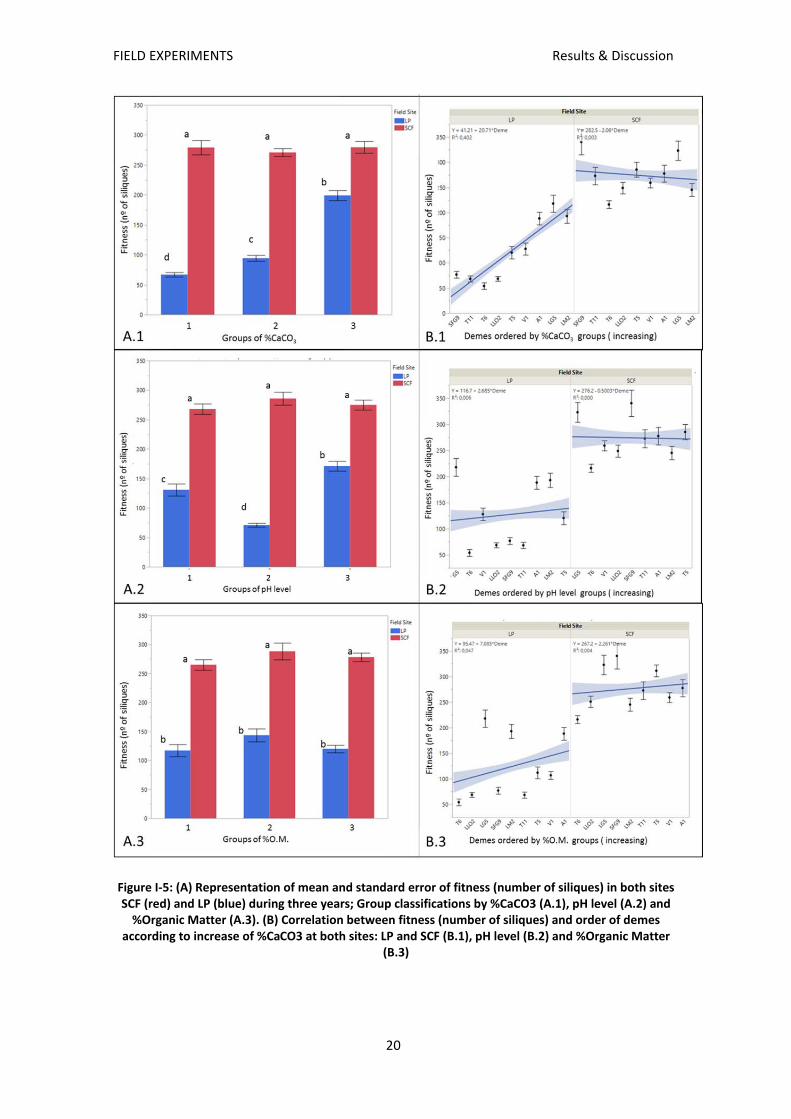
After three years of measurements it was found that plants from all groups had higher fitness
on low carbonate soil (SCF) than in carbonate‐rich substrate (LP).
In Figure I‐5 it can be observed that plants from all groups (regardless the variables used for
classification) had similar fitness on low carbonate soil (SCF). In SCF there were no intergroup
differences in any of the analysed variables (Figure I‐5 A‐1, 2 and 3). Also no correlation was
found between fitness of the demes and any of the considered parameters (R² <0,005) (Figure
I‐5 B‐1, 2 and 3).
Contrastingly, on the carbonate‐rich substrate there was a strong variation in fitness.
Considering the percentage of soil organic matter as the grouping variable, all groups growing
at LP had lower fitness than those grown in SCF, but there were no intergroup differences
(Figure I‐5 A.3). Moreover, no correlation with the fitness of the demes was observed (R²
<0,005) (Figure I‐5 B.3). Therefore, the percentage of organic matter in the original soils is not
a factor that is directly related with the plants’ tolerance to carbonated soils.
Intergroup differences were observed for both: CaCO3% and pH level. The results for both
variables agree that group number 3 is the one with highest fitness (Figure I‐5 A.1‐2). The
composition of demes of group number 3 for pH level and CaCO3 only differ in one deme: LG5.
Curiously, this deme is from group 1 in relation to pH level groups (Figure I‐5 B‐2); this
differential behaviour explains the high variability in group 1 regarding the pH level.
The correlation of groups and fitness in LP exists only for the variable: CaCO3 % (R² >0,3)
(Figure I‐5 B.1) while none is found for groups classified by pH level (R² <0,05) (Figure I‐5 B.2).
For this reason, from now on, we assign the % of carbonate in the original soil as the leading
factor driving the difference in carbonate tolerance in the natural population of A. thaliana
thaliana. Consequently, all further analysis and graphs are done grouping the demes by the
CaCO3 % in their native soil.
FIELD EXPERIMENTS Results & Discussion
20
Figure I‐5: (A) Representation of mean and standard error of fitness (number of siliques) in both sites SCF (red) and LP (blue) during three years; Group classifications by %CaCO3 (A.1), pH level (A.2) and %Organic Matter (A.3). (B) Correlation between fitness (number of siliques) and order of demes
according to increase of %CaCO3 at both sites: LP and SCF (B.1), pH level (B.2) and %Organic Matter (B.3)
FIELD EXPERIMENTS Results & Discussion
21
Ionomic analysis
Sodium: At SCF Na concentrations were similar for all groups, while at LP intergroup
differences were observed: plants from group 1 had distinctively higher Na leaf concentrations
than those from group number 3 (Figure I‐6)
Potassium: Soil concentrations of potassium at SCF were much lower than at LP. Leaf K
concentrations were not differing between groups in neither soil (Figure I‐6).
Calcium: Soil Ca concentrations were similar at both experimental sites. However, plants from
all groups grown in LP had higher leaf Ca concentrations than those in SCF (Figure I‐6). There
are statistically significant differences (p≤0,005) between group 1 and group 3 grown in LP,
(group 1 accumulate more calcium than group 3).
Magnesium: soil concentration of Mg was higher in SCF than in LP, Mg concentration in leaf
was also higher for all groups grown in SCF, and no differences between groups were observed
neither in SCF, nor LP (Figure I‐6).
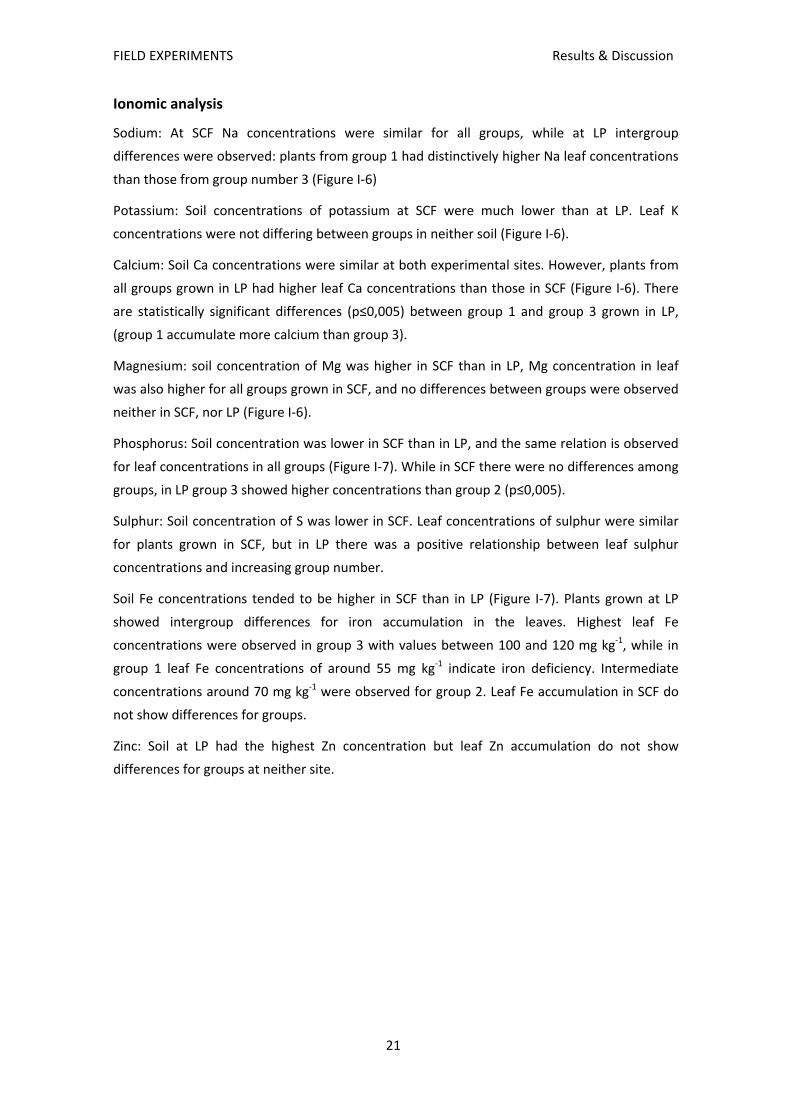
Phosphorus: Soil concentration was lower in SCF than in LP, and the same relation is observed
for leaf concentrations in all groups (Figure I‐7). While in SCF there were no differences among
groups, in LP group 3 showed higher concentrations than group 2 (p≤0,005).
Sulphur: Soil concentration of S was lower in SCF. Leaf concentrations of sulphur were similar
for plants grown in SCF, but in LP there was a positive relationship between leaf sulphur
concentrations and increasing group number.
Soil Fe concentrations tended to be higher in SCF than in LP (Figure I‐7). Plants grown at LP
showed intergroup differences for iron accumulation in the leaves. Highest leaf Fe
concentrations were observed in group 3 with values between 100 and 120 mg kg‐1, while in
group 1 leaf Fe concentrations of around 55 mg kg‐1 indicate iron deficiency. Intermediate
concentrations around 70 mg kg‐1 were observed for group 2. Leaf Fe accumulation in SCF do
not show differences for groups.
Zinc: Soil at LP had the highest Zn concentration but leaf Zn accumulation do not show
differences for groups at neither site.

FIELD EXPERIMENTS Results & Discussion
22
Figure I‐6: (Leaf‐left graphic): Analysis of mineral nutrient in leaves of three CaCO3 groups: Na+, K+, Ca+,
Mg+ (µg/g) grown in LP & SCF. (Soil‐right graphic): same mineral nutrients analysed in soils of LP & SCF
FIELD EXPERIMENTS Results & Discussion
23
Figure I‐7: (Leaf‐left graphic): Analysis of mineral nutrient in leaves of three CaCO3 groups: P, S, Fe, Zn
(µg/g) grown in LP and SCF. (Soil‐right graphic): same mineral nutrients analysed in soils of LP and SCF
FIELD EXPERIMENTS Results & Discussion
24
Natural habitat
All soils of our study region were located on gravel, granodiorite or granitic rocks, and
originated from similar geological bases. Nonetheless, the samples collected from 24 sites of A.
thaliana demes during three years reveal some differences in soil properties.
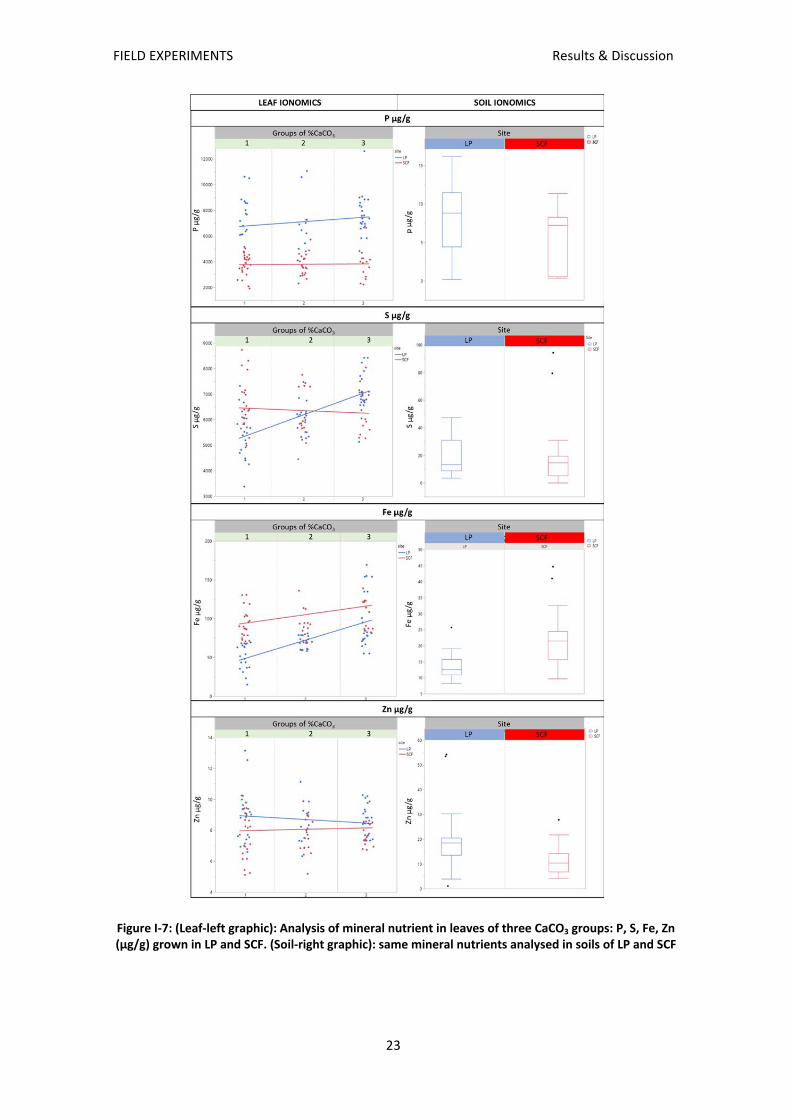
Soils underlying group 3 plants (Figure I‐8) have a high water holding capacity and the sulphate
and chloride concentrations were lower in comparison to group 1 and group 2, with lower
CaCO3%.
Figure I‐8: Means and standard deviation of (A)chloride (mg/g); (B) sulphates (mg/g); C Water Holding Capacity (WHC, mL/g); (D) Distance to the sea (Logarithm of meters to the sea) from soil samples of natural A. thaliana populations collected in 2013, 2014, 2015, and their relationship with CaCO3%
groups. Data include X sample of soils per site and year (ANEX)
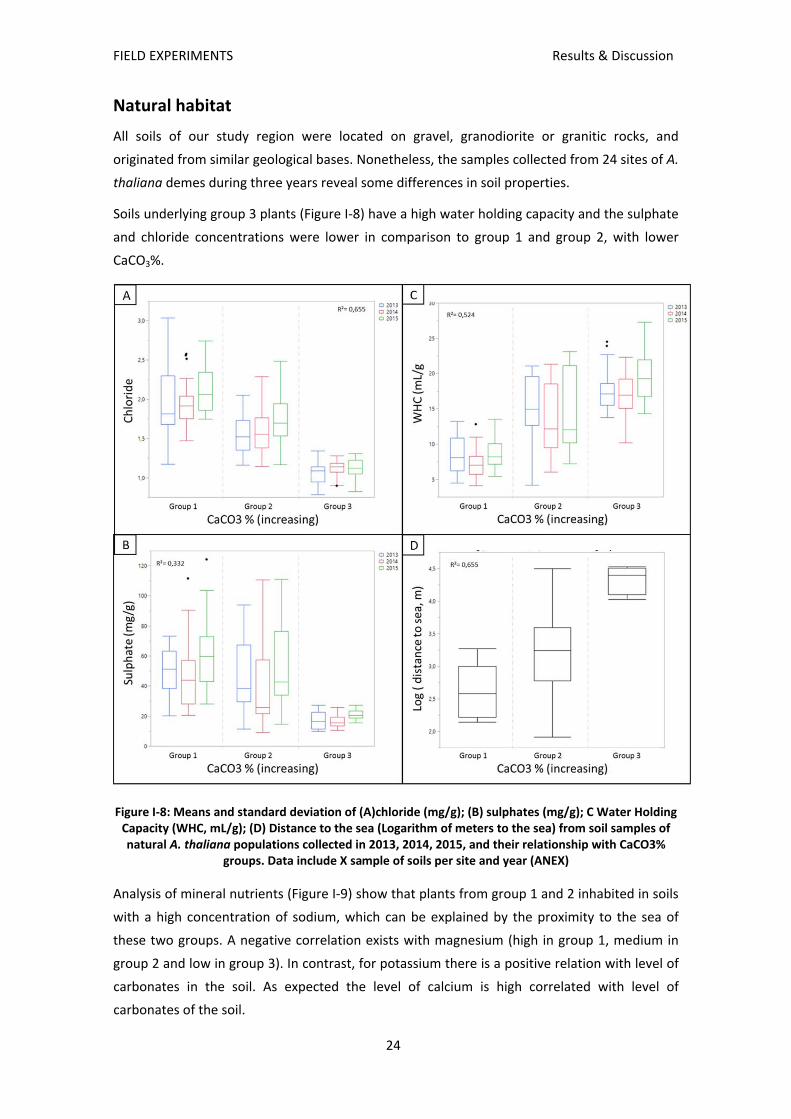
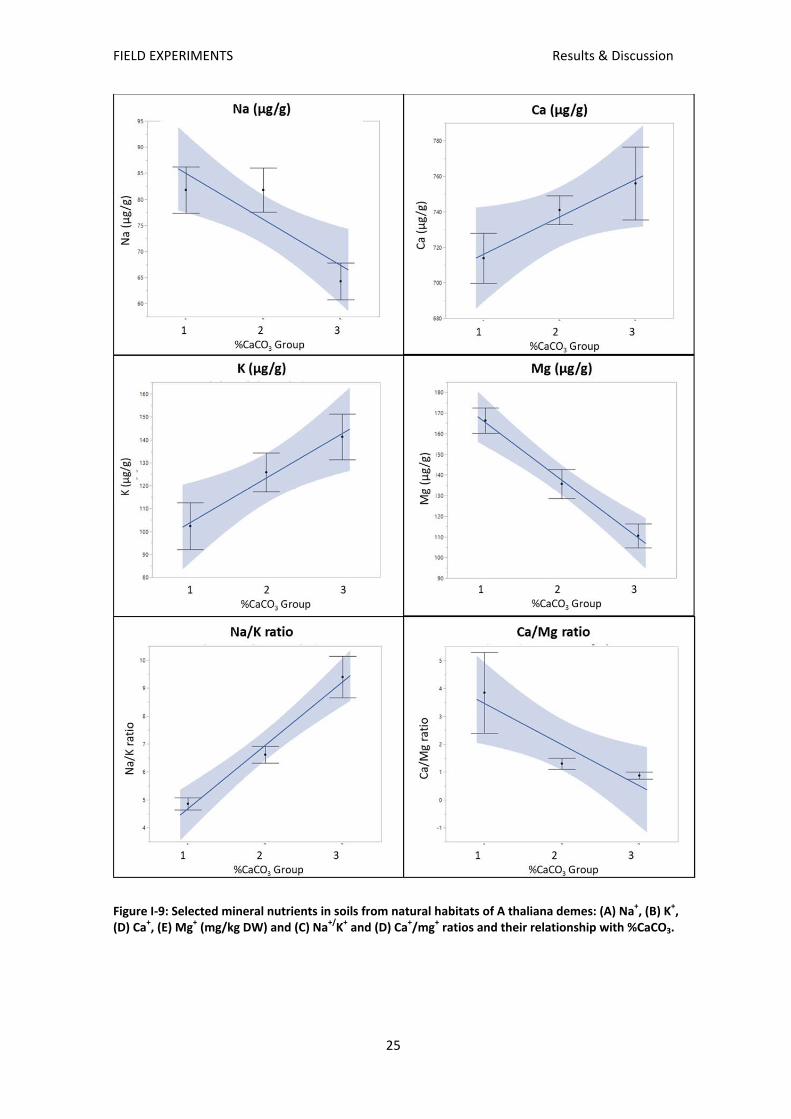
Analysis of mineral nutrients (Figure I‐9) show that plants from group 1 and 2 inhabited in soils
with a high concentration of sodium, which can be explained by the proximity to the sea of
these two groups. A negative correlation exists with magnesium (high in group 1, medium in
group 2 and low in group 3). In contrast, for potassium there is a positive relation with level of
carbonates in the soil. As expected the level of calcium is high correlated with level of
carbonates of the soil.
FIELD EXPERIMENTS Results & Discussion
25
Figure I‐9: Selected mineral nutrients in soils from natural habitats of A thaliana demes: (A) Na+, (B) K+, (D) Ca+, (E) Mg+ (mg/kg DW) and (C) Na+/K+ and (D) Ca+/mg+ ratios and their relationship with %CaCO3.
FIELD EXPERIMENTS Conclusions
26
Conclusions
The carbonate level in the original soil is the leading factor driving the difference in
carbonate tolerance of natural population of A. thaliana.
Transplanted to carbonate rich soils, those populations originating from sites near the
carbonate‐rich area with moderate carbonate soil concentrations produced more
siliques than individuals collected from sites distant to carbonate‐rich soils where soils
have no or low carbonate.
A. thaliana plants collected from sites near carbonate‐rich soils are locally adapted to
soil carbonate, potentially through mechanisms that decrease calcium uptake and
improve iron and phosphorus efficiency.
Note: Different statistical data related to this Chapter I can be found in 0 to Annex 4.

Chapter IIPhysiological traits


PHYSIOLOGICAL TRAITS Introduction
29
Introduction
Iron in plants
Iron (Fe), mainly in the form of FeIII, is very abundant in most soils, but its availability to plants
is low, especially in high pH and calcareous soils (Römheld and Marschner, 1986b). On the
other hand, excessive iron accumulation by plants may lead to toxic effects (Romera et al.,
2014; Brumbarova et al., 2015). Therefore, plants Fe acquisition is highly regulated.
Among the essential micronutrients in plants, iron is required in highest amounts. The nutrient
is required in various key processes, including photosynthesis, respiration, and chlorophyll
biosynthesis. Furthermore, the element is a component in heme proteins, the Fe‐sulfur cluster,
and other Fe‐binding sites. The chemical properties of Fe that make it suitable for redox
reactions also prone it to the generation of reactive oxygen species when it exists in a free
ionic state and in large quantities (Marschner,1995). Despite its abundance in the soil, Fe is
only slightly soluble under aerobic conditions, especially in high‐pH and calcareous soils.
Based on the mechanisms developed to facilitate mobilization and uptake of Fe, plants are
classified into Strategy I species and Strategy II species (Figure II‐1). Strategy I species include
all higher plants excluding most of the Poaceae, while Strategy II species are characteristically
found in the Poaceae (Römheld and Marschner, 1986a; Ivanov et al., 2012; Kobayashi and
Nishizawa, 2012).
The first step to iron up take of Strategy I consist in rhizosphere acidification to liberate FeIII
ions, by proton pumps and phenolic acid exdudation The main characteristic of Strategy I
species is the necessity for reduction of FeIII to FeII, by the enzyme ferric‐chelate reductase,
located in the plasma membrane of root epidermal cells. The responsible gene has been
cloned in A. thaliana (AtFRO2, Robinson et al., 1999) and in other species, such as cucumber
(CsFRO1, Waters et al., 2007) and tomato (SLFRO1, Li et al., 2004). Once iron has been
reduced, it is transported into the cell through a transporter located in the plasma membrane
of root epidermal cells, whose gene has also been cloned in A. thaliana (AtIRT1, Eide et al.,
1996), cucumber (CsIRT1; Waters et al., 2007), and tomato (SlIRT1, Eckhardt et al., 2001).
These iron‐acquisition genes are regulated at the transcriptional level by FIT (a transcription
factor bHLH type in A. thaliana, whose homologue in tomato is FER, that acts together with
two other transcription factors, bHLHH38 and bHLH39 (Colangelo and Guerinot, 2004; Jakob et
al., 2004; Yuan et al., 2008; Bauer et al., 2007). IRON REGULATED1/Ferroportin 1 (IREG1/FPN1)
and IREG2/FPN2. were reported to be expressed in the roots of iron‐deficient plants
(Colangelo and Guerinot, 2004).
To obtain Fe from the soil, Strategy II species release PS (PhytoSiderophores) from their roots,
which form stable FeIII‐chelates. These FeIII‐chelates (FeIII‐PS) are then taken up by specific
epidermal root cell plasma membrane transporters.

PHYSIOLOGICAL TRAITS Introduction
30
Both the strategy I and II plants distribute iron intra‐ and extracellularly with the help of
nicotianamine which forms stable complexes with FeII and protects cells from oxidative
damage (Kaway, 2001).
The ferrous ion is transported through the root cortex via symplast by the plasmodesms,
Apparently in the form of FeII‐nicotianamine (Stephan, 2002). Then, and still in the symplast of
the root system, FeII is oxidized to the FeIII form and is transported to the aerial parts of plant
via xylem, in the form of a soluble complex of dicitrate (Stephan and Sholz, 1993).
In the strategy I plant pea, an inward Fe2+ transport across the internal membrane of the
chloroplast was described (Shingles et al., 2001, 2002). This Fe transport was inhibited by Zn2+,
Cu2+, and Mn2+ in a competitive manner, and was activated by protons, similar to the reduction
based iron (Fe2+) acquisition mechanism in roots. More recently, Fe‐up take experiments using
bathophenantroline disulfonate (BPDS) on isolated sugar beet (Beta vulgaris) chloroplasts
described that ferric (Fe[III]) citrate was preferred over ferrous (Fe[II]) citrate as an iron source
(Solti et al., 2012). This Fe uptake was strongly connected to the photosynthetic performance
of the chloroplast and subjected to negative feedback regulation. There are evidences of a
reduction based mechanism for chloroplast Fe‐acquisition in strategy I and II plants, since the
existence of a chloroplast ferric chelate oxidoreductase (FRO) has been demonstrated at the
enzymatic activity level (Mikami et al., 2011;).
Figure II‐1: Strategy I and Strategy II iron acquisition in plants. (Mod. from: Naranjo‐Arcos & Bauer, 2016).
PHYSIOLOGICAL TRAITS Introduction
31
Iron deficiency
Iron deficiency occurs in a variety of soils, affected soils usually have a pH higher than 6
(Brown, 1971). Iron stress (deficiency or toxicity) in crop plant often represents a serious
constraint for stabilizing and/or increasing crop yields. Any factor that decreases the
availability of Fe in a soil or competes in a plant absorption process contributes to Fe‐
deficiency.
When grown under Fe deficiency, Strategy I plants induce several morphological and
physiological responses in their roots, aimed to facilitate Fe mobilization and uptake. Some of
these responses include development of subapical swelling with abundant root hairs,
development of transfer cells, enhancement of ferric reductase activity (due to enhanced
expression of AtFRO2‐like genes), enhancement of Fe2+ uptake capacity (due to enhanced
expression of AtIRT1‐like genes), acidification of the extracellular medium (due to enhanced
expression of H+‐ ATPase genes), and release of flavins and phenolics (Römheld and Marschner
1986b; Hell and Stephan 2003). The A. thaliana basic helix‐loop‐helix (bHLH) transcription
factor bHLH29/FRU, also known as FIT (for Fe deficiency‐induced transcription factor), controls
some of the root responses upon Fe limitation at different levels (for review, see Guerinot,
2000; Hindt and Guerinot, 2012; Ivanov et al., 2012).
Under Fe‐deficient conditions, Strategy II species greatly increase the production and release
of PS, the number of FeIII‐PS transporters and develop other physiological and regulatory
responses (Kobayashi and Nishizawa, 2012)
Once adequate Fe amounts have been absorbed, Fe deficiency responses need to be down
regulated to avoid toxicity and to conserve energy. The regulation of these responses is not
fully understood but several hormones and signalling substances have been proposed to
participate in the activation, like auxin (Landsberg, 1984), ethylene (Romera and Alcántara,
1994), and NO (Graziano and Lamattina, 2007), as well as in their suppression, like cytokinins
(Séguéla et al., 2008), jasmonic acid (Maurer et al., 2011), and brassinosteroids (Wang et al.,
2012). These hypotheses have been mainly focused on Strategy I species, while the role of
hormones and signalling substances on the regulation of Fe deficiency responses in Strategy II
species has been less studied.
It is well documented that Fe deficiency in field crops primarily occurs in high pH, alkaline soils
(calcareous conditions) (Hansen et al., 2003). The solubility of Fe minerals decreases
exponentially for each unit increase of pH, within the common pH range for soils (Lindsay and
Schwab, 1982). Elevated levels of bicarbonates (HCO3‐) in the soil solution will further
aggravate Fe deficiency stress (Coulombe et al., 1984).
High concentrations of bicarbonate appear to disturb plant metabolic processes which
ultimately affect growth and the nutrient uptake (Marschner, 1995; Mengel et al., 2001a,b).
In calcareous soils, bicarbonate concentrations can reach values up to 9–15 mmol kg−1 (Boxma
1972; Zuo et al., 2007), implying higher values when expressed on a molar base (mmol per L of
PHYSIOLOGICAL TRAITS Introduction
32
soil solution). When working with nutrient solutions, researchers frequently use bicarbonate
concentrations ranging from 5 to 35mmol L−1 (Wadleigh and Brown 1952; Porter and Thorne
1955; Coulombe et al., 1984).
Factors that increase bicarbonate concentration in soils, like high moisture and compaction,
can also induce Fe chlorosis (Boxma 1972; Mengel et al., 1984; Bloom and Inskeep, 1986).
However, the bicarbonate mode of action is not well understood. Due to its pH buffering
capacity, bicarbonate can maintain a high pH (7.5–8.0) in the medium, which can diminish both
Fe solubility and root ferric reductase activity, since the latter has an optimum pH around 5.0
(Römheld et al., 1983; Romera et al., 1994; Moog and Brüggemann 1994; Kosegarten et al.,
2004). Besides these pH‐mediated effects, bicarbonate can inhibit the induction of enhanced
ferric reductase activity in Fe‐deficient cucumber, sunflower (Helianthus annuus L.) and peach
(Prunus persica L.) plants (Romera et al., 1994; Alcántara et al., 2000; Bohórquez et al., 2001).
This is of special relevance to the micronutrients, iron in particular, in relation to high pH in
calcareous soils, which are renowned for so called lime‐induced chlorosis (Marschner, 1995;
Alhendawi et al., 2011).
Within the roots, bicarbonate promotes dark fixation of CO2. This process may have important
consequences for the plants mineral nutrition since the primary products of dark fixation in the
roots are malate and other organic acids (Rhoads and Wallace, 1960; Lee and Woolhouse,
1969). The mode of action of bicarbonate; however, is not yet fully understood. It is still not
clear whether the effects of bicarbonate result from the bicarbonate ion itself or from the high
pH that induce the rhizosphere or a combination of both.
Iron containing primary minerals are specifically dissolved by bacteria (e.g., Thiobacillium and
Metallogenium sp.), a weathering factor. These processes are strictly bacteria dependent and
known as “sorption, solubilization (chelation), accumulation, transformation and
precipitation”. Within the rhizosphere, these mechanisms are even more complex because of
the presence of plants roots. In fact, plants can affect microbes (abundance, diversity, and
activity), Fe availability, and the interactions between Fe minerals and microbes, as a
consequence of root activity (exudation and nutrient uptake) to satisfy their need of this
essential micronutrient. Therefore, the low supply of FeIII to the soil solution and the high Fe
demand of plants and microorganisms (for their intense growth) could induce a considerable
level of competition for Fe in the rhizosphere (Loper and Buyer 1991; Guerinot and Yi 1994).
Oxidative stress and defence
Adverse environmental conditions are reported to induce oxidative stress in plants because
the production of reactive oxygen species (ROS) (Foyer et al., 1997).
The term ROS includes any derivative of molecular oxygen (O2) that is considered more
reactive than O2 itself. Thus, ROS refers to free radicals such as superoxide (∙O2−) and the
hydroxyl radical (∙OH), but also to non‐radicals like singlet oxygen (1O2) and peroxide hydrogen

PHYSIOLOGICAL TRAITS Introduction
33
(H2O2). Because of its relative stability, H2O2 has received attention as a signal molecule
involved in the regulation of specific biological processes such as plant–pathogen interactions.
H2O2 is generated by a two‐electron reduction of O2, catalysed by certain oxidases or indirectly
via reduction or dismutation of O2− which is formed by oxidases, peroxidases, or by
photosynthetic and respiratory electron transport chains (Foyer and Noctor, 2005; Mittler et
al., 2004; Bindschedler et al., 2006; Sagi and Fluhr, 2006). Most of the cellular compartments
(chloroplast, mitochondria, peroxisome, and cytoplasm) in higher plants participate in the
generation of ROS inside the cell (Figure II‐2)
Figure II‐2: Oxidative environment and redox homeostasis in plants: dissecting out significant contribution of major cellular organelles. GO, glycolate oxidase; 3PGA, 3‐phosphoglycerate; RuBisCo, ribulose 1,5‐bisphosphate carboxylase/oxygenase; RuBP, ribulose 1,5‐bisphosphate; SOD, superoxide dismutase; XO, xanthine oxidase; CAT, catalase; APX, ascorbate peroxidase. Mod. From Das et al.,
2015
Oxidative‐stress‐response‐related proteins were among the most affected protein categories
under Fe deficiency conditions. These changes included increases in superoxide dismutases
(CuZnSOD and MnSOD), monodehydroascorbate reductase (MDAR1), peroxidase 12 (PER12)
and a decrease in catalase (CAT‐2) (López‐Millán, 2013). These observations point to the strong
impact of Fe deficiency on redox homeostasis, not only because free Fe ions induce reactive
oxygen species (ROS) formation via Fenton reactions, acting as a prooxidant, (Halliwell and
Gutteridge 1984), but also because many proteins involved in oxidative stress, such as
peroxidases and catalase, are Fe‐containing proteins.
Iron is a constituent of several components of the electron transport chain in mitochondria
and chloroplasts, and thus iron deficiency disrupts normal electron transfer resulting in the
overproduction of ROS. Under these conditions, the high levels of ROS generated exceed the
possibility of being controlled by the antioxidant system, causing cell oxidative damage (Allen,
1997)

PHYSIOLOGICAL TRAITS Introduction
34
In its role as an enzyme constituent, Fe is part of catalase (CAT, EC 1.11.1.6), non‐specific
peroxidases (POD, EC 1.11.1.7), ascorbate peroxidase (APX, EC 1.11.1.11) and Fe superoxide
dismutase (Fe‐SOD, EC 1.15.1.1).
The labile iron pool is composed of weakly chelated iron low‐molecular‐weight compounds.
Most of this iron is FeII or FeIII associated with ligands with a low affinity for iron. Protein
synthesis during plant growth processes generates a constant flow of iron from the
extracellular environment to the cytoplasm (Kruszewski, 2003). The cytoplasmic labile iron
pool supplies iron for the synthesis of heme or [Fe‐S] clusters, and is therefore essential in
controlling numerous metabolic reactions.
Superoxide Dismutase
Superoxide radical (∙O2−) is produced at any location where an electron transfer is present and
thus in every compartment of the cell. Superoxide dismutase, converting ∙O2− to H2O2,
constitutes the first line of defence against ROS in different plant species under several stress
conditions (Elsten, 1991; Alscher et al., 2002; Blokhina et al., 2003).
The importance of SOD has been demonstrated by analysis of mutants in microbes and
animals. SOD mutants in Escherichia coli, Saccharomyces cerevisiae, Neurospora crassa, and
Drosophila melanogaster exhibit increased sensitivity to methyl viologen (paraquat), a redox‐
active compound that enhances the production of O2‐ (Carlioz and Touati, 1986; Phillips et al.,
1989; Gralla et al., 1991; Chary et al., 1994). SOD is also essential for DNA integrity and normal
life span: The E. coli and N. crassa mutations cause an increased spontaneous mutation rate,
whereas the D. melanogaster mutant has a significantly shorter life span then the wild type
(Carlioz and Touati, 1986; Phillips et al., 1989; Chary et al., 1994). Mutations in human and
mouse Cu/ZnSOD have been linked to the disease familiar amyotrophic lateral sclerosis, which
is characterized by premature neuron death (Rosen et al., 1993). Taken together, this evidence
indicates a vital role for SOD in preventing ROS generated cell damage and death in aerobically
growing organisms. SOD is also thought to be important in converting O2‐ to H2O2 during the
pathogen‐induced oxidative burst in animal phagocytic immune cells and in plant cells
(Desikan et al., 1996; Babior et al., 1997).
Based on metal co‐factor used by the enzyme, SODs are classified into three groups: iron SOD
(Fe SOD), manganese SOD (Mn SOD) and cooper‐zinc SOD (Cu/Zn SOD), and these SODs are in
different compartments of the cell (Figure II‐3). Fe SODs are located in the chloroplast, Mn
SODs in the mitochondrion and the peroxisome and Cu‐Zn SODs in the chloroplast, the cytosol
and possibly in the extracellular space.
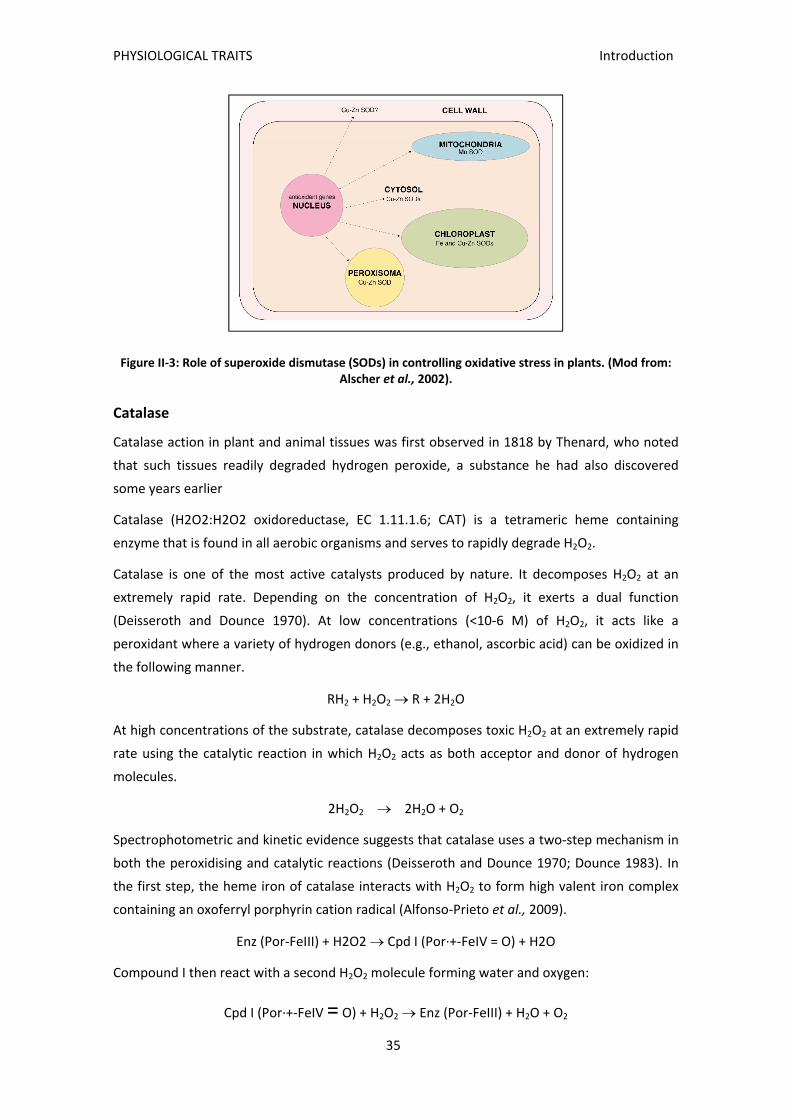
PHYSIOLOGICAL TRAITS Introduction
35
Figure II‐3: Role of superoxide dismutase (SODs) in controlling oxidative stress in plants. (Mod from: Alscher et al., 2002).
Catalase
Catalase action in plant and animal tissues was first observed in 1818 by Thenard, who noted
that such tissues readily degraded hydrogen peroxide, a substance he had also discovered
some years earlier
Catalase (H2O2:H2O2 oxidoreductase, EC 1.11.1.6; CAT) is a tetrameric heme containing
enzyme that is found in all aerobic organisms and serves to rapidly degrade H2O2.
Catalase is one of the most active catalysts produced by nature. It decomposes H2O2 at an
extremely rapid rate. Depending on the concentration of H2O2, it exerts a dual function
(Deisseroth and Dounce 1970). At low concentrations (<10‐6 M) of H2O2, it acts like a
peroxidant where a variety of hydrogen donors (e.g., ethanol, ascorbic acid) can be oxidized in
the following manner.
RH2 + H2O2 R + 2H2O
At high concentrations of the substrate, catalase decomposes toxic H2O2 at an extremely rapid
rate using the catalytic reaction in which H2O2 acts as both acceptor and donor of hydrogen
molecules.
2H2O2 2H2O + O2
Spectrophotometric and kinetic evidence suggests that catalase uses a two‐step mechanism in
both the peroxidising and catalytic reactions (Deisseroth and Dounce 1970; Dounce 1983). In
the first step, the heme iron of catalase interacts with H2O2 to form high valent iron complex
containing an oxoferryl porphyrin cation radical (Alfonso‐Prieto et al., 2009).
Enz (Por‐FeIII) + H2O2 Cpd I (Por∙+‐FeIV = O) + H2O
Compound I then react with a second H2O2 molecule forming water and oxygen:
Cpd I (Por∙+‐FeIV = O) + H2O2 Enz (Por‐FeIII) + H2O + O2

PHYSIOLOGICAL TRAITS Objectives
36
This intermediate compound I, which can be detected in vitro and in vivo, because it alters the
spectrophotometric properties of the catalase heme. In fact, because of special kinetic
properties of catalase, compound I is utilized as an indicator of H2O2 concentrations in vivo
(Oshino et al., 1975).
Phenolic compounds in root exudates
Iron deficient Strategy I plant species have long been known to increase efflux of root exudates
(Cesco et al., 2010). Some species, such as A. thaliana thaliana, produce phenolic compounds
(Fourcroy et al., 2014; Schmid et al., 2014) while other species, including sugar beet, cucumber
and melon, produce flavin compounds (Susin et al., 1994; Welkie, 2000; Rodríguez‐Celma et
al., 2011). Although the function of flavin compounds in plant Fe deficiency is not well defined,
they may function in reduction or complexation of extracellular Fe to facilitate Fe acquisition
(Cesco et al., 2010; Sisó‐Terraza et al., 2016b). Proteins involved in riboflavin synthesis
increased in abundance in response to Fe deficiency or Fe deficiency in alkaline conditions
(Rellán‐Álvarez et al., 2010; Rodríguez‐Celma et al., 2011) and genes involved in riboflavin
biosynthesis were up‐regulated in iron‐deficient roots in alkaline conditions (Rellán‐Álvarez et
al., 2010; Rodríguez‐Celma et al., 2013).
Root secretion of coumarin‐type phenolic compounds has been recently shown to be related
to A. thaliana tolerance to Fe deficiency at high pH. Previous studies revealed the identity of a
few simple coumarins occurring in roots and exudates of Fe‐deficient A. thaliana plants, and
left open the possible existence of other unknown phenolics (Sisó‐Terraza, et al., 2016a).
Objectives
Characterization of Fe deficiency responses in contrasting two demes of A. thaliana
originally developing on soils with different carbonate contents
Evaluation of physiological parameters potentially associates with tolerance to
carbonate soils
Characterization of physiological traits in extreme behaviours
Materials and methods
Plant Culture and Experimental Design
Hydroponics
Seeds from natural habitat of two natural demes of A. thaliana, A1 and T6, were germinated,
pre‐grown and grown as indicated in Fourcroy et al., (2014) with several modifications. Seeds
were sown in 0.2 ml tubes containing 0.6 % agar prepared in nutrient solution 1/4 Hoagland,
pH 5.5. Iron was added as 45 µM Fe(III)‐EDTA. After 10 days in the growth chamber, the
PHYSIOLOGICAL TRAITS Materials and methods
37
bottom of the tubes containing seedlings was cut off and the tubes were placed in opaque 300
ml plastic boxes (pipette tip racks; Starlab, Hamburg, Germany), containing aerated nutrient
solution 1/2 Hoagland, pH 5.5, supplemented with 20 µM Fe(III)‐ EDTA. Plants were grown for
11 d and nutrient solutions were renewed weekly. After that plants (12 plants per rack) were
grown for 14 days in different treatments:
Nutrient solution 1/2 Hoagland with 0 (control) or 20 µM Fe(III)‐ethylendiaminedi (o‐
hydroxyphenylacetate) (treatment) (Fe(III)‐EDDHA); Sequestrene, Syngenta, Madrid,
Spain). Solutions were buffered at pH 5.5 (with 20 mM MES) or at 7.5 (with 5 mM
HEPES) to maintain a stable pH during the whole treatment period. Nutrient solutions
were renewed weekly. Two batches of plants were grown and analysed. Pots without
plants, containing only aerated nutrient solution (with and without Fe) were also
placed in the growth chamber and the nutrient solutions sampled as in pots containing
plants; these samples were later used as blanks for root exudate analyses.
in nutrient solution 1/2 Hoagland with 5 or 20 µM Fe(III)‐ethylendiaminedi (o‐
hydroxyphenylacetate) (Fe(III)‐EDDHA; Sequestrene, Syngenta, Madrid, Spain).
Solutions were started at pH.7.5 without buffered, to analyse changes in pH solution.
Nutrient solutions were renewed weekly. Enzymatic activities were analysed.
Cultivation in soil
Same demes, A1 and T6 were also used for soil experiments. Two different soil cultivation
experiments were performed
Plants from both natural populations of A. thaliana were grown from seeds in potted
soils from Santa Coloma de Farmers (SCF) representative of no‐carbonate soil and soil
from Les Planes (LP), representative of carbonate soil (used for field experiment in
chapter I). Plants were watered two times per week with distilled water. Measures of
growth (dimeter of rosette) were taken weekly during a month, and samples for
genotyping and ICP were taken.
Plants from both A1 and T6 were grown on universal substrate (Compo Sana
Semilleros) watered two times per week. After 21 days from sowing the plants were
watered twice a week with 20mM NaHCO. Rosette diameter was measured every
week.
Germination and plant growth (both in soil and hydroponic experiments) took place in a
controlled‐environment chamber (Conviron CMP5090, Canada), at 21ºC, 70% relative humidity
and a photosynthetic photon flux density of 220 µmol m‐2 s‐1 photosynthetic active radiation
with a photoperiod of 8 h light/16 h dark.
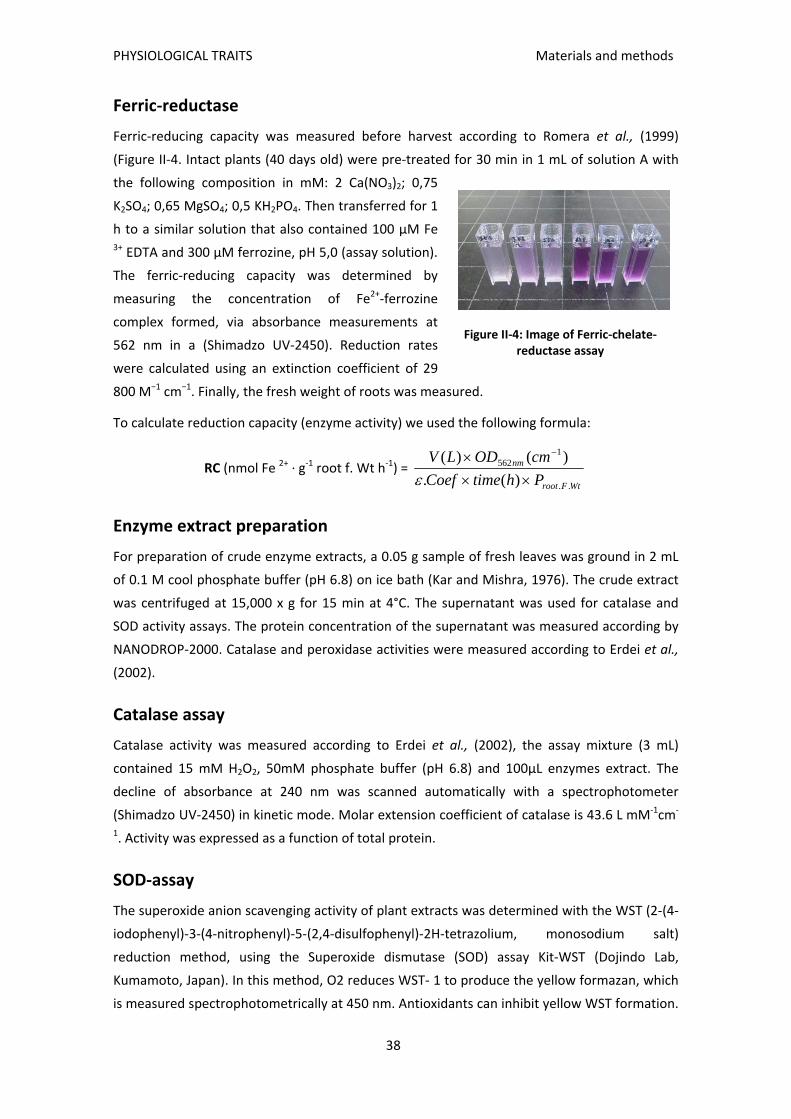
PHYSIOLOGICAL TRAITS Materials and methods
38
Ferric‐reductase
Ferric‐reducing capacity was measured before harvest according to Romera et al., (1999)
(Figure II‐4. Intact plants (40 days old) were pre‐treated for 30 min in 1 mL of solution A with
the following composition in mM: 2 Ca(NO3)2; 0,75
K2SO4; 0,65 MgSO4; 0,5 KH2PO4. Then transferred for 1
h to a similar solution that also contained 100 µM Fe 3+ EDTA and 300 µM ferrozine, pH 5,0 (assay solution).
The ferric‐reducing capacity was determined by
measuring the concentration of Fe2+‐ferrozine
complex formed, via absorbance measurements at
562 nm in a (Shimadzo UV‐2450). Reduction rates
were calculated using an extinction coefficient of 29
800 M−1 cm−1. Finally, the fresh weight of roots was measured.
To calculate reduction capacity (enzyme activity) we used the following formula:
RC (nmol Fe 2+ ∙ g‐1 root f. Wt h‐1) = WtFroot
nm
PhtimeCoef
cmODLV
..
1562
)(.
)()(
Enzyme extract preparation
For preparation of crude enzyme extracts, a 0.05 g sample of fresh leaves was ground in 2 mL
of 0.1 M cool phosphate buffer (pH 6.8) on ice bath (Kar and Mishra, 1976). The crude extract
was centrifuged at 15,000 x g for 15 min at 4°C. The supernatant was used for catalase and
SOD activity assays. The protein concentration of the supernatant was measured according by
NANODROP‐2000. Catalase and peroxidase activities were measured according to Erdei et al.,
(2002).
Catalase assay
Catalase activity was measured according to Erdei et al., (2002), the assay mixture (3 mL)
contained 15 mM H2O2, 50mM phosphate buffer (pH 6.8) and 100μL enzymes extract. The
decline of absorbance at 240 nm was scanned automatically with a spectrophotometer
(Shimadzo UV‐2450) in kinetic mode. Molar extension coefficient of catalase is 43.6 L mM‐1cm‐
1. Activity was expressed as a function of total protein.
SOD‐assay
The superoxide anion scavenging activity of plant extracts was determined with the WST (2‐(4‐
iodophenyl)‐3‐(4‐nitrophenyl)‐5‐(2,4‐disulfophenyl)‐2H‐tetrazolium, monosodium salt)
reduction method, using the Superoxide dismutase (SOD) assay Kit‐WST (Dojindo Lab,
Kumamoto, Japan). In this method, O2 reduces WST‐ 1 to produce the yellow formazan, which
is measured spectrophotometrically at 450 nm. Antioxidants can inhibit yellow WST formation.
Figure II‐4: Image of Ferric‐chelate‐reductase assay

PHYSIOLOGICAL TRAITS Materials and methods
39
All measurements were done in triplicate. The percentage of inhibition of superoxide radicals
was calculated using the above formula.
Chlorophyll concentration
Measures of chlorophyll concentration were taken with a SPAD device (CCM300, Opti‐
Sciences, Hudson, USA) after 14 days of treatment. For each plant three measures on leaves of
different age (old/medium/young) were taken in order to have more representative results.
Genotyping (PCR) AtFPN2
An SSR marker was developed based on this insertion in Ts‐1 plants (CS1552) with forward
primer 5'ACATTTGCAGCTTGGGCTAC‐3' and reverse primer 5'‐ CTCCGGTTCTGAGAGGTGAG‐3',
according to Morrissey et al., 2009
DNA was extracted using 50 mM TRIS (pH 9) and 5 mM EDTA (pH 8). After heating at 95°C for 5
min, 4μl of extract was directly used as a template for PCR. 10 μl PCR reactions contained 2μl
5X Green GoTaq® reaction buffer (Promega), 0.8 μl 25mM MgCl2, 0.8 μl 2.5 mM dNTPs, 0.4 μl
10 mM forward and reverse primer and 0.3 μl homemade Taq polymerase. A total 45 cycles
PCR was performed with 30 secs at 94°C, 15 sec annealing at 60°C followed by 30 sec
extension at 72°C. PCR product was then digested with enzyme XhoI overnight and separated
on 3% agarose gel.
Soil analysis
To characterize the elemental composition of the soils, analyses were performed on the 2‐mm
fraction samples. Soil samples (5g) were dried for 42 h at 60°C in 50‐mL Falcon tubes. The
extraction method, adapted from Soltanpour & Schwab, 1977, consisted of a digestion with 20
mL of 1 M NH4HCO3, 0,005 M diaminetriaminepentaacetic acid, and 5 mL of pure water during
1 h of shaking on a rotary shaker at low speed. Each sample was gravity filtered through
qualitative filter papers until obtaining approximately 5 mL of filtrate, which was transferred
into Pyrex tubes; 0.7 mM trace grade c. HNO3 was added and digested at 115°C for 4,5 h. Each
sample was diluted to 6.0 mL with 18 MV of water and analysed for Cd, Co, Mn and Ni content
(ppb) on an Elan DRCe ICP‐MS (PerkinElmer Sciex). National Institute of Standards and
Technology traceable calibration standards (ULTRAScientific) were used for the calibration.
Phenolic Compounds
Extraction and analysis of phenolics compounds were made in collaboration with Estación
Experimental Aula Dei

PHYSIOLOGICAL TRAITS Materials and methods
40
Extraction of phenolic compound of nutrient solutions and roots
Nutrient solutions were changed weekly and sampled at 14 days after the onset of Fe
deficiency treatment, and immediately stored at ‐20 ºC until extraction of phenolic
compounds.
Phenolic compounds in the nutrient solutions (100 ml of solution used for the growth of 4
plants) were retained in a SepPack C18 Cartridge (Waters), eluted from the cartridge with 2 ml
of 100% LC‐MS grade methanol, and the eluates stored at ‐80°C. Samples were thawed and a
300 µl aliquot was dried under vacuum (SpeedVac) alone or supplemented with 10 µl of a IS
solution (80 µM Artemicapin C and 150 µM Matairesinol). Dried samples were dissolved in
15% methanol and 0.1% formic acid to a final volume of 100 µl, and then analyzed by HPLC‐
MS.
Frozen roots (100 mg) were ground in liquid N2 using a Retsch M301 ball mill (Restch,
Düsseldorf, Germany) for 3 min and then phenolic compounds were extracted with 1 ml of
100% LC‐MS grade methanol, either alone or supplemented with 20 μl of a IS solution (37.5
μM Artemicapin C, 50 μM Esculin and 37.5 μM Matairesinol) by homogenization in the same
mill for 5 min. The supernatant was recovered by centrifugation (12,000 g at 4°C and 5 min),
and stored at ‐20°C. The pellet was re‐suspended in 1 ml of 100% methanol, homogenized
again for 5 min and the supernatant recovered. The two supernatant fractions were pooled,
vacuum dried in a SpeedVac (SPD111V, Thermo‐Savant, Thermo Fisher Scientific, Waltham,
Massachusetts, MA, USA) and dissolved with 250 μl of a solution containing 15% methanol and
0.1% formic acid. Extracts were filtered through poly‐vinylidene fluoride (PVDF) 0.45 μm
ultrafree‐MC centrifugal filter devices (Millipore) and stored at ‐80°C until analysis.
Phenolic compounds were extracted from roots and nutrient solutions as described
in Fourcroy et al., (2014), with some modifications described previously. First, extraction was
carried out without adding internal standards (IS) to identify relevant compounds. This extract
was also used to check for the presence of the
compounds used as IS and other endogenous isobaric
compounds that may co‐elute with them, since in both
cases there will be analytical interferences in the
quantification process. The extraction was then
carried out adding the following three IS compounds
(Figure II‐5): Artemicapin C, a methylenedioxy‐
coumarin, for quantification of the coumarins
scopoletin, fraxetin, isofraxidin and fraxinol; Esculin,
the glucoside form of the coumarin esculetin, for
quantification of coumarin glycosides; and the lignan
Matairesinol, for quantification of coumarinolignans.
Figure II‐5: Internal Standards used for phenolic compound quantification:
Artemicapin C, Esculin and Matairesinol
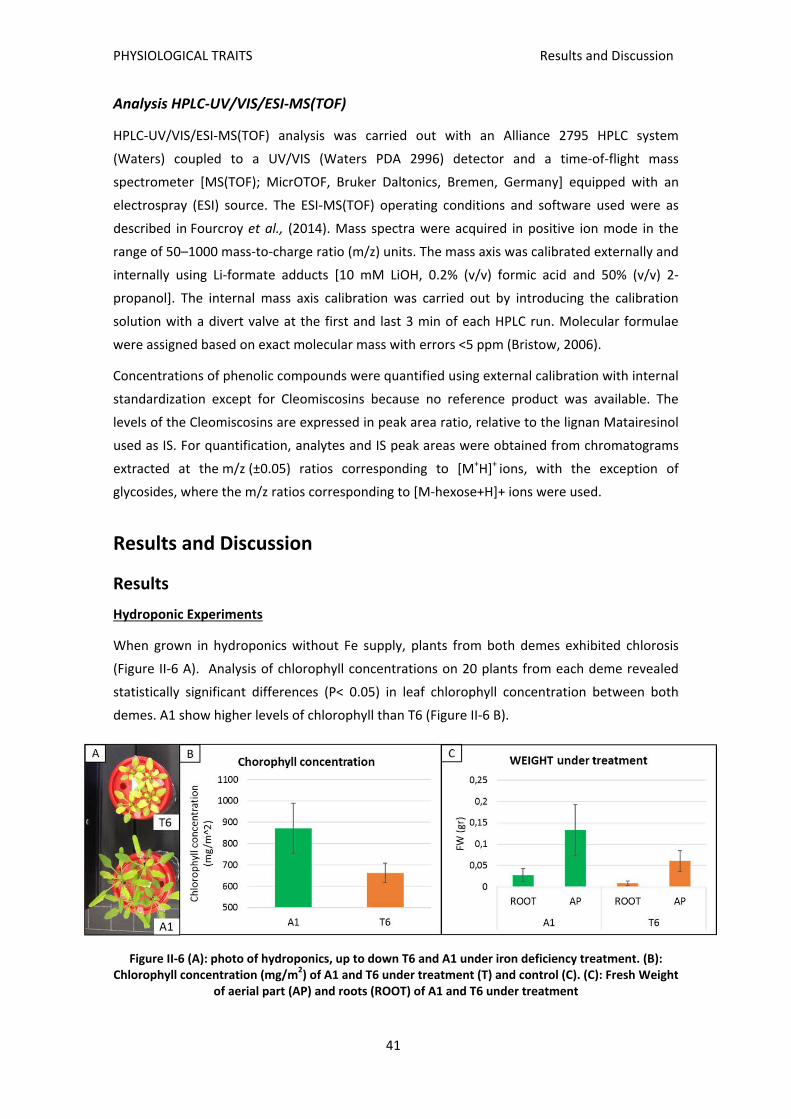
PHYSIOLOGICAL TRAITS Results and Discussion
41
Analysis HPLC‐UV/VIS/ESI‐MS(TOF)
HPLC‐UV/VIS/ESI‐MS(TOF) analysis was carried out with an Alliance 2795 HPLC system
(Waters) coupled to a UV/VIS (Waters PDA 2996) detector and a time‐of‐flight mass
spectrometer [MS(TOF); MicrOTOF, Bruker Daltonics, Bremen, Germany] equipped with an
electrospray (ESI) source. The ESI‐MS(TOF) operating conditions and software used were as
described in Fourcroy et al., (2014). Mass spectra were acquired in positive ion mode in the
range of 50–1000 mass‐to‐charge ratio (m/z) units. The mass axis was calibrated externally and
internally using Li‐formate adducts [10 mM LiOH, 0.2% (v/v) formic acid and 50% (v/v) 2‐
propanol]. The internal mass axis calibration was carried out by introducing the calibration
solution with a divert valve at the first and last 3 min of each HPLC run. Molecular formulae
were assigned based on exact molecular mass with errors <5 ppm (Bristow, 2006).
Concentrations of phenolic compounds were quantified using external calibration with internal
standardization except for Cleomiscosins because no reference product was available. The
levels of the Cleomiscosins are expressed in peak area ratio, relative to the lignan Matairesinol
used as IS. For quantification, analytes and IS peak areas were obtained from chromatograms
extracted at the m/z (±0.05) ratios corresponding to [M+H]+ ions, with the exception of
glycosides, where the m/z ratios corresponding to [M‐hexose+H]+ ions were used.
Results and Discussion
Results
Hydroponic Experiments
When grown in hydroponics without Fe supply, plants from both demes exhibited chlorosis
(Figure II‐6 A). Analysis of chlorophyll concentrations on 20 plants from each deme revealed
statistically significant differences (P< 0.05) in leaf chlorophyll concentration between both
demes. A1 show higher levels of chlorophyll than T6 (Figure II‐6 B).
Figure II‐6 (A): photo of hydroponics, up to down T6 and A1 under iron deficiency treatment. (B): Chlorophyll concentration (mg/m2) of A1 and T6 under treatment (T) and control (C). (C): Fresh Weight
of aerial part (AP) and roots (ROOT) of A1 and T6 under treatment
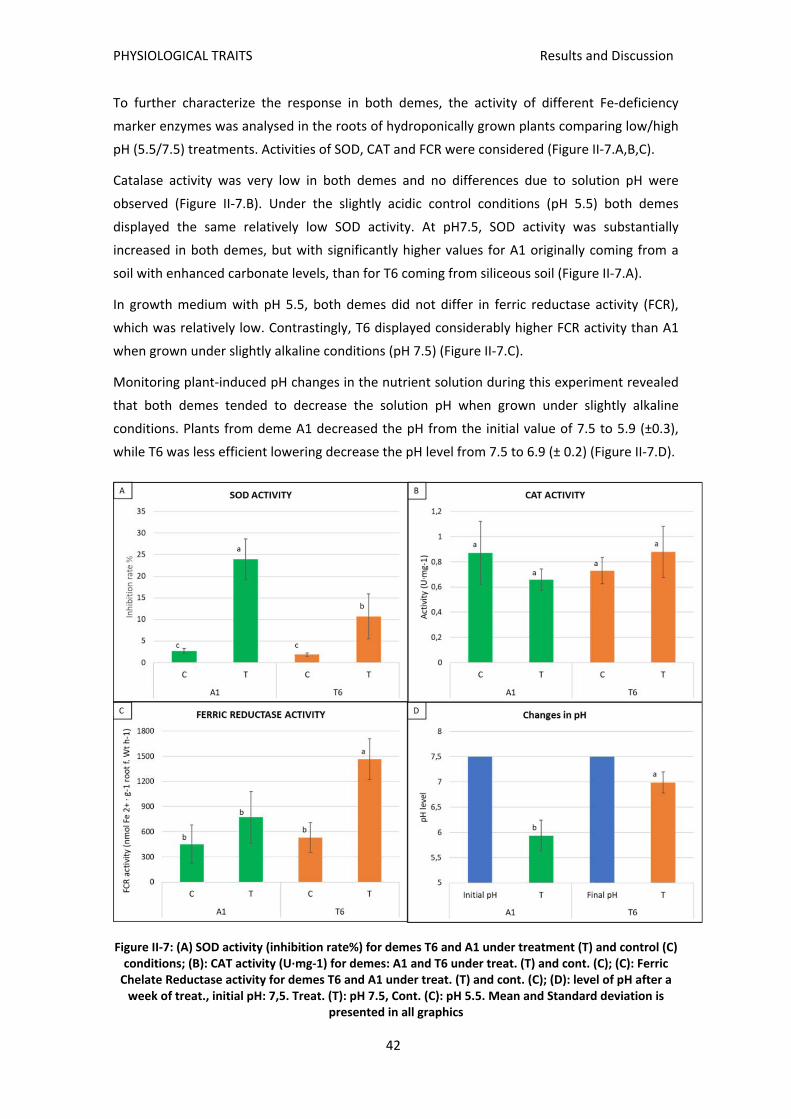
PHYSIOLOGICAL TRAITS Results and Discussion
42
To further characterize the response in both demes, the activity of different Fe‐deficiency
marker enzymes was analysed in the roots of hydroponically grown plants comparing low/high
pH (5.5/7.5) treatments. Activities of SOD, CAT and FCR were considered (Figure II‐7.A,B,C).
Catalase activity was very low in both demes and no differences due to solution pH were
observed (Figure II‐7.B). Under the slightly acidic control conditions (pH 5.5) both demes
displayed the same relatively low SOD activity. At pH7.5, SOD activity was substantially
increased in both demes, but with significantly higher values for A1 originally coming from a
soil with enhanced carbonate levels, than for T6 coming from siliceous soil (Figure II‐7.A).
In growth medium with pH 5.5, both demes did not differ in ferric reductase activity (FCR),
which was relatively low. Contrastingly, T6 displayed considerably higher FCR activity than A1
when grown under slightly alkaline conditions (pH 7.5) (Figure II‐7.C).
Monitoring plant‐induced pH changes in the nutrient solution during this experiment revealed
that both demes tended to decrease the solution pH when grown under slightly alkaline
conditions. Plants from deme A1 decreased the pH from the initial value of 7.5 to 5.9 (±0.3),
while T6 was less efficient lowering decrease the pH level from 7.5 to 6.9 (± 0.2) (Figure II‐7.D).
Figure II‐7: (A) SOD activity (inhibition rate%) for demes T6 and A1 under treatment (T) and control (C) conditions; (B): CAT activity (U∙mg‐1) for demes: A1 and T6 under treat. (T) and cont. (C); (C): Ferric Chelate Reductase activity for demes T6 and A1 under treat. (T) and cont. (C); (D): level of pH after a week of treat., initial pH: 7,5. Treat. (T): pH 7.5, Cont. (C): pH 5.5. Mean and Standard deviation is
presented in all graphics
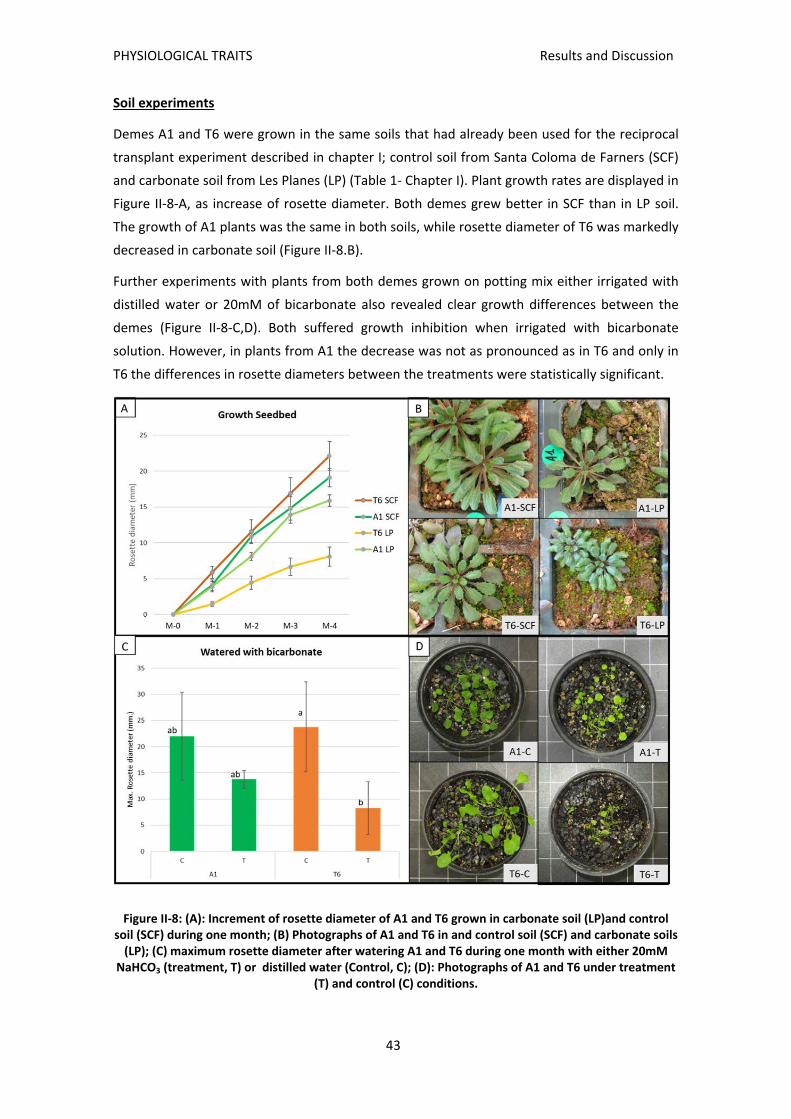
PHYSIOLOGICAL TRAITS Results and Discussion
43
Soil experiments
Demes A1 and T6 were grown in the same soils that had already been used for the reciprocal
transplant experiment described in chapter I; control soil from Santa Coloma de Farners (SCF)
and carbonate soil from Les Planes (LP) (Table 1‐ Chapter I). Plant growth rates are displayed in
Figure II‐8‐A, as increase of rosette diameter. Both demes grew better in SCF than in LP soil.
The growth of A1 plants was the same in both soils, while rosette diameter of T6 was markedly
decreased in carbonate soil (Figure II‐8.B).
Further experiments with plants from both demes grown on potting mix either irrigated with
distilled water or 20mM of bicarbonate also revealed clear growth differences between the
demes (Figure II‐8‐C,D). Both suffered growth inhibition when irrigated with bicarbonate
solution. However, in plants from A1 the decrease was not as pronounced as in T6 and only in
T6 the differences in rosette diameters between the treatments were statistically significant.
Figure II‐8: (A): Increment of rosette diameter of A1 and T6 grown in carbonate soil (LP)and control soil (SCF) during one month; (B) Photographs of A1 and T6 in and control soil (SCF) and carbonate soils (LP); (C) maximum rosette diameter after watering A1 and T6 during one month with either 20mM
NaHCO3 (treatment, T) or distilled water (Control, C); (D): Photographs of A1 and T6 under treatment (T) and control (C) conditions.
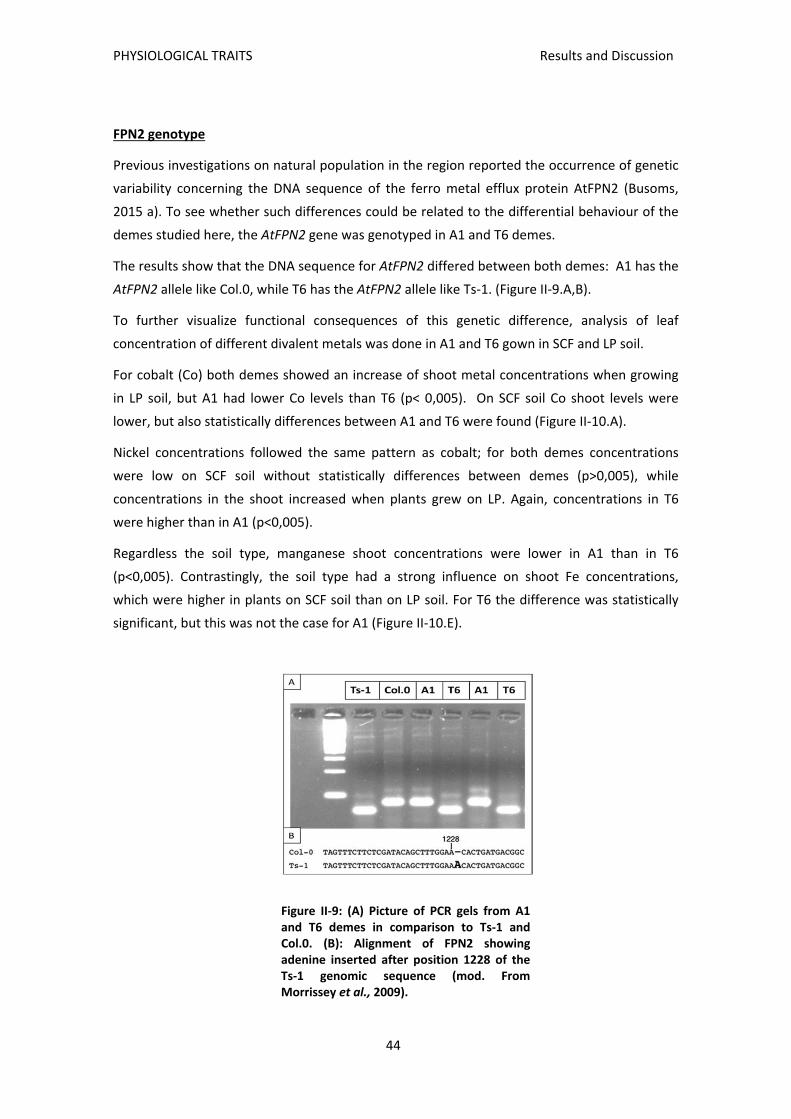
PHYSIOLOGICAL TRAITS Results and Discussion
44
FPN2 genotype
Previous investigations on natural population in the region reported the occurrence of genetic
variability concerning the DNA sequence of the ferro metal efflux protein AtFPN2 (Busoms,
2015 a). To see whether such differences could be related to the differential behaviour of the
demes studied here, the AtFPN2 gene was genotyped in A1 and T6 demes.
The results show that the DNA sequence for AtFPN2 differed between both demes: A1 has the
AtFPN2 allele like Col.0, while T6 has the AtFPN2 allele like Ts‐1. (Figure II‐9.A,B).
To further visualize functional consequences of this genetic difference, analysis of leaf
concentration of different divalent metals was done in A1 and T6 gown in SCF and LP soil.
For cobalt (Co) both demes showed an increase of shoot metal concentrations when growing
in LP soil, but A1 had lower Co levels than T6 (p< 0,005). On SCF soil Co shoot levels were
lower, but also statistically differences between A1 and T6 were found (Figure II‐10.A).
Nickel concentrations followed the same pattern as cobalt; for both demes concentrations
were low on SCF soil without statistically differences between demes (p>0,005), while
concentrations in the shoot increased when plants grew on LP. Again, concentrations in T6
were higher than in A1 (p<0,005).
Regardless the soil type, manganese shoot concentrations were lower in A1 than in T6
(p<0,005). Contrastingly, the soil type had a strong influence on shoot Fe concentrations,
which were higher in plants on SCF soil than on LP soil. For T6 the difference was statistically
significant, but this was not the case for A1 (Figure II‐10.E).
Figure II‐9: (A) Picture of PCR gels from A1 and T6 demes in comparison to Ts‐1 and Col.0. (B): Alignment of FPN2 showing adenine inserted after position 1228 of the Ts‐1 genomic sequence (mod. From Morrissey et al., 2009).
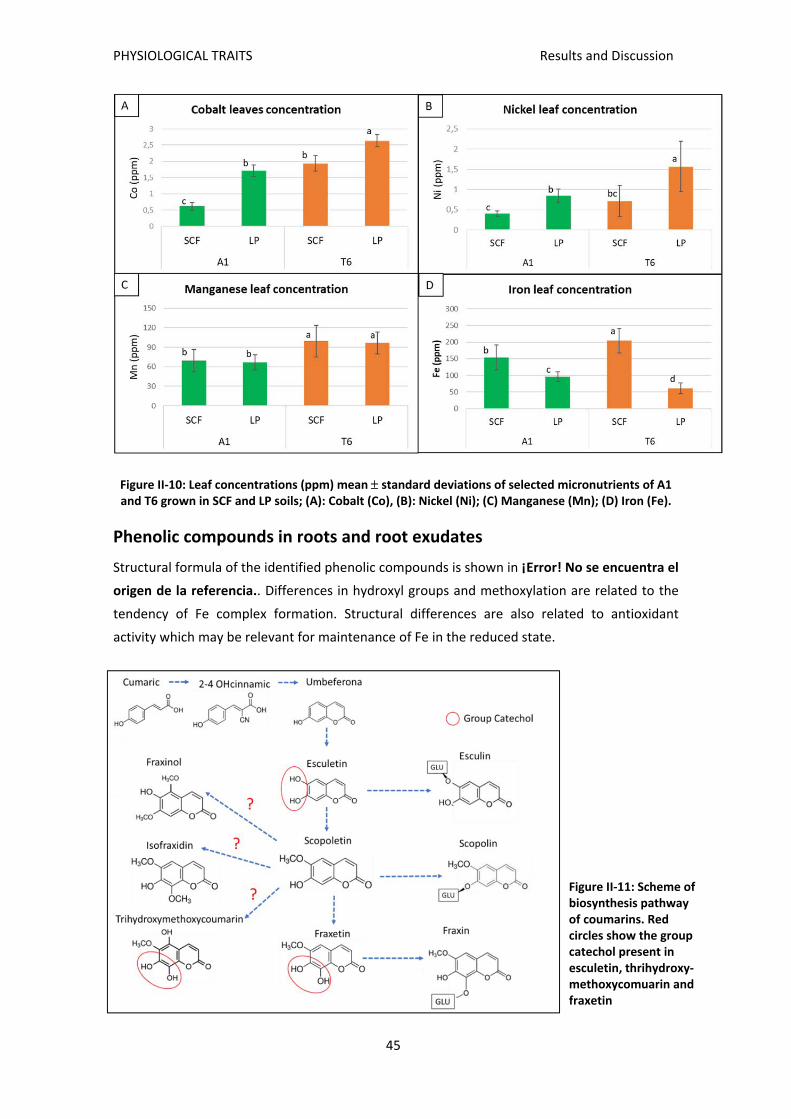
PHYSIOLOGICAL TRAITS Results and Discussion
45
Figure II‐10: Leaf concentrations (ppm) mean standard deviations of selected micronutrients of A1 and T6 grown in SCF and LP soils; (A): Cobalt (Co), (B): Nickel (Ni); (C) Manganese (Mn); (D) Iron (Fe).
Phenolic compounds in roots and root exudates
Structural formula of the identified phenolic compounds is shown in ¡Error! No se encuentra el
origen de la referencia.. Differences in hydroxyl groups and methoxylation are related to the
tendency of Fe complex formation. Structural differences are also related to antioxidant
activity which may be relevant for maintenance of Fe in the reduced state.
Figure II‐11: Scheme of biosynthesis pathway of coumarins. Red circles show the group catechol present in esculetin, thrihydroxy‐methoxycomuarin and fraxetin
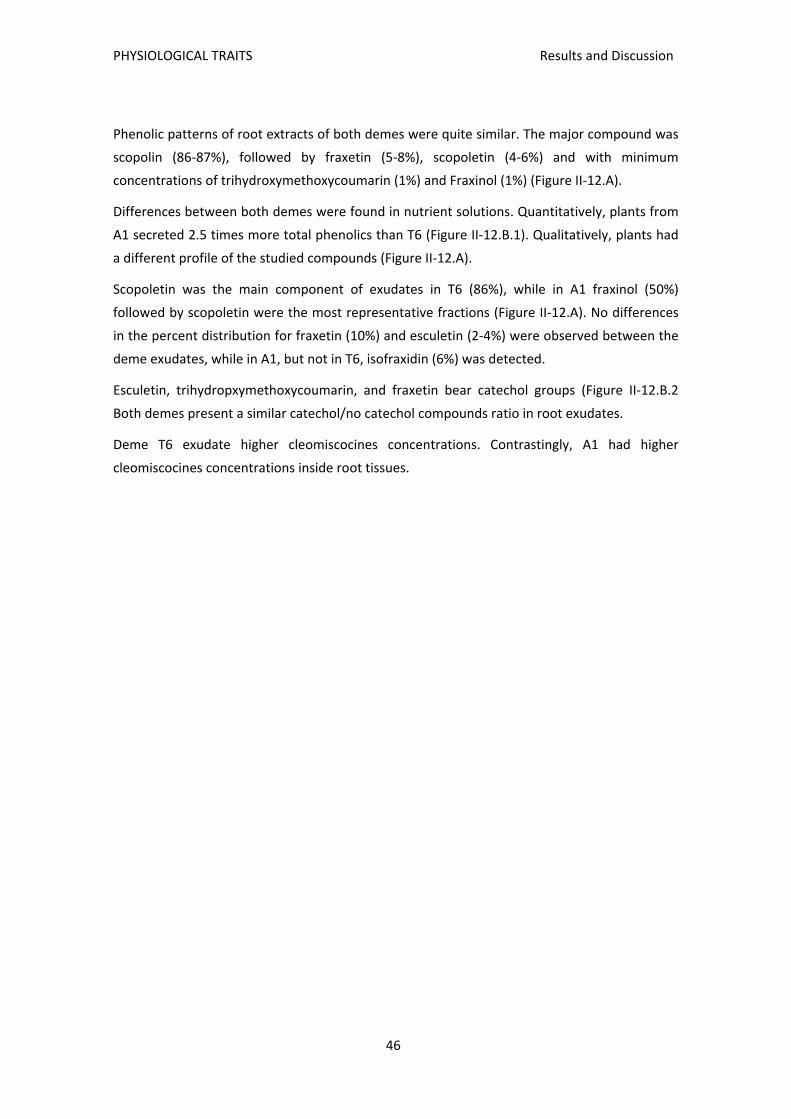
PHYSIOLOGICAL TRAITS Results and Discussion
46
Phenolic patterns of root extracts of both demes were quite similar. The major compound was
scopolin (86‐87%), followed by fraxetin (5‐8%), scopoletin (4‐6%) and with minimum
concentrations of trihydroxymethoxycoumarin (1%) and Fraxinol (1%) (Figure II‐12.A).
Differences between both demes were found in nutrient solutions. Quantitatively, plants from
A1 secreted 2.5 times more total phenolics than T6 (Figure II‐12.B.1). Qualitatively, plants had
a different profile of the studied compounds (Figure II‐12.A).
Scopoletin was the main component of exudates in T6 (86%), while in A1 fraxinol (50%)
followed by scopoletin were the most representative fractions (Figure II‐12.A). No differences
in the percent distribution for fraxetin (10%) and esculetin (2‐4%) were observed between the
deme exudates, while in A1, but not in T6, isofraxidin (6%) was detected.
Esculetin, trihydropxymethoxycoumarin, and fraxetin bear catechol groups (Figure II‐12.B.2
Both demes present a similar catechol/no catechol compounds ratio in root exudates.
Deme T6 exudate higher cleomiscocines concentrations. Contrastingly, A1 had higher
cleomiscocines concentrations inside root tissues.

PHYSIOLOGICAL TRAITS Results and Discussion
47
Figure II‐12: (A): Proportion of different compounds in Nutrient solution and root extracts. (B)‐1: Total compounds (nmol/g root FW) of A1 and T6 demes. ‐2: Proportion of catechol group% in relation of
total compounds per deme (Diameter of circle of A1 2.5 time big than t6). (C): Cleomiscocin (D, C, B, A) concentrations (μM).
Discussion
Based on our field survey reported in chapter 1, two demes with contrasting behaviour were
chosen for further analysis of physiological traits related to carbonate tolerance. In this
chapter 2, deme A1 (from group nº3 of %CaCO3, Chapter I) as a representative of “moderate‐
tolerant to carbonate soils” and deme T6 (from group nº1 of % CaCO3, Chapter I) as a
representative of “sensitive to carbonate soils”.
After two weeks of treatment clear differences between Fe sufficient and Fe deficient plants
were visible (Figure II‐6‐A). A decrease of leaf chlorophyll content was observed in both demes
(Figure II‐6‐B). Under control conditions, deme T6 shows a higher initial chlorophyll
concentration than A1. However, under iron deficiency, a considerable decrease of chlorophyll

PHYSIOLOGICAL TRAITS Results and Discussion
48
concentrations was observed in T6, while in A1 no statistical differences between chlorophyll
levels of control and iron deficient plants were found. Higher chlorophyll leaf concentrations in
A1 under Fe deficiency cannot be attributed to a concentration effect caused by growth
inhibition. On the contrary, A1 plants had higher root and shoot fresh weights than plants from
T6 (Figure II‐6‐C). As all plants were pre‐cultured the first two weeks with a Fe‐containing
control solution, this result could indicate higher efficiency in the use and mobilization of the
previously accumulated iron in A1 than in T6.
To increase Fe availability in the rhizosphere under Fe‐deficient conditions, dicots and non‐
gramineous monocots increase their ferric reduction capacity at the root surface, enhance
proton excretion in the rhizosphere, and release reductants and chelators (Römheld and
Marschner, 1983). Reduction by ferric chelate reductase is thought to be the rate‐limiting step
in Fe uptake (Grusak et al., 1990). The expression of the gene responsible for ferric reduction
in A. thaliana, FR02 (Robinson et al., 1999) involves posttranscriptional regulation, as shown
for iron regulated transporter 1, IRT1 (Connolly et al., 2002, 2003). Overexpression of the FR02
gene leads to improved growth in low‐Fe conditions at pH 6.0. After FeIII reduction, iron is
transported into the epidermal cells by the divalent metal transporter IRT1 (Vert et al., 2002),
that also transports zinc, manganese, cadmium, cobalt (Korshunova et al., 1999), and nickel
(Schaaf et al., 2006). Iron likely moves symplastically to the pericycle, where it then needs to
be exported into the xylem to move to the shoot. FPN2 has previously been reported to be
expressed in the roots of iron‐deficient plants (Colangelo and Guerinot, 2004) and to localize to
the vacuolar membrane (Schaaf et al., 2006). Although upregulated in response to iron
deficiency, FPN2 also functions in nickel sequestration (Schaaf et al., 2006).
The reduction of Fe III to Fe II is generally localized on the surface of the subapical parts of the
root, as well as in the root hairs (Moog and Brüggemann, 1994). Reduction of iron occurs in the
plasma membrane through a specific enzyme, ferric‐chelate reductase, capable of reducing
chelated‐Fe III.
The process requires the generation of a coordination vacancy in the FeIII L6 complex I (Figure
II‐13) to get the most stable species in solution at pH<7 to achieve the octahedral environment
around the metal by incorporation of a single water molecule from proton excretion (Escudero
et al., 2012). The optimum pH for the reduction of Fe III in intact roots, in vivo, is around 5.5.
For this reason, most experiments to analyses ferric reductase activity are performed in this pH
range (Romera et al., 1999). The reduction of Fe varies with the chelate concentration,
following Michaelis‐Menten kinetics (Bienfait et al., 1983). The presence of heavy metals such
as Ni and Cu negatively affects the reduction (Romera et al., 1998, Schmidt, 1999).
Susin et al., (1996) reported that the FCR activity at pH 6.5 was much lower than at pH 6.0.
Further decreases occurred at pH higher than 6.5. In the Fe‐sufficient plants, the FCR activity
did not change from pH 3.0 to pH 6.5 but decreased at higher pH values.

PHYSIOLOGICAL TRAITS Results and Discussion
49
Figure II‐13: Scheme of Fe reduction. Mod from Escudero et al., 2012
Here we compared FCR activity between both contrasting A. thaliana demes growing in
solution with an initial pH of 7.5 or 5.5. In our study plants treated with pH 7.5 showed higher
FCR activity than controls, in both demes. These results demonstrate that FCR enzyme works
well in both demes at pH 5.5. Plants that had been cultivated for 2 weeks at pH7.5 may have
lower tissue Fe than the controls (pH 5.5). This may explain the higher FCR activity in the plants
from the basic nutrient solution treatment.
For studies in carbonated soils, the pH ranges are high, so the reduction of FeIII to FeII is a
limiting factor closely related with high pH in the medium. Here we found that T6 demes have
a high ferric‐reductase activity, in comparison to demes A1 (Figure II‐6.D). On a first glance,
this seems incongruous with the studies that show that in plants adapted to iron deficit, the
activity of ferric‐chelate reductase increases when iron is deficient (Chaney, et al., 1972;
Bienfait, 1985). In our study leaves of T6 demes were more chlorotic and levels of chlorophyll
were lower than A1. So, the enhanced ferric –reductase activity in T6 was rather a sign of Fe
deficiency than an efficient mechanism for Fe acquisition.
The relationship between proton excretion and Fe reductase is not yet clear. Bienfait (1985)
proposed a route to connect both phenomena: the proton extrusion would be coupled to the
accumulation of citrate; this citrate would be isomerized to isocitrate that would lead to
reduction of the NADP+ and the formation of α‐oxoglutarate. The obtained NADPH+ would
directly or indirectly donate electrons to the FCR of the plasma membrane. However, when
simultaneous measurements of both phenomena have been carried out in fruit tree seedlings,
only a significant pH decrease in the nutrient solution in plum varieties has been found, where
the maximum FCR activity is reached when acidification is highest (Romera et al., 1999).
In Figure II‐6.C we can see that A1 is able to decrease the pH to values around 6, while T6
maintains the pH of the rhizosphere at values close to 7. Considering the optimum pH values
for the ferric reductase activity discussed above, it is clear that A1 presents the ideal scenario

PHYSIOLOGICAL TRAITS Results and Discussion
50
for developing ferric reductase activity, while T6 is outside the ideal pH required by the proper
activation of the ferric reductase.
It is evident that the limiting factor for the absorption of iron in T6 is not the state of the
enzyme, because when its activity at pH 5.5 is evaluated it shows high values, but apparently,
it is its inability to decrease the pH of the medium, which causes that ferric reductase cannot
develop this function correctly.
A. thaliana thaliana plants produce and secrete an array of phenolics in response to Fe
deficiency when the pH of the nutrient solution is high. Phenolics found in this study include
previously reported coumarins (scopoletin, fraxetin, isofraxidin and fraxinol) and several
coumarinolignans recently reported in A. thaliana (cleomiscosins A, B, C, and D) (Sisó‐Terraza
et al., 2016a).
The secretion of coumarins by Fe‐deficient roots involves an ABC (ATP‐binding cassette)
transporter, ABCG37/PDR9, which is strongly over‐expressed in plants grown in media
deprived of Fe (Yang et al., 2013; Fourcroy et al., 2014, 2016) or containing insoluble Fe(III) at
high pH (Rodríguez‐Celma et al., 2013). The export of scopoletin, fraxetin, isofraxidin, and an
isofraxidin isomer was greatly impaired in the mutant abcg37 (Fourcroy et al., 2014), which, as
it occurs with F6’H1, is inefficient in taking up Fe from insoluble Fe(III) at pH 7.0 (Rodríguez‐
Celma et al., 2013). It was found a significant level of secreted coumarins for both demes that
suggest no obstacle with ABC transporter, ABCG37/PDR9.
Catechol groups promotes Fe‐complex formation that increase the Fe‐III mobilization (Schmid
et al., 2014). Three coumarins containing the catechol group (trihydroxymethoxycoumarin,
esculetin and fraxetin) were found in root exudates of A1 and T6. Even the percentage of
coumarins with catechol groups was similar for both demes (14%‐12% respectively), while the
biggest differences were found in quantity of total compounds. In other words, both demes
shown the same proportion of catechol‐coumarins, but A1 produce 2.5 times more catechol‐
coumarins than T6. This trait could explain the phenotypical chlorosis differences observed in
A1 and T6.
Fe deficiency present a strong impact on redox homeostasis, not only because free Fe ions
induce ROS formation via Fenton reactions, but also because many proteins involved in
oxidative stress such as peroxidases and catalase are Fe‐containing proteins.
These changes included increases in superoxide dismutases (SOD), monodehydroascorbate
reductase (MDAR1), peroxidase 12 (PER12) and a decrease in catalase (CAT‐2).
Differences in SOD activity were observed between both demes and treatments. Increases of
SOD‐activity, as a result of the compensatory mechanism of the SOD isoenzymes, have already
been reported for in Pyrus dulcis × P. persica, Medicago truncatula, and A. thaliana (López‐
Millán et al., 2013). However, it is interesting to analyse the differences in this increase
between two demes with contrasting behaviour: for A1 the increase of SOD activity was 2.5
PHYSIOLOGICAL TRAITS Results and Discussion
51
times greater than for T6. This indiactes a better ROS defence mechanism in A1 than in T6
(Figure II‐7.A).
The decrease of catalase activity is likely associated with the decrease in Fe availability and it is
observed in S. lycopersicum and P. dulcis × P. persica, (López‐Millán et al., 2013), but in our
experiment, we did no appreciate significant differences neither intra treatments, nor
between demes (Figure II‐7.B); in general CAT‐activity was extremely low.
In some species, the treatment of plants with bicarbonate improves the FeIII reduction
capacity of the roots; examples are pear trees (Donnini et al., 2009), vinyard (Ksouri et al.,
2007), peanut (Zuo et al., 2007), A. thaliana (Msilini et al., 2009) and pea plants (Jelali et al.,
2010). In roots of these species a bicarbonate induced increase of the FCR activity was
observed. However, the values did not reach the high levels detected in plants cultivated
without Fe. However, other studies show opposite results, in cucumber, pea, tomato and A.
thaliana (Waters et al., 2007) and in citrus and peach trees with a high supply of HCO3‐ .
Bicarbonate supplied in high concentrations causes a reduction of FCR activity (Chouliaras et
al., 2004; Molassiotis et al., 2006).
Bicarbonate in the soil solution is a strong pH buffer, mainly in the presence of calcium
carbonate. Since bicarbonate is quite mobile, and CO2 diffusion is a slow process, the pH
decrease in such soils after proton release by plants is small (Lucena, 2000). Also, the ferric
reductase activity of plant roots declines sharply at high pH values. The chemical FeIII
reduction depends on the pH; so, the lower the pH, the more favoured is the formation of
Fe(II) from the Fe(III) in the rhizosphere. Although FCR activity was not determined in this
experiment, chlorosis observed in leaves of treated plant (Figure II‐8.B,D), especial for T6,
could be a consequence of that phenomenon.
Plants watered with 20 mM of bicarbonate showed a decrease of growth for both demes, but
this inhibitory effect of growth was much stronger in T6 than A1 (Figure II‐8.C,D). This relation
between growth inhibition and bicarbonate in the medium has previously been reported for
cucumber plants after 10 days of treatment with 10mM bicarbonate (Garcia et al., 2014), and
also for pea, with a 15mM bicarbonate treatment (Barhoumi et al., 2007). No differences were
observed for tomato productivity (Kg/plant) under treatments with 2.5‐5 mM of bicarbonate
(Parr‐Terraza et al., 2012); however, this study was performed with solutions adjusted to
pH: 5.5±0.1 (with HCl 1N or NaOH 1N).
These results carry on evidencing that one of the most limiting factors to growth in carbonate
soils is the pH level. A1 and T6 demes show a decrease of growth both in carbonated soils and
watered with bicarbonate solution, but T6 present a higher difference between control
treatments, suggesting a clear pattern on of sensitivity in comparison to A1, which exhibits a
tolerant behaviour.
PHYSIOLOGICAL TRAITS Results and Discussion
52
FPN2
Under iron deficiency, IRT1 transports iron and other metals from the rhizosphere to the root
cytoplasm. As under iron deficiency stress this transporter is upregulated not only the uptake
of Fe, but also that of other metal ions can be increased. This may lead to an excessive
accumulation of these metals. FPN2 may transport part of these excess metals to the root
vacuole so avoiding its transport to the xylem via FPN1 and preventing the translocation of
potential toxic metal to the aerial part.
Results of Ni, Co, Mn concentrations in leaves (Figure II‐10.C,B,D) show that A1 presents lower
concentrations than T6. The concentrations of Ni, Co, Mn in aerial part of plants grown in
carbonate soils, suggest that A1 is more capable that T6 to avoid the metal translocation to the
xylem. These accessions present a different allele for FPN2, A1 like col.0 and T6 like Ts‐1. The
difference is a frame shift in Ts‐1, which produces a stop codon 117 amino acids earlier than in
Col‐0.
These results are supported by experiments of Morrysey (2009), who found that without FPN2
cobalt is not sequestered in the root vacuoles; instead, it is able to move to the shoot via FPN1,
resulting in an increase in shoot cobalt and cobalt sensitivity. In a similar way, Schaaf (2006)
demonstrated that wild type plants in comparison to mutants for FPN2 accumulate less nickel
in roots and show increased nickel sensitivity under iron deficiency.
We propose that this modification in FPN2 results in a decreased activity of metal transport
into the root vacuole. On the one hand, this induces the high accumulation of toxic metal in
aerial parts and, on the other hand, increases the iron deficiency through the competition with
other metals to be transported by FPN1.
In Figure II‐14 is proposed a model of action of A1 and T6 under iron deficiency.
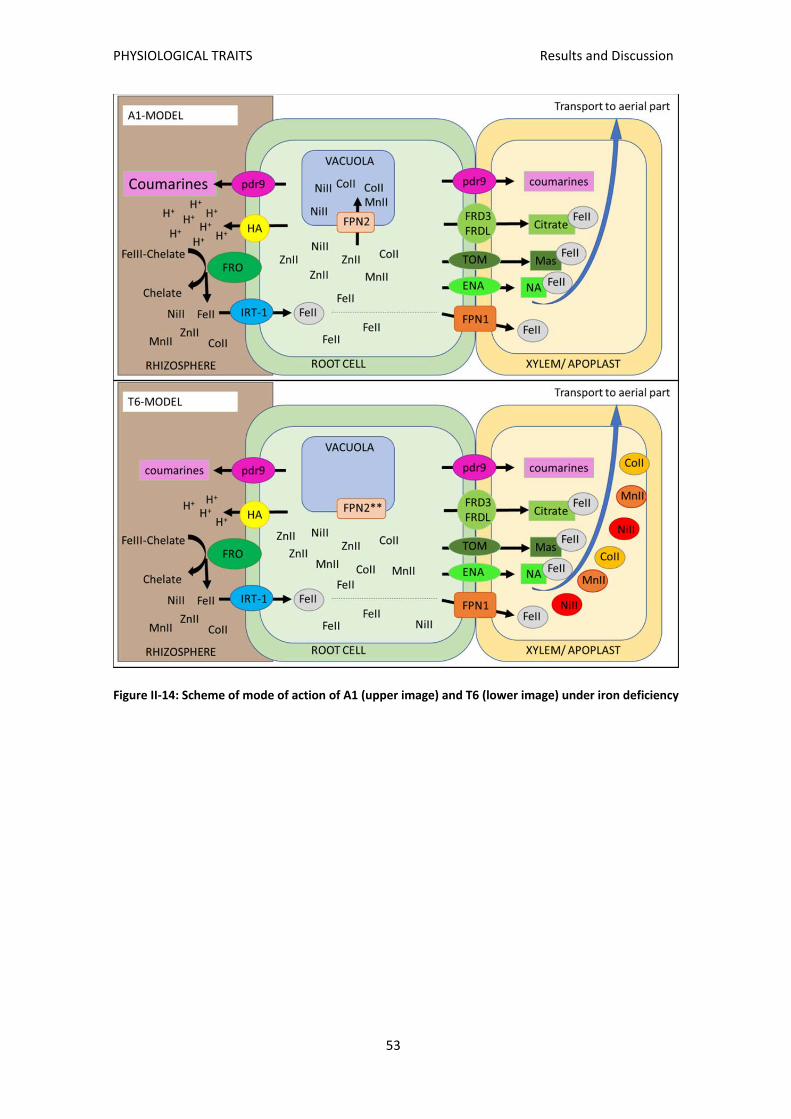
PHYSIOLOGICAL TRAITS Results and Discussion
53
Figure II‐14: Scheme of mode of action of A1 (upper image) and T6 (lower image) under iron deficiency

PHYSIOLOGICAL TRAITS Conclusions
54
Conclusions
Two demes of A.thaliana originally occurring on soils differing in carbonate content
display clear differences in tolerance to iron deficiency and/or carbonate
Under Fe deficiency, A1, deme from soil with low carbonate content was able to
maintain higher chlorophyll concentrations than T6, originally growing on siliceous soil
without carbonate.
On carbonate soil, fitness, in terms of siliques production, was considerably more
affected in T6 than in A1.
The adaptive responses of A1 versus iron deficiency, bicarbonate in the medium, and
high pH, were maintenance of chlorophyll concentration, ability to diminish pH of
rhizosphere, higher quantity of exudates, and early activation of SOD activity, an
efficient mechanism for controlling ROS.
Moreover, in contrast to T6, the ability of A1 to lower the rhizosphere pH provides
ideal conditions for FCR activity.
The dimorphism of FPN2 leading to lower metal ion vacuolar storage in T6 may be a
main reason for the higher shoot translocation of Co, Ni and Mn in this deme, which
may interfere with efficient Fe translocation leading to higher sensitivity to carbonate
and/or Fe deficiency.

Chapter IIIGenetic traits


GENETIC TRAITS Introduction
57
Introduction
A. thaliana thaliana shows a wide range of genetic and trait variations among wild collected
accessions (Shindo et al., 2007). The use of natural genetic variation in A. thaliana has already
proven to be a very powerful approach for the discovery of novel genes and alleles (reviewed
by Alonso‐Blanco et al., 2009).
To understand the significance of natural genetic variation in functional terms, it is necessary
to identify the traits of ecological relevance and to determine their genetic basis. To achieve
this, it is critical to first identify adapted populations in a plant species amenable to the rapid
molecular genetic dissection of the phenotype.
A. thaliana is a tempting species for such studies due to its a small genome size, its excellent
genomic tools, and extensive collections of native populations, along with the general
availability of high‐throughput whole‐genome resequencing, (Bergelson & Roux, 2010).
Different from most of its congeners, A. thaliana is self‐compatible, and its life cycle can be as
short as 6 weeks; both properties greatly facilitate genetic studies. Its native range is
continental Eurasia and North Africa (Al‐Shehbaz and O’Kane, 2002), but it has been
introduced throughout much of the rest of the world, especially around the northern
hemisphere.
The analysis of natural variation in wild species has begun to elucidate the molecular bases of
phenotypic differences related to plant adaptation to distinct natural environments and to
determine the ecological and evolutionary processes that maintain this variation (Mitchell‐
Olds et al., 2007). The model plant A. thaliana shows a wide range of genetic and trait
variation among accessions collected in the field. In addition, because of the unparalleled
availability of genomic resources, the potential of A. thaliana for studies of natural genetic
variation is increasingly recognized (Buescher et al., 2010; Weigel, 2012).
Correlations of life history traits with edaphic conditions and interspecific competition (Brachi
et al., 2013) in natural populations of A. thaliana suggest that these are strong selective agents
driving adaption in local populations.
However, the final proof of the adaptive role of a given allelic variant will require testing the
fitness effects of alternative alleles of the gene in the same genetic background in the field
under the contrasting environmental conditions to which the alleles are assumed to be
adaptive.
As a first step towards such proof, reciprocal transplant experiments are usually performed to
test if the populations containing the contrasting alleles are locally adapted (Blanquart et al.,
2013). Conventionally, local adaptation is considered to exist when demes (local populations
or small stands of plants) have higher fitness in their own habitat compared to demes from any
other habitat, and this has been termed the ‘local vs. foreign’ criterion (Kawecki & Ebert,
2004). Ideally, to establish such local adaptation experimentally requires reciprocal transplant
GENETIC TRAITS Introduction
58
experiments in the field in which the fitness of genotypes from different demes are all directly
compared by growing them together in each of the demes local habitats.
When different A. thaliana accessions are grown together and compared under similar
environmental conditions, genetic variation can be observed for many traits. This kind of
experiment has been done in chapter II, to analyze the local adaptation of natural populations
of A. thaliana to carbonated soils.
To understand the significance of natural genetic variation in functional terms it is necessary to
identify the traits of ecological relevance and determine the genetic basis of these traits.
Furthermore, such an understanding would provide significant benefits to efforts directed to
developing crop varieties that can maintain yields against a backdrop of changing global
temperature and precipitation patterns (for review see Friesen & Wettberg, 2010).
Plant breeding is the art and science of changing the traits of plants in order to produce
desired characteristics (Poehlman & Sleper, 1995). That activity started with sedentary
agriculture and particularly the domestication of the first agricultural plants, a practice which is
estimated to date back 9,000 to 11,000 years.
Initially, early farmers simply selected food plants with particular, desirable characteristics and
employed these as progenitors for subsequent generations. In consequence, they
unconsciously selected for the accumulation of favorable traits over time. Despite the poor
understanding of the process, plant breeding was a popular activity. Gregor Mendel himself,
the father of genetics, was a plant breeder, as were some of the leading botanists of his time.
Mendel's 1865 paper explaining how dominant and recessive alleles could produce the traits
we see and could be passed to offspring was the first major insight into the science behind the
art. The paper was largely ignored until 1900, when three scientists working on breeding
problems rediscovered it and published Mendel's findings.
Mendel established the basis of genetics. The most relevant findings include the Mendelian
genetic theory of inheritance, dominance and recessivity of traits, segregation of character
recombination or re‐assortment of characters, the distinction between germ and soma and
between genotype and phenotype, and the finding that chromosomes are the vehicles of the
units of heredity
Molecular techniques, particularly large‐scale DNA sequencing and expression microarrays,
have heralded a new era of research on the evolution and diversity of domesticated plants
(Doebley et al., 2006; Burke et al., 2007)
The fusion between the chromosomal and the Mendel theories had many remarkable effects.
If Mendelian factors or genes were part of chromosomes, then it was easy to understand why
two copies of every gene exist in all cells of a diploid organism. This provided a mechanistic
foundation of Mendel’s first law, according to which a zygote receives only one version of a
given gene from each parent (law of segregation). But the chromosomal theory also explained

GENETIC TRAITS Objectives
59
why Mendel’s second law (law of reassortment of genes) has many exceptions, since this law
does not apply when two gens located in the same chromosome segregate together.
Objectives
In this study, the traits looked for are those that enable the plants to survive in carbonate soil.
The first step to achieve this was to characterize the deme already adapted to this kind of soils,
as it was done in chapter I and II. The following step will be to select those genes that confers
the ability to grow on carbonate soils. This requires the following actions:
Elaboration of different crossings between contrasting accessions to characterize the
heritability of “tolerance to carbonate soil”.
Selection of the crossing showing a clear heredity (F1 like tolerant or sensitive
parental) for getting next generations.
Selection in F2 generation of the crossings showing tolerance to carbonate soil as a
dominant trait for getting F3 generations.
Getting a F3 generation for ensuring a greater genetic variability by gene segregation
Grouping a pool of most tolerant families to be sequenced (and compare with
sensitive demes) by BSA‐seq.
Getting a list of different genes between parental lines (A1 and T6)
Materials and methods
Plant culture
Experiments were performed in the green house of Aberdeen University during the months
May to July in 2014, 2015, and 2016.
Soil used in this experiment was from Les Planes d’Hostoles (used in Chapter I as a carbonate
soil). Soil was passed through a 2‐mm sieve and mixed with perlite (Soil:Perlite, 3:1) for pot
cultivation.
The following representative demes from the three groups of carbonate classes defied in
chapter 1 were used for the crossings:
Group 1 of CaCO3%: T6 and T11
Group 2 of CaCO3%: V1 and LLO2
Group 3 of CaCO3%: A1 and LM2
The steps taken in each generation are summarized in Figure III‐1.
For getting the first generation, F1, a total of 16 crossings were made (8 pairs of crossings)
using the same deme as a male and female (e.g. T6 x LLM2 and LLM2 x T6).
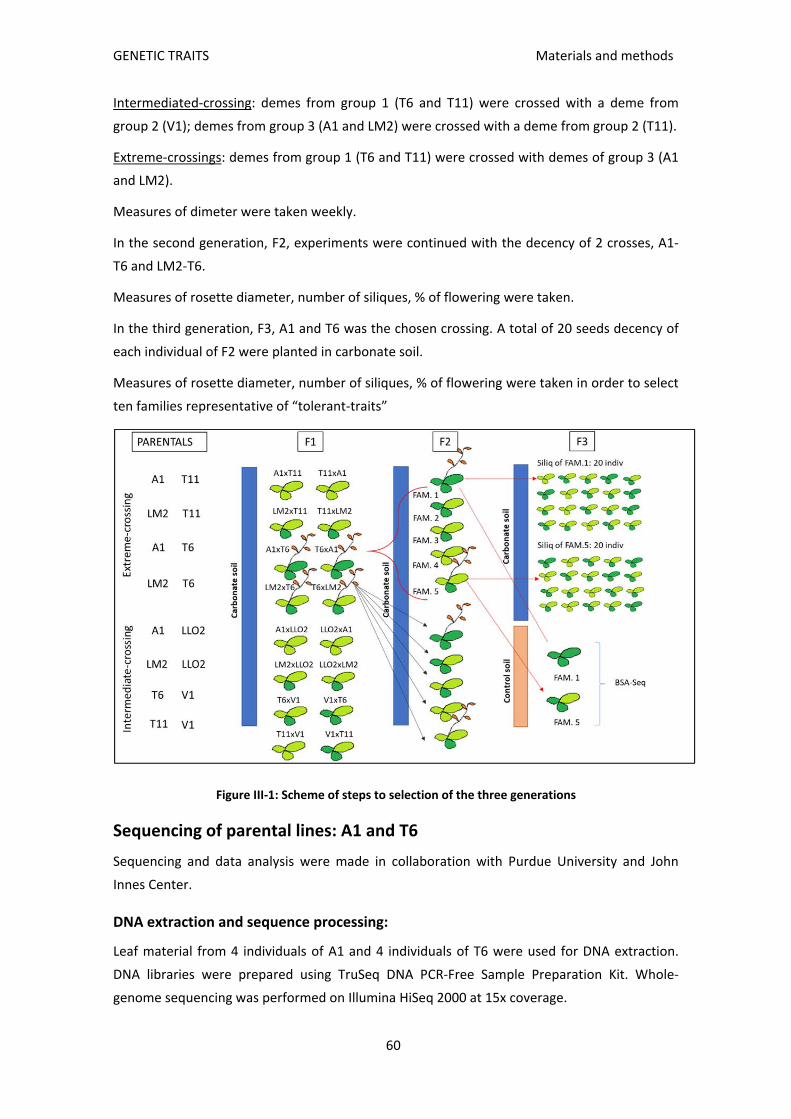
GENETIC TRAITS Materials and methods
60
Intermediated‐crossing: demes from group 1 (T6 and T11) were crossed with a deme from
group 2 (V1); demes from group 3 (A1 and LM2) were crossed with a deme from group 2 (T11).
Extreme‐crossings: demes from group 1 (T6 and T11) were crossed with demes of group 3 (A1
and LM2).
Measures of dimeter were taken weekly.
In the second generation, F2, experiments were continued with the decency of 2 crosses, A1‐
T6 and LM2‐T6.
Measures of rosette diameter, number of siliques, % of flowering were taken.
In the third generation, F3, A1 and T6 was the chosen crossing. A total of 20 seeds decency of
each individual of F2 were planted in carbonate soil.
Measures of rosette diameter, number of siliques, % of flowering were taken in order to select
ten families representative of “tolerant‐traits”
Figure III‐1: Scheme of steps to selection of the three generations
Sequencing of parental lines: A1 and T6
Sequencing and data analysis were made in collaboration with Purdue University and John
Innes Center.
DNA extraction and sequence processing:
Leaf material from 4 individuals of A1 and 4 individuals of T6 were used for DNA extraction.
DNA libraries were prepared using TruSeq DNA PCR‐Free Sample Preparation Kit. Whole‐
genome sequencing was performed on Illumina HiSeq 2000 at 15x coverage.

GENETIC TRAITS Results
61
Raw sequence data were processed as follows: (1) removing duplicate reads using Picard
(MarkDuplicates); (2) applying a ‘namefix’ to the bam files using Picard
(AddOrReplaceReadGroups) and (3) realigning Indels using the GATK ‘GenomeAnalysis’ Toolkit.
Bi‐allelic SNPs were identified using ‘HaplotypeCaller’ and genotyped using ‘GenotypeGVCF’
(both tools in GATK). Data were filtered using GATK SelectVariants using these parameters: QD
< 2.0 || MQ < 40.00 || FS > 60.0 || SOR > 4.0 || MQRankSum < ‐8.0 || ReadPosRankSum < ‐
8.0 and a minimum coverage of 10 per sample.
Data analysis:
To obtain a consensus sequence for each deme, private SNPs of T6 and A1 (shared for the 4
samples) were selected using GATK (selecting AF<0,1 and AF >0.9) and Col‐0 TAIR10 sequence
as a reference.
Example (Table III‐1): For T6, in position X0 all samples share the same nucleotide with Col‐0 so
AF will be 1 (AF > 0.9) and in position X4 all samples differ from Col‐0 so the AF of this position
will be 0 (AF < 0.1). For positions X0 and X4 in deme A1 the opposite happens. For position X1,
X2, and X3 AF will be <0.9 and > 0.1, so those positions will not consider for the consensus list.
T6 AF Col‐0
A1 AF
Position T6‐1 T6‐2 T6‐3 T6‐4 A1‐1 A1‐2 A1‐3 A1‐4
X0 A A A A 1 A C C C C 0
X1 A A A C 0.75 A A C C C 0.25
X2 A A C C 0.5 A A A C C 0.5
X3 A C C C 0.25 A A A A C 0.75
X4 C C C C 0 A A A A A 1
Table III‐1: Example to create a consensus sequence.
Once we obtained the consensus sequence, we selected the sites that differ between demes
using GATK ‘concordance’ command obtaining one vcf file with T16 AF<0.1 and A1 AF > 0.9
and a second vcf file with T16 AF>0.9 and A1 AF< 0.1. We merged the files using VCFtools and
the amino acid changes between A1 and T6 were obtained and quantified using SNPeff.
From the final list, all genes with less than 3 variant‐modifiers were eliminated; also, those
with more than 10 variants modifier to avoid the selection of “Highly variables genes”.
Results
F1 selection
For intermediated crossings (Figure III‐2) all parental and crosses grown at SCF had a similar
increase of rosette diameter. When growing on carbonate–rich soil at Les Planes, crosses
between A1 deme from group 3 of CaCO3% with group 2 deme LLO2 (Figure III‐2.1) showed
less increment of rosette diameter that either parental. This was observed for both ways of

GENETIC TRAITS Results
62
crossings (A1xLLO2 and LLO2xA1). However, when LM2 was used as the group 3 parental
(Figure III‐2.2) a different pattern was observed. Cross LLO2xLM2 showed better growth than
parental LLO2, while cross LM2xLLO2 showed the lowest growth. In the crossings with demes
from group 1 and 2 of CaCO3% we can observe that cross V1xT11 (where deme from group 2
act as a female) grew better than cross T11xV1 where the group 2 deme acted as a male. The
same pattern was observed in T6‐V1 crossings (Figure III‐2.4).
Figure III‐2: F1 results of increase dimeter rosette (mm) of crossing and parental demes grown in SCF (left‐graphs and photos) and LP (right graphs and photos).
For extreme crossings (Figure III‐3) most plants grew better in SCF than in LP except for the
crosses T6xLM2 and LM2xT6, which grew slowly (Figure III‐3.5). These same crossing grown in
LP present high differences with parental LM2; the behaviour of both crosses was like the
sensitive parental T6. The opposite pattern was found in A1‐T6 crosses (Figure III‐3.7); no
growth differences among parentals and crosses were observed at SCF. Contrastingly, on the
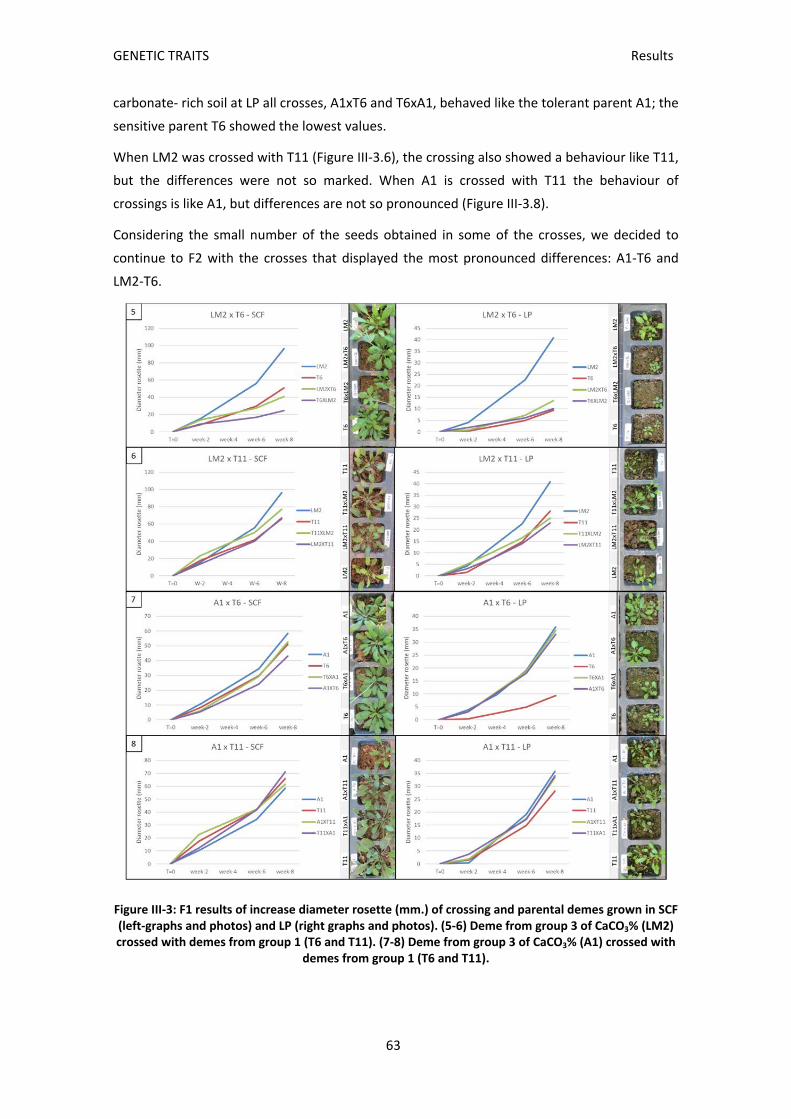
GENETIC TRAITS Results
63
carbonate‐ rich soil at LP all crosses, A1xT6 and T6xA1, behaved like the tolerant parent A1; the
sensitive parent T6 showed the lowest values.
When LM2 was crossed with T11 (Figure III‐3.6), the crossing also showed a behaviour like T11,
but the differences were not so marked. When A1 is crossed with T11 the behaviour of
crossings is like A1, but differences are not so pronounced (Figure III‐3.8).
Considering the small number of the seeds obtained in some of the crosses, we decided to
continue to F2 with the crosses that displayed the most pronounced differences: A1‐T6 and
LM2‐T6.
Figure III‐3: F1 results of increase diameter rosette (mm.) of crossing and parental demes grown in SCF (left‐graphs and photos) and LP (right graphs and photos). (5‐6) Deme from group 3 of CaCO3% (LM2) crossed with demes from group 1 (T6 and T11). (7‐8) Deme from group 3 of CaCO3% (A1) crossed with
demes from group 1 (T6 and T11).

GENETIC TRAITS Results
64
F2 selection
For F2 generation the mean of siliques number and percentage of flowering plants is
represented in Figure III‐4.
In the case of cross A1‐T6, there were no significant differences in silique numbers between
the A1 parental and the crossings (A1xT6 and T6XA1), while the sensitive parental T6 had a low
number of siliques.
The percentages of flowering plants for both crossings (A1xT6 and T6xA1) was generally low
compared to parental A1, but higher than parental T6.
For the cross LM2‐T6, there were no differences of siliques number neither between crossings
and the tolerant parental deme. The percentage of flowering plants was low for T6 and both
crossings in comparison to the tolerant parental, LM2.
Considering the small number of seeds and low percentage of flowering plants it was decided
to continue the F3 experiments with A1‐T6.
Figure III‐4: F2 generation results: left site shows the Mean ± Std Dev of number of siliques of (top box) A1 & T6 and (bottom box) LM2 & T6. In right site, the percentage of flowered plants in each
deme is shown.
F2 generation from crossing A1 & T6 was analysed (Figure III‐5). All plants with seeds were
taken into account and divided in two categories: less than 10 siliques (that represent a maxim
number found in T6 parental) and more than 10 siliques (that represent a behaviour like A1
parental). The results revealed that all crossings have a heredity around 25:75
(sensible:tolerant), T6xA1 was 31:69 and A1xT6 was 18:82. Therefore we decided to carry on
with the two ways of crossing ( A1xT6 and T6xA1) for the generation of F3, in order to have
more genes variability represented.

GENETIC TRAITS Results
65
Figure III‐5: Percentage of number of plants that have less than 10 siliques (siliq) and more than 10 siliques (siliq) for both crossings (T6xA1 and A1xT6)
F3 selection
Three different approaches were assayed to select the tolerant families of F3 (Figure III‐6):
Model 1: results of fitness (mean of number of siliques for family) were used to
organize all families following these categories: 0 = NP (no plant); 1= NF (no flower), 2=
1‐10 siliques, 3= 11‐20 siliques, 4= 21‐30 siliques. 10 families from category 4 where
selected as representation of the most tolerant families.
Model 2: results of fitness from each individual plant in F3; results were represented
giving the following values to each single individual out of 20 individuals for family: 0 if
there was no plant or plant without flower and 1 if there was a plant with flower
and/or siliques. The mean of 0 and 1 values represent the number of family. Families
selected as tolerant were those with a number close to 1.
Model 3: Characters chosen for tolerant families were: less than 15% of no flowering
plants (NF), less than 15‐20% of no plants (NP) and more than 80% of individuals with
flower (FP). Families that present these characters are chosen as representatives of
tolerant families.
The table below in Figure III‐6 shows the selected tolerant families for each model. Families
that are repeated in two of three models are shown in green; families that appear in all models
are marked in orange colour. As any family appeared just one time, we decided to take all
families to do the BSA‐seq, which is under progress.
31%
69%
18%
82%
0%
20%
40%
60%
80%
100%
<10 siliq >10 siliq <10 siliq >10 siliq
T6xA1 A1xT6
A1 &T6

GENETIC TRAITS Discussion
66
Figure III‐6: Three different approaches were assayed to select the tolerant families of F3. Down table show the selected tolerant families for each model, in green are represented families that are
repeated in two of three models and in orange are marked the families that appear in all models
Parental Sequencing
A1, the deme tolerant to moderate carbonate levels and T6, the sensitive deme, were
sequenced in order to find genes differing between these two demes. A list of 968 genes with
3‐10 nucleotides variants was found (see annex XX).
Discussion
In F1 we observed that when demes of group 1 of CaCO3% (T11 and T6) are crossed with a
deme of group 2 of CaCO3% (V1), the direction of the cross was important. When deme from
group 2 acted as a female the increment of diameter was higher (sometimes higher than
parental) than when the cross was done using demes of group 1 of CaCO3% as a female. In that
case these individuals showed the lowest increment of diameter rosette. This could suggest
that genes related with increase of diameter could be associated with maternal effect of
heredity.
In crossings T6‐A1 it was observed that F1 generation looks like A1 (tolerant parental). This
suggests that “traits of tolerance to carbonated soils” are dominant in this crossing. The
opposite happens with the other extreme crossing (T6‐LM2), where F1 looks like the sensitive
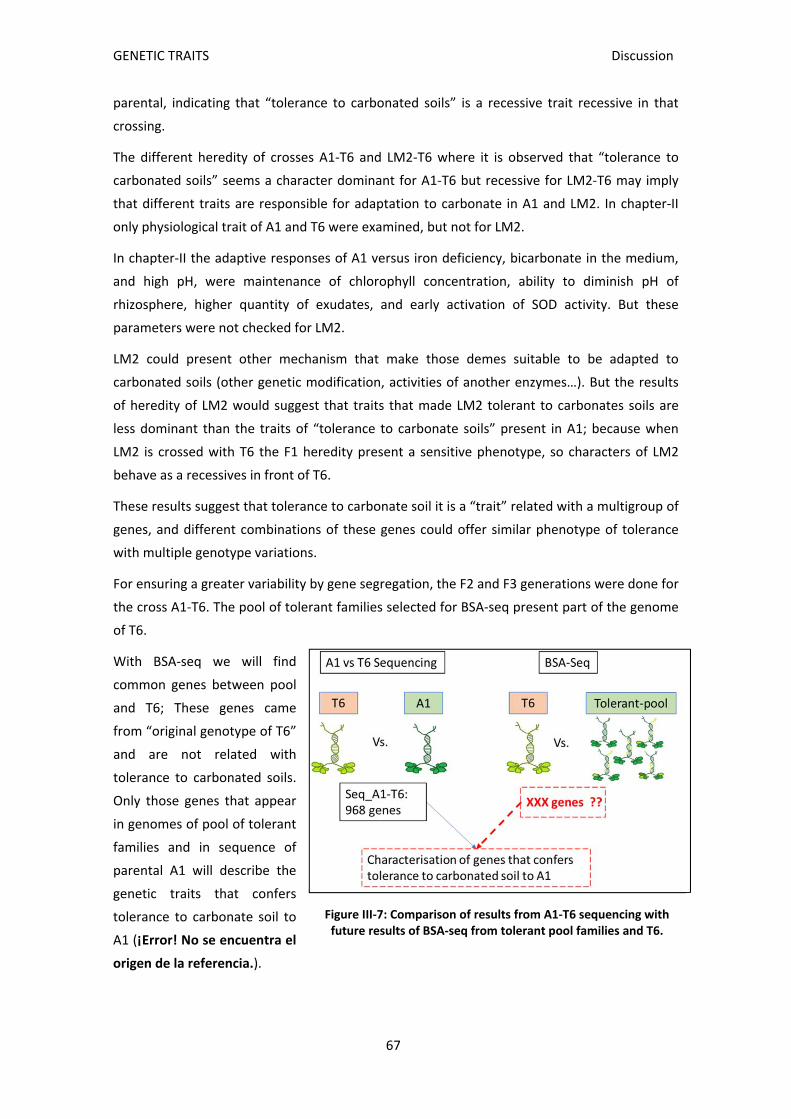
GENETIC TRAITS Discussion
67
parental, indicating that “tolerance to carbonated soils” is a recessive trait recessive in that
crossing.
The different heredity of crosses A1‐T6 and LM2‐T6 where it is observed that “tolerance to
carbonated soils” seems a character dominant for A1‐T6 but recessive for LM2‐T6 may imply
that different traits are responsible for adaptation to carbonate in A1 and LM2. In chapter‐II
only physiological trait of A1 and T6 were examined, but not for LM2.
In chapter‐II the adaptive responses of A1 versus iron deficiency, bicarbonate in the medium,
and high pH, were maintenance of chlorophyll concentration, ability to diminish pH of
rhizosphere, higher quantity of exudates, and early activation of SOD activity. But these
parameters were not checked for LM2.
LM2 could present other mechanism that make those demes suitable to be adapted to
carbonated soils (other genetic modification, activities of another enzymes…). But the results
of heredity of LM2 would suggest that traits that made LM2 tolerant to carbonates soils are
less dominant than the traits of “tolerance to carbonate soils” present in A1; because when
LM2 is crossed with T6 the F1 heredity present a sensitive phenotype, so characters of LM2
behave as a recessives in front of T6.
These results suggest that tolerance to carbonate soil it is a “trait” related with a multigroup of
genes, and different combinations of these genes could offer similar phenotype of tolerance
with multiple genotype variations.
For ensuring a greater variability by gene segregation, the F2 and F3 generations were done for
the cross A1‐T6. The pool of tolerant families selected for BSA‐seq present part of the genome
of T6.
With BSA‐seq we will find
common genes between pool
and T6; These genes came
from “original genotype of T6”
and are not related with
tolerance to carbonated soils.
Only those genes that appear
in genomes of pool of tolerant
families and in sequence of
parental A1 will describe the
genetic traits that confers
tolerance to carbonate soil to
A1 (¡Error! No se encuentra el
origen de la referencia.).
Figure III‐7: Comparison of results from A1‐T6 sequencing with future results of BSA‐seq from tolerant pool families and T6.

GENETIC TRAITS Conclusions
68
Conclusions
Multiple gene combinations confer the capacity to be tolerant to moderate levels of
soil carbonate in A. thaliana
Genetic traits that confers tolerance to deme A1 (tolerant) show a dominant heredity
versus T6 (sensitive)
The difference between A1 (carbonate tolerant) and T6 (carbonate sensitive) is based
on differences in 968 genes.
Bulk sequencing of the pool of tolerant F3 families obtained after A1‐T6 crossings is
expected to reduce this list of genes potentially involved in carbonate tolerance.

Chapter IVGWAs

GWAS Introduction
71
Introduction
Once observed the existence of phenotypic variations in tolerance to moderate soil carbonate
levels in natural populations from Catalonia, we decided to test a larger set of accessions
under more intense carbonate stress to see if more distinctive features can be observed.
For this purpose, a genome wide association analysis with the Hapmap collection of 338
natural accessions was performed at the GWA portal (https://gwas.gmi.oeaw.ac.at/).
GWAS
Genome wide association (GWA) technique was originally developed for human genetics
where it is impossible to obtaining synthetic mapping populations (Hirschhorn et al., 2005).
The genetic sources of phenotypic variation have been a major focus of both plant and animal
studies aimed to identify causes of disease, to improve agriculture, and to understand adaptive
processes. In plants, quantitative trait loci (QTL) were originally mapped in biparental crosses,
but they were restricted in allelic diversity and in having limited genomic resolution (Borevitz,
2003).
GWA mapping has some important advantages over traditional linkage mapping using
synthetic mapping populations. Firstly, natural accessions have experienced more
recombination events than mapping populations such as RIL. That fact allows mapping with
greater precision. Secondly, GWA mapping takes advantage of a much larger range of genetic
variation. This approach however brings some disadvantages as well. Not all variants are
equally likely to be discovered in GWAS. Rare alleles on the scale of the used population are
less likely to be discovered comparing to frequent ones due to smaller statistical power (Asimit
& Zeggini 2010; Gibson, 2011). Such interesting rare alleles could be discovered in QTL studies
as frequency of each variant in mapping population is equal. Another problem of GWA
mapping is the heterogeneity that takes place when certain alleles of different genes produce
the same phenotype. Allelic heterogeneity is observed when different alleles occurring in one
gene lead to the same phenotype. It makes the associations of each of these genetic factors
weaker. Population structure can cause false positive as well false negative results (Zhao et al.,
2007). Correction for effects of population structure using statistical approaches can cause on
the other hand false negative results (Korte & Farlow, 2013).
Using linkage disequilibrium (LD), that is based on non‐random association between alleles and
phenotypes, GWA mapping identifies important polymorphisms and evaluates the statistical
significance of associations between differences in a quantitative phenotype and genetic
polymorphisms tested across many genetically different individuals.
GWA mapping was successfully used in several economically important species apart from A.
thaliana, predominantly in maize (Zea mays) (e.g. Hao et al., 2011; Tian et al., 2011; Yang et
GWAS Objectives
72
al., 2013), rice (Oryza sativa), and wheat (Triticum vulgare) (Cockram et al., 2010; Long et al.,
2013).
The first extensive study that used the GWA approach was performed by Atwell (2010) in A.
thaliana. This study investigated the genetic architecture of 107 different traits related to
flowering time, development, resistance to pathogens and element composition. From 76 to
194 accessions were phenotyped for different traits and genetic information was obtained
using microarray platform that contained almost 250 000 genetic markers ‐ single nucleotide
polymorphisms (SNPs). The GWA approach was validated through finding several loci for traits
that already had been confirmed as highly relevant.
Combining several techniques has advantages and offer different possibilities that could be
used to find and confirm genetic factors taking part in important biological processes and
responsible for traits of interest. GWA approaches in A. thaliana for example can be joined
with traditional linkage mapping (Zhao et al., 2007; Brachi et al., 2010) or with BSA (Chao et al.,
2012; Chao et al., 2014) to identify false negative and false positive results. Finding causal
genetic factors and confirmation of results of genetic mapping can be achieved using various
molecular biology techniques and available resources.
Objectives
Test if there is a genetic variation related with ionomic analysis with a HapMap
collection grown in carbonate soils
Test if there is a genetic variation related with rosette diameter with a HapMap
collection grown in carbonate soils
Materials and methods
Plant Culture and Experimental Design
For assessing natural variation in response to carbonated soils we used 338 natural accessions
of A. thaliana from the HapMap collection (Baxter et al., 2010) representing the within‐species
genetic variation (Supplementary Table 1). We obtained the accessions from the Nottingham
A. thaliana Stock Centre (NASC, Nottingham, UK).
A pair of seeds of each accession was sown in two soils from Mallorca with highly contrasting
carbonate contents, but similar in other physical and chemical properties (see table XX).
Irrigation was done twice a week using distilled water.
The rosette diameter of the plants was measured two weeks after sowing. Further 3
measurements were performed in intervals of 10 days. After the last measurement, the plants
were collected and analyzed for shoot ionome.

GWAS Materials and methods
73
Plant analysis
Chlorophyll
Measure of chlorophyll concentration were taken using a SPAD (Opti‐sciencies CCM300) after
14 days of treatment. For each plant three measurements in leaves of different stages
(old/medium/young) were taken in order to get more representative results.
ICP
Plants from the two different soils were sampled by removing 2–3 leaves (1–5 mg dry weight)
and washed with 18 MΩ water before placing into Pyrex digestion tubes. Sampled plant
material was dried for 42 hr at 60 ºC, and weighed before open‐air digestion in Pyrex tubes
using 0,7 mL concentrated HNO3 (Mallinckrodt AR select grade) at 110 ºC for 5 h. Each sample
was diluted to 6.0 mL with 18 MΩ water and analysed for As, B, Ca, Cd, Co, Cu, Fe, K, Li, Mg,
Mn, Mo, Na, Ni, P, Rb, S, Se, Sr and Zn content (ppm) on an Elan DRCe ICP‐MS (PerkinElmer
Sciex). NIST traceable calibration standards (ULTRAScientific, North Kingstown RI) were used
for the calibration.
Soils
Soils used in this experiment came from Mallorca. There are two different soils: Haplic Calcisol
(carbonated soil) (X: 505185Y: 4390717) and Chromic Endoleptic Luvisol (X: 516699, Y:
4392835).
Soil characteristics were done at the Universitat de les Illes Balears (UIB); the following
analyses were performed: Trace Elements, by microwave digestion with aqua regia described
by Marin et al., (2008) and quantification 5300DV Optima ICP‐OES (Perkin‐Elmer,
Massachusetts), total organic carbon described by Nelson and Sommers (1982), calcic
carbonated using a Bernard calcimeter (Porta et al., 1986), cation exchange capacity: using
ammonic acetate (Rhoades, 1982), texture and particle size by Porta et al., (1986).
Genome‐wide association (GWA) analysis
GWAPP consists of a Web front end with a graphical user interface, and a back end that
handles the data and performs the mapping.
Once a phenotype file has been uploaded, the results are viewed via the Plots tab, an
interactive Manhattan plot (a scatterplot with the negative logarithm P values for the SNP
association plotted against the SNP positions) for all five chromosomes is shown.
The Benjamini‐Hochberg‐Yekutieli multiple testing procedure (Benjamini and Yekutieli, 2001)
was used to control the false discovery rate. Assuming arbitrary dependence between SNPS,
the 5% false discovery rate (FDR) threshold is plotted as a dashed horizontal line. Only the
SNPs with higher value of 5 were taken in account.
GWAS Results & Discussion
74
Linkage disequilibrium (LD) structure can be also detected with GWAAP, that will calculate
genome‐wide r2 values between the selected SNP and all other displayed SNPs and colour code
them in the Manhattan plot
We used two types of phenotype traits for performing the association with the genotype:
Ionomic analysis (Li, B, Na, Mg, P, S, K, Ca, Mn, Fe, Co, Ni, Cu, Zn, As, Se, Rb, Sr, Mo and Cd) and
growth, as an increase of rosette diameter.
For analysis of variable ionomics two scenarios were analysed: leaf concentration of plants
grown in carbonate soils (C) and carbonate and no carbonate leaf concentration difference
(CND), as the relative leaf concentration between plants grown in carbonate and non‐
carbonate soils per unit of leaf concentration in non‐carbonate soil. Calculated using follow
equation:
(C)‐(N)/(N)*100, where (C) is leaf concentration in carbonate soil and (N) is the concentration
in no carbonate soil.
For analysis of the variable diameter the data used were: “differential growth rate” (GRD). The
GRD is obtained by calculating Growth rate from measure 1 until measure 4 between in plants
grown in carbonate soil per unit of non‐carbonate soil. Calculated using follow equation:
GR_14_C/GRD_14_N.
Results & Discussion
Soil analysis
Table IV‐1 displays the multiple variables analysed in the two soils used for the GWAS
experiment. Significant differences in the concentration of CaCO3 (663.5 g / kg carbonated soil
vs. 1.5 g / kg control soil) active lime (136 9 g / kg ground vs. carbonated 0 g / kg ground
control), the electrical conductivity (EC) (116 S / cm soil carbonated vs. 33 µS / cm soil
control), pH (8.5 vs 7.1 in soil carbonate ground control) and presence of coarse elements
(29.5 g / kg ground control ground carbonated vs. 2.5). By contrast there are no significant
differences regarding the percentage of sand, silt, clay or measures cationic exchange capacity
(CEC), field capacity and permanent wilting point.
Soil ionomic analysis revealed that concentrations of most elements tend to be higher in the
control soil than in the carbonate soil (Fe, Zn, Mn, Cu, Mg, Na and Mo), but only for Ca and Mn
the differences are statistically significant. Concentrations of Ni and Co are very similar in both
soils. Although one of the main differences between soils analysis was Ca content, no genetic
variations were associated to leaf Ca content (Figure IV‐1).

GWAS Results & Discussion
75
Carbonated Soil Control Soil
Carbonated Soil
Control Soil
WRB (2014) Haplic Calcisol Chromic Endoleptic
Luvisol C/N 8.8 3.8
Soil Taxonomy (2014) Chromic Luvisol Typic Haploxeralf
P Olsen (mg/kg)
29,4 13.4
Color Munsell wet 2.5Y 5/4 5YR 4/3 CaCO3 (g/kg) 664 1.5
Colour Munsell Dry 2.5Y 7/3.5 5YR 5/6
Active Lime (g/kg)
259 0.0
Depth (cm) 0‐30 0‐30 CEC (mmol/kg) 167,0 170.5
Sands (g/kg) 168 127 EC 1:5 (uS/cm) 116,0 33.0
Slime (g/kg) 565 527 pH H2O 8,5 7.1
Clays (g/kg) 267 346 pH KCl 7,4 5.3
Organic C (g/kg) 9.45 6.44 Field capacity
(g/kg) 227,3 204.9
Organic Matter (g/kg)
16.28 11.10 Permanent
wilting point (g/kg)
97,5 113.6
N (g/kg) 1.07 1.70
Table IV‐1: Physical and Chemical proprieties of two different Mallorca soils
Figure IV‐1: Mean and standard error of ionomic analysis of sodium (Na), potassium (K), magnesium (Mg), copper (Cu), manganese (Mn), iron (Fe), zinc (ZN), Molybdenum (Mo), nickel (Ni), cobalt (Co)
and calcium (Ca) from carbonate soil and control soil from Mallorca.
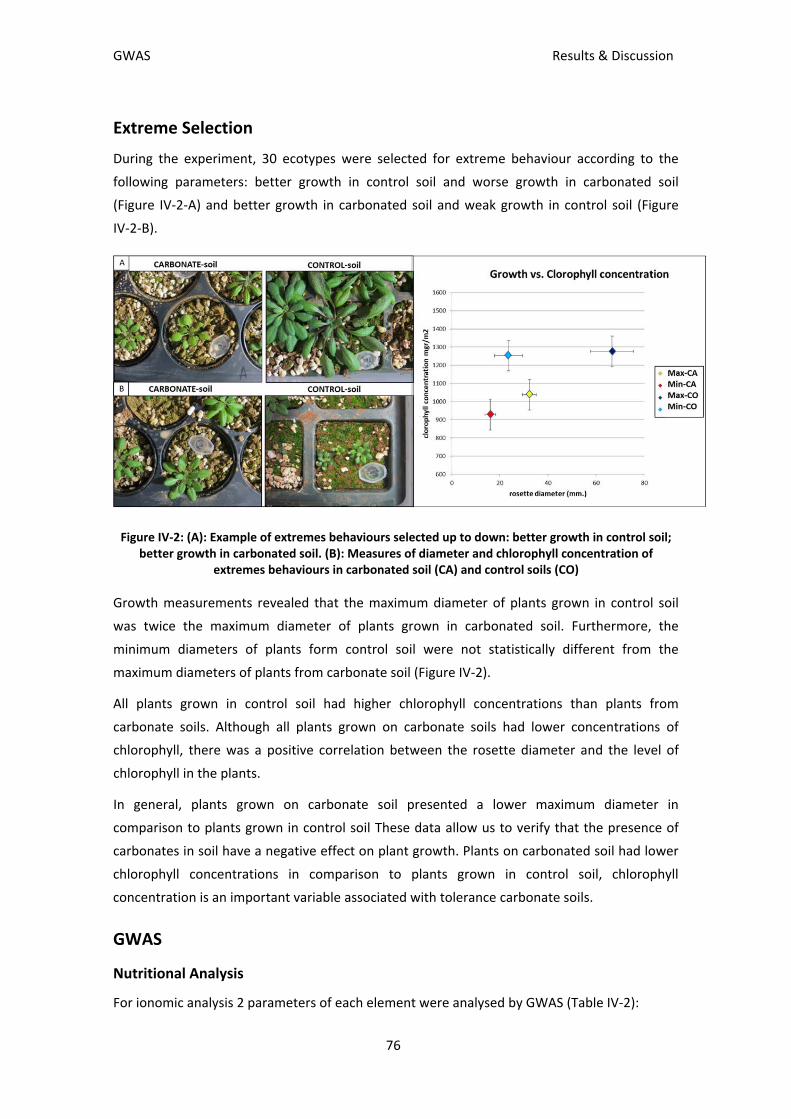
GWAS Results & Discussion
76
Extreme Selection
During the experiment, 30 ecotypes were selected for extreme behaviour according to the
following parameters: better growth in control soil and worse growth in carbonated soil
(Figure IV‐2‐A) and better growth in carbonated soil and weak growth in control soil (Figure
IV‐2‐B).
Figure IV‐2: (A): Example of extremes behaviours selected up to down: better growth in control soil; better growth in carbonated soil. (B): Measures of diameter and chlorophyll concentration of
extremes behaviours in carbonated soil (CA) and control soils (CO)
Growth measurements revealed that the maximum diameter of plants grown in control soil
was twice the maximum diameter of plants grown in carbonated soil. Furthermore, the
minimum diameters of plants form control soil were not statistically different from the
maximum diameters of plants from carbonate soil (Figure IV‐2).
All plants grown in control soil had higher chlorophyll concentrations than plants from
carbonate soils. Although all plants grown on carbonate soils had lower concentrations of
chlorophyll, there was a positive correlation between the rosette diameter and the level of
chlorophyll in the plants.
In general, plants grown on carbonate soil presented a lower maximum diameter in
comparison to plants grown in control soil These data allow us to verify that the presence of
carbonates in soil have a negative effect on plant growth. Plants on carbonated soil had lower
chlorophyll concentrations in comparison to plants grown in control soil, chlorophyll
concentration is an important variable associated with tolerance carbonate soils.
GWAS
Nutritional Analysis
For ionomic analysis 2 parameters of each element were analysed by GWAS (Table IV‐2):

GWAS Results & Discussion
77
Concentration of element in carbonate soil (C). Significant SNPs were found for shoot
concentrations of the following elements: B, Cd, Co, Cu, Fe, Mg, Ni and Zn.
Analysing the differences of shoot element concentrations (CND) between plants
grown on non‐carbonate soil (N) and carbonate soil (C), significant SNPs were found
for the following elements: B, Co, Mn, Mo, Na, Ni, P and Zn.
Table IV‐2: nº of genes associated to SNPs, or locus disequilibrium (LD) of elements in carbonate soil analysis and difference of control and carbonate soil element concentration.
Diameter analysis
Results of GWAs show important genes present in LD and SNPs regions. According to TAIR the
corresponding gene description is as shown in Table IV‐3:
Table IV‐3: List of genes and descriptions resulting from GWAs analysis using diameter as a variable.
Both ionomics and rosette diameter data provided a list of genes potentially implicated in
differences for these variables in plants grown on carbonate soil. Taking into account the
existent description of part of these genes (proteins), some genes can be related to already
described functions relevant for variance in these variables (ionomics and rosette diameter).
For example, for Zn shoot concentrations in plants grown on carbonate soil AT1G10480 was
identified. This gene encodes a Zn finger binding protein (ZFP5), that acts as a positive
regulator of root hair development in A. thaliana (An et al., 2012). However, paying attention

GWAS Results & Discussion
78
only to genes that have a known description that could explain the differences observed in
ionomics or rosette diameter could be misleading, because not all genes and gene functions
have already been described. Moreover, not all genes and their functions have been tested in
carbonate soil.
To evaluate whether these genes indicated by the GWAS analysis can also be relevant for
differences in the behaviour of our natural populations the list of gene differences between
parental A1 (tolerant) and T6 (sensitive) (chapter‐3) was compared to the GWAS results.
The list of differential genes comparing A1 and T6 (SeqA1‐T6) contained 14 genes also present
in the list of GWAS ionomics. For rosette growth, only one gene from the GWAS list was also
among the genes that differ between A1 and T6.
Table IV‐4 shows the list of these 14 matching genes and the corresponding element
associated in GWAs ICP analysis. Moreover, the gen matched for GWAs‐diameter analysis and
it description is shown.
Table IV‐4: List of gens matching when comparing the Seq A1‐T6 with the list of GWAs‐ICP genes. Analyzed element where those genes were detected in the GWAS‐ICP analysis and description of Tair
page are indicated
The gene matching with diameter analysis was AT5G02980.1 that encodes for a galactose
oxidase/kelch repeat superfamily protein according Tair descripction.
GWAS Results & Discussion
79
This superfamily refers to a very large group of proteins that contains a kelch repeat in their
amino acid sequence. Galactose oxidase (GO, EC 1.1.3.9) is a monomèric 6‐ kDa enzyme that
contains a single copper ion and an amino acid‐derived cofactor that selectively oxidizes
primary alcohols to aldehydes.
Among the 14 matching genes (from ionomic variable), 10 where found using Zn shoot
concentrations in plants grown in carbonate soil (H) as a variable in GWAS. That fact
definitively suggest that Zn plays a significant role in adaptation to carbonate soils.
Zn is an essential trace element (micronutrient) required in small but critical amounts by both
plants and animals (including humans). It is required for the structure and function of a wide
range of macromolecules including hundreds of enzymes. Zn is the only metal to be involved in
all six classes of enzymes: oxido‐reductases, transferases, hydrolases, lyases, isomerases and
ligases (Barak and Helmke 1993). Zn ions exist primarily as complexes with proteins and nucleic
acids and participate in all aspects of intermediary metabolism (Tapeiro and Tew, 2003;
Alloway, 2009).
The Zn which is available to plants is that present in the soil solution, or is adsorbed in a labile
(easily desorbed) form. The soil factors affecting the availability of Zn to plants are those which
control the amount of Zn in the soil solution and its sorption‐desorption from/into the soil
solution. These factors include: the total Zn content, pH, organic matter content, clay content,
calcium carbonate content, redox conditions, microbial activity in the rhizosphere, soil
moisture status, concentrations of other trace elements, concentrations of macro‐nutrients,
especially phosphorus and climate (Alloway, 2004).
The relationship of Zn and carbonated soils has been the subject of study for several decades
(Yoshida, 1969; Udo, 1970; Harter, 1983). Kiekens (1980) also studied the adsorption of Zn on a
calcareous soil and found that the reaction was not reversible due to some of the Zn being
irreversibly fixed by the soil. These findings on the fixation/sorption of Zn on calcium
carbonate have some important implications for the behaviour of Zn in calcareous soils. Some
of the worst Zn deficiency problems in crops occur on calcareous soils in arid and semi‐arid
regions of the world. Uygur and Rimmer (2000) have pointed out that calcareous soils tend to
have pH values of 8 or above and that under these pH conditions, iron oxides readily
precipitate out and form coatings on the carbonate minerals. They showed that an increase in
pH from 8 to 8.3 can double the strength of bonding of Zn to calcite but with 0.05% of iron
oxide on the calcite the bonding increases 7‐fold between pH 8 and 8.3. They found that with a
coating of iron oxide on the calcite, the sorption of Zn was greater than it is with pure calcite
and the extent to which Zn is immobilized is greater and it is less readily desorbed than it is
from pure calcite. Therefore, the occurrence in calcareous soils in semi‐arid and arid regions of
calcite with thin coatings of iron oxide results in Zn being even less available to plants than
with pure calcite, and a higher risk of Zn deficiency in crops.
GWAS Results & Discussion
80
Copper is another one of eight essential micronutrients for all higher plants. In soil, Cu is
restricted mainly in the top layer because of its ability to tightly bind with carbonates, clay
minerals, hydrous oxides of Al, Fe and Mn and organic matter (Mengel and Kirkby 2001).
Copper mobility along the soil profile, bioavailability for root uptake and consequently
phytotoxicity threshold for crops depend on soil pH (Chaignon et al., 2003), cation exchange
capacity (CEC), quality of organic matter, texture etc. (Parat et al., 2002).
Copper occurs in the soil almost exclusively in divalent form. The largest fraction of Cu is
usually present in the crystal lattices of primary and secondary minerals. In addition, a high
proportion of Cu is bound by the soil organic matter. The Cu ion is adsorbed to inorganic and
organic negatively charged groups and is dissolved in the soil solution as Cu2+ and organic Cu
complexes. Copper is specifically adsorbed to carbonates, soil organic matter, phyllo silicates,
and hydrous oxides of AI, Fe, and Mn (Reed & Martens 1996).
A particularly important and widely used feature of Cu(I) is its ability to bind small molecules
such as oxygen donor ligands (Krämer et al., 2005). This explains why Cu is a co‐factor of a
large number of oxidases and why Cu‐dependent oxidases are the principal catalysts of
terminal oxidation reactions in cells, for example tyrosinase, lacase, phenolases, ascorbic acid
oxidase and cytochrome c oxidase (Barceló, 2001)
Cu it is also involved in plant growth, there are apparently also multi‐copper oxidase‐like
proteins such as SKU5, which are involved in cell wall formation yet lack any detectable
oxidase activity (Sedbrook et al., 2002), Copper also is required for lignin synthesis which is
needed for cell wall strength and prevention of wilting (Ranocha et al., 2002).
Some smaller proteins with one mononuclear blue copper (type I) centre do not function as
oxidases, but as electron carriers. The best‐known and quantitatively most important example
in plants is plastocyanin, which accounts for about 50% of the plastidic Cu (Marschner 1995).
This protein mediates the electron transfer from the cytochrome b6f complex to PS‐I.
Cu availability decrease with high pH (Huff et al., 1970) so that means that all cited “vital
functions” could be threatened when plants grown in carbonated soils.
Nickel (Ni) occurs abundantly in igneous rocks as a free metal or as a complex with iron. It
stands at twenty‐second position amongst most abundant elements in the earth crust
(Sunderman and Oskarsson 1991)
The uptake of Ni in plants is mainly carried out through the root system via passive diffusion
and active transport (Seregin and Kozhevnikova 2006). The ratio of uptake between active and
passive transport varies with the species, form of Ni and concentration in the soil or nutrient
solution (Vogel‐Mikus et al., 2005). The overall uptake of Ni by plants depends on the
concentration of Ni2+, plant metabolism, the acidity of soil or solution, the presence of other
metals and organic matter composition (Chen et al., 2009). However, uptake of Ni usually

GWAS Conclusions
81
declines at higher pH values of the soil solution due to the formation of less soluble complexes
(Temp, 1991).
Moreover, Ni2+ ion may also compete with other essential metal ions when it is absorbed by
roots. The uptake of heavy metals from the soil solution is strongly affected by calcium ion.
Ca2+ lowered the absorption of Ni2+ in A. thaliana bertolonii, (Gabrielli and Pandolfini 1984).
Besides this, Ni an important component of many enzymes, where it coordinates either with S‐
ligands and O‐ligands (e.g. Urea), S‐ligands (cystein residue e.g. hydrogenase) or ligands of
tetrapyrol structure (Marschner 2002). However, urease is the only enzyme in higher plants
that has been reported to possess Ni as an integral component, in stoichiometric quantities
(Dixon et al., 1980). Moreover, embryonic root was poorly developed or even failed to
develop; in addition to this several other anomalies were also reported in the development of
endosperm together with decreased activity of dehydrogenase. In some legumes, small
amount of Ni is essential for root nodule growth and hydrogenase activation. The efficiency of
nitrogen fixation depends on largely hydrogenase activity because the oxidation of hydrogen
provides ATP required for N reduction to ammonia (Yusuf et al., 2011).
The pH, cation exchange capacity and CaCO3 content of the soils are important characteristics
which affect the adsorption and subsequent plant uptake of Ni from soil (Ramachandran et al.,
2013). So, in the same way of Cu and Zn reported above, taking into account that Ni availability
decrease in carbonated soils, potential tolerant plants (to carbonate soils) should be provided
by mechanisms that permits uptake enough Ni from the carbonate soil.
Conclusions
The presence of carbonates in the soil reduced the growth of all accessions of the
Hapmap collection in comparison to the non‐carbonate soil. This indicates that in this
large, world‐wide collection there is no genotype with preference to carbonate over
siliceous substrate.
Differences in rosette diameter increase of plants growing on carbonate soil versus
siliceous soil reveals differences in adaptation to soil carbonate among the Hapmap
accessions
As expected, low chlorophyll content is an important variable indicating sensitivity to
soil carbonate. The positive correlation between rosette diameter and chlorophyll
concentrations guarantee that the higher chlorophyll concentration in certain
accessions is not the consequence of reduced leaf expansion growth.
Genetic variations were found by GWAs analysis in the Hap Map collection in relation
to ionomics and rosette diameter.

GWAS Conclusions
82
Differences in rosette ionomics was associated with 432 genes that potentially
influence the nutrient leaf concentrations of plants growing on carbonated soils.
The relative increase of rosette diameter of plants growing on carbonate soils is
related to only 10 genes that potentially determine the differences in growth rate
under carbonate stress.
Comparison of potentially important genes for carbonate tolerance got from GWAs
and those differing between genes the natural accessions A1 (carbonate tolerant) and
T6 (carbonate sensitive) identifies only 15 matching genes (14 genes from ionomic
analysis and 1 from rosette diameter analysis)
From ionomic analysis 10 out of 14 matching genes are associated to zinc leaf content.
That fact definitively suggests that Zn plays a significant role in adaptation to
carbonate soils. Further 3 genes are related to rosette Cu concentrations.
From rosette dimeter analysis only one gene matches: At5G02980.1, probably coding
for a Cu‐containing galactose oxidase.
Note: Different statistical data related to this Chapter IV can be found in 0Annex 5 to Annex 7.
Concluding Remarks
Arabidopsis thaliana can be considered a calcifuge species. According to both the distribution
data of 24 demes in Catalonia and growth results on carbonate versus siliceous soil of 361
accessions originating from all over the world this species prefers siliceous over carbonate
substrates. However, the species has evolved local adaptation to moderate carbonate levels
with an apparent upper limit in the Catalonian area of 30 % soil carbonate. Differential
responses were shown by common garden experiments. Observed differences in fitness of A.
thaliana on high carbonate soil was strictly dependent on the carbonate level in the soil of
origin
Accessions with extreme behaviour, A1 moderately tolerant to carbonate and T6 sensitive,
clearly differed in several physiological markers for carbonate tolerance:
In hydroponics under iron deficiency treatment plants from T6, but not A1 present an
extreme chlorosis. FCR activity was different between demes. However, in hydroponics
with initial nutrient solution at pH 7.5, A1 plants decrease pH level to 5.9 (±0.3) while
those of T6 only achieve pH 6.9 (± 0.2). This result suggests that although the FCR enzyme
has a normal activity in both demes, only A1 was able to adjust the pH to the optimal
range of FCR activity.
As pH and iron have a strong impact on redox homeostasis, enzymes related to oxidative
stress were tested. Catalase activity was not different between demes but SOD activity in
A1 under treatment exhibits a higher inhibition rate than in T6. These results suggest that
A1 demes produces higher levels of antioxidant defences under these conditions.
Analysis on phenolic compound in root exudates also reveals differences between demes.
A1 produces 2.5 times more quantity of total exudates with a higher percentage of
catechol groups than T6. Phenolic compounds may function in reduction or complexation
of Fe. So different quantities of these compounds suggest that A1 has more facilities to
mobilize iron under high pH and iron deficiency conditions.
Genetic variability in the DNA sequence of AtFPN2 were found for demes A1 and T6. The
A1 AtFPN2 allele is like that of Col.0 and the T6 allele is like that of TS‐1. FPN2 is a metal
transporter protein located in the tonoplast. Concentrations of Ni, Co and Mn in aerial
parts were higher for T6 than for A1, suggesting that the modification in AtFPN2 could
affect the metal transport to the vacuole. It is proposed that modification of AtFPN2 in T6
decreases the mobility of excess metals in the root vacuole, so the proportion of

GWAS Conclusions
84
cytoplasmic Fe became lower and some of these metals (instead of iron) could be
transported to the aerial parts, reducing iron availability for the leaves and incrementing
metal toxicity.
Carry on with genetic traits we have crossed our demes. When the tolerant deme LM2 was
crossed with the sensitive T6 the F1 phenotype was like T6. Contrastingly, when the tolerant
deme A1 was crossed with T6 the F1 phenotype was like the tolerant parental A1. This result
suggests that multiple genetic combinations can confer a phenotype with tolerance to
carbonate soils and some of these characters act as dominant and some as recessive traits.
The complete genome was obtained for A1 and T6 and the comparison of sequences provided
a list of 968 genes. Although, most probably only a fraction of these genes is directly involved
in the differential response to soil carbonate, this list is a first approach to identify the genetic
trait that confers tolerance to carbonate soil to A1 accession.
For exploring the response to carbonate soil in of a wider source of A. thaliana germplasm the
Hapmap collection of 361 accessions was grown on carbonate and siliceous soils. Rosette
diameter increase and rosette ionome data were used for GWAS analysis. 442 potential genes
related to carbonate response were detected.
A comparison of the GWAs results with the list of genes differing between A1 and T6 reveals
14 matching genes for ionomic parameters and 1 gene for the rosette growth parameter.
Genes matching for the ionomic parameters were found for Zn, Cu and Ni rosette
concentrations.
The results from the BSA‐seq obtained with the pool of tolerant families will be compared with
the list of genes differing between the parentals, A1 and T6. The expected results will be very
helpful to finally define the genes that are directly related to the tolerance to carbonates soil
of the A1 deme. Moreover, the comparison of results of BSA‐seq with the GWAs results will
allow us to see the implication of these genes in the tolerance to carbonated soils for a large
range of A. thaliana accessions.
BIBLIOGRAPHY
References
Abbott, R. J., & Gomes, M. F. (1989). Population genetic structure and outcrossing rate of
Arabidopsis thaliana. Heredity 62:411‐418.
Achard, P., Cheng, H., De Grauwe, L., Decat, J., Schoutteten, H., Moritz, T., ... & Harberd, N. P.
(2006). Integration of plant responses to environmentally activated phytohormonal
signals. Science, 311:91‐94.
Alfonso‐Prieto, M., Biarnés, X., Vidossich, P., & Rovira, C. (2009). The molecular mechanism of
the catalase reaction. Journal of the American Chemical Society, 131:11751‐11761.
Alhendawi, R. A. (2011). Comparisons between Effects of Bicarbonate and High pH on Iron
Uptake, Fem Reducing Capacity of the Roots, PEP Carboxylase Activity, Organic Acid
Composition and Cation‐anion Balance of the Xylem Sap of Maize Seedlings. American Journal
of Plant Nutrition and Fertilization Technology, 201:1.
Alhendawi, R. A., Kirkby, E. A., Pilbeam, D. J., & Römheld, V. (2008). Effect of iron seed
dressing and form of nitrogen‐supply on growth and micronutrient concentration in shoots of
sorghum grown in a calcareous sand culture. Journal of Plant Nutrition, 31:1855‐1865.
Alhendawi, R. A., Römheld, V., Kirkby, E. A., & Marschner, H. (1997). Influence of increasing
bicarbonate concentrations on plant growth, organic acid accumulation in roots and iron
uptake by barley, sorghum, and maize. Journal of Plant Nutrition, 20:1731‐1753.
Alloway, B. J. (2004). Zinc in soils and crop nutrition. IZA Publications. International Zinc
Association, Brussels, pp 1–116
Alloway, B. J. (2009). Soil factors associated with Zn deficiency in crops and
humans. Environmental Geochemistry and Health, 31:537‐548.
Alonso‐Blanco, C., Aarts, M. G., Bentsink, L., Keurentjes, J. J., Reymond, M., Vreugdenhil, D.,
& Koornneef, M. (2009). What has natural variation taught us about plant development,
physiology, and adaptation? The Plant Cell, 21:1877‐1896.
Alonso‐Blanco, C., Gomez‐Mena, C., Llorente, F., Koornneef, M., Salinas, J., & Martínez‐
Zapater, J. M. (2005). Genetic and molecular analyses of natural variation indicate CBF2 as a
candidate gene for underlying a freezing tolerance quantitative trait locus in Arabidopsis. Plant
Physiology, 139:1304‐1312.

BIBLIOGRAPHY Siliques statistics for years 2013‐2015
86
Alscher, R.G., N. Erturk and L.S. Hearth. (2002). Role of superoxide dismutases (SODs) in
controlling oxidative stress in plants. Journal of Experimental Botany, 53:1331–1341
Al‐Shehbaz, I. A., & O'Kane Jr, S. L. (2002). Taxonomy and phylogeny of Arabidopsis
(Brassicaceae). The Arabidopsis Book, e0001.
Amer, E.A., A. Mahmoud and V. Sabel. (1985) Zeta potential and surface area of calcium
carbonate as related to phosphate sorption. Soil Science Society of America Journal, 49:1137‐
1142.
An, L., Zhou, Z., Sun, L., Yan, A., Xi, W., Yu, N. & Gan, Y. (2012). A zinc finger protein gene ZFP5
integrates phytohormone signaling to control root hair development in Arabidopsis. The Plant
Journal, 72:474‐490.
Asimit, J., & Zeggini, E. (2010). Rare variant association analysis methods for complex
traits. Annual Review of Genetics, 44, 293‐308.
Atwell, S., Huang, Y.S., Vilhjalmsson, B.J., Willems, G., Horton, M., … & Nordborg, M. (2010)
Genome‐wide association study of 107 phenotypes in Arabidopsis thaliana inbred lines.
Nature. 465:627–631
Babior, B. M. (1997). Superoxide: a two‐edged sword. Brazilian Journal of Medical and
Biological Research, 30:141‐155.
Bakker, E. G., Toomajian, C., Kreitman, M., & Bergelson, J. (2006). A genome‐wide survey of R
gene polymorphisms in Arabidopsis. The Plant Cell, 18:1803‐1818.
Bangerth, F. (1979). Calcium‐related physiological disorders of plants. Annual Review of
Phytopathology, 17:97‐122.
Barak, P., & Helmke, P. A. (1993). The chemistry of zinc. In Zinc in soils and plants (pp. 1‐13).
Springer Netherlands.
Barceló, J., Nicolás, G., Sabater, B., & Sánchez, R. (2001). Fisiología vegetal. Ediciones
Pirámide, Madrid, 275‐306.
Barhoumi, Z., Rabhi, M., & Gharsalli, M. (2007). Effect of two nitrogen forms on the growth
and iron nutrition of pea cultivated in presence of bicarbonate. Journal of Plant
Nutrition, 30:1953‐1965
Bauer P, Ling H‐Q, Guerinot ML (2007) FIT, the FER‐LIKE iron deficiency induced transcription
factor in Arabidopsis. Plant Physiolgy and Biochemestry 45:260‐61.
Baxter, I., Brazelton, J. N., Yu, D., Huang, Y. S., Lahner, B., Yakubova, E., ... & Vitek, O. (2010).
A coastal cline in sodium accumulation in Arabidopsis thaliana is driven by natural variation of
the sodium transporter AtHKT1. PLoS Genetics, 6,
Baxter, I., Muthukumar, B., Park, H. C., Buchner, P., Lahner, B., Danku, J., ... & Salt, D. E.
(2008). Variation in molybdenum content across broadly distributed populations of
BIBLIOGRAPHY Siliques statistics for years 2013‐2015
87
Arabidopsis thaliana is controlled by a mitochondrial molybdenum transporter (MOT1). PLoS
Genetics, 4,
Benfey, P. N., & Mitchell‐Olds, T. (2008). From genotype to phenotype: systems biology meets
natural variation. Science, 320:495‐497.
Benjamini, Y., & Yekutieli, D. (2001). The control of the false discovery rate in multiple testing
under dependency. Annals of Statistics, 57:1165‐1188.
Bergelson J, Roux F (2010) Towards identifying genes underlying ecologically relevant traits in
Arabidopsis thaliana. Natural Reviews Genetics 11:867‐879
Bienfait, H. F. (1985). Regulated redox processes at the plasmalemma of plant root cells and
their function in iron uptake. Journal of Bioenergetics and Biomembranes, 17:73‐83.
Bienfait, H. F., Bino, R. J., Bliek, A. V. D., Duivenvoorden, J. F., & Fontaine, J. M. (1983).
Characterization of ferric reducing activity in roots of Fe‐deficient Phaseolus
vulgaris. Physiologia Plantarum, 59:196‐202.
Bindschedler LV, Dewdney J, Blee KA, (2006). Peroxidase dependent apoplastic oxidative burst
in Arabidopsis required for pathogen resistance. The Plant Journal, 47:851–863.
Black CA (1965) Particle fraction and particle‐size analysis. Methods of Soil Analysis: Physical
and Mineralogical Properties Including Statistics of Measurement and sampling, 1:550‐551
Blanquart F, Kaltz O, Nuismer SL, Gandon S (2013) A practical guide to measuring local
adaptation. Ecology Letters 16:1195‐1205
Blokhina, O., E. Virolainen and K.V. Fagerstedt. (2003). Antioxidants, oxidative damage and
oxygen deprivation stress. Annals of Botanny, 91:179–194.
Bloom P. R and Inskeep W. P. (1986) Kinetics of Calcite Precipitation in the Presence of Water‐
soluble Organic Ligands. Soil Science 50:1167‐1172
Bohórquez, J. M., Romera, F. J., & Alcántara, E. (2001). Effect of Fe3+, Zn2+ and Mn2+ on ferric
reducing capacity and regreening process of the peach rootstock Nemaguard (Prunus persica
(L.) Batsch). Plant and Soil, 237:157‐163.
Bolòs, O., & Vigo, J. (2015). Flora dels països catalans, vol I‐IV.
Borevitz, J. O., & Nordborg, M. (2003). The impact of genomics on the study of natural
variation in Arabidopsis. Plant Physiology, 132:718‐725
Boxma .R (1972) Bicarbonate as the most important soil factor in lime‐induced chlorosis in the
Netherlands. Plant and Soil, 37:233‐243
Brachi B, Villoutreix R, Faure N, Hautekèete N, Piquot Y, Pauwels M, Roby D, Cuguen J, Berge
lson J, Roux F (2013) Investigation of the geographical scale of adaptive phenological variation
and its underlying genetics in Arabidopsis thaliana. Molecular Ecology 22:4222–4240

BIBLIOGRAPHY Siliques statistics for years 2013‐2015
88
Brachi, B., Faure, N., Horton, M., Flahauw, E., Vazquez, A., Nordborg, M., Bergelson, J.,
Cuguen, J., Roux, F. (2010) Linkage and association mapping of Arabidopsis thaliana flowering
time in nature. PLoS Genetics. 6
Brady, N.C. and R.R. Weil (1999) The Nature and Properties of Soils. 12th Edition. Prentice Hall,
Upper Saddle River, New Jersey.
Bristow, A. W. T. (2006). Accurate mass measurement for the determination of elemental
formula–A tutorial. Mass Spectrometry Reviews, 25:99‐111.
Brown, J. C., Chaney, R. L., and Ambler, J. E. (1971). A new tomato mutant inefficient in the
transport of iron. Plant Physiology, 25:48–53.
Brumbarova, T., Bauer, P., and Ivanov, R. (2015). Molecular mechanisms governing
Arabidopsis iron uptake. Trends in Plant Science. 20:124–133.
Buescher, E., Achberger, T., Amusan, I., Giannini, A., Ochsenfeld, C., Rus, A., Lahner, B.,
Hoekenga, O., Yakubova, E. & Guerinot, M. L. (2010). Natural genetic variation in selected
populations of Arabidopsis thaliana is associated with ionomic differences. PLoS One, 5
Burke, J. M., Burger, J. C., & Chapman, M. A. (2007). Crop evolution: from genetics to
genomics. Current Opinion in Genetics & Development, 17:525‐532.
Busoms, S. (2015) Local adaptation of wild populations of Arabidopsis thaliana to coastal and
inland habitats in Catalonia (Thesis) Universitat Autònoma de Barcelona and University of
Aberdeen.
Busoms, S., Terés, J., Huang, X., Bomblies, K., Danku, J., Douglas, A., Weigel, D.,
Poschenrieder, C. & Salt, D. (2015) Salinity is an agent of divergent selection driving local
adaptation of Arabidopsis to coastal habitats. Plant Physiology, 168:915‐929.
Calvarro, L. M., de Santiago‐Martín, A., Gómez, J. Q., González‐Huecas, C., Quintana, J. R.,
Vázquez, A., ... & Vera, R. R. (2014). Biological activity in metal‐contaminated calcareous
agricultural soils: the role of the organic matter composition and the particle size
distribution. Environmental Science and Pollution Research, 21:6176‐6187.
Carlioz, A., & Touati, D. (1986). Isolation of superoxide dismutase mutants in Escherichia coli:
is superoxide dismutase necessary for aerobic life? The EMBO Journal, 5:623.
Carter MR, Gregorich EG (2006) Soil Sampling and Methods of Analysis, 2nd edn. Taylor and
Francis Group, CRC Press, Boca Raton, FL, pp 1223.
Cesco, S., Neumann, G., Tomasi, N., Pinton, R., & Weisskopf, L. (2010). Release of plant‐borne
flavonoids into the rhizosphere and their role in plant nutrition. Plant and Soil, 329:1‐25.
Chaignon, V., & Hinsinger, P. (2003). A biotest for evaluating copper bioavailability to plants in
a contaminated soil. Journal of Environmental Quality, 32:824‐833.

BIBLIOGRAPHY Siliques statistics for years 2013‐2015
89
Chaney, R. L., Brown, J. C., & Tiffin, L. O. (1972). Obligatory reduction of ferric chelates in iron
uptake by soybeans. Plant Physiology, 50:208‐213.
Chao, D.‐Y., Chen, Y., Chen, J., Shi, S., Chen, Z., Wang, C., Danku, J.M., Zhao, F.‐J, Salt, D.E.
(2014) Genome‐wide association mapping identifies a new arsenate reductase enzyme critical
for limiting arsenic accumulation in plants. PloS Biology. 12
Chao, D.‐Y., Silva, A., Baxter, I., Huang, Y.S. Nordborg, M., Danku, J., Lahner, B., Yakubova, E.,
Salt, D.E. (2012) Genome‐wide association studies identify heavy metal ATPase3 as the
primary determinant of natural variation in leaf cadmium in Arabidopsis thaliana. PLoS
Genetics 8
Charlesworth, D., & Vekemans, X. (2005). How and when did Arabidopsis thaliana become
highly self‐fertilising. Bioessays, 27:472‐476.
Chary, P., Dillon, D., Schroeder, A. L., & Natvig, D. O. (1994). Superoxide dismutase (sod‐1)
null mutants of Neurospora crassa: oxidative stress sensitivity, spontaneous mutation rate and
response to mutagens. Genetics, 137:723‐730.
Chen C, Huang D, Liu J (2009) Functions and toxicity of nickel in plants: recent advances and
future prospects. Clean 37:304–313
Chouliaras, V., Therios, I., Molassiotis, A., & Diamantidis, G. (2004). Iron chlorosis in grafted
sweet orange (Citrus sinensis L.) plants: physiological and biochemical responses. Biologia
plantarum, 48:141‐144.
Clark, R. M., Schweikert, G., Toomajian, C., Ossowski, S., Zeller, G., Shinn, P., ... & Chen, H.
(2007). Common sequence polymorphisms shaping genetic diversity in Arabidopsis
thaliana. Science, 317:338‐342.
Clauss, M. J., & Koch, M. A. (2006). Poorly known relatives of Arabidopsis thaliana. Trends in
Plant Science, 11:449‐459.
Clegg, M. T., & Durbin, M. L. (2003). Tracing floral adaptations from ecology to
molecules. Nature Reviews. Genetics, 4:206.
Cockram, J., White, J., Zuluaga, D.L., Smith, D., Comadran, J., … & O'Sullivan, D.M. (2010)
Genome‐wide association mapping to candidate polymorphism resolution in the unsequenced
barley genome. Proceedings of the National Academy of Sciences of the United States of
America, 107:21611‐21616
Colangelo EP y Guerinot ML (2004) The essensial basic helix‐loop‐helix protein FIT1 is required
for the iron deficiency response. Plant Cell, 16:3400‐ 3412
Colombo, C., Palumbo, G., He, J. Z., Pinton, R., & Cesco, S. (2014). Review on iron availability
in soil: interaction of Fe minerals, plants, and microbes. Journal of Soils and Sediments, 14:538‐
548.
BIBLIOGRAPHY Siliques statistics for years 2013‐2015
90
Connolly, E. L., Campbell, N. H., Grotz, N., Prichard, C. L., & Guerinot, M. L. (2003).
Overexpression of the FRO2 ferric chelate reductase confers tolerance to growth on low iron
and uncovers posttranscriptional control. Plant Physiology, 133:1102‐1110.
Connolly, E. L., Fett, J. P., & Guerinot, M. L. (2002). Expression of the IRT1 metal transporter is
controlled by metals at the levels of transcript and protein accumulation. The Plant
Cell, 14:1347‐1357.
Coulombe, B.A., Chaney R.L., Weibold W.J. (1984). Use of bicarbonate in screening soybeans
for resistance to iron chlorosis. Plant Nature, 7:411‐425
Darwin, C., & Wallace, A. (1858). On the tendency of species to form varieties; and on the
perpetuation of varieties and species by natural means of selection. Zoological Journal of the
Linnean Society, 3:45‐62.
Das, P., Nutan, K. K., Singla‐Pareek, S. L., & Pareek, A. (2015). Oxidative environment and
redox homeostasis in plants: dissecting out significant contribution of major cellular
organelles. Frontiers in Environmental Science, 2:70.
Deisseroth, A. and A. Dounce. (1970). Catalase: Physical and chemical properties, mechanism
of catalysis and physiological role. Physiological Reviews, 50:319‐375.
Desikan, R., Hancock, J. T., Coffey, M. J., & Neill, S. J. (1996). Generation of active oxygen in
elicited cells of Arabidopsis thaliana is mediated by a NADPH oxidase‐like enzyme. FEBS
letters, 382:213‐217.
Dixon NE, Hinds JA, Fihelly AK, Gozala C, Winzor DJ, Blakeley RL, Zerner B (1980) Jack bean
urease (EC 3.5.1.5). IV. The molecular size and mechanism of inhibition by hydroxamic acids.
Spectrophotometric fixation of enzymes with reversible inhibitors. Canadian Journal of
Biochemestry, 58:1323‐1334
Doebley, J. F., Gaut, B. S., & Smith, B. D. (2006). The molecular genetics of crop
domestication. Cell, 127:1309‐1321.
Doerge, R. W. (2002). Mapping and analysis of quantitative trait loci in experimental
populations. Nature Reviews. Genetics, 3: 43.
Donnini, S., Castagna, A., Ranieri, A., & Zocchi, G. (2009). Differential responses in pear and
quince genotypes induced by Fe deficiency and bicarbonate. Journal of Plant
Physiology, 166:1181‐1193.
Dounce, A.L. (1983). A proposed mechanism for the catalatic action of catalase. Journal of
Theoretical Biology, 105:553‐567.
Eckhardt U, Marques AM, Buckout TJ (2001) Two iron‐regulated cation transporters from
tomato complement metal uptake‐deficient yeast mutants. Plant Molecular Biology 45:437‐
448.

BIBLIOGRAPHY Siliques statistics for years 2013‐2015
91
Eide D, Broderius M, Fett J, Guerinot ML (1996) A novel iron‐regulated metal transporter from
plants identified by functional expression in yeast. Proceedings of Natural Academy of Science
93:5624‐5628.
Elstner, E. F. (1991). Mechanisms of oxygen activation in different compartments of plant
cells. Current. Active Oxygen/Oxidative Stress and Plant Metabolism, 6:13‐26.
Erdei, S., A. Hegedûs, G. Hauptmann, J. Szalai and G. Horváth (2002) Heavy metal induced
physiological changes in antioxidative response system. Plant Physiology, 46:89‐90
Escudero, R., Gómez‐Gallego, M., Romano, S., Fernández, I., Gutiérrez‐Alonso, Á., Sierra, M.
A., … & P., Lucena, J. J. (2012). Biological activity of Fe (III) aquo‐complexes towards ferric
chelate reductase (FCR). Organic & Biomolecular Chemistry, 10:2272‐2281.
Fourcroy, P., Sisó‐Terraza, P., Sudre, D., Savirón, M., Reyt, G., Gaymard, F., et al., (2014). 951
Involvement of the ABCG37 transporter in secretion of scopoletin and derivatives by 952
Arabidopsis roots in response to iron deficiency. New Phytology, 201:155‐167
Fourcroy, P., Sisó‐Terraza, P., Sudre, D., Savirón, M., Reyt, G., Gaymard, F., ... & Briat, J. F.
(2014). Involvement of the ABCG37 transporter in secretion of scopoletin and derivatives by
Arabidopsis roots in response to iron deficiency. New Phytologist, 201:155‐167.
Foyer, C. H., and Noctor, G. (2005). Redox homeostasis and antioxidant signaling: a metabolic
interface between stress perception and physiological responses. Plant Cell. 17:1866–1875
Foyer, C. H., Lopez‐Delgado, H., Dat, J. F., & Scott, I. M. (1997). Hydrogen peroxide‐and
glutathione‐associated mechanisms of acclimatory stress tolerance and signalling. Physiologia
Plantarum, 100:241‐254.
Friesen, M. L., & von Wettberg, E. J. (2010). Adapting genomics to study the evolution and
ecology of agricultural systems. Current Opinion in Plant Biology, 13:119‐125.
Frische T, Mebes KH, Filser J. (2003) Assessing the bioavailability of contaminants in soils: A
review of recent contents. Research Report. Federal Environmental Agency
(Umweltbundesamt), Berlin, Germany
Gabrielli R, Pandolfini T (1984) Effect of Mg2+ and Ca2+ on the response to nickel toxicity in a
serpentine endemic and nickelaccumulating species.Physiologia Plantarum, 62:540–544
García, M. J., García‐Mateo, M. J., Lucena, C., Romera, F. J., Rojas, C. L., Alcántara, E., &
Pérez‐Vicente, R. (2014). Hypoxia and bicarbonate could limit the expression of iron
acquisition genes in Strategy I plants by affecting ethylene synthesis and signaling in different
ways. Physiologia Plantarum, 150:95‐106.
Ghandilyan, A., Barboza, L., Tisné, S., Granier, C., Reymond, M., Koornneef, M., Schat, H. and
Aarts, M. G. (2009). Genetic analysis identifies quantitative trait loci controlling rosette
mineral concentrations in Arabidopsis thaliana under drought. New Phytologist, 184:180‐192

BIBLIOGRAPHY Siliques statistics for years 2013‐2015
92
Gibson, G. (2011) Rare and common variants: twenty arguments. Nature Reviews Genetics.
13:135‐145
González‐Martínez, S. C., Krutovsky, K. V., & Neale, D. B. (2006). Forest‐tree population
genomics and adaptive evolution. New Phytologist, 170:227‐238.
Gralla, E. B., Thiele, D. J., Silar, P., & Valentine, J. S. (1991). ACE1, a copper‐dependent
transcription factor, activates expression of the yeast copper, zinc superoxide dismutase
gene. Proceedings of the National Academy of Sciences, 88:8558‐8562.
Graziano, M., and Lamattina, L. (2007). Nitric oxide accumulation is required for molecular
and physiological responses to iron deficiency in tomato roots. Plant Journal, 52:949–960.
Gries, D., & Runge, M. (1992). The ecological significance of iron mobilization in wild
grasses. Journal of Plant Nutrition, 15:1727‐1737.
Gries, D., & Runge, M. (1995). Responses of calcicole and calcifuge poaceae species to iron‐
limiting conditions. Plant Biology, 108:482‐489.
Grusak, M. A., Welch, R. M., & Kochian, L. V. (1990). Physiological characterization of a single‐
gene mutant of Pisum sativum exhibiting excess iron accumulation I. Root iron reduction and
iron uptake. Plant Physiology, 93:976‐981.
Guerinot ML, Yi Y (1994) Iron: nutritious, noxious, and not readily available. Plant Physiology
104:815‐820
Guerinot, M. L. (2000). The ZIP family of metal transporters. Biochimica et Biophysica Acta
(BBA)‐Biomembranes, 1465:190‐198.
Hagin, J. and B. Tucker. (1982). Fertilization of Dryland and Irrigated Soils. Springer Verlag,
New York.
Halliwell, B., & Gutteridge, J. M. (1984). Role of iron in oxygen radical reactions. Methods in
Enzymology, 105:47‐56.
Hansen, N.C., Schmitt M.A., Anderson J.E., Strock J.S. (2003). Iron deficiency of soybean in the
Upper Midwest and associated soil properties. Agronomy Journal, 95:1595‐1601.
Hao, Z., Li, X., Xie, C., Weng, J., Li, M., Zhang, D., … & Zhang, S. (2011) Identification of
functional genetic variations underlying drought tolerance in maize using SNP markers. Journal
of Integrative Plant Biology, 53:641‐52
Harada, H., & Leigh, R. A. (2006). Genetic mapping of natural variation in potassium
concentrations in shoots of Arabidopsis thaliana. Journal of Experimental Botany, 57: 953‐960.
Harter, R. D. (1983). Effect of soil pH on adsorption of lead, copper, zinc, and nickel. Soil
Science Society of America Journal, 47:47‐51.
Hell R, Stephan UW. (2003) Iron uptake, trafficking and homeostasis in plants. Planta. 216:541‐
51

BIBLIOGRAPHY Siliques statistics for years 2013‐2015
93
Helmke, R.H. Loeppert, P.N. Soltanpour, M.A. Tabatabai, C.T. Johnson and M.E. Sumner
(eds.). Methods of Soil Analysis Part 3 Chemical Methods. SSSA Special Publication No. 5.
Madison, WI., pp. 437‐474.
Hindt, M. N., & Guerinot, M. L. (2012). Getting a sense for signals: regulation of the plant iron
deficiency response. Biochimica et Biophysica Acta (BBA)‐Molecular Cell Research, 1823:1521‐
1530.
Hirschhorn, J. N., & Daly, M. J. (2005). Genome‐wide association studies for common diseases
and complex traits. Nature Reviews Genetics, 6:95‐108.
Huff, L. C., Marranzino, A. P., & Nakagawa, H. M. (1970). A geochemical study of alluvium‐
covered copper deposits in Pima County, Arizona (No. 1312‐C). US Govt. Print. Off.
Ivanov, R., Brumbarova, T., and Bauer, P. (2012). Fitting into the harsh reality: regulation of
iron‐deficiency responses in dicotyledonous plants. Molecular Plant 5:27‐42.
Jackson, R.D. and L.J. Erie. (1973). Soil and water management practices for calcareous soils.
In: FAO Soils Bulletin 21 ‐ Calcareous Soils. Food and Agriculture Organization of the United
Nations, Rome
Jakoby M, Wang HY, Reidt W, Eisshaar B, Bauer P (2004) FRU (BHLH029) is required for
induction of iron mobilization genes in Arabidopsis thaliana. FEBS Letters, 577:528‐534.
Jelali, N., Dell’orto, M., Abdelly, C., Gharsalli, M., & Zocchi, G. (2010). Changes of metabolic
responses to direct and induced Fe deficiency of two Pisum sativum cultivars. Environmental
and Experimental Botany 68:238‐246.
Jones, D. L. (1998). Organic acids in the rhizosphere–a critical review. Plant and Soil, 205: 25‐
44.
Kawai, S., Kamei, S., Matsuda, Y., Ando, R., Kondo, S., Ishizawa, A., & Alam, S. (2001).
Concentrations of iron and phytosiderophores in xylem sap of iron‐deficient barley plants. Soil
Science and Plant Nutrition, 47:265‐272.
Kawecki, T. J., & Ebert, D. (2004). Conceptual issues in local adaptation. Ecology
letters, 7:1225‐1241.
Keurentjes, J. J., Fu, J., De Vos, C. R., Lommen, A., Hall, R. D., Bino, R. J., ... & Koornneef, M.
(2006). The genetics of plant metabolism. Nature genetics, 38:842.
Kiekens, L. (1980). Heavy metal sorption in soil. Doctoral Thesis, Gent
Kim, B. G., Waadt, R., Cheong, Y. H., Pandey, G. K., Dominguez‐Solis, J. R., Schültke, S., ... &
Luan, S. (2007). The calcium sensor CBL10 mediates salt tolerance by regulating ion
homeostasis in Arabidopsis. The Plant Journal, 52: 473‐484.
Kliebenstein, D. J., Kroymann, J., Brown, P., Figuth, A., Pedersen, D., Gershenzon, J., &
Mitchell‐Olds, T. (2001). Genetic control of natural variation in Arabidopsis glucosinolate

BIBLIOGRAPHY Siliques statistics for years 2013‐2015
94
accumulation. Plant physiology, 126(2), 811‐825.Kobayashi, T., & Nishizawa, N. K. (2012). Iron
uptake, translocation, and regulation in higher plants. Annual Review of Plant Biology, 63:131‐
152.
Kobayashi, T., and Nishizawa, N. K. (2012). Iron uptake, translocation, and regulation in higher
plants. Annual Review of Plant Biology, 63:131‐152.
Kobayashi, Y., Kuroda, K., Kimura, K., Southron‐Francis, J. L., Furuzawa, A., Kimura, K., ... &
Koyama, H. (2008). Amino acid polymorphisms in strictly conserved domains of a P‐type
ATPase HMA5 are involved in the mechanism of copper tolerance variation in
Arabidopsis. Plant Physiology, 148:969‐980.
Kochian, L. V., Hoekenga, O. A., & Piñeros, M. A. (2004). How do crop plants tolerate acid
soils? Mechanisms of aluminum tolerance and phosphorous efficiency. Annual Review of Plant
Biology, 55:459‐493.
Koornneef, M., Alonso‐Blanco, C., & Vreugdenhil, D. (2004). Naturally occurring genetic
variation in Arabidopsis thaliana. Annual Review of Plant Biology,55:141‐172.
Kooyers, N. J. (2015). The evolution of drought escape and avoidance in natural herbaceous
populations. Plant Science, 234:155‐162.
Korshunova, Y. O., Eide, D., Clark, W. G., Guerinot, M. L., & Pakrasi, H. B. (1999). The IRT1
protein from Arabidopsis thaliana is a metal transporter with a broad substrate range. Plant
Molecular Biology, 40:37‐44.
Korte, A., Farlow, A. (2013) The advantages and limitations of trait analysis with GWAS: a
review. Plant Methods, 9:29
Korves, T. M., & Bergelson, J. (2003). A developmental response to pathogen infection in
Arabidopsis. Plant Physiology, 133:339‐347.
Kosegarten H., Hoffmann B., Rroco E., Grolig F., Glüsenkamp K., Mengel K. (2004) Apoplastic
pH and FeIII reduction in young sunflower (Helianthus annuus) roots. Physiologia Plantarum:
95‐106
Krämer, U., & Clemens, S. (2005). Functions and homeostasis of zinc, copper, and nickel in
plants. In Molecular biology of metal homeostasis and detoxification (pp. 215‐271). Springer
Berlin Heidelberg
Kramer, E. M. (2009). Aquilegia: a new model for plant development, ecology, and
evolution. Annual Review of Plant Biology, 60:261‐277.
Kruszewski, M. (2003). Labile iron pool: the main determinant of cellular response to oxidative
stress. Mutation Research/Fundamental and Molecular Mechanisms of Mutagenesis, 531:81‐
92.

BIBLIOGRAPHY Siliques statistics for years 2013‐2015
95
Ksouri, R., Megdiche, W., Debez, A., Falleh, H., Grignon, C., & Abdelly, C. (2007). Salinity
effects on polyphenol content and antioxidant activities in leaves of the halophyte Cakile
maritima. Plant Physiology and Biochemistry, 45:244‐249.
Landsberg, E.C. (1984). Regulation of iron stress response by whole plant activity. Journal of
Plant Nutrition 7:609‐621.
Lawrence, M. J. (1976). Variations in natural populations of Arabidopsis thaliana (L.)
Heynh. the Biology and Chemistry of the Cruciferae. JG Vaughan, AJ Macleod & BMG Jones,
eds.
Lee, J. A. (1998). The calcicole—calcifuge problem revisited. Advances in Botanical
Research, 29:1‐30.
Lee, J. A., & Woolhouse, H. W. (1969). Root growth and dark fixation of carbon dioxide in
calcicoles and calcifuges. New Phytologist, 68:247‐255.
Levin, D. A. (2006). Flowering phenology in relation to adaptive radiation. Systematic
Botany, 31:239‐246.
Li L, Cheng X, Ling HQ (2004) Isolation and characterization of Fe (III) chelate reductase gene
LeFRO1 in tomato. Plant Molecular Biology 54:125‐136.
Lindsay W.L., Schwab A.P. (1982). The chemistry of iron soils and its availability to plants.
Journal of Plant Nutrition, 5:821‐840
Lindsay, W. L. (1979). Chemical Equilibria in soil. John Wiley & Sons, New York
Lindsay, W. L. (1984). Soil and plant relationships associated with iron deficiency with
emphasis on nutrient interactions. Journal of Plant Nutrition, 7:489‐500.
Loeppert, R.H. and D.L. Suarez. (1996). Carbonate and gypsum, In: D.L. Sparks, A.L. Page, P.A.
Long, N. V., Dolstra, O., Malosetti, M., Kilian, B., Graner, A., Visser, R. G. F., van der Linden, C.
G. (2013). Association mapping of salt tolerance in barley (hordeum vulgare L.). Theoretical
and Applied Genetics. 126:2335‐2351
Loper, J. E., & Buyer, J. S. (1991). Siderophores in microbial interactions on plant
surfaces. Molecular Plant‐Microbe Interact, 4:5‐13.
López‐Millán, A. F., Grusak, M. A., Abadía, A., & Abadía, J. (2013). Iron deficiency in plants: an
insight from proteomic approaches. Frontiers in Plant Science, 4:254.
Loudet, O., Chaillou, S., Merigout, P., Talbotec, J., & Daniel‐Vedele, F. (2003). Quantitative
trait loci analysis of nitrogen use efficiency in Arabidopsis. Plant Physiology, 131:345‐358.
Lowenstam HA (1981) Minerals formed by organisms. Science 211:1126‐1131
Lower SK, Hochella MF, Beveridge TJ (2001) Bacterial recognition of mineral surfaces:
nanoscale interactions between Shewanella and α‐ FeOOH. Science 292:1360‐1363
BIBLIOGRAPHY Siliques statistics for years 2013‐2015
96
Lucena, C., Romera, F. J., Rojas, C. L., García, M. J., Alcántara, E., & Pérez‐Vicente, R. (2007).
Bicarbonate blocks the expression of several genes involved in the physiological responses to
Fe deficiency of Strategy I plants. Functional Plant Biology, 34: 1002‐1009.
Lucena, J. J. (2000). Effects of bicarbonate, nitrate and other environmental factors on iron
deficiency chlorosis. A review. Journal of Plant Nutrition, 23, 1591‐1606
Lyons, R., Stiller, J., Powell, J., Rusu, A., Manners, J. M., & Kazan, K. (2015). Fusarium
oxysporum triggers tissue‐specific transcriptional reprogramming in Arabidopsis thaliana. PLoS
One, 10, e0121902.
Malcolm, J. (2001) Molecular Analysis of Plant Adaptation to the Environment, Dordrecht, The
Netherlands, Kluwer academic publishers
Marin, B., Chopin, E. I. B., Jupinet, B., & Gauthier, D. (2008). Comparison of microwave‐
assisted digestion procedures for total trace element content determination in calcareous
soils. Talanta, 77:282‐288.
Marschner, H., Römheld, V., & Kissel, M. (1986). Different strategies in higher plants in
mobilization and uptake of iron. Journal of Plant Nutrition, 9:695‐713.
Marschner H. (1995) Mineral Nutrition of Higher Plants. London: Academic. 2nd ed.
Marschner H (2002) Mineral nutrition of higher plants, 3rd edn. Academic Press, London, 364‐
369
Maurer, F., Müller, S., and Bauer, P. (2011). Suppression of Fe deficiency gene expression by
jasmonate. Plant Physiology and Biochemistry, 49:530–536.
McCray JM, Matocha JE. (1992) Effects of soil water levels on solution bicarbonate, chlorosis
and growth of sorghum. Journal of Plant Nutrition, 15:1877–1890.
McKay, J. K., Christian, C. E., Harrison, S., & Rice, K. J. (2005). “How local is local?”—a review
of practical and conceptual issues in the genetics of restoration. Restoration Ecology, 13:432‐
440.
Mendel, G. (1996). Experiments in plant hybridization (1865). Verhandlungen des
naturforschenden Vereins Brünn. Available online: www.mendelweb.org/Mend
Mengel K., Breininger M. Th., Bübl W.(1984) Bicarbonate, the most important factor inducing
Iron chlorosis in vine grapes on calcareous soil. Plant and Soil, 81.333‐334.
Mengel, K., Kirkby, E. A., Kosegarten, H., & Appel, T. (2001). Soil Copper. In Principles of plant
nutrition (pp. 599‐611). Springer Netherlands.
Mikami, Y., Saito, A., Miwa, E., & Higuchi, K. (2011). Allocation of Fe and ferric chelate
reductase activities in mesophyll cells of barley and sorghum under Fe‐deficient
conditions. Plant Physiology and Biochemistry, 49:513‐519.

BIBLIOGRAPHY Siliques statistics for years 2013‐2015
97
Mitchell‐Olds, T., Willis, J. H., & Goldstein, D. B. (2007). Which evolutionary processes
influence natural genetic variation for phenotypic traits? Nature Reviews Genetics, 8:845‐856
Mittler R, Vanderauwera S, Gollery M, Van Breusegem F. (2004). The reactive oxygen gene
network in plants. Trends in Plant Science 9:490–498.
Mohsenian, Y., & Roosta, H. R. (2015). Effects of grafting on alkali stress in tomato plants:
datura rootstock improve alkalinity tolerance of tomato plants. Journal of Plant
Nutrition, 38:51‐72.
Molassiotis, A., Sotiropoulos, T., Tanou, G., Diamantidis, G., & Therios, I. (2006). Boron‐
induced oxidative damage and antioxidant and nucleolytic responses in shoot tips culture of
the apple rootstock EM 9 (Malus domestica Borkh). Environmental and Experimental
Botany, 56:54‐62.
Moog P.R., Brüggemann W., Schiefelbein J.W., Kuiper J.C. (1994) Responses to iron deficiency
in Arabidopsis thaliana: The Turbo iron reductase does not depend on the formation of root
hairs and transfer cells. Planta, 195:505‐513
Morris, D.R., R.H. Loeppert and T.J. Moore. (1990). Indigenous soil factors influencing Fe
chlorosis of soybean in calcareous soils. Soil Science of Society America Journal, 15: 1329‐1336.
Morrissey, J., Baxter, I. R., Lee, J., Li, L., Lahner, B., Grotz, N., ... & Guerinot, M. L. (2009). The
ferroportin metal efflux proteins function in iron and cobalt homeostasis in Arabidopsis. The
Plant Cell, 21:3326‐3338.
Msilini, N., Attia, H., Bouraoui, N., M’rah, S., Ksouri, R., Lachaâl, M., & Ouerghi, Z. (2009).
Responses of Arabidopsis thaliana to bicarbonate‐induced iron deficiency. Acta Physiologiae
Plantarum, 31:849‐853.
Myles, S., Peiffer, J., Brown, P. J., Ersoz, E. S., Zhang, Z., Costich, D. E., & Buckler, E. S. (2009).
Association mapping: critical considerations shift from genotyping to experimental design. The
Plant Cell, 21:2194‐2202.
Naranjo‐Arcos, M. A., & Bauer, P. (2016). Nutritional Deficiency. Chapter 4: Iron Nutrition,
Oxidative Stress, and Pathogen Defense.
Nelson DW, Sommers LE. (1982). Total carbon, organic carbon and organic matter. A: Page AL,
Miller RH, Keeney DR (Eds) Methods of soil analysis. Part 2. Chemical and microbiological
properties. American Society of Agronomy and Soil Science Society of America, Madison, 539‐
579.
Nordborg, M., Hu, T. T., Ishino, Y., Jhaveri, J., Toomajian, C., Zheng, H., ... & Jakobsson, M.
(2005). The pattern of polymorphism in Arabidopsis thaliana. PLoS biology, 3.
Obreza, T.A., A. K. Alva and D.V. Calvert. (1993) Citrus fertilizer management on calcareous
soils. Circular 1127, Soil and Water Science Department, Florida Cooperative Extension Service,
Institute of Food and Agricultural Sciences, University of Florida.
BIBLIOGRAPHY Siliques statistics for years 2013‐2015
98
Oshino, N., D. Jamieson, T. Sugano, and B. Chance. (1975). Optical measurement of the
catalase‐hydrogen peroxide intermediate compound I in the level of anaesthetized rats and its
implication to H202 production in viva. Biochemistry Journal, 146:67‐77.
Parat, C., Chaussod, R., Lévêque, J., Dousset, S., & Andreux, F. (2002). The relationship
between copper accumulated in vineyard calcareous soils and soil organic matter and
iron. European Journal of Soil Science, 53:663‐670.
Parra Terraza, S., Lara Murrieta, P., Villarreal Romero, M., & Hernandez Verdugo, S. (2012).
Plant growth and tomato yield at several nitrate/ammonium ratios and bicarbonate
concentrations. Revista Fitotecnia Mexicana, 35:143‐153.
Pearce, R.C., Y. Li and L.P. Bush (1999) Calcium and bicarbonate effects on the growth and
nutrient uptake of burley tobacco seedlings: hydroponic culture. Journal of Plant
Nutrition, 22:1069‐1078.
Peijnenburg WJGM, Jager T. (2003). Monitoring approaches to assess bioaccessibility and
bioavailability of metals: Matrix issues. Ecotoxicological and Environmental Safety 56:63‐77.
Phillips, J. P., Campbell, S. D., Michaud, D., Charbonneau, M., & Hilliker, A. J. (1989). Null
mutation of copper/zinc superoxide dismutase in Drosophila confers hypersensitivity to
paraquat and reduced longevity. Proceedings of the National Academy of Sciences, 86:2761‐
2765.
Poehlman, J. M., & Sleper, D. A. (1995). Methods in Plant Breeding. Breeding Field Crops, 172‐
174.
Porta, J., Lopez‐Acevedo, M., Rodriguez, R. (1986). Técnicas y experimentos en edafología.
Col∙legi Oficial d'Enginyers Agrònoms de Catalunya, Barcelona.
Porter L., Thorne, D. W. (1955) Interrelation of Carbon Dioxide and Bicarbonate Ions in
Causing Plant Chlorosis. Soil Science, 79:373‐382
Ramachandran, V., & D'Souza, S. F. (2013). Adsorption of nickel by Indian soils. Journal of Soil
Science and Plant Nutrition, 13:165‐173
Ranocha, P., Chabannes, M., Chamayou, S., Danoun, S., Jauneau, A., Boudet, A. M., &
Goffner, D. (2002). Laccase down‐regulation causes alterations in phenolic metabolism and cell
wall structure in poplar. Plant Physiology, 129:145‐155.
Reed, S. T., & Martens, D. C. (1996). Copper and zinc. Methods of Soil Analysis Part 3—
Chemical Methods, 703‐722.
Rehm GW, Caldwell AC (1968) Sulfur supplying capacity of soils and the relationship to soil
type. Soil Science 105:355‐361
Rehman, H. U., Aziz, T., Farooq, M., Wakeel, A., & Rengel, Z. (2012). Zinc nutrition in rice
production systems: a review. Plant and soil, 361:203‐226.

BIBLIOGRAPHY Siliques statistics for years 2013‐2015
99
Rellán‐Álvarez, R., Andaluz, S., Rodríguez‐Celma, J., Wohlgemuth, G., Zocchi, G., Álvarez‐
Fernández, A., ... & Abadía, J. (2010). Changes in the proteomic and metabolic profiles of Beta
vulgaris root tips in response to iron deficiency and resupply. BMC Plant Biology, 10:120.
Remington, D. L., & Purugganan, M. D. (2003). Candidate genes, quantitative trait loci, and
functional trait evolution in plants. International Journal of Plant Sciences, 164:7‐20.
Rengel, Z. (2015). Availability of Mn, Zn and Fe in the rhizosphere. Journal of Soil Science and
Plant Nutrition, 15:397‐409.
Rhoades, JD. (1982). Cation exchange capacity. A: Page AL, Miller RH, Keeney DR (Eds)
Methods of soil analysis. Part 2. Chemical and microbiological properties. American Society of
Agronomy and Soil Science Society of America, Madison, 149‐152.
Rhoads, W. A.; Wallace, A. (1960) Possible involvement of dark fixation of coz in lime‐induced
chlorosis. Soil Science 89:248‐256
Robinson NJ, Procter CM, Connolly EL, Guerinot ML (1999) A ferric chelate reductase for iron
uptake from soils. Nature 397:694‐697.
Rodríguez‐Celma, J., & Schmidt, W. (2013). Reduction‐based iron uptake revisited: on the role
of secreted iron‐binding compounds. Plant Signaling & Behavior, 8:1473‐1485.
Rodríguez‐Celma, J., Lattanzio, G., Grusak, M. A., Abadia, A., Abadia, J., & López‐Millán, A. F.
(2011). Root responses of Medicago truncatula plants grown in two different iron deficiency
conditions: changes in root protein profile and riboflavin biosynthesis. Journal of Proteome
Research, 10:2590‐2601.
Rodríguez‐Celma, J., Lin, W. D., Fu, G. M., Abadía, J., López‐Millán, A. F., & Schmidt, W.
(2013). Mutually exclusive alterations in secondary metabolism are critical for the uptake of
insoluble iron compounds by Arabidopsis and Medicago truncatula. Plant
Physiology, 162:1473‐1485.
Romera, F. J., Alcántara, E., & De la Guardia, M. D. (1998). The induction of the “turbo
reductase” is inhibited by cycloheximide, cordycepin and ethylene inhibitors in Fe‐deficient
cucumber (Cucumis sativus L.) plants. Protoplasma, 205:156‐162.
Romera, F. J., Alcantara, E., and De La Guardia, M. D. (1999). Ethylene production by Fe‐
deficient roots and its involvement in the regulation of Fe‐deficiency stress responses by
strategy I plants. Annals of Botany, 83:51‐55.
Romera, F. J., and Alcántara, E. (1994). Iron‐deficiency stress responses in cucumber (Cucumis
sativus L.) roots (A possible role for ethylene?) Plant Physiology, 105:1133–1138.
Romera, F.J., Lucena, C. García, M.J., Alcántara, E., and Pérez‐Vicente, R. (2014). Regulation
of Fe deficiency responses in wt pea and some of its mutants (brz and dgl), in Pisum sativum:
Cultivation, Functional Properties and Health Benefits. Ed. S. Becket: 1–20.
BIBLIOGRAPHY Siliques statistics for years 2013‐2015
100
Römheld V, Marschner H. (1986a) Evidence for a specific uptake system for iron
phytosiderophore in roots of grasses. Plant Physiology, 80:175–180
Römheld, V., & Marschner, H. (1983). Mechanism of iron uptake by peanut plants I. FeIII
reduction, chelate splitting, and release of phenolics. Plant Physiology, 71:949‐954.
Romheld, V., & Marschner, H. (1986a). Mobilization of iron in the rhizosphere of different
plant species. Advances in plant nutrition (USA).
Rosen, D. R., Siddiquef, T., Patterson, D., Figlewicz, D. A., Sapp, P., Hentatif, A and Gaston, S.
M. (1993). Mutations in Cu/Zn superoxide dismutase gene are associated with familial
amyotrophic. Nature, 362:4.
Rus, A., Baxter, I., Muthukumar, B., Gustin, J., Lahner, B., Yakubova, E., & Salt, D. E. (2006).
Natural variants of AtHKT1 enhance Na+ accumulation in two wild populations of
Arabidopsis. PLoS genetics, 2:210.
Ryan, J., D. Curtin and I. Safi (1981) Ammonia volatilization as influenced by calcium
carbonate particle size and iron oxides. Soil Science of Society America Journal, 45:338‐341.
Ryu, J. Y., Park, C. M., & Seo, P. J. (2011). The floral repressor BROTHER OF FT AND TFL1 (BFT)
modulates flowering initiation under high salinity in Arabidopsis. Molecules and cells, 32:295‐
303.
Sagi, M., & Fluhr, R. (2006). Production of reactive oxygen species by plant NADPH
oxidases. Plant physiology, 141:336‐340.
Salt, D. E., Baxter, I., & Lahner, B. (2008). Ionomics and the study of the plant ionome. Annual
Reviews of Plant Biology, 59:709‐733.
Santiago‐Martín A, Valverde‐Asenjo I, Quintana JR, GonzálezHuecas C, Lafuente AL (2013b)
Soil properties affecting metal extractability patterns in periurban calcareous agricultural soils
in the Mediterranean area. International Journal of Environment Research, 7:831–840.
Schaaf, G., Honsbein, A., Meda, A. R., Kirchner, S., Wipf, D., & von Wirén, N. (2006). AtIREG2
encodes a tonoplast transport protein involved in iron‐dependent nickel detoxification in
Arabidopsis thaliana roots. Journal of Biological Chemistry, 281:25532‐25540.
Schmidt, H., Gunther, C., Weber, M., Sporlein, C., Loscher, S., Bottcher, C., et al.,. (2014).
Metabolome analysis of Arabidopsis thaliana roots identifies a key metabolic pathway for iron
acquisition. PLoS ONE 9
Schmidt, W. (1999). Mechanisms and regulation of reduction‐based iron uptake in plants. New
Phytologist, 141:1‐26.
Schöttelndreier, M., Norddahl, M. M., Ström, L., & Falkengren‐Grerup, U. (2001). Organic acid
exudation by wild herbs in response to elevated Al concentrations. Annals of Botany, 87:769‐
775.

BIBLIOGRAPHY Siliques statistics for years 2013‐2015
101
Sedbrook, J. C., Carroll, K. L., Hung, K. F., Masson, P. H., & Somerville, C. R. (2002). The
Arabidopsis SKU5 gene encodes an extracellular glycosyl phosphatidylinositol–anchored
glycoprotein involved in directional root growth. The Plant Cell, 14:1635‐1648.
Séguéla, M., Briat, J. F., Vert, G., and Curie, C. (2008). Cytokinins negatively regulate the root
iron uptake machinery in Arabidopsis through a growth‐dependent pathway. Plant Journal,
55:289–300
Seregin IV, Kozhevnikova AD (2006) Physiological role of nickel and its toxic effects on higher
plants. Russian Journal of Plant Physiology 53:257‐277
Sherrard, M. E., & Maherali, H. (2006). The adaptive significance of drought escape in Avena
barbata, an annual grass. Evolution, 60:2478‐2489.
Shindo, C., Bernasconi, G., & Hardtke, C. S. (2007). Natural genetic variation in Arabidopsis:
tools, traits and prospects for evolutionary ecology. Annals of Botany, 99:1043‐1054.
Shindo, C., Lister, C., Crevillen, P., Nordborg, M., & Dean, C. (2006). Variation in the epigenetic
silencing of FLC contributes to natural variation in Arabidopsis vernalization response. Genes &
Development, 20:3079‐3083.
Shingles, R., North, M., & McCarty, R. E. (2001). Direct measurement of ferrous ion transport
across membranes using a sensitive fluorometric assay. Analytical Biochemistry, 296:106‐113.
Shingles, R., North, M., & McCarty, R. E. (2002). Ferrous ion transport across chloroplast inner
envelope membranes. Plant Physiology, 128:1022‐1030.
Sisó‐Terraza, P., Luis‐Villarroya, A., Fourcroy, P., Briat, J. F., Abadía, A., Gaymard, Fourcroy,
P., …, & Álvarez‐Fernández, A. (2016). Accumulation and Secretion of Coumarinolignans and
other Coumarins in Arabidopsis thaliana Roots in Response to Iron Deficiency at High
pH. Frontiers in Plant Science, 7.
Sisó‐Terraza, P., Rios, J. J., Abadía, J., Abadía, A., & Álvarez‐Fernández, A. (2016). Flavins
secreted by roots of iron‐deficient Beta vulgaris enable mining of ferric oxide via reductive
mechanisms. New Phytologist, 209:733‐745.
Soltanpour PA, Schwab AP (1977) A new soil test for simultaneous extraction of macro‐and
micro‐nutrients in alkaline soils. Communications in Soil Science and Plant Analysis 8:195‐207
Solti, Á., Kovács, K., Basa, B., Vértes, A., Sárvári, É., & Fodor, F. (2012). Uptake and
incorporation of iron in sugar beet chloroplasts. Plant Physiology and Biochemistry, 52:1‐97.
Stenøien, H. K., Fenster, C. B., Tonteri, A., & Savolainen, O. (2005). Genetic variability in
natural populations of Arabidopsis thaliana in northern Europe. Molecular Ecology, 14:137‐
148.
Stephan, U. W. & Sholz, G. (1993). Nicotianamine: mediator of transport of iron and heavy
metals in the phloem? Plant Physiology, 88:522‐529
BIBLIOGRAPHY Siliques statistics for years 2013‐2015
102
Stephan, U. W. (2002). Intra‐ and intercellular iron trafficking and subcellular
compartmentation within roots. Plant and Soil 241:19‐25
Su, Z., Ma, X., Guo, H., Sukiran, N. L., Guo, B., Assmann, S. M., & Ma, H. (2013). Flower
development under drought stress: morphological and transcriptomic analyses reveal acute
responses and long‐term acclimation in Arabidopsis. The Plant Cell, 25:3785‐3807.
Sunderman FW, Oskarsson A (1991) Metals and their compounds in the environment. In:
Merian E, Weinheim VCH (eds), 1101‐1126.
Susin, S., Abadia, A., González‐Reyes, J. A., Lucena, J. J., & Abadia, J. (1996). The pH
requirement for in vivo activity of the iron‐deficiency‐induced" Turbo" ferric chelate reductase
(a comparison of the iron‐deficiency‐induced iron reductase activities of intact plants and
isolated plasma membrane fractions in sugar beet). Plant Physiology, 110:111‐123.
Susín, S., Abián, J., Peleato, M. L., Sánchez‐Baeza, F., Abadía, A., Gelpi, E., & Abadía, J. (1994).
Flavin excretion from roots of iron‐deficient sugar beet (Beta vulgaris L.). Planta, 193:514‐519.
Talibudeen, O. and P. Arambarri (1964) The influence of the amount and the origin of calcium
carbonates on the isotopically‐exchangeable phosphate in calcareous soils. Journal of
Agricultural Science, 62:93‐97.
Tapeiro, H., & Tew, K. D. (2003). Trace elements in human physiology and pathology: Zinc and
metallothioneins. Biomedical Pharmacotherapy, 57:399–411
Temp, GA (1991) Nickel in plants and its toxicity: Ustoichivost’k tyazhelym metallam
dikorastushchikh vidov (Resistance of wild species to heavy metals). In: Alekseeva‐Popova NV
(ed). Lenuprizdat, Leningrad,139–146
Tian, F., Bradbury, P.J., Brown, P.J., Hung, H., Sun, Q., Flint‐Garcia, S., Rocheford, T.R.,
McMullen, M.D., Holland, J.B., Buckler, E.S. (2011) Genome‐wide association study of leaf
architecture in the maize nested association mapping population. Nature Genetics, 43:159‐62
Tyler, G. (2003). Some ecophysiological and historical approaches to species richness and
calcicole/calcifuge behaviour—contribution to a debate. Folia Geobotanica, 38:419‐428.
Udo, E. J., Bohn, H. L., & Tucker, T. C. (1970). Zinc adsorption by calcareous soils. Soil Science
Society of America Journal, 34:405‐407.
Uygur V., & Rimmer, D. L. (2000). Reactions of zinc with iron coated calcite surfaces at alkaline
pH. European Journal of Soil Science, 51:511‐516
Vallejo, V. R. (1986) La distribució dels carbonats en els sòls de la Depressió Central Catalana.
Institut Català de Historia Natural, 53:69‐79.
Vert, G., Grotz, N., Dédaldéchamp, F., Gaymard, F., Guerinot, M. L., Briat, J. F., & Curie, C.
(2002). IRT1, an Arabidopsis transporter essential for iron uptake from the soil and for plant
growth. The Plant Cell, 14:1223‐1233.

BIBLIOGRAPHY Siliques statistics for years 2013‐2015
103
Vogel‐Mikus K, Drobne D, Regvar M (2005) Zn, Cd and Pb accumulation and arbuscular
mycorrhizal colonization of pennycress Thlaspi praecox Wulf. (Brassicaceae) from the vicinity
of a lead mine and smelter in Slovenia. Environnemental Pollution 133:233‐242
Vreugdenhil, D., Aarts, M. G. M., Koornneef, M., Nelissen, H., & Ernst, W. H. O. (2004).
Natural variation and QTL analysis for cationic mineral content in seeds of Arabidopsis
thaliana. Plant, Cell & Environment, 27:828‐839.
Wadleigh, C. H., & Brown, J. W. (1952). The chemical status of bean plants afflicted with
bicarbonate‐induced chlorosis. Botanical Gazette, 373‐392.
Wang, B., Li, Y., and Zhang, W. H. (2012). Brassinosteroids are involved in response of
cucumber (Cucumis sativus) to iron deficiency. Annals of Botany, 110: 681‐688
Waters, B. M., & Grusak, M. A. (2008). Whole‐plant mineral partitioning throughout the life
cycle in Arabidopsis thaliana ecotypes Columbia, Landsberg erecta, Cape Verde Islands, and
the mutant line ysl1ysl3. New Phytologist, 177:389‐405.
Waters, B. M., Lucena, C., Romera, F. J., Jester, G. G., Wynn, A. N., Rojas, C. L., Alcantara, E.,
Pérez‐Vicente, R. (2007). Ethylene involvement in the regulation of the H+‐ATPase CsHA1 gene
and of the new isolated ferric reductase CsFRO1 and iron transporter CsIRT1 genes in
cucumber plants. Plant Physiology and Biochemistry, 45:293‐301.
Weigel, D., & Nordborg, M. (2005). Natural variation in Arabidopsis. How do we find the
causal genes?. Plant Physiology, 138:567‐568.
Weigel, D (2012) Natural Variation in Arabidopsis: From Molecular Genetics to Ecological
Genomics. Plant Physiology 158:2‐22
Welkie, G. W. (2000). Taxonomic distribution of dicotyledonous species capable of root
excretion of riboflavin under iron deficiency. Journal of Plant nutrition, 23, 1819‐1831.
Woolhouse H. W., Lee J. A. (1969) Root growth and dark fixation of carbon dioxide in calcicoles
and calcifuges. New Phytologist, 68:247–255
Wright, S. I., & Gaut, B. S. (2004). Molecular population genetics and the search for adaptive
evolution in plants. Molecular Biology and Evolution, 22:506‐519.
Wu, C. A., Lowry, D. B., Cooley, A. M., Wright, K. M., Lee, Y. W., & Willis, J. H. (2008).
Mimulus is an emerging model system for the integration of ecological and genomic
studies. Heredity, 100:220.
Yang, Q., Li, Z., Li, W., Ku, L., Wang, C., Ye, J., …, & Xu, M. (2013) CACTA‐like transposable
element in ZmCCT attenuated photoperiod sensitivity and accelerated the postdomestication
spread of maize. Proceedings of the National Academy of Sciences of the United States of
America. 110:16969‐16974

BIBLIOGRAPHY Siliques statistics for years 2013‐2015
104
Yoshida, S., & Tanaka, A. (1969). Zinc deficiency of the rice plant in calcareous soils. Soil
Science and Plant Nutrition, 15:75‐80.
Yuan Y, Wu H, Wang N, Li J, Zhao W, Du J, Wang D, Ling H‐Q (2008) FIT interacts with
AtbHLH38 and AtbHLH39 in regulating iron uptake gene expression for iron homeostasis in
Arabidopsis. Cell Research, 18:385‐397.
Yusuf, M., Fariduddin, Q., Hayat, S., & Ahmad, A. (2011). Nickel: an overview of uptake,
essentiality and toxicity in plants. Bulletin of Environmental Contamination and
Toxicology, 86:1‐17.
Zhao K, Aranzana MJ, Kim S, Lister C, Shindo C, Tang C, Toomajian C, Zheng H, Dean C,
Marjoram P, Nordborg M. (2007) An Arabidopsis example of association mapping in
structured samples. PLoS Genetics. 3:e4
Zuo, Y., Ren, L., Zhang, F., & Jiang, R. F. (2007). Bicarbonate concentration as affected by soil
water content controls iron nutrition of peanut plants in a calcareous soil. Plant Physiology and
Biochemistry, 45:357‐364.
Web Pages & Programmes
Bruker Compas Data Analysis: DataAnalysis version 4.2
GATK: McKenna, A., Hanna, M., Banks, E., Sivachenko, A., Cibulskis, K., Kernytsky, A.,
Garimella, K., Altshuler, D., Gabriel, S., Daly, M. & DePristo, M. A. (2010). The Genome
Analysis Toolkit: a MapReduce framework for analyzing next‐generation DNA sequencing
data. Genome Research, 20:1297‐1303.
GWAPP: https://gwas.gmi.oeaw.ac.at
JMP: Version 12 (2013‐2016) & Version 13 (2016‐2017) SAS Institute Inc, Cary, NC
Meteocat: Servei Meteorològic de Catalunya. «Trets generals». Web. [Consulta: 18 de febrer
del 2017]. CC‐BY‐SA‐3.0. http://meteo.cat
PICARD: http://broadinstitute.github.io/picard
SnpEff: Cingolani, P., Platts, A., Wang, L. L., Coon, M., Nguyen, T., Wang, L., Land, S.J., Lu, X. &
Ruden, D. M. (2012). A program for annotating and predicting the effects of single nucleotide
polymorphisms, SnpEff: SNPs in the genome of Drosophila melanogaster strain w1118; iso‐2;
iso‐3. Fly, 6:80‐92.
VCFtools: Danecek, P., Auton, A., Abecasis, G., Albers, C. A., Banks, E., DePristo, M. A.,
Handsaker, R. E., Lunter, G., Marth G. T., Sherry, S.T. & McVean, G. (2011). The variant call
format and VCFtools. Bioinformatics, 27:2156‐2158.

ANNEXES

ANNEXES Siliques statistics for years 2013‐2015
106
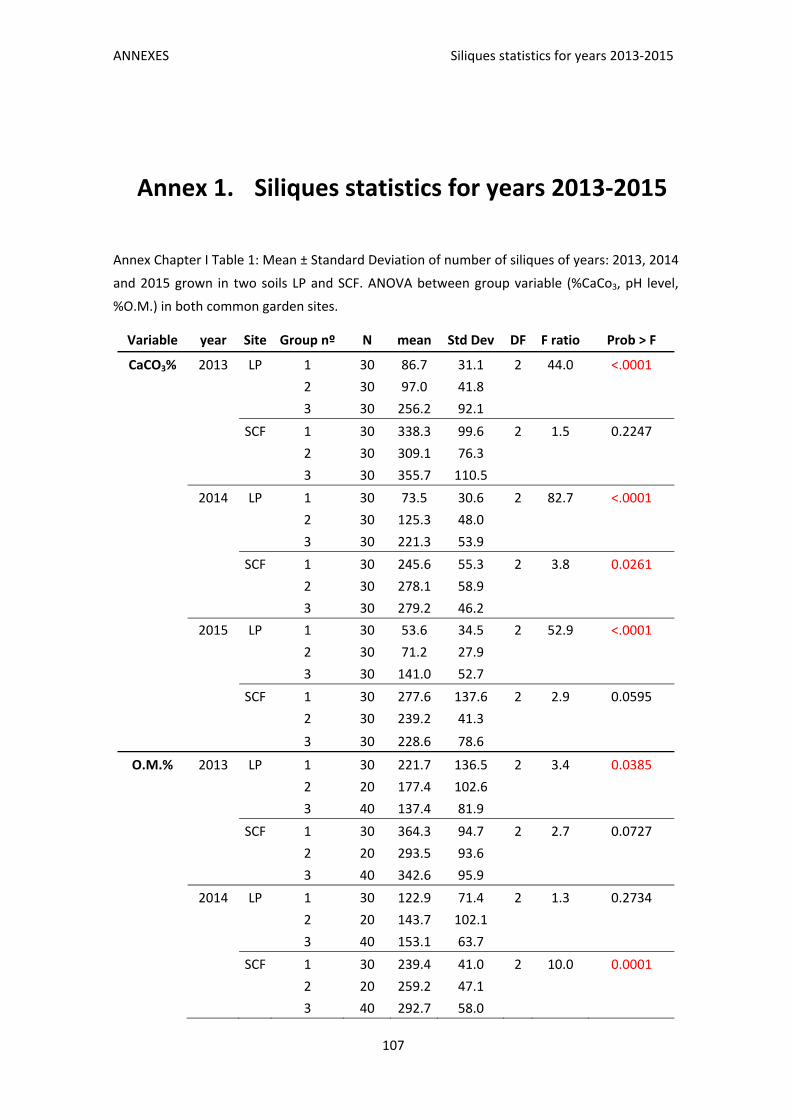
ANNEXES Siliques statistics for years 2013‐2015
107
Annex 1. Siliques statistics for years 2013‐2015
Annex Chapter I Table 1: Mean ± Standard Deviation of number of siliques of years: 2013, 2014
and 2015 grown in two soils LP and SCF. ANOVA between group variable (%CaCo3, pH level,
%O.M.) in both common garden sites.
Variable year Site Group nº N mean Std Dev DF F ratio Prob > F
CaCO3% 2013 LP 1 30 86.7 31.1 2 44.0 <.0001
2 30 97.0 41.8
3 30 256.2 92.1
SCF 1 30 338.3 99.6 2 1.5 0.2247
2 30 309.1 76.3
3 30 355.7 110.5
2014 LP 1 30 73.5 30.6 2 82.7 <.0001
2 30 125.3 48.0
3 30 221.3 53.9
SCF 1 30 245.6 55.3 2 3.8 0.0261
2 30 278.1 58.9
3 30 279.2 46.2
2015 LP 1 30 53.6 34.5 2 52.9 <.0001
2 30 71.2 27.9
3 30 141.0 52.7
SCF 1 30 277.6 137.6 2 2.9 0.0595
2 30 239.2 41.3
3 30 228.6 78.6
O.M.% 2013 LP 1 30 221.7 136.5 2 3.4 0.0385
2 20 177.4 102.6
3 40 137.4 81.9
SCF 1 30 364.3 94.7 2 2.7 0.0727
2 20 293.5 93.6
3 40 342.6 95.9
2014 LP 1 30 122.9 71.4 2 1.3 0.2734
2 20 143.7 102.1
3 40 153.1 63.7
SCF 1 30 239.4 41.0 2 10.0 0.0001
2 20 259.2 47.1
3 40 292.7 58.0
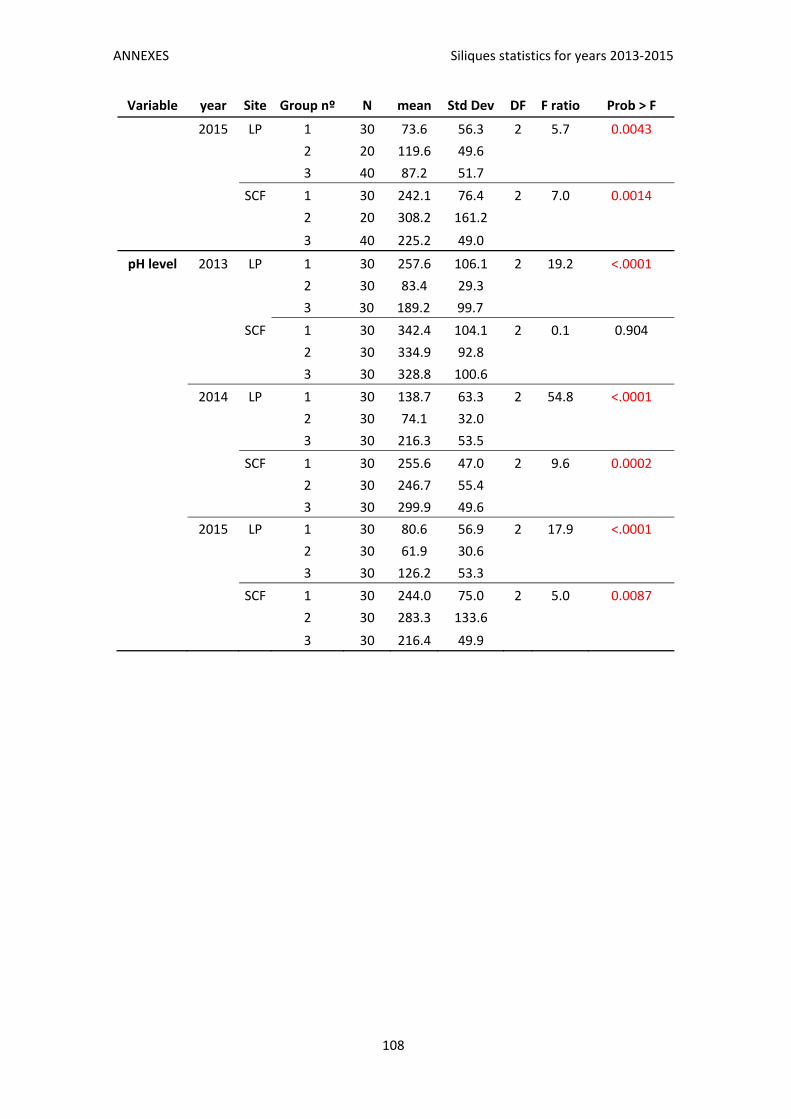
ANNEXES Siliques statistics for years 2013‐2015
108
Variable year Site Group nº N mean Std Dev DF F ratio Prob > F
2015 LP 1 30 73.6 56.3 2 5.7 0.0043
2 20 119.6 49.6
3 40 87.2 51.7
SCF 1 30 242.1 76.4 2 7.0 0.0014
2 20 308.2 161.2
3 40 225.2 49.0
pH level 2013 LP 1 30 257.6 106.1 2 19.2 <.0001
2 30 83.4 29.3
3 30 189.2 99.7
SCF 1 30 342.4 104.1 2 0.1 0.904
2 30 334.9 92.8
3 30 328.8 100.6
2014 LP 1 30 138.7 63.3 2 54.8 <.0001
2 30 74.1 32.0
3 30 216.3 53.5
SCF 1 30 255.6 47.0 2 9.6 0.0002
2 30 246.7 55.4
3 30 299.9 49.6
2015 LP 1 30 80.6 56.9 2 17.9 <.0001
2 30 61.9 30.6
3 30 126.2 53.3
SCF 1 30 244.0 75.0 2 5.0 0.0087
2 30 283.3 133.6
3 30 216.4 49.9
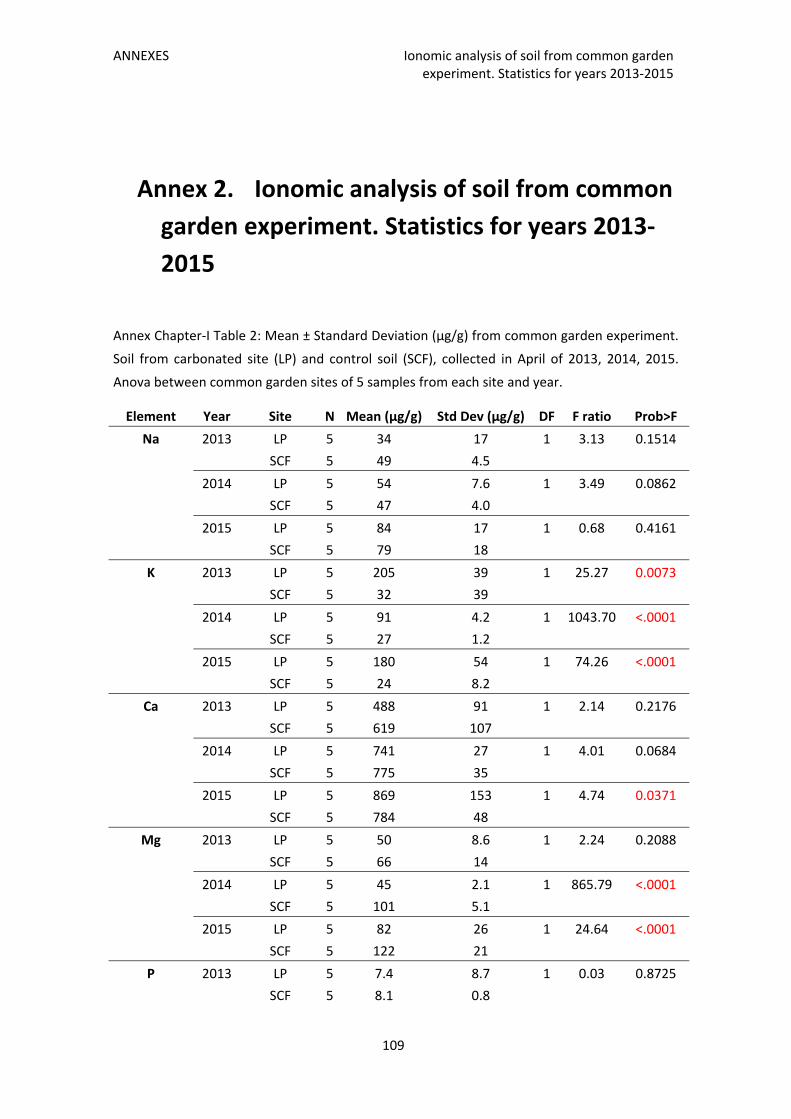
ANNEXES Ionomic analysis of soil from common garden experiment. Statistics for years 2013‐2015
109
Annex 2. Ionomic analysis of soil from common
garden experiment. Statistics for years 2013‐
2015
Annex Chapter‐I Table 2: Mean ± Standard Deviation (µg/g) from common garden experiment.
Soil from carbonated site (LP) and control soil (SCF), collected in April of 2013, 2014, 2015.
Anova between common garden sites of 5 samples from each site and year.
Element Year Site N Mean (µg/g) Std Dev (µg/g) DF F ratio Prob>F
Na 2013 LP 5 34 17 1 3.13 0.1514
SCF 5 49 4.5
2014 LP 5 54 7.6 1 3.49 0.0862
SCF 5 47 4.0
2015 LP 5 84 17 1 0.68 0.4161
SCF 5 79 18
K 2013 LP 5 205 39 1 25.27 0.0073
SCF 5 32 39
2014 LP 5 91 4.2 1 1043.70 <.0001
SCF 5 27 1.2
2015 LP 5 180 54 1 74.26 <.0001
SCF 5 24 8.2
Ca 2013 LP 5 488 91 1 2.14 0.2176
SCF 5 619 107
2014 LP 5 741 27 1 4.01 0.0684
SCF 5 775 35
2015 LP 5 869 153 1 4.74 0.0371
SCF 5 784 48
Mg 2013 LP 5 50 8.6 1 2.24 0.2088
SCF 5 66 14
2014 LP 5 45 2.1 1 865.79 <.0001
SCF 5 101 5.1
2015 LP 5 82 26 1 24.64 <.0001
SCF 5 122 21
P 2013 LP 5 7.4 8.7 1 0.03 0.8725
SCF 5 8.1 0.8

ANNEXES Ionomic analysis of soil from common garden experiment. Statistics for years 2013‐2015
110
Element Year Site N Mean (µg/g) Std Dev (µg/g) DF F ratio Prob>F
2014 LP 5 7.5 3.4 1 0.43 0.5248
SCF 5 8.6 1.7
2015 LP 5 8.7 4.7 1 11.40 0.002
SCF 5 3.5 4.1
S 2013 LP 5 12 3.4 1 1.00 0.4226
SCF 5 24 10
2014 LP 5 32 26 1 4.63 0.0525
SCF 5 6.7 7.4
2015 LP 5 14 9.8 1 0.66 0.4244
SCF 5 21 27
Fe 2013 LP 5 15 6.7 1 6.63 0.0617
SCF 5 37 9.9
2014 LP 5 16 0.7 1 53.08 <.0001
SCF 5 25 3.9
2015 LP 5 11 2.2 1 36.37 <.0001
SCF 5 17 4.2
Zn 2013 LP 5 11 6.7 1 13.36 0.0217
SCF 5 4.4 0.1
2014 LP 5 21 3.9 1 136.01 0.0545
SCF 5 10 7.1
2015 LP 5 21 16 1 80.92 <.0001
SCF 5 14 3.3

ANNEXES Ionomic analysis in leaf of demes grown in LP and SCF. Statistics for years 2013‐2015
111
Annex 3. Ionomic analysis in leaf of demes
grown in LP and SCF. Statistics for years 2013‐
2015
Annex Chapter‐I Table 3: Mean ± Standard Deviation of ionomic analysis (µg/g) in leaf from
A.thaliana plants ordered in relation to groups of CaCo3% growing in carbonated soil (LP) and
control soils (SCF) common gardens. ANOVA between CaCO3% groups in each site for three
years: 2013, 2014, 2015.
Element Year Site Group %CaCO3 N
Mean (µg/g)
Std Dev (µg/g) DF F ratio Prob >F
Na 2013 LP 1 21 644 125 2 1.8963 0.1762
2 21 387 144
3 21 322 118
SCF 1 21 262 111 2 1.2903 0.3008
2 21 549 140
3 21 364 118
2014 LP 1 21 615 132 2 3.4403 0.0632
2 21 539 186
3 21 167 122
SCF 1 21 324 79 2 0.9364 0.4125
2 21 349 91
3 21 492 100
2015 LP 1 21 815 171 2 2.4039 0.1266
2 21 537 156
3 21 308 156
SCF 1 21 480 82 2 1.1471 0.3439
2 21 322 88
3 21 517 134
K 2013 LP 1 21 35051 2505 2 1.5821 0.2302
2 21 32099 2892
3 21 38638 2362
SCF 1 21 32051 2365 2 0.4049 0.6733
2 21 31468 2992
3 21 34608 2528
2014 LP 1 21 34344 2050 2 4.4179 0.0344
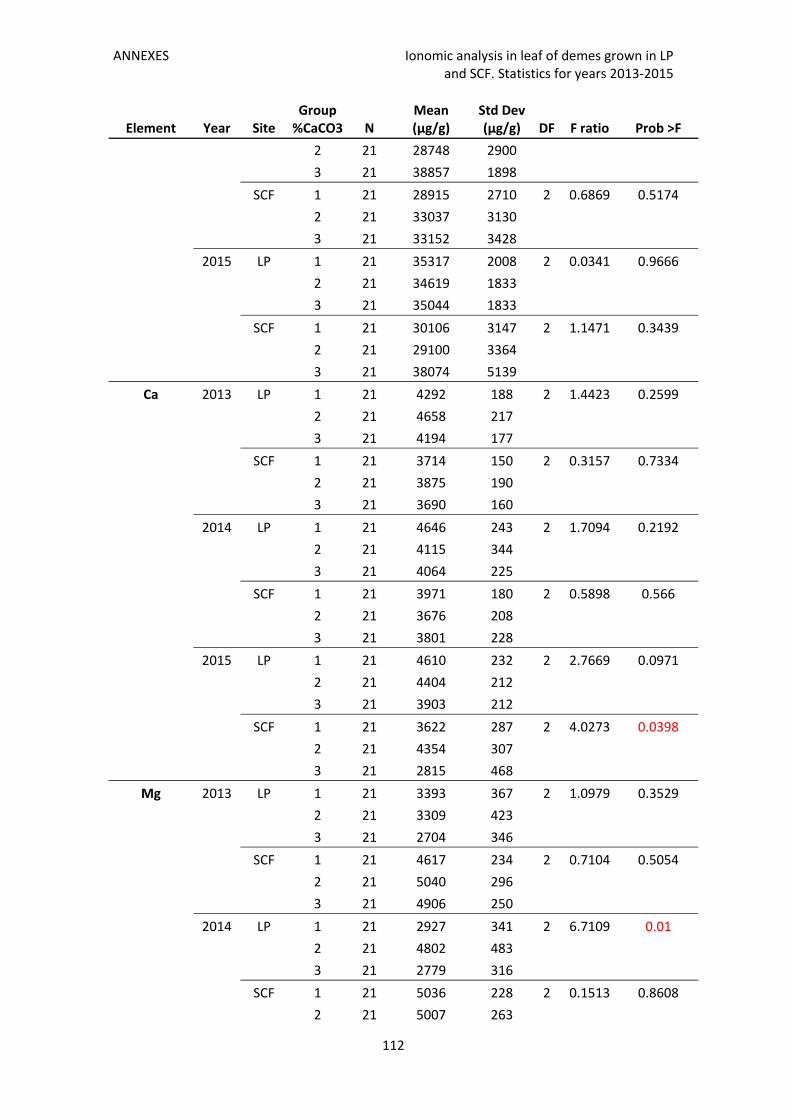
ANNEXES Ionomic analysis in leaf of demes grown in LP and SCF. Statistics for years 2013‐2015
112
Element Year Site Group %CaCO3 N
Mean (µg/g)
Std Dev (µg/g) DF F ratio Prob >F
2 21 28748 2900
3 21 38857 1898
SCF 1 21 28915 2710 2 0.6869 0.5174
2 21 33037 3130
3 21 33152 3428
2015 LP 1 21 35317 2008 2 0.0341 0.9666
2 21 34619 1833
3 21 35044 1833
SCF 1 21 30106 3147 2 1.1471 0.3439
2 21 29100 3364
3 21 38074 5139
Ca 2013 LP 1 21 4292 188 2 1.4423 0.2599
2 21 4658 217
3 21 4194 177
SCF 1 21 3714 150 2 0.3157 0.7334
2 21 3875 190
3 21 3690 160
2014 LP 1 21 4646 243 2 1.7094 0.2192
2 21 4115 344
3 21 4064 225
SCF 1 21 3971 180 2 0.5898 0.566
2 21 3676 208
3 21 3801 228
2015 LP 1 21 4610 232 2 2.7669 0.0971
2 21 4404 212
3 21 3903 212
SCF 1 21 3622 287 2 4.0273 0.0398
2 21 4354 307
3 21 2815 468
Mg 2013 LP 1 21 3393 367 2 1.0979 0.3529
2 21 3309 423
3 21 2704 346
SCF 1 21 4617 234 2 0.7104 0.5054
2 21 5040 296
3 21 4906 250
2014 LP 1 21 2927 341 2 6.7109 0.01
2 21 4802 483
3 21 2779 316
SCF 1 21 5036 228 2 0.1513 0.8608
2 21 5007 263

ANNEXES Ionomic analysis in leaf of demes grown in LP and SCF. Statistics for years 2013‐2015
113
Element Year Site Group %CaCO3 N
Mean (µg/g)
Std Dev (µg/g) DF F ratio Prob >F
3 21 5206 288
2015 LP 1 21 2473 365 2 9.3444 0.0026
2 21 4140 333
3 21 2262 333
SCF 1 21 5064 358 2 0.7345 0.4962
2 21 5479 382
3 21 4671 584
P 2013 LP 1 21 7422 645 2 0.9475 0.4044
2 21 6120 745
3 21 7165 608
SCF 1 21 3975 288 2 0.2091 0.8133
2 21 3691 365
3 21 3783 308
2014 LP 1 21 7094 655 2 4.662 0.0298
2 21 4453 926
3 21 7810 606
SCF 1 21 4015 273 2 0.9384 0.4118
2 21 3942 316
3 21 3436 346
2015 LP 1 21 6773 1022 2 1.116 0.3551
2 21 7076 933
3 21 8652 933
SCF 1 21 3339 410 2 1.3126 0.2983
2 21 3719 438
3 21 4610 669
S 2013 LP 1 21 4967 237 2 19.2813 <.0001
2 21 6147 274
3 21 6987 224
SCF 1 21 6930 281 2 2.8085 0.0883
2 21 6912 356
3 21 6040 301
2014 LP 1 21 5661 391 2 3.2951 0.0696
2 21 6359 553
3 21 7030 362
SCF 1 21 6092 230 2 0.3495 0.7103
2 21 5948 266
3 21 6277 291
2015 LP 1 21 5701 373 2 5.3099 0.0192
2 21 5948 340
3 21 7199 340
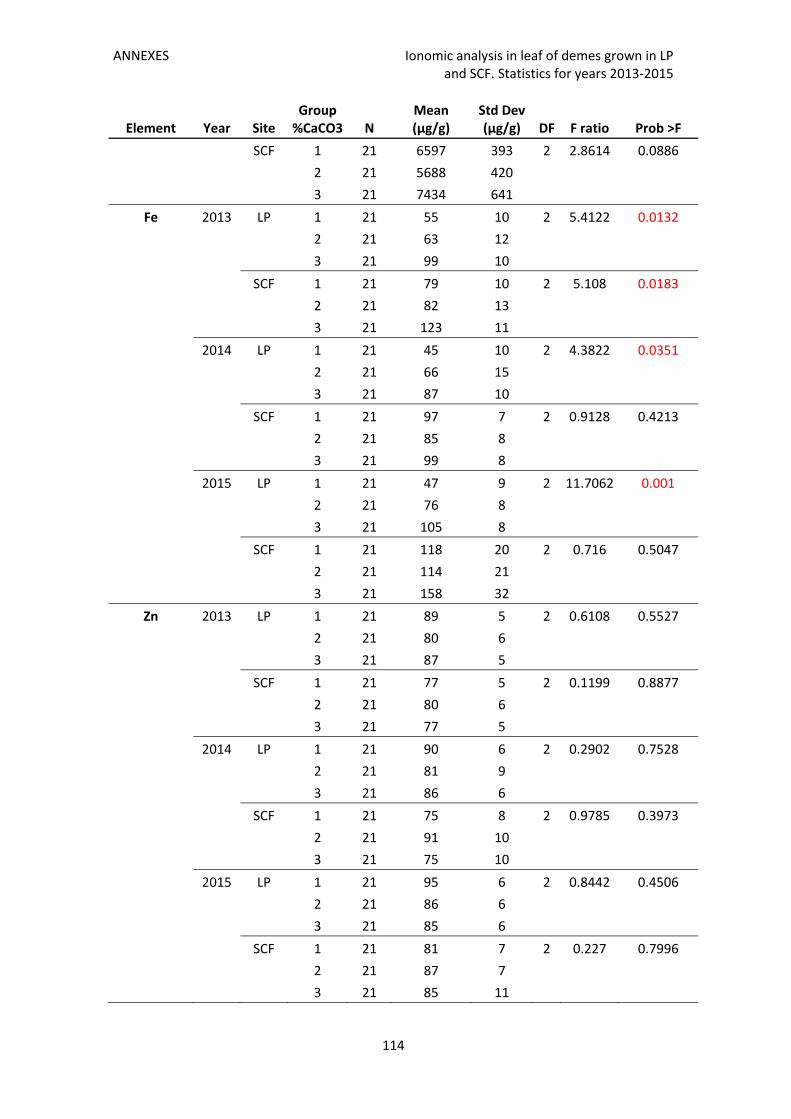
ANNEXES Ionomic analysis in leaf of demes grown in LP and SCF. Statistics for years 2013‐2015
114
Element Year Site Group %CaCO3 N
Mean (µg/g)
Std Dev (µg/g) DF F ratio Prob >F
SCF 1 21 6597 393 2 2.8614 0.0886
2 21 5688 420
3 21 7434 641
Fe 2013 LP 1 21 55 10 2 5.4122 0.0132
2 21 63 12
3 21 99 10
SCF 1 21 79 10 2 5.108 0.0183
2 21 82 13
3 21 123 11
2014 LP 1 21 45 10 2 4.3822 0.0351
2 21 66 15
3 21 87 10
SCF 1 21 97 7 2 0.9128 0.4213
2 21 85 8
3 21 99 8
2015 LP 1 21 47 9 2 11.7062 0.001
2 21 76 8
3 21 105 8
SCF 1 21 118 20 2 0.716 0.5047
2 21 114 21
3 21 158 32
Zn 2013 LP 1 21 89 5 2 0.6108 0.5527
2 21 80 6
3 21 87 5
SCF 1 21 77 5 2 0.1199 0.8877
2 21 80 6
3 21 77 5
2014 LP 1 21 90 6 2 0.2902 0.7528
2 21 81 9
3 21 86 6
SCF 1 21 75 8 2 0.9785 0.3973
2 21 91 10
3 21 75 10
2015 LP 1 21 95 6 2 0.8442 0.4506
2 21 86 6
3 21 85 6
SCF 1 21 81 7 2 0.227 0.7996
2 21 87 7
3 21 85 11

ANNEXES Ionomic analysis in soils from natural habitat. Statistics for years 2013‐2015
115
Annex 4. Ionomic analysis in soils from natural
habitat. Statistics for years 2013‐2015
Annex Chapter‐I Table 4: Mean ± Standard Deviation of mineral nutrients (µg/g) in soils from
Natural habitat collected in April 2013, 2014 and 2015. ANOVA between %CaCO3 groups of 21‐
24 samples from each year.
Element Year %CaCO3 group N
Mean (µg/g)
Std Dev (µg/g) DF F ratio Prob>F
Na
2013
1 24 104 5.5
2 36.98 <.0001 2 24 56.6 5.5
3 21 37.7 5.9
2014
1 24 96.0 4.9
2 21.74 <.0001 2 24 62.6 4.9
3 21 50.8 5.3
2015
1 24 118 5.3
2 31.31 <.0001 2 24 91.9 5.3
3 21 56.5 5.7
K
2013
1 24 105 12
2 42.45 <.0001 2 24 130 12
3 21 257 13
2014
1 24 105 14
2 31.27 <.0001 2 24 143 14
3 21 267 15
2015
1 24 119 17
2 21.54 <.0001 2 24 155 17
3 21 278 18
Ca
2013
1 24 664 20
2 1.28 0.2849 2 24 709 20
3 21 687 21
2014
1 24 692 19
2 0.35 0.7088 2 24 715 19
3 21 705 21
2015
1 24 760 24
2 1.68 0.1946 2 24 796 24
3 21 731 26
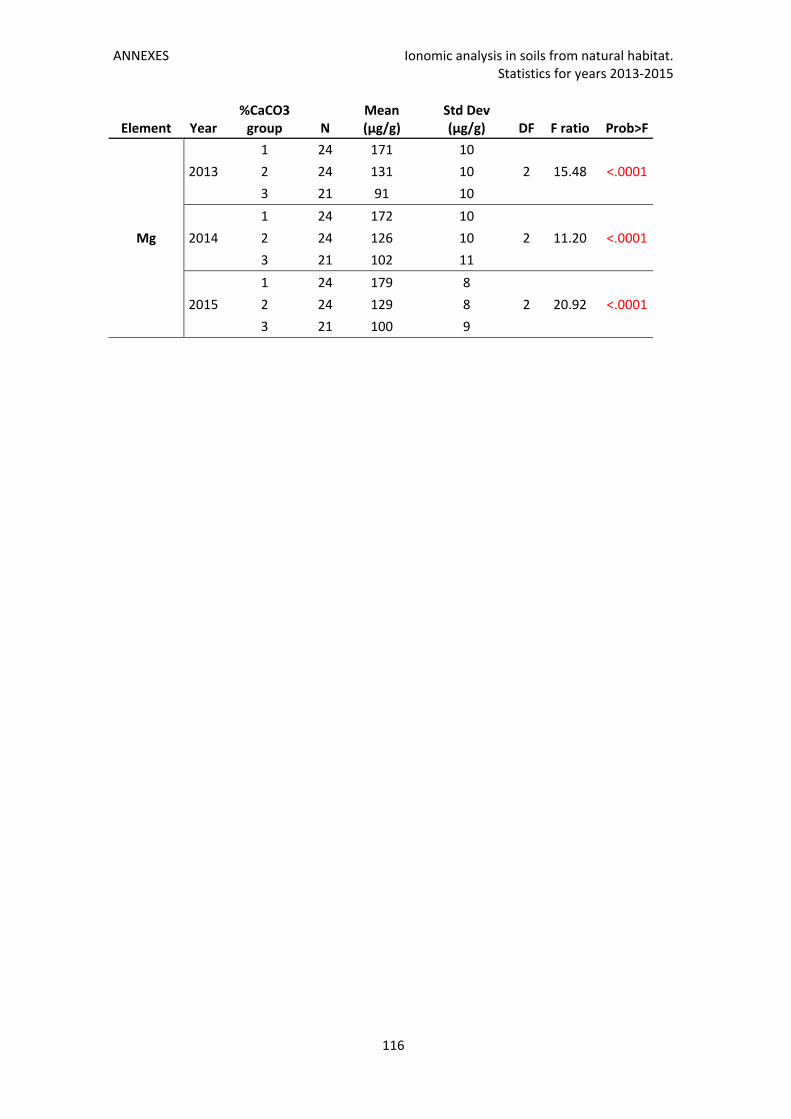
ANNEXES Ionomic analysis in soils from natural habitat. Statistics for years 2013‐2015
116
Element Year %CaCO3 group N
Mean (µg/g)
Std Dev (µg/g) DF F ratio Prob>F
Mg
2013
1 24 171 10
2 15.48 <.0001 2 24 131 10
3 21 91 10
2014
1 24 172 10
2 11.20 <.0001 2 24 126 10
3 21 102 11
2015
1 24 179 8
2 20.92 <.0001 2 24 129 8
3 21 100 9

ANNEXES Ionomic analysis in Mallorca soils
117
Annex 5. Ionomic analysis in Mallorca soils
Annex Chapter‐IV Table 1 Mean ± Standard Deviation of elements (µg/g) in soils from
Mallorca. ANOVA between carbonate soil and no carbonate soil (control) of 6 samples.
Element Soil N Mean Std Dev F ratio Prob > F
Na Carbonate 6 108 28.1 3.7 0,0833
Control 6 147 40.5
Mg Carbonate 6 235 36.1 4.2 0,0666
Control 6 307 78.4
K Carbonate 6 34.1 22.4 3.3 0,0992
Control 6 76.8 53.1
Ca Carbonate 6 720 35.4 14.5 0,0041
Control 6 628 45.3
Mn Carbonate 6 32.8 5.2 4.9 0,0495
Control 6 77.7 49
Fe Carbonate 6 10.8 1.5 2.2 0,1682
Control 6 12.8 2.9
Co Carbonate 6 0.10 0.08 0.007 0,9352
Control 6 0.09 0.05
Ni Carbonate 6 0.13 0.03 0.07 0,8047
Control 6 0.13 0.03
Cu Carbonate 6 2.65 1.36 2.7 0,1308
Control 6 6.55 5.64
Zn Carbonate 6 19.5 5.9 2.8 0,1242
Control 6 29.2 12.8
Mo Carbonate 6 0.04 0.01 4.8 0,0515
Control 6 0.05 0.01
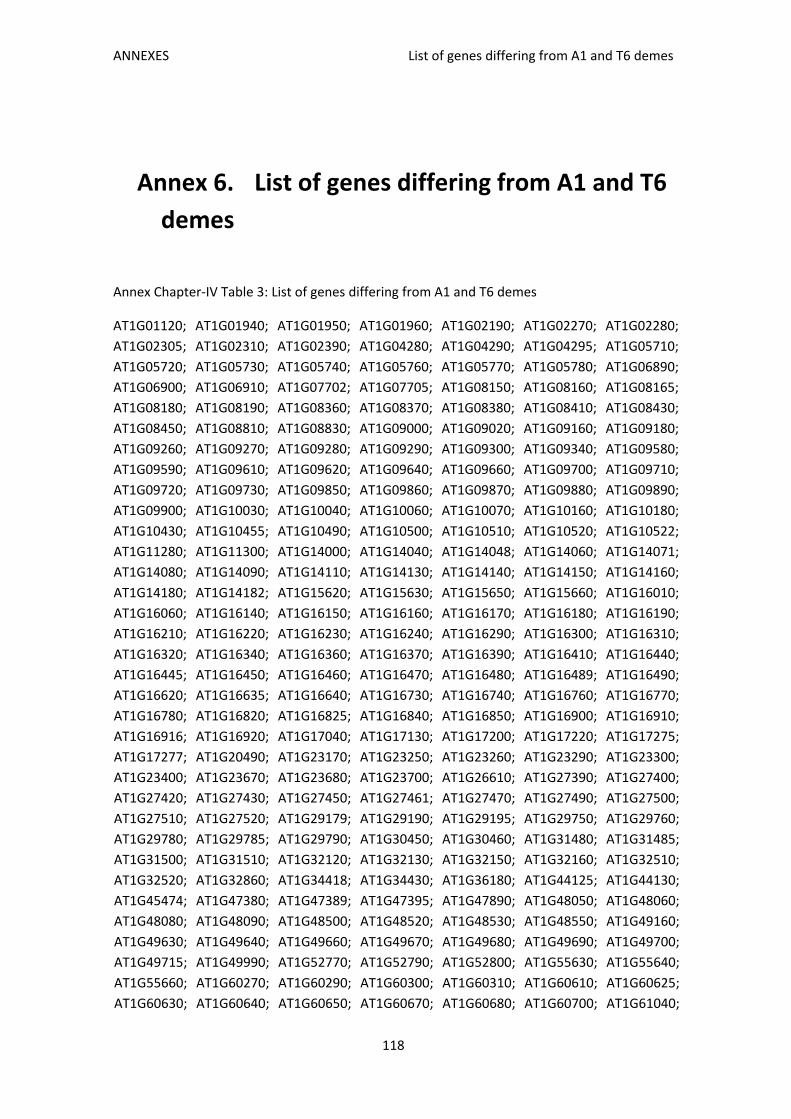
ANNEXES List of genes differing from A1 and T6 demes
118
Annex 6. List of genes differing from A1 and T6
demes
Annex Chapter‐IV Table 3: List of genes differing from A1 and T6 demes
AT1G01120; AT1G01940; AT1G01950; AT1G01960; AT1G02190; AT1G02270; AT1G02280;
AT1G02305; AT1G02310; AT1G02390; AT1G04280; AT1G04290; AT1G04295; AT1G05710;
AT1G05720; AT1G05730; AT1G05740; AT1G05760; AT1G05770; AT1G05780; AT1G06890;
AT1G06900; AT1G06910; AT1G07702; AT1G07705; AT1G08150; AT1G08160; AT1G08165;
AT1G08180; AT1G08190; AT1G08360; AT1G08370; AT1G08380; AT1G08410; AT1G08430;
AT1G08450; AT1G08810; AT1G08830; AT1G09000; AT1G09020; AT1G09160; AT1G09180;
AT1G09260; AT1G09270; AT1G09280; AT1G09290; AT1G09300; AT1G09340; AT1G09580;
AT1G09590; AT1G09610; AT1G09620; AT1G09640; AT1G09660; AT1G09700; AT1G09710;
AT1G09720; AT1G09730; AT1G09850; AT1G09860; AT1G09870; AT1G09880; AT1G09890;
AT1G09900; AT1G10030; AT1G10040; AT1G10060; AT1G10070; AT1G10160; AT1G10180;
AT1G10430; AT1G10455; AT1G10490; AT1G10500; AT1G10510; AT1G10520; AT1G10522;
AT1G11280; AT1G11300; AT1G14000; AT1G14040; AT1G14048; AT1G14060; AT1G14071;
AT1G14080; AT1G14090; AT1G14110; AT1G14130; AT1G14140; AT1G14150; AT1G14160;
AT1G14180; AT1G14182; AT1G15620; AT1G15630; AT1G15650; AT1G15660; AT1G16010;
AT1G16060; AT1G16140; AT1G16150; AT1G16160; AT1G16170; AT1G16180; AT1G16190;
AT1G16210; AT1G16220; AT1G16230; AT1G16240; AT1G16290; AT1G16300; AT1G16310;
AT1G16320; AT1G16340; AT1G16360; AT1G16370; AT1G16390; AT1G16410; AT1G16440;
AT1G16445; AT1G16450; AT1G16460; AT1G16470; AT1G16480; AT1G16489; AT1G16490;
AT1G16620; AT1G16635; AT1G16640; AT1G16730; AT1G16740; AT1G16760; AT1G16770;
AT1G16780; AT1G16820; AT1G16825; AT1G16840; AT1G16850; AT1G16900; AT1G16910;
AT1G16916; AT1G16920; AT1G17040; AT1G17130; AT1G17200; AT1G17220; AT1G17275;
AT1G17277; AT1G20490; AT1G23170; AT1G23250; AT1G23260; AT1G23290; AT1G23300;
AT1G23400; AT1G23670; AT1G23680; AT1G23700; AT1G26610; AT1G27390; AT1G27400;
AT1G27420; AT1G27430; AT1G27450; AT1G27461; AT1G27470; AT1G27490; AT1G27500;
AT1G27510; AT1G27520; AT1G29179; AT1G29190; AT1G29195; AT1G29750; AT1G29760;
AT1G29780; AT1G29785; AT1G29790; AT1G30450; AT1G30460; AT1G31480; AT1G31485;
AT1G31500; AT1G31510; AT1G32120; AT1G32130; AT1G32150; AT1G32160; AT1G32510;
AT1G32520; AT1G32860; AT1G34418; AT1G34430; AT1G36180; AT1G44125; AT1G44130;
AT1G45474; AT1G47380; AT1G47389; AT1G47395; AT1G47890; AT1G48050; AT1G48060;
AT1G48080; AT1G48090; AT1G48500; AT1G48520; AT1G48530; AT1G48550; AT1G49160;
AT1G49630; AT1G49640; AT1G49660; AT1G49670; AT1G49680; AT1G49690; AT1G49700;
AT1G49715; AT1G49990; AT1G52770; AT1G52790; AT1G52800; AT1G55630; AT1G55640;
AT1G55660; AT1G60270; AT1G60290; AT1G60300; AT1G60310; AT1G60610; AT1G60625;
AT1G60630; AT1G60640; AT1G60650; AT1G60670; AT1G60680; AT1G60700; AT1G61040;

ANNEXES List of genes differing from A1 and T6 demes
119
AT1G61050; AT1G61060; AT1G61065; AT1G61070; AT1G61320; AT1G61460; AT1G61480;
AT1G61490; AT1G61510; AT1G61520; AT1G61540; AT1G61560; AT1G61665; AT1G61685;
AT1G61940; AT1G61950; AT1G61980; AT1G62020; AT1G62095; AT1G62110; AT1G62130;
AT1G62670; AT1G62695; AT1G63450; AT1G63460; AT1G63470; AT1G63580; AT1G63610;
AT1G66430; AT1G66440; AT1G66450; AT1G66460; AT1G66630; AT1G66640; AT1G66820;
AT1G67170; AT1G67220; AT1G69450; AT1G69650; AT1G69660; AT1G69680; AT1G72000;
AT1G72110; AT1G72120; AT1G72130; AT1G72270; AT1G74170; AT1G74190; AT1G75540;
AT1G76450; AT1G76620; AT1G76630; AT1G76640; AT1G76660; AT1G76728; AT1G76730;
AT1G76750; AT1G76770; AT1G76790; AT1G77110; AT1G77120; AT1G77130; AT1G77131;
AT1G77370; AT1G77490; AT1G77510; AT1G77525; AT1G77530; AT1G77540; AT1G77580;
AT1G77610; AT1G77630; AT1G77640; AT1G77655; AT1G77660; AT1G77765; AT1G77770;
AT1G77780; AT1G77800; AT1G77810; AT1G78630; AT1G78640; AT1G78660; AT1G78740;
AT1G78750; AT1G78770; AT1G78830; AT2G02950; AT2G02960; AT2G02970; AT2G02980;
AT2G03430; AT2G03460; AT2G03740; AT2G03760; AT2G03780; AT2G10980; AT2G16250;
AT2G16260; AT2G16280; AT2G16365; AT2G16367; AT2G16380; AT2G16485; AT2G16490;
AT2G16500; AT2G19120; AT2G19140; AT2G19910; AT2G19930; AT2G20310; AT2G21520;
AT2G21530; AT2G21550; AT2G21570; AT2G21930; AT2G21940; AT2G21950; AT2G21960;
AT2G21970; AT2G21990; AT2G22000; AT2G22080; AT2G22150; AT2G22155; AT2G22160;
AT2G22180; AT2G22450; AT2G22840; AT2G22860; AT2G22870; AT2G22880; AT2G22900;
AT2G22940; AT2G22950; AT2G22970; AT2G23020; AT2G23040; AT2G23060; AT2G23093;
AT2G23096; AT2G23100; AT2G23110; AT2G24430; AT2G24460; AT2G24470; AT2G25160;
AT2G25170; AT2G25430; AT2G25460; AT2G25480; AT2G26360; AT2G26370; AT2G26390;
AT2G26400; AT2G26420; AT2G26830; AT2G26860; AT2G26940; AT2G29910; AT2G29920;
AT2G29940; AT2G32150; AT2G32160; AT2G32170; AT2G32179; AT2G32180; AT2G34900;
AT2G35630; AT2G35637; AT2G35658; AT2G35660; AT2G35680; AT2G35742; AT2G35743;
AT2G35744; AT2G35747; AT2G35750; AT2G35760; AT2G35765; AT2G35770; AT2G35780;
AT2G35850; AT2G35859; AT2G38140; AT2G38150; AT2G38160; AT2G39970; AT2G41060;
AT2G41460; AT2G41510; AT2G41530; AT2G41905; AT2G41930; AT2G42840; AT2G42860;
AT2G42870; AT2G43950; AT2G43980; AT2G44680; AT2G44850; AT2G44860; AT2G44890;
AT2G44920; AT2G44925; AT2G46360; AT2G46470; AT2G46480; AT2G46490; AT2G46493;
AT2G46494; AT2G46495; AT2G46570; AT2G46572; AT2G47250; AT3G01220; AT3G01230;
AT3G01250; AT3G01260; AT3G01270; AT3G01280; AT3G02020; AT3G02040; AT3G02050;
AT3G02065; AT3G02320; AT3G02330; AT3G02335; AT3G02360; AT3G10490; AT3G10520;
AT3G11200; AT3G11370; AT3G13720; AT3G13724; AT3G13740; AT3G17230; AT3G17240;
AT3G17250; AT3G17310; AT3G17320; AT3G17340; AT3G17350; AT3G17365; AT3G19770;
AT3G19790; AT3G20010; AT3G20020; AT3G20040; AT3G20100; AT3G20155; AT3G20160;
AT3G20240; AT3G20270; AT3G20290; AT3G20330; AT3G20340; AT3G20362; AT3G20680;
AT3G21650; AT3G21755; AT3G22700; AT3G22710; AT3G22720; AT3G22723; AT3G22730;
AT3G22740; AT3G23350; AT3G23360; AT3G23370; AT3G23410; AT3G23430; AT3G23470;
AT3G23490; AT3G23940; AT3G23960; AT3G24700; AT3G24710; AT3G24730; AT3G24740;
AT3G25520; AT3G25530; AT3G26000; AT3G26020; AT3G26030; AT3G26830; AT3G26855;
AT3G26860; AT3G26890; AT3G26900; AT3G26910; AT3G26922; AT3G26930; AT3G26932;
AT3G27540; AT3G27550; AT3G27555; AT3G27560; AT3G28730; AT3G42721; AT3G42722;
AT3G42724; AT3G42725; AT3G42783; AT3G44070; AT3G45390; AT3G45400; AT3G45420;
AT3G45430; AT3G45870; AT3G45890; AT3G45900; AT3G45910; AT3G46658; AT3G46668;

ANNEXES List of genes differing from A1 and T6 demes
120
AT3G46670; AT3G46930; AT3G47430; AT3G47440; AT3G47460; AT3G47750; AT3G47770;
AT3G48670; AT3G48675; AT3G48680; AT3G48690; AT3G48710; AT3G48860; AT3G48880;
AT3G48890; AT3G49060; AT3G49080; AT3G49100; AT3G49180; AT3G49200; AT3G49990;
AT3G50000; AT3G50020; AT3G50376; AT3G50930; AT3G50940; AT3G50950; AT3G50960;
AT3G50970; AT3G51180; AT3G51470; AT3G51478; AT3G51490; AT3G51950; AT3G52605;
AT3G52620; AT3G52630; AT3G52900; AT3G52905; AT3G53310; AT3G53330; AT3G53340;
AT3G53650; AT3G53670; AT3G53680; AT3G53690; AT3G53700; AT3G54010; AT3G54100;
AT3G54110; AT3G54130; AT3G54140; AT3G56880; AT3G56890; AT3G56891; AT3G56900;
AT3G56910; AT3G59950; AT3G59960; AT3G60060; AT3G60070; AT3G62620; AT3G62630;
AT3G62735; AT3G62740; AT3G62760; AT3G62770; AT3G62880; AT3G62890; AT4G00695;
AT4G00910; AT4G01026; AT4G01030; AT4G02060; AT4G02075; AT4G04350; AT4G04360;
AT4G04375; AT4G04380; AT4G04460; AT4G09200; AT4G09730; AT4G09731; AT4G09745;
AT4G09750; AT4G09760; AT4G11120; AT4G11945; AT4G12650; AT4G12680; AT4G12700;
AT4G13760; AT4G13970; AT4G13985; AT4G13990; AT4G13996; AT4G14147; AT4G14149;
AT4G14270; AT4G14272; AT4G14276; AT4G14290; AT4G14368; AT4G14830; AT4G14840;
AT4G14860; AT4G14870; AT4G14880; AT4G15242; AT4G15248; AT4G15258; AT4G15260;
AT4G15320; AT4G15340; AT4G16070; AT4G16095; AT4G16100; AT4G16380; AT4G16400;
AT4G16410; AT4G16420; AT4G19160; AT4G19180; AT4G19350; AT4G19370; AT4G19380;
AT4G19540; AT4G19550; AT4G19570; AT4G19580; AT4G19960; AT4G20070; AT4G20090;
AT4G20150; AT4G21150; AT4G23850; AT4G23870; AT4G23880; AT4G23890; AT4G23895;
AT4G24440; AT4G24470; AT4G24480; AT4G24520; AT4G24530; AT4G25730; AT4G25740;
AT4G25910; AT4G25940; AT4G28680; AT4G28700; AT5G01040; AT5G01130; AT5G01140;
AT5G01240; AT5G01260; AT5G01270; AT5G01290; AT5G01300; AT5G01320; AT5G01330;
AT5G01420; AT5G01430; AT5G01445; AT5G01450; AT5G01460; AT5G01470; AT5G01490;
AT5G01910; AT5G01920; AT5G01930; AT5G01950; AT5G01960; AT5G02980; AT5G02990;
AT5G03010; AT5G03030; AT5G03040; AT5G03610; AT5G03630; AT5G03790; AT5G03795;
AT5G03810; AT5G06560; AT5G06650; AT5G06660; AT5G06700; AT5G07380; AT5G07440;
AT5G08010; AT5G08020; AT5G08040; AT5G08050; AT5G08055; AT5G08060; AT5G08720;
AT5G08740; AT5G08750; AT5G08760; AT5G08780; AT5G08790; AT5G09220; AT5G09225;
AT5G09240; AT5G09250; AT5G09960; AT5G10220; AT5G10240; AT5G10260; AT5G10270;
AT5G10900; AT5G11600; AT5G11610; AT5G11630; AT5G13205; AT5G13220; AT5G13340;
AT5G13360; AT5G13500; AT5G13520; AT5G13530; AT5G13590; AT5G13610; AT5G13620;
AT5G13900; AT5G13910; AT5G13930; AT5G13940; AT5G15880; AT5G15890; AT5G15900;
AT5G15910; AT5G15920; AT5G16050; AT5G16060; AT5G16250; AT5G16260; AT5G16280;
AT5G16390; AT5G16420; AT5G16715; AT5G16840; AT5G16880; AT5G16890; AT5G16910;
AT5G17130; AT5G17140; AT5G17165; AT5G19940; AT5G19950; AT5G20130; AT5G20140;
AT5G20160; AT5G20165; AT5G20170; AT5G20200; AT5G20240; AT5G20580; AT5G20590;
AT5G20600; AT5G20610; AT5G20620; AT5G20635; AT5G20650; AT5G22460; AT5G22510;
AT5G22520; AT5G22530; AT5G22545; AT5G22550; AT5G22600; AT5G23700; AT5G23710;
AT5G23720; AT5G23730; AT5G23880; AT5G23900; AT5G23903; AT5G23908; AT5G23920;
AT5G23955; AT5G23970; AT5G23980; AT5G37020; AT5G37030; AT5G37050; AT5G37055;
AT5G37060; AT5G40080; AT5G40316; AT5G40370; AT5G40382; AT5G40440; AT5G41170;
AT5G41190; AT5G41770; AT5G41790; AT5G42146; AT5G42150; AT5G42180; AT5G42190;
AT5G42470; AT5G45780; AT5G45790; AT5G45800; AT5G46250; AT5G46260; AT5G46270;
AT5G47230; AT5G47240; AT5G47260; AT5G47400; AT5G47420; AT5G47930; AT5G48070;

ANNEXES List of genes differing from A1 and T6 demes
121
AT5G48090; AT5G48100; AT5G48330; AT5G48335; AT5G48350; AT5G48360; AT5G48657;
AT5G48660; AT5G48675; AT5G48920; AT5G48930; AT5G48990; AT5G49590; AT5G49600;
AT5G49615; AT5G49740; AT5G49760; AT5G50210; AT5G50230; AT5G50240; AT5G50260;
AT5G51650; AT5G51740; AT5G51845; AT5G51860; AT5G52010; AT5G53910; AT5G54440;
AT5G54460; AT5G54910; AT5G55140; AT5G55150; AT5G55630; AT5G55640; AT5G55650;
AT5G55660; AT5G55670; AT5G55680; AT5G55700; AT5G55710; AT5G55720; AT5G55730;
AT5G55750; AT5G55855; AT5G56150; AT5G56170; AT5G56180; AT5G56320; AT5G56330;
AT5G56380; AT5G56430; AT5G56440; AT5G56450; AT5G56452; AT5G56460; AT5G56520;
AT5G56680; AT5G56690; AT5G56710; AT5G56720; AT5G56730; AT5G57360; AT5G58840;
AT5G59930; AT5G59945; AT5G59950; AT5G59960; AT5G60080; AT5G60090; AT5G61980;
AT5G63760; AT5G63810; AT5G63820; AT5G63840; AT5G63870; AT5G63880; AT5G63890;
AT5G63905; AT5G63910; AT5G63920; AT5G63930; AT5G63940; AT5G63941; AT5G63950;
AT5G64410; AT5G65610; AT5G65615; AT5G66820; AT5G66840; AT5G66850; AT5G66890;
AT5G66900; AT5G66910; AT5G66920; AT5G67000; AT5G67010; AT5G67030; AT5G67100;
AT5G67265; AT5G67270;
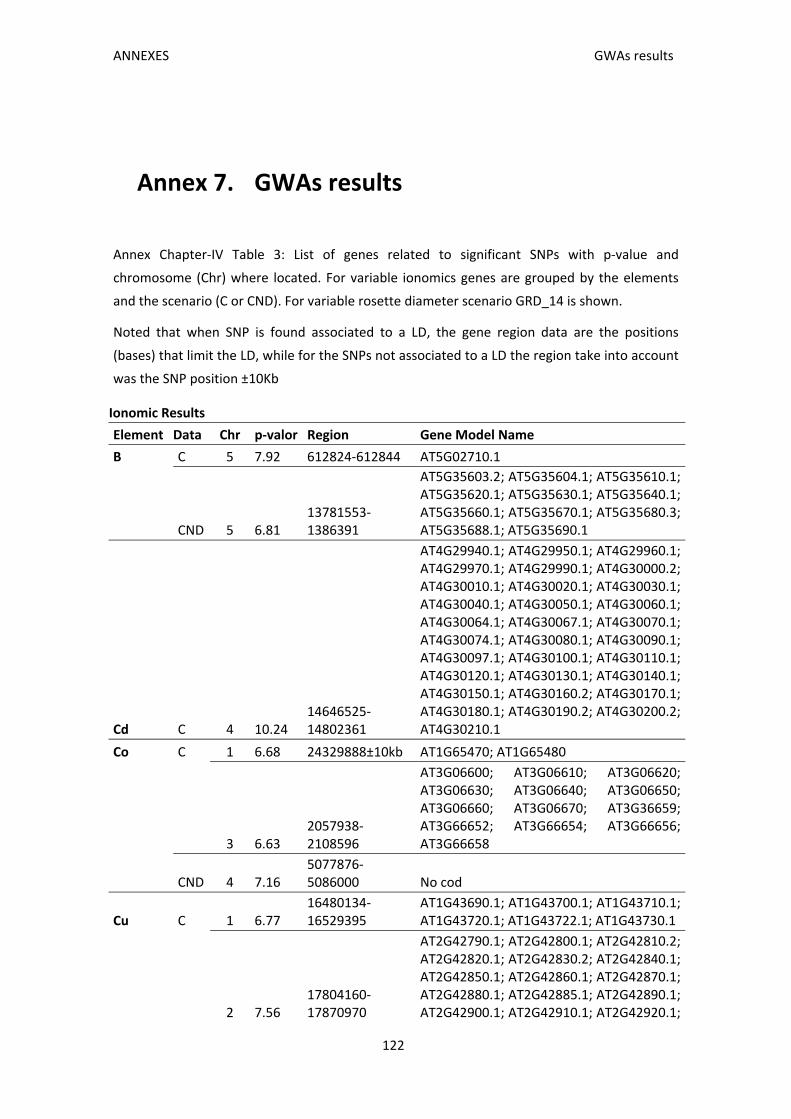
ANNEXES GWAs results
122
Annex 7. GWAs results
Annex Chapter‐IV Table 3: List of genes related to significant SNPs with p‐value and
chromosome (Chr) where located. For variable ionomics genes are grouped by the elements
and the scenario (C or CND). For variable rosette diameter scenario GRD_14 is shown.
Noted that when SNP is found associated to a LD, the gene region data are the positions
(bases) that limit the LD, while for the SNPs not associated to a LD the region take into account
was the SNP position ±10Kb
Ionomic Results
Element Data Chr p‐valor Region Gene Model Name
B C 5 7.92 612824‐612844 AT5G02710.1
CND 5 6.81 13781553‐1386391
AT5G35603.2; AT5G35604.1; AT5G35610.1; AT5G35620.1; AT5G35630.1; AT5G35640.1; AT5G35660.1; AT5G35670.1; AT5G35680.3; AT5G35688.1; AT5G35690.1
Cd C 4 10.24 14646525‐14802361
AT4G29940.1; AT4G29950.1; AT4G29960.1; AT4G29970.1; AT4G29990.1; AT4G30000.2; AT4G30010.1; AT4G30020.1; AT4G30030.1; AT4G30040.1; AT4G30050.1; AT4G30060.1; AT4G30064.1; AT4G30067.1; AT4G30070.1; AT4G30074.1; AT4G30080.1; AT4G30090.1; AT4G30097.1; AT4G30100.1; AT4G30110.1; AT4G30120.1; AT4G30130.1; AT4G30140.1; AT4G30150.1; AT4G30160.2; AT4G30170.1; AT4G30180.1; AT4G30190.2; AT4G30200.2; AT4G30210.1
Co C 1 6.68 24329888±10kb AT1G65470; AT1G65480
3 6.63 2057938‐2108596
AT3G06600; AT3G06610; AT3G06620; AT3G06630; AT3G06640; AT3G06650; AT3G06660; AT3G06670; AT3G36659; AT3G66652; AT3G66654; AT3G66656; AT3G66658
CND 4 7.16 5077876‐5086000 No cod
Cu C 1 6.77 16480134‐16529395
AT1G43690.1; AT1G43700.1; AT1G43710.1; AT1G43720.1; AT1G43722.1; AT1G43730.1
2 7.56 17804160‐17870970
AT2G42790.1; AT2G42800.1; AT2G42810.2; AT2G42820.1; AT2G42830.2; AT2G42840.1; AT2G42850.1; AT2G42860.1; AT2G42870.1; AT2G42880.1; AT2G42885.1; AT2G42890.1; AT2G42900.1; AT2G42910.1; AT2G42920.1;

ANNEXES GWAs results
123
Ionomic Results
Element Data Chr p‐valor Region Gene Model Name
AT2G42930.1; AT2G42940.1; AT2G42950.1; AT2G42955.1; AT2G42960.1
3 6.46 940937‐948608 AT3G03750.2; AT3G03760.1; AT3G03770.1
4 6.35 2694152‐2696156 AT4G05260.1; AT4G05270.1
6.54 7969817‐7971311 AT4G13730.1
6.15 8419223±10kbKb
AT4G14660.1; AT4G14670.1; AT4G14680.1; AT4G14690.1; AT4G14700.1; AT4G14710.5; AT4G14713.1
7.3 15268789±10kb
AT4G31460.1; AT4G31470.1; AT4G31480.1; AT4G31490.1; AT4G31500.1; AT4G31510.1; AT4G31520.1
6.32 17516327±10kb
AT4G37190.1; AT4G37200.1; AT4G37210.1; AT4G37220.1; AT4G37230.1; AT4G37235.1; AT4G37240.1
Fe C 1 7.56 11219975±10kb AT1G31320.1; AT1G31330.1; AT1G31335.1; AT1G31340.1
6.34 29888436‐29938104
AT1G31350.1; AT1G79450.1; AT1G79460.1; AT1G79470.1; AT1G79480.1; AT1G79490.1; AT1G79510.1; AT1G79520.2; AT1G79530.1; AT1G79540.1; AT1G79550.1; AT1G79560.1; AT1G79570.1
5 7.43 13782455‐ 13799218 AT5G35603.2; AT5G35604.1
Mg C 3 8.7 3438537‐3442703 AT3G10980.1; AT3G10985.1
Mn CND 1 6.32 26389344‐26392275 AT1G70060.1; AT1G70070.1
5 6.39 8490721‐8525213
AT5G24750.1; AT5G24760.1; AT5G24770.1; AT5G24780.1; AT5G24790.1; AT5G24800.1; AT5G24810.2; AT5G24820.1
Mo CND 4 6.52 16400142‐16418933
AT4G34260.1; AT4G34265.1; AT4G34270.1; AT4G34280.1; AT4G34290.1; AT4G34400.1; AT4G34410.1
Na CND 1 6.76 3979166±10kb
AT1G11750; AT1G11760; AT1G11765; AT1G11770; AT1G11780; AT1G11785; AT1G11790; AT1G11800; AT1G11810
8.11 4008593‐4041017
AT1G11880.1; AT1G11890.1; AT1G11900.1; AT1G11905.1; AT1G11910.1
2 6.88 16788878
AT2G40160; AT2G40170; AT2G40180; AT2G40190; AT2G40200; AT2G40205; AT2G40210; AT2G40220
3 8.65 10284807‐10311811
AT3G27750.1; AT3G27770.1; AT3G27785.1; AT3G27809.1; AT3G27810.1
6.51 1439513 No COD
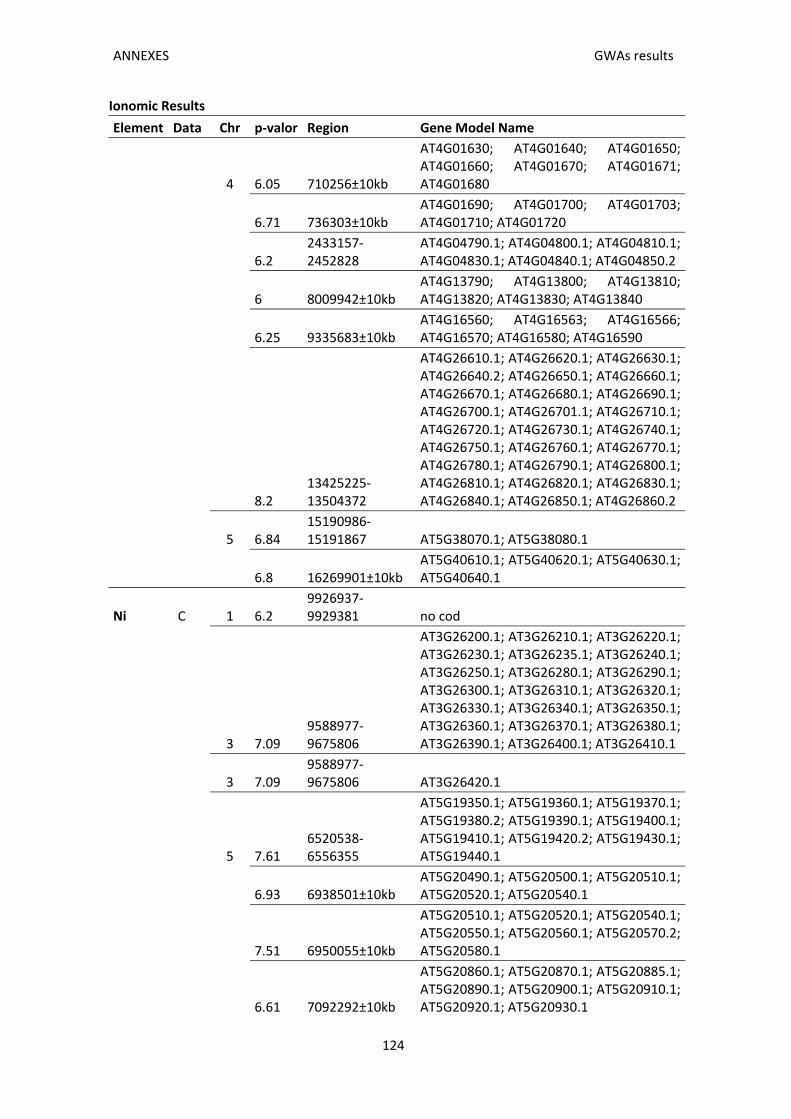
ANNEXES GWAs results
124
Ionomic Results
Element Data Chr p‐valor Region Gene Model Name
4 6.05 710256±10kb
AT4G01630; AT4G01640; AT4G01650; AT4G01660; AT4G01670; AT4G01671; AT4G01680
6.71 736303±10kb AT4G01690; AT4G01700; AT4G01703; AT4G01710; AT4G01720
6.2 2433157‐2452828
AT4G04790.1; AT4G04800.1; AT4G04810.1; AT4G04830.1; AT4G04840.1; AT4G04850.2
6 8009942±10kb AT4G13790; AT4G13800; AT4G13810; AT4G13820; AT4G13830; AT4G13840
6.25 9335683±10kb AT4G16560; AT4G16563; AT4G16566; AT4G16570; AT4G16580; AT4G16590
8.2 13425225‐13504372
AT4G26610.1; AT4G26620.1; AT4G26630.1; AT4G26640.2; AT4G26650.1; AT4G26660.1; AT4G26670.1; AT4G26680.1; AT4G26690.1; AT4G26700.1; AT4G26701.1; AT4G26710.1; AT4G26720.1; AT4G26730.1; AT4G26740.1; AT4G26750.1; AT4G26760.1; AT4G26770.1; AT4G26780.1; AT4G26790.1; AT4G26800.1; AT4G26810.1; AT4G26820.1; AT4G26830.1; AT4G26840.1; AT4G26850.1; AT4G26860.2
5 6.84 15190986‐15191867 AT5G38070.1; AT5G38080.1
6.8 16269901±10kb AT5G40610.1; AT5G40620.1; AT5G40630.1; AT5G40640.1
Ni C 1 6.2 9926937‐9929381 no cod
3 7.09 9588977‐9675806
AT3G26200.1; AT3G26210.1; AT3G26220.1; AT3G26230.1; AT3G26235.1; AT3G26240.1; AT3G26250.1; AT3G26280.1; AT3G26290.1; AT3G26300.1; AT3G26310.1; AT3G26320.1; AT3G26330.1; AT3G26340.1; AT3G26350.1; AT3G26360.1; AT3G26370.1; AT3G26380.1; AT3G26390.1; AT3G26400.1; AT3G26410.1
3 7.09 9588977‐9675806 AT3G26420.1
5 7.61 6520538‐6556355
AT5G19350.1; AT5G19360.1; AT5G19370.1; AT5G19380.2; AT5G19390.1; AT5G19400.1; AT5G19410.1; AT5G19420.2; AT5G19430.1; AT5G19440.1
6.93 6938501±10kb AT5G20490.1; AT5G20500.1; AT5G20510.1; AT5G20520.1; AT5G20540.1
7.51 6950055±10kb
AT5G20510.1; AT5G20520.1; AT5G20540.1; AT5G20550.1; AT5G20560.1; AT5G20570.2; AT5G20580.1
6.61 7092292±10kb
AT5G20860.1; AT5G20870.1; AT5G20885.1; AT5G20890.1; AT5G20900.1; AT5G20910.1; AT5G20920.1; AT5G20930.1
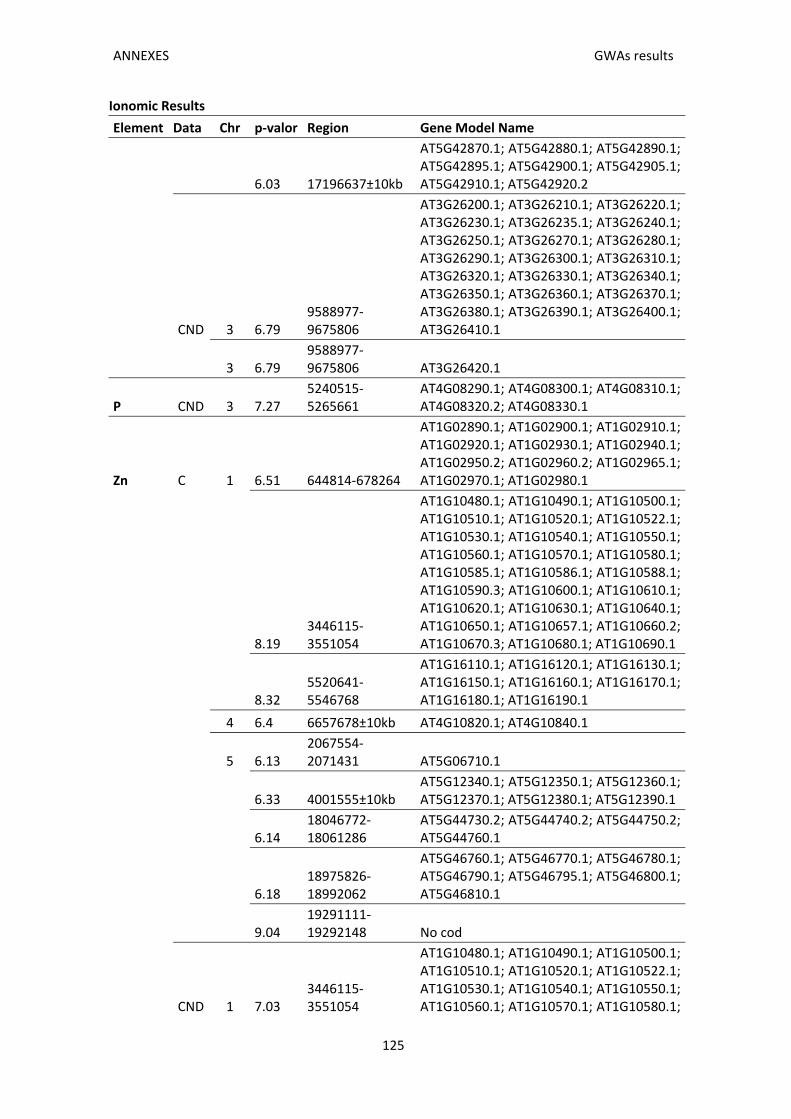
ANNEXES GWAs results
125
Ionomic Results
Element Data Chr p‐valor Region Gene Model Name
6.03 17196637±10kb
AT5G42870.1; AT5G42880.1; AT5G42890.1; AT5G42895.1; AT5G42900.1; AT5G42905.1; AT5G42910.1; AT5G42920.2
CND 3 6.79 9588977‐9675806
AT3G26200.1; AT3G26210.1; AT3G26220.1; AT3G26230.1; AT3G26235.1; AT3G26240.1; AT3G26250.1; AT3G26270.1; AT3G26280.1; AT3G26290.1; AT3G26300.1; AT3G26310.1; AT3G26320.1; AT3G26330.1; AT3G26340.1; AT3G26350.1; AT3G26360.1; AT3G26370.1; AT3G26380.1; AT3G26390.1; AT3G26400.1; AT3G26410.1
3 6.79 9588977‐9675806 AT3G26420.1
P CND 3 7.27 5240515‐5265661
AT4G08290.1; AT4G08300.1; AT4G08310.1; AT4G08320.2; AT4G08330.1
Zn C 1 6.51 644814‐678264
AT1G02890.1; AT1G02900.1; AT1G02910.1; AT1G02920.1; AT1G02930.1; AT1G02940.1; AT1G02950.2; AT1G02960.2; AT1G02965.1; AT1G02970.1; AT1G02980.1
8.19 3446115‐3551054
AT1G10480.1; AT1G10490.1; AT1G10500.1; AT1G10510.1; AT1G10520.1; AT1G10522.1; AT1G10530.1; AT1G10540.1; AT1G10550.1; AT1G10560.1; AT1G10570.1; AT1G10580.1; AT1G10585.1; AT1G10586.1; AT1G10588.1; AT1G10590.3; AT1G10600.1; AT1G10610.1; AT1G10620.1; AT1G10630.1; AT1G10640.1; AT1G10650.1; AT1G10657.1; AT1G10660.2; AT1G10670.3; AT1G10680.1; AT1G10690.1
8.32 5520641‐5546768
AT1G16110.1; AT1G16120.1; AT1G16130.1; AT1G16150.1; AT1G16160.1; AT1G16170.1; AT1G16180.1; AT1G16190.1
4 6.4 6657678±10kb AT4G10820.1; AT4G10840.1
5 6.13 2067554‐2071431 AT5G06710.1
6.33 4001555±10kb AT5G12340.1; AT5G12350.1; AT5G12360.1; AT5G12370.1; AT5G12380.1; AT5G12390.1
6.14 18046772‐18061286
AT5G44730.2; AT5G44740.2; AT5G44750.2; AT5G44760.1
6.18 18975826‐18992062
AT5G46760.1; AT5G46770.1; AT5G46780.1; AT5G46790.1; AT5G46795.1; AT5G46800.1; AT5G46810.1
9.04 19291111‐19292148 No cod
CND 1 7.03 3446115‐3551054
AT1G10480.1; AT1G10490.1; AT1G10500.1; AT1G10510.1; AT1G10520.1; AT1G10522.1; AT1G10530.1; AT1G10540.1; AT1G10550.1; AT1G10560.1; AT1G10570.1; AT1G10580.1;
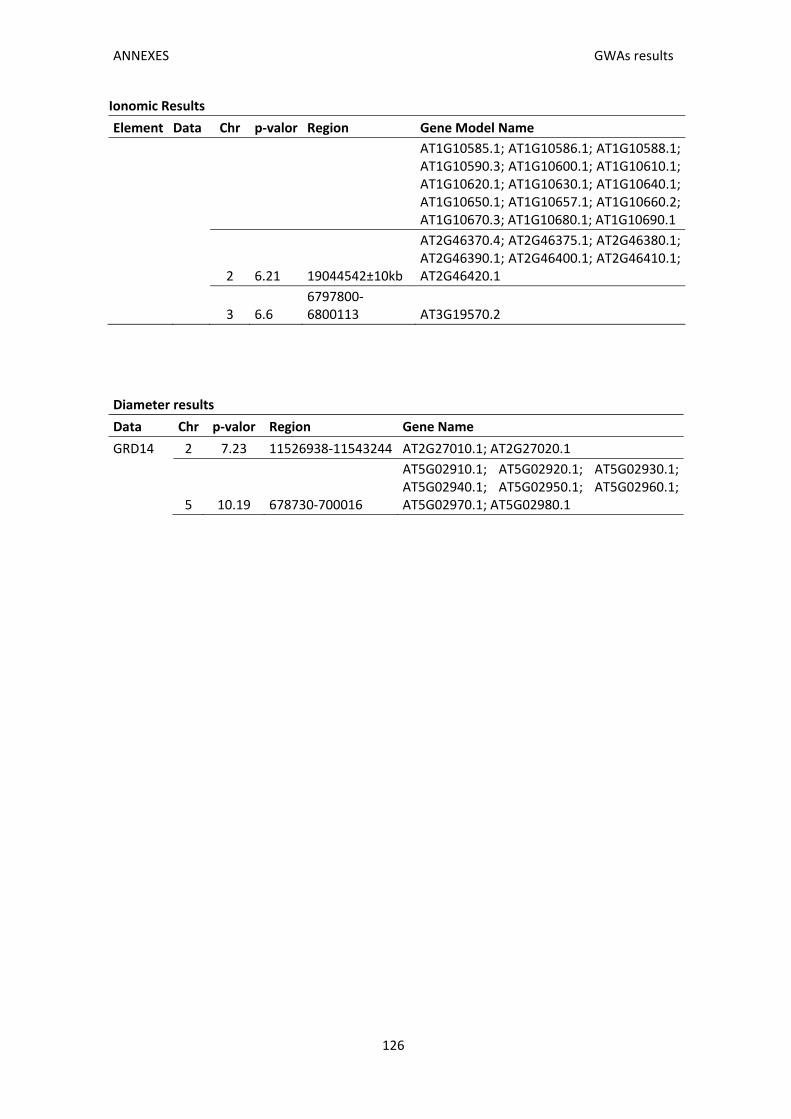
ANNEXES GWAs results
126
Ionomic Results
Element Data Chr p‐valor Region Gene Model Name
AT1G10585.1; AT1G10586.1; AT1G10588.1; AT1G10590.3; AT1G10600.1; AT1G10610.1; AT1G10620.1; AT1G10630.1; AT1G10640.1; AT1G10650.1; AT1G10657.1; AT1G10660.2; AT1G10670.3; AT1G10680.1; AT1G10690.1
2 6.21 19044542±10kb
AT2G46370.4; AT2G46375.1; AT2G46380.1; AT2G46390.1; AT2G46400.1; AT2G46410.1; AT2G46420.1
3 6.6 6797800‐6800113 AT3G19570.2
Diameter results
Data Chr p‐valor Region Gene Name
GRD14 2 7.23 11526938‐11543244 AT2G27010.1; AT2G27020.1
5 10.19 678730‐700016
AT5G02910.1; AT5G02920.1; AT5G02930.1; AT5G02940.1; AT5G02950.1; AT5G02960.1; AT5G02970.1; AT5G02980.1