vogt, nicholas - presentation
TRANSCRIPT
BEHAVIORAL
ANALYSIS OF ELITE
CFB RECRUITSNicholas Vogt

What’s Ahead
Descriptive Statistics
Data
Conditional Logit Model
Potentially unreasonable assumptions
Results
2

3
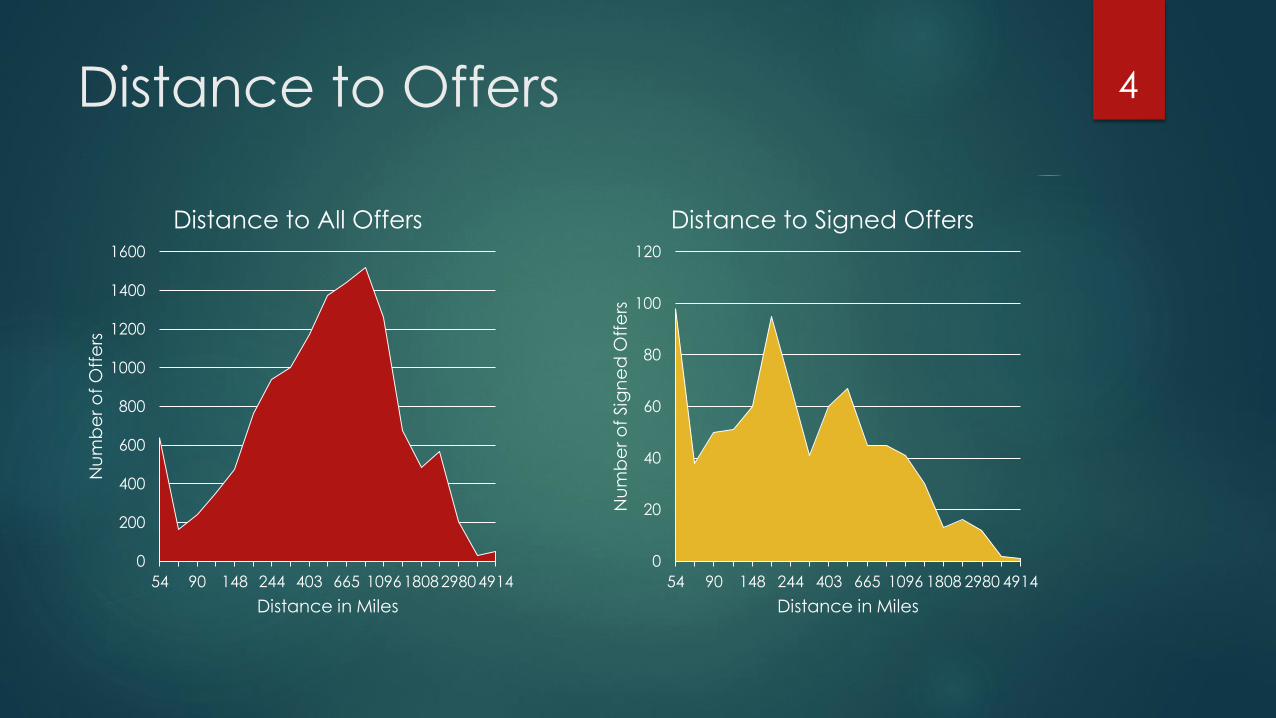
Distance to Offers
0
200
400
600
800
1000
1200
1400
1600
54 90 148 244 403 665 1096180829804914
Nu
mb
er
of
Off
ers
Distance in Miles
Distance to All Offers
0
20
40
60
80
100
120
54 90 148 244 403 665 1096 1808 2980 4914
Nu
mb
er
of
Sig
ne
d O
ffe
rsDistance in Miles
Distance to Signed Offers
4

Academic Rank & Graduation Rate 5
0
20
40
60
80
100
120
140
160
180
55 60 65 70 75 80 85 90 95 100
Ac
ad
em
ic R
an
k
6-Year Graduation Rate
Academic Rank and Graduation Rates
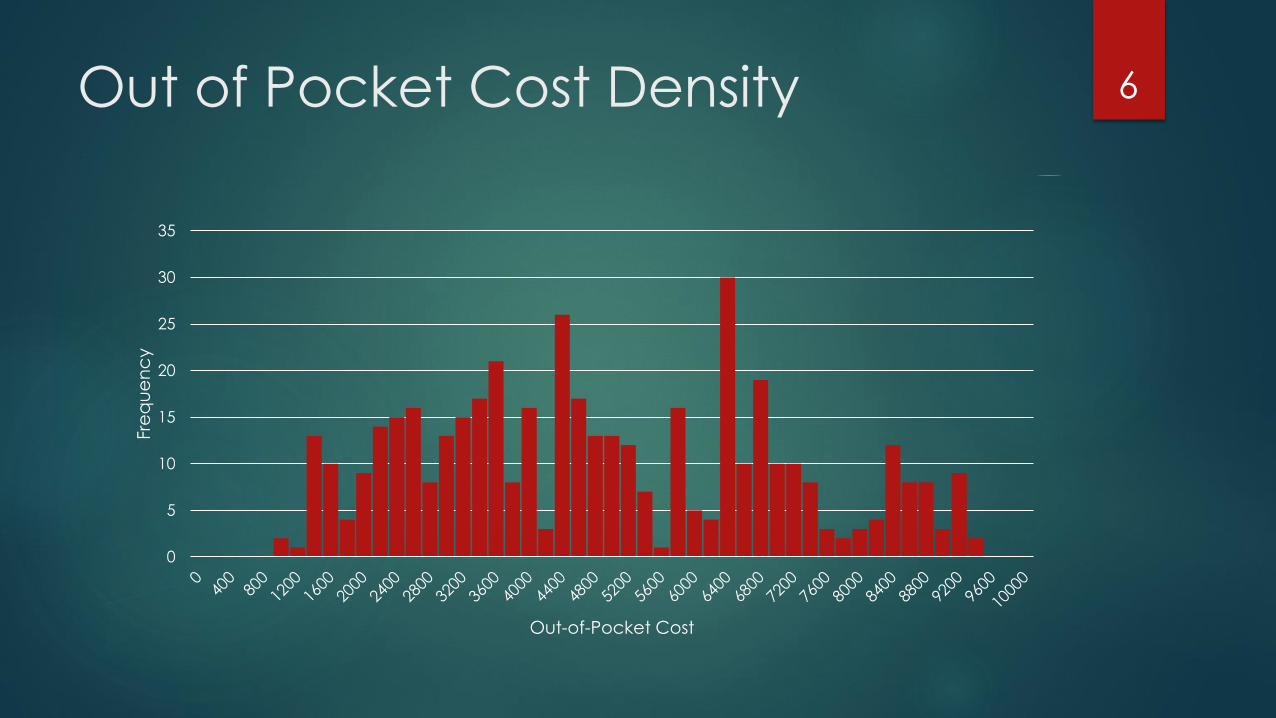
Out of Pocket Cost Density 6
0
5
10
15
20
25
30
35
Fre
qu
en
cy
Out-of-Pocket Cost
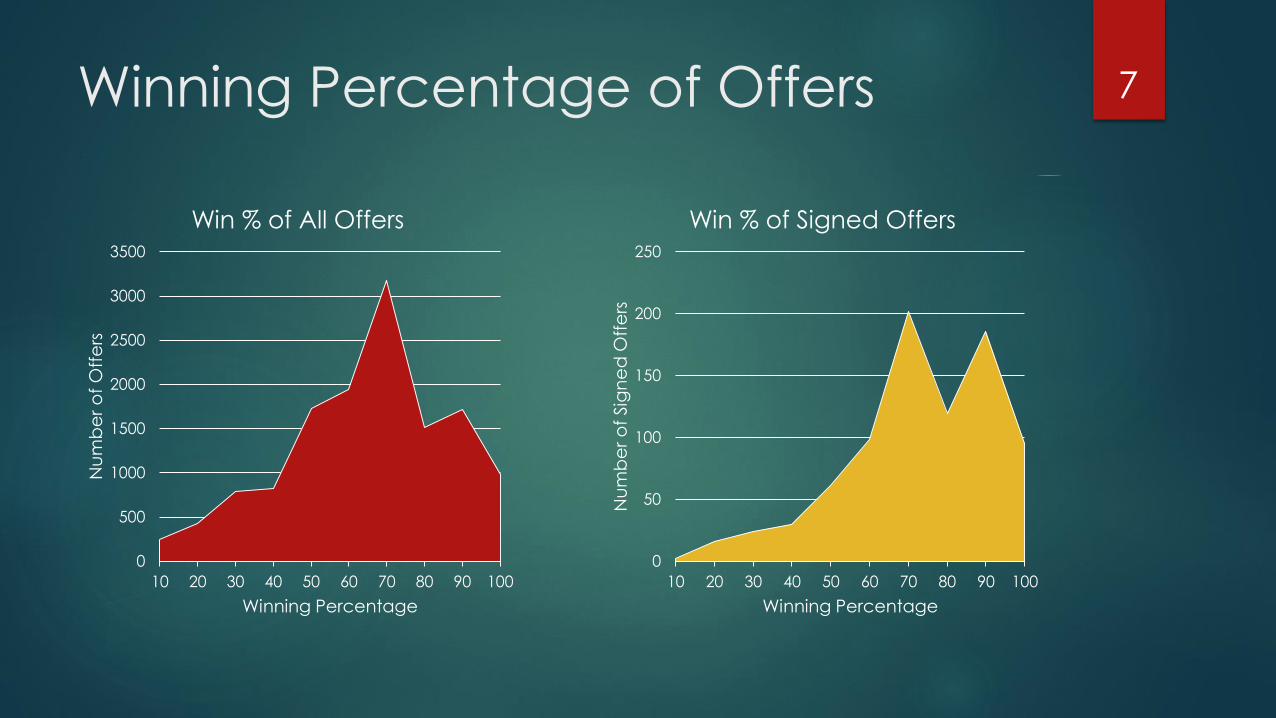
Winning Percentage of Offers
0
500
1000
1500
2000
2500
3000
3500
10 20 30 40 50 60 70 80 90 100
Nu
mb
er
of
Off
ers
Winning Percentage
Win % of All Offers
0
50
100
150
200
250
10 20 30 40 50 60 70 80 90 100
Nu
mb
er
of
Sig
ne
d O
ffe
rsWinning Percentage
Win % of Signed Offers
7
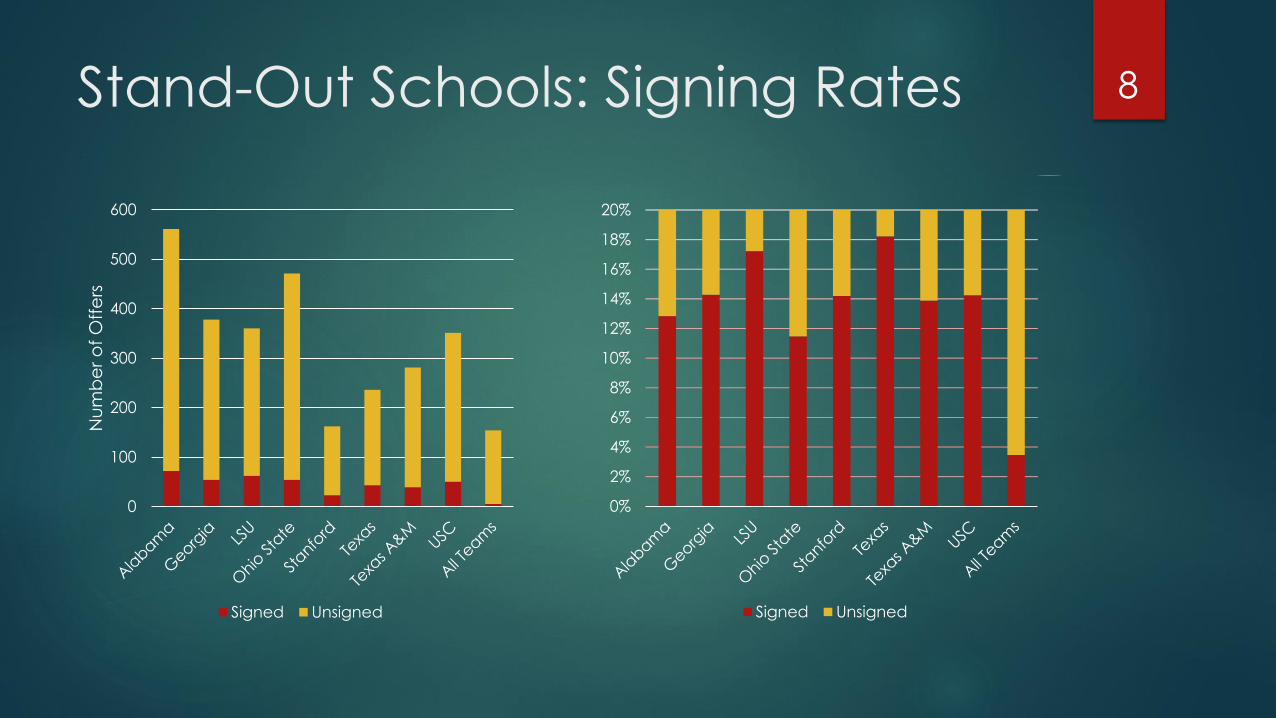
Stand-Out Schools: Signing Rates
0%
2%
4%
6%
8%
10%
12%
14%
16%
18%
20%
Signed Unsigned
0
100
200
300
400
500
600
Nu
mb
er
of
Off
ers
Signed Unsigned
8
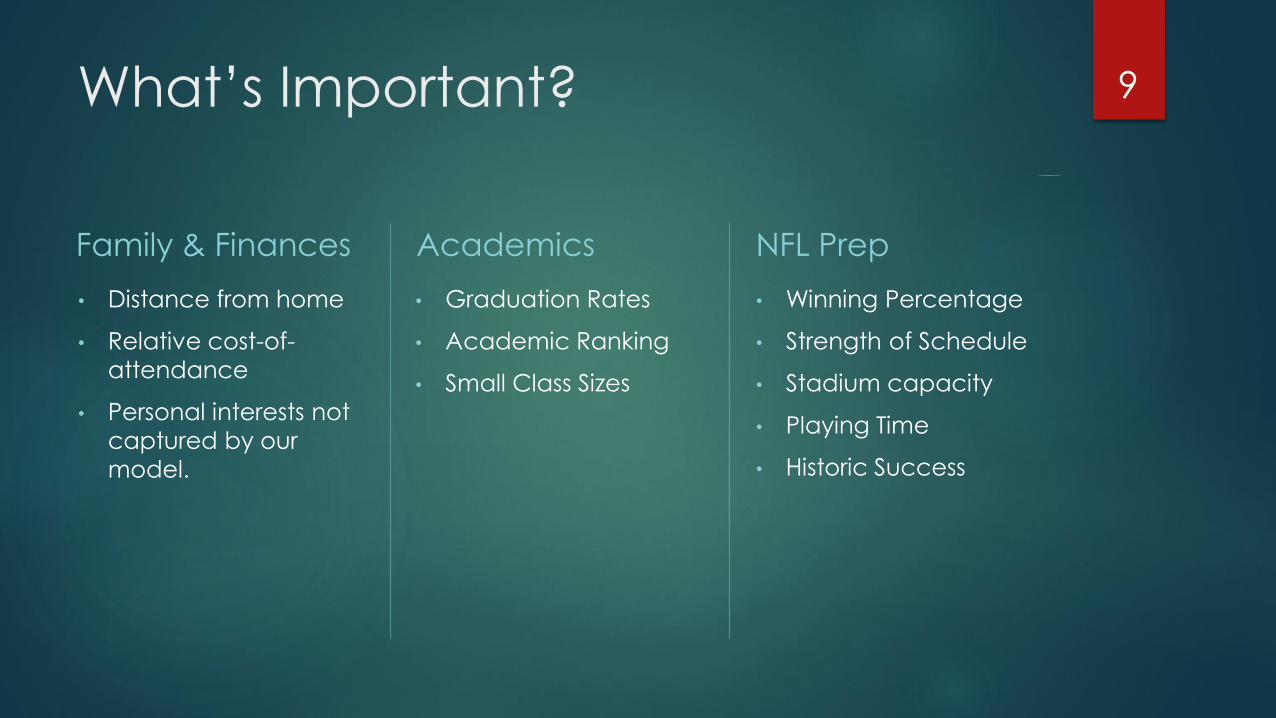
What’s Important?
Family & Finances
• Distance from home
• Relative cost-of-
attendance
• Personal interests not
captured by our
model.
Academics
• Graduation Rates
• Academic Ranking
• Small Class Sizes
NFL Prep
• Winning Percentage
• Strength of Schedule
• Stadium capacity
• Playing Time
• Historic Success
9
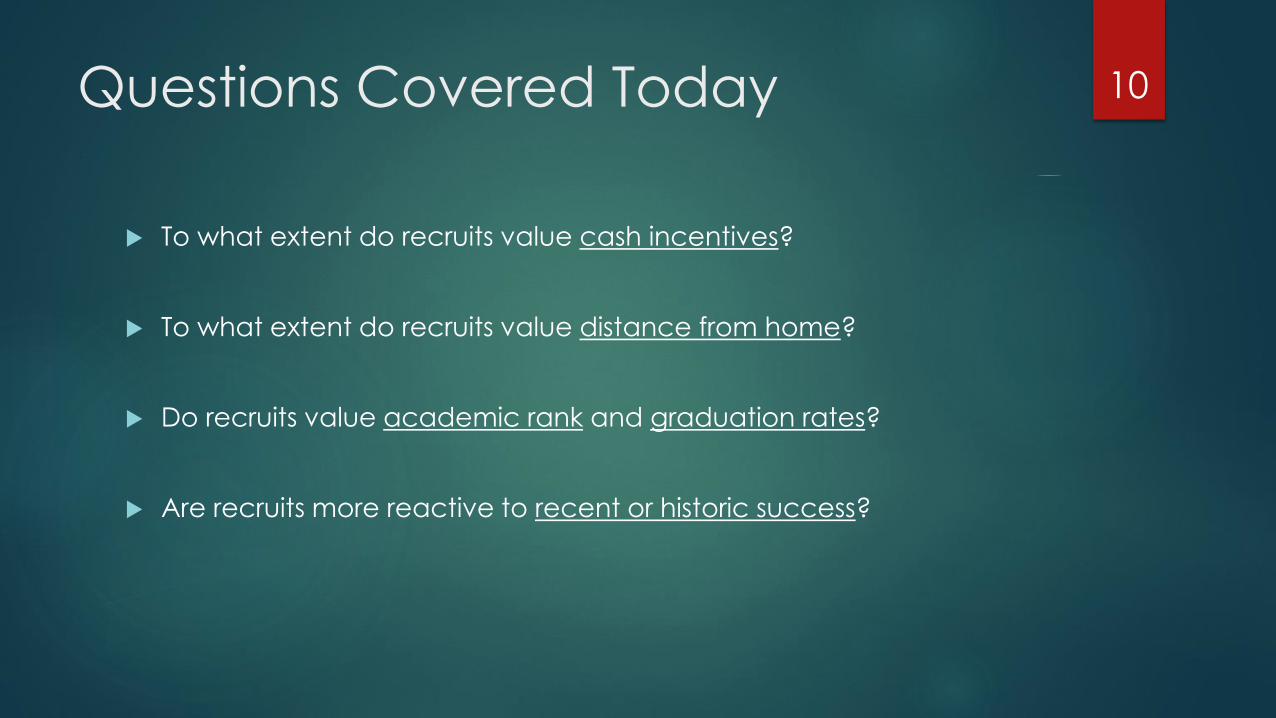
Questions Covered Today
To what extent do recruits value cash incentives?
To what extent do recruits value distance from home?
Do recruits value academic rank and graduation rates?
Are recruits more reactive to recent or historic success?
10

Where Does The Data Come From?
11
Where Do The Data Come From?
Prior literature uses proxies in place of complete data.
But how do we proxy complex interactions holistically? Often, we can’t.
Reliable information is out there; it’s just buried in beneath hundreds
of webpages.
Fortunately, there’s Python.
12

Where Do The Data Come From? 13
Web ScrapingData
Wrangling Analysis
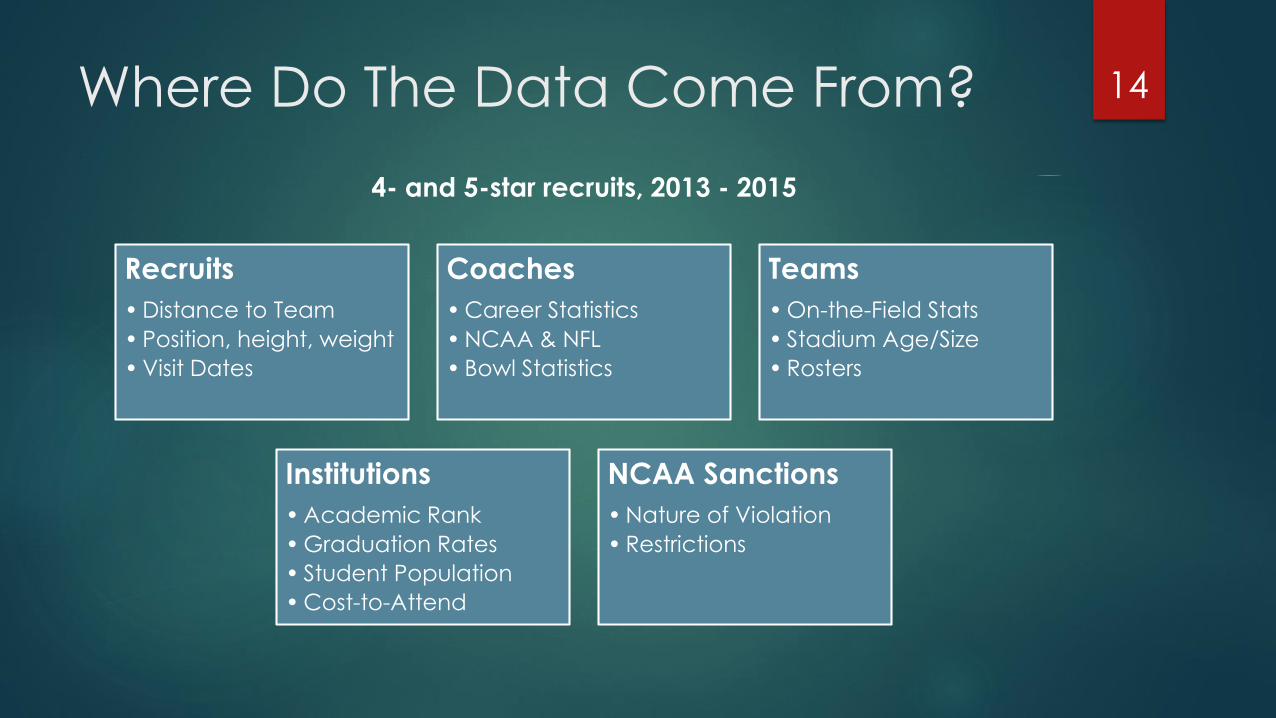
Where Do The Data Come From? 14
Recruits
• Distance to Team
• Position, height, weight
• Visit Dates
Coaches
• Career Statistics
• NCAA & NFL
• Bowl Statistics
Teams
• On-the-Field Stats
• Stadium Age/Size
• Rosters
Institutions
• Academic Rank
• Graduation Rates
• Student Population
• Cost-to-Attend
NCAA Sanctions
• Nature of Violation
• Restrictions
4- and 5-star recruits, 2013 - 2015

The Conditional Logit Model
15
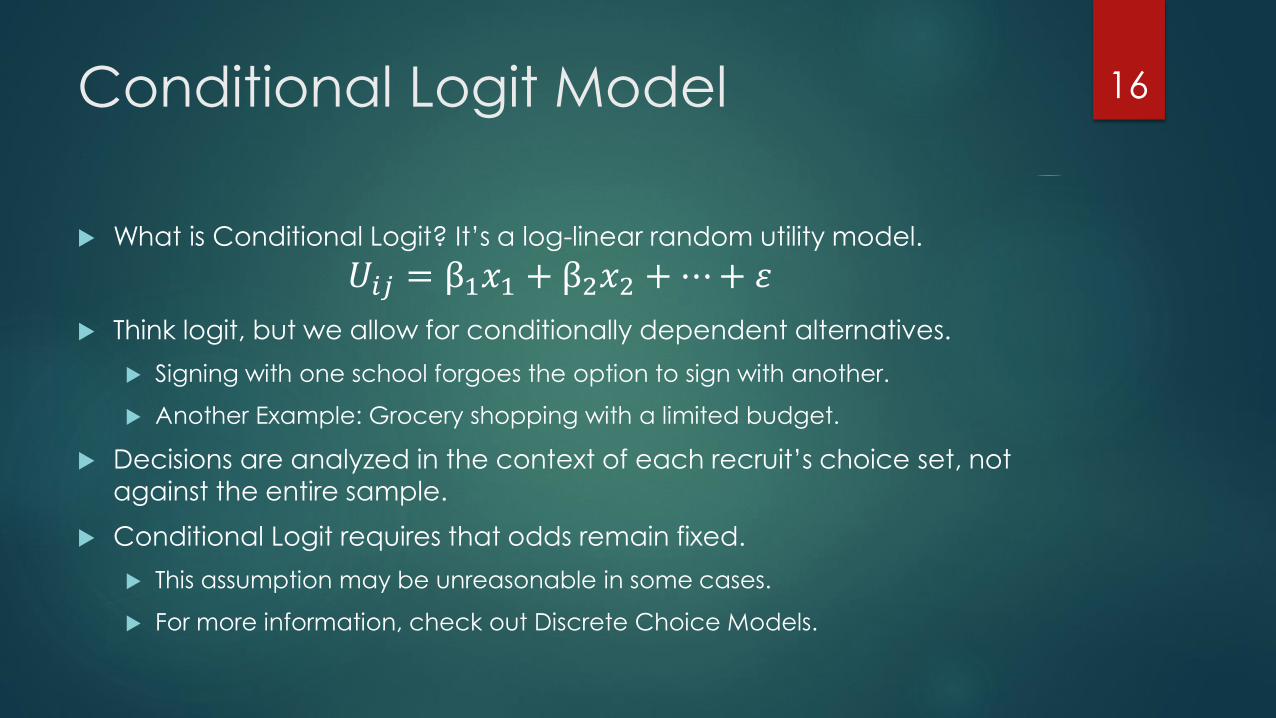
Conditional Logit Model
What is Conditional Logit? It’s a log-linear random utility model.
𝑈𝑖𝑗 = β1𝑥1 + β2𝑥2 +⋯+ 𝜀
Think logit, but we allow for conditionally dependent alternatives.
Signing with one school forgoes the option to sign with another.
Another Example: Grocery shopping with a limited budget.
Decisions are analyzed in the context of each recruit’s choice set, not
against the entire sample.
Conditional Logit requires that odds remain fixed.
This assumption may be unreasonable in some cases.
For more information, check out Discrete Choice Models.
16
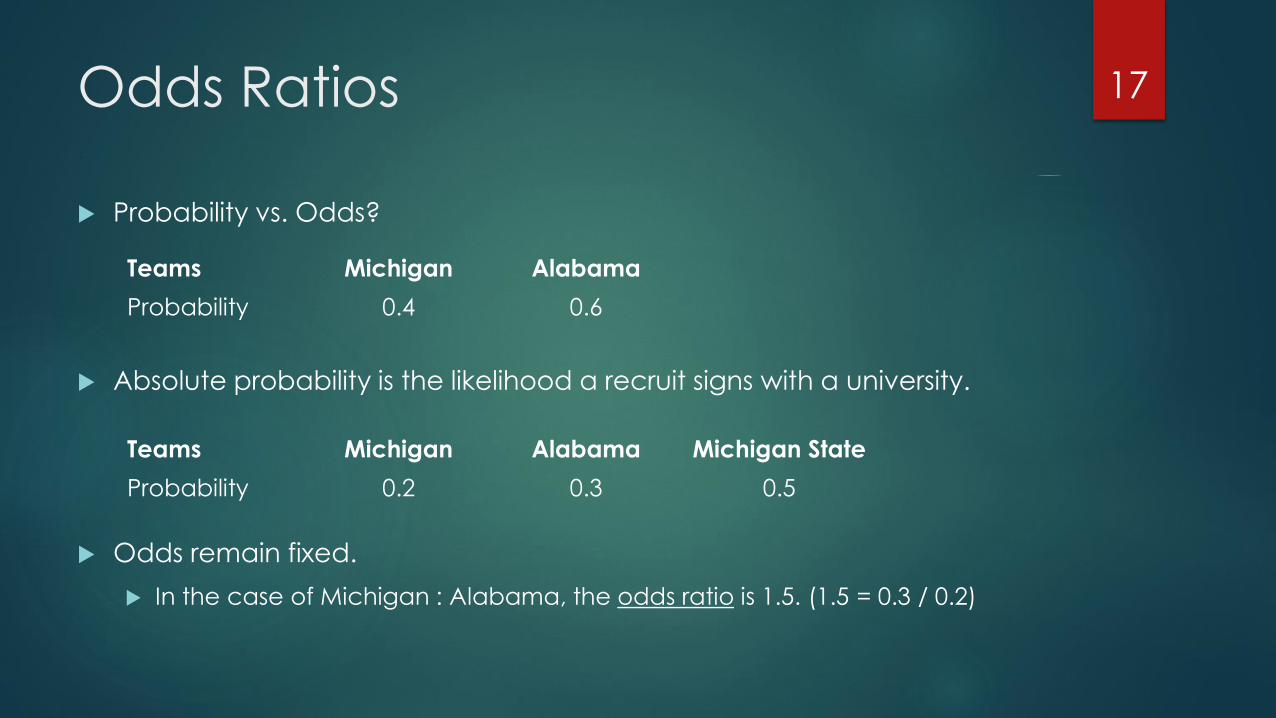
Odds Ratios
Teams Michigan Alabama
Probability 0.4 0.6
Odds remain fixed.
In the case of Michigan : Alabama, the odds ratio is 1.5. (1.5 = 0.3 / 0.2)
Teams Michigan Alabama Michigan State
Probability 0.2 0.3 0.5
Probability vs. Odds?
Absolute probability is the likelihood a recruit signs with a university.
17

Results
18
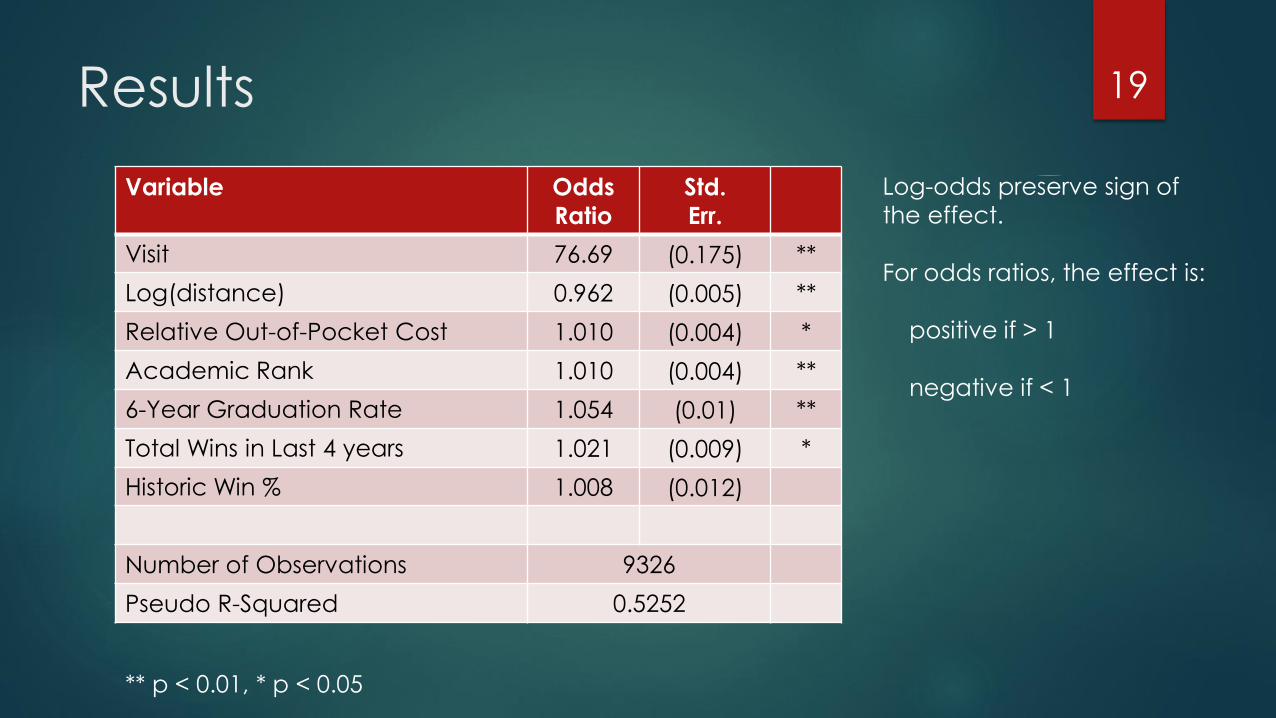
Results 19
Log-odds preserve sign of
the effect.
For odds ratios, the effect is:
positive if > 1
negative if < 1
** p < 0.01, * p < 0.05
Variable Odds
Ratio
Std.
Err.
Visit 76.69 (0.175) **
Log(distance) 0.962 (0.005) **
Relative Out-of-Pocket Cost 1.010 (0.004) *
Academic Rank 1.010 (0.004) **
6-Year Graduation Rate 1.054 (0.01) **
Total Wins in Last 4 years 1.021 (0.009) *
Historic Win % 1.008 (0.012)
Number of Observations 9326
Pseudo R-Squared 0.5252
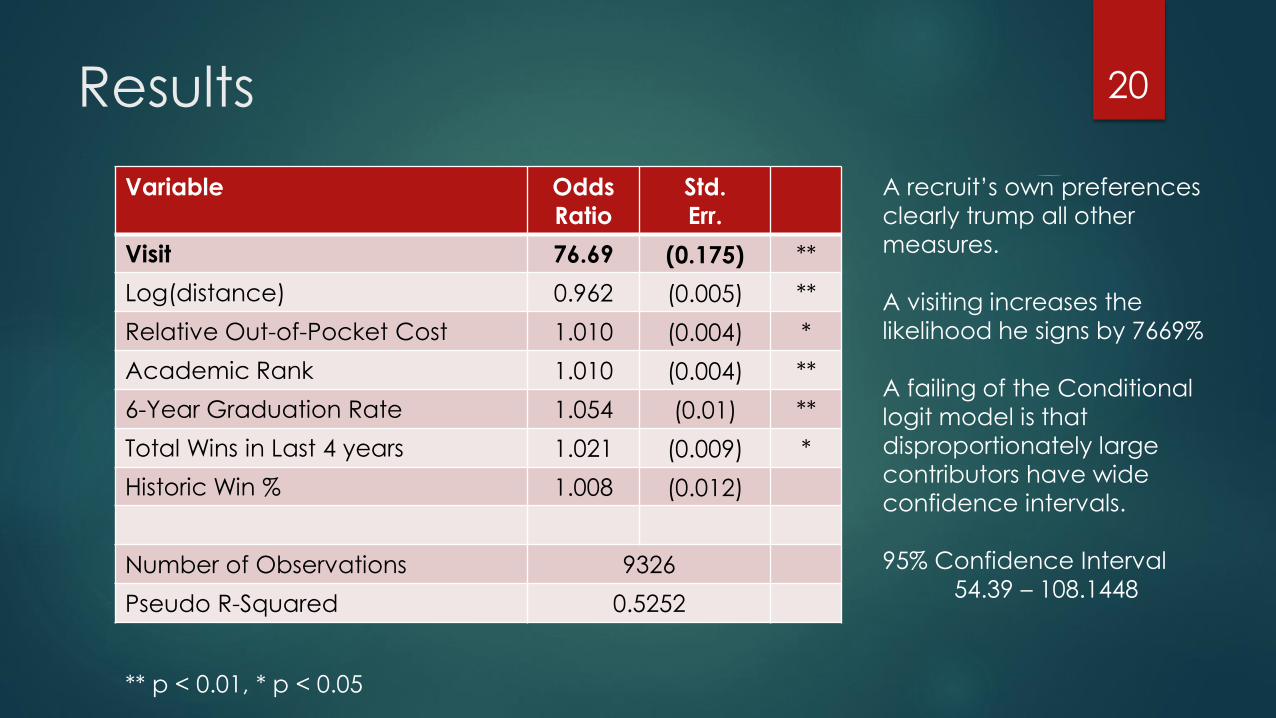
Results 20
A recruit’s own preferences
clearly trump all other
measures.
A visiting increases the
likelihood he signs by 7669%
A failing of the Conditional
logit model is that
disproportionately large
contributors have wide
confidence intervals.
95% Confidence Interval
54.39 – 108.1448
** p < 0.01, * p < 0.05
Variable Odds
Ratio
Std.
Err.
Visit 76.69 (0.175) **
Log(distance) 0.962 (0.005) **
Relative Out-of-Pocket Cost 1.010 (0.004) *
Academic Rank 1.010 (0.004) **
6-Year Graduation Rate 1.054 (0.01) **
Total Wins in Last 4 years 1.021 (0.009) *
Historic Win % 1.008 (0.012)
Number of Observations 9326
Pseudo R-Squared 0.5252
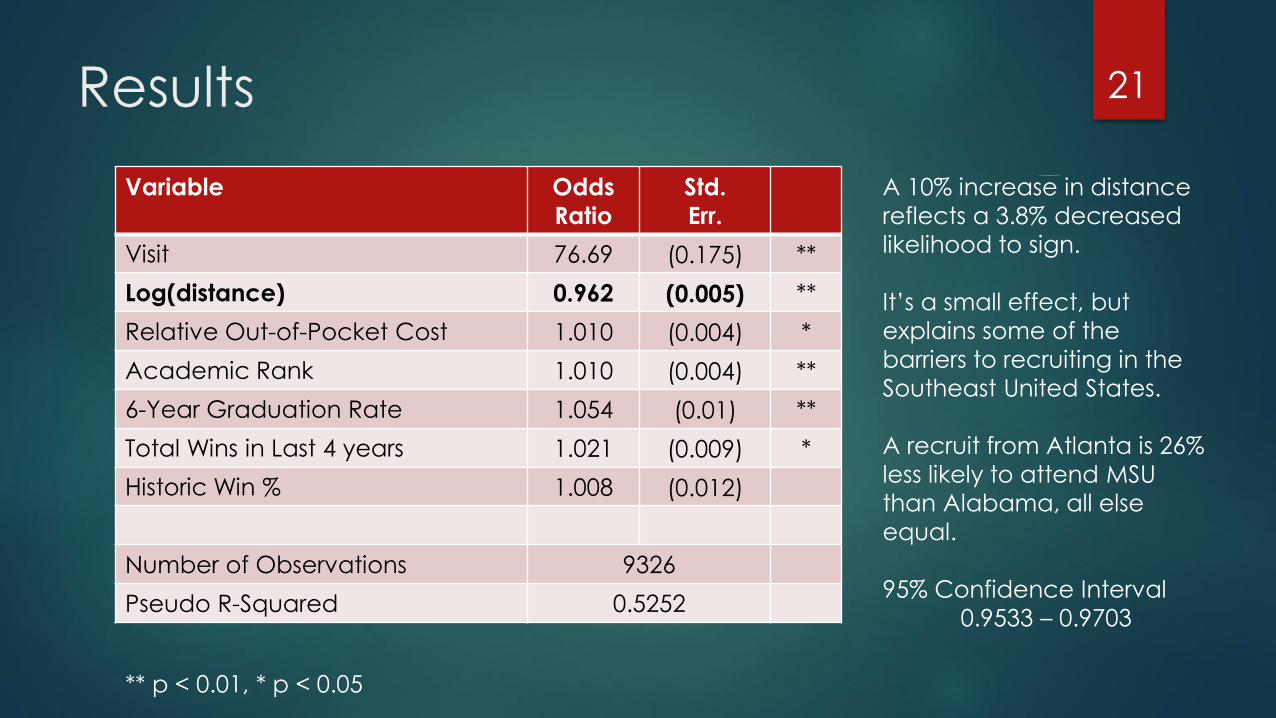
Results 21
A 10% increase in distance
reflects a 3.8% decreased
likelihood to sign.
It’s a small effect, but
explains some of the
barriers to recruiting in the
Southeast United States.
A recruit from Atlanta is 26%
less likely to attend MSU
than Alabama, all else
equal.
95% Confidence Interval
0.9533 – 0.9703
** p < 0.01, * p < 0.05
Variable Odds
Ratio
Std.
Err.
Visit 76.69 (0.175) **
Log(distance) 0.962 (0.005) **
Relative Out-of-Pocket Cost 1.010 (0.004) *
Academic Rank 1.010 (0.004) **
6-Year Graduation Rate 1.054 (0.01) **
Total Wins in Last 4 years 1.021 (0.009) *
Historic Win % 1.008 (0.012)
Number of Observations 9326
Pseudo R-Squared 0.5252
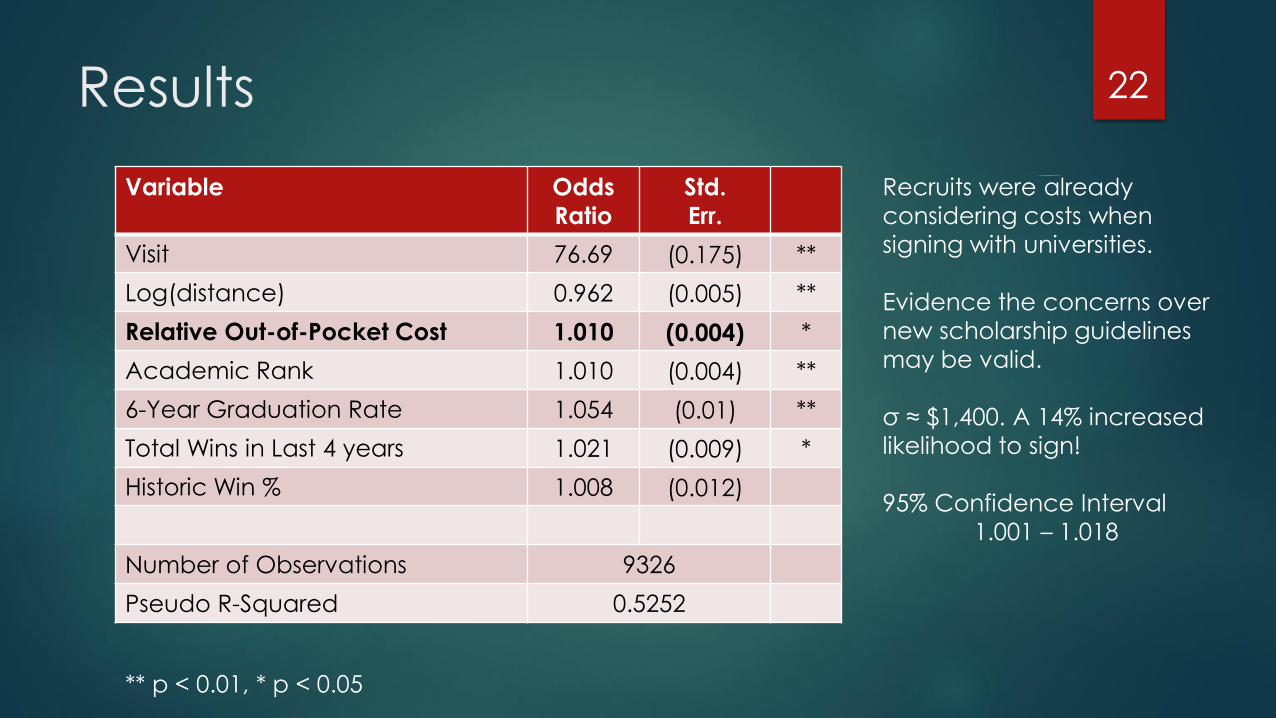
Results 22
Recruits were already
considering costs when
signing with universities.
Evidence the concerns over
new scholarship guidelines
may be valid.
σ ≈ $1,400. A 14% increased
likelihood to sign!
95% Confidence Interval
1.001 – 1.018
** p < 0.01, * p < 0.05
Variable Odds
Ratio
Std.
Err.
Visit 76.69 (0.175) **
Log(distance) 0.962 (0.005) **
Relative Out-of-Pocket Cost 1.010 (0.004) *
Academic Rank 1.010 (0.004) **
6-Year Graduation Rate 1.054 (0.01) **
Total Wins in Last 4 years 1.021 (0.009) *
Historic Win % 1.008 (0.012)
Number of Observations 9326
Pseudo R-Squared 0.5252
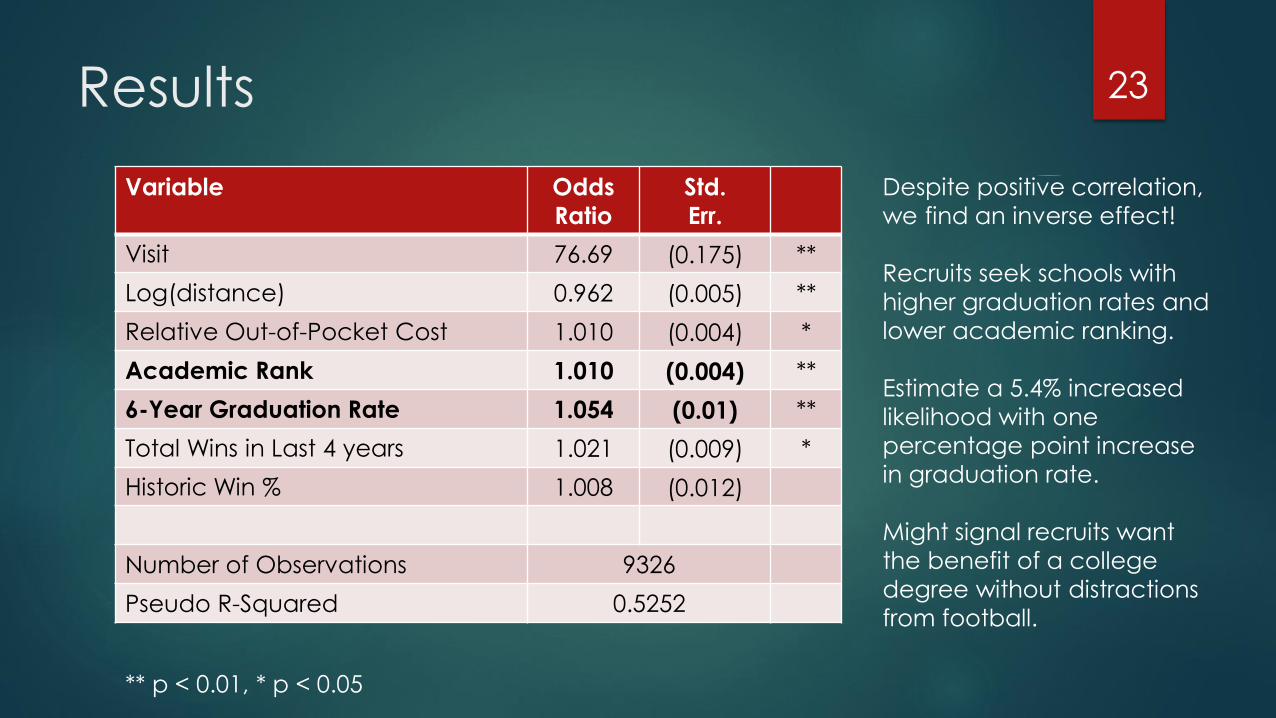
Results 23
Despite positive correlation,
we find an inverse effect!
Recruits seek schools with
higher graduation rates and
lower academic ranking.
Estimate a 5.4% increased
likelihood with one
percentage point increase
in graduation rate.
Might signal recruits want
the benefit of a college
degree without distractions
from football.
** p < 0.01, * p < 0.05
Variable Odds
Ratio
Std.
Err.
Visit 76.69 (0.175) **
Log(distance) 0.962 (0.005) **
Relative Out-of-Pocket Cost 1.010 (0.004) *
Academic Rank 1.010 (0.004) **
6-Year Graduation Rate 1.054 (0.01) **
Total Wins in Last 4 years 1.021 (0.009) *
Historic Win % 1.008 (0.012)
Number of Observations 9326
Pseudo R-Squared 0.5252
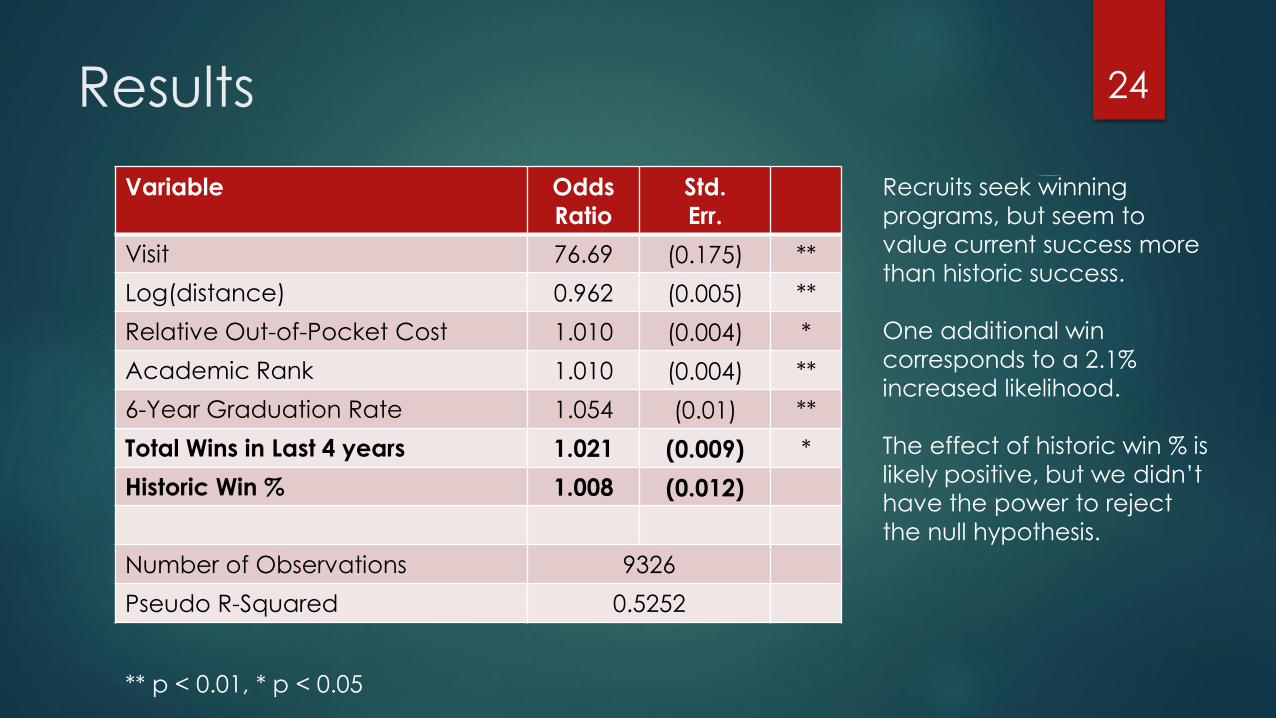
Results 24
Recruits seek winning
programs, but seem to
value current success more
than historic success.
One additional win
corresponds to a 2.1%
increased likelihood.
The effect of historic win % is
likely positive, but we didn’t
have the power to reject
the null hypothesis.
** p < 0.01, * p < 0.05
Variable Odds
Ratio
Std.
Err.
Visit 76.69 (0.175) **
Log(distance) 0.962 (0.005) **
Relative Out-of-Pocket Cost 1.010 (0.004) *
Academic Rank 1.010 (0.004) **
6-Year Graduation Rate 1.054 (0.01) **
Total Wins in Last 4 years 1.021 (0.009) *
Historic Win % 1.008 (0.012)
Number of Observations 9326
Pseudo R-Squared 0.5252
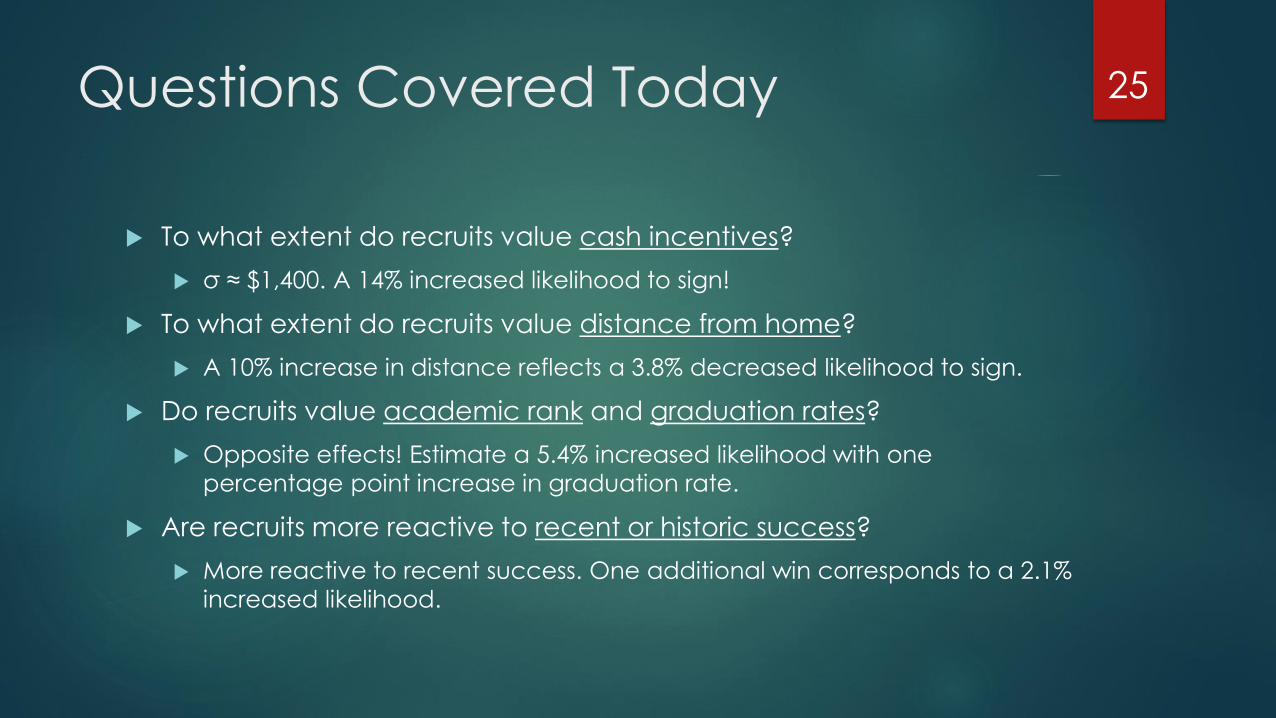
Questions Covered Today
To what extent do recruits value cash incentives?
σ ≈ $1,400. A 14% increased likelihood to sign!
To what extent do recruits value distance from home?
A 10% increase in distance reflects a 3.8% decreased likelihood to sign.
Do recruits value academic rank and graduation rates?
Opposite effects! Estimate a 5.4% increased likelihood with one
percentage point increase in graduation rate.
Are recruits more reactive to recent or historic success?
More reactive to recent success. One additional win corresponds to a 2.1%
increased likelihood.
25

Questions?
26