universidad complutense de madrid - …biblioteca.ucm.es/tesis/bio/ucm-t26005.pdf · contaminación...
TRANSCRIPT

UNIVERSIDAD COMPLUTENSE DE MADRID
FACULTAD DE CC. BIOLÓGICAS Departamento de Ecología
INCIDENCIA DE LOS CONTAMINATES AMBIENTALES GENOTÓXICOS EN CÉLULAS DE TRUCHA ARCOIRIS
(ONCORHYNCHUS MYKISS)
MEMORIA PRESENTADA PARA OPTAR AL GRADO DE DOCTOR POR Concepción Becerril Moral
Bajo la dirección de la Doctora: Argelia Castaño Calvo
Madrid, 2002
ISBN: 84-669-1679-2

UNIVERSIDAD COMPLUTENSE DE MADRID
FACULTAD DE CIENCIAS BIOLÓGICAS
IINNCCIIDDEENNCCIIAA DDEE LLOOSS CCOONNTTAAMMIINNAANNTTEESS
AAMMBBIIEENNTTAALLEESS GGEENNOOTTÓÓXXIICCOOSS EENN
CCÉÉLLUULLAASS DDEE TTRRUUCCHHAA AARRCCOOIIRRIISS
((OOnnccoorrhhyynncchhuuss mmyykkiissss))
Concepción Becerril Moral.
Marzo, 2002

Este trabajo ha sido realizado en
el Servicio de Toxicología del
Centro Nacional de Alimentación
perteneciente al Instituto de
Salud Carlos III y financiado
CYCIT (proyectos AMB1994-0655-
CO2 y AMB1997-0431-CO2).
Vº Bº Fdo.: Argelia Castaño Calvo
Tesis dirigida por la Dra. Argelia
Castaño Calvo y presentada por
Concepción Becerril Moral para optar
al grado de Doctor en Ciencias
Biológicas por la Universidad
Complutense de Madrid.
Fdo.: Concepción Becerril Moral

A mis padres
A Antonio, Elena y Miguel

AGRADECIMIENTOS
Quisiera expresar mi mas sincero agradecimiento a todas aquellas
personas que de una manera u otra me ayudaron en la realización de este
trabajo:
• En primer lugar y de forma muy especial a mi directora de tesis Dra.
Argelia Castaño por darme su amistad a lo largo de tantos años. Su
constante animo, ayuda y dedicación ha hecho posible lo que en
muchos momentos considere imposible: la finalización de esta tesis.
• Al Dr. Félix Sanz, Jefe de Servicio de Toxicología Alimentaría por las
facilidades que me ha concedido a lo largo de estos años y que han
permitido la realización de este trabajo.
• Al Dr. Francisco Díaz Pineda por su confianza al aceptar la ponencia
de esta tesis.
• A Mar Ferrero que en todo momento ha estado a mi lado
ofreciéndome su desinteresada ayuda y colaboración. Esta también es
su tesis.
• A Helda Acevedo que en este tiempo ha conseguido contagiarme de
su constancia y sentido practico. Además, su colaboración ha
permitido la finalización de esta tesis, de la que nunca dudó.

• A mis compañeras, Irene, Mercedes, Ángela, Thea, y Olga que gracias
a los buenos ratos compartidos han hecho que todo me pareciese más
sencillo.
• A Mª Luz por el cariño e interés que mostró en la traducción de
algunos de estos trabajos.
• A Angelita del Pino por sus frases y refranes tan oportunos y por su
buen hacer en las tareas administrativas del servicio.
• A Vicente Calderón y Henny Hooghuis que siempre han estado
dispuestos a ayudarme desinteresadamente cuando por una causa u
otra les he necesitado.
• A Maria Bravo que siempre con palabras amables a mostrado su
interés y buena disposición a colaborar.
• A Carmen Rodríguez por su buen hacer en el mantenimiento de las
células y todos mis compañeros del Servicio porque de una forma u
otra han colaborado.
• Por último quiero agradecer a mi madre, a Antonio, Elena y Miguel por
haber estado siempre a mi lado mostrándome su constante
colaboración, cariño y apoyo.

Índice i
INDICE
I. MEMORIA
1. INTRODUCCIÓN 1
1.1. Conceptos generales de la valoración del riesgo
medioambiental 2
1.2. Medio Acuático: valoración de efectos en poblaciones 10
1.3. Antecedentes metodológicos de la técnica de RAPD 23
2. JUSTIFICACIÓN Y OBJETIVOS 30
3. PLANTEAMIENTO Y RESULTADOS 33
3.1. Optimización de la Técnica 33
3.1.1. Integridad del ADN 34
3.1.2. Ajuste de los parámetros de la reacción 36
3.2. Capacidad para la Detección de Daño al ADN 38
3.2.1. Patrón de bandas específico y reproducible 38
3.2.2. Condiciones óptimas de detección de daño al ADN 39
3.2.3. Sistema de análisis para la detección de
alteraciones en el patrón de bandas 42
3.3. Capacidad de Predecir el Daño “in vivo” 44
3.3.1. Similitud genética entre los sistemas “in vivo” e “in
vitro” 45
3.3.2. Similitud de los efectos “in vivo” e “in vitro” 46

Índice ii
4. DISCUSIÓN 48
5. CONCLUSIONES 62
6. BIBLIOGRAFÍA 67
II. ANEXOS.
ANEXO 1. PROTOCOLO DEL ENSAYO 89
ANEXO 2. PUBLICACIONES
ANEXO 2.1. Characterization of RTG-2 Fish Cell
Line by Random Amplified Polymorphic DNA. (1998)
Ecotoxicology and Environmental Safety Vol. 40, pp
56-64
108
ANEXO 2.2. Detection of Mitomycin C-Induced
Genetic Damage in Fish Cells by use of RAPD. (1999).
Mutagenesis Vol. 14, nº 5 pp. 449-456
120
ANEXO 2.3. DNA Fingerprint Comparison of Rainbow
Trout and RTG-2 cell line using Random Amplified
Polymorphic DNA. (2001). Ecotoxicology, Vol. 10 nº 2
pp. 115-125
131
ANEXO 2.4. Detection by RAPD of Genetic
Alterations in vitro Amplification and conservation
conditions of DNA Extract. (2002) Toxicology Methods.

Índice iii
Vol. 12, nº 1 (en prensa)
144
ANEXO 3. PUBLICACIONES (en proceso de aceptación)
ANEXO 3.1. In Vitro Assessment of DNA Damage
after Chronic Exposure to B(a)P using RAPD and
RTG-2 Fish Cell Line. ATLA.
169
ANEXO 3.2. In vitro Detection of Alterations in the
DNA after Acute Exposure to B(a)P Using the RAPD
Technique. Chemosphere.
198
ANEXO 4. PUBLICACIONES (en preparación)
ANEXO 4.1. Detección de Alteraciones Genéticas
en Truchas Arcoiris Expuestas a Benzo(a)Pireno.
230

I. MEMORIA

Introducción 1 1. INTRODUCCIÓN
El desarrollo económico producido en el ultimo siglo ha estado
íntimamente ligado a la utilización de una gran cantidad de productos químicos
en todos los campos de la actividad humana. La liberación continuada de los
mismos, o sus derivados, al ambiente ha generado problemas de
contaminación a escala mundial que afectan tanto a la salud humana como al
mantenimiento de los ecosistemas.
El alcance global del deterioro ambiental fue puesto en evidencia ya en
los años sesenta. Poco a poco se fue tomando conciencia de que los recursos
del planeta son limitados, y que era necesario controlar la actividad industrial
mundial y aunar esfuerzos para minimizar los efectos adversos de la
contaminación. Estos dos objetivos se plantearon como retos sin precedentes
asumiendo que en cualquier actividad humana no existe el riesgo cero.
Consecuencia de ello fue la creación de una estrategia mundial para la
conservación de la naturaleza como pieza clave en la consecución de un
desarrollo sostenible estableciéndose de forma explicita, por primera vez, la
existencia de una interrelación dinámica entre economía y medioambiente.

Introducción 2
La respuesta institucional a esta nueva concepción se recogió en el
Convenio sobre la Diversidad Biológica firmado en la Conferencia de las
Naciones Unidas de Medio Ambiente y Desarrollo, celebrada en Río de Janeiro
en 1992. Después de la cumbre de Río quedaron establecidos los principios
que deben regir las actuaciones medioambientales en materia de
contaminación, y que pueden resumirse en: el Principio de precaución, el
Principio de quien contamina paga, y el compromiso de todos los Estados de
aplicar las mejores técnicas disponibles y las mejores prácticas
medioambientales, tomando las medidas necesarias para conseguir un
ambiente saludable en el marco de un desarrollo sostenible.
La gestión y conservación de los sistemas naturales se ha incorporado a
las políticas de los diferentes países de la OCDE (Organización para la
Cooperación y Desarrollo Económico), estableciéndose el desarrollo conjunto
de programas de investigación y la elaboración de normativas de gestión
medioambiental.
1.1 CONCEPTOS GENERALES DE LA VALORACIÓN DE RIESGO
MEDIOAMBIENTAL.
El concepto de riesgo medioambiental se puede definir como la
probabilidad de que el uso de una sustancia química o actividad humana pueda
producir efectos adversos sobre la estructura y función de los ecosistemas,
entendiendo éstos como unidades discretas formadas por un conjunto de
factores abióticos y bióticos que interactúan para formar un sistema estable.
Introducción 3 (Smrchek and Zimamm 1998).
Los procedimientos de valoración de riesgo se realizan mediante la
identificación y cuantificación de estos efectos adversos, y constituyen una
poderosa herramienta para la toma de decisiones en el proceso de gestión
medioambiental. Dichos procedimientos se encuentran en evolución constante,
incorporando herramientas o metodologías cada vez mas precisas.
Básicamente se realizan siguiendo las siguientes fases:
Evaluación de la exposición,
Identificación del peligro,
Caracterización del riesgo,
Gestión del riesgo.
Las tres primeras están basadas en la aplicación de herramientas
científico-técnicas, mientras que la última, la gestión del riesgo, implica una
toma de decisiones considerando factores socio-económicos. En este contexto,
la ecotoxicología, - rama de la toxicología que trata de entender los efectos
tóxicos que los agentes físicos y químicos ejercen sobre el medio -, se ha
convertido en una herramienta muy valiosa en el binomio desarrollo económico
/ medioambiente
La evaluación de la exposición consiste en determinar la
concentración que previsiblemente puede alcanzar un xenobiótico en un
determinado medio receptor.

Introducción 4
Cuando un xenobiótico llega a un compartimento medioambiental, en
función de sus características y de las del medio receptor, puede ser
incorporado o absorbido por los organismos, puede formar complejos con la
materia orgánica o inorgánica del medio, o puede movilizarse rápidamente a
otros compartimentos (suelo - agua subterránea, etc.) Todo ello determina la
concentración final que alcanzará dicho contaminante y por tanto, la magnitud
de la exposición.
La evaluación de la exposición, se calcula con modelos matemáticos
mas o menos complejos, considerando las características fisicoquímicas del
compuesto -punto de fusión, solubilidad en agua, productos de degradación,
persistencia, bioacumulación etc-, su uso -frecuencia y duración de la
exposición, vías de exposición, compartimentos afectados, etc- y las
características del medio receptor – dureza, temperatura, pH, etc-.
El resultado se conoce como Concentración Medioambiental Prevista
(PEC - Predicted Environmental Concentration) y es un valor numérico que
representa los niveles de exposición a los que están sometidos los organismos
que viven en el compartimento estudiado.
La identificación del peligro se realiza mediante estudios de
ecotoxicidad, encaminados a identificar la naturaleza de los efectos producidos
por el contaminante y a establecer la relación dosis (concentración) - respuesta
(efecto).

Introducción 5
El objetivo de esta fase es estimar la concentración por debajo de la
cual una sustancia no es capaz de producir efectos adversos. Para ello se
determinan los efectos del contaminante sobre las especies representativas del
compartimento estudiado, a través de todas las posibles rutas de acceso,
mediante estudios de ecotoxicidad. El resultado se expresa mediante un valor
numérico llamado Concentración que Previsiblemente No producirá Efectos
(PNEC - Predicted No Effect Concentration)
Los ensayos de toxicidad que se requieren para la identificación del
peligro con fines de clasificación en la Unión Europea o en la OCDE, son
siempre métodos estandarizados por organismos de normalización nacionales
o internacionales. Metodológicamente, los procedimientos básicos utilizados en
la evaluación de la toxicidad para sustancias industriales, existentes y de nueva
síntesis, biocidas etc., están recogidos en el anexo V de la directiva
67/548/EEC de clasificación, embalado y etiquetado y sus posteriores
adaptaciones al progreso técnico.
En la fase de identificación del peligro, cuando se trata de muestras
complejas, como vertidos o mezclas de contaminantes, o cuando se realiza una
valoración de riesgo de un proceso industrial o cualquier otro procedimiento no
enmarcado en la normativa anteriormente citada, la gama de herramientas para
la valoración de efectos ecotoxicológicos se amplía considerablemente,
utilizando bioensayos o “test” de ecotoxicidad mucho más versátiles y
sensibles.

Introducción 6
Un ensayo o “test” de toxicidad, en definitiva, no es mas que un
procedimiento que utiliza un sistema vivo (uno o varios organismos o células)
en presencia de la sustancia, compuesto o mezcla a estudiar y sobre el que se
valora el efecto que produce en unas condiciones previamente fijadas. Estos
resultados obtenidos en el laboratorio, deben ser capaces de predecir los
efectos de la sustancia estudiada en situaciones reales. La valoración de
efectos se realiza mediante un sistema escalonado. En las primeras etapas se
utilizan modelos sencillos, como parámetros agudos de mortalidad (CL50) o de
efecto (CE50). Posteriormente, y en función de estos resultados iniciales, se
valoran efectos fisiológicos crónicos o más específicos (alteraciones en la
reproducción, teratogénesis, carcinógenesis etc).
Los ensayos de ecotoxicidad pueden realizarse a cualquier nivel de
organización biológica, desde moléculas hasta ecosistemas completos. No
obstante, y en mayor medida que en la toxicología humana, los ensayos de
laboratorio en ecotoxicología conllevan un alto grado de incertidumbre, debido
a las complejas relaciones entre materia y seres vivos que existen en un
ecosistema.
La elección del organismo biológico de ensayo determinará,
obviamente, el valor predictivo del mismo. De esta forma, y teniendo en cuenta
que existe una relación directa entre el grado de representatividad y la
complejidad del sistema elegido, los estudios de campo serían los sistemas de
valoración que más se asemejan a la realidad, y por tanto, con mayor valor
predictivo. Sin embargo, su coste y la gran cantidad de variables a considerar,

Introducción 7 los convierten en inapropiados, sobre todo en las primeras fases de
identificación del peligro. Por esta razón solo se utilizan en ensayos
confirmatorios, en casos de diagnóstico, o en aquellos casos donde el
resultado de la valoración de riesgo necesite una confirmación “in situ”,
considerando factores climáticos y especies autóctonas, como es el caso de
algunos productos fitosanitarios.
En la práctica, el procedimiento que más se utiliza en ecotoxicología,
consiste en la aplicación de una batería de ensayos agudos o subagudos
utilizando especies representativas de distintos niveles tróficos para un mismo
compartimento; normalmente, productores primarios, consumidores primarios y
secundarios y descomponedores.
Los ensayos con especies de pequeño tamaño, (bacterias, algas o
microcrustáceos) son relativamente baratos y no requieren grandes
instalaciones de laboratorio. Por el contrario, la aplicación de ensayos sobre
vertebrados, como los bioensayos de peces, incluso en sus estadíos más
tempranos requiere de instalaciones y personal cualificado en el mantenimiento
de las especies, además de un gran volumen de muestra y del sacrificio de un
alto número de animales, lo que plantea problemas éticos.
Los ensayos “in vitro” que utilizan órganos aislados, cultivos primarios
de tejidos o células derivadas de vertebrados, permiten obtener información
acerca de la toxicidad de un compuesto químico o de cualquier tipo de muestra
ambiental, evitando el sacrificio masivo de animales y reduciendo los

Introducción 8 problemas técnicos y económicos. Es más, desde un punto vista mecanicista,
los ensayos “in vitro” resultan idóneos, pues permiten abarcar un amplio
numero de respuestas (mortalidad, efectos sobre el sistema inmune,
teratogénicidad, mutagenicidad etc) eliminando las interferencias debidas a los
efectos sistémicos.
No obstante, la aplicación de sistemas “in vitro” requiere un importante
esfuerzo en el desarrollo del ensayo para conseguir que sus resultados
adquieran precisión, sensibilidad, y lo que es más importante, que demuestren
una buena correlación con el ensayo “in vivo” que pretenden sustituir. Todo ello
es determinante para que el grado de predicción sea aceptable desde un punto
de vista científico.
La caracterización del riesgo se lleva a cabo mediante la relación de
los parámetros mencionados anteriormente, es decir, el nivel de exposición de
un tóxico, y el efecto que produce sobre las especies seleccionadas como
representativas.
La caracterización del riesgo es el resultado, por tanto, de la relación
entre la PEC y la PNEC para la especie que resulte más sensible en cada
compartimento ambiental estudiado.
Si el cociente PEC/PNEC es menor o igual que la unidad, se considerará
que el riesgo es bajo y, por tanto, que no se requiere una mayor información
toxicológica, es decir, más ensayos. Si el cociente es mayor que uno, la
probabilidad de que se produzca un daño sobre el compartimiento considerado

Introducción 9 será grande, y, por tanto, se asumirá que el compuesto tiene un alto riesgo
ambiental. En ese caso se decidirá si son necesarios más ensayos, y de que
tipo, o si se ha de reducir el riesgo adoptando medidas de mitigación.
La caracterización del riesgo no es una tarea fácil, ya que la
vulnerabilidad de los sistemas biológicos frente a la polución por sustancias
químicas depende de múltiples y complejos factores. La cuantificación de los
parámetros analizados mediante ensayos ecotoxicológicos adecuados, es la
única manera de realizar de forma objetiva la caracterización del riesgo. Por
todo ello, es necesario incorporar metodologías cada vez más específicas y
sensibles, que permitan reducir los niveles de incertidumbre que toda
estimación de riesgo lleva asociada.
Por último, la gestión del riesgo implica una toma de decisiones tras
realizar un balance coste / beneficio, considerando factores tales como la
posibilidad real de control, la preocupación pública, razones políticas, éticas,
intereses de los sectores de producción, mantenimiento o mejora de la calidad
de vida, etc. De esta forma, la gestión del riesgo adquiere una gran importancia
y sus repercusiones afectan al conjunto de la sociedad.
Un eficaz sistema de gestión medioambiental debe disponer de los
conocimientos científico-técnicos necesarios para predecir el riesgo que implica
la liberación de contaminantes físicos y químicos, y su valoración última debe
realizarse considerando el medio ambiente como un todo.
En la actualidad, este concepto globalizador ya ha sido recogido en

Introducción 10 algunas normativas. Así la Directiva Europea del Control y Prevención
Integrado de la Contaminación (96/61/CE) (IPPC- Integrated Prevention and
Control), que acaba de entrar en vigor en nuestro país, exige a los organismos
responsables de la gestión medioambiental una valoración integrada de los
riesgos inherentes a una determinada actividad industrial, y aunque por motivos
metodológicos los análisis de riesgo se aborden por compartimentos (acuático,
aéreo y terrestre), la valoración final siempre debe ser realizada conjuntamente.
1.2 MEDIO ACUÁTICO: VALORACIÓN DE EFECTOS EN POBLACIONES
Actualmente la contaminación se extiende a una buena parte de las redes
hidrográficas, lagos y costas. Las causas de ello se deben en gran medida al
incremento del número de industrias que vierten sus residuos, en muchas
ocasiones sin depurar, al medio acuático, bien sean ríos o zonas costeras.
Aunque tradicionalmente se ha tenido la tendencia a considerar que el medio
acuático, por un principio de simple dilución y autodepuración, era capaz de
asimilar cantidades ilimitadas de residuos; la detección de concentraciones
crecientes de diferentes contaminantes químicos, metales pesados,
organoclorados etc., en organismos acuáticos, ha puesto de manifiesto la poca
protección que supone el principio basado en la dilución.
El compartimento acuático es sin duda el más estudiado, tanto en lo que
se refiere al destino y comportamiento de los contaminantes, como en el
desarrollo de metodologías para la valoración de los efectos en poblaciones
acuáticas. Todo ello facilita los procedimientos de valoración de riesgo, que en
éste compartimento ambiental están muy bien definidos. De hecho, el interés

Introducción 11 científico en la actualidad se ha desplazado desde la valoración de los efectos
agudos, a considerar los efectos transgeneracionales que ejercen ciertos
compuestos químicos sobre las poblaciones naturales. (Colborn et al., 1996;
Anderson et al., 1994).
Estos efectos pueden manifestarse de forma indirecta dando lugar a un
decrecimiento de la supervivencia, de la tasa de reproducción, edad de
maduración etc., de los individuos pertenecientes a las poblaciones afectadas. De
esta manera se provoca un proceso de selección o cuello de botella dirigido por la
acción del tóxico (Theodorakis et al., 2001) En consecuencia, la diversidad
genética puede verse disminuida, e incidir negativamente sobre la capacidad de
adaptación, viabilidad y persistencia de la población expuesta. (Bickham and
Smolen, 1994; Bickham et al., 2000) (Figura 1)
También los efectos transgeneracionales pueden manifestarse de manera
directa por la acción de los denominados agentes genotóxicos, contaminantes
capaces de interaccionar y modificar la molécula de ADN. La alteración del ADN
de las células somáticas incrementa la incidencia de determinados tipos de
tumores, mientras que la alteración del ADN de las células germinales de los
individuos expuestos se transmite a la descendencia. De esta forma, las
alteraciones a escala celular pueden modificar, finalmente, y tras periodos más o
menos largos de tiempo, la estructura genética de estas poblaciones (Bickham et
al., 2000) (Figura 2)

Introducción 12
Las especies piscícolas están directamente afectadas por ambos
procesos, pero los estudios a escala poblacional plantean graves problemas
prácticos, como disponer de poblaciones control, e incluso de metodologías
sensibles y específicas que permitan predecir de manera inequívoca, si un
contaminante es capaz de producir alteraciones en la dotación genética en una
población. Sin embargo son numerosos los trabajos que asocian la presencia de
neoplasias en una gran variedad de especies piscícolas, con la presencia en el
agua de xenobióticos. (Harshbarger and Clark, 1990; Leblanc and Bain., 1997;
Malins et al., 1996; Dawe, 1969; Al-Sabti and Metcalfe, 1995) Por tanto, y
aunque en ecotoxicología el centro de interés se establece a escala poblacional
mas que individual, la posibilidad de detectar “a priori” alteraciones genéticas en
células somáticas adquiere una gran importancia, permitiendo identificar
compuestos de relevancia ambiental (Shugart, 2000; Weinstein, 1988).
Tiempo
Div
ersi
dad
Gen
étic
a Tamaño de la Población
Tam
año
de la
Pob
laci
ón
Diversidad Genética
Figura 1. Relación entre diversidad genética y tamaño de la población. ( Bickham et al., 2000)

Introducción 13
Mutágenos Ambientales
Mutaciones en Línea Germinal Mutaciones Somáticas
Sustancias Toxicas Medioambientales no mutagénicos
Daño en Células Somáticas y Tejidos
Alteraciones en el Desarrollo
Disminución de la Diversidad Genética de la Población
Alteración de la Viabilidad o Salud de los Individuos
Alteración de los Procesos Reproductivos de los Individuos
Selección de Loci críticos para la Supervivencia en
un Medio Específicamente Contaminado Reducc
Ext
Figura 2. Relación entre los distintos efectos caus
ambiental (compuestos mutagénicos o no mutagénicos
biológica. (Bickham et al., 2000)
Efectos Demográficos:Declive de la Población,
Cuellos de botella
ión de la media de los parámetros de adaptab
Adaptación a un Medio Ambiente Contaminado: Perdida del Potencial de Adaptación, Frecuencia alelica alterada .
inción o Extirpación de poblaciones
ados por la contaminación
) y la pérdida de diversidad

Introducción 14
En este sentido, y al igual que en los estudios de genotoxicidad en
mamíferos, resultan de gran utilidad los ensayos “in vitro”. La utilización de
líneas celulares derivadas de especies piscícolas representativas constituye
una alternativa real a los bioensayos de peces, y presenta grandes ventajas
técnicas como, por ejemplo, la capacidad de abordar un gran numero de
muestras con instalaciones de laboratorio poco sofisticadas, lo que se traduce
en una reducción de los costes. En el ámbito metodológico, la homogeneidad
genética de las células y su ciclo celular, permite simular estudios
transgeneracionales en periodos relativamente cortos de tiempo y con
volúmenes de muestra reducidos (Tabla I) (Rachlin and Perlmuter 1968, Babich
and Borenfreund 1991; Castaño et al., 1994; 1996; 2000; Segner, 1998, Fent
2001).
Concretamente, la línea celular RTG-2 derivada de tejido gonadal de
trucha arcoiris (Oncorhynchus mykiss), es una de las mejor caracterizadas
(Figura 3) Se estableció a principios de los años sesenta por Wolf y Kimby y
está incluida en la colección de cultivos celulares americana (ATCC) y europea
(ETCC). Es una línea de morfología fibroblástica, con una dotación
cromosómica de 2n = 60, que retiene capacidad para metabolizar xenobióticos
(Clark, and Diamond, 1970; Thornton, et al., 1982) y que es viable en un
amplio rango de temperaturas (4 a 23º C), lo que permite investigar múltiples
variables cinéticas, y además resulta extremadamente útil en la práctica diaria
de laboratorio.

Introducción 15
A
U
Tabla 1: Estudios de genotoxicidad in vitro con células de peces. BB: Tejido de tronco posterior de Brown Bullhead (Ameiurus nebulosus); BF-2: tronco caudal de Bluegill fry (Lepomis macrochirus); EPC: Epitelio de Carpa común (Cyprinus carpio); R1: Hígado de trucha arco iris; RTG-2: Tejido gonadal de trucha arco iris (Oncorhynchus mykiss); RTL-W1: Hígado de trucha arco iris; Ul-h: Corazón de Umbra limi;; ULF-23HU: Aleta de Umbra limi. AA: Aminoacridina; BA: 1,2-benzoantraceno; B(a)P: Benzo(a)pireno; BP: 3,4-Benzopireno; BS: 1,4-butanosultona; DBA: 1,2,5,6- dibenzoantraceno; DMBA: Dimetilbenzo(a)ntraceno; DP: dicromato potásico; EMS: etilmetilsulfonato; 3-MC: 3-metilcolantreno; MNNG: N-metil-N-nitro-N-nitrosoguanidiana; MMC: Mitomicina-C; MMS: metilmetanosulfonato; MND: menadodiona; 4NQO: 1-oxido- 4-nitroquinolina; PQ: 9,10- fenantrenoquinona; PY: pireno; VS: sulfato de vincristina.
ENSAYO COMPUESTO LÍNEA ESTABLECIDA CULTIVO PRIMARIO BIBLIOGRAFÍA
B(a)P, DMBA BF-2, RTG-2, BB Smolarek et al, 1987, 1988
Aflatoxina B1 Hepatocitos de trucha arcoiris
Bailey et al, 1982 ductos de ADN
B(a)P Hepatocitos de trucha arcoiris
Masfaraud et al, 1992
Alkaline nwinding Assay
MND, PQ BB Hasspieler et al, 1996
MNNG, H2O2 R1, RTG-2 Braunbeck and Neumüller, 1996
Extractos orgánicos de sedimentos marinos
EPC Kamman et al, 2000; 2001
Cadmio Hepatocitos de trucha Risso-de Faverney et al, 2001
B(a)P, 4NQO RTG-2, RTL-W1 Nehls and Segner, 1998
Muestras ambientales RTG-2, RTL-W1 Nehls and Segner, 2001
Muestras de agua Hepatocitos de pez cebra Schnurstein and Braunbeck, 2001
Muestras de agua Pez cebra células branquiales
Schnurstein and Braunbeck, 2001
H2O2, B(a)P Hepatocitos de trucha arcoiris
Devaux et al, 1997
H2O2, furanona, B(a)P, 1-nitropireno
Hepatocitos/sangre trucha Mitchelmore et al, 1998
H2O2 Células rojas Pleuronectes Nacci et al, 1996
Metil mercurio Linfocitos de T. Truncatus Betti et al, 1996
Ensayo Cometa
Ciclofosfamida Eritrocitos carpa Pandrangi et al, 1995

Introducción 16
ENSAYO
COMPUESTO LÍNEA ESTABLECIDA CULTIVO PRIMARIO BIBLIOGRAFÍA
Kocan et al, 1982, 1985 B(a)P, MNNG, MMC, AA, 3-MC RTG-2
Kocan and Powell, 1985 Kocan et al, 1985 Landolt and Kocan, 1984 Sedimentos marinos RTG-2 Ahne and Schweitzer, 1993
Atrazina, meturxoron,4-ClA, HCH, PCP,alacloro,carbofurano R1 Ahne and Schweitzer, 1993
N-nitroso-N-methylurea ULF-23 Park et al, 1989
Aberraciones Cromosómicas
(AC)
3,4-BP, 1,2,5,6-DBA, 1,2-BA, pyrene (PY).
Ul-h Walton et al, 1988
MMC, MNNG, MMS Línea celular A. splendens Barker and Rackham, 1979
MNNG ULF-23 Suyamah and Etoh, 1988
N-nitroso-N-methylurea ULF-23 Park et al, 1989
Leucocitos en cultivo Ellingham et al, 1986
Leucocitos en cultivo Zakour et al, 1984
Intercambio de Cromatidas Hermanas
(SCE
EMS, MMS Leucocitos Maddock and Kelly, 1980
Fenil-, etil-, metil- organomercuriados BG/F
Babich et al, 1990 MNNG, 4NQO Ul-h Walton et al, 1984 B(a)P, DP, EMS RTG-2 Kolpoth et al, 1999 MMC, B(a)P, VS RTG-2 Sanchez et al, 2000
Inducción de Micronúcleos
Mezclas complejas RTG-2 Castaño et al, 2000 MNNG, 4NQO, aflatoxin B1 RTG-2 Walton et al, 1983
MNNG, 4NQO Ul-h Walton et al, 1984
B(a)P, Aflatoxina B1 RTG-2 + S9 Walton et al, 1987
Sedimentos BB Ali et al, 1993
Hepatocitos de peces Klaunig, 1984
Hepatocitos de peces Kelly and Maddock, 1985
Hepatocitos de peces Miller et al, 1989
Irradiación UV CAF-MM1 Mano et al, 1980
Mitani et al, 1982
Síntesis no programada
de ADN (UDS)
Irradiación Gamma CAF-MM1
Mitani and Egami, 1982

Introducción 17
Esta línea celular se ha utilizado para la valoración de la toxicidad aguda
de compuestos representativos de casi la totalidad de los grupos de
contaminantes ambientales, mostrando una muy buena correlación con los
resultados obtenidos “in vivo” (Babich and Borenfreund, 1991; Segner 1998;
Castaño et al., 1996; 2000), en estudios citogenéticos (Kohlpott, et al., 1997;
Sánchez et al., 2000) así como, más recientemente, para la detección de
compuestos que modifican el comportamiento hormonal o disruptores
endocrinos (Fent, 2001)
Figura 3. Línea celular RTG-2 derivada de tejido gonadal de trucha arcoiris
(Oncorhynchus mykiss),
En los estudios de genotoxicidad, los sistemas “in vitro” constituyen el
primer paso para la identificación de efectos. Una vez que el mutágeno
interacciona con la molécula de ADN, se producen en ella, tras cortos periodos

Introducción 18 de tiempo (minutos e incluso segundos), daños estructurales cuya naturaleza
está en función de las características físico-químicas del compuesto (Tabla II)
Existe un importante grupo de sustancias con capacidad genotóxica
(algunas de ellas tras ser metabolizadas), que forman enlaces covalentes con
la molécula de ADN, dando lugar a los llamados aductos (Figura 4). En los
últimos años se han desarrollado diferentes metodologías capaces de
cuantificarlos, aplicando técnicas inmunológicas con anticuerpos específicos
(Poirier, 1984; Santella, 1988), HPLC combinado con espectroscopia
fluorescente (Dunn, 1991; Krahn et al., 1993), cromatografía de gases acoplada
a espectrometría de masas (Krahn et al., 1993) o marcaje con 32P también
llamado “32P-postlabeling”.
PAH-N7 aducto
Lugar abasico
Síntesis de ADN
Figura 4. Formación de mutaciohidrocarburo policíclico aromático
Síntesis de ADN
Mutante
nes a partir del aducto formado entre un (PAH) y el N - 7 de la adenina.

Introducción 19
Esta última, es quizás la más utilizada debido a su gran especificidad y
sensibilidad ya que es capaz de detectar un aducto entre 1010 nucleótidos
normales. (Gupta et al., 1982; 1985; 1988; Liu et al., 1988; Halbrook et al.,
1992; Lloyd-Jones, 1995; Jones and Parry, 1992; Pfau 1997; Qu et al., 1997)
La formación de aductos, está considerada como un elemento clave en
la iniciación de procesos carcinogénicos, ya que pueden desestabilizar las
uniones glucosídicas y dar lugar a lugares apurínicos con posterior rotura de la
cadena de ADN, o pueden dar lugar a la inserción de bases incorrectas, que
tras el proceso de replicación pueden comprometer la fidelidad de la copia.
(Weinstein, 1978; Wogan and Goreling, 1985).
Los daños sobre el ADN, además de por la formación de aductos,
pueden producirse por otros procesos diferentes, como son la generación de
especies de oxígeno altamente reactivas, (Kuchino et al., 1987; White et al.,
1996; Park et al., 1996; Sugg et al., 1996) o dando lugar a mutaciones por
formación de dímeros de pirimidina, desaminación de bases, o interfiriendo con
los procesos de replicación, metilación o reparación (Shugart, 2000). La
hipometilación, consecuencia, por ejemplo, de la oxidación de las bases por
radicales libres, puede medirse mediante la hidrólisis enzimática del ADN
(Rosiello et al., 1994; Count and Goodman ,1995) o mediante la síntesis no
programada de ADN (Selden et al., 1994).
En cuanto a la detección de capacidad mutagénica la, los ensayos
bacterianos tradicionales de mutagenicidad, como el “test” de Ames (Ames et

Introducción 20 al., 1975; Stepanova et al., 1999), están siendo sustituidos por ensayos de
activación de oncogenes (Deveraux, 1994; Abshire et al., 1996), o la utilización
de modelos con animales transgénicos (Jowett et al., 1991; Murti et al., 1994;
Ryskova et al., 1997)
La detección de roturas en las cadenas de ADN puede realizarse
mediante los ensayos de desnaturalización en medio alcalino, (Shugart, 1988;
1998; 1996b; Meyers-Schone et al., 1993; Everaart et al., 1998), electroforesis
en geles alcalinos o neutros (Theodorakis et al., 1994) o el ensayo Comet
(Ostling and Johanson 1984; Michelmore and Chipman 1998; Singh et al.,
1988; Olive et al., 1992; Fairbairn et al., 1995), todos ellos basados en la
desnaturalización “in vitro” de la doble hélice a determinado pH. La proporción
de ADN de cadena sencilla detectada se considera que está relacionada con el
número de roturas.
Los daños estructurales son reparados la mayor parte de las veces por
los mecanismos celulares, pero cuando no es así y persisten o son reparados
erróneamente, pueden interferir en la fidelidad de la replicación y producir
cambios irreversibles en el genoma. Estos efectos tardíos e irreversibles, tales
como el intercambio de cromátidas, las aberraciones cromosómicas o el
incremento en la frecuencia de micronúcleos, se denominan efectos
citogenéticos y para la detección de los mismos se han incorporado
recientemente técnicas de análisis automático de imagen y de citometría de
flujo. (Gordon et al., 1989; Custer et al., 1994; 1997; Lamb et al., 1995; Grawe

Introducción 21 et al., 1997; Bikham et al., 1998; Carrano et al., 1978; Kohlpoth et al., 1999;
Sánchez et al., 2000)
En función de la magnitud del daño producido al ADN, sus efectos
pueden no ser fácilmente observables, siendo necesarios meses o años para
hacerse patentes, a veces incluso, después de que la fuente de contaminación
haya sido eliminada. Son precisamente estos eventos tardíos, los que a escala
poblacional adquieren mayor importancia (Saava, 1998; Anderson et al., 1994)
(Tabla II) Por tanto, el desarrollo de metodologías capaces de detectar el daño
al ADN en estadíos tempranos adquiere una gran importancia.

Introducción 22
Tabla II. Secuencia de efectos de la exposición a genotóxicos.
Efectos biológicos al nivel de individuo Efectos a escala poblacional
Temprano Temprano-Medio-Tarde Medio /Tarde Tarde
3. ADN anormal
4. Condiciones
patológicas
5. Efectos genéticos
1. Detoxificación • Inducción del
sistema enzimático P450
• Aberraciones cromosómicas.
• Micronúcleos
• Neoplasias • Tumores
• Alteración de la diversidad genotípica
• Variaciones en la frecuencia alélica
2. Alteraciones estructurales Agentes físicos • Dímeros de
Timidina • Rotura de cadena
Agentes químicos • Aductos
• Alteraciones de bases
• Rotura de
cadenas • Modificación de
bases • Hipometilación • Interferencias con
la reparación y replicación del ADN
• Mutaciones
• Aneuploidías
• Apoptosis
• Disfunción de proteínas
• Declive de
la fertilidad • Letalidad
6. Efectos fenotípicos • Rasgos fenotípicos
alterados. • Modificaciones en la
estructura de las clases de edad.
• Decrecimiento de la
abundancia y distribución de la población
• Extinción de la
población
El tiempo de aparición de estos efectos dependerá de las especies y tipo de genotóxico. (Temprano: horas o días. Medio: días, semanas o meses. Tarde: semanas, meses o años.) Modificada a partir de Thomson et al., 1999

Introducción 23
1.3 ANTECEDENTES METODOLÓGICOS DE LA TÉCNICA DE RAPD
En la última década, los avances en biología molecular han permitido el
desarrollo de técnicas tales como el análisis de polimorfismos obtenidos
mediante enzimas de restricción (RFLP), y la amplificación de genes mediante
la Reacción en Cadena de la Polimerasa (PCR), abriendo nuevas posibilidades
en la detección del daño al ADN. (Botstein et al., 1980; Saiki et al., 1988; Nirmal
et al., 1999)
La técnica de PCR, fue desarrollada por Mullis a finales de los años
ochenta y con ella se consigue la amplificación enzimática de un fragmento de
ADN o ARN hasta millones de veces, de un modo rápido y fiable. Su gran
sensibilidad, sencillez y eficacia para amplificar específicamente determinados
segmentos de ácidos nucleicos, ha permitido afrontar problemas
experimentales que antes eran irresolubles. En ella se imita, bajo condiciones
controladas de laboratorio, el proceso de replicación del ADN que tiene lugar
en los organismos vivos (Figura 6)
La complejidad del ciclo biológico, se simplifica “in vitro” utilizando una
ADN polimerasa y ciclos de temperatura para desnaturalizar e hibridar
alternativamente, la parte de ADN que se desee obtener. El resultado es la
amplificación exponencial de determinados fragmentos de ADN seleccionados
mediante cebadores o “primers” diseñados por el analista. El principal
inconveniente de la PCR, es que requiere el conocimiento previo de las

Introducción 24
ADN moldeee
Nuevo ADN Cebador
ADN + Cebador + dNTPs + ADN polimerasa + Bufer
1º Ciclo 2º Ciclo 3º Ciclo 4º Ciclo
Figura 6. Esquema de la técnica de PCR. Después de 30 ciclos se obtienen
1 billón de copias idénticas de un fragmento determinado de ADN.

Introducción 25 secuencias que flanquean el fragmento a amplificar, cosa que no siempre es
posible.
Para solventar este problema se desarrollaron una serie de variantes
conocidas con el nombre de MAAP (Multiple Arbitrary Amplificon Profiling o
Técnicas de Obtención de Perfiles Múltiples y Arbitrarios de Amplificación), que
utilizan cebadores de secuencia arbitraria y generan una huella genética del
ADN molde estudiado. Este grupo está formado por la técnica de RAPD
(Random Amplified Polimorphic ADN o ADN Polimórfico Amplificado al Azar)
(Williams et al., 1990), AP-PCR (Arbitrarily Primed PCR o Reacción en Cadena
de la Polimerasa Usando Cebadores al Azar) (Welsh and McClelland 1990) y
DAF (ADN Amplification Fingerprinting o Huella Genética Mediante
Amplificación del ADN) (Caetano-Anolles et al., 1991) Las diferencias entre
ellas, consisten en la longitud del cebador utilizado y en la forma de visualizar
los fragmentos amplificados (Tabla III)
La técnica de RAPD, desarrollada por Williams y col., en 1990 utiliza
cebadores cortos (entre 9-14 bases) de secuencia arbitraria, y la reacción de
amplificación se realiza a una temperatura de hibridación o “anillamiento” poco
selectiva, alrededor de 36ºC. Con estas condiciones la especificidad del
cebador disminuye, aumentando la probabilidad de hibridación, aunque en
muchos casos de forma imperfecta. Las diferencias entre PCR y RAPD
aparecen en la tabla IV.

Introducción 26
Tabla III. Principales diferencias entre las Técnicas de Obtención de
Perfiles Múltiples y Arbitrarios de Amplificación.
RAPD AP-PCR DAF
• Cebadores 10-12 pb 20 pb 5 pb
• Ciclo de temperaturas
Baja tª de hibridación en todos sus ciclos (30-39ºC)
Baja tª de hibridación en los primeros 2-5 ciclos alta en el resto (45-50ºC)
Baja tª de hibridación en todos sus ciclos (30ºC)
• Nº de ciclos 40-45 40-45 30-35
• Visualización de los productos
Electroforesis en geles de agarosa + bromuro de etídio
Incorporación de α32P-dATP en los primeros ciclos. Electroforesis en geles de poliacrilamida + autoradiografía
Electroforesis en poliacrilamida + tinción con plata
• Tamaño de los productos
Entre 300 y 2000 pb
Por encima de 500 pb
Por encima de 500 pb
(pb = pares de bases) Datos tomados de Menier y Grimont (1993)
Tabla IV. Diferencias básicas entre la técnica de PCR y RAPD.
PCR RAPD
Secuencia del cebador complementaria al DNA molde conocido.
Secuencia del cebador al azar, no requiere del conocimiento del ADN molde.
En ausencia de la secuencia no se produce amplificación.
Por lo general, se encuentran secuencias complementarias.
No exige integridad al ADN molde.
Es fundamental la integridad del ADN molde
Ciclo de temperaturas (tª de hibridación: 50 - 55ºC)
Ciclo de temperaturas (tª de hibridación : 30 - 39ºC)
Nº de ciclos: 30 Nº de ciclos: 45

Introducción 27
Durante los primeros ciclos el proceso es competitivo, es decir,
inicialmente un numero elevado de fragmentos son co-amplificados, pero solo
aquellos que presentan una mayor estabilidad cebador-ADN molde serán los
productos finales de la reacción.
El resultado, es un amplio espectro de fragmentos amplificados que
conforman un patrón de bandas o huella genética característica del ADN molde
utilizado. Los fragmentos o bandas, generalmente entre 300 y 2000 pares de
bases, son separados electroforeticamente en geles de agarosa y visualizados
mediante una tinción con bromuro de etídio. La técnica presenta grandes
ventajas ya que:
No necesita conocimiento previo de la secuencia a amplificar.
Utiliza pequeñas cantidades de ADN molde (entre 5-50 ng)
Utiliza los mismos cebadores para distintos sistemas biológicos.
Puede analizar un número elevado de muestras en poco tiempo.
No necesita marcaje radiactivo ni grandes equipos de laboratorio.
Todas ellas, han hecho que esta técnica se aplique con éxito en una
gran variedad de campos: en epidemiología molecular para la identificación de
cepas patógenas causantes de infecciones bacterianas (Allerberger et al.,
1997; De Vos et al., 1997), en el sector alimentario permitiendo la detección de
brotes de intoxicación (Loudon, et al., 1996) o el seguimiento de las vías de
diseminación de patógenos durante el procesamiento de alimentos

Introducción 28
(Niederhauser, et al., 1994); en estudios taxonómicos estableciendo relaciones
de proximidad evolutiva en especies animales y vegetales (Rothmanier, et al.,
1997; Rout et al. 1998; Hoey et al., 1996); en la elaboración de mapas
genéticos (Williams, et al., 1993), etc.
También, aunque más tímidamente, se ha utilizado en estudios de
genotoxicidad humana y animal. Peinado y colaboradores la aplicaron para la
detección de mutaciones en células tumorales de colon, tras comparar sus
patrones de bandas con los de las células sanas (Peinado et al., 1992). En
ecotoxicología, Kubota y colaboradores irradiaron machos del pez “medaka”
(Oryzias latipes), con el objetivo de detectar alteraciones en el ADN de los
individuos irradiados y en su progenie. Los resultados confirmaron la alteración
del patrón mediante la perdida y ganancia de bandas, así como diferencias en
la intensidad de amplificación. Verificaron el carácter hereditario de alguna de
las bandas de nueva aparición, sin que ello afectara a la viabilidad de la
progenie (Kubota et al., 1995). Además, demostraron una relación directa entre
las alteraciones en el patrón y la intensidad de irradiación (Kubota et al., 1992).
No obstante, esta técnica ha sido criticada por la aparición de bandas
erráticas de difícil interpretación y, en general, por la falta de reproducibilidad
de sus resultados, aspectos muy estudiados aunque no bien entendidos.
La naturaleza e intensidad de las bandas, está en función de múltiples
parámetros, tales como la integridad del ADN molde utilizado y/o de cada una
de las condiciones que intervienen en la reacción, desde la elección de la ADN

Introducción 29
polimerasa hasta el ciclo de temperaturas establecido. (Davin-Regli et al., 1995;
Abed et al., 1995; Bassam et al., 1992; Ellsmorth et al., 1993; Meunir and
Grimont 1993; Park and Kohel, 1994; Penner et al., 1993; Williams et al., 1990).
A su vez, la integridad del ADN molde está en función de las
condiciones iniciales de la muestra, del método de extracción utilizado, así
como de la conservación posterior del extracto genómico obtenido. (Black,
1993; Cheng et al., 1995). En cuanto a la unión cebador–ADN molde, es
directamente dependiente de la temperatura de hibridación y pequeñas
variaciones en ella pueden modificar los lugares de anillamiento y, por tanto,
los productos finalmente amplificados.

Justificación y Objetivos 30
2. JUSTIFICACIÓN Y OBJETIVOS
La presencia continuada de sustancias químicas de naturaleza
genotóxica, provoca daños estructurales en el material hereditario de las
poblaciones piscícolas expuestas. La posibilidad de evaluarlo tempranamente,
representa un avance metodológico en los procedimientos de valoración de
riesgo.
En los últimos años, y gracias al incipiente auge de la genómica, se han
desarrollado técnicas sensibles y específicas que abren nuevas posibilidades
en disciplinas científicas muy dispares.
Aún así, la aplicación de dichas metodologías en estudios poblacionales
de peces, plantea dificultades técnicas, económicas y éticas, debido al alto
número de animales, a las instalaciones de laboratorio que requieren y a la
larga duración de los estudios. Estas dificultades pueden en parte solventarse
mediante la utilización de sistemas “in vitro”, particularmente en las primeras
fases de valoración de riesgo.
Nuestros estudios han ido dirigidos a conseguir un modelo sencillo y
suficientemente representativo del medio acuático, que permita detectar una
amplia gama de alteraciones en la molécula de ADN, asociadas a la acción de
sustancias genotóxicas medioambientalmente relevantes.
El sistema biológico elegido ha sido la línea celular RTG-2, derivada de

Justificación y Objetivos 31
trucha arcoiris, y, que como se ha mencionado anteriormente, ha presentado
una buena correlación en multitud de estudios de citotoxicidad con el sistema
“in vivo” del que procede.
La técnica de RAPD, de reciente desarrollo, ha sido elegida para la
detección de efectos sobre dicho sistema. Teniendo en cuenta su fundamento
teórico, es posible detectar alteraciones inespecíficas en el ADN procedente de
células que posean una dotación genética idéntica, como es el caso de las
líneas celulares establecidas, mediante la comparación del patrón de bandas
de las células expuestas a la acción de genotóxicos y el patrón de bandas de
células no expuestas o controles. El hecho de no requerir información de la
secuencia genómica representa una gran ventaja en estudios ecotoxicológicos,
donde el conocimiento de la genética de las especies silvestres es muy
reducido, y donde el interés se centra en la detección del daño, y sus posibles
consecuencias, más que en la naturaleza del daño en sí mismo, objeto de otras
disciplinas como la genética molecular o la bioquímica.
Además de lo anterior, la técnica de RAPD es simple y no necesita
marcaje radiactivo, lo que permite que pueda realizarse prácticamente en
cualquier laboratorio. Por lo tanto, considerando la gran cantidad de ventajas
que presenta teóricamente esta técnica en estudios de ecotoxicología genética,
y aunque ha sido criticada por la falta de reproducibilidad de sus resultados,
nos hemos planteado esta tesis marcándonos dos objetivos concretos:

Justificación y Objetivos 32
1. Conseguir resultados fiables y reproducibles, optimizando todos y
cada uno de los diferentes parámetros que intervienen en la
reacción RAPD.
2. Desarrollar un sistema “in vitro” sensible y versátil, que permita
valorar a priori el carácter genotóxico de compuestos químicos y
muestras ambientales.

Planteamiento y resultados. 33
3. PLANTEAMIENTO Y RESULTADOS
El desarrollo metodológico ha ido dirigido a conseguir un sistema
sensible y cuyos resultados “in vitro” sean capaces de predecir los resultados
“in vivo”. Como las variaciones, incluso muy pequeñas, en el patrón de bandas
de células control y células expuestas son asumidas como resultado de la
acción del tóxico sobre el ADN, es imprescindible que dicho patrón sea
específico y altamente reproducible.
Por tanto, este trabajo se ha estructurado de la siguiente manera:
1. OPTIMIZACIÓN DE LA TÉCNICA (Reproducibilidad y
Especificidad)
2. CAPACIDAD PARA LA DETECCIÓN DE DAÑO AL ADN
(Sensibilidad)
3. CAPACIDAD PARA PREDECIR EL DAÑO “IN VIVO”
3.1 OPTIMIZACIÓN DE LA TÉCNICA. (Reproducibilidad y Especificidad)
(Anexos 2.1 y 2.4)
Como ya se ha mencionado, uno de los aspectos mas criticados a la
técnica de RAPD, ha sido la falta de reproducibilidad de sus resultados, dando
lugar a patrones de bandas variables. Los factores que intervienen en esta falta
de reproducibilidad se pueden agrupar en:

Planteamiento y resultados. 34
1. Integridad del ADN.
2. Ajuste de los Parámetros de la Reacción.
3.1.1. La Integridad del ADN, a su vez, está determinada por el método
de extracción seleccionado y por el estado de conservación de los
extractos.
Para seleccionar el método de extracción mas adecuado, se
ensayaron tres técnicas diferentes: (Anexo 2.1)
Precipitación de proteínas en un medio con alto contenido
en sales (Salting out) (Miller et al., 1988; Cheng et al., 1995).
Ebullición en presencia de “Chelex” como resina quelante
de metales divalentes. (Walsh et al., 1991).
Extracción con Fenol-cloroformo basado en la extracción
diferencial, de la molécula de ADN (Sambrook et al., 1988).
La idoneidad del método de extracción se valoró analizando la
concentración, pureza e integridad de cada uno de los extractos
geonómicos.
La concentración se determinó midiendo la absorbancia que presenta a
260 nm; y la pureza, mediante la relación de absorbancias a 260/280 nm.
Adicionalmente se introdujo una medida a 320 nm para sustraer el fondo

Planteamiento y resultados. 35
inespecífico, tras comprobar la distorsión que éste producía en un estudio
realizado con 18 extractos genómicos.
La integridad se determinó realizando una electroforesis en gel de
agarosa (al 0,8%) de una alícuota del extracto. La presencia en el gel de una
sola banda de aproximadamente 23.000 Kb indica el buen estado del ADN
extraído. En caso contrario, se observa la presencia de varias bandas de pesos
moleculares significativamente mas bajos, o bien una fluorescencia difusa a lo
largo de toda la calle.
Los resultados mostraron que el método más adecuado para la técnica
de RAPD era la extracción con Fenol-Cloroformo.
La conservación de los extractos de ADN (anexo 2.4) es determinante
para mantener el tamaño y el número de fragmentos en el patrón de
amplificación.
Generalmente, bien por conveniencia o por el propio diseño del ensayo,
el proceso de extracción del ADN se realiza simultáneamente en un número
elevado de muestras, almacenando los extractos hasta el momento de su
análisis, en algunos casos después de semanas o meses. En muchas
ocasiones, el almacenamiento conlleva un deterioro del extracto y, por tanto es
fundamental determinar los márgenes dentro de los cuales se puede realizar un
ensayo en condiciones de seguridad.

Planteamiento y resultados. 36
Se valoraron, a intervalos regulares de 3, 6, 9, 15 y 21 meses, la
integridad y concentración del ADN de 18 extractos genómicos almacenados a
4º C durante un periodo de casi 2 años.
Los resultados mostraron que los extractos pueden ser utilizados
durante un periodo máximo de 9 meses. Pasado este tiempo, y aunque la
concentración de ADN permanece prácticamente constante, su integridad se ve
alterada significativamente.
3.1.2. Ajuste de los parámetros de la reacción. (Anexo 2.1)
Con respecto a la enzima el Fragmento Stoffel de la Taq polimerasa,
existe acuerdo unánime en que esta enzima, obtenida a partir de la Taq
polimerasa por modificación genética, mejora la reproducibilidad en la reacción,
y, aunque no se conoce la causa concreta, se apunta a una mayor estabilidad
térmica, menor velocidad de procesamiento (10 veces menor que la Taq
polimerasa) y / o el amplio rango de iones magnesio (2 -10 mM) en el cual
trabaja. (Lawyer et al., 1988; 1993). El resto de los componentes de la
reacción, aunque se estudiaron diferentes concentraciones de Mg y dNTPs, se
fijaron finalmente dentro de los rangos recomendados: 4 mM de Mg y 0,2 mM
de cada dNTPs y 2 U del enzima.
En relación a las concentraciones optimas de ADN y primer utilizadas
en la reacción, existen opiniones contradictorias. Nosotros hemos estudiado un
amplio rango de concentraciones, desde 1 a 100 ng/25 ul de ADN y desde 1 a
8,5 pM de primer. Los resultados nos indujeron a elegir, inicialmente, 15 ng/25

Planteamiento y resultados. 37
ul y 5 pM de ADN y primer respectivamente, como las proporciones mas
adecuadas. Se observó que cada cebador, en función del número de bandas
que amplifica, presenta sus propias concentraciones óptimas, lo que nos
llevaría a ajustar las concentraciones en futuros trabajos.
La unión cebador–ADN molde es directamente dependiente de la
temperatura de hibridación, y pequeñas variaciones en ella pueden modificar
los lugares de unión y, por tanto, los productos finales amplificados. (Penner et
al., 1993; Roehrdanz et al., 1993). En éste sentido se estudiaron, un rango de
temperaturas de hibridación (entre 34º a 39º C), tiempos y numero de ciclos.
Los resultados obtenidos permitieron establecer la temperatura idónea en 36º
C durante 75 seg. y 50 ciclos.
En lo referente a la visualización de los fragmentos amplificados, ésta
se realiza mediante electroforesis en geles de agarosa y tinción con bromuro
de etídio. Tras estudiar diferentes voltajes, tiempos (de 1 a 4h) y
concentraciones, se determinó una tensión de 115 V durante 4 h y 2.1% de
agarosa como condiciones óptimas para conseguir una buena separación entre
los fragmentos o bandas. La incorporación del bromuro de etídio (0,5 µg/ml) se
realiza durante la preparación del gel, antes de que se solidifique, lo que
permite la comparación fluorimétrica de las bandas, a la vez que se minimiza el
manejo de este compuesto.
Para evitar la subjetividad en la interpretación de los resultados por parte
del operador, la imagen del gel es capturada y analizada por densitometría

Planteamiento y resultados. 38
mediante soporte informático.
3.2. CAPACIDAD PARA LA DETECCIÓN DE DAÑO AL ADN (Sensibilidad)
(Anexos 2.1, 2.2, 2.4, 3.1, 3.2)
La detección de alteraciones en el ADN de las células expuestas es
teóricamente sencilla, ya que las variaciones observadas en los patrones de
bandas de células controles y expuestas son interpretadas como resultado de
la acción del compuesto genotóxico sobre el ADN. Por ello es importante
obtener:
1. Un Patrón de Bandas Específico y Reproducible.
2. Unas Condiciones Óptimas para Detección de Daño al ADN.
3. Un Sistema de Análisis suficientemente sensible para detectar
alteraciones en el patrón de bandas.
3.2.1 Patrón de Bandas Específico y Reproducible. (Anexo 2.1, 2.2)
Una vez fijadas las condiciones de la reacción, dicho patrón de bandas
se consiguió mediante una adecuada selección de primers.
Se probaron 26 primers. Algunos no generaron bandas, otros
proporcionaron productos de amplificación difusa o bandas poco definidas y en
otros casos, aunque se obtuvieron bandas definidas, no presentaban
reproducibilidad intra y/o inter extractos, por lo que se seleccionaron solo
aquellos que presentaban bandas claras y altamente reproducibles. También

Planteamiento y resultados. 39
se estudiaron combinaciones binarias de cebadores, ninguna de las cuales
presentó resultados satisfactorios, bien por fallos en la amplificación, bien por
pérdida de reproducibilidad intergenómica, o bien por la aparición de bandas
con iguales pesos moleculares que los utilizados individualmente, por lo que la
combinación de primers no aportaba ninguna ventaja.
Finalmente, la huella genética de las células pertenecientes a la línea
celular RTG-2 quedó establecida con 8 cebadores que generaban un total de
56 bandas, con una reproducibilidad superior al 80% en todas las
amplificaciones y dentro de un amplio rango de pesos moleculares
(aproximadamente entre 2000 y 300 pares de bases)
La reproducibilidad de los patrones se comprobó amplificando
extractos procedentes de diferentes pases celulares (entre el pase 100 y el
135).
La especificidad de la huella obtenida se constató comparando los
patrones de bandas de otras líneas celulares derivadas de carpa (EPC) y de
hámster (CHO-K1)
3.2.2 Condiciones Óptimas para la Detección de Daño al ADN.
(Anexos 2.2, 2.4, 3.1 y 3.2)
Después de obtener un patrón constante y específico, se procedió a
comprobar la capacidad de esta técnica para detectar daño en el ADN tras

Planteamiento y resultados. 40
exposiciones agudas y crónicas. En este proceso hubo que optimizar las
concentraciones de ADN molde y cebador mas adecuadas para incrementar la
sensibilidad del ensayo y evitar la presencia de falsos positivos.
Se utilizaron dos compuestos genotóxicos de referencia, la Mitomicina C
(MMC) como mutágeno directo, (Anexo 2.2 y 2.4) y el Benzo(a)Pireno (BaP)
como mutágeno indirecto (Anexos 3.1 y 3.2).
MMC es un mutágeno de acción directa, ampliamente conocido por su
acción mutagénica y clastogénica. En función de la dosis y del periodo de
exposición, éste compuesto provoca, tanto “in vivo” como “in vitro”, sustitución
de bases, incremento en el intercambio de cromátidas hermanas, aberraciones
cromosómicas y formación de micronúcleos. (IARC)
Los estudios de exposiciones agudas realizadas con MMC, (1 y 0,5 µg/ml
durante 4 y 4, 6 y 8 h respectivamente) nos condujeron a ajustar tanto las
concentraciones de ADN molde, (de 15 a 5 ng / 25 µl) como las de cebador (de
5 a 4 pM). Las condiciones finalmente fijadas resultaron óptimas en la
detección de mutaciones, incluso para primers que generan un número muy
diferente de productos finales (de una a seis bandas).
El BaP, se seleccionó como compuesto de referencia, en estudios
agudos y en exposiciones prolongadas. La elección de dicho compuesto,
además de por su relevancia ambiental, se basó en que es un mutágeno de
acción indirecta, es decir, los productos activos son sus metabolitos.

Planteamiento y resultados. 41
El BaP pertenece al grupo de los hidrocarburos aromáticos policíclicos
(PAHs) que se producen a partir de la ignición de combustibles fósiles. Está
clasificado por la EPA como polucionante prioritario debido a su persistencia,
carcinogenicidad y alta capacidad de acumulación a lo largo de la cadena
trófica (Kanaly et al., 2001). Este compuesto, después de ser metabolizado se
transforma y da lugar a formas altamente reactivas, capaces de formar enlaces
covalentes con el ADN. En este tipo de estudios, donde los productos activos
son los metabolitos, la línea celular RTG-2 presenta la ventaja de retener cierta
capacidad metabólica, lo que le permite transformar el BaP en sus
intermediarios activos (Thornton et al.,1982).
El BaP se utilizó para establecer la sensibilidad de la técnica en las
condiciones anteriormente fijadas, comparándola con la inducción de
micronúcleos, utilizando para ello la misma línea celular, y las mismas
concentraciones y periodos de exposición. Los resultados, además de
confirmar que sus efectos son dependientes del tiempo y de la dosis, mostraron
que la técnica de RAPD presentaba una mayor sensibilidad. La concentración
mínima de compuesto genotóxico necesario para la inducción de micronúcleos,
era prácticamente el doble de la requerida para detectar alteraciones en el
patrón de bandas previamente establecido. No obstante, la sensibilidad estaba
en función del primer utilizado.
Las variaciones observadas en el patrón de bandas del ADN de las
células expuestas, tanto a MMC como a BaP, respecto a células control,

Planteamiento y resultados. 42
consistieron en diferencias en la intensidad y / o en la ausencia y / o presencia
de nuevas bandas.
La valoración de estas diferencias requirió el desarrollo de una
metodología de análisis precisa y objetiva, para minimizar la variabilidad del
método y facilitar la interpretación de resultados.
3.2.3. Sistema de Análisis para la Detección de Alteraciones en el Patrón
de Bandas. (Anexo 2.2)
Como práctica habitual, y para evitar errores a lo largo del proceso, en
cada gel se corrieron conjuntamente controles y expuestos (cada uno de ellos
al menos por triplicado), un patrón de pesos moleculares y un blanco
consistente en todos los reactivos excepto ADN molde. Además, para cada
ensayo, los geles se realizan, al menos, por duplicado y en diferentes días. El
análisis de las diferencias entre controles y expuestos se objetivó mediante un
proceso de captación de imagen computerizado.
En el análisis del perfil fluorimétrico de cada gel, se estudiaron las
diferencias cualitativas y cuantitativas. Las primeras, desaparición de bandas o
la aparición de otras nuevas, se expresaron como porcentajes respecto al
número de repeticiones realizadas.
Los análisis cuantitativos se llevaron a cabo mediante un software
específico, considerando inicialmente tres parámetros: altura, volumen y

Planteamiento y resultados. 43
porcentaje de amplificación de cada una de las bandas. Las diferencias entre
controles y expuestos de cada uno de estos parámetros, se establecieron
mediante el análisis de la t-Student, confirmando los resultados mediante el
“test” de U-Mann-Whitney. Todos los parámetros analizados mostraron
diferencias estadísticamente significativas (p<0,05), pero el nivel de
significación mas alto se obtuvo cuando se consideró el porcentaje de
amplificación (p<0,0001). Además, y aunque los tres parámetros están
relacionados, el porcentaje de amplificación resulta ser el mas objetivo, puesto
que se expresa en términos relativos y facilita las comparaciones entre los
perfiles de amplificación, aunque se hayan obtenido en diferentes días.
A pesar de ello, en la mayoría de los casos, los valores individualizados
de cada una de las bandas presentaban un alto coeficiente de variación, por lo
que se realizaron también los análisis agrupando las bandas en alto ( >800 pb),
medio (entre 600 y 800 pb) y bajo peso molecular (<600 pb). En estas
condiciones, se observa en los perfiles de las células expuestas un
decrecimiento en la amplificación de las bandas de alto peso molecular, en
favor de las de bajo peso molecular. Por tanto, la agrupación de bandas en los
análisis cuantitativos, disminuye la variabilidad de los datos, y muestra mas
claramente las diferencias entre controles y expuestos.
La sensibilidad del ensayo se incrementó cuando se realizaron
exposiciones a largo plazo. Las exposiciones crónicas ejercen una presión
constante sobre las poblaciones piscícolas, que se manifiesta en muchos casos
a lo largo de diferentes generaciones. Los sistemas “in vitro” pueden ser de

Planteamiento y resultados. 44
gran ayuda en los estudios en donde las observaciones de los efectos sobre la
dotación genética deben realizarse tras varias generaciones.
Se expusieron células RTG-2 a una baja concentración de BaP (0,05
µg/ml) y tras 3, 15 y 30 días de exposición, se extrajo y analizó el ADN. Los
resultados, al igual que los obtenidos en la exposición aguda realizada con este
mismo compuesto, presentaron una relación tiempo y dosis dependiente,
confirmándose también la sensibilidad selectiva de los primers utilizados.
Particularmente interesante fue la observación de la aparición de nuevas
bandas altamente repetitivas, tanto en el 100% de las amplificaciones como en
la totalidad de los extractos analizados, tras el mayor periodo de exposición.
3.3. CAPACIDAD PARA PREDECIR EL DAÑO “IN VIVO”.
(Anexos 2.3 y 4.1)
Los sistemas “in vitro” presentan grandes ventajas científicas técnicas,
económicas y éticas, pero deben ser capaces de predecir los efectos que se
observarían en la especie “in vivo”. Por lo tanto, la capacidad de extrapolación
de los resultados es requisito fundamental, por razones obvias, para su
aplicación.
En el caso concreto de la detección de alteraciones en el ADN mediante
la técnica de RAPD, la capacidad predictiva del ensayo vendría determinada
por:

Planteamiento y resultados. 45
1. La Similitud Genética entre los Sistemas “in vivo” e “in vitro,”
que se manifiesta en el grado de semejanza de sus respectivos
patrones de bandas y
2. La Similitud de los Efectos “in vivo” e “in vitro” producidos por
un mismo agente tóxico.
3.3.1. Similitud Genética entre los Sistemas “in vivo” e “in vitro”. (Anexo 2.3)
Se comparó el patrón de bandas de la línea RTG-2 con el de los
individuos de trucha arcoiris, especie de la que procede. Para ello, se utilizaron
33 individuos procedentes de 3 piscifactorías distintas. El ADN se extrajo a
partir de células de sangre periférica, y las amplificaciones se realizaron
mediante los cebadores inicialmente seleccionados para la caracterización de
la línea celular RTG-2. Para comparar el patrón de bandas de cada uno de los
individuos con la línea celular, se amplificaron los resultados conjuntamente y
por duplicado en un mismo gel.
Finalizado este proceso, se constató que los extractos genómicos de
todos los individuos generaban un total de 73 fragmentos frente a los 56
obtenidos en la línea celular. Este menor número de bandas está relacionado
con el carácter homocigótico de la línea celular. El análisis comparativo de los
patrones mostró una gran concordancia, ya que casi un 75% de las bandas se
encontraron en ambos sistemas. Las restantes se debieron a la presencia de

Planteamiento y resultados. 46
polimorfismos.
Las amplificaciones de todos los cebadores mostraron “in vivo” bandas
polimórficas, consecuencia de su diversidad genética, pero su número estuvo
en función del cebador utilizado. La similitud observada en los patrones de
bandas es una consecuencia de la homogeneidad que presentan ambos
sistemas. Así, el índice de similaridad inter-poblacional “in vivo” / “in vitro”
obtenido (0,931) está muy próximo al valor máximo 1.
Igualmente, en el dendrograma de distancias genéticas construido entre
todos los individuos analizados y la línea RTG-2, se observaron dos brazos
indistintamente formados por individuos pertenecientes a todas las poblaciones
y la línea celular RTG-2. Como conclusión de este trabajo y para estudios
posteriores, se seleccionaron de entre los primers inicialmente ensayados,
aquellos cuyo patrón de bandas presentaba una mayor concordancia “in vivo”
e “in vitro”.
3.3.2. Similitud de Efectos “in vivo” e “in vitro”. (Anexo 4.1)
Una vez constatada la similitud genética de ambos sistemas, se realizó un
ensayo “in vivo” con el mismo agente (BaP), que permitiera comprobar si los
efectos observados “in vitro” se confirmaban “in vivo”.
Se realizó una exposición subletal, mediante una inyección
intraperitoneal, y se valoraron sus efectos a diferentes tiempos (1 - 4 meses),

Planteamiento y resultados. 47
comparando el patrón de bandas obtenido a partir del ADN de células de
sangre periférica.
Los análisis cualitativos y cuantitativos confirmaron los resultados “in
vitro”, mostrando la aparición de nuevas bandas y alteraciones en su
intensidad. No obstante, la presencia de bandas polimórficas dificultó el análisis
entre los grupos de individuos tratados y no tratados, de manera que las
comparaciones solamente se pudieron realizar en un mismo individuo antes y
después del tratamiento. Esta es la mayor limitación que presenta la técnica de
RAPD en los estudios “in vivo”. El sistema de agrupación de bandas se mostró
especialmente adecuado para evidenciar los efectos del contaminante. No
obstante, y debido al pequeño número de individuos analizados en este
estudio, no es posible extraer conclusiones determinantes, ya que la propia
susceptibilidad individual requiere el análisis de muestras de gran tamaño. De
cualquier manera los resultados obtenidos son, sin duda, la manifestación de
las alteraciones producidas por este compuesto en el material genético, tanto
“in vivo” como “in vitro”, demostrando claramente la capacidad de la línea
celular RTG-2, tanto para metabolizar este conocido promutágeno, como para
predecir los efectos genotóxicos que se observarían en los individuos
expuestos.
Con este trabajo, sólo hemos pretendido apuntar la capacidad
metodológica del sistema desarrollado y, es evidente que para poder llegar a
conclusiones más fiables que permitan transferir dichos resultados “in vitro” a
los sistemas “in vivo”, son necesarios estudios más completos y ambiciosos

Planteamiento y resultados. 48
que exceden de los objetivos de este trabajo.

Discusión. 49
4. DISCUSIÓN
Uno de los objetivos de la ecotoxicología, es proporcionar metodologías
sensibles y realistas que permitan acometer las valoraciones de riesgo con
mayor grado de seguridad. Actualmente, en los foros de consenso internacional
sobre seguridad de sustancias químicas para el medio acuático (Convenio
OSPAR, Convenio de Londres y de Barcelona) , se está planteando la política
de eliminación de la contaminación en su origen, recomendando la adopción
del concepto de sustitución de las sustancias químicas más peligrosas, o bien
reduciendo sus niveles de emisión a cero. Esta política, que acarreará una gran
controversia en particular por parte de la industria, se debe en gran medida a la
ausencia de metodologías prácticas capaces de predecir efectos a largo plazo
sobre las poblaciones expuestas. El desarrollo de nuevos métodos, que
contribuyan a la monitorización de los efectos que producen los compuestos
químicos de relevancia medioambiental sobre los organismos y poblaciones
expuestas, es hoy en día, por tanto, una prioridad en ecotoxicología.
Las técnicas moleculares que permiten la obtención de la huella genética
o patrón de bandas específico del sistema biológico utilizado, pueden aportar
nuevas herramientas en la detección de efectos genotóxicos sobre los
individuos y poblaciones expuestas.
La aparición a principios de los noventa de este tipo de técnicas, que no
requerían el conocimiento de la secuencia de ADN, supuso una auténtica
revolución en el campo de la ecotoxicología genética, pues permiten obtener

Discusión. 50
huellas genéticas especie–específicas, población–específicas e incluso
individuo–específicas. Esta es una de las razones por las cuales la literatura
científica que se puede encontrar sobre el tema, sea prácticamente coincidente
en el tiempo y se deba en su mayoría a los trabajos de tres o cuatro equipos de
investigación en todo el mundo que hemos trabajado simultáneamente.
La obtención de un patrón de bandas especifico de un determinado ADN
permite detectar cambios en dicha molécula tras ser expuesta a diferentes
factores de estrés, como son los contaminantes físicos o químicos (Kubota et
al., 1992,1995). Con estas técnicas, la huella genética se obtiene mediante una
PCR que utiliza primers cortos y de secuencia arbitraria. Se han desarrollado
tres protocolos diferentes, de los cuales el de AP-PCR y particularmente el de
RAPD han sido los que se han aplicado de forma mayoritaria.
Los primeros trabajos aplicaron la técnica de AP-PCR. Su protocolo
utiliza altas temperaturas de hibridación, permitiendo aumentar la especificidad
cebador-molde y obtener un número reducido de fragmentos finales. Por el
contrario, la técnica de RAPD, debido a las bajas temperaturas que utiliza (34-
39º C), permite multiplicar los lugares de unión cebador–ADN molde y por tanto
aumentar el número de bandas o productos finales. Sin embargo, la falta de
especificidad de muchas de estas uniones, hace que ligeras variaciones en
algunos de los parámetros que intervienen en la reacción, alteren la intensidad
e incluso el número de los productos amplificados. Todo ello ha contribuido a
cuestionar la reproducibilidad de sus resultados y en definitiva, la idoneidad de
esta técnica (Abed et al., 1995; Bassam et al., 1992; Ellsmorth et al., 1993;

Discusión. 51
Meunir and Grimont 1993; Park and Kohel, 1994; Penner et al., 1993; Regli et
al., 1995).
Nuestra hipótesis inicial partió de la base de que si los diferentes
parámetros que intervienen en la reacción eran minuciosamente
estandarizados, los resultados llegarían a ser altamente repetitivos y por tanto
la técnica podría ser aplicada satisfactoriamente en ecotoxicología. Ello ha
supuesto que el trabajo realizado en esta tesis haya sido eminentemente
metodológico.
Uno de los factores a controlar es la integridad del ADN utilizado como
molde. Durante la fase de hibridación, el cebador busca o explora a lo largo de
todo el genoma, secuencias complementarias a las que unirse. Sólo si existen
lugares de unión en ambas cadenas del ADN y a distancias adecuadas, el
fragmento comprendido entre ambos será amplificado. Si el ADN ha sufrido
roturas durante el proceso de extracción o conservación, algunos de los
lugares de unión pueden verse dañados y por tanto, afectar a la
reproducibilidad de los resultados finales. De la gran cantidad de métodos de
extracción, incluyendo “kits” comerciales, de que se dispone en la actualidad,
sólo pueden utilizarse aquellos que no rompan la molécula de ADN (Black,
1993; Cheng et al., 1995). Según nuestros resultados, la extracción con fenol
cloroformo proporciona un ADN de alta eficiencia que puede ser almacenado
durante varios meses a 4º C sin alterarse, lo que le convierte en un método
óptimo.

Discusión. 52
Además, en la reacción de amplificación propiamente dicha, intervienen
un gran número de variables que cada equipo de investigación ha
protocolizado a su elección. Algunas de ellas están condicionadas por el tipo de
polimerasa y el ciclo de temperaturas elegido (Roehrdanz y col., 1993; Penner
y col., 1993; Meunier and Grimont 1993). La Taq polimerasa fue empleada por
Williams y colaboradores en 1990 en el desarrollo del método, pero en la
actualidad el fragmento Stoffel de la Taq polimerasa esta siendo
preferentemente utilizado, pues a bajas temperaturas de hibridación
proporciona resultados más reproducibles y presenta una actividad óptima
dentro de un rango más amplio de concentraciones de iones magnesio (Nicol et
al., 1998; Schiliro et al., 2001; Aljanabi et al., 1999; Lawyer et al., 1993).
Algo semejante ha sucedido con el ciclo de temperaturas. La unión
cebador–ADN molde es directamente dependiente de la temperatura de
hibridación y pequeñas variaciones en ella pueden modificar los lugares de
unión y, por tanto, los productos finalmente amplificados. Penner y col., (1993)
en un estudio comparativo, comprobaron que la diferencia en los resultados
finales entre distintos laboratorios, era debida a las diferencias de temperaturas
conseguidas por los termocicladores en el interior de los tubos de amplificación,
a pesar de estar igualmente programados. Williams, y col., (1990) al desarrollar
el método sugirieron la imposibilidad de utilizar temperaturas superiores a 40º
cuando se trabajaba con primers cortos de 10 pares de bases. Posteriormente,
sin embargo, se han desarrollado protocolos para la detección de mutaciones
en el intervalo de temperaturas que va desde 35ºC (Conte et al., 1998) a 50ºC
(Atienzar et al., 2000b). En nuestro caso la temperatura óptima se ha fijado en

Discusión. 53
36º C.
La concentración de ADN molde y primer son factores que afectan en la
obtención de un patrón de bandas constante. Aunque existen diferentes
opiniones sobre su influencia (Van Belkum 1994; Welsk and McClelland 1990,
Muralidharan and Wekeland 1993; Davin-Regli et al., 1995), en nuestros
estudios han resultado ser de gran importancia para la obtención de resultados
repetitivos y para eliminar la presencia de bandas erráticas. No obstante,
hemos podido comprobar que cada cebador, en función del número de bandas
que amplifica, presenta concentraciones óptimas de trabajo, lo que
posiblemente sea la causa de las diferentes opiniones al respecto. Además, la
concentración de ADN molde fue decisiva para la detección de diferencias en el
ADN de células control y expuestas a compuestos genotóxicos, y su
optimización ha permitido aumentar la sensibilidad, eliminando la presencia
falsos positivos. El ADN de las células expuestas, en función de las
concentraciones y tiempos de exposición utilizados, permanece intacto en un
cierto número de copias. Cuando se utilizan concentraciones de ADN altas (20
ng / 25 µl), el número de copias inalteradas es suficiente para que el primer (4
pM) pueda encontrar secuencias donde hibridar y dar lugar, finalmente, a
patrones de bandas no alterados. Sin embargo, cuando la concentración de
ADN es menor, (5 ng / 25 ul) y a pesar de que en términos relativos la
proporción de copias intactas sea la misma, el numero absoluto es mas bajo e
insuficiente, incrementando así la probabilidad de mostrar secuencias
alteradas.

Discusión. 54
El ajuste de la concentración de ADN a cantidades tan bajas, requiere
una gran precisión para la cuantificación de los extractos, en este sentido, una
lectura adicional a 320 nm permite eliminar las interferencias debidas a otros
componentes presentes en el medio, evitando la sobrevaloración de la medida.
Además de las variables consideradas, la obtención de un patrón de
bandas específico y adecuado para la detección de genotoxicidad requiere una
meticulosa selección de los primers. Del total de los mismos y sus
combinaciones binarias inicialmente probadas, sólo se seleccionaron 8,
siguiendo como criterio que las bandas amplificadas sean constantes y bien
definidas, y que se encuentren dentro de un amplio rango de pesos
moleculares. La necesidad de una buena reproducibilidad del patrón resulta
obvia, y la obtención de bandas de diferentes pesos moleculares, incrementa la
sensibilidad en la detección de daño al ADN. (Atienzar, et al., 2001)
Por lo que respecta a la aplicación de la técnica de RAPD para el estudio
de alteraciones genéticas “in vivo”, existen ciertas complicaciones. Los
individuos pertenecientes a una misma especie, presentan diferencias
individuales que se manifiestan como bandas polimórficas. Este hecho, que es
de gran interés para estudios de diversidad, es un grave inconveniente cuando
se aplica a la detección de genotoxicidad, pues la presencia o ausencia de
bandas entre los individuos expuestos y no expuestos, puede ser debida tanto
a la presencia de polimorfismos propios de la especie, como a la acción de
sustancias genotóxicas, lo que implica, para evitar incertidumbre, la utilización
de muestras de gran tamaño, encareciendo y complicando el estudio

Discusión. 55
(Theodorakis, et al., 1997; 1998; Krane et al., 1998; Bickham et al., 2000). La
utilización de individuos genéticamente homogéneos, tales como clones de
Daphnia magna (Atienzar et al., 1999; 2001) o células pertenecientes a una
misma línea celular, permite detectar fácilmente tales cambios, tras comparar
los patrones de bandas de individuos controles y expuestos.
La utilización de cultivos celulares en la detección de efectos
genotóxicos simplifica muchos de los problemas asociados al uso de sistemas
“in vivo”, y pueden resultar de gran utilidad en los procedimientos de predicción
/ valoración de riesgo, siempre y cuando se haya constatado el grado de
similitud entre ambos sistemas. Hay que tener en cuenta que las líneas
celulares establecidas pueden poseer características genéticas diferentes de
las células originales y, además, muchas especies de peces presentan una
gran variabilidad en su dotación genética. Por ejemplo, en trucha arcoiris se
han descrito individuos con dotaciones diplóides, tetraplóides e incluso
aneuplóides. (Al-Sabty, 1991). Por ello es imprescindible comparar ambos
patrones de bandas (“in vivo”/”in vitro”) y establecer su grado de similaridad,
mediante la detección de bandas comunes y / o exclusivas de cada uno de los
sistemas, con objeto de acotar mejor la extrapolación de resultados.
La comparación de los patrones de bandas de diferentes individuos de
trucha arcoiris y de la línea celular RTG-2 utilizando los 8 primers
seleccionados, reveló una gran concordancia, pues el 73% de las bandas que
componen el patrón de la línea celular RTG-2 están presentes en todos los
individuos de trucha arcoiris estudiados. La línea celular presenta un numero

Discusión. 56
menor de bandas que el sistema “in vivo”, como consecuencia de su carácter
homocigótico (Theodorakis, et al., 1997). Debido a que el numero de loci que
pueden ser analizados por esta técnica es teóricamente ilimitado (Lynch and
Milligan, 1994), aproximadamente el 50% de las bandas obtenidas “in vivo “
resultaron ser polimórficas, mostrando la variabilidad genética de las
poblaciones estudiadas.
A pesar de que la técnica de RAPD es relativamente nueva y hay una
información limitada de valores de referencia, el índice de similaridad
interpoblacional “in vivo”/”in vitro” obtenido (0,931) es considerablemente mayor
al mostrado por otros autores entre poblaciones piscícolas dentro de una
misma especie. (Bardakci et al., 1994; Bielawski and Pumo, 1997).
Teniendo en cuenta la gran similitud genética que presentan ambos
sistemas, cabría esperar efectos genotóxicos similares cuando individuos de
trucha arcoiris y células RTG-2 estén expuestos a un mismo contaminante.
Esta hipótesis quedó demostrada al detectar alteraciones en el patrón de
bandas de células RTG-2 y de células de sangre periférica de individuos de
trucha arcoiris expuestos a BaP. Sin embargo, en los estudios “in vivo”, la
propia susceptibilidad individual y la presencia de polimorfismos hace que los
resultados no sean homogéneos, obligándonos a realizar análisis horizontales
para detectar en un mismo individuo, las variaciones que sufre su patrón de
bandas antes y después de la exposición. Esta aproximación experimental
tiene cabida en los estudios de laboratorio cuando el tamaño de la especie lo
permite, pero desde luego no es posible cuando se pretende realizar un estudio

Discusión. 57
de monitorización de campo, a menos que se incremente notablemente el
tamaño de la muestra.
En los estudios de campo con poblaciones naturales se puede, tras
estudiar un elevado numero de individuos, determinar la frecuencia de
aparición de las distintas bandas dentro de una población expuesta y
compararlo con poblaciones no expuestas o controles. Aunque se han
abordado algunos estudios de este tipo, (Theodorakis et al., 1997; 1998; Krane
et al., 1998) la dificultad que presenta el disponer de poblaciones control, y los
problemas inherentes a los propios estudios de campo (sexo, tamaño, edad de
los individuos capturados, etc.), limita en gran medida su realización.
Estos problemas pueden ser minimizados utilizando sistemas biológicos
genéticamente homogéneos, donde una población celular puede ser expuesta
a la acción de un determinado genotóxico durante varias generaciones, debido
a su, relativamente corto, ciclo celular. Concretamente en los estudios que
hemos realizado con mitomicina C y benzo(a)pireno, el patrón de bandas
obtenido para la línea celular RTG-2, ha mostrado ser sensible a tales cambios,
detectándose tanto variaciones cualitativas (alteraciones en la frecuencia de
aparición de alguna de las bandas y / o presencia de otras nuevas), como
cuantitativas (variaciones en su intensidad de amplificación). Estos cambios
cualitativos, detectados entre los patrones controles y expuestos, han sido
confirmados por otros autores, tanto utilizando el mismo compuesto - BaP-,
como en exposiciones a otro tipo de contaminantes - luz ultravioleta y metales
pesados - en una amplia variedad de especies: gusanos (Platynereis dumerilii),

Discusión. 58
moluscos (Mytilus edulis), microcrustáceos (Daphnia. magna), plantas
acuáticas (Arabidopsis thaliana), algas (Palmaria palmata) y –bacterias
(Escherichia coli y Renibacterium salmoninarum) (Saava 1996; Atienzar et al.,
1999; 2001; 2000a; Conte et al., 1998).
La desaparición y/o aparición de nuevas bandas, revelan cambios en la
estructura del ADN debido a la presencia de mutaciones puntuales que alteren
o generen nuevos lugares de unión con el primer, a delecciones que provoquen
la pérdida de algunos lugares de unión y acerquen lugares de hibridación ya
existentes, o como han sugerido diversos autores, como consecuencia de la
recombinación de homólogos, yuxtaponiéndose dos secuencias
complementarias a la secuencia del primer. (Kubota et al., 1992; 1995; Peinado
1992; Atienzar 1999; 2001, Saava, 2000; Conte et al 1998).
La aparición de nuevas bandas como consecuencia de mutaciones
requiere que éstas se produzcan en un mismo locus en un número
suficientemente alto de células, al menos en el 10%, para conseguir que un
nuevo producto de PCR sea visible en geles de agarosa (Atienzar et al., 1999).
La obtención de una nueva banda con un alto porcentaje de aparición, podría
sugerir la interacción del tóxico con el ADN en lugares específicos de la
molécula, mostrando de esta forma la existencia de puntos calientes o
secuencias específicamente sensibles a la acción de un determinado tipo de
agente inductor.
En las exposiciones a corto y largo plazo que hemos realizado con BaP,

Discusión. 59
se muestra la aparición, en los patrones de las células expuestas, de dos
nuevas bandas (D-8936 y AA-82620) de pesos moleculares iguales en ambos
ensayos. Esto muestra la capacidad de la técnica para detectar la presencia
de puntos calientes en el genoma a la acción del tóxico, como ya observamos
en exposiciones agudas a MMC y como también ha sido sugerido por otros
autores (Atienzar et al., 2001; Saava 1998).
En las exposiciones prolongadas (15-30 días) a bajas concentraciones
de BaP (0,05 µg/ml), la manifestación de estos efectos resulta más evidente. A
los 15 días de exposición, se observó la presencia de cuatro nuevas bandas
aunque con diferentes porcentajes de aparición. Esta variabilidad fue debida,
tanto a que durante este periodo de exposición sólo afecta a parte de población
celular, como a la propia dinámica de la reacción, donde los productos finales
son el resultado de una multiplicación exponencial de los fragmentos mas
abundantes, lo que hace que en ocasiones esas bandas no sean reproducibles
al 100% (Davin-Regin 1995). Al aumentar el periodo de exposición a 30 días,
solo persistieron dos de ellas (AA-82620 y AA-89484) pero con un porcentaje de
aparición del 100%, sugiriendo que dicha alteración se encuentra en un numero
elevado de células; es decir, se produce un aumento en el índice de mutación,
y lo que es más, sugiere el carácter hereditario de dicha alteración genética.
Las implicaciones biológicas que pueden acarrear estos cambios están
en función de la secuencia afectada. Pueden darse en genes recesivos,
trasmitiéndose a las células hijas y manifestándose ante un cambio en las
condiciones ambientales, o bien, pueden producirse en secuencias que

Discusión. 60
codifican proteínas vitales para la supervivencia de las células, dando lugar a
procesos de letalidad a corto o medio plazo.
Por lo que nosotros hemos podido constatar, los equipos de
investigación que han utilizado y optimizado la técnica de RAPD para la
detección de mutaciones, se han centrado en el análisis cualitativo o
semicuantitativo de los datos (Conte et al., 1998; Atienzar et al., 1999; 2001;
Theodorakis et al., 1997). Nuestro desarrollo metodológico ha ido encaminado
a dotar de mayor precisión a la técnica, por lo que, cuando los resultados se
analizan mediante programas de ordenador específicos, además de eliminar la
subjetividad propia del observador, el análisis puede realizarse de forma
cuantitativa utilizando la altura, el volumen y el porcentaje de amplificación de
cada una de las bandas. De todos ellos el más adecuado, en nuestra opinión,
es el porcentaje de amplificación, pues proporciona valores relativos al total
amplificado, permitiendo una mejor comparación entre los diferentes geles y al
mismo tiempo, una menor dispersión. Además, cuando las bandas se agrupan
según sus pesos moleculares, las diferencias se manifiestan más claramente,
mostrando en los individuos expuestos una pérdida de amplificación de las
bandas de alto peso molecular a favor de las de bajo peso molecular.
Aunque la causa de las diferencias de intensidad se deba a un conjunto
de eventos, la más significativa probablemente sea la pérdida de amplificación,
bien por la formación de aductos que bloqueen la polimerización del ADN
(Nelson et al., 1996), o por la presencia de roturas en dichos lugares (Atienzar
et al., 1999). En ambos casos los fragmentos de mayor peso molecular tienen

Discusión. 61
una mayor probabilidad de sufrir tales eventos (Atienzar et al., 1999), y en
consecuencia, la eficiencia de la amplificación se desplaza hacia los
fragmentos de menor peso molecular. En el caso de las exposiciones agudas a
MMC, observamos variaciones en la razón alto:bajo peso molecular de 5:2 en
los controles, a 1:1 en los expuestos. Aunque desde luego es imprescindible
realizar estudios más amplios tanto a lo que se refiere al número y tipo de
compuestos, como al número de individuos; nos atrevemos a sugerir que tal
vez la utilización de esta sencilla relación matemática pueda servir como
parámetro o biomarcador de genotoxicidad.
En resumen, las modificaciones en el patrón de bandas pueden estar
originadas por un amplio rango de alteraciones en el ADN, desde cambios de
bases (mutaciones puntuales) a complejos reagrupamientos de cromosomas
(White et al., 1990; Peinado et al., 1992; Welsh et al., 1991 Kubota et al., 1995;
Atienzar et al., 1999; 2000; 2001). La capacidad de la técnica para detectar un
amplio espectro de alteraciones estructurales en el ADN la hace especialmente
interesante para los estudios ecotoxicológicos, pues incrementa de 2 a 4 veces
su sensibilidad, concretamente en el caso del BaP, frente a otros ensayos
clásicos de genotoxicidad, como el incremento de micronúcleos (Kolpoth et al.,
1999; Sánchez et al., 2000) o aberraciones cromosómicas (Kocan et al., 1982 y
1985), utilizando la misma línea celular, o bien a escala poblacional detectando
inestabilidad genética frente a otros parámetros poblacionales como
crecimiento, supervivencia, fecundidad, etc. (Atienzar et al., 1999; 2000; 2001),
con este mismo genotóxico.

Discusión. 62
Por otro lado no todos los primers presentaron la misma capacidad para
detectar alteraciones, ya que de los cuatro utilizados, dos se mostraron más
sensibles a la acción del tóxico (AA-82 y AA-89). Fueron estos mismos, los que
manifestaron los mayores porcentajes de polimorfismos (>50%) en los
individuos de trucha arcoiris analizados, sugiriendo la posibilidad de que las
secuencias que amplifican presenten una alta susceptibilidad a ser alteradas
por agentes externos.
En definitiva, la técnica de RAPD se muestra como una valiosa
herramienta para la detección de efectos sobre el ADN. La rapidez, versatilidad
y sensibilidad para detectar un amplio rango de alteraciones son sus
principales ventajas. Además, su aplicación conjunta con sistemas “in vitro”,
cuya homogeneidad genética elimina la presencia de polimorfismos, permite
detectar alteraciones transgeneracionales en exposiciones prolongadas a
genotóxicos medioambientalmente relevantes por su persistencia y ubicuidad
contribuyendo a dotar de mayor grado de seguridad a los procedimientos de
valoración de riesgo.

Conclusiones 63
5. CONCLUSIONES.
1. La extracción del ADN molde con fenol cloroformo, proporciona una
alta eficiencia de amplificación y permite que los extractos genómicos
puedan utilizarse, almacenados a 4º C, por periodos de hasta nueve
meses.
2. Para evitar la sobrevaloración de la concentración y pureza del ADN
presente en los extractos, es necesario sustraer el fondo inespecífico,
realizando una medida espectrométrica adicional a 320 nm.
3. Para eliminar la presencia de falsos positivos, la integridad del ADN
extraído en cada uno de los extractos debe ser comprobada mediante
geles de agarosa antes de iniciar la amplificación.
4. El protocolo que proporciona mayor grado de reproducibilidad consiste
en: 4 mM de Mg, 0,2 mM de cada dNTP, 2 U del fragmento Stofel, 5
pM de primer, 15 ng de ADN en un volumen finadle 25 µl; una
temperatura de hibridación de 36º C durante 75 seg y un numero de
50 ciclos. La visualización de los fragmentos amplificados se realiza
mediante electroforesis a 115 v durante 4 h en geles de agarosa al
2,1%.
5. El patrón de bandas o huella genética de la línea celular RTG-2 quedó

Conclusiones 64
establecida con 8 cebadores que generaban un total de 56 bandas,
con una reproducibilidad superior al 80% en todas las amplificaciones
y dentro de un rango de pesos moleculares de entre 2000 y 300 pares
de bases.
6. Este patrón de bandas es sensible a la detección de alteraciones en el
ADN de células expuestas, tanto a genotóxicos de acción directa,
mitomicina C, como indirecta, benzo(a)pireno; esta sensibilidad varía
en función del cebador utilizado.
7. Aunque el patrón de bandas obtenido es constante dentro de un
amplio rango de concentraciones de ADN y cebador, la sensibilidad en
la detección de daño al ADN fue óptima cuando éstas se ajustaron a 5
ng de ADN y 4 pM de cebador.
8. El daño al ADN se detecta como variaciones en el patrón de bandas
de las células expuestas, respecto al de las células control. El sistema
desarrollado permite evidenciar alteraciones cualitativas (aparición de
nuevas bandas y / o perdida de la amplificación de alguna de ellas) y /
o cuantitativas (variaciones en la intensidad de amplificación)
9. De los parámetros considerados para el análisis cuantitativo, altura
volumen y porcentaje de amplificación de las bandas, se selecciono
este último ya que presenta menor dispersión de datos, y además
permite el análisis de resultados obtenidos en diferentes días.

Conclusiones 65
10. La agrupación de bandas en los análisis cuantitativos en alto, medio y
bajo peso molecular, disminuye la variabilidad de los datos, y muestra
mas claramente las diferencias entre genomas controles y tratados.
Estas diferencias se manifestaron en los genomas expuestos como un
decrecimiento en las bandas de alto peso molecular a favor de las de
bajo peso molecular.
11. El sistema desarrollado resultó ser de 2 a 4 veces más sensible que
otros ensayos clásicos de genotoxicidad, utilizando la misma línea
celular, el mismo compuesto tóxico y periodos de exposición.
12. El patrón de células sanguíneas de trucha arcoiris, presenta un
número mas elevado de bandas que el obtenido para la línea RTG-2
(73 frente a 56). El 50% de las bandas fueron polimórficas. Los primers
AA-89 y AA-82 mostraron los porcentajes de polimorfismos mas
elevados.
13. El análisis comparativo de los patrones “in vivo” / ”in vitro” mostró una
gran semejanza. Alrededor de un 75% de las bandas se encontraron
en ambos sistemas. Los primers AA-89, AA-82, D-8 y C-96 se
seleccionaron por su mayor concordancia para posteriores estudios.
14. La línea celular RTG-2 y la especie de la que procede presentan una
gran homogeneidad genética, con un alto índice de similaridad Inter.-

Conclusiones 66
poblacional “in vivo” e “in vitro” (0.931). Igualmente el dendrograma de
distancias genéticas construido entre todos los individuos analizados y
la línea RTG-2, no muestra diferencias entre los individuos trucha
arcoiris y la línea celular RTG-2.
15. En los estudios in vivo tras la exposición intraperitoneal de 69 µg/g p.c.
a Benzo(a)pireno se detectaron alteraciones cualitativas, presencia
de una nueva banda, y cuantitativas, diferencias en los porcentajes de
amplificación, en todos los individuos de trucha arcoiris. Estas
alteraciones confirmaron las observadas en los estudios “in vitro” .
16. La presencia de nuevas bandas, como consecuencia de alteraciones
en lugares específicos del genoma observadas tanto “in vivo” como “in
vitro”,, hace suponer la presencia de secuencias más sensibles a la
acción del toxico. La capacidad de la metodología desarrollada para
evidenciar estas secuencias más sensibles en la molécula de ADN,
resulta de una gran utilidad para el estudio de los mecanismos de
acción de genotóxicos ambientales.
17. La presencia de bandas polimórficas, obliga a realizar estudios
horizontales en cada individuo, antes y después de la exposición. Esto
limita y dificulta los estudios de campo marcando como requisito
imprescindible la utilización de muestras de gran tamaño.
18. El sistema desarrollado mediante la combinación de ensayos in vitro y

Conclusiones 67
la técnica de RAPD proporciona sensibilidad, versatilidad y rapidez, lo
que nos induce a recomendarlo para que sea incorporado, como una
herramienta muy útil, en los procedimientos de valoración de riesgo
para el medio acuático de sustancias químicas y mezclas complejas.

Bibliografía 68
6. BIBLIOGRAFÍA
Abed, Y., Davin-Regli, A., Charrel, R. N. Bollet, C. and Micco, P. (1995)
Variation of RAPD fingerprint patterns using different DNA-extraction methods
with Gram-positive bacteria. World J. Microbiol Biotechnol., 11, 238-239
Abshire, M.K., Buzard, G.S., Shiraishi, N. and Waalkes, M.P. (1996)
Induction of c-myc and c-jun proto-oncogene expression in rat L6 myoblasts by
cadmiun is inhibited by zinc preinduction of the metallothionein gene. J.
Toxicol. Environ. Health. 48, 359-77
Ahne, W. and Schweitzer, U. (1993). Durch Pestizide induzierte
chromosomale Strukturveränderungen (Anaphase-Aberrationen) bei
Fischzelkulturen (R1-Forellenzellen). Wasser Abwasser 134: 745-748.
Ali, F., Lazar, R., Haffner, D. And Adeli, K. (1993). Development of a rapid
and simple genotoxicity assay using brown bullhead fish cel line: application to
toxicological surveys of sediments in the Huron-Erie corridor. J. Great Lakes
Res. 19, 342-351.
Aljanabi, S.M., Forget, L. and Dookun, A. (1999). An improved and RAPD
protocol for the isolation of polysaccharide and polyphenol free sugarcauce
DNA. Plant Mol. Biol. Reporter 17, 1-8
Allerberger, F; Dierich, MP; Grundmann, H; Hartung, D; Bannerman, E;
Bille, J. (1997) Typing of australian Listeria monocytogenes isolates by
automated laser fluorescence analysis of randomly amplified polymorphic DNA.
Zentralbl-Bakteriol 286, 33-40
Al-Sabty K. (1991). Handbook of genotoxic effects and fish chromosomes.
September 1991. J. Stefan Institute. Ljubljana, Yugoslavia.

Bibliografía 69
Al-Sabty K. And Metcalfe, C.D. (1995). Fish micronuclei for assessing
genotoxicity in water. Mut. Res. 343, 121-135
Ames, B.N., McCann, J., and Jamasaki, E. (1975) Method for detecting
carcinogens and mutagens with the Salmonella mammalian microsomes
mutagenicity “test”. Mutant. Res. 31, 347-64
Anderson, S. W., Sandisnski, L., Shugart, P., Brussard, M., Depledge, T.,
Ford, J., Hose, J., Steman, W., Suk, Y., Wirgin, W., and Wogan, G. (1994)
Genetic and molecular ecotoxicology : A research framework. Environ. Health
Perspect., 102, 3-8.
Araujo, C.S.A., Marques, S.A.F., Carrondo, M.J.T. and Goncalves L.M.D.
(2000). In vitro response of the brown bullhead catfish (BB) and rainbow trout
(RTG-2) cell lines to Benzo(a)Pyrene. Science of Total Environmental. 247,
127-135
Atienzar, F., Cheung, V., Awadhesh N., Jha, A.N. and Depledge M.H.
(2001) Fitness parameters and DNA effects are sensitive indicators of copper-
induced toxicity in Daphnia magna. Toxicol. Sci. 59, 241-250
Atienzar, F., Conradi, M., Avenden, A., Jha, A., and Depledge, M. (1999).
Qualitative assessment of genotoxicity using RAPD: comparison of genomic
template stability with key fitness parameters in Daphnia magna exposed to
benzo(a)pyrene. Environ. Toxicol. Chem. 18, 2275-2282
Atienzar, F., Evenden, A.J., Jha, A.N., Saava, D. and Depledge M.H.
(2000). Optimized RAPD analysis generates high-quality genomic DNA profiles
at high annealing temperature. Biothechniques, 28, 52-54
Atienzar, F., Condi, B., Donkin, M., Evenden, A.J., Jha, A. N., and
Depledge, M.H., (2000a). Comparison of ultraviolet-induced genotoxicity

Bibliografía 70
deteted by random amplified polimorphic DNA with chlorophill fluorescence an
grow in amarine macroalgae Palmaria palmata. Acuatic Tox. 50, 1-12
Auerbach, C., Robson, J. M., and Carr, J. G. (1947) The chemical
production of mutations. Science. 105:243.
Babich, H. and Borenfreund, E (1991). Cytotoxicity and genotoxicity
assays with cultured fish cells: A review. Toxic. Vitro. 5, 91-100.
Babich, H., Goldstein, S.H., Borenfreund, E., 1990. In vitro cyto- and
genotoxicity of organo-mercurials to cells in culture. Toxicology Letters 50, 143-
149.
Bailey G.S., Taylor M.J. and Selivonchick D.P. (1982). Aflatoxin B1
metabolism and DNA binding in isolated hepatocytes from rainbow trout (Salmo
gairdneri). Carcinogenesis 3, 511-518.
Bardakci, F. and Skibinski, D.O.F. (1994). Application of the RAPD
technique in Tilapia fish, species and subspecies identification. Heredity 73,
117-123
Barker CJ, Rackham BD. (1979) The induction of sister-chromatid
exchanges in cultured fish cells (Ameca splendens) by carcinogenic mutagens.
Mutat Res .68, 381-7.
Bassam , B.J. Caetano-Anolles, G. And Gresshoff, P. M. (1992); DNA
amplification fingerprint of bacteria. Appl. Microbiol. Biotechnol. 38, 70-76
Betti C., and Nigro M. (1996) The comet asay for the evaluation of the
genetic hazard of pollutants in cetaceans-preliminary results on the genotoxic
effects of methyl mercury on the bottle nosed dolphin (Tursiops truncatus)
lymphocytes in vitro. Mar. Pollut. Bull. 32, 545-548.
Bickham, J.W. and Smolen, M. (1994) Somatic and heritable effects of

Bibliografía 71
environmental genotoxins and the emergence of evolutionary toxicology.
Environ. Health Perspect. 102, 25-28
Bickham; J.W., Mazet, J.A., Blake, J., Smolen, M.J., Lou, Y.G. and
Ballachey, B. (1998). Flow cytometric determination of genotoxic effects of
exposure to petroleum in mink and sea otters. Ecotoxicology 7, 191-199.
Bickham, J.W., Sandhu, S.S., Hebert, P. Chikhi, L. and Anthwal, R. (2000)
Effects of chemical contaminants on genetic diversity in natural populations:
Implications for biomonitoring and ecotoxicology. Mut. Res. 463, 33-51
Bielawski J.P. and Pumo D.E. (1997). Ramdomly amplified polymorphic
DNA (RAPD) analysis of Atlantic Coast striped bass. Heredity 78, 32-40
Black, W.C. (1993) PCR with arbitrarily primers: approach with care. Insect
Mol. Biol. 2, 1-6
Botstein D., White, R.L., Skolnick, M. and Davis, R.W. (1980) Construction
of a genetic linkage map in man using restriction fragment length
polymorphisms. Am. J. Hum. Genet. 32, 314-31
Braunbeck, T., Neumüller, D. (1996) The COMET assay in permanent and
primary fish cell cultures - a novel system to detect genotoxicity. In vitro Cell.
Dev. Biol. 32, 61A.
Caetano-Anolles G., Bassam, B.J. and Gresshoff P.M. (1991). DNA
amplification fingerprinting using very short arbitrary oligonucleotide primers.
Biotechnology 9, 553-557
Carrano, A.V., Thompson, L.H., Lindli, P.A. and Minkler, J.L. (1978) Sister
chromatid exchange as an indicator of mutagenesis. Nature 271, 551-3
Castaño, A., Vega, M., Blazquez, T. and Tarazona, J.V. (1994). Biologicas
alternatives to chemical identification for the ecological assessment of industrial

Bibliografía 72
effluents: the RTG-2 cytotoxicity “test”. Env. Tox. and Chemistry., 13, 1607-
1611
Castaño, A., Cantarino, M.J., Castillo, P., Tarazona, J.V., 1996. Correlations
between the RTG-2 cytotoxicity test and in vivo LC50 rainbow trout bioassay.
Chemosphere 32, 2141-2157.
Castano A, Sanchez P, Llorente MT, Carballo M, de la Torre A, Munoz MJ.
(2000) The use of alternative systems for the ecotoxicological screening of
complex mixtures on fish populations.Sci Total Environ. 20, 337-48.
Cheng, S., Chen, Y., Monforte, J.A., Higuchi, R., Houten, B.V. (1995).
Templete integrity is essential from genomic DNA. PCR Methods Appl. 4, 294-
298
Clark, H. and Diamond, L. (1970). Comparative studies on the interaction
of Benzo(a)Pyrene with cells derived from poikilothermic and homeothermic
vertebrates. I. Metabolism of Benzo(a)Pyrene. J. Nat. Cancer Inst. 45, 1005-
1012
Colborn, T., Dumanoski, D., and Myers, P. (1996) Our Stolen Future.
Penguin Book. New York. 306 pp.
Conte, C., Mutti, I., Puglisi, P., Ferrarini, A., Regina, G., Maestri, E., and
Marmiroli, N. (1998). DNA fingerprinting analysis by a PCR based method for
monitoring the genotoxic effects of heavy metals pollution. Chemosphere 37,
2739-2749
Counts, J. L. and Goodman, J. I. (1995). Hypomethylation of DNA: a
possible epigenetic mechanism involved in tumor promotion. Prog. Clin. Biol.
Res. 391, 81-101.

Bibliografía 73
Custer, T. W., Bickham, J. W., Lyne, T. B., Lewis, T. Ruedas, L.A., Custer,
C. M. Melancon, M. J. (1994). Flow-cytometry for monitoring contaminant
exposure in black-crowned night-herous. Arch. Environ. Con. Tox. 27, 176-9.
Custer, T. W., Hines, R. K, Melancon, M.J., Hoffman, D. J., Wickliffe, J.
K.,Bickman, J. W. and Henshel, D. S. (1997). Contaminant concentrations and
biomarker response in great blue heron eggs from 10 colonies in the upper
Mississippi River, USA. Environ. Toxicol. Chem. 16, 260-71
Davin-Regli, A., Abed, Y., Charrel, R.N., Bollet, C. and Micco, P. (1995).
Variations in DNA concentrations significantly affect the reproducibility of RAPD
fingerprint patterns. Res. Microbiol. 146, 561-568
Devaux A., Pesonen M., Monod G.1 (1997). Alkaline comet assay in
rainbow trout hepatocytes. Toxicol. in vitro,11, 71-79.
De Vos D; Lima, Jr; Pirnay, JP; Duinslaeger, l; Revets, H; Vanderkelen, A;
Cornelis, P. (1997) Analysis of epidemic Pseudomonas aeruginosa isolates by
isoelectric focusing of pyoverdine and RAPD-PCR: Modern tools for an
integrated anti-nosocomial infection strategy in burn wound centres. Burns 23,
379-386
Devereaux, T. R.., White, C. M., Sills, R. C., Bucher, J. R., Maronpot, R. R.
and Anderson, M. W. (1994). Low frecuency of H-ras mutations in
hepatocellular adenomas and carcinomas and in hepatoblastomas from B6C3FI
mice exposed to oxazepam in the diet. Carcinogenesis 15, 1083-7
Dunn, B. P. (1991). Carcinogen adducts as an indicator for the public
health risks of consuming carcinogen-exposed fish and shellfish. Environ.
Health. Persp. 90, 111-6
Ellingham TJ, Christensen, A., Maddock, M.B. (1986). In vitro induction of

Bibliografía 74
sister chromatid exchanges and chromosomal aberrations in peripheral
lymphocytes of the oyster toadfish and american eel. Environ. Mutagen 8: 555-
569.
Ellsworth D. L., Rittenhouse, K. D. and Honeycutt, R. L. (1993); Artifactual
variation in randomly amplified polimorphic DNA banding patterns. Biotech., 14,
214-217
Everaarts, J. M., DenBesten, P. J., Hillebrand, M. T. J., Halbrook, R. S.
and Shugart, L. R. (1998). DNA strand breaks, cytochrome p-450 dependent
monooxigenase system activity and levels of chlorinatd biphenyl congeners in
the pyloric caeca of the seastar (Asterias rubens) from the North Sea.
Ecotoxicology 7, 69-79
Fairbairn, D. W., Olive, P. L. and O’Neill, K.L. (1995). The comet assay: A
comprehensive review. Mutat. Res. 339, 37-59.
Fent, K., 2001. Fish cell lines as versatile tools in ecotoxicology:
assessment of cytotoxicity, cytochrome P4501A induction potential and
estrogenic activity of chemicals and environmental samples. Toxicology in Vitro
15, 477-488.
Gordon, D. J., Milner, A. E., Vaughan, A. T. and Chipman, J. K. (1989).
The use of flow cytometriy in the detection of radiation and chemically-induced
cuclear damage in human mononuclear cells. Mutagenesis 4, 35-8.
Grandjean P., Brown SS., Reayey P and Yound D.S. 1994. Biomarkers of
chemical exposure: state of the art. Clinical Chemistry 40, 1360-1362
Grawe, J., Nusse, M. and Adler, L. D. (1997). Quantitative and qualitative
studies of micronucleus induction in mouse erytrocytes using flow cytometry. I.
Measurement of micronucleus induction in peripheral blood polychromatic

Bibliografía 75
erythrocytes by chemicals with known and suspected genotoxicity.
Mutagenesis, 12, 1-8.
Gupta, R. C. (1985). Enhanced sensibility of 32P-Postlabeling analysis of
aromatic carcinogen-DNA adducts. Cancer Res. 45, 5656-62
Gupta, R. C. and Randerath, K. (1988). Analysis of DNA adducts by 32P-
labeling and thin layer chromatography. In E. C. Friedberg and P.C. Hanawalt
(ed) DNA Repair vol 3 399-419. New York Marcel Dekker, Inc
Gupta, R. C., Reddy, M. V. and Randerath, K (1982). 32 P-post-labelling
analysis of non-radioactive aromatic carcinogen-DNA adducts. Carcinogenesis
3, 1081-92
Halbrook, R. S., Kilpatrick, R. L., Bevan, D.R. and Dunn, B. P. (1992). DNA
adducts detected in muskrats by p-32 postlabelling analysis. Environ. Toxicol.
Chem. 11, 1605-13
Harshbarger, M.A. and Clark J.B. (1990) Epizootiology of neoplasm in
bony fish of Noeth America. Sci. Total Envirom., 94, 1-32
Hasspieler BM, Haffner GD, Adeli K. (1996) Influence of DT diaphorase on
quinone-mediated genotoxicity in human and fish cell lines. Mutat Res. 17, 43-
9.
Hoey. B.K., Crowe, K.R. and Jones, V:M: (1996) A phylogenetic analysis
of Pisum based on morphological characters, and allozyme and RAPD markers.
Theor. Appl. Genet 92. 92-100
Jones, N.J. and Parry, J. M. (1992). The detection of DNA adducts, DNA
base changes and chromosome damage for the assessment of exposure to
genotoxic pollutants. Aquatic Toxicol. 22, 323-44.

Bibliografía 76
Jowelt, T., Wajidi, M.F.F., Oxtoby, E. and Wolf, C. R. (1991). Mammalian
genes expressed in Drosophila-Atransgenic model for the study of mechanisms
of chemical mutagenesis and metabolism. EMBO J. 10, 1075-81.
Kanaly, A. K., Bartha, R., Watanabe, K and Harayama, S. (2001).
Enhanced mineralization of benzo(a)Pyrene in the presence of nonaqueous
phase liquids. Environmental Toxicology and Chemistry 3, 498-501
Kelly J.J. and Maddock M.B. (1985). In vitro induction of unscheduled DNA
synthesis by genotoxic carcinogens in the hepatocytes of the oyster toadfish
(Opsanus tau). Archives of Environmental Contamination and Toxicology 14,
555-563.
Kocan, R.M., Landolt, M.L. and Sabo K.M. (1982) Anaphase aberrations: a
measure of genotoxicity in mutagen-treated fish cells. Environ. Mutagen. 4, 181-
189.
Kocan, R.M., Powell, D.B. and Liguori, V.M. (1985). Relationship between
visible and heritable chromosome damage in trout cells and embryos. Mar.
Environ. Res. 17, 320-323.
Kocan R.M., Sabo K.M. and Landolt M.L.. (1985).
Cytotoxicity/Genotoxicity: the application of cell culture techniques to the
measurement of marine sediment pollution. Aquatic Toxicology 6, 165-177.
Kohlpoth, M., Rusche, B. and Nusse, M. (1999). Flow cytometric
measurement of micronuclei inducced in a permanent fish cell line as a
possible screening “test” for the genotoxicity of industrial waste waters.
Mutagenesis 14, 397-402
Kohlpoth, M., Rusche, B. 1997. Kultivierung einer permanenten
Fischzellinie in serum-freien Medium: speziell Erfahrungen mit einen

Bibliografía 77
Zytotoxizitätstest für Abwasserproben. ALTEX 14, 16-20.
Krahn, M., Ylitaro, G., Buzitis, J., Chan, S. And Varasani, U. (1993) Rapid
high performance liquid chromatographic methods that screen for aromatic
compounds in environmental samples. J. Chromatogr. 642, 15-32.
Krane D.E., Sternberg D. C. and Burton G.A. (1998). Randomly amplified
polymorphic DNA profile-based measures of genetic diversity in crayfish
correlated with environmental impacts. Env. Tox. and Chem. 18, 504-508
Kubota, Y. Shimada, A. and Shima, A. (1992). Detection of Gamma ray
induced DNA damages in malformed dominant lethal embryos of the Japonese
medaka (Orycias latipes) using AP-PCR fingerprinting. Mutation Research
283, 263-270
Kubota, Y. Shimada, A. and Shima, A. (1995). DNA alterations detected in
the progeny of paternally irradiated Japonese medaka fish (Orycias latipes).
Proceedings of the National Academy of Sciences of the United States of
America 92, 330-334
Kuchino,Y., Mori, F., Kasai, H. Inoue, H., Iwai, S., Miura, K., Ohtsaka, F.,
and Nishimura S. (1987) Misreading of DNA templates containing 8-
hydroxydeoxyguanosine at the modified base and a adjancent residues. Nature,
327, 77-79
Lamb, T., Bickham, J. W., Lyne, T. B. and Gibbons, J. W. (1995). The
slider turtle as an environmental sentinel – multiple tissue-assays using flow
cytometric analysis. Ecotoxicology 4, 5-13.
Landolt M.L. and Kocan R.M. (1984). Lethal and sublethal effects of
marine sediment extracts on fish cells and chromosomes. Helgolander
Meeresunters 37, 479-491.

Bibliografía 78
Lawyer, F. C., Sttofel, S., Saiki R.K., Chang S.Y., Landre P.A., Abramson
R.D., and Gelfand D.H. (1993).
Lawyer, F. C., Sttofel, S., Saiki R.K., Myambo, K., Drummond, R., and
Gelfand D.H. (1989). Isolation, characterization and expression in E. coli of the
DNA polymerase gene from the extreme Thermophile, Thermus acuaticus. J.
Biol. Chem. 264 6427-6437.
Leblanc G.A. and Bain L. (1997) Chonic toxicity of environmental
contaminants : Sentinels and biomarkers. Environ. Health Perspect., 105, 65-
80.
Liu, S.F., Rappaport, S. M., Rasmussen, J. and Bodell, W. J. (1998)
Detection of styrene oxide DNA adducts by 32P-postlabelling. Carcinogenesis
9, 1401-4.
Lloyd-Jones, G. (1995) 32P-postlabelling a valid biomarker for
environmental assessment. TEN 2, 100-4
Loudon, KW; Coke, AP; Burnie, JP; Shaw, AJ; Oppenheim, BA; Morris,
CQ. (1996) Kitchens as a source of Aspergillus niger infection. Journal of
hospital Infection 32, 191-198
Lynch, M. and Mulligan, B.G. (1994). Analysis of population genetic
structure with RAPD markers. Mol. Ecol. 3, 91-99
MacGregor, J. T., Tucker, J. D., Eastmond D. A. and Wyrobek, A. J.
(1995). Integration of cytogenetic assays with toxicology studies. Environ. Mol.
Mutagen. 25, 328-37.
Malins, D., Polissar, N. Garner, M. and Gunselman, S. (1996) Mutagenic
DNA base modifications are correlated withlesions in nonneoplastic hepatic
tissue of the English sole carcinogenesis model. Cancer Res. 56, 5563-5565

Bibliografía 79
Meunier J.R. and Grimont P.A. (1993) Factors affecting reproducibility of
random amplified polymorphic DNA fingerprinting. Res. Microbiol. 144, 373-379.
Meyers-Schone, L., Shugart, L.R., Beauchamp, J.J. and Walton, B.T.
(1993). Comparison of 2 fresh-water turtle species as monitors of radionuclide
and chemical contamination DNA-damage and residue analysis. Environ.
Toxicol. Chem. 12, 1487-1496.
Mitchelmore, C.L. and Chipman, J.K. (1998) DNA strand breakage in
aquatic organisms and the potential value of the comet assay in environmental
monitoring. Mutat. Res. 399, 135-147.
Miller, S., Dykes, D.D., and Polesky, H.J. (1989). A simple salting out
procedure for extracting DNA from human nucleated cells. Nucleic Acids
Res. 16, 1215.
Muller, H. J. (1997). Artificial transmutation of the gene. Science. 66:84-87
Muller, H., Ziegler, B., and Schweizer, B. (1993). UV-VIS spectrometric
methods for qualitative and quantitative analysis of nucleic acids. Int. Spectrosc.
Lab. 4, 4-11
Muralidharan, K. and Wakeland, E. K. (1993) Concentration of cebador
and template qualitatively affects products in Random amplified polymorphyc
DNA-PCR. BioTechnique., 14, 362-364
Murti, J.R., Schimenti, K.J. and Schimenti, J.C. (1994). A recombination-
based transgenic mouse system for genotoxicity testing. Mutat. Res. 309, 583-
595.
Nacci D.E., Cayula S., Jackim EE.. (1996 Detection of DNA damage in
individual cells from marine organisms using the single cell gel assay. Aquat.
Toxicol, 35: 197-210.

Bibliografía 80
Nehls, S, Segner, H (1998). Anpassung des Comet Assay als in vitro-
Gentoxizitätstest für Wasserproben: Vergleich unterschiedlicher
Fischzellsysteme anhand von Exposition an Einzelsubstanzen. Poster, 3.
deutschsprachige SETAC Europe-Tagung, Zittau, 18.-19.05.
Nehls, S. and Segner, H.(2001). Detection of DNA damage in two cel lines
from rainbow trout , RTG-2 and RTL-W1, using the comet assay. Environ.
Toxicol. 16: 321-329.
Nelson, J.R., Lawrence, C.W., and Hinkle, D.C. (1998) Thymine-thimine
dimmer bypass by yeast DNA polymerase. Sciences 272, 1646-1649.
Nicol, D., Armstrong, K.F., Wratten, S.D., Walsh, N.A., Straw, N.A.,
Cameron, C.M., Lahmann, C. and Frampton, C.M. (1998). Genetic diversity of
an introduced pest the green spruce aphid Elatobium abietinum (Hemiptera:
Aphididae) in New Zealand and the United Kingdom. Bull. Entomol. Res. 88
537-543
Niederhauser, C; Hofelein, C; Allmann, M; Burkhalter, P; Luthy, J;
Candrian, U. (1994) Random amplification of polymorphic DNA: Evaluation of
11 oligonucleotides and application to food contaminated with Listeria
monocytogenes. Journal of Applied Bacteriology 77, 574-582
Nirmal K. R., Stabile, J., Habicht, C. and Wirgin I. (1999) High frequency
of k-ras mutations in pink salmon embryos experimentally exposed to Exxon
valdez oil. Env. Tox. and Chem. 18, 1521–1528.
Olive, P. L., Wlodek, D., Durand, R.E. and Banath, J.P. (1992). Factors
influencing DNA migration from individual cells subjected to gel electrophoresis.
Exp. Cells. Res. 198, 259-66.

Bibliografía 81
Ostling, O. and Johanson, K.J. (1984). Microelectrophoretic study of
radiation-induced DNA damage in individual mammalian cells. Biochem.
Biophys. Res. Comm. 123, 291-298.
Pandrangi R, Petras M, Ralph S, Vrzoc M. (1995) Alkaline single cell gel
(comet) assay and genotoxicity monitoring using bullheads and carp. Environ
Mol Mutagen.;26, 345-56.
Park Eun-Ho, Lee Jae-Seong, Yi Ae-Kyung, and Etoh Hisami. (1989). Fish
cell line (ULF-23HU) derived form the fin of the central mudminnow (Umbra
limi): suitable characteristics for clastogenitcity assay. In vitro cellular and
developmental biology 25, 987-994.
Park , Y. H. and Kohel, R. J., (1994) Effects of concentration of MgCl2 on
RAPD DNA polimorphism. Biotech., 16, 652
Park, J., Shigenaga, M. And Ames, B. (1996) Induction of cytochrome
P4501A1 by 2,3,7,8-tetrachlorodibenzo-p-dioxin or indolo (3,2-b)carbazole is
associated with oxidative DNA damage. Proc Natl Acad Sci USA. 93, 2322-
2327
Peinado, M.A., Malkhosyan, S., Velásquez, A. and Perucho, M. (1992).
Isolation and characterization of allelic and gains in colorectal tumors by
arbitrarily primed polymerase chaín reaction. Proc. Natl. Acad. Sci. USA, 89,
10065-10069.
Penner, G. A., Bush, A., Wise, R., Kim, W., Domier, L.,Kasha, K.,Laroche,
A., Scoles, G., Molnar, S.J. and Fedak, G. (1993); Reproducibility of random
amplified polimorphic DNA (RAPD) analisys among laboratories. PCR methods
Appl. , 2, 341-345
Pfau, W. (1997). DNA adducts in marine and freshwater fish as biomarkers

Bibliografía 82
of environmental contamination. Biomarkers 2, 145-52.
Poirier, M.C. (1984) The use of carcinogen-DNA Adduct antisera for
quantitation and localization of genomic damage in animal models and the
human population. Environ. Mutagen. 6, 879-889
Qu, S. X., Bai, C. L, and Stacey, N. H. (1997). Determination of bulky DNA
adducts in biomonitoring of carcinogenic chemical exposures: Features and
comparison of current techniques. Biomarkers 2, 3-6.
Rachlin, J.W. and Perlmutter, A., 1968. Fish cells in culture for study of
aquatic toxicants. Water Res. 2, 409-414.
Risso-de Faverney C, Devaux A, Lafaurie M, Girard JP, Bailly B, Rahmani
R. (2001) Cadmium induces apoptosis and genotoxicity in rainbow trout
hepatocytes through generation of reactive oxygene species. Aquat Toxicol. 53,
65-76.
Rossiello, M., Rao, P., Rajalakshami, S. and Sarma D.S. (1994). Similar
patterns of hypomethylation in the β-hydroxy-β-methylglutaryl coenzyme A
reductase gene in hepatic nodules induces by different carcinogens. Mol.
Carcinogen. 10, 237-245.
Rothmanier, R; Weidenmann, A; Botzenhart, K. (1997). Transport of
Escherichia coli through soil to groundwater traced by randomly amplified
plymorphic DNA (RAPD). Water Science and Technology 35,, 351-357
Rout, G.R.;P. Das, S. Goel, and S.N. Raina (1998) Determination of
genetic stability of micropropagated plants of ginger using Random Amplified
Polymorphic DNA (RAPD) markers. Bot. Bull. Acad. Sin. 39: 23_27
Ryskova, M., Chroust, K., Tibusek,M., Benedik, J. and Jowett T. (1997)
Genotoxicity of N-nitroso-N-methylurea and acetone axime in the transgenic

Bibliografía 83
Drosophila carrying the human gene encoding a subunit of glutathione-S-
transferase. Folia Biol. 43,19-24
Saava, D. (1996) DNA fingerprint as a biomarker assay in acotoxicology.
Toxicol. Ecotoxicol.News Rev. 3, 110-114
Saava, D. (1998). Use of DNA fingerprinting to detect genotoxic effects.
Ecotoxicol. Environ. Safety 41, 103-106
Saava, D. (2000) The use of arbitrarily primed PCR (AP-PCR)
fingerprinting to detect exposure to genotoxic chemicals. Ecotoxicology, 9, 341-
353.
Saiki, R.K., Gelfand, D.H., Stoffel, S., Scharf, S.J., Higuchi, H., Horn, G.T.,
Mullis, K.B. and Erlich, H.A. (1998). Primer-directed enzymatic amplification of
DNA with a thermostable DNA polymerase. Sciences 239, 487-491.
Sambroock, J., Fritsch, E. F. and Maniatis, T. (1988) Molecular cloning: A
Laboratory Manual. 2nd ed. Cold Spring Harbor Laboratory Press, Cold Spring
Harbor, NY.
Sánchez , P. Llorente M. T., and Castaño A. (2000). Flow cytometric
detection of micronuclei and cell cycle alterations in fish-derived cells after
exposure to three model genotoxic agents: Mitomicyn C, Vincristine sulfate and
Benzo(a)Pyrene. Mutation Research 465, 113-122
Santella, R.M. (1998). Application of new techniques for the detection of
carcinogen adducts to human populationmonitoring. Mutat. Res. 205, 271-282.
Schiliro, E. Predieri, S. and Bertaccini, A. (2001). Use of random amplified
polymorphic DNA analysis to detect genetic variation in Pyrus species. Plant
Mol. Biol. Reporter 19, 271a-h

Bibliografía 84
Schnurstein A, Braunbeck T. Tail moment versus tail length--application of
an in vitro version of the comet assay in biomonitoring for genotoxicity in native
surface waters using primary hepatocytes and gill cells from zebrafish (Danio
rerio). Ecotoxicol Environ Saf. 2001, 187-96.
Schnurstein, A., Froschauer, A., Braunbeck, T. (2001) Detection of in vivo
genotoxicity in zebrafish (Danio rerio) liver and gill cells with the comet assay.
Environ. Mutag., submitted.
Segner, H., 1998. Fish cell lines as a tool in aquatic toxicology. In: T.
Braunbeck, D.E. Hinton and B. Streit. (Eds) Fish Ecotoxicology. Birkäuser Verlag
Basel/Switzerland, pp 1-38.
Selden, J., Dolbeare, F., Clair, J.H., Miller, J.E., McGettigan, K., DiJoohn,
J.A., Dysart, G.R. and DeLuca, J.G. (1994). Validation of a flow cytometric “in
vitro” DNA repair (UDS) assay in rat hepatocytes. Mutat. Res. 315, 147-167.
Shugart L.R. (2000) DNA damage as a biomarker of exposure.
Ecotoxicology, 9, 329-340.
Shugart, L. R (1996b). Application of the alkaline unwindind assay to
detec DNA strand breaks in aquatic species. In G.K. Ostrander (ed) Techniques
in Aquatic Toxicology, pp. 205-18. Boca Raton: CRC
Shugart, L. R (1998). Structural damage to DNA in response to toxican
exposure; In V.E. Forbes (ed) Genetic and Ecotoxicology, pp. 151-68.
Philadelphia: Taylor & Francis Publishers.
Shugart, L. R. (1988). Quantitation of chemically induced damage to DNA
of aquatic organisms by alkaline unwinding assay. Aquatic Toxicol. 13, 43-52.
Singh, N. P., M.T., Tice, R. R. and Schneider, E. L. (1998). A simple
technique for quantitation of low levels of DNA damage in individual cells.

Bibliografía 85
Experimental Cell Res. 175, 184-91.
Smolarek T.A., Morgan S. and Baird W.M. (1988). Temperature induced
alterations in the metabolic activation of benzo(a)pyrene to DNA –binding
metabolites in the bluefill fish cell line, BF-2. Aquatic Toxicology 13, 89-98.
Smolarek T.A., Morgan S. L., Moyniham C.G., Lee h., Harvey R.G. and
Baird W.M. (1987). Metabolism and DNA adduct formation of benzo(a)pyrene
and 7,12-dimethylbenz(a)anthracene in fish cell lines in culture. Carcinogenesis
8, 1501-1509
Smrchek J. and Zimamm M. (1998). Assessing Risk to Ecological Systems
from Chemicals. Handbook of Environmental Risk Assessment and
Management. Ed. Calow P. Blackwell Sciences Oxford pp 24 – 90
Steparova, L.I., Glaser, V., Savinova, T., Kotelevtsev, S.V. and Saava, D.
(1999) Accumulation of mutagenic xenobiotics in fresh water (Lake Baikal) and
marine (Hornoya Island) ecosystems. Ecotoxicology, 8, 83-96
Sugg, D.W., Bickham, J.W., Brooks, J.A., Lomakin, M.D., Jagoe, C.H.,
Dallas, C.E., Smith, M.H., Baker, R.J. and Chesser, R.K. (1996) DNA damage
and radiocesium in channel catfish from Chernobyl. Env. Tox. and Chem. 15,
1057–1063.
Suyama, I. And Etoh, H. (1988). Establishment of a cell line from Umbra
limi (Umbridae, Pisces). In : Kuroda, Y., Kurstak, E. and Maramorosch,K. (Eds)
Invertebrate and fish tissue culture. Springer, New York, pp. 270-273.
Theodorakis, C. W., Bickham, J.W., Lamb, T. Medica, P., and Lyne B.
(2001). Integration of genotoxicity and population genetic analyses in kangaroo
rats (Dipodomys merriami) exposed to radionuclide contamination at the
nevada “test” site, USA. Env. Tox. and Chem. 20, pp. 317–326.

Bibliografía 86
Theodorakis, C.W. and Shugart, L.R. (1997). Genetic ecotoxicology II:
population genetic structure in mosquitofish exposed in situ to radionuclides.
Ecotoxicology 6, 335-354
Theodorakis, C.W., Bickman, J.M., Elbi, T., Shugart, L.R. and Chesser,
R.K. (1998). Genetics of radionuclide-contaminated mosquitofish populations
and homology between Gambusia affinis and G. holbrooki. Environ. Toxicol.
Chem. 17, 1992-1998
Theodorakis, C.W., Bickman, J.M., Elbi, T., Shugart, L.R. and Chesser,
R.K. (1998). Genetics of radionuclide-contaminated mosquitofish populations
and homology between Gambusia affinis and G. holbrooki. Environ. Toxicol.
Chem. 17 1992-1998
Theodorakis, C.W., Elbi, T. And Shugart, L.R. (1994) Detection of genotoxic
insult as DNA strand breaks in fish blood cells by agarose gel electrophoresis.
Environ. Toxicol. Chem. 13, 1023-1031.
Thornton, S. C., Diamond, L. and Baird, W. M. (1982). Metabolism of
Benzo(a)Pyrene by fish cells line in culture. J. Tox. and Env. Health 10, 157
Van Belkum, A. (1994) DNA fingerprinting of medically important
microorganisms by use of PCR. Clin. Microbiol. Rev., 7, 174-184
Walton D.G., Acton A.B. and Stich H.F. (1983). DNA repair synthesis in
cultured mammalian and fish cells following exposures to chemical mutagens.
Mutation Research 124, 153-161.
Walton D.G., Acton A.B. and Stich H.F. (1987). DNA repair synthesis in
cultured fish and human cells exposed to fish S9-activated aromatic
hydrocarbons. Comparative Biochemistry and Physiology 96c, 399-404.

Bibliografía 87
Walton D.G., Acton A.B., Stich H.F.. (1984) DNA repair synthesis following
exposure to chemical mutagens in primary liver, stomach and intestinal cells
isolated from rainbow trout, Cancer Res. 44, 1120-1121.
Walton DG, Acton AB, Stich HF. (1988) Chromosome aberrations in
cultured central mudminnow heart cells and Chinese hamster ovary cells
exposed to polycyclic aromatic hydrocarbons and sediment extracts. Comp
Biochem Physiol C.;89, 395-402.
Walsh P.S., Metzger D.A. and Higuchi R. (1991). Chelex 100 as a medium
for simple extraction of DNA for PCR-based typing forensic material.
Biotechniques 10, 506-513
Weinstein, 1.B. (1978). Current concepts on mechanism of chemical
carcinogenesis. Bull. NY Acad. Med. 54, 336-83.
Weinstein, I. B. (1988). The origins of human cancer: molecular
mechanisms of carcinogenesis and their implications for cancer prevention and
treatment. Cancer Res. 48, 4135 – 4143.
Welsh, J and McClelland. (1990) Fingerprinting genomes using PCR with
arbitrary cebadors. Nucleic Acids. Res. 18, 7213-7218
Welsh, J and McClelland. (1991) Genomic fingerprinting using arbitrarily
primed PCR and a matrix of pairwise combinations of primer. Nucleic Acids
Res., 19, 5275-5279
Welsh, J., Pertersen, C. and McClelland. (1991).Polimorphic generated by
arbitrarily primed PCR in the mouse: application to strain identificationand
genetic mapping. Nucleic Acid. Res. 19, 303-306.
White, J.W., Neuwirth, H., Miller, C.D. and Schneider, E. (1990). DNA
alterations in prostatic adenocarcinoma and benign prostatic hyperplaxia:

Bibliografía 88
detection by DNA fingerprint analysis. Mut. Res. 237, 37-43
White,R. and Stegeman, J. (1996). Inactivation of cytochrome P4501A1 by
3,3,4,4-tetrachlorobiphenyl and the formation of reactive axigen species.
Abstracts, Society of Environmental Toxicology and Chemistry, Washington,
DC, USA.
Williams, J., Kuberlik, A., Livak, K., Rafalski, J. and Tingey, S. (1990). DNA
polymorphisms amplified by arbitrary primers are useful as genetic markers.
Nucleic Acids Res., 18, 6531-6535
Wogan, G. N. and Gorelick, N. J. (1985). Chemical and biochemical
dosimetry to exposure to genotoxic chemicals. Environ. Health Perspec. 62, 5-
18.
Wolf, K. and Quimby, M.C. (1969). Fish cell and tissue culture. Ed. W.S.
Hoar and Randall, Fish Physiology, vol 3 N.Y. Academic Press,
Zakour H.R., Landolt M.L. and Kocan R.M. (1984). Sister chromatid
exchange analysis in cultured peripheral blood leukocytes of the coldwater
marine fish, Pacific staghorn sculpin (Leptocottus armatus): a feasible system
for assessing genotoxic marine pollutants. In Sister Chromatid Exchanges.
Edited by R.R. Tice and A. Hollaender. PP. 493-507. Plenum, New York.

II. ANEXOS

90
ANEXO 1
PROTOCOLO DEL ENSAYO

Protocolo del ensayo 91
PROTOCOLO DEL ENSAYO 1. MATERIAL
1.1. CELULAS
Se utiliza la línea celular certificada RTG-2 CCL55 de la American Type
Culture Collection procedente de tejido gonadal de Oncorhynchus mykiss de
morfología fibroblástica, establecida por Wolf y Quimby en 1962.
1.2. EQUIPOS
- Analizador de imagen.Gelwork 1D (UVP)
- Autoclave. Selecta.
- Baño termostatizado. Selecta
- Bombona de CO2
- Cabina de flujo laminar vertical. Testar.
- Captador de imagen. Grab-it (UVP)
- Centrífuga. Eppendorf
- Congelador a – 40º C
- Cubetas (varios tamaños). Ecogen
- Cubetas de cuarzo. Hellma.
- Espectrofotometro. Perkin-Elmer
- -Estufa incubador a 20º C. Nuaire
- Frascos de PVC para cultivos de células de 75 cm2 . Costar
- Fuente de Alimentación. Apelex

Protocolo del ensayo 92
- Micropipetas de volumen variable (0.5 – 25, 25 – 100 / 100 – 200 / 200 –
1000 µl). Wilson.
- Microscopio invertido. Olimpus.
- Nevera a 4º C. Indesit
- Peines. Ecogen
- Pipetas estériles desechables de 1, 5, 10 ml. Corning.
- Portageles. Ecogen.
- Puntas estériles con filtro de
- Termociclador. Perkin-Elmer modelo 2400.
- Transiluminador. Espectroline.
- Tubos Eppendorf
1.3. REACTIVOS
- 2´-deoxinucleóxidos-5´-trifosfatos (dNTPs). Pharmacia.
- 8-hidroxiquinoleina. Merck.
- Acido acetico. Merck
- Ácido bórico. Serva.
- Ácido Clorhídrico. Merck
- Ácido etilen-diamino-tetra-acetico (EDTA). ICN.
- ARNasa libre de ADNasa. Bohering
- Cl2Mg (25 mM). PERKIN- ELMER
- Cloroformo. Panreac.
- Cloruro magnesico. Perkin-Elmer.
- Cloruro potásico. Merck.

Protocolo del ensayo 93
- Cloruro potásico. Merck.
- Dihidrogeno fosfato de potasio. Merck.
- Dodecil sulfato sodico (SDS). Merck
- Estreptomicina. Flow.
- Fenol. Merck
- Fragmento Stoffel, enzima polimerasa (10 U/µl). PERKIN- ELMER
- Fungizona 250 µg/ml (Amphotericina B). Flow.
- Glucosa. Flow.
- Hidrógeno fosfato de disódio. Merck.
- Hidróxido Sódico. Merck.
- L-Glutamina (200 mM). Flow.
- Mercaptoetanol. Serva.
- Penicilina. Flow.
- Solución buffer 10X (ClK 100 mM, EDTA 0.1 mM, Tris-ClH 20 mM,). PERKIN-
ELMER
- Suero fetal bovino. (SFB) Flow.
- Tripsina. Flow.
- Alcohol etílico. Merck
- Alcohol isoamilico. Quimon.
- Azul de bromofenol. Serva.
- Oligonucleotidos o primers: AA-89 (5´-GGGCCTCTGAT–3´), C-95 (5´-
CGGCCACTGT–3´),C-96 (5´-AGCACTGTCA-3´), D-4 (5´-CTGTAGCATC-3´),
D-8 (5´-CCAAGTCGACA-3´), Trna-1 (5´-AGTCCGGTGTGCTCTA-3).
Pharmacia
- Tris-hidroxi-metil-amino-metano (Tris-base). ICN.

Protocolo del ensayo 94
- Verseno. Flow.
- Xilen-cianol. Bioprove.
- Agarosa.
- Agua milliQ. esteril
- Bromuro de Etídio. Bioprobe.
- Marcador de Peso Molecular (poner los dos)
- Medio Eagle con sales de Earle con aminoácidos no esenciales, penicilina
(200 IU/ml), estrectomicina (100 µg/ml) y 0.85 g/l de bicarbonato sódico
(EMEM). Flow.
1.4. SOLUCIONES QUÍMICAS Y MEDIOS DE CULTIVOS
1.4.1. Utilizados en el mantenimiento de la línea celular.
Medio de cultivo: (medio 1)
EMEM 500 ml
L-Glutamina (200mM) 5 ml
Fungizona 2.5 ml
Suero fetal bovino 50 ml
o Solución tampón fosfato (PBS) (Dulbecco y Vogt, 1954). Se prepara con
agua milliQ y se ajusta pH 7.2
Solución 1.- solución de Tripsina-Verseno
ClNa 16 g., ClK 0.8 g., PO4HNa2-12H2O 0.24 g., PO4H2K 0.12 g.,
Glucosa 2.2., Rojo Fenol 0.02 g., Tripsina 2.5 g., Verseno 0.275 g.,

Protocolo del ensayo 95
CO3HNa 1.4 g., Penicilina 200.000 U. Colimicina 400.000 U.
Estreptomicina 0.160 g.
Se enrasa a 1000 ml con agua milliQ. Una vez preparada se esteriliza
por filtración, se hacen alícuotas y se congela hasta su uso a –20º C.
1.4.2. Utilizados en la extracción de ADN.
Solución 2.- solución buffer Tris-base 1 M.
Tris-base 48,44 g
Agua milliQ. 400 ml
Solución 3.- solución buffer Tris-ClH 1M
Tris-base 12,11 g
ClH 4.2 ml
Agua milliQ. 100 ml
Una vez preparada ajustar a pH 8 con ClH y autoclavar. Almacenar a
temperatura ambiente.
Solución 4.- solución buffer Tris-ClH 0.1M.
A partir de la solución 3 efectuar una dilución 1:10 utilizando agua milliQ.
Solución 5.- solución Tris-EDTA (TE).
Tris-base 0.0302 g
EDTA 0.93 g
Agua milliQ. Hasta 25 ml

Protocolo del ensayo 96
Ajustar el pH a 8 con NaOH. Autoclavar y guardar a temperatura
ambiente.
Solución 6.- solución buffer de extracción (EB).
Tris- base 0.6056 g
EDTA 0.9304 g
ClNa 1.45 g
Agua milliQ. Hasta 50 ml
Ajustar a pH 8. Autoclavar y guardar a temperatura ambiente.
Solución 7.- solución de acetato potásico 5 M.
Ajustar el pH a 7.5 con ácido acético. Autoclavar y almacenar a –20º C
en alícuotas de aproximadamente 1.5 ml. Una vez descongeladas no
volver a congelar.
Solución 8.- solución de fenol estabilizado con Tris-ClH.
a) Fundir el fenol en un baño a 68º C.
b) Añadir 8-hidroxiquinoleina a una concentración final de 0.1%
c) Estabilización con solución 2, para ello:
• Añadir un volumen de solución 2 (sin ajustar pH).
• Agitar 30´ y dejar en reposo durante 10´
• Añadir unas gotas de ClH y dejar en reposo durante 10´
• Desechar la fase acuosa.
d) Repetir si es necesario el paso c) hasta que el pH de la fase orgánica
sea aproximadamente de 7.

Protocolo del ensayo 97
e) Estabilización con solución 4.
• Lo mismo que el paso c) pero con la solución 4.
f) Repetir el paso 5 hasta que el pH de la fase orgánica sea 7.8.
g) Añadir a la fase orgánica:
• 0.1 volumen de solución 4.
• 0,2% mercaptoetanol
Almacenar en refrigeración a 4º C en oscuridad.
Solución 9.- solución de extracción.
Solución 8. 25 ml
Cloroformo 24 ml
Alcohol isoamilico 1 ml
Mezclar los reactivos en agitador magnético y dejar en reposo toda la
noche. Almacenar a 4ºC en oscuridad.
Solución 10.- solución de ARNasa.
ARNasa 20 mg
Tris-ClH, 10 mM, pH 7.5 2 ml
ClNa 0.0017 g
Una vez añadidos todos los componentes calentar a 100º C durante 15´
y dejar enfriar lentamente a temperatura ambiente. Hacer alícuotas de
0.5 ml y almacenar a –20º C.

Protocolo del ensayo 98
Solución 11.- solución de SDS al 10%.
SDS 1,5 g
Agua milliQ Hasta 15 ml
Una vez preparada, ajustar el pH a 7.2 con ClH. Es conveniente hacer
alícuotas de aproximadamente 3 ml.
1.4.3. Soluciones para la reacción de RAPD.
Solución 12.- solución de dNTPs.
A partir del reactivo comercial 0.1 M. Añadir 5.5 µl de cada nucleotido
(dATP, dTTP, dGTP, dCTP y llevar a 220 ml con agua milliQ. Guardar a
–20º C
Solución 13.- soluciones individualizadas de cada uno de los primers.
Ajustar cada uno de los primer con agua milliQ. a una concentración final
de 5 pM / µl. Realizar alícuotas de 200 µl y guardar a –20º C
1.4.4. Soluciones para electroforesis.
Solución 14.- solución de Buffer Tris-borato-EDTA (TBE) 5X.
Tris-Base 54 g.
Acido borico 27.5 g.
EDTA 3.7223 g.

Protocolo del ensayo 99
Agua milliQ. Hasta 1 L
Una vez preparado ajustar a pH 8.
Tras largos periodos de tiempo pueden aparecer precipitados en cuyo
caso es conveniente desechar la solución
Solución 15: solución de Buffer Tris-borato-EDTA (TBE) 0.5X
A partir de esta solución 13 realizar una dilución 1:10 con agua milliQ.
Solución 16.- solución de buffer de carga.
Xilen-cianol 0.025 g.
Azul de bromofenol 0.025 g.
Glicerina 3 g.
Agua milliQ. Hasta 10 ml.
Realizar alícuotas de 1.5 ml y conservar a 4º C.
Los colorantes migran en el campo magnético de la siguiente forma:
Azul de bromofenol: 300 pares de bases. Xilen-Cianol: 3000 pares de
bases.
Solución 17.- solución de bromuro de etídio.
Bromuro de Etídio 0.1 g.
Agua milliQ. Hasta 10 ml.
Conservar a 4º C en oscuridad.

Protocolo del ensayo 100
2. METODOS.
2.1. CULTIVO DE CELULAS.
La línea celular RTG-2 es una línea establecida de naturaleza fibroblastica
que crece adherida al sustrato formando un tapiz en monocapa celular.
Todo el manejo, crecimiento, renovación del medio y subcultivos se
realizan en condiciones de esterilidad en cabina de flujo laminar y en
condiciones de esterilidad.
Se hacen crecer las células en frascos de PVC de 75 cm2 de superficie,
con medio EMEM con sales de Eagle, antibióticos, glutamina, 10% de suero
fetal bovino (Medio1).
Para proceder a la extracción de ADN se elimina el medio y se desorganiza
el tapiz celular poniéndolo en contacto con la solución 1. De esta forma se
obtiene una suspensión celular.
2.2. PROCEDIMIENTO DE EXTRACCIÓN DE ADN.
A partir de células RTG-2:
La suspensión celular obtenida, se recoge en un tubo eppendof esteril y
se centrifuga a 3000 rpm, durante 10´. Retirar el sobrenadante y añadir un

Protocolo del ensayo 101
volumen aproximado de 1 ml de PBS repitiendo de nuevo la centrifugación.
Retirar el sobrenadante.
A partir de células sanguíneas:
Añadir 1 ml de PBS a 100 µl de sangre heparinizada, centrifugar a 1500
rpm durante 10´ Retirar el sobrenadante y repetir el proceso hasta conseguir un
precipitado limpio.
En precipitado obtenido a partir de células RTG-2 o células sanguíneas
se procede como sigue:
a) Añadir al precipitado un volumen de 500 µl de la solución 6.
b) Añadir 35 µl de la solución 11 y calentar en baño a 65º C durante 15´
c) Añadir 165 µl de la solución 7, agitar y dejar reposar a 4º C durante 10´.
d) Centrifugar a 13000 rpm durante 10´ a 4º C.
e) Traspasar el sobrenadante a un nuevo tubo eppendorf y desechar el
precipitado.
Eliminación del RNA y digestión de proteínas.
f) Añadir 20 µg de solución 10 e incubar a 37º C durante 1 h.
g) Añadir una punta de espátula de proteinasa K, agitar e incubar en
estufa a 37º C, durante una noche.
Purificación del ADN.

Protocolo del ensayo 102
h) Añadir 500 µl de la solución 9, centrífugar a 13000 rpm durante 3`a 4º
C.
i) Recoger la fase acuosa en un nuevo tubo eppendorf y repetir el proceso
hasta que la interfase esté limpia.
j) Recoger la fase acuosa y añadir 500 µl de cloroformo y centrifugar a
13000 rpm, 3`, 4º C
Precipitación del ADN
k) Recoger la fase acuosa y añadir 500 µl de isopropanol, centrifugar a
13000 rpm durante 10’.
l) Eliminar el sobrenadante y el precipitado de ADN lavarlo dos veces. La
primera con Etanol 100% y tras centrifugar a 13000 rpm 10´ se repite el
procedimiento lavando con etanol al 70%.
m) Secar el precipitado y resuspenderlo en agua destilada estéril. Guardar
en nevera a 4º C hasta su cuantificación.
2.3. DETERMINACIÓN DE LA CONCENTRACIÓN Y PUREZA DEL ADN
PRESENTE EN EL EXTRACTO.
Ambas se determinan espectrofotometricamente de la siguiente forma:
a) Añadir en una cubeta de cuarzo, 200 µl del extracto anteriormente
obtenido y realizar en el espectrofotometro tres lecturas a 260,
280, 320 nm.
b) La pureza del ADN extraído se calcula mediante la relación
260/280 una vez que a ambas lecturas se les ha sustraído el valor

Protocolo del ensayo 103
obtenido a 320 nm. Se considera una pureza adecuada cuando
dicha relación esta próxima a 2.
c) La concentración de ADN se obtiene mediante la lectura a 260 nm
una vez sustraído el valor a 320 nm (50 mg/ml equivale a 1 unidad
de absorbancia).
2.4. REACCION DE RAPD
2.4.1. Componentes de la reacción.
La reacción se realiza en tubos PCR de pared fina. El volumen final de la
reacción es de 25 µl .
Añadir los siguientes reactivos en el tubos de reacción:
Reactivos Volumen Concentración final
• Solución buffer 10 X
- Tris-ClH
- KCl
2,5 µl 10 mM 50 mM
• Cl2Mg 4 µl 4 mM
• Solución 12
(dNTPs)
2 µl 0.2 mM de cada dNTPs
• Solución 13 (primer) 0.8 µl 4 pM
• Enzima 0.2 µl 2 U
• ADN molde 5 ng 5 ng / 25 µl
• Agua esteril milliQ Hasta 25 µl
Uno de los tubos se tomara como blanco añadiendo todos los reactivos
excepto el ADN molde.

Protocolo del ensayo 104
Tapar cuidadosamente los tubos PCR e introducirlos en el termociclador.
previamente programado.
2.4.2. Ciclo de temperaturas.
El ciclo de temperatura establecido es el siguiente:
Inicialmente 92º C durante 3´ seguido de cuarenta y cinco ciclos programados
de la siguiente forma:
Desnaturalización: 92º C durante 25 seg.
Hibridación: 36º C durante 1 min. 15 seg.
Elongación: 72º C durante 6 min.
Posteriormente se mantiene 5 ciclos mas con un periodo de elongación
de 7 min, finalmente esta se mantiene durante otros 7 min,
3´25´´
92ºC
25´´
92ºC
6´
72ºC36ºC
7´
92ºC
7´
36ºC
1,15´
72ºC 72ºC
4ºC
45 ciclos 5 ciclos
1,15´
Una vez finalizados los ciclos de temperaturas programados, los tubos
de PCR se mantienen a 4º C hasta que se realiza la electroforesis.
2.5. ELECTROFORESIS

Protocolo del ensayo 105
2.5.1. Comprobación de la Integridad del ADN presente en los extractos.
a) Pesar una cantidad determinada de agarosa de tal forma que la
concentración final sea del 0.8 % en solución 15 y añadir 7 µl de la
solución 17.
b) Calentar la agarosa hasta que adquiera transparencia.
c) Enfriar ligeramente bajo el grifo y verter el contenido en el portageles
con el peine incorporado.
d) Dejar polimerizar completamente la solución de agarosa.
e) Añadir 500 ng de ADN, 5 µl de marcador de peso molecular (Fago
Lamda) y solución 16 en diferentes pocillos.
f) Sumergir el portageles en la cubeta que previamente se ha llenado
con la solución 15 y conectar los electrodos en los extremos de la
cubeta y regular la fuente de alimentación en 110 V
g) Dejar que el ADN migre al polo negativo durante media hora.
h) Comprobar el estado del ADN por comparación con el marcador de
peso molecular.
2.5.2. Visualización de los Fragmentos Amplificados.
a) La visualización se realiza mediante electroforesis horizontal en geles
de agarosa.
b) Pesar una cantidad determinada de agarosa (en función del tamaño
del portagel donde se vaya a realizar la electroforesis) de tal forma

Protocolo del ensayo 106
que la concentración final sea del 2.1% y proceder como en los
apartados 1 a 4 del punto anterior.
c) Retirar el peine una vez polimerizada la agarosa y cargar en cada
uno de los pocillos un volumen de 22 µl de la reacción de RAPD.
d) Dejar al menos 3 o 4 pocillos sin cargar volumen de reacción. En uno
o dos de ellos añadir 2 µl de marcador de peso molecular, otro se
utilizara como blanco (añadiendo igual volumen 22 µl que en las
muestras) y en otro 3 µl de solución 16.
e) Proceder como en el apartado 6 anterior.
f) Dejar que los fragmentos de ADN migren hacia el polo positivo
durante 4 h.
g) Pasado ese tiempo sacar la cubeta y colocar el gel en un
trasiluminador. Grabar la imagen y analizar posteriormente el gel.
2.6. PROCEDIMIENTO DE ANÁLISIS.
a) Efectuar, al menos, dos extracciones diferentes de ADN en cada
muestra a analizar.
b) Amplificar por duplicado y en diferentes días, cada uno de los
extractos obtenidos.
c) Dentro de un mismo gel correr conjuntamente controles y expuestos,
al menos de 3 a 4 reacciones de cada uno de ellos, junto con un
marcador de peso molecular y una reacción amplificada sin ADN
molde y considerada como blanco.

Protocolo del ensayo 107
d) Para evitar la subjetividad del analista y una vez capturada la imagen
por ordenador, analizar los perfiles fluorimetricos de cada uno de los
gel mediante un software especifico, de forma cualitativa (ausencia o
presencia de bandas) o de forma cuantitativa mediante parámetros
específicos, tal como el porcentaje de amplificación.

ANEXO 2
PUBLICACIONES

108
ANEXO 2.1
CHARACTERIZATION OF RTG-2 FISH CELL LINE BY RANDOM AMPLIFIED
POLYMORPHIC DNA. (1998)
ECOTOXICOLOGY AND ENVIRONMENTAL SAFETY. 40, 56-64
Páginas 109 a 119
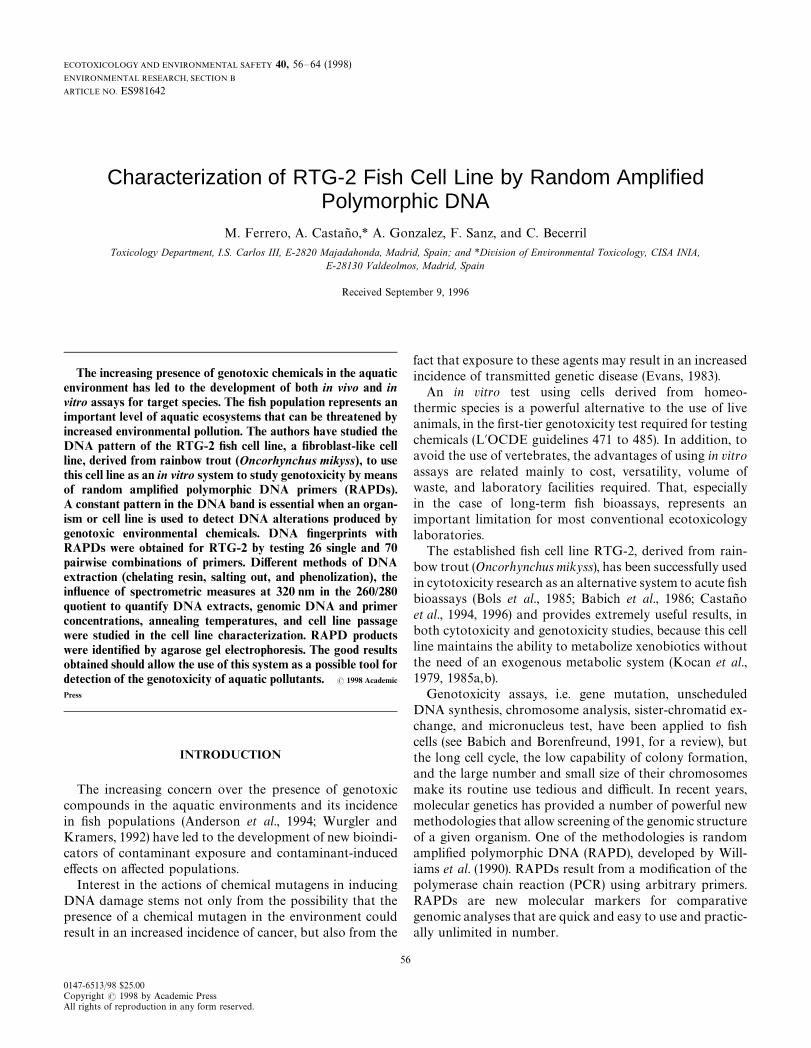
ECOTOXICOLOGY AND ENVIRONMENTAL SAFETY 40, 56—64 (1998)ENVIRONMENTAL RESEARCH, SECTION B
ARTICLE NO. ES981642
Characterization of RTG-2 Fish Cell Line by Random AmplifiedPolymorphic DNA
M. Ferrero, A. Castan8 o,* A. Gonzalez, F. Sanz, and C. Becerril
Toxicology Department, I.S. Carlos III, E-2820 Majadahonda, Madrid, Spain; and *Division of Environmental Toxicology, CISA INIA,E-28130 Valdeolmos, Madrid, Spain
Received September 9, 1996
The increasing presence of genotoxic chemicals in the aquaticenvironment has led to the development of both in vivo and invitro assays for target species. The fish population represents animportant level of aquatic ecosystems that can be threatened byincreased environmental pollution. The authors have studied theDNA pattern of the RTG-2 fish cell line, a fibroblast-like cellline, derived from rainbow trout (Oncorhynchus mikyss), to usethis cell line as an in vitro system to study genotoxicity by meansof random amplified polymorphic DNA primers (RAPDs).A constant pattern in the DNA band is essential when an organ-ism or cell line is used to detect DNA alterations produced bygenotoxic environmental chemicals. DNA fingerprints withRAPDs were obtained for RTG-2 by testing 26 single and 70pairwise combinations of primers. Different methods of DNAextraction (chelating resin, salting out, and phenolization), theinfluence of spectrometric measures at 320 nm in the 260/280quotient to quantify DNA extracts, genomic DNA and primerconcentrations, annealing temperatures, and cell line passagewere studied in the cell line characterization. RAPD productswere identified by agarose gel electrophoresis. The good resultsobtained should allow the use of this system as a possible tool fordetection of the genotoxicity of aquatic pollutants. ( 1998 Academic
Press
INTRODUCTION
The increasing concern over the presence of genotoxiccompounds in the aquatic environments and its incidencein fish populations (Anderson et al., 1994; Wurgler andKramers, 1992) have led to the development of new bioindi-cators of contaminant exposure and contaminant-inducedeffects on affected populations.
Interest in the actions of chemical mutagens in inducingDNA damage stems not only from the possibility that thepresence of a chemical mutagen in the environment couldresult in an increased incidence of cancer, but also from the
56
0147-6513/98 $25.00Copyright ( 1998 by Academic PressAll rights of reproduction in any form reserved.
fact that exposure to these agents may result in an increasedincidence of transmitted genetic disease (Evans, 1983).
An in vitro test using cells derived from homeo-thermic species is a powerful alternative to the use of liveanimals, in the first-tier genotoxicity test required for testingchemicals (L@OCDE guidelines 471 to 485). In addition, toavoid the use of vertebrates, the advantages of using in vitroassays are related mainly to cost, versatility, volume ofwaste, and laboratory facilities required. That, especiallyin the case of long-term fish bioassays, represents animportant limitation for most conventional ecotoxicologylaboratories.
The established fish cell line RTG-2, derived from rain-bow trout (Oncorhynchus mikyss), has been successfully usedin cytotoxicity research as an alternative system to acute fishbioassays (Bols et al., 1985; Babich et al., 1986; Castan8 oet al., 1994, 1996) and provides extremely useful results, inboth cytotoxicity and genotoxicity studies, because this cellline maintains the ability to metabolize xenobiotics withoutthe need of an exogenous metabolic system (Kocan et al.,1979, 1985a,b).
Genotoxicity assays, i.e. gene mutation, unscheduledDNA synthesis, chromosome analysis, sister-chromatid ex-change, and micronucleus test, have been applied to fishcells (see Babich and Borenfreund, 1991, for a review), butthe long cell cycle, the low capability of colony formation,and the large number and small size of their chromosomesmake its routine use tedious and difficult. In recent years,molecular genetics has provided a number of powerful newmethodologies that allow screening of the genomic structureof a given organism. One of the methodologies is randomamplified polymorphic DNA (RAPD), developed by Will-iams et al. (1990). RAPDs result from a modification of thepolymerase chain reaction (PCR) using arbitrary primers.RAPDs are new molecular markers for comparativegenomic analyses that are quick and easy to use and practic-ally unlimited in number.

RTG-2 CHARACTERIZATION WITH RAPDs 57
Because of their great simplicity, RAPDs have been foundto be a powerful tool in the genomic map construction ofdifferent species (Ye et al., 1996; Faure et al., 1993), microor-ganism identification (Cocconcelli et al., 1995), taxonomicalstudies (Castiglione et al., 1993; Hu and Quiros, 1991),population studies (Welsh et al., 1991), and, recently, muta-tion detection (Kubota et al., 1995).
A consistent band pattern or fingerprint is essential and isthe first step in the detection of genome alterations causedby environmental mutagens. These possible alterations canbe expressed as a gain and/or loss of bands and variations inband intensit intensity (Kubota et al., 1995).
Extraction conditions, accurate quantification of theDNA template, concentrations and sequences of primers,annealing temperature, and stability of the cell line arefactors that should be studied and defined, to obtain a re-liable band pattern.
This paper presents the results of the study of thesefactors and the final protocol used to obtain a stable andspecific fingerprint for the RTG-2 cell line. This band pat-tern allows exploration of the use of RAPDs in the detectionof DNA alterations in environmental genotoxicology.
MATERIALS AND METHODS
RTG-2 cells (American Type Culture Collection, CCL 55)an established fibroblastic cell line derived from rainbowtrout (O. mykiss), were grown in Eagle’s minimum essentialmedium with Earle’s salts (EMEM), supplemented with10% fetal bovine serum, 100 U/ml penicillin, 100 lg/mlstreptomycin, 1.25 lg/ml fungizone, and 2 mM L-glutamine,in PVC tissue culture flacks (Costar) and incubated at20$1°C in a 5% CO
2/air atmosphere. Different line pas-
sages (100—135) were used.Epithelioma papulosum cyprini (EPC) cells, an estab-
lished epithelial cell line (Fijan et al., 1983) derived fromcarp (Cyprinus carpio), were grown in EMEM supplementedwith 10% fetal bovine serum, 100 U/ml penicillin, 100 lg/mlstreptomycin, 1.25 lg/ml fungizone, and L-glutamine 2 mM,in PVC tissue culture flacks (Costar), and incubated at20$1°C in a 5% CO
2/air atmosphere.
CHO-K1 cells (American Type Culture Collection, CCL61), an established fibroblastic cell line derived from Chinesehamster ovary, were grown in Hams’s F-12 medium supple-mented with 10% fetal bovine serum and 10 lg/ml gen-tamicin, in PVC tissue culture flacks (Costar), and incubatedat 37$1°C in a 5% CO
2/air atmosphere.
Extraction Methods
The study of the extraction methods was carried out in six75-cm2 PVC flasks (Costar). Cells were dissociated withtrypsin—EDTA (Flow, Scotland), collected in phosphate-
buffered saline solution (PBS), divided into three aliquots,and centrifuged at 3000 rpm for 10 min.
Three different methods were used to isolate genomicDNA from the cell pellet: phenol extraction, high-salt pre-cipitation, and boiling in the presence of a chelating resin.
Method I: Phenol extraction. DNA was isolated follow-ing a modification of the procedure of Sambrook et al.(1989).
About 2]106 cells were pelleted and then diluted in0.5 ml of extraction buffer: 100 mM Tris—HCl, pH 8.0,50 mM EDTA pH 8.0, 500 mM NaCl with 0.5% SDS(Dellaporta et al., 1983), and incubated at 65°C in a waterbath for approx 15 min. To purify DNA, 165 ll 5 M potas-sium acetate was added and the mixture centrifuged at12,000 rpm for 10 min; the supernatant was transferred toan Eppendorf tube and incubated with proteinase K andRNAse (Boehringer-Mannheim, Germany) at 37°C over-night. Digested proteins were extracted with Tris-bufferedphenol, and the DNA (aqueous phase) was precipitated withisopropanol and then with 70% ethanol. DNA was dilutedwith sterile distilled water and its concentration estimatedat 260 nm. Additional measures at 280 and 320 nm wereperformed.
Method II: Salting out. The procedure of DNA extrac-tion and purification is the same as described for method I,but the extraction buffer used is 10 mM Tris—HCl and 2 mMNa
2EDTA, pH 8.2 (Miller et al., 1988). Phenol : chloroform
extraction was replaced by high-salt precipitation of pro-teins with saturated NaCl (Cheng et al., 1995).
Method III: Chelating agent extraction. DNA was extrac-ted using the Chelex chelating resin described by Walsh etal. (1991).
About 25,000 cells were pelleted at 3000 rpm for 4 min.The cell clamp was diluted with 0.45 ml of sterile distilledwater, and 0.15 ml of 20% Chelex solution was added. Afterincubating at 56°C for 15 min, the suspension was vortexedand boiled for 2 min in a water bath. After a 10-min centrifu-gation at 12,000 rpm, the supernatant was transferred toa microcentrifuge tube, ready to be used for PCR amplifica-tion.
The sizes and integrity of the DNA fragments obtained ineach extraction procedure were evaluated in 0.8% agarosegel electrophoresis.
DNA Amplification
Twenty-six primers ranging in size from 10 to 15 bases,with variable nucleotide proportion (G#C content), weredesigned, avoiding possible secondary structure formation.The purified oligonucleotides were supplied by thebiopolymer department of CNBCR (I.S. Carlos III,

FIG. 1. Comparison of DNA concentrations of different genomic preparations with and without OD320
correction.
58 FERRERO ET AL.
Majadahonda, Madrid). These 26 single primers and 70pairwise combinations were tested for RAPDs.
Amplification was performed in 25-ll reaction volumescontaining 10 mM Tris—HCl (pH 8.3), 50 mM KCl, 4 mMMgCl
2, 0.2 mM of each dNTP (Pharmacia Biotech,
Barcelona, Spain), and 2 U of Stoffel fragment (Perkin—El-mer). DNA template and primers were added at differentconcentrations ranging from 1 to 100 ng for DNA and from1 to 8.5 pg for primers.
FIG. 2. Comparison of OD260
/OD280
ratio values of ge
The RAPD protocol consisted of an initial denaturingstep of 3 min at 92°C, followed by 45 cycles at 92°C for 25 s(denaturation), 36 or 39°C for 75 s (annealing), and 72°C for6 min (extension). Five additional cycles were programmedat 92°C for 20 s, 36°C for 75 s, and 72°C for 7 min. Cyclingwas concluded with a final extension at 72°C for 7 min.The thermal cycler used was Perkin—Elmer Model 2400.All amplifications were done in duplicate and on differentdays.
nomic preparations with and without OD320
correction.

TABLE 1OD260/OD280 Index Values in Extraction Comparative Assays
Extraction
Sample Phenol : chloroform Salting out Chelex
1 1.68 1.73 3.212 1.83 1.8 3.443 1.8 1.86 3.174 1.83 1.82 3.235 1.86 1.9 3.766 1.73 1.82 3.07
Mean 1.79 1.82 3.31
FIG. 3. Comparison of genomic DNA extracts. Aliquots of the samecell suspension were extracted by three different methods: phenol : chloro-form (lane 1), salting out (lane 2), and Chelex resin (lane 3). Equal charges(approximately 1500 ng) of DNA from the three preparations were run on0.8% agarose gel and stained with ethidium bromide. In all the three cases,genomic bands showed similar molecular weights (above 23.13 kb), al-though different fluorescene intensities were obtained. M, molecular weightmarker.
RTG-2 CHARACTERIZATION WITH RAPDs 59
Amplification products were separated electrophoreti-cally in a 2.3% agarose gel using Tris—borate—EDTA (TBE)buffer system for 1 h at 115 V. Fractionated bands weredetected by ethidium bromide fluorescence under UV lightand photographed with a DS-34 Polaroid camera.
RESULTS AND DISCUSSION
The suitability of the extraction methods was evaluated onthe basis of the extract purity, the integrity and efficiency ofthe genome amplification, and the yield obtained with each.
Concentration and purity of the DNA extract are usuallymeasured at OD
260and by the 260 nm/280 nm absorbance
ratio, but nonspecific background absorbance often dis-turbs these measurements (Muller et al., 1993). An addi-tional reading at 320 nm was performed to correct it.Figures 1 and 2 illustrate the influence of the 320 nm correc-tion in the estimations of the DNA concentration and DNApurity of a set of 18 extracts.
While, in general, the values with and without the correc-tion at 320 nm are very similar, exceptions exist that justify
TABLE 2DNA Yield in Extraction Comparative Assays
Extraction
Sample Phenol : chloroform Salting out Chelex
1 0.001872 0.00361 0.16192 0.001042 0.00385 0.14883 0.000831 0.00247 0.16484 0.000551 0.00065 0.23755 0.000836 0.00058 0.19566 0.000404 0.00063 0.2637
Mean 0.000921 0.00196 0.1954
Note. Results are expressed as ng of DNA per cell.
its use (extracts 2, 3, and 5). These extracts, looking at the260/280 ratio, would have been rejected without theOD
320nm correction. Although these cases represent just
a small percentage of the total, the systematic correction atOD
320measurement is recommended also to avoid DNA
overestimation (Fig. 1), especially in the RAPD technique,where a great deal of precision is required because of thesmall amounts (15—2 ng) of DNA used.
The results of the purity grade (260/280 ratio after 320correction) obtained for each extraction method are given inTable 1. Chelex extractions gave indexes above 3, whereasthe values obtained with salting out and phenol : chloroform(1.68—2) indicated an acceptable grade of purity. In contrast,the yield obtained (0.1954 ng DNA/cell) using Chelex was
TABLE 3Primer Sequences Selected
Primer identification Sequence Length (bp)
D-4 5@-CTGTAGCATC-3@ 10D-8 5@-CCAAGTCGACA-3@ 11C-95 5@-CGGCCACTGT-3@ 10C-96 5@-AGCACTGTCA-3@ 10TRNA-1 5@-AGTCCGGTGCTCTA-3@ 14ALU-2 5@-GACCCGCACC-3@ 10

FIG. 4. Comparison of purified. DNA efficiency in RAPD reaction. DNA templates obtained from the three extraction procedures were amplifiedwith T-1 (1), D-8 (2), C-95 (3), and C-96 (4) primers. P, S, and C lanes correspond to phenol : chloroform, salting out, and Chelex extraction procedures,respectively. Chelex extracts gave patterns inconsistent with those obtained by the other two methods. M, molecular weight marker.
60 FERRERO ET AL.
about 200% higher than the yields of the other two methods(Table 2). Salting out and phenol: chloroform methods gavesimilar results.
The integrity of the genomic DNA extracted by eachprocedure from the same charged amount of DNA is illus-trated in Fig. 3. The electrophoresis indicates that the sizesof the genomes obtained by the three methods are similar,but the fluorescence intensity of the Chelex extract is con-siderably lower than those of the other two extracts. Thereare no differences in fluorescence intensity between thesalting out and phenol : chloroform methods.
The effectiveness of the different methods was evaluatedby studying the amplification of each of the genomic ex-tracts. The band patterns obtained with phenol : chloroformand salting out (Fig. 4) are the same and highly reproduciblein all cases, in contrast with the band pattern obtained withChelex.
The presence of RNA as an impurity in Chelex extractswould justify the results obtained: values above 2 in theOD
260/OD
280index and erroneous calculation of the DNA
concentration. A lack of precision in genome quantifica-tion, caused by the undetected presence of RNA in the

RTG-2 CHARACTERIZATION WITH RAPDs 61
electrophoresis or partial destruction of the same, couldhave led to the nonrepeated results with the same and/orwith different extracts.
The use of Chelex resin in PCR studies gives good resultsbecause the aim of the study is the amplification of a precisesequence (Walsh et al., 1991). However, in the scanning ofa complete genomic DNA pool (RAPDs technique), thisextraction method is not recommended.
Band Pattern
The selection of the primers to obtain a specific and stableband pattern, as well as the amplification conditions, de-pends on the number of bands obtained with each and theirintra- and intergenomic repeatebility.
An annealing temperature of 36°C gives better results than39°C for most of primers tested. Although amplificationsamples can be obtained in a wide range of DNA and primer
FIG. 5. Fingerprint obtained for RTG-2 cell line. RAPD pattern generatstable for a set of different RTG-2 genomic extracts. M, molecular weight m
concentrations, each oligonucleotide provides an optimumvalue depending on the number of bands obtained. Forexample, using D-4, which provides only one band, the bestamplification is obtained with 2 ng of genome and 2 pmol ofprimer. With respect to the best general conditions for theprimers that give better results (large and constant numberof bands), an annealing temperature of 36°C, 15 ng of DNA,and 5.0 pmol of primer were chosen.
Amplifications with single primers gave better resultsthan the binary combinations tested, in some cases becauseof the failure of amplification, lack of intergenomic repro-ducibility, appearance of bands with the same molecularweight as the single primers, or polymerization of the ampli-fied products.
Of the 26 single primers tested, only 6 gave reproducibleresults. The primers selected for the band pattern wereoligonucleotides from 10 to 14 bases (Table 3), which gener-ated a number of bands above 40, from 300 to 1500 bp in size.
ed by the chosen primers A-2, D-8, C-95, C-96, D-4, and T-1 proved to bearker.

FIG. 6. Effect of DNA template integrity on the reproducibility of the pattern. (a) The D-8-specific DNA profile shown in F is not reproduced bygenomes A, B, C, and D. (b) The same amounts of genomic extracts that failed to give the amplification pattern expected were loaded in 0.8% agarose gelto check their integrity. No discrete genomic band was visualized by C, D, and A, and a loss in fluorescence intensity is observed in B when compared withgenomic extract F. M, molecular weight marker.
62 FERRERO ET AL.
Under the selected conditions the fingerprint obtainedwas stable and specific (Fig. 5). The occurrence of intraassayvariations (Fig. 6a) has been attributed to failures in theextraction procedure and/or genomic degradation (Fig. 6b).
In the amplifications carried out with genomic extractsderived from different cell passages (from 100 to 135), nodifferences were observed in the band patterns. The specifi-city of the pattern was tested by amplifying genomes extrac-ted from the EPC and CHO-K1 cell lines with four of the sixselected primers (C-95, C-96, D-4, Trna-1) (Fig. 7). Resultsobtained reflect differences between RTG-2 fingerprint andboth EPC and CHO-K1 fingerprints. Differences were alsofound between the two fish cell lines (RTG-2 and EPC cells)and the mammal cell line (CHO-K1): thus, D-4 primerprovides products of equal molecular weight in the three celllines studied; another product, of high molecular weight,only in the mammalian line (CHO-K1 cells), may be a con-sequence of its different position on the evolutionary scale.
Based on the usefulness of the RAPD technique for thedifferentiation of very close populations and the detection ofmutations produced by radiation of medaka eggs (Kubotaet al., 1995), the purpose of obtaining a specific band patternfor the RTG-2 cell line (Fig. 5) is to use this in vitro system asa tool for the detection of environmental DNA damage infish. A loss or gain in bands as well as densimetric differ-ences in them would be interpreted as an alteration in
genomic DNA. Preliminary results using mitomycin C asreference mutagen (data not provided) left us optimisticabout this point, although future research is needed toconfirm its usefulness in aquatic genotoxicology.
CONCLUSIONS
The OD320
correction, in the establishment of puritygrade and DNA amount in an extract, is not usual practice,but the results obtained with genomic extracts would makeit advisable on a routine basis in the RAPD technique.
Phenol : chloroform and salting out extraction methodsare suitable for use in the RAPD technique because of thegrade of purity, integrity, and effectiveness obtained. Al-though the yield obtained with Chelex extraction is higher,the results do not recommend its use.
The band pattern established using primers D-4, D-8,C-95, C-96, Trna-1, and Alu-2 is specific to and stable in theRTG-2 cell line. It is formed by a number of bands above 40(between 300 and 1500 bp).
The results of preliminary studies carried out in the labor-atory using mutagenic products such as mitomycin C allowoptimism in the use of this technique for the detection ofmutations induced by the presence of chemical mutagens inthe aquatic environment.

FIG. 7. Amplification of DNA from different species. RAPD analysis with C-96 (1), D-4 (2), D-8 (3), and T-1 (4) primers under fixed conditions wasperformed over DNA isolated from RTG-2, EPC, and CHO-K1 cell lines (lanes A, B, and C respectively). Different random products were obtained foreach cell line. M, molecular weight marker.
RTG-2 CHARACTERIZATION WITH RAPDs 63
ACKNOWLEDGMENTS
The authors thank Carmen Rodriguez for her technical assistance andMr. J. Roset for his help with photographs. This work was supported bySpanish CICYT Research Projects AMB94-0655-CO2-01 and AMB94-0655-CO2-02
REFERENCES
Anderson, S. W., Sadisnski, L., Shugart, P., Brussard, M., Depledge, T.,Ford, J., Hose, J., Stegeman, W., Suk, I., Wirgin, W., and Wogan, G.(1994). Genetic and molecular ecotoxicology: A research framework.Environ. Health Perspect. 102, 3—8.
Babich, H., and Borenfreund, E. (1991). Cytotoxicity and genotoxicityassays with cultured fish cells: A review. ¹oxicol. In »itro 5, 91—100.
Babich, H., Shopsis, C., and Borenfreund, E. (1986). In vitro cytotoxicitytesting of aquatic pollutants (cadmium, copper, zinc, nickel) using estab-lished fish cell lines. Ecotoxicol. Environ. Saf. 11, 91—99.
Bols, N. C., Boliska, S. A., Dixon, D. G., Hodson, P. V., and Kaiser, K. L.(1985). The use of fish cell cultures as an indication of contaminanttoxicity to fish. Aquat. ¹oxicol. 6, 147—155.
Castan8 o, A., Vega, M., Blazquez, T., and Tarazona, J. V. (1994). Biologicalalternatives to chemical identification for the ecological assessment ofindustrial effluents: The RTG-2 cytotoxicity test. Environ. ¹oxicol. Chem.13, 1607—1611.
Castan8 o, A., Cantarino, M. J., Castillo, P., and Tarazona, J. V. (1996).Correlations between the RTG-2 cytotoxicity test EC50 and in vivoLC50 rainbow trout bioassay. Chemosphere 32, 2141—2157.

64 FERRERO ET AL.
Castiglione, S., Wang, G., Damiani, G., Bandi, C., Bissofi S., andSala F. (1993). RAPD fingerprints for identifications and for taxonomicstudies of elite poplar (Populus spp.) clones. ¹heor. Appl. Genet. 87,54—59.
Cheng, S., Chen, Y., Monforte, J. A., Higuchi, R., Houten, B. V. (1995).Template integrity is essential from genomic DNA. PCR Methods Appl.4, 294—298.
Cocconcelli, P., Porro D., Galandini, S., and Senini, L. (1995). Developmentof RAPD protocol for typing of strains of lactic acid bacteria andenterococci. ¸ett. Appl. Microbiol. 21, 376—379.
Dellaporta, S., Wood, J., and Hicks, J. B. (1983). A plant DNA minip-reparation: Version II. Plant Mol. Biol. Rep. 1, 19—21.
Evans H. J. (1983). Effects on chromosomes of carcinogenic rays andchemicals. In Chromosome Mutation and Neoplasia, pp. 253—279. Liss,New York.
Faure, S., Noyer, J. L., Horry, J. P., Bakry, F., Lanaud, C., and Leon. D. J.(1993). A molecular marker-based linkage map of diploid bananas (Musaacuminata). ¹heor. Appl. Genet. 87, 517—526.
Fijan, N., Sulimanovic, D., Bearzotti, M., Muzinic D., and Kinkelin, P.(1983). Some properties of the epithelioma papulosum cyprini (EPC)cell line from carp Cyprinus carpio. Ann. »irol. (Inst. Pasteur) 134E,207—220.
Hu, J., and Quiros, C. (1991). Identification of broccoli and cauliflowercultivars with RAPD markers. Plant Cell Rep. 10, 505—511.
Kocan, R. M., Landolt, M. L., and Sabo, K. M. (1979). In vitro toxicity ofeight mutagens/carcinogens for three fish cell lines. Bull. Environ. Con-tam. ¹oxicol. 23, 269—274.
Kocan, R. M., Powel, D. B., and Liguori, V. M. (1985a). Relationshipbetween visible and heritable chromosome damage in trout cells andembryos. Mar. Environ. Res. 17, 320—323.
Kocan, R. M., Sabo, M. L., and Landolt, M. L. (1985b). Cytotoxic-ity/genotoxicity: The application of cell culture techniques to themeasurement of marine sediment pollution. Aquat. ¹oxicol. 6, 165—177.
Kubota, Y., Shimoda, A., and Shima, A. (1995). DNA alterations detectedin progeny of paternally irradiated Japanese medaka fish (Oryzias lapi-tes). Proc. Natl. Acad. Sci. ºSA 92, 330—334.
L’OCDE (1996). ¸ignes directrices de ¸’OCDE pour les essais de pruduitschimiques. Ed. ¸OCDE publication.
Miller, S., Dykes, D. D., and Polesky, H. J. (1988). A simple salting outprocedure for extracting DNA from human nucleated cells. NucleicAcids Res. 16, 1215.
Muller, H., Ziegler, B., and Schweizer, B. (1993). UV—VIS spectrometricmethods for qualitative and quantitative analysis of nucleic acids. Int.Spectrosc. ¸ab. 4, 4—11.
Sambrook, J., Fritsch, E. F., and Maniatis, T. (1989). Molecular cloning:A ¸aboratory Manual, 2nd ed. Cold Spring Harbor Laboratory Press,Cold Spring Harbor, NY.
Walsh, P. S., Metzger, M., and Higuchi, R. (1991). Chelex 100 as a mediumfor forensic material. Biotechnics 10, 506—513.
Welsh, J., and McClelland. (1991). Genomic fingerprinting using arbitrarilyprimed PCR and a matrix of pairwise combinations of primers. NucleicAcids Res. 19, 5275—5279.
Williams, J., Kubelik, A., Livak, K., Rafalski, J., and Tingey, S. (1990). DNApolymorphisms amplified by arbitrary primers are useful as geneticmarkers. Nucleic Acids Res. 18, 56—78.
Wurgler, F. E., and Kramers, P. G. (1992). Environmental effects ofgenotoxins (eco-genotoxicology). Mutagenesis 7, 321—327.
Ye, G., Hemmat, M., Lodhi, M. A., Weeden, N. F., and Reisch, B. (1996).Long primers for RAPDs mapping and fingerprinting of grape and pear.Bio¹echniques 20, 368—371.

120
ANEXO 2.2
DETECTION OF MITOMYCIN C-INDUCED GENETIC DAMAGE IN FISH
CELLS BY USE OF RAPD. (1999)
MUTAGENESIS VOL. 14, Nº 5, 449 – 456,
Páginas 121 a 130

Mutagenesisvol.14 no.5 pp.449–456, 1999
Detection of mitomycin C-induced genetic damage in fish cells byuse of RAPD
Concepcion Becerril2, Mar Ferrero, Felix Sanz andArgelia Castano1
Toxicology Department CNA, I.S. Carlos III, E-28220 Majadahonda,Madrid and1Division of Environmental Toxicology, CISA-INIA, E-28130,Madrid, Spain
Concern about genetic alterations in fish populationsarising from anthropogenic activities has led to the adapta-tion and/or development of new tests and techniques thatshed light on these alterations. The high number and thereduced size of chromosomes and the long cell cycleassociated with most fish species preclude the use of mostaccepted genotoxicity assays. The purpose of this workwas to study the capability of the randomly amplifiedpolymorphic DNA technique to show genotoxic effectsinduced by chemicals in fish cells. To do that we studied theeffect of 0.5µg/ml mitomycin C (MMC) on an establishedrainbow trout cell line (RTG-2). To increase the sensitivityof detecting altered copies of DNA and to avoid the presenceof false positives and a lack of reproducibility, the amountsof DNA template and primer present in amplificationreactions were studied and optimized after comparisonbetween the control and exposed fingerprints for 4, 6 and8 h. Results show that 5 ng of DNA template and 4 pMchosen primer were optimum to show differences betweencontrol and exposed cells and to obtain reproducibleresults. The results obtained, after optimum conditionswere established, show that this system could be useful forthe assessment of DNA alterations inin vitro genotoxicitystudies.
Introduction
Sublethal exposure to environmental genotoxic agentsarising from human activity causes different forms of altera-tions to exposed aquatic populations, which may lead to thestructure and function of ecosystems being altered (Andersonet al., 1994).
These derived effects of genotoxins directly or indirectlyaffect genome integrity due to mutations in germinal and/orsomatic cells, leading to an increase in the incidence ofdifferent types of tumours (Leblanc and Bain, 1997) and, inthe long term, to alterations in the genetic variability of theexposed populations (Theodorakiset al., 1998).
These facts, and for risk assessment purposes, make itimperative that prior laboratory tests are carried out to establishif a particular pollutant or a complex mixture can cause adverseaffects on the genetic material of the exposed populationsbefore its liberation into the aquatic environment.
However, reproducing the effects on a fish population oflong-term exposure to genotoxic agents, or even short-termexposure but with long-term expression of the effects,requires the availability of large laboratory facilities, personnel
2To whom correspondence should be addressed. Tel:134 91 5097900; Fax:134 91 5097926; Email: [email protected]
© UK Environmental Mutagen Society/Oxford University Press 1999 449
specialized in maintaining the species and a large volume ofsamples, all of which make it very costly.
In vitro tests using fish cell lines are an alternative to theuse of fish and have big advantages in ecotoxicology studies(Babich and Borenfreund, 1991; Castan˜o et al., 1994). TheRTG-2 cell line derived from rainbow trout (Oncorhynchusmikiss)has been widely used in cytotoxicity studies and showsa good correlation within vivo acute fish bioassays (Bolset al., 1985; Castan˜o et al., 1996). Owing to its capacityto metabolize xenobiotics without requiring the addition ofmetabolic activation systems (Smolareket al., 1988; Araujoet al., 1998), it has also been shown to be appropriate forgenotoxicity studies (Kocanet al., 1985).
The OECDGuidelines(1998) list a series of widely usedtechniques, bothin vivo andin vitro, for use in risk assessmentprocedures associated with genotoxins for humans. However,the application of these traditional techniques to the detectionin DNA of both macro- and micro-damage (sister chromatidexchange, chromosomal aberrations, etc.) are particularlytedious when applied to fish, due to the high number ofchromosomes and the long cell cycle found in fish cells. Theappearance of new assays in the last few years, such as theComet assay (McKelveyet al., 1993; Pandangiet al., 1996),automatic scoring techniques for micronuclei assays (OCDE,1998) and 32P-post-labelling for the detection of adducts(Phillips et al., 1997), together with recent advances inmolecular biology, such as DNA fingerprinting and geneamplification by PCR, offer new possibilities for detectingDNA damage, circumventing these limitations.
Randomly amplified polymorphic DNA (RAPD), developedby Williams et al. (1990), is a technique that involves theamplification of random segments of genomic DNA using thePCR methodology. This method does not require prior sequenceinformation and arbitrarily chosen short primers are used atlow stringency to amplify multiple segments from genomicDNA to any species (Williamset al., 1990). The majority ofsuch fragments are identical between individuals or strains,which represents a tremendous potential for application indifferent research fields: the study of genetic variation innatural populations (Welsh and McClelland, 1991; Theodorakiset al., 1998), genetic variability studies (Paffetiet al., 1996;Endtz et al., 1997) and mutation detection inin vivo studies(Kubota et al., 1992, 1995; Theodorakis and Shugart, 1997;Atienzaret al., 1998).
In the same way, cell populations exposedin vitro togenotoxins suffer DNA alterations in a certain number of cells,which are reflected as variations in the fingerprint obtainedfor the control population. These are defined as band losses and/or gains as well as alterations in the intensity of amplification ofsome of them. Such alterationsin vivoare considered mutationsthat are produced by changes to, deletions of or insertions intothe pair bases (Muralidharan and Wakeland, 1993).
In a previous work, the characteristic fingerprint of the RTG-

C.Becerril et al.
Fig. 1. Amplification and fluorescence profiles of band pattern generated by the AA-82 primer at two template concentrations. (a) Amplifications carried outwith 5 ng of genomic DNA. (b) Amplifications carried out with 20 ng of genomic DNA; bands x, y and z of 1615, 490 and 340 bp, respectively, wereconsidered erratic bands. The RTG-2 fingerprint with this primer was established with the six common bands: three of high molecular weight, bands A–C(1075, 965 and 840 bp, respectively); one of medium molecular weight, band D (700 bp); two of low molecular weight, bands E and F (570 and 430 bp,respectively).
2 cell line was established in order to use this methodology forthe detection of DNA damage after exposure of cell populationsto genotoxic agents (Ferreroet al., 1998).
The RAPD technique has been associated with somelimitations concerning lack of reproducibility and the appear-ance of ‘ghost’ bands which are difficult to interpret. In thiswork we have studied some variables in order to avoid theselimitations. For that, a well-known clastogenic agent was used,mitomycin C (MMC), an inducer of DNA interstrand crosslinks(Sehlmeyer et al., 1996), DNA adducts and mutations(Sanderson and Shield, 1996), bothin vivo (Fahring, 1977;Ehling, 1978; Caoet al., 1993; Grawe´ et al., 1993) andin vitro(Kato and Shimada, 1975; Singh and Gupta, 1983; Davieset al., 1993; Salvadoriet al., 1994).
To increase the sensitivity of detection of altered copies of
450
DNA and to avoid the presence of false positives and lackof reproducibility, the amounts of DNA template and primerpresent in amplification reactions were studied and optimizedafter comparison between the control and exposed fingerprintsfor different exposure periods. The final purpose of this workwas thus to minimize the limitations of this technique in orderto be able to apply it to the detection of genomic DNAalterations caused by environmental chemicals to exposed cells.
Materials and methods
Cell cultures
RTG-2 cells (CCL 55; American Type Culture Collection, Rockville, MD),an established fibroblastic cell line derived from rainbow trout (Oncorhynchusmykiss) were grown in Eagle’s minimum essential medium with Earle’ssalts (EMEM), supplemented with 10% fetal serum, 100 U/ml penicillin,

Detection of mitomycin C-induced genetic damage
Table I. Frequency of appearance of each of the bands obtained with 5 and20 ng of genomic DNA
Band Size (bp) 5 ng (%) 20 ng (%)
x 1615 0 61A 1075 100 100B 965 100 100C 840 100 100D 700 84 94E 570 100 100y 490 0 4F 430 100 100z 335 0 14
Bands A–F form the fingerprint control. x, y and z are erratic bands.Twenty-three amplifications (two genomic DNA extracts) were carried outat both template concentrations. The data obtained is the result of assigningthe value 1 (presence) or 0 (absence of band) to each band in eachamplification reaction.
Table II. Differences in frequency of appearance of bands between controlsand exposed cells at 4, 6 and 8 h: (a) 5 ng of genomic DNA; (b) 20 ng ofgenomic DNA
Band Size (bp) Control 4 h 6 h 8 h
aA0 1345 5 0 0A 1075 100 100 100 85B 965 100 95 100 93C 840 100 90 100 90C1 780 0 0 7D 700 84 50 40 40D1 645 1 5 21E 570 100 95 100 91E1 545 0 0 2F 430 100 100 100 100F1 410 0 5 2bA0 1345 0 0 0A 1075 100 100 100 100B 965 100 100 100 100C 840 100 100 100 100C1 780 0 0 0D 700 84 100 75 75D1 645 0 0 0E 570 100 100 100 88E1 545 0 0 0F 430 100 100 100 100F1 410 0 0 0
Data are expressed as percentages. Numbers of replicate reactions were asfollows: (a) Control, 23; 4 h, 20; 6 h, 20; 8 h, 36 and (b) control, 23; 4 h,8; 6 h, 8; 8 h, 8.
100 µg/ml streptomycin, 1.25µg/ml fungizone and 2 mML-glutamine, inPVC tissue culture flasks (Costar, Corning, NY) and incubated at 206 1°Cin a 5% CO2/air atmosphere.
Exponentially growing cells were exposed to 0.5µg/ml MMC (Sigma, StLouis, MO) for 4, 6 or 8 h. After each exposure period, the medium wasremoved and the cells washed with phosphate-buffered saline (PBS). Freshmedium was then added and the cells were left to grow for a further 72 h(~1.5 cell cycles).
Two 75 cm2 flasks were used for the control and for each one of theexposure periods. The experiment was repeated twice on different days.
DNA extraction and RAPD reactionCells were dissociated with trypsin–EDTA (Flow Laboratories, Rickmans-worth, UK), collected in PBS, pH 7.3, and their DNA isolated by phenolextraction (Ferreroet al., 1998). The integrity of the extracted genomic DNAwas checked by 0.8% agarose electrophoresis using theλ phage as molecularweight marker (Eurobio, Paris, France). Amplification was performed in a
451
Fig. 2. Graphic representation of quantitative differences in the RTG-2fingerprint using 5 and 20 ng of template. In both cases bands A, B, D andE coincide and bands C and F are directly and inversely proportional to thegenomic DNA concentration. (a) Height. (b) Volume. (c) Percentage ofband amplified.
25 µl volume containing buffer solution, 4 mM MgCl2, 2 U Stoffel fragment(Perkin-Elmer, Branchburg, NY) and 0.2 mM each dNTP (Pharmacia,Barcelona, Spain). DNA template was added at two different concentrations,20 and 5 ng.
The RAPD protocol was previously described by Ferreroet al. (1998).Briefly, an initial denaturing step at 92°C was followed by 45 cycles ofannealing at 36°C for 75 s and extension at 72°C for 6 min. The thermalcycler used was a Perkin-Elmer model 2400.
The primer used was AA-82 (59-GATCCATTGC-39; Biopolymers Depart-ment, CNBCR, I.S. Carlos III, Madrid, Spain). This primer was selected

C.Becerril et al.
Table III. Results of quantitative analysis of height, volume and percentage of amplified bands with 5 ng of genomic DNA for controls and exposed cells
Height Volume Percentage of band n
Band A Control 1076 26.3 157416 4555 20.06 4.7 234 h 896 28.4 127076 5714 20.86 9.9 206 h 696 32.7c 99806 5157b 14.1 6 6.9b 208 h 806 26.8b 106206 3919c 12.2 6 4.8c 35
Band B Control 1576 26.7 332276 9785 43.16 8.8 234 h 1626 10.9 325436 7841 46.16 6.0 206 h 1076 33.7c 198416 6608c 28.4 6 8.7c 208 h 1456 39.2 274456 9428a 29.6 6 10.4c 36
Band C Control 356 14.9 48876 2503 6.16 2.7 234 h 526 19.8b 73286 3019a 8.9 6 3.4 186 h 236 10a 34466 1871 4.76 2.4 208 h 206 9.4b 29246 1411b 3.0 6 1.1c 36
Band D Control 136 4.9 18726 781 2.46 1.0 194 h 196 12.5 26946 1854 3.96 2.4 106 h 9 6 3.0 15656 513 2.26 0.6 88 h 276 20.9a 48796 3644c 5.3 6 4.2b 23
Band E Control 486 16.9 72586 2691 9.86 3.1 234 h 336 16.9a 49296 2773b 7.4 6 3.6 196 h 556 33.1 88776 5333 13.06 8.0 208 h 676 38.4 126686 6934b 13.9 6 6.4b 35
Band F Control 736 33.6 144596 6750 19.26 10.3 234 h 386 24.2c 69706 4876c 13.0 6 10.3a 206 h 1236 46.7b 271876 12304b 38.6 6 16.7c 208 h 1166 50.2b 274526 12446c 35.9 6 20.9c 36
Values are means6 SD of n amplifications of different genomic DNA extracts (when the band was not present, it was given no value). Significantdifferences versus control,aP , 0.05,bP , 0.01,cP , 0.0001 by Mann–WhitneyU-test.
Table IV. Results of quantitative analysis of height, volume and percentage of amplified bands with 20 ng of genomic DNA from control and exposed cells
Height Volume Percentage of band n
Band A Control 104.76 27.1 154846 5558 19.86 4.8 234 h 100.96 30.5 165376 6113 20.76 5.9 86 h 78.06 23.8 116696 4246 20.06 5.9 88 h 110.36 24.3 152306 3961 19.96 4.6 8
Band B Control 145.16 13.4 329326 7626 43.56 5.3 234 h 156.06 11.7 376586 7492 46.26 4.4 86 h 139.86 22.8 287026 7338 45.06 5.4 88 h 145.86 22.1 354096 8124 47.66 3.5 8
Band C Control 55.96 10.2 86896 1577 11.06 2.1 234 h 55.06 11.6 77186 1938 10.06 2.4 86 h 42.06 8.2b 63986 1668b 11.3 6 3.1 88 h 59.06 17.8 91556 4259 11.66 3.4 7
Band D Control 13.86 3.8 20326 635 2.56 0.8 214 h 14.66 5.4 23036 1195 2.96 1.1 86 h 11.06 1.8 15486 220 2.86 0.8 68 h 21.36 4.5b 28426 431b 2.6 6 1.6 6
Band E Control 43.66 11.3 62426 1536 8.06 1.8 234 h 44.36 11.2 71466 3058 9.66 3.5 86 h 33.06 6.8a 49486 1888 8.76 3.5 88 h 39.96 12.4 53276 1924 8.26 2.1 7
Band F Control 52.46 23.4 101666 3686 14.06 5.8 234 h 30.66 9.4a 63676 2320 9.86 4.4 86 h 22.86 6.2b 44296 1663b 12.1 6 5.5 88 h 48.56 17.0 75136 3263 10.26 3.5 8
Values are means6 SD of n amplifications of different genomic DNA extracts (when the band was not present, it was given no value). Significantdifferences versus control,aP , 0.05,bP , 0.01,cP , 0.0001 by Mann–WhitneyU-test.
because with this cell line it generates different amplification products withina wide range of molecular weights.
Amplification products (22µl) were resolved electrophoretically on 2.1%agarose gels and stained with ethidium bromide. The image was recorded bythe Grab-it program (UVP, Uplad, CA).
452
Optimization of primer concentrationIn order to avoid the presence of artefacts, we carried out 20 amplificationson different days, without DNA template and using three different primerconcentrations (2.5, 4 and 5 pM) following the above described amplifica-tion conditions.

Detection of mitomycin C-induced genetic damage
Table V. Grouped values of height, volume and percentage of amplified bands with 5 and 20 ng of template from control and exposed cells according tomolecular weight
Height Volume Percentage of band n
Band of high molecular weight (.800 bp)20 ng Control 3066 42.5 571056 12278 74.36 7.9 23
4 h 3126 49.0 619136 13869 76.96 8.3 86 h 2606 50.4a 467696 10991a 76.3 6 8.1 88 h 3156 58.3 597946 14111 79.16 3.9 8
5 ng Control 2986 58.5 538556 14110 69.26 11.4 234 h 3046 51.6 525786 13828 75.86 6.1b 206 h 1996 71.9c 332666 12342c 47.1 6 16.5c 208 h 2796 70.8 473076 13766 44.86 13.4c 36
Band of low molecular weight (,600 bp)20 ng Control 966 33.5 164086 4709 22.06 7.5 23
4 h 756 22.8 135136 5013 19.46 7.7 86 h 566 15.7b 93776 3357b 20.8 6 7.6 88 h 886 31.7 128406 4789 18.46 1.9 8
5 ng Control 806 26.4 217166 7601 29.06 9.0 234 h 706 23.1c 118986 4200c 20.4 6 7.2b 206 h 1786 52.9c 360636 12153c 51.5 6 16.4c 208 h 1836 74.6b 401206 15326c 49.8 6 17.9c 36
Values are means6 SD of n amplifications. Significant differences versus control,aP , 0.05,bP , 0.01,cP , 0.0001 by Mann–WhitneyU-test.
Fig. 3. Differences observed between genomic DNA of control and exposed cells. (a) Amplifications carried out with 5 ng of DNA from control and exposedcells. Control fingerprint (lines 4–6) bands A–F. The fingerprints of exposed cells (lines 1–3 and lines 7–10) show alterations such as absence of bands(lines1, 3 and 8, band E) or the presence of other new bands (line 10, band D1). (b) Comparison of the fluorimetric profile of two amplifications carried out withDNA from control (dotted line) and exposed (solid line) cells where three types of differences are observed: (1) different intensity of amplification; (2)absence of bands (loss of band D); (3) presence of a new band (band F1, of 410 bp).
Analysis of the band pattern of control and exposed cellsThe genomic DNA extract in the two different flasks was obtained andamplified at least twice on different days. The control and exposed cells foreach experiment were individually amplified but developed together in thesame gels, using the molecular weight markersφX174-HaeIII and λ/EcoRI-HindIII (Eurobio). The agarose gels were analysed by densitometry (Gelworks1D; UVP).
Qualitative analysis was performed by comparing the percentage appearance
453
of each of the peaks of the control and exposed cells. After eliminatingthe background, quantitative differences were studied using three types ofparameters: height, volume and percentage of the amplified band. Additionally,the individual data obtained on the height, volume and percentage of amplifiedbands were grouped together according to the following criteria: bands ofhigh molecular weight (.800 bp), bands of intermediate molecular weight(between 600 and 800 bp) and bands of low molecular weight (,600 bp).
For statistical analysis all individual data on control and treated cells from

C.Becerril et al.
the different experiments were considered together. The data were analysedusing Student’st-test and the Mann–WhitneyU-test.
Results and conclusions
Primer concentrationIn five of the 20 amplifications carried out with 5 pM ofprimer and without template, the appearance of ‘ghost’ bandsof different molecular weights was noted as a result ofpolymerization of the primer with itself. When assays wereperformed with 2.5 and 4 pM, no artefacts were observed, so4 pM primer was selected as the optimum for later assays.Differences in the band pattern of control and treated cellsQualitative analysis.The assays carried out with 5 and 20 ngof control genomic DNA resulted in six common amplificationproducts, three considered as having high molecular weights(i.e. .800 bp), one with an intermediate molecular weight(700 bp) and two with low molecular weights (i.e.,600 bp).When the assay was carried out with 20 ng, apart from thosedescribed, three bands with a low appearance rate (erraticbands) were observed and therefore were not included in thepattern (Figure 1). Assays with 2.5 ng of genomic DNAgenerated the characteristic bands already defined, but theyvaried greatly in their intensity and frequency of appearance,so this concentration was discarded in later studies. In summary,in the assay conditions of 4 pM primer and 5 or 20 ng ofDNA template, a constant pattern was established by thosebands whose percentage of appearance was always.80%(Table I).
In genomic DNA extracts of the exposed cells, qualitativedifferences were observed in both concentrations when com-pared with the control cells, although these were greater whenusing 5 ng of genomic DNA. A drop in the appearance rateof bands was observed in treated cells at 5 ng for all theexposure periods. Band D was particularly affected, goingfrom being present in 84% of the control assays to 50% at 4 hand 40% at 6 and 8 h of exposure, respectively. Five extrabands were also detected: band D1 appeared at all exposureperiods, band F1 at 6 and 8 h, band A0 at 4 h and band C1at 8 h. With 20 ng of template, a drop in the appearance rateof band D was also observed, decreasing by up to 74% after6 and 8 h oftreatment. No new bands were observed withthis concentration (Table II).Quantitative analysis.The control amplification productsobtained for both DNA concentrations showed a constantfluorimetric profile and for the three quantitative parametersstudied, band B presented the highest average values andband D the lowest. The values of these parameters behavedin the same way: Bands A, B, D and E coincide anddifferences observed in bands C and F are directly and inverselyproportional to the genomic DNA concentration, respectively(Figure 2). In exposed cells, significant statistical differences(P , 0.05) versus the control were found using 5 ng oftemplate for most fingerprint bands at all exposure periods asa function of the parameter analysed. The most significantdifferences (P , 0.0001) were observed at 8 h of exposure,when considering the percentage of the amplified band (TableIII). These results contrast with those obtained when theconcentration of genomic DNA used was 20 ng. No bandshowed significant overall differences in the parametersconsidered and, furthermore, the values obtained for thepercentage of amplified bands coincide, for all exposureperiods, with those of the control pattern (Table IV).
454
When each band is analysed individually, it is noted thatthe results for the control and exposed data are greatlydispersed. However, if data are grouped according to theirmolecular weights, this variability decreases and the differencesbetween the control and treated cells are seen more clearly.When using this method with 5 ng of template, differencesare noticeable at 6 and 8 h of treatment and the 5:2 ratiobetween the high and low molecular weight bands of thecontrol was modified to a value of 1:1 (Table V). Thedifferences were seen as a decrease in the amplification of thehigh molecular weight peaks in favour of the lower molecularweights. Conversely, at 4 h the differences were seen as adecrease in amplification of the low molecular weight peaksin favour of the high molecular weight peaks (bands C and F).
Statistically significant differences (P , 0.01) were obtainedfor all exposure periods in the low molecular weight bandgroup (,600 bp) for all parameters, as well as in the highmolecular weight band group (.800 bp), but only when theband percentage is considered. Although the parameters usedfor the quantitative valuation are all related, the height variesdue to the electrophoretic process itself and the volume has agreat dispersion of data. As the band percentage is a valuerelative to the total amplification of each reaction, we considerthis latter as the most appropriate parameter for quantifyingour results as it allows for a better comparison between gels.No differences were found with 20 ng of template even whenthe bands were grouped according to their molecular weights.
In conclusion, qualitative and quantitative differences werefound in RTG-2 cells after exposure to 0.5µg/ml MMC, butonly when the template concentration was lowered to 5 ng ofgenomic DNA (Figure 3).
Discussion
Template concentration affects the electrophoretic band patternand is the major source of non-reproducibility in RAPDfingerprint analysis, as previously described by other authorsusing different species (Muralidharan and Wakeland, 1993;Sakallahet al., 1995). In our case, 5 and 20 ng of genomicDNA from RTG-2 cells show variations in the intensity ofamplification of two of the bands (C and F) and in theappearance of erratic bands at the higher concentration (TableI and Figure 2). The template concentration is also a key factorin showing differences in the band pattern between controland exposed cells. While some qualitative differences occurat both concentrations, such as a decrease in the frequency ofthe appearance of some bands, the appearance of new bandsas well as quantitative alterations can be observed only whenthe template concentration is reduced (Figure 3).
Amongst the new bands observed in the exposed cells, bandD1 (645 bp) was detected for all the exposure periods and thefrequency of its appearance increased with the length ofexposure. This leads one to think that these bands are theresult of a MMC-directed action on specific points on thegenomic DNA. This is in accordance with the specificity ofMMC in CG-rich areas (Kumaret al., 1997; Palomet al.,1998; Warrenet al., 1998).
Quantitative differences in control cells can be observed inthe intensity of amplification by decreasing the amount ofgenomic DNA from 20 to 5 ng. This same effect, but muchmore noticeable, is found when comparing the control andexposed genomic DNA using 5 ng.
MMC is a well-known mutagenic and clastogenic agent;

Detection of mitomycin C-induced genetic damage
base substitutions, sister chromatid exchanges, chromosomalaberrations and micronuclei, bothin vivo and in vitro, aregenetic effects that can be observed as a function of dose andexposure period (Peltet al., 1991; Ruddet al., 1991; Salvadoriet al., 1994). The dosage selected for this work was inaccordance with previous studies of micronucleus inductionin our laboratory on the same cell line (Llorenteet al., 1998)and is also in the range for the positive control inin vitrogenotoxicity assays (Ribaset al., 1998). Although MMCprovokes alterations in the DNA of the cell population, withthe concentration and exposure periods used in this work acertain proportion of DNA copies remain intact. In the caseof 20 ng, the number of unaffected copies is sufficient thatwith the concentration of primer used, it finds sections whereit can hybridize and therefore the characteristic band patternis not altered. This is supported by the fact that only thescarcest bands (bands D and E, which represent 2.5 and 8%of the total amplified, respectively) are affected at the longerexposure periods (Table V). Nevertheless, when the amountof template is lowered to 5 ng, despite the fact that in relativeterms the proportion of intact genomic DNA is the same, thenumber of original copies to be amplified is now much lowerand insufficient, which increases the probability of the alteredgenomic DNA showing itself. The result is that a band patterndifferent to that of the control is obtained.
Smaller but significant quantitative differences betweencontrol and exposed cells for the shorter studied period canbe observed as an opposite tendency when compared withlonger exposure periods. In the RAPD reaction a high numberof different sequences are co-amplified in the first cycles andthe products from the most stable primer–template unions arethe ‘winners’ of this process (Davin-Reglinet al., 1995). Theobserved tendency for 4 h could suggest that short exposures(4 h represents 1/12 of the population doubling time for thiscell line) may lead to the production of mutations with changesin base pairs (Srikanthet al., 1994; Maccubbinet al., 1997)which can give the primer the opportunity to find newhybridization sites and obtain products of similar molecularweight but with different sequences (Reisenberg, 1996).Attention should also be paid to the qualitative analyses. After4 h, a new high molecular weight band appears and thefrequency of appearance of band C decreases by up to 90%,so that new and possibly unstable hybridizations may besuspected. Longer exposure periods lead to a decrease inthe amplification of high molecular weight bands as a resultof the clastogenic action of MMC (Peltet al., 1991;Channarayappa and Ong, 1992).
Although RAPD assays are usually associated with inherentproblems of the technique which prevent its routine application(Hadrys et al., 1993), if the conditions of the assay wereoptimized these inconveniences can be solved, i.e. appearanceof ‘ghost’ bands, reproducibility, etc. (Theodorakiset al.,1998). By optimizing the RAPD conditions, and bearing inmind that RAPD are PCR products, they can be cloned andsequenced to obtain a wider knowledge of genotoxicant actionmechanisms (Theodorakiset al., 1998).
The results of this work shows that the RAPD techniquecould be a promising tool in thein vitro detection of alterationsin DNA produced by genotoxic agents, allowing us to see themechanisms of action of the agent in greater detail and alsopermitting areas or ‘hotspots’ within the affected genomicDNA to be seen. Moreover, the practically unlimited numberof informative primers provides a good overall coverage of
455
genomic DNA (Ramseret al., 1996) so that the choice of aset of primers with different sequences will allow increasedsensitivity of the assay in the detection of low frequencymutation events.
The purpose of this work was to study the capability of thistechnique to show genotoxic effects induced by chemicals inspecies where a long cell cycle, low ability of colony formationand small or high numbers of chromosomes (Babich andBorenfreund, 1991; Al-Sabty and Metcalfe, 1995) makesapplication of most mutagenicity assays impractical. Obviously,a large number and types of genotoxic agents must be testedto establish sensitivity limits before routine application ofthis assay.
AcknowledgementThis work was supported by CICYT projects AMB94-0655-CO2 andAMB97-0431-CO2
ReferencesAl-Sabty,K. and Metcalfe,C.D. (1995) Fish micronuclei for assessing
genotoxicity in water.Mut. Res., 343, 121–135.Anderson,S.W., Sandisnski,L., Shugart,P., Brussard,M., Depledge,T., Ford,J.,
Hose,J., Steman,W., Suk,Y., Wirgin,W. and Wogan,G. (1994) Genetic andmolecular ecotoxicology: a research framework.Environ. Health Perspect.,102, 3–8.
Araujo,C., Marques,S. and Gonc¸alves,I. (1998)In vitro response of the SSand RTG-2 cell line to benzo(a)pyrene.Cuadernos Invest. Biol., 20, 99–102.
Atienzar,F., Eveden,A., Jha,A. and Depledje,M. (1998) The use of the arbitraryprimers polymerase chain reaction to detect DNA damage. InProceedingsof the 8th Annual Meeting of SETAC, April 1998, Bordeaux, France.
Babich,H. and Borenfreund,E. (1991) Cytotoxicity and genotoxicity assayswith cultured fish cells: a review.Toxicol. In Vitro, 5, 91–100.
Bols,N.C., Boliska,S.A., Dixon,G.D., Hodson,P.V. and Kaiser,K.L. (1985) Theuse of fish cell culture as an indication of contaminant toxicity to fish.Aquatic Toxicol., 6, 147–155.
Cao,J., Beisker,W., Nusse,M. and Adler,D. (1993) Flow cytometric detectionof micronuclei induced by chemical in polychomatic and normochromaticerythrocytes of mouse peripherical blood.Mutagenesis, 8, 533–541.
Castan˜o,A., Vega,M., Blazquez,T. and Tarazona,J.V. (1994) Biologicalalternatives to chemical identification for the ecological assessment ofindustrial effluents: the RTG-2 cytotoxicity test.Environ. Toxicol. Chem.,13, 1607–1611.
Castan˜o,A., Cantarino,M.J., Castillo,P. and Tarazona,J.V. (1996) Correlationsbetween the RTG-2 cytotoxicity test EC50 andin vitro LC50 rainbow troutassay.Chemosphere, 32, 2141–2157.
Channarayappa,J.N. and Ong,T. (1992) Clastogenic and aneuploidogeniceffects of cigarette smoke condensate, mitomycin C and vincristine sulfate.Mutagenesis, 7, 457–460.
Davies,M.J., Phillips,B.J. and Rumsby,P.C. (1993) Molecular analysis ofmutations at the HPRT locus of Chinese hamster V79 cells induced byethyl methanesulphonate and mitomycin C.Mutat. Res., 291, 117–124.
Davin-Reglin,A., Abed,Y., Charrel,R.N., Bollet,C. and Micco,P. (1995)Variations in DNA concentrations significantly affect the reproducibility ofRAPD finger print patterns.Res. Microbiol., 146, 561–568.
Ehling,U. (1978) Specific locus mutations in mice. In Hollaender,A. and deSerres,F.J. (eds)Chemical Mutagens: Principles and Methods for theirDetection. Plenum Press, New York, NY, Vol. 5, pp. 233–256.
Endtz,H.P., Vliegenthart,J.S., Vandamme,P., Weverink,H.W., Van-den-Braak,N.P., Verbrugh,H.A. and Van-Belkum,A. (1997) Genotypic diversityof Campylobacter lariisolated from mussels and oysters in The Netherlands.Int. J. Food Microbiol., 34, 79–88.
Fahring,R. (1997) The mammalian spot test (Fellfleckentest) with mice.Arch.Toxicol., 38, 87–98.
Ferrero,M., Castan˜o,A., Gonzalez,A., Sanz,F. and Becerril,C. (1998)Characterization of RTG-2 fish cell line by random amplified polymorphicDNA. Ecotoxicol. Environ. Safety, 40, 56–64.
Grawe,J., Zetterberg,G. and Amneus,H. (1993) DNA content determinationof micronucleated polychomatic erythrocytes induced by clastogens andspindle poisons in mouse bone marrow and peripheral blood.Mutagenesis,8, 249–255.

C.Becerril et al.
Hadrys,H., Balick,M. and Schierwater,B. (1993) Applications of randomamplified polymorphic DNA (RAPD) in molecular ecology.Mol. Ecol., 1,55–63.
Kato,H. and Shimada,H. (1975) Sister chomatid exchanges induced bymitomycin C: a new method of detecting DNA damage at chromosomallevel. Mutat. Res., 28, 459–464.
Kocan,R.M., Sabo,K.M. and Landolt,M.L. (1985) Cytotoxicity/genotoxicity:the applications of cell culture techniques to the measurement of marinesediment pollution.Aquatic Toxicol., 6, 165–177.
Kubota,Y. Shimada,A. and Shima,A. (1992) Detection of gamma ray inducedDNA damages in malformed dominant lethal embryos of the Japanesemedaka (Orycias latipes) using AP-PCR fingerprinting.Mutat. Res., 283,263–270.
Kubota,Y., Shimada,A. and Shima,A. (1995) DNA alterations detected inprogeny of paternally irradiated Japanese medaka fish (Oryzias lapides).Proc. Natl Acad. Sci. USA, 92, 330–334.
Kumar,G.S., Lipman,R., Cummings,J. and Tomasz,M. (1997) Mitomycin C–DNA adduct generated by DT-diaphorase. Revised mechanism of theenzymatic reductive activation of mitomycin C.Biochemistry, 36, 14128–14136.
LeBlanc,G.A. and Bain,L. (1997) Chonic toxicity of environmentalcontaminants: sentinels and biomarkers.Environ. Health Perspect., 105,65–80.
Llorente,M., Sanchez,P. and Castan˜o,A. (1998) Valoracionin vitro de lafrecuencia de micronucleos en celulas de trucha por citometria de flujo.Proceedings IX Reunion Cientifica y X Aniversario de la SEMA. Universityof Murcia, CSIC, Spain, p. 87.
Maccubbin,A.E., Mudipalli,A., Nadadur,S.S., Ersing,N. and Gurtoo,H.L.(1997) Mutations induced in a shuttle vector plasmid exposed tomonofunctionally activated mitomycin C.Environ. Mol. Mutagen., 29,143–151.
McKelvey,U.J., Green,M.H., Schmezer,P., Pool-Zobel,B.L., De Meo,M.P. andCollins,A. (1993) The single cell gel electrophoresis assay (comet assay):a European review.Mutat. Res., 288, 47–63.
Muralidharan,K. and Wakeland,E.K. (1993) Concentration of primer andtemplate qualitatively affects products in Random amplified polymorphicDNA-PCR.BioTechniques, 14, 362–364.
OCDE (1998) Mammalian erythrocyte micronucleus test. no. 474. InAddenumto OCDE Guidelines for Testing Chemicals 1998. OCDE, France.
Paffeti,D., Scotti,C., Gnocchi,S., Fancelli,S. and Bazzicalupo,M. (1996)Genetic diversity of an ItalianRhizobium melilotipopulation from differentMedicago sativavarieties.Appl. Environ. Microbiol., 62, 2279–2285.
Palom,Y., Lipman,R., Musser,S.M. and Tomasz,M. (1998) A mitomycin C–N6-deoxyadenosine adduct isolated from DNA.Chem. Res. Toxicol., 11,203–210.
Pandrangi,R., Petras,M., Ralph,S. and Vrzoc,M. (1996) Alkaline single cellgel (Comet assay) and genotoxicity monitoring using bullheads and carp.Environ. Mol. Mutat., 26, 345–356.
Pelt,F., Haring,R.M., Overkamp,M. and Weterings,P. (1991) Micronucleusformation in cultured human keratinocytes following exposure to mitomycinC and cyclophosphamide.Mutat. Res., 252, 45–50.
Phillips,D.H. (1997) Detection of DNA modifications by the super32P-postlabelling assay.Mutat. Res., 378, 1–12.
Ramser,J., Lopez-Peralta,C., Wetzel,R., Weising,K. and Kahl,G. (1996)Genomic variation and relationships in aerial yam (Dioscores bulbiferaL.)detected by ramdon amplified polymorphic DNA.Genome, 39, 1725.
Riesenberg,L.K. (1996). Homology among RAPD fragments in interspecificcomparisons.Mol. Ecol., 5, 99–105.
Ribas,G., Surralles,J., Carbonell,E., Creus,A., Xamena,N. and Marcos,R.(1998) Lack of genotoxicity of the herbicide atrazine in cultured humanlymphocytes.Mutat. Res., 416, 93–99.
Rudd,N.L., Williams,S.E., Evans,M., Hennig,U.G. and Hoar,D.I. (1991)Kinetochore analysis of micronuclei allows insights into the actions ofcolcemid and mitomycin C.Mutat. Res., 261, 57–68.
Sakallah,S.A., Lanning,R.W. and Cooper,D.L. (1995) DNA fingerprinting ofcrude bacterial lysates using degenerate RAPD primers.PCR MethodsAppl., 4, 265–268.
Salvadori,D., Ribeiro,L. and Natarajan,A.T. (1994) Effect ofβ-carotene onclastogenic effects of mitomycin C, methyl methanesulphonate andbleomycin in Chinese hamster ovary cells.Mutagenesis, 9, 53–57.
Sanderson,B.J.S. and Shield,A.J. (1996) Mutagenic damage to mammaliancells by therapeutic alkylating agents.Mutat. Res., 355, 41–57.
Sehlmeyer,U., Meister,A., Beisker,W. and Wobus,A.M. (1996) Low mutageniceffects of mitomycin C in undifferentiated embryonic P19 cells are correlatedwith efficient cell cycle control.Mutat. Res., 354, 103–112.
Singh,B. and Gupta,R.S. (1983) Comparison of the mutagenic responses of12 anticancer drugs at the hypoxanthine-guanine phosphoribosyl transferase
456
and adenosine kinase loci in Chinese hamster ovary cells.Environ. Mutagen.,5, 871–880.
Smolarek,T.A., Morgan,S. and Baird,W.M. (1998) Temperature-inducedalterations in the metabolic activation of benzo(a)pyrene to DNA bindingmetabolites in the bluegill fry cell line BF-2.Aquatic Toxicol., 13, 89–98.
Srikanth,N.S., Mudipalli,A., Maccubbin,A.E. and Gurtoo,H.L. (1994)Mutations in a shuttle vector exposed to activated mitomycin C.Mol.Carcinog., 10, 23–29.
Theodorakis,C.M. and Shugart,L.R. (1997) Genetic ecotoxicology II:population genetic structure in mosquitofish exposedin situ to radionuclides.Ecotoxicology, 6, 335–354.
Theodorakis,C.M., Bickman,J.M., Elbi,T., Shugart,L.R. and Chesser,R.K.(1998) Genetics of radionuclide-contaminated mosquitofish populations andhomology betweenGambusia affinisand G.holbrooki. Environ. Toxicol.Chem., 17, 1992–1998.
Warren,A.J., Maccubbin,A.E. and Hamilton,W. (1998). Detection of mitomycinC–DNA adductsin vivo by 32P-postlabeling: time course for formation andremoval of adducts and biochemical modulation.Cancer Res., 58, 453–461.
Welsh,J. and McClelland,M. (1991) Genomic fingerprinting using arbitrarilyprimed PCR and a matrix of pairwise combinations of primers.NucleicAcids Res., 19, 5275–5279.
Williams,J., Kuberlik,A., Livak,K., Rafalski,J. and Tingey,S. (1990) DNApolymorphisms amplified by arbitrary primers are useful as genetic markers.Nucleic Acids Res., 18, 56–78.
Received on November 10, 1998; accepted on April 29, 1999

131
ANEXO 2.3
DNA FINGERPRINT COMPARISON OF RAINBOW TROUT AND RTG-2
CELL LINE USING RANDOM AMPLIFIED POLYMORPHIC DNA. (2001)
ECOTOXICOLOGY, Vol. 10, nº 2, 115-125
Páginas 132 a 143


ANEXO 2.4
DETECTION BY RAPD OF GENETIC ALTERATIONS IN VITRO.
AMPLIFICATION AND CONSERVATION CONDITIONS OF DNA EXTRACTS.
(2002)
TOXICOLOGY METHODS. Vol. 12 nº 1 (en prensa)
Páginas 145 a 167

Detection by RAPD of genetic alterations in vitro.
Amplification and conservation conditions of DNA
extracts.
Concepción Becerril1 , Mar Ferrero and Argelia Castaño2. 1Toxicology Department, CNA, I.S. Carlos III. E-28220, Majadahonda, Madrid, Spain and
2Division of Environmental Toxicology, CISA-INIA, E-28130, Madrid, Spain
1Please contact us at Tf. +34 91 5097900; Fax: +34 91 5097926; E-mail: [email protected] This work was supported by Spanish project CYCIT AMB97-0431-CO2

ABSTRACT
The technique of random amplified polymorphic DNA (RAPD) permits the
study of genetic ecotoxicology without the problem posed by the high number
of chromosomes generally presented by fish species for traditional methods.
Additionally, the use of in vitro systems allows us to increase the number of
samples in environmental risk assessment studies.
Good standardization of the parameters involved in the RAPD reaction,
such as primer concentration, the DNA template used and its integrity is
fundamental for obtaining reliable and repetitive results. This is specially
important when the differences in the DNA fingerprints between control and
exposed cells to genotoxic agents are interpreted as toxic-dependent
alterations. The use of more than one primer increases sensitivity in the
detection of such differences, provided the amplification is carried out in
optimum conditions. In this report we show how the conditions established for
certain primers in previous studies can be acceptable for others, independently
of the complexity of band patterns generated.
Furthermore, the integrity of the DNA is shown to be stable for several
months- in the genomic extracts stored at 4ºC, which to a large extent facilitates
the application of this methodology.
Key word: RAPD, Genotoxicity, DNA alteration, MMC, DNA stability,
RTG-2 fish cell line.

INTRODUCTION.
The increasingly frequent application of in vitro systems in toxicology is
demonstrating the usefulness of alternative systems in the first stages of risk
assessment of chemicals.
In environmental risk assessment procedures, and specifically in the
evaluation of environmental pollutants, in vitro models are particularly useful
because their low cost permits to process a high number of samples and, in
contrast to the in vivo studies, the environmental conditions of the assays are
easily controllable.
The established fish cell line RTG-2 derived from gonadal tissue of
rainbow trout (Oncorrynchus mikyss) (1) has been widely used in cytoxicity and
genotoxicity studies, showing a good correlation with in vivo bioassays (2, 3).
Its use, together with molecular techniques, allows to perform genetic
ecotoxicology studies without the problem the high number of chromosomes,
characteristic of this species, has presented for traditional genotoxicity tests.
The Random Amplified Polymorphic DNA (RAPD) technique developed
by Williams et al., (4) is a modification of the PCR technique that uses short
sequence primers and low annealing temperature. Under these conditions, the
primer links itself to various areas of the genome generating multiple
fragments that, once developed using electrophoresis in agarose gels, form a
template of bands specific for the genomic DNA used.
In the past few years this methodology has been applied to taxonomic
studies and identification of species (5-8). In genetic ecotoxicology it has shown
to be efficient for the detection of mutations (9-17), and for the detection of

modifications in the genetic diversity of the exposed populations (18, 19).
This technique has been associated with lack of homogeneity in the
results for a number of reasons. Among them, variations in temperature profiles,
particularly the annealing temperature (20-22), different thermostable DNA
polymerases, salt concentrations (23) etc., can lead to a lack of reproducibility.
Aside from these factors, the primer and template concentrations are
critical because they affect the products quantitatively (24, 25), and must be
established and adjusted before initiating any study. When the protocols have
been established very carefully, the results are sensitive and repetitive. (12).
Good standardization of each one of the parameters involved in the
reaction is especially important when this technique is used for the detection of
genotoxic alterations. In these studies small variations in the band pattern
such as modification in intensity, loss and/or gain of bands are interpreted as
alterations undergone by the DNA after being exposed to genotoxic agents.
In previous studies, the concentrations of genome and primer were
established for the detection of changes in the DNA of RTG-2 cells exposed to
Mitomycin C (MMC), using a primer that generated multiple fragments,
between 1075 and 430 bp (12).
Since the best approach for this type of researches is the use of a
battery of primers (26), in this study selected conditions of amplifications are
evaluated to establish whether they can be generalized for any of the primers
selected.
Furthermore, and independently of the standardized parameters,
obviously the integrity of the DNA template is fundamental to the
reproducibility of the results. The integrity of the DNA template depends on the

extraction method, the time and the storage conditions. Black (27) found
changes in RAPD patterns due to template DNA degradation during freezing
and thawing on consecutive days. Due to this, the DNA degradation occurring
in the genomic extracts is evaluated additionally in this study over a period of
almost two years.
For this:
a) The integrity of the DNA of 18 genome extracts stored at 4ºC
over a period of almost two years was monitored .
b) The genomic DNA originated from RTG-2 control cells and
exposed to 1 µg/ml of MMC for 4 hours was amplified using a
primer whose band pattern is made up of a single amplification
product.
MATERIAL AND METHODS
Culture cells
RTG-2 cells (28) from an established fibroblastic cell line obtained from
rainbow trout (Oncorhynchus mykiss) were grown in Minimum Essential
Medium Eagle with Earle´s salts (EMEM), supplemented with 10% fetal serum,
100 U/ml penicillin, 100 g/streptomycin, 1.25 µg/ml fungizone and L-glutamine
2mM, in PVC tissue culture flasks (Costar, Corning, NY) and incubated at 20 ±
1ºC in 5% CO2/air atmosphere.
Exponential growing cells were exposed to 1 µg/ml MMC (Sigma, St
Louis, MO) for 4 h. After this time the medium was withdrawn and after
washing with pH 7.3 Phosphate Buffered Saline Solution (PBS), fresh medium

was added and the cells were left to grow for a further 72 h (approximately
one and a half cell cycles).
Two 75 cm2 flasks were used for each of the exposure times and also
for the control. The experiment was repeated twice on different days.
ADN extraction and RAPD amplification.
Cells were dissociated with trypsin-EDTA (Flow Laboratories,
Riskmansworth, UK), collected in BPS pH 7.3 and centrifuged at 3000 rpm for
10 min.
The DNA was extracted with phenol and the concentration and purity of
DNA were calculated, with an additional reading at 320 nm, (Lamda 2, Perkin-
Elmer, Branchburg, NY) (26). Its integrity was checked by electrophoresis in
0.8% agarose gels using λ Phage DNA native as molecular weight marker
(Eurobio, Paris, France).
The genome extracts were aliquoted in Eppendorf tubes and stored at
4ºC for a total of twenty one months.
The amplifications were carried out in a volume of 25 µL,
containing a buffer solution of Mg Cl2, 2 U Stoffel fragments (Perkin-
Elmer, Branchburg, NY) and 0,2 mM of each of the dNTP (Pharmacia,
Barcelona, Spain). The DNA template and primers were added in
different concentrations.
The RAPD protocol used consisted of an initial denaturing step of 3 min.
at 92ºC, followed by 45 cycles at 92ºC for 25 s (denaturation), 36ºC for 75 s
(annealing), and 72º C for 6 min. (extension). Five additional cycles were
programmed at 92 ºC for 20 s, 36 ºC for 75 s, and 72 ºC for 7 min. Cycling

was concluded with a final extension at 72 ºC for 7 min. The thermal cycler
used was a Perkin-Elmer, mod. 2400.
The primer used was D-4 (5´-CTGTAGCATC-3´) (supplied by the
Biopolymers Department of the CNBCR, I.S. Carlos III, Majadahonda, Madrid,
Spain). This primer was selected because it generates only one amplification
product as opposed to the previously studied primer, which generates multiple
products (12).
All DNA amplifications were carried out in duplicate and were repeated
two or four times on different days.
Amplification products (22 µL), together with a molecular weight marker
(Marker VI, Roche, Germany), were resolved electrophoretically on 2.1%
agarose gels at 150 V for 4 hours and stained with ethidium bromide. The
image was recorded by the Grab-it program (UVP, USA) and the band
intensity was analyzed by densitometry (Gelworks 1D, UVP, USA).
Checking of optimum concentrations
Firstly, the cell control fingerprint was checked at different concentration
levels: 20, 15, 10, and 5 ng DNA template and 6, 5, 4 and 2 pM primer.
To check the validity of this primer in the optimum conditions previously
selected, (5 ng of DNA template and 4 pM of primer) (12) genomic DNA from
control and exposed cells (20, 10, 5 y 2 ng/µL) was amplified using 4 pM of
primer. To check the results and avoid possible artifacts, the control and
exposed genomic DNA were amplified in duplicate and run in the same gel.
The possible qualitative and quantitative differences between the DNA
from control and exposed cells in the agarose gels were analyzed by

densitometry (Gelworks 1D; UVP). The quantitative analysis was carried out
by comparing peak height between control and exposed cells.
For statistical analysis all individual data on control and treated cells
from the different experiments were considered together. The data were
analyzed using the Mann-Whitney U-test.
Genomic DNA extract stability stored at 4ºC.
A total of 18 genomic DNA extracts (42-18 µg/µL) were stored at 4ºC for
21 months. To monitor the stability of these extracts, the concentration and
integrity of the genomic DNA were checked using the previously described
method. These tests were carried out at regular intervals for each of the stored
extracts (0, 3, 6, 9, 15 y 21 months).
RESULTS
Optimum DNA template concentration.
The D-4 primer shows a constant band at 578 bp in all the genome and
primer conditions tested. Furthermore, when primer concentrations of 6 and 5
pM are used in the reaction, a variable number of erratic fragments of different
molecular weights appear (Fig.1), independently of genomic DNA
concentrations tested (20 – 5 ng).
When the DNA template concentrations used in this study are amplified
with 4 pM of primer, the erratic fragments, though present in some
amplifications, are of such low intensity that they can effectively be considered
as non-existent. When the primer concentration is decreased to 2 pM the
erratic bands disappear (Fig. 1).

Figure 2, shows the quantitative differences in amplification intensity of
the 578 bp fragment between control and exposed cells when genome
concentrations of 10 ng or less are used.
These differences, quantified using peak height values, were
statistically significant for 10 and 5 ng of genome template (p<0.05 y p<0.001
respectively) (Table1). At lower concentrations (2 ng) quantitative analysis
was not possible due to frequent amplification losses of the DNA from the
exposed cells (Fig.2).
Stability of genomic DNA at 4ºC.
The spectophotometric studies carried out show DNA concentrations
similar to initial concentration in all the extracts at all times (Fig 3).
The electrophoretic studies showed that genomic DNA was intact in
100% of the extracts during the first 9 months of storage. After this period, only
45.5 and 28.3% of the extracts (at 15 and 21 months respectively) maintained
their integrity (Fig.4).
Accordingly, the DNA extracted in the manner described and stored at
4ºC can be used as a template in the RAPD amplifications for at least nine
months after its extraction.
DISCUSSION.
Detection of genotoxic effect using these techniques involves the
comparison of band patterns generated from control (unexposed) and treated
(exposed) DNA from a set of previously selected primers.

Differences in profiles such as variations in the band number or
changes in amplification intensity of some of the bands show alterations in the
DNA sequence of exposed cells.
Such changes are attributed to a loss or gain of a priming site owing to
specific mutations at one or both primer annealing sites on the DNA strand
and/or large deletions and/or homologous recombination in a sufficient number
of cells. The changes in amplified band fluorescence can be due, aside from
the changes already described, to the presence of bulky adducts that
potentially block the PCR enzyme (10, 24).
Given the existence of a variety of genotoxic contaminants with different
mechanisms of action on the DNA, the possibility of showing this variety of
damage will depend on the possibility of amplifying different regions of the
genomic DNA of the exposed cells.
It is to be expected that the profiles obtained from a wide set of primers
increase the sensitivity in the detection of differences between control and
exposed DNA. However, although a good amplification can be obtained in a
wide range of DNA and primer concentrations, each oligonucleotide provides
an optimum value depending on the number of bands obtained (26), and the
affinity of the DNA template-primer in specific work conditions (23). It is
important, thus, to verify the optimum amplification characteristics of the
primers used.
On the other hand, not all optimum primer and genome concentrations
show differences in control and exposed amplification profiles. In a cellular
population exposed to genotoxic agents a certain proportion of DNA copies
can be remain intact, and if the number of unaffected copies present in the

DNA template is sufficient, the primer finds sections where it can hybridize and
the characteristic band pattern is therefore not altered.
From a pragmatic point of view, if we can establish similar conditions for
a set of primers, the assays could be obviously simplified.
Previous studies have shown that lower genome and primer
concentrations (2 ng / 2 pM) for obtaining the fingerprint, are optimal for this
primer (26), but, as we have demonstrated in this study, these low
concentrations are responsible for a varying amplification loss of the exposed
genomes, making quantitative dose (concentration) / response (effect) studies
more difficult.
If we compare the 578 bp band height after amplification with 4 pM of
primer and 20 - 2 ng of genomic DNA of control and exposed cells to MMC,
only the amplifications carried out with 10 and 5 ng of genome show significant
statistical differences (p<0.05 y p<0.001 respectively) (Table 1). At
concentrations of 2 ng, genomic DNA obtained from exposed cells did not
always amplify, indicating that the number of damaged copies at this
concentration were not sufficient to visualize the product generated. (Fig.2)
This shows that the primer and DNA template (4 pM and 5 ng
respectively) conditions chosen are adequate for detecting quantitative
differences between control and exposed genomic DNA.
These conditions, which are coincident with those already established
for the first primer (12), suggest its suitability, independently of the number of
fragments that are generated.
The in vitro studies, as mentioned before, have the advantage of
simultaneously evaluating a large number of samples. On some occasions this

involves extracting the DNA from a large number of samples simultaneously,
to be subsequently processed.
The process of freezing and thawing can negatively affect the integrity
of the genome (27), not permitting results with sufficient precision and
reliability. This fact is often not detected by the operator. Furthermore, in
many cases the DNA content present in each aliquot of the extract is low and
does not permit to carry out of electrophoresis to check the integrity of the
DNA each time it is used.
In our work conditions, 100% of the extracts stored at 4ºC maintain
their integrity for nine months. Beyond this time, although DNA concentration
in the extract remains practically constant (Fig.3), the integrity decreases and
should not, therefore, be used as a template in the RAPD reaction.
The methodological advance offered by the RAPD technique in the
detection of DNA alterations after exposure to genotoxic agents depends to a
large extent on an effective standardization of all the parameters involved in
the reaction. The possibility of storing genomic extracts at 4ºC, and the use of
different primers with the same protocol considerably facilitates the application
of this methodology.
Acknowledgements
We thank Carmen Rodríguez for the RTG-2 cell line maintenance.

REFERENCES
1. Wolf, K. and Quimby, M.C. (1969). Fish cell and tissue culture. Ed. W.S.
Hoar and Randall, Fish Physiology, vol 3 N.Y. Academic Press,
2. Castaño, A., Cantarino, M.J., Castillo, P. and Tarazona, J.V. (1996).
Correlations between the RTG-2 cytotoxicity test EC50 and in vitro LC50
rainbow trout assay. Chemosphere 32, 2141-2157
3. Becerril, C.; Acevedo, H.; Ferrero, M.; Sanz, F. and Castaño, A. (2001).
DNA fingerprint comparison of rainbow trout and RTG-2 cell line using
random amplified polymorphic DNA. Ecotoxicology 10, 115-124
4. Williams, J., Kuberlik, A., Livak, K., Rafalski, J. and Tingey, S. (1990). DNA
polymorphisms amplified by arbitrary primers are useful as genetic markers.
Nucleic Acids Res, 18, 56-78
5. Al-Zahim, M., Newbury, H.J. and Ford-Lloyd, B.V. (1997). Classification of
genetic variation in garlic (Allium sativum L.) revealed by RAPD.
HortSciences 32, 1102-1104
6. Terzi, V. (1998) RAPD markers for fingerprinting barley, oat and triticale
varieties. Journal of Genetics Breeding 51, 115-120
7. Mohan, M., Nair. S., Bhagwat. A., Krishna, T.C., Yano, M., Bhatia, C.R.
and Sasaki, T. (1998) Genome mapping, molecular markers and marker-
assisted selection in crop plants. Molecular Breeding 3, 87-103
8. Henry R.J., Ko H.L. and Weining S. (1997). Identification of cereals using
DNA-based technology. Cereal Food World 42, 26-29
9. Atienzar, F., Child, P., Avenden, A., Jha, A., Savva, D., Walker, C. and
Depledge, M. (1998). Application of the arbitrarily primed polymerase
chain reaction for the detection of DNA damage. Marine Env. Res. 46,

331-335
10. Atienzar, F., Conradi, M., Avenden, A., Jha, A., and Depledge, M. (1999).
Qualitative assessment of genotoxicity using RAPD: comparison of
genomic template stability with key fitness parameters in Daphnia magna
exposed to benzo(a)pyrene. Environ. Toxicol. Chem. 18, 2275-2282
11. Atienzar, F., Cordi, B., Donkin, M.E., Evenden, A.J., Jha, A.N. and
Depledge M.H. (2000). Comparison of ultraviolet-induced genotoxicity by
random amplified polymorphic DNA with chlorophyll fluorescence and
growth in a marine macroalgae Palmaria palmate. Aquatic Tox. 50, 1-12
12. Becerril, C.; Ferrero, M.; Sanz, F. and Castaño, A. (1999). Detection of
mitomycin C-induced genetic damage in fish cells by use of RAPD.
Mutagénesis 14, 449-456.
13. Conte, C., Mutti, I., Puglisi, P., Ferrarini, A., Regina, A., Maestri, E. and
Marmiroli, N. (1998) DNA fingerprinting analysis by a PCR based method
for monitoring the genotoxic effects of heavy metals pollution.
Chemosphere 37, 2739-2749
14. Kubota, Y. Shimada, A. and Shima, A. (1992). Detection of Gamma ray
induced DNA damages in malformed dominant lethal embryos of the
Japonese medaka (Orycias latipes) using AP-PCR fingerprinting. Mut.
Res. 283, 263-270
15. Kubota, Y. Shimada, A. and Shima, A. (1995). DNA alterations detected in
the progeny of paternally irradiated Japonese medaka fish (Orycias
latipes). Proc. Natl. Acad.Sci. USA 92, 330-334
16. Savva, D. (1996). DNA fingerprinting as a biomarker assay in ecotoxicology.
Tox. Ecotoxicol. News 3, 110-140

17. Savva, D. (1998). Use of DNA fingerprinting to detect genotoxic effects.
Ecotoxicol. Environ. Safety 41, 103-106
18. Theodorakis, C.W. and Shugart, L.R. (1997). Genetic ecotoxicology II:
population genetic structure in mosquitofish exposed in situ to radionuclides.
Ecotoxicology 6, 335-354
19. Theodorakis, C.W., Bickman, J.M., Elbi, T., Shugart, L.R. and Chesser, R.K.
(1998). Genetics of radionuclide-contaminated mosquitofish populations and
homology between Gambusia affinis and G. holbrooki. Environ. Toxicol.
Chem. 17 1992-1998
20. Meunier, J. R. And Grimont, P. A. D. (1993) Factors affecting
reproducibility or Random Amplified Polymorphic DNA Fingerprinting. Res.
Microbiol. 144, 373-379
21. Penner, G. A., Bush, A., Wise, W., Kim, W., Domier, L., Kasha,K.,
Laroche, A., Scoles, G., Molnar, S.J. and Fedak, G. (1993) PCR Methods
and Applications 2 341-345
22. Schweder, M. E., Shatters, R. G., West, S. H. and Smith, R. I. (1995)
Effect of transition interval between melting and annealing temperature on
RAPD analysis. Biotechniques 19, 38-42
23. Hilton, A. C., Banks, J. G. And Penn, C. W. (1997) Optimization of RAPD
for fingerprinting Salmonella. Lett. Appl. Microbiol. 24, 243-248
24. Muralidharan, K. and Wakeland, E.K. (1993) Concentration of primer and
template qualitatively affects products in Random-Amplified Polymorphic.
Biotechiques 14, 362-364
25. Davin-Regli, A., Abed, Y., Charrel, R. N., Bollet, C. and Micco, P. (1995)
Variations in DNA concentrations significantly affect the reproducibility of

RAPD fingerprint patterns. Res. Microbiol. 146, 561-568
26. Ferrero, M., Castaño, A., Gonzalez, A., Sanz, F. and Becerril, C. (1998).
Characterization of RTG-2 fish cell line by random amplified polymorphic
DNA. (1998) Ecotoxicol. Environ. Safety. 40, 56-64
27. Black, W.C. (1993) PCR with arbitrarily primers: approach with care. Insect
Mol. Biol. 2, 1-6
28. American Type Culture Collection. (1988). Catalogue of Cell Line &
Hibridomas. Ed. Hay R., Marvin, M. C., Chen, T. R., McClintock, P. and
Reid, Y. 6ª Ed. Rockville, Maryland.

TABLE 1. Average data on height with 20, 15, 10 and 5 ng of genomic DNA for control and exposed
cells (C and E respectively) for the band making up the fingerprint of D-4 primer.
20 15 10 5 C E C E C E C E
163 ± 14.1 154 ± 26.7 153 ± 22.5 143 ± 24.9 155 ± 26,3 102 ± 11,8a 147 ± 12.8 66 ± 18,5 c
Values are mean ± SD of 8 amplifications. Significant differences versus control. aP < 0.05, bP < 0.001, cP <
0.0001 by Mann-Whinney test.
Height ± SD
Exposure
ng DNA
FIGURES LEGENDS
Fig. 1. Fingerprints generated from DNA obtained from control cells using
different concentrations of genome and primer. Using 6 and 5 pM of primer
the amplifications show erratic bands of different molecular weights. (mw:
molecular weigh marker)
Fig. 2. Comparison of the amplification intensity at different genomic DNA
concentrations from control and exposed cells.
a) Differences in the amplification intensity are observed upwards of 10
ng of genomic DNA, (E exposed, C control), there with no
amplification at lower concentrations tested.
(1, 2, 3, 4 and 5 amplifications using 20, 15, 10, 5 and 2 ng of
genomic DNA respectively).
b) Electrophoretic profile of control and exposed cells with 10 and 5
ng genomic DNA.
Fig. 3. Variations in the DNA concentration in the extracts and times studied.
Fig. 4. Checking Gel of genomic DNA integrity. Lanes a shows the presence
of a high molecular weight band which indicates the good state of conservation
of the genomic DNA, 0 month (a1) and 9 months (a2) after extraction.
However, the smear showed by lanes b is a consequence of the
disintegration of the DNA present in the extracts, 15 months (b1) and 21
months (b2) after extraction. (mw: molecular weigh marker)


0
5
10
15
20
25
30
35
40
45
E1 E2 E3 E4 E5 E6 E7 E8 E9 E1 E12 E13 E14 E15 E16 E17 E18
Genomic Ex
ng o
f gen
omic
DN
A
T0 T1 T2 T3 T4
Figura 3. Variations in the DNA concen in the extracts and times
0 E11
tracts
tration


ANEXO 3
PUBLICACIONES (en proceso de aceptación)

167
ANEXO 3.1
IN VITRO ASSESSMENT OF DNA DAMAGE AFTER CHRONIC EXPOSURE
TO B(A)P USING RAPD AND THE RTG-2 FISH CELL LINE. (Enviado a la
revista ATLA)
Páginas 170 a 197

IN VITRO ASSESSMENT OF DNA DAMAGE AFTER CHRONIC
EXPOSURE TO B(A)P USING RAPD AND THE RTG-2 FISH
CELL LINE.
Concepción Becerril1,, Helda Acevedo1, Mar Ferrero1, Teresa Llorente2,
and Argelia Castaño2.
1Toxicology Department, I.S. Carlos III, E-28220 Majadahonda, Madrid, Spain;
and 2Division of Environmental Toxicology, CISA INIA, E-28130, Madrid, Spain.
Address for correspondence: Concepcion Becerril, Toxicology Department, C.N.A, I.S. Carlos III. Majadahonda, 28220-Madrid. Spain. e-mail: [email protected]

SUMMARY
Persistent and ubiquitous chemicals are nowadays sources of relevant
environmental problems when considering the genotoxic effects associated with
chronic exposure of natural populations. The high genetic similarity index
between in vitro RTG-2 cells and in vivo rainbow trout individuals, showed by
means of the RAPDs technique, allows to detect the genotoxic effects of
chemicals by comparing DNA fingerprints from unexposed and exposed
individuals. This study evaluates the capacity of RTG-2 cell lines together with
the RAPD technique, in the detection of genotoxic effects on DNA after chronic
exposure to B(a)P. RTG-2 cells were exposed for 3, 15 and 30 days to
0,05µg/ml B(a)P. After comparing control and exposed cells’ DNA fingerprints
both qualitatively and quantitatively, an increase in the instability of the exposed
cells’ DNA in a time dependent manner is shown. The sensitivity of the
detection the sequence of primer used showing the existence of a B(a)P’ hot
spot in the DNA sequence. Two of the primers showed altered bands after only
three days of exposure reaching 50% after the longest exposure period. Also
the appearance of new bands was observed with a 100% level of reproducibility
after 30 days of exposure. This work shows the usefulness of in vitro systems in
population studies, considering cells as genetically homogenous populations,
permitting us to undertake both acute and chronic studies, avoiding the
inconveniences that studies in natural populations have.
Key words: Chronic effects, genotoxicity, fish cells, RAPD, DNA
fingerprint, B(a)P.

INTRODUCTION.
Persistent and ubiquitous chemicals are nowadays sources of relevant
environmental problems when considering natural populations. Environmental
attacks diminish an ecosystem’s ability to maintain productive and adaptable
populations of organisms (1). Stochastic and deterministic demographic,
environmental, and genetic factors contribute to a population’s or a species’
viability. Maintaining adequate levels of genetic diversity within and amongst
populations is a critical aspect to consider (2).
Sustainable environmental development depends to a large extent on our
capacity to monitor the effects that such chemicals may have upon ecosystems.
Field studies have shown that continual exposure to certain contaminants
produce a selective pressure on the affected populations, altering the alleles
frequency of the most sensitive genotypes, and, a decrease in the reproduction
and survival rate later on. (3). Moreover, laboratory toxicity studies show that
chemically-induced mortality was dependent on genotype, suggesting that
genotype frequencies are mediated by selection for certain alleles during
toxicant exposure. (4, 5)
These types of effects have a great importance because they can
manifest themselves long after the source of contamination has been
eliminated (6).
A large number of biomarkers have been developed over the last couple
of decades, in order to be employed in environmental monitoring studies. These
biomarkers show the toxic effects caused by exposure to high concentrations of
mutagenic and clastogenic chemicals to individuals, but uncertainty exists

concerning the potential genotoxic effects associated with chronic exposure to
low levels of pollutants at a higher level of organization (population, community
and ecosystem) (7)
Recent advances in molecular technology have opened a new chapter in
the evaluation of a wide range of effects and in species conservation efforts.(2)
Allozyme variation (8, 9), nuclear or mitochondria restriction fragment
length polymorphism (RFLP) (10, 11) DNA sequencing and Random Amplified
Polymorphic DNA (RAPD) (12-14) are examples of these.
Nevertheless, in vivo chronic studies on populations are time consuming
and expensive and involve such a high number and complexity of variables that
the evaluation of results is very difficult. The studies carried out up till now have
focused on almost confined populations, for which there were reliable controls
available and a precise understanding of the studied contaminant. (1, 3, 15, 16).
Although the use of the in vitro tests are widely accepted in the testing
sequence of genotoxicity of chemicals, this testing is used to assess effects at
an individual level. However, these systems, formed by genetically
homogeneous individuals in a controlled environment, can contribute to a better
understanding of the genotoxic effects at a population level.
This population homogeneity linked to the choice of an adequate
molecular technology have provided new tools for the detection of genetic
alteration, by looking directly at the level of DNA sequence and structure of
populations. RAPDs can be used for this purpose, because differences can be
shown when comparing DNA fingerprints from unexposed and exposed
individuals to genotoxic agents (7,17-24).

In previous works we have proved both the capability of rainbow trout
derived cells, the RTG-2 cell line, and the RAPD technique to detect acute
effects of known genotoxic chemicals (24). The high genetic similarity index
between in vitro RTG-2 cells and in vivo rainbow trout individuals (25) allows
this in vitro system, together with the RAPD technique, to show the genotoxic
effects after chronic exposure periods of a known persistent water pollutant.
Polycyclic aromatic hydrocarbons (PAHs), chiefly produced by the use of
fossil fuels, are ubiquitous at low concentrations and their presence in water
during long periods of time, has been related with a high incidence of hepatic
tumours in fish (26). Benzo(a)Pyrene is one such PAH and is classified by EPA
as a priority pollutant due to its persistence, carcinogenicity, high
bioaccumulation factor and biomagnification capability through the food chain.
(27)
After being swallowed and metabolised by live organisms the B(a)P
transforms itself into highly reactive chemicals one of which B(a)P-7,8-diol-9,10
epoxide metabolite (BPDE) is able to bind covalently to DNA and alkali-labile
apurinic sites on DNA inducing mutations such as substitution of bases,
frameshifts, insertions and deletions, some of which correlate with tumour
initiation and progression. (28)
Some established cell lines derived from poikilothermic organisms have
B(a)P metabolising ability (30). The RTG-2 cell line is one of them and can
convert B(a)P to intermediate actives (31). For this reason this cell line has
been used in cytotoxicity and genotoxicity studies after acute exposure to
B(a)P. (32, 33)

In this work RTG-2 cells are exposed during 3, 15 and 30 days to low
concentrations of B(a)P (0,05µg/ml) and its genotoxic action is measured
using the RAPD technique.
MATERIALS AND METHODS
Cell Cultures
The RTG-2 fish cell line (34), an established fibroblastic cell line derived from
rainbow trout (Oncorhynchus mykiss), was grown in Eagle Minimum Essential
Medium with Earle’s salts (EMEM), supplemented with 10% foetal serum, 100
U/ml penicillin, 100 µg/ml streptomycin, 1.25 µg/ml fungizone, 2 mM L-
glutamine and 1% non- essential aminoacids (complete medium) in PVC tissue
culture flasks (Costar, Corning, NY) at 20 ± 1ºC in 5% CO2/air atmosphere. For
cell subcultures, cells were detached from the substratum with trypsin-EDTA
(Flow, Laboratories, Rickmansworth, UK), re-suspended in culture medium and
split into three new flasks.
Toxic exposure
Cells, in their exponential growth phase, were exposed to 0.05 µg/ml,
Benzo(a)Pyrene (B(a)P) (CAS nº 50-32-8, Sigma, USA) in complete medium for
3, 15 and 30 d. The selected concentration did not show genotoxic effects in
acute assays with these same cells (35). Dimetil sulfoxide (DMSO) at 0.1% in
complete medium was included as solvent control. A negative control (complete
medium alone) was also included for each exposure period.

When cells reached confluence (after 15 and 30 days of exposure) flasks
were subcultured at a 1:3 proportion. Exposure was contined in the same
conditions in one of the subculture flasks and the other two are discarded.
On finishing each of the established exposure periods for the assay, the
medium was removed and after being washed with phosphate-buffer saline
(PBS, pH 7.3), the cells were detached from the substratum with trypsin-EDTA
and collected in PBS in order for their subsequent analysis.
Two 75 cm2 flasks were used for the both control and exposed cells for
each exposure period. The experiment was repeated on two different days.
DNA extraction and RAPD reaction
The DNA was extracted separately from each of the replicates by phenol-
chloroform. Its integrity was checked by electrophoresis in 0.8% agarose gels
using λ Phage DNA native as a molecular weight marker (Eurobio, Paris,
France). The RAPD protocol was performed with 5 ng of DNA per reaction (36;
24) in a Perkin-Elmer model 2400 Thermalcycler, using four primers previously
selected for their good in vivo / in vitro correlation (25). The primers were
obtained from the Biopolymers Department of the CNBCR, (I.S. Carlos III,
Majadahonda, Madrid). The selected primers were: 5´-GATCCATTGC-3´ (AA-
82); 5´GGGCCTCTGAT-3´ (AA-89); 5´-AGCACTGTCA-3´ (C-96); 5´-
CCAAGTCGACA-3´ (D-8)
Amplification products were resolved electrophoretically on 2.1% agarose
gels and stained with ethidium bromide. The image was recorded by the Grab-it
program (UVP, USA).
For greater accuracy in the comparison of the results both the control
and the exposed DNA extract were run in the same gel. A negative control

reaction without DNA template, and a molecular weight marker (marker VI,
Roche, Germany; or φX174-Hae III EUROBIO, France) were also included in
the same gel. The bands were coded following the system described by
Theodorakis and Shugart (1997) (3, 25)
Analysis of the results.
The image captured of each of the agarose gels was analysed by
densitometry (Gelworks 1D, UVP, USA), and the fluorimetric profiles of each
amplification reaction were studied both qualitatively and quantitatively.
Qualitative analysis was established by comparing the percentage
appearance/absence of each of the bands present in the amplification profiles
of the control and exposed DNA extracts.
Following the criteria established in a previous study, (24) the
amplification bands for each of the primers were grouped together according to
high, medium and low molecular weight in function of their amplification profile
(Figure 1)
Quantitative analysis was performed taking as a comparative parameter
the percentage of amplification of each of the bands, after the densitometric
analysis of the control and exposed cells’ profiles both in individual bands and
when bands are grouped together.
The statistical tests used were the Student t-test and the Mann-Whinney
U-test.

RESULTS
Both the quantitative analysis and the qualitative analysis show an increase in
the instability of the exposed cells’ DNA, depending on the toxic exposure
period.
The sensitivity of the detection depended on the sequence of the primer
used. The profiles that showed the greatest alterations were those that
corresponded to the primers AA-89 and AA-82. Two of the bands (AA-891225
and AA-821075) are significantly altered after only three days of exposure, with
an increase in both primers the number of altered bands as the length of
exposure increased, reaching close to 50 % after 30 days. (Table I)
The primer fingerprint C-96 is the most stable one, with one of the eight
bands that is amplified (C-961714) showing significant statistical differences with
respect to the controls at 15 and 30 days. The fluorimetric profile of the primer
D-8, although remaining constant during the first two periods of exposure, alters
drastically (up to the 40% of its bands) at 30 days of exposure. (Table I)
The time-dependent toxicant action of the B(a)P is clearly shown in the
analysis of grouped bands with the primers AA-82 and AA-89. At 30 days of
exposure both the high molecular weigh bands and those of low molecular
weight are altered, presenting the former a decrease in their intensity of
amplification, with those of medium and low molecular weight showing a
proportional increase.(Figure 2)
In the qualitative study, the primer’s fingerprints AA-82 and AA-89 were
also the most affected by the toxicant, although terms, in general, the absence
of bands of low fluorescence is observed also in a time-dependent manner (C-
961714, AA-82700). (Table II)

Perhaps the most outstanding result was the appearance, after 15 days
of exposure, of new additional bands: D-8936, AA-82620,402 and AA-89484.
Although the frequency of the appearance of these bands showed a very low
reproducibility. (Figure 3)
In contrast to what was expected, when the exposure period was
increased to 30 days the number of extra bands was reduced (AA-89484, AA-
82620), but their reproducibility increased to 100% in all of the DNA extracts
analysed. (Figure 4)
DISCUSSION
Environmental stress is just one of many potential causes for the reduction of a
standing variation within a population. Altered genetic diversity was shown in
fish populations living in sites affected by anthropogenic stressors, when
compared with those living in unpolluted areas. The DNA-profile allows the
detection of both chronic and acute exposure to stressors within populations
with low migration rates, but the availability of reference populations is a
prerequisite. (1, 3, 15, 16)
The need of control populations and the inherent difficulties associated
with field studies ( ranging from the climatic conditions of sampling, to the
variety of size, age and sex of the individuals captured, etc.) limits the fulfillment
of risk assessment studies in natural populations, particularly to evaluate
chronic situations.
These problems can be minimized, in studies of the direct damage to
DNA, using cell cultures from representative species of fish. Both due to the

strict control of the experimental conditions and the characteristics of a
genetically homogenous population.
In vitro systems generate, by means of the RAPD technique, a specific
and constant DNA fingerprint allowing for the detection of alterations in the DNA
when comparing the fingerprints of control and exposed cells. The
aforementioned alterations can be visualized in the DNA fingerprint as
presence and/or absence of bands and/or alterations in their amplification
intensity. (17-24).
This study evaluates the capacity of RTG-2 cell lines together with the
RAPD technique, in the detection of chronic effects on DNA after exposure to
B(a)P. The high level of similarity of this in vitro system with the species that it
originates from, and the use of a set of primers previously selected for their
good in vivo-in vitro correlation (25), allow to evaluate the before mentioned
effects .
The sensitivity of he detection depends on the primer. Two of the four
used (the AA-89 and AA-82) clearly show a greater alteration after the exposure
to B(a)P, confirming the specificity of the mechanism of action this compound
with a hot spot in the DNA sequence (28). Thus, after three days of exposure
(1,5 cell cycles) and despite the RTG-2 cell line is able to convert 63% of the
B(a)P to water-soluble metabolites (29-31) both qualitative and quantitative
alterations are detected (Table I, II) The presence of bulky adducts that block
the enzyme, and/or errors produced in the DNA replication are probably the
cause of these early alterations. The mutation spectra resulting from DNA
modifications by B(a)P are quite complex and depend on the sterochemistry of
the adducts. These adducts have been shown to be capable of inducing base

substitution, frameshifts, insertions and deletions in specific sites of the DNA
(28). These alterations can induce changes in the DNA sequence of a specific
form generating new annealing primer-template sites.
Only when these alterations are present in sufficient numbers of cells,
exceeding a mutation index of 10%, can they be seen in agarose gels (23). This
would be in accordance with the presence of new bands in the amplification
profiles originating from the cells exposed during 15 days. However, the nature
of the RAPD’s reaction, where the final products are the result of an exponential
multiplication of the most abundant and stable fragments co-amplified in the first
cycles, is the cause that these band ocasionaly are not reproductible in all
cases. (37). (Figure 3)
Therefore, of the four amplified bands that appeared after 15 days of
exposure two of them (AA-89484, AA-82620) not only persist after 30 days, but
are present in 100% of the amplifications carried out. (Figure 4) This suggests
as much the inheritability of aforementioned genetic alteration as an increase in
the mutation index. These changes in the sequence, found in silent regions of
the DNA, either transmit themselves to the daughter cells or are produced in
sequences that codify vital proteins for the survival of the cells, in which case
cytotoxic effects would be observed.
The genetic damage produced by the B(a)P increases in a time –
dependent manner. Up to 50 % of the bands of the more sensitive primers are
affected in the longest exposure period. In addition, a delay in the cell division
(data not shown) has been observed. This has also been seen to in the same
cells at a higher doses and with shorter exposure periods (35, 33)
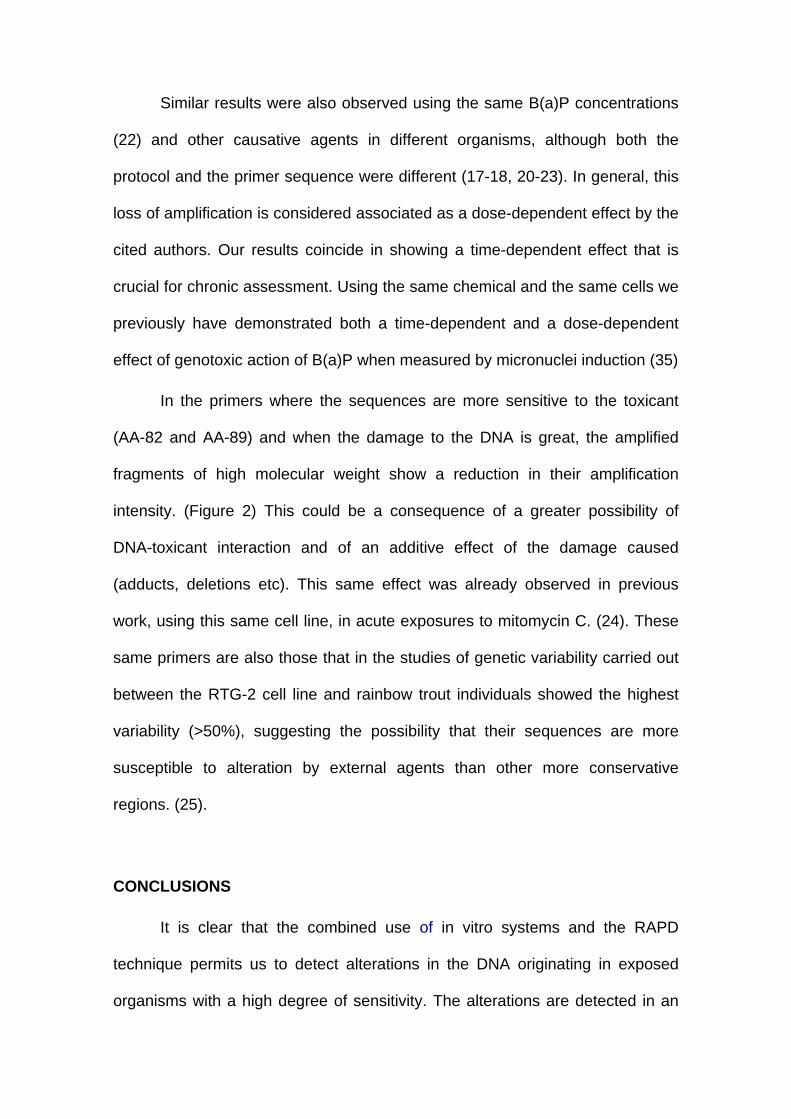
Similar results were also observed using the same B(a)P concentrations
(22) and other causative agents in different organisms, although both the
protocol and the primer sequence were different (17-18, 20-23). In general, this
loss of amplification is considered associated as a dose-dependent effect by the
cited authors. Our results coincide in showing a time-dependent effect that is
crucial for chronic assessment. Using the same chemical and the same cells we
previously have demonstrated both a time-dependent and a dose-dependent
effect of genotoxic action of B(a)P when measured by micronuclei induction (35)
In the primers where the sequences are more sensitive to the toxicant
(AA-82 and AA-89) and when the damage to the DNA is great, the amplified
fragments of high molecular weight show a reduction in their amplification
intensity. (Figure 2) This could be a consequence of a greater possibility of
DNA-toxicant interaction and of an additive effect of the damage caused
(adducts, deletions etc). This same effect was already observed in previous
work, using this same cell line, in acute exposures to mitomycin C. (24). These
same primers are also those that in the studies of genetic variability carried out
between the RTG-2 cell line and rainbow trout individuals showed the highest
variability (>50%), suggesting the possibility that their sequences are more
susceptible to alteration by external agents than other more conservative
regions. (25).
CONCLUSIONS
It is clear that the combined use of in vitro systems and the RAPD
technique permits us to detect alterations in the DNA originating in exposed
organisms with a high degree of sensitivity. The alterations are detected in an

unspecific form by losses and / or gains of bands and variations in the
amplification intensity.
When the objective is to establish if damage to DNA exists or not, i.e. for
hazard identification in risk assessment studies, the presence in the fingerprint
of any of these abnormalities would be enough show this effect.
This work shows the usefulness of in vitro systems for population studies,
considering cells as genetically homogenous populations, permitting us to
undertake both acute and chronic studies, avoiding the inconveniences that
studies in natural populations have.
The high level of similarity of this in vitro study with the species from
which the cells originate and the use of a set of primers previously selected for
their good in vivo-in vitro correlation, permits the extrapolation of results and
offers a cheap and versatile tool to evaluate the chronic effects of
environmentally relevant compounds due to their persistence and ubiquity.
ACKNOWLEDGEMENTS.
This work was supported by Spanish project CICYT AMB97-0431-CO2
We thank Carmen Rodriguez for the RTG-2 cell line maintenance.

REFERENCE.
1. Krane D.E., Sternberg D. C. and Burton G.A. (1998). Randomly amplified
polymorphic DNA profile-based measures of genetic diversity in crayfish
correlated with environmental impacts. Environmental Toxicology and
Chemistry 18, 504-508
2. Haig, M. S. (1998). Molecular contributions to conservation. Molecular
Techniques in Ecotoxicology 79, 413-425
3. Theodorakis, C.W. and Shugart, L.R. (1997). Genetic ecotoxicology II:
population genetic structure in mosquitofish exposed in situ to
radionuclides. Ecotoxicology 6, 335-354
4. Gillespie, R.B. and Guttman, S.I. (1989). Effects of contaminants on the
frequencies of allozymes in populations of the central stoneroller.
Environmental Toxicology and Chemistry 8, 309-317
5. Changon N.L. and Guttman S.I. (1989). Differential survivorship of
allozymes genotypes in mosquitofish populations exposed to copper or
cadmium. Environmental Toxicology and Chemistry 8, 319-326
6. Anderson, S., Sadinski, W., Shugart, L., Brussard, P., Depledge, M.,
Ford, T., Hose, J., Stegeman, J., Suk, W., Wirgin, I. and Wogan, G.
(1994). Genetic and molecular ecotoxicology: A research framework.
Environmental Health Perspectives 102, 3-8
7. Savva, D. (1998). Use of DNA fingerprinting to detect genotoxic effects.
Ecotoxicology and Environmental Safety 41, 103-106
8. Gillespie, R.B. and Guttman, S.I. (1993). Correlations between water
quality and frequencies of allozymes genotypes in spotfin shinier

(Notropis spilopterus) populations. In Gorusch, J.E., Dwyer, F.J.,
Ingersoll, C.G., La Point T.W., eds, Environmental Toxicology and Risk
Assessment, Vol, 2 American Society for Testing and Materials,
Philadelphia, PA. 134-145.
9. Calleja, C. (1998). Establecimiento de relaciones filogeneticas mediante
marcadores moleculares en las especies del genero Barbus en la
peninsula Iberica. Tesis Doctoral. Universidad Complutense de . Madrid.
10. Rhymer, J. M., Williams M. J. and Braun, M. J. (1994). Mitochondrial
analysis of gene flow between New Zealand Mallards (Anas
platyrhynchos) and Grey Ducks (A. superciliosa). The Auk 111, 970-978
11. Norman, J. A., Noritz, C. and Limpus, C. J. (1994). Mitochondrial DNA
control region polymorphisms: genetic markers for ecological studies of
marine turtles. Molecular Ecology 3, 363-373.
12. Peinado, M. A. Malkhosyan, S., Velásquez, A. and Perucho, M. (1992)
Isolation and characterizations of allelic losses and gains in colon rectal
tumours by arbitrarily primed polymerase chain reaction. Proceedings of
the National Academy of Sciences of the United States of America, 89.
10065-10069
13. Williams, J., Kuberlik, A., Livak, K., Rafalski, J. and Tingey, S. (1990).
DNA polymorphisms amplified by arbitrary primers are useful as genetic
markers. Nucleic Acids Research, 18, 56-78
14. Welsh, J. and McClelland, M. (1990). Fingerprinting genomes using PCR
with arbitrary primers. Nucleic Acids Research 18, 7213-7218

15. Theodorakis, C.W., Bickman, J.M., Elbi, T., Shugart, L.R. and Chesser,
R.K. (1998). Genetics of radionuclide-contaminated mosquitofish
populations and homology between Gambusia affinis and G. holbrooki.
Environmental Toxicology and Chemistry 17 1992-1998
16. Theodorakis, C.W., Bickham J. W. and Lyne Y. B.(2000). Integration of
genotoxicity and population genetic analyses in kangaroo rats
(Dipodomys merriam) exposed to radionuclide contamination at the
Nevada Test Site, USA. Environmental Toxicology and Chemistry 2, 317-
326
17. Kubota, Y. Shimada, A. and Shima, A. (1992). Detection of Gamma ray
induced DNA damages in malformed dominant lethal embryos of the
Japonese medaka (Orycias latipes) using AP-PCR fingerprinting.
Mutation Research 283, 263-270
18. Kubota, Y. Shimada, A. and Shima, A. (1995). DNA alterations detected
in the progeny of paternally irradiated Japonese medaka fish (Orycias
latipes). Proceedings of the National Academy of Sciences of the United
States of America 92, 330-334
19. Savva, D. (1996). DNA fingerprinting as a biomarker assay in
ecotoxicology. Toxicology and Ecotoxicology News 3, 110-140
20. Conte, C., Mutti, I., Puglisi, P., Ferrarini, A., Regina, G., Maestri, E., and
Marmiroli, N. (1998)DNA fingerprinting analysis by a PCR based method
for monitoring the genotoxic effects of heavy metals pollution.
Chemosphere 37, 2739-2749
21. Atienzar, F., Child, P., Avenden, A., Jha, A., Savva, D., Walker, C. and
Depledge, M. (1998). Application of the arbitrarily primed polymerase

chain reaction for the detection of DNA damage. Marine Environmental
Research 46, 331-335
22. Atienzar, F., Conradi, M., Avenden, A., Jha, A., and Depledge, M. (1999).
Qualitative assessment of genotoxicity using RAPD: comparison of
genomic template stability with key fitness parameters in Daphnia magna
exposed to Benzo(a)Pyrene. Environmental Toxicology and Chemistry
18, 2275-2282
23. Atienzar, F., Cordi, B., Donkin, M.E., Evenden, A.J., Jha, A.N. and
Depledge M.H. (2000). Comparison of ultraviolet-induced genotoxicity by
random amplified polymorphic DNA with chlorophyll fluorescence and
growth in a marine macroalgae Palmaria palmate. Aquatic Toxicology
50, 1-12
24. Becerril, C.; Ferrero, M.; Sanz, F. and Castaño, A. (1999). Detection of
Mitomycin C-induced genetic damage in fish cells by use of RAPD.
Mutagénesis 14, 449-456.
25. Becerril, C., Acevedo, H., Ferrero, M., Sanz F. And Castaño, A. (2001).
DNA fingerprint comparison of Rainbow trout and RTG-2 cell line using
random amplified polymorphic DNA. Ecotoxicology 10, 115-124.
26. Shugart, L., McCarthy, J., Jimenez, B. And Daniels, J. (1987). Analysis of
adduct formation in the bluegill sunfish (lepomis macrochirus) between
Benzo(a)Pyrene and DNA of the liver and haemoglobin of the
erythrocyte. Aquatic Toxicology 9, 319-325
27. Kanaly, A. K., Bartha, R., Watanabe, K and Harayama, S. (2001).
Enhanced mineralization of benzo(a)Pyrene in the presence of

nonaqueous phase liquids. Environmental Toxicology and Chemistry 3,
498-501
28. Alekseyev Y. O. and Romano L. J. (2000). In vitro replication of primer-
template containing Benzo(a)pyrene adducts by exonuclease-deficient
Escherichia coli DNA polimerase I (Klenow fragment): effect of sequence
context on lesion bypass. Biochemistry 39, 10431-10438.
29. Smolarek T. A., Morgan S. and Baird W. M. (1988). Temperature-
induced alterations in the metabolic activation of benzo(a)pyrene to DNA-
binding metabolites in the Bluegill fry cell line BF-2. Aquatic Toxicology
13, 89-98.
30. Clark, H. and Diamond, L. (1970). Comparative studies on the interaction
of Benzo(a)Pyrene with cells derived from poikilothermic and
homeothermic vertebrates. I. Metabolism of Benzo(a)Pyrene. Journal of
National Cancer Institute 45, 1005-1012
31. Thornton, S. C., Diamond, L. and Baird, W. M. (1982). Metabolism of
Benzo(a)Pyrene by fish cells line in culture. Journal of Toxicology and
Environmental Health 10, 157
32. Babich, H. and Borenfreund, E. (1995). Cytotoxicity and genotoxicity
assays with cultured fish cells: a review. Toxicology In Vitro 5, 91-100
33. Araujo, C.S.A., Marques, S.A.F., Carrondo, M.J.T. and Goncalves L.M.D.
(2000). In vitro response of the brown bullhead catfish (BB) and rainbow
trout (RTG-2) cell lines to Benzo(a)Pyrene. Science of Total
Environmental 247, 127-135

34. American Type Culture Collection. (1988). Catalogue of Cell Line &
Hibridomas. Ed. Hay R., Marvin, M. C., Chen, T. R., McClintock, P. and
Reid, Y. 6ª Ed. Rockville, Maryland.
35. Sánchez , P. Llorente M. T., and Castaño A. (2000). Flow cytometric
detection of micronuclei and cell cycle alterations in fish-derived cells
after exposure to three model genotoxic agents: Mitomicyn C, Vincristine
sulfate and Benzo(a)Pyrene. Mutation Research 465, 113-122
36. Ferrero, M., Castaño, A., Gonzalez, A., Sanz, F. and Becerril, C. (1998).
Characterization of RTG-2 fish cell line by random amplified polymorphic
DNA. (1998). Ecotoxicology and Environmental Safety 40, 56-64
37. Davin-Reglin, A., Abed, Y., Charrel, R. N., Bollet, C. and Micco, P. (1995)
Variations in DNA concentrations significantly affect the reproducibility of
RAPD finger print patterns. Research Microbiology 146, 561-568

Table I: Quantitative analysis of each of the bands obtained with the different
primers, taking into account the variations in the percentages of the
amplification, between control and exposed cells. The analysis has
been undertaken considering the bands individually.
Bands 3 d. n = 12
15 d. n = 24
30 d. n = 24
AA-821075 a NS a AA-821075 NS NS NS AA-82840 NS NS NS AA-82700 NS a b AA-82570 NS NS NS AA-82430 NS NS a
AA-891699 NS b a AA-891566 NS NS a AA-891418 NS NS NS AA-891225 a a a AA-891141 NS NS NS AA-89867 NS NS NS AA-89776 NS NS a AA-89463 NS NS NS AA-89450 NS NS NS
C-961714 NS b c C-961321 NS NS NS C-961099 NS NS NS C-96910 NS NS NS C-96856 NS NS NS C-96642 NS NS NS C-96487 NS NS NS C-96380 NS NS NS
D-81554 NS NS c D-81172 NS NS c D-81112 NS NS NS D-8825 NS NS NS D-8686 NS NS NS
NS = No significant differences versus control.
Significant differences versus control, a = P<0.05, b = P< 0.01, c = P< 0.001 by Mann-
Whitney U-test. n number of replicate reactions.

Table II: Qualitative analysis: Bands presenting a difference between the
control and exposed cells´ DNA fingerprint.
a)
Control 3 d. Control 15 d Control 30 d Bands n =12 n =12 n =12
AA-891225 94 75 92 75 96 75 C-961714 100 100 100 72 100 65 AA-82700 100 87 90 63 93 50
b)
Control 3 d. Control 15 d Control 30 d Bands n =12 n =12 n =12
AA-89484 0 0 0 58 0 100 D-8936 0 0 0 17 0 0 AA-82620 0 0 0 42 0 100 AA-82402 0 0 0 17 0 0
a. Bands that loose amplification in exposed cells at different periods of exposure.
b. New bands that appear in the exposed cells´DNA fingerprint.
Data are expressed as percentage. n number of replicate reactions.

FIGURE LEGENDS Figure 1.- Pattern for grouping of bands in function of the primer amplification
profile. HMW = high molecular weight, MMW = medium molecular weight, LMW = low molecular weight. Figure 2.- Quantitative analysis for the bands obtained with the different
primers, taking into account the variations in the percentages of the amplification, between control and exposed cells. The analysis has been undertaken considering the bands grouped together in high, medium and low molecular weight bands, for each of the primers.
Figure 3.- Agarose gels showing the DNA band patterns obtained with the
different primers (AA-82, D-8, AA-89 and C-96). DNA extract from control (c) and from treated cells (3, 15 and 30) after different exposure periods (days). Arrows show the appearance /disappearance of bands. (mw) molecular weight marker. (w) negative control reaction without DNA template.
Figure 4.- Agarose gels showing the reproducibility of the appearance of the
extra bands on the DNA fingerprint cells after been treated for 30 days obtained with the AA-82 and AA-89 primers. (C) DNA extract from control cells: (nc) negative control – complete medium- and (sc) solvent control – complete medium with solvent. (30 d) DNA extracts from exposed cells at 30 days (E1 and E2). Arrows show the appearance of the new bands: AA-89484 y AA-82620. (mw) molecular weigh marker. (w) negative control reaction without DNA template.


198
ANEXO 3.2
IN VITRO DETECTION OF ALTERATIONS IN THE DNA AFTER ACUTE
EXPOSURE TO B(a)P USING THE RAPD TECHNIQUE. (Enviado a la
revista CHEMOSFERE)
Páginas 199 a 228

IN VITRO DETECTION OF ALTERATIONS IN THE DNA AFTER ACUTE EXPOSURE TO B(a)P USING THE RAPD TECHNIQUE. Concepción Becerril, Helda Acevedo, and Argelia Castaño1.
Toxicology Department, C.N.A-I.S.C III, E-28220 Majadahonda, Madrid, Spain
and 1Division of Environmental Toxicology, CISA-INIA, E-28130, Madrid, Spain.
*To whom correspondence should be addressed. Tf. +34 91 5097900; Fax : 34 91 5097926 Email: [email protected]

1
SUMMARY
Several factors are involved in the loss of the world’s biodiversity.
Environmental genotoxins are often associated with the decline or
disappearance of many populations. Sensitive and specific tests are required to
safely establish the security levels of chemicals prior to their use, or for hazard
assessment. The use of in vitro systems, i.e. cells in culture, together with the
recently developed molecular techniques, are promising tools for this objective.
In this work the sensitivity of the Random Amplified Polymorphic DNA technique
is studied, to detect the deleterious effect of a known pro-mutagen, B(a)P, after
the exposure of an established fish cell line, RTG-2, to 0.05, 0.1, 0.5 µg/ml for
24, 48 and 72 h. The concentration and length of exposure are inversely
related, confirming the results previously observed using the same cell line,
chemical and exposure periods, but measuring the increase of micronuclei
frequency. In identical conditions, double of the concentration of chemicals is
necessary (0.1 µg/ml) in order to detect the presence of micronuclei and lower
concentrations of B(a)P (0.05 µg/ml) alter the cells’ DNA-fingerprint after 72
hours of exposure. This study shows that the RAPD technique presents a high
level of sensibility in the early detection of DNA damage produced by this
relevant environmental chemical. Although these results have to be confirmed
with a higher number of chemicals, its application can be of great usefulness in
the detection of the genotoxicity of potentially dangerous substances for aquatic
biota.
Key words: Fish cell line, Acute effects, Genotoxicity, RAPD, DNA
fingerprint, B(a)P.

2
1. INTRODUCTION.
Ecosystems result from the dynamic interactions of living and inert matter
where the living material acclimatizes and adapts to environmental change
(Shugart and Theodorakis, 1996).
Pollution, in general, can represent a stress factor selectively leading to a
change in the genetic make-up. In addition, environmental genotoxins can
directly alter gene pools. A change in the genetic constitution may be
advantageous for certain populations living in stressful conditions, but may
present a disadvantage for others, including man. (Wurgler and Kramers, 1992)
Several factors are involved in the loss of the world’s biodiversity.
Chemical contamination of the environment, including the effect of long-term,
low level chronic exposure of populations, as well as acute exposures have
been implicated in the decline or disappearance of many populations. (Bickham
et al., 2000). The genetic apparatus of an organism can interact with
genotoxicants in a variety of ways and an understanding of the cellular
mechanisms involved in these interactions provide the researcher with the
opportunity to predict, and possibly prevent, contaminant-induced genetic
damage in exposed populations. (Shugart and Theodorakis, 1996).
Obviously both the exposure and the nature of the chemical are key
factors in the observed cellular effects, therefore precise information (dose-
response data) is required in hazard identification as a requisite for a correct
risk assessment and to establish the adequate security factors.

3
Genotoxicity detection techniques both in field and laboratory studies
were based until a few years ago on the application of the classic assays of
genotoxicity used in human risk assessment. (Wurgler and Kramers, 1992).
The most commonly used assays: exchange of sister chromosomes,
detection of chromosomic aberrations etc. involve the observation of the
chromosomes through an optic microscope. However, when fish species are
used problems are presented that are associated with the small size of the
chromosomes and the low metabolic rate of the fish. (Sugg, et al., 1996).
However, advances in molecular biology have led to the development of
a number of selective and sensitive assays for DNA analysis: oncogene
activation (Abshire et al., 1996), the use of transgenic animals (Murti et al.,
1994), detection of micronuclei by flow cytometry (Sanchez et al., 2000; Grawe
et al., 1993), a molecular marker for the detection of genetic alteration by
looking directly at the level of the DNA sequence and structure (Jeffreys, 1987).
These new techniques have considerable promise for increasing our
understanding of both mechanisms of toxicity on genomes or genome products
and the relevance of detrimental effects to individual fitness. (Anderson et al.,
1994.)
Random Amplified Polymorphic DNA (RAPD) developed by Williams et
al. (1990) is one of those. Based on the classic PCR, it uses low temperatures
of annealing and short primers of arbitrary sequence. This allows to scan the
DNA molecule. The final result is the amplification of a determined number of
anonymous segments that, after being revealed in agarose gels, generate a
constant band fingerprint specific to the genome used.

4
This technique doesn’t require an exact understanding of the
amplification sequence, and the same primer can be used in different species
for the detection of polymorphisms. These characteristics have made it very
useful in studies directed at genetic populations (Welsh et al.,1991),
identification of species (Koh et al., 1998; Szalai et al., 1997; Henry et al.,
1997), construction of genetic maps (Al-Zahim et al., 1997), and for the
detection of the genotoxic effects on an individual and / or population level
(Kubota et al., 1995; Conte et al.,1998; Atienzar et al., 1998; 1999; 2000;
Becerril et al., 1999; Theodorakis et al.,1997; Krane et al.,1998).
Obtaining a specific DNA-fingerprint permits a comparison between the
control and exposed individuals to detect changes in the DNA. The use of a
high number of different primers increases the sensitivity in the detection of
alterations in the genomic DNA.
This technique had previously been put in doubt due to the lack of
reproducibility, and the appearance of erratic bands that complicate the analysis
of the results (Penner et al.,1993; Meunier and Grimont,1993; Ellsmorth et al.,
1993; Davin-Regli, 1995). Although it is worth noting that this technique is very
sensitive to protocol changes, when the protocol has been meticulously
established the results are shown to be highly repetitive (Atienzar et al., 2000b).
The application of this technique in biological genetically homogenous
systems , such as cell cultures, also presents great advantages: testing a large
number of samples, the use of a low chemical volume, reduced wastes and the
possibility to use a high number of cells simulating the effects on an exposed
population. Finally, after comparing the DNA fingerprint of the control and

5
exposed cells alterations can be detected in the genomic material produced by
the toxin.
The RTG-2 cell line proceeding from the rainbow trout has been used
extensively in in vitro studies in order to evaluate the cytotoxicity and
genotoxicity of environmental samples. (Babich et al., 1995) This cell line also
presents a good in vivo / in vitro correlation, both in its capability to predict acute
toxicity (Castaño et al., 1994; 1996) as in its genetic fingerprint. It is also
particularly interesting in genotoxicity studies in that it is capable of metabolising
compounds without adding to the average systems of metabolic activation.
(Thornton et al., 1982; Clark and Diamond, 1970; Ajaujo et al., 2000)
In previous work we have established an optimum protocol for the
detection of alterations in the DNA fingerprint of this cell line after exposure to
the reference genotoxic. Also in in vivo / in vitro studies, we established the
intimate genetic inter-relation that exists between both systems, permitting the
extrapolation of the results of genotoxicity in a theoretic form. (Becerril et al.,
2001)
The object of this work is to evaluate the sensitivity offered by RAPD
technique in comparison with another technique whose endpoint is widely
accepted, the increase of the frequency of the micronuclei.
In the current work the genotoxic effects of acute exposure to B(a)P are
studied, on RTG-2 cells evaluated using the RAPD technique and using primers
previously selected for their good in vivo / in vitro correlation, and these results
will be compared with those obtained by using the detection of micronuclei by
flow cytometry after exposing this same cell line in the same conditions
(Sánchez et al., 2000).

6
2. MATERIAL AND METHODS
The RTG-2 cell line, an established fibroblastic-like cell line (ATCC CCL
55) derived from rainbow trout gonadal tissue (Oncorhynchus mykiss) (2n= 60)
was used in this study.
RTG-2 cells were grown on Minimal Essential Medium (MEM-Earle)
supplemented with 10% of foetal bovine serum (FBS), penicillin (0.05 IU/ml),
streptomycin (0.05 µg/ml), amphotericin B (1.25 µg/ml), glutamine (2mM) and
1% non-essential monoacids, at its optimum grow temperature 20º± 1º C, pH
7.3 and 5% CO2 in air.
2.1. Chemical Exposure
Benzo(a)pyrene (B(a)P) (CAS nº 50-32-8, Sigma, USA) was first
dissolved in dimethyl sulfoxide (DMSO) at a concentration of 1 mg/ml. B(a)P
was assayed at concentrations of 0.05, 0.1 and 0.5 µg/ml for 24, 48 and 72 h .
The solvent (DMSO), never exceeded 0.1% v/v.
Each concentration and exposure period was replicated once.
Experiments were repeated in different days (4 replicates). Two negative
controls, a MEM control and a solvent (DMSO) control were included in each
exposure period. After treatment, medium with toxic was removed, cultures
were washed with Phosphate Buffered Saline (PBS), and fresh medium was
added. Cultures with fresh medium were left to grow for 72 h (including the
exposure period).

7
2.2. DNA extraction and RAPD reaction
Cells were dissociated with tripsin-EDTA (Flow, Laboratories,
Rickmansworth, UK), collected in PBS, pH 7.3 and their DNA isolated by
phenol-chloroform extraction. The integrity of extracted genomic DNA was
checked by electrophoresis in 0.8% agarose gels using λ Phage native DNA as
molecular weight marker (Eurobio, France).
The RAPD reaction previously described (Ferrero et al., 1998; Becerril et
al., 1999) was performed in a total volume of 25 µl volume containing 4 mM
MgCl2, 2 U Stoffel Fragment (Perkin-Elmer, Branchburg,NY), 0,2 mM each
dNTP (Pharmacia, Barcelona, Spain) and 5 ng DNA template. Temperature
cycle was: an initial denaturing step at 92ºC followed by 45 cycles of annealing
at 36ºC for 75 s and extension at 72ºC for 6 min. The thermalcycler used was a
Perkin-Elmer model 2400.
Four primers previously selected for their good in vivo / in vitro correlation
were used in this study (Becerril et al., 2001). Their sequences are, AA-82: 5´-
GATCCATTGC-3´; AA-89: 5´GGGCCTCTGAT-3´; C-96: 5´-AGCACTGTCA-3´;
D-8: 5´-CCAAGTCGACA-3´. The primers were obtained from the Biopolymers
Department of the CNBCR, (I.S. Carlos III, Majadahonda, Madrid).
Amplification products were resolved electrophoretically on 2.1% agarose
gels and stained with ethidium bromide. The image was recorded using the
Grab-it program (UVP, USA).
The amplifications were carried out in duplicate and on different days for
each of the primers used.
In each gel and for a better comparison of the results, control and
exposed cells were run at the same time. A negative control reaction without

8
template DNA, and a molecular weight marker (marker VI, Roche, Germany)
were also included in the same gel. The bands were coded following the system
described by Theodorakis and Shugart (1997).
2.3. Analysis of the results.
The image captured of each of the agarose gels was analysed by
densitometry (Gelworks 1D, UVP, USA), and the fluorimetric profiles of each
amplification reaction were studied both qualitatively and quantitatively.
Qualitative analysis was established by comparing the percentage
appearance / absence of each of the bands present in the amplification profiles
of both the control and exposed DNA extracts.
Qualitative analysis was established by comparing the percentage
appearance/absence of each of the bands present in the amplification profiles
of the control and exposed DNA extracts.
Following the criteria established in previous studies, (Becerril et al.,
1999) the amplification bands for each of the primers were grouped together
according to high, medium and low molecular weight according to their
amplification profile (Fig. 1)
Quantitative analysis was performed taking as a comparative parameter
the percentage of amplification of each of the bands, after the densitometric
analysis of the control and exposed cells’ profiles both in individual bands and
when bands are grouped together.
The statistical differences were established using the Student t-test and
the Mann-Whinney U-test.

9
3. RESULTS.
After comparing the amplification profiles from the control and exposed
cells, we can observe both quantitative differences (Table I), evaluated using
the amplification percentage, and qualitative differences, expressed as absence
or presence of new bands (Table II).
Figure 2 shows graphically only those bands which present significant
statistical differences with respect to the control, for each of the concentrations
and exposure periods used in the assay.
The lowest concentration tested (0.05 µg/ml) produced significant
alterations after the longest exposure period (72 hours). In these conditions
7.1% of the bands are shown to be altered. However, when the concentration is
increased to 0.1 and 0.5 µg/ml these effects show themselves in shorter
periods, 7.1% and 28.6% respectively of the total of the bands after 24 hours
of exposure. These percentages increase to 42.8% and 53.6% of the bands
when either the concentration and/or the period of exposure are at their
maximum.
Analysing the results of each of the primers individually one can observe
differences in their sensitivity against the action of the toxin. The primers AA-89
and AA-82, in the lowest concentration used in the assay, show altered profiles
(bands AA-821075 and AA-891225), while the amplified fragments with the primer
C-96 remain stable, only showing alteration at higher concentrations and the
longest exposure time (Fig. 3).
When the high, middle and low molecular weight bands are grouped
together, their amplification percentages show values that are statistically
significant after periods of exposure of 48 and 72 hours, but chemical

10
concentrations greater than 0.05 µg/ml are necessary. In general an inverse
relation is observed between the amplification intensity of the different
fragments and their molecular weights (Fig. 4).
The qualitative study shows that the exposed cells’ DNA-fingerprint with
respect to the control cells, presents an absence of bands in some of the
amplifications. The percentage of disappearance of the aforementioned bands
is directly proportional to the concentration and time of exposure to the toxin.
So, when both parameters are at their maximum, all the primers present
anomalous amplifications with absences in some of their bands (Table II). The
earliest effects are observed in the bands AA-891225 and AA-82700 only present
in 76% and 62% of the amplifications after a 24 h period of exposure to 0.5
µg/ml of toxin.
Figure 5 shows the presence of three new bands in the fluorimetric
profiles of the AA-82 and D-8 primers (AA-82620, D-8936, D-8798). These new
bands are only visible after long periods of exposure and when the toxin
concentration is 0.05 and 0.1 µg/ml of B(a)P.
4. DISCUSSION.
Cell cultures offer great advantages against in vivo studies in the
detection of damage to the DNA. Apart from the inherent advantages of easy
handling, low cost and a precise control of the environmental conditions, for
genotoxicity studies they present a constant and specific DNA-fingerprint,
avoiding the presence of polymorphisms common to in vivo systems.
The reproducibility of the DNA-fingerprint, generated by RAPD was
initially put in doubt by the sporadic appearance of erratic bands, in some cases

11
difficult to interpret (Davin-Regli, 1995; Penner et al., 1993). However when the
reaction is meticulously standardized the results are reliable and repetitive. This
way the changes produced in the amplification profile are attributed to
modifications in the DNA template (Kubota et al., 1995; Atienzar et al., 2000;
Becerril et al, 1999). Moreover, when the extraction technique is adequate, the
extracts can be stored until their use, during relatively long periods of time.
(Becerril et al., in press).
The purpose of this work is to compare the sensibility the detection of
DNA damage offers, with a more classic and widely accepted methodology
such as the detection of micronuclei (Nüsse et al., 1994).
The observed effects are time and dose dependent, confirming the
results obtained in a previous study with the same cell line, the same chemical
concentrations and exposure periods used in this work (Sánchez et al., 2000).
However, the RAPD technique shows greater sensitivity. The results obtained
show that low concentrations of B(a)P (0.05 µg/ml) alter the cells’ DNA-
fingerprint after 72 hours of contact with the toxin (1.5 cycles). In identical
conditions, double the concentration of toxin is necessary (0.1 µg/ml) in order to
detect the presence of micronuclei. (Sánchez et al., 2000).
Results observed by other authors through the assessment of anaphase
chromosome aberrations (Kocan et al., 1982) or alterations in the variation
coefficient DNA content in the G1 phase using the same cell line also show
lower sensitivity (Kocan et al., 1985).
Although all these techniques detected DNA damage, the presence of
micronuclei, and / or chromosome aberration reveal breaks in the DNA, whilst
the RAPD technique detects an extensive and varied spectre of alterations in

12
the genetic material (Kubota et al., 1995; Atienzar et al., 1999). This would
justify its greater capacity in the detection of DNA damage at lower
concentrations of the toxin.
The most frequently detected changes in the DNA fingerprint are shown
as percentage differences of amplification and loss of amplification of some
bands, generally of low intensity. Both can be the result of a combination of
events, one of the earlier effects being the formation of adducts. These can
block the enzyme action and alter the amplification process in function of the
toxin’s concentration. It’s probable that this is the cause of the alterations
detected after 24 h of exposure.
The bands of greater molecular weight are those that are most easily
affected, which to be expected since a greater length increases the probability
of interaction between the DNA and the toxin (Becerril et al.,1999).
Other events, such as small deletions or insertions or changes in the
structure of the chromosomes due to the formation of breaks and / or
reorganizations, can be the cause of the disappearance and/or appearance of
new bands and affect the amplification intensity. Some places of primer-
template union can disappear in them or even other new can be created. This
could be the cause of the appearance of the new bands AA-82620 and D-8936,798
or of the disappearance of the bands D-81554 and AA-82700 in more than 50% of
the amplifications after 72 hours of exposure. The absence or presence of
bands is a less frequent phenomenon than the variations in fluorimetric
intensity since it requires that a same event affects a relatively high number of
cells in order that it becomes visible in agarose gels (not less than 10%)
(Atienzar et al., 2000).

13
Other alterations such as mutations due to changes of bases or faults in
the replication of the DNA could be detected using this technique.
Not all the primers present amplification profiles sensitive to the action of
the toxin. Whilst the primer C-96 remains unalterable except at the greatest
concentration and time of exposure, others (AA-82 and AA-89) present early
alterations in some of their bands confirming the great affinity of the toxin
towards certain DNA sequences. The specific action of the B(a)P on certain
DNA sequences could be the cause of these results. If this were the case the
sequences presented by the bands affected earliest (AA-82 and AA-89) would
contain a hot spot to the toxin’s action, (Bigger et al., 2000) and their
sequencing would help to increase our comprehension of the mechanisms of
the B(a)P action.
The length of exposure period and the concentration of B(a)P affect
metabolic efficiency, or cell growth (Kocan et al., 1982). Using flow cytometry,
cell cycle alterations are shown in RTG-2 cells after 72 h of exposure to 0.5
µg/ml of the chemical (Sánchez et al., 2000). In these conditions the RAPD
technique shows high levels of DNA damage that could possibly correspond to
the presence of a cytotoxic process: alterations in the amplification intensity
(56.6% of the total) and, in general, an increase in the disappearance of bands.
The presence of new bands only occurs at this stage of exposure (72 h), but at
lower toxin concentrations (0.05 and 0.1 µg/ml). The alterations in the cell cycle
delaying cell division (Araujo et al., 2000) and the appearance of cytotoxicity at
high toxin concentrations can be the cause of new bands not appearing at this
concentration.

14
This study shows that the RAPD technique presents a higher level of
sensitivity in the early detection of DNA damage when compared to other well
established genotoxicity assays. Its use together with cell lines, capable to
metabolise relevant environmental chemicals, can be of great usefulness in the
detection of the genotoxicity for aquatic biota.
Acknowledgements: This work was supported by Spanish project CICYT AMB97-0431-CO2.

15
REFERENCES. Abshire, M.K., Buzard, G.S., Shiraishi, N. and Waalkes, M.P. (1996).
Induction of c-myc and c-jun proto-oncogen expression in rat L6 myoblasts by
cadmiun is inhibited by zinc preinduction of the metallothionein gene. J. Toxicol.
Health 48, 359-377
Al-Zahim, M., Newbury, H.J. and Ford-Lloyd, B.V. (1997). Classification of
genetic variation in garlic (Allium sativum L.) revealed by RAPD. HortSciences
32, 1102-1104
American Type Culture Collection. (1988). Catalogue of Cell Line &
Hibridomas. Ed. Hay R., Marvin, M. C., Chen, T. R., McClintock, P. and Reid,
Y. 6ª Ed. Rockville, Maryland.
Anderson, S., Sadinski, W., Shugart, L., Brussard, P., Depledge, M., Ford,
T., Hose, J., Stegeman, J., Suk, W., Wirgin, I. and Wogan, G. (1994). Genetic
and molecular ecotoxicology: A research framework. Environmental Health
Perspectives, 102, 3-8
Araujo, C.S.A., Marques, S.A.F., Carrondo, M.J.T. and Goncalves L.M.D.
(2000). In vitro response of the brown bullhead catfish (BB) and rainbow trout
(RTG-2) cell lines to Benzo(a)Pyrene. Sci. of Total Environ. 247, 127-135
Atienzar F., Chung, V., Jha, A.N. and Depledge M.H. (2001) Fitness
parameters and DNA effects are sensitive indicators of Koper-induced toxicity in
Daphnia magna. Toxicol. Sciences 59, 241-250.
Atienzar, F., Child, P., Avenden, A., Jha, A., Savva, D., Walker, C. and
Depledge, M. (1998). Application of the arbitrarily primed polymerase chain
reaction for the detection of DNA damage. Mar. Environ. Res. 46, 331-335

16
Atienzar, F., Conradi, M., Avenden, A., Jha, A., and Depledge, M. (1999).
Qualitative assessment of genotoxicity using RAPD: comparison of genomic
template stability with key fitness parameters in Daphnia magna exposed to
Benzo(a)Pyrene. Env. Tox. and Chem. 18, 2275-2282
Atienzar, F., Cordi, B., Donkin, M.E., Evenden, A.J., Jha, A.N. and
Depledge M.H. (2000). Comparison of ultraviolet-induced genotoxicity by
random amplified polymorphic DNA with chlorophyll fluorescence and growth in
a marine macroalgae Palmaria palmate. Aquatic Tox. 50, 1-12
Atienzar, F., Evenden, A.J., Jha, A.N., Saava, D. and Depledge M.H.
(2000b). Optimized RAPD analysis generates high-quality genomic DNA
profiles at high annealing temperature. Biothechniques, 28, 52-54
Babich, H. and Borenfreund, E. (1995). Cytotoxicity and genotoxicity assays
with cultured fish cells: a review. Toxicol. in Vitro 5, 91-100
Becerril, C., Acevedo, H., Ferrero, M., Sanz F. and Castaño, A. (2001).
DNA fingerprint comparison of Rainbow trout and RTG-2 cell line using random
amplified polymorphic DNA. Ecotoxicology 10, 115-124.
Becerril, C., Ferrero, M. and Castaño, A. (2002). Detection by RAPD of
genetic alterations in vitro. Amplification and conservation conditions of genetic
extracts. Toxicol. Methods, 12, in press
Becerril, C., Ferrero, M., Sanz, F. and Castaño, A. (1999). Detection of
Mitomycin C-induced genetic damage in fish cells by use of RAPD.
Mutagénesis 14, 449-456.
Bickham, J. W., Sandhu, S., Hebert, P., Chikhi, L. and Athwal, R. (2000).
Effects of chemical contaminations on genetic diversity in natural populations:
implications for biomonitoring and ecotoxicology. Mut. Res. 463, 33-51

17
Bigger C.A., Ponten I., Page, J. and Dipple A. (2000) Mutational spectra for
polycyclic aromatic hydrocarbons in the supF targer gene. Mut. Res. 450, 75-93
Clark, H. and Diamond, L. (1970). Comparative studies on the interaction of
Benzo(a)Pyrene with cells derived from poikilothermic and homeothermic
vertebrates. I. Metabolism of Benzo(a)Pyrene. J. Nat. Cancer Institute 45, 1005-
1012
Conte, C., Mutti, I., Puglisi, P., Ferrarini, A., Regina, G., Maestri, E., and
Marmiroli, N. (1998). DNA fingerprinting analysis by a PCR based method for
monitoring the genotoxic effects of heavy metals pollution. Chemosphere 37,
2739-2749
Davin-Regli, A., Abed, Y., Charrel, R. N., Bollet, C. and Micco, P. (1995)
Variations in DNA concentrations significantly affect the reproducibility of
RAPD fingerprint patterns. Res. Microbiol. 146, 561-568
Ellsworth D. L., Rittenhouse, K. D. and Honeycutt, R. L. (1993); Artifactual
variation in randomly amplified polimorphic DNA banding patterns. Biotech., 14,
214-217
Ferrero, M., Castaño, A., Gonzalez, A., Sanz, F. and Becerril, C. (1998).
Characterization of RTG-2 fish cell line by random amplified polymorphic DNA.
Ecotoxicol. Environ. Safety. 40, 56-64
Grawé J., Zetterberg, G and Amneus, H. (1993). DNA content
determination of micronucleated polychomatic erythrocytes induced by
clastogens and spindle poisons in mouse bone marrow and peripheral blood.
Mutagenesis. 8, 249-255
Henry R.J., Ko H.L. and Weining S. (1997). Identification of cereals using
DNA-based technology. Cereal Food World 42, 26-29

18
Jeffreys, A.J. (1987). Highly variable minisatellites and DNA fingerprints.
Biochem. Soc. Trans. 15, 309-317
Kocan, R.M., Landolt, M.L. and Sabo K.M. (1982) Anaphase aberrations: a
measure of genotoxicity in mutagen-treated fish cells. Environ. Mutagen. 4, 181-
189.
Kocan, R.M., Powell, D.B. and Liguori, V.M. (1985). Relationship between
visible and heritable chromosome damage in trout cells and embryos. Mar.
Environ. Res. 17, 320-323.
Koh, M.C., Lim, C.H., Chua, S.B., Chew, S.T. and Phang, S. (1998).
Ramdon amplified polymorphic DNA (RAPD) fingerprints for identification of red
meat animal species. Meat Sci. 48, 275-285.
Krane D.E., Sternberg D. C. and Burton G.A. (1998). Randomly amplified
polymorphic DNA profile-based measures of genetic diversity in crayfish
correlated with environmental impacts. Env. Tox. and Chem. 18, 504-508
Kubota, Y. Shimada, A. and Shima, A. (1995). DNA alterations detected in
the progeny of paternally irradiated Japonese medaka fish (Orycias latipes).
Proc. Nat. Acad. Scien. USA 92, 330-334
Meunier, J. R. and Grimont, P. A. D. (1993) Factors affecting reproducibility
or Random Amplified Polymorphic DNA Fingerprinting. Res. Microbiol, 144,
373-379
Murti, J.R., Schimenti, K.J. and Schimenti, J.C. (1994). A recombination-
based transgenic mouse system for genotoxicity testing. Mut. Res. 307, 583-
595
19
Nüsse, N., Beisker, W. Kramer, J., Miller, B.M., Schreiber, G.A., Viaggi, S.
Weller, E.M and Wessels M. (1994). Flow cytometric analysis of
bromodcosyuridinc induced micronuclei. Methods Cell Biol. 42, 149-158
Penner, G. A., Bush, A., Wise, R., Kim, W., Domier, L., Kasha, K., Laroche,
A., Scoles, G., Molnar, S.J. and Fedak, G. (1993) Reproducibility of random
amplified polimorphic DNA (RAPD) analysis among laboratories. PCR Methods
Appl. 2, 341-345
Sánchez , P. Llorente M. T., and Castaño A. (2000). Flow cytometric
detection of micronuclei and cell cycle alterations in fish-derived cells after
exposure to three model genotoxic agents: Mitomicyn C, Vincristine sulfate and
Benzo(a)Pyrene. Mut. Res. 465, 113-122
Savva, D. (2000). The use of arbitrarily primed PCR (AP-PCR)
fingerprinting to detect exposure to genotoxic chemical. Ecotoxicology, 9, 341-
353.
Shugart L.R. and Theodorakis C.W. (1996). Genetic Ecotoxicology: The
genotypic diversity approach. Comp. Biochem. Physiol. 113, 273-276.
Sugg, D. W., Bickham, J. A., Brooks, M.D., Lomakin, C.H. Jagoe, C.E.
Dallas, M.H., Smith, R.J. and Chesser, R.K. (1996). DNA damage and
radiocesium in channel catfish from Chernobyl. Environ. Toxicol. Chem. 15,
1057–1063.
Szalai, G., Toth, A., Lasztity, R. and Salgo A. (1997). Techniques based on
DNA determination in food quality control. Elelmiszervizsgalati-Koezlemenyek,
43, 97-103.

20
Theodorakis, C.W. and Shugart, L.R. (1997). Genetic ecotoxicology II:
population genetic structure in mosquitofish exposed in situ to radionuclides.
Ecotoxicology 6, 335-354.
Thornton, S. C., Diamond, L. and Baird, W. M. (1982) Metabolism of benzo
(a) pyrene by fish cells line in culture. J. Toxicol. Environ. Health 10, 157-167.
Welsh, J and McClelland. (1991) Genomic fingerprinting using arbitrarily
primed PCR and a matrix of pair wise combinations of primers. Nucleic Acids
Res. 19, 5275-5279.
Williams, J., Kuberlik, A., Livak, K., Rafalski, J. and Tingey, S. (1990). DNA
polymorphisms amplified by arbitrary primers are useful as genetic markers.
Nucleic Acids Res. 18, 56-78.
Wurgler F. and Kramers P. (1992). Environmental effects of genotoxins o-
genotoxicology. Mutagenesis 7, 321-327

Table I. Quantitative analysis of each of the bands obtained with the
different primers, taking into account the variations in the
percentages of the amplification, between control and exposed cells
to different exposure periods and B(a)P concentrations.
24 h 48 h 72 h
0,05 0,10 0,50 0,05 0,10 0,50
0,05 0,10 0,50
n=16 n=16 n=16
AA-821075 ns ns a ns ns c a ns ns AA-82965 ns ns ns ns ns c ns c c AA-82840 ns ns ns ns ns ns ns ns ns AA-82700 ns ns c ns c c ns c c AA-82570 ns ns ns ns a c ns c c AA-82430 ns ns c ns ns c ns ns c
D-81554 ns a c ns ns c ns c c D-81172 ns ns a ns a c ns b b D-81112 ns ns ns ns ns ns ns ns ns D-8825 ns ns ns ns ns ns ns b b D-8686 ns ns a ns ns c ns ns c
C-961714 ns ns ns ns ns ns ns ns a C-961321 ns ns ns ns ns ns ns ns ns C-961099 ns ns ns ns ns ns ns ns a C-96910 ns ns ns ns ns ns ns a a C-96856 ns ns ns ns ns ns ns ns ns C-96642 ns ns ns ns ns ns ns ns ns C-96487 ns ns ns ns ns ns ns ns ns C-96380 ns ns ns ns ns ns ns ns ns
AA-891699 ns ns b ns b c ns c b AA-891566 ns ns ns ns ns c ns c b AA-891418 ns ns ns ns ns ns ns ns ns AA-891225 ns a ns ns a b a b a AA-891141 ns ns b ns a b ns b c AA-89867 ns ns ns ns ns ns ns ns ns AA-89776 ns ns ns ns ns ns ns ns ns AA-89463 ns ns ns ns ns c ns c c AA-89450 ns ns ns ns a c ns c c ns = No significant differences versus control. Significant differences versus control, a = P<0.05, b = P< 0.01, c = P< 0.001 by Mann-Whitney U-test n number of replicate reactions.

Table II: Qualitative analysis. Bands presenting a difference
between the control and exposed cells´ DNA fingerprint.
a.
24 h 48 h 72 h
C 0.05 0.1 0.5 C 0.05 0.1 0.5 C 0.05 0.1 0.5 Bands
AA-891225 100 100 100 76 100 100 83 67 100 100 50 58 AA-891141 100 100 100 100 100 100 100 81 100 100 67 50 AA-82700 100 100 100 62 100 100 67 56 100 100 67 42 D-81554 100 100 100 100 100 100 100 92 100 100 100 48 C-961714 100 100 100 100 100 100 100 100 100 100 71 75 b.
24 h 48 h 72 h
C 0.05 0.1 0.5 C 0.05 0.1 0.5 C 0.05 0.1 0.5 Bands
D-8936 0 0 0 0 0 0 0 0 0 6.5 25 8.3
D-8798 0 0 0 0 0 0 0 0 0 6,5 12.5 0 AA-82620 0 0 0 0 0 0 0 0 0 0 25 0
a. Bands that lose amplification in exposed cells at different periods of
exposure. b. New bands that appear in the exposed cells´DNA fingerprint. Data are expressed as percentage. 16 replicate per reaction. C control

FIGURE LEGENDS Figure 1.- Pattern for grouping of bands in function of the primer
amplification profile. HMW = high molecular weight, MMW = medium molecular weight, LMW = low molecular weight. Figure 2.- The total bands with significant statistical differences
respect to the control for each of the concentrations (0.05, 0.10, 0.50 µg/ml) and exposure periods used in the assay (24, 48, 72 h).
Figure 3.- Percentage of altered bands generated for each primers
respect to the control to different concentrations (0.05, 0.10, 0.50 µg/ml) and exposure periods used (24, 48, 72 h).
Figure 4.- Quantitative analysis for the bands obtained with the
different primers, taking into account the variations in the percentages of the amplification, between control and exposed cells. The analysis has been undertaken considering the bands grouped together in high, medium and low molecular weight bands, for each of the primers to different exposure periods and B(a)P concentrations.
Figure 5.- Agarose gels showing the DNA band patterns obtained
with the AA-82, D-8 primers. DNA extract from control (C) and from treated cells (0.05, 0.1 and 0.5) after different exposure periods (24, 48 and 72 h). Arrows show the appearance /disappearance of bands. (mw) molecular weight marker. (w) negative control reaction without DNA template.


ANEXO 4
PUBLICACIONES ( en preparación)

230
ANEXO 4.1
DETECCIÓN DE ALTERACIONES GENETICAS EN TRUCHAS
ARCOIRIS EXPUESTAS A BENZO(a)PIRENO
Páginas 231 a 248

DETECCIÓN DE ALTERACIONES GENETICAS EN TRUCHAS
ARCOIRIS EXPUESTAS A BENZO(a)PIRENO
1. INTRODUCCIÓN
En ecotoxicología la aplicación de líneas celulares derivadas de
especies piscícolas, está centrada fundamentalmente en estudios de toxicidad
aguda. La línea celular RTG-2 derivada de trucha arcoiris, es una de las mas
utilizadas, habiéndose demostrado en estudios de citotoxicidad, una gran
capacidad para predecir la toxicidad relativa de sustancias químicas y muestras
ambientales (Castaño y col., 1996; Segner, 1998, Braunbeck 2000, Fent 2001)
es decir, presenta una muy buena correlación in vivo / in vitro. Esta línea celular
también ha sido aplicada en diversos estudios de genotoxicidad, valorando
aberraciones cromosómicas, incremento de micronúcleos, rotura de cadenas
etc (Kocan y col., 1982, 1985; Babich y Borenfreund,1995; Kohlpott, y col.,
1997; Sánchez y col., 2000; Braunbeck, y col., 2000). En trabajos anteriores

2
nuestro equipo de investigación ha aplicado la técnica de RAPDs para la
detección de daño inespecífico al DNA tras exposiciones agudas y crónicas a
genotóxicos patrón.
Las líneas celulares establecidas, presentan una dotación genómica
homogénea lo que permite, mediante la técnica RAPD, la obtención de una
huella genética o patrón de bandas constante y especifico de su DNA, sin la
distorsión que presenta la existencia de bandas polimórficas en la especie in
vivo. Esto junto con la posibilidad de evaluar los efectos transgeneracionales
que pueden producir las exposiciones crónicas a contaminantes
medioambientales, las convierten en un sistema muy adecuado para los
estudios de genotoxicidad. No obstante la idoneidad de su aplicación esta en
función básicamente, de la constatación de que los resultados obtenidos in vitro
sean semejantes a los resultados que se obtengan en estudios in vivo.
En el presente trabajo se realizo un estudio de detección de alteraciones
en trucha arcoiris tras una exposición intraperitoneal subletal a Benzo(a)Pireno,
el mismo contaminante ambiental utilizado en los estudios in vitro.
Con objeto de valorar los efectos que produce la exposición al toxico en
un mismo individuo a lo largo del tiempo, se utilizaron células de sangre
periférica que no implicaban el sacrificio del animal.
2. MATERIAL Y MÉTODOS
Se utilizaron un total de 18 truchas de las cuales y por diferentes
razones experimentales, solo 8 terminaron el periodo de estudio de 3 meses de

3
duración. Las truchas, obtenidas de varias piscifactorías, fueron aclimatadas
durante un mes antes de la exposición, que se realizó en acuarios individuales
de cristal de 50 L con flujo continuo. Los parámetros de calidad del agua se
controlaron diariamente (pH, oxígeno disuelto y temperatura) y en el momento
de la exposición, el peso medio de los individuos era de aproximadamente 150
grs.
Se realizo una exposición subletal en la mitad de los individuos (T5 a T8)
de 69 µg/g de peso corporal de Benzo(a)Pyrene (B(a)P, CAS nº 50-32-8,
Sigma, USA) mediante una única inyección intraperitoneal, utilizando aceite de
maíz como solvente. Las truchas restantes, (T1 a T4) fueron tratadas con la
misma cantidad de aceite de maíz y se utilizaron como control.
Para realizar los análisis, se extrajo 100 µl de sangre periférica de la
arteria caudal, inmediatamente antes de iniciar el tratamiento (t0) y
posteriormente, a intervalos de 30 días (t1, t2, t3). Dicha sangre fue recogida en
tubos de heparinizados y centrifuga a continuación a 1500 rpm durante 2 min.
El sedimento obtenido se resuspendió en buffer citrato (pH 7.4) y se congelaron
a –70 ºC en alícuotas de 100 µl hasta su posterior análisis.
2.1. Extracción del DNA y reacción de RAPD
La extracción y amplificación del DNA se realizo mediante el
procedimiento optimizado ya descrito en trabajos anteriores. (Ferrero y col.,
1998; Becerril y col., 1999)
Las amplificaciones se realizaron utilizando 4 primers (AA-82, AA-89, C-
96 y D-8) que previamente habían sido seleccionados por su buena correlación
in vivo / in vitro (Becerril y col.,2000). Debido a la presencia de polimorfismos

4
detectados en los individuos antes de la exposición, se realizo un estudio
individualizado de todos los individuos (tratados y no tratados). Para facilitar
este estudio, en cada gel se corrieron conjuntamente las reacciones de
amplificación realizadas con un solo primer y el DNA procedente de un solo
individuo, a los diferentes tiempos (cada uno de ellos por cuadruplicado), un
blanco (sin DNA molde) y un marcador de peso molecular (marker IV, Roche,
Alemania). Los geles se realizaron por duplicado en diferentes días.
Los productos de amplificación se resolvieron mediante electroforesis en
geles de agarosa (2,1% a 140 V durante 4 h) y teñidos con bromuro de etídio.
La imagen obtenida en cada gel fue captada utilizando el programa Grab-it
(UVP, USA) y, para evitar la subjetividad del operador, fue analizada mediante
el programa GelWork 1D (UVP, USA). Las bandas fueron codificadas siguiendo
el sistema descrito por Theodorakis y Shugart (1997).
2.2. Análisis de los resultados.
Se llevo a cabo un estudio horizontal intrasujeto, comparando cualitativa
y cuantitativamente los patrones de bandas obtenidos a los diferentes tiempos
de extracción (t0, t1, t2, t3,), considerando como control en todos los casos, el
perfil fluorimétrico correspondiente a t0.
El análisis cualitativo consistió en la detección de pérdida o ganancia de
nuevas bandas en cada uno de los individuos.
El estudio cuantitativo se realiza comparando estadísticamente los
valores del porcentaje de amplificación de las bandas considerando, tanto los
valores individualizados, como los valores agrupados en función de sus pesos
moleculares. (Becerril y col., 1999)

5
El análisis estadístico de los resultados se llevo a cabo comparando en
primer lugar, la homogeneidad de las varianzas mediante la prueba de
Friedman, de cada individuo a lo largo del periodo de estudio y posteriormente,
mediante la t-Student, las diferencias entre cada uno de los valores t1, t2, t3 y su
correspondiente control t0. El análisis estadístico se realizó mediante el
programa SPSS.
3. RESULTADOS y DISCUSIÓN
La presencia de bandas polimórficas, como consecuencia de la
variabilidad que presentan los individuos dentro de las poblaciones piscícolas,
dificulta la comparación de los patrones de bandas entre diferentes individuos,
siendo ésta la mayor limitación que presenta la técnica de RAPD en los
estudios in vivo. En nuestro caso todos los primers utilizados en este estudio
presentaron bandas polimórficas (Figura 1). Por esta razón, se ha realizado un
estudio horizontal a lo largo del tiempo para cada uno de los individuos,
tratados y no tratados, comparando cualitativa y cuantitativamente, los patrones
de bandas obtenidos con cada uno de los primers antes (t0) y después (t1 t2 t3)
de la exposición a B(a)P.
En el análisis cuantitativo, mediante el prueba de Friedman, se
advirtieron diferencias significativas en prácticamente la totalidad de las bandas
en todos los individuos tratados mientras que en los no tratados ninguna de
ellas se mostró alterada (Tabla l). Cuando se estudió la evolución de las
alteraciones en función del tiempo para cada individuo, se observó que en los

6
tratados, el porcentaje de bandas alteradas es máximo en t2 disminuyendo
prácticamente a niveles basales al final del periodo estudiado (t3) (Figura 2).
Esto se justifica por el propio sistema dinámico de renovación de células
sanguíneas favorecida, además, por el propio diseño del experimento, ya que
los sangrados secuenciales estimulan la eritropoyesis.
Como ya se ha demostrado en trabajos anteriores en los estudios in
vitro, las diferencias cuantitativas entre los patrones de bandas quedan mas
patentes cuando éstas se agrupan en función de sus pesos moleculares (Tabla
ll a y b). No obstante, y por razones obvias, los resultados de dicha agrupación
varían en función del primer, es decir, primers con un mayor numero de bandas
y distribuidas en un amplio rango de pesos moleculares p.ej. AA-89, AA-82 y
C-96, resultan más adecuados que aquellos que amplifican pocas bandas o
están desigualmente distribuidas, por ejemplo el D-8. (Figura 1).
En general las bandas de bajo peso molecular presentan en los
individuos tratados niveles mas altos de amplificación en detrimento de las
bandas de alto peso molecular, confirmando los resultados previamente
obtenidos en los estudios in vitro (Figura 3).
Estas alteraciones son consecuencia de cambios inducidos por el toxico
en la molécula de ADN. La formación de aductos no solamente inducir cambios
estructurales en el ADN sino que reducir la polimerización del ADN y / o
bloquear la actividad de la polimerasa. (Atienzar et al 2001).
También en el análisis cualitativo el patrón de bandas de los individuos
no tratados permaneció constante a lo largo del periodo de estudio. Sin
embargo, en la mitad de los individuos tratados apareció una nueva banda (AA-
89631) a partir de t1 o t2, (en función del individuo estudiado) permaneciendo

7
hasta el final del estudio, confirmando los resultados observados in vitro tanto
en las exposiciones agudas como en las exposiciones a largo plazo. La
frecuencia de aparición de dicha banda fue del 100% en todos los casos,
confirmando de nuevo lo observado en el caso de la exposición a largo plazo
de las células RTG-2 (Fig. 4). Sin embargo, y a diferencia de lo observado en
las exposiciones in vitro, no hubo desaparición de bandas.
La aparición de una nueva banda en dos de los individuos, como ya
ocurriera en los estudios in vitro, sugiere la presencia de cambios o mutaciones
en la secuencia genómica producidos por la acción especifica del B(a)P, como
ya se ha observado, utilizando esta misma metodología, en estudios de
poblaciones de peces y mamíferos sometidos a otros contaminantes.
(Theodorakis y Shugart 1997; Theodorakis y col., 1998, 2000; Shugart y col.,
1996; Sugg y col., 1996; Krane y col., 1998; Bickhman y col., 2000). La
presencia de cambios en el genoma también justificaría que a los diferentes
periodos de tiempo estudiados dicha banda permanezca constante.
Sin embargo, y debido al pequeño número de individuos analizados en
este estudio, no es posible extraer conclusiones determinantes ya que la propia
susceptibilidad individual requiere el análisis de muestras de gran tamaño. De
cualquier manera los resultados obtenidos son, sin duda, la manifestación de
las alteraciones producidas por este compuesto en el material genético tanto in
vivo como in vitro, demostrando claramente la capacidad de la línea celular
RTG-2 tanto para metabolizar este conocido promutágeno, como para predecir
los efectos genotóxicos que se observarían en los individuos expuestos. Es
evidente que para poder transferir dichos resultados in vitro a una escala

8
poblacional son necesarios estudios más completos y ambiciosos que exceden
los objetivos de este trabajo.
4. BIBLIOGRAFÍA
Babich, H. and Borenfreund, E. (1995). Cytotoxicity and genotoxicity assays
with cultured fish cells: a review. Toxicol. in Vitro 5, 91-100
Becerril, C., Ferrero, M., Sanz, F. and Castaño, A. (1999). Detection of
Mitomycin C-induced genetic damage in fish cells by use of RAPD.
Mutagénesis 14, 449-456.
Bickham, J. W., Sandhu, S., Hebert, P., Chikhi, L. and Athwal, R. (2000).
Effects of chemical contaminations on genetic diversity in natural populations:
implications for biomonitoring and ecotoxicology. Mut. Res. 463, 33-51
Braunbeck, T., Neumüller, D. (1996) The COMET assay in permanent and
primary fish cell cultures - a novel system to detect genotoxicity. In vitro Cell.
Dev. Biol. 32, 61A.
Castaño, A., Cantarino, M.J., Castillo, P. and Tarazona, J.V. (1996).
Correlations between the RTG-2 cytotoxicity test EC50 and in vitro LC50
rainbow trout assay. Chemosphere 32, 2141-2157
Fent, K., 2001. Fish cell lines as versatile tools in ecotoxicology:
assessment of cytotoxicity, cytochrome P4501A induction potential and
estrogenic activity of chemicals and environmental samples. Toxicology in Vitro
15, 477-488.

9
Ferrero, M., Castaño, A., Gonzalez, A., Sanz, F. and Becerril, C. (1998).
Characterization of RTG-2 fish cell line by random amplified polymorphic DNA.
Ecotoxicol. Environ. Safety. 40, 56-64
Kocan, R.M., Landolt, M.L. and Sabo K.M. (1982) Anaphase aberrations: a
measure of genotoxicity in mutagen-treated fish cells. Environ. Mutagen. 4, 181-
189.
Kocan, R.M., Powell, D.B. and Liguori, V.M. (1985). Relationship between
visible and heritable chromosome damage in trout cells and embryos. Mar.
Environ. Res. 17, 320-323.
Kohlpoth, M., Rusche, B. 1997. Kultivierung einer permanenten
Fischzellinie in serum-freien Medium: speziell Erfahrungen mit einen
Zytotoxizitätstest für Abwasserproben. ALTEX 14, 16-20.
Krane D.E., Sternberg D. C. and Burton G.A. (1998). Randomly amplified
polymorphic DNA profile-based measures of genetic diversity in crayfish
correlated with environmental impacts. Env. Tox. and Chem. 18, 504-508
Segner, H., 1998. Fish cell lines as a tool in aquatic toxicology. In: T.
Braunbeck, D.E. Hinton and B. Streit. (Eds) Fish Ecotoxicology. Birkäuser
Verlag Basel/Switzerland, pp 1-38.
Sánchez , P. Llorente M. T., and Castaño A. (2000). Flow cytometric
detection of micronuclei and cell cycle alterations in fish-derived cells after
exposure to three model genotoxic agents: Mitomicyn C, Vincristine sulfate and
Benzo(a)Pyrene. Mut. Res. 465, 113-122
Shugart L.R. and Theodorakis C.W. (1996). Genetic Ecotoxicology: The
genotypic diversity approach. Comp. Biochem. Physiol. 113, 273-276.

10
Sugg, D. W., Bickham, J. A., Brooks, M.D., Lomakin, C.H. Jagoe, C.E.
Dallas, M.H., Smith, R.J. and Chesser, R.K. (1996). DNA damage and
radiocesium in channel catfish from Chernobyl. Environ. Toxicol. Chem. 15,
1057–1063.
Theodorakis, C.W. and Shugart, L.R. (1997). Genetic ecotoxicology II:
population genetic structure in mosquitofish exposed in situ to radionuclides.
Ecotoxicology 6, 335-354.
Theodorakis, C.W., Bickham J. W. and Lyne Y. B.(2000). Integration of
genotoxicity and population genetic analyses in kangaroo rats (Dipodomys
merriam) exposed to radionuclide contamination at the Nevada Test Site, USA.
Environ. Toxicol. Chem. 2, 317-326
Theodorakis, C.W., Bickman, J.M., Elbi, T., Shugart, L.R. and Chesser,
R.K. (1998). Genetics of radionuclide-contaminated mosquitofish populations
and homology between Gambusia affinis and G. holbrooki. Environ. Toxicol.
Chem. 17 1992-1998
Atienzar, F., Cheung, V., Awadhesh N., Jha, A.N. and Depledge M.H.
(2001) Fitness parameters and DNA effects are sensitive indicators of copper-
induced toxicity in Daphnia magna. Toxicol. Sci. 59, 241-250

Tabla 1. Análisis cuantitativo: prueba de Friedman para el análisis de varianzas
del total de bandas amplificadas en los periodos de muestreo (t0, t1, t2, t3) para
cada uno de los individuo, tratados (B) y no tratados (A).
A B
Bandas T1 T2 T3 T4 T5 T6 T7 T8 C-961714 ns ns ns ns b c b b D-81554 ns ns ns ns ns c c a C-961321 ns ns ns ns b b c b D-81172 ns ns ns ns c a c ns D-81112 ns ns ns ns ns b c ns C-961099 ns ns ns ns b ns ------ ns AA-821075 ns ns ns ns b ns b a AA-82965 ns ns ns ns c ns c a C-96965 ----- ------ ------ ------ ns a ------ a C-96856 ns ns ns ns ns c ns ns AA-82840 ns ns ns ns ns ns ns ns D-8826 ns ns ns ns c b ns ns AA-82700 ns ns ns ns ns ns a a D-8686 ----- ----- ns ns ----- ----- ----- ----- C-96642 ns ns ns ns c a ns ns AA-82640 ----- ----- ----- ----- ----- ns ----- ns C-96598 ns ----- ----- ----- ns ----- ns ----- AA-82570 ----- ns ns ns a a b a C-96487 ns ns ns ns c a c a AA-82430 ns ns ns ns b b b C-96380 ns ns ns ns c c c a
ns = diferencias no significativas frente al control.
Diferencias significativas frente al control a = P<0,05; b = P<0,005: c = P<0,001
Numero de replicados = 8

Tabla 2. Análisis cuantitativo comparando los porcentajes de amplificación
individualizados de cada una de las bandas y agrupado según sus pesos
moleculares, antes y después de la exposición a B(a)P.
t0-t1 t0-t2 t0-t3
Bandas T5 T6 T7 T8 T5 T6 T7 T8 T5 T6 T7 T8 AA-821075 b ns a ns b ns ns ns ns ns ns ns AA-82965 c a c ns c a a b b ns ns ns AA-82840 ns ns ns ns ns ns ns ns ns ns ns ns
Altopm c b c c c b c c ns ns c ns AA-82700 ns ns ns b ns ns a a ns ns ns ns AA-82640 ------ ns ------ ns ------ ns ------ ns ------ ns ------ ns
Mediopm AA-82570 ns ns c ns c a ns b a ns ns ns AA-82430 c ns b ns c b a b ns b ns ns
Bajopm b a c c c b b c ns ns b ns C-961714 b a b b a ns b b ns ns ns ns C-961321 a b c a ns c b ns ns ns ns ns C-961099 b a ------ ns ns a ------ ns ns ns ------ ns
Altopm b b b ns ns ns b ns ns ns ns ns C-96964 ns a ------ ns ns b ------ b ns a ------ b C-96856 ns ns ns ns ns ns ns ns ns ns ns ns
Mediopm a a a ns a ns ns ns ns ns ns ns C-96642 b b ns ns c ns a ns a ns ns ns C-96598 ns ------ ns ------ ns ------ ns ------ ns ------ ns ------ C-96487 a b b a c a a a b ns ns ns C-96380 c c a b a ns c a ns ns ns ns
Bajopm c a b ns ns a ns ns ns ns ns ns D-81554 ns ns a ns ns c b b ns ns ns ns
Altopm D-81172 b a c ns c ns ns ns b ns ns ns D-81112 ns a c ns b a ns ns ns a ns ns
Mediopm c a a ns b a c b ns ns ns ns D-8826 c a ns ns c ns ns ns a ns ns ns
Bajopm
AA-89 Altopm c b c c c b c c ns ns c ns
Mediopm ns c a ns ns c a ns ns ns b ns Bajopm b a c c c b b c ns ns b ns
ns = diferencias no significativas frente al control. t0 = antes de la exposición t1, t2 y t3 = 1, 2 y 3 meses después de la exposición. Diferencias significativas frente al control a = P<0,05; b = P<0,005: c = P<0,001 Numero de replicados = 8


