universidad catÓlica de santa maria … · electrica y mecatronica “caracterizacion de un nuevo...
TRANSCRIPT

UNIVERSIDAD CATÓLICA DE SANTA MARIA
FACULTAD DE CIENCIAS E INGENIERIAS FISICAS Y FORMALES
PROGRAMA PROFESIONAL DE INGENIERIA MECANICA, MECANICA ELECTRICA Y MECATRONICA
“CARACTERIZACION DE UN NUEVO PAVIMENTO BLANDO USANDO
COMO BASE CAUCHO RECICLADO Y POLIMERO DE ALTA DENSIDAD
(HDPE) RECICLADO”
Tesis Presentado por los Bachilleres:
Atamari Chahuara, Luis Carlos
Condorpocco Huamaní, Walter Gabriel
Para optar el Título Profesional:
Ingeniero Mecatrónico
Ingeniero Mecánico Electricista
Arequipa - Perú
2013

2
INDICE
INDICE..………………………………………………………………………………………………….…………………………. 2 DEDICATORIA……………………………………………………………………………………….…………………………… 5 RESUMEN…………………………………………………………………………………….………….………………………… 6 ABSTRACT……………………………………………………………………………………………….………………………… 7 INTRODUCCION……………………………………………………………………………………….……………………….. 8
CAPITULO I
PLANTEAMIENTO METODOLOGICO
1. Planteamiento metodológico………………………………………………………………………………. 11 1.1 Justificación……………………………………………………………………………..……………………. 11 1.2 Problema Objeto de investigación………………………………………………………………… 11 1.3 Objetivos.….…………………………………………………………………………………………………… 12
1.3.1. Objetivo general…………………………………………………………………………………. 12 1.3.2. Objetivos específicos………………………………………………………………….………. 12
1.4 Hipótesis……………………………………………………………………………………………….……….. 12 1.5 Producto del proyecto……………………………………………………………………………………. 13 1.6 Identificación de las Variables…………………………………………………………….………….. 13 1.7 Impacto medio ambiental……………………………………………………………………..……….. 13 1.8 Impacto de la realización del trabajo……………………………………………………………… 13 1.9 Impacto medio ambiental del plástico cauchos………………………………………………. 14
CAPITULO II
MARCO TEORICO
2. Marco teórico…………………………………………………..…………………………………................. 16 2.1 Introducción………………………………………………………………………………………………….. 16 2.2 Clasificación y propiedad de los polímeros…………………………………………..……….. 16
2.2.1 Clasificación de los polímeros……………………………………..………..………..… 17 2.3 Propiedades de los polímeros………………………………………………………………………… 20
2.3.1 Masa molecular media y longitud de las cadenas……………………………… 20 2.3.2 Masa molecular media y longitud de las cadenas……………………………… 20 2.3.3 Dureza y flexibilidad………………………………………………………………….......... 21 2.3.4 Conductividad térmica y eléctrica……………………………………………………… 21 2.3.5 Resistencia………………………………………………………………………………………… 21
2.4 Obtención de los polímeros…………………………………………………………………………… 21 2.4.1 Polímeros de Adición………………………………………………………………………… 21 2.4.2 Polímeros de Condensación …………………………………………………………….. 22
2.5 Plásticos sintéticos………………………………………..………………………………………………. 22 2.5.1 Polietileno(PE)………………………..………………….…….…………….……………….. 23
3
2.6 Comparación de propiedades……………………………………………………….………………. 25 2.7 Ventajas y desventajas al usar HDPE Y LDPE………………………………………………….. 27 2.8 Cauchos…………………………………………………………………………………………………………. 27
2.8.1 Origen………………………………………………………………………………………………. 27 2.8.2 Teoría del caucho……………………………………………………………………………… 28 2.8.3 Caucho natural……………………………………………………………………………….…
2.8.3.1 Obtención del caucho natural……………………………………………….……. 29 29
2.8.3.2 Propiedades generales……………………………………………………….………. 29 2.8.4 Caucho sintético……………………………………………………………………………….. 34
2.8.4.1 Principales tipos de caucho sintético ……………………………...…………. 35 2.8.5 Propiedades……………………………………………………………………………………… 41
2.9 Vulcanización del caucho……………………………………………………………………….……… 43 2.9.1 Fundamentos del proceso………………………………………………………………… 49 2.9.2 Causas que generan un mal registro de temperaturas………….…….……. 52 2.9.3 Cura optima…………………………………………………………………………………..…. 53 2.9.4 Control del proceso……………………………………………………………..……….….. 53 2.9.5 Validación del proceso productivo de vulcanización ………………………… 54
2.10 Reutilización de los desechos sólidos en las industrias de llantas y neumáticos………..........................................................................................
54
2.10.1 Reencauchado………………………………………………….………………………………. 55 2.11 Tecnologías de reducción de tamaño………………………..………..…………………… 56
2.11.1 Molienda criogénica…………………………………………………..…………………….. 56 2.11.2 Regla de mezclas…………………………………………………..………………………….. 57
2.12 Concepto de miscibilidad…………………………………………………………………………. 58 2.13 La transición vítrea en polímeros………………………………..…………………………… 59 2.14 Análisis mecánico dinámico……………………………………………………………………… 60
CAPITULO III
PROCEDIMIENTO EXPERIMENTAL
3. PROCEDIMIENTO EXPERIMENTAL………………………………………………………………………… 62 3.1 Caracterización de las Muestras……………………………………………………….…………… 62 3.2 Preparación de las Mezclas………………………………………………………………..……….…. 65 3.3 Preparación de las Placas………………………………………………………………………………. 67 3.4 Elaboración de las Placas………………………………………………………………………………. 68 3.5 Ensayo de Impacto de Caída de bola…………………………………………….………………. 72 3.6 Ensayo de Dureza……………………………………………………………………………………….… 73
CAPITULO IV
RESULTADOS Y DISCUSIONES
4. RESULTADOS Y DISCUSIONES……………….…………………………….……..………….………..…… 76 4.1 Caracterización de las Muestras …………………………………………..………………………. 76 4.2 Resultados de la Preparación de las mezclas……………………….………………………… 78 4.3 Resultados del Control Reologico……………………………..………………………….……….. 80

4
4.4 Ensayo de Impacto de Caída de Bola…………………………………………………….…….…. 88 4.5 Ensayo de Dureza ………………………………………………………………….……………..……… 90 4.6 Ensayo de Tracción………………………………………………………………….………….…….…… 93
4.7. Comparación de Pavimentos………………………………………………………………………… 96 4.7.1 Pavimentos Tradicionales……………………………………….…………………….….… 96 4.7.2 Pavimento Blandos Reciclados……………………………….….…………………....... 97
CAPITULO V
COSTO de EQUIPOS
5. Costos…………………………………………………………….……………………………….………………… 101
CONCLUSIONES…………………………………………………………….………………………..….………………….. 105 RECOMENDACIONES…………………………………………………….…….………….………….………………….. 106 BIBLIOGRAFIA……………………………………………………………………………………..……….……….……….. 107 PAGINA WEB……………………………………………………………..………………………………….……….......... 109 ANEXOS………………………………………………………………………………………………..……….…………….... 110

5
DEDICATORIA
A la memoria de mi madre Virginia con
el más grande de mis recuerdos, a quien
eternamente agradeceré por guiarme en
mi formación profesional.
A mi padre Godofredo con inmenso
amor y gratitud por su preocupación y
sacrificio en mi formación profesional.
A mis Hermanos Dhilner y Rina por su
constante aliento y apoyo moral.
Luis Carlos Atamari Chahuara
A mis padres Catalina y Oswaldo por guiarme
por el buen camino y por darme su amor y
apoyo incondicional, porque gracias a sus
consejos y ejemplos dignos de esfuerzo y
perseverancia logre una de mis metas mas
anheladas.
A mis hermanos Lucho, Wilson y Luis quienes
estuvieron apoyándome en todo momento.
A todos los ingenieros que contribuyeron en la
elaboración de esta Tesis.
Gabriel Walter Condorpocco Huamaní
6
RESUMEN
“CARACTERIZACION DE UN NUEVO PAVIMENTO BLANDO USANDO COMO BASE CAUCHO RECICLADO Y POLIMERO DE ALTA DENSIDAD
(HDPE) RECICLADO”
Los pavimentos blandos son materiales que se obtienen de una mezcla óptima de
caucho reciclado y polietileno de alta densidad o baja densidad dependiendo del uso o
utilización del mismo.
En este trabajo realizamos mezclas a diferentes porcentajes de caucho y HDPE
reciclado pasándolo por diferentes tamices (mallas) aplicándole diferentes pruebas
mecánicas como son:
• Rebote.
• Dureza.
• Tracción.
Quedando demostrado que el mejor porcentaje para este pavimento es 85 % de caucho
15 % de HDPE pasando por la malla Nº 4 obteniendo como resultados un buen
comportamiento mecánico y un bajo costo.
Todos los parámetros usados para la fabricación de probetas y la realización de ensayos
están basados en las Normas ASTM con designación F 1487, ASTM D412, DIN 53504,
ISO 37, ISO 1798, JIS K6251.

7
ABSTRACT
"CHARACTERIZATION OF A NEW PAVEMENT USING AS BASE SOFT RUBBER POLYMER RECYCLING AND HIGH DENSITY
(HDPE) RECYCLED"
The pavements are soft materials that are obtained from an optimal mix of recycled
rubber and polyethylene high density or low density depending on the use or use of the
same.
This paper made mixtures at various percentages of rubber and HDPE recycling by
passing it different strainers (meshes) by applying different mechanical tests such as:
• Rebound.
• Hardness.
• Traction.
It was demonstrated that the best percentage for this pavement is 85 per cent of rubber
15 per cent of HDPE passing through the mesh No. 4 obtaining as results a good
mechanical behavior and a low cost.
All parameters used in the manufacture of test specimens and testing are based on
standards with designation ASTM F 1487, ASTM D412, DIN 53504, ISO 37, ISO
1798, JIS K6251.

8
INTRODUCCION
Durante los últimos años se han implantado sistemas de calidad que controlan los
procesos y el material en la empresas que fabrican caucho; en este sentido las
empresas recicladoras ya han impuesto la misma filosofía de calidad, al igual que
en los materiales vírgenes, de tal modo que las empresas recuperadoras con un
mínimo de proyección futura ya expenden los materiales con determinada
certificación. Por el contrario, no existen datos que den a entender que las
empresas recuperadoras apliquen la misma filosofía sobre los residuos que
recuperan.
En la última década, en muchos países se ha acentuado la preocupación por la
disposición de residuos sólidos, que por sus características no biodegradables y
alto volumen en que se producen, constituyen un grave problema para el medio
ambiente; entre estos se encuentran los residuos de caucho como EVA (etileno
vinil acetato), PU (poliuretano), y SBR (hule estireno-butadieno), así como los
productos fabricados con este último material que al concluir su vida útil vienen a
sumarse a la acumulación de este tipo de residuos como es el caso de los
neumáticos; muchos de los cuales, son quemados en condiciones no controladas
generando un grave deterioro en la calidad del aire y agravando la contaminación
ambiental excesiva.
Por otro lado el desarrollo de materiales alternativos empleados en la industria de
la construcción es un acontecimiento que se ha incrementado en los últimos años,
en donde el aprovechamiento de diferentes residuos generados en las ciudades es
el eje central de esta investigación. Esta situación obedece principalmente a dos
causas, una como estrategia para la disminución de los altos volúmenes de
residuos generados y la segunda al cumplimiento de las exigencias para poder
reciclar, en donde es factible el empleo del material o del pavimento blando a
desarrollarse.
Los neumáticos desechados constituyen un grave problema medioambiental en
nuestra ciudad y en el mundo entero. Las principales dificultades generadas por
este residuo, tienen que ver con su disposición final, dado que la mayoría de los

9
neumáticos fuera de uso, se encuentran desechados y juntados ocupando gran
espacio, o en casos extremos son quemados por algunas fábricas que lo usan
como combustible, también contribuye a la proliferación de roedores, insectos y
otros posibles focos de infecciones.
Una vez que los plásticos y neumáticos han cumplido la misión para los que
fueron fabricados y termina la vida útil de los mismos son simplemente
acumulados, es por esta razón que es necesario realizar estudios para poder
reutilizar los materiales desechados generando así un nuevo producto.
Para poder realizar esta investigación y viendo la necesidad que requería el
Laboratorio de Materiales de Fabricación del Programa Profesional de Ingeniería
Mecánica, Mecánica Eléctrica y Mecatrónica, se vio por conveniente Diseñar y
Construir una Maquina Mezcladora de Cauchos con Resistencias Tipo
Brabender con su respectiva Termo Prensa de Conformado para Donación de
nuestro Programa y Alma Mater.

10
CAPITULO I
PLANTEAMIENTO METODOLOGICO
11
1. PLANTEAMIENTO METODOLOGICO
1.1 JUSTIFICACION
El desarrollo del presente trabajo nos permite adoptar una nueva forma de
minimizar la contaminación reutilizando productos que conlleven a la misma y
al mismo tiempo aprovechar de ellos.
Actualmente, el estudio sobre las posibilidades de utilizar los residuos, es uno
de los objetivos prioritarios de carácter medioambiental en la investigación
científica y técnica, para ello es necesario alcanzar un conocimiento profundo
sobre los distintos tipos de residuos, el volumen de los mismos, las
posibilidades técnicas, la repercusión económica, las limitaciones de uso y las
precauciones que requiere su empleo. Además de asignar para cada residuo de
los diferentes tipos de caucho el mejor aprovechamiento entre los usos
posibles, a fin de obtener el mayor valor añadido.
Parte de la solución al problema que se va a plantear es la reutilización de
caucho reciclado para la obtención de nuevos pavimentos blandos ya que el uso
de estos es muy diverso en parques infantiles, guarderías u otros, se pretende
desarrollar un enfoque que ayude a minimizar la contaminación usando los
materiales reciclados que mediante la combinación de polietilenos de alta
densidad (HDPE) reciclado y caucho granulado reciclado de neumáticos nos
proporcione un nuevo producto.
1.2 PROBLEMA OBJETO DE INVESTIGACION
En el desarrollo del presente trabajo de investigación sobre pavimentos blandos
busca identificar el efecto de la mezcla en diferentes porcentajes del caucho
reciclado (triturado) y polietileno de alta densidad reciclado picado, así como
evaluar las posibles modificaciones de las propiedades mecánicas del nuevo
producto según Normas ASTM.

12
1.3 OBJETIVOS
1.3.1 Objetivo General.
Determinar la proporción optima de mezcla y evaluar las propiedades
mecánicas, mediante ensayos mecánicos de acuerdo a las Normas
existentes ASTM con designación F 1487, ASTM D412, DIN 53504,
ISO 37, ISO 1798, JIS K6251.
1.3.2 Objetivos Específicos.
• Analizar el grado de dureza de estos pavimentos blandos.
• Determinar su resistencia a la elongación de estos pavimentos blandos.
• Contribuir a la eliminación de residuos sólidos, para mejorar la calidad
de vida en la ciudad de Arequipa.
• Encontrar un nuevo pavimento blando, que en su producción no se utilice
productos contaminantes, o procesos que contaminen el medio ambiente;
es decir un proceso y producto ecológico.
• Contribuir dándole un valor agregado a los productos resultantes de la
preparación de neumáticos en desuso reciclándolos con el polietileno de
alta densidad reciclado.
• Evaluar la posibilidad de producir un pavimento blando con menor costo
que el convencional.
1.4 HIPOTESIS
La unión o combinación de caucho reciclado triturado y polietileno de alta
densidad darán como resultado un nuevo pavimento blando, con buenas
propiedades de acuerdo a Norma ASTM con designación F 1487.

13
1.5 PRODUCTOS DEL PROYECTO
Como productos se obtendrán:
Una mezcla optima de caucho reciclado triturado y polietileno de alta
densidad reciclado, para la generación de un pavimento blando que serán
utilizados en pisos de jardines, pisos de albergues, y centros de salud o
donde este sea necesario.
Una mezcla optima de caucho reciclado, triturado y polietileno de alta
densidad reciclado para la generación de un pavimento blando de menor
costo y que cumpla con los requerimientos especificados en las normas ya
expuestas.
1.6 IDENTIFICACION DE LAS VARIABLES
En estas mezclas o combinaciones se evaluaran los diferentes porcentajes,
tamaños de grano de caucho y polietileno reciclado triturado.
a. Variable Independiente: Ensayo de resiliencia, ensayo de dureza, ensayo
de tracción.
b. Variable Dependiente: Porcentajes de caucho y granulometría y costo.
1.7 IMPACTO MEDIO AMBIENTAL
Durante la elaboración de este proyecto de investigación, se han tomado las
medidas correspondientes para el cuidado del medio ambiente. Teniendo en
cuenta dos puntos importantes, en primer lugar, el impacto derivado durante la
realización del proyecto y en segundo lugar, el impacto que con lleva en
general el plástico y el caucho en la naturaleza.
1.8 IMPACTO DE LA REALIZACIÓN DEL TRABAJO
Fueron tomadas en cuenta las medidas correspondientes durante la realización
de este proyecto como: reciclaje de residuos, buen manejo de residuos, ahorro
de energía durante los ensayos sin hacer un consumo excesivo de éstos; y sobre
todo la limpieza de los equipos usados.
14
1.9 IMPACTO MEDIO AMBIENTAL DEL PLÁSTICO Y CAUCHOS
Los residuos son aquellos productos que ya no son utilizables por quien los
genero y que usualmente se tiran a la basura. Estos dos productos que se están
utilizando para generar pavimentos blandos son generalmente desechados
indiscriminadamente. A diferencia de otros muchos materiales que llegan a los
vertederos, los plásticos y cauchos no se disuelven en el agua ni se pudren.
Trayendo consigo una ventaja y una desventaja:
• Una ventaja: Porque, al no descomponerse, no liberan ningún producto
nocivo.
• Desventaja o inconveniente: Porque se acumulan sin desaparecer.

15
CAPITULO II
MARCO TEORICO

16
2. MARCO TEÓRICO
2.1 INTRODUCCIÓN
Se denominan materiales plásticos a un numeroso grupo de materiales
poliméricos orgánicos (los compuestos por moléculas orgánicas gigantes), que
son plásticos, es decir, poseen durante unintervalo de temperaturas
propiedades de elasticidad y flexibilidad que permiten moldearlas y adaptarlas
a diferentes formas y aplicaciones hasta conseguir una forma deseada por
medio de extrusión, moldeo o hilado. Las moléculas pueden ser de origen
natural (celulosa, cera, caucho, etc.), o sintéticas (polietileno, nylon).
Los plásticos se caracterizan por una relación resistencia/densidad elevada,
unas propiedades excelentes para el aislamiento térmico y eléctrico y una
buena resistencia a la corrosión, a los ácidos, álcalis y disolventes. Las enormes
moléculas de las que están compuestos pueden ser lineales, ramificadas o
entrecruzadas, dependiendo del tipo de polímero. Las moléculas lineales y
ramificadas son termoplásticas (se ablandan con el calor), mientras que las
entrecruzadas son termoestables (se endurecen con el calor).
2.2 CLASIFICACIÓN Y PROPIEDADES DE LOS POLÍMEROS
Los polímeros son grandes agrupaciones de monómeros unidos mediante un
proceso químico llamado polimerización al ser obtenidos por un proceso
químico su clasificación es muy diversa esto lo desarrollaremos más adelante.
Los plásticos proporcionan el balance necesario de propiedades que no pueden
lograrse con otros materiales por ejemplo: color, poco peso, tacto agradable y
resistencia a la degradación ambiental y biológica.
Las propiedades y características de la mayoría de los plásticos (aunque no
siempre se cumplen en determinados plásticos especiales) son estas:
• Fáciles de trabajar y moldear,
• Tienen un bajo costo de producción,
• Poseen baja densidad,
• Suelen ser impermeables,

17
• Buenos aislantes eléctricos,
• Aceptables aislantes acústicos,
• Buenos aislantes térmicos, aunque la mayoría no resisten temperaturas
muy elevadas,
• Resistentes a la corrosión y a muchos factores químicos;
• Algunos no son biodegradables ni fáciles de reciclar, y si se queman, son
muy contaminantes.
2.2.1 Clasificación de los polímeros
La clasificación de un polímero dependerá de diversos parámetros:
método de síntesis, estructura, configuración, composición, uso final,
estado físico, etc. Analizaremos al polímero según su:
a) Composición química
Atendiendo a su composición química, los polímeros pueden clasificarse
en:
• Polímeros Inorgánicos: Son polímeros en los que no intervienen
monómeros de hidrocarburo en su composición. Se pueden clasificar
atendiendo a su composición en siliconas (formadas básicamente por
silicio y oxígeno), azufres poliméricos, fosfacenos (fósforo y nitrógeno)
y fibras de carbono y de grafito, que si bien contienen carbono, éste no
se encuentra formando parte de moléculas de hidrocarburo.
• Polímeros Orgánicos: Son los plásticos convencionales, estando
formados por hidrocarburos o derivados de ellos. Se clasifican según el
tipo de monómeros que intervienen en su formación (poliamidas,
polivinilos, etc.).
b) Origen
En cuanto a su origen podemos distinguir tres tipos de polímeros:
• Polímeros naturales: Son los polímeros generados por la actividad de
los seres vivos, que los utilizan con fines estructurales, funcionales y de
reserva energética. A este grupo pertenecen las proteínas, los ácidos

18
nucleídos y los polisacáridos, siendo estos últimos los que presentan un
mayor interés en cuanto a sus aplicaciones.
• Polímeros de transformación: son polímeros obtenidos por
transformación de polímeros naturales.
• Polímeros sintéticos: Son polímeros sintetizados mediante técnicas de
laboratorio o industriales, directamente a partir de las unidades de
monómero.
c) Monómeros de partida
Según los monómeros que constituyen los polímeros, éstos pueden
clasificarse en:
• Homopolímeros: formados a partir de un solo tipo de unidades de
monómeros.
• Heteropolímeros o Copolímeros: formados a partir de dos o más tipos
diferentes de monómeros. A este grupo pertenecen las proteínas, que
pueden contener hasta 20 unidades diferentes, y los ácidos nucleídos.
Los polisacáridos y los polímeros sintéticos pueden ser tanto homo
como heteropolímeros, si bien en este caso el número de unidades
diferentes que participan no suele ser superior a 2 o 3.
d) Estructura de la cadena
Según este criterio, los polímeros pueden clasificarse en dos grandes
grupos:
• Lineales: son aquellos en los que las cadenas están formadas por
monómeros que presentan sólo dos puntos de unión con las otras
unidades monoméricas, dando lugar a estructuras unidimensionales.
• Ramificados: Los monómeros presentan tres o más puntos de unión,
dando lugar a estructuras bidimensionales o tridimensionales.
19
e) Según el orden de las cadenas
Según el orden se pueden presentar las cadenas poliméricas en el estado
sólido podemos distinguir dos grupos:
• Cristalinos: este término no estrictamente correcto aplicarlo en el caso
de los polímeros ya que éstos no dan lugar a estructuras
tridimensionales ordenadas (están más próximas a los llamados cristales
líquidos), sin embargo se emplea para designar aquellos polímeros
cuyas largas cadenas se ordenan paralelamente unas a otras, uniéndose
entre ellas a través de enlaces (puente de hidrógeno, etc.) De esta forma,
el material resulta presenta una mayor resistencia a la tracción.
• Amorfos: En este tipo de polímeros, las cadenas no se alinean ni se
producen uniones transversales entre ellas. Esto hace que si se calienta
el material las cadenas pueden deslizar unas respecto otras, se ablandan
el polímero volviéndose pegajoso, pudiendo llegar a fundir. A
temperaturas inferiores a la que se produce el estado pegajoso, los
polímeros amorfos son blandos y elásticos, y, a temperaturas más bajas,
se endurecen y adoptan un aspecto vítreo.
f) Respuesta al calor
Es quizás uno de los criterios más empleados a la hora de clasificar a los
plásticos. Según este criterio, los polímeros pueden clasificarse en:
• Termoplásticos: Son aquellos que al exponerlos al calor pueden
fundirse o reblandecerse varias veces sin que cambie su estructura y
propiedades, es decir, que pueden moldearse de nuevo. Son, en general,
polímeros con bajas temperaturas de fusión y solubles en disolventes
orgánicos. La mayoría de los polímeros con estructura lineal pertenecen
a este grupo.
• Termoestables: son polímeros que al calentarse sufren cambios
químicos y estructurales que provocan su endurecimiento, y por tanto al
enfriarse y solidificar lo hacen de forma irreversible. Este
comportamiento se debe, generalmente, a que se producen un aumento
de la polimerización por reacciones de entrecruzamiento entre las
20
cadenas. Son polímeros de punto de fusión elevado (aunque pueden
degradarse y descomponerse antes de fundir), e insolubles en disolvente
orgánicos. La mayoría de los polímeros con estructura bi o
tridimensionales pertenecen a este grupo.
2.3 PROPIEDADES DE LOS POLÍMEROS
2.3.1 MASA MOLECULAR MEDIA Y LONGITUD DE LAS CADENAS
Muchos polímeros no están constituidos por moléculas bien definidas,
sino mezclas de moléculas de diferente tamaño, ya que el proceso de
crecimiento de las cadenas poliméricas está sujeto a las leyes de la
probabilidad; es decir, la polimerización puede progresar en diferente
grado en la misma reacción. Por este motivo no se habla estrictamente de
masa molecular, sino de masa molecular promedio, que corresponderá a
la longitud media de las cadenas poliméricas.
Hay que tener presente además que los polímeros presentan propiedades
físicas y químicas muy distintas de las que poseen los materiales
formados por moléculas sencillas. Así, suelen presentar una mayor su
inercia química, que los hace inatacables por los ácidos, los álcalis y por
los agentes atmosféricos; una elevada resistencia mecánica, que los hace
resistentes a la rotura y al desgaste; un elevado poder dieléctrico; además
de su elasticidad, su fácil teñido, su baja densidad y su fácil obtención a
bajas temperaturas, que permite su fabricación a gran escala.
2.3.2 DUREZA Y FLEXIBILIDAD
La dureza o robustez que ofrece un material de naturaleza polimérica va
a depender esencialmente de las fuerzas de Van der Waals y de los
puentes de hidrógeno que puedan establecerse entre sus cadenas.
Recordemos que las fuerzas de Van der Waals aparecen entre moléculas
neutras como resultado de la polarización eléctrica y que su intensidad
aumenta con la masa molecular. No obstante, la dureza de los materiales
plásticos suele ser baja.

21
Por su parte, la flexibilidad depende de la posibilidad de desplazamiento
de unas cadenas respecto a otras, aunque en conjunto estén empaquetadas
de un modo compacto. Esta facilidad de desplazamiento se encuentra en
mayor medida en polímeros no polares donde las uniones entre cadenas
son más débiles.
2.3.3 CONDUCTIVIDAD TÉRMICA Y ELÉCTRICA
La conductividad térmica de los plásticos es muy baja, disminuyendo
cuanto más desordenada sea la estructura molecular del mismo. Son por
tanto buenos aislantes, tanto del frío como del calor.
En cuanto a la conductividad eléctrica, ésta es muy pequeña ya que el
número de electrones libres para la conducción es prácticamente nulo al
estar constituidos por compuestos covalentes.
2.3.4 RESISTENCIA:
La resistencia a la tracción, en general, no es pequeña en comparación
con otros materiales, oscilando entre 4 y 10 Kg./mm2, siendo los
plásticos termoestables más resistentes, debido a su estructura
tridimensional, que los termoplásticos. Dentro de estos últimos, los que
presentan cadenas rígidas son más resistentes que los que no presente
cadena rígida. En lo que se refiere a la resistencia al choque, existen
algunos tipos de plásticos que presentan valores muy altos.
2.4 OBTENCIÓN DE POLÍMEROS
Las reacciones por las que los monómeros se unen entre sí para formar un
polímero son básicamente de dos tipos: de adición y de condensación.
2.4.1 POLÍMEROS DE ADICIÓN
La característica fundamental de este tipo de reacción es que el polímero
se forma por unión directa de las unidades monoméricas entre sí, sin que
se elimine ningún tipo de molécula residual. Estas reacciones se basan en
la existencia de uno o varios enlaces insaturados en el monómero, que se
transforman en enlaces simples en el polímero. Hay que tener en cuenta
que, si el monómero posee más de un enlace insaturado, la reacción puede
22
proceder de varias formas, dando lugar a diferentes polímeros con
propiedades que pueden llegar a ser totalmente diferentes. En cualquier
caso, los polímeros resultantes presentarán una estructura lineal, siendo en
general plásticos termoplásticos.
Se trata de reacciones en cadena en las que la primera adición de un
monómero a otro, produce una especie intermedia muy reactiva que
promueve sucesivas adiciones.
2.4.2 POLÍMEROS DE CONDENSACIÓN
Mientras que la polimerización por adición se basa en una reacción en
cadena, cuyos eslabones son las moléculas en crecimiento, en la
polimerización por condensación no se presenta tal cadena, sino que
procede paso a paso, por sucesivas condensaciones entre moléculas de
monómero poli funcional, con eliminación de una pequeña molécula
(generalmente agua). Esta liberación constituye la característica
fundamental de la polimerización por condensación.
Este tipo de reacciones, a diferencia de las anteriores, presentan equilibrio
químico, lo que hace que las longitudes de las cadenas formadas, que
también presentarán una estructura lineal, sean sensiblemente menores que
la de los polímeros de adición.
2.5 PLÁSTICOS SINTÉTICOS
Los plásticos sintéticos se diferencian de los plásticos de origen natural en la
naturaleza de la materia prima. A diferencias de estos últimos, los sintéticos no
se preparan a partir de alguna sustancia polimérica, sino que parten de los
monómeros que van a constituir el polímero plástico. En la actualidad, la
fuente de dichos monómeros es el petróleo, no obstante, dado que las
existencias mundiales de petróleo tienen un límite, se están investigando otras
fuentes de materias primas, como la gasificación del carbón.
23
2.5.1 POLIETILENO (PE)
Se obtiene por polimerización del etileno, siendo el polímero de cadena
más sencilla, mediante un proceso cuyo resultado depende de la presión a
la que éste se ha llevado a cabo. A presiones altas (entre 1.000 y 3.000
atm) se obtiene el llamado polietileno de baja densidad (0.915–0.935
gr/cc), y a presiones normales y a unos 70ºC, en presencia de
catalizadores, se obtiene el polietileno de alta densidad (0.935–0.975
gr/cc). Sus características varían ampliamente, según su peso molecular.
Puede existir bajo la forma cristalina (elástico, oscuro, poco soluble,
deformable) o la forma amorfa (duro, resistente, más claro, más soluble).
Tiene gran inercia química y es resistente a la corrosión y a los hongos.
Posee gran impermeabilidad a líquidos y vapores.
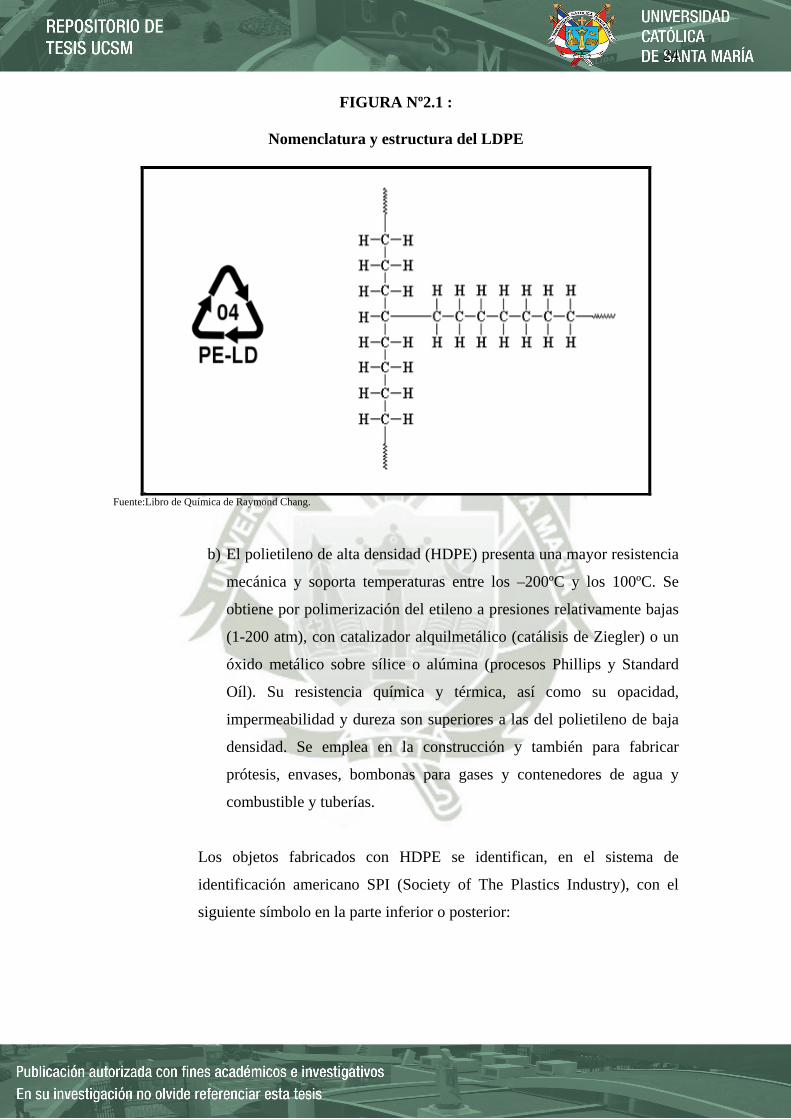
a) El polietileno de baja densidad (LDPE), Se obtiene por polimerización
del etileno a altas presiones (aproximadamente 1200 atm y 200º C)
con oxígeno o catalizador de peróxido y por mecanismo de radicales
libres. Es un sólido más o menos flexible, según el grosor, ligero y
buen aislante eléctrico. Se trata de un material plástico que por sus
características y bajo coste se utiliza mucho en envasado,
revestimiento de cables y en la fabricación de tuberías. Los objetos
fabricados con LDPE se identifican, en el sistema de identificación
americano SPI (Society of The Plastics Industry), con el siguiente
símbolo en la parte inferior o posterior:
24
FIGURA Nº2.1 :
Nomenclatura y estructura del LDPE
Fuente:Libro de Química de Raymond Chang.
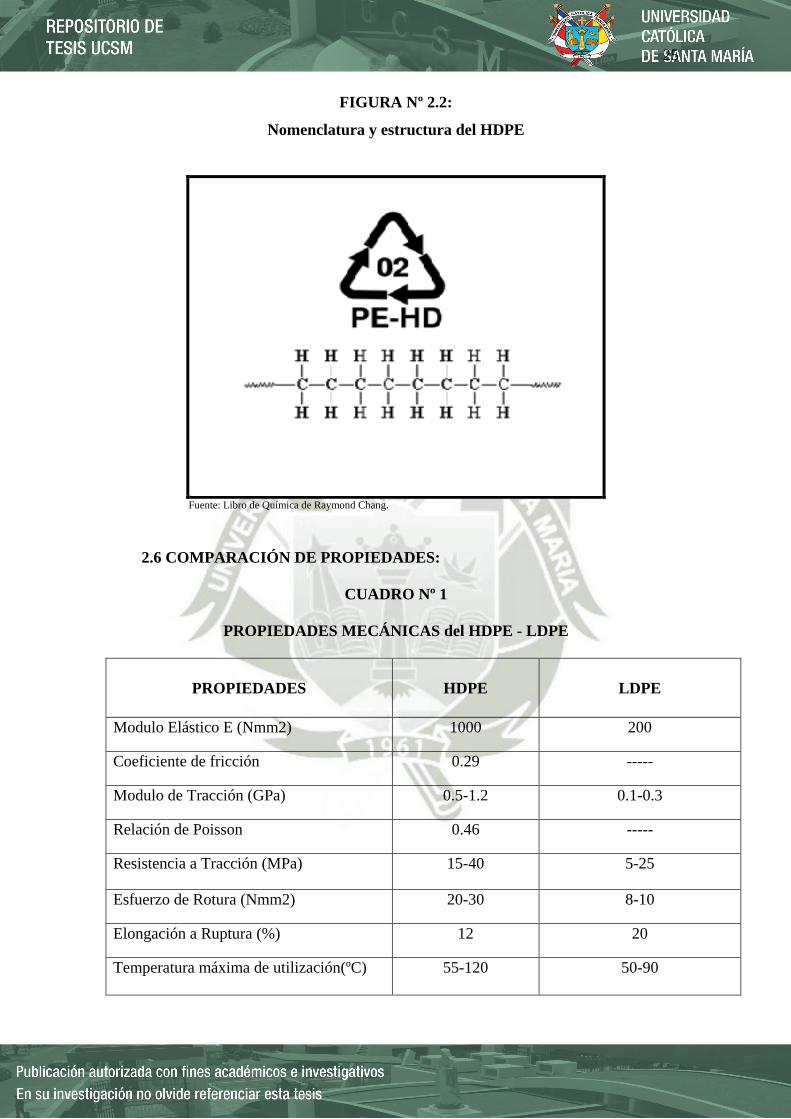
b) El polietileno de alta densidad (HDPE) presenta una mayor resistencia
mecánica y soporta temperaturas entre los –200ºC y los 100ºC. Se
obtiene por polimerización del etileno a presiones relativamente bajas
(1-200 atm), con catalizador alquilmetálico (catálisis de Ziegler) o un
óxido metálico sobre sílice o alúmina (procesos Phillips y Standard
Oíl). Su resistencia química y térmica, así como su opacidad,
impermeabilidad y dureza son superiores a las del polietileno de baja
densidad. Se emplea en la construcción y también para fabricar
prótesis, envases, bombonas para gases y contenedores de agua y
combustible y tuberías.
Los objetos fabricados con HDPE se identifican, en el sistema de
identificación americano SPI (Society of The Plastics Industry), con el
siguiente símbolo en la parte inferior o posterior:
25
FIGURA Nº 2.2:
Nomenclatura y estructura del HDPE
Fuente: Libro de Química de Raymond Chang.
2.6 COMPARACIÓN DE PROPIEDADES:
CUADRO Nº 1
PROPIEDADES MECÁNICAS del HDPE - LDPE
PROPIEDADES HDPE LDPE
Modulo Elástico E (Nmm2) 1000 200
Coeficiente de fricción 0.29 -----
Modulo de Tracción (GPa) 0.5-1.2 0.1-0.3
Relación de Poisson 0.46 -----
Resistencia a Tracción (MPa) 15-40 5-25
Esfuerzo de Rotura (Nmm2) 20-30 8-10
Elongación a Ruptura (%) 12 20
Temperatura máxima de utilización(ºC) 55-120 50-90
26
Temperatura de reblandecimiento (ºC) 140 110
Temperatura de cristalización (ºC) 130-135 105-110
Resistencia a los ácidos –concentrados Buena - Aceptable Buena - Aceptable
Resistencia a los ácidos –diluidos Buena Buena
Resistencia – Álcalis Buena Buena
Resistencia a los Alcoholes Buena Buena
Resistencia a las Cetonas Buena - Aceptable Buena - Aceptable
Resistencia a las Grasas y Aceites Buena - Aceptable Buena - Aceptable
Fuente: Libro de James Shackelford de Ciencia de Materiales.
2.7 VENTAJAS Y DESVENTAJAS AL USAR HDPE Y LDPE:
CUADRO Nº 2
COMPARACION DE PROPIEDADES DEL HDPE - LDPE
POLIETILENO DE ALTA DENSIDAD POLIETILENO DE BAJA DENSIDAD
VENTAJAS VENTAJAS
Elasticidad. No se deforma permanentemente. Es un producto reciclable. Fácil de transportar. Tiene una vida útil bastante larga. Es flexible. Es resistente a cualquier forma de
corrosión. Su costo de adquisición e instalación es
sumamente reducido. Se puede procesar en grandes láminas,
lo que reduce la necesidad de otros materiales.
Resistencia a movimientos sísmicos. Resiste ácidos, elementos
químicosaltamente corrosivos y bacterias.
Alta resistencia química. Buena resistencia al impacto en
bajas temperaturas. Características eléctricas excelentes.

27
DESVENTAJAS DESVENTAJAS Baja barrera a los gases, como oxigeno,
dióxido de carbono. Baja barrera a los olores, sabores,
aromas. Baja – mediana transparencia, de los
envases Alta migración de grasas y aceites
Temperatura máxima de funcionamiento baja.
Baja resistencia ultravioleta Inflamable. Poca resistencia a la tensión
ambiental y a agrietarse.
Fuente: Libro de James Shackelford de Ciencia de Materiales. 2.8 CAUCHOS
2.8.1 Origen.
El lugar de origen del caucho es el centro y sur de América, donde muchas
civilizaciones la usaron de diferentes formas, por ejemplo: como pelotas
de juego (en las civilizaciones Mesoamericanas), tipos de zapato de goma
(en la Cultura Maya) y como tiras para sostener productos de piedra y
metálicos.
El origen del nombre caucho se remonta hacia mucho antes de la primera
visita de Colón a América, en donde los indios peruanos conocían al
caucho como cauchue y es de este nombre de donde se deriva su nombre
actual. Debido a las visitas de los españoles y otros europeos al continente
americano, surgió el ímpetu por conocer más a fondo el caucho y es así
que en 1736 Charles de La Condamine hizo los primeros estudios, luego le
siguieron otros científicos como el británico Joseph Priestley (1770),
quién descubrió que el caucho podía ser utilizado como borrador de trazos
hechos a lápiz. Sin embargo, la primera aplicación comercial que se le dio
al caucho fue el de realizar un método de impermeabilizar tejidos al
tratarlos con caucho disuelto en trementina.
Actualmente el caucho es muy usado en numerosas industrias y constituye
una materia prima importante por sus diversas propiedades, las cuales
serán explicadas en puntos posteriores.

28
2.8.2 Teoría del Caucho.
El caucho natural es una sustancia orgánica formada por moléculas
gigantescas que están entrelazadas entre sí. Dichas moléculas son
gigantescas porque el caucho se va formando a través de monómeros, los
cuales representan eslabones que están enlazados por cadenas moleculares.
Dependiendo de la fuerza de enlace de los monómeros, el caucho puede
adquirir distintos grados de resistencia al estiramiento o deformación,
característica que se conoce mayormente como viscosidad. Además el
caucho, sea natural o sintético, se caracteriza por su elasticidad, repelencia
al agua y resistencia eléctrica.
Generalmente el caucho posee altas fuerzas de atracción intermoleculares
ya que al estirarse dichas moléculas, tienden a orientarse en la dirección
del esfuerzo. Las altas fuerzas de atracción generan en el caucho un
comportamiento cristalino, cosa que no ocurre cuando las moléculas de
caucho se desordenan y lo vuelven amorfo.
Como ya mencionamos anteriormente, el caucho tiene distintos grados de
resistencia al estiramiento, para la cual es importante definir dos fases
dentro de todas sus características ya mencionadas:
• Fase elástica: se da cuando las fuerzas de atracción entre sus moléculas
son grandes y no permiten la deformación del caucho. Por el contrario,
ante una fuerza de estiramiento, el caucho vuelve a su configuración
inicial.
• Fase plástica: el resbalamiento de las moléculas de caucho, producto
de la aplicación de una fuerza, genera una deformación que permite
moldear, mezclar o extrusión al caucho.
Estas dos fases coexisten en el caucho y son importantes para el proceso
de vulcanización (que será explicado más adelante) que se pueda aplicar
en él. Por tanto ante la falta de estas fases, se utilizan diversas cargas
químicas que generan en el caucho un comportamiento elástico y plástico.

29
2.8.3 Caucho natural
El caucho natural se obtiene de cierto tipo de árboles (especies Hevea,
Ficus y otras) que exudan una substancia blanca y lechosa, el “látex”,
cuando se hace una incisión profunda en su corteza (el árbol no se daña).
El látex contiene 30-36% de caucho en forma de pequeñísimas gotas en
suspensión, el que es obtenido en forma sólida por “coagulación” mediante
acido fórmico (HCOOH) o acético (CH3COOH) a un pH de 4,8 a 5,0.
2.8.3.1 Obtención de caucho natural
Para recoger el látex de las plantaciones, se practica un corte
diagonal en ángulo hacia abajo en la corteza del árbol. El corte tiene
una extensión de un tercio o de la mitad de la circunferencia del
tronco. El látex exuda desde el corte y se recoge en un recipiente. La
cantidad de látex que se extrae de cada corte suele ser de unos 30 ml.
Después se arranca un trozo de corteza de la base del tronco para
volver a tapar el corte, normalmente al día siguiente. Cuando los
cortes llegan hasta el suelo, se deja que la corteza se renueve antes
de practicar nuevos cortes.
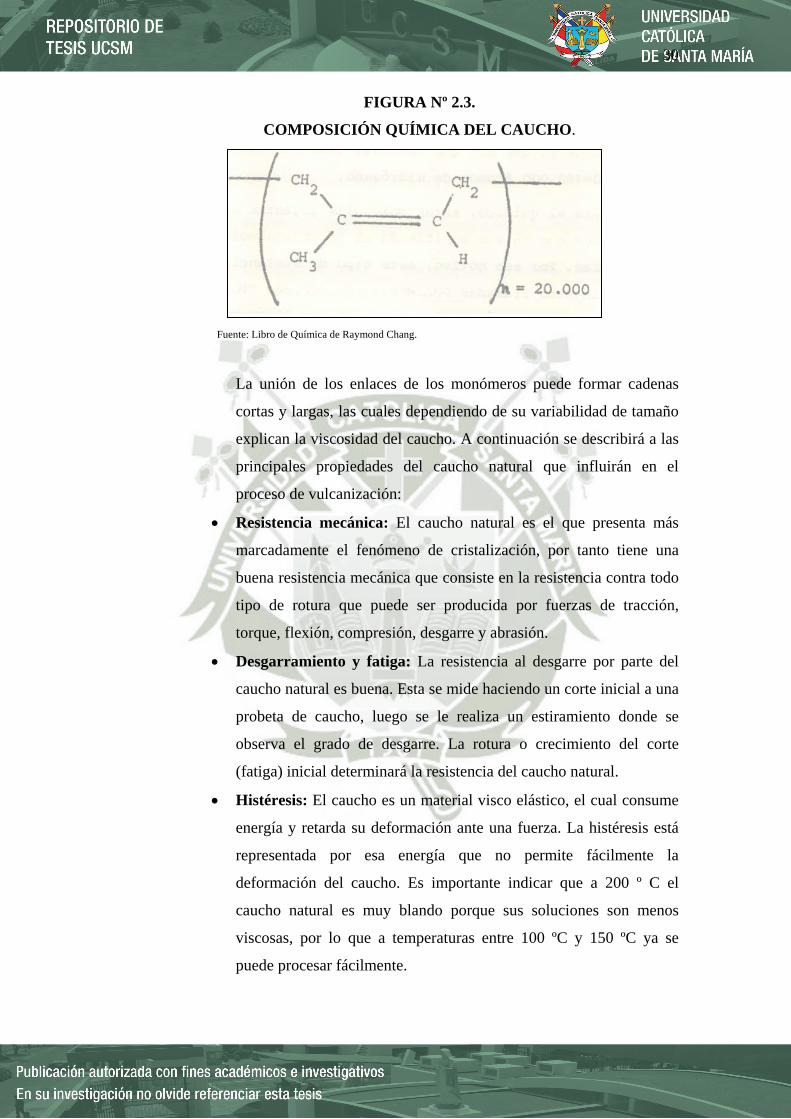
2.8.3.2 Propiedades generales.
El caucho natural es un polímero lineal que tiene como principal
monómero al Isopreno 2- metilbutadieno cuya fórmula química es
C5H8 el cual es un líquido de relativa volatilidad. En la figura 2.3 se
muestra la composición química del caucho.
30
FIGURA Nº 2.3.
COMPOSICIÓN QUÍMICA DEL CAUCHO.
Fuente: Libro de Química de Raymond Chang.
La unión de los enlaces de los monómeros puede formar cadenas
cortas y largas, las cuales dependiendo de su variabilidad de tamaño
explican la viscosidad del caucho. A continuación se describirá a las
principales propiedades del caucho natural que influirán en el
proceso de vulcanización:
• Resistencia mecánica: El caucho natural es el que presenta más
marcadamente el fenómeno de cristalización, por tanto tiene una
buena resistencia mecánica que consiste en la resistencia contra todo
tipo de rotura que puede ser producida por fuerzas de tracción,
torque, flexión, compresión, desgarre y abrasión.
• Desgarramiento y fatiga: La resistencia al desgarre por parte del
caucho natural es buena. Esta se mide haciendo un corte inicial a una
probeta de caucho, luego se le realiza un estiramiento donde se
observa el grado de desgarre. La rotura o crecimiento del corte
(fatiga) inicial determinará la resistencia del caucho natural.
• Histéresis: El caucho es un material visco elástico, el cual consume
energía y retarda su deformación ante una fuerza. La histéresis está
representada por esa energía que no permite fácilmente la
deformación del caucho. Es importante indicar que a 200 º C el
caucho natural es muy blando porque sus soluciones son menos
viscosas, por lo que a temperaturas entre 100 ºC y 150 ºC ya se
puede procesar fácilmente.

31
• Resiliencia: Es la medida de elasticidad ante la aplicación de fuerzas
dinámicas. En el caso del caucho, ésta es medida mediante la
aplicación de las fuerzas provenientes de péndulos que rebotan a
determinada altura sobre el caucho. La resiliencia del caucho
entonces estará entendida como la relación de la elasticidad
producida por el choque de una fuerza proveniente de un péndulo a
determinada altura.
• Tracción: Las características de Tracción son, junto con la dureza,
las que con mayor frecuencia se incluyen en las especificaciones
tanto de cauchos sintéticos como naturales.
Este ensayo se llevó a cabo de acuerdo a las dimensiones
establecidas por la norma ASTM D412. Se eligió la probeta tipo D.
CUADRO Nº3
Dimensiones De La Probeta Para Ensayo De Tracción
Fuente: Norma ASTM D412.
Para medir la tracción de un elastómero, se utiliza un dinamómetro
(Instron). Se toma la muestra (probeta de forma halterio o anular), se
sujeta cada extremo y luego se procede a estirarla a velocidad
constante, hasta su rotura. La tensión requerida para romper la
muestra representa la resistencia a la tracción del material. Mientras
32
dura el estiramiento de la muestra, va midiendo la fuerza (F) que está
ejerciendo. Cuando conocemos la fuerza que se está ejerciendo sobre
la muestra, dividimos ese número por el área (A) de la muestra.
El resultado es la tensión que está experimentando la muestra.
F / A = Esfuerzo.
Puesto que la carga de rotura es la fuerza aplicada sobre la muestra
dividida por el área de la misma, tanto la tensión como la carga de
rotura se miden en unidades de fuerza por unidad de área,
generalmente N/cm2. La tensión y la resistencia también pueden ser
medidas en mega pascales (MPa). Resulta sencilla la conversión
entre diferentes unidades, ya que 1 MPa = 100 N/cm2.
Otras veces, la tensión y la resistencia se miden en las viejas
unidades del sistema inglés, libras por pulgada cuadrada, o psi. Para
convertir psi a N/cm2, el factor de conversión es 1 N/cm2 = 1.45 psi
Normas
ASTM D412, DIN 53504, ISO 37, ISO 1798, JIS K6251.
• ASTM D412: Ensayo de tracción sobre caucho vulcanizado y
elastómeros termoplásticos.
La norma ASTM D412 especifica las condiciones de ensayo para
determinar las propiedades de tracción de elastómeros moldeados
y troquelados. Debido a la extensibilidad que los cauchos y
elastómeros exhiben, se requieren generalmente extensómetros
para medir con precisión la elongación o estiramiento durante la
carga aplicada. Anexo
• ISO 1798:1999: Resistencia a la Tracción y Alargamiento a la
Rotura de los materiales poliméricos flexibles celulares.
La ISO 1798 investiga la resistencia a la tracción y las
propiedades de deformación de los materiales poliméricos
flexibles celulares cuando se extienden a una velocidad constante
de desplazamiento hasta el fallo. En principio, la muestra de
ensayo está soportada entre dos mordazas de sujeción y se instala
un extensómetro para una longitud de referencia dada. La muestra

33
se estira hasta que rompe a una velocidad constante de
desplazamiento. La carga y la deformación se registran durante la
prueba, y se utilizan para determinar la resistencia a la tracción y
alargamiento a la rotura.
• Elongación, Alargamiento a la Rotura
Las propiedades mecánicas de un caucho no se remiten
exclusivamente a conocer cuán resistente es.
La resistencia nos indica cuánta tensión se necesita para romper
algo. Pero no nos dice nada de lo que ocurre con la muestra
mientras estamos tratando de romperla. Ahí es donde corresponde
estudiar el comportamiento de Elongación de la muestra
polimérica.
La Elongación es un tipo de deformación. La deformación es
simplemente el cambio en la forma que experimenta cualquier cosa
bajo tensión. Cuando hablamos de tensión, la muestra se deforma
por estiramiento, volviéndose más larga. Obviamente llamamos a
esto elongación.
Por lo general, hablamos de porcentaje de elongación, que es el
largo de la muestra después del estiramiento (L), dividido por el
largo original (L0), y multiplicado por 100. (L / L0) x 100 = %
Elongación.
Normas: ASTM D412, DIN 53504, ISO 37, EN ISO 1798, JIS
K6251
Existen muchas cosas relacionadas con la elongación, que
dependen del tipo de material que se está estudiando. Dos
mediciones importantes son la elongación final y la elongación
elástica.

34
La elongación final es crucial para todo tipo de material.
Representa cuánto puede ser estirada una muestra antes de que se
rompa. La elongación elástica es el porcentaje de elongación al que
se puede llegar, sin una deformación permanente de la muestra. Es
decir, cuánto puede estirársela, logrando que ésta vuelva a su
longitud original luego de suspender la tensión. Esto es importante
si el material es un elastómero. Los elastómeros tienen que ser
capaces de estirarse bastante y luego recuperar su longitud original.
La mayoría de ellos pueden estirarse entre el 200% y el 700% y
volver a su longitud original sin inconvenientes.
• Propiedades de fricción y desgaste: el desgaste o abrasión del
caucho, se produce cuando éste, es sometido a una fricción contra
una superficie que provoca el desprendimiento de pequeñas
partículas de caucho. Otras consideraciones a tomar en cuenta, es
que el caucho es insoluble en agua y a determinadas temperaturas
tiene distintas características que son las siguientes:
2.8.4 CAUCHO SINTÉTICO
El caucho sintético es un tipo de elastómero, invariablemente
un polímero obtenida artificialmente por reacciones químicas conocidas
como condensación o polimerización a partir de determinados
hidrocarburos insaturados.
El caucho sintético tiene como compuesto básico al monómero, el cual
forma moléculas grandes al ir entrelazándose con monómeros de su
mismo tipo.
Un elastómero es un material con la propiedad mecánica de poder sufrir
mucha más deformación elástica bajo estrés que la mayoría de los
materiales y aun así regresar a su tamaño previo sin deformación
permanente. El caucho sintético sirve como un sustituto
del caucho natural en muchos casos, especialmente cuando se requieren
propiedades mejoradas de los materiales.

35
2.8.4.1 PRINCIPALES TIPOS DE CAUCHO SINTÉTICO.
A través del tiempo se han desarrollado numerosos tipos de caucho
con propiedades específicas, los cuales sirven para aplicaciones
especiales en la industria. A continuación se mencionará y se hará una
breve descripción de algunos tipos de caucho sintético utilizados en la
industria:
• Poliisoprenonatural (NR) y sintético (IR)
El caucho natural y el poliisopreno sintético ambos tienen una
histéresis extensible y buenas características extensibles frente al
calor. La naturaleza muy específica del poliisopreno sintético
proporciona un número de factores que la distingan del caucho
natural. Hay una variación mínima en las características físicas. Las
condiciones de la polimerización se controlan bien para asegurar que
el polímero es altamente específico químicamente. Los non polímeros
son menos en el sintético que en el caucho natural.
En el proceso de fabricación del poliisopreno sintético, se requieren
menos trabajo mecánico e interrupción. Los ciclos de mezcla son más
cortos lo que permite ahorros de tiempo, de energía y aumento del
rendimiento. Además, el poliisopreno sintético tiene más
compatibilidad que el caucho natural en mezclas con solución SBR y
EPDM. La uniformidad del poliisopreno sintético garantiza una
calidad constante.
• Butadieno estireno (SBR)
El caucho estireno-butadieno, frecuentemente abreviado SBR (del
inglés Styene-Butadiene Rubber) es un elastómero sintético obtenido
mediante la polimerización de una mezcla deestirenoy de butadieno.
Es el caucho sintético con mayor volumen de producción mundial. Su
principal aplicación es en la fabricación de neumáticos.
Una de las ventajas era que su producción tenía una muy buena
relación costo-utilidad. El caucho sintético fue usado para disminuir el
consumo de las fuentes naturales de caucho, especialmente en el área
36
de la fabricación de neumáticos, que en ese momento aún consistían
de caucho sólido. Otros países comenzaron a copiar los esfuerzos y a
la década siguiente, muchas naciones desarrolladas estaban en el
negocio de la creación del SBR para ser usado en una variedad de
productos.
• Etileno - Propileno (EPDM)
Los elastómeros de EPDM, poseen excelente resistencia al calor, al
agua, al vapor, al ozono y a los rayos UV (estabilidad de color), a la
vez que tienen muy buenas propiedades de flexibilidad a bajas
temperaturas. Soportan los efectos de líquidos de frenos, medios
alcalinos, ambientes levemente ácidos y disolventes oxigenados.
Poseen un inmejorable comportamiento frente al envejecimiento en su
uso a la intemperie a largo plazo. Los elastómeros de EPDM son
asimismo muy adecuados para su uso con agua caliente y vapor. Son
especialmente adecuados para trabajar con líquidos de freno a altas
temperaturas. Los compuestos de caucho EPDM no se recomienda su
uso con gasolinas, aceites y grasas a base de petróleo y con
disolventes a base de hidrocarburos.
• Policloropreno (CR)/Neopreno.
Neopreno es el nombre comercial con el que se conocen los polímeros
compuestos de cloropreno. Las características físicas generales del
neopreno lo sitúan como un elastómero de uso de amplio espectro. Sus
excelentes características de envejecimiento frente al ozono y los
agentes atmosféricos a la vez que su buena resistencia a la abrasión y a
la flexión, le otorgan la categoría de caucho de uso general. El
neopreno es resistente a los ácidos y álcalis, retardador de llama y
adecuado para su uso con aceites con base de petróleo. Las grasas
animales y vegetales también proporcionan un entorno muy estable
para este polímero. Se caracteriza por una buena resistencia a la
flexión, excelente resistencia a la fatiga y amplía resistencia a la
intemperie y el ozono. Su excelente adherencia a los metales lo hace
37
ideal para el moldeo con insertos metálicos. El Neopreno no es eficaz
en contacto con disolventes aromáticos y oxigenados.
• Nitrilo carboxílico (XNBR)
Años de investigación para el desarrollo de nuevos compuestos han
dado como resultado un material único que captura los beneficios de
la resistencia al desgaste de los nitrilos carboxilados y a la vez
la resistencia a mayores temperaturas de los nitrilos altamente
saturados. Esta formulación se llama XNBR (Nitrilo Hidrogenado).
Una muy alta resistencia a la tracción junto con una alta resistencia al
calor y una buena resistencia química al sulfuro de hidrógeno, a
inhibidores de corrosión, al vapor y al petróleo hace de este
elastómero un excelente puente entre los nitrilos comunes y los
fluorocarbonos.
• Poliacrílico (ACM)
Los compuestos de Poliacrilato (ACM) están diseñados para soportar
altas temperaturas sin perder resistencia a los hidrocarburos.
Especialmente diseñados para aplicaciones en aceites sulfurados. Los
elastómeros ACM son asimismo resistentes a la oxidación, el
ozono, los disolventes alifáticos, la luz del sol y la intemperie y
poseen una baja permeabilidad a los gases. Los cauchos Poliacrílicos
son capaces de soportar altas temperaturas pero su resistencia a bajas
temperaturas es relativamente pobre.
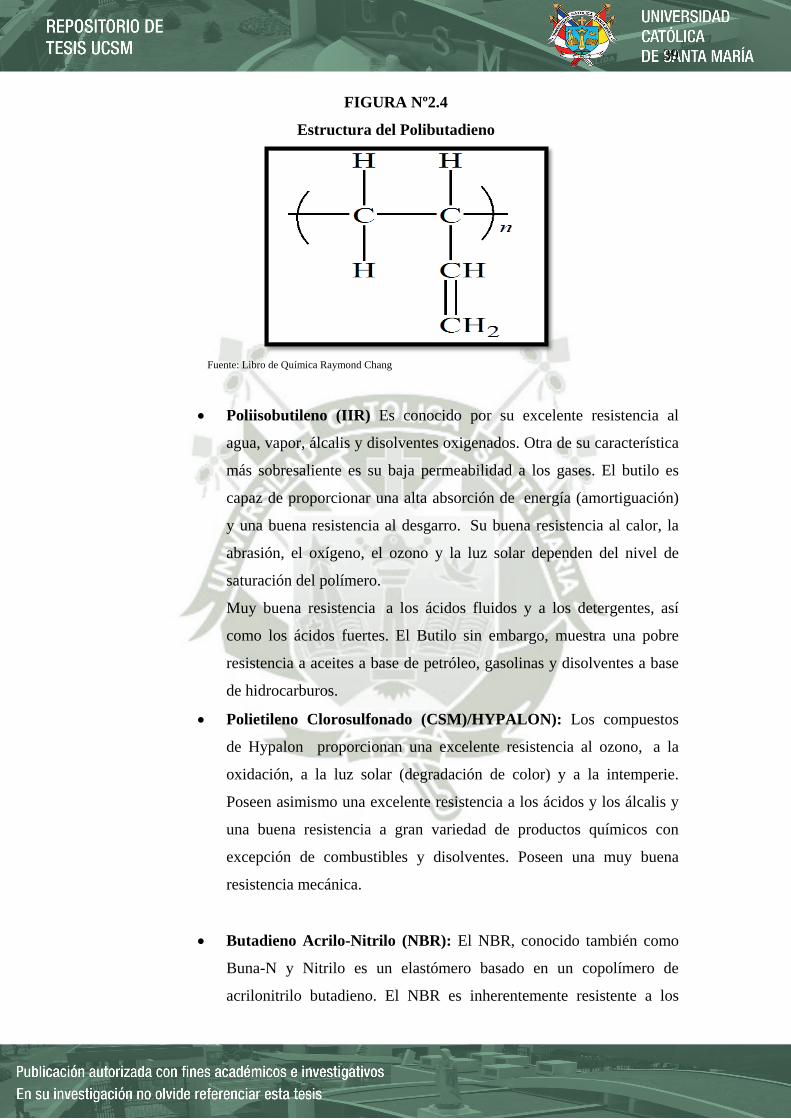
• Polibutadieno (BR)
Es un gas incoloro de olor parecido al de la gasolina, producido en la
destilación del petróleo y usado para la fabricación de caucho sintético
SBS. El caucho fabricado por la polimerización de butadieno es duro
y a temperatura ambiente tiene un comportamiento elastomérico,
mientras que a altas temperaturas puede ser procesado como plástico.
Es difícil de tratar y presenta baja histéresis.

38
39
FIGURA Nº2.4
Estructura del Polibutadieno
Fuente: Libro de Química Raymond Chang
• Poliisobutileno (IIR) Es conocido por su excelente resistencia al
agua, vapor, álcalis y disolventes oxigenados. Otra de su característica
más sobresaliente es su baja permeabilidad a los gases. El butilo es
capaz de proporcionar una alta absorción de energía (amortiguación)
y una buena resistencia al desgarro. Su buena resistencia al calor, la
abrasión, el oxígeno, el ozono y la luz solar dependen del nivel de
saturación del polímero.
Muy buena resistencia a los ácidos fluidos y a los detergentes, así
como los ácidos fuertes. El Butilo sin embargo, muestra una pobre
resistencia a aceites a base de petróleo, gasolinas y disolventes a base
de hidrocarburos.
• Polietileno Clorosulfonado (CSM)/HYPALON): Los compuestos
de Hypalon proporcionan una excelente resistencia al ozono, a la
oxidación, a la luz solar (degradación de color) y a la intemperie.
Poseen asimismo una excelente resistencia a los ácidos y los álcalis y
una buena resistencia a gran variedad de productos químicos con
excepción de combustibles y disolventes. Poseen una muy buena
resistencia mecánica.
• Butadieno Acrilo-Nitrilo (NBR): El NBR, conocido también como
Buna-N y Nitrilo es un elastómero basado en un copolímero de
acrilonitrilo butadieno. El NBR es inherentemente resistente a los
40
fluidos hidráulicos, aceites lubricantes, fluidos de transmisión y otros
productos a base de petróleo no polar, debido a la estructura polar de
este elastómero. Los nitrilos también son resistentes a los agentes
atmosféricos y al agua. Con la utilización de la variedad de polímeros
de nitrilo y de otros ingredientes en su composición, se pueden
obtener compuestos de caucho nitrilo para resistir entornos que
requieren baja compresión, resistencia a la abrasión, baja temperatura
de flexión, resistencia a la penetración del gas y resistencia al ozono.
Por hidrogenación (HNBR), adición de ácidos carboxílicos (XNBR) o
mezcla de PVC (NBR/PVC), los polímeros de nitrilo pueden
satisfacer una gama más amplia de necesidades físicas o químicas.
• Nitrilo Hidrogenado (HNBR): El HNBR ha sido desarrollado para
soportar temperaturas continuas de hasta 150 º C, manteniendo la
resistencia a los aceites derivados del petróleo. Se obtiene por
hidrogeneración del copolímero de nitrilo. El HNBR llena el vacío
dejado por los elastómeros de NBR y FKM cuando las condiciones de
alta temperatura requieren una alta resistencia a la tracción,
manteniendo una excelente resistencia al aceite de motor, gas
amargo, mezclas de amina/aceite y aceites lubricantes
• Fluorocarbono (FKM)/VITON: Los elastómeros de Viton,
polímeros altamente fluorados con estructura de carbono, son
utilizados en aplicaciones que requieren una elevada resistencia al
ataque químico, al ozono y que requieran de una elevada estabilidad
térmica (hasta 260º). Los fluorocarbonos poseen asimismo una baja
deformación remanente por compresión y un excelente
comportamiento al envejecimiento. Proporcionan un excelente
servicio en contacto con aceites, gasolinas, fluidos hidráulicos,
disolventes de hidrocarburos y combustibles. En términos generales,
aumentando el contenido en flúor, la resistencia al ataque químico se
mejora al mismo tiempo que se disminuyen las características de baja
temperatura. Hay, sin embargo, algunos fluorocarbonos especialmente

41
formulados con un alto contenido en flúor con muy buen
comportamiento a bajas temperaturas.
• Fluorsilicona (FVMQ): Las siliconas fluoradas poseen propiedades
químicas similares a las de los elastómeros fluorados orgánicos. Esta
propiedad otorga una excelente resistencia a combustibles de
hidrocarburos, aceites de petróleo y aceites de silicona. Poseen
asimismo un mayor rango de temperatura operativa que los
fluorocarbonos (FKM) (de -57 º C a 205 º C). Se utilizan,
predominantemente, para aceites sintéticos, gasolinas
y combustibles.
• Silicona (VMQ, PMQ, PVMQ): Estabilidad a temperatura extrema y
flexibilidad a bajas temperaturas son características notorias de los
compuestos de silicona. Las siliconas poseen excelente resistencia a la
compresión, la luz solar, el ozono, el oxígeno y la humedad. Por su
carácter inerte se utilizan ampliamente en aplicaciones médicas,
farmacéuticas y alimentarias ya que no dejan olor ni sabor.
Las siliconas pueden ser formulada para ser eléctricamente
resistentes, conductoras o retardadoras de la llama.
• Poliuretano (EU/AU): Los poliuretanos se caracterizan por una
resistencia excepcional a la abrasión y al desgaste. Ofrecen la
resistencia a la tracción más alta entre todos los elastómeros a la vez
que una buena resistencia al estiramiento. El ozono, la oxidación, la
luz solar, los agentes atmosféricos y la exposición eventual al petróleo
y la gasolina son ambientes adecuados para aplicaciones de este
compuesto. Los poliuretanos con base de poliéter están
específicamente diseñados para su uso en aplicaciones que requieran
flexibilidad a baja temperatura. Los poliuretanos basados en poliéster
(AU) proporcionan una mejor resistencia a la abrasión, al calor y al
hinchamiento en fluidos derivados del petróleo. No son
recomendables para álcalis, ácidos y disolventes oxigenados. No se
recomienda el uso de los poliuretanos con base de poliéster para agua

42
caliente, vapor y aplicaciones con alta humedad ambiental, pero estos
pueden ser formulados para incrementar la resistencia a estas
propiedades.
• Epichlorohidrina (ECO/CO): La epiclorhidrina se caracteriza por
una notablemente baja permeabilidad a los gases y unas muy buenas
propiedades físicas en un amplio rango de temperaturas (de-40 º C a
135 º C) a la vez que posee una excelente resistencia a los aceites
derivados del petróleo. Resistencia al ozono, a la oxidación, al
desgaste y a la luz del sol son otras cualidades típicas de este
material.
• Etil-Acrilato (AEM)/VAMAC): Los compuestos de etil-acrilato
poseen una excelente resistencia al envejecimiento a altas
temperaturas (175 º C), y unas buenas propiedades físicas. Un alto
grado de resistencia al aceite, el ozono, los rayos UV y a la intemperie
así como una buena flexibilidad a bajas temperaturas son también
atributos del Etil-acrilato.
2.8.5 Propiedades
Propiedades Físicas
• A bajas temperaturas, se vuelve rígido, y cuando se congela en estado de
extensión adquiere estructura fibrosa.
• Calentando a más de 100 ºC., se ablanda y sufre alteraciones
permanentes.
• El caucho bruto adquiere gran deformación permanente debido a su
naturaleza plástica.
• La plasticidad del caucho varía de un árbol a otro y también depende de
la cantidad de trabajo debido al caucho desde el estado látex, de las
bacterias que lo acompañan e influyen en su oxidación y de otros
factores. La plasticidad puede modificarse dentro de ciertos límites por la
acción de productos químicos.

43
• La densidad del caucho a 0 ºC es de 0.950 a 20 ºC es de 0.934. El caucho
bruto deshelado después de la masticación por cilindros fríos no varía de
densidad.
• Cuando el caucho bruto ha sido estirado y deformado durante algún
tiempo, no vuelve completamente a su estado original.
• Si se calienta, la recuperación es mayor que a la temperatura ordinaria.
Este fenómeno se denomina deformación residual o estiramiento
permanente y es propio del caucho.
• El caucho bruto absorbe agua. Los coagulantes usados en el látex al
preparar el caucho afectan al grado de absorción de agua; usando ácido
clorhídrico, sulfúrico o alumbre se obtienen cauchos con poder de
absorción relativamente elevado. El poder de absorción de agua del
caucho purificado es muy bajo.
• Gran variedad de sustancias son solubles o pueden dispersarse en caucho
bruto, tales como el azufre, colorantes, ácido esteárico, N-fenil-2-
naftilamina, pigmentos, aceites, resinas, ceras, negro de carbono y otras.
• El efecto deteriorante de luz y el calor sobre el caucho se reconoció largo
antes del descubrimiento de la vulcanización.
Propiedades Químicas
• La solubilidad del caucho bruto en sus disolventes más comunes no es
muy elevada. Para hacer una solución de 10% es necesaria cierta
disociación, ya por medios químicos, empleando un oxidante, ya por
medio físicos, utilizando un molino.
• Los disolventes más usados son el benceno y la nafta. Otros buenos
disolventes son el tricloroetileno, tetracloroetano, pentacloroetano,
tetracloruro de carbono, cloroformo, tolueno, xileno, keroseno y éter. El
caucho se hincha primero poco a poco hasta las consistencias de gel y
44
después éste se dispersa formando una solución. El caucho bruto aumenta
de 10 a 40 veces su propio peso en disolventes que a la temperatura
ordinaria forman gel con el caucho.
• La viscosidad de la solución del caucho bruto es grande.
• El caucho bruto calentado hasta 200 ºC. se ablanda y sus soluciones
tienen menor viscosidad, pero el número de dobles enlaces se conserva
sin alteración.
• Cuando la temperatura se eleva hasta 250 ºC., los enlaces dobles se
separan y tiene lugar la formación de anillos. El cambio a caucho cíclico
eleva la densidad y la solubilidad, el producto obtenido es una dura y
frágil resina.
2.9 VULCANIZACION DEL CAUCHO
Concepto.
El proceso de vulcanización es aquel en donde algunos materiales de
composición variable y malos conductores de energía calorífica son sometidos a
un calentamiento, con azufre u otro acelerante de composición similar, que tiene
por finalidad producir un material uniforme que posea cualidades físicas
mejoradas.
Este proceso se desarrolla durante un determinado periodo de tiempo, teniendo
en cuenta que los intervalos de tiempo de cura sean los adecuados para no
ocasionar ningún perjuicio al material que está siendo vulcanizado.
Durante la vulcanización del caucho, que generalmente se calienta en presencia
de azufre durante un determinado periodo de tiempo, se generan dos fenómenos:
• El primero se da cuando los polímeros lineales paralelos cercanos constituyen
entre sí puentes de entrecruzamiento generados por calor, por lo tanto el
proceso a de ser controlado para evitar una vulcanización prematura del
caucho.

45
• El segundo fenómeno se genera cuando los átomos de azufre encuentran
espacios atractivos a lo largo de la molécula del caucho (estos espacios son
llamados sitios de cura). En los sitios de cura los átomos de azufre se unen a sí
mismos hasta formar una cadena que puede alcanzar el sitio de cura de otra
molécula.
Ambos fenómenos permiten que el caucho sea más estable, que obtenga una
mayor dureza, durabilidad y resistencia al ataque químico sin perder su
elasticidad natural. Además el proceso de vulcanización hace del caucho un
material termo rígido, ya que no se puede derretir en presencia de calor; es decir
el caucho es sometido a un proceso irreversible donde no solamente se puede
calentar en presencia de azufre, sino que también en presencia de otros aditivos
como carbono, silicio, telurio, selenio y cloruro de azufre en fase líquida o de
vapor.
El poder calorífico generado durante la vulcanización se crea mediante fuentes
que abarcan desde energía eléctrica por medio de resistencia de calentamiento,
inducción y dieléctricos; corrientes de aire caliente o de gases inertes, y
finalmente corrientes de agua caliente y vapor.
El azufre es un material con singulares propiedades. En determinadas
circunstancias, formará cadenas de sus propios átomos. El carbono y el silicio
pueden formar también esas cadenas. El proceso de vulcanización hace uso de
este fenómeno.
A lo largo de la molécula del caucho, hay un número de sitios que son atractivos
para los átomos de azufre. Son los llamados sitios de cura. En cada sitio de cura,
un átomo de azufre se puede unir a sí mismo, y a partir de allí la cadena de
átomos de azufre puede crecer hasta que alcance el sitio de cura de otra
molécula. Estos puentes de azufre son usualmente de 2 a 10 átomos de largo, en
contraste con los polímeros más comunes en los que la "columna vertebral" de
carbonos puedes ser varios miles de veces de larga.

46
FIGURA Nº 2. 5
Estructura del Poliisopreno
Fuente: Libro de Química Raymond Chang
Punto de fusión del azufre es de 113ºC, su densidad es de 2.06, es soluble en
acetona el sulfuro de carbono, el cloruro de azufre, el benceno y la trementina;
cristaliza normalmente en el sistema rómbico. Cuando se funde a 113ºC, se
convierte en un líquido amarillo, y si la temperatura aumenta lentamente se
convierte en un líquido viscoso y rojizo oscuro, a medida que va alcanzando los
180 a 190ºC, volviéndose negro a 230ºC.
Cargas, la adición de cargas al caucho se realizan por dos razones:
• Técnica, porque logra propiedades y cualidades determinadas al producto
final, en tal caso se denominan reforzante.
• Económica, porque abarata los productos elaborados, se denominan cargas
inertes o no reforzante.
Las cargas es activa o reforzante cuando:
• Mejoran resistencia a la tracción
• Mejoran la resistencia a la abrasión.
• Mejoran la resistencia al desgarre.
• Aumentan la dureza.
• Aumentan la rigidez y modulo.

47
CUADRO Nº4
Clasificación de las Cargas Usadas en Elastómeros
Fuente: Libró de James Shackelford de Ciencia de materiales.
Negro de Humo, es un pigmento negro obtenido por descomposición térmica de
hidrocarburos líquidos o gaseosos. El diámetro de una partícula individual esta en
rango de los coloides, por debajo de 1200 A., la composición de partículas es
carbono pseudo-grafítico amorfo, con variaciones de hidrógeno y carbono
absorbidos químicamente. Mediante el microscopio electrónico el negro de humo
aparece formando grupos o cadenas, el potencial reforzante de este pigmento esta
poco influenciado por el tamaño del agregado y más por el tamaño de partículas
dentro del mismo agregado. Cuanto menor sea el tamaño de las partículas más
dificultoso es el procesado pero mayor el grado de reforzado alcanzado, cuando la
estructura del negro de humo (forma total de agregados: solidez y tamaño) es
mayor, corresponde compuestos crudos más viscosos y con menos nervio.
Peptizantes.
La peptización puede ser de dos tipos:
• Peptización Física o Masticación, es una rotura termo mecánica del caucho
a temperaturas relativamente bajas, reduciendo la viscosidad, se usan los
lubricantes y mejoran la procesabilidad de los compuestos.
48
• Peptización química, describe la rotura mecánica termo-óxidativa, catalizada
del caucho a temperaturas elevadas, su uso está restringido al caucho natural.
Homogenizantes. Son mezclas de resinas aromáticas y alifáticas de diferente
polaridad, se usan en caso de mezclas de cauchos difíciles de combinar, donde el
proceso es Solvatación (asimilación de oxígeno). Es importante tener en cuenta
los parámetros de solubilidad.
Plastificantes. Provocan el deslizamiento entre moléculas inhibiendo la fuerza de
atracción intermolecular, facilitando la incorporación de los ingredientes al
caucho, se agregan básicamente para auxiliar en las operaciones de mezclado,
calandrado, extorsionado y molde. Influyen los parámetros de solubilidad al
momento de mezcla.
Hay 2 formas de generar el movimiento interno molecular (resbalen unas
cadenas respecto a otras), primero acortando la longitud, esto logrado con
peptizantes, y la segunda provocar el deslizamiento de cadenas (lubricar) esto
origina la disminución del módulo, dureza y también de su carga de rotura.
Promotores de adhesión. Son productos que se agregan a las formulaciones para
aumentar la adhesión en crudo o pegajosidad de los compuestos. Son resinas de
naturaleza termoplástica. Con su uso se logran mejoras en el procesado y moldeo
sin alterar significativamente el módulo y la dureza del vulcanizado ya que las
resinas endurecen nuevamente cuando el compuesto se enfría.
Lubricantes. Se usan en dosis relativamente bajas y permite mejorar la
procesabilidad de los compuestos. Existen lubricantes internos y externos un
lubricante interno servirá principalmente como modificador de la viscosidad
específica y mejorará la dispersión de la carga mientras que el comportamiento de
deslizamiento está influenciado en un menor grado. Un lubricante con acción
predominantemente externa (plastificante) mejorará en gran medida el
deslizamiento y reducirá la fricción entre el elastómero y la superficie de metal de
los equipos de procesamiento, su influencia sobre la viscosidad del compuesto es
49
marginal, altos niveles de dosis, sin embargo pueden llevar a una sobre
lubricación y subsiguiente eflorescencia.
La lubricación se logra a través de una reducción de la fricción, en cuya fase
inicial el lubricante cubre al elastómero y otros compuestos reduciendo la fricción
contra las partes de metal del equipo de procesamiento, al elevar la temperatura, el
lubricante comienza a derretirse y es moldeado en la matriz por la acción cizállate
del mezclador. Tanto la velocidad y el grado de incorporación del lubricante
dentro del elastómero están determinados por el punto de ablandamiento,
viscosidad de ablandamiento y solubilidad, estos factores dependen de su
estructura química y su polaridad.
Agentes de protección. El caucho sea natural o sintético está sujeto a deterioro
por envejecimiento, que generalmente depende del grado de instauración del
polímero, por lo que el caucho butílico, siliconas y algunos cauchos fluorados son
los más protegidos debido a su nula instauración, caso contrario, son el butadieno,
SBR y al caucho natural.
Al diferenciar entre el envejecimiento del caucho natural, este, da compuestos
reblandecidos y pegajosos en su superficie, previamente a un cierto nivel de
endurecimiento y fragilidad, en cambio el SBR por envejecimiento da compuestos
quebradizos y endurecidos.
En ambos cauchos el deterioro por envejecimiento genera que la carga de rotura,
elongación y resistencia al agrietamiento por flexión disminuyan progresivamente
a medida que el material envejece. En cambio el módulo y dureza evolucionan de
forma diferente según sea el caucho deteriorado.
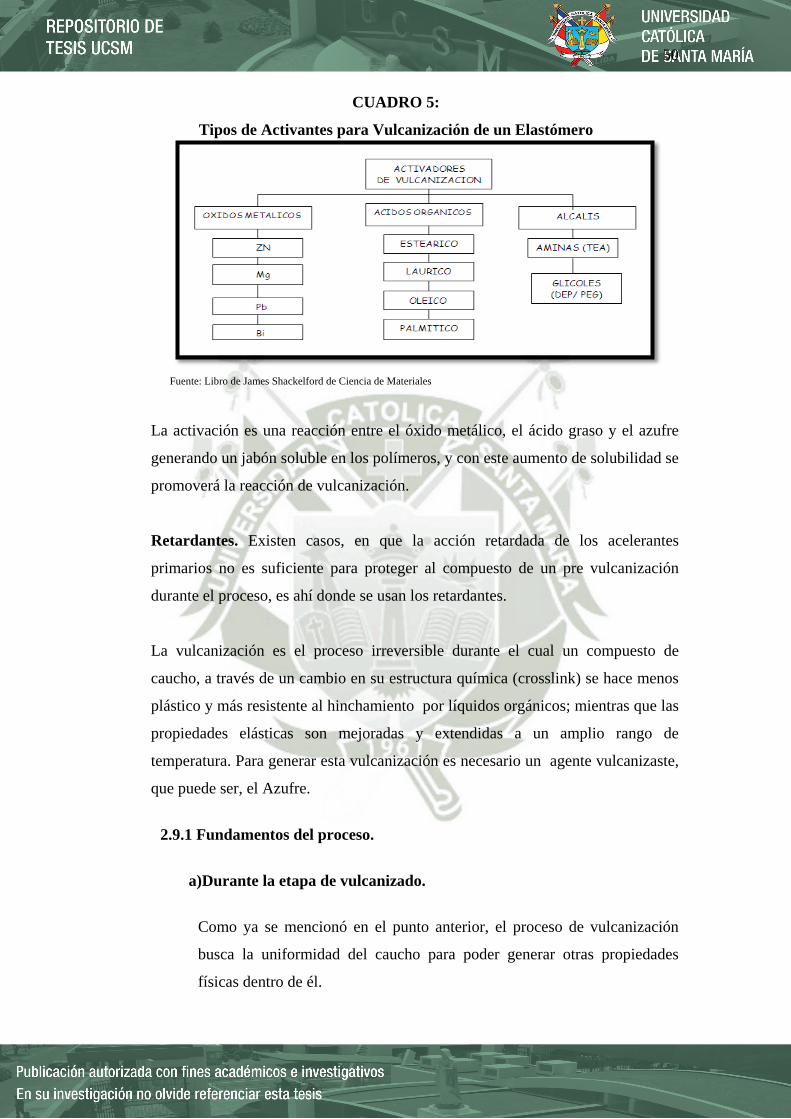
Activadores de vulcanización. La acción conjunta de ácidos grasos (ácido
esteárico y ácido oleico) en combinación con óxidos metálicos como el óxido de
Zinc y el óxido de Mg activan la reacción del azufre y se denominan activadores.
50
CUADRO 5:
Tipos de Activantes para Vulcanización de un Elastómero
Fuente: Libro de James Shackelford de Ciencia de Materiales
La activación es una reacción entre el óxido metálico, el ácido graso y el azufre
generando un jabón soluble en los polímeros, y con este aumento de solubilidad se
promoverá la reacción de vulcanización.
Retardantes. Existen casos, en que la acción retardada de los acelerantes
primarios no es suficiente para proteger al compuesto de un pre vulcanización
durante el proceso, es ahí donde se usan los retardantes.
La vulcanización es el proceso irreversible durante el cual un compuesto de
caucho, a través de un cambio en su estructura química (crosslink) se hace menos
plástico y más resistente al hinchamiento por líquidos orgánicos; mientras que las
propiedades elásticas son mejoradas y extendidas a un amplio rango de
temperatura. Para generar esta vulcanización es necesario un agente vulcanizaste,
que puede ser, el Azufre.
2.9.1 Fundamentos del proceso.
a)Durante la etapa de vulcanizado.
Como ya se mencionó en el punto anterior, el proceso de vulcanización
busca la uniformidad del caucho para poder generar otras propiedades
físicas dentro de él.
51
Para tal fin es necesario que se ejerza un control sobre aquellos factores
que puede influir en la composición final del producto que se desea
vulcanizar.
El primero de los dos factores esta relacionado al control de la uniformidad
en la calidad de las materias primas y a la incorporación uniforme del
azufre y otros aditivos durante las etapas del proceso de vulcanización. El
segundo factor consiste en el control de los tiempos, presiones y
temperaturas que se utilizan durante las operaciones.
Es importante mencionar que las condiciones pueden variar dependiendo
del vulcanizado que se quiera obtener y de los medios con que se cuenta
para éste.
Dichas condiciones generalmente son especificaciones previas del
producto que consisten en determinar la dureza requerida, la cantidad de
trabajo que es necesario realizar, el espesor del artículo y el tratamiento de
las cargas de caucho después del tratamiento de cura.
Para poder llegar a la uniformidad y especificaciones deseadas para el
producto, se hace imprescindible el uso de procedimientos que permitan
manejar el aspecto térmico referente al espesor de los artículos de caucho.
Uno de los procedimientos consiste en manejar de forma escalonada las
temperaturas. En un inicio se proporciona un calentamiento uniforme a
toda la masa del artículo; luego, se eleva la temperatura hasta que esté
próxima a la de vulcanización y finalmente, se calienta el caucho hasta
alcanzar la temperatura de cura.
El segundo procedimiento consiste en realizar un enfriamiento externo
lento (opuesto al procedimiento anterior donde el calentamiento era
lento). Para esto se interrumpe el suministro de energía calorífica antes de
llegar a la cura del caucho; luego, se sujeta a presión el molde que contiene
a la masa, teniendo cuidado en que no existan otros factores (como el
viento) que lo puedan enfriar. Finalmente, durante la etapa de sujeción, se
introduce la energía calorífica en el seno de la masa del artículo. Este
procedimiento de cura se denomina de “absorción”. Cabe resaltar que si el
tamaño del producto a vulcanizar aumenta, es necesario disminuir la
temperatura de cura y aumentar la duración para la misma de modo que se
logre una uniformidad en todo el producto.

52
b) Después de la etapa de vulcanizado.
Así como el caucho aumenta su temperatura para llegar a un estado de
cura, luego de ésta pasa a una etapa de enfriamiento en el cual la
vulcanización termina cuando la temperatura de cura se reduce hasta un
cierto nivel.
Cuando el caucho es calentado en presencia de azufre u otros acelerantes
es recomendable que se disponga de un periodo mínimo de cura, ya que a
ciertas temperaturas menores a ésta el producto podría resultar poroso o
hincharse. Por eso es adecuado que la temperatura de enfriamiento llegue a
ser igual a la de ambiente, la cual a su vez debe ser mayor a las
temperaturas causantes de las porosidades en el caucho resultante del
proceso de vulcanización.
A continuación se presenta el la Figura 2.6 en donde se muestra las
consecuencias de cura en la misma clase de artículos, empleando tres
periodos diferentes de moldeo.
FIGURA Nº 2.6:
Consecuencias de Cura empleando Tres Periodos Diferentes de Moldeo para un
mismo Artículo.
Fuente: Revista del plástico.
53
En el primero, se ha pasado por escaso margen el límite que determina la
condición porosa antes de sacarlos de los moldes, no obstante la
temperatura de enfriamiento normal hasta la temperatura ambiente ha
sobrepasado el límite de porosidad y se encuentra en estado de sobrecura.
Para el segundo caso, si bien es cierto se elimina la condición porosa, se ha
llegado a un estado de sobrecura debido a un calentamiento excesivo. Por
último, en el tercer caso, la temperatura es mayor a la de porosidad y se
encuentra en un estado de cura óptimo.
Está claro que de acuerdo al gráfico, las mejores curas se dan cuando los
productos se obtienen con temperaturas menores y con periodos más
prolongados de vulcanización.
Los periodos mínimos de cura son determinados por dos aspectos
importantes, el primero de ellos es la temperatura máxima a la cual puede
estar expuesto el caucho (150 ºC para el caucho natural) y el segundo
aspecto esta determinado por las operaciones previas a las que son
sometidos los artículos de caucho antes del vulcanizado. Las temperaturas
a las que es sometido el caucho es un factor relevante en el resultado del
proceso de cura, ya que al producto no se le puede inspeccionar mientras
se está vulcanizando. Por lo tanto, tener un control sobre la temperatura
ayudará a obtener un producto acorde con las propiedades deseadas.
2.9.2 Causas que generan un mal registro de temperaturas.
A continuación se mencionarán algunas causas que ocasionan
inadecuados controles de temperatura y que por lo general hacen obtener
productos defectuosos:
• Fallas en las calderas.
• Alargamientos innecesarios a las tuberías de vapor.
• Tuberías de vapor obstruidas por presencia de agua, esto ocasiona que
las relaciones directas entre la temperatura y la presión cambien debido
a que el vapor contenido en la tubería no está seco. La temperatura
determina la rapidez de cura y debe medirse y controlarse durante la
vulcanización.

54
• Mala colocación de los indicadores de presión y temperatura. En los
casos que el vapor recorre distancias apreciables puede producirse una
disminución de la temperatura, la cual varía de la originalmente
pensada para el proceso de cura. Esto se debe a que las tuberías carecen
de aislamiento térmico y para compensar esta pérdida de energía
calorífica, es recomendable usar el vapor con algunos grados más de
recalentamiento y reducir al mínimo la condensación antes de que el
vapor llegue al dispositivo de vulcanización.
• Moldes sucios que impiden un contacto adecuado con la superficie de
caucho. La energía calorífica transferida por conducción no sería la
esperada.
• Disposición, en paralelo o serie, de las tuberías de vapor. Las tuberías
colocadas en serie producen mayor diferencia de temperaturas entre sus
puntos de entradas y salidas. La uniformidad de la temperatura es más
adecuada disponiendo paralelamente a las tuberías, pero puede que se
tenga una circulación deficiente debido a una deficiencia en las líneas.
Cuando se tiene un alargamiento excesivo de las tuberías de vapor se
producen pérdidas de energía calorífica, y cuando son muy cortas la
circulación de vapor se hace lenta.
2.9.3 CURA ÓPTIMA.
El curado óptimo del caucho se puede escoger tomando como base
propiedades adecuadas para el uso que se le quiera dar, por ejemplo: la
dureza, la resistencia al desgarre, la abrasión, el agrietamiento a la flexión
y otras propiedades. Además se debe tener en cuenta la vulcanización
probable que experimenten los artículos cuando estén en servicio,
especialmente cuando estén sometidos a calentamientos ocasionados por
rozamientos internos.
2.9.4 CONTROL DEL PROCESO.
El control del proceso de vulcanización puede realizarse a través de los
siguientes ensayos:

55
a) Determinación de la dureza, las lecturas que se pueda obtener de los
durómetros son veraces cuando el caucho ya está enfriado, lo que
significa esperar de 4 a 24 horas después de haber sido vulcanizado.
La medición de la dureza se puede realizar en el caucho caliente, pero
puede determinar el rechazo del artículo examinado que en frío, puede
ser aceptado. Es recomendable que las mediciones en caucho caliente
siempre se realicen a la misma temperatura, por ejemplo puede hacerse
después de que se saquen los moldes.
b) La comparación de pares térmicos entre la superficie del caucho que
está siendo vulcanizado, el interior del mismo y las partes internas de
autoclaves y prensas que influyen en el proceso, nos dan una idea de la
uniformidad del proceso. Para esto las partes de las prensas y autoclaves
deben de ser revisadas continuamente para comprobar la uniformidad
térmica en su interior.
c) Ensayos que determinen la fuerzade adhesión entre las superficies de
contacto de la porción de caucho y la del material que no es caucho (por
ejemplo el material de los moldes metálicos).
d) Análisis químicos que determinen el contenido de azufre sin combinar
proporcionan uno de los procedimientos más usados para determinar el
grado de cura del caucho.
2.9.5 VALIDACIÓN DEL PROCESO PRODUCTIVO DE
VULCANIZACIÓN
La validación es la verificación del resultado final de un proceso, en el
cual no se puede ver, a simple vista, la transformación de la materia prima
que formo parte de sus operaciones. Es así que la validación del proceso de
caucho consiste en analizar y verificar los resultados de la vulcanización,
para el cual no se puede observar directamente la transformación del
caucho por intermedio de la transferencia de calor. Lo que si es posible es
medir, acorde a algún tipo ensayo y diseño de experimentos, las
propiedades del producto e ir haciendo algunos cambios pequeños, pero
significativos para los principales factores que forman parte del
procesamiento del caucho.
56
Para la presente proyecto de mejora, el tipo de ensayo a realizar será el de
dureza, en base al cual, como bien ya se ha mencionado, examinaremos el
proceso y sacaremos las conclusiones pertinentes al respecto.
2.10 REUTILIZACIÓN DE LOS DESECHOS SÓLIDOS EN LAS
INDUSTRIAS DE LLANTAS Y NEUMÁTICOS.
La reutilización de las llantas cuyo ciclo de vida ya ha finalizado, éstas
pueden ser utilizadas para la formación de arrecifes para peces, para
muelles y protección para botes, como materas, para zonas de
recreación (juguetes y columpios), utilizarlas para el control de la
erosión, como elementos de protección para los árboles y como
revestimiento de corrales.
El potencial para solucionar el problema del desecho por el uso de estos
métodos es severamente limitado, es por esta razón que buscaremos una
mezcla optima entre el caucho de las llantas, con polietileno de alta
densidad, para darle un uso adecuado además estaremos colaborando en
la preservación de nuestra ecología.
2.10.1 REENCAUCHADO.
El renovado (reencauchado) del neumático es un proceso mediante el
cual se vuelve a utilizar un neumático gastado sustituyéndole la banda de
rodadura.
El reencauchado se presenta como el recurso más eficaz para la
recuperación de neumáticos con ahorro de material y energía. Se
requiere más energía para fabricar un neumático nuevo que para
reencauchado un neumático usado.
Hay dos técnicas diferentes de producción de un neumático renovado:
Renovado en caliente: en este proceso la vulcanización se realiza en
prensas con moldes a una temperatura comprendida entre 150 ºC y
160 ºC. Existe el renovado integral, donde se renueva la banda de
rodamiento y los flancos (de talón a talón) y el renovado semi-
integral, donde se renueva la banda de rodamiento y parte del flanco.
Renovado en frío: en este proceso la banda de rodamiento está
previamente vulcanizada y se adhiere mediante una goma (llamada
57
“de unión”), vulcanizándose en autoclaves a una temperatura entre
98 ºC y 125 ºC
Renovado de banda clásico: la banda se fabrica en tiras
longitudinales de unos 10 metros, que se cortan a la medida de la
circunferencia del neumático.
Renovado de banda en anillo: la banda se fabrica formando ya el
anillo a la medida final de forma que no hay uniones.
2.11 TECNOLOGIAS DE REDUCCION DE TAMAÑO
Algunos de los procesos más empleados para producir polvo de caucho
son: la molienda mecánica a temperatura ambiente, la molienda
criogénica y la molienda húmeda.
2.11.1 MOLIENDA CRIOGÉNICA
A muy bajas temperaturas (-200ºC) el caucho se fragiliza
desapareciendo su elasticidad característica siendo posible, por tanto
desintegrarlo fácilmente.
El proceso de molienda criogénica viene acompañado por un primer
paso de enfriamiento de las piezas de caucho con nitrógeno líquido.
Este proceso produce la congelación de las piezas.
Las piezas congeladas pasan por un molino de impacto (similar a un
percutor o martillo) donde son molidos en elementos más finos. El
polvo obtenido se seca, se separan la fibra y el metal y se clasifica
según los tamaños obtenidos.
La forma, tamaño, distribución de tamaños y características
superficiales de las partículas de caucho molidas obtenidas por
molienda criogénica son diferentes a las obtenidas por molienda a
temperatura ambiente. Éstas últimas tienden a tener una forma irregular
con una considerable rugosidad superficial y el caucho es parcialmente
oxidado en la superficie debido al calor generado durante el proceso.
Sin embargo, las partículas del polvo obtenidas por molienda criogénica
a una temperatura por debajo de -70º C presentan una superficie
relativamente suave, un amplio rango de tamaño de partícula así como

58
una mínima oxidación superficial. Estas diferencias en la naturaleza y
reactividad pueden producir diferentes propiedades en el producto final.
2.11.2 REGLA DE MEZCLAS
Con la regla de las mezclas se predicen propiedades como densidad,
conductividad térmica y eléctrica (sólo para la dirección de las fibras, si
son unidireccionales y continuas, ya que si no sabemos la dirección de
las fibras y no se predicen sus propiedades).
Ejemplo:
ρ=fm x ρm +ff x ρf
ρ = Densidad del material fibroso.
fm = Fracción volumétrica de la matriz.
ρm = Densidad de la matriz.
ff = Fracción volumétrica de las fibras.
ρf = Densidad de las fibras.
El módulo de la elasticidad se predice también con esta regla (sólo para fibras
continuas y unidireccionales), pero sólo a baja tensión; a altas tensiones se
deforma la matriz y contribuye poco a la rigidez del compuesto, no
cumpliéndose la regla de las mezclas:
E=ff x Ef
E = Modulo de la elasticidad.
ff= Fracción volumétrica de las fibras.
Ef = Módulo de la elasticidad de las fibras.
Si la carga se aplica en dirección perpendicular a las fibras:
1/E = (fm /Em) + (ff /Ef)
La resistencia de un material compuesto reforzado por fibras depende de la
unión entre las fibras y la matriz.
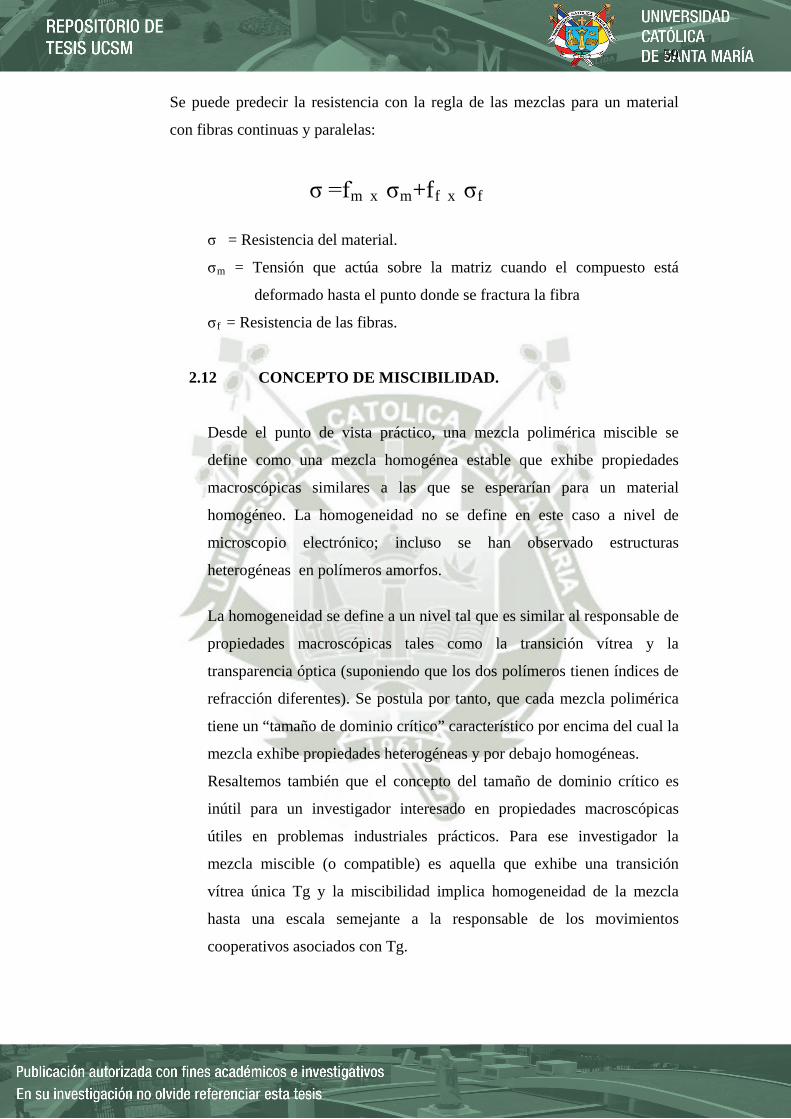
59
Se puede predecir la resistencia con la regla de las mezclas para un material
con fibras continuas y paralelas:
σ =fm x σm+ff x σf
σ = Resistencia del material.
σm = Tensión que actúa sobre la matriz cuando el compuesto está
deformado hasta el punto donde se fractura la fibra
σf = Resistencia de las fibras.
2.12 CONCEPTO DE MISCIBILIDAD.
Desde el punto de vista práctico, una mezcla polimérica miscible se
define como una mezcla homogénea estable que exhibe propiedades
macroscópicas similares a las que se esperarían para un material
homogéneo. La homogeneidad no se define en este caso a nivel de
microscopio electrónico; incluso se han observado estructuras
heterogéneas en polímeros amorfos.
La homogeneidad se define a un nivel tal que es similar al responsable de
propiedades macroscópicas tales como la transición vítrea y la
transparencia óptica (suponiendo que los dos polímeros tienen índices de
refracción diferentes). Se postula por tanto, que cada mezcla polimérica
tiene un “tamaño de dominio crítico” característico por encima del cual la
mezcla exhibe propiedades heterogéneas y por debajo homogéneas.
Resaltemos también que el concepto del tamaño de dominio crítico es
inútil para un investigador interesado en propiedades macroscópicas
útiles en problemas industriales prácticos. Para ese investigador la
mezcla miscible (o compatible) es aquella que exhibe una transición
vítrea única Tg y la miscibilidad implica homogeneidad de la mezcla
hasta una escala semejante a la responsable de los movimientos
cooperativos asociados con Tg.

60
2.13 LA TRANSICIÓN VÍTREA EN POLÍMEROS.
Es la temperatura en el cual un polímero cambia de un estado rígido y
quebradizo a otro blando y maleable, está presente sólo en polímeros
amorfos y es diferente para cada polímero. Es común imaginar a la
transición vítrea como a un tipo de fusión del polímero. Pero no es la
manera correcta. Hay muchas diferencias importantes entre la transición
vítrea y la fusión.
Existe otra gran diferencia entre fusión y transición vítrea. Cuando usted
calienta un polímero cristalino a velocidad constante, la temperatura
aumentará a velocidad constante. La cantidad de calor requerida para
incrementar un grado Celsius la temperatura de un gramo de polímero, se
denomina capacidad calorífica.
Sin embargo, la temperatura seguirá aumentando hasta que el polímero
llegue a su punto de fusión. Cuando esto sucede, la temperatura se
mantendrá constante por un momento, aun cuando se suministre más
calor. Se mantendrá constante hasta que todo el polímero haya fundido
completamente. Luego, la temperatura del polímero comenzará a
ascender nuevamente. El aumento se detiene porque la fusión requiere
energía.
Pero cuando se calienta un polímero amorfo hasta su Tg, sucede algo
diferente. Primero se calienta y la temperatura se eleva a una velocidad
determinada por la capacidad calorífica del polímero. Pero cuando se
alcanza la Tg ocurre algo divertido. La temperatura sigue aumentando,
no se detiene. No hay calor latente de transición vítrea. La temperatura se
sigue incrementando.
Pero por encima de la Tg ya no lo hace a la misma velocidad que por
debajo. El polímero experimenta un incremento en su capacidad
calorífica luego de alcanzar la transición vítrea. La temperatura de
transición vítrea, es un incremento de la pendiente, lo que significa,
61
obviamente, que tenemos un aumento en la capacidad calorífica.
Podemos observar un cambio en capacidad calorífica en la Tg, pero no
una ruptura, como sí puede apreciarse en el caso de un polímero
cristalino.
2.14 ANÁLISIS MECÁNICO DINÁMICO
La respuesta visco elástica de los materiales poliméricos es un tema de
Importancia tanto teórica como práctica. Como su nombre indica el
comportamiento frente a las fuerzas externas es intermedio entre un
sólido elástico y un material viscoso. Es de notar la dependencia que con
el tiempo y la temperatura tienen las propiedades mecánicas de los
polímeros cuando se compara con otros materiales estructurales como los
metales.
La visco elasticidad es una materia de gran complejidad y es posible
distinguir dos aproximaciones básicas que se conocen como la
aproximación mecánica del continuo y la aproximación molecular.
La primera pretende describir el comportamiento visco elástico de un
cuerpo mediante un esquema macroscópico, mientras que el último
pretende deducir propiedades víscoelásticas macroscópicas a partir de la
arquitectura molecular.
La magnitud principal es el módulo del material y se define como la
relación entre el esfuerzo aplicado y la deformación resultante. En los
polímeros esta magnitud depende de la temperatura y del tiempo desde
que se aplicó el esfuerzo. La variación con la temperatura explica la
existencia de dos tipos de estado físicos en los polímeros: tipo caucho y
vítreo.

62
CAPITULO III
PROCEDIMIENTO EXPERIMENTAL
63
3 . PROCEDIMIENTO EXPERIMENTAL
Este estudio se desarrolla en el Laboratorio de Ensayo de MaterialesdelPrograma
Profesional de Ingeniería Mecánica, Mecánica – Eléctrica y Mecatrónica (R - 102) de
la Universidad Católica de Santa María, donde realizamos nuestras mezclas
poliméricas y posteriormente se realizaran en instalaciones los ensayos respectivos
en las instalaciones de la Universidad Nacional de San Agustín Arequipa.
Aquí realizamos la preparación y caracterización del polietileno reciclado, obtenido
de las recicladoras existentes en la ciudad y caucho reciclado obtenido de las llantas
del transporte urbano, y carga pesada, este caucho lo conseguimos triturado de las
reencauchadoras ubicadas en el Distrito de Cerro Colorado. Las mezclas fueron
preparadas en una mezcladora que se encuentra dentro del laboratorio esta tiene una
capacidad de 100gr.
Para las mezclas se tomara como base el diseño experimental 2k para medir cómo
influyen k factores en un proceso y descubrir si interaccionan entre ellos. Este diseño
permite explorar una zona escogida del dominio experimental y encontrar una
dirección prometedora para la optimización posterior. Tomaremos la granulometría y
el porcentaje de polietileno de alta densidad (PEAD).
1. Identificar los factores que pueden influir en la variable respuesta y proponer un
Modelo. 2. Realizar el experimento, tomando las observaciones necesarias. 3. Estimar los parámetros del modelo. 4. Contrastar si los factores influyen en la respuesta. 5. Si los factores influyen en la respuesta, detectar dónde radican las diferencias. 6. Si algún factor no influye, simplificar el modelo y repetir los pasos anteriores. 7. Realizar la diagnosis del modelo mediante el análisis de los residuos.
3.1 Caracterización de las muestras
Los materiales obtenidos, el polietileno de alta densidad fueron adquiridos,
lavado y picado en las recicladoras de Pachacutec en el distrito Cerro Colorado
listo para ser pasado por mallas. El caucho se obtuvo de las reencauchadoras y
de plantas industriales de caucho ubicadas en el Distrito de Cerro Colorado, el
caucho que conseguimos se encontró triturado, limpio y listo para usarlo.
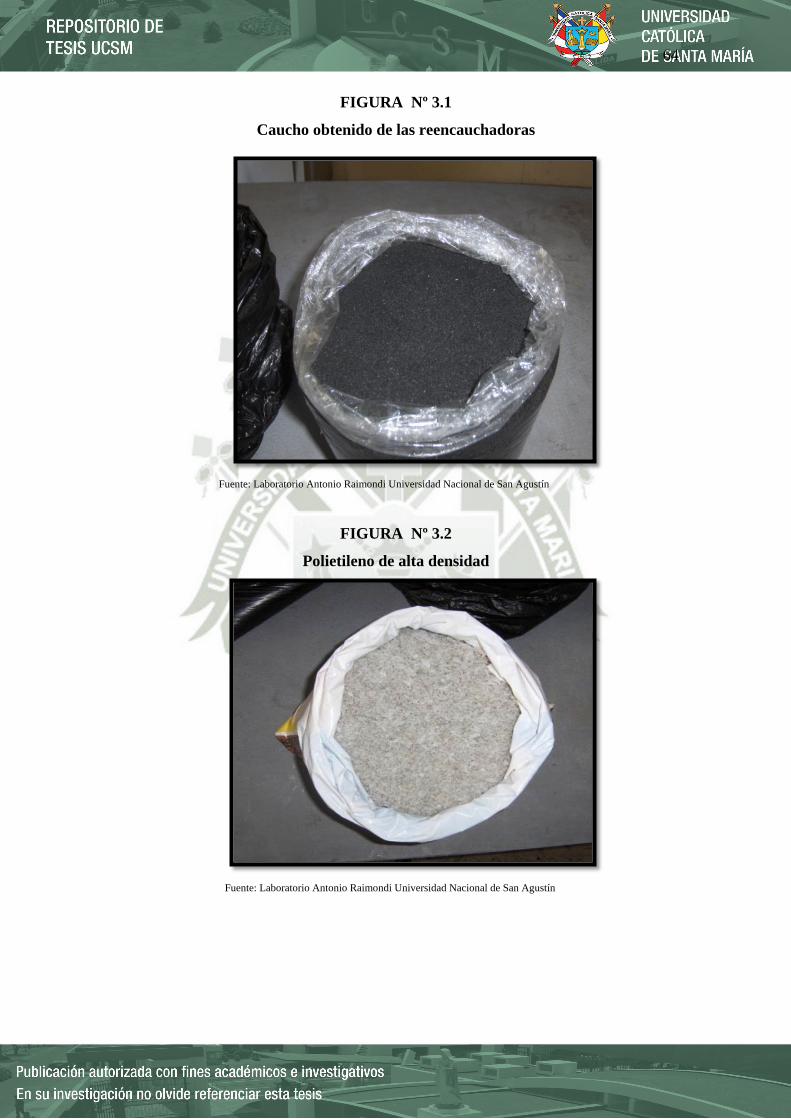
64
FIGURA Nº 3.1
Caucho obtenido de las reencauchadoras
Fuente: Laboratorio Antonio Raimondi Universidad Nacional de San Agustín
FIGURA Nº 3.2
Polietileno de alta densidad
Fuente: Laboratorio Antonio Raimondi Universidad Nacional de San Agustín
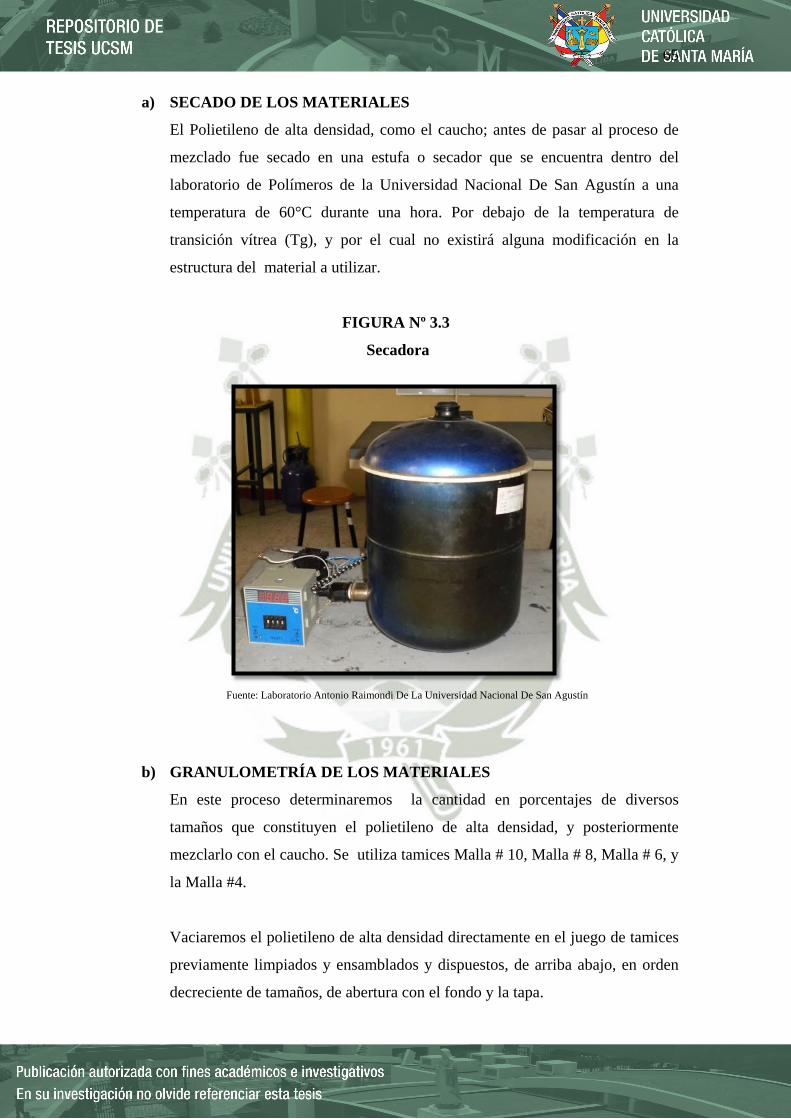
65
a) SECADO DE LOS MATERIALES
El Polietileno de alta densidad, como el caucho; antes de pasar al proceso de
mezclado fue secado en una estufa o secador que se encuentra dentro del
laboratorio de Polímeros de la Universidad Nacional De San Agustín a una
temperatura de 60°C durante una hora. Por debajo de la temperatura de
transición vítrea (Tg), y por el cual no existirá alguna modificación en la
estructura del material a utilizar.
FIGURA Nº 3.3
Secadora
Fuente: Laboratorio Antonio Raimondi De La Universidad Nacional De San Agustín
b) GRANULOMETRÍA DE LOS MATERIALES
En este proceso determinaremos la cantidad en porcentajes de diversos
tamaños que constituyen el polietileno de alta densidad, y posteriormente
mezclarlo con el caucho. Se utiliza tamices Malla # 10, Malla # 8, Malla # 6, y
la Malla #4.
Vaciaremos el polietileno de alta densidad directamente en el juego de tamices
previamente limpiados y ensamblados y dispuestos, de arriba abajo, en orden
decreciente de tamaños, de abertura con el fondo y la tapa.
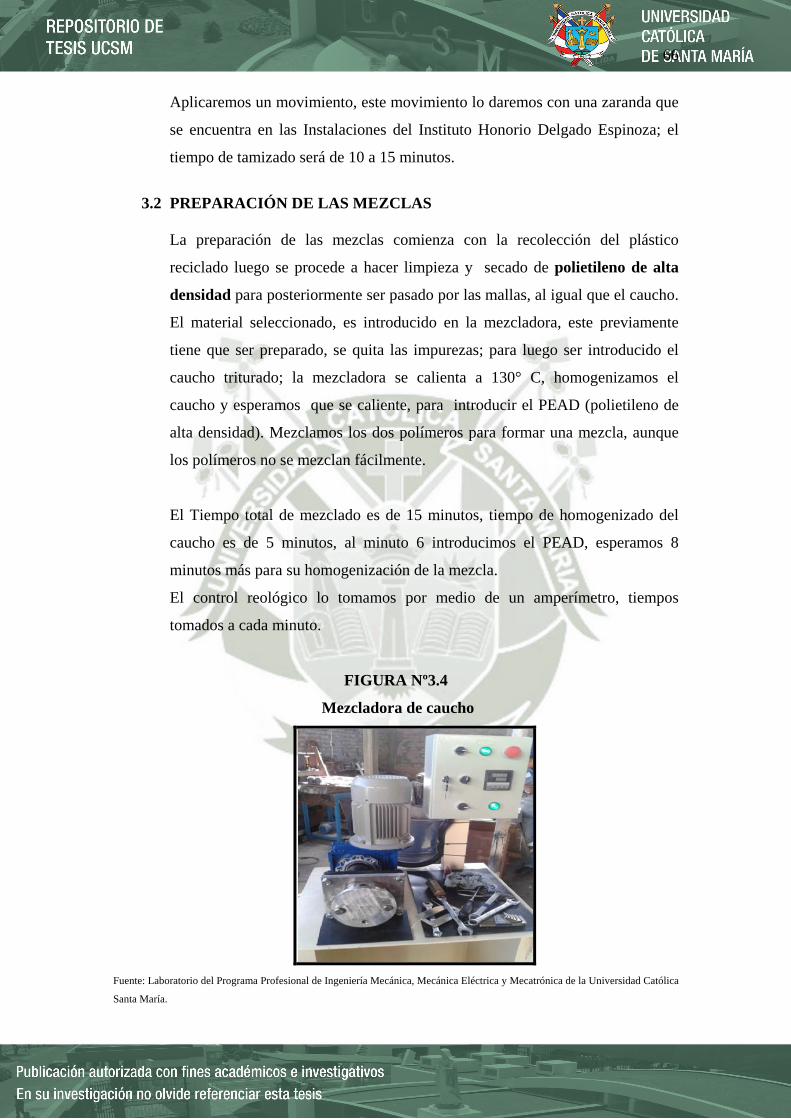
66
Aplicaremos un movimiento, este movimiento lo daremos con una zaranda que
se encuentra en las Instalaciones del Instituto Honorio Delgado Espinoza; el
tiempo de tamizado será de 10 a 15 minutos.
3.2 PREPARACIÓN DE LAS MEZCLAS
La preparación de las mezclas comienza con la recolección del plástico
reciclado luego se procede a hacer limpieza y secado de polietileno de alta
densidad para posteriormente ser pasado por las mallas, al igual que el caucho.
El material seleccionado, es introducido en la mezcladora, este previamente
tiene que ser preparado, se quita las impurezas; para luego ser introducido el
caucho triturado; la mezcladora se calienta a 130° C, homogenizamos el
caucho y esperamos que se caliente, para introducir el PEAD (polietileno de
alta densidad). Mezclamos los dos polímeros para formar una mezcla, aunque
los polímeros no se mezclan fácilmente.
El Tiempo total de mezclado es de 15 minutos, tiempo de homogenizado del
caucho es de 5 minutos, al minuto 6 introducimos el PEAD, esperamos 8
minutos más para su homogenización de la mezcla.
El control reológico lo tomamos por medio de un amperímetro, tiempos
tomados a cada minuto.
FIGURA Nº3.4
Mezcladora de caucho
Fuente: Laboratorio del Programa Profesional de Ingeniería Mecánica, Mecánica Eléctrica y Mecatrónica de la Universidad Católica
Santa María.
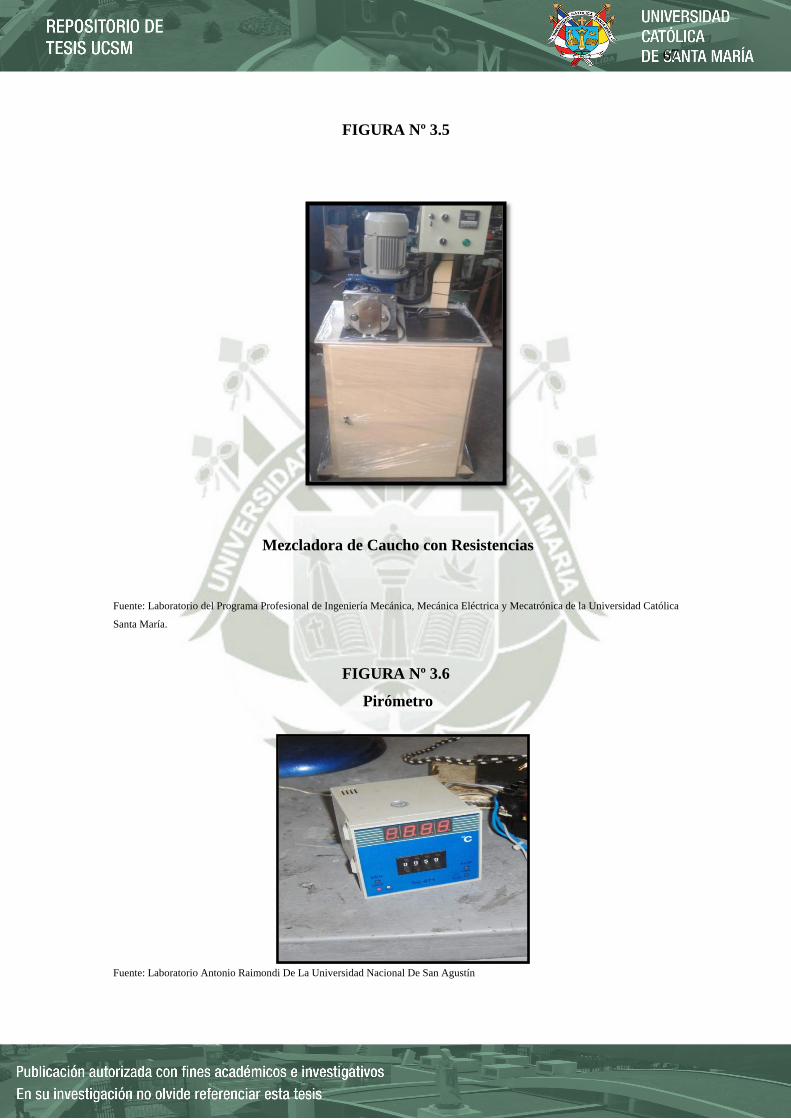
67
FIGURA Nº 3.5
Mezcladora de Caucho con Resistencias
Fuente: Laboratorio del Programa Profesional de Ingeniería Mecánica, Mecánica Eléctrica y Mecatrónica de la Universidad Católica
Santa María.
FIGURA Nº 3.6
Pirómetro
Fuente: Laboratorio Antonio Raimondi De La Universidad Nacional De San Agustín

68
69
FIGURA Nº 3.7
Amperímetro de Pinzas
Fuente: Laboratorio Antonio Raimondi De La Universidad Nacional De San Agustín
3.3 PREPARACIÓN DE LAS PLACAS
a) PICADO DE LAS MEZCLAS OBTENIDAS
La masa obtenida de la mezcladora, es aplanada por la fuerza de un rodillo y
prensa, posteriormente picado con la ayuda de tijeras y cúter.
Una vez picado, es pesado en una balanza electrónica.
FIGURA Nº 3.8
Mezcla Aplanado Caucho más PEAD
Fuente: Laboratorio Antonio Raimondi De La Universidad Nacional De San Agustín.
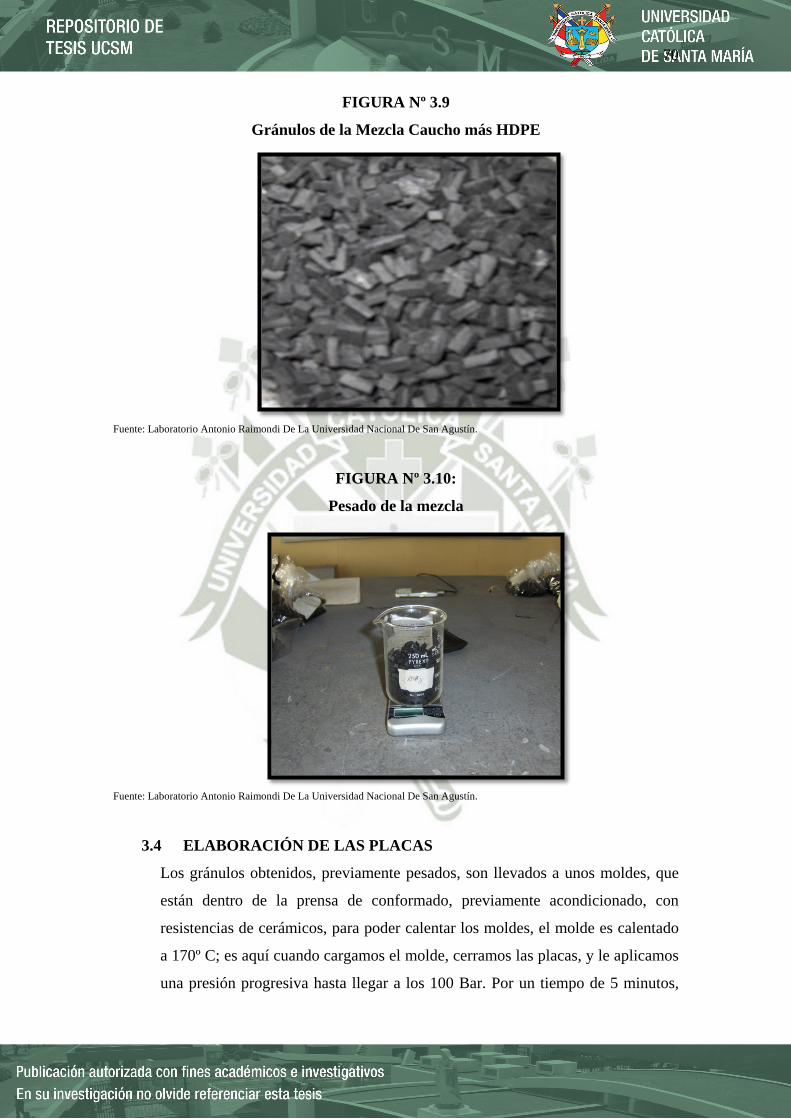
70
FIGURA Nº 3.9
Gránulos de la Mezcla Caucho más HDPE
Fuente: Laboratorio Antonio Raimondi De La Universidad Nacional De San Agustín.
FIGURA Nº 3.10:
Pesado de la mezcla
Fuente: Laboratorio Antonio Raimondi De La Universidad Nacional De San Agustín.
3.4 ELABORACIÓN DE LAS PLACAS
Los gránulos obtenidos, previamente pesados, son llevados a unos moldes, que
están dentro de la prensa de conformado, previamente acondicionado, con
resistencias de cerámicos, para poder calentar los moldes, el molde es calentado
a 170º C; es aquí cuando cargamos el molde, cerramos las placas, y le aplicamos
una presión progresiva hasta llegar a los 100 Bar. Por un tiempo de 5 minutos,
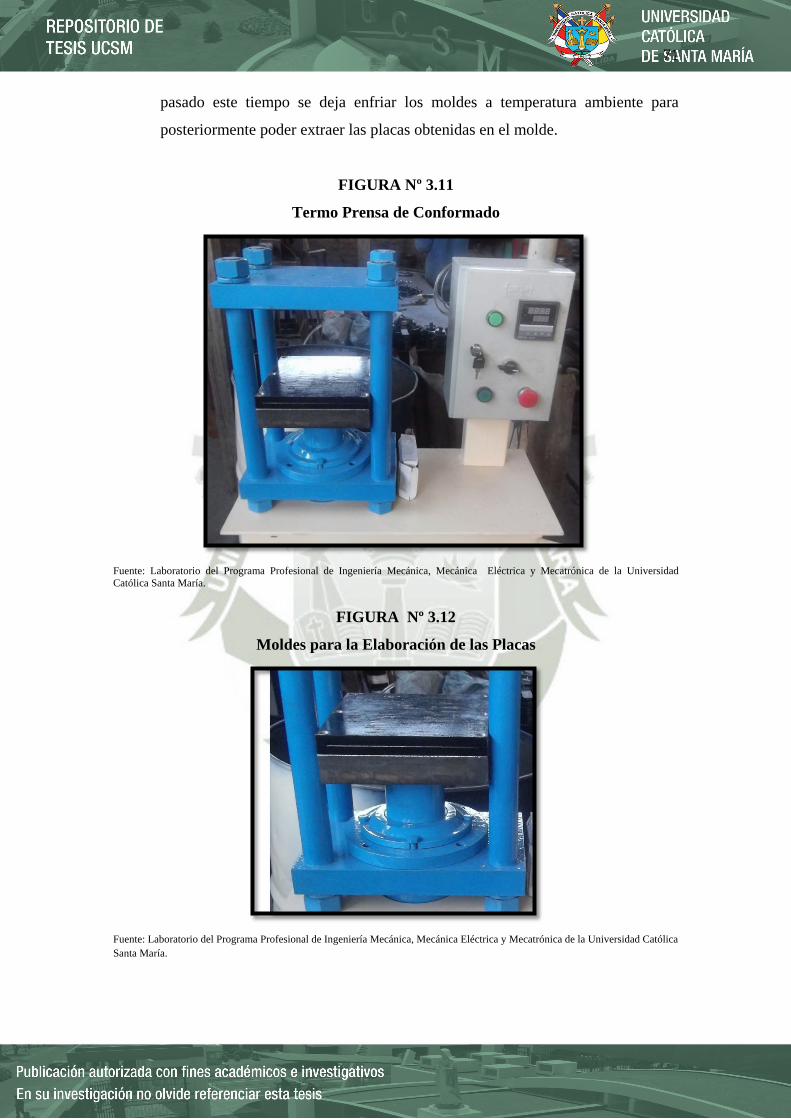
71
pasado este tiempo se deja enfriar los moldes a temperatura ambiente para
posteriormente poder extraer las placas obtenidas en el molde.
FIGURA Nº 3.11
Termo Prensa de Conformado
Fuente: Laboratorio del Programa Profesional de Ingeniería Mecánica, Mecánica Eléctrica y Mecatrónica de la Universidad Católica Santa María.
FIGURA Nº 3.12
Moldes para la Elaboración de las Placas
Fuente: Laboratorio del Programa Profesional de Ingeniería Mecánica, Mecánica Eléctrica y Mecatrónica de la Universidad Católica Santa María.
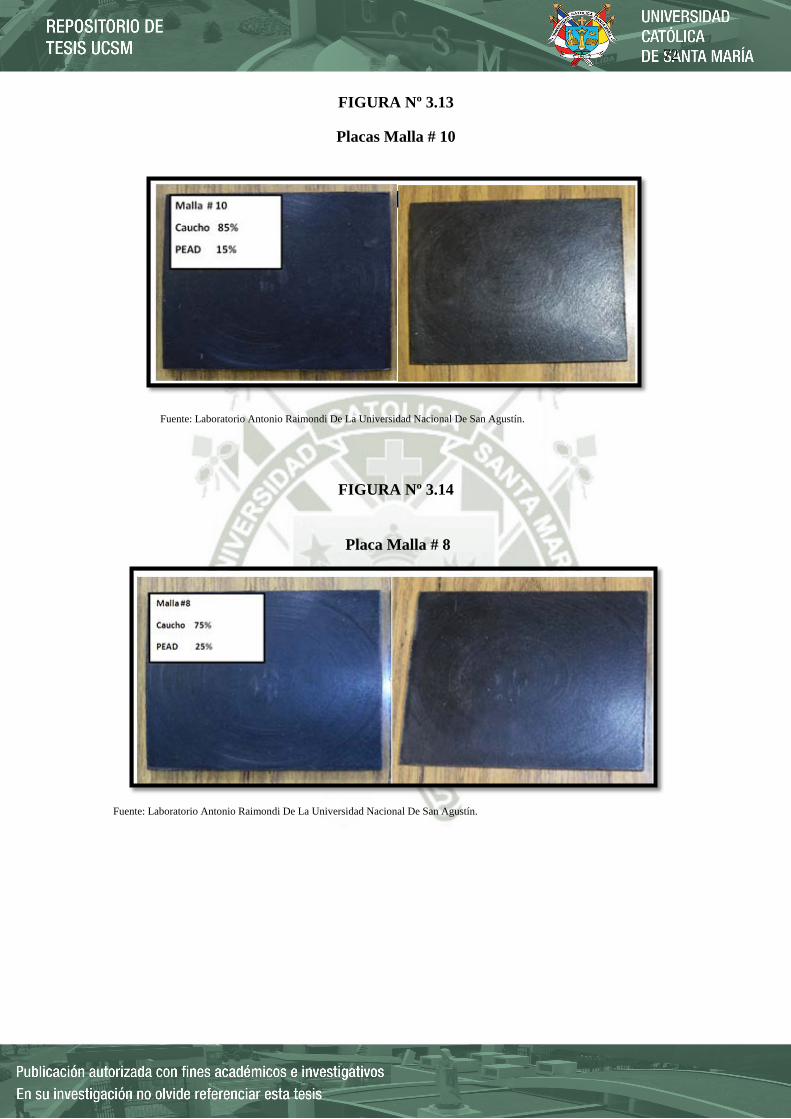
72
FIGURA Nº 3.13
Placas Malla # 10
Fuente: Laboratorio Antonio Raimondi De La Universidad Nacional De San Agustín.
FIGURA Nº 3.14
Placa Malla # 8
Fuente: Laboratorio Antonio Raimondi De La Universidad Nacional De San Agustín.

73
FIGURA Nº 3.15
Placa Malla #6
Fuente: Laboratorio Antonio Raimondi De La Universidad Nacional De San Agustín.
FIGURA Nº 3.16
Placa Malla # 4
Fuente: Laboratorio Antonio Raimondi De La Universidad Nacional De San Agustín.
Una vez retirado de los moldes, son etiquetados, para que no tengamos
confusiones, y realizar sus respectivos ensayos (Moldes Según Norma
ASTM D3182).
Las placas obtenidas tienen la apariencia de caucho, con la resistencia suficiente
(primera impresión) para ser utilizado en aplicaciones de pisos (pavimentos

74
blandos). Estos pavimentos son ecológicos por qué no contiene adición de
componentes tóxicos dañinos para el medio ambiente. Se trabaja,
exclusivamente con material reciclado.
Los residuos producidos por los pavimentos de caucho reciclado no están
considerados como tóxicos ni peligrosos. Los residuos de recorte, o trozos no
utilizados pueden ser reutilizados. Nuestros pavimentos entonces pueden ser
reciclados.
Las muestras obtenidas son cuadrados de aproximadamente 10 cm de lado con
un espesor de 1.5 cm, deben tener unas superficies totalmente lisas para poder
obtener unos resultados más precisos al momento de realizar las indentación, al
realizar los ensayos de caída de bola (resiliencia), dureza y tracción.
3.5 ENSAYO DE IMPACTO DE CAÍDA DE BOLA
En este análisis tomamos como referencia de la Norma ASTM F1487. Se
menciona las especificaciones de desempeño de seguridad para equipos de
áreas de juego para uso público.
Este ensayo ha sido concebido con el fin de generar pautas que disminuyan el
riesgo al impacto resultante de caídas.
Veremos aquí el rendimiento de amortiguación del material de superficie, la
altura crítica del material de superficie.
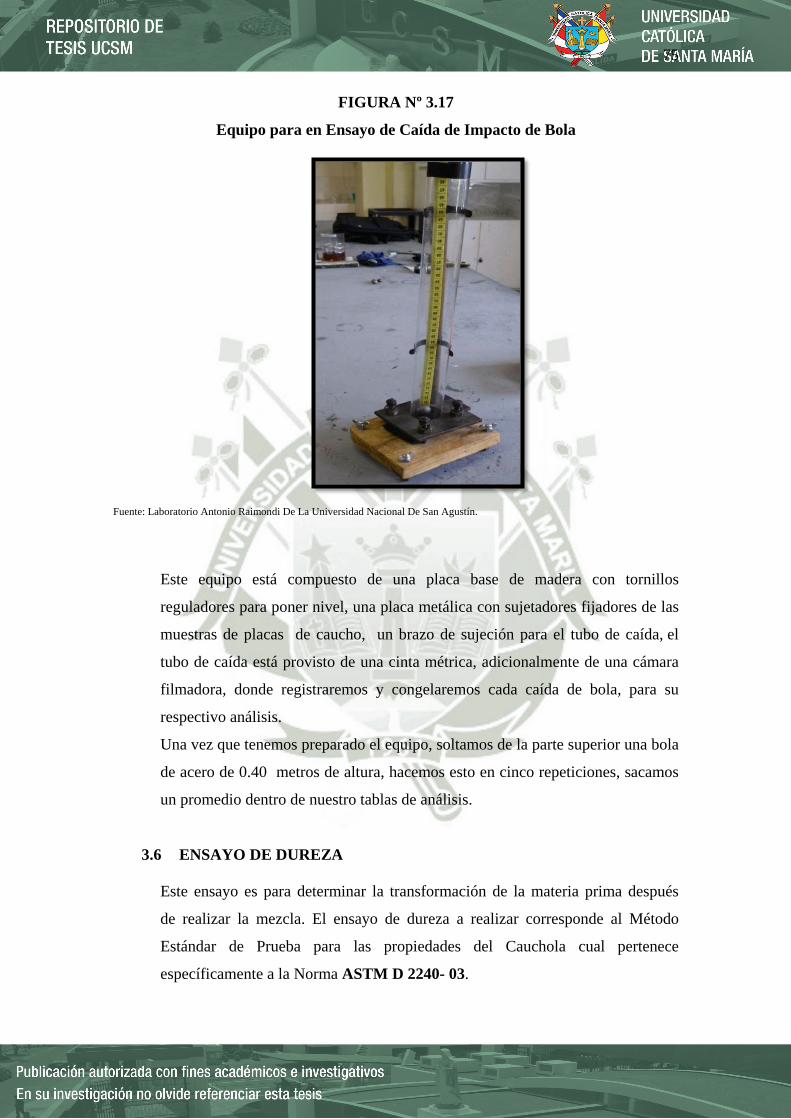
75
FIGURA Nº 3.17
Equipo para en Ensayo de Caída de Impacto de Bola
Fuente: Laboratorio Antonio Raimondi De La Universidad Nacional De San Agustín.
Este equipo está compuesto de una placa base de madera con tornillos
reguladores para poner nivel, una placa metálica con sujetadores fijadores de las
muestras de placas de caucho, un brazo de sujeción para el tubo de caída, el
tubo de caída está provisto de una cinta métrica, adicionalmente de una cámara
filmadora, donde registraremos y congelaremos cada caída de bola, para su
respectivo análisis.
Una vez que tenemos preparado el equipo, soltamos de la parte superior una bola
de acero de 0.40 metros de altura, hacemos esto en cinco repeticiones, sacamos
un promedio dentro de nuestro tablas de análisis.
3.6 ENSAYO DE DUREZA
Este ensayo es para determinar la transformación de la materia prima después
de realizar la mezcla. El ensayo de dureza a realizar corresponde al Método
Estándar de Prueba para las propiedades del Cauchola cual pertenece
específicamente a la Norma ASTM D 2240- 03.

76
El propósito de este ensayo será el de poder medir la dureza basada en la
penetración de un indentador de un tipo determinado sobre las muestras a
analizar. Teóricamente, los resultados de la dureza de indentación deberán ser
inversamente proporcionales a la hendidura realizada y directamente
proporcional al módulo de elasticidad y a la viscosidad del material. Es
importante mencionar que los resultados de este ensayo dependerán en gran
medida de la geometría del indentador y la fuerza aplicada sobre el material
objeto de análisis; sin embargo, no existe una relación entre los valores de
dureza determinados por diferentes durómetros sobre un mismo material. Las
unidades de dureza a utilizar en los ensayos será la de Shore A.
FIGURA Nº 3.17
Durómetro Shore A
Fuente: Laboratorio Antonio Raimondi De La Universidad Nacional De San Agustín.

77
CAPITULO IV
RESULTADOS Y DISCUSIONES

78
4. RESULTADOS Y DISCUSIONES
En este capítulo presentaremos los resultados obtenidos en la elaboración de
pavimentos blandos, seguido con las interpretaciones, de cada ensayo realizado
4.1 CARACTERIZACIÓN DE LAS MUESTRAS
a) GRANULOMETRÍA DE LOS MATERIALES
El Polietileno fue pasado por mallas Malla # 10, Malla # 8, Malla # 6, y Malla
# 4. El caucho no lo pasamos por mallas ya que conseguimos un caucho
triturado en un tamaño muy pequeño. Esto principalmente para su respectivo
análisis reológico, al momento de las mezclas.
CUADRO Nº 6
DISTRIBUCIÓN DEL ANÁLISIS GRANULOMÉTRICO
USA Estándar ASTM E 11-61 Material Retenido (gr) %Retenido %Acumulado
4 234.5 46.90 46.90 6 138.2 27.64 74.54 8 95.7 19.14 93.68 10 25.5 5.10 98.78
Fondo 3.4 0.68 99.46 Total 497.3 99.46
Perdidas (gr.) 2,7
Material retenido(gr.) + perdidas (gr.) 500
% de perdidas 0.54
% Acumulado + % de perdidas 100 Fuente: Laboratorio del Instituto Honorio Delgado Espinoza
Cantidad total de caucho utilizado fue de 500 gr.
Del Cuadro Nº 6 observamos que la mayor cantidad de caucho encontrado en la malla
pasante # 4, aquí tenemos 46.90%; viendo los otros porcentajes, es también
recomendable trabajar con malla # 6 y malla # 8.

79
FIGURA Nº 4.1
Malla # 4
Fuente: Laboratorio Antonio Raimondi De La Universidad Nacional De San Agustín.
FIGURA Nº 4.2
Malla # 6
Fuente: Laboratorio Antonio Raimondi De La Universidad Nacional De San Agustín.
FIGURA Nº 4.3
Malla # 8
Fuente: Laboratorio Antonio Raimondi De La Universidad Nacional De San Agustín.

80
FIGURA Nº 4.4
Malla # 10
Fuente: Laboratorio Antonio Raimondi De La Universidad Nacional De San Agustín.
4.2 RESULTADOS DE LA PREPARACIÓN DE LAS MEZCLAS
Las mezclas se toman como base el diseño experimental 2k, este diseño permite
explorar una zona escogida del dominio experimental y encontrar una dirección
prometedora para la optimización posterior.
Para la optimización de las mezclas, es necesario saber cuáles son las variables
independientes (ensayo a la bola, Dureza) y las variables dependientes
(Granulometría medidos en mallas, y porcentaje de caucho en las mezclas).
CUADRO Nº 7
Identificación de las variables dependientes
FACTORES Nivel (-) Nivel (+)
Granulometría Malla Nº 4 Malla Nº 10
Porcentaje de caucho 65 % 85 % Fuente: Laboratorio Antonio Raimondi De La Universidad Nacional De San Agustín.
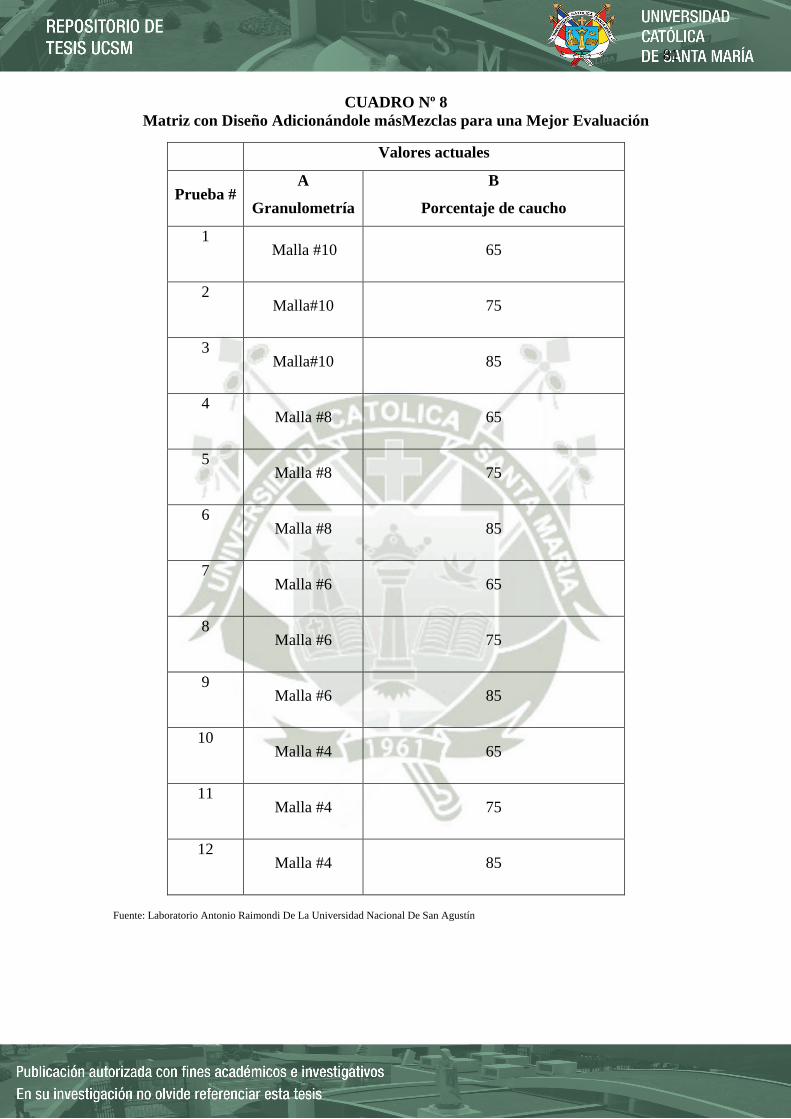
81
CUADRO Nº 8 Matriz con Diseño Adicionándole másMezclas para una Mejor Evaluación
Fuente: Laboratorio Antonio Raimondi De La Universidad Nacional De San Agustín
Valores actuales
Prueba # A
Granulometría
B
Porcentaje de caucho
1
Malla #10 65
2
Malla#10 75
3
Malla#10 85
4
Malla #8 65
5
Malla #8 75
6
Malla #8 85
7
Malla #6 65
8
Malla #6 75
9
Malla #6 85
10
Malla #4 65
11
Malla #4 75
12
Malla #4 85

82
4.3 RESULTADOS DEL CONTROL REOLÓGICO
CUADRO Nº 9
Datos Obtenidos durante el Mezclado usando Malla # 4
Malla # 4
85% de Caucho, 15% de PEAD
85% de Caucho, 15% de PEAD
75% de Caucho, 25% de PEAD
75% de Caucho, 25% de PEAD
65% de Caucho, 35% de PEAD
65% de Caucho, 35% de PEAD
Tiempo (min)
Amperaje (A)
Amperaje (A)
Amperaje (A)
Amperaje (A)
Amperaje (A)
Amperaje (A)
1 3,8
3,8
3,7
3,9
4,0
3,9
2 3,8
3,8
3,7
3,9
3,9
4,0
3 3,8
3,8
3,7
3,9
3,8
4,0
4 3,8
3,9
3,7
3,9
3,8
4,0
5 3,8
3,9
3,7
3,9
3,9
4,0
6 3,8
3,9
3,7
3,9
3,9
4,0
7
5,6
5,6
4,9
5,1
5,2
5,1
8
5,5
5,5
4,9
5,0
5,1
5,0
9
5,5
5,5
4,9
4,9
5,0
5,0
10 5.3
5,4
4,8
4,9
5,0
4,8
11
5,4
5,4
4,8
4,8
4,9
4,8
12
5,4
5,3
4,8
4,8
4,8
4,7
13
5,4
5,3
4,8
4,8
4,8
4,8
14
5,3
5,3
4,7
4,8
4,8
4,8 Fuente: Laboratorio Antonio Raimondi De La Universidad Nacional De San Agustín

83
GRAFICA Nº 4.1:
Tiempo vs Amperaje Malla # 4
Fuente: Laboratorio Antonio Raimondi De La Universidad Nacional De San Agustín
Observamos, los primeros 6 minutos casi horizontal existiendo un consumo uniforme de
energía, al agregar el PEAD aumenta su consumo, a partir del minuto 7, para
posteriormente estabilizarse; además tenemos que todos los porcentajes usados para la
mezcla, tienen casi el mismo comportamiento, con pequeña diferencia, del caucho al
85%, y 15% de PEAD, estimamos que aquí existe un poco más de consumo de energía.
0,0
1,0
2,0
3,0
4,0
5,0
6,0
0 2 4 6 8 10 12 14 16
Ampe
raje
Tiempo
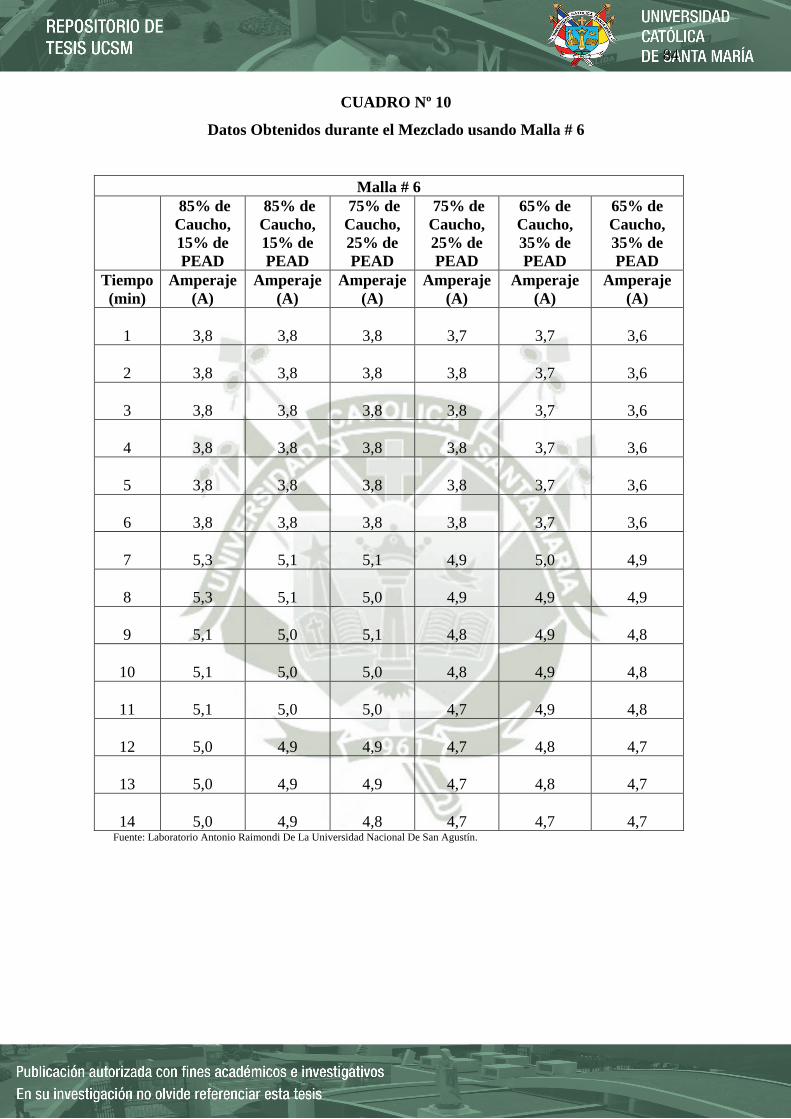
84
CUADRO Nº 10
Datos Obtenidos durante el Mezclado usando Malla # 6
Malla # 6
85% de Caucho, 15% de PEAD
85% de Caucho, 15% de PEAD
75% de Caucho, 25% de PEAD
75% de Caucho, 25% de PEAD
65% de Caucho, 35% de PEAD
65% de Caucho, 35% de PEAD
Tiempo (min)
Amperaje (A)
Amperaje (A)
Amperaje (A)
Amperaje (A)
Amperaje (A)
Amperaje (A)
1
3,8
3,8
3,8
3,7
3,7
3,6
2
3,8
3,8
3,8
3,8
3,7
3,6
3
3,8
3,8
3,8
3,8
3,7
3,6
4
3,8
3,8
3,8
3,8
3,7
3,6
5
3,8
3,8
3,8
3,8
3,7
3,6
6
3,8
3,8
3,8
3,8
3,7
3,6
7
5,3
5,1
5,1
4,9
5,0
4,9
8
5,3
5,1
5,0
4,9
4,9
4,9
9
5,1
5,0
5,1
4,8
4,9
4,8
10
5,1
5,0
5,0
4,8
4,9
4,8
11
5,1
5,0
5,0
4,7
4,9
4,8
12
5,0
4,9
4,9
4,7
4,8
4,7
13
5,0
4,9
4,9
4,7
4,8
4,7
14
5,0
4,9
4,8
4,7
4,7
4,7 Fuente: Laboratorio Antonio Raimondi De La Universidad Nacional De San Agustín.

85
GRAFICA Nº4.2
Tiempo vs Amperaje Malla # 6
Fuente: Laboratorio Antonio Raimondi De La Universidad Nacional De San Agustín.
Observamos, que los primeros 6 minutos casi horizontal; existiendo un consumo
uniforme de energía, al agregar el PEAD aumenta su consumo, a partir del minuto 7,
para posteriormente estabilizarse; además tenemos que todos los porcentajes usados
para la mezcla, tienen casi el mismo comportamiento, con pequeña diferencia, del
caucho al 85%, 15% de PEAD, y uno de las mezclas de 75% caucho y 25% de PEAD;
estimamos que aquí existe un poco más de consumo de energía.
0,0
1,0
2,0
3,0
4,0
5,0
6,0
0 2 4 6 8 10 12 14 16
Ampe
raje
Tiempo

86
CUADRO Nº 11
Datos Obtenidos durante el Mezclado usando Malla # 8
Malla # 8
85% de Caucho, 15% de PEAD
85% de Caucho, 15% de PEAD
75% de Caucho, 25% de PEAD
75% de Caucho, 25% de PEAD
65% de Caucho, 35% de PEAD
65% de Caucho, 35% de PEAD
Tiempo (min)
Amperaje (A)
Amperaje (A)
Amperaje (A)
Amperaje (A)
Amperaje (A)
Amperaje (A)
1
3,7
3,9
4,2
3,8
3,8
3,7
2
3,7
3,9
4,2
3,8
3,8
3,7
3
3,7
3,9
4,1
3,8
3,8
3,7
4
3,7
3,9
4,1
3,8
3,8
3,7
5
3,7
3,9
4,1
3,8
3,7
3,7
6
3,7
3,9
4,1
3,8
3,7
3,7
7
4,9
4,8
5,4
5,0
5,0
5,0
8
4,9
4,7
5,3
5,0
5,0
5,0
9
4,9
4,7
5,3
5,0
5,0
5,0
10
4,9
4,7
5,3
4,9
5,0
5,0
11
4,8
4,7
5,2
4,9
4,9
4,9
12
4,8
4,7
5,2
4,9
4,8
4,9
13
4,8
4,7
5,2
4,8
4,8
4,9
14
4,7
4,6
5,1
4,8
4,8
4,9 Fuente: Laboratorio Antonio Raimondi De La Universidad Nacional De San Agustín.
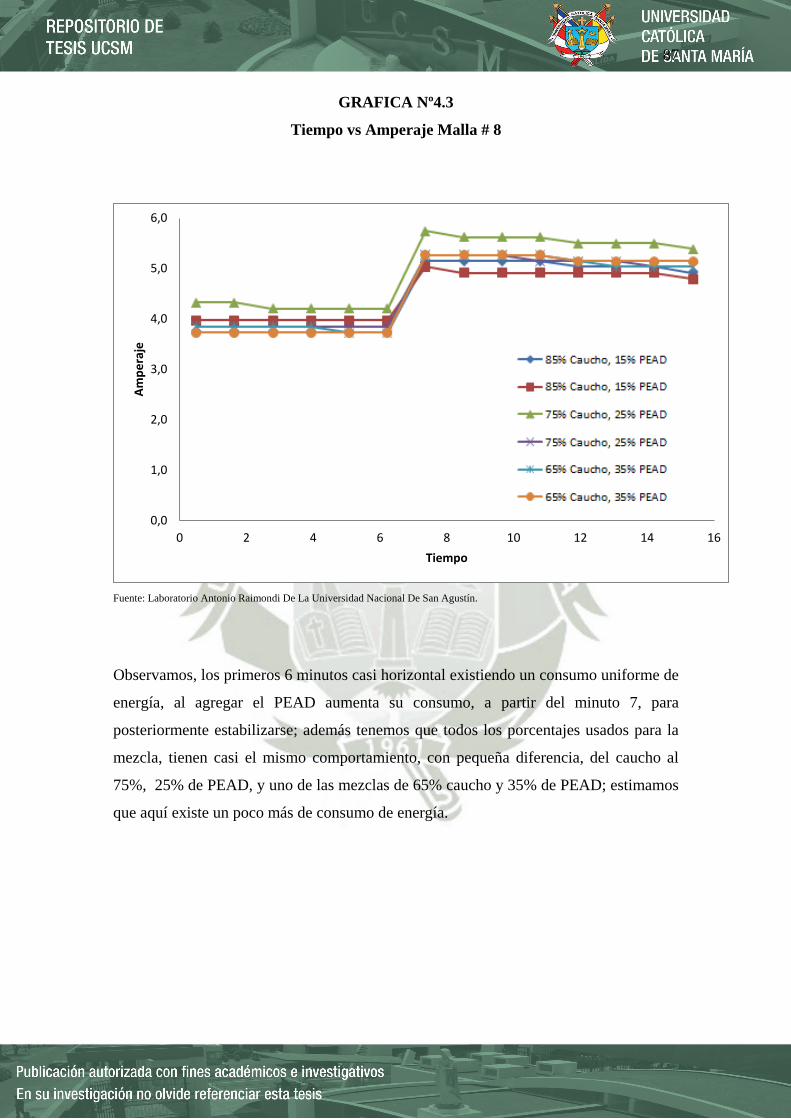
87
GRAFICA Nº4.3
Tiempo vs Amperaje Malla # 8
Fuente: Laboratorio Antonio Raimondi De La Universidad Nacional De San Agustín.
Observamos, los primeros 6 minutos casi horizontal existiendo un consumo uniforme de
energía, al agregar el PEAD aumenta su consumo, a partir del minuto 7, para
posteriormente estabilizarse; además tenemos que todos los porcentajes usados para la
mezcla, tienen casi el mismo comportamiento, con pequeña diferencia, del caucho al
75%, 25% de PEAD, y uno de las mezclas de 65% caucho y 35% de PEAD; estimamos
que aquí existe un poco más de consumo de energía.
0,0
1,0
2,0
3,0
4,0
5,0
6,0
0 2 4 6 8 10 12 14 16
Ampe
raje
Tiempo

88
CUADRO Nº 12
Datos Obtenidos durante el Mezclado usando Malla # 10
Malla # 10
85% de Caucho, 15% de PEAD
85% de Caucho, 15% de PEAD
75% de Caucho, 25% de PEAD
75% de Caucho, 25% de PEAD
65% de Caucho, 35% de PEAD
65% de Caucho, 35% de PEAD
Tiempo (min)
Amperaje (A)
Amperaje (A)
Amperaje (A)
Amperaje (A)
Amperaje (A)
Amperaje (A)
1
3,9
3,9
3,7
4,0
3,9
3,8
2
3,9
3,9
3,7
4,0
3,9
3,8
3
3,9
3,9
3,7
4,0
3,9
3,8
4
3,9
3,9
3,7
4,0
3,9
3,8
5
3,9
3,9
3,7
4,0
3,9
3,8
6
3,9
3,9
3,7
4,0
3,9
3,8
7
4,8
4,8
5,0
5,4
5,5
5,3
8
4,8
4,7
5,0
5,4
5,5
5,3
9
4,8
4,7
5,0
5,3
5,5
5,3
10
4,8
4,7
4,9
5,3
5,4
5,3
11
4,7
4,7
4,9
5,3
5,3
5,2
12
4,7
4,7
4,9
5,3
5,3
5,2
13
4,7
4,6
4,8
5,3
5,3
5,2
14
4,7
4,6
4,8
5,2
5,2
5,1 Fuente: Laboratorio Antonio Raimondi De La Universidad Nacional De San Agustín.

89
GRAFICA Nº4.4
Tiempo vs Amperaje Malla # 10
Fuente: Laboratorio Antonio Raimondi De La Universidad Nacional De San Agustín.
Observamos, los primeros 6 minutos casi horizontal existiendo un consumo uniforme de
energía, al agregar el PEAD aumenta su consumo, a partir del minuto 7, para
posteriormente estabilizarse; además tenemos que todos los porcentajes usados para la
mezcla, tienen casi el mismo comportamiento, con pequeña diferencia, del caucho al
65%, 35% de PEAD, y uno de las mezclas de 75% caucho y 25% de PEAD; estimamos
que aquí existe un poco más de consumo de energía.
0,0
1,0
2,0
3,0
4,0
5,0
6,0
0 2 4 6 8 10 12 14 16
Ampe
raje
Tiempo

90
4.4 ENSAYO DE IMPACTO DE CAÍDA DE BOLA
FIGURA Nº 4.5
Fotografías Tomadas Después de la Filmación
Fuente: Laboratorio Antonio Raimondi De La Universidad Nacional De San Agustín. Para este ensayo utilizamos una cámara filmadora, para registrar las alturas
correspondientes, congelamos las imágenes cuando se encontraban en la parte superior,
haciendo el acercamiento respectivo, tenemos las lecturas, con un error de +- 0.1 cm.
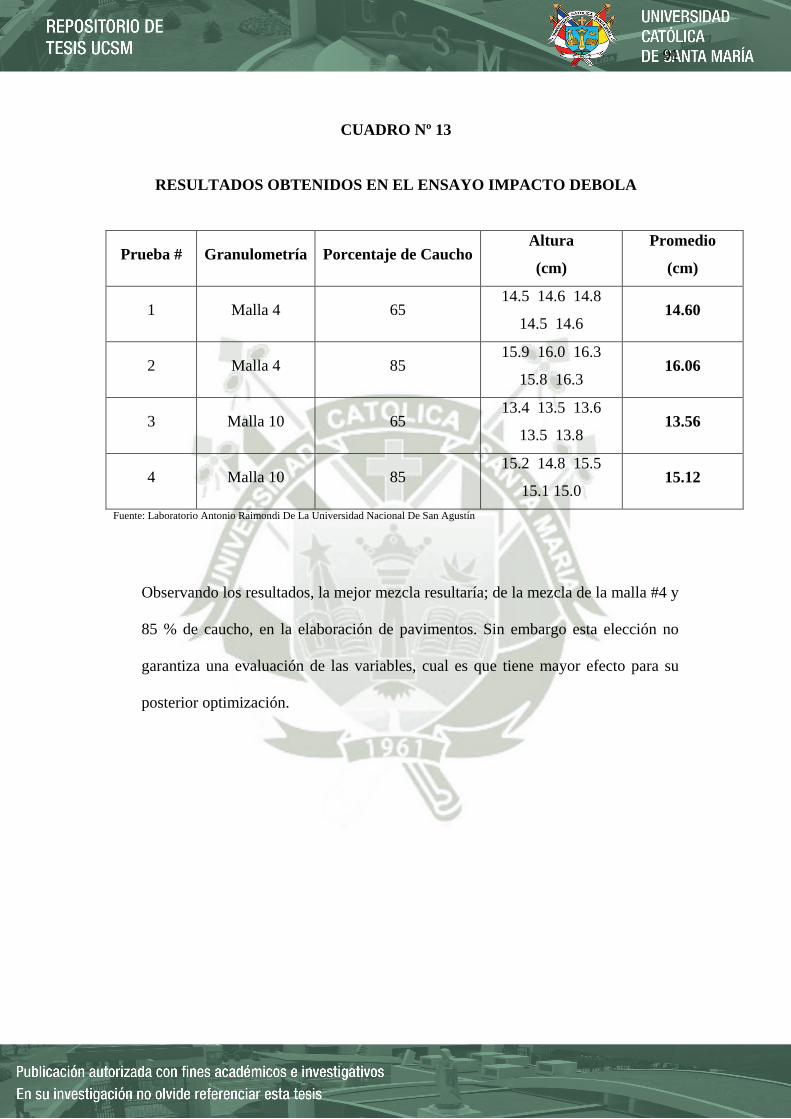
91
CUADRO Nº 13
RESULTADOS OBTENIDOS EN EL ENSAYO IMPACTO DEBOLA
Prueba # Granulometría Porcentaje de Caucho Altura
(cm)
Promedio
(cm)
1 Malla 4 65 14.5 14.6 14.8
14.5 14.6 14.60
2 Malla 4 85 15.9 16.0 16.3
15.8 16.3 16.06
3 Malla 10 65 13.4 13.5 13.6
13.5 13.8 13.56
4 Malla 10 85 15.2 14.8 15.5
15.1 15.0 15.12
Fuente: Laboratorio Antonio Raimondi De La Universidad Nacional De San Agustín
Observando los resultados, la mejor mezcla resultaría; de la mezcla de la malla #4 y
85 % de caucho, en la elaboración de pavimentos. Sin embargo esta elección no
garantiza una evaluación de las variables, cual es que tiene mayor efecto para su
posterior optimización.
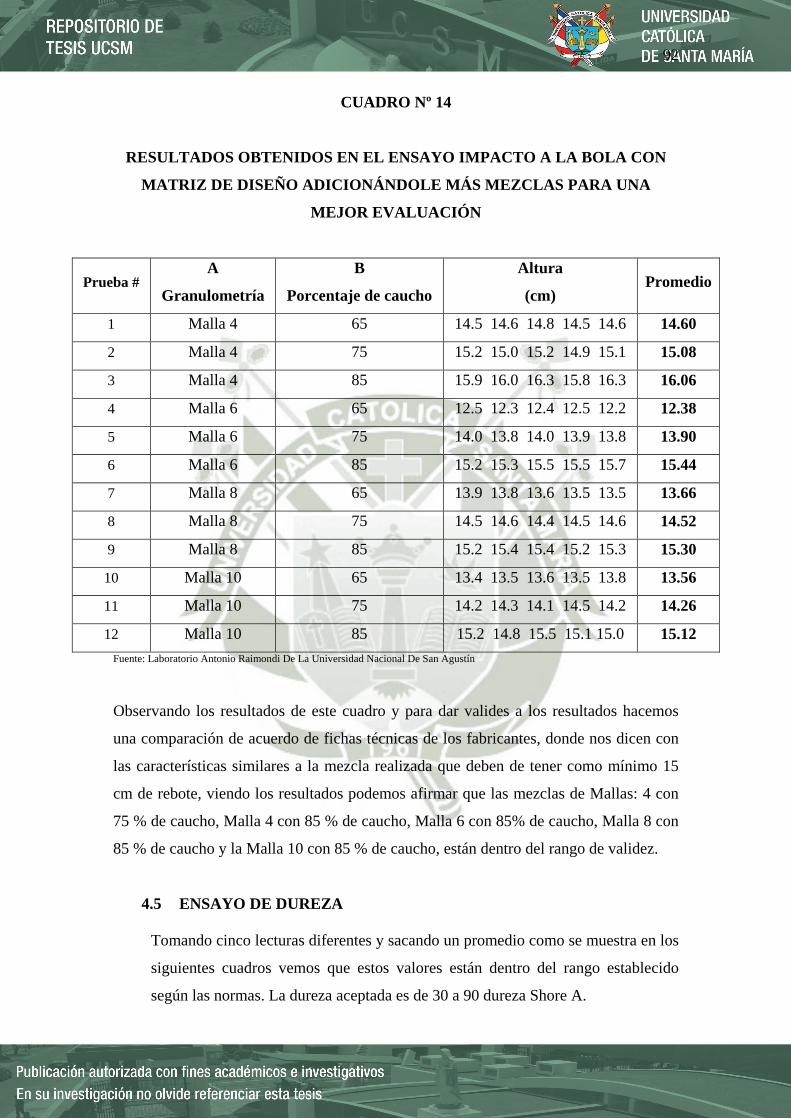
92
CUADRO Nº 14
RESULTADOS OBTENIDOS EN EL ENSAYO IMPACTO A LA BOLA CON
MATRIZ DE DISEÑO ADICIONÁNDOLE MÁS MEZCLAS PARA UNA
MEJOR EVALUACIÓN
Prueba # A
Granulometría
B
Porcentaje de caucho
Altura
(cm) Promedio
1 Malla 4 65 14.5 14.6 14.8 14.5 14.6 14.60
2 Malla 4 75 15.2 15.0 15.2 14.9 15.1 15.08
3 Malla 4 85 15.9 16.0 16.3 15.8 16.3 16.06
4 Malla 6 65 12.5 12.3 12.4 12.5 12.2 12.38
5 Malla 6 75 14.0 13.8 14.0 13.9 13.8 13.90
6 Malla 6 85 15.2 15.3 15.5 15.5 15.7 15.44
7 Malla 8 65 13.9 13.8 13.6 13.5 13.5 13.66
8 Malla 8 75 14.5 14.6 14.4 14.5 14.6 14.52
9 Malla 8 85 15.2 15.4 15.4 15.2 15.3 15.30
10 Malla 10 65 13.4 13.5 13.6 13.5 13.8 13.56
11 Malla 10 75 14.2 14.3 14.1 14.5 14.2 14.26
12 Malla 10 85 15.2 14.8 15.5 15.1 15.0 15.12 Fuente: Laboratorio Antonio Raimondi De La Universidad Nacional De San Agustín Observando los resultados de este cuadro y para dar valides a los resultados hacemos
una comparación de acuerdo de fichas técnicas de los fabricantes, donde nos dicen con
las características similares a la mezcla realizada que deben de tener como mínimo 15
cm de rebote, viendo los resultados podemos afirmar que las mezclas de Mallas: 4 con
75 % de caucho, Malla 4 con 85 % de caucho, Malla 6 con 85% de caucho, Malla 8 con
85 % de caucho y la Malla 10 con 85 % de caucho, están dentro del rango de validez.
4.5 ENSAYO DE DUREZA
Tomando cinco lecturas diferentes y sacando un promedio como se muestra en los
siguientes cuadros vemos que estos valores están dentro del rango establecido
según las normas. La dureza aceptada es de 30 a 90 dureza Shore A.

93
CUADRO Nº 15
Resultados Obtenidos en la Malla # 4
PORCENTAJE DUREZA PROMEDIO
85% caucho 15% PEAD 79.5,79.7,81,80.1,79.7 80
75% caucho 25% PEAD 58.4,59.6,57,59.1,58 58.42
65% caucho 35% PEAD 35.1,34.9,35.4,36.1,37 35.7
Fuente: Laboratorio Antonio Raimondi De La Universidad Nacional De San Agustín
Observación: Usando la Malla # 4 y a diferentes porcentajes de caucho y PEAD
y aplicando la prueba de dureza nos damos cuenta que a mayor porcentaje de
caucho reciclado el promedio de dureza Shore A aumenta.
CUADRO Nº 16
Resultados Obtenidos en la Malla # 6
PORCENTAJE DUREZA PROMEDIO
85% caucho 15% PEAD 75.6,76.2,75.9,76.1,76 75.96
75% caucho 25% PEAD 58.9,59.1,57.9,58.4,59 58.66
65% caucho 35% PEAD 32.1,32.9,31.4,32.1,33 32.3
Fuente: Laboratorio Antonio Raimondi De La Universidad Nacional De San Agustín.
Observación: Usando la Malla # 6 y a diferentes porcentajes de caucho y PEAD
y aplicando la prueba de dureza nos damos cuenta que a mayor porcentaje de
caucho reciclado el promedio de dureza Shore A aumenta.
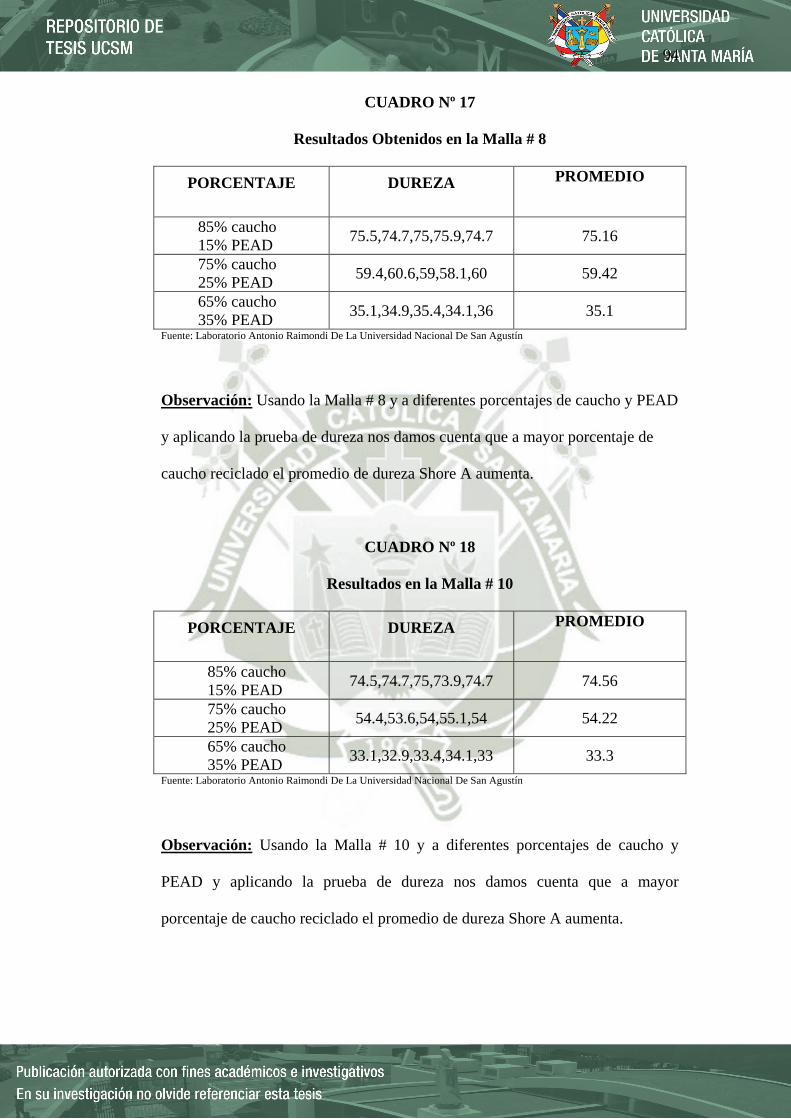
94
CUADRO Nº 17
Resultados Obtenidos en la Malla # 8
PORCENTAJE DUREZA PROMEDIO
85% caucho 15% PEAD 75.5,74.7,75,75.9,74.7 75.16
75% caucho 25% PEAD 59.4,60.6,59,58.1,60 59.42
65% caucho 35% PEAD 35.1,34.9,35.4,34.1,36 35.1
Fuente: Laboratorio Antonio Raimondi De La Universidad Nacional De San Agustín
Observación: Usando la Malla # 8 y a diferentes porcentajes de caucho y PEAD
y aplicando la prueba de dureza nos damos cuenta que a mayor porcentaje de
caucho reciclado el promedio de dureza Shore A aumenta.
CUADRO Nº 18
Resultados en la Malla # 10
PORCENTAJE DUREZA PROMEDIO
85% caucho 15% PEAD 74.5,74.7,75,73.9,74.7 74.56
75% caucho 25% PEAD 54.4,53.6,54,55.1,54 54.22
65% caucho 35% PEAD 33.1,32.9,33.4,34.1,33 33.3
Fuente: Laboratorio Antonio Raimondi De La Universidad Nacional De San Agustín
Observación: Usando la Malla # 10 y a diferentes porcentajes de caucho y
PEAD y aplicando la prueba de dureza nos damos cuenta que a mayor
porcentaje de caucho reciclado el promedio de dureza Shore A aumenta.
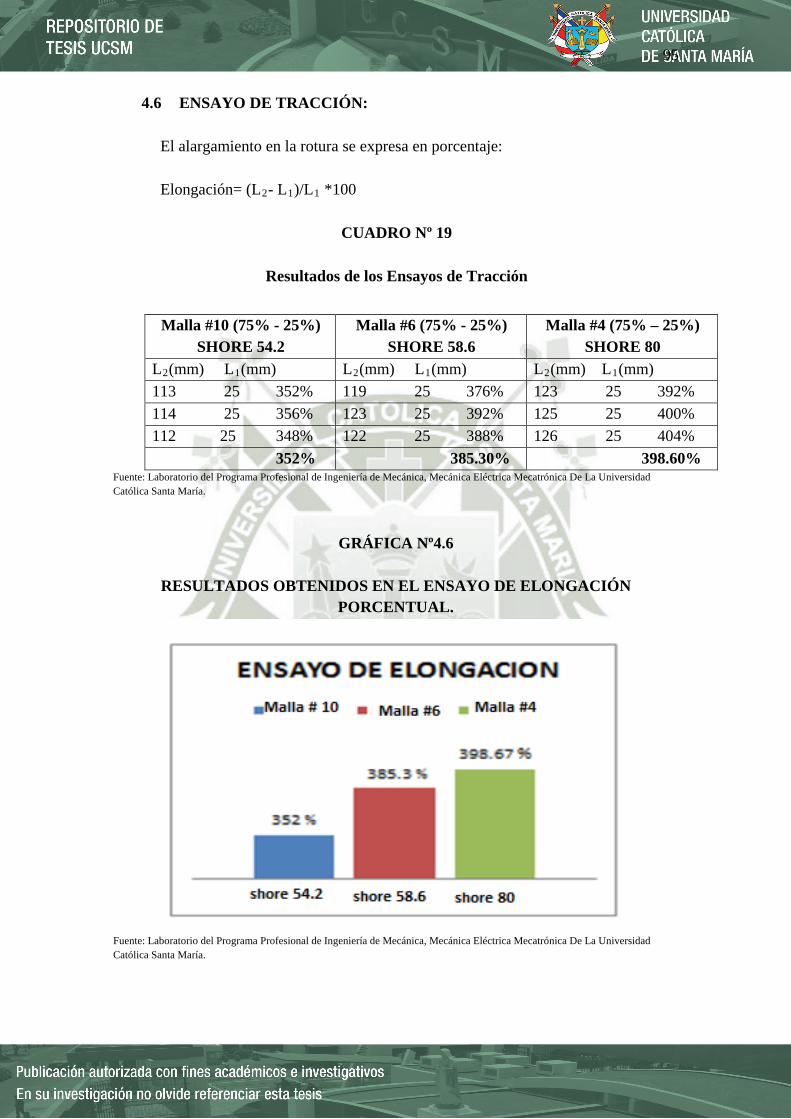
95
4.6 ENSAYO DE TRACCIÓN:
El alargamiento en la rotura se expresa en porcentaje: Elongación= (L2- L1)/L1 *100
CUADRO Nº 19
Resultados de los Ensayos de Tracción
Fuente: Laboratorio del Programa Profesional de Ingeniería de Mecánica, Mecánica Eléctrica Mecatrónica De La Universidad Católica Santa María.
GRÁFICA Nº4.6
RESULTADOS OBTENIDOS EN EL ENSAYO DE ELONGACIÓN PORCENTUAL.
Fuente: Laboratorio del Programa Profesional de Ingeniería de Mecánica, Mecánica Eléctrica Mecatrónica De La Universidad Católica Santa María.
Malla #10 (75% - 25%) SHORE 54.2
Malla #6 (75% - 25%) SHORE 58.6
Malla #4 (75% – 25%) SHORE 80
L2(mm) L1(mm) L2(mm) L1(mm) L2(mm) L1(mm) 113 25 352% 119 25 376% 123 25 392% 114 25 356% 123 25 392% 125 25 400% 112 25 348% 122 25 388% 126 25 404% 352% 385.30% 398.60%

96
GRAFICASDEFUERZA - DEFORMACIÓN:
GRAFICA Nº 4.7 Grafica Curva de Fuerza-Deformación en Shore 54.2
Fuente: Laboratorio del Programa Profesional de Ingeniería de Mecánica, Mecánica Eléctrica Mecatrónica De La Universidad Católica Santa María.
GRAFICA Nº 4.8
Grafica Curva De Fuerza-Deformación En Shore 58.6
Fuente: Laboratorio del Programa Profesional de Ingeniería de Mecánica, Mecánica Eléctrica Mecatrónica De La Universidad Católica Santa María.
54.2
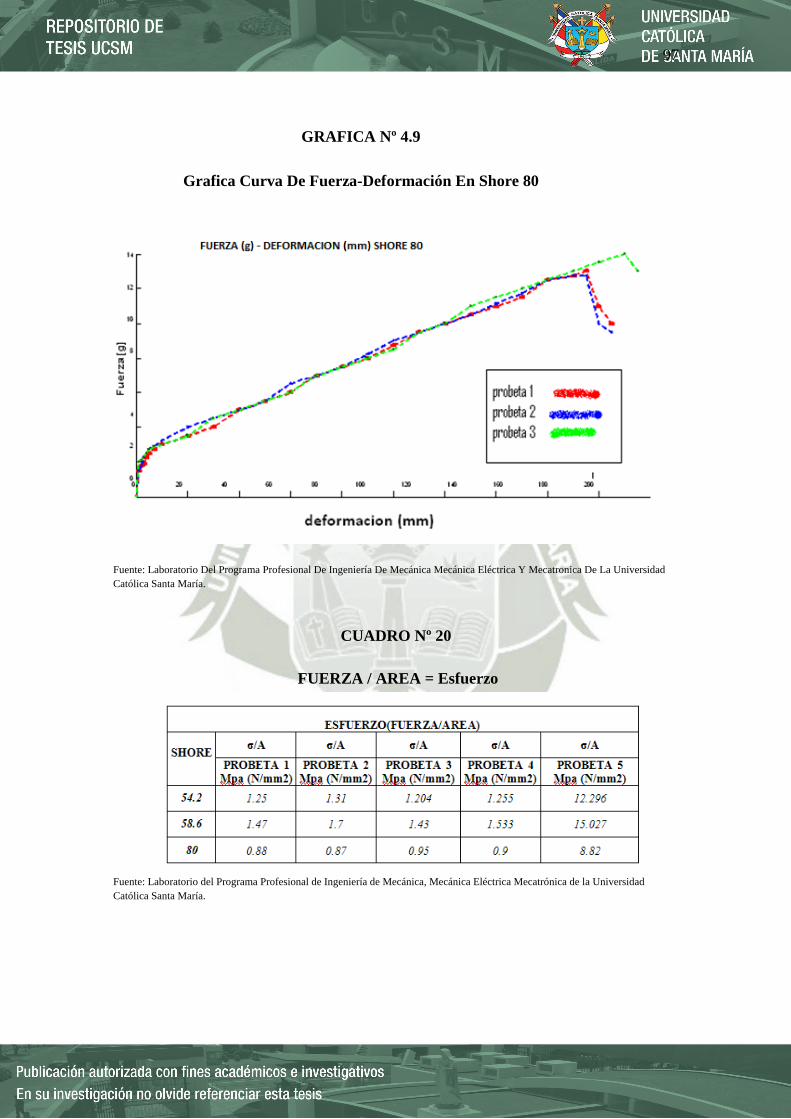
97
GRAFICA Nº 4.9
Grafica Curva De Fuerza-Deformación En Shore 80
Fuente: Laboratorio Del Programa Profesional De Ingeniería De Mecánica Mecánica Eléctrica Y Mecatronica De La Universidad Católica Santa María.
CUADRO Nº 20
FUERZA / AREA = Esfuerzo
Fuente: Laboratorio del Programa Profesional de Ingeniería de Mecánica, Mecánica Eléctrica Mecatrónica de la Universidad Católica Santa María.

98
GRAFICA N° 4.10
Fuente: Laboratorio del Programa Profesional de Ingeniería de Mecánica, Mecánica Eléctrica Mecatrónica de la Universidad Católica Santa María.
4.7.COMPARACION DE RESULTADOS:
4.7.1 PAVIMENTOS TRADICIONALES
Tradicionalmente las áreas de juegos para niños las constituían las propias
calles cuyo pavimento era la tierra compactada. Su dureza hace que se
empiecen a utilizar otros materiales que de forma intuitiva y por la práctica,
parecía que podían absorber mejor los golpes.
• DEFICIENCIAS
Este tipo de pavimento presenta una serie de problemas tales como:
- La absorción de impactos por caídas es insuficiente.
- La accesibilidad para dispositivos con ruedas (sillas adaptadas,
carritos de bebé) queda comprometida.
99
- Los elementos del pavimento pueden ser utilizados como armas
arrojadizas, pudiendo causar daños entre los niños.
- El mantenimiento y la limpieza son muy complicados por las
razones expuestas con anterioridad.
- Elevado coste.
- La dificultad de extracción de los materiales que constituyen el
pavimento, pues el uso de las graveras de ríos y playas está muy
limitado, hay pocas concesiones por parte de la Administración y
la obtención de éstas exigen estudios de Impacto Ambiental que
las avalen.
De igual forma y a pesar de amortiguar en parte la caída de los niños,
incumplen normas de seguridad tales como la Norma UNE-EN 1177.
“Revestimientos de las superficies de las áreas de juego absorbentes
de impactos. Requisitos generales de seguridad y métodos de ensayo”
4.7.2 PAVIMENTOS BLANDOS RECICLADOS
Se trata de un pavimento constituido por una mezcla de grano de caucho
tipo SBR procedente del reciclado de neumáticos y HDPE de granulometría
1-6 mm.
El espesor es variable dependiendo de la HIC (Altura Crítica de Caída), con
una capa superficial de terminación de 10 mm de espesor quees mezcla de
grano de caucho de EPDM de color, con granulometría 1-4 mm.
• Ventajas:
- Elevada amortiguación y absorción de impactos Son
antideslizantes.
- Aislamiento térmico y acústico.
- Fácil mantenimiento.
- No inflamable/ ni tóxico.
- No tiene juntas.
- Bajo coste.
- Se puede reforzar y adaptar a nuevas situaciones de juego, como
la instalación de elementos con altura de caída superior.

100
- Admite prácticamente cualquier diseño, por lo que la capacidad
de accesibilidad es mayor.
- Mejor adaptación al terreno, se pueden crear suaves ondulaciones
y recubrirlas con este material.
• Desventajas:
- Su instalación necesita especialistas y su acabado depende de una
buena ejecución.

101
CAPITULO V
COSTOS de EQUIPOS
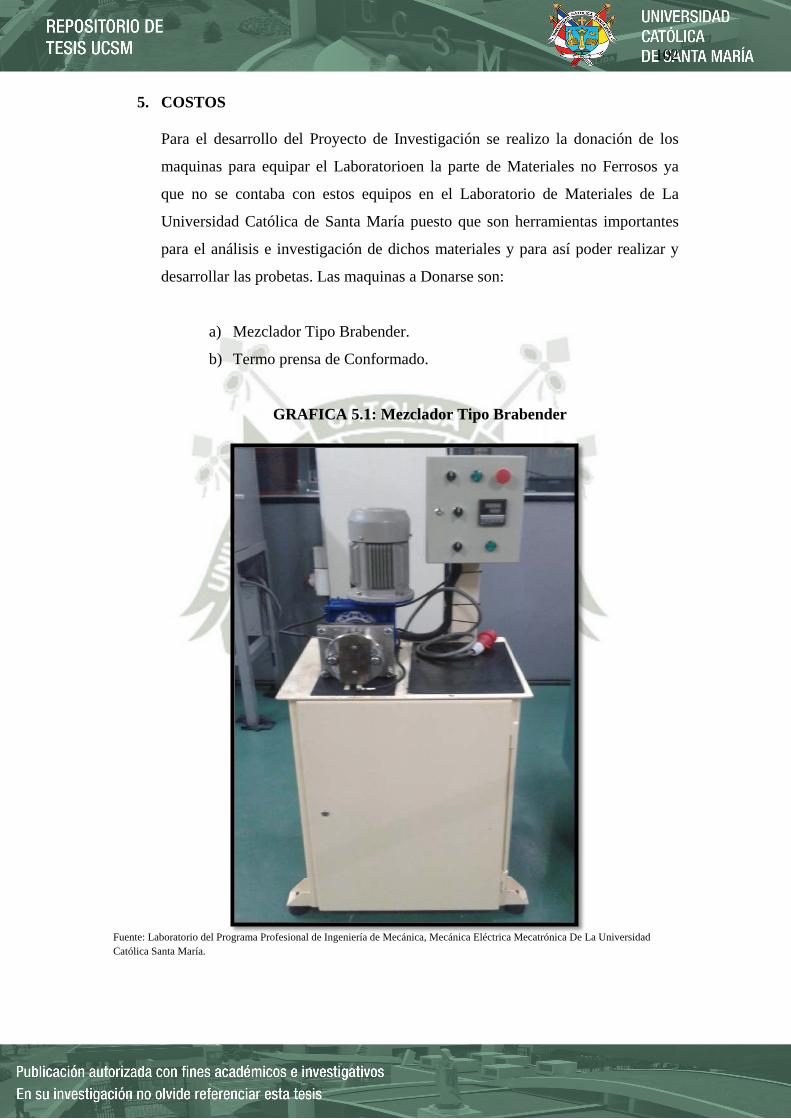
102
5. COSTOS Para el desarrollo del Proyecto de Investigación se realizo la donación de los
maquinas para equipar el Laboratorioen la parte de Materiales no Ferrosos ya
que no se contaba con estos equipos en el Laboratorio de Materiales de La
Universidad Católica de Santa María puesto que son herramientas importantes
para el análisis e investigación de dichos materiales y para así poder realizar y
desarrollar las probetas. Las maquinas a Donarse son:
a) Mezclador Tipo Brabender.
b) Termo prensa de Conformado.
GRAFICA 5.1: Mezclador Tipo Brabender
Fuente: Laboratorio del Programa Profesional de Ingeniería de Mecánica, Mecánica Eléctrica Mecatrónica De La Universidad Católica Santa María.

103
GRAFICO 5.2:
TERMO PRENSA DE CONFORMADO
Fuente: Laboratorio del Programa Profesional de Ingeniería de Mecánica, Mecánica Eléctrica Mecatrónica De La Universidad Católica Santa María.
Los costos de los equipos y de cada actividad realizada de los mismos están en
tiempo estándar y en tiempo óptimo. Ambos costos deben ser proporcionados
por las personas responsables de la ejecución.
Los costos se deben anotar en la matriz de información (Ver Cuadro Nº21 ).

104
CUADRO Nº 21:
MATRIZ DE COSTOS MAQUINA MEZCLADOR TIPO BRABENDER:
ITEM ACTIVIDADES CANTIDAD COSTO UNITARIO
COSTO TOTAL
ESTRUCTURA 1 Plancha de fierro de 1/8”. 1 300.00 300.00 2 Plancha de fierro de ¼”. 1 100.00 100.00 3 Tubo de cuadrado de 4”. 1 50.00 50.00 4 Chapa de puerta. 1 10.00 10.00 5 Patas de caucho. 4 25.00 100.00 6 Eje para bisagra. 1 15.00 15.00 7 Servicio de corte, plegado, soldadura y armado. 400.00 400.00 8 Pintura. 100.00 100.00 SISTEMA MECÁNICO 9 Motorreductor. 1 2500.00 2500.00 10 Eje de 6”x 3” acero inox. 1 200.00 200.00 11 Disco de inox de 6” x ½”. 1 50.00 50.00 12 Eje de inox de 2”. 2 25.00 50.00 13 Plancha de inox 8” x 10”x 5/8”. 1 100.00 100.00 14 Pernos y turcas de acero inoxidable. 50.00 50.00 15 Acople de motor. 1 100.00 100.00 16 Caja reductora 1 entrada - 2 salidas. 1 300.00 300.00 17 Plancha de fierro negro de 8” x 10”x 5/8”. 1 50.00 50.00 18 Angulo de 2” x ¼”. 1 20.00 20.00 19 Servicio de maquinado. 2000.00 2000.00 SISTEMA ELÉCTRICO
20 Tablero de control. 1 500.00 500.00 21 Cables eléctricos. 1 200.00 200.00 22 Terminal de cable. 1 50.00 50.00 OTROS
23 Servicio de armado y ensamble. 800.00 800.00 TOTAL S/. 8,045.00
En el Cuadro Nº 21 se puede apreciar los costos de cada actividad realizada por el
fabricante presentándonos el costo real y total de las Maquinas que se donaron al
Laboratorio de Materiales de la Universidad Católica de Santa María.
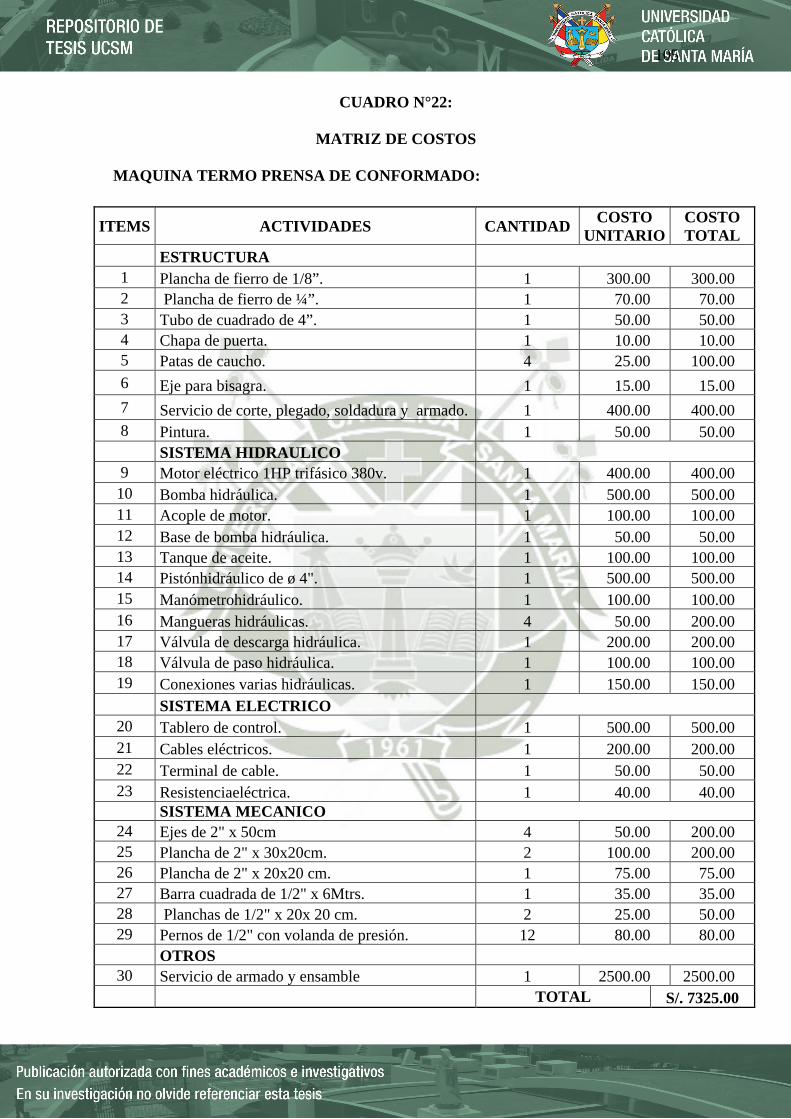
105
CUADRO N°22:
MATRIZ DE COSTOS MAQUINA TERMO PRENSA DE CONFORMADO:
ITEMS ACTIVIDADES CANTIDAD COSTO
UNITARIO COSTO TOTAL
ESTRUCTURA 1 Plancha de fierro de 1/8”. 1 300.00 300.00 2 Plancha de fierro de ¼”. 1 70.00 70.00 3 Tubo de cuadrado de 4”. 1 50.00 50.00 4 Chapa de puerta. 1 10.00 10.00 5 Patas de caucho. 4 25.00 100.00 6 Eje para bisagra. 1 15.00 15.00 7 Servicio de corte, plegado, soldadura y armado. 1 400.00 400.00 8 Pintura. 1 50.00 50.00
SISTEMA HIDRAULICO 9 Motor eléctrico 1HP trifásico 380v. 1 400.00 400.00
10 Bomba hidráulica. 1 500.00 500.00 11 Acople de motor. 1 100.00 100.00 12 Base de bomba hidráulica. 1 50.00 50.00 13 Tanque de aceite. 1 100.00 100.00 14 Pistónhidráulico de ø 4". 1 500.00 500.00 15 Manómetrohidráulico. 1 100.00 100.00 16 Mangueras hidráulicas. 4 50.00 200.00 17 Válvula de descarga hidráulica. 1 200.00 200.00 18 Válvula de paso hidráulica. 1 100.00 100.00 19 Conexiones varias hidráulicas. 1 150.00 150.00
SISTEMA ELECTRICO 20 Tablero de control. 1 500.00 500.00
21 Cables eléctricos. 1 200.00 200.00 22 Terminal de cable. 1 50.00 50.00 23 Resistenciaeléctrica. 1 40.00 40.00
SISTEMA MECANICO 24 Ejes de 2" x 50cm 4 50.00 200.00 25 Plancha de 2" x 30x20cm. 2 100.00 200.00 26 Plancha de 2" x 20x20 cm. 1 75.00 75.00 27 Barra cuadrada de 1/2" x 6Mtrs. 1 35.00 35.00 28 Planchas de 1/2" x 20x 20 cm. 2 25.00 50.00 29 Pernos de 1/2" con volanda de presión. 12 80.00 80.00
OTROS 30 Servicio de armado y ensamble 1 2500.00 2500.00
TOTAL S/. 7325.00

106
COSTO TOTAL
ITEMS ACTIVIDADES COSTO
UNITARIO COSTO TOTAL
1 Maquina Mezclador Tipo Brabender. 6695.00 8,045.00 2 Maquina Termo Prensa de Conformado. 5670.00 7,325.00
I.G.V. (18%) 2766.60
COSTO TOTAL S/. 18,136.60

107
CONCLUSIONES
• Después de ensayar varias combinaciones de caucho y polietileno se comprobó
que 85 % de caucho mas el 15 % de polietileno y con Malla N° 4; es la mejor
combinación de mezcla para nuestro pavimento blando según lo realizado en
el Proyecto de Investigación.
• Con este estudio contribuimos a la reducción de los residuos sólidos, pues
estamos reutilizando productos desechados, como son el polietileno de alta
densidad como las bolsas de plástico y el caucho proveniente de las llantas de
nuestro parque automotor.
• A los pavimentos obtenidos podemos agregar color, forma, dependiendo del
diseño del productor, agregándole mayor valor comercial, mejorando las
utilidades de su producción.
• Al usar material reciclado disminuimos el costo de este producto en casi cerca a
un 50% y vemos la importancia y el valor que podemos sacar de estos tipos de
materiales desechados.
• En la producción del pavimento para zonas recreacionales, no utilizamos ningún
tipo de contaminantes o soluciones que contaminan nuestro medio ambiente,
todo por el contrario es una técnica limpia y el producto terminado puede ser
reutilizado para la producción de más pavimentos blandos.
108
RECOMENDACIONES
• Se recomienda hacer ensayos de Desgaste y Abrasión según normas ASTM
D2228 y ASTM D5963.
• Se recomienda hacer pruebas de permeabilidad para ver su comportamiento
frente a climas adversos.
• Se recomienda hacer ensayos de Envejecimiento Acelerado según normas
ASTM D573 y ASTM D1349.
• Se recomienda una mejor implementación en laboratorios el cual mejoraría
enormemente los resultados generando más seguridad en las acciones a realizar.
• Se recomienda evitar el reaprovechamiento energéticamente de los neumáticos
desechados como combustible alternativo, dentro de las ladrilleras de la ciudad,
sustituyendo parcialmente en sus hornos a los combustibles primarios fósiles
(coque de petróleo, carbón, fuel-oíl, etc.). por ser altamente contaminante
• Se recomienda seguir estudiando con granulometrías para elaborar mezclas,
tanto con más plásticos o mezclas con caucho virgen para analizar sus nuevas
propiedades, de los nuevos pavimentos.
• Se recomienda hacer nuevas mezclas con diferentes plásticos, para tener nuevos
pavimentos.
• Se recomienda hacer mezclas con caucho virgen, para pavimentos u otras
aplicaciones.

109
BIBLIOGRAFÍA
[1] S.L. Aggarwal V. (Editor) “Comprehensive Polymer Science”, V7. Pergamon Press
(1987).
[2] Tratamiento Modern de las industrias del caucho, 2da. Edicion ampliada 1963.
[3] M. Grayson (Editor) “Encyclopedia of Composite Materials and Components”,
Wiley & Sons, 1983.
[4] W.F. Gum, W. Riese y H. Ulrich (Editores) “Reaction Polymers”, Hanser, 1992.
[5] C. Bolton, 12 ins. 13/2/89 43 DI-6277-6E Lantorine, Technical Information, 1989.
[6] E. Signorelli; Kunststoffe, 78, No 3, 227(1988).
[7] R.C. Talbot, Chemical Engineering, October 29, P76 (1984).
[8] Rubber Chemistry and Technology 1970.
[9] C.F. Jasso-Gastinel, T. Hernández, M.A. Salas y J. Covarrubias, International
Symposium on Poly condensation (IUPAC) Paris, B16, 177 (1996).
[10] Cappelletti J. Enrique, Mecánica de Taller – Materiales Metrología I, 1988,
Editorial Monterrico S.A. Peru.
[11] C.F. Jasso, y O. Laguna-Castellanos en “Polymeric Materials Encyclopedia”, J.C.
Salamone (Editor). CRC Press Inc. V.11, 8476 (1996).
[12] P.J. Roe y M.P. Ansell, J. Materials Sci., 20, 4015 (1985)
[13] P. Zadorecki y A.J. Mitchell, Polymer Composites 10, 66 (1989)
[14] R.T. Woodhams, G. Thomas y D.K. Rodgers, Polym. Eng. Sci., 31, 1358 (1991).
[15] Ing. Esteban Friedeenthal, Tecnología de plásticos, Editorial Gustavo Gill, S.A.
Barcelona – España, 1973.
[16] G. Canché-Escamilla, G. Rodríguez-Trujillo, P.J. Herrera-Franco, E. Mendizábal y
J.Puig. J. Appl. Polym. Sci., 66, 339 (1997).
[17] N.G. Gaylord US Pat. 3,645,939: 29 Feb. 1972 (to US Plywood Champion Paper
Inc.).
[18] J.A.Brydson, “Plastics Materials”, editorial Butterworth, Cuarta Edicion 1982.
[19] Hellerich, Harsch, Haenle, “Guía de materiales plásticos, propiedades, ensayos y
parámetros” editorial Hansen, Barcelona, 1992.
[20] Silvia Illescas Fernández, « Curso DMTA: Principios y Aplicaciones », Centre
Catalá del Plastic, Mayo 2008.

110
[21] Miroslaw Pluta, Zbigniew Bartczak, “Phase Structure and Viscoelastic Properties
of compatibilized blends of PET and HDPE recyclates”, Poland, Italy, accepted
February 2005.
[22] A.F.Yee, J.Mater.Sci, 757 (1977).
[23] M.-P.LEE, A.Hiltner, E.BAER, “Fractography of Injection Molded Polycarbonate
Acrylonitrile-Butadiene-Styrene Terpolymer Blends”, Department of
Macromolecular Science and Center for applied Polymer Research Case Western
Reserve University Cleverland, Ohio, 1992
[24] J.I. Kim, S.H. Ryu, Y.W. Chang; “Mechanical and dynamic mechanical properties
of waste rubber powder/HDPE composite”. Journal of Applied Polymer Science 77,
2595-2602, 2000.
[25] R.J. Sanderson, A. Crosky; “Tyre crumb and milk jug HDPE RIM composite”.
School of Materials Science & Engineering.The University of New South Wales,
Sydney NSW 2052, Australia.
[26] X. Colom, F. Carrillo, F.J. Cañavate; “Composites Reinforced with Reused Tyres:
Surface Oxidant Treatment to Improve the Interfacial Compatibility”. European
Polymer Journal 42, 2369-2378, 2006.
[27] Cardillo, Marco Antonio (Octubre- Diciembre 1995), Nuevas tecnologías en
laIndustria del Caucho, Lima.
[28] Carranza, N. R. (2002), Tecnología del Caucho, Universidad Nacional del
Callao,pp. 195-202, Callao.
[29] Friedenthal, E. (setiembre 1993). Curso de capacitación Industria y Tecnología del
caucho, Universidad de Lima, pp. 1-74, Lima.
[30] Montgomery, D. (2002), Análisis y Diseño de Experimentos, Editorial LIMUSA,
S.A., Balderas 95, México D.F.
[31] Myers, R. and Montgomery, D. (1995), Response surface methodology: Process
and product optimization using designed experiments, John Wiley & Sons, pp.
624-637, Canadá.
[32] Nauton W. J. S (1967), Ciencia y Tecnología del Caucho, Compañía Editorial
Continental S.A., Calzada de Tlalpan Num. 4620, México 22, D.F.
[33] Struktol Company of América (2006). Manual del Caucho, junio 2006 (Nº 3),
Brasil.Escalante, E. J. (2003), Seis Sigma: Metodología y Técnicas (pp. 17-25).
LIMUSA,Grupo Noriega Editores.

111
PAGINA WEB
[1] http://www.firestone.com.
[2] http://www.tut.fi/plastics/tyreschool/index.html.
[3] http://www.evrosoluciones.com.ar/pdfparawebdeproductos/PisosdeGoma.pdf.
[4] http://www.arkemagroup.com.
[5] http://es.wikipedia.org/wiki//polimeros.
[6] http://www.grade.org.pe/asp/brw_med1.asp?id=8388
[7] http://www.educared.edu.pe/estudiantes/geografia/tema3_2_2_1.asp.
[8] http://www.struktol.com.

112
ANEXOS
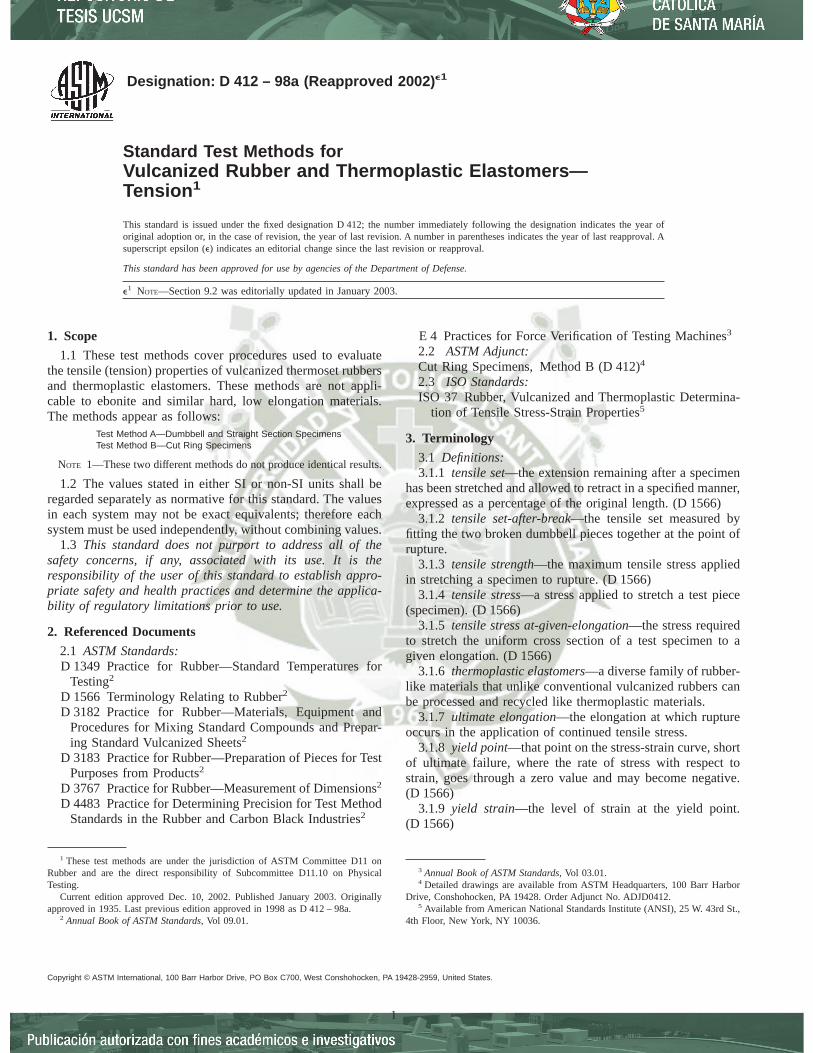
Designation: D 412 – 98a (Reapproved 2002) e1
Standard Test Methods forVulcanized Rubber and Thermoplastic Elastomers—Tension 1
This standard is issued under the fixed designation D 412; the number immediately following the designation indicates the year oforiginal adoption or, in the case of revision, the year of last revision. A number in parentheses indicates the year of last reapproval. Asuperscript epsilon (e) indicates an editorial change since the last revision or reapproval.
This standard has been approved for use by agencies of the Department of Defense.
e1 NOTE—Section 9.2 was editorially updated in January 2003.
1. Scope
1.1 These test methods cover procedures used to evaluatethe tensile (tension) properties of vulcanized thermoset rubbersand thermoplastic elastomers. These methods are not appli-cable to ebonite and similar hard, low elongation materials.The methods appear as follows:
Test Method A—Dumbbell and Straight Section SpecimensTest Method B—Cut Ring Specimens
NOTE 1—These two different methods do not produce identical results.
1.2 The values stated in either SI or non-SI units shall beregarded separately as normative for this standard. The valuesin each system may not be exact equivalents; therefore eachsystem must be used independently, without combining values.
1.3 This standard does not purport to address all of thesafety concerns, if any, associated with its use. It is theresponsibility of the user of this standard to establish appro-priate safety and health practices and determine the applica-bility of regulatory limitations prior to use.
2. Referenced Documents
2.1 ASTM Standards:D 1349 Practice for Rubber—Standard Temperatures for
Testing2
D 1566 Terminology Relating to Rubber2
D 3182 Practice for Rubber—Materials, Equipment andProcedures for Mixing Standard Compounds and Prepar-ing Standard Vulcanized Sheets2
D 3183 Practice for Rubber—Preparation of Pieces for TestPurposes from Products2
D 3767 Practice for Rubber—Measurement of Dimensions2
D 4483 Practice for Determining Precision for Test MethodStandards in the Rubber and Carbon Black Industries2
E 4 Practices for Force Verification of Testing Machines3
2.2 ASTM Adjunct:Cut Ring Specimens, Method B (D 412)4
2.3 ISO Standards:ISO 37 Rubber, Vulcanized and Thermoplastic Determina-
tion of Tensile Stress-Strain Properties5
3. Terminology
3.1 Definitions:3.1.1 tensile set—the extension remaining after a specimen
has been stretched and allowed to retract in a specified manner,expressed as a percentage of the original length. (D 1566)
3.1.2 tensile set-after-break—the tensile set measured byfitting the two broken dumbbell pieces together at the point ofrupture.
3.1.3 tensile strength—the maximum tensile stress appliedin stretching a specimen to rupture. (D 1566)
3.1.4 tensile stress—a stress applied to stretch a test piece(specimen). (D 1566)
3.1.5 tensile stress at-given-elongation—the stress requiredto stretch the uniform cross section of a test specimen to agiven elongation. (D 1566)
3.1.6 thermoplastic elastomers—a diverse family of rubber-like materials that unlike conventional vulcanized rubbers canbe processed and recycled like thermoplastic materials.
3.1.7 ultimate elongation—the elongation at which ruptureoccurs in the application of continued tensile stress.
3.1.8 yield point—that point on the stress-strain curve, shortof ultimate failure, where the rate of stress with respect tostrain, goes through a zero value and may become negative.(D 1566)
3.1.9 yield strain—the level of strain at the yield point.(D 1566)
1 These test methods are under the jurisdiction of ASTM Committee D11 onRubber and are the direct responsibility of Subcommittee D11.10 on PhysicalTesting.
Current edition approved Dec. 10, 2002. Published January 2003. Originallyapproved in 1935. Last previous edition approved in 1998 as D 412 – 98a.
2 Annual Book of ASTM Standards, Vol 09.01.
3 Annual Book of ASTM Standards, Vol 03.01.4 Detailed drawings are available from ASTM Headquarters, 100 Barr Harbor
Drive, Conshohocken, PA 19428. Order Adjunct No. ADJD0412.5 Available from American National Standards Institute (ANSI), 25 W. 43rd St.,
4th Floor, New York, NY 10036.
1
Copyright © ASTM International, 100 Barr Harbor Drive, PO Box C700, West Conshohocken, PA 19428-2959, United States.

3.1.10 yield stress—the level of stress at the yield point.(D 1566)
4. Summary of Test Method
4.1 The determination of tensile properties starts with testpieces taken from the sample material and includes thepreparation of the specimens and the testing of the specimens.Specimens may be in the shape of dumbbells, rings or straightpieces of uniform cross-sectional area.
4.2 Measurements for tensile stress, tensile stress at a givenelongation, tensile strength, yield point, and ultimate elonga-tion are made on specimens that have not been prestressed.Tensile stress, yield point, and tensile strength are based on theoriginal cross-sectional area of a uniform cross-section of thespecimen.
4.3 Measurement of tensile set is made after a previouslyunstressed specimen has been extended and allowed to retractby a prescribed procedure. Measurement of “set after break” isalso described.
5. Significance and Use
5.1 All materials and products covered by these test meth-ods must withstand tensile forces for adequate performance incertain applications. These test methods allow for the measure-ment of such tensile properties. However, tensile propertiesalone may not directly relate to the total end use performanceof the product because of the wide range of potential perfor-mance requirements in actual use.
5.2 Tensile properties depend both on the material and theconditions of test (extension rate, temperature, humidity, speci-men geometry, pretest conditioning, etc.); therefore materialsshould be compared only when tested under the same condi-tions.
5.3 Temperature and rate of extension may have substantialeffects on tensile properties and therefore should be controlled.These effects will vary depending on the type of material beingtested.
5.4 Tensile set represents residual deformation which ispartly permanent and partly recoverable after stretching andretraction. For this reason, the periods of extension andrecovery (and other conditions of test) must be controlled toobtain comparable results.
6. Apparatus
6.1 Testing Machine—Tension tests shall be made on apower driven machine equipped to produce a uniform rate ofgrip separation of 5006 50 mm/min (206 2 in./min) for adistance of at least 750 mm (30 in.) (see Note 1). The testingmachine shall have both a suitable dynamometer and anindicating or recording system for measuring the applied forcewithin 62 %. If the capacity range cannot be changed for a test(as in the case of pendulum dynamometers) the applied force atbreak shall be measured within62 % of the full scale value,and the smallest tensile force measured shall be accurate towithin 10 %. If the dynamometer is of the compensating typefor measuring tensile stress directly, means shall be provided toadjust for the cross-sectional area of the specimen. Theresponse of the recorder shall be sufficiently rapid that the
applied force is measured with the requisite accuracy duringthe extension of the specimen to rupture. If the testing machineis not equipped with a recorder, a device shall be provided thatindicates, after rupture, the maximum force applied duringextension. Testing machine systems shall be capable of mea-suring elongation of the test specimen in minimum incrementsof 10 %.
NOTE 2—A rate of elongation of 10006 100 mm/min (406 4 in./min)may be used and notation of the speed made in the report. In case ofdispute, the test shall be repeated and the rate of elongation shall be at 5006 50 mm/min (206 2 in./min).
6.2 Test Chamber for Elevated and Low Temperatures—Thetest chamber shall conform with the following requirements:
6.2.1 Air shall be circulated through the chamber at avelocity of 1 to 2 m/s (3.3 to 6.6 ft/s) at the location of the gripsor spindles and specimens maintained within 2°C (3.6°F) of thespecified temperature.
6.2.2 A calibrated sensing device shall be located near thegrips or spindles for measuring the actual temperature.
6.2.3 The chamber shall be vented to an exhaust system orto the outside atmosphere to remove fumes liberated at hightemperatures.
6.2.4 Provisions shall be made for suspending specimensvertically near the grips or spindles for conditioning prior totest. The specimens shall not touch each other or the sides ofthe chamber except for momentary contact when agitated bythe circulating air.
6.2.5 Fast acting grips suitable for manipulation at high orlow temperatures may be provided to permit placing dumbbellsor straight specimens in the grips in the shortest time possibleto minimize any change in temperature of the chamber.
6.2.6 The dynamometer shall be suitable for use at thetemperature of test or it shall be thermally insulated from thechamber.
6.2.7 Provision shall be made for measuring the elongationof specimens in the chamber. If a scale is used to measure theextension between the bench-marks, the scale shall be locatedparallel and close to the grip path during specimen extensionand shall be controlled from outside the chamber.
6.3 Dial Micrometer—The dial micrometer shall conform tothe requirements of Practice D 3767 (Method A). For ringspecimens, see 14.10 of these test methods.
6.4 Apparatus for Tensile Set Test—The testing machinedescribed in 6.1 or an apparatus similar to that shown in Fig. 1may be used. A stop watch or other suitable timing devicemeasuring in minute intervals for at least 30 min, shall beprovided. A scale or other device shall be provided formeasuring tensile set to within 1 %.
7. Selection of Test Specimens
7.1 Consider the following information in making selec-tions:
7.1.1 Since anisotropy or grain directionality due to flowintroduced during processing and preparation may have aninfluence on tensile properties, dumbbell or straight specimensshould be cut so the lengthwise direction of the specimen is
D 412 – 98a (2002)e1
2
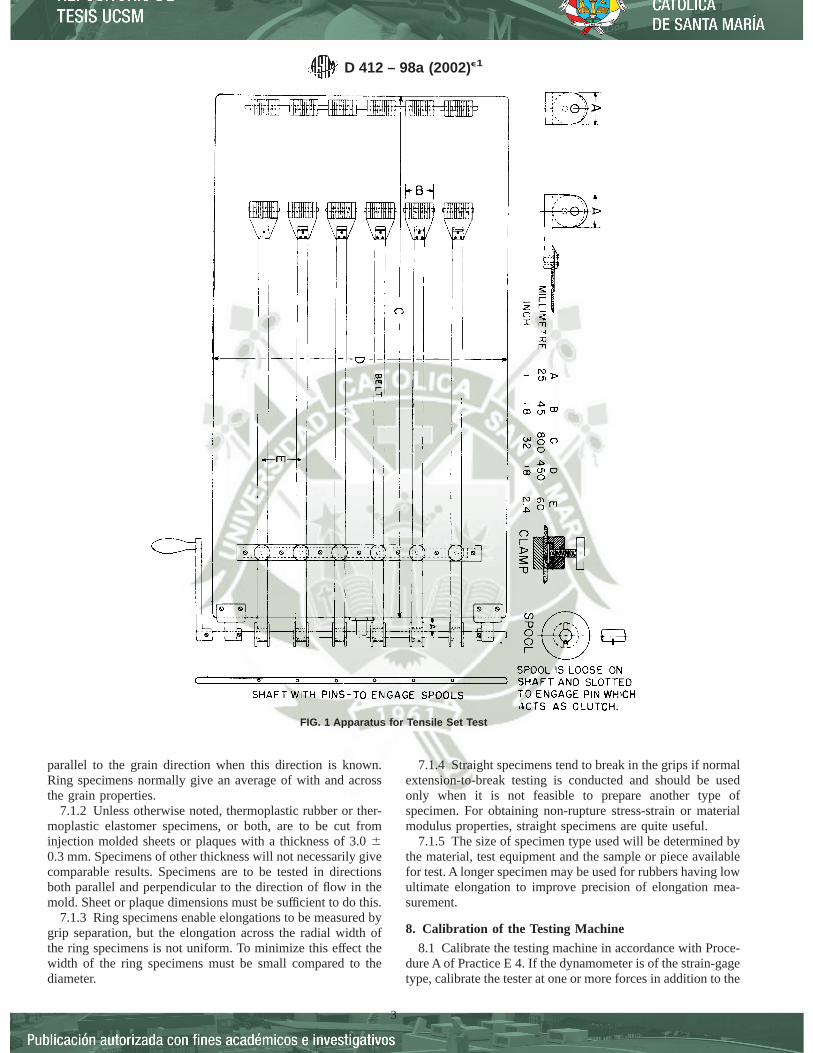
parallel to the grain direction when this direction is known.Ring specimens normally give an average of with and acrossthe grain properties.
7.1.2 Unless otherwise noted, thermoplastic rubber or ther-moplastic elastomer specimens, or both, are to be cut frominjection molded sheets or plaques with a thickness of 3.060.3 mm. Specimens of other thickness will not necessarily givecomparable results. Specimens are to be tested in directionsboth parallel and perpendicular to the direction of flow in themold. Sheet or plaque dimensions must be sufficient to do this.
7.1.3 Ring specimens enable elongations to be measured bygrip separation, but the elongation across the radial width ofthe ring specimens is not uniform. To minimize this effect thewidth of the ring specimens must be small compared to thediameter.
7.1.4 Straight specimens tend to break in the grips if normalextension-to-break testing is conducted and should be usedonly when it is not feasible to prepare another type ofspecimen. For obtaining non-rupture stress-strain or materialmodulus properties, straight specimens are quite useful.
7.1.5 The size of specimen type used will be determined bythe material, test equipment and the sample or piece availablefor test. A longer specimen may be used for rubbers having lowultimate elongation to improve precision of elongation mea-surement.
8. Calibration of the Testing Machine
8.1 Calibrate the testing machine in accordance with Proce-dure A of Practice E 4. If the dynamometer is of the strain-gagetype, calibrate the tester at one or more forces in addition to the
FIG. 1 Apparatus for Tensile Set Test
D 412 – 98a (2002)e1
3
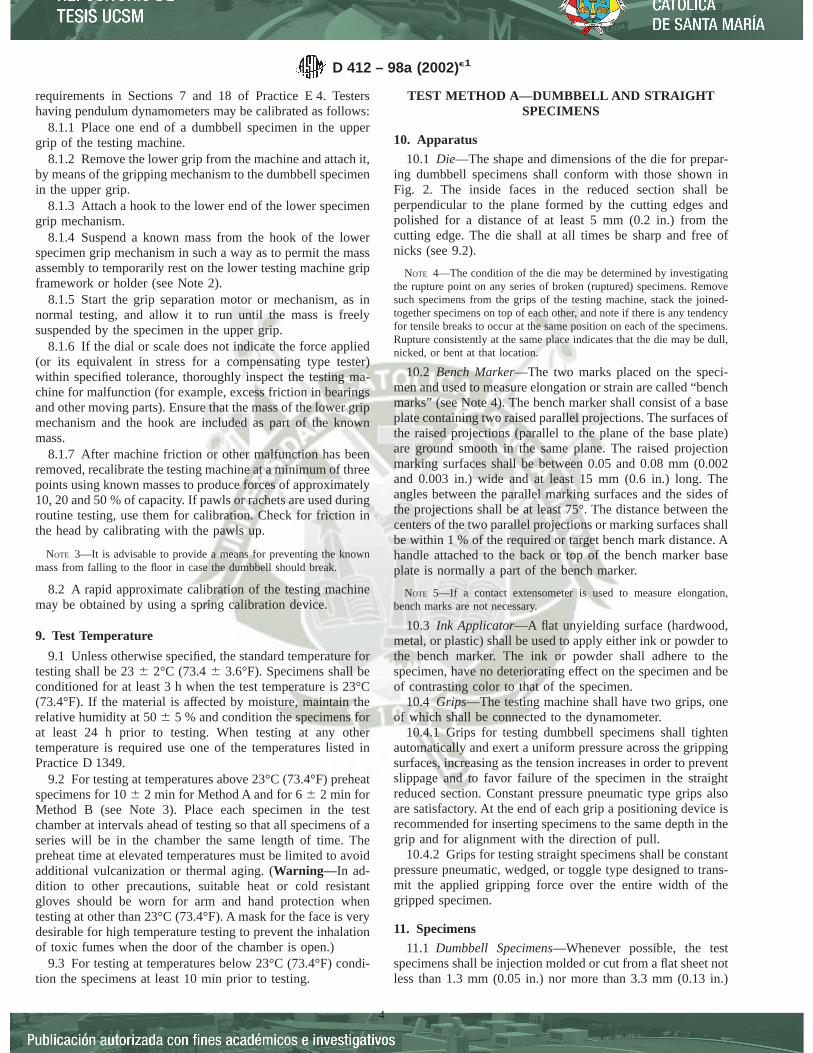
requirements in Sections 7 and 18 of Practice E 4. Testershaving pendulum dynamometers may be calibrated as follows:
8.1.1 Place one end of a dumbbell specimen in the uppergrip of the testing machine.
8.1.2 Remove the lower grip from the machine and attach it,by means of the gripping mechanism to the dumbbell specimenin the upper grip.
8.1.3 Attach a hook to the lower end of the lower specimengrip mechanism.
8.1.4 Suspend a known mass from the hook of the lowerspecimen grip mechanism in such a way as to permit the massassembly to temporarily rest on the lower testing machine gripframework or holder (see Note 2).
8.1.5 Start the grip separation motor or mechanism, as innormal testing, and allow it to run until the mass is freelysuspended by the specimen in the upper grip.
8.1.6 If the dial or scale does not indicate the force applied(or its equivalent in stress for a compensating type tester)within specified tolerance, thoroughly inspect the testing ma-chine for malfunction (for example, excess friction in bearingsand other moving parts). Ensure that the mass of the lower gripmechanism and the hook are included as part of the knownmass.
8.1.7 After machine friction or other malfunction has beenremoved, recalibrate the testing machine at a minimum of threepoints using known masses to produce forces of approximately10, 20 and 50 % of capacity. If pawls or rachets are used duringroutine testing, use them for calibration. Check for friction inthe head by calibrating with the pawls up.
NOTE 3—It is advisable to provide a means for preventing the knownmass from falling to the floor in case the dumbbell should break.
8.2 A rapid approximate calibration of the testing machinemay be obtained by using a spring calibration device.
9. Test Temperature
9.1 Unless otherwise specified, the standard temperature fortesting shall be 236 2°C (73.46 3.6°F). Specimens shall beconditioned for at least 3 h when the test temperature is 23°C(73.4°F). If the material is affected by moisture, maintain therelative humidity at 506 5 % and condition the specimens forat least 24 h prior to testing. When testing at any othertemperature is required use one of the temperatures listed inPractice D 1349.
9.2 For testing at temperatures above 23°C (73.4°F) preheatspecimens for 106 2 min for Method A and for 66 2 min forMethod B (see Note 3). Place each specimen in the testchamber at intervals ahead of testing so that all specimens of aseries will be in the chamber the same length of time. Thepreheat time at elevated temperatures must be limited to avoidadditional vulcanization or thermal aging. (Warning—In ad-dition to other precautions, suitable heat or cold resistantgloves should be worn for arm and hand protection whentesting at other than 23°C (73.4°F). A mask for the face is verydesirable for high temperature testing to prevent the inhalationof toxic fumes when the door of the chamber is open.)
9.3 For testing at temperatures below 23°C (73.4°F) condi-tion the specimens at least 10 min prior to testing.
TEST METHOD A—DUMBBELL AND STRAIGHTSPECIMENS
10. Apparatus
10.1 Die—The shape and dimensions of the die for prepar-ing dumbbell specimens shall conform with those shown inFig. 2. The inside faces in the reduced section shall beperpendicular to the plane formed by the cutting edges andpolished for a distance of at least 5 mm (0.2 in.) from thecutting edge. The die shall at all times be sharp and free ofnicks (see 9.2).
NOTE 4—The condition of the die may be determined by investigatingthe rupture point on any series of broken (ruptured) specimens. Removesuch specimens from the grips of the testing machine, stack the joined-together specimens on top of each other, and note if there is any tendencyfor tensile breaks to occur at the same position on each of the specimens.Rupture consistently at the same place indicates that the die may be dull,nicked, or bent at that location.
10.2 Bench Marker—The two marks placed on the speci-men and used to measure elongation or strain are called “benchmarks” (see Note 4). The bench marker shall consist of a baseplate containing two raised parallel projections. The surfaces ofthe raised projections (parallel to the plane of the base plate)are ground smooth in the same plane. The raised projectionmarking surfaces shall be between 0.05 and 0.08 mm (0.002and 0.003 in.) wide and at least 15 mm (0.6 in.) long. Theangles between the parallel marking surfaces and the sides ofthe projections shall be at least 75°. The distance between thecenters of the two parallel projections or marking surfaces shallbe within 1 % of the required or target bench mark distance. Ahandle attached to the back or top of the bench marker baseplate is normally a part of the bench marker.
NOTE 5—If a contact extensometer is used to measure elongation,bench marks are not necessary.
10.3 Ink Applicator—A flat unyielding surface (hardwood,metal, or plastic) shall be used to apply either ink or powder tothe bench marker. The ink or powder shall adhere to thespecimen, have no deteriorating effect on the specimen and beof contrasting color to that of the specimen.
10.4 Grips—The testing machine shall have two grips, oneof which shall be connected to the dynamometer.
10.4.1 Grips for testing dumbbell specimens shall tightenautomatically and exert a uniform pressure across the grippingsurfaces, increasing as the tension increases in order to preventslippage and to favor failure of the specimen in the straightreduced section. Constant pressure pneumatic type grips alsoare satisfactory. At the end of each grip a positioning device isrecommended for inserting specimens to the same depth in thegrip and for alignment with the direction of pull.
10.4.2 Grips for testing straight specimens shall be constantpressure pneumatic, wedged, or toggle type designed to trans-mit the applied gripping force over the entire width of thegripped specimen.
11. Specimens
11.1 Dumbbell Specimens—Whenever possible, the testspecimens shall be injection molded or cut from a flat sheet notless than 1.3 mm (0.05 in.) nor more than 3.3 mm (0.13 in.)
D 412 – 98a (2002)e1
4
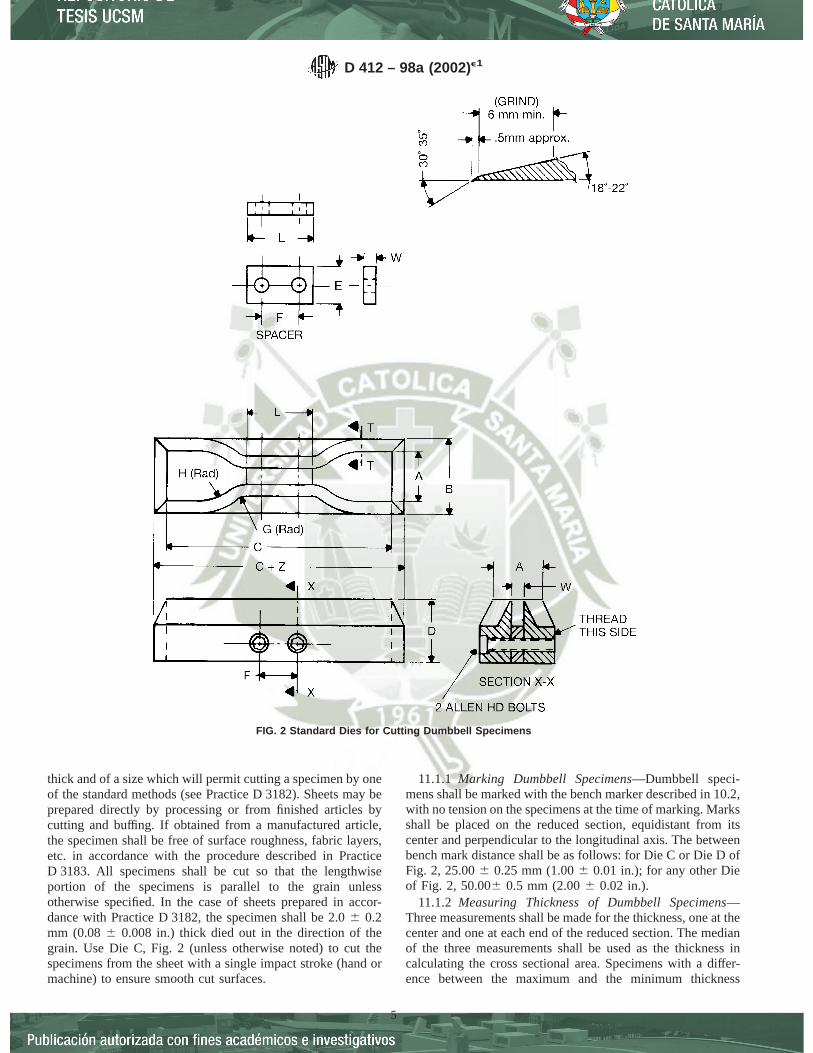
thick and of a size which will permit cutting a specimen by oneof the standard methods (see Practice D 3182). Sheets may beprepared directly by processing or from finished articles bycutting and buffing. If obtained from a manufactured article,the specimen shall be free of surface roughness, fabric layers,etc. in accordance with the procedure described in PracticeD 3183. All specimens shall be cut so that the lengthwiseportion of the specimens is parallel to the grain unlessotherwise specified. In the case of sheets prepared in accor-dance with Practice D 3182, the specimen shall be 2.06 0.2mm (0.086 0.008 in.) thick died out in the direction of thegrain. Use Die C, Fig. 2 (unless otherwise noted) to cut thespecimens from the sheet with a single impact stroke (hand ormachine) to ensure smooth cut surfaces.
11.1.1 Marking Dumbbell Specimens—Dumbbell speci-mens shall be marked with the bench marker described in 10.2,with no tension on the specimens at the time of marking. Marksshall be placed on the reduced section, equidistant from itscenter and perpendicular to the longitudinal axis. The betweenbench mark distance shall be as follows: for Die C or Die D ofFig. 2, 25.006 0.25 mm (1.006 0.01 in.); for any other Dieof Fig. 2, 50.0060.5 mm (2.006 0.02 in.).
11.1.2 Measuring Thickness of Dumbbell Specimens—Three measurements shall be made for the thickness, one at thecenter and one at each end of the reduced section. The medianof the three measurements shall be used as the thickness incalculating the cross sectional area. Specimens with a differ-ence between the maximum and the minimum thickness
FIG. 2 Standard Dies for Cutting Dumbbell Specimens
D 412 – 98a (2002)e1
5

exceeding 0.08 mm (0.003 in.), shall be discarded. The widthof the specimen shall be taken as the distance between thecutting edges of the die in the restricted section.
11.2 Straight Specimens—Straight specimens may be pre-pared if it is not practical to cut either a dumbbell or a ringspecimen as in the case of a narrow strip, small tubing ornarrow electrical insulation material. These specimens shall beof sufficient length to permit their insertion in the grips used forthe test. Bench marks shall be placed on the specimens asdescribed for dumbbell specimens in 11.1.1. To determine thecross sectional area of straight specimens in the form of tubes,the mass, length, and density of the specimen may be required.The cross sectional area shall be calculated from these mea-surements as follows:
A 5 M/DL (1)
where:A = cross-sectional area, cm2,M = mass, g,D = density, g/cm3, andL = length, cm.
NOTE 6—A in square inches =A (cm2) 3 0.155.
12. Procedure
12.1 Determination of Tensile Stress, Tensile Strength andYield Point—Place the dumbbell or straight specimen in thegrips of the testing machine, using care to adjust the specimensymmetrically to distribute tension uniformly over the cross
section. This avoids complications that prevent the maximumstrength of the material from being evaluated. Unless otherwisespecified, the rate of grip separation shall be 5006 50 mm/min(20 6 2 in./min) (see Note 6). Start the machine and note thedistance between the bench marks, taking care to avoidparallax. Record the force at the elongation(s) specified for thetest and at the time of rupture. The elongation measurement ismade preferably through the use of an extensometer, anautographic mechanism or a spark mechanism. At rupture,measure and record the elongation to the nearest 10 %. SeeSection 13 for calculations.
NOTE 7—For materials having a yield point (yield strain) under 20 %elongation when tested at 5006 50 mm/min (206 2 in./min), the rate ofelongation shall be reduced to 506 5 mm/min (2.06 0.2 in./min). If thematerial still has a yield point (strain) under 20 % elongation, the rate shallbe reduced to 56 0.5 mm/min (0.26 0.002 in./min). The actual rate ofseparation shall be reported.
12.2 Determination of Tensile Set—Place the specimen inthe grips of the testing machine described in 6.1 or theapparatus shown in Fig. 1, and adjust symmetrically so as todistribute the tension uniformly over the cross section. Sepa-rate the grips at a rate of speed as uniformly as possible, thatrequires 15 s to reach the specified elongation. Hold thespecimen at the specified elongation for 10 min, releasequickly without allowing it to snap back and allow thespecimen to rest for 10 min. At the end of the 10 min restperiod, measure the distance between the bench marks to the
Dimensions of Standard Dumbbell DiesA (Metric Units)
Dimension Units Tolerance Die A Die B Die C Die D Die E Die F
A mm 61 25 25 25 16 16 16B mm max 40 40 40 30 30 30C mm min 140 140 115 100 125 125D mm 66B 32 32 32 32 32 32D-E mm 61 13 13 13 13 13 13F mm 62 38 38 19 19 38 38G mm 61 14 14 14 14 14 14H mm 62 25 25 25 16 16 16L mm 62 59 59 33 33 59 59W mm 60.05, –0.00 12 6 6 3 3 6Z mm 61 13 13 13 13 13 13
A Dies whose dimensions are expressed in metric units are not exactly the same as dies whose dimensions are expressed in U.S. customary units. Dies dimensionedin metric units are intended for use with apparatus calibrated in metric units.
B For dies used in clicking machines it is preferable that this tolerance be 60.5 mm.
FIG. 2 a (continued)
Dimensions of Standard Dumbbell DiesA (U.S. Customary Units)
Dimension Units Tolerance Die A Die B Die C Die D Die E Die F
A in. 60.04 1 1 1 0.62 0.62 0.62B in. max 1.6 1.6 1.6 1.2 1.2 1.2C in. min 5.5 5.5 4.5 4 5 5D in. 60.25B 1.25 1.25 1.25 1.25 1.25 1.25D-E in. 60.04 0.5 0.5 0.5 0.5 0.5 0.5F in. 60.08 1.5 1.5 0.75 0.75 1.5 1.5G in. 60.04 0.56 0.56 0.56 0.56 0.56 0.56H in. 60.08 1 1 1 0.63 0.63 0.63L in. 60.08 2.32 2.32 1.31 1.31 2.32 2.32W in. 60.002, –0.000 0.500 0.250 0.250 0.125 0.125 0.250Z in. 60.04 0.5 0.5 0.5 0.5 0.5 0.5
A Dies whose dimensions are expressed in metric units are not exactly the same as dies whose dimensions are expressed in U.S. customary units.B For dies used in clicking machines it is preferable that this tolerance by 60.02 in.
FIG. 2 b (continued)
D 412 – 98a (2002)e1
6
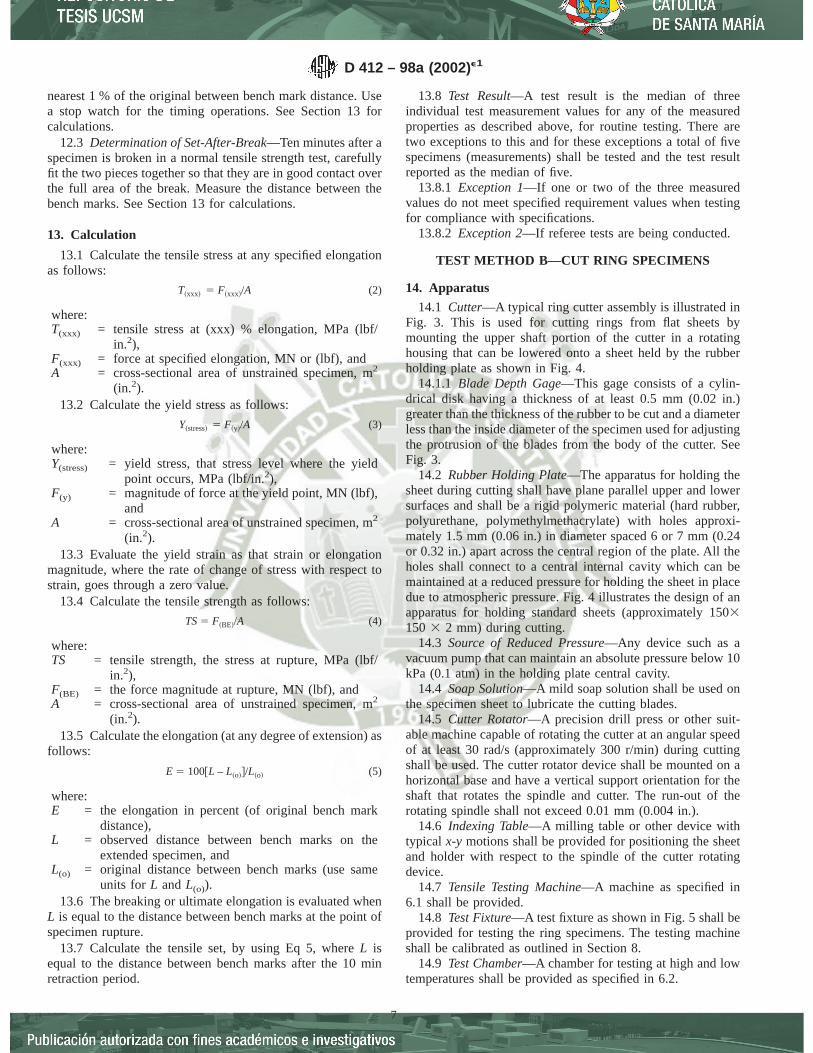
nearest 1 % of the original between bench mark distance. Usea stop watch for the timing operations. See Section 13 forcalculations.
12.3 Determination of Set-After-Break—Ten minutes after aspecimen is broken in a normal tensile strength test, carefullyfit the two pieces together so that they are in good contact overthe full area of the break. Measure the distance between thebench marks. See Section 13 for calculations.
13. Calculation
13.1 Calculate the tensile stress at any specified elongationas follows:
T~xxx! 5 F~xxx!/A (2)
where:T(xxx) = tensile stress at (xxx) % elongation, MPa (lbf/
in.2),F(xxx) = force at specified elongation, MN or (lbf), andA = cross-sectional area of unstrained specimen, m2
(in.2).13.2 Calculate the yield stress as follows:
Y~stress! 5 F~y!/A (3)
where:Y(stress) = yield stress, that stress level where the yield
point occurs, MPa (lbf/in.2),F(y) = magnitude of force at the yield point, MN (lbf),
andA = cross-sectional area of unstrained specimen, m2
(in.2).13.3 Evaluate the yield strain as that strain or elongation
magnitude, where the rate of change of stress with respect tostrain, goes through a zero value.
13.4 Calculate the tensile strength as follows:
TS5 F~BE!/A (4)
where:TS = tensile strength, the stress at rupture, MPa (lbf/
in.2),F(BE) = the force magnitude at rupture, MN (lbf), andA = cross-sectional area of unstrained specimen, m2
(in.2).13.5 Calculate the elongation (at any degree of extension) as
follows:
E 5 100@L – L~o!#/L~o! (5)
where:E = the elongation in percent (of original bench mark
distance),L = observed distance between bench marks on the
extended specimen, andL(o) = original distance between bench marks (use same
units for L andL(o)).13.6 The breaking or ultimate elongation is evaluated when
L is equal to the distance between bench marks at the point ofspecimen rupture.
13.7 Calculate the tensile set, by using Eq 5, whereL isequal to the distance between bench marks after the 10 minretraction period.
13.8 Test Result—A test result is the median of threeindividual test measurement values for any of the measuredproperties as described above, for routine testing. There aretwo exceptions to this and for these exceptions a total of fivespecimens (measurements) shall be tested and the test resultreported as the median of five.
13.8.1 Exception 1—If one or two of the three measuredvalues do not meet specified requirement values when testingfor compliance with specifications.
13.8.2 Exception 2—If referee tests are being conducted.
TEST METHOD B—CUT RING SPECIMENS
14. Apparatus
14.1 Cutter—A typical ring cutter assembly is illustrated inFig. 3. This is used for cutting rings from flat sheets bymounting the upper shaft portion of the cutter in a rotatinghousing that can be lowered onto a sheet held by the rubberholding plate as shown in Fig. 4.
14.1.1 Blade Depth Gage—This gage consists of a cylin-drical disk having a thickness of at least 0.5 mm (0.02 in.)greater than the thickness of the rubber to be cut and a diameterless than the inside diameter of the specimen used for adjustingthe protrusion of the blades from the body of the cutter. SeeFig. 3.
14.2 Rubber Holding Plate—The apparatus for holding thesheet during cutting shall have plane parallel upper and lowersurfaces and shall be a rigid polymeric material (hard rubber,polyurethane, polymethylmethacrylate) with holes approxi-mately 1.5 mm (0.06 in.) in diameter spaced 6 or 7 mm (0.24or 0.32 in.) apart across the central region of the plate. All theholes shall connect to a central internal cavity which can bemaintained at a reduced pressure for holding the sheet in placedue to atmospheric pressure. Fig. 4 illustrates the design of anapparatus for holding standard sheets (approximately 1503150 3 2 mm) during cutting.
14.3 Source of Reduced Pressure—Any device such as avacuum pump that can maintain an absolute pressure below 10kPa (0.1 atm) in the holding plate central cavity.
14.4 Soap Solution—A mild soap solution shall be used onthe specimen sheet to lubricate the cutting blades.
14.5 Cutter Rotator—A precision drill press or other suit-able machine capable of rotating the cutter at an angular speedof at least 30 rad/s (approximately 300 r/min) during cuttingshall be used. The cutter rotator device shall be mounted on ahorizontal base and have a vertical support orientation for theshaft that rotates the spindle and cutter. The run-out of therotating spindle shall not exceed 0.01 mm (0.004 in.).
14.6 Indexing Table—A milling table or other device withtypical x-y motions shall be provided for positioning the sheetand holder with respect to the spindle of the cutter rotatingdevice.
14.7 Tensile Testing Machine—A machine as specified in6.1 shall be provided.
14.8 Test Fixture—A test fixture as shown in Fig. 5 shall beprovided for testing the ring specimens. The testing machineshall be calibrated as outlined in Section 8.
14.9 Test Chamber—A chamber for testing at high and lowtemperatures shall be provided as specified in 6.2.
D 412 – 98a (2002)e1
7
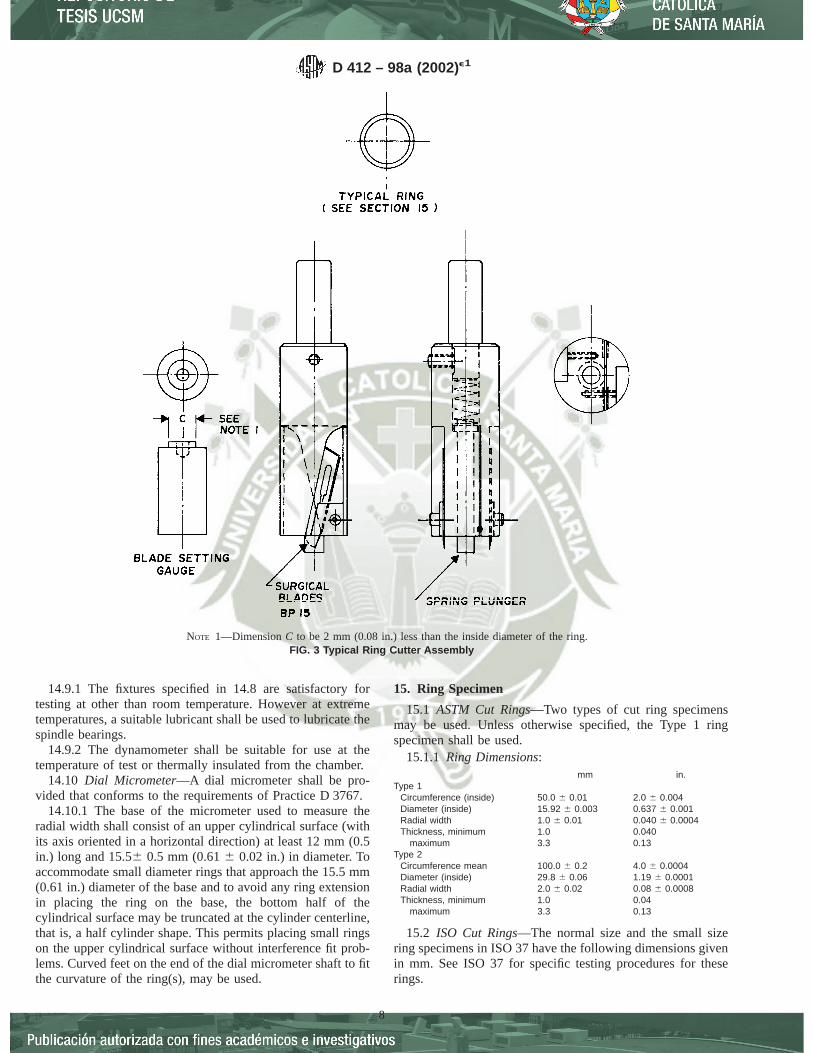
14.9.1 The fixtures specified in 14.8 are satisfactory fortesting at other than room temperature. However at extremetemperatures, a suitable lubricant shall be used to lubricate thespindle bearings.
14.9.2 The dynamometer shall be suitable for use at thetemperature of test or thermally insulated from the chamber.
14.10 Dial Micrometer—A dial micrometer shall be pro-vided that conforms to the requirements of Practice D 3767.
14.10.1 The base of the micrometer used to measure theradial width shall consist of an upper cylindrical surface (withits axis oriented in a horizontal direction) at least 12 mm (0.5in.) long and 15.56 0.5 mm (0.616 0.02 in.) in diameter. Toaccommodate small diameter rings that approach the 15.5 mm(0.61 in.) diameter of the base and to avoid any ring extensionin placing the ring on the base, the bottom half of thecylindrical surface may be truncated at the cylinder centerline,that is, a half cylinder shape. This permits placing small ringson the upper cylindrical surface without interference fit prob-lems. Curved feet on the end of the dial micrometer shaft to fitthe curvature of the ring(s), may be used.
15. Ring Specimen
15.1 ASTM Cut Rings—Two types of cut ring specimensmay be used. Unless otherwise specified, the Type 1 ringspecimen shall be used.
15.1.1 Ring Dimensions:mm in.
Type 1Circumference (inside) 50.0 6 0.01 2.0 6 0.004Diameter (inside) 15.92 6 0.003 0.637 6 0.001Radial width 1.0 6 0.01 0.040 6 0.0004Thickness, minimum 1.0 0.040
maximum 3.3 0.13Type 2
Circumference mean 100.0 6 0.2 4.0 6 0.0004Diameter (inside) 29.8 6 0.06 1.19 6 0.0001Radial width 2.0 6 0.02 0.08 6 0.0008Thickness, minimum 1.0 0.04
maximum 3.3 0.13
15.2 ISO Cut Rings—The normal size and the small sizering specimens in ISO 37 have the following dimensions givenin mm. See ISO 37 for specific testing procedures for theserings.
NOTE 1—DimensionC to be 2 mm (0.08 in.) less than the inside diameter of the ring.FIG. 3 Typical Ring Cutter Assembly
D 412 – 98a (2002)e1
8

Normal SmallDiameter, inside 44.6 6 0.2 mm 8.0 6 0.1 mmDiameter, outside 52.6 6 0.2 mm 10.0 6 0.1 mmThickness 4.0 6 0.2 mm 1.0 6 0.1 mm
15.3 Rings Cut from Tubing—The dimensions of the ringspecimen(s) depend on the diameter and wall thickness of thetubing and should be specified in the product specification.
15.4 Preparation of Cut Ring Specimens—Place the bladesin the slots of the cutter and adjust the blade depth using the
blade depth gage. Place the cutter in the drill press and adjustthe spindle or table so that the bottom of the blade holder isabout 13 mm (0.5 in.) above the surface of the holding plate.Set the stop on the vertical travel of the spindle so that the tipsof the cutting blades just penetrate the surface of the plate.Place the sheet on the holding plate and reduce the pressure inthe cavity to 10 kPa (0.1 atm) or less. Lubricate the sheet withmild soap solution. Lower the cutter at a steady rate until it
Dimension mm in. Dimension mm in.
A 178 7.0 F 19 0.75B 152 6.0 G 23 0.90C 89 3.5 H 1.5 0.062D 229 9.0E 6 0.25
FIG. 4 Rubber Holding Plate
FIG. 5 Assembly, Ring Tensile Test Fixture
D 412 – 98a (2002)e1
9
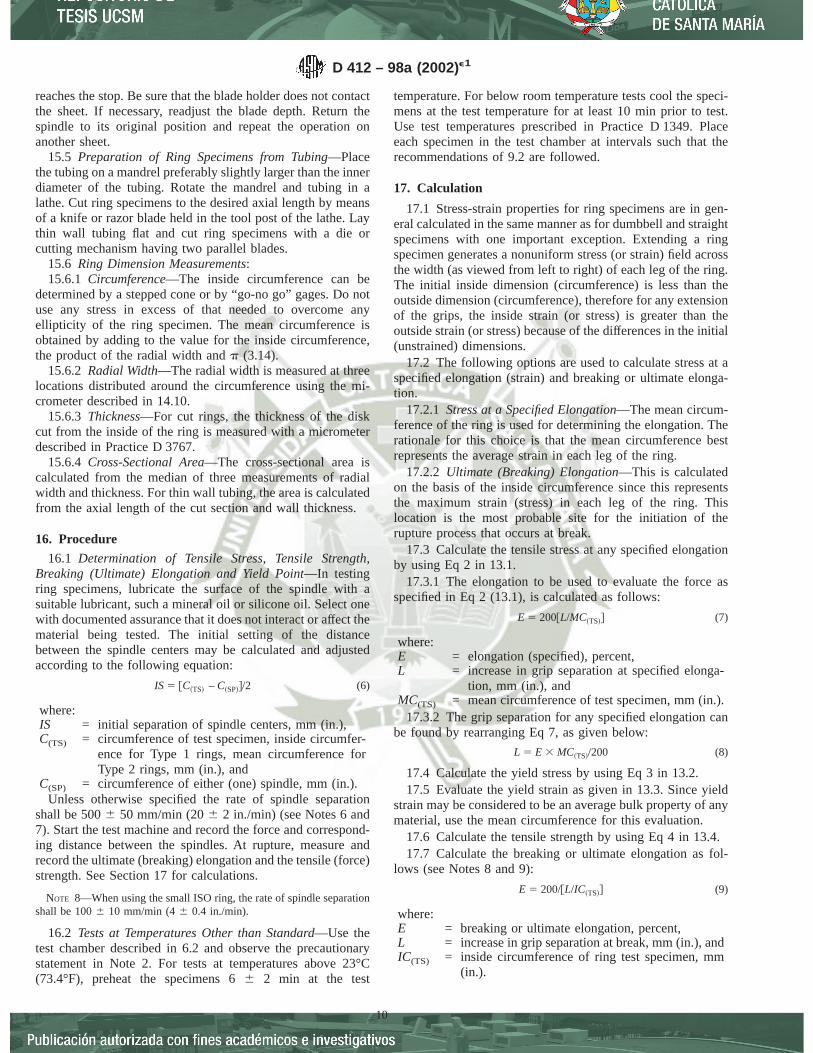
reaches the stop. Be sure that the blade holder does not contactthe sheet. If necessary, readjust the blade depth. Return thespindle to its original position and repeat the operation onanother sheet.
15.5 Preparation of Ring Specimens from Tubing—Placethe tubing on a mandrel preferably slightly larger than the innerdiameter of the tubing. Rotate the mandrel and tubing in alathe. Cut ring specimens to the desired axial length by meansof a knife or razor blade held in the tool post of the lathe. Laythin wall tubing flat and cut ring specimens with a die orcutting mechanism having two parallel blades.
15.6 Ring Dimension Measurements:15.6.1 Circumference—The inside circumference can be
determined by a stepped cone or by “go-no go” gages. Do notuse any stress in excess of that needed to overcome anyellipticity of the ring specimen. The mean circumference isobtained by adding to the value for the inside circumference,the product of the radial width andp (3.14).
15.6.2 Radial Width—The radial width is measured at threelocations distributed around the circumference using the mi-crometer described in 14.10.
15.6.3 Thickness—For cut rings, the thickness of the diskcut from the inside of the ring is measured with a micrometerdescribed in Practice D 3767.
15.6.4 Cross-Sectional Area—The cross-sectional area iscalculated from the median of three measurements of radialwidth and thickness. For thin wall tubing, the area is calculatedfrom the axial length of the cut section and wall thickness.
16. Procedure
16.1 Determination of Tensile Stress, Tensile Strength,Breaking (Ultimate) Elongation and Yield Point—In testingring specimens, lubricate the surface of the spindle with asuitable lubricant, such a mineral oil or silicone oil. Select onewith documented assurance that it does not interact or affect thematerial being tested. The initial setting of the distancebetween the spindle centers may be calculated and adjustedaccording to the following equation:
IS5 @C~TS! – C~SP!#/2 (6)
where:IS = initial separation of spindle centers, mm (in.),C(TS) = circumference of test specimen, inside circumfer-
ence for Type 1 rings, mean circumference forType 2 rings, mm (in.), and
C(SP) = circumference of either (one) spindle, mm (in.).Unless otherwise specified the rate of spindle separation
shall be 5006 50 mm/min (206 2 in./min) (see Notes 6 and7). Start the test machine and record the force and correspond-ing distance between the spindles. At rupture, measure andrecord the ultimate (breaking) elongation and the tensile (force)strength. See Section 17 for calculations.
NOTE 8—When using the small ISO ring, the rate of spindle separationshall be 1006 10 mm/min (46 0.4 in./min).
16.2 Tests at Temperatures Other than Standard—Use thetest chamber described in 6.2 and observe the precautionarystatement in Note 2. For tests at temperatures above 23°C(73.4°F), preheat the specimens 66 2 min at the test
temperature. For below room temperature tests cool the speci-mens at the test temperature for at least 10 min prior to test.Use test temperatures prescribed in Practice D 1349. Placeeach specimen in the test chamber at intervals such that therecommendations of 9.2 are followed.
17. Calculation
17.1 Stress-strain properties for ring specimens are in gen-eral calculated in the same manner as for dumbbell and straightspecimens with one important exception. Extending a ringspecimen generates a nonuniform stress (or strain) field acrossthe width (as viewed from left to right) of each leg of the ring.The initial inside dimension (circumference) is less than theoutside dimension (circumference), therefore for any extensionof the grips, the inside strain (or stress) is greater than theoutside strain (or stress) because of the differences in the initial(unstrained) dimensions.
17.2 The following options are used to calculate stress at aspecified elongation (strain) and breaking or ultimate elonga-tion.
17.2.1 Stress at a Specified Elongation—The mean circum-ference of the ring is used for determining the elongation. Therationale for this choice is that the mean circumference bestrepresents the average strain in each leg of the ring.
17.2.2 Ultimate (Breaking) Elongation—This is calculatedon the basis of the inside circumference since this representsthe maximum strain (stress) in each leg of the ring. Thislocation is the most probable site for the initiation of therupture process that occurs at break.
17.3 Calculate the tensile stress at any specified elongationby using Eq 2 in 13.1.
17.3.1 The elongation to be used to evaluate the force asspecified in Eq 2 (13.1), is calculated as follows:
E 5 200@L/MC~TS!# (7)
where:E = elongation (specified), percent,L = increase in grip separation at specified elonga-
tion, mm (in.), andMC(TS) = mean circumference of test specimen, mm (in.).
17.3.2 The grip separation for any specified elongation canbe found by rearranging Eq 7, as given below:
L 5 E 3 MC~TS!/200 (8)
17.4 Calculate the yield stress by using Eq 3 in 13.2.17.5 Evaluate the yield strain as given in 13.3. Since yield
strain may be considered to be an average bulk property of anymaterial, use the mean circumference for this evaluation.
17.6 Calculate the tensile strength by using Eq 4 in 13.4.17.7 Calculate the breaking or ultimate elongation as fol-
lows (see Notes 8 and 9):
E 5 200/@L/IC~TS!# (9)
where:E = breaking or ultimate elongation, percent,L = increase in grip separation at break, mm (in.), andIC(TS) = inside circumference of ring test specimen, mm
(in.).
D 412 – 98a (2002)e1
10
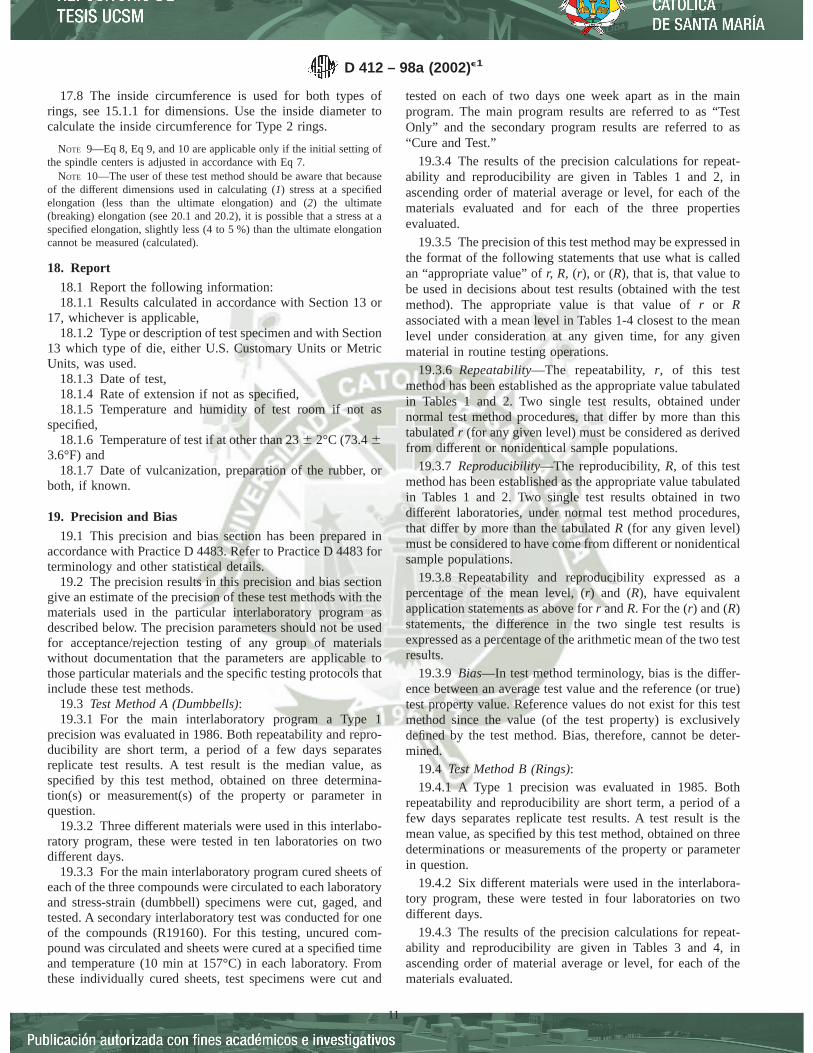
17.8 The inside circumference is used for both types ofrings, see 15.1.1 for dimensions. Use the inside diameter tocalculate the inside circumference for Type 2 rings.
NOTE 9—Eq 8, Eq 9, and 10 are applicable only if the initial setting ofthe spindle centers is adjusted in accordance with Eq 7.
NOTE 10—The user of these test method should be aware that becauseof the different dimensions used in calculating (1) stress at a specifiedelongation (less than the ultimate elongation) and (2) the ultimate(breaking) elongation (see 20.1 and 20.2), it is possible that a stress at aspecified elongation, slightly less (4 to 5 %) than the ultimate elongationcannot be measured (calculated).
18. Report
18.1 Report the following information:18.1.1 Results calculated in accordance with Section 13 or
17, whichever is applicable,18.1.2 Type or description of test specimen and with Section
13 which type of die, either U.S. Customary Units or MetricUnits, was used.
18.1.3 Date of test,18.1.4 Rate of extension if not as specified,18.1.5 Temperature and humidity of test room if not as
specified,18.1.6 Temperature of test if at other than 236 2°C (73.46
3.6°F) and18.1.7 Date of vulcanization, preparation of the rubber, or
both, if known.
19. Precision and Bias
19.1 This precision and bias section has been prepared inaccordance with Practice D 4483. Refer to Practice D 4483 forterminology and other statistical details.
19.2 The precision results in this precision and bias sectiongive an estimate of the precision of these test methods with thematerials used in the particular interlaboratory program asdescribed below. The precision parameters should not be usedfor acceptance/rejection testing of any group of materialswithout documentation that the parameters are applicable tothose particular materials and the specific testing protocols thatinclude these test methods.
19.3 Test Method A (Dumbbells):19.3.1 For the main interlaboratory program a Type 1
precision was evaluated in 1986. Both repeatability and repro-ducibility are short term, a period of a few days separatesreplicate test results. A test result is the median value, asspecified by this test method, obtained on three determina-tion(s) or measurement(s) of the property or parameter inquestion.
19.3.2 Three different materials were used in this interlabo-ratory program, these were tested in ten laboratories on twodifferent days.
19.3.3 For the main interlaboratory program cured sheets ofeach of the three compounds were circulated to each laboratoryand stress-strain (dumbbell) specimens were cut, gaged, andtested. A secondary interlaboratory test was conducted for oneof the compounds (R19160). For this testing, uncured com-pound was circulated and sheets were cured at a specified timeand temperature (10 min at 157°C) in each laboratory. Fromthese individually cured sheets, test specimens were cut and
tested on each of two days one week apart as in the mainprogram. The main program results are referred to as “TestOnly” and the secondary program results are referred to as“Cure and Test.”
19.3.4 The results of the precision calculations for repeat-ability and reproducibility are given in Tables 1 and 2, inascending order of material average or level, for each of thematerials evaluated and for each of the three propertiesevaluated.
19.3.5 The precision of this test method may be expressed inthe format of the following statements that use what is calledan “appropriate value” ofr, R, (r), or (R), that is, that value tobe used in decisions about test results (obtained with the testmethod). The appropriate value is that value ofr or Rassociated with a mean level in Tables 1-4 closest to the meanlevel under consideration at any given time, for any givenmaterial in routine testing operations.
19.3.6 Repeatability—The repeatability,r, of this testmethod has been established as the appropriate value tabulatedin Tables 1 and 2. Two single test results, obtained undernormal test method procedures, that differ by more than thistabulatedr (for any given level) must be considered as derivedfrom different or nonidentical sample populations.
19.3.7 Reproducibility—The reproducibility,R, of this testmethod has been established as the appropriate value tabulatedin Tables 1 and 2. Two single test results obtained in twodifferent laboratories, under normal test method procedures,that differ by more than the tabulatedR (for any given level)must be considered to have come from different or nonidenticalsample populations.
19.3.8 Repeatability and reproducibility expressed as apercentage of the mean level, (r) and (R), have equivalentapplication statements as above forr andR. For the (r) and (R)statements, the difference in the two single test results isexpressed as a percentage of the arithmetic mean of the two testresults.
19.3.9 Bias—In test method terminology, bias is the differ-ence between an average test value and the reference (or true)test property value. Reference values do not exist for this testmethod since the value (of the test property) is exclusivelydefined by the test method. Bias, therefore, cannot be deter-mined.
19.4 Test Method B (Rings):19.4.1 A Type 1 precision was evaluated in 1985. Both
repeatability and reproducibility are short term, a period of afew days separates replicate test results. A test result is themean value, as specified by this test method, obtained on threedeterminations or measurements of the property or parameterin question.
19.4.2 Six different materials were used in the interlabora-tory program, these were tested in four laboratories on twodifferent days.
19.4.3 The results of the precision calculations for repeat-ability and reproducibility are given in Tables 3 and 4, inascending order of material average or level, for each of thematerials evaluated.
D 412 – 98a (2002)e1
11

19.4.4 Repeatability,r, varies over the range of materiallevels as evaluated. Reproducibility,R, varies over the range ofmaterial levels as evaluated.
19.4.5 The precision of this test method may be expressed inthe format of the following statements that use what is calledan “appropriate value” ofr, R, (r), or (R), that is, that value to
TABLE 1 Type 1 (Test Only) Precision on Method A Die C Dumbbell Test Specimens
NOTE:Sr = repeatability standard deviation.r = repeatability = 2.83 times the square root of the repeatability variance.(r) = repeatability (as percentage of material average).SR = reproducibility standard deviation.R = reproducibility = 2.83 times the square root of the reproducibility variance.(R) = reproducibility (as percentage of material average).
Part 1 Tensile Strength, MPa:Material Average Within Laboratories Between Laboratories
Sr r (r) SR R (R)1. N18081 9.88 0.200 0.568 5.75 0.293 0.829 8.403. E17074 15.38 0.467 1.323 8.60 0.482 1.366 8.882. R19160 25.70 0.436 1.235 4.80 1.890 5.351 20.82Pooled ValuesA 16.99 0.385 1.090 6.42 1.102 3.120 18.37
Part 2 Percent Elongation:Material Average Within Laboratories Between Laboratories
Sr r (r) SR R (R)3. E17074 156.3 6.304 17.842 11.41 11.481 32.492 20.782. R19160 510.4 11.471 32.464 6.36 21.243 60.120 11.771. N18081 591.6 17.810 50.402 8.52 27.198 76.972 13.01Pooled ValuesA 419.4 12.761 36.114 8.61 20.999 59.427 14.16
Part 3 Stress at 100 % Elongation, MPa:Material Average Within Laboratories Between Laboratories
Sr r (r) SR R (R)1. N18081 1.17 0.053 0.151 12.96 0.061 0.1744 14.922. R19160 2.01 0.050 0.142 7.10 0.274 0.7755 38.623. E17074 9.08 0.489 1.385 15.25 0.738 2.0910 23.02Pooled ValuesA 4.09 0.285 0.808 19.79 0.456 1.2915 31.60
A No values omitted.
TABLE 2 Type 1 (Cure and Test) Precision on Method A Die C Dumbbell Test Specimens A
NOTE 1:Sr = repeatability standard deviation.r = repeatability = 2.83 times the square root of the repeatability variance.(r) = repeatability (as percentage of material average).SR = reproducibility standard deviation.R = reproducibility = 2.83 times the square root of the reproducibility variance.(R) = reproducibility (as percentage of material average).
NOTE 2:N18081—highly extended, low durometer CR (Neoprene).R19160—high tensile NR.E17047—moderately filled EPDM.
Part 1 Tensile Strength, MPa:Material Average Within Laboratories Between Laboratories
Sr r (r) SR R (R)1. R19160 26.0 0.613 1.73 6.66 1.74 4.95 19.0
Part 2 Percent Elongation:Material Average Within Laboratories Between Laboratories
Sr r (r) SR R (R)1. R19160 526.9 13.32 37.7 7.15 19.6 55.70 10.5
Part 3 Stress at 100 % Elongation, MPa:Material Average Within Laboratories Between Laboratories
Sr r (r) SR R (R)1. R19160 1.83 0.072 0.205 11.21 0.226 0.641 34.5
A Seven laboratories participated in this cure and test program.
D 412 – 98a (2002)e1
12

be used in decisions about test results (obtained with the testmethod). The appropriate value is that value ofr or Rassociated with a mean level in Tables 1-4 closest to the meanlevel under consideration at any given time, for any givenmaterial in routine testing operations.
19.4.6 Repeatability—The repeatability,r, of this testmethod has been established as the appropriate value tabulatedin Tables 3 and 4. Two single test results, obtained undernormal test method procedures, that differ by more than thistabulatedr (for any given level) must be considered as derivedfrom different or nonidentical sample populations.
19.4.7 Reproducibility—The reproducibility,R, of this testmethod has been established as the appropriate value tabulatedin Tables 3 and 4. Two single test results obtained in twodifferent laboratories, under normal test method procedures,that differ by more than the tabulatedR (for any given level)must be considered to have come from different or nonidenticalsample populations.
19.4.8 Repeatability and reproducibility expressed as apercentage of the mean level, (r) and (R), have equivalentapplication statements as 19.3.6 and 19.3.7 forr andR. For the(r) and (R) statements, the difference in the two single testresults is expressed as a percentage of the arithmetic mean ofthe two test results.
19.4.9 Bias—In test method terminology, bias is the differ-ence between an average test value and the reference (or true)test property value. Reference values do not exist for this testmethod since the value (of the test property) is exclusivelydefined by the test method. Bias, therefore, cannot be deter-mined.
20. Keywords
20.1 elongation; set after break; tensile properties; tensileset; tensile strength; tensile stress; yield point
TABLE 3 Type 1 Precision—Test Method B (Rings)
NOTE:Sr = repeatability standard deviation.r = repeatability = 2.83 times the square root of the repeatability variance.(r) = repeatability (as percentage of material average).SR = reproducibility standard deviation.R = reproducibility = 2.83 times the square root of the reproducibility variance.(R) = reproducibility (as percentage of material average).
Tensile Strength (MPa)
Material Average Within Laboratories Between Laboratories
Sr r (r) SR R (R)5. MATL 5 11.5 0.666 1.885 16.3 1.43 4.06 35.36. MATL 6 12.7 0.274 0.775 6.0 0.83 2.35 18.51. MATL 1 14.6 0.367 1.040 7.1 0.40 1.15 7.94. MATL 4 15.0 0.553 1.565 10.4 3.03 8.59 57.22. MATL 2 20.3 1.293 3.660 18.0 2.47 6.99 34.43. MATL 3 22.3 1.556 4.405 19.6 1.55 4.40 19.6Pooled ValuesA 15.9 0.942 2.666 16.7 1.87 5.31 33.3
A No values omitted.
TABLE 4 Type 1 Precision—Test Method B (Rings)
NOTE:Sr = repeatability standard deviation.r = repeatability = 2.83 times the square root of the repeatability variance.(r) = repeatability (as percentage of material average).SR = reproducibility standard deviation.R = reproducibility = 2.83 times the square root of the reproducibility variance.(R) = reproducibility (as percentage of material average).
Ultimate Elongation, %
Material Average Within Laboratories Between Laboratories
Sr r (r) SR R (R)1. MATL 1 322.1 15.25 43.18 13.40 33.4 94.7 29.42. MATL 2 445.4 11.35 32.12 7.21 34.1 96.6 21.74. MATL 4 509.4 27.44 77.65 15.24 51.1 144.8 28.45. MATL 5 545.0 2.91 8.25 1.51 56.3 159.5 29.26. MATL 6 599.7 12.91 36.55 6.09 14.0 39.6 6.603. MATL 3 815.8 16.25 45.99 5.63 90.6 256.5 31.4Pooled ValuesA 539.6 16.54 46.82 8.67 48.2 136.4 25.2
A No values omitted.
D 412 – 98a (2002)e1
13

ASTM International takes no position respecting the validity of any patent rights asserted in connection with any item mentionedin this standard. Users of this standard are expressly advised that determination of the validity of any such patent rights, and the riskof infringement of such rights, are entirely their own responsibility.
This standard is subject to revision at any time by the responsible technical committee and must be reviewed every five years andif not revised, either reapproved or withdrawn. Your comments are invited either for revision of this standard or for additional standardsand should be addressed to ASTM International Headquarters. Your comments will receive careful consideration at a meeting of theresponsible technical committee, which you may attend. If you feel that your comments have not received a fair hearing you shouldmake your views known to the ASTM Committee on Standards, at the address shown below.
This standard is copyrighted by ASTM International, 100 Barr Harbor Drive, PO Box C700, West Conshohocken, PA 19428-2959,United States. Individual reprints (single or multiple copies) of this standard may be obtained by contacting ASTM at the aboveaddress or at 610-832-9585 (phone), 610-832-9555 (fax), or [email protected] (e-mail); or through the ASTM website(www.astm.org).
D 412 – 98a (2002)e1
14

Designation: D 573 – 99
Standard Test Method forRubber—Deterioration in an Air Oven 1
This standard is issued under the fixed designation D 573; the number immediately following the designation indicates the year oforiginal adoption or, in the case of revision, the year of last revision. A number in parentheses indicates the year of last reapproval. Asuperscript epsilon (e) indicates an editorial change since the last revision or reapproval.
This standard has been approved for use by agencies of the Department of Defense.
1. Scope
1.1 This test method describes a procedure to determine theinfluence of elevated temperature on the physical properties ofvulcanized rubber. The results of this test method may not givean exact correlation with service performance since perfor-mance conditions vary widely. This test method may, however,be used to evaluate rubber compounds on a laboratory com-parison basis.
1.2 The values stated in SI units are to be regarded as thestandard. The values given in parentheses are for informationonly.
1.3 This standard does not purport to address all of thesafety concerns, if any, associated with its use. It is theresponsibility of the user of this standard to establish appro-priate safety and health practices and determine the applica-bility of regulatory limitations prior to use.(For specificprecautionary statement, see Note 1.)
2. Referenced Documents
2.1 ASTM Standards:D 412 Test Methods for Vulcanized Rubber and Thermo-
plastic Rubbers and Thermoplastic Elastomers—Tension2
D 1349 Practice for Rubber—Standard Temperatures forTesting2
D 3182 Practice for Rubber—Materials, Equipment, andProcedures for Mixing Standard Compounds and Prepar-ing Standard Vulcanized Sheets2
D 3183 Practice for Rubber—Preparation of Pieces for TestPurposes from Products2
D 4483 Practice for Determining Precision for Test MethodStandards in the Rubber and Carbon Black Industries2
E 145 Specification for Gravity-Convection and Forced-Ventilation Ovens3
3. Summary of Test Method
3.1 Specimens of vulcanized rubber are exposed to thedeteriorating influence of air at specified elevated temperatures
for known periods of time, after which their physical propertiesare determined. These are compared with the properties deter-mined on the original specimens and the changes noted.
3.2 Unless otherwise specified, the determination of thephysical properties shall be carried out in accordance with TestMethods D 412.
3.3 Except as may be otherwise specified in this testmethod, the requirements of Practices D 3182 and D 3183 shallbe complied with and are made part of this test method.
3.4 In case of conflict between the provisions of this testmethod and those of detailed specifications or test methods fora particular material, the latter shall take precedence.
4. Significance and Use
4.1 Rubber and rubber products must resist the deteriorationof physical properties with time caused by oxidative andthermal aging. This test method provides a way to assess theseperformance characteristics of rubber, under certain acceler-ated conditions as specified.
4.2 Please refer to the Annex for important information onstandard compounds used for precision testing for acceleratedtest aging evaluation.
5. Apparatus
5.1 Type IIB ovens specified in Test Method E 145 aresatisfactory for use through 70°C. For higher temperatures,Type IIA ovens are necessary.
5.1.1 The interior size shall be as follows or of an equivalentvolume:
Interior size of air oven:min 300 by 300 by 300 mm (12 by 12 by 12 in.)max 900 by 900 by 1200 mm (36 by 36 by 48 in.)
5.1.2 Provision shall be made for suspending specimensvertically without touching each other or the sides of the agingchamber.
5.1.3 The heating medium for the aging chamber shall be aircirculated within it at atmospheric pressure.
5.1.4 The source of heat is optional but shall be located inthe air supply outside of the aging chamber proper.
5.1.5 The temperature should be automatically recordedover the entire test period using a temperature-measuringdevice capable of measuring at the specified temperature towithin 61°C. Located in the upper central portion of thechamber near the center of the aging specimens. For apparatus
1 This test method is under the jurisdiction of ASTM Committee D-11 on Rubberand is the direct responsibility of Subcommittee D11.15 on Degradation Tests.
Current edition approved Nov. 10, 1999. Published December 1999. Originallypublished as D 573 – 40. Last previous edition D 573–88 (1994)e1.
2 Annual Book of ASTM Standards, Vol 09.01.3 Annual Book of ASTM Standards, Vol 14.02.
1
Copyright © ASTM, 100 Barr Harbor Drive, West Conshohocken, PA 19428-2959, United States.
not equipped with automatic recording capabilities, tempera-ture shall be measured with sufficient frequency to ascertainthat the temperature limits specified in 10.2 are adhered to.
5.1.6 Automatic temperature control by means of thermo-static regulation shall be used.
5.1.7 The following special precautions shall be taken inorder that accurate, uniform heating is obtained in all parts ofthe aging chamber:
5.1.7.1 The heated air shall be thoroughly circulated in theoven by means of mechanical agitation. When a motor-drivenfan is used, the air must not come in contact with the fan motorbrush discharge because of danger of ozone formation.
5.1.7.2 Baffles shall be used as required to prevent localoverheating and dead spots.
5.1.7.3 The thermostatic control device shall be so locatedas to give accurate temperature control of the heating medium.The preferred location is adjacent to the recording thermom-eter.
5.1.7.4 An actual check shall be made by means of maxi-mum reading thermometers placed in various parts of the ovento verify the uniformity of the heating.
6. Sampling
6.1 The sample size shall be sufficient to allow for thedetermination of the original properties on three specimens andalso on three or more specimens for each exposure period ofthe test. At least 24 h must elapse between completion of thevulcanization of the samples and the start of the aging test.
6.2 When minimum requirements are specified, one test onthree dumbbells shall be considered sufficient. But if the resultsare below the specified requirements, two additional specimensshall be prepared from the original sample and tested. Shouldthe results of either of these tests be below the specifiedrequirements, the sample shall be considered to have failed tomeet the specifications.
7. Test Specimens
7.1 Dumbbell-shaped specimens prepared as described inTest Methods D 412 shall be considered standard. Their formshall be such that no mechanical, chemical, or heat treatmentwill be required after exposure. If any adjustments (forexample, to thickness) are necessary, they should be performedprior to exposure.
7.2 The cross-sectional dimensions of test specimens forcalculating the physical properties shall be measured prior toexposure in the aging chamber. Gage lines used for measuringelongation shall be applied after the specimens have been aged.Only specimens of similar dimensions having approximatelythe same exposed areas may be compared with each other.
8. Number of Test Specimens
8.1 At least three test specimens shall be used to determinethe original physical properties of each sample and also threeor more specimens of the same material for each exposureperiod of the test.
8.2 When minimum requirements are specified, one testshall be made for tensile strength and elongation. If the resultsare below the specified requirements, two additional specimensshall be prepared from the original sample and tested. Should
the results of either of these tests be below the specifiedrequirements, the samples shall be considered to have failed tomeet the specifications.
9. Tests of Unaged Specimens
9.1 The stress - strain properties or tensile strength andultimate elongation and any other required properties of theoriginal unaged specimens shall be determined within 96 h ofthe start of the aging period. Results on specimens that arefound to be imperfect shall be discarded and retests shall bemade.
9.2 When rubber compounds are to be tested for the purposeof determining compliance with specifications, it shall bepermissible to determine the original properties required in 9.1simultaneously with the determination of the values after thefirst aging period even though the elapsed time exceeds 96 h.
10. Procedure for Accelerated Aging
10.1 Place the specimens for aging in the oven after it hasbeen preheated to the operating temperature. If possible, avoidsimultaneous aging of a mixed group of different compounds.For instance, high-sulfur compounds should not be aged withlow-sulfur compounds and those containing antioxidants shallnot be aged with those having no antioxidants. Some migrationis known to occur.
10.2 The operating temperature may be any elevated stan-dard temperature as shown in Practice D 1349, as agreed upon.
NOTE 1—Caution: It should be noted that, for each 10°C increase intemperature, the rate of oxidation may be approximately double. Withrapid aging types of rubber or those containing or contaminated by certainoxidizing chemicals, the rate of oxidation may be catalyzed to such anextent as to become violent with increasing temperatures.
10.3 Start the aging interval at the time the specimens areplaced in the oven and continue for a measured time interval.The selection of suitable intervals of aging will depend on therate of deterioration of the particular material being tested.Intervals frequently used are 2, 4, 7, and 14 days.
10.4 Use aging intervals such that the deterioration will notbe so great as to prevent determination of the final physicalproperties. In experimental work, it is desirable to use a rangeof periods while for routine tests of known materials fewerintervals may be employed.
10.5 At the termination of the aging interval, remove thespecimens from the oven, cool to room temperature on a flatsurface, and allow them to rest not less than 16 h nor more than96 h before determination of the physical properties. Apply thegage lines to the specimens for use in measuring elongations.
11. Physical Tests of Aged Specimens
11.1 The tensile strength and ultimate elongation or thestress - strain properties of the specimens aged for differentintervals shall be determined as the intervals terminate in theprogress of aging, disregarding the fact that more specimensmay still be aging. In determining the physical properties afteraging, the final values shall be the median of results from threespecimens except that under the following conditions twoadditional specimens shall be exposed and tested and themedian of the values for the five specimens shall be used:
11.1.1 If one or more values do not meet the specified
D 573
2

requirements when testing for compliance with specifications.11.1.2 If referee tests are being made. After completion of
the tests, the broken specimens shall be examined visually andmanually and their condition noted.
12. Calculation
12.1 Express the results of the aging test as a percentage ofthe change in each physical property (tensile strength, ultimateelongation, or tensile stress), calculated as follows:
P 5 @~A 2 O!/O# 3 100 (1)
where:P 5 percentage change in property,O 5 original value, andA 5 value after aging.
13. Report
13.1 The report shall include the following:13.1.1 The results calculated in accordance with Section 12,13.1.2 All observed and recorded data on which the calcu-
lations are based,13.1.3 Type of aging test,13.1.4 Aging interval,13.1.5 Aging temperature,13.1.6 Duration, temperature, and data of vulcanization of
the rubber, if known,13.1.7 Dates of original and final determinations of physical
properties, and13.1.8 Dimensions of test specimens.
14. Precision and Bias4
14.1 This precision and bias section has been prepared inaccordance with Practice D 4483. Refer to this practice forterminology and other statistical calculation details.
14.2 A Type 2 (interlaboratory) precision was evaluated in1974. Both repeatability and reproducibility are short term, aperiod of a few days separates replicate test results. A test resultis expressed on the basis of a median value, as specified by TestMethods D 412 obtained on 3 determinations or measurementsof the property or parameter in question.
14.3 Six different materials were used in the interlaboratoryprogram, these were tested in 3 laboratories on 2 different days.These precision results were obtained for a variety of com-pounds prepared in accordance with Method D 15 prior to itsremoval from theAnnual Book of ASTM Standards. Please seeannex of Test Method D 573 for more details on this work.
14.4 The results of the precision calculations for repeatabil-ity and reproducibility for both percent tensile strength changeand percent elongation change are given in Table 1, inascending order of material average or level, for each of thematerials evaluated.
14.4.1 The precision of this test method may be expressed inthe format of the following statements that use an appropriatevalue of r, R, (r), or (R), that is, that value to be used indecisions about test results (obtained with the test method).
Theappropriate valueis that value ofr or R associated with amean level in the precision tables closest to the mean levelunder consideration at any given time, for any given material inroutine testing operation.
14.5 Repeatability— The repeatabilityr, of this test methodhas been established as theappropriate valuetabulated in theprecision tables. Two single test results, obtained under normaltest method procedures, that differ by more than this tabulatedr (for any given level) must be considered as derived fromdifferent or non-identical sample populations.
14.6 Reproducibility— The reproducibilityR, of this testmethod has been established as theappropriate valuetabulatedin the precision tables. Two single test results obtained in twodifferent laboratories, under normal test method procedures,that differ by more than the tabulatedR (for any given level)must be considered to have come from different or non-identical sample populations.
14.7 The precision results indicate that the repeatability andreproducibility of both percent tensile strength change andpercent elongation change are essentially the same. Also thevalue of r or R, or both does not vary with the magnitude ofpercent elongation or percent tensile strength change. Novalues are given for (r) or (R) because of the near zero averagevalues for some of the materials.
14.8 Bias—In test method terminology, bias is the differ-ence between an average test value and the reference (or true)test property value. Reference values do not exist for this testmethod since the value (of the test property) is exclusivelydefined by the test method. Bias, therefore, cannot be deter-mined.
4 Supporting data have been filed at ASTM Headquarters. Request RR:D-11-1056.
TABLE 1 Type 2 Precision Results—100°C Aging
NOTE—The averaging of results for 48 and 96 h of aging gives anincreased DF estimate of precision.
NOTE:Sr 5 within laboratory standard deviationr 5 repeatability (in measurement units)(r) 5 repeatability (in percent)SR 5 between laboratory standard deviationR 5 Reproducibility (in measurement units)(R) 5 Reproducibility (in percent)
Part 1—Percent Tensile Strength Change, 48 h
Material orCompound
Mean TestLevel
WithinLaboratories
BetweenLaboratories
Sr r SR R
NR (1G) −56.6 3.28 9.28 5.91 16.7SBR (9B) −14.2 3.42 9.68 3.02 8.55NBR (1F) −11.5 2.46 6.96 2.49 7.05CR (2D) −10.6 3.83 10.8 5.11 14.5OESBR (10B3) −7.6 2.34 6.62 5.56 15.7IIR (2E) −1.1 3.47 9.82 3.77 10.7
Pooled Values ... 3.18 9.00 3.90 11.04
Part 2—Percent Change in Elongation, Average of 48, 96 h Aging
NR (1G) −55.6 5.08 14.4 7.79 22.0SBR (9B) −48.3 5.38 15.2 6.09 17.2OESBR (10B3) −40.5 3.20 9.06 5.11 14.5NBR (1F) −39.6 7.10 20.1 7.11 20.1CR (2D) −12.1 7.85 22.2 9.00 25.5IIR (2E) −6.2 2.56 7.24 3.97 11.2
Pooled Values ... 5.20 14.7 6.51 18.4
D 573
3

15. Keywords
15.1 accelerated aging; elevated temperature; oxidative ag-ing; rubber articles; rubber products; thermal aging
ANNEX
(Mandatory Information)
A1. FORMER TEST METHOD (D 15) COMPOUNDS USED FOR PRECISION TESTING
A1.1 Introduction
A1.1.1 Testing to develop precision data was begun bysome Subcommittees in D-11 prior to the removal of ASTMMethod D 15, Compound and Sample Preparation for PhysicalTesting of Rubber Products.5 In this initial precision worksome of the standard compounds that were currently includedin D15 were used. Since that time these standard D15 com-pounds have been either modified or removed from theAnnualBook of ASTM Standards.They were replaced by a series ofnew standards, for example, Methods D 3184 on NR, MethodsD 3185 on SBR, etc.
A1.1.2 To provide a source of reference for the compoundsremoved from the previous D15 standard, those compoundsused in measuring precision, especially those used in Subcom-mittee D11.15, are included in Tables A1.1-A1.6 taken directlyfrom D15. These tables are listed below.
A1.1.3 The formulations for the compounds in Tables A1.1-A1.6 are placed in this standard temporarily. This test methodis selected as a location since it is the most frequently usedstandard test for evaluating compounds for accelerated agingperformance.
A1.2 Cure Times for Compounds
A1.2.1 The cure times for compounds selected in theD11.15 precision testing are as follows:
Time, Temper-Compound min, ature,° C
Polychloroprene (neoprene) 30 150Natural (1G) 30 145
SBR (9B) 50 145OE–SBR (10B3) 50 145
Butyl (2E) 80 150NBR (1F) 40 150
A1.3 Materials and Mixing
A1.3.1 In the precision test programs that generated Type 2Precision data for D11.15 standards, that is, that precisionwhich includes compound weighing, mixing, and curing com-ponents of variation, a special testing procedure was employed.A common supply was set up for all the materials needed toprepare compounds in accordance with the tables of thisAnnex. All laboratories that participated in any interlaboratoryprogram drew their materials from this common uniformsupply; thus the within-materials source of variation wasreduced to the lowest possible (practical) level.
A1.3.2 Mixes of the selected compounds were made onspecified days (2 days normally being selected) to determinewithin-laboratory variability as specified in Practice D 4483.5 Discontinued—see 1974Annual Book of ASTM Standards,Part 37.
TABLE A1.1 Type A—Standard Formulations for Styrene-Butadiene Rubbers
NBS 9B
SBR or OE-SBR 100.00Zinc oxide 370 3.00Stearic acid 372 1.00Sulfur 371 1.75Furnace blackA 378 50.00TBBS 384 1.00
156.75Batch factor 3.0
A Current Industry Reference Black (IRB) may be used in place of NBS 378,although slightly different results may be obtained. Weight ingredients to nearest0.1 g for SBR and carbon black and to the nearest 0.01 g for other ingredients.
D 573
4
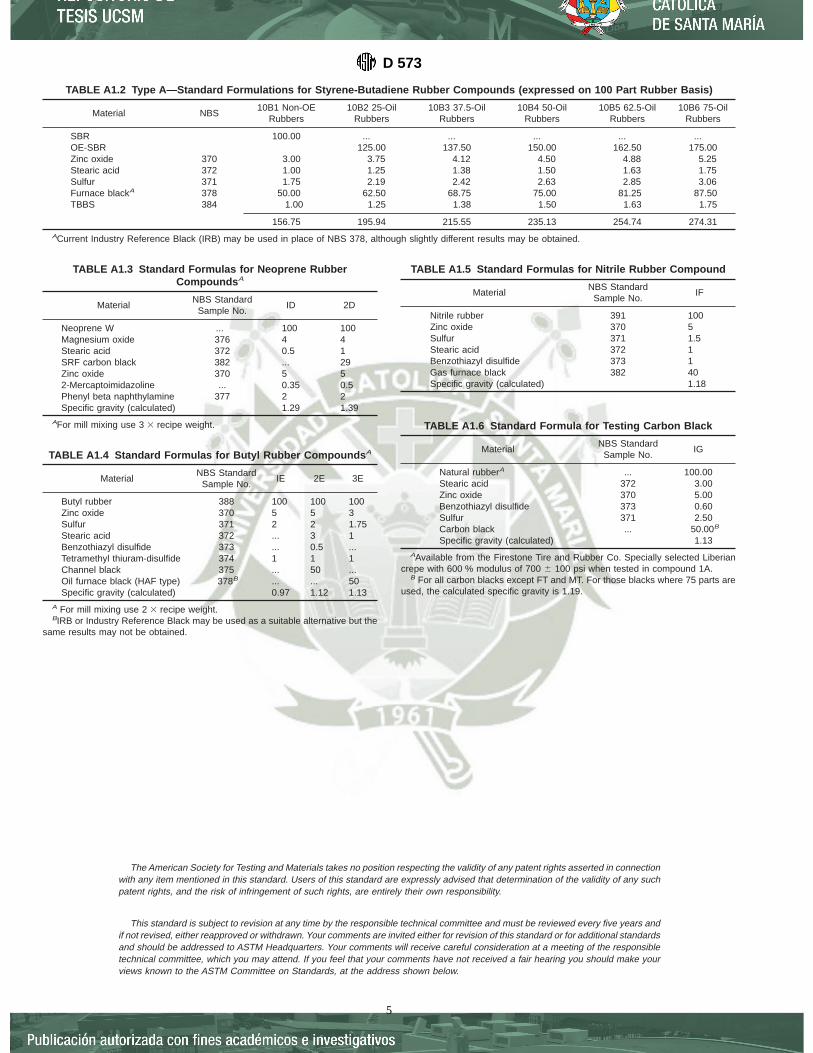
The American Society for Testing and Materials takes no position respecting the validity of any patent rights asserted in connectionwith any item mentioned in this standard. Users of this standard are expressly advised that determination of the validity of any suchpatent rights, and the risk of infringement of such rights, are entirely their own responsibility.
This standard is subject to revision at any time by the responsible technical committee and must be reviewed every five years andif not revised, either reapproved or withdrawn. Your comments are invited either for revision of this standard or for additional standardsand should be addressed to ASTM Headquarters. Your comments will receive careful consideration at a meeting of the responsibletechnical committee, which you may attend. If you feel that your comments have not received a fair hearing you should make yourviews known to the ASTM Committee on Standards, at the address shown below.
TABLE A1.2 Type A—Standard Formulations for Styrene-Butadiene Rubber Compounds (expressed on 100 Part Rubber Basis)
Material NBS10B1 Non-OE
Rubbers10B2 25-Oil
Rubbers10B3 37.5-Oil
Rubbers10B4 50-Oil
Rubbers10B5 62.5-Oil
Rubbers10B6 75-Oil
Rubbers
SBR 100.00 ... ... ... ... ...OE-SBR 125.00 137.50 150.00 162.50 175.00Zinc oxide 370 3.00 3.75 4.12 4.50 4.88 5.25Stearic acid 372 1.00 1.25 1.38 1.50 1.63 1.75Sulfur 371 1.75 2.19 2.42 2.63 2.85 3.06Furnace blackA 378 50.00 62.50 68.75 75.00 81.25 87.50TBBS 384 1.00 1.25 1.38 1.50 1.63 1.75
156.75 195.94 215.55 235.13 254.74 274.31ACurrent Industry Reference Black (IRB) may be used in place of NBS 378, although slightly different results may be obtained.
TABLE A1.3 Standard Formulas for Neoprene RubberCompounds A
MaterialNBS Standard
Sample No.ID 2D
Neoprene W ... 100 100Magnesium oxide 376 4 4Stearic acid 372 0.5 1SRF carbon black 382 ... 29Zinc oxide 370 5 52-Mercaptoimidazoline ... 0.35 0.5Phenyl beta naphthylamine 377 2 2Specific gravity (calculated) 1.29 1.39
AFor mill mixing use 3 3 recipe weight.
TABLE A1.4 Standard Formulas for Butyl Rubber Compounds A
MaterialNBS Standard
Sample No.IE 2E 3E
Butyl rubber 388 100 100 100Zinc oxide 370 5 5 3Sulfur 371 2 2 1.75Stearic acid 372 ... 3 1Benzothiazyl disulfide 373 ... 0.5 ...Tetramethyl thiuram-disulfide 374 1 1 1Channel black 375 ... 50 ...Oil furnace black (HAF type) 378B ... ... 50Specific gravity (calculated) 0.97 1.12 1.13
A For mill mixing use 2 3 recipe weight.BIRB or Industry Reference Black may be used as a suitable alternative but the
same results may not be obtained.
TABLE A1.5 Standard Formulas for Nitrile Rubber Compound
MaterialNBS Standard
Sample No.IF
Nitrile rubber 391 100Zinc oxide 370 5Sulfur 371 1.5Stearic acid 372 1Benzothiazyl disulfide 373 1Gas furnace black 382 40Specific gravity (calculated) 1.18
TABLE A1.6 Standard Formula for Testing Carbon Black
MaterialNBS Standard
Sample No.IG
Natural rubberA ... 100.00Stearic acid 372 3.00Zinc oxide 370 5.00Benzothiazyl disulfide 373 0.60Sulfur 371 2.50Carbon black ... 50.00B
Specific gravity (calculated) 1.13AAvailable from the Firestone Tire and Rubber Co. Specially selected Liberian
crepe with 600 % modulus of 700 6 100 psi when tested in compound 1A.B For all carbon blacks except FT and MT. For those blacks where 75 parts are
used, the calculated specific gravity is 1.19.
D 573
5

This standard is copyrighted by ASTM, 100 Barr Harbor Drive, PO Box C700, West Conshohocken, PA 19428-2959, United States.Individual reprints (single or multiple copies) of this standard may be obtained by contacting ASTM at the above address or at610-832-9585 (phone), 610-832-9555 (fax), or [email protected] (e-mail); or through the ASTM website (www.astm.org).
D 573
6

Designation: D 1349 – 99
Standard Practice forRubber—Standard Temperatures For Testing 1
This standard is issued under the fixed designation D 1349; the number immediately following the designation indicates the year oforiginal adoption or, in the case of revision, the year of last revision. A number in parentheses indicates the year of last reapproval. Asuperscript epsilon (e) indicates an editorial change since the last revision or reapproval.
This standard has been approved for use by agencies of the Department of Defense.
1. Scope
1.1 This practice establishes a list of standard temperaturesfrom which selection may be made for any specific test or testmethod. Any standard or specification which specifies testtemperatures not listed shall take precedence over this practice.1.2 These temperatures do not apply to mixing, processing,
or vulcanizing temperatures for rubber compounds. Any stan-dard requiring preparation of a particular rubber compoundshould specify the conditions to be used.1.3 The values stated in SI units are to be regarded as the
standard. The values given in parentheses are for informationonly.1.4 This standard does not purport to address all of the
safety problems, if any, associated with its use. It is theresponsibility of the user of this standard to establish appro-priate safety and health practices and determine the applica-bility of regulatory limitations prior to use.
2. Test Temperatures
2.1 The test temperatures are as follows:°C °F−75 −103−55 −67−40 −40−25 −13−10 140 3223 73.440 10455 13170 15885 185100 212125 257135 275150 302160 320175 347200 392225 437250 482
2.2 Tolerances for the test temperature, unless otherwisespecified in a particular method, shall be62°C or63.6°F. Thistolerance is the maximum allowable variation in the tempera-ture of the space enclosing the specimens being tested. Theaverage temperature of the space shall be as close as practi-cable to the specified temperature.2.3 Unless otherwise specified, conditioning and testing of
materials known to be sensitive to variations in temperature orrelative humidity, shall be carried out at a temperature of 2362°C (73.463.6°F) and a relative humidity of 506 5 %.
3. Keywords
3.1 standard test temperatures
The American Society for Testing and Materials takes no position respecting the validity of any patent rights asserted in connectionwith any item mentioned in this standard. Users of this standard are expressly advised that determination of the validity of any suchpatent rights, and the risk of infringement of such rights, are entirely their own responsibility.
This standard is subject to revision at any time by the responsible technical committee and must be reviewed every five years andif not revised, either reapproved or withdrawn. Your comments are invited either for revision of this standard or for additional standardsand should be addressed to ASTM Headquarters. Your comments will receive careful consideration at a meeting of the responsibletechnical committee, which you may attend. If you feel that your comments have not received a fair hearing you should make yourviews known to the ASTM Committee on Standards, 100 Barr Harbor Drive, West Conshohocken, PA 19428.
1 This practice is under the jurisdiction of ASTM Committee D-11 on Rubber andis the direct responsibility of Subcommittee D11.14 on Time and Temperature-Dependent Physical Properties.
Current edition approved February 10, 1999. Published February 1999. Origi-nally published as D1349 – 54 T. Last previous edition D1349 – 87 (1992)e1.
1
AMERICAN SOCIETY FOR TESTING AND MATERIALS100 Barr Harbor Dr., West Conshohocken, PA 19428
Reprinted from the Annual Book of ASTM Standards. Copyright ASTM
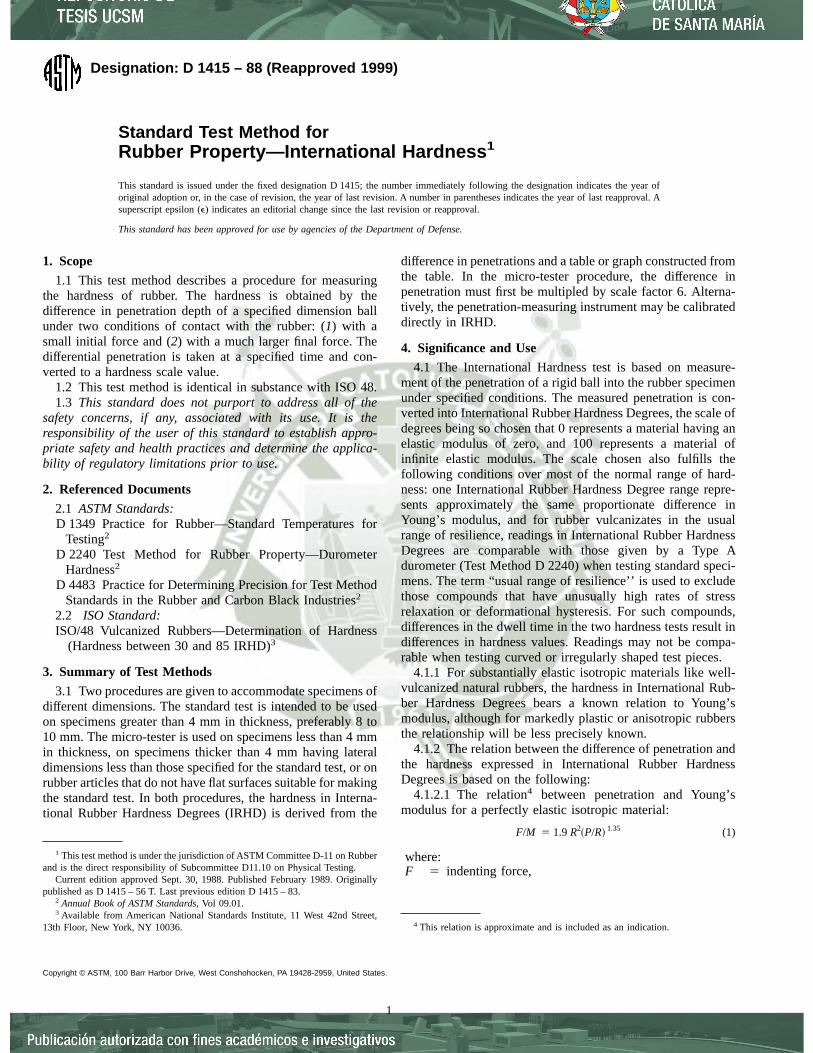
Designation: D 1415 – 88 (Reapproved 1999)
Standard Test Method forRubber Property—International Hardness 1
This standard is issued under the fixed designation D 1415; the number immediately following the designation indicates the year oforiginal adoption or, in the case of revision, the year of last revision. A number in parentheses indicates the year of last reapproval. Asuperscript epsilon (e) indicates an editorial change since the last revision or reapproval.
This standard has been approved for use by agencies of the Department of Defense.
1. Scope
1.1 This test method describes a procedure for measuringthe hardness of rubber. The hardness is obtained by thedifference in penetration depth of a specified dimension ballunder two conditions of contact with the rubber: (1) with asmall initial force and (2) with a much larger final force. Thedifferential penetration is taken at a specified time and con-verted to a hardness scale value.
1.2 This test method is identical in substance with ISO 48.1.3 This standard does not purport to address all of the
safety concerns, if any, associated with its use. It is theresponsibility of the user of this standard to establish appro-priate safety and health practices and determine the applica-bility of regulatory limitations prior to use.
2. Referenced Documents
2.1 ASTM Standards:D 1349 Practice for Rubber—Standard Temperatures for
Testing2
D 2240 Test Method for Rubber Property—DurometerHardness2
D 4483 Practice for Determining Precision for Test MethodStandards in the Rubber and Carbon Black Industries2
2.2 ISO Standard:ISO/48 Vulcanized Rubbers—Determination of Hardness
(Hardness between 30 and 85 IRHD)3
3. Summary of Test Methods
3.1 Two procedures are given to accommodate specimens ofdifferent dimensions. The standard test is intended to be usedon specimens greater than 4 mm in thickness, preferably 8 to10 mm. The micro-tester is used on specimens less than 4 mmin thickness, on specimens thicker than 4 mm having lateraldimensions less than those specified for the standard test, or onrubber articles that do not have flat surfaces suitable for makingthe standard test. In both procedures, the hardness in Interna-tional Rubber Hardness Degrees (IRHD) is derived from the
difference in penetrations and a table or graph constructed fromthe table. In the micro-tester procedure, the difference inpenetration must first be multipled by scale factor 6. Alterna-tively, the penetration-measuring instrument may be calibrateddirectly in IRHD.
4. Significance and Use
4.1 The International Hardness test is based on measure-ment of the penetration of a rigid ball into the rubber specimenunder specified conditions. The measured penetration is con-verted into International Rubber Hardness Degrees, the scale ofdegrees being so chosen that 0 represents a material having anelastic modulus of zero, and 100 represents a material ofinfinite elastic modulus. The scale chosen also fulfills thefollowing conditions over most of the normal range of hard-ness: one International Rubber Hardness Degree range repre-sents approximately the same proportionate difference inYoung’s modulus, and for rubber vulcanizates in the usualrange of resilience, readings in International Rubber HardnessDegrees are comparable with those given by a Type Adurometer (Test Method D 2240) when testing standard speci-mens. The term “usual range of resilience’’ is used to excludethose compounds that have unusually high rates of stressrelaxation or deformational hysteresis. For such compounds,differences in the dwell time in the two hardness tests result indifferences in hardness values. Readings may not be compa-rable when testing curved or irregularly shaped test pieces.
4.1.1 For substantially elastic isotropic materials like well-vulcanized natural rubbers, the hardness in International Rub-ber Hardness Degrees bears a known relation to Young’smodulus, although for markedly plastic or anisotropic rubbersthe relationship will be less precisely known.
4.1.2 The relation between the difference of penetration andthe hardness expressed in International Rubber HardnessDegrees is based on the following:
4.1.2.1 The relation4 between penetration and Young’smodulus for a perfectly elastic isotropic material:
F/M 5 1.9R2~P/R! 1.35 (1)
where:F 5 indenting force,
1 This test method is under the jurisdiction of ASTM Committee D-11 on Rubberand is the direct responsibility of Subcommittee D11.10 on Physical Testing.
Current edition approved Sept. 30, 1988. Published February 1989. Originallypublished as D 1415 – 56 T. Last previous edition D 1415 – 83.
2 Annual Book of ASTM Standards, Vol 09.01.3 Available from American National Standards Institute, 11 West 42nd Street,
13th Floor, New York, NY 10036. 4 This relation is approximate and is included as an indication.
1
Copyright © ASTM, 100 Barr Harbor Drive, West Conshohocken, PA 19428-2959, United States.

M 5 Young’s modulus, MPa,R 5 radius of ball, mm, andP 5 penetration, mm.
4.1.2.2 Use of a probit (integrated normal error) curve torelate log10 M and hardness in International Rubber HardnessDegrees, as shown in Fig. 1. This curve is defined as follows:
4.1.2.3 The value of log10 M corresponding to the midpointof the curve is equal to 0.364, that is,M 5 2.31 MPa or 335psi.
4.1.2.4 The maximum slope is equal to 57 InternationalRubber Hardness Degrees per unit increase in log10 M.
5. Apparatus
5.1 The essential parts of the apparatus are as follows, theappropriate dimensions and loads being given in Table 1:
5.1.1 Vertical Plunger, terminating in a rigid ball.5.1.2 Force Applicator—for applying a minor force and a
major force to the ball the mass of the plunger and of anyfittings attached to it and the force of any spring acting on itshall be included in determining the minor and major forces.This is in order that the forces actually applied to the ball shallbe as specified.
5.1.3 Measuring Device—A mechanical, optical, or electri-cal device graduated either in standard units of length or inInternational Rubber Hardness Degrees for measuring theincrease in depth of penetration of the plunger caused by themajor load.
5.1.4 Foot—A flat annular-shaped foot that is rigidly fas-tened to the penetration-measuring device and normal to theaxis of the plunger, and which during the test is forced againstthe specimen in order to determine accurately the position ofthe upper surface.
5.1.5 Vibrating Device—For example, an electrically oper-ated buzzer, for gently vibrating the apparatus to overcome anyslight friction; this should not exceed 5 % of the minor load.This device may be omitted on apparatus without any friction.
6. Test Specimen
6.1 Tests intended to be comparable must be made onspecimens of the same thickness that have smooth, flat, andparallel upper and lower surfaces. Two pieces of rubber, but notmore than two, may be superimposed to obtain the requiredthickness. The dimensions of the specimen depend on the testerused to measure the hardness.
6.2 Standard Tester—The standard specimen shall be be-tween 8 and 10 mm in thickness; nonstandard specimens maybe either thicker or thinner but in no case less than 4 mm thick.The lateral dimensions of both standard and nonstandardspecimens shall be not less than 20 mm, and no test shall bemade at a distance from the edge of the specimen less than theappropriate distance shown in Table 2.
6.3 Micro Tester—The standard specimen for the micro testprocedure shall be between 2 and 2.5 mm in thickness;nonstandard specimens may be either thicker or thinner but inno case less than 1 mm thick. The lateral dimensions of bothstandard and nonstandard specimens shall be such that no testis made at a distance from the edge of less than 2 mm. Whenspecimens thicker than 4 mm are tested on the micro testerbecause lateral dimensions or area of flatness do not permittesting on a standard tester, the test shall be made at a distancefrom the edge as great as possible. Curved specimens, forexample, O-rings, may be tested with the micro tester if thespecimens are mounted in such a manner as to preventmovement during the test, but the values obtained may not be
FIG. 1 Point Curve to Relate Log 10 M and the Hardness in International Rubber Hardness Degrees
D 1415
2
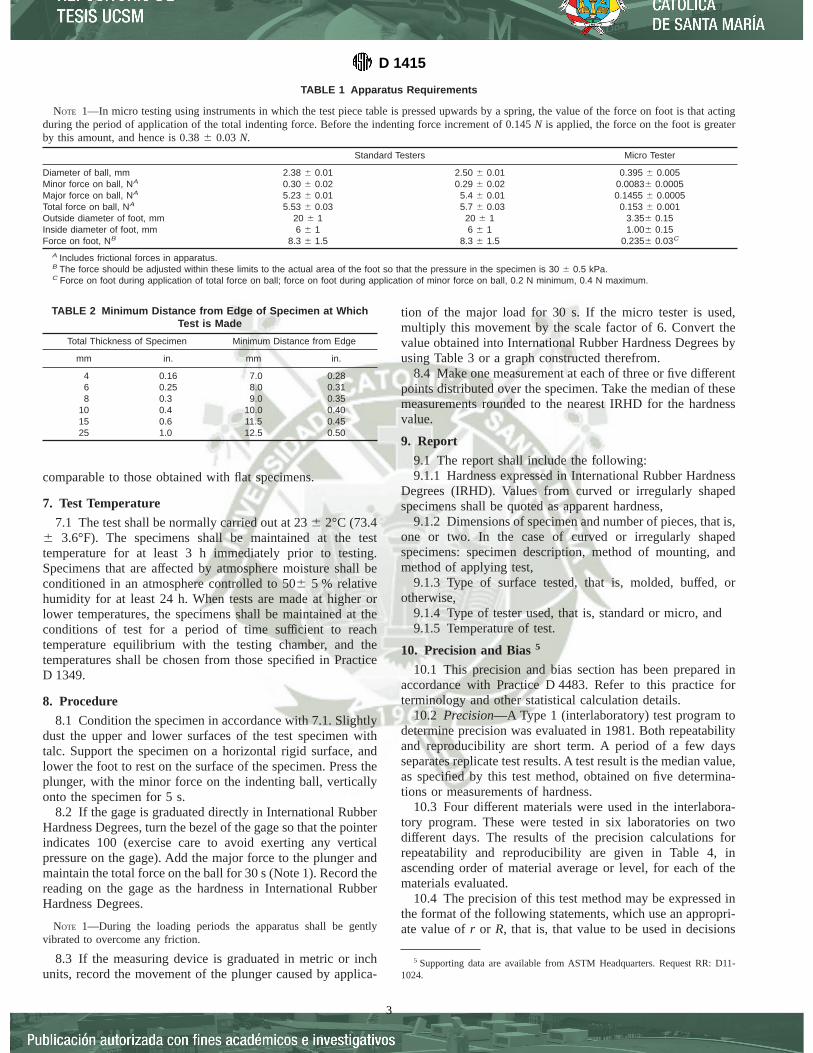
comparable to those obtained with flat specimens.
7. Test Temperature
7.1 The test shall be normally carried out at 236 2°C (73.46 3.6°F). The specimens shall be maintained at the testtemperature for at least 3 h immediately prior to testing.Specimens that are affected by atmosphere moisture shall beconditioned in an atmosphere controlled to 506 5 % relativehumidity for at least 24 h. When tests are made at higher orlower temperatures, the specimens shall be maintained at theconditions of test for a period of time sufficient to reachtemperature equilibrium with the testing chamber, and thetemperatures shall be chosen from those specified in PracticeD 1349.
8. Procedure
8.1 Condition the specimen in accordance with 7.1. Slightlydust the upper and lower surfaces of the test specimen withtalc. Support the specimen on a horizontal rigid surface, andlower the foot to rest on the surface of the specimen. Press theplunger, with the minor force on the indenting ball, verticallyonto the specimen for 5 s.
8.2 If the gage is graduated directly in International RubberHardness Degrees, turn the bezel of the gage so that the pointerindicates 100 (exercise care to avoid exerting any verticalpressure on the gage). Add the major force to the plunger andmaintain the total force on the ball for 30 s (Note 1). Record thereading on the gage as the hardness in International RubberHardness Degrees.
NOTE 1—During the loading periods the apparatus shall be gentlyvibrated to overcome any friction.
8.3 If the measuring device is graduated in metric or inchunits, record the movement of the plunger caused by applica-
tion of the major load for 30 s. If the micro tester is used,multiply this movement by the scale factor of 6. Convert thevalue obtained into International Rubber Hardness Degrees byusing Table 3 or a graph constructed therefrom.
8.4 Make one measurement at each of three or five differentpoints distributed over the specimen. Take the median of thesemeasurements rounded to the nearest IRHD for the hardnessvalue.
9. Report
9.1 The report shall include the following:9.1.1 Hardness expressed in International Rubber Hardness
Degrees (IRHD). Values from curved or irregularly shapedspecimens shall be quoted as apparent hardness,
9.1.2 Dimensions of specimen and number of pieces, that is,one or two. In the case of curved or irregularly shapedspecimens: specimen description, method of mounting, andmethod of applying test,
9.1.3 Type of surface tested, that is, molded, buffed, orotherwise,
9.1.4 Type of tester used, that is, standard or micro, and9.1.5 Temperature of test.
10. Precision and Bias5
10.1 This precision and bias section has been prepared inaccordance with Practice D 4483. Refer to this practice forterminology and other statistical calculation details.
10.2 Precision—A Type 1 (interlaboratory) test program todetermine precision was evaluated in 1981. Both repeatabilityand reproducibility are short term. A period of a few daysseparates replicate test results. A test result is the median value,as specified by this test method, obtained on five determina-tions or measurements of hardness.
10.3 Four different materials were used in the interlabora-tory program. These were tested in six laboratories on twodifferent days. The results of the precision calculations forrepeatability and reproducibility are given in Table 4, inascending order of material average or level, for each of thematerials evaluated.
10.4 The precision of this test method may be expressed inthe format of the following statements, which use an appropri-ate value ofr or R, that is, that value to be used in decisions
5 Supporting data are available from ASTM Headquarters. Request RR: D11-1024.
TABLE 1 Apparatus Requirements
NOTE 1—In micro testing using instruments in which the test piece table is pressed upwards by a spring, the value of the force on foot is that actingduring the period of application of the total indenting force. Before the indenting force increment of 0.145N is applied, the force on the foot is greaterby this amount, and hence is 0.386 0.03N.
Standard Testers Micro Tester
Diameter of ball, mm 2.38 6 0.01 2.50 6 0.01 0.395 6 0.005Minor force on ball, NA 0.30 6 0.02 0.29 6 0.02 0.00836 0.0005Major force on ball, NA 5.23 6 0.01 5.4 6 0.01 0.1455 6 0.0005Total force on ball, NA 5.53 6 0.03 5.7 6 0.03 0.153 6 0.001Outside diameter of foot, mm 20 6 1 20 6 1 3.356 0.15Inside diameter of foot, mm 6 6 1 6 6 1 1.006 0.15Force on foot, NB 8.3 6 1.5 8.3 6 1.5 0.2356 0.03C
A Includes frictional forces in apparatus.B The force should be adjusted within these limits to the actual area of the foot so that the pressure in the specimen is 30 6 0.5 kPa.C Force on foot during application of total force on ball; force on foot during application of minor force on ball, 0.2 N minimum, 0.4 N maximum.
TABLE 2 Minimum Distance from Edge of Specimen at WhichTest is Made
Total Thickness of Specimen Minimum Distance from Edge
mm in. mm in.
4 0.16 7.0 0.286 0.25 8.0 0.318 0.3 9.0 0.35
10 0.4 10.0 0.4015 0.6 11.5 0.4525 1.0 12.5 0.50
D 1415
3
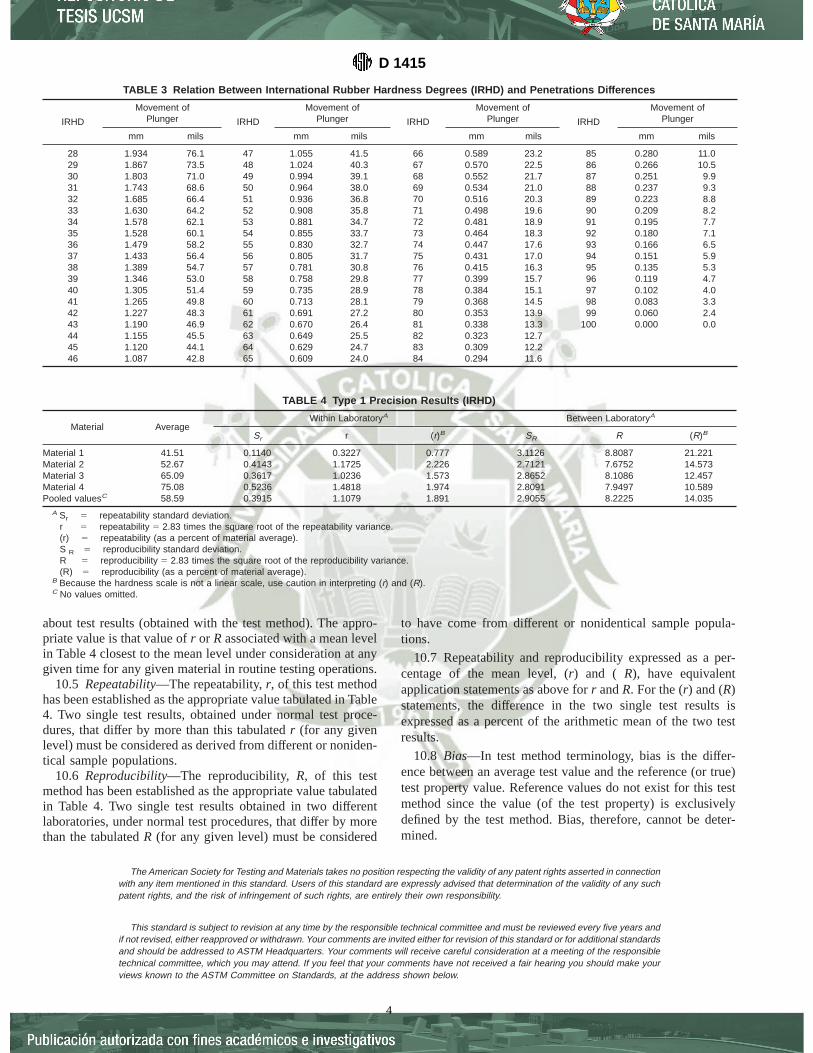
about test results (obtained with the test method). The appro-priate value is that value ofr or R associated with a mean levelin Table 4 closest to the mean level under consideration at anygiven time for any given material in routine testing operations.
10.5 Repeatability—The repeatability,r, of this test methodhas been established as the appropriate value tabulated in Table4. Two single test results, obtained under normal test proce-dures, that differ by more than this tabulatedr (for any givenlevel) must be considered as derived from different or noniden-tical sample populations.
10.6 Reproducibility—The reproducibility,R, of this testmethod has been established as the appropriate value tabulatedin Table 4. Two single test results obtained in two differentlaboratories, under normal test procedures, that differ by morethan the tabulatedR (for any given level) must be considered
to have come from different or nonidentical sample popula-tions.
10.7 Repeatability and reproducibility expressed as a per-centage of the mean level, (r) and (R), have equivalentapplication statements as above forr andR. For the (r) and (R)statements, the difference in the two single test results isexpressed as a percent of the arithmetic mean of the two testresults.
10.8 Bias—In test method terminology, bias is the differ-ence between an average test value and the reference (or true)test property value. Reference values do not exist for this testmethod since the value (of the test property) is exclusivelydefined by the test method. Bias, therefore, cannot be deter-mined.
The American Society for Testing and Materials takes no position respecting the validity of any patent rights asserted in connectionwith any item mentioned in this standard. Users of this standard are expressly advised that determination of the validity of any suchpatent rights, and the risk of infringement of such rights, are entirely their own responsibility.
This standard is subject to revision at any time by the responsible technical committee and must be reviewed every five years andif not revised, either reapproved or withdrawn. Your comments are invited either for revision of this standard or for additional standardsand should be addressed to ASTM Headquarters. Your comments will receive careful consideration at a meeting of the responsibletechnical committee, which you may attend. If you feel that your comments have not received a fair hearing you should make yourviews known to the ASTM Committee on Standards, at the address shown below.
TABLE 3 Relation Between International Rubber Hardness Degrees (IRHD) and Penetrations Differences
IRHD
Movement ofPlunger IRHD
Movement ofPlunger IRHD
Movement ofPlunger IRHD
Movement ofPlunger
mm mils mm mils mm mils mm mils
28 1.934 76.1 47 1.055 41.5 66 0.589 23.2 85 0.280 11.029 1.867 73.5 48 1.024 40.3 67 0.570 22.5 86 0.266 10.530 1.803 71.0 49 0.994 39.1 68 0.552 21.7 87 0.251 9.931 1.743 68.6 50 0.964 38.0 69 0.534 21.0 88 0.237 9.332 1.685 66.4 51 0.936 36.8 70 0.516 20.3 89 0.223 8.833 1.630 64.2 52 0.908 35.8 71 0.498 19.6 90 0.209 8.234 1.578 62.1 53 0.881 34.7 72 0.481 18.9 91 0.195 7.735 1.528 60.1 54 0.855 33.7 73 0.464 18.3 92 0.180 7.136 1.479 58.2 55 0.830 32.7 74 0.447 17.6 93 0.166 6.537 1.433 56.4 56 0.805 31.7 75 0.431 17.0 94 0.151 5.938 1.389 54.7 57 0.781 30.8 76 0.415 16.3 95 0.135 5.339 1.346 53.0 58 0.758 29.8 77 0.399 15.7 96 0.119 4.740 1.305 51.4 59 0.735 28.9 78 0.384 15.1 97 0.102 4.041 1.265 49.8 60 0.713 28.1 79 0.368 14.5 98 0.083 3.342 1.227 48.3 61 0.691 27.2 80 0.353 13.9 99 0.060 2.443 1.190 46.9 62 0.670 26.4 81 0.338 13.3 100 0.000 0.044 1.155 45.5 63 0.649 25.5 82 0.323 12.745 1.120 44.1 64 0.629 24.7 83 0.309 12.246 1.087 42.8 65 0.609 24.0 84 0.294 11.6
TABLE 4 Type 1 Precision Results (IRHD)
Material AverageWithin LaboratoryA Between LaboratoryA
Sr r (r)B SR R (R)B
Material 1 41.51 0.1140 0.3227 0.777 3.1126 8.8087 21.221Material 2 52.67 0.4143 1.1725 2.226 2.7121 7.6752 14.573Material 3 65.09 0.3617 1.0236 1.573 2.8652 8.1086 12.457Material 4 75.08 0.5236 1.4818 1.974 2.8091 7.9497 10.589Pooled valuesC 58.59 0.3915 1.1079 1.891 2.9055 8.2225 14.035
A Sr 5 repeatability standard deviation.r 5 repeatability 5 2.83 times the square root of the repeatability variance.(r) 5 repeatability (as a percent of material average).S R 5 reproducibility standard deviation.R 5 reproducibility 5 2.83 times the square root of the reproducibility variance.(R) 5 reproducibility (as a percent of material average).
B Because the hardness scale is not a linear scale, use caution in interpreting (r) and (R).C No values omitted.
D 1415
4

This standard is copyrighted by ASTM, 100 Barr Harbor Drive, PO Box C700, West Conshohocken, PA 19428-2959, United States.Individual reprints (single or multiple copies) of this standard may be obtained by contacting ASTM at the above address or at610-832-9585 (phone), 610-832-9555 (fax), or [email protected] (e-mail); or through the ASTM website (www.astm.org).
D 1415
5
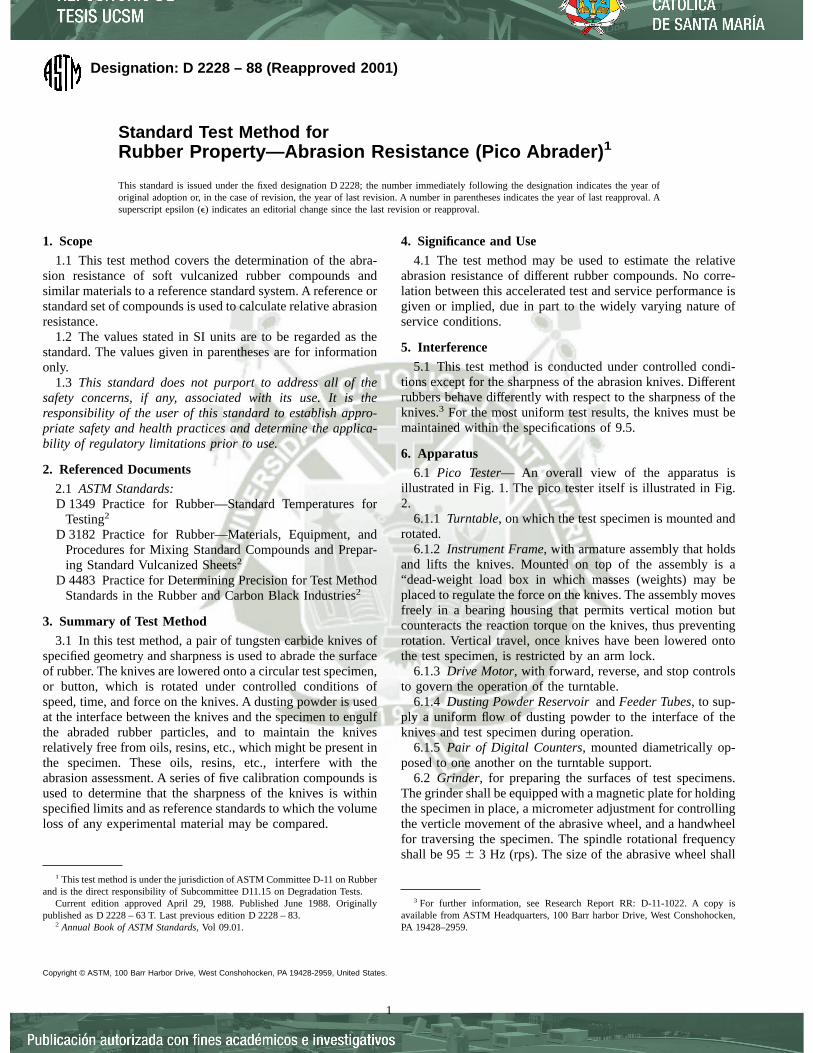
Designation: D 2228 – 88 (Reapproved 2001)
Standard Test Method forRubber Property—Abrasion Resistance (Pico Abrader) 1
This standard is issued under the fixed designation D 2228; the number immediately following the designation indicates the year oforiginal adoption or, in the case of revision, the year of last revision. A number in parentheses indicates the year of last reapproval. Asuperscript epsilon (e) indicates an editorial change since the last revision or reapproval.
1. Scope
1.1 This test method covers the determination of the abra-sion resistance of soft vulcanized rubber compounds andsimilar materials to a reference standard system. A reference orstandard set of compounds is used to calculate relative abrasionresistance.
1.2 The values stated in SI units are to be regarded as thestandard. The values given in parentheses are for informationonly.
1.3 This standard does not purport to address all of thesafety concerns, if any, associated with its use. It is theresponsibility of the user of this standard to establish appro-priate safety and health practices and determine the applica-bility of regulatory limitations prior to use.
2. Referenced Documents
2.1 ASTM Standards:D 1349 Practice for Rubber—Standard Temperatures for
Testing2
D 3182 Practice for Rubber—Materials, Equipment, andProcedures for Mixing Standard Compounds and Prepar-ing Standard Vulcanized Sheets2
D 4483 Practice for Determining Precision for Test MethodStandards in the Rubber and Carbon Black Industries2
3. Summary of Test Method
3.1 In this test method, a pair of tungsten carbide knives ofspecified geometry and sharpness is used to abrade the surfaceof rubber. The knives are lowered onto a circular test specimen,or button, which is rotated under controlled conditions ofspeed, time, and force on the knives. A dusting powder is usedat the interface between the knives and the specimen to engulfthe abraded rubber particles, and to maintain the knivesrelatively free from oils, resins, etc., which might be present inthe specimen. These oils, resins, etc., interfere with theabrasion assessment. A series of five calibration compounds isused to determine that the sharpness of the knives is withinspecified limits and as reference standards to which the volumeloss of any experimental material may be compared.
4. Significance and Use
4.1 The test method may be used to estimate the relativeabrasion resistance of different rubber compounds. No corre-lation between this accelerated test and service performance isgiven or implied, due in part to the widely varying nature ofservice conditions.
5. Interference
5.1 This test method is conducted under controlled condi-tions except for the sharpness of the abrasion knives. Differentrubbers behave differently with respect to the sharpness of theknives.3 For the most uniform test results, the knives must bemaintained within the specifications of 9.5.
6. Apparatus
6.1 Pico Tester— An overall view of the apparatus isillustrated in Fig. 1. The pico tester itself is illustrated in Fig.2.
6.1.1 Turntable, on which the test specimen is mounted androtated.
6.1.2 Instrument Frame, with armature assembly that holdsand lifts the knives. Mounted on top of the assembly is a“dead-weight load box in which masses (weights) may beplaced to regulate the force on the knives. The assembly movesfreely in a bearing housing that permits vertical motion butcounteracts the reaction torque on the knives, thus preventingrotation. Vertical travel, once knives have been lowered ontothe test specimen, is restricted by an arm lock.
6.1.3 Drive Motor, with forward, reverse, and stop controlsto govern the operation of the turntable.
6.1.4 Dusting Powder ReservoirandFeeder Tubes, to sup-ply a uniform flow of dusting powder to the interface of theknives and test specimen during operation.
6.1.5 Pair of Digital Counters, mounted diametrically op-posed to one another on the turntable support.
6.2 Grinder, for preparing the surfaces of test specimens.The grinder shall be equipped with a magnetic plate for holdingthe specimen in place, a micrometer adjustment for controllingthe verticle movement of the abrasive wheel, and a handwheelfor traversing the specimen. The spindle rotational frequencyshall be 956 3 Hz (rps). The size of the abrasive wheel shall
1 This test method is under the jurisdiction of ASTM Committee D-11 on Rubberand is the direct responsibility of Subcommittee D11.15 on Degradation Tests.
Current edition approved April 29, 1988. Published June 1988. Originallypublished as D 2228 – 63 T. Last previous edition D 2228 – 83.
2 Annual Book of ASTM Standards, Vol 09.01.
3 For further information, see Research Report RR: D-11-1022. A copy isavailable from ASTM Headquarters, 100 Barr harbor Drive, West Conshohocken,PA 19428–2959.
1
Copyright © ASTM, 100 Barr Harbor Drive, West Conshohocken, PA 19428-2959, United States.

be about 100 mm (4 in.) in diameter and 12.5 mm (0.5 in.) inwidth with a center mounting hole of 12.7 mm (0.5 in.)diameter. The grit grade of the wheel shall be equivalent toCarborundum C30LB.
6.3 Vacuum Dust Collector, with vacuum sweeper hose ofgum rubber tubing having a tapered tip to provide rapidremoval of the dusting powder and engulfed particles from thespecimen.
6.4 Balance, accurate to60.0001 g.
7. Auxiliary Materials
7.1 Dusting Powder:7.1.1 The dusting powder used shall be a blend of equal
parts by weight of aluminum oxide and diatomaceous earth.The diatomaceous earth should be passed through a No. 200(75-µm) screen and the retained material discarded.4,5
7.1.2 An equal part mixture of the two powders shall bethoroughly blended, densed, and screened. For small quanti-ties, the following procedure is satisfactory: into a sturdyceramic wide-mouth, 4-dm3 jar, place 100 g of each of the twopigments. Blend thoroughly by agitation. Add 1000 g of4.76-mm (3⁄16-in.) steel balls, and place the closed jar on aroller for approximately 8 h atabout 0.33 Hz (rps). Remove thesteel balls. Scrape the densed dust out of the jar and passthrough a No. 30 (600 µm) screen with the aid of a brush.6
4 Alon-C undensed aluminum oxide, manufactured by the Cabot Corp., Boston,MA, has been found satisfactory.
5 “Seneca Standard” Tripoli, Air Float Rose diatomaceous earth, manufacturedby the American Tripoli Co., Seneca, MO, or Double Ground Rose, manufacturedby the Harshaw Chemical Co., Cleveland, OH, has been found satisfactory.
6 A preblend mixture of these pigments is commercially available through theFerry Machine Co., Kent, OH 44240.
FIG. 1 Pico Tester with Auxiliary Apparatus
FIG. 2 Pico Tester
D 2228
2
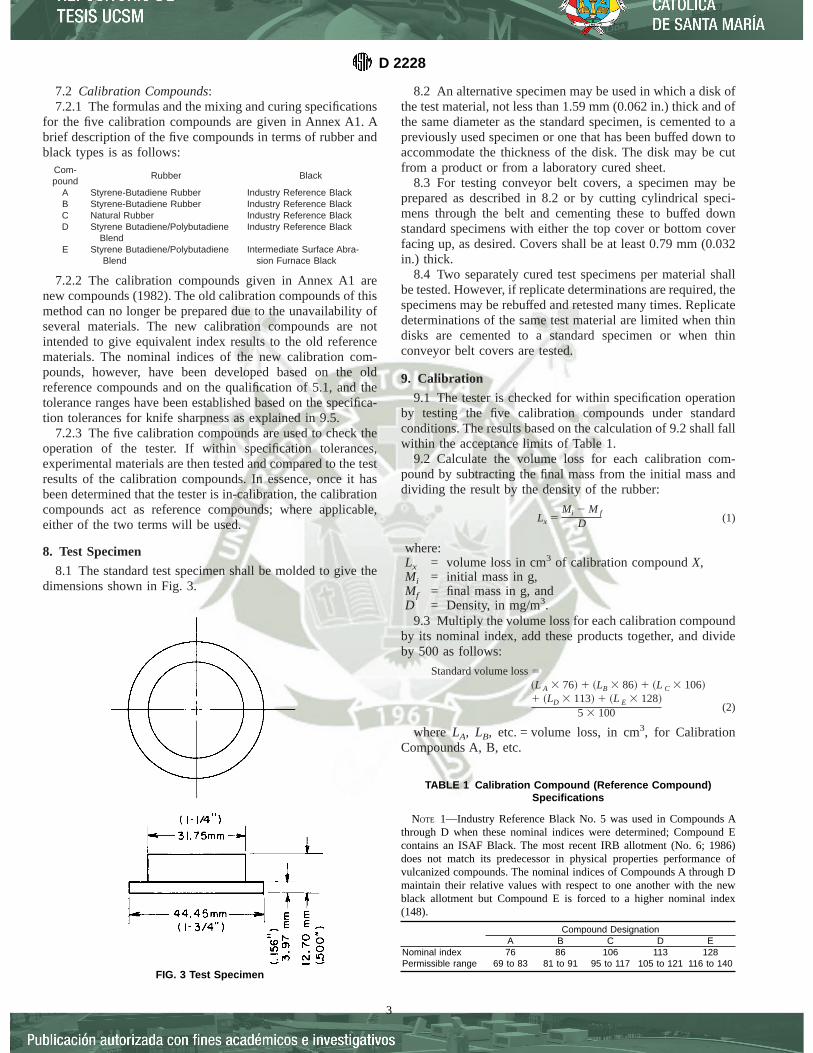
7.2 Calibration Compounds:7.2.1 The formulas and the mixing and curing specifications
for the five calibration compounds are given in Annex A1. Abrief description of the five compounds in terms of rubber andblack types is as follows:
Com-pound
Rubber Black
A Styrene-Butadiene Rubber Industry Reference BlackB Styrene-Butadiene Rubber Industry Reference BlackC Natural Rubber Industry Reference BlackD Styrene Butadiene/Polybutadiene
BlendIndustry Reference Black
E Styrene Butadiene/PolybutadieneBlend
Intermediate Surface Abra-sion Furnace Black
7.2.2 The calibration compounds given in Annex A1 arenew compounds (1982). The old calibration compounds of thismethod can no longer be prepared due to the unavailability ofseveral materials. The new calibration compounds are notintended to give equivalent index results to the old referencematerials. The nominal indices of the new calibration com-pounds, however, have been developed based on the oldreference compounds and on the qualification of 5.1, and thetolerance ranges have been established based on the specifica-tion tolerances for knife sharpness as explained in 9.5.
7.2.3 The five calibration compounds are used to check theoperation of the tester. If within specification tolerances,experimental materials are then tested and compared to the testresults of the calibration compounds. In essence, once it hasbeen determined that the tester is in-calibration, the calibrationcompounds act as reference compounds; where applicable,either of the two terms will be used.
8. Test Specimen
8.1 The standard test specimen shall be molded to give thedimensions shown in Fig. 3.
8.2 An alternative specimen may be used in which a disk ofthe test material, not less than 1.59 mm (0.062 in.) thick and ofthe same diameter as the standard specimen, is cemented to apreviously used specimen or one that has been buffed down toaccommodate the thickness of the disk. The disk may be cutfrom a product or from a laboratory cured sheet.
8.3 For testing conveyor belt covers, a specimen may beprepared as described in 8.2 or by cutting cylindrical speci-mens through the belt and cementing these to buffed downstandard specimens with either the top cover or bottom coverfacing up, as desired. Covers shall be at least 0.79 mm (0.032in.) thick.
8.4 Two separately cured test specimens per material shallbe tested. However, if replicate determinations are required, thespecimens may be rebuffed and retested many times. Replicatedeterminations of the same test material are limited when thindisks are cemented to a standard specimen or when thinconveyor belt covers are tested.
9. Calibration
9.1 The tester is checked for within specification operationby testing the five calibration compounds under standardconditions. The results based on the calculation of 9.2 shall fallwithin the acceptance limits of Table 1.
9.2 Calculate the volume loss for each calibration com-pound by subtracting the final mass from the initial mass anddividing the result by the density of the rubber:
Lx 5Mi 2 M f
D (1)
where:Lx = volume loss in cm3 of calibration compoundX,Mi = initial mass in g,Mf = final mass in g, andD = Density, in mg/m3.
9.3 Multiply the volume loss for each calibration compoundby its nominal index, add these products together, and divideby 500 as follows:
Standard volume loss5~L A 3 76! 1 ~LB 3 86! 1 ~L C 3 106!1 ~LD 3 113! 1 ~L E 3 128!
5 3 100 (2)
where LA, LB, etc. = volume loss, in cm3, for CalibrationCompounds A, B, etc.
FIG. 3 Test Specimen
TABLE 1 Calibration Compound (Reference Compound)Specifications
NOTE 1—Industry Reference Black No. 5 was used in Compounds Athrough D when these nominal indices were determined; Compound Econtains an ISAF Black. The most recent IRB allotment (No. 6; 1986)does not match its predecessor in physical properties performance ofvulcanized compounds. The nominal indices of Compounds A through Dmaintain their relative values with respect to one another with the newblack allotment but Compound E is forced to a higher nominal index(148).
Compound DesignationA B C D E
Nominal indexPermissible range
7669 to 83
8681 to 91
10695 to 117
113105 to 121
128116 to 140
D 2228
3
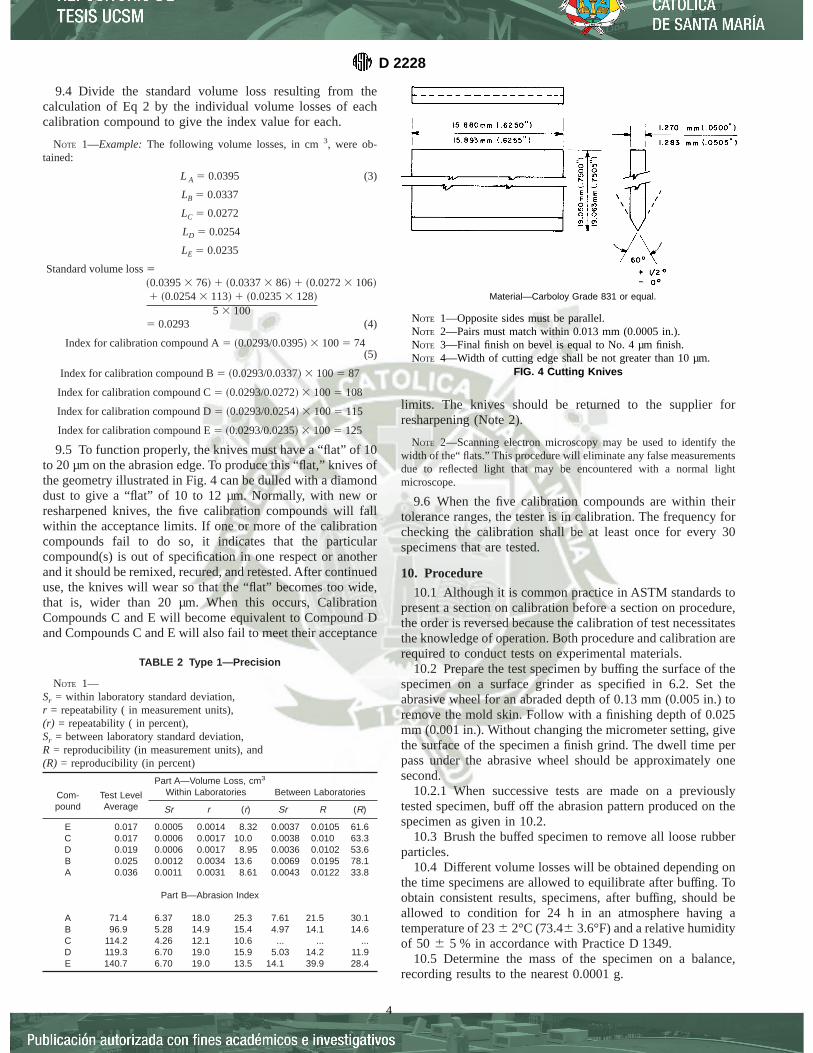
9.4 Divide the standard volume loss resulting from thecalculation of Eq 2 by the individual volume losses of eachcalibration compound to give the index value for each.
NOTE 1—Example:The following volume losses, in cm3, were ob-tained:
L A 5 0.0395 (3)
LB 5 0.0337
LC 5 0.0272
LD 5 0.0254
LE 5 0.0235
Standard volume loss5~0.03953 76! 1 ~0.03373 86! 1 ~0.02723 106!1 ~0.02543 113! 1 ~0.02353 128!
5 3 1005 0.0293 (4)
Index for calibration compound A5 ~0.0293/0.0395! 3 1005 74(5)
Index for calibration compound B5 ~0.0293/0.0337! 3 1005 87
Index for calibration compound C5 ~0.0293/0.0272! 3 1005 108
Index for calibration compound D5 ~0.0293/0.0254! 3 1005 115
Index for calibration compound E5 ~0.0293/0.0235! 3 1005 125
9.5 To function properly, the knives must have a “flat” of 10to 20 µm on the abrasion edge. To produce this “flat,” knives ofthe geometry illustrated in Fig. 4 can be dulled with a diamonddust to give a “flat” of 10 to 12 µm. Normally, with new orresharpened knives, the five calibration compounds will fallwithin the acceptance limits. If one or more of the calibrationcompounds fail to do so, it indicates that the particularcompound(s) is out of specification in one respect or anotherand it should be remixed, recured, and retested. After continueduse, the knives will wear so that the “flat” becomes too wide,that is, wider than 20 µm. When this occurs, CalibrationCompounds C and E will become equivalent to Compound Dand Compounds C and E will also fail to meet their acceptance
limits. The knives should be returned to the supplier forresharpening (Note 2).
NOTE 2—Scanning electron microscopy may be used to identify thewidth of the“ flats.” This procedure will eliminate any false measurementsdue to reflected light that may be encountered with a normal lightmicroscope.
9.6 When the five calibration compounds are within theirtolerance ranges, the tester is in calibration. The frequency forchecking the calibration shall be at least once for every 30specimens that are tested.
10. Procedure
10.1 Although it is common practice in ASTM standards topresent a section on calibration before a section on procedure,the order is reversed because the calibration of test necessitatesthe knowledge of operation. Both procedure and calibration arerequired to conduct tests on experimental materials.
10.2 Prepare the test specimen by buffing the surface of thespecimen on a surface grinder as specified in 6.2. Set theabrasive wheel for an abraded depth of 0.13 mm (0.005 in.) toremove the mold skin. Follow with a finishing depth of 0.025mm (0.001 in.). Without changing the micrometer setting, givethe surface of the specimen a finish grind. The dwell time perpass under the abrasive wheel should be approximately onesecond.
10.2.1 When successive tests are made on a previouslytested specimen, buff off the abrasion pattern produced on thespecimen as given in 10.2.
10.3 Brush the buffed specimen to remove all loose rubberparticles.
10.4 Different volume losses will be obtained depending onthe time specimens are allowed to equilibrate after buffing. Toobtain consistent results, specimens, after buffing, should beallowed to condition for 24 h in an atmosphere having atemperature of 236 2°C (73.463.6°F) and a relative humidityof 50 6 5 % in accordance with Practice D 1349.
10.5 Determine the mass of the specimen on a balance,recording results to the nearest 0.0001 g.
TABLE 2 Type 1—Precision
NOTE 1—Sr = within laboratory standard deviation,r = repeatability ( in measurement units),(r) = repeatability ( in percent),Sr = between laboratory standard deviation,R = reproducibility (in measurement units), and(R) = reproducibility (in percent)
Part A—Volume Loss, cm3
Com-pound
Test LevelAverage
Within Laboratories Between Laboratories
Sr r (r) Sr R (R)
E 0.017 0.0005 0.0014 8.32 0.0037 0.0105 61.6C 0.017 0.0006 0.0017 10.0 0.0038 0.010 63.3D 0.019 0.0006 0.0017 8.95 0.0036 0.0102 53.6B 0.025 0.0012 0.0034 13.6 0.0069 0.0195 78.1A 0.036 0.0011 0.0031 8.61 0.0043 0.0122 33.8
Part B—Abrasion Index
A 71.4 6.37 18.0 25.3 7.61 21.5 30.1B 96.9 5.28 14.9 15.4 4.97 14.1 14.6C 114.2 4.26 12.1 10.6 ... ... ...D 119.3 6.70 19.0 15.9 5.03 14.2 11.9E 140.7 6.70 19.0 13.5 14.1 39.9 28.4
Material—Carboloy Grade 831 or equal.
NOTE 1—Opposite sides must be parallel.NOTE 2—Pairs must match within 0.013 mm (0.0005 in.).NOTE 3—Final finish on bevel is equal to No. 4 µm finish.NOTE 4—Width of cutting edge shall be not greater than 10 µm.
FIG. 4 Cutting Knives
D 2228
4
10.6 Close the power switch for the motor control unit. Letthe thymatrol tubes warm up for two minutes before startingthe motor. After the motor warms up, it can be started, stopped,and reversed at will (Note 3).
NOTE 3—A direct-current driven motor with SCR control may be used.If so, 10.6 can be disregarded.
10.7 Control the rotational frequency of the turntable to1.00 6 0.03 Hz (rps) by a rheostat on the control. Check therotational frequency occasionally with a stopwatch (Note 4).
NOTE 4—A tachometer may be mounted permanently to the apparatusto give a direct indication of rotational frequency.
10.8 The force on the knives for standard conditions shall be44 N (Note 5). The tare of the shaft, chuck, knife holder,knives, and box is stamped on each tester. Add a sufficientamount of lead or steel to attain 44 N.
NOTE 5—The rotational frequency of 1 Hz (rps) with a force of 44 N isa standard condition. If varying severity tests are desired, it is recom-mended that the following conditions be employed:
Rotational Frequency,Hz (rps)
Force,N
Low severityHigh severity
0.501.83
24.588.2
For each condition, the number of revolutions remains the same, that is,a total of 80.
10.9 Clamp the specimen onto the turntable. Start the dusterand adjust so that an even flow (5 mg/s) of dusting powder isestablished.
10.10 Push the forward button, and at the first click of thecounter, lower the knives gently onto the specimen within thefirst quarter revolution following the click. On the twentiethclick, stop the tester within one quarter of a revolution. Stop theduster and lift the knives from the specimen. Vacuum thedusting powder and the abraded rubber particles from thespecimen. Restart the duster and repeat these operations,reversing the direction of rotation for three more increments of20 revolutions, to a total of 80 revolutions, 40 revolutions ineach direction.
10.11 A cylindrical receptacle may be placed around the testspecimen and filled with a sufficient supply of dusting powderso that the knives do not have to be lifted upon change ofrotational direction. Volume losses obtained by this methodwill not be as great, but as long as all test specimens andcalibration compounds are tested similarly, similar index re-sults will be attained. If this procedure is used, some form ofelectronically automated control is permissible.
10.12 Remove the specimen, brush away all loose powderand abraded rubber with a stiff brush and determine the masson a balance, recording the result to the nearest 0.0001 g.
11. Calculation
11.1 Calculate the volume loss from the mass loss anddensity of the tested material. As done in 9.2, 9.3, and 9.4,express the result as an index number obtained by dividing thestandard volume loss of the reference compounds, tested in thesame series, by the volume loss of the tested material andmultiplying the quotient by 100.
11.2 Calculate the index of the tested material against anyone of the reference compounds as described in 11.1. This test
method is particularly useful when employing nonstandardseverity conditions.
12. Report
12.1 The report shall include the following:12.1.1 Identification of the tested specimens,12.1.2 Cure time and temperature,12.1.3 Density,12.1.4 Force on knives used,12.1.5 Rotational frequency used,12.1.6 Initial specimen mass,12.1.7 Final specimen mass,12.1.8 Specimen mass loss,12.1.9 Specimen volume loss, and12.1.10 Abrasion index with the test method used to calcu-
late the index as described in 11.1 or 11.2.
13. Precision and Bias7
13.1 These precision statements have been prepared inaccordance with Practice D 4483. Please refer to this practicefor terminology and other testing and statistical conceptexplanations.
13.2 Type 1—Precision data have been compiled whichexcludes the compounding variation among laboratories.
13.3 The statements were developed from interlaboratorytesting of the five new Calibration Compounds (A–E). Thesefive compounds were mixed in a B Banbury internal mixerwith curatives added on a mill. All specimens of the samecompound were cured from the same mix.
13.4 The precision statements are based on the testing offive samples by six laboratories on two days.
13.5 A test result is defined to be the average of twoseparately cured specimens.
13.6 Precision statements were prepared for both volumeloss and abrasion index. Volume loss is the measure of thephysical differences among the interlaboratory testers andindex is a measure of the test method in general.
13.7 The precision of this test method may be expressed inthe format of the following statements that use an appropriatevalue of r, R, (r), or (R), that is, that value to be used indecisions about test results (obtained with this test method).Theappropriate valueis that value ofr or R associated with amean level in the precision table closest to the mean levelunder consideration (at any given time, for any given material)in routine testing operations.
13.8 Repeatability— The repeatabilityr, of this test methodhas been established as theappropriate valuetabulated in theprecision tables. Two single test results, obtained under normaltest method procedures, that differ by more than this tabulatedr (for any given level) must be considered as derived fromdifferent or non-identical sample populations.
13.9 Reproducibility— The reproducibilityR, of this testmethod has been established as theappropriate valuetabulatedin the precision tables. Two single test results obtained in twodifferent laboratories, under normal test method procedures,
7 Supporting data are available from ASTM Headquarters. Request RR:D11–1022.
D 2228
5
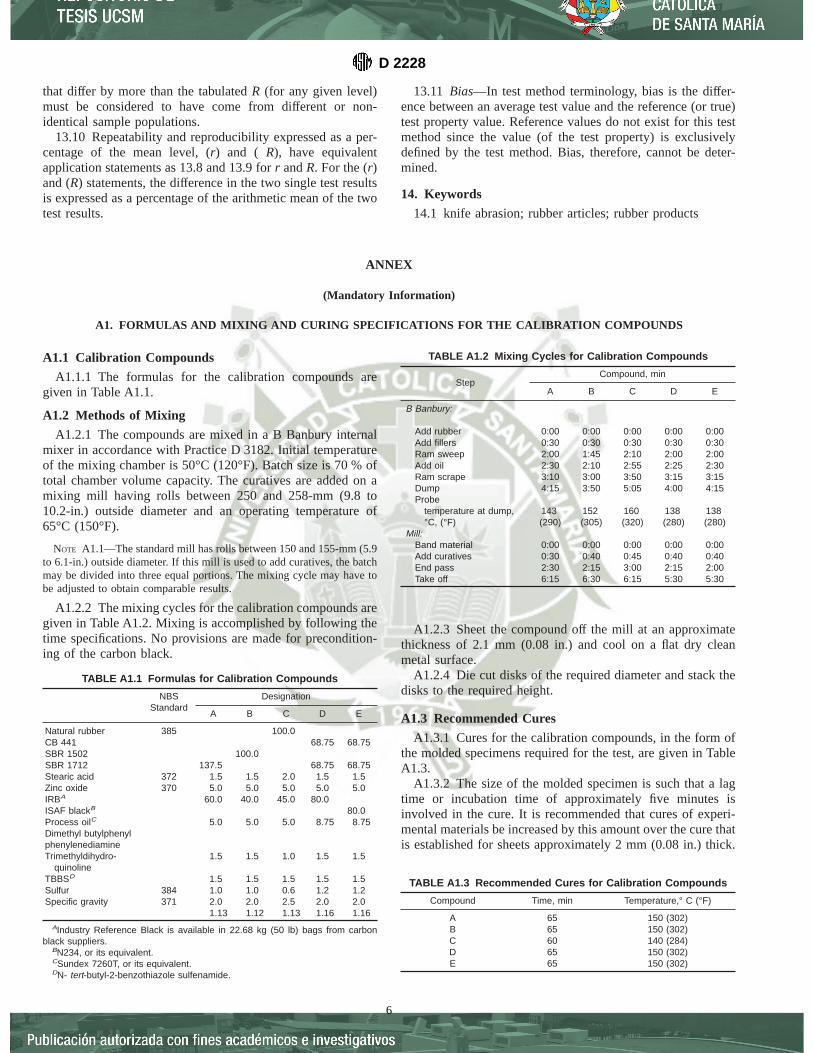
that differ by more than the tabulatedR (for any given level)must be considered to have come from different or non-identical sample populations.
13.10 Repeatability and reproducibility expressed as a per-centage of the mean level, (r) and (R), have equivalentapplication statements as 13.8 and 13.9 forr andR. For the (r)and (R) statements, the difference in the two single test resultsis expressed as a percentage of the arithmetic mean of the twotest results.
13.11 Bias—In test method terminology, bias is the differ-ence between an average test value and the reference (or true)test property value. Reference values do not exist for this testmethod since the value (of the test property) is exclusivelydefined by the test method. Bias, therefore, cannot be deter-mined.
14. Keywords
14.1 knife abrasion; rubber articles; rubber products
ANNEX
(Mandatory Information)
A1. FORMULAS AND MIXING AND CURING SPECIFICATIONS FOR THE CALIBRATION COMPOUNDS
A1.1 Calibration Compounds
A1.1.1 The formulas for the calibration compounds aregiven in Table A1.1.
A1.2 Methods of Mixing
A1.2.1 The compounds are mixed in a B Banbury internalmixer in accordance with Practice D 3182. Initial temperatureof the mixing chamber is 50°C (120°F). Batch size is 70 % oftotal chamber volume capacity. The curatives are added on amixing mill having rolls between 250 and 258-mm (9.8 to10.2-in.) outside diameter and an operating temperature of65°C (150°F).
NOTE A1.1—The standard mill has rolls between 150 and 155-mm (5.9to 6.1-in.) outside diameter. If this mill is used to add curatives, the batchmay be divided into three equal portions. The mixing cycle may have tobe adjusted to obtain comparable results.
A1.2.2 The mixing cycles for the calibration compounds aregiven in Table A1.2. Mixing is accomplished by following thetime specifications. No provisions are made for precondition-ing of the carbon black.
A1.2.3 Sheet the compound off the mill at an approximatethickness of 2.1 mm (0.08 in.) and cool on a flat dry cleanmetal surface.
A1.2.4 Die cut disks of the required diameter and stack thedisks to the required height.
A1.3 Recommended Cures
A1.3.1 Cures for the calibration compounds, in the form ofthe molded specimens required for the test, are given in TableA1.3.
A1.3.2 The size of the molded specimen is such that a lagtime or incubation time of approximately five minutes isinvolved in the cure. It is recommended that cures of experi-mental materials be increased by this amount over the cure thatis established for sheets approximately 2 mm (0.08 in.) thick.
TABLE A1.1 Formulas for Calibration Compounds
NBSStandard
Designation
A B C D E
Natural rubber 385 100.0CB 441 68.75 68.75SBR 1502 100.0SBR 1712 137.5 68.75 68.75Stearic acid 372 1.5 1.5 2.0 1.5 1.5Zinc oxide 370 5.0 5.0 5.0 5.0 5.0IRBA 60.0 40.0 45.0 80.0ISAF blackB 80.0Process oilC 5.0 5.0 5.0 8.75 8.75Dimethyl butylphenylphenylenediamineTrimethyldihydro- 1.5 1.5 1.0 1.5 1.5
quinolineTBBSD 1.5 1.5 1.5 1.5 1.5Sulfur 384 1.0 1.0 0.6 1.2 1.2Specific gravity 371 2.0 2.0 2.5 2.0 2.0
1.13 1.12 1.13 1.16 1.16AIndustry Reference Black is available in 22.68 kg (50 lb) bags from carbon
black suppliers.BN234, or its equivalent.CSundex 7260T, or its equivalent.DN- tert-butyl-2-benzothiazole sulfenamide.
TABLE A1.2 Mixing Cycles for Calibration Compounds
StepCompound, min
A B C D E
B Banbury:
Add rubber 0:00 0:00 0:00 0:00 0:00Add fillers 0:30 0:30 0:30 0:30 0:30Ram sweep 2:00 1:45 2:10 2:00 2:00Add oil 2:30 2:10 2:55 2:25 2:30Ram scrape 3:10 3:00 3:50 3:15 3:15DumpProbe
4:15 3:50 5:05 4:00 4:15
temperature at dump,°C, (°F)
143(290)
152(305)
160(320)
138(280)
138(280)
Mill:Band material 0:00 0:00 0:00 0:00 0:00Add curatives 0:30 0:40 0:45 0:40 0:40End pass 2:30 2:15 3:00 2:15 2:00Take off 6:15 6:30 6:15 5:30 5:30
TABLE A1.3 Recommended Cures for Calibration Compounds
Compound Time, min Temperature,° C (°F)
A 65 150 (302)B 65 150 (302)C 60 140 (284)D 65 150 (302)E 65 150 (302)
D 2228
6

The American Society for Testing and Materials takes no position respecting the validity of any patent rights asserted in connectionwith any item mentioned in this standard. Users of this standard are expressly advised that determination of the validity of any suchpatent rights, and the risk of infringement of such rights, are entirely their own responsibility.
This standard is subject to revision at any time by the responsible technical committee and must be reviewed every five years andif not revised, either reapproved or withdrawn. Your comments are invited either for revision of this standard or for additional standardsand should be addressed to ASTM Headquarters. Your comments will receive careful consideration at a meeting of the responsibletechnical committee, which you may attend. If you feel that your comments have not received a fair hearing you should make yourviews known to the ASTM Committee on Standards, at the address shown below.
This standard is copyrighted by ASTM, 100 Barr Harbor Drive, PO Box C700, West Conshohocken, PA 19428-2959, United States.Individual reprints (single or multiple copies) of this standard may be obtained by contacting ASTM at the above address or at610-832-9585 (phone), 610-832-9555 (fax), or [email protected] (e-mail); or through the ASTM website (www.astm.org).
D 2228
7

Designation: D 2229 – 99
Standard Test Method forAdhesion Between Steel Tire Cords and Rubber 1
This standard is issued under the fixed designation D 2229; the number immediately following the designation indicates the year oforiginal adoption or, in the case of revision, the year of last revision. A number in parentheses indicates the year of last reapproval. Asuperscript epsilon (e) indicates an editorial change since the last revision or reapproval.
1. Scope
1.1 This test method covers the determination of the forcerequired to pull a steel cord from a block of vulcanized rubber.
1.2 Although designed primarily for steel cord, this testmethod may be applied with modifications to wire used inrubber products.
1.3 This test method can also be used for evaluating rubbercompound performance with respect to adhesion to steel cord.
1.4 The values stated in SI units are to be regarded as thestandard. No other units of measurement are included in thisstandard.
1.5 This standard does not purport to address all of thesafety concerns, if any, associated with its use. It is theresponsibility of the user of this standard to establish appro-priate safety and health practices and determine the applica-bility of regulatory limitations prior to use.
2. Referenced Documents
2.1 ASTM Standards:D 76 Specification for Tensile Testing Machines for Tex-
tiles2
D 123 Terminology Relating to Textiles2
D 1566 Terminology Relating to Rubber3
D 2904 Practice for Interlaboratory Testing of a Textile TestMethod that Produces Normally Distributed Data2
E 105 Practice for Probability Sampling of Materials4
E 122 Practice for Choice of Sample Size to Estimate aMeasure of Quality for a Lot or Process4
3. Terminology
3.1 Definitions3.1.1 adhesion, n—in tire fabrics, the force required to
separate a textile material from rubber or other elastomer by adefinite prescribed method.
3.1.2 rubber compound, n—as used in the manufacture ofrubber articles, an intimate mixture of elastomer(s) with allmaterials necessary for the finished article.
3.1.3 steel cord, n—a formed structure made of two or moresteel filaments when used as an end product or a combination
of strands or filaments and strands.3.1.4 For definitions of other textile or rubber terms used in
this test method refer to Terminology D 123 or TerminologyD 1566.
4. Summary of Test Method
4.1 The steel cords are vulcanized into a block of rubber andthe force necessary to pull the cords linearly out of the rubberis measured.
5. Significance and Use
5.1 This test method is considered satisfactory for theacceptance testing of commercial shipments of steel tire cordbecause current estimates of between-laboratory precision forsingle materials are considered acceptable and the method hasbeen used extensively in the trade for acceptance testing.
5.1.1 If there are differences or practical significances be-tween reported test results for two laboratories (or more),comparative tests should be performed to determine if there isa statistical bias between them, using competent statisticalassistance. As a minimum, the test samples should be used thatare as homogenous as possible, that are drawn from thematerial from which the disparate test results were obtained,and that are randomly assigned in equal numbers to eachlaboratory for testing. Other materials with established testvalues may be used for this purpose. The test results from thetwo laboratories should be compared using a statistical test forunpaired data, at a probability level chosen prior to the testingseries. If a bias is found, either its cause must be found andcorrected, or future test results must be adjusted in consider-ation of the known bias.
5.2 The mold described in this test method is primarilydesigned for quality acceptance testing for steel cord where thesample size for each cord is 4 or a multiple thereof, but anymold/cavity combination which will provide the required testblock dimensions (Figs. 1 and 2) is acceptable.
5.3 Appendix X1 contains suggested ranges of environmen-tal conditions for aging tests.
5.4 The property measured by this test method indicateswhether the adhesion of the steel cord to the rubber is greaterthan the cohesion of the rubber, that is, complete rubbercoverage of the steel cord, or less than the cohesion of therubber, that is, lack of rubber coverage.
6. Apparatus
6.1 Mold (Figs. 2 and 3)—The mold is designed to produce
1 This test method is under the jurisdiction of ASTM Committee D-13 on Textilesand is the direct responsibility of Subcommittee D13.19 on Tire Cord and Fabrics.
Current edition approved Nov. 10, 1999. Published January 2000. Originallypublished as D 2229 –63 T. Last previous edition D 2229 – 98.
2 Annual Book of ASTM Standards, Vol 07.01.3 Annual Book of ASTM Standards, Vol 09.01.4 Annual Book of ASTM Standards, Vol 14.02.
1
Copyright © ASTM, 100 Barr Harbor Drive, West Conshohocken, PA 19428-2959, United States.
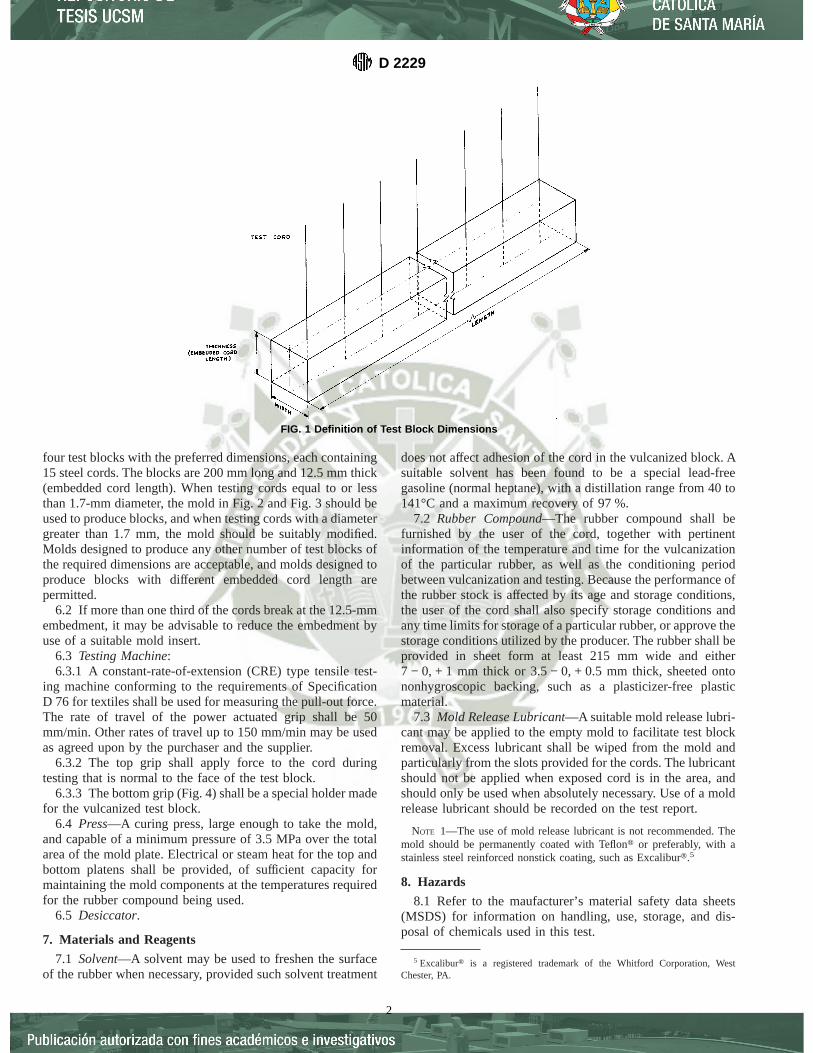
four test blocks with the preferred dimensions, each containing15 steel cords. The blocks are 200 mm long and 12.5 mm thick(embedded cord length). When testing cords equal to or lessthan 1.7-mm diameter, the mold in Fig. 2 and Fig. 3 should beused to produce blocks, and when testing cords with a diametergreater than 1.7 mm, the mold should be suitably modified.Molds designed to produce any other number of test blocks ofthe required dimensions are acceptable, and molds designed toproduce blocks with different embedded cord length arepermitted.
6.2 If more than one third of the cords break at the 12.5-mmembedment, it may be advisable to reduce the embedment byuse of a suitable mold insert.
6.3 Testing Machine:6.3.1 A constant-rate-of-extension (CRE) type tensile test-
ing machine conforming to the requirements of SpecificationD 76 for textiles shall be used for measuring the pull-out force.The rate of travel of the power actuated grip shall be 50mm/min. Other rates of travel up to 150 mm/min may be usedas agreed upon by the purchaser and the supplier.
6.3.2 The top grip shall apply force to the cord duringtesting that is normal to the face of the test block.
6.3.3 The bottom grip (Fig. 4) shall be a special holder madefor the vulcanized test block.
6.4 Press—A curing press, large enough to take the mold,and capable of a minimum pressure of 3.5 MPa over the totalarea of the mold plate. Electrical or steam heat for the top andbottom platens shall be provided, of sufficient capacity formaintaining the mold components at the temperatures requiredfor the rubber compound being used.
6.5 Desiccator.
7. Materials and Reagents
7.1 Solvent—A solvent may be used to freshen the surfaceof the rubber when necessary, provided such solvent treatment
does not affect adhesion of the cord in the vulcanized block. Asuitable solvent has been found to be a special lead-freegasoline (normal heptane), with a distillation range from 40 to141°C and a maximum recovery of 97 %.
7.2 Rubber Compound—The rubber compound shall befurnished by the user of the cord, together with pertinentinformation of the temperature and time for the vulcanizationof the particular rubber, as well as the conditioning periodbetween vulcanization and testing. Because the performance ofthe rubber stock is affected by its age and storage conditions,the user of the cord shall also specify storage conditions andany time limits for storage of a particular rubber, or approve thestorage conditions utilized by the producer. The rubber shall beprovided in sheet form at least 215 mm wide and either7 − 0, + 1 mm thick or 3.5 − 0, + 0.5 mm thick, sheeted ontononhygroscopic backing, such as a plasticizer-free plasticmaterial.
7.3 Mold Release Lubricant—A suitable mold release lubri-cant may be applied to the empty mold to facilitate test blockremoval. Excess lubricant shall be wiped from the mold andparticularly from the slots provided for the cords. The lubricantshould not be applied when exposed cord is in the area, andshould only be used when absolutely necessary. Use of a moldrelease lubricant should be recorded on the test report.
NOTE 1—The use of mold release lubricant is not recommended. Themold should be permanently coated with Teflont or preferably, with astainless steel reinforced nonstick coating, such as Excaliburt.5
8. Hazards
8.1 Refer to the maufacturer’s material safety data sheets(MSDS) for information on handling, use, storage, and dis-posal of chemicals used in this test.
5 Excaliburt is a registered trademark of the Whitford Corporation, WestChester, PA.
FIG. 1 Definition of Test Block Dimensions
D 2229
2
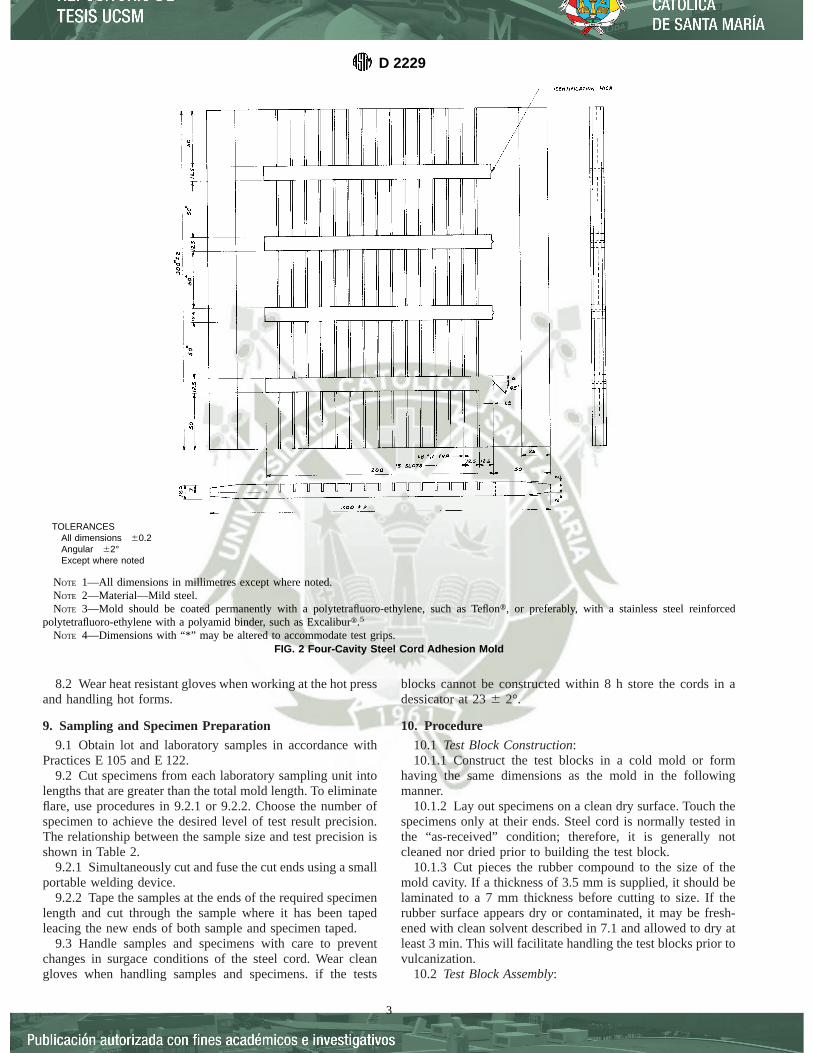
8.2 Wear heat resistant gloves when working at the hot pressand handling hot forms.
9. Sampling and Specimen Preparation
9.1 Obtain lot and laboratory samples in accordance withPractices E 105 and E 122.
9.2 Cut specimens from each laboratory sampling unit intolengths that are greater than the total mold length. To eliminateflare, use procedures in 9.2.1 or 9.2.2. Choose the number ofspecimen to achieve the desired level of test result precision.The relationship between the sample size and test precision isshown in Table 2.
9.2.1 Simultaneously cut and fuse the cut ends using a smallportable welding device.
9.2.2 Tape the samples at the ends of the required specimenlength and cut through the sample where it has been tapedleacing the new ends of both sample and specimen taped.
9.3 Handle samples and specimens with care to preventchanges in surgace conditions of the steel cord. Wear cleangloves when handling samples and specimens. if the tests
blocks cannot be constructed within 8 h store the cords in adessicator at 236 2°.
10. Procedure
10.1 Test Block Construction:10.1.1 Construct the test blocks in a cold mold or form
having the same dimensions as the mold in the followingmanner.
10.1.2 Lay out specimens on a clean dry surface. Touch thespecimens only at their ends. Steel cord is normally tested inthe “as-received” condition; therefore, it is generally notcleaned nor dried prior to building the test block.
10.1.3 Cut pieces the rubber compound to the size of themold cavity. If a thickness of 3.5 mm is supplied, it should belaminated to a 7 mm thickness before cutting to size. If therubber surface appears dry or contaminated, it may be fresh-ened with clean solvent described in 7.1 and allowed to dry atleast 3 min. This will facilitate handling the test blocks prior tovulcanization.
10.2 Test Block Assembly:
TOLERANCESAll dimensions 60.2Angular 62°Except where noted
NOTE 1—All dimensions in millimetres except where noted.NOTE 2—Material—Mild steel.NOTE 3—Mold should be coated permanently with a polytetrafluoro-ethylene, such as Teflont, or preferably, with a stainless steel reinforced
polytetrafluoro-ethylene with a polyamid binder, such as Excaliburt.5
NOTE 4—Dimensions with “*” may be altered to accommodate test grips.FIG. 2 Four-Cavity Steel Cord Adhesion Mold
D 2229
3
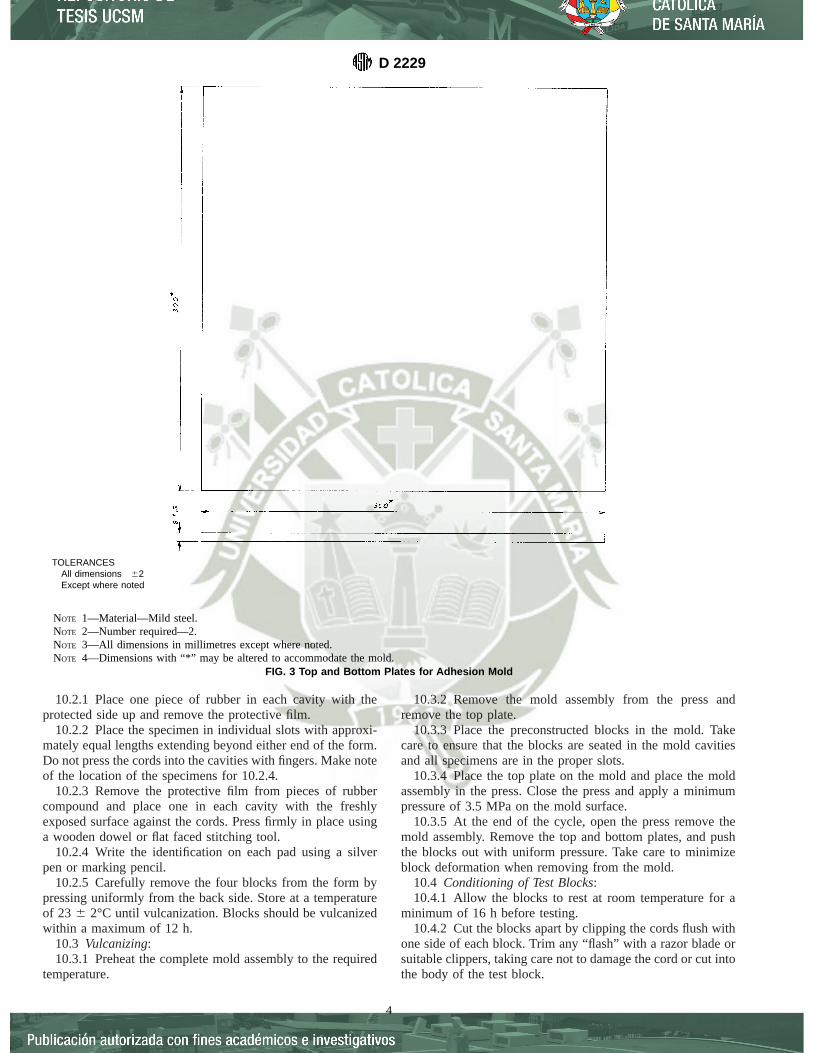
10.2.1 Place one piece of rubber in each cavity with theprotected side up and remove the protective film.
10.2.2 Place the specimen in individual slots with approxi-mately equal lengths extending beyond either end of the form.Do not press the cords into the cavities with fingers. Make noteof the location of the specimens for 10.2.4.
10.2.3 Remove the protective film from pieces of rubbercompound and place one in each cavity with the freshlyexposed surface against the cords. Press firmly in place usinga wooden dowel or flat faced stitching tool.
10.2.4 Write the identification on each pad using a silverpen or marking pencil.
10.2.5 Carefully remove the four blocks from the form bypressing uniformly from the back side. Store at a temperatureof 23 6 2°C until vulcanization. Blocks should be vulcanizedwithin a maximum of 12 h.
10.3 Vulcanizing:10.3.1 Preheat the complete mold assembly to the required
temperature.
10.3.2 Remove the mold assembly from the press andremove the top plate.
10.3.3 Place the preconstructed blocks in the mold. Takecare to ensure that the blocks are seated in the mold cavitiesand all specimens are in the proper slots.
10.3.4 Place the top plate on the mold and place the moldassembly in the press. Close the press and apply a minimumpressure of 3.5 MPa on the mold surface.
10.3.5 At the end of the cycle, open the press remove themold assembly. Remove the top and bottom plates, and pushthe blocks out with uniform pressure. Take care to minimizeblock deformation when removing from the mold.
10.4 Conditioning of Test Blocks:10.4.1 Allow the blocks to rest at room temperature for a
minimum of 16 h before testing.10.4.2 Cut the blocks apart by clipping the cords flush with
one side of each block. Trim any “flash” with a razor blade orsuitable clippers, taking care not to damage the cord or cut intothe body of the test block.
TOLERANCESAll dimensions 62Except where noted
NOTE 1—Material—Mild steel.NOTE 2—Number required—2.NOTE 3—All dimensions in millimetres except where noted.NOTE 4—Dimensions with “*” may be altered to accommodate the mold.
FIG. 3 Top and Bottom Plates for Adhesion Mold
D 2229
4
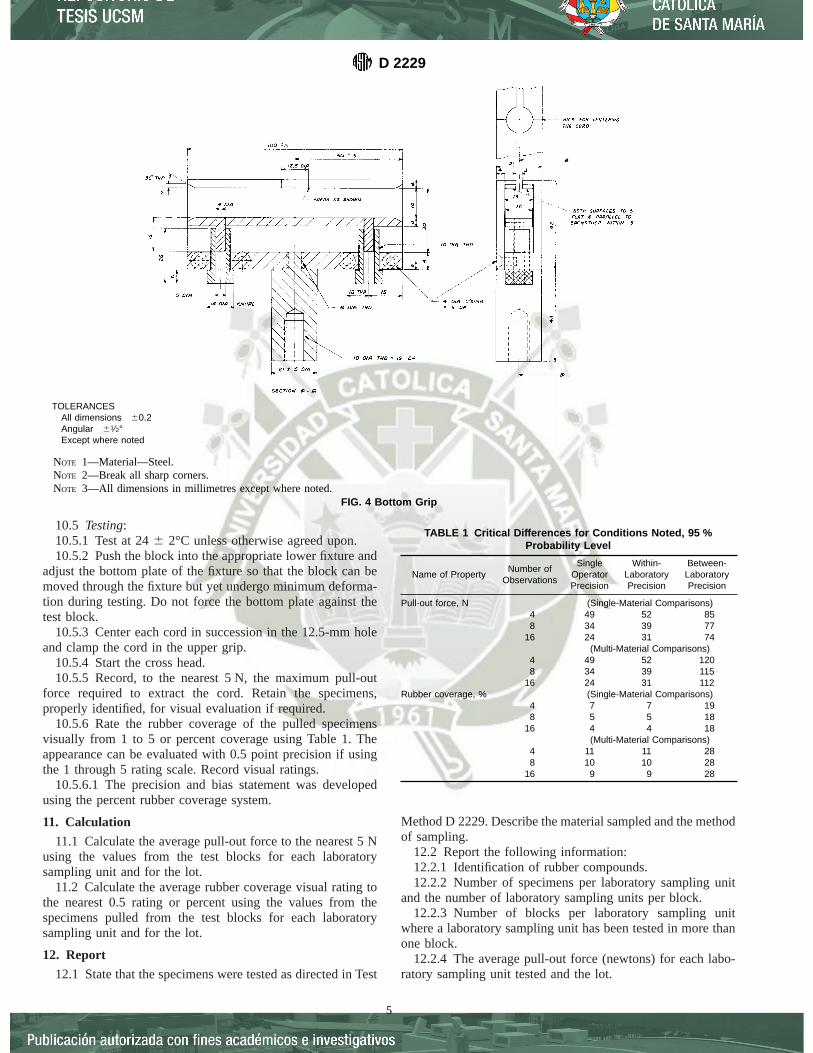
10.5 Testing:10.5.1 Test at 246 2°C unless otherwise agreed upon.10.5.2 Push the block into the appropriate lower fixture and
adjust the bottom plate of the fixture so that the block can bemoved through the fixture but yet undergo minimum deforma-tion during testing. Do not force the bottom plate against thetest block.
10.5.3 Center each cord in succession in the 12.5-mm holeand clamp the cord in the upper grip.
10.5.4 Start the cross head.10.5.5 Record, to the nearest 5 N, the maximum pull-out
force required to extract the cord. Retain the specimens,properly identified, for visual evaluation if required.
10.5.6 Rate the rubber coverage of the pulled specimensvisually from 1 to 5 or percent coverage using Table 1. Theappearance can be evaluated with 0.5 point precision if usingthe 1 through 5 rating scale. Record visual ratings.
10.5.6.1 The precision and bias statement was developedusing the percent rubber coverage system.
11. Calculation
11.1 Calculate the average pull-out force to the nearest 5 Nusing the values from the test blocks for each laboratorysampling unit and for the lot.
11.2 Calculate the average rubber coverage visual rating tothe nearest 0.5 rating or percent using the values from thespecimens pulled from the test blocks for each laboratorysampling unit and for the lot.
12. Report
12.1 State that the specimens were tested as directed in Test
Method D 2229. Describe the material sampled and the methodof sampling.
12.2 Report the following information:12.2.1 Identification of rubber compounds.12.2.2 Number of specimens per laboratory sampling unit
and the number of laboratory sampling units per block.12.2.3 Number of blocks per laboratory sampling unit
where a laboratory sampling unit has been tested in more thanone block.
12.2.4 The average pull-out force (newtons) for each labo-ratory sampling unit tested and the lot.
TOLERANCESAll dimensions 60.2Angular 61⁄2°Except where noted
NOTE 1—Material—Steel.NOTE 2—Break all sharp corners.NOTE 3—All dimensions in millimetres except where noted.
FIG. 4 Bottom Grip
TABLE 1 Critical Differences for Conditions Noted, 95 %Probability Level
Name of PropertyNumber of
Observations
SingleOperatorPrecision
Within-LaboratoryPrecision
Between-LaboratoryPrecision
Pull-out force, N (Single-Material Comparisons)4 49 52 858 34 39 77
16 24 31 74(Multi-Material Comparisons)
4 49 52 1208 34 39 115
16 24 31 112Rubber coverage, % (Single-Material Comparisons)
4 7 7 198 5 5 18
16 4 4 18(Multi-Material Comparisons)
4 11 11 288 10 10 28
16 9 9 28
D 2229
5

12.2.5 Date of test.12.2.6 Rate of extension, if not standard.12.2.7 Vulcanization time and temperature.12.2.8 Visual evaluation, if required.12.2.9 Any modifications to the test.
13. Precision and Bias
13.1 Summary—In comparing two averages of four obser-vations, the difference between averages should not exceed thefollowing amounts in 95 out of 100 cases when all of theobservations are taken by the same well-trained operator usingthe same piece of equipment and specimens are randomlydrawn from the same sample of material:
Pull-out force, 50 NRubber coverage, 10 %
13.1.1 Because the pull-out force is affected significantly bythe thickness of the steel tire cord, larger or smaller differencesare likely to occur when testing steel tire cords with thicknessesoutside the range of the specimens used in the interlaboratoryevaluation that generated these data.
13.2 Interlaboratory Test Data—An interlaboratory evalu-ation was conducted in 1990 in which randomly drawn samplesof two constructions of steel tire cord and two different rubbercompounds were tested in the four possible combinations in 10laboratories in accordance with Practice D 2904. Each labora-tory used two operators, each of whom tested the four materialson two separate days. Initial analysis of the data indicated thatthe results from two of the laboratories were statistical outliers,and upon investigation the cause for this condition wasdetermined to be failure to follow the test method properly. Thedata from the two laboratories was deleted prior to furtheranalysis.
13.2.1 The steel tire cords used in the laboratory evaluationwere of the following construction and nominal thickness:
Cord 1 1 3 2 + 7 3 0.22 mm 0.81 mmCord 2 (1 3 3 3 0.20 mm) + 6 3 0.35 mm 1.13 mm
The details of the formulation of the rubber compounds arecontained in a research report.6
13.3 Precision—Two test results should be considered sig-nificantly different at the 95 % probability level if the differ-ence equals or exceeds the critical differences listed in Table 2.For the purposes of the interlaboratory evaluation, each com-bination of steel tire cord and rubber compound was consideredas a different material; therefore, caution should be exercisedwhen referring to the critical differences for multi-materialcomparisons.
13.4 Bias—The procedures in this test method produce testvalues that can be defined only in terms of a test method. Thereis no independent referee method by which bias may bedetermined. This test method has no known bias.
NOTE 2—The tabulated values of the critical differences should beconsidered to be a general statement, particularly with respect to between-laboratory precision. Before a meaningful statement can be made abouttwo specific laboratories, the amount of statistical bias, if any, betweenthem must be established, with each comparison being based on recentdata obtained on specimens taken from a lot of material of the type beingevaluated so as to be as nearly homogeneous as possible and thenrandomly assigned in equal numbers to each of the laboratories (see5.1.1).
14. Keywords
14.1 adhesion; rubber; steel; tire cord
APPENDIX
(Nonmandatory Information)
X1. SUGGESTED RANGES OF CONDITIONS FOR ACCELERATED AGING OF STEEL CORD ADHESION BLOCKS
6 Supporting data is available from ASTM Headquarters. Request RR: D13-1054.
TABLE X1.1 Ranges of Conditions for Accelerated Aging of Steel Cord Adhesion Blocks
Uncured humidity 90–95 % RH, 35–40°CCured humidity 90–95 % RH, 35–40°C or 95–100 % RH, 70–80°COxygen 70–80°CSteam 120–130°CThermal 100–120°C
D 2229
6

The American Society for Testing and Materials takes no position respecting the validity of any patent rights asserted in connectionwith any item mentioned in this standard. Users of this standard are expressly advised that determination of the validity of any suchpatent rights, and the risk of infringement of such rights, are entirely their own responsibility.
This standard is subject to revision at any time by the responsible technical committee and must be reviewed every five years andif not revised, either reapproved or withdrawn. Your comments are invited either for revision of this standard or for additional standardsand should be addressed to ASTM Headquarters. Your comments will receive careful consideration at a meeting of the responsibletechnical committee, which you may attend. If you feel that your comments have not received a fair hearing you should make yourviews known to the ASTM Committee on Standards, at the address shown below.
This standard is copyrighted by ASTM, 100 Barr Harbor Drive, PO Box C700, West Conshohocken, PA 19428-2959, United States.Individual reprints (single or multiple copies) of this standard may be obtained by contacting ASTM at the above address or at610-832-9585 (phone), 610-832-9555 (fax), or [email protected] (e-mail); or through the ASTM website (www.astm.org).
D 2229
7

Designation: D 2240 – 02
Standard Test Method forRubber Property—Durometer Hardness 1
This standard is issued under the fixed designation D 2240; the number immediately following the designation indicates the year oforiginal adoption or, in the case of revision, the year of last revision. A number in parentheses indicates the year of last reapproval. Asuperscript epsilon (e) indicates an editorial change since the last revision or reapproval.
This standard has been approved for use by agencies of the Department of Defense.
1. Scope
1.1 This test method describes eight types of rubber hard-ness measurement devices known as durometers: types A, B,C, D, DO, O, OO and M. The procedure for determiningindentation hardness of substances classified as thermoplasticelastomers, vulcanized (thermoset) rubber, elastomeric materi-als, cellular materials, and some plastics is also described.
1.2 This test method is not equivalent to other indentationhardness methods and instrument types, specifically thosedescribed in Test Method D 1415.
1.3 This test method is not applicable to the testing ofcoated fabrics.
1.4 The values stated in SI units are to be regarded asstandard. The values given in parentheses are for informationonly. Many of the stated dimensions in SI are direct conver-sions from the U. S. Customary System to accommodate theinstrumentation, practices and procedures that existed prior tothe Metric Conversion Act of 1975.
1.5 All materials, instruments, or equipment used for thedetermination of mass, force or dimension shall have traceabil-ity to the National Institute for Standards and Technology, orother internationally recognized organization parallel in nature.
1.6 This standard does not purport to address all of thesafety concerns, if any, associated with its use. It is theresponsibility of the user of this standard to establish appro-priate safety and health practices and determine the applica-bility of regulatory limitations prior to use.
2. Referenced Documents
2.1 ASTM Standards:D 374 Test Methods for Thickness of Solid Electrical Insu-
lation2
D 618 Practice for Conditioning Plastics for Testing3
D 785 Test Method for Rockwell Hardness of Plastics andElectrical Insulating Materials3
D 1349 Practice for Rubber—Standard Temperatures ForTesting4
D 1415 Test Method for Rubber Property—InternationalHardness4
D 4483 Practice for Determining Precision for Test MethodStandards in the Rubber and Carbon Black Industries4
F 1957 Test Method for Composite Foam Hardness-Durometer Hardness5
3. Summary of Test Method
3.1 This test method permits hardness measurements basedon either initial indentation or indentation after a specifiedperiod of time, or both. Durometers with maximum readingindicators used to determine maximum hardness values of amaterial may yield lower hardness when the maximum indi-cator is used.
3.2 The procedures for Type M, or micro hardness durom-eters, accommodate specimens that are, by their dimensions orconfiguration, ordinarily unable to have their durometer hard-ness determined by the other durometer types described. TypeM durometers are intended for the testing of specimens havinga thickness or cross sectional diameter of 1.25 mm (0.050 in.)or greater, although specimens of lesser dimensions may besuccessfully accommodated under the conditions specified inSection 6, and have a Type M durometer hardness range ofbetween 20 and 90. Those specimens which have a durometerhardness range other than specified shall use another suitableprocedure for determining durometer hardness.
4. Significance and Use
4.1 This test method is based on the penetration of a specifictype of indentor when forced into the material under specifiedconditions. The indentation hardness is inversely related to thepenetration and is dependent on the elastic modulus andviscoelastic behavior of the material.The geometry of theindentor and the applied force influence the measurementssuch that no simple relationship exists between the measure-ments obtained with one type of durometer and those obtainedwith another type of durometer or other instruments used formeasuring hardness. This test method is an empirical test
1 This test method is under the jurisdiction of ASTM Committee D11 on Rubberand is the direct responsibility of Subcommittee D11.10 on Physical Testing.
Current edition approved Jan 10, 2002. Published March 2002. Originallypublished as D 2240 – 64 T. Last previous edition D 2240 – 00.
2 Annual Book of ASTM Standards, Vol 10.01.3 Annual Book of ASTM Standards, Vol 08.01. 4 Annual Book of ASTM Standards, Vol 09.01.
5 Annual Book of ASTM Standards, Vol 15.07.
1
Copyright © ASTM International, 100 Barr Harbor Drive, PO Box C700, West Conshohocken, PA 19428-2959, United States.
COPYRIGHT ASTM InternationalLicensed by Information Handling ServicesCOPYRIGHT ASTM InternationalLicensed by Information Handling Services
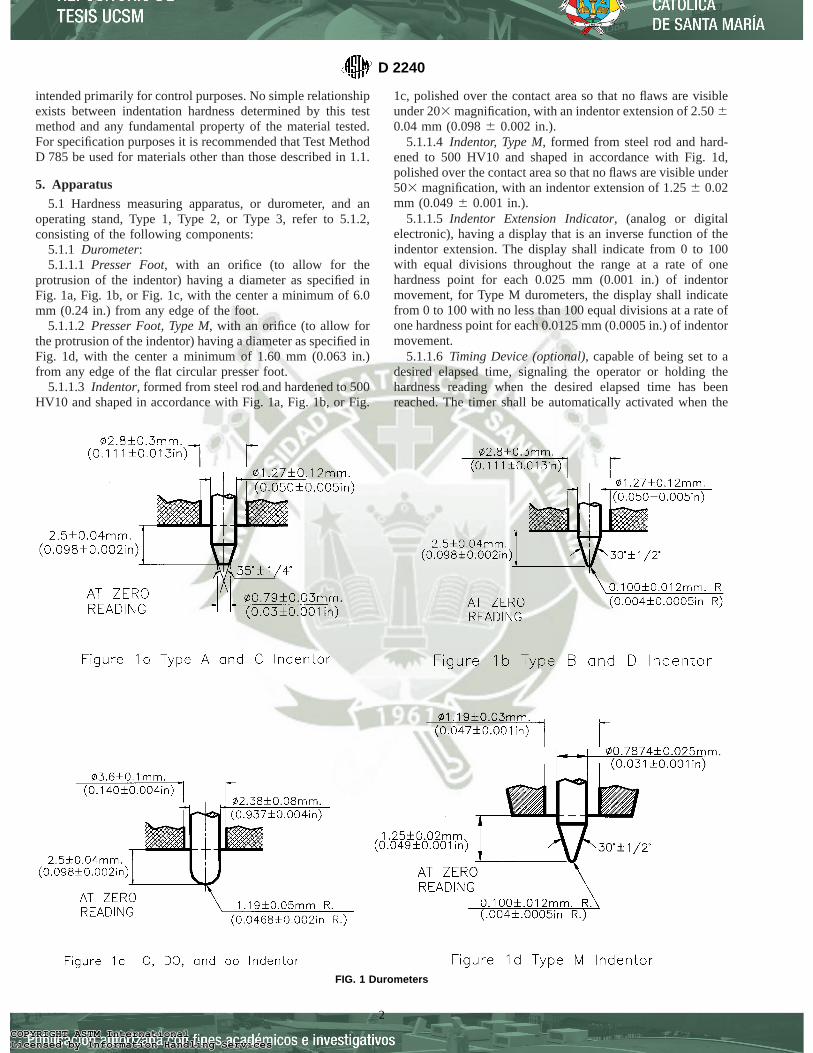
intended primarily for control purposes. No simple relationshipexists between indentation hardness determined by this testmethod and any fundamental property of the material tested.For specification purposes it is recommended that Test MethodD 785 be used for materials other than those described in 1.1.
5. Apparatus
5.1 Hardness measuring apparatus, or durometer, and anoperating stand, Type 1, Type 2, or Type 3, refer to 5.1.2,consisting of the following components:
5.1.1 Durometer:5.1.1.1 Presser Foot, with an orifice (to allow for the
protrusion of the indentor) having a diameter as specified inFig. 1a, Fig. 1b, or Fig. 1c, with the center a minimum of 6.0mm (0.24 in.) from any edge of the foot.
5.1.1.2 Presser Foot, Type M, with an orifice (to allow forthe protrusion of the indentor) having a diameter as specified inFig. 1d, with the center a minimum of 1.60 mm (0.063 in.)from any edge of the flat circular presser foot.
5.1.1.3 Indentor, formed from steel rod and hardened to 500HV10 and shaped in accordance with Fig. 1a, Fig. 1b, or Fig.
1c, polished over the contact area so that no flaws are visibleunder 203magnification, with an indentor extension of 2.5060.04 mm (0.0986 0.002 in.).
5.1.1.4 Indentor, Type M, formed from steel rod and hard-ened to 500 HV10 and shaped in accordance with Fig. 1d,polished over the contact area so that no flaws are visible under503 magnification, with an indentor extension of 1.256 0.02mm (0.0496 0.001 in.).
5.1.1.5 Indentor Extension Indicator, (analog or digitalelectronic), having a display that is an inverse function of theindentor extension. The display shall indicate from 0 to 100with equal divisions throughout the range at a rate of onehardness point for each 0.025 mm (0.001 in.) of indentormovement, for Type M durometers, the display shall indicatefrom 0 to 100 with no less than 100 equal divisions at a rate ofone hardness point for each 0.0125 mm (0.0005 in.) of indentormovement.
5.1.1.6 Timing Device (optional), capable of being set to adesired elapsed time, signaling the operator or holding thehardness reading when the desired elapsed time has beenreached. The timer shall be automatically activated when the
FIG. 1 Durometers
D 2240
2
COPYRIGHT ASTM InternationalLicensed by Information Handling ServicesCOPYRIGHT ASTM InternationalLicensed by Information Handling Services

presser foot is in contact with the specimen being tested, forexample, the initial indentor travel has ceased. Digital elec-tronic durometers may be equipped with electronic timingdevices that shall not affect the indicated reading or determi-nations attained by more than one half the calibration tolerancestated in Table 1.
5.1.1.7 Maximum indicators (optional), maximum indicat-ing pointers are auxiliary analog indicating hands designed toremain at the maximum hardness value attained until reset bythe operator. Electronic maximum indicators are digital dis-plays electronically indicating and maintaining the maximumvalue hardness value achieved, until reset by the operator.
5.1.1.8 Analog maximum indicating pointers have beenshown to have a nominal effect on the values attained, howeverthis effect is greater on durometers of lesser total mainspringloads, for example, the effect of a maximum indicating pointeron Type D durometer determinations will be less than thosedeterminations achieved using a Type A durometer. Analogstyle durometers may be equipped with maximum indicatingpointers. The effect of a maximum indicating pointer shall benoted at the time of calibration in the calibration report, refer to10.1.4, and when reporting hardness determinations, refer to10.2.4. Analog Type M durometers shall not be equipped withmaximum indicating pointers.
5.1.1.9 Digital electronic durometers may be equipped withelectronic maximum indicators that shall not affect the indi-cated reading or determinations attained by more than one halfof the spring calibration tolerance stated in Table 1.
5.1.1.10Calibrated Spring, for applying force to the inden-tor, in accordance with Fig. 1a through Fig. 1d and capable ofapplying the forces as specified in Table 1.
5.1.2 Operating Stand:5.1.2.1 Type 1, Type 2, and Type 3, shall be capable of
supporting the durometer presser foot surface parallel to thespecimen support table (Fig. 2) throughout the travel of each.The durometer presser foot to specimen support table parallel-ism shall be verified each time the test specimen support tableis adjusted to accommodate specimens of varying dimensions.This may be accomplished by applying the durometer presserfoot to the point of contact with the specimen support table andmaking adjustments by way of the durometer mounting assem-bly or as specified by the manufacturer.
5.1.2.2 Operating Stand, Type 1(specimen to indentortype), shall be capable of applying the specimen to the indentor
in a manner that minimizes shock.5.1.2.3 Operating Stand, Type 2(indentor to specimen
type), shall be capable of controlling the rate of descent of theindentor to the specimen at a maximum of 3.20 mm/s (0.125in/s) and applying a force sufficient to overcome the calibratedspring force as shown in Table 1.
5.1.2.4 Operating Stand, Type 3(indentor to specimentype), hydraulic dampening, pneumatic dampening or electro-mechanical (required for the operation of Type M durometers)shall be capable of controlling the rate of descent of theindentor to the specimen at a maximum of 3.2 mm/s (0.125in/s) and applying a force sufficient to overcome the calibratedspring force as shown in Table 1. Manual application, Type 1or Type 2 operating stands are not acceptable for Type Mdurometer operation.
5.1.2.5 The entire instrument should be plumb and level,and resting on a surface that will minimize vibration. Operatingthe instrument under adverse conditions will negatively affectthe determinations attained.
5.1.2.6 Specimen Support Table, (Fig. 2) integral to theoperating stand, and having a solid flat surface. The specimensupport platform may have orifices designed to accept variousinserts or support fixtures (Fig. 3) to provide for the support ofirregularly configured specimens. When inserts are used tosupport test specimens, care must be taken to align the indentorto the center of the insert, or the point at which the indentor isto contact the specimen. Care should be exercised to assure thatthe indentor does not abruptly contact the specimen support
TABLE 1 Durometer Spring Force CalibrationAll Values are in N
Indicated Value Type M Type A, B, O Type C, D, DO Type OO
0 0.324 0.55 0.20310 0.368 1.3 4.445 0.29420 0.412 2.05 8.89 0.38530 0.456 2.8 13.335 0.47640 0.5 3.55 17.78 0.56650 0.544 4.3 22.225 0.65760 0.589 5.05 26.67 0.74870 0.633 5.8 31.115 0.83980 0.677 6.55 35.56 0.9390 0.721 7.3 40.005 1.02
100 0.765 8.05 44.45 1.111N/durometer unit 0.0044 0.075 0.4445 0.00908Spring CalibrationTolerance
60.0176 N 60.075 N 60.4445 N 60.0182 N
FIG. 2 Durometer Operating Stand
D 2240
3
COPYRIGHT ASTM InternationalLicensed by Information Handling ServicesCOPYRIGHT ASTM InternationalLicensed by Information Handling Services
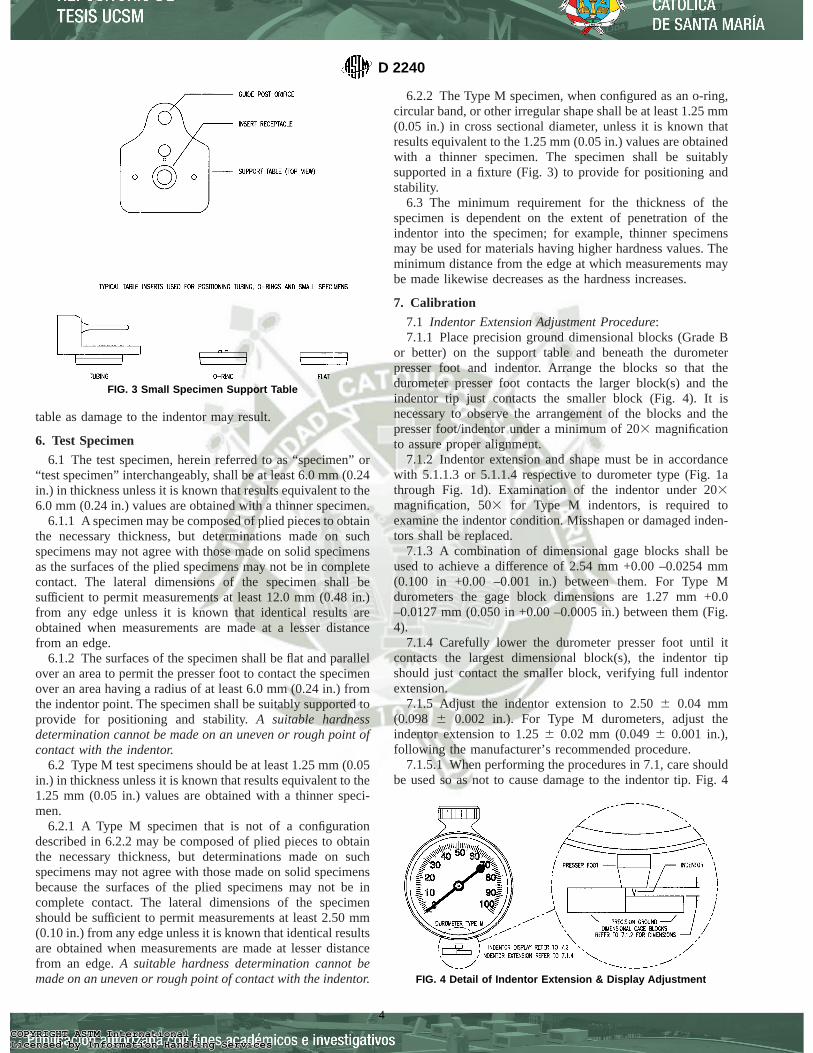
table as damage to the indentor may result.
6. Test Specimen
6.1 The test specimen, herein referred to as “specimen” or“test specimen” interchangeably, shall be at least 6.0 mm (0.24in.) in thickness unless it is known that results equivalent to the6.0 mm (0.24 in.) values are obtained with a thinner specimen.
6.1.1 A specimen may be composed of plied pieces to obtainthe necessary thickness, but determinations made on suchspecimens may not agree with those made on solid specimensas the surfaces of the plied specimens may not be in completecontact. The lateral dimensions of the specimen shall besufficient to permit measurements at least 12.0 mm (0.48 in.)from any edge unless it is known that identical results areobtained when measurements are made at a lesser distancefrom an edge.
6.1.2 The surfaces of the specimen shall be flat and parallelover an area to permit the presser foot to contact the specimenover an area having a radius of at least 6.0 mm (0.24 in.) fromthe indentor point. The specimen shall be suitably supported toprovide for positioning and stability.A suitable hardnessdetermination cannot be made on an uneven or rough point ofcontact with the indentor.
6.2 Type M test specimens should be at least 1.25 mm (0.05in.) in thickness unless it is known that results equivalent to the1.25 mm (0.05 in.) values are obtained with a thinner speci-men.
6.2.1 A Type M specimen that is not of a configurationdescribed in 6.2.2 may be composed of plied pieces to obtainthe necessary thickness, but determinations made on suchspecimens may not agree with those made on solid specimensbecause the surfaces of the plied specimens may not be incomplete contact. The lateral dimensions of the specimenshould be sufficient to permit measurements at least 2.50 mm(0.10 in.) from any edge unless it is known that identical resultsare obtained when measurements are made at lesser distancefrom an edge.A suitable hardness determination cannot bemade on an uneven or rough point of contact with the indentor.
6.2.2 The Type M specimen, when configured as an o-ring,circular band, or other irregular shape shall be at least 1.25 mm(0.05 in.) in cross sectional diameter, unless it is known thatresults equivalent to the 1.25 mm (0.05 in.) values are obtainedwith a thinner specimen. The specimen shall be suitablysupported in a fixture (Fig. 3) to provide for positioning andstability.
6.3 The minimum requirement for the thickness of thespecimen is dependent on the extent of penetration of theindentor into the specimen; for example, thinner specimensmay be used for materials having higher hardness values. Theminimum distance from the edge at which measurements maybe made likewise decreases as the hardness increases.
7. Calibration
7.1 Indentor Extension Adjustment Procedure:7.1.1 Place precision ground dimensional blocks (Grade B
or better) on the support table and beneath the durometerpresser foot and indentor. Arrange the blocks so that thedurometer presser foot contacts the larger block(s) and theindentor tip just contacts the smaller block (Fig. 4). It isnecessary to observe the arrangement of the blocks and thepresser foot/indentor under a minimum of 203 magnificationto assure proper alignment.
7.1.2 Indentor extension and shape must be in accordancewith 5.1.1.3 or 5.1.1.4 respective to durometer type (Fig. 1athrough Fig. 1d). Examination of the indentor under 203magnification, 503for Type M indentors, is required toexamine the indentor condition. Misshapen or damaged inden-tors shall be replaced.
7.1.3 A combination of dimensional gage blocks shall beused to achieve a difference of 2.54 mm +0.00 –0.0254 mm(0.100 in +0.00 –0.001 in.) between them. For Type Mdurometers the gage block dimensions are 1.27 mm +0.0–0.0127 mm (0.050 in +0.00 –0.0005 in.) between them (Fig.4).
7.1.4 Carefully lower the durometer presser foot until itcontacts the largest dimensional block(s), the indentor tipshould just contact the smaller block, verifying full indentorextension.
7.1.5 Adjust the indentor extension to 2.506 0.04 mm(0.098 6 0.002 in.). For Type M durometers, adjust theindentor extension to 1.256 0.02 mm (0.0496 0.001 in.),following the manufacturer’s recommended procedure.
7.1.5.1 When performing the procedures in 7.1, care shouldbe used so as not to cause damage to the indentor tip. Fig. 4
FIG. 3 Small Specimen Support Table
FIG. 4 Detail of Indentor Extension & Display Adjustment
D 2240
4
COPYRIGHT ASTM InternationalLicensed by Information Handling ServicesCOPYRIGHT ASTM InternationalLicensed by Information Handling Services
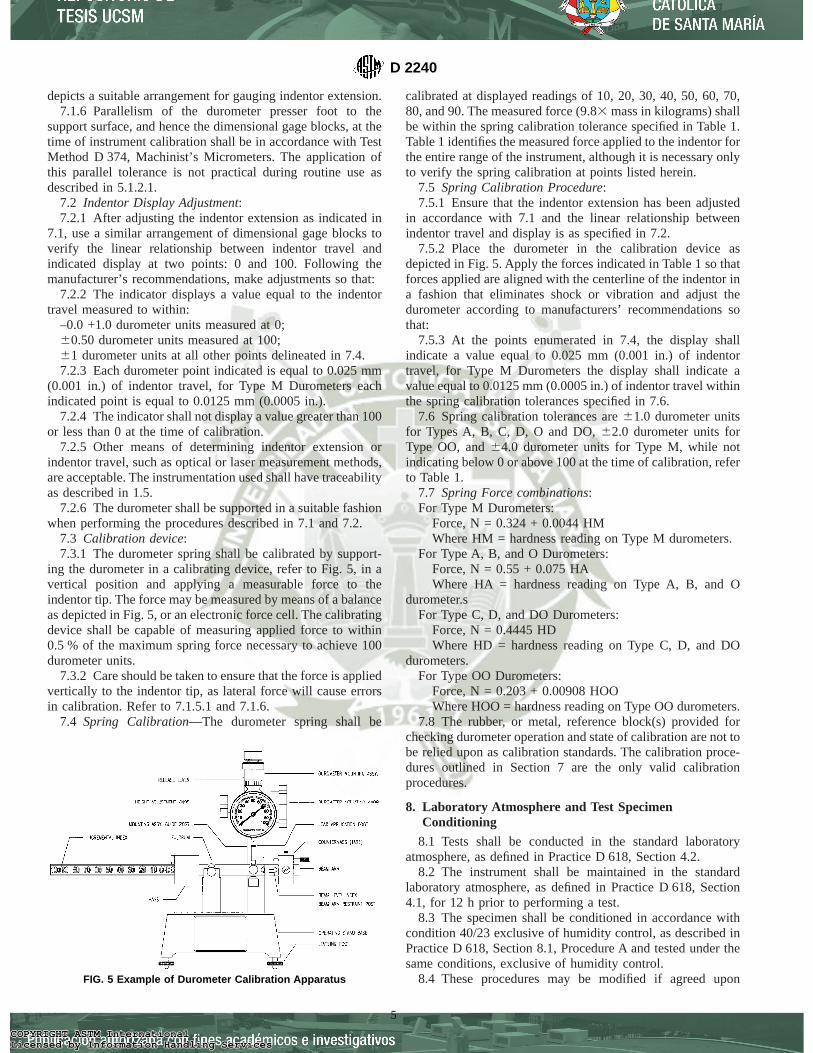
depicts a suitable arrangement for gauging indentor extension.7.1.6 Parallelism of the durometer presser foot to the
support surface, and hence the dimensional gage blocks, at thetime of instrument calibration shall be in accordance with TestMethod D 374, Machinist’s Micrometers. The application ofthis parallel tolerance is not practical during routine use asdescribed in 5.1.2.1.
7.2 Indentor Display Adjustment:7.2.1 After adjusting the indentor extension as indicated in
7.1, use a similar arrangement of dimensional gage blocks toverify the linear relationship between indentor travel andindicated display at two points: 0 and 100. Following themanufacturer’s recommendations, make adjustments so that:
7.2.2 The indicator displays a value equal to the indentortravel measured to within:
–0.0 +1.0 durometer units measured at 0;60.50 durometer units measured at 100;61 durometer units at all other points delineated in 7.4.7.2.3 Each durometer point indicated is equal to 0.025 mm
(0.001 in.) of indentor travel, for Type M Durometers eachindicated point is equal to 0.0125 mm (0.0005 in.).
7.2.4 The indicator shall not display a value greater than 100or less than 0 at the time of calibration.
7.2.5 Other means of determining indentor extension orindentor travel, such as optical or laser measurement methods,are acceptable. The instrumentation used shall have traceabilityas described in 1.5.
7.2.6 The durometer shall be supported in a suitable fashionwhen performing the procedures described in 7.1 and 7.2.
7.3 Calibration device:7.3.1 The durometer spring shall be calibrated by support-
ing the durometer in a calibrating device, refer to Fig. 5, in avertical position and applying a measurable force to theindentor tip. The force may be measured by means of a balanceas depicted in Fig. 5, or an electronic force cell. The calibratingdevice shall be capable of measuring applied force to within0.5 % of the maximum spring force necessary to achieve 100durometer units.
7.3.2 Care should be taken to ensure that the force is appliedvertically to the indentor tip, as lateral force will cause errorsin calibration. Refer to 7.1.5.1 and 7.1.6.
7.4 Spring Calibration—The durometer spring shall be
calibrated at displayed readings of 10, 20, 30, 40, 50, 60, 70,80, and 90. The measured force (9.83 mass in kilograms) shallbe within the spring calibration tolerance specified in Table 1.Table 1 identifies the measured force applied to the indentor forthe entire range of the instrument, although it is necessary onlyto verify the spring calibration at points listed herein.
7.5 Spring Calibration Procedure:7.5.1 Ensure that the indentor extension has been adjusted
in accordance with 7.1 and the linear relationship betweenindentor travel and display is as specified in 7.2.
7.5.2 Place the durometer in the calibration device asdepicted in Fig. 5. Apply the forces indicated in Table 1 so thatforces applied are aligned with the centerline of the indentor ina fashion that eliminates shock or vibration and adjust thedurometer according to manufacturers’ recommendations sothat:
7.5.3 At the points enumerated in 7.4, the display shallindicate a value equal to 0.025 mm (0.001 in.) of indentortravel, for Type M Durometers the display shall indicate avalue equal to 0.0125 mm (0.0005 in.) of indentor travel withinthe spring calibration tolerances specified in 7.6.
7.6 Spring calibration tolerances are61.0 durometer unitsfor Types A, B, C, D, O and DO,62.0 durometer units forType OO, and64.0 durometer units for Type M, while notindicating below 0 or above 100 at the time of calibration, referto Table 1.
7.7 Spring Force combinations:For Type M Durometers:
Force, N = 0.324 + 0.0044 HMWhere HM = hardness reading on Type M durometers.
For Type A, B, and O Durometers:Force, N = 0.55 + 0.075 HAWhere HA = hardness reading on Type A, B, and O
durometer.sFor Type C, D, and DO Durometers:
Force, N = 0.4445 HDWhere HD = hardness reading on Type C, D, and DO
durometers.For Type OO Durometers:
Force, N = 0.203 + 0.00908 HOOWhere HOO = hardness reading on Type OO durometers.
7.8 The rubber, or metal, reference block(s) provided forchecking durometer operation and state of calibration are not tobe relied upon as calibration standards. The calibration proce-dures outlined in Section 7 are the only valid calibrationprocedures.
8. Laboratory Atmosphere and Test SpecimenConditioning
8.1 Tests shall be conducted in the standard laboratoryatmosphere, as defined in Practice D 618, Section 4.2.
8.2 The instrument shall be maintained in the standardlaboratory atmosphere, as defined in Practice D 618, Section4.1, for 12 h prior to performing a test.
8.3 The specimen shall be conditioned in accordance withcondition 40/23 exclusive of humidity control, as described inPractice D 618, Section 8.1, Procedure A and tested under thesame conditions, exclusive of humidity control.
8.4 These procedures may be modified if agreed uponFIG. 5 Example of Durometer Calibration Apparatus
D 2240
5
COPYRIGHT ASTM InternationalLicensed by Information Handling ServicesCOPYRIGHT ASTM InternationalLicensed by Information Handling Services

between laboratories or between supplier and user and are inaccordance with alternative procedures identified in PracticeD 618.
8.5 No conclusive evaluation has been made on durometersat temperatures other than 23.06 2.0°C (73.4 6 3.6°F).Conditioning at temperatures other than the above may showchanges in calibration. Durometer use at temperatures otherthan the above should be decided locally (see Practice D 1349).
9. Procedure
9.1 Operating Stand Operation (Type 3 Operating StandRequired for Type M):
9.1.1 Care shall be exercised to minimize the exposure ofthe instrument to environmental conditions that are adverse tothe performance of the instrument, or adversely affect testresults.
9.1.2 Adjust the presser foot to support table parallelism asdescribed in 5.1.2.1. It is necessary to make this adjustmenteach time the support table is moved to accommodate speci-mens of varying dimensions.
9.1.3 Prior to conducting a test, adjust the vertical distancefrom the presser foot to the contact surface of the test specimento 25.46 2.5 mm (01.006 0.100 in.), unless it is known thatidentical results are obtained with presser foot at a greater orlesser vertical distance from the test specimen contact surface,or if otherwise stipulated by the manufacturer.
9.1.4 Place the specimen on the specimen support table, ina manner that the contact point of the indentor is in accordancewith Section 6, unless it is known that identical results areobtained when measurements are made with the indentor at alesser distance from the edge of the test specimen.
9.1.5 Actuate the release lever (Fig. 2) of the operatingstand or activate the electromechanical device, allowing thedurometer to descend at a controlled rate and apply the presserfoot to the specimen in accordance with 5.1.2. In the case of“specimen to indentor” type operating stands, operate the leveror other mechanism to apply the specimen to the indentor in amanner that assures parallel contact of the specimen to thedurometer presser foot without shock and with just sufficientforce to overcome the calibrated spring force as shown in Table1.
9.1.6 An operating stand that applies the mass at a con-trolled rate of descent, without shock is mandatory for Type Mdurometers. Hand held application or the use of a Type 1 orType 2 operating stands for the Type M durometer is not anacceptable practice, refer to 5.1.2.4.
9.1.7 For any material covered in 1.1, once the presser footis in contact with the specimen, for example, the initialindentor travel has ceased, the indicated reading shall berecorded within 16 0.1 s, or after any period of time agreedupon among laboratories or between supplier and user. If thedurometer is equipped with a maximum indicator, the maxi-mum indicated reading shall be recorded within 16 0.1 s ofthe cessation of indentor travel. The indicated hardness readingmay change with time.
9.1.8 Make five determinations of hardness at differentpositions on the specimen at least 6.0 mm (0.24 in.) apart, 0.80mm (0.030 in.) apart for Type M; and calculate the arithmeticmean, or alternatively calculate the median. The means of
calculating the determinations shall be reported according to10.2.8
9.2 Manual (Hand Held) Operation of Durometer:9.2.1 Care shall be exercised to minimize the exposure of
the instrument to environmental conditions that are adverse tothe performance of the instrument, or adversely affect testresults.
9.2.2 Place the specimen on a flat, hard, horizontal surface.Hold the durometer in a vertical position with the indentor tipat a distance from any edge of the specimen as described inSection 6, unless it is known that identical results are obtainedwhen measurements are made with the indentor at a lesserdistance.
9.2.3 Apply the presser foot to the specimen, maintaining itin a vertical position keeping the presser foot parallel to thespecimen, with a firm smooth downward action that will avoidshock, rolling of the presser foot over the specimen, or theapplication of lateral force. Apply sufficient pressure to assurefirm contact between the presser foot and the specimen.
9.2.4 For any material covered in 1.1, after the presser footis in contact with the specimen, the indicated reading shall berecorded within 16 0.1 s, or after any period of time agreedupon among laboratories or between supplier and user. If thedurometer is equipped with a maximum indicator, the maxi-mum indicated reading shall be recorded within 16 0.1 s ofthe cessation of initial indentor travel. The indicated hardnessreading may change with time.
9.2.5 Make five determinations of hardness at differentpositions on the specimen at least 6.0 mm (0.24 in.) apart andcalculate the arithmetic mean, or alternatively calculate themedian. The means of calculating the determinations shall bereported according to Section 10.2.8.
9.3 It is acknowledged that durometer readings below 20 orabove 90 are not considered reliable. It is suggested thatreadings in these ranges not be recorded.
9.4 Manual operation (hand held) of a durometer will causevariations in the results attained. Improved repeatability maybe obtained by using a mass, securely affixed to the durometerand centered on the axis of the indentor. Recommended massesare 1 kg for Type A, B and O durometers, 5 kg for Type C, Dand DO durometers, and 400 g for Type OO durometers.Further improvement may be achieved by the use of adurometer operating stand which controls the rate of descent ofthe durometer presser foot to the test specimen and incorpo-rates the masses described above.
10. Report
10.1 Instrument Calibration Report (Durometer or Operat-ing Stand):
10.1.1 Date of calibration.10.1.2 Date of last calibration.10.1.3 Manufacturer, type, model, and serial number of the
instrument, and a notation when a maximum indicator ortiming device is present.
10.1.4 Values obtained (pre- and post calibration results),including a notation of the affect of a maximum indicator, ifpresent. The method of reporting the calibrated value shall beby attaining the arithmetic mean of the determinations.
10.1.5 Ambient temperature.
D 2240
6
COPYRIGHT ASTM InternationalLicensed by Information Handling ServicesCOPYRIGHT ASTM InternationalLicensed by Information Handling Services

10.1.6 Relative humidity.10.1.7 Technician identification.10.1.8 Applicable standards to which the instrument is
calibrated.10.1.9 Calibrating instrument information to include type,
serial number, manufacturer, date of last calibration, and astatement of traceability of standards used to NIST or otheracceptable organization. See 1.5.
10.2 Hardness Measurement Report:10.2.1 Date of test.10.2.2 Relative humidity.10.2.3 Ambient temperature.10.2.4 Manufacturer, type and serial number of the durom-
eter or operating stand, or both, including a notation when amaximum indicator or timing device is present, and date of lastcalibration.
10.2.5 Means of testing, whether manual (hand held), Type1 operating stand (specimen to indentor), Type 2 operatingstand (indentor to specimen type), or Type 3 operating stand(electromechanical or hydraulically dampened).
10.2.6 Description of test specimen, including thickness,number of pieces plied if less than the thickness indicated inSection 6, including the vulcanization date.
10.2.7 Complete identification of material tested.10.2.8 Hardness value obtained and method of calculation,
either arithmetic mean or alternatively, the median.10.2.9 Indentation hardness time interval at which determi-
nation was made. Readings may be reported in the form:M/60/1 where M is the type of durometer, 60 the reading, and1 the time in seconds that the presser foot is in contact with thespecimen or from an electronic timing device.
11. Precision and Bias
11.1 These precision and bias statements have been pre-pared in accordance with Practice D 4483. Refer to thisPractice for terminology and other testing and statisticalconcepts.
11.2 The Type 1 precision for the Type M method wasdetermined from an interlaboratory program with 21 materialsof varying hardness, with six participating laboratories. Testswere conducted on two separate days in each laboratory for theType M testing program. All materials were supplied from asingle source, being those commonly supplied as referencematerials with the instruments from the manufacturer.
11.3 The precision results in this precision and bias sectiongive an estimate of the precision of this test method with thematerials (rubbers) used in the particular interlaboratory pro-gram as described above. The precision parameters should notbe used for acceptance or rejection testing, or both, of anygroup of materials without documentation that they are appli-cable to those particular materials and the specific testingprotocols that include this test method.
11.4 The Type 1 precision for both Type A and D methodswas determined from an interlaboratory program with 3materials of varying hardness, with six participating laborato-ries. Tests were conducted on two separate days in eachlaboratory for both A and D testing programs. All materialswere supplied from a single source.
11.5 A test result for hardness, for Types A, D, and M, wasthe median of five individual hardness readings on each day ineach laboratory.
11.6 Table 2 shows the precision results for Type Mmethod6, Table 3 shows the precision results for Type A
6 Supporting data are available from ASTM International Headquarters. RequestRR: D11-1091.
TABLE 2 Type 1 Precision—Type M Durometer Method
Material Within Laboratories Between Laboratories
MEAN SrA rB (r)C SRD RE (R)F
1 31.8 1.26 3.58 11.24 3.76 10.63 33.412 40.8 1.14 3.23 7.90 2.47 7.00 17.133 54.0 0.975 2.76 5.11 2.38 6.73 12.464 62.8 0.782 2.21 3.52 2.24 6.34 10.105 70.9 0.709 2.01 2.83 0.974 2.76 3.896 80.6 1.686 4.77 5.92 1.61 4.56 5.657 87.7 1.15 3.25 3.71 2.63 7.45 8.508 32.4 0.947 2.68 8.26 3.64 10.29 31.739 41.8 0.797 2.26 5.40 2.23 6.31 15.11
10 53.3 0.669 1.89 3.55 2.29 6.49 12.1711 63.2 0.485 1.37 2.17 2.19 6.20 9.8012 69.6 0.737 2.09 3.00 0.99 2.80 4.0213 78.3 0.784 2.22 2.84 1.04 2.94 3.7514 87.6 1.121 3.17 3.62 2.65 7.49 8.5515 34.1 0.85 2.40 7.05 1.84 5.20 15.2516 42.3 0.635 1.80 4.25 1.20 3.39 8.0117 54.6 0.56 1.59 2.90 2.15 6.09 11.1518 62.9 1.12 3.17 5.04 1.47 4.16 6.6119 70.3 0.689 1.95 2.77 0.944 2.67 3.8020 81.7 0.483 1.37 1.67 1.10 3.10 3.8021 87.9 0.879 2.49 2.83 2.07 5.86 6.67
AVERAGE 61.4
POOLEDVALUES
0.924 2.62 4.26 2.146 6.07 9.89
A Sr = repeatability standard deviation, measurement units.B r = repeatability = 2.83 3 Sr, measurement units.C (r) = repeatability, relative, (that is, in percent).D SR = reproducibility standard deviation, measurement units.E R = reproducibility = 2.83 3 SR, measurement units.F (R) = reproducibility, relative, (that is, in percent).
TABLE 3 Type 1 Precision—Type A Durometer Method
MaterialAverage
LevelWithin Laboratories Between Laboratories
Sr A r B (r) C SR D R E (R) F
1 51.4 0.646 1.83 3.56 1.56 4.41 8.592 65.3 0.878 2.48 3.81 2.21 6.06 9.273 68.0 0.433 1.23 1.80 2.28 6.45 9.49
Pooled 61.6 0.677 1.92 3.11 2.018 5.72 9.28A Sr = repeatability standard deviation, measurement units.B r = repeatability = 2.83 3 Sr, measurement units.C (r) = repeatability, relative, (that is, in percent).D SR = reproducibility standard deviation, measurement units.E R = reproducibility = 2.83 3 SR, measurement units.F (R) = reproducibility, relative, (that is, in percent).
TABLE 4 Type 1 Precision—Type D Durometer Method
MaterialAverage
LevelWithin Laboratories Between Laboratories
Sr A r B (r) C SR D R E (R) F
1 42.6 0.316 0.894 2.10 2.82 7.98 18.72 54.5 0.791 2.24 4.11 3.54 10.0 18.43 82.3 1.01 2.86 3.47 3.54 10.0 12.2
Pooled 59.8 0.762 2.16 3.61 3.32 9.40 15.7A Sr = repeatability standard deviation, measurement units.B r = repeatability = 2.83 3 Sr, measurement units.C (r) = repeatability, relative, (that is, in percent).D SR = reproducibility standard deviation, measurement units.E R = reproducibility = 2.83 3 SR, measurement units.F (R) = reproducibility, relative, (that is, in percent).
D 2240
7
COPYRIGHT ASTM InternationalLicensed by Information Handling ServicesCOPYRIGHT ASTM InternationalLicensed by Information Handling Services

method7, and Table 4 gives the precision results for Type Dmethod7.
11.7 Precision—The precision of this test method may beexpressed in the format of the following statements which useas appropriate valuer, R, (r), or (R), that is, that value to beused in decisions about test results (obtained with the testmethod). The appropriate value is that value ofr or Rassociated with a mean level in Table 1 closest to the meanlevel under consideration (at any given time, for any givenmaterial) in routine testing operations.
11.7.1 Repeatability—The repeatability,r, of these testmethods has been established as the appropriate value tabu-lated in Tables 2-4. Two single test results, obtained undernormal test method procedures, that differ by more than thistabulatedr (for any given level) must be considered as derivedfrom different or non-identical sample populations.
11.7.2 Reproducibility—The reproducibility,R, of these testmethods has been established as the appropriate value tabu-
lated in Tables 2-4. Two single test results obtained in twodifferent laboratories, under normal test method procedures,that differ by more than the tabulatedR (for any given level)must be considered to have come from different or non-identical sample populations.
11.7.3 Repeatability and reproducibility are expressed as apercentage of the mean level,(r) and (R), have equivalentapplication statements as above forr andR. For the(r)and(R)statements, the difference in the two single test results isexpressed as a percentage of the arithmetic mean of the two testresults.
11.8 Bias—In test method terminology, bias is the differ-ence between an average test value and the reference (or true)test property value. Reference values do not exist for this testmethod since the value (of the test property) is exclusivelydefined by this test method. Bias, therefore cannot be deter-mined.
12. Keywords
12.1 durometer; durometer hardness; hardness; indentationhardness; micro durometer hardness
APPENDIXES
(Nonmandatory Information)
X1. DUROMETER SELECTION GUIDE
X1.1 The durometer selection guide is designed to assist inthe selection of the proper durometer type for various applica-tions.
X1.2 It is generally recognized that durometer hardnessdetermination below 20 and above 90 are unreliable. It is
recommended that the next lower or higher type (scale) be usedin these situations.
X1.3 It is also recommended that, whenever possible, anoperating stand be employed in performing durometer hardnesstests.
7 Supporting data are available from ASTM International Headquarters. RequestRR: D11-1029.
TABLE X1.1 Durometer Selection: Typical Uses
Type(Scale)
Typical Examples of Materials TestedDurometer Hardness
(Typical Uses)
A Soft vulcanized rubber, natural rubber, nitriles, thermoplasticelastomers, flexible polyacrylics and thermosets, wax, felt, andleathers
20–90 A
B Moderately hard rubber, thermoplastic elastomers, paper products,and fibrous materials
Above 90 ABelow 20 D
C Medium-hard rubber, thermoplastic elastomers, medium-hardplastics and thermoplastics
Above 90 BBelow 20 D
D Hard rubber, thermoplastic elastomers, harder plastics, and rigidthermoplastics
Above 90 A
DO Moderately hard rubber, thermoplastic elastomers, and very densetextile windings
Above 90 CBelow 20 D
M Thin, irregularly shaped rubber, thermoplastic elastomer, and plasticspecimens
20–85 A
O Soft rubber, thermoplastic elastomers, very soft plastics andthermoplastics, medium-density textile windings
Below 20 DO
OO Extremely soft rubber, thermoplastic elastomers, sponge, extremelysoft plastics and thermoplastics, foams, low-density textile windings,human and animal tissue
Below 20 O
CF Composite foam materials such as amusement ride safety cushions,vehicle seats, dashboards, headrests, armrests, and door panels
See TestMethod F 1957
D 2240
8
COPYRIGHT ASTM InternationalLicensed by Information Handling ServicesCOPYRIGHT ASTM InternationalLicensed by Information Handling Services

X2. RELATED TEST METHODS
C 367 Test Methods for Strength Properties of PrefabricatedArchitectural Acoustical Tile or Lay-In Ceiling Panels8
C 473 Test Methods for Physical Testing of Gypsum PanelProduct9
C 581 Practice for Determining Chemical Resistance ofThermosetting Resins Used in Glass-Fiber-Reinforced Struc-tures Intended for Liquid Service10
C 661 Test Method for Indentation Hardness ofElastomeric-Type Sealants by Means of a Durometer11
C 836 Specification for High Solids Content, Cold Liquid-Applied Elastomeric Waterproofing Membrane for Use withSeparate Wearing Course11
D 461 Test Methods for Felt12
D 531 Test Method for Rubber Property—Pusey and JonesIndentation4
D 619 Test Methods for Vulcanized Fibre Used for Electri-cal Insulation2
D 1037 Test Methods for Evaluating Properties of Wood-Base Fiber and Particle Panel Materials13
D 1054 Test Method for Rubber Property—Resilience Us-ing a Rebound Pendulum4
D 1414 Test Methods for Rubber O-Rings14
D 1474 Test Methods for Indentation Hardness of OrganicCoatings15
D 2134 Test Method for Determining the Hardness of Or-ganic Coatings with a Sward-Type Hardness Rocker15
D 2287 Specification for Nonrigid Vinyl Chloride Polymerand Copolymer Molding and Extrusion Compounds3
D 2583 Test Method for Indentation Hardness of RigidPlastics by Means of a Barcol Impressor16
D 2632 Test Method for Rubber Property—Resilience byVertical Rebound4
D 4289 Test Method for Elastomer Compatibility of Lubri-cating Greases and Fluids17
D 5672 Test Method for Testing Flexible Cellular MaterialsMeasurement of Indentation Force Deflection Using a 25 mm(1 in.) Deflection Technique18
D 6546 Test Methods for and Suggested Limits for Deter-mining Compatibility of Elastomer Seals for Industrial Hy-draulic Fluid Applications19
F 1151 Test Method for Determining Variations in Hardnessof Film Ribbon Pancakes20
NOTE X2.1—The hardness testing of other nonmetallic materials maybe under the jurisdiction of one or more ASTM committees; the respectivecommittee should be contacted for specific information.
ASTM International takes no position respecting the validity of any patent rights asserted in connection with any item mentionedin this standard. Users of this standard are expressly advised that determination of the validity of any such patent rights, and the riskof infringement of such rights, are entirely their own responsibility.
This standard is subject to revision at any time by the responsible technical committee and must be reviewed every five years andif not revised, either reapproved or withdrawn. Your comments are invited either for revision of this standard or for additional standardsand should be addressed to ASTM International Headquarters. Your comments will receive careful consideration at a meeting of theresponsible technical committee, which you may attend. If you feel that your comments have not received a fair hearing you shouldmake your views known to the ASTM Committee on Standards, at the address shown below.
This standard is copyrighted by ASTM International, 100 Barr Harbor Drive, PO Box C700, West Conshohocken, PA 19428-2959,United States. Individual reprints (single or multiple copies) of this standard may be obtained by contacting ASTM at the aboveaddress or at 610-832-9585 (phone), 610-832-9555 (fax), or [email protected] (e-mail); or through the ASTM website(www.astm.org).
8 Annual Book of ASTM Standards, Vol 04.06.9 Annual Book of ASTM Standards, Vol 04.01.10 Annual Book of ASTM Standards, Vol 08.04.11 Annual Book of ASTM Standards, Vol 04.07.12 Annual Book of ASTM Standards, Vol 07.01.13 Annual Book of ASTM Standards, Vol 04.10.14 Annual Book of ASTM Standards, Vol 09.02.
15 Annual Book of ASTM Standards, Vol 06.01.16 Annual Book of ASTM Standards, Vol 08.02.17 Annual Book of ASTM Standards, Vol 05.02.18 Annual Book of ASTM Standards, Vol 08.03.19 Annual Book of ASTM Standards, Vol 05.04.20 Annual Book of ASTM Standards, Vol 15.09.
D 2240
9
COPYRIGHT ASTM InternationalLicensed by Information Handling ServicesCOPYRIGHT ASTM InternationalLicensed by Information Handling Services

Designation: D 3182 – 89 (Reapproved 1994)
Standard Practice forRubber—Materials, Equipment, and Procedures for MixingStandard Compounds and Preparing StandardVulcanized Sheets 1
This standard is issued under the fixed designation D 3182; the number immediately following the designation indicates the year oforiginal adoption or, in the case of revision, the year of last revision. A number in parentheses indicates the year of last reapproval. Asuperscript epsilon (e) indicates an editorial change since the last revision or reapproval.
This standard has been approved for use by agencies of the Department of Defense.
1. Scope
1.1 This practice provides a listing of reference compound-ing materials required to prepare the rubber test compoundslisted in succeeding methods and contains procedures forweighing. It also specifies the mixing equipment, generalmixing procedures, vulcanization equipment and procedures.
1.2 The values stated in SI units are to be regarded as thestandard. The values given in parentheses are for informationonly.
1.3 This standard does not purport to address all of thesafety concerns, if any, associated with its use. It is theresponsibility of the user of this standard to establish appro-priate safety and health practices and determine the applica-bility of regulatory limitations prior to use.For specificprecaution statements, see 5.5.
2. Referenced Documents
2.1 ASTM Standards:D 88 Test Method for Saybolt Viscosity2
D 1646 Test Method for Rubber—Viscosity, Stress Relax-ation, and Pre-Vulcanization Characteristics (Mooney Vis-cometer)3
D 2084 Test Method for Rubber Property—VulcanizationUsing Oscillating Disk Cure Meter3
D 2161 Practice for Conversion of Kinematic Viscosity toSaybolt Universal Viscosity or to Saybolt Furol Viscosity4
D 2226 Classification for Various Types of Petroleum Oilsfor Rubber Compounding Use3
D 2501 Test Method for Calculation of Viscosity-GravityConstant (VGC) of Petroleum Oils4
D 4678 Practice for Rubber—Preparation, Testing, Accep-tance, Documentation, and Use of Reference Materials3
E 145 Specification for Gravity-Convection and Forced-Ventilation Ovens5
3. Significance and Use
3.1 This practice shall be used for specific procedures usedin preparing rubber compounds for quality control of produc-tion, for research and development purposes, and for compari-son of different materials.
4. Standard Materials
4.1 Standard Reference Materials:4.1.1 The materials required for standard rubber test formu-
las shall be National Institute of Standards and Technology(NIST) Reference Materials or materials that are known tohave properties similar to these standard materials. However,in case of dispute, the following actual standard materials fromthe NIST of the United States shall be used:
4.1.2 An Industry Reference Material (IRM) is a standardreference from a designated supplier and has been certified inaccordance with Practice D 4678.6 ,7
Standard IndustryReference Reference
NIST Standard Reference Material MaterialMaterial or IRM No. No.
Zinc oxide 370Sulfur 371Stearic acid 372Benzothiazyl disulfide6 2Tetramethylthiuram disulfide6,7 1Magnesium oxide 376Oil furnace carbon black—HAF 378Gas furnace carbon black—SRF 382Mercaptobenzothiazole 383N-tert-butyl-2-benzothiazolesulfenamide 384SBR-1500 386Natural rubber8 201
1 This practice is under the jurisdiction of ASTM Committee D11 on Rubber andis the direct responsibility of Subcommittee D11.20 on Compounding Materials andProcedures.
Current edition approved Mar. 31, 1989. Published May 1989. Originallypublished as D 3182 – 73. Last previous edition D 3182 – 87.
2 Annual Book of ASTM Standards, Vol 04.04.3 Annual Book of ASTM Standards, Vol 09.01.4 Annual Book of ASTM Standards, Vol 05.01.
5 Annual Book of ASTM Standards, Vol 14.04.6 NIST has discontinued supply of SRM 373, 374, and 385. A substitute material
is available as IRM 2, 1, and 201 respectively from Forcoven Products, Inc., P.O.Box 1556, Humble, TX 77338 for IRM 1 and 2. IRM 201 is available from AkronChemical Co., 255 Fountain St., Akron, OH 44304. Request RR: D11-1034 fromASTM Headquarters, 1916 Race St., Philadelphia, PA 19103.
7 Supporting data are available from ASTM Headquarters. Request RR: D11-1026.
1
Copyright © ASTM International, 100 Barr Harbor Drive, PO Box C700, West Conshohocken, PA 19428-2959, United States.

4.2 Other standard or industry reference materials are asfollows: Industry Reference Black Current Lot in use at time oftesting ASTM Oil Type 1038
5. Weighing of Materials
5.1 The standard batch mass (in grams) for the laboratorymill shall be three times the formula mass in parts per hundredgrams of rubber, unless otherwise specified.
5.2 The batch mass (in grams) for an internal mixer shall bethe nominal capacity (11706 40 cm3) multiplied by thedensity of the rubber compound.
5.3 The batch mass (in grams) for a miniature internal mixer(MIM) shall be 75 % of the nominal capacity (856 1 cm 3)multiplied by the density of the rubber compound.
5.4 The rubber and carbon black shall be weighed to withina tolerance of61 g for mill and internal mixer compounds andwith a tolerance of60.1 g for miniature internal mixercompounds. All other materials shall be weighed with a60.1-gaccuracy or less for mill and internal mixer compounds andwith 60.01-g accuracy for the miniature internal mixer com-pounds.
5.5 Compounding materials other than rubber, carbon black,and oil may be added to miniature internal mixer batches moreprecisely and with greater ease if they are previously blendedin proportion to the mass required by the recipe. Such blendmay be made in a mortar and pestle, by mixing for 10 min ina biconical blender with intensifier bar turning, or by mixing ina blender9 for five 3-s periods and scraping the inside of themixer to dislodge materials stuck to the sides after each 3-smix. Caution: If mixed longer than 3 s, the stearic acid maymelt and prevent good dispersion.
5.6 Unless otherwise specified, carbon black shall be con-ditioned by heating for 1 h at 1256 3°C (2576 5°F) in a 1 Boven or equivalent, in accordance with Specification E 145.
5.6.1 Place the carbon black in an open vessel of suitabledimensions so that the depth of the black is no more than 10mm (0.4 in.) during conditioning. Store the conditioned carbonblack in a closed moisture-proof container until cool and thenuse for weighing and mixing.
6. Equipment for Mixing
6.1 Standard Mill:6.1.1 The standard mill shall have rolls between 150 and
155 mm (5.9 and 6.1 in.) in diameter. The mill shall beequipped with retaining guides, with a distance between theguides at the nip of 250 to 280 mm (10 to 11 in.).
NOTE 1—If mills of other sizes are used, adjustments to batch massesand mixing cycles may be required to obtain equivalent results.
6.1.2 The speed of the slow roll shall be 0.46 0.50 rad/s (246 0.5 rpm) and the ratio between slow and fast roll shall be
1:1.4. Other ratios may be used, but modifications in mixingprocedure may be required to obtain equivalent results. The useof other than a standard mill shall be recorded with the reporteddata.
6.1.3 Means shall be provided for controlling the mill rolltemperatures to the specified temperature65°C (69°F).
6.1.4 The clearance between rolls shall be adjustable from0.2 to 8.0 mm (0.008 to 0.31 in.) as a minimum range ofadjustment. Roll clearance shall be determined by means oftwo lead strips 106 3 mm (0.46 0.1 in.) wide, at least 50 mm(2 in.) long, and 0.25 to 0.50 mm (0.01 to 0.02 in.) thicker thanthe roll clearance to be measured. The lead strips shall beinserted, one at each end of the rolls approximately 25 mm (1in.) from the guides, while a piece of compounded rubber, withMooney viscosity in excess of 50 ML 1 + 4 at 100°C (212°F),approximately 75 by 75 by 6 mm (3 by 3 by 0.25 in.) is passingthrough the center portion of the rolls. The rolls shall be at thetemperature specified for mixing. After the lead strips havepassed through the rolls, measure the thickness of the strips tothe nearest 0.02 mm (0.001 in.). Tolerance on a roll clearanceshall be610 % or 0.05 mm (0.002 in.), whichever is larger.
6.2 Standard Internal Mixer—The standard internal mixershall have a chamber of 15756 50 cm3 volume and two rotorswith approximately 400-cm3 displacement volume, resulting in11706 40-cm3 loading capacity. The slow rotor speed shall be8.16 rad/s (77 rpm) and the gear ratio shall be 1:1.125. Therotor wing tip to side clearance shall be 2.4 + 0.3, − 0.1 mm(0.094 + 0.010, − 0.005 in.). The mixer shall be equipped witha thermocouple for measuring and recording batch mixingtemperatures. The thermocouple shall be installed through theend frame and shall protrude into the mixing chamber 256 2.5mm (1 6 0.1 in.) measured along the top side of thethermocouple probe. A ram that is 566 3 mm by 1406 8 mm(2.2 6 0.1 in. by 5.56 0.3 in.) shall exert a force of 1.2760.06 kN (2856 14 lbf) on the batch in the chamber. The sidesshall be hinged to swing open, made of cast stainless steel andjacketed for controlling temperature by means of a circulatingliquid or steam. The end frames shall be of ductile iron that hasa 0.206 0.02-mm (0.0086 0.001-in.) thick chrome plating onthe working surfaces. Rotors are of stainless steel, nitrided,drilled, and equipped with rotary unions for controlling therotor temperature by means of a circulating liquid or steam.
NOTE 2—If internal mixers of other sizes are used, adjustments of batchmasses and rotor speeds or mixing cycles will be required to obtainequivalent results.
6.3 Standard Miniature Internal Mixer (MIM):6.3.1 The standard miniature internal mixer shall be
equipped with a stainless steel mixer head having a bowl of120-cm
3
volume and stainless steel cam-style mixer rotors(removable or fixed) of 34 to 35-cm3 displacement, thusresulting in a 856 1-cm3 volume. The recommended loadingis 75 % (64 cm3). The fast or driving rotor (left) shall turn at6.28 + 3.14 rad/s (60 + 3, − 0 rpm) and the gear ratio (drive todriven) shall be 1.5:1. The mixer shall be equipped with athermocouple installed through the ridge in the bowl formeasuring and recording the batch temperatures. The mixingchamber shall be closed during the mixing cycle by means ofa lever or ram. The head and the backplate shall be maintained
8 Defined by Classification D 2226. A lot of oil conforming to the basic descrip-tion in Classification D 2226 and more specifically, to the values listed below, canbe obtained from Sun Refining and Marketing Co., Process Materials Group, 10Penn Center, 1801 Market St., Philadelphia, PA 19103 (available in 1 and 5-galquantities): Kinematic Viscosity (Test Method D 88) and (Practice D 2161) 16.861.2 mm2/s at 100°F, Viscosity-Gravity Constant (Test Method D 2501) 0.88960.002.
9 A Waring Blender has been used in this practice. Results cannot be guaranteedusing another brand.
D 3182
2

at the required temperature either electrically or by means of athermal liquid medium.
NOTE 3—If miniature internal mixers equipped with Banbury-stylemixer head and rotors or heads of other sizes are used, adjustments ofbatch masses, rotor speeds, or mixing cycles will be required to obtainequivalent results.
6.3.2 The miniature internal mixer may be equipped with atorque-measuring instrument and recorder, which are notessential for the mixing operation. If used, it must be calibratedoccasionally and after each overhaul of the miniature internalmixer using the manufacturer’s instructions.
7. General Mixing Procedures
7.1 Mill Mixing Procedure:7.1.1 Mix compounds with the rubber banded on the slow
roll, unless otherwise specified.7.1.2 Measure the temperature of the surfaces of the rolls at
a point approximately equidistant from the ends during themixing operation either continuously on a recorder or with amanual device having an accuracy of at least61°C (6 2°F),frequently enough to maintain the desired temperature. Thebatch may be removed momentarily from the mill to measurethe surface temperature of the slow roll.
7.1.3 Whenever3⁄4cuts are specified, cut the batch3⁄4of thedistance across the roll and hold the knife at this position untilthe bank just disappears. Make successive3⁄4 cuts fromalternate ends of the roll, allowing 20 s between each cut unlessotherwise specified.
7.1.4 Do not cut any batch while free materials are evidentin the bank or on the milling surface.
7.1.5 Add carbon black evenly across the mill at a uniformrate. Add all other dry materials slowly and evenly in pre-scribed times. Oil, if required, may be added alternately withcarbon black. Carefully collect materials falling through thenip from the tray and return to the mix.
7.1.6 Conclude the mixing cycle by passing the rolled batchendwise through the mill six times with an opening of 0.8 mm(0.031 in.), to improve the dispersion.
7.1.7 Pass the batch four times through the mill at a settingof 6 mm (.25 in.), folding it back on itself each time.
7.1.8 Weigh the batch, remove the test specimens forMooney viscosity in accordance with Test Method D 1646 orcure meter in accordance with Test Method D 2084, or both,and sheet out the remainder to 2.2 to 2.4-mm (0.087 to0.094-in.) thickness after shrinkage has taken place.
7.2 Internal Mixer Mixing Procedure:7.2.1 The compound is usually prepared in two stages: the
first one always in the internal mixer and the second either inthe internal mixer or on the standard mill.
7.2.2 The initial internal mixer temperature will be eitherindicated or be such that the required discharge temperature isreached.
7.2.3 The rotor speed shall be 8.16 rad/s (77 rpm), unlessotherwise specified.
7.2.4 Cut the rubber into pieces suitable for fast feeding.7.2.5 Prepare the mix according to specified instructions
regarding the order and time of material addition.7.2.6 Consolidate the discharge on a standard mill, weigh,
and allow to cool on a flat metal surface before proceeding with
the second-stage mix.7.2.7 If the second stage mix is prepared in the internal
mixer, cut the batch from stage 1 into strips for easier feeding,and follow by the addition of the materials according to thespecific instructions. The batch should then be discharged atthe prescribed time or temperature. If the second-stage mix isprepared on the standard mill, add materials in prescribed orderand time. The batch size may be reduced to better accommo-date the mill and to result in better dispersion of compoundingmaterials.
7.2.8 Conclude the mixing by passing the rolled batchendwise through the standard mill six times with an opening of0.8 mm (0.031 in.), to improve the dispersion.
7.2.9 Pass the batch four times through the mill at a settingof 6 mm (0.24 in.), folding it back on itself each time.
7.2.10 After weighing and removal of test specimens, sheetout the batch to 2.2 to 2.4-mm (0.087 to 0.094-in.) thicknessafter shrinkage has taken place.
7.3 Miniature Internal Mixer Procedure:7.3.1 Maintain the mixer head temperature for at least 5 min
before mixing.7.3.2 The unloaded rotor speed shall be 1.0 + 0.05, − 0 rev/s
(60 + 3, − 0 rpm), unless otherwise specified. It should befrequently checked if a variable speed model is used.
7.3.3 Prepare the compound according to instructions speci-fied for the rubber.
7.3.4 Immediately pass the discharge from the mixer twicethrough a standard mill maintained at specified temperaturewith roll separation of 0.5 mm (0.020 in.) once, then twice ata separation of 3 mm (0.12 in.), in order to dissipate the heat,and weigh.
7.3.5 After the removal of a curemeter specimen, if acompound viscosity or tension specimen, or both are required,pass the batch endwise through the mill six times with anopening of 0.8 mm (0.031 in.) to enhance the dispersion.
7.3.6 After removing the compound viscosity specimen, if atension specimen is required, pass the batch four times througha standard mill at specified temperature. Fold it lengthwiseafter each pass and pass always in the same direction to obtainthe effect of mill direction. The roll opening should be such thatit will produce a 2.2 to 2.4-mm (0.087 to 0.094-in.) thick sheetafter shrinkage.
8. Preparation of Standard Vulcanized Sheets
8.1 Preparation of Sheets:8.1.1 Unless otherwise specified, condition the sheeted
compound for 1 to 24 h at 236 3°C (73.46 5.4°F) at a relativehumidity not greater than 55 %. For maximum precision,condition for 1 to 24 h in a closed container to preventabsorption of moisture from the air, or in an area controlled at35 6 5 % relative humidity.
8.1.2 Place the sheeted compound on a flat, dry, clean metalsurface and cut pieces that are 4.56 1.5 mm (0.186 0.06 in.)shorter in width and length than the corresponding dimensionsof the mold cavity. Mark the direction of the milling on eachpiece.
8.1.3 The mass of a 150 by 150-mm (6 by 6-in.) sheet or a150 by 75-mm (6 by 3-in.) sheet to be vulcanized in the moldsdescribed in 8.2.2 shall be as shown below:
D 3182
3
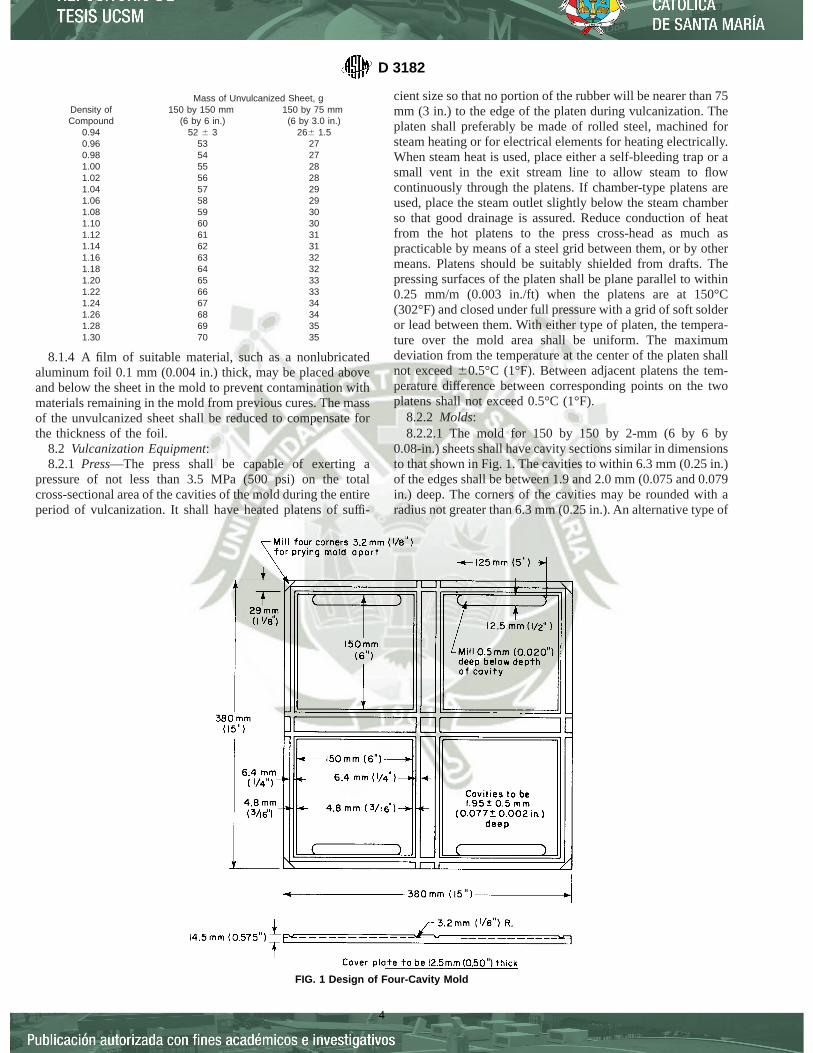
Mass of Unvulcanized Sheet, gDensity ofCompound
150 by 150 mm(6 by 6 in.)
150 by 75 mm(6 by 3.0 in.)
0.94 52 6 3 266 1.50.96 53 270.98 54 271.00 55 281.02 56 281.04 57 291.06 58 291.08 59 301.10 60 301.12 61 311.14 62 311.16 63 321.18 64 321.20 65 331.22 66 331.24 67 341.26 68 341.28 69 351.30 70 35
8.1.4 A film of suitable material, such as a nonlubricatedaluminum foil 0.1 mm (0.004 in.) thick, may be placed aboveand below the sheet in the mold to prevent contamination withmaterials remaining in the mold from previous cures. The massof the unvulcanized sheet shall be reduced to compensate forthe thickness of the foil.
8.2 Vulcanization Equipment:8.2.1 Press—The press shall be capable of exerting a
pressure of not less than 3.5 MPa (500 psi) on the totalcross-sectional area of the cavities of the mold during the entireperiod of vulcanization. It shall have heated platens of suffi-
cient size so that no portion of the rubber will be nearer than 75mm (3 in.) to the edge of the platen during vulcanization. Theplaten shall preferably be made of rolled steel, machined forsteam heating or for electrical elements for heating electrically.When steam heat is used, place either a self-bleeding trap or asmall vent in the exit stream line to allow steam to flowcontinuously through the platens. If chamber-type platens areused, place the steam outlet slightly below the steam chamberso that good drainage is assured. Reduce conduction of heatfrom the hot platens to the press cross-head as much aspracticable by means of a steel grid between them, or by othermeans. Platens should be suitably shielded from drafts. Thepressing surfaces of the platen shall be plane parallel to within0.25 mm/m (0.003 in./ft) when the platens are at 150°C(302°F) and closed under full pressure with a grid of soft solderor lead between them. With either type of platen, the tempera-ture over the mold area shall be uniform. The maximumdeviation from the temperature at the center of the platen shallnot exceed60.5°C (1°F). Between adjacent platens the tem-perature difference between corresponding points on the twoplatens shall not exceed 0.5°C (1°F).
8.2.2 Molds:8.2.2.1 The mold for 150 by 150 by 2-mm (6 by 6 by
0.08-in.) sheets shall have cavity sections similar in dimensionsto that shown in Fig. 1. The cavities to within 6.3 mm (0.25 in.)of the edges shall be between 1.9 and 2.0 mm (0.075 and 0.079in.) deep. The corners of the cavities may be rounded with aradius not greater than 6.3 mm (0.25 in.). An alternative type of
FIG. 1 Design of Four-Cavity Mold
D 3182
4
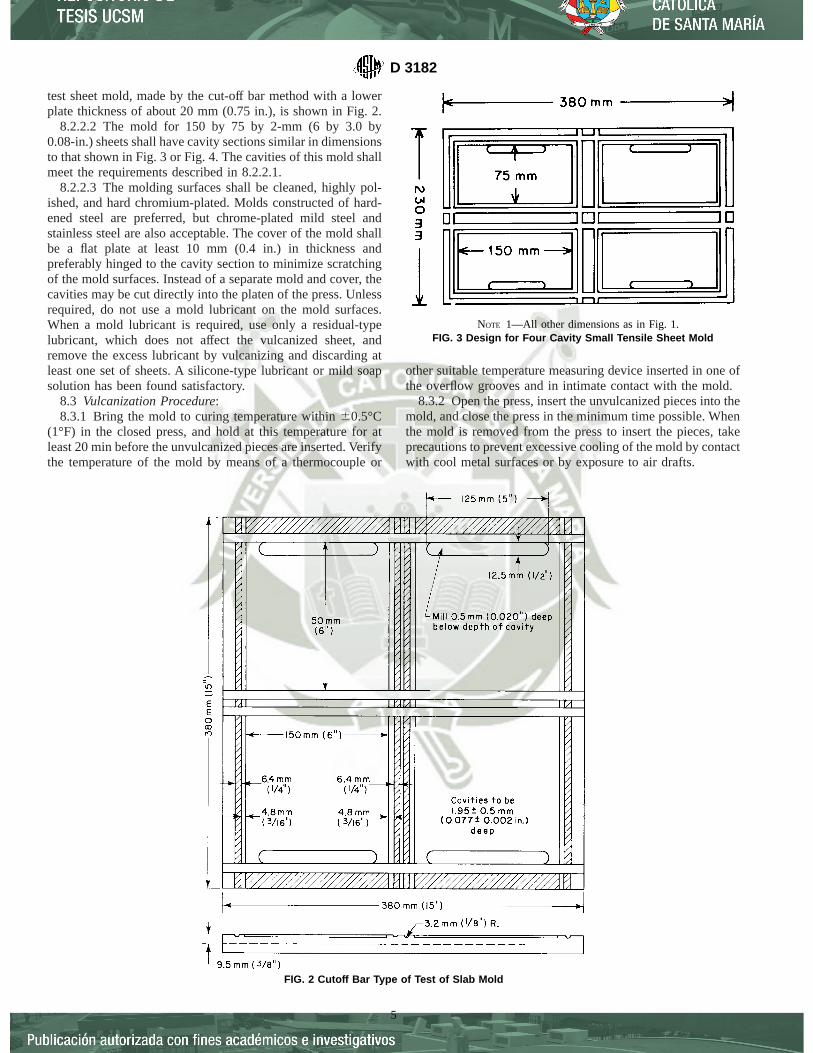
test sheet mold, made by the cut-off bar method with a lowerplate thickness of about 20 mm (0.75 in.), is shown in Fig. 2.
8.2.2.2 The mold for 150 by 75 by 2-mm (6 by 3.0 by0.08-in.) sheets shall have cavity sections similar in dimensionsto that shown in Fig. 3 or Fig. 4. The cavities of this mold shallmeet the requirements described in 8.2.2.1.
8.2.2.3 The molding surfaces shall be cleaned, highly pol-ished, and hard chromium-plated. Molds constructed of hard-ened steel are preferred, but chrome-plated mild steel andstainless steel are also acceptable. The cover of the mold shallbe a flat plate at least 10 mm (0.4 in.) in thickness andpreferably hinged to the cavity section to minimize scratchingof the mold surfaces. Instead of a separate mold and cover, thecavities may be cut directly into the platen of the press. Unlessrequired, do not use a mold lubricant on the mold surfaces.When a mold lubricant is required, use only a residual-typelubricant, which does not affect the vulcanized sheet, andremove the excess lubricant by vulcanizing and discarding atleast one set of sheets. A silicone-type lubricant or mild soapsolution has been found satisfactory.
8.3 Vulcanization Procedure:8.3.1 Bring the mold to curing temperature within60.5°C
(1°F) in the closed press, and hold at this temperature for atleast 20 min before the unvulcanized pieces are inserted. Verifythe temperature of the mold by means of a thermocouple or
other suitable temperature measuring device inserted in one ofthe overflow grooves and in intimate contact with the mold.
8.3.2 Open the press, insert the unvulcanized pieces into themold, and close the press in the minimum time possible. Whenthe mold is removed from the press to insert the pieces, takeprecautions to prevent excessive cooling of the mold by contactwith cool metal surfaces or by exposure to air drafts.
FIG. 2 Cutoff Bar Type of Test of Slab Mold
NOTE 1—All other dimensions as in Fig. 1.FIG. 3 Design for Four Cavity Small Tensile Sheet Mold
D 3182
5

8.3.3 Consider the time of vulcanization to be the periodbetween the instant the pressure is applied fully and the instantthe pressure is released. Hold the mold under a minimumpressure of 3.5 MPa (500 psi) on the cavity areas duringvulcanization. As soon as the press is opened, remove thevulcanized sheets from the mold and cool in water (roomtemperature or lower) or on a metal surface (for items used forelectrical measurements) for 10 to 15 min. Designate in thereport the type of cooling used.
8.3.4 Condition vulcanizates of compounds at a temperature
of 23 6 2°C (736 3.6°F) for at least 16 h (Note 4) and for notmore than 96 h before preparing and testing, unless otherwisespecified.
NOTE 4—Quality control of rubber production may require testingwithin 1 to 6 h to provide close surveillance of the plant operation;however, slightly different results may be obtained.
The ASTM International takes no position respecting the validity of any patent rights asserted in connection with any itemmentioned in this standard. Users of this standard are expressly advised that determination of the validity of any such patent rights,and the risk of infringement of such rights, are entirely their own responsibility.
This standard is subject to revision at any time by the responsible technical committee and must be reviewed every five years andif not revised, either reapproved or withdrawn. Your comments are invited either for revision of this standard or for additional standardsand should be addressed to ASTM International Headquarters. Your comments will receive careful consideration at a meeting of theresponsible technical committee, which you may attend. If you feel that your comments have not received a fair hearing you shouldmake your views known to the ASTM Committee on Standards, at the address shown below.
This standard is copyrighted by ASTM International, 100 Barr Harbor Drive, PO Box C700, West Conshohocken, PA 19428-2959,United States. Individual reprints (single or multiple copies) of this standard may be obtained by contacting ASTM at the aboveaddress or at 610-832-9585 (phone), 610-832-9555 (fax), or [email protected] (e-mail); or through the ASTM website(www.astm.org).
FIG. 4 Design of Eight Cavity Mold, for Small Tensile Sheets Made by Modifying the Mold Shown in Fig. 1
D 3182
6

Designation: D 3574 – 95
Standard Test Methods forFlexible Cellular Materials—Slab, Bonded, and MoldedUrethane Foams 1
This standard is issued under the fixed designation D 3574; the number immediately following the designation indicates the year oforiginal adoption or, in the case of revision, the year of last revision. A number in parentheses indicates the year of last reapproval. Asuperscript epsilon (e) indicates an editorial change since the last revision or reapproval.
This standard has been approved for use by agencies of the Department of Defense.
1. Scope
1.1 These test methods apply to slab, bonded, and moldedflexible cellular products known as urethane foams. Urethanefoam may be generally defined as an expanded cellular productproduced by the interaction of active hydrogen compounds,water, and isocyanates.
1.2 This standard does not purport to address all of thesafety concerns, if any, associated with its use. It is theresponsibility of the user of this standard to establish appro-priate safety and health practices and determine the applica-bility of regulatory limitations prior to use.
1.3 This standard should be used to measure and describethe response of materials, products, or assemblies to heat andflame under controlled conditions and should not be used todescribe or appraise the fire hazard or fire risk of materials,products, or assemblies under actual fire conditions. However,results of this test may be used as elements of a fire hazardassessment or a fire risk assessment which takes into accountall of the factors which are pertinent to an assessment of thefire hazard or fire risk of a particular end use.
2. Referenced Documents
2.1 ASTM Standards:D 412 Test Methods for Vulcanized Rubber and Thermo-
plastic Rubbers and Thermoplastic Elastomers— Tension2
D 4483 Practice for Determining Precision for Test MethodStandards in the Rubber and Carbon Black Industries2
E 162 Test Method for Surface Flammability of MaterialsUsing a Radiant Heat Energy Source3
NOTE 1—The specific dated edition of Practice D 4483 that prevails inthis document is referenced in the Precision and Bias section.
3. Terminology
3.1 Definitions of Terms Specific to This Standard:3.1.1 bonded foam—a product produced by the adhesion of
small pieces of urethane foam to each other with a suitablebonding agent.
3.1.2 core—the internal portion of a molded part, free ofskin.
3.1.3 flexible cellular product—a cellular organic polymericmaterial that will not rupture when a specimen 200 by 25 by 25mm is bent around a 25-mm diameter mandrel at a uniform rateof 1 lap in 5 s at atemperature between 18 and 29°C.
3.1.4 molded foam—a cellular product having the shape ofthe enclosed chamber in which it is produced by foaming.
3.1.5 skin—the smooth surface layer of a molded foamproduct, formed by contact with the mold or surfaces.
3.1.6 slab—a section of foam that is cut from the internalportion of a large bun.
3.1.7 urethane foam—a flexible cellular product producedby the interaction of active hydrogen compounds, water, andisocyanates.
4. Summary of Test Methods
4.1 Unless specifically stated otherwise between the sup-plier and the purchaser, all tests shall be made in accordancewith the methods specified in Sections 9-124 which include testprocedures for the following:
Tests: SectionsTest A Density Test 9-15Test B1 Indentation Force Deflection Test—Specified
Deflection 16-22Test B2 Indentation Force Deflection Test—Specified
Force 23-29Test C Compression Force Deflection Test 30-36Test D Constant Deflection Compression Set Test 37-44Test E Tension Test 45-52Test F Tear Resistance Test 53-60Test G Air Flow Test 61-67Test H Resilience (Ball Rebound) Test 68-75Test I1 Static Force Loss Test at Constant Deflection
77-85Test I2 Dynamic Fatigue Test by the Roller Shear at
Constant Force, 86-94Test I3 Dynamic Fatigue Test by Constant Force
Pounding 95-103Test I4 Dynamic Fatigue Test for Carpet Cushion 104-112Test J Steam Autoclave Aging 113-118Test K Dry Heat Aging 119-124
Appendixes:X1. Suggested Method for Specifying Flexible Urethane Foams
1 These test methods are under the jurisdiction of ASTM Committee D-20 onPlastics and are the direct responsibility of Subcommittee D20.22 on CellularPlastics.
Current edition approved Feb. 15, 1995. Published May 1995. Originallypublished as D 3574 – 77. Last previous edition D 3574 – 91.
2 Annual Book of ASTM Standards, Vol 09.01.3 Annual Book of ASTM Standards, Vol 04.07.
1
AMERICAN SOCIETY FOR TESTING AND MATERIALS100 Barr Harbor Dr., West Conshohocken, PA 19428
Reprinted from the Annual Book of ASTM Standards. Copyright ASTM
X2. Suggested Method of Construction for a Roller Shear Dynamic Flex Fa-tigue Apparatus
X3. Definitions of Terms Used to Describe the Force-Deflection Curve ofFlexible Urethane Foam
X4. Suggested Tests for Determining Combustibility of Flexible UrethaneFoam. (The combustion tests are given for informational purposes onlyand are not part of the standard.)
X5. Suggested Method for Verification of an Inclined Oil Manometer
5. Significance and Use
5.1 The test procedures provide a standard method ofobtaining data for research and development, quality control,acceptance and rejection under specifications, and specialpurposes.
5.2 The data obtained by these test methods are applicableto the material under conditions of the particular test and arenot necessarily the same as obtained in other environments inuse.
6. General Test Conditions
6.1 Tests shall be conducted under known conditions oftemperature and humidity or as specified in the individual testprocedure. The product shall be conditioned undeflected, andundistorted at the temperature and humidity of test for at least12 h before being tested. In cases of dispute, the tests shall bemade at a temperature of 236 2°C and in an atmosphere of 506 5 % relative humidity.
6.2 It is recommended for referee purposes that all testsshall be performed 7 days or more after the foam has beenmanufactured.
6.3 All foams shall be preflexed twice 75 to 80 % of theirnominal thickness or as specified by the purchaser.
7. Sampling
7.1 When possible, the completed manufactured productshall be used for the test specified. Representative samples ofthe lot being examined shall be selected at random as required.
7.2 When it is necessary or advisable to obtain specimensfrom the articles, as in those cases where the entire sample isnot required or adaptable for testing, the method of cutting andthe exact position from which specimens are to be taken shallbe specified. The density and the state of cure may vary indifferent parts of the finished product, especially if the article isof complicated shape or of varying thickness, and these factorsaffect the physical properties of the specimens. Also, thedensity is affected by the number of cut surfaces on thespecimen. If a test specimen is die cut, sufficient time should beallowed for complete recovery of the thickness across the fullwidth of the specimen.
7.3 When the finished molded product does not lend itself totesting or to the taking of specimens because of complicatedshape, small size, metal or fabric inserts, adhesion to metal, orother reasons, molded test slabs as agreed upon between thesupplier and the purchaser shall be prepared.
7.4 When differences in test results arise due to the difficultyin obtaining suitable specimens from the finished parts, thesupplier and the purchaser may agree upon an acceptablelocation to take the specimen.
8. Measurement of Test Specimens
8.1 Measure the length and width with a scale or tape. Take
care not to distort the foam.8.2 Measure thickness up to and including 25 mm using a
dial-type gage with a minimum foot area of 650 mm2. Hold thepressure of the dial foot to 1706 35 Pa (Note 2). Thicknessesover 25 mm may be measured with a dial gage, a slidingcaliper gage, or as specified in 8.1. When a sliding caliper gageis employed, make the gage setting with the gage out of contactwith the foam. Pass the specimen through the previously setgage: the proper setting shall be the one when the measuringfaces of the gage contact the surfaces of the specimen withoutcompressing it.
NOTE 2—For soft foams having compression force deflection valuesless than 1.65 kPa, the pressure on the dial foot shall not exceed 70 Pa.
8.3 The scale, tape, or gage shall be graduated so as topermit measurements within61 % of the dimensions to bemeasured.
8.4 Results reported shall be the median of a minimum ofthree measurements.
TEST A—DENSITY TEST
9. Scope
9.1 This test method covers determination of the density ofuncored foam by calculation from the mass and volume of thespecimen. The density value thus obtained applies only to theimmediate area from which the specimen has been taken. Itdoes not necessarily relate to the bulk density of the entiremolded pad.
10. Test Specimen
10.1 Interior Density—A representative specimen of regularshape, circular or square without skins or densification lines,not less than 1000 mm3 in volume, shall be cut from a portionfree of voids and defects and as near as possible to the sectionfrom which the tension and tear specimens were taken.
10.2 Section Density—A representative specimen with skinson the top and bottom surface measuring at least 0.1 m2 in areaby full-part thickness shall be cut from an area free of voidsand defects and as near as possible to the location from whichthe tension and tear specimens were taken. When thesedimensions are not possible, the largest representative portionas agreed upon between the supplier and the purchaser shall beused.
11. Number of Specimens
11.1 One specimen shall be tested.
12. Procedure
12.1 Determine the mass of the specimen within 1 %.12.2 Determine the dimensions of the specimen in accor-
dance with Section 8, and calculate the volume.
13. Calculation
13.1 Calculate the density in kilograms per cubic metre asfollows:
Density5 M/V (1)
where:
D 3574
2

M 5 mass of specimen, kg, andV 5 volume of specimen, m3.
14. Report
14.1 Report the following information:14.1.1 Density to the nearest 1 kg/m3, and14.1.2 Type of specimen.
15. Precision and Bias
15.1 Precision statements are in the process of being pre-pared in the form specified by Practice D 4483 – 85.
TEST B1 —INDENTATION FORCE DEFLECTIONTEST—SPECIFIED DEFLECTION
16. Summary of Test Method
16.1 This will be known as the indentation force deflectiontest and the results as the IFD values. This test consists ofmeasuring the force necessary to produce 25 and 65 % or otherdesignated indentations in the foam product (Appendix X3).
17. Apparatus
17.1 An apparatus having a flat circular indentor foot 323cm
2
in area connected by means of a swivel joint capable ofaccommodating the angle of the sample to a force-measuringdevice and mounted in such a manner that the product orspecimen can be deflected at a speed of 0.4 to 6.3 mm/s. Theapparatus shall be arranged to support the specimen on a levelhorizontal plate which is perforated with approximately6.5-mm holes on approximately 20-mm centers to allow forrapid escape of air during the test. Special support for con-toured molded pads shall be perforated and agreed uponbetween the supplier and the purchaser. Pads longer than thebase plate shall be supported from distortion at the 4.5-Ncontact force.
18. Test Specimen
18.1 The test specimen shall consist of the entire productsample or a suitable portion of it, except that in no case shallthe specimen have dimensions less than 380 by 380 by 20 mm.Specimens less than 20 mm thick shall be plied up, without theuse of cement, to a minimum of 20 mm.
18.2 The IFD values for molded products are dependent onthe specimen dimensions. Higher values are generally obtainedfor specimens that retain all molded surfaces.
19. Number of Specimens
19.1 One specimen shall be tested.
20. Procedure
20.1 Place the test specimen in position on the supportingplate of the apparatus. If the product has one side cored orhoney-combed, this face shall rest on the perforated plate. Thespecimen position shall be such that whenever practicable theindentation will be made at the center of all articles, exceptwhere another location is agreed upon by the supplier and thepurchaser.
20.2 Preflex the area to be tested by twice lowering theindentor foot to a total deflection of 75 to 80 % of the full-part
thickness at a rate of 46 0.4 mm/s. Mark the location of thetest area with a pen by circumscribing the indentor foot whileunder a 4.5-N force. Allow the specimen to rest 66 1 min afterthe preflex.
20.3 Bring the indentor foot into contact with the specimenand determine the thickness after applying a contact force of4.5 N (Note 3) to the indentor foot. Indent the specimen at 0.836 0.08 mm/s 25 % of this thickness and observe the force innewtons after 606 3 s. Without removing the specimenincrease the deflection to 65 % deflection, allowing the force todrift while maintaining the 65 % deflection, and again observethe force in newtons after 606 3 s.
NOTE 3—For super-soft foam, foam with a 25 % IFD less than 40 N, areduction of pressure on the indentor foot shall be allowed. Sufficientpressure to make contact is normal.
21. Report
21.1 Report the force in newtons required for 25 and 65 %indentation (Note 4). These figures are known as the 25 % and65 % IFD values, respectively. Report also length, width, andthickness of the specimen and the ratio (comfort factorAppendix X3) of 65 % to 25 % IFD values.
NOTE 4—Indentation deflection tests, other than 25 and 65 %, as well asa 25 % return value, may be specified as agreed upon between the supplierand the purchaser.
22. Precision and Bias
22.1 Precision statements are in the process of being pre-pared in the form specified by Practice D 4483 – 85.
TEST B2 —INDENTATION FORCE DEFLECTIONTEST—SPECIFIED FORCE
23. Summary of Test Method
23.1 Cellular foam products have been traditionally checkedfor force deflection by determining the force required to effecta 5 % deflection. In seating, on the other hand, the interest is indetermining how thick the padding is under the average person.Two measurements are called for to meet the requirements ofthis test method. The force deflection is determined by mea-suring the thickness of the pad under a fixed force of 4.5 N, 110N, and 220 N, on a 323-cm2 circular indentor foot.
23.2 This determination shall be known as the IndentationResidual Deflection Force and the measurements as the IRDFvalues.
24. Apparatus
24.1 An apparatus having a flat circular indentor foot 323cm
2
in area and equipped with a swivel joint for applying forcesof 4.5 N, 110 N, and 220 N shall be mounted over a levelhorizontal platform that is perforated with approximately6.5-mm holes on approximately 20-mm centers to allow forrapid escape of air during the test. The distance between theindentor foot and the platform shall be variable to indent thespecimen at a speed of 0.836 0.08 to 3.36 0.3 mm/s fordeflection measurements. The apparatus shall be equipped witha device for measuring the distance between plates.
24.2 Special support for contoured molded pads shall beperforated and agreed upon between the supplier and the
D 3574
3

purchaser. Pads longer than the base plate shall be supportedfrom distortion at the 4.5-N contact force.
25. Test Conditions
25.1 When possible the completed manufactured productshall be used. In the case of tapered cushions, the location ofthe area for measurement is to be agreed upon between thesupplier and the purchaser. In the case a finished part is notfeasible for test, 380 by 380-mm specimens of an averagethickness are to be cut from the cushion.
25.2 The IRDF values for molded products are dependenton the specimen dimensions. Difference values are generallyobtained for specimens that retain all molded surfaces.
26. Number of Specimens
26.1 One specimen shall be tested.
27. Procedure
27.1 Test the whole test specimen or a minimum area of 380by 380 mm. Preflex twice to a 10-kPa pressure. This corre-sponds to 330 N on a 320-cm2 indentor foot at 3.3 mm/s. Allowto rest 66 1 min. Position in the test apparatus with anycoring, honeycombing, or slotting resting on the perforatedbottom plate.
27.2 Bring the indentor foot into contact and determine thethickness of the specimen with the 4.5-N load on the indentorfoot.
27.3 Apply the 110-N force at 0.836 0.08 mm/s to theindentor foot and indent the specimen until the force is carriedby the specimen. Determine the thickness at 110 N aftermaintaining the force for 606 3 s.
27.4 Without removing the specimen apply the 220-N forceto the indentor foot and further indent the pad until this load iscarried. After 606 3 s under load, observe the thickness of thepad.
28. Report
28.1 Report the specimen thickness after 606 3 s at 4.5 N,110 N, and 220 N. These figures are known as the IRDF values,respectively. Report also the length, width, and thickness of thespecimen.
29. Precision and Bias
29.1 Precision statements are in the process of being pre-pared in the form specified by Practice D 4483 – 85.
TEST C—COMPRESSION FORCE DEFLECTIONTEST
30. Summary of Test Method
30.1 This test consists of measuring the force necessary toproduce a 50 % compression over the entire top area of thefoam specimen.
NOTE 5—Compression deflection tests other than at 50 % may bespecified as agreed upon between the supplier and the purchaser.
31. Apparatus
31.1 An apparatus having a flat compression foot, largerthan the specimen to be tested connected to a force-measuring
device and mounted in a manner such that the product orspecimen can be deflected at a speed of 0.4 to 6.3 mm/s. Theapparatus shall be arranged to support the specimen on a levelhorizontal plate that is perforated with approximately 6.5-mmholes on approximately 20-mm centers to allow for rapidescape of air during the test.
32. Test Specimens
32.1 The slab test specimen shall have parallel top andbottom surfaces and essentially vertical sides. The thicknessshall be no greater than 75 % of the minimum top dimension.
32.2 Specimens from uncored slab stock shall be a mini-mum of 2500 mm2 in area and a minimum thickness of 20 mm.Specimens less than 20 mm thick shall be plied up, without theuse of cement, to a minimum of 20 mm.
32.3 Specimens from cored slab stock shall be of such sizethat the coring does not appreciably affect the compressionvalue.
32.4 The test specimen from molded parts shall haveparallel top and bottom surfaces and perpendicular sides.Preferably the specimen should include both top and bottommolded skins. If a test specimen with parallel top and bottomsurfaces including both molded skins cannot be obtainedbecause of the shape of the molded part, at least one of themolded skin surfaces should be retained. Both surface skinsshould be removed only in cases where the shape of theoriginal sample makes this absolutely necessary.
32.5 Maximum molded specimen thickness shall be nogreater than the minimum top dimensions. Specimens fromuncored stock shall have a minimum length of 50 mm, aminimum width of 50 mm, and a minimum thickness of 20mm. Specimens less than 20 mm thick shall be plied up,without the use of cement, to a minimum of 20 mm.
33. Number of Specimens
33.1 Three specimens per sample shall be tested. The valuereported shall be the median of those observed. If any valuedeviates more than 20 % from this median, two additionalspecimens shall be tested and the median for all five valuesshall be reported.
34. Procedure
34.1 Preflex the specimen twice, 75 to 80 % of its originalthickness at 46 0.4 mm/s. Then allow the specimen to rest fora period of 66 1 min.
34.2 Place the specimen centered in the line of the axial loadon the supporting plate of the apparatus. If the product has oneside cored or honeycombed, rest this face on the perforatedplates.
34.3 Bring the compression foot into contact with thespecimen and determine the thickness after applying a contactload of 140 Pa to the specimen area (Note 2). Compress thespecimen 50 % of this thickness at 0.836 0.08 mm/s andobserve the final load after 606 3 s.
35. Report
35.1 Report the thickness after contact load, and the 50 %compression deflection value in pascals.
D 3574
4

36. Precision and Bias
36.1 Precision statements are in the process of being pre-pared in the form specified by Practice D 4483 – 85.
TEST D—CONSTANT DEFLECTION COMPRESSIONSET TEST
37. Summary of Test Method
37.1 This test method consists of deflecting the foamspecimen under specified conditions of time and temperatureand noting the effect on the thickness of the specimen.
38. Apparatus
38.1 Compression Device, consisting of two or more flatplates arranged so the plates are held parallel to each other bybolts or clamps and the space between the plates is adjustableto the required deflection thickness by means of spacers.
39. Test Specimens
39.1 The test specimens shall have parallel top and bottomsurfaces and essentially perpendicular sides.
39.2 Specimens from uncored slab stock shall be 50 by 50by 25 mm unless otherwise specified. Specimens less than 25mm in thickness shall be plied up, without the use of cement,to a 25-mm thickness.
39.3 Specimens from cored slab stock shall be of such sizethat the coring does not appreciably affect the test result. Theyshall have a minimum top surface area of 100 cm2. Thethickness shall be no greater than 75 % of the minimum topdimension.
39.4 Specimens from uncored molded products 75 mm orless in thickness shall be 50 by 50 mm by full-part thicknessand shall contain the top and bottom skin.
39.5 Specimens greater than 50 mm in thickness shall be cutto 50 mm thickness and the sample containing the top skin usedfor testing.
39.6 Specimens from cored molded products shall be ofsuch size that the coring does not appreciably affect the testresults. They shall have a minimum top surface area of at least100 cm2. The thickness shall be no greater than 75 mm andshall include the top molded surface. Specimens from moldedproducts may be tested without skins by agreement betweenthe customer and the supplier.
40. Number of Specimens
40.1 Three specimens per sample shall be tested. The valuereported shall be the median of those observed. If any valuedeviates more than 20 % from this median, two additionalspecimens shall be tested and the median for all five valuesshall be reported.
41. Procedure
41.1 Perform the entire test procedure under the followingconditions: Conduct all measurements, conditioning, and re-covery of the specimen at 236 2°C and in an atmosphere of506 2 % relative humidity. The oven conditions shall be 7062°C and 561 % relative humidity.
NOTE 6—This condition of relative humidity may be achieved byplacing an oven at 706 2°C in an atmosphere maintained at 236 2°C and
50 6 2 % relative humidity.
41.2 Measure the test specimen in accordance with theprocedure described in Section 8.
41.3 Place the test specimen in the apparatus and deflect itto either 506 1, 756 1, or 906 1 % of its thickness, or anyother deflection depending on the value agreed upon betweenthe supplier and the purchaser.
41.4 Within 15 min, place the deflected specimen and theapparatus in the mechanically convected air oven for a periodof 22 h; then remove the apparatus.
41.5 Remove the specimen immediately from the apparatusand measure it in accordance with the procedure described inSection 8 after 30 to 40 min recovery.
42. Calculation
42.1 Calculate two compression set values as follows:42.1.1 Calculate the constant deflection compression set,
expressed as a percentage of the original thickness, as follows:
Ct 5 @~to 2 tf!/to # 3 100 (2)
where:Ct 5 compression set expressed as a percentage of the
original thickness,to 5 original thickness of test specimen, andtf 5 final thickness of test specimen 30 min + 10 or − 0
min after removal from the apparatus.42.1.2 Calculate the constant deflection compression set,
expressed as a percentage of the original deflection, as follows:
Cd 5 @~to 2 tf!/~to 2 ts!# 3 100 (3)
where:Cd 5 compression set expressed as a percent of the origi-
nal deflection,to 5 original thickness of test specimen,ts 5 thickness of spacer bar used, andtf 5 final thickness of test specimen 30 min +10 or −0
min after removal from the apparatus.
NOTE 7—Approximate conversion ofCd to Ct can be calculated bymultiplying the 50 % Ct by 2, the 75 %Ct by 1.33, and the 90 %Ct by1.11.
43. Report
43.1 Report compression set asCt or Cd, and deflectionused.
44. Precision and Bias
44.1 Precision statements are in the process of being pre-pared in the form specified by Practice D 4483 – 85.
TEST E—TENSION TEST
45. Scope
45.1 This test method determines the effect of the applica-tion of a tensile force to foam. Measurements are made fortensile stress, tensile strength, and ultimate elongation.
46. Apparatus
46.1 Dies—The specimen for tension tests shall be stampedout with a die of the shape and dimensions shown in Fig. 1, or
D 3574
5

Die A of Test Methods D 412. The die shall be sharp and freeof nicks in order to prevent leaving ragged edges on thespecimen.
46.2 Bench Marker—The marker shall have two parallelmarking edges 1.6 mm in thickness and spaced 20 or 25 mmapart on centers.
46.3 Measurements—The dimensions of the test specimenshall be determined with a suitable gage in accordance withSection 8.
46.4 Machine—Tension tests shall be made on a power-driven machine complying with the following requirements:
46.4.1 The machine shall be of such capacity as to allow thespecimen to break at practically three fourths of machinefull-scale force. It shall be equipped with a dial or scaleindicator that will remain at the point of maximum load afterrupture of the specimen and will measure the applied tension atthat point. Rate of travel of a power-actuated grip shall be 8.360.8 mm/s and shall be uniform at all times.
46.4.2 The machine may be equipped with a device gradu-ated to 2.5 mm for measuring the elongation. For testingdumbbell specimens, the machine shall have either screw-typeflat plate grips or a type of grip that tightens automatically andexerts a uniform pressure across the gripping surfaces, increas-ing as the tension increases to prevent slipping.
47. Test Specimens
47.1 The test specimens shall be cut from flat sheet material12.5 6 1.5 mm thick. The top and bottom surfaces shall beparallel and free of skin. The cut edges shall be perpendicularto the top surface and be free of ragged edges. The specimensshall be die cut either parallel to or across the direction of riseof the foam and shall be so specified. The length of the tabsmay be adjusted to fit machine conditions provided that allother requirements remain constant.
48. Number of Specimens
48.1 Three specimens per sample shall be tested. The valuereported shall be the median of those observed. If any valuedeviates more than 20 % from this median, two additionalspecimens shall be tested, and the median for all five valuesshall be reported.
49. Procedure
49.1 Set the grip separation at 65.3 mm minimum. Place thedumbbell tabs in the grips of the testing machine, using care toadjust them symmetrically, in order that the tension will bedistributed uniformly over the cross section. Start the machine
and note continuously the distance between the two benchmarks. Record the stress at the corresponding elongation or ifan automatic recording device is used, it will record the datacontinuously. At rupture, measure or record elongation to thenearest 10 %.
50. Calculation
50.1 Calculate the tensile strength by dividing the breakingforce by the original cross-sectional area of the specimen.
50.2 Calculate the stress by dividing the force at a prede-termined elongation by the original cross-sectional area of thespecimen.
50.3 Calculate the ultimate elongation,A, by subtracting theoriginal distance between the bench marks from the totaldistance between the bench marks at the time of rupture andexpressing the difference as a percentage of the originaldistance, as follows, or use the grip separations in a similarcalculation.
A, % 5@~df 2 do!/do # 3 100 (4)
where:do 5 original distance between bench marks, anddf 5 distance between bench marks at the break point.
50.4 The value reported shall be the median value of allspecimens tested.
51. Report
51.1 Report the following information:51.1.1 Tensile strength in kilopascals,51.1.2 Stress in kilopascals at a predetermined elongation,
and51.1.3 Ultimate elongation, in percent, and whether the
distance between bench marks or grip separations were used inthe calculations.
52. Precision and Bias
52.1 Precision statements are in the process of being pre-pared in the form specified by Practice D 4483 – 85.
TEST F—TEAR RESISTANCE TEST
53. Scope
53.1 This test method covers determination of the tearresistance of foam. The block method, as described, measuresthe tear resistance under the conditions of this particular test.
54. Apparatus
54.1 Tear resistance shall be measured on a power-drivenapparatus which will indicate the final load at which rupture ofthe specimen takes place. An automatic machine may be usedwhich draws the actual curve, or, a style or scale shall be usedhaving an indicator that remains at the point of maximum forceafter rupture.
55. Test Specimens
55.1 The test specimens shall be a block shape free of skin,voids, and densification lines, as shown in Fig. 2. They may becut on a saw or die cut from sheet material so that the sides areparallel and perpendicular to each other. A40-mm cut shall be
FIG. 1 Die for Stamping Tension Specimens
D 3574
6

placed in one side as shown in Fig. 2. DimensionA-B can bereduced to the pad thickness. The thickness shall be determinedin accordance with Section 8.
56. Number of Specimens
56.1 Three specimens per sample shall be tested. The valuesreported shall be the median of those tested. If any valuedeviates more than 20 % from this median, two additionalspecimens shall be tested and the median for all five valuesshall be reported.
57. Procedure
57.1 Clamp the test specimen in the jaws of the testingmachine, taking care that the jaws grip the specimen properly.Spread the block so that each tab is held in the jaw to pullacross the specimen. Apply the force with a jaw speed of 0.75to 9 mm/s. Aid the cut in the specimen with a razor blade orknife, so as to keep it in the center of the block. After therupture of the specimen, or after at least a 50-mm length is torn,record in newtons the maximum on the dial or scale, and notealso the thickness of the specimen (directionA-B).
58. Calculation
58.1 Calculate the tear strength from the maximum forceregistered on the testing machine and the average thickness ofthe specimen (directionA-B), as follows:
Tear strength, N/m5 F/T (5)
where:F 5 force, N, andT 5 thickness, m.
59. Report
59.1 Report the following information:59.1.1 Tear strength in newtons per metre,59.1.2 Orientation of specimen, and59.1.3 Crosshead speed.
60. Precision and Bias
60.1 Precision statements are in the process of being pre-pared in the form specified by Practice D 4483 – 85.
TEST G—AIR FLOW TEST
61. Scope
61.1 The air flow test measures the ease with which airpasses through a cellular structure. Air flow values may be usedas an indirect measurement of certain cell structure character-istics. The test consists of placing a flexible foam core
specimen in a cavity over a chamber and creating a specifiedconstant air-pressure differential. The rate of flow of airrequired to maintain this pressure differential is the air flowvalue.
NOTE 8—A surface porosity test will be developed when required for amolded skin surface. This test is normally for slab products.
62. Terminology
62.1 Definitions of Terms Specific to This Standard:62.1.1 air flow value—the volume of air per second at
standard temperature and pressure required to maintain aconstant pressure differential of 125 Pa across a flexible foamspecimen approximately 50 by 50 by 25 mm.
62.1.2 air flow parallel to foam rise—the air flow valueobtained when the air enters and leaves the mounted specimenparallel to foam rise.
62.1.3 air flow perpendicular to foam rise—the air flowvalue obtained when the air enters and leaves the specimenperpendicular to foam rise.
63. Apparatus
63.1 A schematic drawing of the apparatus including thespecimen mounting chamber, manometer, air flowmeters,blowmeters, blower, and voltage control is shown in Fig. 3.4
63.2 Chamber, consisting of a pot approximately 130 mm indiameter and 150 mm high with provision for mounting thefoam specimen and fittings for the manometer and air exhaust.The specimen mount cavity shall be either 50.06 0.05 by 50.06 0.05 by 25.06 0.05 mm in size. Four foam support vanesapproximately 1 mm thick and 12.5 mm high shall be placedunder the opening to prevent the foam from being pulled intothe vacuum chamber. The vanes shall be spaced 12.5 mm oncenter from each other and also centered relative to the bottomof the cavity opening. The manometer fitting shall enter a1-mm hole midway along the side of the chamber. A 25-mmpipe fitting shall be used as the exhaust outlet from the centerof the bottom of the chamber.
63.3 Manometer, calibrated from 0 to 250 Pa and having anaccuracy of62 %, is required. An inclined oil manometer withgraduations of 2 Pa is recommended. A level mounted on themanometer shall be used to ensure that the proper degree ofinclination from the horizontal is maintained. Traps shall beprovided to prevent indicating fluid from being accidentallydrawn into the chamber. Appendix X5. describes a suggestedmethod for the verification of the inclined oil manometer, themanometer can alternatively be replaced with a O-250 Pamagnehelic gage with graduations in 5 Pa.
63.4 Flowmeters and Blower—Low-pressure-drop air flow-meters accurate to62 % shall be used for air-flow measure-ments. A given flowmeter should not be used for values lessthan 10 % of full scale. Air flowmeters with at least 250-mmscales are recommended. Since the flowmeter calibration istemperature-and pressure-dependent, the use of the apparatusunder ambient conditions can result in erroneous readings. Incases of dispute, the apparatus should be used under standard
4 An electronic instrument that has proven to be effective for measuring air flowis available from Fluid Data, 2512 N. Velasco, Angleton, TX 77515.
FIG. 2 Tear Resistance Test Specimens
D 3574
7
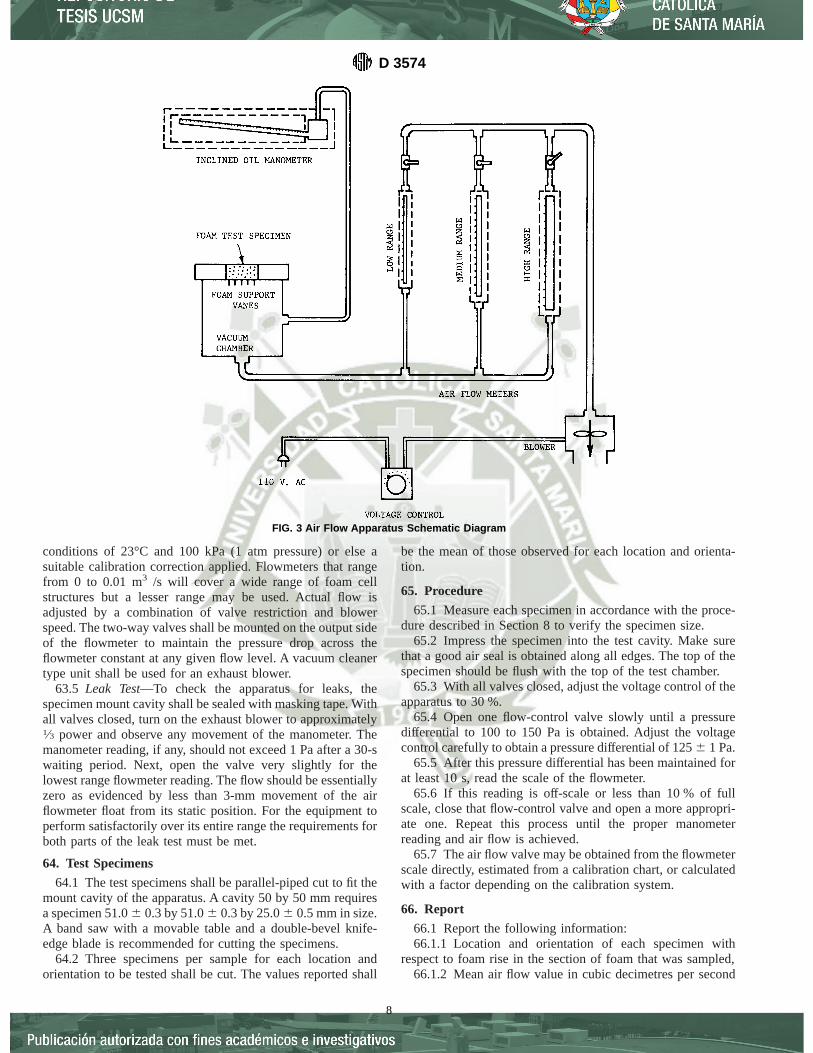
conditions of 23°C and 100 kPa (1 atm pressure) or else asuitable calibration correction applied. Flowmeters that rangefrom 0 to 0.01 m3 /s will cover a wide range of foam cellstructures but a lesser range may be used. Actual flow isadjusted by a combination of valve restriction and blowerspeed. The two-way valves shall be mounted on the output sideof the flowmeter to maintain the pressure drop across theflowmeter constant at any given flow level. A vacuum cleanertype unit shall be used for an exhaust blower.
63.5 Leak Test—To check the apparatus for leaks, thespecimen mount cavity shall be sealed with masking tape. Withall valves closed, turn on the exhaust blower to approximately1⁄3 power and observe any movement of the manometer. Themanometer reading, if any, should not exceed 1 Pa after a 30-swaiting period. Next, open the valve very slightly for thelowest range flowmeter reading. The flow should be essentiallyzero as evidenced by less than 3-mm movement of the airflowmeter float from its static position. For the equipment toperform satisfactorily over its entire range the requirements forboth parts of the leak test must be met.
64. Test Specimens
64.1 The test specimens shall be parallel-piped cut to fit themount cavity of the apparatus. A cavity 50 by 50 mm requiresa specimen 51.06 0.3 by 51.06 0.3 by 25.06 0.5 mm in size.A band saw with a movable table and a double-bevel knife-edge blade is recommended for cutting the specimens.
64.2 Three specimens per sample for each location andorientation to be tested shall be cut. The values reported shall
be the mean of those observed for each location and orienta-tion.
65. Procedure
65.1 Measure each specimen in accordance with the proce-dure described in Section 8 to verify the specimen size.
65.2 Impress the specimen into the test cavity. Make surethat a good air seal is obtained along all edges. The top of thespecimen should be flush with the top of the test chamber.
65.3 With all valves closed, adjust the voltage control of theapparatus to 30 %.
65.4 Open one flow-control valve slowly until a pressuredifferential to 100 to 150 Pa is obtained. Adjust the voltagecontrol carefully to obtain a pressure differential of 1256 1 Pa.
65.5 After this pressure differential has been maintained forat least 10 s, read the scale of the flowmeter.
65.6 If this reading is off-scale or less than 10 % of fullscale, close that flow-control valve and open a more appropri-ate one. Repeat this process until the proper manometerreading and air flow is achieved.
65.7 The air flow valve may be obtained from the flowmeterscale directly, estimated from a calibration chart, or calculatedwith a factor depending on the calibration system.
66. Report
66.1 Report the following information:66.1.1 Location and orientation of each specimen with
respect to foam rise in the section of foam that was sampled,66.1.2 Mean air flow value in cubic decimetres per second
FIG. 3 Air Flow Apparatus Schematic Diagram
D 3574
8
for each location and orientation,66.1.3 Dimensions of the specimen, and66.1.4 Dimension of the mount cavity of the apparatus.
67. Precision and Bias
67.1 Precision statements are in the process of being pre-pared in the form specified by Practice D 4483 – 85.
TEST H—RESILIENCE (BALL REBOUND) TEST
68. Scope
68.1 This test consists of dropping a steel ball on a foamspecimen and noting the height of rebound.
69. Apparatus
69.1 The ball rebound tester shall consist of a 38-mm insidediameter vertical clear plastic tube, such as acrylic, into whicha 16-mm diameter (16.3-g) steel ball is released by a magnet orother device. The steel ball must be released so that it fallswithout rotation. Centering of the ball is assured by a recess atthe base of the magnet. The height of drop shall be 500 mm.Since it is most convenient to note the position of the top of theball on rebound, the top of the ball shall be 516 mm above thesurface of the foam. Thus, “zero” rebound shall be 16 mm(diameter of ball) above the specimen surface. The scale on theback of the tube shall be calibrated directly in percent asfollows. Every 5 % a complete circle shall be scribed and every1 % a 120° arc shall be scribed. The complete circles are anessential part of the apparatus, since they are used to eliminateparallax error.
70. Test Specimens
70.1 The test specimens shall have parallel top and bottomsurfaces.
70.2 The test specimens shall consist of the entire productsample or a suitable portion of it, except that in no case shallthe thickness be less than 50 mm, or the area less than 100 by100 mm. Specimens less than 50 mm thick should be plied up,without the use of cement, to a minimum of 50 mm. Formolded products the top skin should be removed.
71. Number of Specimens
71.1 Three specimens per sample shall be tested. The threespecimens may be obtained by using separate items or differentlocations on a given item.
72. Procedure
72.1 Center the specimen at the base of the tube and adjustthe height of the tube so that zero rebound is 16 mm above thesurface of the foam specimen.
72.2 Mount the steel ball on the release mechanism; thendrop it and note the maximum rebound height. If the ballstrikes the tube on the drop or rebound, the value obtained isinvalid. This condition is usually due to the tube not beingvertical or irregularities on the specimen surface. In order tominimize parallax error, the circles on the tube in the regionwhere the percent rebound is read must appear as lines.
72.3 Make an additional two drops on the same specimen.
73. Calculation
73.1 Calculate the median of the three rebound values. If
any value deviates more than 20 % from this median, make twoadditional drops and calculate the median for all five drops.
74. Report
74.1 Report the median of the three specimen medians asthe ball rebound resilience value of the sample in percent.
75. Precision and Bias
75.1 Precision statements are in the process of being pre-pared in the form specified by Practice D 4483 – 85.
TEST I—FATIGUE TESTS
76. Scope
76.1 The fatigue tests consist of four methods:76.1.1 Static Force Loss Test at Constant Deflection,76.1.2 Dynamic Fatigue by the Roller Shear at Constant
Force,76.1.3 Dynamic Fatigue Test by Constant Force Pounding,
and76.1.4 Dynamic Fatigue Test for Carpet Cushion.
TEST I1 —STATIC FORCE LOSS TEST ATCONSTANT
DEFLECTION
77. Scope
77.1 The purpose of this static force loss test is to deter-mine: (1) a loss of force support, (2) a loss of thickness, and (3)structural breakdown by visual examination.
77.2 This procedure tests the specimen statistically at a75 % constant deflection.
78. Apparatus
78.1 The apparatus shall consist of two parallel plates(wood or metal) which can produce a uniform, constantdeflection of the specimen. The plates shall be 500 by 500 mmsquare, and spacer bars shall be available to produce 75 %deflection.
79. Test Specimen
79.1 The test specimen shall be 380 by 380 mm by thedesired thickness. One specimen shall be tested.
80. Initial Measurements
80.1 Measure the 25 and 65 % IFD of the test specimen inaccordance with Sections 16 to 22 except preflex six timesinstead of twice and allow to rest 5 min6 15 s rather than 66 1 min. Measure the original thickness with 4.5-N contactforce after preflexing.
81. Procedure
81.1 Place the specimen between the plates with the spacerbars to provide a 75 % deflection. Clamp the plates and hold at75 % deflection for 22 h at 236 2°C and 506 2 % relativehumidity.
82. Final Measurements
82.1 For the final force reading 30 min after the fatigue testis completed, repeat 80.1 using six preflexes and the original
D 3574
9

thickness to determine the deflection for the final force reading.82.2 If the loss in thickness is above 10 %, the force loss
would be indeterminate and only the thickness loss should bereported.
82.3 For a measurement of more permanent fatigue, repeat82.1, except allow 24 h of recovery time rather than 30 min.
83. Calculation
83.1 Check the specimen for physical breakdown of thecellular structure by visual examination and comparison withunflexed specimens.
83.2 Calculate the percentage loss of thickness as follows:
Ft 5to 2 tf
to3 100 (6)
where:Ft 5 loss in thickness, %,to 5 original specimen thickness, andtf 5 final specimen thickness.
83.3 Calculate the percentage loss of force deflection, asfollows:
FL 5Lo 2 Lf
Lo3 100 (7)
where:FL 5 loss of indentation force deflection, %,Lo 5 original indentation force deflection value, andLf 5 final indentation force deflection value.
84. Report
84.1 Report the following information:84.1.1 Percentage loss of thickness and the percentage loss
of 25 and 65 % IFD if the thickness loss is less than 10 %, and84.1.2 Results of visual examination.84.1.3 Recovery time whether 30 min. or 24 h.
85. Precision and Bias
85.1 Precision statements are in the process of being pre-pared in the form specified by Practice D 4483 – 85.
TEST I2 —DYNAMIC FATIGUE TEST BY THEROLLER
SHEAR AT CONSTANT FORCE
86. Scope
86.1 This procedure fatigues the specimen dynamically at aconstant force, deflecting the material both vertically andlaterally.
86.2 The fatigue test may be conducted by either ProcedureA or Procedure B. Both test procedures are the same and differonly in the number of cycles used. Procedure A shall use 8000cycles (approximately 5 h) and Procedure B shall use 20 000cycles (approximately 12 h).
NOTE 9—The mass of the roller and the number of cycles may bechanged as agreed upon between the supplier and the purchaser.
87. Apparatus (Appendix X2)
87.1 Perforated-Base Platen, approximately 500 by 500 by10 mm with a finished ground-top surface and with perforation
of approximately 6.5-mm centers covering the center 360 by360-mm portion.
87.2 Roller, 450-mm minimum length and 76.06 1.3mm-diameter made from stainless steel or chrome-plated metalhaving a minimum surface finish of 1 µm. The roller shall bemounted in an offset position (156 3°) with suitable means ofadjustment for a specified loading of the test specimen. Theforce imparted by the roller assembly shall not exceed 110 N.
87.3 The test is conducted at a frequency of 0.456 0.5 Hz.A cycle is a complete forward and reverse stroke. The length ofthe stroke shall be 3006 10 mm.
87.4 Any suitable method for holding the test specimensecurely on the roller base platen is acceptable as long as thetest specimen remains stationary during the rolling flex cycles.An acceptable method for retaining the specimen on the baseplaten is described as follows: Four pieces of cotton sheeting orpaper masking tape 50 to 75 mm wide at least 50 mm longerthan each side of the test specimen shall be required. Bond thecotton strips (with a solvent or water-emulsion-type of adhe-sive) or the masking tape along the edges of the base surface ofthe test specimen. Allow 25 to 50 mm of each strip to extendbeyond the edges of the test specimen so that the test specimencan be securely clamped to the base platen through the use ofsuitable metal retainer straps.
88. Test Specimen
88.1 A specimen 380 mm long by 300 mm wide by thedesired thickness is used. The thickness of specimens testedshould be at least 25 mm and no greater than 125 mm.Normally full-part thickness is used where the top and bottomsurfaces are essentially parallel and fall within the thicknesslimits. Where part thickness exceeds 125 mm or the bottomsurface is contoured so that the surfaces are not essentiallyparallel, the bottom surface shall be sliced to provide a flatsurface essentially parallel to the top surfaces (see Section 7).
88.2 The length and width dimensions shall be held to6 6.5mm and shall be saw cut or die cut; if die cut, sufficient timemust be allowed for complete edge recovery (usually 2 hminimum).
88.3 One specimen shall be tested.
89. Initial Measurements
89.1 Bond the masking tape or suitable hold-down cloth tothe bottom edges of the specimen so the specimen can besecured to the perforated base platen of the fatigue tester.
89.2 Condition the specimen as in Section 6. The test shouldalso be run under the same conditions.
89.3 Determine the IRDF in accordance with Sections23-29 except preflex the test specimen six times.
90. Procedure
90.1 Adjust the roller to obtain a constant force of 1306 2N on the foam specimen. This critical measurement may bemade by fashioning a lightweight fabric sling around the rollerat its center and measuring the force downward while holdingthe weighing scale vertically over the roller and maintainingthe roller axis in a horizontal plane with the pivot axis.
NOTE 10—Forces greater than 130 N may be used as agreed uponbetween the supplier and the purchaser.
D 3574
10

90.2 Set the vertical adjustment of the roller or the mountingbase by placing the specimen in position and lowering theroller so it is supported by the specimen. Observe the pivot axisand roller axis relationship and adjust the vertical height so thatthe axes lie in an essentially horizontal plane at the start of thetest.
90.3 Mount the test specimen on the base platen with thelong dimension parallel to the stroke of the dynamic fatiguemachine and secure by means of the tape and metal-retainerstrips. When mounting cored pieces, coring is to be against theplaten. Set the counter to zero, start the machine, and fatiguetest the sample for either 8000 cycles (Procedure A) or 20 000cycles (Procedure B).
91. Final Measurements
91.1 Within 606 5 min after the fatigue test is completed,measure the final thickness in accordance with Sections 23-29,preflexing the specimen six times.
91.2 For a measurement of more permanent fatigue repeat91.1, except allow 24 h of recovery rather than 60 min.
92. Calculation and Inspection
92.1 Check the specimen for physical breakdown of cellularstructure by visual examination and comparison with unflexedsimilar specimens.
92.2 Calculate and report the percent loss in thickness asfollows:
Thickness loss, %5100~A 2 B!
A (8)
where:A 5 original thickness under compression forces of 4.5 N,
110 N, and 220 N, andB 5 final thickness under the same compression forces.
92.3 Calculate the total loss number as follows:
Total loss number5 sum of % losses at each load (9)
Sample Calculation:Percent thickness loss at 4.5 N 5 2.0Percent thickness loss at 110 N 5 18.0Percent thickness loss at 220 N 5 27.0Total loss number 47.0
93. Report
93.1 Report the following information:93.1.1 Percentage loss of thickness and the percentage loss
of compressed thickness under the force if the thickness loss isless than 10 %,
93.1.2 Method used for load deflection,93.1.3 Total loss number, and93.1.4 Results of visual examination.93.1.5 Recovery time whether 60 min. or 24 h.
94. Precision and Bias
94.1 Precision statements are in the process of being pre-pared in the form specified by Practice D 4483 – 85.
TEST I3 —DYNAMIC FATIGUE TEST BY CONSTANTFORCE POUNDING
95. Scope
95.1 The purpose of the fatigue test is to determine: (1) the
loss of force support at 40 % IFD (indentation force deflec-tion), (2) a loss in thickness, and (3) structural breakdown asassessed by visual inspection.
NOTE 11—Deflection other than 40 % may be used as agreed uponbetween supplier and purchaser.
95.2 This procedure describes tests that evaluate the speci-men by repeatedly deflecting the material by a flat-horizontalindention exerting a vertical force of 7506 20 N on the testspecimen.
95.3 This fatigue test may be conducted by either ProcedureA or Procedure B. The test procedures differ only in the numberof cycles used. Procedure A shall use 8000 cycles (approxi-mately 2 h) and Procedure B shall use 80 000 cycles (approxi-mately 19 h).
96. Apparatus
96.1 Perforated Base Platen, approximately 500 by 300 by10 mm, with finished ground-top surface and with perforationof approximately 6.5-mm diameter holes on 20-mm centers,over a minimum central area of 350 by 350 mm.
96.2 A flat circular indentor that exerts a force of 7506 20N on the test specimen at maximum indentation. The indentorshall have an overall diameter of 2506 1 mm with a 25 61-mm radius at the lower edge, to prevent cutting hard foam.
96.3 By means of a crank or other suitable mechanism, themachine shall be capable of oscillating either the platencarrying the test specimen or the indentor support mountingtowards each other in a vertical direction at a frequency of 706 5 cycles per minute.
96.4 The indentor shall be free to be lifted in its mounting toprevent overloading of the test specimen.5
97. Test Specimen
97.1 The test specimen shall be 380 by 380 by 50 mm. Onespecimen shall be tested.
98. Initial Measurement
98.1 The specimen shall be conditioned for at least 12 h andalso fatigued at 236 2°C and 506 5 % relative humidity.
98.2 Measure the 40 % IFD of the test specimen in accor-dance with Sections 16-22 except preflex six times instead oftwice. Measure the original thickness with 4.5-N contact forceafter preflexing. (See Note 10).
99. Procedure
99.1 Mount the specimen on the base platen. Set the counterto zero, start the machine, and fatigue the test specimen foreither 8000 cycles (Procedure A) or 80 000 cycles (ProcedureB).
100. Final Measurement
100.1 Within 606 5 min after the fatigue test is completed,repeat 98.2 using six preflexes and the original thickness todetermine the deflection for the final force reading.
5 Detailed drawings are available from ASTM Headquarters. Request AdjunctNo. 12-435740-20.
D 3574
11

100.2 For a measurement of more permanent fatigue repeat100.1, except allow 24 h of recovery rather than 60 min.
100.3 If the loss in thickness is above 10 %, the force losswould be indeterminate and only the thickness loss should bereported.
101. Calculation
101.1 Check the specimen for physical breakdown of thecellular structure by visual examination and comparison withunflexed specimens.
101.2 Calculate the percent loss of thickness as follows:
Ft 5to 2 tf
to3 100 (10)
where:Ft 5 loss in thickness, %,to 5 original specimen thickness, andtf 5 final specimen thickness.
101.3 Calculate the percent loss of force deflection, asfollows:
FL 5Lo 2 Lf
Lo3 100 (11)
where:FL 5 loss of 40 % indentation force deflection, %,Lo 5 original 40 % indentation force deflection value, andLf 5 final indentation force deflection value.
102. Report
102.1 Report the following information:102.1.1 Percent loss in thickness and the percent loss of
40 % IFD if the thickness loss is less than 10 %, and102.1.2 Results of visual examination.102.1.3 Recovery time whether 60 min. or 24 h.
103. Precision and Bias
103.1 Precision statements are in the process of beingprepared in the form specified by Practice D 4483 – 85.
TEST I4 —DYNAMIC FATIGUE TEST FOR CARPETCUSHION
104. Scope
104.1 The purpose of this test is to determine: (1) retentionof force support at 65 % CFD (compression force deflection),(2) a loss in thickness, and (3) structural breakdown asaddressed by visual inspection.
104.2 This procedure describes tests that evaluate the speci-men by repeatedly deflecting the carpet cushion by a 152 mmdiameter and 152 mm wide rubber covered roller exerting aforce of 2666 5N on the test specimens.
104.3 This fatigue test may be conducted by either Proce-dure A or Procedure B. The test procedures differ only in thenumber of cycles used. Procedure A shall use 8000 cycles(approximately 5 h) and Procedure B shall use 20 000 cycles(approximately 12 h).
NOTE 12—CFD at other than 65 % deflection may be used uponagreement between customer and supplier.
105. Apparatus (Appendix X2)
105.1 The apparatus is identical to that described in Section87 with the following changes. The roller described in 104.2replaces the longer roller and is attached perpendicularly. Thebase platen is replaced or covered with a 19 mm thick plywoodfor mounting the sample. The sample is secured with floortacks or staples. The carpet is likewise attached with floor tacksor staples. (See Fig. 4 for test apparatus.)
FIG. 4 Three-station Carpet Cushion Fatigue Tester
D 3574
12

106. Test Specimens
106.1 The specimen is 380 mm long and 230 mm wide, diecut with two 100 mm diameter discs on the center line about 20to 30 mm apart. Secure the sample to the plywood base.
107. Initial Measurements
107.1 Condition the specimens as in Section 6. The testshould be run under the same conditions, if possible. Preflexthe specimens 6 times 75 % of the nominal thickness. After a6 6 1 min rest, measure the original thickness,to, according toSection 8 and determine the original 65 % CFD,Lo, accordingto Sections 30-36.
108. Procedure
108.1 Place the disc specimens in the sample with the slipcoat up and cover with carpet, securing the free end of thecarpet to the plywood base. The type of carpet used shall beagreed upon by the purchaser and supplier. Lab studies havedetermined that the carpet can be used up to 5 tests (100 000cycles) and be replaced without affecting the foam fatigue.
108.2 If needed, adjust the vertical height of the roller orbase so that the axis lies in an essentially horizontal plane at thestart of the test.
108.3 Set the counter to zero, start the machine, and fatiguethe sample for either 8000 cycles (Procedure A) or 20 000cycles (Procedure B).
109. Final Measurements
109.1 Within 606 5 min after the fatigue test is completedmeasure the final thickness,tf, according to Section 8 and thefinal 65 % CFD,Lf, according to Sections 30-36 except preflex6 times and use the original thickness,to, to determine thedeflection.
109.2 For a measurement of more permanent fatigue repeat109.1, except allow 24 h of recovery rather than 60 min.
110. Calculation and Inspection
110.1 Check the specimen and the carpet backing forphysical breakdown by visual examination.
110.2 Calculate and report the percentage loss in thicknessas follows:
Fl 5to 2 tf
to3 100 (12)
where:Fl 5 loss in thickness, %,to 5 original specimen thickness, andtf 5 final specimen thickness.
110.3 Calculate the percentage retain of force deflection asfollows:
R5 1002~Lo 2 Lf 3 100!
~Lo!(13)
where:R 5 retain CFD, %,Lo 5 original CFD force, andLf 5 final CFD force.
111. Report
111.1 Report the following information:
111.1.1 Percentage loss in thickness and percentage retainof 65 % compression force deflection,
111.1.2 Result of visual examination of both the carpet andcarpet backing, and
111.1.3 Description of the carpet.111.1.4 Recovery time whether 60 min. or 24 h.
112. Precision and Bias
112.1 Precision statements are in the process of beingprepared in the form specified by Practice D 4483 – 85.
TEST J—STEAM AUTOCLAVE AGING
113. Summary of Test Method
113.1 This test consists of treating the foam specimen in alow-pressure steam autoclave and observing the effects on theproperties of the foam specimen. Use either of the followingprocedures,J1 or J2 :
113.1.1 Procedure J1, 3 h at 105 63°C.113.1.2 Procedure J2, 5 h at 125 + 0,−5°C.
114. Apparatus
114.1 Steam Autoclave, or similar vessel, that is thermostati-cally controlled to62°C and capable of withstanding gagepressures of up to 140 kPa.
115. Procedure
115.1 Fill the autoclave with fresh-distilled water to a level50 mm above the bottom of the autoclave. Set the thermostatcontrol at the desired procedures of test, which is between 1056 3°C and 125 + 0, −5°C. Allow the autoclave to heat until thewater boils. Place the specimen on edge on a rack in the insidecontainer so that one specimen does not touch another or anymetal except at the supporting surface. Place the containerinside the autoclave and close and tighten the top. Leave thesafety valve open until all the air is out of the autoclave. Thisis apparent when steam begins blowing out of the ports on thesafety valve. Close the valve 2 min after the appearance ofsteam, and take the zero time of the heat at this point.
115.2 After the exposed period, turn off the heat, release thesteam pressure, and remove the specimens without delay. Drythe specimens for 3 h for each 25 mm of thickness at 10065°C in a mechanically convected dry-air oven. Allow them tocome to temperature equilibrium, after removal from the oven,for at least 2 and no more than 24 h at 236 2°C and 506 5 %relative humidity.
115.3 Test each specimen for the prescribed property inaccordance with the appropriate sections.
NOTE 13—A drying temperature of 70°C may be used where 100°Cadversely affects the final properties upon agreement by customer andsupplier.
116. Calculation
116.1 Calculate the present change in physical property asfollows:
Physical property change, %5~Po 2 Pf!
Po3 100 (14)
D 3574
13
where:Po 5 mean property of the unexposed specimen, andPf 5 mean property of the exposed specimen.
117. Report
117.1 Report the following information:117.1.1 Percent change in physical property,117.1.2 Original and steam aged results for other properties,
and117.1.3 Test procedureJ1 or J2.
118. Precision and Bias
118.1 Precision statements are in the process of beingprepared in the form specified by Practice D 4483 – 85.
TEST K—DRY HEAT AGING
119. Summary of Test Method
119.1 This test consists of exposing foam specimens in anair-circulating oven and observing the effect on the propertiesof the foam.
120. Apparatus
120.1 Air-Circulating Oven, capable of maintaining 14061.2°C for exposing the specimens. A device for sensing andrecording the temperature of the oven at least every 2 h shall beattached.
121. Procedure
121.1 Expose the specimens for 22 h. Obtain and record theoven temperature near the specimen at least every 2 h.
121.2 Remove the specimens from the oven and conditionfor not less than 12 h at 236 2°C and 506 5 % relativehumidity.
122. Calculation
122.1 Calculate the percent change in physical property asfollows:
Physical property change, %5~Po 2 Pf!
Po3 100 (15)
where:Po 5 mean property of the unexpected specimen, andPf 5 mean property of the exposed specimen.
123. Report
123.1 Report the following information:123.1.1 Percent change in physical property, and123.1.2 Original and heat aged results for other properties.
124. Precision and Bias
124.1 Precision statements are in the process of beingprepared in the form specified by Practice D 4483 – 85.
125. Keywords
125.1 bonded; flexible cellular; molded; slab; urethane
APPENDIXES
(Nonmandatory Information)
X1. SUGGESTED METHOD FOR SPECIFYING FLEXIBLE URETHANE FOAMS
X1.1 The suggested practice for specifying flexible ure-thane foam is:
USU—Urethane Slab UncoredUSC—Urethane Slab CoredUMU—Urethane Molded UncoredUMC—Urethane Molded Cored
Digits following the number specify the firmness grade and theletters following that specify type of load deflection test.
X1.2 Suffix letters may be added singly or in combination
after the above to indicate additional requirements. The valuesfor these suffix tests are to be arranged between the supplierand the purchaser.
X1.3 Example: USU 30 IFD F E H
The foam is a urethane slab uncored with a 30-lb IndentationForce Deflection value at 25 % deflection. Minimum value tear(F), tension (E), and resilience values (H) have been agreedupon.
X2. SUGGESTED METHOD OF CONSTRUCTION FOR A ROLLER SHEARDYNAMIC FLEX FATIGUE APPARATUS
X2.1 The following requirements are established to definethe equipment and relationship of parts for a constant-loadroller shear machine. See Fig. X2.1 and Fig. X2.2 for referenceto part numbers.
X2.2 Roller, 1:
X2.2.1 Dimensions—457-mm minimum length, and 76.206 1.27-mm diameter.
X2.2.2 Material—Corrosion and wear-resistant metal, ei-
ther (1) chrome-plated material, or (2) stainless steel.
X2.2.3 Surface Finish—Finish surface on roller is to beground and equivalent to at least 0.001 mm.
X2.2.4 The mass of the roller shall not exceed 11.340 kg.
X2.3 Roller Mounting Bracket Assembly2, 3, 4, 11—Theassembly consists of metal members designed to attach theroller to a pivot point, to provide bearing surfaces for minimum
D 3574
14
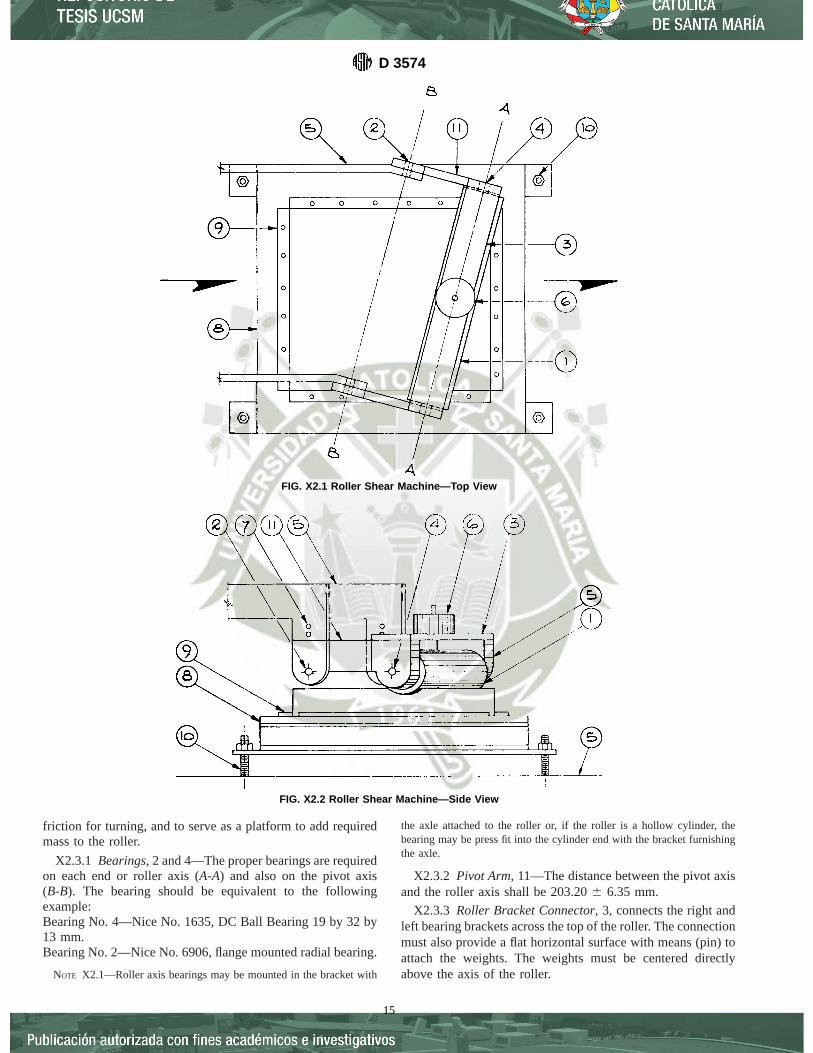
friction for turning, and to serve as a platform to add requiredmass to the roller.
X2.3.1 Bearings, 2 and 4—The proper bearings are requiredon each end or roller axis (A-A) and also on the pivot axis(B-B). The bearing should be equivalent to the followingexample:Bearing No. 4—Nice No. 1635, DC Ball Bearing 19 by 32 by13 mm.Bearing No. 2—Nice No. 6906, flange mounted radial bearing.
NOTE X2.1—Roller axis bearings may be mounted in the bracket with
the axle attached to the roller or, if the roller is a hollow cylinder, thebearing may be press fit into the cylinder end with the bracket furnishingthe axle.
X2.3.2 Pivot Arm, 11—The distance between the pivot axisand the roller axis shall be 203.206 6.35 mm.
X2.3.3 Roller Bracket Connector, 3, connects the right andleft bearing brackets across the top of the roller. The connectionmust also provide a flat horizontal surface with means (pin) toattach the weights. The weights must be centered directlyabove the axis of the roller.
FIG. X2.1 Roller Shear Machine—Top View
FIG. X2.2 Roller Shear Machine—Side View
D 3574
15

X2.3.4 Axis Relationship—The roller axis (A-A) and pivotaxis (B-B) must be parallel and lie in the same horizontal planeparallel to the specimen mounting base.
X2.3.5 Alignment and Clearance—Brackets and axles mustbe aligned so that no binding occurs to obstruct free turning oneither axis. Brackets and other support members (5) must givefree clearance so that specimen is not touched during test otherthan by roller surface.
X2.3.6 Weight, 6—The total vertical force exerted by theassembly plus the roller should not exceed 111 N as measuredat a point directly above or below the roller axis when bothroller and pivot axes are in the same horizontal plane (X2.3.4).Additional weights to be added as shown.
X2.3.7 Vertical Adjustment, 7—If the roller is not driven toprovide stroke movement, provision should be made so thatattachment of the pivot axis to the support can be raised orlowered at least 75 mm (3 in.). This adjustment must be able tobe made in not less than 12.5-mm increments.
X2.4 Specimen Mounting Base, 8:
X2.4.1 Dimensions—500-mm minimum length. 500-mmminimum width, and 9.5-mm minimum thickness.
X2.4.2 Material—Structural-grade carbon steel.X2.4.3 Perforation—6-mm diameter holes on 20-mm cen-
ters, over a minimum area covering 350 mm in length by 350mm in width.
X2.4.4 Surface Finish—Top surface shall be a finish grind.X2.4.5 Hold-Down Plates, 9—Provision to attach metal or
wood hold-down plates for clamping cotton sheeting retaining
strips to base. Four plates are required to cover perimeter ofspecimen size.
X2.4.6 Vertical Adjustment and Level, 10—If mountingbase is not driven to provide stroke movement, provisionshould be made for vertical adjustment of at least 75 mm. Thisadjustment must be able to provide vertical movement in notless than 12.5-mm increments and maintain a horizontal levelcondition of the mounting base.
X2.5 Mechanical Requirements:
X2.5.1 Stroke Length—The length of stroke shall be 330612 mm.
X2.5.2 Stroke Speed, Stroke Drive—The rate of strokespeed should produce 0.476 0.03 Hz. A cycle is a completeforward and reverse stroke. Either the roller or the mountingbase may be driven to produce stroke travel. In either case, thedrive mechanism must produce travel in a horizontal plane.
X2.5.3 Angular Offset—The axis of the roller should belevel and mounted at a 156 3° offset from perpendicular to thedirection of the stroke.
X2.5.4 Mounting Base Location—The length of the mount-ing base should be parallel to the direction of the stroke andcentered under the midpoint of the stroke and the center of theroller. The distance of the base surface from the roller axis(X2.3.4) should be 45 mm when vertical adjustment providesa minimum clearance.
X2.5.5 Cycle Counter—Means to record the number ofcycles should be provided.
X3. DEFINITIONS OF TERMS USED TO DESCRIBE THE FORCE-DEFLECTION CURVEOF FLEXIBLE URETHANE FOAM
X3.1 support factor—the ratio of the 65 % indentationforce deflection to the 25 % indentation force deflectiondetermined after 1 min of rest. Most specifications are based onthe 25 % IFD value of a 100-mm foam. The support factor thusindicates what 65 % IFD value would be acceptable for aparticular application. The 65 % IFD measures the supportregion of the stress-strain curve. Seating foams with lowsupport factors will usually bottom out and give inferiorperformance.
Support factor~SF! 5 ~65 % IFD/25 % IFD! (X3.1)
Synonyms—Sag factor, hardness ratio, comfort factor.
X3.2 guide factor—the ratio of the 25 % indentation forcedeflection to the density after a 1-min rest. Most specificationsdo not have a density requirement; therefore the product withthe highest guide factor has the cost advantage but notnecessarily the performance advantage.
Guide factor~GF! 5 ~25 % IFD/density! (X3.2)
X3.3 initial hardness factor—the ratio of the 25 % inden-tation force deflection force to the 5 % indentation forcedeflection determined without the 1-min rest. The initialhardness ratio defines the surface feel of a flexible urethanefoam. Supple or soft surface foam will have a high value, while
boardy or stiff surface foams will have a low value (NoteX3.1).
Initial hardness factor~IHF! 5 ~25 % IFD/5 % IFD! (X3.3)
NOTE X3.1—Standard IFD curves can be used to generate the IHF, IM,and MIF data.
X3.4 hardness index—the term used in some specificationsfor the 50 % IFD value. The chair designer will often designfurniture for a maximum 50 % indentation. Bar stools on theother hand may be designed for only a 20 % deflection.
X3.5 indentation modulus—the force required to producean indentation of an additional 1 % between the limits of 20 %indentation force deflection and 40 % indentation force deflec-tion determined without the 1-min rest. The slope of this linedepends upon the resistance of the cells struts to post buckling(Note X3.1).
Indentation modulus~IM! 5 ~40 % IFD2 20 % IFD/20 % IFD!(X3.4)
X3.6 modulus irregularity factor—the intercept producedon the stress axis by extrapolation of the linear portion of thestress-strain curve. The indentation modulus, that is, the slopeof the line, may be substantially constant up to and beyond the40 % indentation level. In this event, the indentation stress-strain curve is linear and passes through the origin Fig. X3.1.
D 3574
16

The indentation modulus usually varies at low levels of strainbefore reaching a constant value at above approximately 10 perstrain. The stress-strain curve may exhibit a marked step in thatregion which may result in some discomfort in seating appli-cations, Fig. X3.2 and Fig. X3.3. The MIF value is calculatedfrom the same data necessary to derive the modulus of thefoam as a seating material (Note X3.1).
Modulus irregularity factor~MIF! 5 2 3 20 % IFD2 40 % IFD(X3.5)
X4. SUGGESTED TESTS FOR DETERMINING COMBUSTIBILITY OF FLEXIBLE URETHANE FOAM
X4.1 This appendix lists for informational purposes onlythe test methods commonly used for determining the combus-tion properties of flexible urethane foams. These tests have
been found useful in ascertaining the effectiveness of additivesand reactants to modify the combustion characteristics of thesematerials. See 1.3.
X4.2 Some Applicable Codes and Regulations for SpecifiedApplications:
FIG. X3.1 Indentation Stress-Strain Curve (MIF is Zero)FIG. X3.2 Indentation Stress-Strain Curve (MIF is positive)
FIG. X3.3 Indentation Stress-Strain Curve (MIF is negative)
D 3574
17
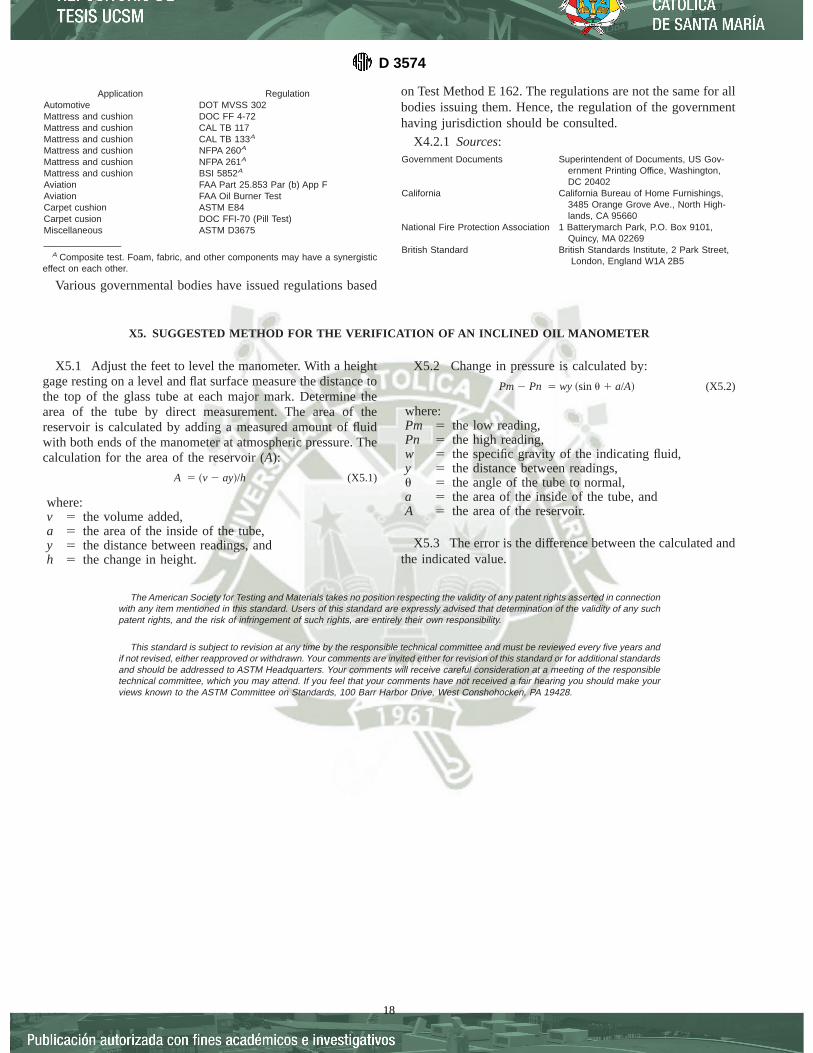
Application RegulationAutomotive DOT MVSS 302Mattress and cushion DOC FF 4-72Mattress and cushion CAL TB 117Mattress and cushion CAL TB 133A
Mattress and cushion NFPA 260A
Mattress and cushion NFPA 261A
Mattress and cushion BSI 5852A
Aviation FAA Part 25.853 Par (b) App FAviation FAA Oil Burner TestCarpet cushion ASTM E84Carpet cusion DOC FFI-70 (Pill Test)Miscellaneous ASTM D3675_______________
A Composite test. Foam, fabric, and other components may have a synergisticeffect on each other.
Various governmental bodies have issued regulations based
on Test Method E 162. The regulations are not the same for allbodies issuing them. Hence, the regulation of the governmenthaving jurisdiction should be consulted.
X4.2.1 Sources:Government Documents Superintendent of Documents, US Gov-
ernment Printing Office, Washington,DC 20402
California California Bureau of Home Furnishings,3485 Orange Grove Ave., North High-lands, CA 95660
National Fire Protection Association 1 Batterymarch Park, P.O. Box 9101,Quincy, MA 02269
British Standard British Standards Institute, 2 Park Street,London, England W1A 2B5
X5. SUGGESTED METHOD FOR THE VERIFICATION OF AN INCLINED OIL MANOMETER
X5.1 Adjust the feet to level the manometer. With a heightgage resting on a level and flat surface measure the distance tothe top of the glass tube at each major mark. Determine thearea of the tube by direct measurement. The area of thereservoir is calculated by adding a measured amount of fluidwith both ends of the manometer at atmospheric pressure. Thecalculation for the area of the reservoir (A):
A 5 ~v 2 ay!/h (X5.1)
where:v 5 the volume added,a 5 the area of the inside of the tube,y 5 the distance between readings, andh 5 the change in height.
X5.2 Change in pressure is calculated by:
Pm2 Pn 5 wy ~sinu 1 a/A! (X5.2)
where:Pm 5 the low reading,Pn 5 the high reading,w 5 the specific gravity of the indicating fluid,y 5 the distance between readings,u 5 the angle of the tube to normal,a 5 the area of the inside of the tube, andA 5 the area of the reservoir.
X5.3 The error is the difference between the calculated andthe indicated value.
The American Society for Testing and Materials takes no position respecting the validity of any patent rights asserted in connectionwith any item mentioned in this standard. Users of this standard are expressly advised that determination of the validity of any suchpatent rights, and the risk of infringement of such rights, are entirely their own responsibility.
This standard is subject to revision at any time by the responsible technical committee and must be reviewed every five years andif not revised, either reapproved or withdrawn. Your comments are invited either for revision of this standard or for additional standardsand should be addressed to ASTM Headquarters. Your comments will receive careful consideration at a meeting of the responsibletechnical committee, which you may attend. If you feel that your comments have not received a fair hearing you should make yourviews known to the ASTM Committee on Standards, 100 Barr Harbor Drive, West Conshohocken, PA 19428.
D 3574
18
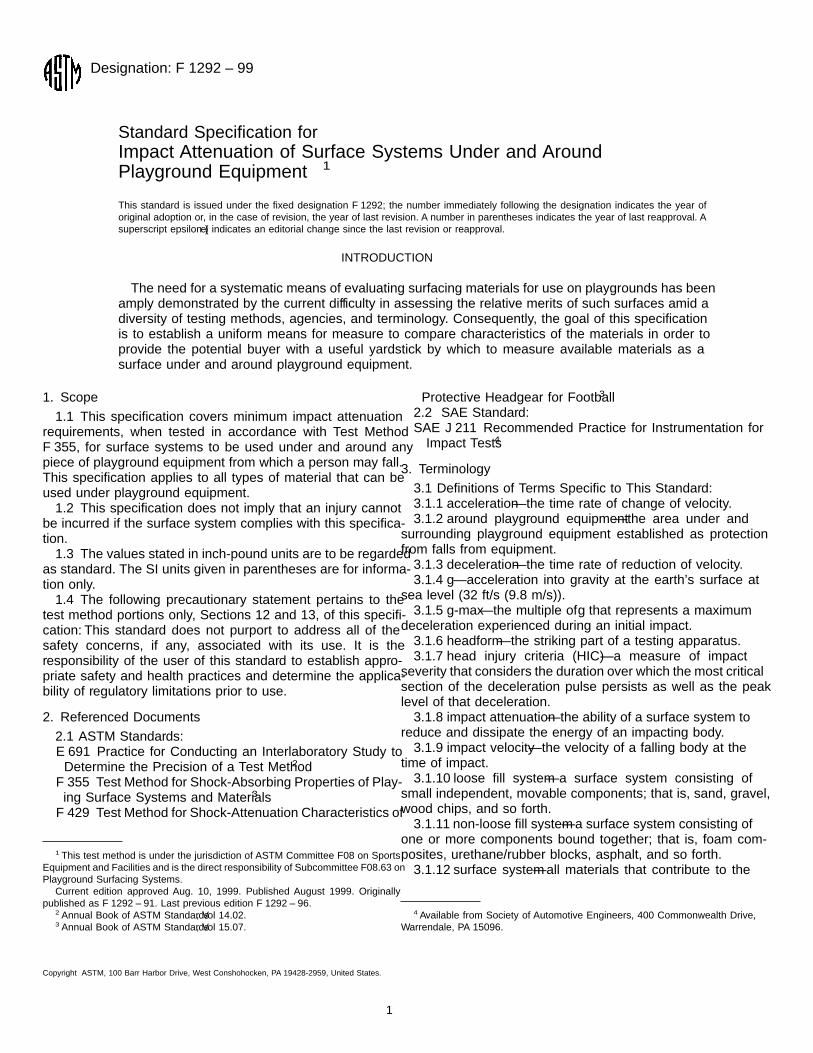
Designation: F 1292 ± 99
Standard Speci®cation forImpact Attenuation of Surface Systems Under and AroundPlayground Equipment 1
This standard is issued under the ®xed designation F 1292; the number immediately following the designation indicates the year oforiginal adoption or, in the case of revision, the year of last revision. A number in parentheses indicates the year of last reapproval. Asuperscript epsilon (e) indicates an editorial change since the last revision or reapproval.
INTRODUCTION
The need for a systematic means of evaluating surfacing materials for use on playgrounds has beenamply demonstrated by the current difficulty in assessing the relative merits of such surfaces amid adiversity of testing methods, agencies, and terminology. Consequently, the goal of this speci®cationis to establish a uniform means for measure to compare characteristics of the materials in order toprovide the potential buyer with a useful yardstick by which to measure available materials as asurface under and around playground equipment.
1. Scope
1.1 This speci®cation covers minimum impact attenuationrequirements, when tested in accordance with Test MethodF 355, for surface systems to be used under and around anypiece of playground equipment from which a person may fall.This speci®cation applies to all types of material that can beused under playground equipment.
1.2 This speci®cation does not imply that an injury cannotbe incurred if the surface system complies with this speci®ca-tion.
1.3 The values stated in inch-pound units are to be regardedas standard. The SI units given in parentheses are for informa-tion only.
1.4 The following precautionary statement pertains to thetest method portions only, Sections 12 and 13, of this speci®-cation: This standard does not purport to address all of thesafety concerns, if any, associated with its use. It is theresponsibility of the user of this standard to establish appro-priate safety and health practices and determine the applica-bility of regulatory limitations prior to use.
2. Referenced Documents
2.1 ASTM Standards:E 691 Practice for Conducting an Interlaboratory Study to
Determine the Precision of a Test Method2
F 355 Test Method for Shock-Absorbing Properties of Play-ing Surface Systems and Materials3
F 429 Test Method for Shock-Attenuation Characteristics of
Protective Headgear for Football3
2.2 SAE Standard:SAE J 211 Recommended Practice for Instrumentation for
Impact Tests4
3. Terminology
3.1 De®nitions of Terms Speci®c to This Standard:3.1.1 accelerationÐthe time rate of change of velocity.3.1.2 around playground equipmentÐthe area under and
surrounding playground equipment established as protectionfrom falls from equipment.
3.1.3 decelerationÐthe time rate of reduction of velocity.3.1.4 gÐacceleration into gravity at the earth's surface at
sea level (32 ft/s (9.8 m/s)).3.1.5 g-maxÐthe multiple of g that represents a maximum
deceleration experienced during an initial impact.3.1.6 headformÐthe striking part of a testing apparatus.3.1.7 head injury criteria (HIC)Ða measure of impact
severity that considers the duration over which the most criticalsection of the deceleration pulse persists as well as the peaklevel of that deceleration.
3.1.8 impact attenuationÐthe ability of a surface system toreduce and dissipate the energy of an impacting body.
3.1.9 impact velocityÐthe velocity of a falling body at thetime of impact.
3.1.10 loose ®ll systemÐa surface system consisting ofsmall independent, movable components; that is, sand, gravel,wood chips, and so forth.
3.1.11 non-loose ®ll systemÐa surface system consisting ofone or more components bound together; that is, foam com-posites, urethane/rubber blocks, asphalt, and so forth.
3.1.12 surface systemÐall materials that contribute to the
1 This test method is under the jurisdiction of ASTM Committee F08 on SportsEquipment and Facilities and is the direct responsibility of Subcommittee F08.63 onPlayground Surfacing Systems.
Current edition approved Aug. 10, 1999. Published August 1999. Originallypublished as F 1292 ± 91. Last previous edition F 1292 ± 96.
2 Annual Book of ASTM Standards, Vol 14.02.3 Annual Book of ASTM Standards, Vol 15.07.
4 Available from Society of Automotive Engineers, 400 Commonwealth Drive,Warrendale, PA 15096.
1
Copyright • ASTM, 100 Barr Harbor Drive, West Conshohocken, PA 19428-2959, United States.

impact absorbing unit.3.1.13 theoretical drop heightÐequates the measured ve-
locity of the headform at the moment of impact to a height thatwould generate the same velocity if the test were performed atsea level and there was no friction to retard the headformduring a drop from that height.
3.2 For the de®nitions of other terms used in this speci®ca-tion, refer to Test Methods F 355 and F 429.
4. Performance Requirements
4.1 All surface systems must be tested in accordance withthe performance requirements in 4.2. In addition, surfaces mayalso be tested in accordance with 4.3. Testing in accordancewith the performance requirements in 4.3 is optional.
4.2 When tested in accordance with Test Method F 355 orthe free fall test method in Annex A1, using an average of thelast two of three drops, no value shall exceed 200g-max or1000 HIC for laboratory tests at temperatures of 30, 72, and120ÉF (±1, 23, and 49ÉC), respectively.
4.3 When tested in the ®eld at ambient temperature inaccordance with Test Method F 355 or the free fall test methodin Annex A1, using an average of the last two of three drops,no value shall exceed 200g-max or 1000 HIC at the heightspeci®ed by the initial owner/operator prior to purchase of thesurface.
4.4 When the surface system, while in use, is tested inaccordance with Test Method F 355 or the free fall test methodin Annex A1, using an average of the last two of three drops,at each of three test sites, and exceeds 200g-max or 1000 HICat ambient temperature, as determined by Section 13, at theheight speci®ed by the initial owner/operator prior to thepurchase of the surface, the surface system should be made tocomply or the playground equipment on the surface should notbe used until the surface complies.
5. Summary of Test Method
5.1 Representative playground surface systems or surfacingmaterial samples, or both, are tested in accordance with TestMethod F 355 or the free fall test method described in AnnexA1. Conduct laboratory tests at various drop heights and testtemperatures. Conduct the ®eld tests at the drop height speci-®ed and at the ambient temperature of the site within aspeci®ed range. The laboratory test method will determine themaximum drop height at which theg-max does not exceed 200or the HIC does not exceed 1000. The ®eld test method willdetermine theg-max and the HIC from the drop heightspeci®ed by the initial owner/operator at the ambient tempera-ture of the test.
6. Signi®cance and Use
6.1 Data obtained from this speci®cation are indicative ofthe relative impact attenuation characteristics of the play-ground surface system and can be used only for comparisonsand for establishing minimum requirements.
7. Operator Quali®cations
7.1 If not an employee of an accredited or recognizedlaboratory, the operator shall be trained and certi®ed by theequipment supplier, including written and performance testing,
to establish competency in performing appropriate Speci®ca-tion F 1292 testing.
8. Test Apparatus
8.1 The signal from the acceleration transducer shall beconditioned with a low pass ®lter, complying to Channel Class1000 of SAE J 211 (see Fig. 1).
8.2 The acceleration recording system must be capable ofaccurately resolving the deceleration to a minimum of6 5 gfrom 0 to 500g.
8.3 The acceleration transducer must be capable of with-standing impacts of at least 1000g without damage.
8.4 Use the ANSI metal Headform C from Test MethodF 355 or the hemispherical headform from the free fall testmethod in Annex A1.
8.4.1 The ANSI metal Headform C from Test MethodF 355, Procedure C, must be connected to guides (such asmonorail, dual rail, or guide wires) using a follower or othermechanism. Alternatively, the hemispherical headform fromthe free fall test method in Annex A1 may be used if connectedto a system of guides. A uniaxial or triaxial accelerometer mustbe used. The guidance system must allow the headform to beleveled prior to and during the drop tests in the crown position.The vertical accelerometer must be aligned to within 5É of thevertical axis. The accelerometer must be attached at the centerof mass of the headform.
8.4.2 The hemispherical headform from the free fall testmethod in Annex A1 must be used with a triaxial accelerom-eter. The vertical accelerometer must be aligned to within 5É ofthe vertical axis. The accelerometer must be attached at thecenter of mass of the headform.
8.5 The minimum system sampling rate required is 16 000Hz or 16 000 samples/s.
FIG. 1 Data Channel Dynamic Accuracy
F 1292
2

8.6 The HIC shall be calculated based on the followingmathematical expression:
HIC 5 F~t2 2 t1! S 1~t2 2 t1! *t1
t2adtD2.5G
max, 1000 (1)
The speci®ed algorithm and veri®cation calculations for HICare included as Appendix X2.5
9. Test Sample
9.1 Each sample of surfacing material shall represent theplayground surface system as it is intended to be used in place,including seams, partitions, corners, and fasteners/anchors orother areas that may result in less than optimal impactcharacteristics.
9.2 In the case of non-loose ®ll playground surface systems,the minimum sample shall be 12 by 12 in. (300 by 300 mm).
9.3 In the case of loose ®ll playground surface systems, abox with a minimum inside dimension of 18 by 18 in. (450 by450 mm) and side walls of sufficient height to hold the loose ®llmaterial at the thickness of intended use and to keep the loose®ll materials in place should be constructed around the base ofthe test equipment. The loose ®ll materials shall be poured toan even depth and the surface leveled and left undisturbed forthe entire test period.
10. Number of Specimens
10.1 At least nine specimens of a speci®c playgroundsurface system shall be submitted for laboratory testing.
11. Sample Conditioning
11.1 Laboratory samples shall be preconditioned at 50610 % relative humidity 726 5ÉF (236 3ÉC) for a minimumof 24 h prior to beginning testing.
11.2 Samples tested at various temperatures, 30, 72, and120ÉF, (þ1, 23, and 496 1ÉC, respectively) shall be condi-tioned for 4 h minimum. Testing must be started within 1 minof taking each sample out of the environmental chamber witha time interval between drops of 36 0.25 min. If the testintervals are not met, an additional conditioning period of 4 hwill be necessary.
12. Laboratory Procedure (Test Method)
12.1 Test all samples of the surface system in accordancewith the selected test method, Test Method F 355, or the freefall test method in Annex A1, with the headform impacting inthe crown position.
12.2 Conduct impact tests considering the following crite-ria:
12.2.1 Carry forth the impact test to a maximum drop heightin whole foot increments, that is, 1, 2, 3 ...n, that gives both adeceleration force of 200-g max and an HIC of 1000 or less. Itmust also be measured at intervals of 1 ft over and under thismaximum drop height.
12.2.2 An impact test consists of three drops at the sameimpact site, at each height. The impact site shall be at the
location that exhibits the least optimal impact characteristics(as described in 9.1). Calculate the average of the second andthird drops.
12.2.3 The impact test uses a different sample at all heightsat the given temperatures.
12.2.4 The impact test samples are to be tested at the threespeci®c temperatures of 30, 72, and 120ÉF (þ1, 23, and 49ÉC,respectively) after the required conditioning.
12.2.5 If for any reason during the test, the headformholding ®xture interferes with the test, note it in the report anddiscontinue the test. The information recorded shall be consid-ered invalid.
12.2.6 When using Test Method F 355, measure and recordthe impact velocity for each drop. It cannot vary more than6 0.5 ft/s from the theoretical free fall velocity at the dropheight used.
13. Field Test Procedure (Test Method)
13.1 Test at least three different impact sites of each surfacesystem in use in accordance with the selected test method,either Test Method F 355 or the free fall test method in AnnexA1 with the headform in the crown position. The selectedimpact sites shall include those areas that may exhibit less thanoptimal impact characteristics. These areas may be high trafficor compressed areas as well as areas containing seams,partitions, corners, and fasteners/anchors.
13.2 Conduct impact test in accordance with the followingcriteria:
13.2.1 Carry forth the impact tests at the drop height, asspeci®ed by the initial owner/operator.
13.2.2 The impact test shall have three drops at each of theimpact sites, for a total of nine impacts. Report the average ofthe second and the third drops for bothg-max and HIC values.
13.2.3 Insert a temperature measuring device into the sur-face system (within 6 in. (152 mm) of the impact site) at thetime of the impact test, to measure the temperature of thesurface system, at a1¤2-in. (12.5-mm) depth or no more thanhalf the depth of the surface system.
13.2.4 Measure and record the impact velocity for eachdrop. The impact velocity cannot vary more than6 0.5 ft./sec.from the theoretical free fall velocity at the drop height used.
14. Report
14.1 Report the following information:14.1.1 The sample identi®cation, including type, source,
size, and thickness.14.1.2 Test procedure used and missile description, includ-
ing mass, geometry, and orientation.14.1.3 Testing conditions, including sample temperatures
and drop heights employed.14.1.4 Individual drop values and the average of the second
and third drop values for bothg-max and HIC values.14.1.5 The theoretical drop heights used.14.1.6 The deceleration/time trace in 0.5-ms intervals.
NOTE 1ÐThe preferred method of exhibiting the data would be in chartform (see Figs. 2 and 3).
15. Precision
15.1 Potential sources of error or deviations are as follows:5 Chou, C., and Nyquist, G., ªAnalytical Studies of the Head Injury Criterion,º
Society of Automotive Engineers, SAE Paper No. 740082, 1974.
F 1292
3

15.1.1 Variations in the time needed to conduct the testresult in variable levels of recovery of the material during theroom temperature tests. This variation is accentuated in non-
room temperature tests by the addition of changing temperatureconditions within the sample to the variable recovery of thematerial.
15.1.2 Variations in the impact velocity brought about bychanges in drop height or friction in the drop guidancemechanism.
15.1.3 Use of missiles other than those referenced in thisspeci®cation may cause substantial variations in results.
15.2 An interlaboratory study was conducted in 1996-97during the development of this test method. Seven laboratoriesran pairs of tests on eight surface materials using Test MethodF 355, Procedure C. The same laboratories also ran pairs oftests on the same surface materials using the free fall test
FIG. 2 Suggested Laboratory Test Report Form
FIG. 3 Suggested Field Test Report Form
TABLE 1 Precision Statistics for g-max, Test Method F 355,Procedure C
Material Average
RepeatabilityStandardDeviation
(Sr)
ReproducibilityStandardDeviation
(SR)
RepeatabilityLimit
(r)
ReproducibilityLimit(R)
D 52.4 2.0 7.8 5.6 21.8E 62.9 9.1 11.4 25.5 31.9H 107.2 3.8 7.9 10.6 25.8A 125.0 2.6 9.5 7.3 26.6C 143.8 1.9 7.7 5.3 21.6G 193.2 15.2 17.1 42.6 47.9B 202.0 2.6 14.6 7.3 40.9F 234.3 3.2 12.0 9.0 33.6
TABLE 2 Precision Statistics for g-max, Free Fall Test Method
Material Average
RepeatabilityStandardDeviation
(Sr)
ReproducibilityStandardDeviation
(SR)
RepeatabilityLimit
(r)
ReproducibilityLimit(R)
D 54.4 7.6 9.4 21.3 26.3E 51.5 11.0 11.0 30.8 30.8H 100.9 3.9 6.9 10.9 19.3A 118.0 2.1 6.2 5.9 17.4C 148.9 5.6 10.0 15.7 28.0G 180.6 5.7 9.1 16.0 25.5B 213.0 7.9 16.3 22.1 45.6F 247.1 10.9 20.2 30.5 56.6
TABLE 3 Precision Statistics for HIC, Test Method F 355,Procedure C
Material Average
RepeatabilityStandardDeviation
(Sr)
ReproducibilityStandardDeviation
(SR)
RepeatabilityLimit
(r)
ReproducibilityLimit(R)
D 145.0 12.0 30.5 33.6 85.4E 211.9 47.4 79.4 132.7 222.3H 600.0 14.4 103.2 40.3 289.0A 628.7 130.0 166.0 364.0 464.8C 731.0 13.0 103.4 36.4 289.5G 1162.0 31.9 177.0 89.3 495.6B 1433.0 148.3 220.4 415.2 617.1F 1849.0 17.3 188.2 48.4 527.0
TABLE 4 Precision Statistics for HIC, Free Fall Test Method
Material Average
RepeatabilityStandardDeviation
(Sr)
ReproducibilityStandardDeviation
(SR)
RepeatabilityLimit
(r)
ReproducibilityLimit(R)
D 144.4 26.1 35.7 73.1 100.0E 120.0 45.7 47.8 128.0 133.8H 585.3 34.1 87.4 95.5 244.7A 557.0 31.2 81.3 87.4 227.6C 767.0 44.6 110.9 124.9 310.5G 1262.0 87.8 194.8 245.8 545.4B 1330.0 71.8 162.4 201.0 454.7F 1849.0 295.9 398.7 828.5 1116.4
TABLE 5 Combined Results - Loose Fill and Non-loose FillMaterials
Uniaxial: Peak G (F 355, Procedure C) 6 24 %Free Fall: Peak G 6 20 %
Uniaxial: HIC (F 355, Procedure C) 6 54 %Free Fall: HIC 6 40 %
F 1292
4

method. In both series of tests,g-max and HIC values weredetermined. From the results of these tests, precision statisticswere calculated in compliance with Practice E 691.
15.2.1 The precision results are summarized in Tables 1-4.15.2.2 A statement on bias cannot be made because no
reference surfaces are available.15.2.3 An earlier interlaboratory study was completed in
1989.6 The technique used to analyze the study data resulted ina 6 ®gure being generated for test method precision. Applyingthis method to the 1996-7 study, the results described in Tables5 and 6 were obtained.
NOTE 2ÐThe method used to generate Tables 5 and 6 is not asstatistically accurate as the analysis used in 15.2.1. It is provided forinformational purposes only.
16. Keywords
16.1 impact attenuation; playground; surface system
ANNEXES
(Mandatory Information)
A1. FREE FALL TEST METHOD
A1.1 A nonguided headform may be used for impact testingof playground surface systems or surfacing material samples.
A1.2. Terminology
A1.2.1 De®nition of Term Speci®c to This Annex:A1.2.1.1 free fallÐthe trajectory of the headform is not
restrained by rails, wires, or a mechanism or structure of anytype.
A1.3 Apparatus
A1.3.1 Headform DesignÐThe headform as a 10.16 0.1 lb(4.6 6 0.05 kg) hemispherical missile of diameter 6.30060.200 in. (1606 5 mm). An optional handle may be affixed tothe headform provided that the total weight of the headformand handle combination does not exceed 10.16 0.1 lb (4.660.05 kg).
A1.3.2 AccelerometerÐRigidly attach a triaxial accelerom-eter at the center of mass of the headform.
A1.3.2.1 One axis of the accelerometer must be mountedparallel within 5É to the primary axis of impact of theheadform. This axis of the accelerometer shall have a linearoutput signal from 0 to 500g.
A1.3.2.2 The remaining two axes of the accelerometer mustde®ne a plane normal to the primary axis. Both of these axesshall have a linear output signal from 0 to6 500 g.
A1.3.2.3 All axes of the accelerometer must be capable ofwithstanding impacts of 1000g without damage.
A1.3.2.4 Connect the output signal of the accelerometer tothe recording device by a ¯exible multiple conductor cable.The cable shall be sufficiently ¯exible so as to not in¯uence thetrajectory of the headform before or during the impact test. Thefully extended length of the cable shall be at least two times thedrop height speci®ed by the initial owner/operator. The cableshall be of self-coiling design. The cable shall be attached tothe headform and recording device by a single multiple contactelectrical connector with integral locking action.
A1.3.2.5 The axis nominally perpendicular to the impact
surface shall be annotatedZ. The axes forming the planenominally parallel to the impact surface shall be annotatedXandY. This coordinate system complies with the right handedcoordinate system, Orientation 2, of SAE J 211.
A1.3.3 Recording EquipmentÐThe recording equipmentshall meet the following criteria:
A1.3.3.1 Acceleration TimeÐThe acceleration-time record-ing equipment shall have three input channels, each matched tothe output signal levels of the triaxial accelerometer. Eachinput channel and accelerometer pair shall have a frequencyresponse adequate to measure the peak acceleration to anaccuracy of6 5 % of the true value. The total system, accel-erometers and recorders, shall be capable of measuring im-pulses up to 500g at frequencies from 2 to an accuracy of6 5 %. The minimum system sampling rate required is 20 000Hz per input channel or 20 000 samples/s per input channels.The recording device must be capable of simultaneouslysampling each of the three input channels at the speci®edsampling rate. Three independent digitizers or a single digitizerwith three track and hold ampli®ers is acceptable. Eachacceleration data channel should comply with SAE J 211. Alow pass ®lter having a 4-pole Butterworth transfer functionand a corner frequency of 1650 Hz meets this requirement.Digitizer resolution shall be a minimum of twelve bits.
A1.3.3.2 Displacement - TimeÐProvision will be made torecord the time, in seconds, from the release of the headform tothe time of initial impact. The velocity at impact will becalculated by multiplying the fall time by the acceleration dueto gravity (32.2 ft/s/s) to yield the velocity in feet per second.The time measurement function will be part of the recordingdevice and will not require operator intervention to start andstop the measurement.
A1.3.3.3 System IntegrityÐPortable recording equipmentshall provide continuous battery voltage monitoring. If record-ing equipment battery voltage falls below a level required forproper equipment operation, the recording function shall be
6 Available from ASTM Headquarters. Request RR:F08-1002.
TABLE 6 Non-loose Fill Materials Only
Uniaxial: Peak G (F 355, Procedure C) 6 21 %Free Fall: Peak G 6 11 %
Uniaxial: HIC (F 355, Procedure C) 6 31 %Free Fall: HIC 6 24 %
F 1292
5

inhibited and the person performing the test alerted by anindicator lamp or message on the LCD interface of therecording device. Auxiliary power means, such as automobilebattery voltage converters or wall receptacle connected charg-ers, may be used to restore battery voltage to the acceptableoperating level. Impact tests may be performed with therecording device connected to the auxiliary power source. Priorto use the recording equipment and headform shall be checkedfor proper operation by impact test on a reference surfacematerial sample. The sample shall be provided by the recordingdevice manufacturer and be furnished with reference impacttest data including serial number of sample, drop height,ambient temperature, subsurface condition,g-max, and HIC.Average the results of the last two of three drops, and compareto the referenceg-max and HIC. The manufacturer of thetriaxial headform is to provide the criteria for the requirementfor recalibration of the headform, recorder, and reference pad.The impact test on the reference sample will not be construedto be a calibration of the instrument, which can only beperformed in a properly equipped metrology laboratory.
A1.3.3.4 CalibrationÐCheck the recording equipment,headform, and reference surface material sample annually forproper calibration by returning them to the manufacturer'scalibration laboratory or repair depot quali®ed by the manu-facturer.
A1.3.3.5 Impact Data and Waveform DisplayÐThe record-ing device shall have a graphic display device capable ofindicating theg-max, HIC, and impact waveform.
A1.3.3.6 Drop Height Measurement and Control-DropHeight, shall be measured from the top of the surface to betested to the surface of the headform expected to initiallyimpact the surface. Measurement shall be made with a steelrule or steel tape measure. Use a support structure or tripod toensure repeatable drop height and location. The support struc-ture or tripod shall be sufficiently rigid to support, withminimum de¯ection, the weight of the headform. The supportstructure or tripod must allow for the testing of the surface atany location within the playspace. A quick-release mechanismshall be provided to connect the headform to the support arm.The operation of the release mechanism shall not in¯uence thetrajectory of the headform during free fall. Erect the supportstructure or tripod in such a manner so as to prevent theheadform from coming in contact with any part of the supportstructure or tripod before impact with the surface being tested.
A1.3.4 Calculation:A1.3.4.1 Triaxial Acceleration Component SummingÐThe
components of acceleration in each of the three axes must bevector summed to determine composite acceleration of theheadform. Perform vector addition on each set of three samplesto determine the composite acceleration for the respectivesample period. The vector addition shall be based on thefollowing mathematical expression:
a@n# 5 ~az@n#2 1 ay@n#
2 1 ax@n#2!0.5 (A1.1)
where:a[n] = composite acceleration at sample point [n],az[n] = acceleration value ofZ axis at sample point [n],ay[n] = acceleration value ofYaxis at sample point [n], andax[n] = acceleration value ofX axis at sample point [n].
A1.3.4.2 g-Max and HICÐThe g-max and HIC shall bedetermined from the composite acceleration values. The speci-®ed algorithm and veri®cation calculations for HIC are in-cluded as Appendix X2.
A1.4 Procedure
A1.4.1 For portable recording devices, verify battery volt-age level as recommended by manufacturer.
A1.4.2 Perform the system integrity impact test using thetesting equipment manufacturer's supplied surface sample.Verify that test results are in agreement with those quoted andsupplied by the testing equipment manufacturer.
A1.4.3 Erect the support structure or tripod on the play-ground surface. The position of the release mechanism shouldallow the headform to impact the desired point repeatedly onthe surface from the drop height and location as speci®ed bythe initial owner/operator.
A1.4.4 Release the Headform:A1.4.5 Observe the impact waveform on the display of the
recording device and con®rm that it contains only one impactevent. The impact waveform should start at 0g, increase to theg-max of the drop, and return to 0g. An impact waveform notshowing this shape should be discarded. The increase anddecrease portions of the waveform may be smooth or jaggedand will depend upon the material being impacted upon.
A1.4.6 Record and Report the Following Information:A1.4.6.1 The test surface identi®cation, indicating type,
source, size, and thickness.A1.4.6.2 Test procedure used and headform description,
including mass, geometry, and orientation.A1.4.6.3 Testing conditions, including sample temperatures
and drop heights employed.A1.4.6.4 Individual drop values and the average of the
second and third drop values for bothg-max and HIC values.A1.4.6.5 The drop heights speci®ed by the initial owner/
operator.
NOTE A1.1ÐThe preferred method of exhibiting the data would be inchart form (see Fig. 1).
A1.4.7 Make three consecutive drops at intervals of 360.25 min, unless otherwise speci®ed.
A1.5 Report
A1.5.1 A detailed report will be prepared to document theresult of the drop tests. Fig. A1.1 is a suggested format for thisreport.
F 1292
6

A2. INSTRUMENTATION REQUIREMENTS
A2.1 To adequately perform surface impact tests complyingwith Speci®cation F 1292, the instrumentation employed mustmeet minimum requirements for resolution, accuracy, preci-sion, and calibration.
A2.2 Accelerometers
A2.2.1 In guided head form systems, a single axis or triaxialaccelerometer may be used. The active axis of the accelerom-eter must be rigidly attached to the head form and within6 5Éof the axis of impact of the head form.
A2.2.2 In free fall head form systems, a triaxial accelerom-eter is required. One axis of the accelerometer must be rigidlyattached to the head form and within6 5É of the primary axisof impact. The remaining two axes will form a plane parallel tothe impact surface within6 5É.
A2.2.3 The accelerometer oriented parallel to the axis ofimpact must have an output range from 0 to 500g minimum.The secondary axes in a triaxial accelerometer must have anoutput range from 0 to6 500 g minimum. All axes must becapable of withstanding a maximum shock of 1000g.
A2.2.4 The frequency response of all accelerometers shallcover the complete range from 2 to 2000 Hz.
A2.2.5 Nominal accelerometer output will be 10.0 mV/g.
A2.3 Recording Device
A2.3.1 A digital electronic recorder will be used to captureimpact wave forms. The recorder may be in the form of adigital storage oscilloscope or dedicated wave form digitizer.
Analog oscilloscopes are not acceptable.A2.3.2 Each digitizer input will have a minimum resolution
of twelve bits spanning the full output range of the respectiveaccelerometer.
A2.3.3 Minimum digitizer sampling rate will be 20.0 kHz.In triaxial head form systems, three individual digitizers (oneper axis), each with a 20.0 kHz sampling rate, will be used.Alternatively, a single 60.0 kHz digitizer may be used ifsimultaneous track and hold ampli®ers are provided for eachaccelerometer axis.
A2.3.4 Minimum digitizer memory length will be to allow aminimum of 20 ms of the impact wave form to be recorded.
A2.3.5 Analog ®ltering on all accelerometer input channelswill be used to prevent digital signal aliasing. The ®lter willhave a cut-off frequency of 1.0 kHz, with a minimum of a twopole roll off.
A2.3.6 Provision to measure head form velocity at impactwill be provided.
A2.3.6.1 A light gate device may be used to measure thetime an opaque ¯ag interrupts a light sensor. The light gate willbe located so as to be activated with the head form no morethan 1 in. from impact with the surface being tested. Velocityof head form shall be calculated by dividing the length of theopaque ¯ag (inches) by the time the light sensor was activated(seconds) to velocity in inches per second. Conversion to unitsof feet per second may be obtained by dividing the inches persecond value by 12.0
FIG. A1.1 Suggested Field Test Report Form
F 1292
7
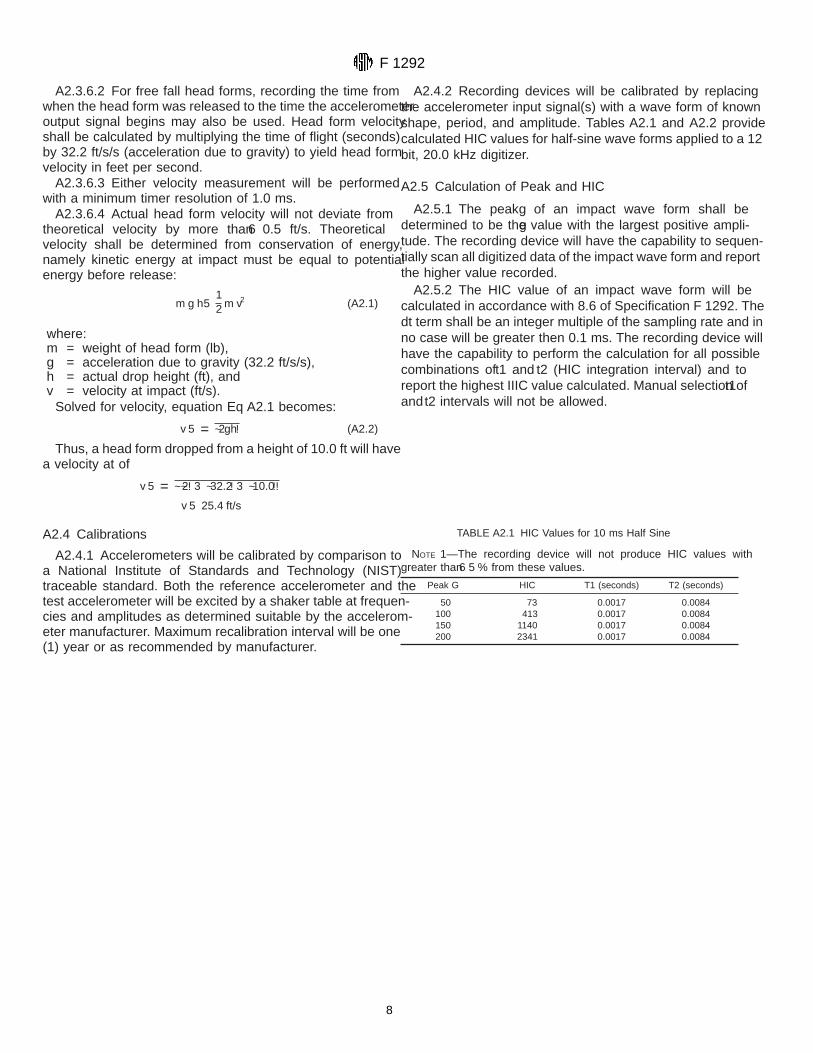
A2.3.6.2 For free fall head forms, recording the time fromwhen the head form was released to the time the accelerometeroutput signal begins may also be used. Head form velocityshall be calculated by multiplying the time of ¯ight (seconds)by 32.2 ft/s/s (acceleration due to gravity) to yield head formvelocity in feet per second.
A2.3.6.3 Either velocity measurement will be performedwith a minimum timer resolution of 1.0 ms.
A2.3.6.4 Actual head form velocity will not deviate fromtheoretical velocity by more than6 0.5 ft/s. Theoreticalvelocity shall be determined from conservation of energy,namely kinetic energy at impact must be equal to potentialenergy before release:
m g h512 m v2 (A2.1)
where:m = weight of head form (lb),g = acceleration due to gravity (32.2 ft/s/s),h = actual drop height (ft), andv = velocity at impact (ft/s).
Solved for velocity, equation Eq A2.1 becomes:
v 5 = ~2gh! (A2.2)
Thus, a head form dropped from a height of 10.0 ft will havea velocity at of
v 5 = ~~2! 3 ~32.2! 3 ~10.0!!
v 5 25.4 ft/s
A2.4 Calibrations
A2.4.1 Accelerometers will be calibrated by comparison toa National Institute of Standards and Technology (NIST)traceable standard. Both the reference accelerometer and thetest accelerometer will be excited by a shaker table at frequen-cies and amplitudes as determined suitable by the accelerom-eter manufacturer. Maximum recalibration interval will be one(1) year or as recommended by manufacturer.
A2.4.2 Recording devices will be calibrated by replacingthe accelerometer input signal(s) with a wave form of knownshape, period, and amplitude. Tables A2.1 and A2.2 providecalculated HIC values for half-sine wave forms applied to a 12bit, 20.0 kHz digitizer.
A2.5 Calculation of Peak and HIC
A2.5.1 The peakg of an impact wave form shall bedetermined to be theg value with the largest positive ampli-tude. The recording device will have the capability to sequen-tially scan all digitized data of the impact wave form and reportthe higher value recorded.
A2.5.2 The HIC value of an impact wave form will becalculated in accordance with 8.6 of Speci®cation F 1292. Thedt term shall be an integer multiple of the sampling rate and inno case will be greater then 0.1 ms. The recording device willhave the capability to perform the calculation for all possiblecombinations oft1 and t2 (HIC integration interval) and toreport the highest IIIC value calculated. Manual selection oft1andt2 intervals will not be allowed.
TABLE A2.1 HIC Values for 10 ms Half Sine
NOTE 1ÐThe recording device will not produce HIC values withgreater than6 5 % from these values.
Peak G HIC T1 (seconds) T2 (seconds)
50 73 0.0017 0.0084100 413 0.0017 0.0084150 1140 0.0017 0.0084200 2341 0.0017 0.0084
F 1292
8
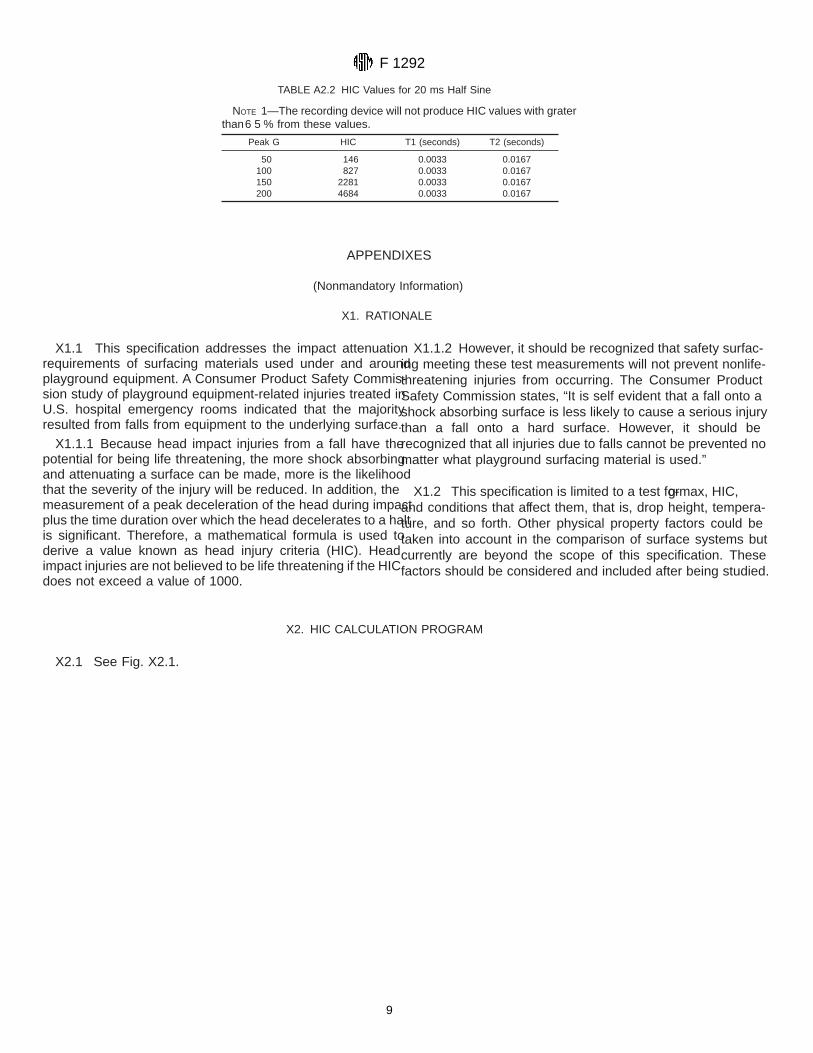
APPENDIXES
(Nonmandatory Information)
X1. RATIONALE
X1.1 This speci®cation addresses the impact attenuationrequirements of surfacing materials used under and aroundplayground equipment. A Consumer Product Safety Commis-sion study of playground equipment-related injuries treated inU.S. hospital emergency rooms indicated that the majorityresulted from falls from equipment to the underlying surface.
X1.1.1 Because head impact injuries from a fall have thepotential for being life threatening, the more shock absorbingand attenuating a surface can be made, more is the likelihoodthat the severity of the injury will be reduced. In addition, themeasurement of a peak deceleration of the head during impactplus the time duration over which the head decelerates to a haltis signi®cant. Therefore, a mathematical formula is used toderive a value known as head injury criteria (HIC). Headimpact injuries are not believed to be life threatening if the HICdoes not exceed a value of 1000.
X1.1.2 However, it should be recognized that safety surfac-ing meeting these test measurements will not prevent nonlife-threatening injuries from occurring. The Consumer ProductSafety Commission states, ªIt is self evident that a fall onto ashock absorbing surface is less likely to cause a serious injurythan a fall onto a hard surface. However, it should berecognized that all injuries due to falls cannot be prevented nomatter what playground surfacing material is used.º
X1.2 This speci®cation is limited to a test forg-max, HIC,and conditions that affect them, that is, drop height, tempera-ture, and so forth. Other physical property factors could betaken into account in the comparison of surface systems butcurrently are beyond the scope of this speci®cation. Thesefactors should be considered and included after being studied.
X2. HIC CALCULATION PROGRAM
X2.1 See Fig. X2.1.
TABLE A2.2 HIC Values for 20 ms Half Sine
NOTE 1ÐThe recording device will not produce HIC values with graterthan6 5 % from these values.
Peak G HIC T1 (seconds) T2 (seconds)
50 146 0.0033 0.0167100 827 0.0033 0.0167150 2281 0.0033 0.0167200 4684 0.0033 0.0167
F 1292
9
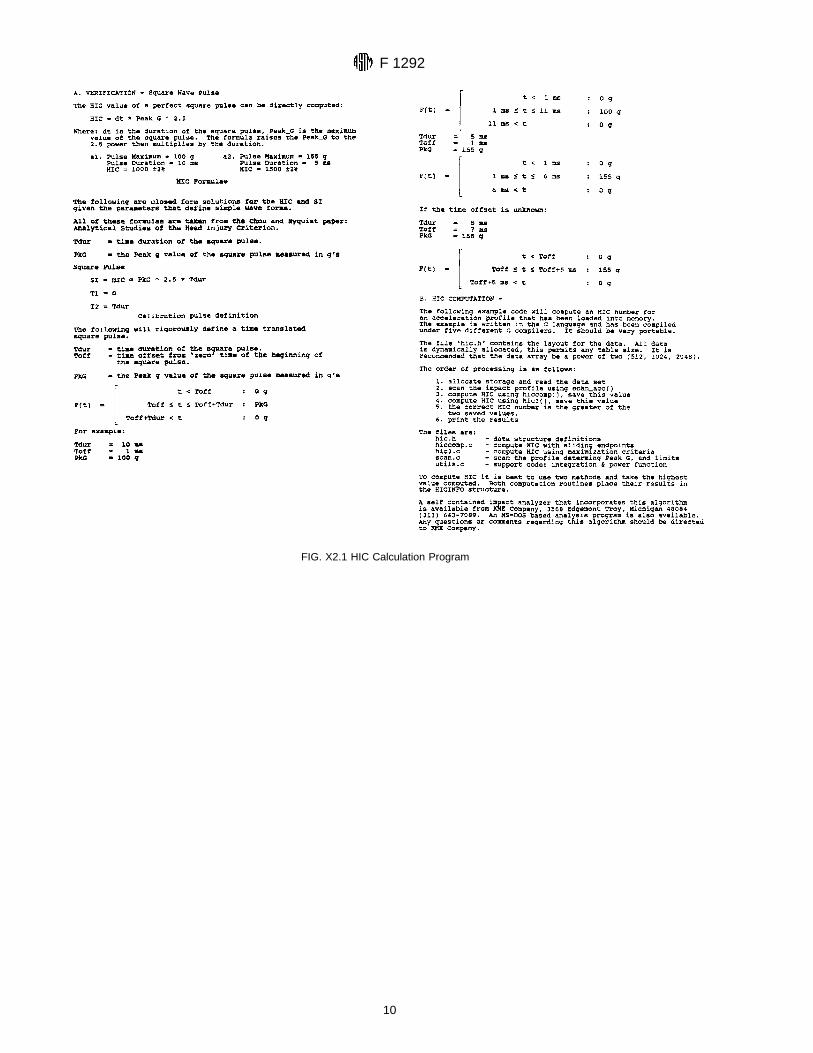
FIG. X2.1 HIC Calculation Program
F 1292
10
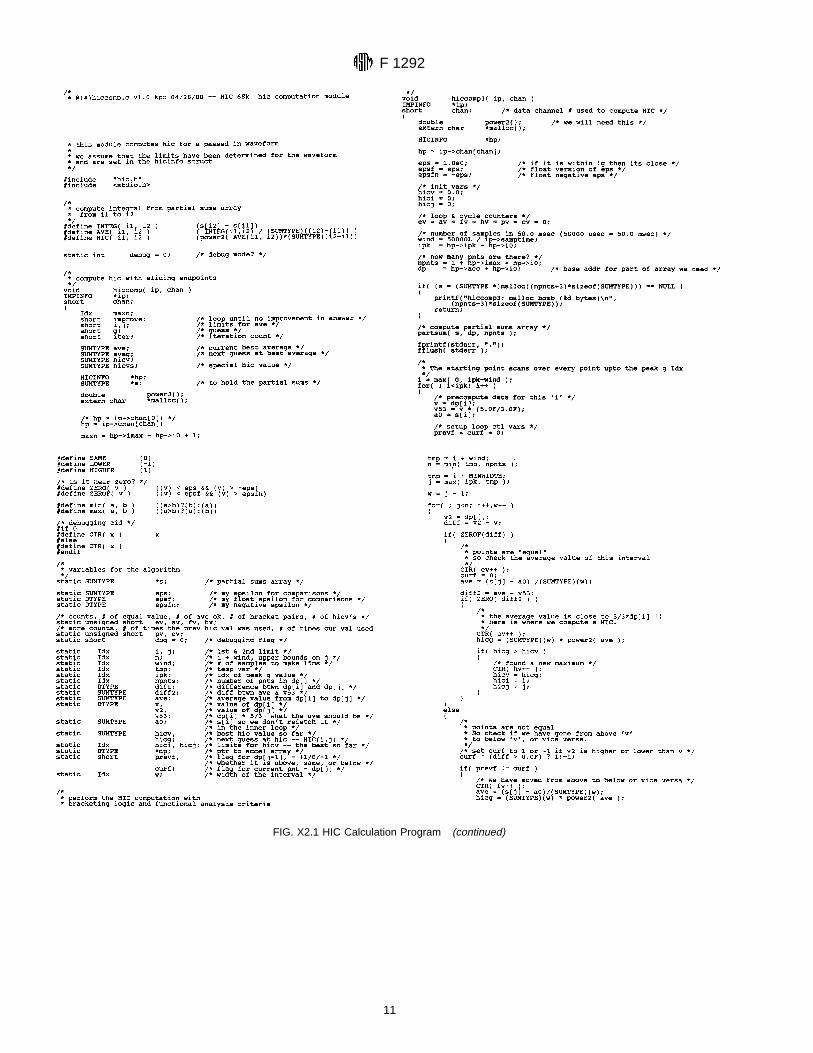
FIG. X2.1 HIC Calculation Program (continued)
F 1292
11
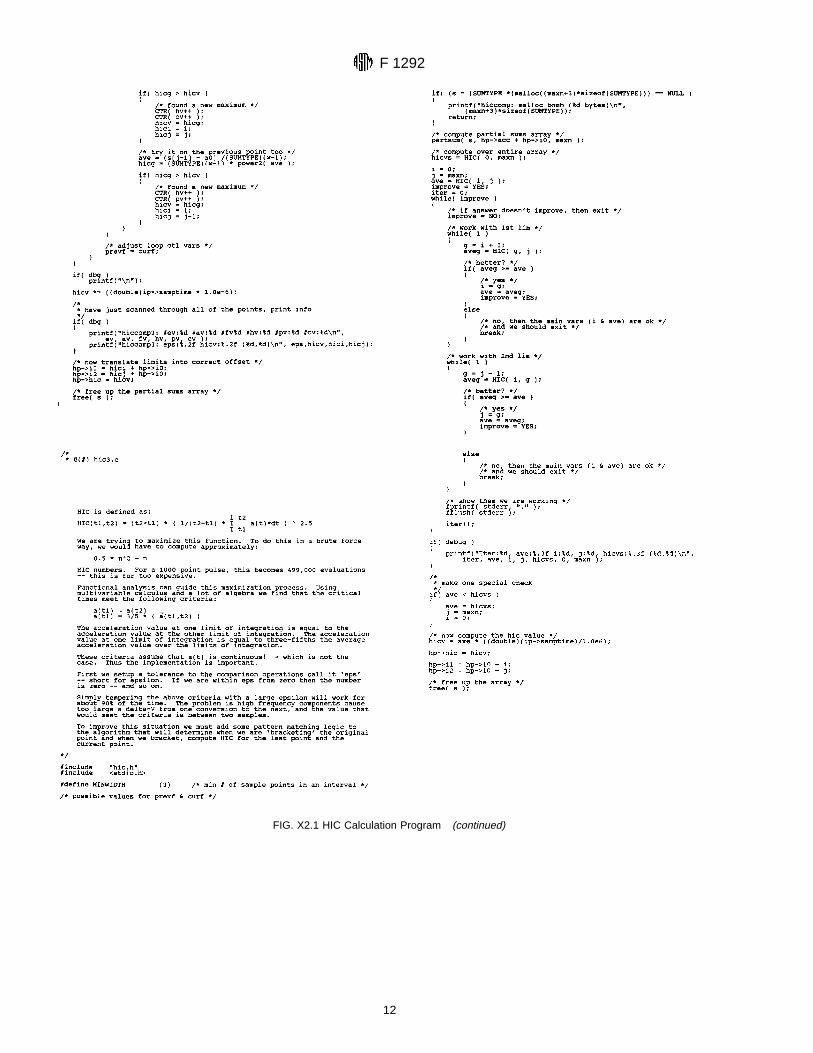
FIG. X2.1 HIC Calculation Program (continued)
F 1292
12
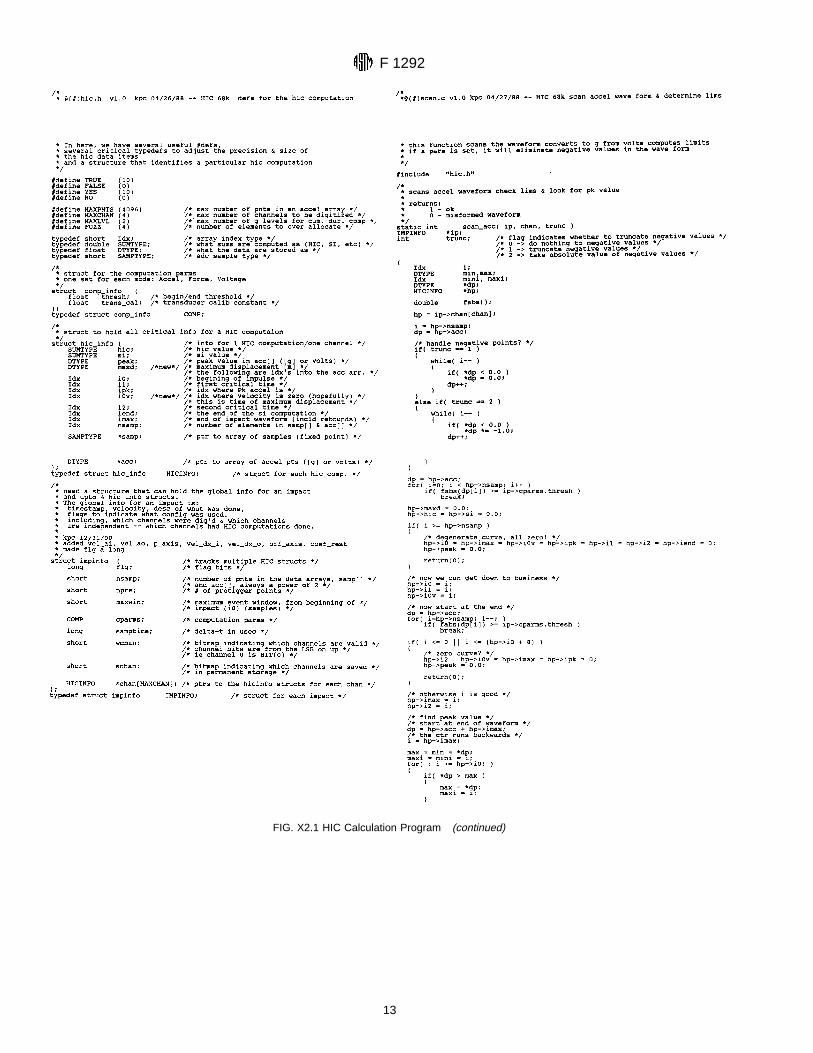
FIG. X2.1 HIC Calculation Program (continued)
F 1292
13
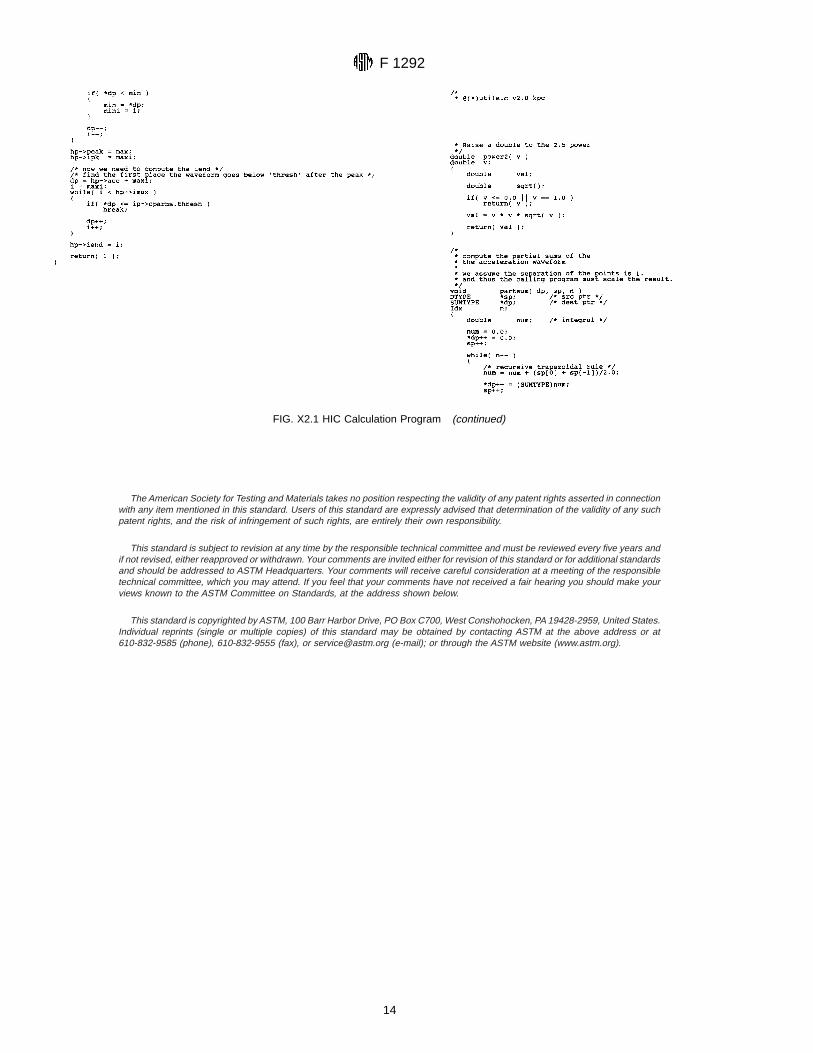
The American Society for Testing and Materials takes no position respecting the validity of any patent rights asserted in connectionwith any item mentioned in this standard. Users of this standard are expressly advised that determination of the validity of any suchpatent rights, and the risk of infringement of such rights, are entirely their own responsibility.
This standard is subject to revision at any time by the responsible technical committee and must be reviewed every ®ve years andif not revised, either reapproved or withdrawn. Your comments are invited either for revision of this standard or for additional standardsand should be addressed to ASTM Headquarters. Your comments will receive careful consideration at a meeting of the responsibletechnical committee, which you may attend. If you feel that your comments have not received a fair hearing you should make yourviews known to the ASTM Committee on Standards, at the address shown below.
This standard is copyrighted by ASTM, 100 Barr Harbor Drive, PO Box C700, West Conshohocken, PA 19428-2959, United States.Individual reprints (single or multiple copies) of this standard may be obtained by contacting ASTM at the above address or at610-832-9585 (phone), 610-832-9555 (fax), or [email protected] (e-mail); or through the ASTM website (www.astm.org).
FIG. X2.1 HIC Calculation Program (continued)
F 1292
14
Designation: D 5963 – 97a (Reapproved 2001) e1
Standard Test Method forRubber Property—Abrasion Resistance (Rotary DrumAbrader) 1
This standard is issued under the fixed designation D 5963; the number immediately following the designation indicates the year oforiginal adoption or, in the case of revision, the year of last revision. A number in parentheses indicates the year of last reapproval. Asuperscript epsilon (e) indicates an editorial change since the last revision or reapproval.
e1 NOTE—Footnotes 7, 8, 9, and 10 were editorially updated in October 2002.
1. Scope
1.1 This test method covers the measurement of abrasionresistance of rubbers (vulcanized thermoset rubbers and ther-moplastic elastomers) that are subject to abrasive/frictionalwear in actual service. The abrasion resistance is measured bymoving a test piece across the surface of an abrasive sheetmounted to a revolving drum, and is expressed as volume lossin mm3 or abrasion resistance index in percent. For volumeloss, a smaller number indicates better abrasion resistance,while for the abrasion resistance index, a smaller numberdenotes poorer abrasion resistance.
1.2 Test results obtained by this test method shall not beassumed to represent the wear behavior of rubber productsexperienced in actual service.
1.3 The values stated in SI units are to be regarded as thestandard. The values in parentheses are for information only.
1.4 This standard does not purport to address all of thesafety concerns, if any, associated with its use. It is theresponsibility of the user of this standard to establish appro-priate safety and health practices and determine the applica-bility of regulatory limitations prior to use.
2. Referenced Documents
2.1 ASTM Standards:D 297 Test Methods for Rubber Products—Chemical
Analysis2
D 1765 Classification System for Carbon Blacks Used inRubber Products2
D 2240 Test Method for Rubber Property—DurometerHardness2
D 3182 Practice for Rubber—Materials, Equipment, andProcedures for Mixing Standard Compounds and Prepar-
ing Standard Vulcanized Sheets2
D 4483 Practice for Determining Precision for Test MethodStandards in the Rubber and Carbon Black Industries3
2.2 Other Standards:DIN 53516 Determination of Abrasion Resistance4
ISO 868 Plastics and Ebonite—Determination of Indenta-tion Hardness by Means of a Durometer (Shore Hard-ness)5
ISO 2393 Rubber Test Mixes—Preparation, Mixing andVulcanization—Equipment and Procedures5
ISO 2781 Rubber, Vulcanized—Determination of Density5
ISO 4649 Rubber—Determination of Abrasion ResistanceUsing a Rotating Cylindrical Drum Device5
ISO 5725 Precision of Test Methods—Determination ofRepeatability and Reproducibility for a Standard TestMethod by Interlaboratory Tests5
ISO 9298 Rubber Compounding Ingredients—Zone OxideTest Methods5
3. Terminology
3.1 abrasion loss, A,(mm3), n—the volume loss of adefined rubber test piece determined by sliding the test pieceunder specified conditions over the surface of an abrasive sheetof “nominal abrasiveness,”SO, mounted to a rotating drum ofspecified dimensions.6
3.1.1 Discussion—The designationAA is used to indicatethat the test was run in accordance with Method A.
3.2 abrasion resistance index ARI (%), n—the ratio of thevolume loss of a Standard Rubber to that of a test rubberexpressed in percent, with the volume loss determined by
1 This test method is under the jurisdiction of ASTM Committee D11 on Rubberand is the direct responsibility of Subcommittee D11.15 on Degradation Tests.
Current edition approved Nov. 10, 1997. Published May 1998.This test method is an adaptation of ISO Standard 4649 (1985 revision),
Rubber—Determination of Abrasion Resistance Using a Rotating Cylindrical DrumDevice, and is being coordinated with a current draft revision of that standard (seeAppendix X1).
2 Annual Book of ASTM Standards, Vol 09.01.
3 Annual Book of ASTM Standards, Vol 09.02.4 Available from DIN (Deutches Institut Fuer Normung), Burggrafenstrasse 6,
10787,Berlin, Germany.5 Available from American National Standards Institute, 25 W. 43rd St., 4th
Floor, New York, NY 10036.6 This corresponds to the test method of DIN 53516 and to Method A (Relative
volume loss) of ISO 4649:1985. The same calculation could be made for the othertest methods if the proper value for the “nominal abrasiveness,” S0, for the testmethod were known or assumed. (150 mg has been indicated as a possible value forMethod D but its accuracy has not been established to the degree of the Method Avalue.)
1
Copyright © ASTM International, 100 Barr Harbor Drive, PO Box C700, West Conshohocken, PA 19428-2959, United States.

sliding a defined rubber test piece under specified conditionsover the surface of an abrasive sheet of known abrasivenessS(180 to 220 mg) mounted to a rotating drum of specifieddimensions.
3.2.1 Discussion—The designationsARIA, ARIB, ARIC, andARID are used to indicate that the test was run in accordancewith Method A, B, C or D, respectively.
3.3 “nominal abrasiveness,” SO of the abrasive sheet, (mg),n—a specified (theoretical) mass loss of 200 mg of a definedtest piece of a Standard Rubber, obtained by sliding the testpiece under specified conditions over the surface of theabrasive sheet mounted to a rotating drum of specified dimen-sions.
3.4 abrasiveness, S of the abrasive sheet,(mg), n—theactual mass loss, within a specified range of 180 to 220 mg, ofa defined test piece of a Standard Rubber, obtained by slidingthe test piece under specified conditions over the surface of theabrasive sheet mounted to a rotating drum of specified dimen-sions.
3.5 Standard Rubber—A natural rubber compound of speci-fied composition, mixed and vulcanized under defined condi-tions.
3.5.1 Discussion—Standard Rubber # 1 isused to determinethe abrasiveness,S, of the abrasive sheet and to ensure thatSis within the specified range of 180 to 220 mg. The ratio of the“nominal abrasiveness,”SO, and the actual abrasiveness,S, isused to correct the abrasion loss of a test rubber for anydeviation of the abrasiveness of the abrasive sheet from thespecified “nominal abrasiveness” (200 mg).
4. Summary of Test Method
4.1 This test method provides procedures for preparingcylindrical test pieces of specified dimensions from vulcanizedthermoset rubbers or thermoplastic elastomers and for evalu-ating their abrasion resistance by sliding a test piece across thesurface of an abrasive sheet attached to a rotating drum. It alsodescribes the preparation and compliance testing of a StandardRubber (see Annex A1).
4.2 The test is performed under specified conditions ofcontact pressure, sliding distance, and travel speed of the testpiece, rotational speed of the drum, and degree of abrasivenessof the abrasive sheet.
4.3 The abrasiveness,S, of the abrasive sheet is defined bythe mass loss in mg of a test piece prepared from StandardRubber #1 when tested under the same specified conditions.
4.4 Four different methods may be used to test the abrasionresistance. Method A, uses anon-rotating test piece andMethod B arotating test piece, both utilizing Standard Rubber#1 as the reference. Methods C and D use Standard Rubber #2as reference with anon-rotating and rotating test piece,respectively. The rotating test pieces provide, in many cases, amore uniform abrasion wear pattern.
4.5 The abrasion resistance,AA, obtained in accordance withMethod A is reported as abrasion (volume) loss in mm3,calculated from the mass loss of the test piece, density of thetest rubber and the abrasiveness of the abrasive sheet in relationto the “nominal abrasiveness,”SO, defined by a mass loss of200 mg. A smaller number indicates a higher resistance toabrasion.
4.6 The abrasion resistance,ARIA–D, obtained in accordancewith Methods A, B, C and D is reported as the abrasionresistance index in percent, calculated from the mass losses anddensities of the Standard Rubbers and test rubbers. A smallernumber indicates a lower resistance to abrasion.
4.7 The mass loss obtained by the different methods candiffer and the same method shall therefore be used if mass (andvolume) losses are to be compared directly.
5. Significance and Use
5.1 Abrasion resistance is a performance factor of para-mount importance for many rubber products, such as tires,conveyor belts, power transmission belts, hoses, footwear, andfloor covering. A test capable of measuring resistance toabrasion of rubber, including uniformity of wear behaviorunder abrasive/frictional service conditions is therefore highlydesirable.
5.2 This test method may be used to estimate the relativeabrasion resistance of different rubbers. Since conditions ofabrasive wear in service are complex and vary widely, no directcorrelation between this accelerated test and actual perfor-mance can be assumed.
5.3 This test method is suitable for comparative testing,quality control, specification compliance testing, referee pur-poses, and research and development work.
6. Limitations
6.1 Test pieces containing voids or porosity, or both, willyield unreliable test results.
6.2 Test pieces that bounce (chatter) over the surface of theabrasive sheet rather than running smoothly will produceinaccurate test results.
6.3 Test pieces that tend to extensively smear the surface ofthe abrasive sheet will provide meaningless test results.
6.4 Test results obtained under any of the above conditionsshall not be used to reach conclusions regarding the relativeabrasion resistance of rubbers.
7. Apparatus and Materials
7.1 Abrasion Tester.7
7.1.1 The abrasion tester consists of a machine frameholding a laterally movable test piece holder, a rotary cylin-drical drum to which an abrasive sheet can be fastened and adrive system as shown in Fig. 1. Dimensions are given in Fig.2.
7.1.2 The diameter of the cylindrical drum shall be 150.060.2 mm (5.9066 0.008 in.) and its length approximately 500mm (20 in.), operating at a rotational frequency of 0.1160.003 rad/s (406 1 rpm).
7.1.3 The abrasive sheet shall be bonded tightly to the drumusing three evenly spaced double faced pressure-sensitiveadhesive tapes, extending the full length of the drum. The tapesshall be about 50 mm (2 in.) wide and not more than 0.2 mm
7 A suitable tester can be obtained under the name Zwick 6102 Abrasion Tester,from Zwick USA, 1620 Cobb International Blvd., Suite 1, Kennesaw, GA 30152,website: www.zwick.com, e-mail: [email protected], or from Zwick GmbH &Co., August Nagel Strasse 11, Postfach 4350, D 89079 Ulm, Germany, website:www.zwick.de, e-mail: [email protected].
D 5963 – 97a (2001)e1
2
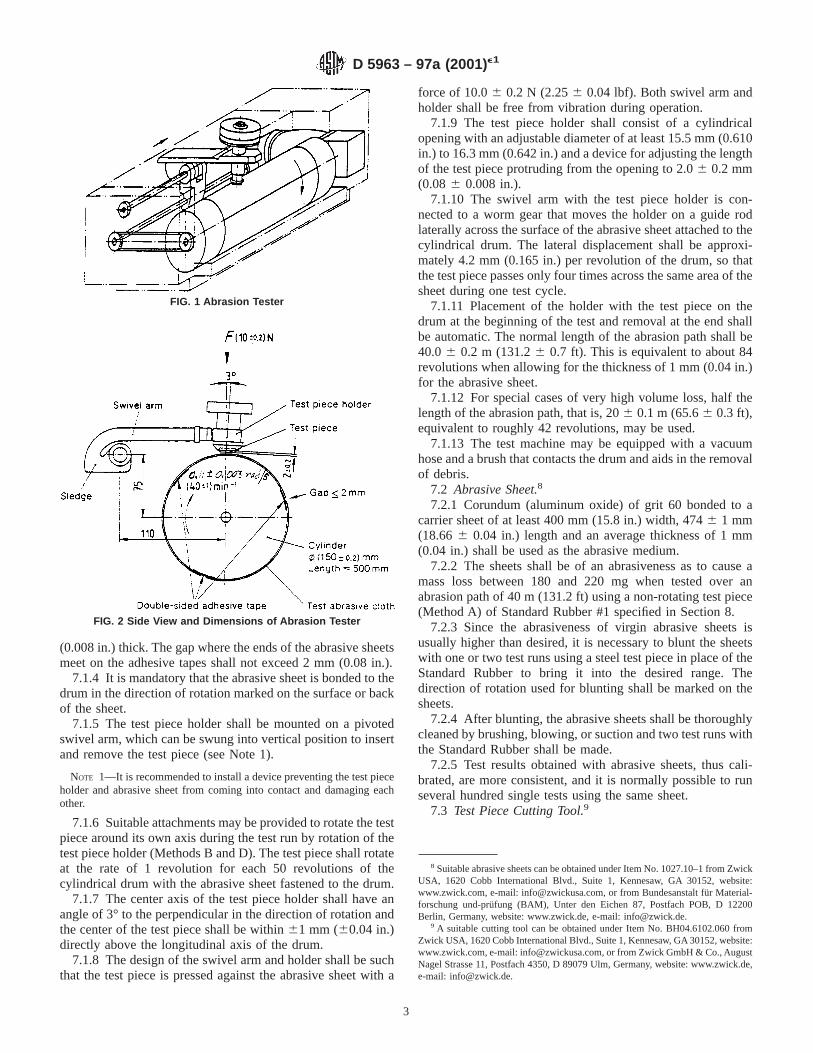
(0.008 in.) thick. The gap where the ends of the abrasive sheetsmeet on the adhesive tapes shall not exceed 2 mm (0.08 in.).
7.1.4 It is mandatory that the abrasive sheet is bonded to thedrum in the direction of rotation marked on the surface or backof the sheet.
7.1.5 The test piece holder shall be mounted on a pivotedswivel arm, which can be swung into vertical position to insertand remove the test piece (see Note 1).
NOTE 1—It is recommended to install a device preventing the test pieceholder and abrasive sheet from coming into contact and damaging eachother.
7.1.6 Suitable attachments may be provided to rotate the testpiece around its own axis during the test run by rotation of thetest piece holder (Methods B and D). The test piece shall rotateat the rate of 1 revolution for each 50 revolutions of thecylindrical drum with the abrasive sheet fastened to the drum.
7.1.7 The center axis of the test piece holder shall have anangle of 3° to the perpendicular in the direction of rotation andthe center of the test piece shall be within61 mm (60.04 in.)directly above the longitudinal axis of the drum.
7.1.8 The design of the swivel arm and holder shall be suchthat the test piece is pressed against the abrasive sheet with a
force of 10.06 0.2 N (2.256 0.04 lbf). Both swivel arm andholder shall be free from vibration during operation.
7.1.9 The test piece holder shall consist of a cylindricalopening with an adjustable diameter of at least 15.5 mm (0.610in.) to 16.3 mm (0.642 in.) and a device for adjusting the lengthof the test piece protruding from the opening to 2.06 0.2 mm(0.086 0.008 in.).
7.1.10 The swivel arm with the test piece holder is con-nected to a worm gear that moves the holder on a guide rodlaterally across the surface of the abrasive sheet attached to thecylindrical drum. The lateral displacement shall be approxi-mately 4.2 mm (0.165 in.) per revolution of the drum, so thatthe test piece passes only four times across the same area of thesheet during one test cycle.
7.1.11 Placement of the holder with the test piece on thedrum at the beginning of the test and removal at the end shallbe automatic. The normal length of the abrasion path shall be40.06 0.2 m (131.26 0.7 ft). This is equivalent to about 84revolutions when allowing for the thickness of 1 mm (0.04 in.)for the abrasive sheet.
7.1.12 For special cases of very high volume loss, half thelength of the abrasion path, that is, 206 0.1 m (65.66 0.3 ft),equivalent to roughly 42 revolutions, may be used.
7.1.13 The test machine may be equipped with a vacuumhose and a brush that contacts the drum and aids in the removalof debris.
7.2 Abrasive Sheet.8
7.2.1 Corundum (aluminum oxide) of grit 60 bonded to acarrier sheet of at least 400 mm (15.8 in.) width, 4746 1 mm(18.666 0.04 in.) length and an average thickness of 1 mm(0.04 in.) shall be used as the abrasive medium.
7.2.2 The sheets shall be of an abrasiveness as to cause amass loss between 180 and 220 mg when tested over anabrasion path of 40 m (131.2 ft) using a non-rotating test piece(Method A) of Standard Rubber #1 specified in Section 8.
7.2.3 Since the abrasiveness of virgin abrasive sheets isusually higher than desired, it is necessary to blunt the sheetswith one or two test runs using a steel test piece in place of theStandard Rubber to bring it into the desired range. Thedirection of rotation used for blunting shall be marked on thesheets.
7.2.4 After blunting, the abrasive sheets shall be thoroughlycleaned by brushing, blowing, or suction and two test runs withthe Standard Rubber shall be made.
7.2.5 Test results obtained with abrasive sheets, thus cali-brated, are more consistent, and it is normally possible to runseveral hundred single tests using the same sheet.
7.3 Test Piece Cutting Tool.9
8 Suitable abrasive sheets can be obtained under Item No. 1027.10–1 from ZwickUSA, 1620 Cobb International Blvd., Suite 1, Kennesaw, GA 30152, website:www.zwick.com, e-mail: [email protected], or from Bundesanstalt für Material-forschung und-prüfung (BAM), Unter den Eichen 87, Postfach POB, D 12200Berlin, Germany, website: www.zwick.de, e-mail: [email protected].
9 A suitable cutting tool can be obtained under Item No. BH04.6102.060 fromZwick USA, 1620 Cobb International Blvd., Suite 1, Kennesaw, GA 30152, website:www.zwick.com, e-mail: [email protected], or from Zwick GmbH & Co., AugustNagel Strasse 11, Postfach 4350, D 89079 Ulm, Germany, website: www.zwick.de,e-mail: [email protected].
FIG. 1 Abrasion Tester
FIG. 2 Side View and Dimensions of Abrasion Tester
D 5963 – 97a (2001)e1
3
7.3.1 The circular cutting tool for test piece preparation is ahollow drill made from hardened metal with dimensions shownin Fig. 3.
7.3.2 The rotational frequency of the drill should be about2.65 rad/s (1000 rpm) and even higher for rubbers with ahardness of less than 50 Shore A (see Test Method D 2240 andISO 868).
7.3.3 When cutting, the cutting edge of the drill shall belubricated with water containing a wetting agent.
8. Standard Rubber
8.1 Sheets of Standard Rubber may be obtained commer-cially10 or prepared in-house, following the directions given inAnnex A1.
8.2 If prepared in-house, it is mandatory to test a commer-cially obtained reference sheet for comparison.
8.3 Standard Rubber sheets shall be stored under cool, dry,and dark conditions, and wrapped in a suitable protectivecovering such as polyehtylene film, which protects the sheetsfrom ozone attack (see Note 2).
NOTE 2—Sheets of Standard Rubber stored under the above conditionsremain usable for at least three years.
8.4 Standard Rubber sheets of satisfactory quality shallmeet the requirements of Section A1.3.1 in Annex A1.
8.5 Standard Rubber test pieces may be used for up to threetest runs per test piece (see 11.3).
9. Preparation of Rubber Test Pieces
9.1 Test pieces are cylindrical in shape with a diameter of 166 0.2 mm (0.6306 0.008 in.) and a minimum thickness of 6mm (0.24 in.).
9.2 They are cut from sheets of at least 6 mm (0.24 in.)thickness, using a hollow drill as described in 7.3.
9.3 Preparation of test pieces by die cutting is not permitted,but test pieces may be vulcanized or formed in an appropriatemold.
9.4 If test pieces of the required thickness are not available,the necessary thickness may be obtained by bonding a testpiece of at least 2 mm (0.08 in.) to a base piece with a hardnessof at least 80 Shore A (see Test Method D 2240 and ISO 868).Care shall be taken that test pieces prepared in this manner arenot abraded down to the bond line.
9.5 When testing finished products such as fabric reinforcedconveyor belts, test pieces shall be prepared, if possible, fromthe entire product including the fabric. In this case it is alsoimportant that test pieces are not abraded down to the adhesivelayer or the fabric and that only the density of the rubber layertested for abrasion is determined.
10. Procedure
10.1 The test shall be carried out at 236 5°C (736 9°F)and no sooner than 16 h after vulcanization or forming of thetest compounds.
10.2 The density of the rubbers to be tested shall bedetermined using a hydrostatic method (see Test MethodsD 297 or ISO 2781).
10.3 Method A—Test Run:10.3.1 Method A is run with a non-rotating test piece, using
Standard Rubber #1 as reference.10.3.2 Prior to each test, any debris left on the abrasive
sheet from a previous abrasion test shall be removed byvigorous brushing, blowing, or suction. If necessary, the sheetmay be cleaned by running a blank test with the StandardRubber in case the sheet has been smeared by a test piece fromthe previous test.
10.3.3 First, at least three test runs shall be made with theStandard Rubber, followed by a maximum of ten runs (seeNote 3) with one or more rubbers to be tested (test series). Thisshall be followed by at least another three runs with theStandard Rubber.
NOTE 3—Do not split tests of one test rubber. Run nine tests, and soforth, if that completes the tests for a test rubber.
10.3.4 When more than one rubber is to be tested, the testruns for each rubber shall be carried out consecutively. Onlyone test run per test rubber piece is permitted.
10.3.5 At least three test pieces and, for referee purposes,ten test pieces shall be run. The results shall be expressed as themean value.
10.3.6 The test pieces shall be weighed to the nearest 1 mgand firmly fixed into the holder so that it protrudes 2.06 0.2mm (0.086 0.008 in.) from the opening of the holder. Turn thevacuum on if it is provided. The swivel arm is moved intostarting position and the automatic test run is started (see Note4).
10 Standard Rubber #1 sheets can be obtained from the following sources: ZwickUSA, 1620 Cobb International Blvd., Suite 1, Kennesaw, GA 30152 under Item No.MA11.15-5/3, website: www.zwick.com, e-mail: [email protected]; Bundesan-stalt für Materialforschung und Prüfung (BAM), Unter den Eichen 87, PostfachPOB, D 12200 Berlin, Germany; Laboratoire de Recherches et de Controle duCaoutchouc et des Plastiques (LRCCP), 60 Rue Auber, F94408 Vitry Sur Seine,France. Standard rubber #2 sheets would normally be prepared by the user. Userswho do not have the facilities to do so may request it from Rapra Technology Ltd.,Shawbury, Shrewsbury, Shropshire, SY4 4NR, UK.
FIG. 3 Hollow Drill for Test Piece Preparation
D 5963 – 97a (2001)e1
4
NOTE 4—A preparatory run to hollow-grind the test piece is notnecessary.
10.3.7 There shall be no vibration in the test piece holderduring the run. After completing an abrasion path of 40 m(131.2 ft), the test piece shall automatically disengage from theabrasive sheet.
10.3.8 The test piece is reweighed to the nearest 1 mg. Testpieces that have heated up during testing shall be conditionedto room temperature prior to weighing. Any loose materialshall be removed from the test piece prior to weighing.
10.3.9 If there is a considerable loss in mass (400 mg ormore per 40 m [131.2 ft] abrasion path), the test may be run bystopping the abrasion drum approximately halfway through thetest, readjusting the test piece to protrude 2.06 0.2 mm (0.086 0.008 in.) from the opening of the holder and then completethe run. Care shall be taken that the test piece does not abradeto a thickness of less than 5 mm (0.2 in.).
10.3.10 If very high mass losses are encountered (600 mg ormore per 40 m [131.2 ft] abrasion path), it may be necessary toterminate the test after an abrasion path of 20 m (65.6 ft). Thisshall be noted in the test report and the volume loss reported foran abrasion distance of 40 m (131.2 ft) by multiplying thevalue by two.
10.4 Method B—Test Run:10.4.1 Method B is run with a rotating test piece. This
applies to the test rubber as well as the Standard Rubber.Standard Rubber #1 is used as reference.
10.4.2 All other test conditions are the same as described in10.3.
10.5 Method C—Test Run:10.5.1 Method C is run with a non-rotating test piece. This
applies to the test rubber as well as the Standard Rubber.Standard Rubber #2 is used as reference.
10.5.2 All other test conditions are the same as described in10.3.
10.6 Method D—Test Run:10.6.1 Method D is run with a rotating test piece. This
applies to the test rubber as well as the Standard Rubber.Standard Rubber #2 is used as reference.
10.6.2 All other test conditions are the same as described in10.3.
11. Determination of Abrasiveness of the Abrasive Sheet
11.1 The abrasiveness,S, of the sheet used for the test(expressed as mass loss in mg) shall be determined with the aidof the Standard Rubber #1 in at least three, or, for refereepurposes, at least five test runs, both before and after each testseries. The test procedure described in 10.3 shall be followed(Method A, non-rotating test piece).
11.2 The abrasiveness is reported as the mean value of theindividual mass losses before and after each test series.
11.3 Up to three runs may be carried out with the same testpiece of Standard Rubber, making certain that the test piece isplaced into the holder the same way each time.
11.4 For test rubbers that have a tendency to smear, it maybe necessary to determine the abrasiveness after each test run.
12. Calculation of Test Results
12.1 Calculation of Abrasion Loss—Method A:
12.1.1 Calculate the abrasion loss,AA, the loss in mass(mean value of 3 to 10 single tests) shall be converted intovolume loss using the density (volume loss equal mass lossdivided by density) of the test rubber (see Note 5). The volume
loss is then corrected by using the ratioSO
S whereSO is the
“nominal abrasiveness” of the abrasive sheet andS that of theabrasive sheet used for the test. See Eq 1.
AA 5Dmt · S0
dt · S (1)
where:AA = abrasion loss in mm3 (non-rotating test piece),Dmt = mass loss of the test piece in mg,dt = density of the test rubber in mg/m3,S0 = “normal abbrasiveness” = 200 mg, andS = abrasiveness in mg.
NOTE 5—The volume loss of non-porous test pieces may also bedetermined by forced immersion in a buoyant medium, such as water,before and after the test run, instead of weighing the loss in mass andconverting this from the density. The volume for the test piece is thenobtained by weighing the displaced mass of the buoyant medium.
12.2 Calculation of Abrasion Resistance Index—Method A:12.2.1 To calculate the abrasion resistance index,ARIA, the
loss in mass (mean value of 3 to 10 single tests) shall beconverted into volume loss using the density of the test rubber(see Note 5). The ratio of the volume loss of Standard Rubber#1 to that of the test rubber is then expressed in percent, asshown in Eq 2.
ARIA 5Dm1 · dt
Dmt· d1· 100 (2)
where:ARIA = abrasion resistance index in percent (non-rotating
test piece),Dm1 = mass loss of the Standard Rubber #1 test piece in
mg,d1 = density of Standard Rubber #1 in mg/m3,Dmt = mass loss of the test rubber piece in mg, anddt = density of the test rubber in mg/m3.
12.3 Calculation of Abrasion Resistance Index—Method B:12.3.1 The abrasion resistance index,ARIB, is calculated as
described in 12.2.1 using Eq 3:
ARIB 5Dm1 · dt
Dmt · d1· 100 (3)
where:ARIB = abrasion resistance index in percent (rotating test
piece),Dm1 = mass loss of the Standard Rubber #1 test piece in
mg,d1 = density of Standard Rubber #1 in mg/m3,Dmt = mass loss of the test rubber piece in mg, anddt = density of the test rubber in mg/m3.
12.4 Calculation of Abrasion Resistance Index—Method C:12.4.1 The abrasion resistance index,ARIC, is calculated as
described in 12.2.1 using Eq 4, except that Standard Rubber #2is used instead of Standard Rubber #1.
ARIC 5Dm2 · dt
Dmt· d2· 100 (4)
D 5963 – 97a (2001)e1
5

where:ARIC = abrasion resistance index in percent (non-rotating
test piece),Dm2 = mass loss of the Standard Rubber #2 test piece in
mg, andd2 = density of Standard Rubber #2 in mg/m3,
12.5 Calculation of Abrasion Resistance Index—Method D:12.5.1 The abrasion resistance index,ARID, is calculated as
described in 12.2.1 using Eq 5, except that Standard Rubber #2is used instead of Standard Rubber #1.
ARID 5Dm2 · dt
Dmt· d2· 100 (5)
where:ARID = abrasion resistance index in percent (rotating test
piece),Dm2 = mass loss of the Standard Rubber #2 test piece in
mg, andd2 = density of Standard Rubber #2 in mg/m3,
13. Test Report
13.1 Report the following information:13.1.1 Type and identification of the product under test,13.1.2 Date and temperature of testing,13.1.3 Rubber compound details, if available (rubber type,
vulcanization temperature and time),13.1.4 Density of the test rubbers,13.1.5 Method of test piece preparation (cut or molded),13.1.6 Test method used: Method A, B, C or D,13.1.7 The mean value of either the abrasion loss in mm3 or
the abrasion resistance index in percent,13.1.8 The standard deviation of the test result (optional)
and13.1.9 Any deviations from standard test methods, espe-
cially if the length of the abrasion path was reduced from thespecified 40 m (131.2 ft) to 20 m (65.6 ft).
14. Precision and Bias
14.1 The precision and Bias section deals with test results ofMethods A, C, and D obtained in an international interlabora-tory program organized in accordance with ISO 572511. Thissection has been prepared in accordance with Practice D 4483,
which is equivalent to ISO 5725. Refer to this practice forterminology and other statistical calculation details.
14.2 The precision results in this section give an estimate ofthe precision of Methods A, C, and D using the materials of theparticular interlaboratory test program as described below. Theprecision parameters should not be used for acceptance orrejection testing of any group of materials without documen-tation that the parameters are applicable to the group ofmaterials and the specific testing protocols of the test method.Abrasion tests were conducted for each rubber in triplicate oneach of two days, separated by three to four days. A test resultwas reported as the mean of three individual test runs (abrasionloss in mm3).
14.3 A Type 1 interlaboratory test program was conductedin 1986 with 16 participating laboratories, using five differentvulcanized rubbers at different abrasion levels. The vulcanizedrubbers were distributed in sheet form by one laboratory, andtest pieces were cut from these sheets by each of the partici-pating laboratories.
14.4 The precision is given in terms ofSr, r, (r), SR, R, and(R) for the measured abrasion loss values.
14.5 The precision of the test method may be expressed inthe format of the following statements which use an “appro-priate value” ofr, R, (r), or (R), that is, that value to be used indecisions about test results obtained with this test method. Theappropriate value is that value ofr or R associated with themean level in Tables 1-3 closest to the mean level underconsideration (at any given time, for any given material) inroutine testing operations.
14.6 Repeatability—The repeatability,r, of this test methodhas been established as the appropriate value tabulated inTables 1-3. Two single test results obtained under normal testmethod procedures that differ by more than this tabulatedr (forany given level) must be considered as derived from differentor nonidentical sample populations.
14.7 Reproducibility—The reproducibility,R, of this testmethod has been established as the appropriate value tabulatedin Tables 1-3. Two single test results obtained in two differentlaboratories under normal test method procedures that differ bymore than the tabulatedR (for any given value) must beconsidered to have come from different or nonidentical samplepopulations.
14.8 Repeatability and reproducibility expressed as percentof the mean level (r) and (R), have equivalent applicationstatements as above forr andR. For (r) and (R) statements, the
11 Supporting data have been filed at ASTM International Headquarters and maybe obtained by requesting Research Report RR: D11-1079.
TABLE 1 Type 1 Precision (Method A: Non-Rotating Test Piece)
Test Rubber CompoundProperty Mean
Abrasion Loss A(mm3)
Within Laboratory Between Laboratory
Sr r (r) SR R (R)
A (NR/BR) 68 2.3 6.5 9.6 6.6 18.8 27.6B (NR/SBR) 106 3.8 10.8 10.2 7.6 21.4 20.2C (NR) 160 8.2 23.2 14.5 10.7 30.4 19.0D (IIR) 257 10.7 30.2 11.8 20.3 57.5 22.4E (EPDM) 345 14.1 39.8 11.5 29.3 83.0 24.1
NOTE 1—Sr = repeatability standard deviation in measurement units;r = repeatability = 2.833 Sr (in measurement units); (r) = repeatability in percentof the mean;SR = reproducibility standard deviation in measurement units;R = reproducibility = 2.833 Sr (in measurement units); and (R) =reproducibility in percent of the mean.
D 5963 – 97a (2001)e1
6
difference in the two single test results is expressed as a percentof the arithmetic mean of the two-test results.
14.9 In test method terminology, bias is the differencebetween an average test value and the reference (or true) test
property value. Reference values do not exist for this testmethod since the values of abrasion loss are exclusivelydefined by this test method. Bias, therefore, cannot be deter-mined.
ANNEX
(Mandatory Information)
A1. STANDARD RUBBERS FORMULA, MIXING, VULCANIZATION AND COMPLIANCE TESTING
A1.1 Preparation of Standard Rubber #1 for Method Aand Method B
A1.1.1 The formula for Standard Rubber #1 is given inTable A1.1.
A1.1.2 Mixing:A1.1.2.1 The following procedure is recommended in mix-
ing the Standard Rubber:
NOTE A1.1—Other mixing procedures may be employed provided theyyield good dispersion of the ingredients and produce a Standard Rubber incompliance with requirements set forth in Section A1.3.1.
A1.1.2.1.1 An internal mixer with a capacity to accommo-date batch sizes of 3000 to 4000 g (6.6 to 8.8 lbs) has beenfound suitable to produce a Standard Rubber of acceptablequality.
A1.1.2.1.2 The internal mixer typically has a chambercolume of 4.6 I (measured with wheat grain) and is chargedwith 2000 g of natural rubber, bringing the fill factor of thefinished compound to 656 5 %. Mixing is carried out at a
rotor speed of about 0.080 rad/s (30 rpm), with full coolingturned on and following the procedure outlined in Table A1.2.
A1.1.2.1.3 After dropping the stock from the internal mixer,it is homogenized on a two roll rubber mill at a nip setting of0.5 mm (0.02 in.) and a surface temperature of 506 5°C (1226 9°F), by making about four3⁄4 cuts from alternate end of theroll and crossblending for about 5 min. The rolled sheet is thenpassed endwise through the nip until it is sheeted from the millat a nip setting of 5 mm (0.2 in.) after 10 min total mixing time.Final batch temperature shall be approximately 70°C (158°F).
A1.1.2.1.4 The two mill rolls shall have a nominal diameterof 250 mm (10 in.), a working width of 400 mm (16 in.), anda rotational frequency of about 0.032/0.048 rad/s (12/18 rpm),giving a friction ratio of 1:1.5.
A1.1.3 Vulcanization:
TABLE 2 Type 1 Precision (Method C: Non-Rotating Test Piece)
Test Rubber CompoundProperty Mean
Abrasion Loss A(mm3)
Within Laboratory Between Laboratory
Sr r (r) SR R (R)
A (NR/BR) 157 10.9 30.8 19.6 21.1 59.6 38.0B (NR/SBR) 102 5.3 15.0 14.7 6.7 19.1 18.7C (NR) 67 3.2 9.1 13.6 4.8 13.6 20.3D (IIR) 43 2.8 7.9 18.4 3.6 10.2 23.7E (EPDM) 32 1.3 3.8 11.9 2.5 7.2 22.5
NOTE 1—Sr = repeatability standard deviation in measurement units;r = repeatability = 2.833 Sr (in measurement units); (r) = repeatability in percentof the mean;SR = reproducibility standard deviation in measurement units;R = reproducibility = 2.833 Sr (in measurement units); and (R) =reproducibility in percent of the mean.
TABLE 3 Type 1 Precision (Method D: Rotating Test Piece)
Test Rubber CompoundProperty Mean
Abrasion Loss A(mm3)
Within Laboratory Between Laboratory
Sr r (r) SR R (R)
A (NR/BR) 144 7.1 20.2 14.0 16.2 45.8 31.8B (NR/SBR) 101 3.4 9.6 9.5 5.6 15.9 15.7C (NR) 71 2.5 7.0 9.9 3.9 11.0 15.5D (IIR) 43 1.2 3.4 7.9 1.9 5.3 12.3E (EPDM) 34 1.2 3.3 9.7 2.5 7.2 21.2
NOTE 1—Sr = repeatability standard deviation in measurement units;r = repeatability = 2.833 Sr (in measurement units); (r) = repeatability in percentof the mean;SR = reproducibility standard deviation in measurement units;R = reproducibility = 2.833 Sr (in measurement units); and (R) =reproducibility in percent of the mean.
D 5963 – 97a (2001)e1
7
A1.1.3.1 Blanks are prepared by plying up milled sheets andweighing them to an excess mass of approximately 7 %. Theblank is inserted into a mold, preheated to 1506 2°C (30264°F).
A1.1.3.2 The mold is placed into the press, and afterapplying several bumping cycles, vulcanization is carried outfor 20 6 1 min under a pressure of at least 3.5 MPa (508 psi).It is recommended that the pressure be applied slowly.
A1.1.3.3 Recommended dimensions of the vulcanizedsheets are 83 116 3 182 mm (0.323 4.57 3 7.17 in.),yielding approximately 60 test pieces.
A1.1.3.4 After vulcanization, sheets of the Standard Rubbershall be conditioned at ambient conditions for at least 16 hprior to use.
A1.1.3.5 The hardness in Shore A8 of each sheet shall bemeasured at a minimum of five different locations and themedian reported. The mean of the median values of all sheetsfrom one lot shall be 606 3 Shore A.
A1.2 Preparation of Standard Rubber #2 for Method Cand Method D
A1.2.1 The formula for Standard Rubber #2 is given inTable A1.3.
A1.2.2 Mixing and Vulcanization:
A1.2.2.1 Mixing shall be carried out with equipment andprocedures described in Practice D 3182 or ISO 2393.
A1.2.2.2 Vulcanization of sheets for the preparation of testpieces shall be carried out in accordance with Practice D 3182or ISO 2393 at 1406 2°C (2846 4°F) for 60 min.
A1.2.2.3 The dimensions of the sheets shall meet theguidelines outlined in A1.3.3.
A1.3 Compliance Testing for Mass Loss
A1.3.1 Compliance testing for mass loss of Standard Rub-bers shall be conducted no sooner than 16 hours and no laterthan seven days after vulcanization.
A1.3.2 One sheet is selected from each lot of StandardRubber, prepared in accordance with Sections A1.1 or A1.2.Fifteen test pieces are cut from each sheet in accordance withSection 9. If several lots are prepared under the same condi-tions by the same operator over a period of one or two days,one sheet shall be selected for every fifth lot.
A1.3.3 The mass losses of fifteen test pieces of a (commer-cial) reference material (see 8.1) are determined first. Each testpiece is run three times, the median reported and the meancalculated from the fifteen median values. This mean serves asthe reference value.
A1.3.4 The same procedure is repeated for the fifteen testpieces of each sheet of Standard Rubber. The differencebetween the mean of the reference material and the mean ofeach lot (sheet) of Standard Rubber shall not exceed 15 mg.
A1.3.5 All compliance testing for mass loss shall be con-ducted with abrasive sheets especially conditioned and re-served for this purpose. The abrasiveness of these sheets,determined as the mean of fifteen median values for thereference material, shall be between 200 and 220 mg forStandard Rubber #1, when tested in accordance with A1.3.3,using Method A (non-rotating test piece).
A1.3.6 It has been determined that Standard Rubber #2yields an abrasion loss of about 150 mg when tested inaccordance with Method D (rotating test piece).
A1.3.7 It is recommended to retain test pieces of a numberof Standard Rubber sheets as references for future lots ofStandard Rubber. The test pieces shall be stored as described in8.3.
TABLE A1.1 Standard Rubber #1
Ingredients Parts by Mass
Natural rubber, SMR L 100.02.28 Dibenzothiazyl disulfideA 1.8N-Isopropyl-N8-phenyl-p-phenylenediamineB
1.0
Zinc oxide,C ISO 9298, Class B4cD 50.0N 330 carbon blackE 36.0Sulfur 2.5
TOTAL 191.3
NOTE—If optimum reproducibility is desired, the following materialsshall be used:Vulkacit DM/CA and Vulkanox 4010 NA/LGB from Bayer Corporation,2603 West Market Street, Akron, OH 44313 or Bayer AG, RubberBusiness Group, D 51368 Leverkusen—Bayerwerk, Germany.
CZinkweiss G9 available from Grillo Zinkoxid GmbH, HalberstädterStrasse 15, D 38644 Goslar, Germany.
DZinc oxide, ISO 9298, Class B4c is an indirect (French process)type with the following typical properties: 99.0 % zinc oxide, 0.25 %lead, 0.05 % cadmium, surface area 9.0 m2/g, volatile matter 0.3 %,sieve residue (45 µm) 0.05 %, acidity 0.12 g sulfuric acid/100 g,copper 0.001 %, manganese 0.001 %, acid-insoluble 0.1 % and water-soluble 0.2 %.
ECorax N 330 from Degussa Corporation, 3500 Embassy Parkway,Akron, OH 44333 or Degussa AG, Dept. AC-KP-AT, D 50354 Hürth—Werk Kalscheuren, Germany.
TABLE A1.2 Mixing Procedure
Addition min
Rubber 0Ingredients A, B, C—premixed 7.5Carbon black 11Sulfur 14Dump at 100 to 110°C (212 to 230°F) 18
TABLE A1.3 Standard Rubber #2
Ingredients Parts by Mass
Natural rubber, SMR 5 100.0Stearic acid 2.0Zinc oxide 5.0N 330 carbon blackA 50.0N-Isopropyl-N8-phenyl-p-phenylenediamine
1.0
Cyclohexyl benzothiazolesulfenamide
0.5
Sulfur 2.5
TOTAL 161.0AFor referee purposes the current Industry Reference Black (IRB) should be
used (see Classification D 1765); this may, however, generate different testresults.
D 5963 – 97a (2001)e1
8
APPENDIX
(Nonmandatory Information)
X1. BACKGROUND INFORMATION
X1.1 The method described in this test method is insubstantial agreement with a current draft revision of ISO4649:1985, Rubber—Determination of Abrasion ResistanceUsing a Rotating Drum Device, with the minor exception notedbelow. Some elements of the German Standard DIN 53516,Determination of Abrasion Resistance, for forerunner of ISO
4649, have been retained in this test method.
X1.2 This method specifies 10 N as the only force forpressing the test piece against the revolving abrasive drum (thesame as in DIN 53516). ISO 4649 allows the use of an alternateforce of 5 N.
ASTM International takes no position respecting the validity of any patent rights asserted in connection with any item mentionedin this standard. Users of this standard are expressly advised that determination of the validity of any such patent rights, and the riskof infringement of such rights, are entirely their own responsibility.
This standard is subject to revision at any time by the responsible technical committee and must be reviewed every five years andif not revised, either reapproved or withdrawn. Your comments are invited either for revision of this standard or for additional standardsand should be addressed to ASTM International Headquarters. Your comments will receive careful consideration at a meeting of theresponsible technical committee, which you may attend. If you feel that your comments have not received a fair hearing you shouldmake your views known to the ASTM Committee on Standards, at the address shown below.
This standard is copyrighted by ASTM International, 100 Barr Harbor Drive, PO Box C700, West Conshohocken, PA 19428-2959,United States. Individual reprints (single or multiple copies) of this standard may be obtained by contacting ASTM at the aboveaddress or at 610-832-9585 (phone), 610-832-9555 (fax), or [email protected] (e-mail); or through the ASTM website(www.astm.org).
D 5963 – 97a (2001)e1
9

Designation: F 1487 – 01
Standard Consumer Safety Performance Specification forPlayground Equipment for Public Use 1
This standard is issued under the fixed designation F 1487; the number immediately following the designation indicates the year oforiginal adoption or, in the case of revision, the year of last revision. A number in parentheses indicates the year of last reapproval. Asuperscript epsilon (e) indicates an editorial change since the last revision or reapproval.
INTRODUCTION
This consumer safety performance specification establishes nationally recognized safety standardsfor public playground equipment to address injuries identified by the U.S. Consumer Product SafetyCommission (CPSC).
During 1999 the CPSC estimated that about 156 000 victims were treated in U.S. hospitalemergency rooms for injuries associated with public playground equipment. About three fourths ofthese injuries resulted from falls, primarily to the surface on which the equipment was located. Otherhazard patterns involved impact by swings and other moving equipment and contact with protrusions,pinch points, and sharp edges. Fatalities reported to the CPSC resulted from falls; entanglement ofclothing or similar items on equipment; entanglement in ropes tied to or caught on equipment; headentrapment; impact by equipment that tipped over or otherwise failed; and impact by moving swings.This consumer safety performance specification does not eliminate the need for supervision ofchildren on public playground equipment. It is intended to minimize the likelihood of life-threateningor debilitating injuries, such as those identified by the CPSC.
There has been significant harmonization of this performance specification and CAN/CSA-Z614.
1. Scope
1.1 This consumer safety performance specification pro-vides safety and performance standards for various types ofpublic playground equipment. Its purpose is to reduce life-threatening and debilitating injuries.
1.2 The range of users encompassed by this consumer safetyperformance specification is the 5th percentile 2-year-oldthrough the 95th percentile 12-year-old.
1.3 Home playground equipment, amusement park equip-ment, sports equipment, fitness equipment intended for usersover the age of 12, and soft contained play equipment are notincluded in this specification.
1.4 This consumer safety performance specification in-cludes the following sections:
Title Section Number
Scope 1Referenced Documents 2Terminology 3Materials and Manufacture 4General Requirements 5Performance Requirements 6Requirements for Access/Egress 7Equipment 8Public Use Playground Layout 9
Accessibility 10Installation 11Structural Integrity 12Maintenance 13Labeling 14Figures Annex A1
1.5 The values stated in inch-pound units are to be regardedas standard. The values given in parentheses are for informa-tion only.
NOTE 1—The conversion factor from inch-pound to metric units is 1in. = 25.4 mm, and 1 lb = 0.45359 kg.
NOTE 2—See Annex A1 for figures referenced throughout this specifi-cation.
NOTE 3—General dimensional tolerances for this specification (unlessotherwise noted) are as follows:
Dimension ToleranceX in. 60.5 in.
X.X in. 60.05 in.X.XX in. 60.005 in.
2. Referenced Documents
2.1 ASTM Standards:D 2240 Test Method for Rubber Property—Durometer
Hardness2
F 698 Specification for Physical Information to be Providedfor Amusement Rides and Devices3
1 This specification is under the jurisdiction of ASTM Committee F15 onConsumer Products and is the direct responsibility of Subcommittee F15.29 onPlayground Equipment for Public Use.
Current edition approved June 10, 2001. Published August 2001. Originallypublished as F 1487 – 93. Last previous edition F 1487 – 98.
2 Annual Book of ASTM Standards, Vol 09.01.3 Annual Book of ASTM Standards, Vol 15.07.
1
Copyright © ASTM, 100 Barr Harbor Drive, West Conshohocken, PA 19428-2959, United States.

F 846 Guide for Testing Performance of Amusement Ridesand Devices3
F 853 Practice for Maintenance Procedures for AmusementRides and Devices3
F 893 Guide for Inspection of Amusement Rides and De-vices3
F 1004 Consumer Safety Specification for Expansion Gatesand Expandable Enclosures3
F 1077 Guide for the Selection of Committee F-16 FastenerSpecifications4
F 1148 Consumer Safety Performance Specification forHome Playground Equipment3
F 1159 Practice for the Design and Manufacture of Amuse-ment Rides and Devices3
F 1292 Specification for Impact Attenuation of SurfaceSystems Under and Around Playground Equipment3
F 1951 Specification for Determination of Accessibility ofSurface Systems Under and Around Playground Equip-ment3
2.2 ANSI Standards:5
Z535.1 Safety Color CodeZ535.4 Products Safety—Signs and Labels2.3 Federal Standards:6
16 CFR Part 1303 Ban of Lead-Containing Paint andCertain Consumer Products Bearing Lead-ContainingPaint
16 CFR 1500 Hazardous Substances Act Regulations, in-cluding Sections:
1500.48 Technical Requirements for Determining a SharpPoint in Toys and Other Articles Intended for Use byChildren Under 8 Years of Age
1500.49 Technical Requirements for Determining a SharpMetal or Glass Edge in Toys and Other Articles Intendedfor Use by Children Under 8 Years of Age
16 CFR Section 1501 Method for Identifying Toys andOther Articles Intended for Use by Children Under 3 Yearsof Age Which Present Choking, Aspiration or IngestionHazards Because of Small Parts
36 CFR Part 1191 Americans with Disabilities Act Disabil-ity Accessibility Guidelines (ADAAG) for Buildings andFacilities; Section 15.6 Play Areas
2.4 UL Standards:7
UL 969 Standard for Safety: Marking and Labeling Sys-tems
2.5 CSA Standards:8
CAN/CSA-Z614 Children’s Playspaces and Equipment
3. Terminology
3.1 Descriptions of Terms Specific to This Standard:
3.1.1 accessible, adj—relating to a part or portion of theplayground equipment, (1) capable of being contacted by anybody part, or (2) accessible to and usable by persons withdisabilities.
3.1.2 accessible playground, n—playground equipmentarea, that, when viewed in its entirety, may be approached, andentered and provides a range of play opportunities and expe-riences to users of varying abilities.
3.1.3 accessible route, n— to a piece of playground equip-ment,a continuous unobstructed pathway from the perimeter ofthe use zone to the equipment.
3.1.4 adjacent platforms, n—two platforms having a com-mon vertical plane with some deviation in their height.
3.1.5 completely bounded opening, n—any opening in apiece of play equipment that is totally enclosed by boundarieson all sides so that the perimeter of the opening is continuous.
3.1.6 component, n—of a play structure, any portion thereofthat generates specific activity and cannot stand alone.
3.1.7 composite play structure, n—two or more play struc-tures attached or functionally linked, to create one integral unitthat provides more than one play activity; an example is acombination climber, slide, and horizontal ladder.
3.1.8 designated play surface, n—any elevated surface forstanding, walking, sitting, or climbing, or a flat surface largerthan 2.0 in. (51 mm) wide by 2.0 in. (51 mm) long having lessthan 30° angle from horizontal.
3.1.9 enclosed swing seat, n—a suspended device uponwhich a user sits with non-removable supports on all sides ofa user, which are intended to prevent a user from falling off thedevice while it is in motion.
3.1.10 entanglement, n—a condition in which the user’sclothes or something around the user’s neck becomes caught orentwined on a component of playground equipment.
3.1.11 entrapment, n—any condition which impedes with-drawal of a body or body part that has penetrated an opening.
3.1.12 fall height, n—the vertical distance between a des-ignated play surface and the protective surfacing beneath it.
3.1.13 flexible component, n—any part of the playgroundequipment, excluding swings, that temporarily changes itsshape when in use; examples include the tire net, the cargo net,and the log bridge.
3.1.14 functionally linked play structure, n— a play struc-ture that acts as a single unit in its physical form or sense offunction as continuous play even if the components are notphysically attached.
3.1.15 guardrail, n—a device around an elevated surfacethat prevents inadvertent falls from the elevated surface.
3.1.16 handrail, n—a rigid linear device, following the pathof access or egress, that when grasped, provides balance andsupport in maintaining a specific body posture.
3.1.17 maximum user, n—a 12-year-old child; measurementcharacteristics are the 95th percentile values for combinedsexes.
3.1.18 minimum user, n—a 2-year-old child; measurementcharacteristics are the 5th percentile values for combinedsexes.
3.1.19 partially bounded opening, n—any opening in apiece of play equipment that is not totally enclosed by
4 Annual Book of ASTM Standards, Vol 15.08.5 Available from American National Standards Institute, 11 W. 42nd St., 13th
Floor, New York, NY 10036.6 Code of Federal Regulations, available from U.S. Government Printing Office,
Washington, DC 20402.7 Available from Underwriters Laboratories, Inc., 333 Pfingsten Rd., Northbrook,
IL 60062.8 Available from Canadian Standards Association, Etobicoke (Toronto), 178
Rexdale Blvd., Etobicoke (Toronto), ON M9W 1R3.
F 1487
2
boundaries on all sides so that the perimeter of the opening isdiscontinuous.
3.1.20 pinch, crush, and shear point, n— the juncture atwhich the user could suffer contusion, laceration, abrasion,amputation, or fracture during use of the playground equip-ment.
3.1.21 platform, n—a flat surface, intended for more thanone user to stand, and upon which the user(s) can move freely.
3.1.22 play structure, n—a free standing structure with oneor more components and their supporting members.
3.1.23 preventive maintenance, n—a planned program ofinspections and maintenance intended to keep equipmentfunctioning properly and to forestall equipment failures.
3.1.24 professional judgment, n—the ability of an indi-vidual with current knowledge, skill or experience, or both, inthe field of playgrounds/playground equipment design, use, oroperations, which enables the person to form an opinion ormake a decision, or both, concerning a matter within that fieldof expertise.
3.1.25 projection, n—a condition which, due to its physicalnature, must be tested to the requirements of this standard todetermine whether it is a protrusion or entanglement hazard, orboth.
3.1.26 protective barrier, n—an enclosing device around anelevated surface that prevents both inadvertent and deliberateattempts to pass through the device.
3.1.27 protective surfacing, n—material(s) to be used withinthe use zone of any playground equipment.
3.1.27.1Discussion—Protective surfacing shall meet theminimum impact attenuation requirements of SpecificationF 1292.
3.1.28 protrusion, n—a projection which, when tested inaccordance with the requirements of this standard, is found tobe a hazard having the potential to cause bodily injury to a userwho impacts it.
3.1.29 public use playground equipment, n— a play struc-ture anchored to the ground or not intended to be moved, foruse in play areas of schools, parks, child-care facilities,institutions, multiple-family dwellings, private resorts andrecreation developments, restaurants, and other areas of publicuse.
3.1.29.1Discussion—Requirements for amusement parkequipment, sports use, and home playground equipment arecovered in Specifications F 698 and F 1148, Guides F 846 andF 893, and Practices F 853 and F 1159.
3.1.30 rocking/springing equipment, n—any play structurethat rocks about a fixed base.
3.1.31 rotating equipment, n—any play structure that movesabout a vertical or horizontal axis (for example, a merry-go-round, whirl, logroll, or spinner).
3.1.32 rotating swing, n—a play structure with at least onesuspended seat designed for swinging by the user, in a seatedposition, in more than one plane and spins about its axis.
3.1.33 rung, n—a crosspiece in a ladder or other climbingequipment used for supporting the user’s feet or for graspingby the user’s hands, or both.
3.1.34 sharp edge, n—an edge that can cut a user’s skin.3.1.34.1Discussion—An edge is judged as potentially sharp
pursuant to the provisions of 16 CFR Section 1500.49.3.1.35 sharp point, n—a point that can puncture or lacerate
a user’s skin during use.3.1.35.1Discussion—A point is judged as potentially sharp
pursuant to the provisions of 16 CFR Section 1500.48.3.1.36 signal word, n—the word that designates a degree or
level of hazard.3.1.36.1Discussion—The signal word for safety labels is
WARNING.3.1.37 small part, n—an object that may become detached
and presents a choking, aspiration, or ingestion hazard to theuser.
3.1.37.1Discussion—A small part is determined to be ahazard pursuant to the provision of 16 CFR Part 1501.
3.1.38 stability, n—the ability of the playground equipmentto withstand anticipated forces which act to tip or slide theplayground equipment when properly assembled and installed.
3.1.39 stair, n—a device having a slope of 50° or less froma horizontal plane and consisting of a series of steps that can beused for ascending and descending.
3.1.40 stationary equipment, n—any play structure whichhas a fixed base and does not move.
3.1.41 step, n—a horizontal flat crosspiece of a ladder orstair used primarily as a foot support.
3.1.41.1Discussion—Also referred to as atread.3.1.42 swing bay, n—the space beneath the overhead beam
bounded by one or more supports on which swing assembly orassemblies are attached.
3.1.43 to-fro swing, n—a play structure with at least onesuspended component designed for swinging by the user in asingle vertical plane, such as a seat, ring, bar, platform, or net.
3.1.44 track rides—play components designed for coasting,with a rolling mechanism enclosed within or surrounding atrack.
3.1.45 transfer point, n—a platform along an accessibleroute of travel or an accessible platform provided to allow achild in a wheelchair to transfer from the chair onto theequipment.
3.1.46 trip hazard, n—an abrupt change in elevation that isnot clear and obvious to the user.
3.1.47 upper body equipment, n—overhead component de-signed to support a child by the hands only (for example,horizontal ladders, chinning bars, and ring ladders).
3.1.48 use zone, n—the area beneath and immediatelyadjacent to a play structure or equipment that is designated forunrestricted circulation around the equipment and on whosesurface it is predicted that a user would land when falling fromor exiting the equipment.
3.1.48.1Discussion—The surface area within the use zoneshall meet the minimum impact attenuation requirements ofSpecification F 1292 from the maximum fall height.
3.1.49 warning, n—a notice or communication to indicate apotentially hazardous situation that if not avoided could resultin death or serious injury.
4. Materials and Manufacture
4.1 General Requirements—Playground equipment shall bemanufactured and constructed only of materials that have ademonstrated durability in the playground or similar outdoor
F 1487
3

setting. Any new materials shall be documented or testedaccordingly for durability by the playground equipment manu-facturer.
4.1.1 Metals subject to structural degradation such as rust orcorrosion shall be painted, galvanized, or otherwise treated.Woods shall be naturally rot- and insect-resistant or treated toavoid such deterioration. Plastics and other materials thatexperience ultraviolet (UV) degradation shall be protectedagainst ultraviolet light.
4.1.2 Regardless of the material or the treatment process,the manufacturer shall ensure that the users of the playgroundequipment cannot ingest, inhale, or absorb any potentiallyhazardous amounts of substances through body surfaces as aresult of contact with the equipment. All paints or other similarfinishes shall comply with 16 CFR Part 1303.
4.1.3 Wood intended for playground equipment that is notnaturally rot- and insect-resistant shall be treated to resist rotand insect attack from standard procedures. Any wood notnaturally rot- and insect-resistant, which has any fabrication upto 6 in. (150 mm) above, or any portion at or below the levelof the protective surface of the playground, shall be treatedafter wood fabrication. Deviations shall have independentdocumentation of durability. Creosote, pentachlorophenol,tributyl tin oxide, and surface coatings that contain pesticidesshall not be used for playground equipment. Wood treaters andplayground equipment manufacturers shall practice technolo-gies and procedures that minimize the level of dislodgeabletoxin.
4.2 All fasteners used to construct public playground equip-ment shall be manufactured in accordance with Guide F 1077and shall meet the requirements of Section 4.
4.2.1 All fasteners, connecting, and covering devices shallbe inherently corrosion resistant or be provided with acorrosion-resistant coating.
4.2.2 When installed in accordance with the manufacturer’sinstructions, fasteners, connecting, and covering devices shallnot loosen or be removable without the use of tools. Lockwashers, self-locking nuts, or other locking means shall beprovided for all nuts and bolts to protect them from detach-ment. Hardware in moving joints shall also be secured againstunintentional loosening.
4.2.3 Moving suspended elements shall be connected to thefixed support with bearings or bearing surfaces that serve toreduce friction or wear.
4.2.3.1 Steel cable that is permanently affixed to a hangerassembly performs as a bearing surface. Cable ends should beinaccessible or capped to prevent injury from frayed wires.Cables and steel-cored ropes should be protected to preventfraying, loosening, unraveling, or excessive shifting of joints.
4.2.4 Hooks and connecting devices shall be subject to therequirements of 6.4.5.
4.3 Tires4.3.1 Tires shall not trap water.4.3.2 Tires shall not have exposed steel belts.
5. General Requirements
5.1 Playground equipment represented as complying withthis consumer safety performance specification shall meet allapplicable requirements specified herein. Anyone representing
compliance with this specification shall keep such essentialrecords as are necessary to document any claim that therequirements within this specification have been met.
5.2 Play equipment designed for a specific age group (2through 5, 5 through 12, 2 through 12) shall have all playactivities on that equipment meet the requirements for that agegroup.
5.3 Small Parts—When installed in accordance with themanufacturer’s instructions, equipment for children under 3years of age shall meet the requirements of 16 CFR Part 1501.
6. Performance Requirements
6.1 Head and Neck Entrapment—Public playground equip-ment shall be designed and constructed or assembled so thatany accessible opening shall meet the following performancerequirements to reduce the risk of accidental head or neckentrapment by either a head-first or feet-first entry into theopening. Openings between the protective surfacing and thebottom edge of the equipment (that is, rails, platforms, steps,and so forth) are exempt from this requirement as indicated byFig. A1.1.
6.1.1 Accessible Openings—A completely bounded rigidopening is accessible when a torso test probe (see Fig. A1.2)can be inserted into the opening to a depth of 4.0 in. (102 mm)or more.
6.1.1.1 Test Procedure for Completely Bounded RigidOpenings—Place the torso probe (see Fig. A1.2) in the openingwith the plane of the base of the probe parallel to the plane ofthe opening; rotate the probe to its most adverse orientation(that is, major axis of the base of the probe parallel to the majoraxis of opening). If the torso probe can be inserted into theopening to a depth of 4.0 in. (102 mm) or more, place the headprobe (see Fig. A1.3) in the opening with the plane of the baseof the probe parallel to the plane of the opening. An openingpasses this test if (1) the opening does not admit the torso probewhen it is rotated to any orientation about its own axis, or (2)the opening admits the torso probe and also admits the headprobe. An opening fails the test if the opening admits the torsoprobe but does not admit the head probe.
6.1.2 Nonrigid Completely Bounded Openings—A nonrigidopening such as may be found in but not limited to flexiblenets, tarps, and plastic enclosures is considered accessible if atorso probe will penetrate the opening to a depth of 4.0 in. (102mm) or more when tested in accordance with the test procedureoutlined in 6.1.2.1. (See Figs. A1.2 and A1.3 for probedimensions.)
6.1.2.1 Test Procedure for Completely Bounded NonrigidOpenings—Place the torso probe in the opening, tapered-endfirst, with the plane of its base parallel to the plane of theopening; rotate the probe to its most adverse orientation (thatis, the major axis of the base of the probe parallel to the majoraxis of the opening); apply a force of 50 lbf (222 N) to theprobe to attempt to pass it through the opening. If the base ofthe probe passes through the opening, place the large headprobe in the opening, tapered end first, with the plane of itsbase parallel to the plane of the opening. Apply a force of 50lbf (222 N) to the probe to attempt to pass it through theopening. A nonrigid opening passes the test if: (1) the openingdoes not allow the torso probe to be inserted so deep that the
F 1487
4

opening admits the base of the probe when it is rotated to anyorientation about its own axis, or (2) the opening allows fullpassage of the torso probe and also allows the large head probeto pass completely through. A nonrigid opening fails the test ifthe opening allows full passage of the torso probe but does notadmit the large head probe.
6.1.3 Boundaries of Large Openings—If the opening admitsthe 9.0-in. (229-mm) head probe, each portion of its boundaryshall be evaluated for partially bounded opening requirementsof 6.1.4.
6.1.4 Partially Bounded Openings:6.1.4.1 A partially bounded opening is considered acces-
sible when any of the following conditions exist, and mustmeet the performance requirements as recommended in 6.1.4.2and 6.1.4.3.
6.1.4.2 If the unbounded part of a partially bounded openingis between 1.8756 0.005 in. (47.6 mm) and 9.0 in. (229 mm)in width when measured perpendicular to each surface, theopening can be considered accessible and must meet theconditions of 6.1.4.3.
6.1.4.3 Test Method— The “A” portion of the test template(Fig. A1.4) is to be inserted along the centerline of the opening(determine the most adverse condition) (see Fig. A1.5) so thatthe centerline of the template follows the centerline of theopening and the plane of the template is parallel to the plane ofthe opening until the motion is arrested by contact between thetest template and the boundaries of the opening. By visualinspection, determine if there is simultaneous contact betweenthe sides of the template. If simultaneous contact is made theopening is accessible and must be tested using the “B” portionof the test template (see Fig. A1.6).
6.1.4.4 If the angle test template “A” indicates failure, checkfor an exempted thick surface condition by positioning theplane of the “B” portion of the test template between andperpendicular to the plane of the boundaries of the opening (seeFig. A1.7 and Fig. A1.9). If the test template fits completelywithin the boundaries of the opening, the opening is consideredhazardous and fails the test unless it allows full passage of the9.0-in. (229 mm) head probe (see Fig. A1.8). If the templatedoes not fit down within the boundaries of the opening (definedas the opening outlined by the contact points of the testtemplate “A”) the opening is not considered accessible.
6.1.4.5 The test template is divided into two sections.Section “A” is used first to determine accessibility and is basedon the Specification F 1004 standard rationale. Section “B” isused to determine if the thickness of the material or the locationof the opening prevents access to the opening. The thickness of0.75 in. (19.1 mm) for the template itself is based on half of theneck depth of a 5th percentile two year old minus compression.This dimension is consistent with Specification F 1004.
6.1.4.6 Other dimensions are based on the following:(1) 6.1 in. (155 mm) width represents 95th percentile 5 year
old head width,(2) 1.8756 0.005 in. (47.6 mm) is the neck breadth of the
5th percentile 2 year old (2.5 in. (64 mm) minus tissuecompression),
(3) 8.5 in. (216 mm) shoulder width of 5th percentile 2 yearold, and
(4) 3.0 in. (76 mm) neck length of a five year old.6.1.4.7 Exemption to 6.1.4:(1) Those partially bounded openings which are inverted. A
partially bounded opening is considered inverted if the lowestinterior boundary immediately adjacent to the opening ishorizontal or slopes downward.
(2) Partially bounded openings that form “V” angles lessthan 55 degrees where the apex of the angle is formed by aninclined or vertical climbing surface and a rope, chain or cableare exempt if the rope, chain or cable are in contact with theinclined surface at or below the protective surface at the pointof the formed “V” angle.
6.2 Sharp Points and Sharp Edges—There shall be noaccessible sharp points or sharp edges on public play equip-ment.
6.2.1 All points and edges on public play equipment shall betested for sharpness in accordance with the requirements in 16CFR 1500.48 and 1500.49 referenced in 2.3.
6.2.2 The exposed open ends of all tubing shall be providedwith caps or plugs that cannot be removed without the use oftools.
6.2.3 Suspended members, such as rings on upper bodyequipment and swing seats, shall have a minimum radius of0.25 in. (6.4 mm) on corners and edges. This requirement doesnot apply to swing belt seats, straps, ropes, chains, connectors,and other flexible components.
6.2.4 A cut-off bolt end projecting beyond the face of the nutshall be free of burrs, sharp points, and sharp edges.
6.3 Protrusions— There shall be no protrusions on publicplay equipment. Four protrusion test gages (shown in Figs.A1.10 and A1.11) are required to determine whether projec-tions are protrusions. Their use is described in this section.
6.3.1 Accessible Projections—A projection is not accessibleand is not a protrusion when it is recessed or located in such amanner that will not allow any of the protrusion gages to beplaced over it. Any of the conditions described in the remainderof this section constitute a protrusion hazard.
6.3.2 Determining Whether a Projection is a Protrusion—Successively place each of three gages (see Fig. A1.10) overeach accessible projection in all orientations (see Fig. A1.12and Fig. A1.13). Determine whether the projection extendsbeyond the face of any gage. The projection fails the test andis a protrusion if it extends beyond the face of any of the threegages.
6.3.3 Swing Seat Protrusions—Test for this condition withthe suspended member in all positions of its intended travel.Keeping the protrusion gage (see Fig. A1.11) oriented verti-cally, and its axis parallel to the plane of travel, place it overany projection accessible throughout the path of travel. Anyprojection on the suspended member which extends beyond theface of the test gage is a protrusion.
6.4 Entanglement— There shall be no entanglement hazardson public play equipment. Three test gages, a feeler gage, andthe means to accurately measure a 0.12 in. (3.0 mm) extensionare required to determine whether entanglement hazards exist.Any of the conditions described in this section constitutes anentanglement hazard.
6.4.1 Slides—The following requirements apply to slides in
F 1487
5

the areas shown in Fig. A1.14. Examples are shown in Fig.A1.15, Fig. A1.16 and Fig. A1.22.
6.4.1.1 A projection that meets both of the following re-quirements is an entanglement hazard:
(1) One of the three protrusion gages (see Fig. A1.10) passesover the projection and contacts the initial surface.
(2) The projection extends perpendicular (65°) from theinitial surface more than 0.12 in. (3.0 mm). The thickness ofthe protrusion gage (see Fig. A1.11) may be used to measurethe 0.12 in. (3.0 mm) extension.
6.4.1.2 Slides shall be constructed in such a manner as toprovide a smooth continuous sliding surface (roller slidesexempted) and have no gaps or spaces that might create anentanglement hazard such as but not limited to the spacecreated between sidewalls when two single slides are combinedto create a doublewide slide or the point where a hood attachesto the sidewalls of a slide.
6.4.2 Projections from a Horizontal Plane—A projectionthat meets the conditions of 6.4.1.1 (1) and (2) and which alsoprojects upwards from a horizontal plane (see Figs. A1.15 andA1.16) is an entanglement hazard.
6.4.3 Exposed Bolt End Projections—Any accessible boltend projecting beyond the face of the nut more than two fullthreads is an entanglement hazard. A bolt end is inaccessibleand not an entanglement hazard (see Fig. A1.15(6))when thebolt end is recessed and the 3.5 in. (89 mm) OD protrusiongage (see Fig. A1.10) cannot be made to contact the bolt endwhen the outside curve of the gage is placed flat against therecessed area (see Fig. A1.17).
6.4.4 Projections Which Increase in Size—Any projectionwhich fits within any of the three protrusion test gages (see Fig.A1.10) and increases in size or diameter from the initial surfaceto the outer end (see Fig. A1.15(7)) is an entanglement hazard.
6.4.5 Connecting Devices—Connecting devices such as, butnot limited to, S-hooks, pelican hooks and C-hooks, whenproperly closed, are not entanglement hazards. These connec-tors are considered closed when there is no gap or space greaterthan 0.04 in. (1.0 mm) when measured with a feeler gage (seeFig. A1.18(1)).
6.4.5.1 S-hook connectors are subject to these further re-quirements. If any of the following requirements are not met,an entanglement hazard exists:
(1) No portion of the closed end of an S-hook lower loopmay project beyond the vertical boundary established by theupper loop (see Fig. A1.18(2)).
(2) An S-hook upper loop may align with, may partiallyoverlap, or may completely overlap the connector body. If theupper loop completely overlaps the connector body, it must notextend past the connector body (see Fig. A1.18(3)).
(3) An S-hook lower loop must align with the connectorbody and not overlap it in any way (see Fig. A1.18(4)).
6.5 Pinch, Crush, and Shear Points—There shall be nopinch, crush, or shear points caused by junctures of twocomponents moving relative to one another, or at an openingpresent at the junction of a stationary support and a rigidsupporting member for a swinging element (that is, pendulumsee saw, glide rides, and so forth) while the swinging elementsare within their normal swinging angles. A pinch, crush, or
shear point is any point that entraps at one or more positions a0.62 in. (15.7 mm) diameter rod.
6.5.1 To reduce the likelihood of unintentional contact witha pinch, crush, or shear point, an opening shall comply witheither 6.5.1.1 or 6.5.1.2.
6.5.1.1 An opening with a minor dimension of less than 1.0in. (25 mm) is acceptable if a finger probe (as illustrated in Fig.A1.19), when inserted point first into an opening, cannot bemade to touch any pinch, crush, or shear point. The probe shallbe applied in all possible articulated positions with an appli-cation force not to exceed 1 lb (4 N).
6.5.1.2 An opening in an enclosure with a minor dimensionof 1.0 in. (25 mm) or more, shall require that the pinch, crush,or shear point be located at a distance as specified in Table 1from the plane of the opening.
NOTE 4—An enclosure in this case covers a pinch, crush, or shear point.
6.5.1.3 Exemptions to 6.5:(1) Chain and its method of attachment, and(2) The attachment area of heavy duty coil springs to the
body and base of rocking equipment.(3) The area between a swinging element and a horizontal
toprail.(4) The area between small, lightweight moving parts nec-
essary as an integral part of the play activity (for example,abacus beads, bell clappers, telephone receivers, etc.) providedthat this area is not considered a pinch, crush, or shear point asdefined in 3.1.20.
6.6 Suspended Hazards—There shall be no single nonrigidcomponent (cable, wire, rope, or other similar component)suspended between play units or from the ground to the playunit within 45° of horizontal, unless it is above 84 in. (2130mm) from the playground surface and is a minimum of 1.0 in.(25 mm) at its widest cross-section dimension. It is recom-mended that the suspended elements be either brightly coloredor contrast with surrounding equipment to add to visibility.
6.6.1 Rope, cable, or chain shall be fixed at both ends andnot be capable of being looped back on itself, creating an insideloop perimeter greater than 5.0 in. (127 mm).
6.6.2 Exemptions for Suspended Components (Rigid orFlexible):
6.6.2.1 Multiple (two or more) suspended components(cables, wire, rope, or similar components) located at two ormore elevations, may be suspended below 84 in. (2130 mm)when they comply with all other aspects of the single sus-pended component section and cannot be looped or stretched tocontact another suspended component(s).
TABLE 1 Minimum Acceptable Distance from an Opening to aPinch, Crush, or Shear Point
Minimum Dimension of Opening,A
in. (mm), 60.05BMinimum Distance from Opening
to Part, in. (mm)
1 (25) 6.5 (165)1.25 (32) 7.5 (190)1.5 (38) 12.5 (318)
1.875 (48) 15.5 (394)2.125 (54) 17.5 (445)
More than 2.125 (54) and less than 6(152)
30 (762)
A See 6.5.1.2.B Between 1 and 2.5-in. (25 and 64-mm) interpolation is used to determine
values specified in the table.
F 1487
6

6.6.2.2 Chain or cable used to support a swing is exemptfrom this requirement. Rope shall not be used as a method ofsuspending swings.
6.6.2.3 Rope, cable, or chain with a length of 7.0 in. (178mm) or less may be attached at one end only. Multiple lengthsof such cords that can contact each other would be treated asone length of cord.
7. Requirements for Access/Egress
7.1 Rung Ladders, Stepladders, Stairways, and Ramps(Does Not Address Wheelchair Use):
7.1.1 Steps and rungs shall be evenly spaced within atolerance of60.25 in. (66.4 mm) and horizontal within atolerance of62°.
7.1.2 Steps and rungs shall not trap water (that is, nostanding water) and should not encourage the accumulation ofdebris.
7.1.3 See Table 2 for access slope; tread, rung, or rampwidth; tread depth; ladder rung diameter; and vertical rise.
7.1.4 Handrails:7.1.4.1 Continuous handrails shall be provided on both sides
of stairways (see 7.2.1.3 for spiral stairways) and stepladdersthat have more than one tread.
7.1.4.2 Stairways or stepladders which consist of only onetread shall have handrails or alternate means of hand supporton both sides.
7.1.4.3 Handrails or other means of hand support shall be
available for use at the beginning of the first step.7.1.4.4 Handrails shall be between 0.95 and 1.55 in. (24 and
39 mm) in diameter or maximum cross section.7.1.4.5 Handrail height (the vertical distance between the
top front edge of a step or, if used on a ramp, the top of theramp surface, and the top surface of the handrail above it) shallbe between 22 and 38 in. (560 and 970 mm).
7.2 Other Means of Access:7.2.1 Spiral Stairways:7.2.1.1 Spiral stairways shall meet the general requirements
for spacing, orientation, drainage, tread width, and vertical risespecified for stairway access in 7.1.1-7.1.3.
7.2.1.2 The depth of the outer edge of the tread on spiralstairways shall be 7.0 in. (178 mm) or greater on equipment forchildren 2 through 5 years, and 8.0 in. (203 mm) or greater onequipment for children 5 through 12 years. These depthrequirements apply to spiral stairways with both open andclosed risers.
7.2.1.3 Spiral stairways shall meet the requirements speci-fied for handrails in 7.1.4. However, when the design of thestairway does not permit handrails on both sides of thestairway, a continuous handrail shall be provided along theoutside perimeter of the steps.
7.2.2 Climbers:7.2.2.1 Arch climbers and flexible components shall not be
TABLE 2 Rung Ladders, Stepladders, Stairways, and Ramps (Access Slope; Tread, Rung, and Ramp Width; Tread Depth; RungDiameter; and Vertical Rise, by Age of Intended User)
Type of AccessAge of Intended User, years
2 through 5 5 through 12 2 through 12
Rung Ladders:A
Slope 75 to 90° 75 to 90° 75 to 90°Total ladder widthB $12 in. (300 mm) $16 in. (410 mm) $16 in. (410 mm)Vertical rise (top of rung to top
of rung)#12 in.C (300 mm) #12 in.C (300 mm) #12 in.C (300 mm)
Rung diameter 0.95 to 1.55 in. (24 to 39 mm) 0.95 to 1.55 in. (24 to 39 mm) 0.95 to 1.55 in. (24 to 39 mm)Stepladders:
Slope 50 to 75° 50 to 75° 50 to 75°Tread width:
Single file access 12 to 21 in. (300 to 530 mm) $16 in. (410 mm) 16 to 21 in. (410 to 530 mm)Two-abreast access A $36 in. (910 mm) A
Tread depth:Open riser $7.0 in. (178 mm) $3.0 in. (76 mm) $7.0 in. (178 mm)Closed riser $7.0 in. (178 mm) $6.0 in. (152 mm) $7.0 in. (178 mm)
Vertical rise (top of step to topof step)
#9.0 in.C (229 mm) #12.0 in.C (305 mm) #9.0 in.C (229 mm)
Stairways:Slope <50° <50° <50°Tread width:
Single file access $12 in. (300 mm) $16 in. (410 mm) $16 in. (410 mm)Two-abreast access $30 in. (760 mm) $36 in. (910 mm) $36 in. (910 mm)
Tread depth:Open riser $7.0 in. (178 mm) $8.0 in. (203 mm) $8.0 in. (203 mm)Closed riser $7.0 in. (178 mm) $8.0 in. (203 mm) $8.0 in. (203 mm)
Vertical rise (top of step to topof step)
#9.0 in.C(229 mm) #12.0 in.C (305 mm) #9.0 in.C (229 mm)
Ramps (does not address wheelchairuse):Slope (vertical/horizontal) #1:8 #1:8 #1:8Width:
Single file access $12.0 in. (300 mm) $16.0 in. (410 mm) $16.0 in. (410 mm)Two-abreast access $30.0 in. (760 mm) $36.0 in. (910 mm) $36.0 in. (910 mm)
A Not recommended as sole access for preschoolers.B Excluding side supports.C Entrapment provisions apply.
F 1487
7