unidas ep - multilateralfund.org · hcfc-22 al propano (hc-290), en las empresas midea room air...
TRANSCRIPT
Los documentos previos al período de sesiones del Comité Ejecutivo del Fondo Multilateral para la Aplicación del Protocolo de Montreal no van en perjuicio de cualquier decisión que el Comité Ejecutivo pudiera adoptar después de la emisión de los mismos.
NACIONES UNIDAS EP
Programa de las Naciones Unidas para el Medio Ambiente
Distr. GENERAL UNEP/OzL.Pro/ExCom/73/17/Add.1 21 de octubre de 2014 ESPAÑOL ORIGINAL: INGLÉS
COMITÉ EJECUTIVO DEL FONDO MULTILATERAL PARA LA APLICACIÓN DEL PROTOCOLO DE MONTREAL Septuagésima tercera Reunión París, 9 – 13 de noviembre de 2014
Addendum
INFORMES DE SITUACIÓN Y CUMPLIMIENTO
El presente documento se publica para añadir una sección sobre proyectos con requisitos específicos de presentación de informes.
1. Esta sección trata de los proyectos y actividades para los que se solicitaron informes específicos en anteriores reuniones y que requieren la atención del Comité Ejecutivo. Los informes se han agrupado en las siguientes partes:
Parte IV: Proyectos de demostración de HCFC
Parte V: Informes de auditoría para los sectores de halones, producción de CFC, espumas, agente de procesos II, solventes y servicio y mantenimiento de la refrigeración con CFC en China
Parte VI: Planes nacionales para la eliminación de CFC
Parte VII: Proyecto de eliminación del metilbromuro (MB) en Guatemala
Parte VIII: Gestión y eliminación de desechos de SAO
Parte IX: Movilización de recursos
2. Cada parte contiene una descripción sucinta de los progresos logrados y los comentarios y recomendaciones de la Secretaría.
UNEP/OzL.Pro/ExCom/73/17/Add.1
2
PARTE IV: PROYECTOS DE DEMOSTRACIÓN DE HCFC
Mundial: Proyecto de demostración para la conversión desde la tecnología HCFC-22/HCFC-142b al CO2 con tecnología coespumante de formiato de metilo en la fábrica de espuma de poliestireno extruido en Feininger (Nanjing) Energy Saving Technology Co. Ltd. Antecedentes 3. En la 64a reunión el Comité Ejecutivo aprobó el proyecto de demostración para la conversión desde la tecnología con HCFC-22/HCFC-142b a la tecnología con CO2 y coespumante de formiato de metilo en la fábrica de espuma de poliestireno extruido en Feininger (Nanjing) Energy Saving Technology Co. Ltd., a ser ejecutado por el PNUD (decisión 64/47). El objetivo del proyecto era establecer la idoneidad del CO2 con tecnología de formiato de metilo coespumante como sustituto viable del agente espumante HCFC-22/HCFC-142b que se emplea actualmente en la fabricación de la espuma de poliestireno extruido.
4. El PNUD ha presentado a la 73a reunión el informe final sobre el proyecto de demostración. El informe técnico completo se encuentra en el anexo I del presente documento.
Resumen ejecutivo 5. Se llevaron a cabo las siguientes actividades: evaluación del plan de retroadaptación; adquisición, instalación y puesta en servicio de equipos; celebración del proyecto piloto; comprobación de propiedades; evaluación de la factibilidad industrial; y capacitación en torno al proceso y a la seguridad.
6. Con el fin de producir espuma de poliestireno extruido con CO2 y formiato de metilo, Feininger actualizó su línea de producción original y retroadaptó los sistemas de ventilación y se seguridad contra los incendios de la planta de producción. Se evaluaron los sistemas de coespumación compuestos de CO2 y formiato de metilo y de CO2, formiato de metilo y etanol. El PNUD llegó a la conclusión de que la formula con CO2 y formiato de metilo que se probó se puede aplicar a la fabricación de espuma de poliestireno extruido dado que la conductividad térmica, la fuerza de compresión y el índice de oxígeno limitado son aceptables. También se estableció que el uso del formiato de metilo como agente coespumante del CO2 no tuvo una influencia significativa en el procesamiento de tableros de poliestireno extruido.
7. La línea de producción funciona comercialmente y los costos de explotación adicionales (CEA) serán desembolsados a la empresa en 2015. Se ha verificado la factibilidad de la aplicación industrial del formiato de metilo conjuntamente con el CO2 y el etanol en la producción de tableros de espuma de poliestireno extruido.
8. Los CEA reales para la conversión fueron de 1 743 186 $EUA, de los cuales 1 557 635 $EUA fueron aportados por el Fondo Multilateral y 185 551 $EUA fueron cofinanciados por la empresa. El PNUD ha estimado los CEA anuales en 531 200 $EUA (tabla 1). Aunque la línea de producción funciona con carácter comercial, los CEA todavía son valores preliminares.

UNEP/OzL.Pro/ExCom/73/17/Add.1
3
Tabla 1: CEA estimados usando la tecnología del CO2 y formiato de metilo para espumas de poliestireno extruido
Fuente de los CEA(*) Tecnología con HCFC Tecnología con CO2
Consumo en un año (kg)
Costo ($EUA) Consumo en un
año (kg) Costo ($EUA)
HCFC-22/142b 200 000 380 000 - CO2 - 120 000 13 200 Formiato de metilo - 80 000 180 000 Materia prima 2 000 000 2 900 000 2 000 000 (**) 3 600 000 Total 3 280 000 3 793 200
(*) HCFC-22/142b: 1,9 $EUA/kg; materia prima (materias regeneradas): 1,45 $EUA/kg; CO2: 0,11 $EUA/kg; formiato de metilo: 2,25 $EUA/kg; material prima (nuevas materias con resinas de poliestireno): 1,8 $EUA/kg. (**) La fórmula con HCFC usaba materias regeneradas, mientras que la fórmula con CO2 y formiato de metilo usaba nuevas materias con resinas de poliestireno en la demostración. Nota: El cálculo de los CEA no incluyó el costo del agente de combustión lenta adicional necesario para poder funcionar con CO2 y formiato de metilo, el cual se estima que incrementa el precio del producto en un 20 %.
9. El proyecto de demostración produjo una reducción del consumo de HCFC de 12,3 toneladas PAO y redujo las emisiones anuales de 420 250 toneladas de equivalente de CO2; la demostración y disponibilidad de una alternativa segura desde el punto de vista ecológico, rentable y reproducible para las empresas del sector de las espumas de poliestireno extruido en China y en otros países del Artículo 5; el uso de este producto en distintas aplicaciones; y la adopción de normas seguras para la fabricación de tableros de espuma de poliestireno extruido.
Comentarios de la Secretaría 10. Al tomar nota de que el cálculo de los CEA se realizó sobre la base del uso de nuevas materias con resinas de poliestireno en vez de materias regeneradas, la Secretaría preguntó si la tecnología probaba podría usar materias primas regeneradas, tal y como necesitan muchas empresas en China. El PNUD explicó que, aunque la evaluación se basó en nuevas materias, también podrían usarse materias de poliestireno regeneradas; sin embargo, el desempeño de la espuma no sería tan bueno como si se produjera con materias primas nuevas. Actualmente la línea de producción en Feininger usa materias de poliestireno regeneradas. Sobre esta base, la Secretaría toma nota de que, en el caso de Feininger, el uso de materias regeneradas costaría 2 900 000 $EUA en vez de 3 600 00 $EUA (como puede verse en la tabla 1), lo cual permite unos ahorros de explotación de 186 800 $EUA.
11. Al hacer aclaraciones adicionales sobre las características y el costo de los agentes de combustión lenta para la tecnología, el PNUD explicó que el agente de combustión lenta usado fue el hexabromociclododecano (HBCD). Los tableros de espuma de poliestireno extruido fabricados con CO2, formiato de metilo y etanol necesitaban cinco veces más de agente de combustión lenta que los que usaban la tecnología con HCFC, con lo cual los costos del producto se incrementaban en un 20 %. Esto se añade a los CEA que se calculan en la tabla 1 y que sólo tuvieron en cuenta el agente espumante.
12. Al ofrecer más detalles sobre las principales exigencias y dificultades para que otras empresas adopten esta tecnología en países del Artículo 5, el PNUD explicó lo siguiente:
a) En China, la tecnología pudo usarse para aplicaciones de espumas de poliestireno extruido cuando la exigencia de seguridad no era muy estricta (p. ej., aislamiento de carreteras, vías férreas y zonas de tráfico contra la congelación y otras aplicaciones de ingeniería civil). En otros países del Artículo 5 los usos dependerían de sus exigencias en materia de seguridad para los materiales de construcción;
b) La tecnología podría usarse a gran altitud. En los países de baja altitud la tecnología se podría aplicar usando cisternas a presión para el transporte y el almacenamiento, debido al bajo punto de ebullición del formiato de metilo (32°C). Dado que estas medidas
UNEP/OzL.Pro/ExCom/73/17/Add.1
4
adicionales incrementan los costos, muchas de las empresas de espumas de poliestireno extruido a las que ayuda el plan de gestión de la eliminación de los HCFC en China —incluida la segunda línea de Feininger— han preferido convertirse al CO2 y al etanol en vez de al CO2 y al formiato de metilo. Otras razones para elegir el etanol con respecto al formiato de metilo son su accesibilidad y que la materia auxiliar para la tecnología ha sido bien estudiada y ha alcanzado un grado de madurez en el país; y
c) Actualmente, el costo del equipo y el de transformación por razones de seguridad para la tecnología con CO2 y formiato de metilo son mayores que el de la tecnología con HCFC. Cuando la tecnología haya madurado, si el costo disminuye, será posible usarla en pequeñas y medianas empresas (PyME).
13. Tras tratar todos los comentarios planteados por la Secretaría, el PNUD examinó el informe final del proyecto de demostración en consecuencia.
Recomendación de la Secretaría 14. El Comité Ejecutivo podría considerar oportuno:
a) Tomar nota del informe final sobre el proyecto de demostración para la conversión de la tecnología con HCFC-22/HCFC-142b a la tecnología con CO2 y coespumante de formiato de metilo como coespumante, en la fábrica de espuma de poliestireno extruido en Feininger (Nanjing) Energy Saving Technology Co. Ltd., en China, presentado por el PNUD y recogido en el documento UNEP/OzL.Pro/ExCom/73/17/Add.1; y
b) Solicitar a los organismos bilaterales y de ejecución que consideren el informe del PNUD sobre la tecnología de CO2 y el formiato de metilo como coespumante en la fabricación de espuma de poliestireno extruido, conjuntamente con la información y otras alternativas, cuando ayuden a los países del Artículo 5 a preparar proyectos para la eliminación de los HCFC en las aplicaciones de espuma de poliestireno extruido.
China: Informe final sobre el proyecto de demostración para la conversión del HCFC-22 al propano en las empresas Midea Room Air Conditioner Manufacturer Company y Guangdong Meizhi Co. Antecedentes 15. ONUDI ha presentado a la 73ª reunión el informe final para proyectos de demostración para la conversión, en la fabricación de aparatos para la climatización de habitaciones y de compresores, desde el HCFC-22 al propano (HC-290), en las empresas Midea Room Air Conditioner Manufacturer Company (Midea) y Guangdong Meizhi Co., respectivamente. Los proyectos de demostración se realizaron para validar el uso del HC-290 como refrigerante en la fabricación de aparatos para la climatización de habitaciones y de compresores. El informe completo se encuentra en el anexo II del presente documento.
Conversión de la línea de producción de aparatos de climatización en Midea Informe sobre la marcha de las actividades 16. La conversión de la línea de producción en Midea ya ha terminado. Se realizó la inspección de seguridad de los productos y se concedió la aceptación nacional. La autoridad encargada de la certificación en China ha certificado la congruencia de los aparatos de climatización de habitaciones basados en el HC-290 con la norma nacional GB4706.32, que permite el uso de refrigerante inflamable en los productos para la climatización de habitaciones en el mercado local. Los aparatos de climatización de

UNEP/OzL.Pro/ExCom/73/17/Add.1
5
habitaciones basados en el HC-290 también recibieron certificados de organismos internacionales de certificación.
Aplicabilidad técnica y rendimiento del producto 17. Se desarrollaron y prepararon para la producción en masa dos tipos de unidades basadas en el HC-290 (unidad de frecuencia variable y unidad portátil) y seis modelos. En el informe se llega a la conclusión de que el HC-290 se considera un sustituto ideal para el HCFC-22 en el sector de fabricación de aparatos de climatización para habitaciones. El desempeño de los aparatos de climatización para habitaciones basados en el HC-290 ha cumplido con las exigencias de las normas nacionales e internacionales. El desempeño de los modelos portátiles es entre un 15 % y un 19 % superior al de las unidades R-410A y el de los modelos con dos bloques es comparable al de las unidades HFC-410A. Sobre la base de las pruebas realizadas por Midea, el rendimiento energético de los aparatos de climatización para habitaciones basados en HC-290 es entre un 5 % y un 12 % superior al de las unidades basadas en HCFC-22.
18. Para resolver el problema de la inflamabilidad del HC-290 se redujo el tamaño de la carga de refrigerante. Se agregaron al producto características de seguridad, tales como la detección y la contención de fugas, para evitar que las fugas de refrigerante alcanzaran límites explosivos. Otras medidas de seguridad han de ser mejoradas en el almacenamiento, transporte, instalación y servicio y mantenimiento de los aparatos en los locales de los clientes para que sea posible una comercialización total del producto.
Costos adicionales 19. Los costos adicionales de capital (CAC) para la fabricación de aparatos de climatización para habitaciones se presentaron en la 71ª reunión y no cambiaron en el informe final. Los CAC constaban principalmente de los siguientes componentes: equipo de proceso del intercambiador de calor (62,08 %), equipo para la conversión de la línea de montaje, que incluye el almacenamiento y la alimentación con HC-290, la detección y pruebas de fugas, la máquina de vacío, la ventilación y otras medidas de seguridad para la zona de trabajo (29,74 %) y el equipo de pruebas de desempeño de la explotación (8,18 %).
20. El costo adicional de explotación (CAE) es de 41,95 $EUA por unidad para la fabricación de una unidad de dos bloques basada en HC-290. El incremento se debe principalmente al detector electrónico de fugas (16,33 $EUA) y a la instalación (21,31 $EUA), dadas las exigencias en materia de seguridad. El informe señaló que el alto CAE está relacionado con la creación del nuevo producto y se espera que disminuya en el futuro.
Conversión de la línea de producción de compresores en Guangdong Meizhi Co. Informe sobre la marcha de las actividades 21. La conversión de la línea de producción se terminó en junio de 2013. Se instaló y probó todo el equipo y las instalaciones de laboratorio. La línea ha estado en pruebas de producción. Se diseñaron dos tipos (de frecuencia fija y variable) y tres modelos de compresores. Se probó un prototipo que cumplió todas las exigencias de la norma nacional de China. La puesta en servicio final de la línea de producción convertida está prevista para noviembre de 2014.

UNEP/OzL.Pro/ExCom/73/17/Add.1
6
Aplicabilidad técnica y rendimiento del producto 22. El rendimiento del compresor basado en HC-290 es coherente con las normas nacionales e internacionales y ha sido certificado por las autoridades correspondientes. Sobre la base de la prueba realizada por Guangdong Meizhi Co., la eficiencia energética del compresor basado en HC-290 es de un 2 % a un 5 % superior a la del compresor basado en HCFC-22.
Costo adicional 23. Los datos sobre los CAC para la fabricación del compresor se presentaron a la 71ª reunión y se actualizaron, con un ligero aumento (694 $EUA), en el informe final. Los CAC se deben principalmente al costo del equipo para la conversión de la línea de montaje (89,46 %), a la asistencia técnica, que incluye el diseño, la consulta de expertos y las pruebas (8,39 %), y a las pruebas de producción y a la capacitación del personal (2,15 %). Los datos de los CAE presentados en esta reunión en el informe final son de 7,57 $EUA por unidad. Los CAE no fueron financiados.
Comentarios de la Secretaría 24. Los proyectos de demostración para la fabricación de aparatos de climatización para habitaciones fueron esenciales para el perfeccionamiento de la unidad con HC-290 y el uso de la tecnología en el sector de los aparatos de climatización para habitaciones en China. Esto ha permitido constituir una base para la estrategia de eliminación del plan de eliminación del sector de los aparatos de climatización para habitaciones en China. A raíz de los resultados de los proyectos de demostración, la mayoría de los fabricantes de aparatos de climatización para habitaciones han puesto en marcha actividades de investigación y desarrollo y de conversión, usando para ello la tecnología HC-290. Como se indica en el informe sobre la marcha de las actividades para el tercer tramo del sector de los aparatos de climatización para habitaciones1, se convirtieron a la tecnología HC-290 13 líneas de producción para la fabricación de aparatos de climatización para habitaciones y 3 líneas de producción para la fabricación de compresores. Se están llevando a cabo otras actividades de investigación y desarrollo sobre la aplicación del HC-290 en el contexto de la ejecución del plan de gestión de la eliminación de HCFC. Se espera que, con el apoyo de las actividades de asistencia técnica, más fabricantes del sector de los aparatos de climatización para habitaciones opten por el HC-290 como tecnología alternativa para la eliminación de los HCFC.
25. La Secretaría señaló que durante la conversión se produjo una amplia optimación y se preguntó hasta qué punto contribuyó esto a la mejora de la eficiencia. ONUDI informó que la optimación de los sistemas a menudo era necesaria en las conversiones en el campo de la fabricación de equipos de refrigeración. En el caso del proyecto de demostración, la mejora de la eficiencia se debió principalmente a la optimación de sistemas realizada mediante investigación y desarrollo por Midea y Guangdong Meizhi Co. en los últimos años. Estas optimaciones fueron necesarias para compensar los efectos que las restricciones en la carga de refrigerante tienen en el rendimiento energético de las unidades de climatización para habitaciones basadas en HC-290 con el fin de cumplir con las normas. El cambio de refrigerante únicamente, para pasar del HCFC-22 al HC-290, podría haber producido un rendimiento peor en comparación con la unidad basada en HCFC-22. Se podría mejorar aún más la eficiencia si se rebajaran las restricciones sobre el tamaño de la carga en las normas internacionales.
1 Informe sobre la marcha de las actividades de la etapa I del plan de gestión de la eliminación de HCFC para el
sector de los aparatos de climatización para habitaciones en China, recogido en el documento UNEP/OzL.Pro/ExCom/73/35, párrafo 76.
UNEP/OzL.Pro/ExCom/73/17/Add.1
7
Conversión de la línea de producción de aparatos de climatización en Midea 26. Aunque los CAE calculados son altos (41,95 $EUA por unidad), la Secretaría señaló que en el cálculo no se ha tenido en cuenta el ahorro energético. ONUDI indicó que la mejora de la eficiencia energética no está relacionada directamente con los CAE. El ahorro va en beneficio de los usuarios finales. Los clientes pueden preferir un producto con mayor eficiencia energética incluso si el precio es superior, pero esto no reducirá el costo del equipo. En esta etapa es difícil cuantificar el beneficio que supone la mejora de la eficiencia energética en el cálculo de los CAE.
27. La Secretaría también señaló que los CAE también incluían el costo adicional de la instalación (21,31 $EUA por unidad), que no forma parte del costo de producción. Si se excluye el costo de instalación, los CAE son de 20,64 $EUA por unidad. Asimismo, los CAE actuales para la unidad de HC-290 se basan en la producción en serie y es muy probable que disminuyan cuando empiece la producción completa y se consolide la tecnología. Actualmente Midea y Guangdong Meizhi Co. prosiguen con la investigación para simplificar aún más las medidas de seguridad, tales como la eliminación de la fuente de ignición en vez de instalar detectores de fugas en las unidades. Dado que los CAE notificados no reflejan plenamente los CAE reales del nuevo producto, ONUDI aceptó seguir supervisando el proyecto y notificar a la 75ª reunión la información sobre los CAE en la fabricación de compresores y aparatos de climatización con HC-290, mediante el informe sobre la marcha de las actividades del sector de los aparatos de climatización para habitaciones del plan de gestión de la eliminación de HCFC de China.
28. La Secretaría preguntó sobre las condiciones ambientales designadas para los modelos desarrollados actuales y si estos modelos se podrían usar con temperaturas ambiente altas. ONUDI aclaró que todos los productos del proyecto de demostración fueron diseñados para una gama de temperaturas entre 18°C y 43°C. Tras la terminación del proyecto de demostración, Guangdong Meizhi Co. ha fabricado compresores para temperaturas entre 21°C y 52°C, para regiones más calurosas. La próxima etapa será diseñar unidades de climatización para habitaciones para estas condiciones.
29. La principal dificultad vigente para la comercialización total de las unidades con HC-290 sigue siendo la falta de normas pertinentes. Como se indica en el informe sobre la marcha de las actividades del tercer tramo del plan del sector de los aparatos de climatización para habitaciones2, el Gobierno de China ha empezado a elaborar las tres normas siguientes: códigos técnicos de seguridad para el uso de refrigerantes inflamables en la industria de fabricación de aparatos de climatización domésticos y similares; requisitos para el transporte de aparatos de climatización para habitaciones cargados con refrigerantes inflamables y códigos técnicos de seguridad para el servicio y mantenimiento de equipos que usan refrigerantes inflamables. La adopción de estas normas está prevista para 2015. El estado de elaboración de estas normas se notifica en el informe sobre la marcha de las actividades del plan del sector de los aparatos de climatización para habitaciones de China3.
Conversión de la línea de producción de compresores en Guangdong Meizhi Co. 30. En respuesta a una pregunta sobre la elección de lubricante, ONUDI informó que el HC-290 puede disolverse bien en todos los lubricantes corrientes, incluso en el aceite mineral, el aceite de alquibenceno, el aceite de polioléster y otros lubricantes de fuerte polaridad. Las propiedades del nuevo lubricante para el HC-290 son distintas de los lubricantes que se emplean tradicionalmente con el HCFC-22, lo cual entraña también la modificación de la construcción del compresor.
2 Informe sobre la marcha de las actividades de la etapa I del plan de gestión de la eliminación de HCFC para el
sector de los aparatos de climatización para habitaciones en China, recogido en el documento UNEP/OzL.Pro/ExCom/73/35, párrafo 79. 3 Ibid.
UNEP/OzL.Pro/ExCom/73/17/Add.1
8
Recomendaciones de la Secretaría 31. El Comité Ejecutivo podría considerar oportuno:
a) Tomar nota del informe final sobre el proyecto de demostración para la conversión del HCFC-22 al propano en Midea Room Air Conditioner Manufacturer Company y en Guangdong Meizhi Co., en China, presentado por ONUDI y que se recoge en el documento UNEP/OzL.Pro/ExCom/73/17/Add.1;
b) Solicitar a los organismos bilaterales y de ejecución que consideren la información que se recoge en el informe cuando ayuden a países del Artículo 5 a preparar proyectos para la eliminación del HCFC-22 en el sector de la fabricación de aparatos de climatización para habitaciones; y
c) Solicitar a ONUDI que siga supervisando el proyecto de demostración y notifique a la 75ª reunión los costos adicionales de explotación relativos a los compresores y aparatos de climatización basados en HC-290, por medio del informe sobre la marcha de las actividades del plan del sector de fabricación de aparatos de climatización para habitaciones del plan de gestión de la eliminación de HCFC de China.
China: Informe sobre el proyecto de demostración para la conversión desde la tecnología basada en HCFC-141b a la tecnología con isoparafina y siloxano (KC-6) para la limpieza en la fabricación de dispositivos médicos en la empresa Zhejiang Kindly Medical Devices Co. Ltd. Antecedentes 32. En su 64a reunión, el Comité Ejecutivo aprobó para China el proyecto de demostración para la conversión de la tecnología basada en HCFC-141b a la tecnología con isoparafina y siloxano (KC-6) en Zhejiang Kindly Medical Devices Co. Ltd (KDL). KDL es una empresa especializada en la fabricación de dispositivos médicos desechables, particularmente diversos tipos de juegos de agujas, cánulas y microperfusores desechables. En 2009 la producción de la empresa representó alrededor del 45 % de la producción nacional de estos productos. El proyecto fue aprobado dentro del plan sectorial de solventes del plan de gestión de la eliminación de los HCFC en China. El proyecto de demostración pretendía establecer la idoneidad de la tecnología con KC-6 como sustituto viable para el HCFC-141b como solvente en la fabricación de dispositivos médicos. Se esperaba que la información recogida en el proyecto de demostración podría usarse para la conversión de otras empresas del sector de los solventes. El PNUD ha presentado a la 73ª reunión el informe final del proyecto de demostración. El informe completo se encuentra en el anexo III del presente documento.
Avances 33. Las actividades del proyecto fueron el diseño del proyecto, la instalación y modificación del equipo, la conversión de la línea de montaje, las pruebas y la evaluación del rendimiento y la capacitación. Se instaló equipo de seguridad adicional y se realizaron modificaciones o ajustes en el proceso de producción para tratar de resolver la inflamabilidad del KC-6. Todas las actividades del proyecto para la conversión se terminaron a finales de 2013. La línea de producción está en producción comercial. El proyecto logró la aprobación nacional en diciembre de 2013. Como consecuencia de la conversión, se han eliminado 27,82 toneladas métricas (tm) de HCFC-141b.
UNEP/OzL.Pro/ExCom/73/17/Add.1
9
Idoneidad y rendimiento de la tecnología 34. El proyecto de demostración puso de manifiesto que el KC-6 tenía buenas propiedades como solvente para el aceite de silicona y que el componente con aceite de silicona mostró buena calidad de recubrimiento sobre la superficie de los dispositivos médicos. Se realizó una serie de pruebas para evaluar el desempeño de las agujas fabricadas con el KC-6 como solvente. Los resultados mostraron que la calidad de limpieza y la durabilidad del producto responden a las exigencias de los productos. El desempeño en cuanto a fuerza de perforación es ligeramente mejor que con HCFC-141b. También se probaron la biocompatibilidad y la compatibilidad con fármacos y los resultados respondieron a las normas nacionales. La idoneidad de la tecnología KC-6 como sustituto viable del HCFC-141b como solvente en la fabricación de agujas ha quedado establecida.
35. El KC-6 también tiene buen desempeño medioambiental. Además de no contener ninguna SAO y de su potencial de calentamiento de la atmósfera inferior a 20, también tiene un punto de ebullición y una estabilidad química superiores a los del HCFC-141b. Esto permite una gestión más fácil de la reducción de emisiones y genera menos consumo.
Costo adicional 36. El costo adicional de capital global de 360 005 $EUA de la conversión es similar a la cantidad aprobada de 352 051 $EUA, con ciertas variaciones en algunos costos. En promedio, el costo total de la conversión es 2 % superior al aprobado. El costo adicional de explotación de 205 616 $EUA ha sido entregado a la empresa. El precio del KC-6 es de 6,8 $EUA/kg.
Comentarios de la Secretaría 37. La Secretaría preguntó por el impacto del proyecto de demostración en la eliminación de los HCFC en el sector de los solventes. El PNUD respondió que el proyecto de demostración ha contribuido al programa sectorial de eliminación ya que, ante los resultados del proyecto, seis empresas eligieron el KC-6 como tecnología alternativa y firmaron contratos para eliminar el consumo de HCFC-141b en la fabricación de dispositivos médicos. El consumo total de esas seis empresas asciende a 410 tm, que representan el 65 % de la eliminación total planificada para la etapa I del plan del sector de los solventes del plan de gestión de la eliminación de los HCFC de China. Dado que KDL es la mayor empresa de fabricación de agujas y tiene una fuerte capacidad de investigación y de desarrollo de tecnologías, muchos productores de dispositivos médicos dependen del papel preponderante de KDL en la elección de tecnologías. En julio de 2014 se organizó un taller para difundir la tecnología en el que KDL ofreció detalles sobre la conversión y expuso su experiencia en relación con la gestión del fluido de silicificación y con el funcionamiento de equipos optimizados para obtener productos cualificados.
38. La Secretaría se interesó por las principales dificultades habidas durante la conversión. El PNUD destacó la inflamabilidad del solvente y sugirió que debería tratarse de resolver este problema mediante el uso de material ignífugo, la ventilación del taller y la instalación de alarmas contra incendios y rociadores adecuados. También es necesario capacitar a los trabajadores para que la línea convertida funcione de manera segura.
39. La Secretaría también preguntó por los problemas de patente y de disponibilidad comercial del KC-6. El PNUD informó que KDL no dispone de patentes relacionadas con la aplicación del KC-6. Este producto ha sido creado por Beijing Aerospace Technology Innovation Co. Ltd. Sus principales componentes son la isoparafina y el siloxano, sustancias que se consiguen fácilmente en el mercado. El KC-6 puede comprarse en el mercado a un precio de 6,8 $EUA/kg frente a los 2,66 $EUA/kg del HCFC-141b.
UNEP/OzL.Pro/ExCom/73/17/Add.1
10
Recomendación de la Secretaría 40. El Comité Ejecutivo podría considerar oportuno:
a) Tomar nota del informe final sobre el proyecto de demostración para convertir la tecnología HCFC-141b en tecnología con isoparafina y siloxano (KC-6) en la empresa Zhejiang Kindly Medical Devices Co. Ltd., en China, presentado por el PNUD y recogido en el documento UNEP/OzL.Pro/ExCom/73/17/Add.1; y
b) Solicitar a los organismos bilaterales y de ejecución que consideren la información que se recoge en el informe cuando ayuden a países del Artículo 5 a preparar proyectos para la eliminación del HCFC-141b en aplicaciones para la limpieza de dispositivos médicos del sector de los solventes.
Mundial: Opciones de bajo costo para el uso de hidrocarburos (HC) en la fabricación de espumas de poliuretano. Una evaluación para la aplicación en proyectos del Fondo Multilateral. Antecedentes 41. En su 58ª reunión, el Comité Ejecutivo aprobó un proyecto para demostrar las opciones de bajo costo para el uso de HC como agentes espumantes en la fabricación de espumas de poliuretano en Egipto, a ejecutar por el PNUD (decisión 58/31).
42. El PNUD presentó a la 66ª reunión un informe4 en el que documentaba la ejecución del proyecto de demostración, que incluyó el perfeccionamiento del equipo, el perfeccionamiento del sistema y las pruebas a cargo de un proveedor de sistemas y la comunicación de información a través de un taller interregional para difundir los resultados, seguido por un informe final al Comité Ejecutivo. La demostración permitió verificar las propiedades físicas aceptables de los productos de espuma rígida para refrigeración comercial, de los tableros discontinuos y de las aplicaciones para calentar agua que usan sistemas basados en HC premezclados e inyección directa de HC. También se demostró que, para los sistemas basados en HC premezclados, al no necesitar un sistema de mezcla previo, cabe esperar un ahorro de costos de 100 000 $EUA en Egipto. Para la inyección directa, aunque no hay ahorro alguno en el costo del equipo, el diseño compacto podría entrañar ahorros en la disposición y el almacenamiento.
43. Al ser necesario dar más información sobre diversos aspectos, entre ellos la seguridad y los costos, el Comité Ejecutivo decidió, entre otras cosas, pedir al PNUD que finalice las demás investigaciones sobre cuestiones de seguridad, densidades y optimización del equipo; elabore más el concepto de ingresos y gastos sobre la base de los sistemas basados en HC premezclados; y presente un informe complementario en la 67ª reunión (decisión 66/15(s)).
Informe sobre la marcha de las actividades y plan de acción 44. El PNUD ha presentado a la 73ª reunión un informe provisional sobre la marcha de la ejecución de las actividades adicionales que se están llevando a cabo. El PNUD trabaja actualmente con SAIP, fabricante del equipo, en la optimización de la cabeza mezcladora del dosificador, y con un proveedor de sistemas en el estudio del posible efecto beneficioso de la densidad del ciclopentano premezclado centralmente o inyectado directamente.
45. SAIP ha perfeccionado una cabeza mezcladora optimizada de triple acción que se instaló en el dosificador prototipo existente. Las pruebas realizadas por el proveedor de sistemas confirmaron que había problemas con la densidad de la espuma, pero no se pudieron realizar más pruebas por las
4 UNEP/OzL.Pro/ExCom/66/17.
UNEP/OzL.Pro/ExCom/73/17/Add.1
11
dificultades técnicas con la cabeza mezcladora. Ésta fue modificada en octubre de 2014 para terminar la última serie de pruebas. Los resultados de estas pruebas serán analizados en noviembre y el informe final se presentará en la 74ª reunión.
Recomendación de la Secretaría 46. El Comité Ejecutivo podría considerar oportuno:
a) Tomar nota del informe complementario sobre la marcha de las actividades de ejecución del proyecto de demostración sobre opciones de bajo costo para el uso de hidrocarburos en la fabricación de espumas de poliuretano, presentado por el PNUD y recogido en el documento UNEP/OzL.Pro/ExCom/73/17/Add.1; y
b) Pedir al PNUD que presente el informe final del proyecto de demostración en la 74ª reunión.
PARTE V: INFORMES DE AUDITORIA PARA LOS SECTORES DE HALONES, PRODUCCIÓN DE CFC, ESPUMAS, AGENTE DE PROCESOS II, SOLVENTES Y SERVICIO Y MANTENIMIENTO DE LA REFRIGERACIÓN CON CFC EN CHINA
Antecedentes 47. En sus 56ª y 57ª reuniones, el Comité Ejecutivo decidió, entre otras cosas, seguir supervisando actividades y la utilización de los saldos de los proyectos tras la finalización de los acuerdos para los planes de los sectores de espumas y halones y de la producción de CFC y para los planes afines del sector de la eliminación acelerada en China5. El informe de auditoría financiera de los años 2011 y 2012 se presentó en la 71ª reunión. Entre otras cosas, el Comité Ejecutivo solicitó información adicional al Banco Mundial sobre los sectores de espumas y halones y sobre los presupuestos para el uso de los saldos en estos sectores y en el sector de la producción de CFC (decisión 71/12(b))6.
5 Con los procedimientos simplificados siguientes: a) China presentaría un plan de trabajo final para el sector de las espumas sobre las actividades planificadas y la financiación asociada. Cada plan de trabajo presentaría las actividades —y el presupuesto asociado— a realizar en 2009 y posteriormente, entendiéndose que China dispondría de flexibilidad para efectuar los ajustes necesarios en dichos planes, y no se le exigiría que presente planes de trabajo adicionales a menos que haya cambios mayores en ellos; b) China continuaría sujeta a auditorías financieras independientes, realizadas con motivo de los tres planes sectoriales, auditorías que se presentarían al Comité Ejecutivo anualmente desde 2009 y posteriormente; y c) El Banco Mundial facilitaría el examen y la presentación al Comité Ejecutivo de cualquier ajuste en los planes de trabajo y en los informes de las auditorías financieras y presentaría los informes de terminación de proyecto con los gastos finales de los fondos (decisión 56/13). En su 57a reunión, el Comité Ejecutivo aprobó el plan de trabajo para el sector de las espumas en China de 2010 a 2012 (decisión 57/14(c)(i)). 6 El Comité Ejecutivo decidió “Invitar al Gobierno de China a i) proporcionar un informe a la 72ª reunión a través del Banco Mundial para explicar por qué en el informe de auditoría correspondiente a 2012 se informaba de saldos superiores a los presupuestos aprobados en la 56ª y 57ª reuniones para los sectores de halones y espumas de poliuretano, y brindar la información solicitada en la decisión 65/10 i) ii) sobre la resolución del problema legal señalado en el informe de verificación a la 65ª reunión en relación con el transporte a los bancos de halones de los halones recuperados para ser reciclados; ii) a través del organismo de ejecución correspondiente, incorporar en los informes de auditoría financiera previstos en la decisión 56/13 los datos sobre todos los fondos provenientes del Fondo Multilateral que se encuentren en poder del Gobierno de China para su desembolso a los beneficiarios finales, con indicación de los intereses devengados sobre esos saldos, comprendidos los datos correspondientes al plan sectorial para el agente de procesos II, el plan sectorial para disolventes y el plan para servicio y mantenimiento de refrigeración; y iii) brindar información integral sobre los avances en los planes de trabajo para los planes

UNEP/OzL.Pro/ExCom/73/17/Add.1
12
48. Consecuentemente, el Banco Mundial, en nombre del Gobierno de China, presentó en la 72ª reunión un presupuesto para el saldo de los fondos de los sectores de producción de CFC, espuma de poliuretano y halones.
49. En su 72ª reunión, el Comité Ejecutivo consideró el informe de auditoría financiera para los planes de los sectores de halones, producción de CFC y espumas en China7 y decidió invitar al Gobierno de China, a través de los organismos de ejecución pertinentes, a presentar en la 73ª reunión los informes de las auditorías financieras para los sectores del agente de procesos II, solventes y servicio y mantenimiento de la refrigeración con CFC, así como los planes para los fondos restantes para los sectores de halones, producción de CFC, espumas, agente de procesos II, solventes y servicio y mantenimiento de la refrigeración con CFC, en los que debe describir cómo usará dichos fondos para actividades relacionadas con la eliminación de SAO, teniendo en cuenta que estos planes sectoriales deben terminarse a finales de 2018 (decisión 72/13(b)).
50. De conformidad con la decisión 72/13(b), el Gobierno de China presentó, a través de los organismos de ejecución pertinentes, la información solicitada, incluyendo en ella los informes de las auditorías financieras de cada uno de los planes sectoriales. Estos informes se recibieron únicamente entre el 14 y el 17 de octubre de 2014. Antes de esta presentación, la Secretaría fue informada por los organismos de una solicitud del Gobierno de China para presentar los informes después de la fecha prevista para la presentación de documentos a la Secretaría para su estudio en la 73ª reunión.
51. Este documento contiene lo siguiente:
a) Los presupuestos planificados e informes sobre la marcha de las actividades para el uso del saldo de los fondos para los sectores de halones, producción de CFC, espumas, agente de procesos II, solventes y servicio y mantenimiento de la refrigeración con CFC;
b) El informe de la auditoría financiera del Gobierno de China para los sectores mencionados anteriormente;
c) El interés generado a partir de los proyectos sectoriales; y
d) Los comentarios y recomendaciones de la Secretaría.
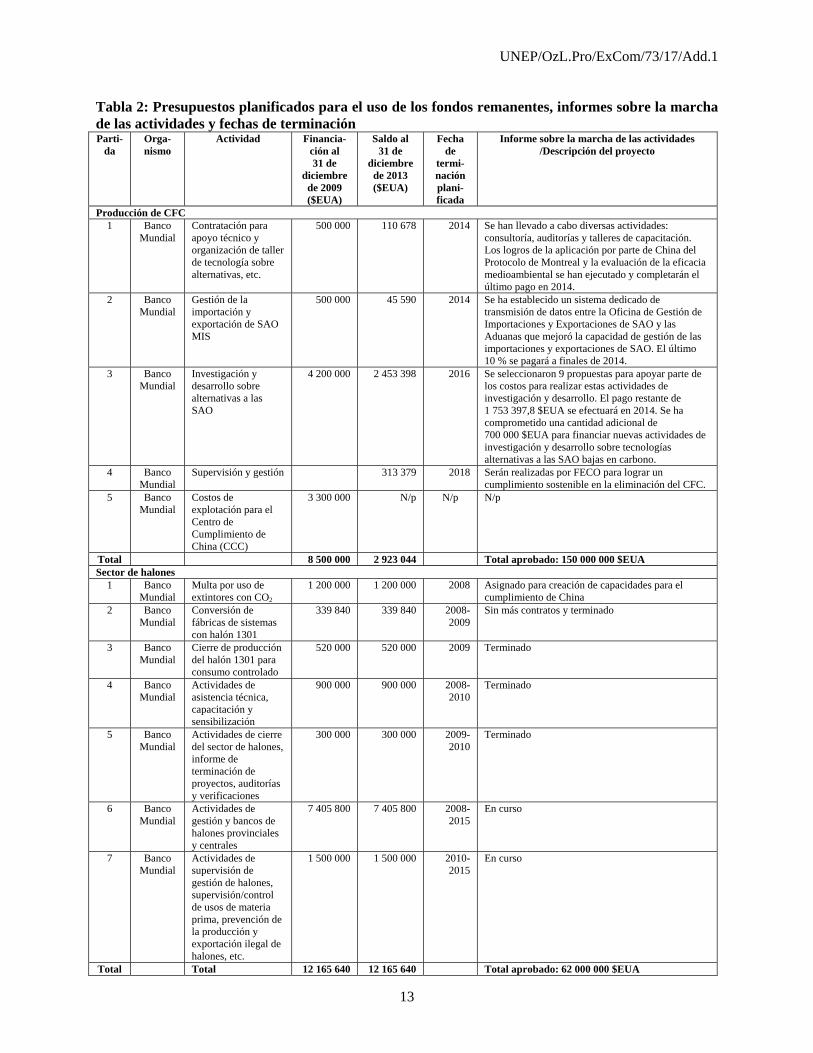
52. En la tabla 2 se presenta la información ofrecida en relación con las fechas de terminación previstas, informes sobre la marcha de las actividades o descripciones de proyectos para cada actividad, y la financiación al 31 de diciembre de 2009, tal y como se indica en esta o en documentación anterior.
sectoriales, proponiendo además la forma en que, a su juicio, deberían utilizarse los posibles saldos para la consideración del Comité Ejecutivo en su 72ª reunión”. 7 Parte VI del documento UNEP/OzL.Pro/ExCom/72/11/Add.1.
UNEP/OzL.Pro/ExCom/73/17/Add.1
13
Tabla 2: Presupuestos planificados para el uso de los fondos remanentes, informes sobre la marcha de las actividades y fechas de terminación Parti-
da Orga-nismo
Actividad Financia-ción al 31 de
diciembre de 2009 ($EUA)
Saldo al 31 de
diciembre de 2013 ($EUA)
Fecha de
termi-nación plani-ficada
Informe sobre la marcha de las actividades /Descripción del proyecto
Producción de CFC 1 Banco
Mundial Contratación para apoyo técnico y organización de taller de tecnología sobre alternativas, etc.
500 000 110 678 2014 Se han llevado a cabo diversas actividades: consultoría, auditorías y talleres de capacitación. Los logros de la aplicación por parte de China del Protocolo de Montreal y la evaluación de la eficacia medioambiental se han ejecutado y completarán el último pago en 2014.
2 Banco Mundial
Gestión de la importación y exportación de SAO MIS
500 000 45 590 2014 Se ha establecido un sistema dedicado de transmisión de datos entre la Oficina de Gestión de Importaciones y Exportaciones de SAO y las Aduanas que mejoró la capacidad de gestión de las importaciones y exportaciones de SAO. El último 10 % se pagará a finales de 2014.
3 Banco Mundial
Investigación y desarrollo sobre alternativas a las SAO
4 200 000 2 453 398 2016 Se seleccionaron 9 propuestas para apoyar parte de los costos para realizar estas actividades de investigación y desarrollo. El pago restante de 1 753 397,8 $EUA se efectuará en 2014. Se ha comprometido una cantidad adicional de 700 000 $EUA para financiar nuevas actividades de investigación y desarrollo sobre tecnologías alternativas a las SAO bajas en carbono.
4 Banco Mundial
Supervisión y gestión 313 379 2018 Serán realizadas por FECO para lograr un cumplimiento sostenible en la eliminación del CFC.
5 Banco Mundial
Costos de explotación para el Centro de Cumplimiento de China (CCC)
3 300 000 N/p N/p N/p
Total 8 500 000 2 923 044 Total aprobado: 150 000 000 $EUA Sector de halones
1 Banco Mundial
Multa por uso de extintores con CO2
1 200 000 1 200 000 2008 Asignado para creación de capacidades para el cumplimiento de China
2 Banco Mundial
Conversión de fábricas de sistemas con halón 1301
339 840 339 840 2008-2009
Sin más contratos y terminado
3 Banco Mundial
Cierre de producción del halón 1301 para consumo controlado
520 000 520 000 2009 Terminado
4 Banco Mundial
Actividades de asistencia técnica, capacitación y sensibilización
900 000 900 000 2008-2010
Terminado
5 Banco Mundial
Actividades de cierre del sector de halones, informe de terminación de proyectos, auditorías y verificaciones
300 000 300 000 2009-2010
Terminado
6 Banco Mundial
Actividades de gestión y bancos de halones provinciales y centrales
7 405 800 7 405 800 2008-2015
En curso
7 Banco Mundial
Actividades de supervisión de gestión de halones, supervisión/control de usos de materia prima, prevención de la producción y exportación ilegal de halones, etc.
1 500 000 1 500 000 2010-2015
En curso
Total Total 12 165 640 12 165 640 Total aprobado: 62 000 000 $EUA
UNEP/OzL.Pro/ExCom/73/17/Add.1
14
Parti-da
Orga-nismo
Actividad Financia-ción al 31 de
diciembre de 2009 ($EUA)
Saldo al 31 de
diciembre de 2013 ($EUA)
Fecha de
termi-nación plani-ficada
Informe sobre la marcha de las actividades /Descripción del proyecto
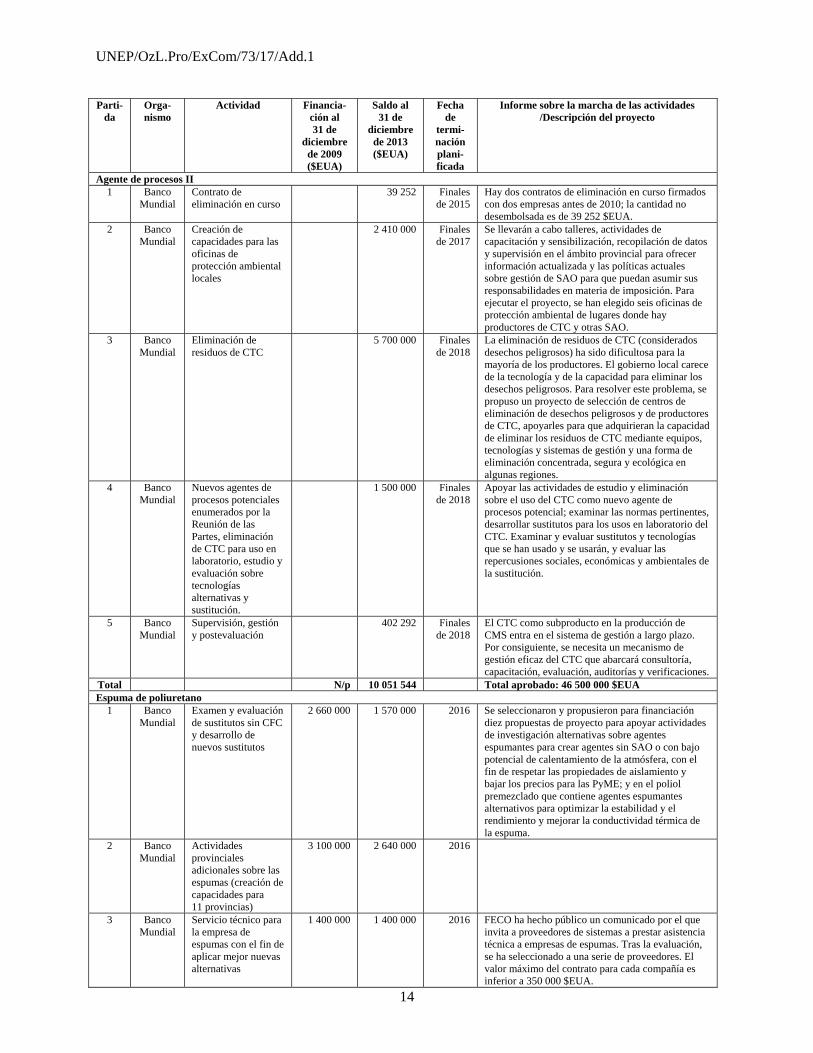
Agente de procesos II 1 Banco
Mundial Contrato de eliminación en curso
39 252 Finales de 2015
Hay dos contratos de eliminación en curso firmados con dos empresas antes de 2010; la cantidad no desembolsada es de 39 252 $EUA.
2 Banco Mundial
Creación de capacidades para las oficinas de protección ambiental locales
2 410 000 Finales de 2017
Se llevarán a cabo talleres, actividades de capacitación y sensibilización, recopilación de datos y supervisión en el ámbito provincial para ofrecer información actualizada y las políticas actuales sobre gestión de SAO para que puedan asumir sus responsabilidades en materia de imposición. Para ejecutar el proyecto, se han elegido seis oficinas de protección ambiental de lugares donde hay productores de CTC y otras SAO.
3 Banco Mundial
Eliminación de residuos de CTC
5 700 000 Finales de 2018
La eliminación de residuos de CTC (considerados desechos peligrosos) ha sido dificultosa para la mayoría de los productores. El gobierno local carece de la tecnología y de la capacidad para eliminar los desechos peligrosos. Para resolver este problema, se propuso un proyecto de selección de centros de eliminación de desechos peligrosos y de productores de CTC, apoyarles para que adquirieran la capacidad de eliminar los residuos de CTC mediante equipos, tecnologías y sistemas de gestión y una forma de eliminación concentrada, segura y ecológica en algunas regiones.
4 Banco Mundial
Nuevos agentes de procesos potenciales enumerados por la Reunión de las Partes, eliminación de CTC para uso en laboratorio, estudio y evaluación sobre tecnologías alternativas y sustitución.
1 500 000 Finales de 2018
Apoyar las actividades de estudio y eliminación sobre el uso del CTC como nuevo agente de procesos potencial; examinar las normas pertinentes, desarrollar sustitutos para los usos en laboratorio del CTC. Examinar y evaluar sustitutos y tecnologías que se han usado y se usarán, y evaluar las repercusiones sociales, económicas y ambientales de la sustitución.
5 Banco Mundial
Supervisión, gestión y postevaluación
402 292 Finales de 2018
El CTC como subproducto en la producción de CMS entra en el sistema de gestión a largo plazo. Por consiguiente, se necesita un mecanismo de gestión eficaz del CTC que abarcará consultoría, capacitación, evaluación, auditorías y verificaciones.
Total N/p 10 051 544 Total aprobado: 46 500 000 $EUA Espuma de poliuretano
1 Banco Mundial
Examen y evaluación de sustitutos sin CFC y desarrollo de nuevos sustitutos
2 660 000 1 570 000 2016 Se seleccionaron y propusieron para financiación diez propuestas de proyecto para apoyar actividades de investigación alternativas sobre agentes espumantes para crear agentes sin SAO o con bajo potencial de calentamiento de la atmósfera, con el fin de respetar las propiedades de aislamiento y bajar los precios para las PyME; y en el poliol premezclado que contiene agentes espumantes alternativos para optimizar la estabilidad y el rendimiento y mejorar la conductividad térmica de la espuma.
2 Banco Mundial
Actividades provinciales adicionales sobre las espumas (creación de capacidades para 11 provincias)
3 100 000 2 640 000 2016
3 Banco Mundial
Servicio técnico para la empresa de espumas con el fin de aplicar mejor nuevas alternativas
1 400 000 1 400 000 2016 FECO ha hecho público un comunicado por el que invita a proveedores de sistemas a prestar asistencia técnica a empresas de espumas. Tras la evaluación, se ha seleccionado a una serie de proveedores. El valor máximo del contrato para cada compañía es inferior a 350 000 $EUA.
UNEP/OzL.Pro/ExCom/73/17/Add.1
15
Parti-da
Orga-nismo
Actividad Financia-ción al 31 de
diciembre de 2009 ($EUA)
Saldo al 31 de
diciembre de 2013 ($EUA)
Fecha de
termi-nación plani-ficada
Informe sobre la marcha de las actividades /Descripción del proyecto
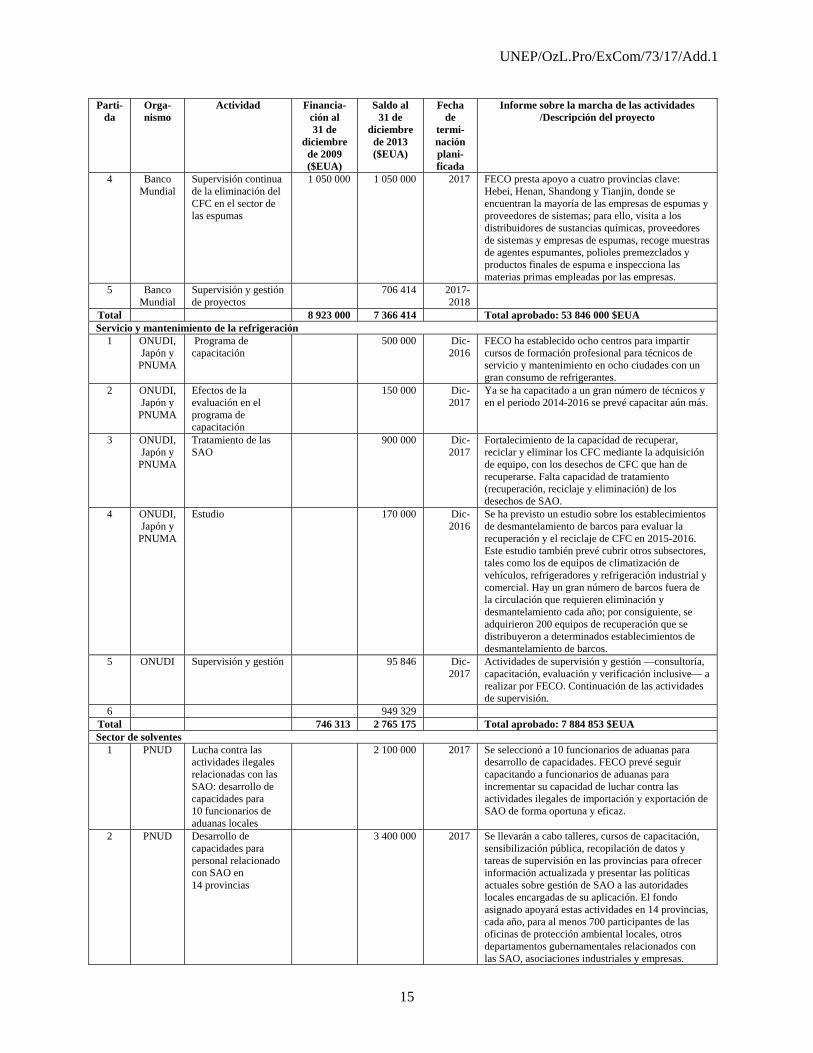
4 Banco Mundial
Supervisión continua de la eliminación del CFC en el sector de las espumas
1 050 000 1 050 000 2017 FECO presta apoyo a cuatro provincias clave: Hebei, Henan, Shandong y Tianjin, donde se encuentran la mayoría de las empresas de espumas y proveedores de sistemas; para ello, visita a los distribuidores de sustancias químicas, proveedores de sistemas y empresas de espumas, recoge muestras de agentes espumantes, polioles premezclados y productos finales de espuma e inspecciona las materias primas empleadas por las empresas.
5 Banco Mundial
Supervisión y gestión de proyectos
706 414 2017-2018
Total 8 923 000 7 366 414 Total aprobado: 53 846 000 $EUA Servicio y mantenimiento de la refrigeración
1 ONUDI, Japón y
PNUMA
Programa de capacitación
500 000 Dic-2016
FECO ha establecido ocho centros para impartir cursos de formación profesional para técnicos de servicio y mantenimiento en ocho ciudades con un gran consumo de refrigerantes.
2 ONUDI, Japón y
PNUMA
Efectos de la evaluación en el programa de capacitación
150 000 Dic-2017
Ya se ha capacitado a un gran número de técnicos y en el periodo 2014-2016 se prevé capacitar aún más.
3 ONUDI, Japón y
PNUMA
Tratamiento de las SAO
900 000 Dic-2017
Fortalecimiento de la capacidad de recuperar, reciclar y eliminar los CFC mediante la adquisición de equipo, con los desechos de CFC que han de recuperarse. Falta capacidad de tratamiento (recuperación, reciclaje y eliminación) de los desechos de SAO.
4 ONUDI, Japón y
PNUMA
Estudio 170 000 Dic-2016
Se ha previsto un estudio sobre los establecimientos de desmantelamiento de barcos para evaluar la recuperación y el reciclaje de CFC en 2015-2016. Este estudio también prevé cubrir otros subsectores, tales como los de equipos de climatización de vehículos, refrigeradores y refrigeración industrial y comercial. Hay un gran número de barcos fuera de la circulación que requieren eliminación y desmantelamiento cada año; por consiguiente, se adquirieron 200 equipos de recuperación que se distribuyeron a determinados establecimientos de desmantelamiento de barcos.
5 ONUDI Supervisión y gestión 95 846 Dic-2017
Actividades de supervisión y gestión —consultoría, capacitación, evaluación y verificación inclusive— a realizar por FECO. Continuación de las actividades de supervisión.
6 949 329 Total 746 313 2 765 175 Total aprobado: 7 884 853 $EUA Sector de solventes
1 PNUD Lucha contra las actividades ilegales relacionadas con las SAO: desarrollo de capacidades para 10 funcionarios de aduanas locales
2 100 000 2017 Se seleccionó a 10 funcionarios de aduanas para desarrollo de capacidades. FECO prevé seguir capacitando a funcionarios de aduanas para incrementar su capacidad de luchar contra las actividades ilegales de importación y exportación de SAO de forma oportuna y eficaz.
2 PNUD Desarrollo de capacidades para personal relacionado con SAO en 14 provincias
3 400 000 2017 Se llevarán a cabo talleres, cursos de capacitación, sensibilización pública, recopilación de datos y tareas de supervisión en las provincias para ofrecer información actualizada y presentar las políticas actuales sobre gestión de SAO a las autoridades locales encargadas de su aplicación. El fondo asignado apoyará estas actividades en 14 provincias, cada año, para al menos 700 participantes de las oficinas de protección ambiental locales, otros departamentos gubernamentales relacionados con las SAO, asociaciones industriales y empresas.
UNEP/OzL.Pro/ExCom/73/17/Add.1
16
Parti-da
Orga-nismo
Actividad Financia-ción al 31 de
diciembre de 2009 ($EUA)
Saldo al 31 de
diciembre de 2013 ($EUA)
Fecha de
termi-nación plani-ficada
Informe sobre la marcha de las actividades /Descripción del proyecto
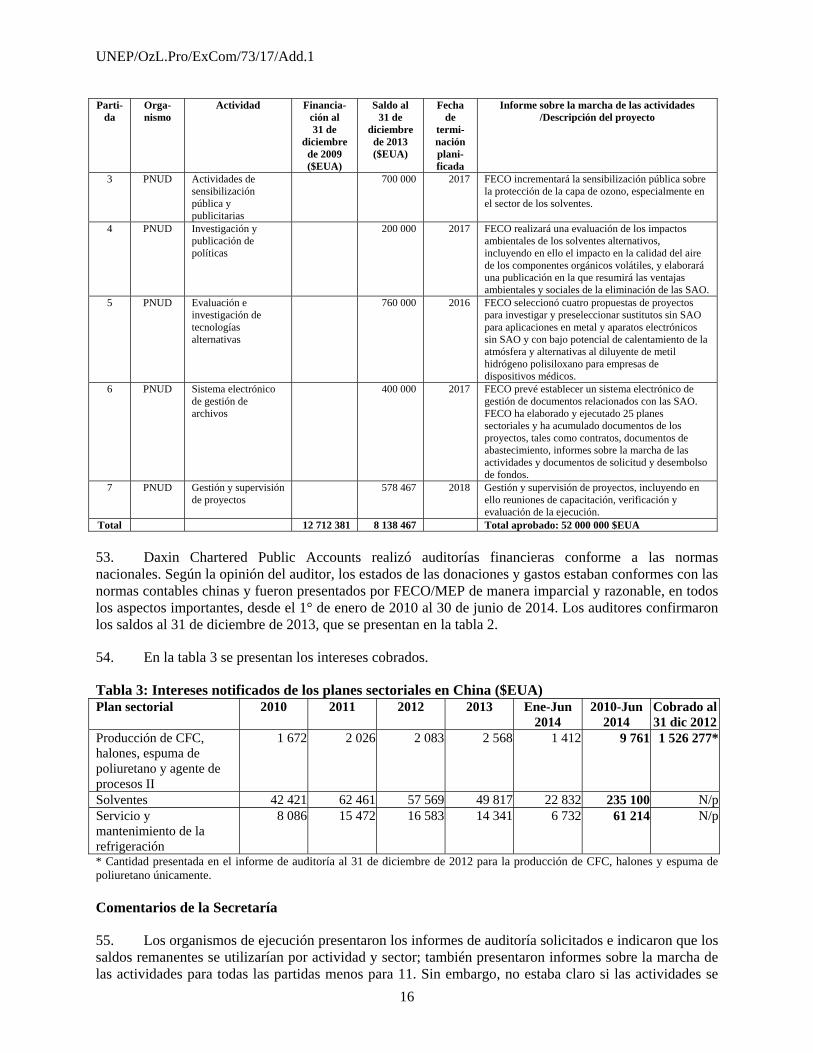
3 PNUD Actividades de sensibilización pública y publicitarias
700 000 2017 FECO incrementará la sensibilización pública sobre la protección de la capa de ozono, especialmente en el sector de los solventes.
4 PNUD Investigación y publicación de políticas
200 000 2017 FECO realizará una evaluación de los impactos ambientales de los solventes alternativos, incluyendo en ello el impacto en la calidad del aire de los componentes orgánicos volátiles, y elaborará una publicación en la que resumirá las ventajas ambientales y sociales de la eliminación de las SAO.
5 PNUD Evaluación e investigación de tecnologías alternativas
760 000 2016 FECO seleccionó cuatro propuestas de proyectos para investigar y preseleccionar sustitutos sin SAO para aplicaciones en metal y aparatos electrónicos sin SAO y con bajo potencial de calentamiento de la atmósfera y alternativas al diluyente de metil hidrógeno polisiloxano para empresas de dispositivos médicos.
6 PNUD Sistema electrónico de gestión de archivos
400 000 2017 FECO prevé establecer un sistema electrónico de gestión de documentos relacionados con las SAO. FECO ha elaborado y ejecutado 25 planes sectoriales y ha acumulado documentos de los proyectos, tales como contratos, documentos de abastecimiento, informes sobre la marcha de las actividades y documentos de solicitud y desembolso de fondos.
7 PNUD Gestión y supervisión de proyectos
578 467 2018 Gestión y supervisión de proyectos, incluyendo en ello reuniones de capacitación, verificación y evaluación de la ejecución.
Total 12 712 381 8 138 467 Total aprobado: 52 000 000 $EUA
53. Daxin Chartered Public Accounts realizó auditorías financieras conforme a las normas nacionales. Según la opinión del auditor, los estados de las donaciones y gastos estaban conformes con las normas contables chinas y fueron presentados por FECO/MEP de manera imparcial y razonable, en todos los aspectos importantes, desde el 1° de enero de 2010 al 30 de junio de 2014. Los auditores confirmaron los saldos al 31 de diciembre de 2013, que se presentan en la tabla 2.
54. En la tabla 3 se presentan los intereses cobrados.
Tabla 3: Intereses notificados de los planes sectoriales en China ($EUA) Plan sectorial 2010 2011 2012 2013 Ene-Jun
2014 2010-Jun
2014 Cobrado al 31 dic 2012
Producción de CFC, halones, espuma de poliuretano y agente de procesos II
1 672 2 026 2 083 2 568 1 412 9 761 1 526 277*
Solventes 42 421 62 461 57 569 49 817 22 832 235 100 N/pServicio y mantenimiento de la refrigeración
8 086 15 472 16 583 14 341 6 732 61 214 N/p
* Cantidad presentada en el informe de auditoría al 31 de diciembre de 2012 para la producción de CFC, halones y espuma de poliuretano únicamente. Comentarios de la Secretaría
55. Los organismos de ejecución presentaron los informes de auditoría solicitados e indicaron que los saldos remanentes se utilizarían por actividad y sector; también presentaron informes sobre la marcha de las actividades para todas las partidas menos para 11. Sin embargo, no estaba claro si las actividades se

UNEP/OzL.Pro/ExCom/73/17/Add.1
17
habían iniciado. Se ha pedido información de los informes sobre la marcha de las actividades para estas partidas, incluyendo la resolución de la cuestión jurídica indicada en el informe de verificación presentado a la 65ª reunión sobre la aptitud para transportar halones recuperados a los bancos de halones para tareas de recuperación y reciclaje (conforme a la decisión 65/10(i)(ii)).
56. Las actividades terminadas tuvieron un saldo remanente de 1 452 090 $EUA, pero no se presentó información sobre la forma en que se usarían estos fondos. En el informe de auditoría presentado a esta reunión no se dieron los intereses devengados y, por consiguiente, se han solicitado para los sectores del agente de procesos II, servicio y mantenimiento de la refrigeración y solventes.
57. En la tabla 4 se presenta información sobre los saldos actualizados e intereses acumulados para los planes sectoriales del Banco Mundial y los planes del sector de servicio y mantenimiento de la refrigeración. El nivel de los intereses acumulados por el sector de servicio y mantenimiento de la refrigeración supera considerablemente el notificado para los planes sectoriales del Banco aunque los planes sectoriales del Banco tuvieron saldos actualizados mayores.
Tabla 4: Saldos actualizados e intereses cobrados para los planes sectoriales ejecutados por el Banco Mundial y el sector de servicio y mantenimiento de la refrigeración
Partida Acumulativo 31 dic 2009
($EUA)
2010 ($EUA)
2011 ($EUA)
2012 ($EUA)
2013 ($EUA)
Ene-Jun 2014 ($EUA)
Acumulativo($EUA)
Saldo actualizado (todos los sectores del Banco)
59 063 212 49 003 536 44 313 004 39 088 842 35 864 676 32 548 865
Intereses (Banco Mundial)
N/p 1 672 2 026 2 083 2 568 1 412 9 761
Saldo actualizado (servicio y mantenimiento de la refrigeración)
746 313 2 469 519 3 112 783 3 143 117 2 814 062 2 765 175
Intereses (ONUDI, Japón y PNUMA)
N/p 8 086 15 472 16 583 14 341 6 732 61 214
58. El Comité Ejecutivo será informado en la 73ª reunión sobre la información adicional que han de presentar los organismos de ejecución pertinentes en respuesta a las preguntas planteadas por la Secretaría.
Recomendaciones de la Secretaría
59. El Comité Ejecutivo puede considerar oportuno:
a) Tomar nota, con beneplácito, de los informes de las auditorías financieras, planes de trabajo e informes sobre la marcha de las actividades presentados para los sectores de producción de CFC, halones, espuma de poliuretano, agente de procesos II, servicio y mantenimiento de refrigeración y solventes en China, que se recoge en el documento UNEP/OzL.Pro/ExCom/73/17/Add.1;

UNEP/OzL.Pro/ExCom/73/17/Add.1
18
b) Solicitar al Gobierno de China y a los organismos bilaterales y de ejecución pertinentes que:
i) Presenten, a más tardar el 31 de diciembre de 2018, informes anuales sobre la marcha de las actividades, informes de auditoría e intereses devengados durante la ejecución de la producción de CFC, halones, espuma de poliuretano, agente de procesos II, sector de servicio y mantenimiento de la refrigeración y planes sectoriales de solventes, hasta la terminación de todas las actividades asociadas planificadas; y
ii) Presenten al Comité Ejecutivo, a más tardar en la primera reunión de 2019, informes de terminación de proyectos de producción de CFC, halones, espuma de poliuretano, agente de procesos II, sector de servicio y mantenimiento de la refrigeración y planes sectoriales de solventes.
PARTE VI: PLANES NACIONALES DE ELIMINACIÓN DE CFC
República Islámica de Irán: Ejecución del plan nacional de eliminación de CFC: componente político y reglamentario
Antecedentes
60. En su 41ª reunión (diciembre de 2003), el Comité Ejecutivo aprobó la cantidad de 100 000 $EUA, más los gastos de apoyo al organismo para el PNUMA, para la ejecución del componente político y reglamentario del plan nacional de eliminación de CFC de la República Islámica de Irán (IRA/PHA/41/TAS/161). En septiembre de 2004 el PNUMA firmó un memorando de entendimiento con el Gobierno para ejecutar estas actividades y transfirió un total de 90 000 $EUA para ello. Aunque todas estas actividades se ejecutaron, sólo 30 000 $EUA de los 90 000 $EUA transferidos fueron contabilizados por el Gobierno.
Comentarios de la Secretaría
61. El PNUMA ha presentado un informe sobre el pago no contabilizado de 60 000 $EUA en la 73ª reunión, conforme a la decisión 72/16. En dicho informe, el PNUMA informó que, desde 2008, ha seguido de cerca esta cuestión mediante comunicaciones oficiales y discusiones bilaterales con funcionarios gubernamentales. Sin embargo, llegados a la 73ª reunión, el Gobierno no ha presentado un informe sobre el pago de 60 000 $EUA no contabilizados. Por ello, el PNUMA propuso devolver 60 000 $EUA de una cantidad de 262 000 $EUA aprobada en la 63ª reunión (IRA/PHA/63/TAS/200) para que el PNUMA ejecute el componente del sector de servicio y mantenimiento de la refrigeración de la etapa I del plan de gestión de la eliminación de HCFC, entendiéndose que las actividades correspondientes serán ejecutadas por el Gobierno de la República Islámica de Irán con sus propios recursos.
Recomendación de la Secretaría
62. El Comité Ejecutivo puede considerar oportuno tomar nota de la devolución a la 74ª reunión de 60 000 $EUA del componente del sector de servicio y mantenimiento de la refrigeración de la etapa I del plan de gestión de la eliminación de HCFC de la República Islámica de Irán, que no se habían tenido en cuenta en el plan nacional de eliminación del CFC (IRA/PHA/63/TAS/200), entendiéndose que las actividades correspondientes del plan de gestión de la eliminación de HCFC se ejecutarán con los propios recursos del Gobierno.
UNEP/OzL.Pro/ExCom/73/17/Add.1
19
Filipinas: Informe financiero para el plan nacional de eliminación de CFC (PNEC) Antecedentes
63. En la 72ª reunión, el Comité Ejecutivo, al estudiar el informe financiero presentado por el PNUMA en nombre del Gobierno de Filipinas, decidió, entre otras cosas, solicitar al Gobierno de Filipinas, a través del PNUMA, que presentara a la Secretaría, a más tardar el 30 de junio de 2014, el informe financiero auditado oficial para el PNEC en Filipinas, debidamente firmado por un auditor independiente o acreditado por el Gobierno (decisión 72/14 (c)).
Informe de la auditoría financiera
64. La auditoría financiera (presentada el 16 de julio de 2014) cubría las transacciones y operaciones de la Unidad de Gestión de Proyectos (UGP) del PNEC desde el 1° de enero de 2013 hasta el 31 de mayo de 2014. Los auditores notificaron que los estados financieros presentados por la UGP y la documentación de apoyo estaban conformes con las leyes, normas y reglamentos aplicables y con los principios de contabilidad generalmente aceptados. Del total de 801 630 $EUA aprobados para las actividades remanentes en el PNEC, 786 218,37 $EUA habían sido desembolsados por el Gobierno a finales de diciembre de 2013. El saldo restante de 15 411,63 $EUA ha de devolverse al Fondo Multilateral en la 73ª reunión.
Comentarios de la Secretaría
65. El PNUMA confirmó que la auditoría realizada por el PNEC respondía a las exigencias de las normas y reglamentos de la ONU en materia de contabilidad y, por consiguiente, se consideraba aceptable.
66. La Secretaría tomó nota asimismo de que, en la decisión 72/14(d)(i), el Comité Ejecutivo, entre otras cosas, solicitó al PNUMA que se encargara de la devolución, a más tardar en la 73ª reunión, de cualquier saldo remanente no gastado, basándose para ello en el informe del auditor al Fondo Multilateral. En el momento de redactar este documento, esos saldos no habían sido devueltos.
Recomendación de la Secretaría
67. El Comité Ejecutivo puede considerar oportuno:
a) Tomar nota del informe financiero auditado para el plan nacional de eliminación del CFC en Filipinas, presentado por el PNUMA en nombre del Gobierno de Filipinas, y que se recoge en el documento UNEP/OzL.Pro/ExCom/73/17/Add.1;
b) Solicitar al PNUMA que devuelva el saldo de 15 411 $EUA, más los gastos de apoyo del organismo, lo antes posible y, a más tardar, en la 74ª reunión, conforme a la decisión 72/14(d)(i); y
c) Tomar nota de que el PNUMA presentará el informe de terminación del proyecto a más tardar en la 74ª reunión, conforme a lo que se solicita en la decisión 72/14(d)(ii).

UNEP/OzL.Pro/ExCom/73/17/Add.1
20
PARTE VII: PROYECTO DE ELIMINACIÓN DEL MB EN GUATEMALA
Antecedentes 68. En su 71a reunión, el Comité Ejecutivo solicitó a ONUDI que presentara un informe sobre la marcha de las actividades relativas a la prohibición de importar usos controlados del MB al 1° de enero de 2015 y sobre las medidas adoptadas para cerciorarse de la sostenibilidad a largo plazo de las tecnologías alternativas, dado que el consumo en 2012 superó al permitido por el Acuerdo con el Comité Ejecutivo. Por consiguiente, ONUDI presentó un informe conforme a la decisión 71/7(b)(i).
Informe sobre la marcha de las actividades 69. El informe sobre la marcha de las actividades de ONUDI indicaba que se realizaron diversas actividades para cuatro de las cinco empresas que usan el MB (una de las empresas pertenece íntegramente a intereses de países ajenos al Artículo 5), incluyendo en ello la adquisición e instalación de equipos de laboratorio, los talleres prácticos sobre injertos, la capacitación de técnicos de universidades y establecimientos de investigación agrícolas y la asistencia técnica a la Escuela de Agricultura de Zacapa. Se actualizarán los planes de estudio de los estudiantes de horticultura para incluir en ellos los agentes biológicos, los injertos y el uso responsable de fumigantes. Las actividades previstas para el periodo de ejecución restante son la adquisición de más equipos para injertos, la celebración de más talleres y cursos de capacitación sobre injertos, agentes biológicos, el monosporascus y su control, y una visita sobre el terreno a México. Todas estas actividades contribuirán a la sostenibilidad a largo plazo de las tecnologías alternativas en el país. Asimismo, el Gobierno de Guatemala ha prohibido la importación de usos controlados del MB en Guatemala desde el 1° de enero de 2015.
Comentarios de la Secretaría 70. Al examinar el informe de ONUDI, la Secretaría tomó nota del fuerte compromiso del Gobierno de Guatemala por cumplir con las medidas de control del MB: el Gobierno emitió una prohibición de la importación de usos controlados del MB desde el 1° de enero de 2015; devolvió 210 000 $EUA de los fondos aprobados para el segundo tramo para ONUDI y 35 000 $EUA de los 70 000 $EUA de fondos aprobados para el PNUMA. Se han llevado a cabo diversas actividades, tales como la adquisición de equipos, talleres y cursos de capacitación de partes interesadas. Todas estas actuaciones asegurarán la sostenibilidad de las tecnologías alternativas a largo plazo.
Recomendaciones de la Secretaría 71. El Comité Ejecutivo puede considerar oportuno:
a) Tomar nota del informe sobre la marcha de las actividades de ejecución del proyecto de eliminación del metilbromuro (MB) en Guatemala, presentado por ONUDI en nombre del Gobierno de Guatemala, y recogido en el documento UNEP/OzL.Pro/ExCom/73/17/Add.1; y
b) Solicitar a ONUDI y al PNUMA que presenten en la 74ª reunión un informe sobre la marcha de las actividades y un informe sobre el riesgo potencial de incumplimiento para 2015.

UNEP/OzL.Pro/ExCom/73/17/Add.1
21
PARTE VIII: GESTIÓN Y ELIMINACIÓN DE DESECHOS DE SAO
Indonesia y Filipinas: Informes finales de proyectos de eliminación de SAO Antecedentes 72. En la 57a reunión, el Comité Ejecutivo aprobó fondos para preparar proyectos piloto de demostración para la gestión y eliminación de desechos de SAO en Indonesia y Filipinas. En esa reunión, el Banco Mundial había indicado que esos fondos se usarían para generar datos y adquirir experiencia sobre la gestión y las modalidades de financiación y que se examinarían las posibilidades de potenciar la cofinanciación.
73. El Banco Mundial presentó informes finales que contenían documentación en la que se describían los inventarios de desechos actuales de SAO en Indonesia y Filipinas; información sobre la forma de realizar inventarios y recoger datos; orientación sobre la gestión de las SAO no deseadas; opciones de financiación para destruir las SAO no deseadas, incluyendo en ello información sobre los mercados disponibles y consideraciones sobre costos y precios del mercado. Los informes también contienen opciones específicas para cada país, una evaluación de dichas opciones y las etapas siguientes que serían necesarias para la ejecución. Estos informes se encuentran en el anexo IV.
Comentarios de la Secretaría 74. Al examinar estos informes, la Secretaría tomó nota de la amplia información que contenían y de su utilidad, principalmente los manuales preparados para Indonesia y Filipinas. La Secretaría también advirtió que la orientación que ofrecen estos documentos ayudará a los países del Artículo 5 a comprender sus situaciones actuales en relación con los desechos de SAO y las opciones gestión y eliminación que se les ofrecen.
Recomendaciones de la Secretaría 75. El Comité Ejecutivo puede considerar oportuno:
a) Tomar nota de los informes presentados por el Banco Mundial sobre proyectos de eliminación de SAO en Indonesia y Filipinas, recogidos en el documento UNEP/OzL.Pro/ExCom/73/17/Add.1; y
b) Solicitar a los organismos bilaterales y de ejecución que consideren la información que aparece en esos informes cuando asesoren a países del Artículo 5 sobre gestión y eliminación de desechos de SAO.
Región de Europa y Asia Central: Demonstración de una estrategia regional para la gestión y eliminación de desechos de SAO Antecedentes 76. En la 69a reunión, el Comité Ejecutivo aprobó la ejecución de un proyecto regional para elaborar y demostrar una estrategia para la gestión y eliminación de desechos de SAO en la región de Europa y Asia Central8 a ser ejecutado por ONUDI y el PNUMA, entendiéndose que se presentaría un amplio informe con información actualizada sobre los volúmenes reales de desechos de SAO recogidos por sustancia desde la fecha de la aprobación del proyecto hasta la 73ª reunión (decisión 69/19(b)(ii)).
8 Los países participantes en este proyecto son Bosnia y Herzegovina, Croacia y Montenegro.
UNEP/OzL.Pro/ExCom/73/17/Add.1
22
77. El informe presentado mostró que, hasta la fecha de la presentación, los centros de recuperación y reciclaje participantes en el proyecto habían recogido un volumen total de 25,13 toneladas métricas de desechos de SAO. El volumen restante de 3,94 toneladas métricas a destruir se recogerá en el último trimestre de 2014 y se eliminará en la primera mitad de 2015.
Comentarios de la Secretaría 78. A petición de la Secretaría, ONUDI notificó que los volúmenes de desechos de SAO se habían recogido en los tres centros de recuperación y reciclaje de Croacia y que el origen de las 3,94 toneladas métricas restantes que han de destruirse está por determinar. ONUDI también informó que se ha incrementado la capacidad de acumulación de un centro de recuperación y reciclaje en Bosnia y Herzegovina y uno en Montenegro mediante el suministro de herramientas y equipos. La creación de capacidades continúa en estos tres países y ONUDI confía en que se alcancen los objetivos del proyecto.
Recomendaciones de la Secretaría 79. El Comité Ejecutivo puede considerar oportuno:
a) Tomar nota del informe presentado por ONUDI sobre los volúmenes reales de desechos de SAO recogidos por sustancia para la demostración del proyecto de estrategia regional para la gestión y eliminación de desechos de SAO en la región de Europa y Asia Central, conforme a la decisión 69/19(b)(ii), informe que se recoge en el documento UNEP/OzL.Pro/ExCom/73/17/Add.1; y
b) Solicitar a ONUDI y al PNUMA que presenten el informe de terminación del proyecto una vez acabado el proyecto piloto de demostración y, a más tardar, en la primera reunión de 2016.
PARTE IX: MOVILIZACIÓN DE RECURSOS
Mundial: Movilización de recursos para beneficios colaterales para el clima Informe final
80. En su 63a reunión, el Comité Ejecutivo aprobó la cantidad de 100 000 $EUA para que el PNUMA realizara un estudio sobre opciones de financiación, talleres regionales sobre cofinanciación y/o una o varias aplicaciones piloto de cofinanciación para uno o varios países de bajo consumo de SAO con un plan de gestión de la eliminación de los HCFC, a financiarse como actividades de movilización de recursos.
81. El PNUMA presentó el informe final del proyecto de movilización de recursos en un documento titulado Opciones de Financiación para Tratar los Beneficios Colaterales para el Clima de la Eliminación de los HCFC en Países de Bajo Consumo de SAO con Sector de Servicio y Mantenimiento únicamente. El documento ofrece orientación a los oficiales encargados del ozono de los países de bajo consumo de SAO sobre la forma de buscar financiación fuera del Fondo Multilateral para conseguir beneficios colaterales para el clima vinculados a sus planes de gestión de la eliminación de los HCFC. El informe contiene información sobre la situación de los países de bajo consumo de SAO, una sección sobre las alternativas de bajo potencial de calentamiento de la atmósfera para los HCFC, particularmente para el sector de servicio y mantenimiento, una breve descripción de las fuentes clave de apoyo financiero para beneficios colaterales para el clima que podrían estar disponibles y termina con una guía por etapas para los oficiales encargados del ozono que tratan de aprovechar los beneficios colaterales para el clima durante la eliminación de los HCFC.

UNEP/OzL.Pro/ExCom/73/17/Add.1
23
Comentarios de la Secretaría 82. Al examinar el informe, la Secretaría pidió al PNUMA que aclarara el proceso o metodología utilizada para preparar el informe y la forma en que se tendrían en cuenta los resultados de los talleres regionales celebrados en el documento final. La Secretaría también comentó el formato del informe y propuso algunos cambios que mejorarían su presentación.
83. La Secretaría también tomó nota de que los elementos que se exigía que formaran parte del proyecto (p. ej., adicionalidad, transparencia, ausencia de incentivos perversos, reparto de los beneficios, sostenibilidad asegurada, ausencia de duplicaciones e información sobre los costos de las transacciones) no formaban parte del informe. La Secretaría recordó al PNUMA otras decisiones pertinentes sobre movilización de recursos —tales como el análisis de la evaluación del proyecto de enfriadores— y que determinados aspectos pueden tenerse en cuenta en los informes finales, cuando es pertinente.
84. Tras el debate con el PNUMA, se presentó un borrador final revisado que tenía en cuenta las observaciones y comentarios de la Secretaría así como los elementos pendientes exigidos en el párrafo 83. Este informe final se encuentra en el anexo V.
Recomendaciones de la Secretaría 85. El Comité Ejecutivo puede considerar oportuno:
a) Tomar nota del informe sobre la movilización de recursos para beneficios complementarios para el clima presentado por el PNUMA, que se recoge en el documento UNEP/OzL.Pro/ExCom/73/17/Add.1; y
b) Alentar a los países con bajo consumo de SAO, a través de los organismos bilaterales y de ejecución, a usar la guía provista en el informe cuando busquen recursos adicionales para beneficios complementarios para el clima, durante la ejecución de la etapa I y etapas posteriores de los planes de gestión de la eliminación de HCFC.

1
DEMONSTRATION PROJECT FOR CONVERSION FROM HCFC-22/HCFC-142b TECHNOLOGY TO CO2 WITH METHYL FORMATE CO-BLOWING TECHNOLOGY IN THE MANUFACTURE OF XPS FOAM AT FEININGER
(NANJING) ENERGY SAVING TECHNOLOGY CO. LTD.
FINAL REPORT
August, 2014
Submitted by:
Foreign Economic Cooperation Office, Ministry of Environmental Protection, China (FECO/MEP)
and
United Nations Development Programme (UNDP)
2
Executive Summary Demonstration project for conversion from HCFC-22/HCFC-142b technology to CO2 with methyl formate co-blowing technology in the manufacture of XPS foam at Feininger (Nanjing) Energy Saving Technology Co. Ltd. was approved by the 64th Executive Committee meeting at a funding level of US$ 1,973,300. This demonstration project was successfully implemented, and established the suitability of methyl formate co-blowing technology as a viable replacement of the currently used HCFC-22 / HCFC-142b in the manufacture of XPS foam at Feininger (Nanjing) Energy Saving Technology Co. Ltd. The project activities includes product redesign and development, equipment installation and modifications safety, laboratory testing and performance evaluation, product trials, production line conversion, technical assistance and training. The successful completion of the demonstration project showed that the methyl formate co-blown with CO2 exhibited the industrial feasibility in the production of XPS foam board. XPS foam board produced by this conversion technique can be used for frost insulation of roads, railways, trafficked areas, light weight fill for reduction of horizontal and vertical earth pressure and other civil engineering applications etc.
1. Introduction The Demonstration Proposal prepared and submitted to the 62nd ExCom meeting. And the Executive Committee approved the XPS Demonstration project in 64th meeting in July 2011 at a funding level of US $ 1,973,300. The project’s implementing agency is UNDP. The national agency implementing this project is Foreign Economic Cooperation Office (FECO), Ministry Of Environmental Protection, China. The objective of this demonstration project is to establish the suitability of CO2 with methyl formate co- blowing technology as a viable replacement of the currently used HCFC-22/HCFC-142b blowing agent in the manufacture of XPS foam at Feininger (Nanjing) Energy Saving Technology Co. Ltd. The successful implementation of this demonstration project will provide an environment friendly and cost-effective alternative for enabling replication of this technology in similar applications and enterprises in the XPS Foam Sector, and result in reductions in HCFC consumption of 12.3 ODP tones, contributing to compliance with the 2013/2015 control targets in China. It will also lead to net annual emission reductions of 420,250 tonnes CO2-eq. 1.1 Background The XPS Foam Sector in China has experienced remarkable growth in the past several years. Due to the steep growth in the construction industry, demand for XPS foam boards for building thermal insulation has increased significantly, ascribed also to enhanced energy-efficiency standards for buildings. The 2009 estimated HCFC consumption in the sector was about 41,000 metric tonnes. Based on information from surveys, there are about 20 indigenous manufacturers of XPS extrusion lines and an estimated 500 manufacturers of XPS foam in the sector. Another defining characteristic of this sector is that most of the polystyrene raw material used in XPS foam manufacturing originates from recycled polystyrene scrap with aim to reduce the production cost. Recent zero-ODP XPS foam technologies introduced by multinational corporations are expensive and have been closely guarded in terms of intellectual property,for example complex cell technology used isobutene as blowing agent by Kaneka Corporation and pure CO2 foaming technology by Dow Corporation. Due to this, these technologies are not cost-effectively accessible for most of XPS foam enterprises of China and may not be compatible to

3
operate with a high proportion of recycled polystyrene scrap. There is, thus, a clear and present need for a cost-effective and environmentally safe technology alternative for the XPS foam sector of China, in order to remain sustainable and maintain product quality. Feininger (Nanjing) Energy Saving Technology Co. Ltd. was established in 2002 and it is one of the major manufacturers of Extruded Polystyrene (XPS) foam and XPS foam machines in China. The enterprise also manufacturers XPS foam boards with thickness from 20 mm to 100 mm. Other products include Extruded Polyethylene (XPE) foam boards and sheets, XPS foam pipe sections and PVC pipes. Feininger currently employs 143 persons, of which about 50 are technical. Feininger has been recognized as one of the leading companies in the XPS industry in China with excellent management and high quality products. The enterprise has 26 patents, covering almost all the core technologies in XPS manufacturing. Feininger has been identified as a national high technology enterprise. It has obtained the Class-A Tax Credit Certification Award promulgated by the Internal Revenue Service and the Local Taxation Bureau of Nanjing, Jiangsu. It has also obtained ISO 9000, ISO14001 and CE certifications. The enterprise currently operates two XPS foam manufacturing lines, both built in-house. The main technical parameters of the baseline equipment in these two manufacturing lines are tabulated below: Parameter Unit Line 1/ SE 150/200* Line 2/TE 75/200
Type N/A Single/Single Tandem Twin/Single Tandem Capacity
kg/hr 480-720 480-720 m3/day 300-450 300-450
Diameter of primary extruder Mm SE 150 TE 75 Diameter of secondary extruder Mm SE 200 SE 200 Power of primary extruder kW 110 110 Power of secondary extruder kW 75 75 Connected load kVA 250 250 Electrical supply Volts 380V/3 Ph/50 HzXPS board thickness Mm 20-100XPS board width Mm 600, 900, 1200Blowing agents N/A HCFC-142b/22 (50:50) HCFC-142b/22,142bHCFC consumption** Metric tonnes 205 290 *Line 1/ SE 150/200 have been converted to non-HCFC technology in this demonstration project. ** 2010
The manufacturing line 1/SE 150/200 is a primary single-screw extruder/single-screw tandem extrusion system and line 2/TE 75/200 is a twin-screw extruder/single-screw tandem extrusion system. Compared with the primary single-screw (line 1), the primary twin-screw (line 2) has some advantages, such as steadier feeding, better dispersive and distributive mixing and better temperature control capability. These characteristics result in XPS foam with lower density and better insulation value. In the past three years, due to demand for improved product standards, the line 2/TE75/200 twin-screw system has been used for a larger share of the production. The existing extrusion line 1/SE 150/200 comprises of the following main equipment:
• Primary extruder 150 mm (36:1) • Secondary extruder 200 mm (34:1) • Pre-blending system for additives • Two single stage blowing agent pumps delivering to the primary extruder • Static mixer at the discharge of the secondary extruder • Extrusion die and shaper • Interconnecting piping and fitting • Controls and indications
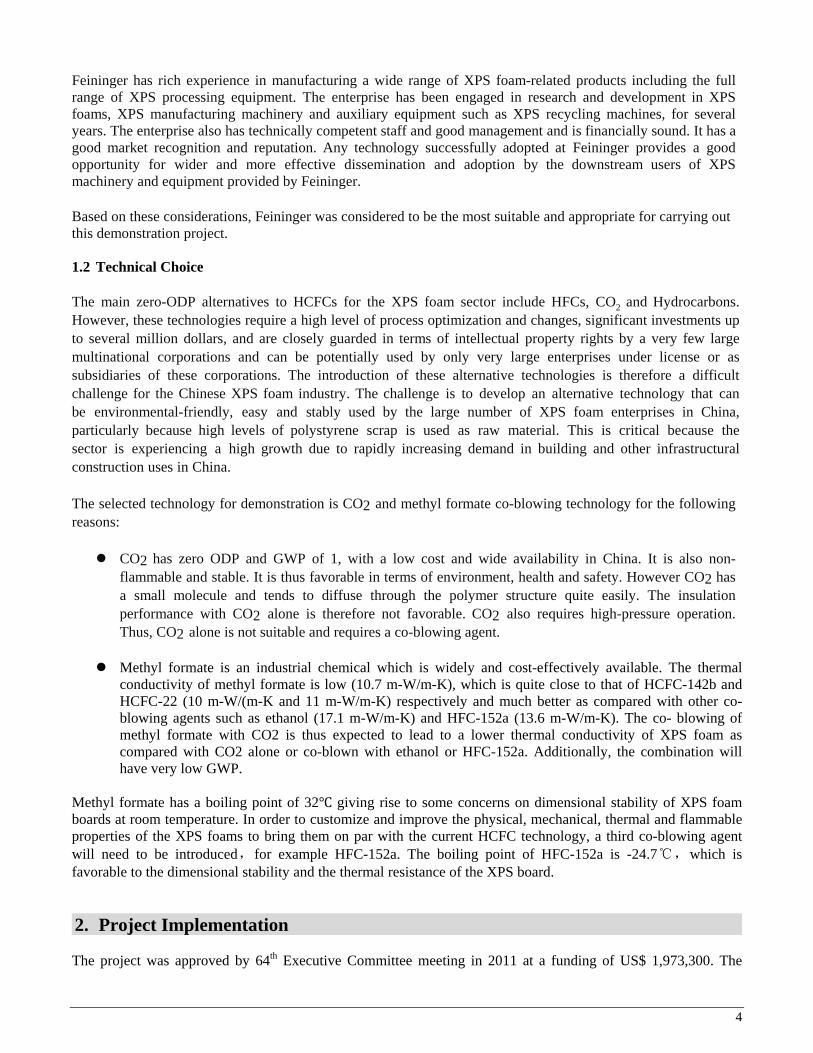
4
Feininger has rich experience in manufacturing a wide range of XPS foam-related products including the full range of XPS processing equipment. The enterprise has been engaged in research and development in XPS foams, XPS manufacturing machinery and auxiliary equipment such as XPS recycling machines, for several years. The enterprise also has technically competent staff and good management and is financially sound. It has a good market recognition and reputation. Any technology successfully adopted at Feininger provides a good opportunity for wider and more effective dissemination and adoption by the downstream users of XPS machinery and equipment provided by Feininger. Based on these considerations, Feininger was considered to be the most suitable and appropriate for carrying out this demonstration project. 1.2 Technical Choice The main zero-ODP alternatives to HCFCs for the XPS foam sector include HFCs, CO2 and Hydrocarbons. However, these technologies require a high level of process optimization and changes, significant investments up to several million dollars, and are closely guarded in terms of intellectual property rights by a very few large multinational corporations and can be potentially used by only very large enterprises under license or as subsidiaries of these corporations. The introduction of these alternative technologies is therefore a difficult challenge for the Chinese XPS foam industry. The challenge is to develop an alternative technology that can be environmental-friendly, easy and stably used by the large number of XPS foam enterprises in China, particularly because high levels of polystyrene scrap is used as raw material. This is critical because the sector is experiencing a high growth due to rapidly increasing demand in building and other infrastructural construction uses in China. The selected technology for demonstration is CO2 and methyl formate co-blowing technology for the following reasons: CO2 has zero ODP and GWP of 1, with a low cost and wide availability in China. It is also non-
flammable and stable. It is thus favorable in terms of environment, health and safety. However CO2 has a small molecule and tends to diffuse through the polymer structure quite easily. The insulation performance with CO2 alone is therefore not favorable. CO2 also requires high-pressure operation. Thus, CO2 alone is not suitable and requires a co-blowing agent.
Methyl formate is an industrial chemical which is widely and cost-effectively available. The thermal
conductivity of methyl formate is low (10.7 m-W/m-K), which is quite close to that of HCFC-142b and HCFC-22 (10 m-W/(m-K and 11 m-W/m-K) respectively and much better as compared with other co-blowing agents such as ethanol (17.1 m-W/m-K) and HFC-152a (13.6 m-W/m-K). The co- blowing of methyl formate with CO2 is thus expected to lead to a lower thermal conductivity of XPS foam as compared with CO2 alone or co-blown with ethanol or HFC-152a. Additionally, the combination will have very low GWP.
Methyl formate has a boiling point of 32 giving rise to some concerns on dimensional stability of XPS foam boards at room temperature. In order to customize and improve the physical, mechanical, thermal and flammable properties of the XPS foams to bring them on par with the current HCFC technology, a third co-blowing agent will need to be introduced,for example HFC-152a. The boiling point of HFC-152a is -24.7℃,which is favorable to the dimensional stability and the thermal resistance of the XPS board.
2. Project Implementation The project was approved by 64th Executive Committee meeting in 2011 at a funding of US$ 1,973,300. The
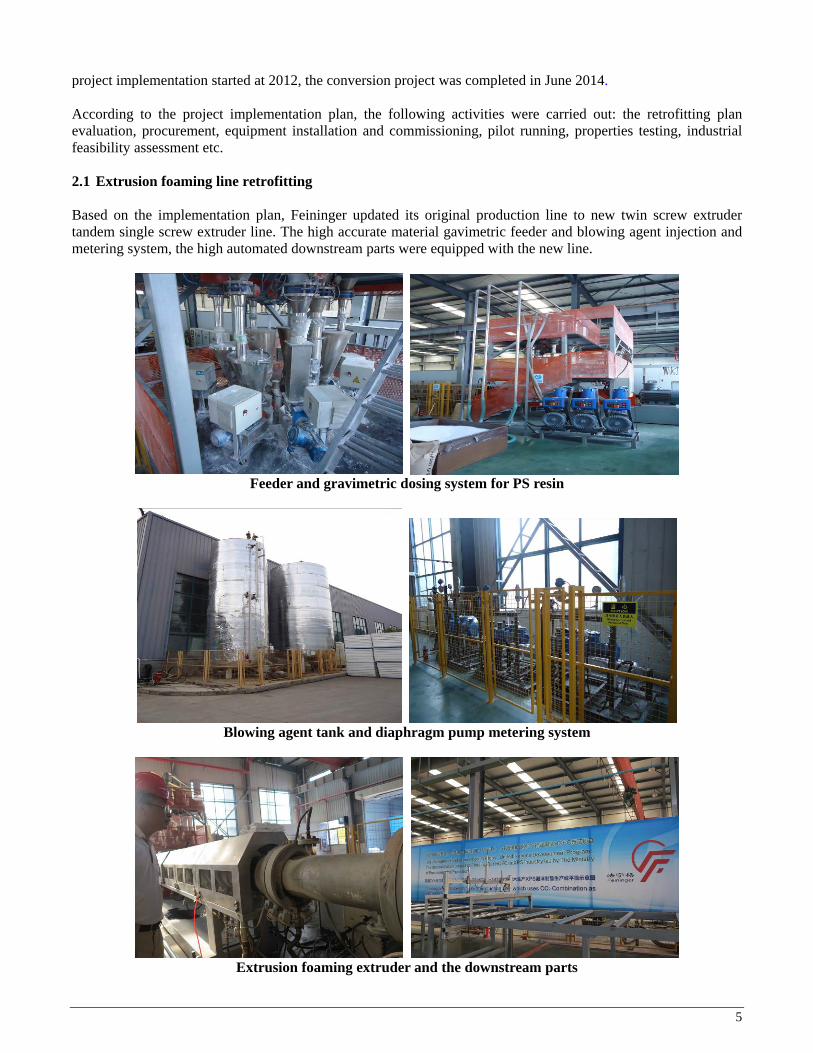
5
project implementation started at 2012, the conversion project was completed in June 2014. According to the project implementation plan, the following activities were carried out: the retrofitting plan evaluation, procurement, equipment installation and commissioning, pilot running, properties testing, industrial feasibility assessment etc. 2.1 Extrusion foaming line retrofitting Based on the implementation plan, Feininger updated its original production line to new twin screw extruder tandem single screw extruder line. The high accurate material gavimetric feeder and blowing agent injection and metering system, the high automated downstream parts were equipped with the new line.
Feeder and gravimetric dosing system for PS resin
Blowing agent tank and diaphragm pump metering system
Extrusion foaming extruder and the downstream parts

6
2.2 Ventilation and fire safety systems retrofitting The ventilation and fire safety systems of the production workshop were retrofitted and also came into use. An external safety audit was carried out to ensure that the safety systems were consistent with local regulations.
Forced ventilation system and highly sensitive flammable gas sensor
Fire equipment and anti-explosive control cabinet
2.3 Commissioning/Trial-production Co-blowing system comprising of CO2/Methyl formate, CO2/Methyl formate/Ethanol were choose as the substitutes for the HCFC-22/HCFC-142b. The effect of those new blowing systems on the processing process and the properties of the XPS foam board were evaluated. By use of CO2/Methyl fomate blowing system, the XPS foam board was manufactured in the new line to verify the industrial feasibility. Some special formula was introduced to assess the stability and reliability of the production in the commissioning process.
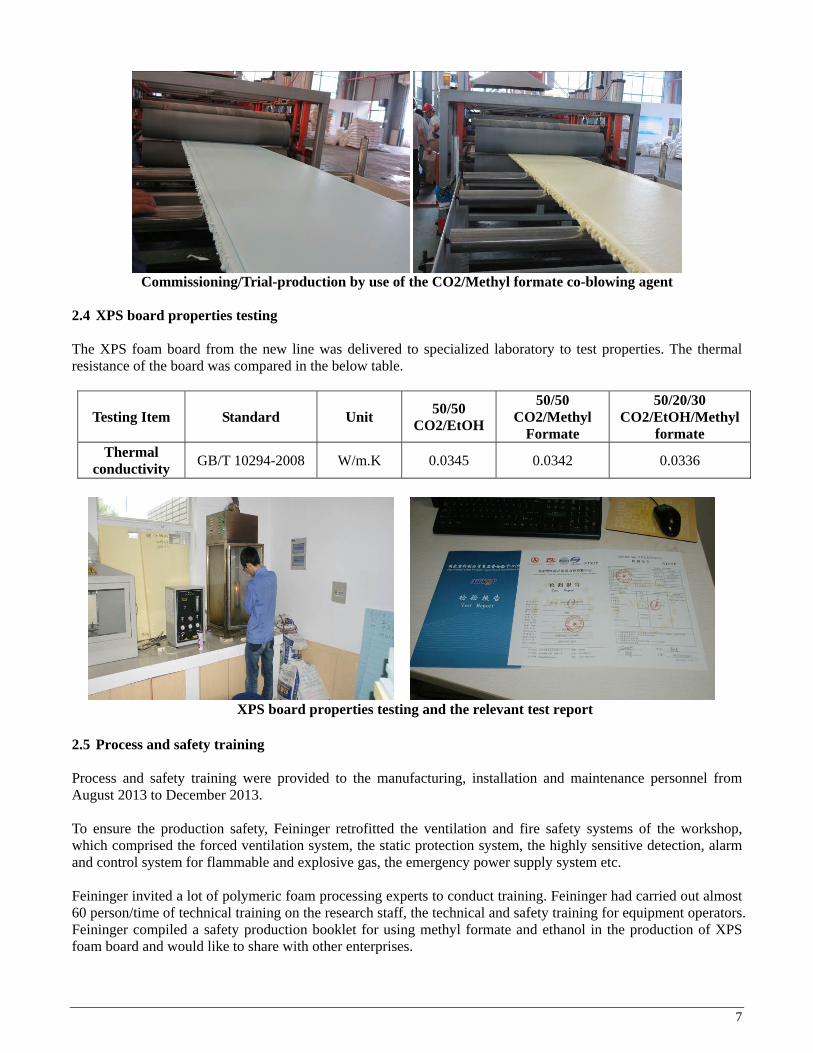
7
Commissioning/Trial-production by use of the CO2/Methyl formate co-blowing agent
2.4 XPS board properties testing The XPS foam board from the new line was delivered to specialized laboratory to test properties. The thermal resistance of the board was compared in the below table.
Testing Item Standard Unit 50/50
CO2/EtOH
50/50 CO2/Methyl
Formate
50/20/30 CO2/EtOH/Methyl
formate Thermal
conductivity GB/T 10294-2008 W/m.K 0.0345 0.0342 0.0336
XPS board properties testing and the relevant test report
2.5 Process and safety training Process and safety training were provided to the manufacturing, installation and maintenance personnel from August 2013 to December 2013. To ensure the production safety, Feininger retrofitted the ventilation and fire safety systems of the workshop, which comprised the forced ventilation system, the static protection system, the highly sensitive detection, alarm and control system for flammable and explosive gas, the emergency power supply system etc. Feininger invited a lot of polymeric foam processing experts to conduct training. Feininger had carried out almost 60 person/time of technical training on the research staff, the technical and safety training for equipment operators. Feininger compiled a safety production booklet for using methyl formate and ethanol in the production of XPS foam board and would like to share with other enterprises.
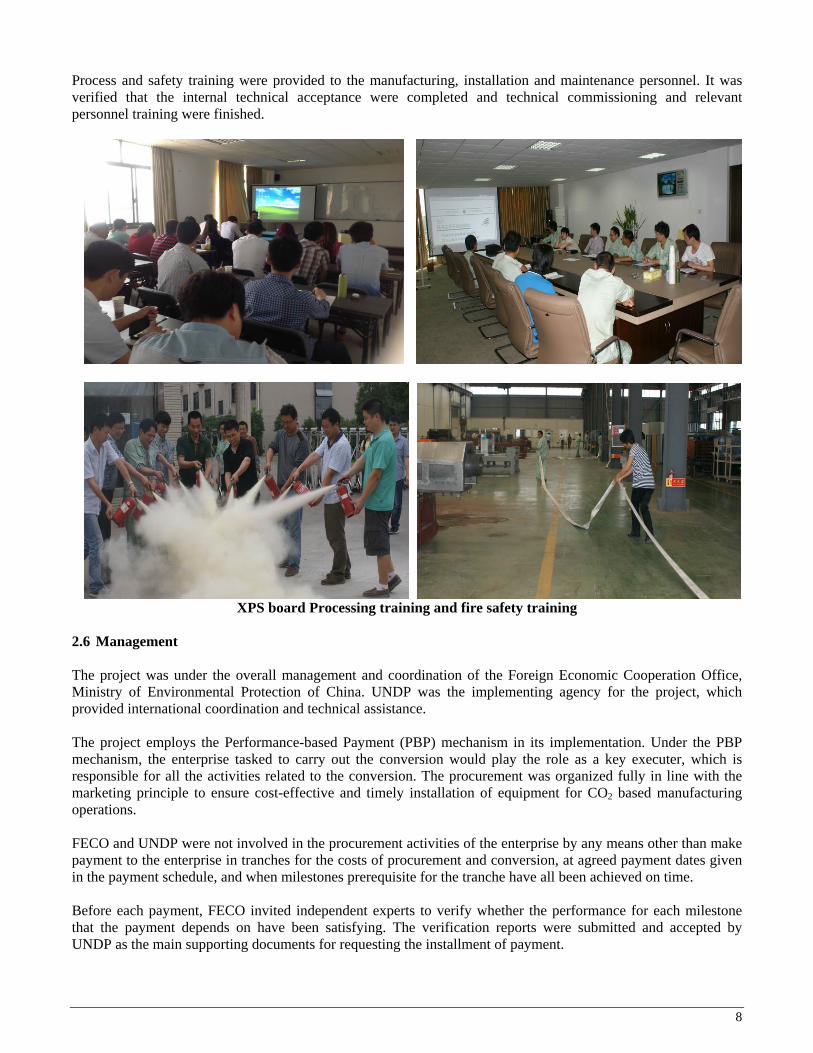
8
Process and safety training were provided to the manufacturing, installation and maintenance personnel. It was verified that the internal technical acceptance were completed and technical commissioning and relevant personnel training were finished.
XPS board Processing training and fire safety training
2.6 Management The project was under the overall management and coordination of the Foreign Economic Cooperation Office, Ministry of Environmental Protection of China. UNDP was the implementing agency for the project, which provided international coordination and technical assistance. The project employs the Performance-based Payment (PBP) mechanism in its implementation. Under the PBP mechanism, the enterprise tasked to carry out the conversion would play the role as a key executer, which is responsible for all the activities related to the conversion. The procurement was organized fully in line with the marketing principle to ensure cost-effective and timely installation of equipment for CO2 based manufacturing operations. FECO and UNDP were not involved in the procurement activities of the enterprise by any means other than make payment to the enterprise in tranches for the costs of procurement and conversion, at agreed payment dates given in the payment schedule, and when milestones prerequisite for the tranche have all been achieved on time. Before each payment, FECO invited independent experts to verify whether the performance for each milestone that the payment depends on have been satisfying. The verification reports were submitted and accepted by UNDP as the main supporting documents for requesting the installment of payment.

9
During project implementation, FECO and UNDP organized 5 verification missions combined with monitoring and evaluation at Feininger (Nanjing) factory - once in 2011, once in 2012, 2 times in 2013and once in 2014. The experts group included technology experts and finance experts, FECO staff and UNDP staff as well. The experts team traced the project implementation situations, evaluated the project technical issues and progress, and verified whether the performance for each milestone that the payment depends on have been satisfied. Each verification activity was carried out in a process of planning, preparation, data confirmation, technical material checking, on-the-spot investigation, result confirmation and conclusion.
3. Outcomes The project was implementing smoothly according to the program schedule, and was completed in June 2014. The national acceptance will be completed by the end of 2014. The production line is running commercially, and IOC will be disbursed to enterprise in 2015. The industrial application feasibility of methyl formate together with CO2 and ethanol in the production of XPS foam board has been well verified. The following are the salient outcomes of the project. The enterprise completed the redesign of extruder production line, foaming agent injection control system
and fire safety system in 2012. Equipment for extruder production line was procured in 2012. The fire safety system and explosion-proof retrofit were completed in 2013. Technical commissioning was completed successfully and relevant personnel were trained in 2013. The project Completion verification has been carried out in June 2014.
4. Technical performance Technical performance of the XPS foam manufactured after implementation of conversion technology is given below. CO2 has zero ODP and GWP of 1, with a low cost and wide availability in China. CO2 is non- flammable and stable. It is thus favorable in terms of environment, health and safety. Methyl formate is an industrial chemical which is widely and cost-effectively available. The thermal conductivity of methyl formate is low, which is quite close to that of HCFC-142b and
HCFC-22 respectively. The co-blowing of methyl formate with CO2 was thus expected to lead to a lower thermal conductivity of
XPS board as compared with CO2 alone or co-blown with ethanol if the processing process could not be severely influenced.
Methyl formate could be used as the co-blowing agent of CO2 basically. Using methyl formate as the co-blowing agent of CO2 had no significant influences on the processing process of XPS board.
5. Project management and monitoring 5.1 Project progress The project was implementing smoothly according to the program schedule, and was completed in June 2014. The national acceptance will be completed by the end of 2014. The capacity of the production line has been converted to use substitute Foaming agent. Each of milestones was achieved and verified, the details are as follows:
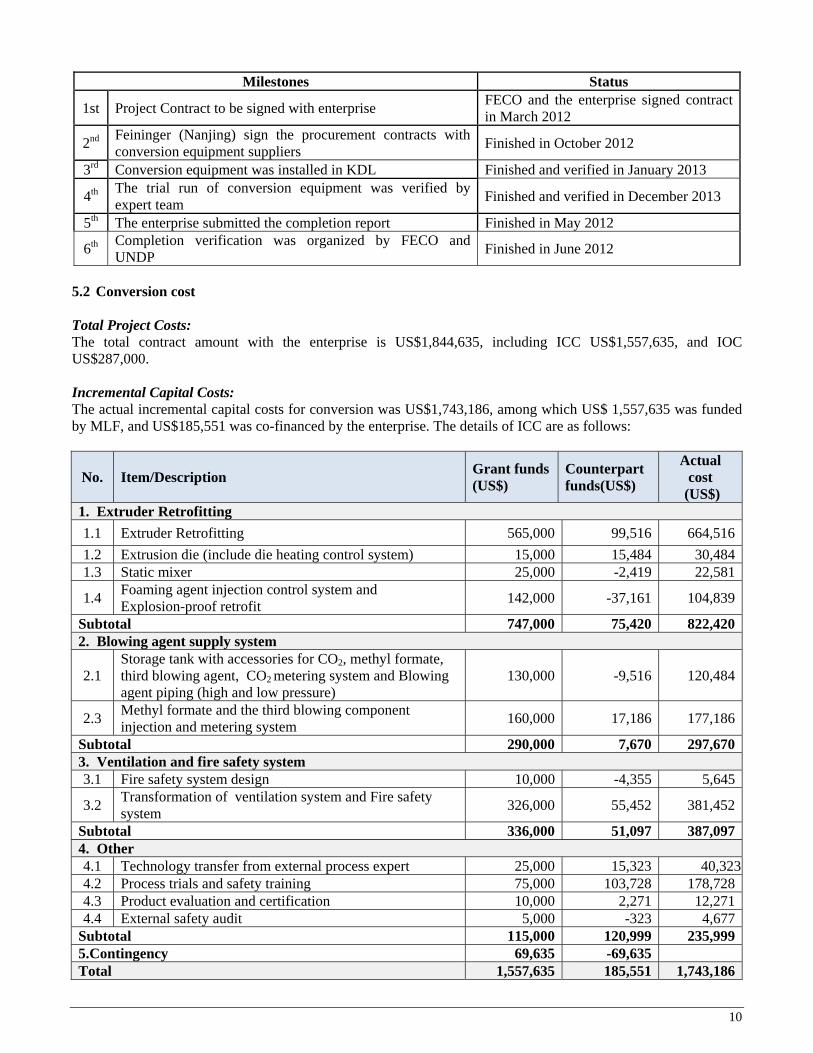
10
Milestones Status
1st Project Contract to be signed with enterprise FECO and the enterprise signed contract in March 2012
2nd Feininger (Nanjing) sign the procurement contracts with conversion equipment suppliers
Finished in October 2012
3rd Conversion equipment was installed in KDL Finished and verified in January 2013
4th The trial run of conversion equipment was verified by expert team
Finished and verified in December 2013
5th The enterprise submitted the completion report Finished in May 2012
6th Completion verification was organized by FECO and UNDP
Finished in June 2012
5.2 Conversion cost Total Project Costs: The total contract amount with the enterprise is US$1,844,635, including ICC US$1,557,635, and IOC US$287,000. Incremental Capital Costs: The actual incremental capital costs for conversion was US$1,743,186, among which US$ 1,557,635 was funded by MLF, and US$185,551 was co-financed by the enterprise. The details of ICC are as follows:
No. Item/Description Grant funds (US$)
Counterpart funds(US$)
Actual cost
(US$) 1. Extruder Retrofitting
1.1 Extruder Retrofitting 565,000 99,516 664,516
1.2 Extrusion die (include die heating control system) 15,000 15,484 30,4841.3 Static mixer 25,000 -2,419 22,581
1.4 Foaming agent injection control system and Explosion-proof retrofit
142,000 -37,161 104,839
Subtotal 747,000 75,420 822,4202. Blowing agent supply system
2.1 Storage tank with accessories for CO2, methyl formate, third blowing agent, CO2 metering system and Blowing agent piping (high and low pressure)
130,000 -9,516 120,484
2.3 Methyl formate and the third blowing component injection and metering system
160,000 17,186 177,186
Subtotal 290,000 7,670 297,6703. Ventilation and fire safety system 3.1 Fire safety system design 10,000 -4,355 5,645
3.2 Transformation of ventilation system and Fire safety system
326,000 55,452 381,452
Subtotal 336,000 51,097 387,0974. Other 4.1 Technology transfer from external process expert 25,000 15,323 40,3234.2 Process trials and safety training 75,000 103,728 178,7284.3 Product evaluation and certification 10,000 2,271 12,2714.4 External safety audit 5,000 -323 4,677
Subtotal 115,000 120,999 235,9995.Contingency 69,635 -69,635 Total 1,557,635 185,551 1,743,186
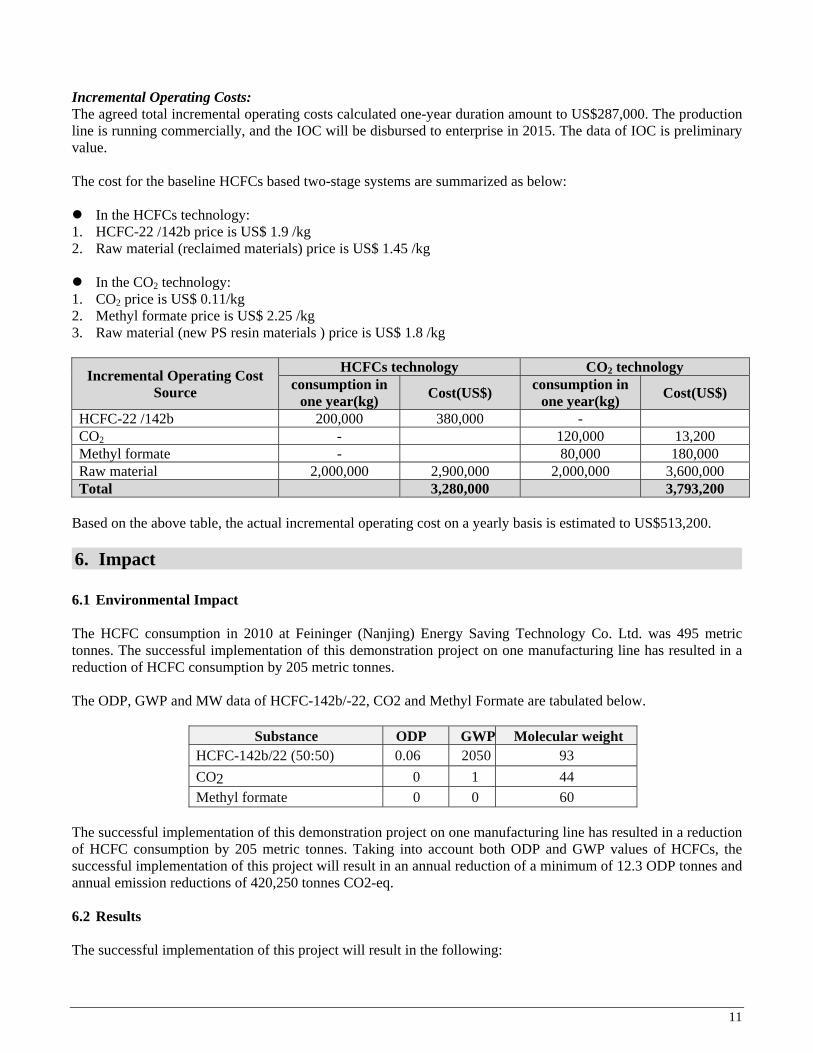
11
Incremental Operating Costs: The agreed total incremental operating costs calculated one-year duration amount to US$287,000. The production line is running commercially, and the IOC will be disbursed to enterprise in 2015. The data of IOC is preliminary value. The cost for the baseline HCFCs based two-stage systems are summarized as below: In the HCFCs technology: 1. HCFC-22 /142b price is US$ 1.9 /kg 2. Raw material (reclaimed materials) price is US$ 1.45 /kg In the CO2 technology: 1. CO2 price is US$ 0.11/kg 2. Methyl formate price is US$ 2.25 /kg 3. Raw material (new PS resin materials ) price is US$ 1.8 /kg
Incremental Operating Cost Source
HCFCs technology CO2 technology consumption in
one year(kg) Cost(US$)
consumption in one year(kg)
Cost(US$)
HCFC-22 /142b 200,000 380,000 - CO2 - 120,000 13,200 Methyl formate - 80,000 180,000 Raw material 2,000,000 2,900,000 2,000,000 3,600,000 Total 3,280,000 3,793,200
Based on the above table, the actual incremental operating cost on a yearly basis is estimated to US$513,200.
6. Impact 6.1 Environmental Impact The HCFC consumption in 2010 at Feininger (Nanjing) Energy Saving Technology Co. Ltd. was 495 metric tonnes. The successful implementation of this demonstration project on one manufacturing line has resulted in a reduction of HCFC consumption by 205 metric tonnes. The ODP, GWP and MW data of HCFC-142b/-22, CO2 and Methyl Formate are tabulated below.
Substance ODP GWP Molecular weight HCFC-142b/22 (50:50) 0.06 2050 93
CO2 0 1 44
Methyl formate 0 0 60 The successful implementation of this demonstration project on one manufacturing line has resulted in a reduction of HCFC consumption by 205 metric tonnes. Taking into account both ODP and GWP values of HCFCs, the successful implementation of this project will result in an annual reduction of a minimum of 12.3 ODP tonnes and annual emission reductions of 420,250 tonnes CO2-eq. 6.2 Results The successful implementation of this project will result in the following:
12
(a) Sustainable reductions in HCFC consumption in the XPS sector in China of 12.3 ODP tonnes, contributing to China’s compliance with the 2013 and 2015 control targets.
(b) Demonstration and availability of an environmentally safe and cost-effective alternative for enabling replication of this technology in similar applications and enterprises in the XPS Foam Sector in China.
(c) XPS foam board produced by this conversion technique can be used for frost insulation of roads,
railways, trafficked areas, light weight fill for reduction of horizontal and vertical earth pressure and other civil engineering applications etc.

1
UNITED NATIONS INDUSTRIAL DEVELOPMENT ORGANIZATION
Demonstration Sub-Project for Conversion from HCFC-22 to Propane
at Midea Room Air-conditioner Manufacturing Company
Demonstration Sub-Project for Conversion of Room A/C Compressor
Manufacturing from HCFC-22 to Propane at Guangdong Meizhi Co.
FINAL REPORT
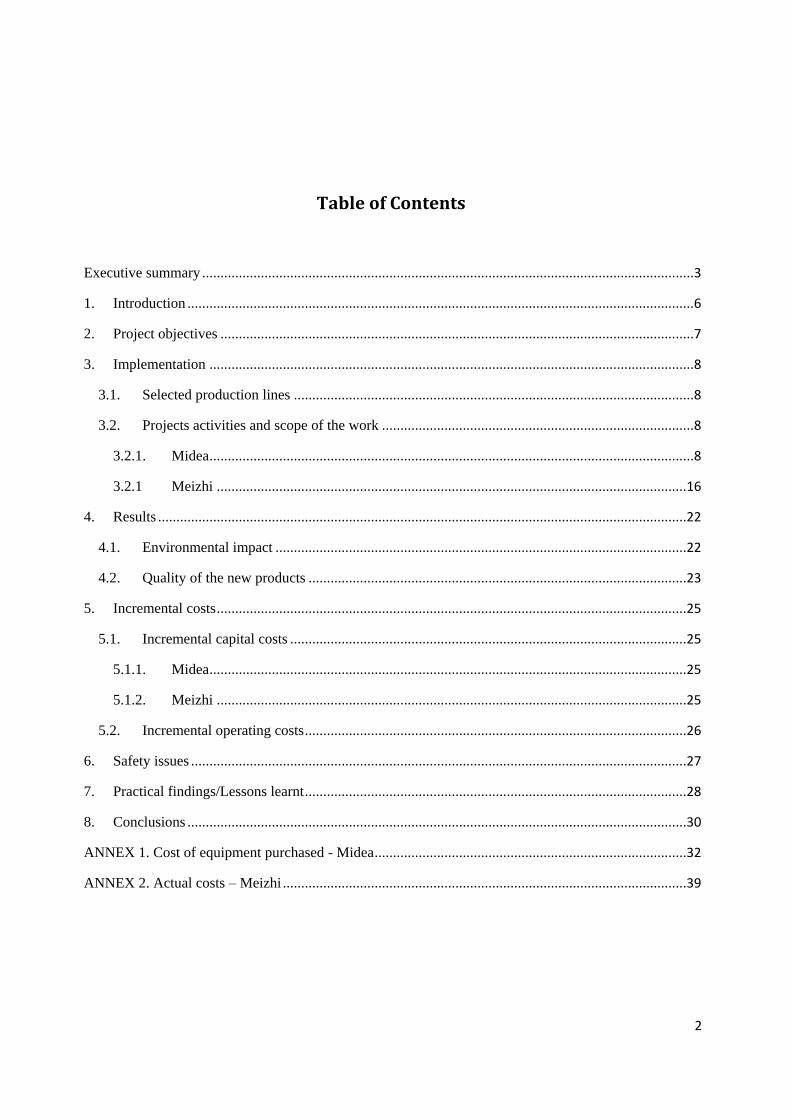
2
Table of Contents
Executive summary ...................................................................................................................................... 3
1. Introduction .......................................................................................................................................... 6
2. Project objectives ................................................................................................................................. 7
3. Implementation .................................................................................................................................... 8
3.1. Selected production lines ............................................................................................................. 8
3.2. Projects activities and scope of the work ..................................................................................... 8
3.2.1. Midea .................................................................................................................................... 8
3.2.1 Meizhi ................................................................................................................................16
4. Results ................................................................................................................................................22
4.1. Environmental impact ................................................................................................................22
4.2. Quality of the new products .......................................................................................................23
5. Incremental costs ................................................................................................................................25
5.1. Incremental capital costs ............................................................................................................25
5.1.1. Midea ..................................................................................................................................25
5.1.2. Meizhi ................................................................................................................................25
5.2. Incremental operating costs ........................................................................................................26
6. Safety issues .......................................................................................................................................27
7. Practical findings/Lessons learnt ........................................................................................................28
8. Conclusions ........................................................................................................................................30
ANNEX 1. Cost of equipment purchased - Midea .....................................................................................32
ANNEX 2. Actual costs – Meizhi ..............................................................................................................39
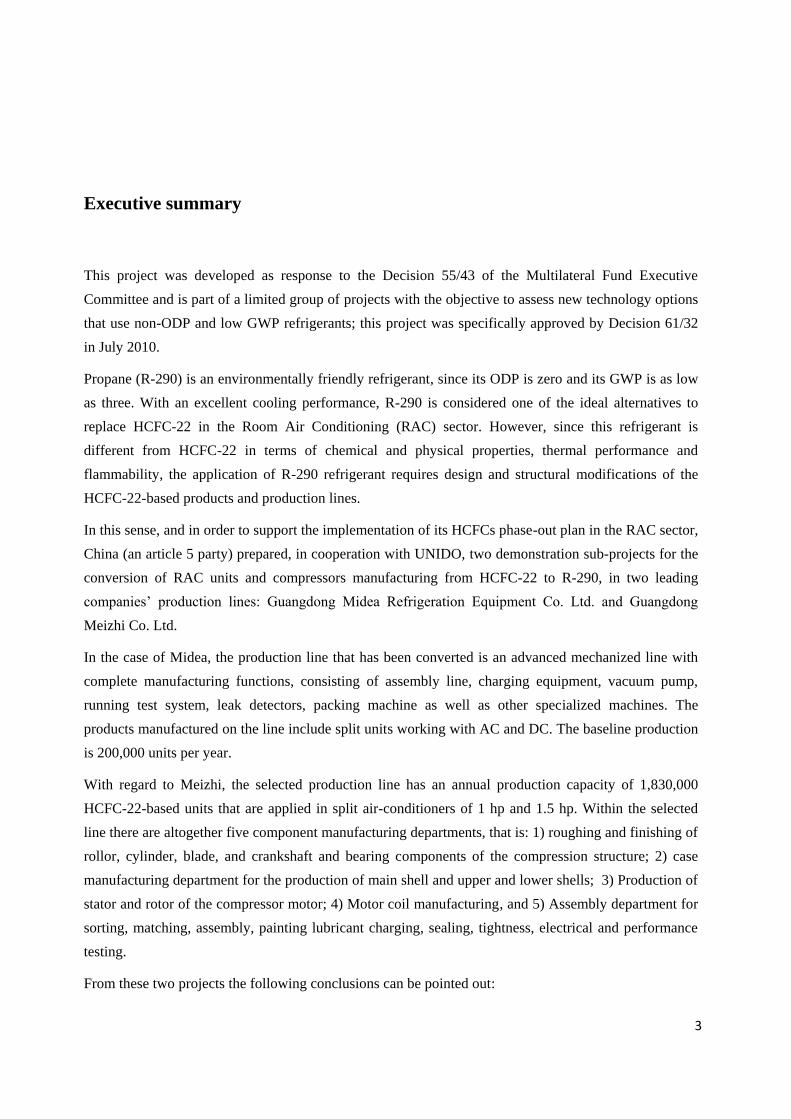
3
Executive summary
This project was developed as response to the Decision 55/43 of the Multilateral Fund Executive
Committee and is part of a limited group of projects with the objective to assess new technology options
that use non-ODP and low GWP refrigerants; this project was specifically approved by Decision 61/32
in July 2010.
Propane (R-290) is an environmentally friendly refrigerant, since its ODP is zero and its GWP is as low
as three. With an excellent cooling performance, R-290 is considered one of the ideal alternatives to
replace HCFC-22 in the Room Air Conditioning (RAC) sector. However, since this refrigerant is
different from HCFC-22 in terms of chemical and physical properties, thermal performance and
flammability, the application of R-290 refrigerant requires design and structural modifications of the
HCFC-22-based products and production lines.
In this sense, and in order to support the implementation of its HCFCs phase-out plan in the RAC sector,
China (an article 5 party) prepared, in cooperation with UNIDO, two demonstration sub-projects for the
conversion of RAC units and compressors manufacturing from HCFC-22 to R-290, in two leading
companies’ production lines: Guangdong Midea Refrigeration Equipment Co. Ltd. and Guangdong
Meizhi Co. Ltd.
In the case of Midea, the production line that has been converted is an advanced mechanized line with
complete manufacturing functions, consisting of assembly line, charging equipment, vacuum pump,
running test system, leak detectors, packing machine as well as other specialized machines. The
products manufactured on the line include split units working with AC and DC. The baseline production
is 200,000 units per year.
With regard to Meizhi, the selected production line has an annual production capacity of 1,830,000
HCFC-22-based units that are applied in split air-conditioners of 1 hp and 1.5 hp. Within the selected
line there are altogether five component manufacturing departments, that is: 1) roughing and finishing of
rollor, cylinder, blade, and crankshaft and bearing components of the compression structure; 2) case
manufacturing department for the production of main shell and upper and lower shells; 3) Production of
stator and rotor of the compressor motor; 4) Motor coil manufacturing, and 5) Assembly department for
sorting, matching, assembly, painting lubricant charging, sealing, tightness, electrical and performance
testing.
From these two projects the following conclusions can be pointed out:
4
- With an excellent cooling performance, R-290 is considered one of the ideal alternatives of
HCFC-22 in the RAC sector after conversion of production lines.
- R-290 is available in the Chinese market.
- The conversion of two of the most important production lines of RAC units and compressors in
China has maintained the quality and performance of the appliances produced by these two
companies. Their performance is consistent with national (CCC) and international standards
(IEC/CB and CE), and this has already been certified by the authorities.
- In order to obtain such improvements in the new products’ performance, as well as in the system
optimization, significant additional efforts were required in terms of co-financing by both
companies.
- Regarding the new compressors’ performance, the energy efficiency is 2%-3% higher than
HCFC-22 compressors.
- Concerning the new RAC units’ performance, the energy efficiency is 5%-12% higher than
HCFC-22 air-conditioners.
- Further efficiency improvement both in compressors and AC units could be achieved if the
charge sizes specified in international standards were relaxed, since there is a relationship
between charge and efficiency. Until then, efficiency improvement is mainly dependent on the
actual R&D - invested in the product in the past several years and the years to come - and also
on system optimization, which was required as in most refrigeration conversion activities in the
past.
- Two types of R-290 compressors (fixed and variable frequency) with 1 HP and COP of
4.12-4.33 are available for mass production after the conversion of the production line.
- Two types of R-290 RAC units (split/VF and portable A/C) and six different models are
also available for mass production after conversion.
- The conversion of production lines and the manufacturing of new appliances can be handled
safely, despite the flammability of R-290, if appropriate measures are implemented and
appropriate tools and equipment are used.
- Developments continue post-project with the aim to minimize and simplify product
modifications while maintaining safety; as well as to reduce the refrigerant charge in order to
expand the range of products.
- The experiments and assessments show that the possibility of fire and explosion for a wall-
mounted R-290 air-conditioner is only 10-8-10-9 per year under household use conditions in
China. Nevertheless, the next stages of phase-out programme should focus on risks in the
servicing and installation processes, risks at different charges, and secondary risks from a fire.

5
- Besides, in order to foster the introduction of this new technology in the Chinese market it is
necessary to establish new policies and financial measures, as well as updated safety standards.
Incremental capital costs
- In the case of both Midea and Meizhi, the projects have had higher capital costs than the agreed
project budget.
Incremental operating costs
- Regarding Midea’s project, the estimated IOC for one split unit is currently US$ 41.95.
Although the actual IOC is significantly higher than the eligible USD 6.3/kg, these additional
costs are associated with the product initiation and expected to decrease in future, albeit not
quite the level of the IOC threshold. In addition, the methodology for applying the safety
measures is also being refined.
- The cost of the new compressor manufactured by Meizhi is US$ 7.57 higher than the HCFC-22
based compressor (cost already part of the above calculation). IOC for compressor for Midea
was not covered by the funds provided by the MLF, instead the conversion of Meizhi
compressor manufacturing line was financed.
The approval and implementation of these demonstration projects was key for the development of R290
units and was a basis for the RAC phase-out strategy in China. As a result, by now, most RAC
manufacturers in China are involved in R290 conversion activities and R&D.
While these demonstration projects in China were successful, the application of hydrocarbon (HC)
technology should be carefully evaluated in context of the local situation prevailing in each country. The
report by no means concludes that the technology was sufficiently consolidated to be applied in all
countries, and did not address issues of availability and cost in the field. Finally, interested parties must
take into consideration the proprietary issues related to the technology.

6
1. Introduction
In 2007, the 19th Meeting of the Parties of the Montreal Protocol agreed on accelerating the phase-out of
HCFCs. To achieve the compliance goal, China is implementing a HCFCs phase-out sector plan in the
Room Air Conditioning (RAC) sector since 2012. In order to support the implementation of this sector
plan, China prepared, in cooperation with UNIDO, two demonstration projects (hereafter, the projects)
for the conversion of RAC and compressors manufacturing from HCFC-22 to propane (R-290), in two
different companies: Guangdong Midea Refrigeration Equipment Co. Ltd. and Guangdong Meizhi Co.
Ltd.
The Executive Committee (ExCom) approved the Midea and Meizhi projects at the 61st ExCom
meeting, with a budget of US$ 4,026,507 and US$ 1,875,000, respectively. UNIDO has been the
implementing international agency of the two projects, while the Foreign Economic Cooperation Office
of China (FECO), which is part of the Ministry of Environmental Protection, has been the national
implementing agency.
Guangdong Midea Refrigeration Equipment Co., Ltd was jointly funded by Guangdong Midea Electric
Appliances Inc. (80%) and Toshiba-Carrier Corporation (20%) in 2000. Midea is a large-scale enterprise
focusing on the development, production, sales and after-sales service of domestic, commercial and
central air-conditioners. As one of the leading manufacturers in the RAC sector of China, Midea has
altogether 75 RAC production lines and the annual production capacity amounts to 20,000,000 units.
Guandong Meizhi Refrigeration Equipment Company Co., Ltd is a comprehensive technology-oriented
compressor manufacturer established in September 1995. It is owned by Guangdong Midea Electric
Appliances Group (60% share) and Toshiba (40% share). Meizhi belongs to the refrigeration business
group of Midea, and it is specializing in the production, sale, and R&D of domestic compressors, mainly
for RAC appliances, but also for refrigeration.
Since these two companies are joint ventures shared by local and foreign companies, the budget
allocated by the ExCom covers the associated costs of the projects in the same proportion as the local
ownership, that is: 80% in the case of Midea and 60% in the case of Meizhi. For this reason, co-
financing was needed to cover the rest of the associated costs.
The conversion projects in these two companies were developed as response to the Decision 55/43 (b) of
the Multilateral Fund Executive Committee, which is intended to select projects that best demonstrated
alternative technologies and facilitated the collection of accurate data on incremental capital costs and
incremental operating costs or savings, as well as other data relevant to the application of the
technologies. They are also part of a limited group of projects with the objective to assess new
technology options that use refrigerants with zero ozone depleting potential (ODP) and low global
warming potential (GWP).

7
2. Project objectives
R-290 is an environmentally friendly refrigerant, since its ODP is zero and its GWP is as low as three.
With an excellent cooling performance, R-290 is considered one of the ideal alternatives of HCFC-22 in
RAC sector. However, since this refrigerant is different from HCFC-22 in terms of chemical and
physical properties, thermal performance and flammability, the application of R-290 refrigerant
necessitates design and structural modifications of the HCFC-22-based products and their production
lines.
Table 1. Physical properties of R-290 compared to HCFC-22
Parameters HCFC-22 R-290
Molecular formula CHCLF2 C3H8
Molecular weight 86.5 44.1
Critical temperature ℃ 96.2 96.8
Critical pressure (MPa) 4.99 4.25
Boiling point (℃) -40.8 -42.1
Lower flammable limit (v%) N 2.1
Burning velocity (cm/s) N 39
Combustion heat (KJ/mol) N 2217.8
GWP 1700 3
ODP 0.055 0
In this sense, these projects consist of the conversion of two HCFC-22-based production lines of both
split room air-conditioners and compressors, to R-290 technology1, with no capacity increase and quality
upgrade, in order to:
Promote the replacement of HCFC in RAC manufacturing sector;
Demonstrate redesign of split RAC units and compressors for the use of R-290 refrigerant;
Seek solutions and obtain experience in safe conversion of production lines, refrigerant storage
and handling facilities,
Demonstrate alternative production techniques in air-conditioner and compressor
manufacturing;
Undertake training and marketing of RAC appliances and compressors using R-290 refrigerant;
Elaborate techniques and processes as well as to collect experience in transportation and
installation of R-290 split RACs;
Support the testing and verification of the conversion of manufacturing of HCFC-22-based
compressors to R-290-based compressor and;
1 Refrigerant R-290 is currently available in the Chinese market.

8
Accumulate and disseminate experience for future technical conversion projects.
With the conversion of Meizhi’s production line, the new compressors will indirectly phase out 2,196
metric tons of HCFC-22, with an impact of 121 ODP tons per year. In the case of Midea, the new RAC
units will phase out 240 metric tons per year, with an impact of 13.2 ODP tons per year.
3. Implementation
3.1. Selected production lines
In the case of Midea, the production line that has been converted is an advanced mechanized line with
complete manufacturing functions, consisting of assembly line, charging equipment, vacuum pump,
running test system, leak detectors, packing machine as well as other specialized machines. The
products manufactured on the line include split unit working with AC and DC. The production line met
quality and safety requirements and its baseline production was 200,000 units per year.
The company produces most of the components, including heat exchangers. The compressors are
purchased from Meizhi compressor factory.
In the case of Meizhi, among the eleven domestic RAC compressor production lines of the company, it
has been converted the one with an annual production capacity of 1,830,000 HCFC-22-based units. The
compressors of this line are applied in split air-conditioners of 1 hp and 1.5 hp. Within the selected line
there are altogether five component manufacturing departments:
Roughing and finishing of rollor, cylinder, blade, and crankshaft and bearing components of the
compression structure;
Case manufacturing department for the production of main shell and upper and lower shells;
Production of stator and rotor of the compressor motor;
Motor coil manufacturing and;
Assembly department for sorting, matching, assembly, painting lubricant charging, sealing,
tightness, electrical and performance testing etc.
3.2. Projects activities and scope of the work
3.2.1. Midea
After the project was approved in July 2010, FECO and UNIDO signed a contract in May 2011 for its
implementation. After 30 months implementation, the conversion project was completed by the end of
2013, and all equipment and lab facilities were installed and tested. Midea has developed different types
of A/C products for domestic and oversea markets. It entrusted the national quality supervision and
inspection center and the provider of technical services TUV to carry out product test. The test focused

9
especially on the safety of products. The R-290 A/C has received the China Compulsory Certificate
(CCC), the IEC/CB certificate, and the CE certificate.
The following activities were carried out in the implementation: production line planning, conversion of
product testing unit, modification of production process, product redesign and development, set-up of
prototype and training2.
The residential air conditioner research and development center of Midea was responsible for the overall
coordination and management of the project implementation.
Production line planning
Capacity of R-290 production line
The R-290 production line was converted from an existing HCFC-22 line. The capacity of this
production line will be 200,000 units annually. It can produce outdoor units, including VF, for split A/C
of 1.5HP and below, portable A/C, window A/C and dehumidifiers.
Location and construction plan
The old line was located in a plant with other 6 lines. Considering the flammability of R-290, the
company decided to select a new production site, separated from other lines. In this sense, it was decided
that the production line would be moved to the second floor of No9 plant building. The size of the new
production area is 1,800 m2, from previously around 1,000 m2, but this increase in the operating area is
not related to the flammability of R-290, neither is it to any increase in production capacity.
Conversion of production line
The following conversions and modifications were carried out to the production line:
2 Transportation, installation and servicing of R-290 AC units are part of an ongoing R&D project under the Stage I HPMP of
the RAC sector.
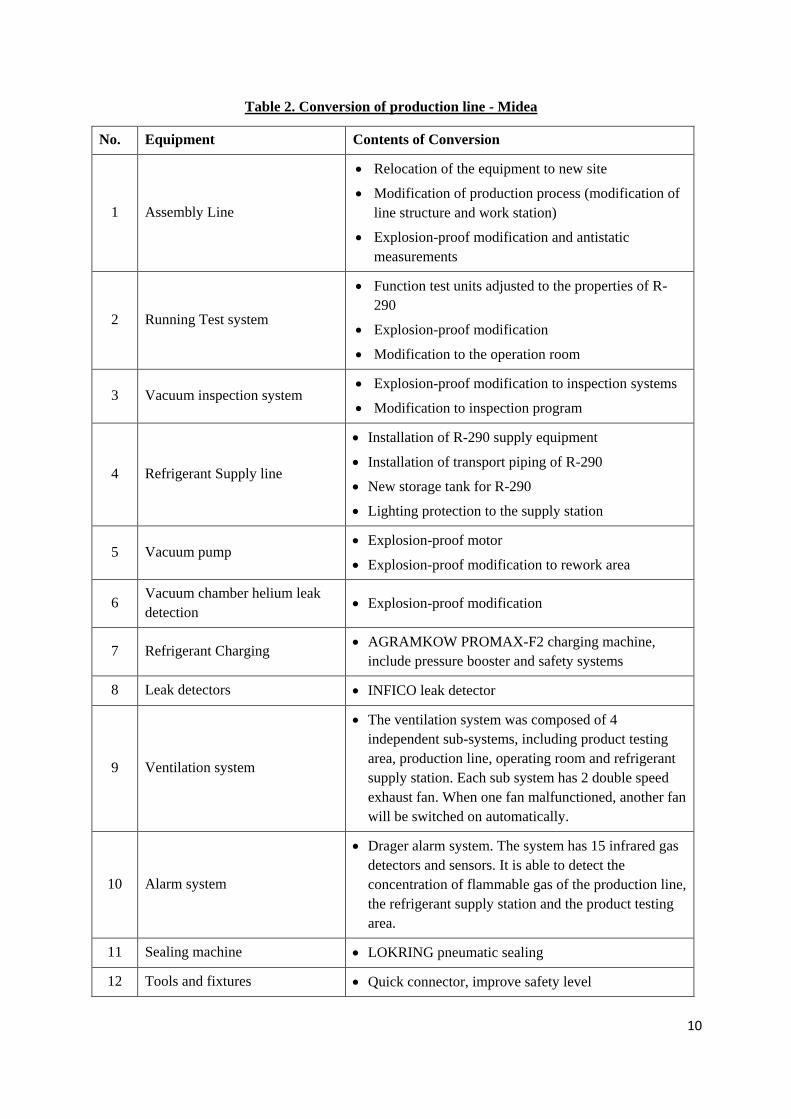
10
Table 2. Conversion of production line - Midea
No. Equipment Contents of Conversion
1 Assembly Line
Relocation of the equipment to new site
Modification of production process (modification of
line structure and work station)
Explosion-proof modification and antistatic
measurements
2 Running Test system
Function test units adjusted to the properties of R-
290
Explosion-proof modification
Modification to the operation room
3 Vacuum inspection system Explosion-proof modification to inspection systems
Modification to inspection program
4 Refrigerant Supply line
Installation of R-290 supply equipment
Installation of transport piping of R-290
New storage tank for R-290
Lighting protection to the supply station
5 Vacuum pump Explosion-proof motor
Explosion-proof modification to rework area
6 Vacuum chamber helium leak
detection Explosion-proof modification
7 Refrigerant Charging AGRAMKOW PROMAX-F2 charging machine,
include pressure booster and safety systems
8 Leak detectors INFICO leak detector
9 Ventilation system
The ventilation system was composed of 4
independent sub-systems, including product testing
area, production line, operating room and refrigerant
supply station. Each sub system has 2 double speed
exhaust fan. When one fan malfunctioned, another fan
will be switched on automatically.
10 Alarm system
Drager alarm system. The system has 15 infrared gas
detectors and sensors. It is able to detect the
concentration of flammable gas of the production line,
the refrigerant supply station and the product testing
area.
11 Sealing machine LOKRING pneumatic sealing
12 Tools and fixtures Quick connector, improve safety level

11
The layout of the production line is shown in the picture below:
Picture 1. Layout of the production line.
Area A: refrigerant charging area
Area B: performance testing area
Area C: leakage detecting and final testing area
Area D: products inspection area
Area E: refrigerants supply station
Area F: other assembly
Regarding the modification of production process in the assembly line, the structure remained the same
with some differences, mainly related to the safety measures required for the R-290. After the assembly
of the units, there is a N2/H2 pressure and leak test to control the tightness of the assembled unit ,
followed by evacuation of the units. After this, charging takes place followed by a leak test, which
includes a repair area. Then, there is a sealing (ultrasonic welding or Lokring) function test, followed by
a leak test and packaging. In hazardous areas (charging, repair, testing areas) there are dedicated
ventilation systems and enclosures to avoid spreading R-290 in case of a leak.
Concerning the running test system, a new function test room was built with R-290 indoor units,
antistatic floor, proper ventilation and earthing system. Besides, as regards the vacuum inspection
system, gas sensors have been installed in hazardous areas, triggering ventilation system when needed,
and activating the automatic shut off only after continued leak.
Finally, regarding the refrigerant charging machines, electrical components are separated and
encapsulated to avoid contact with the refrigerant. There is an enclosure at the charging area to avoid
spreading R290. There is antistatic floor, there are proper earthing connections and there is ventilation in
the charging station as well as in the enclosure as well as under the conveyor belt. For refrigerant supply,
a dedicated storage area is located outside, next to the building.

12
Procurement of new equipment
The company made a procurement plan according to the implementation plan. The procurement was
finished in March 2013. By July 2013, all equipment has been installed and commissioned by the
company.
Product redesign and development
Dimension
Indoor unit:930x370x298 (mm)
Outdoor unit:760x285x590
Picture 2. Product redesign.
Configuration
Heat exchanger for indoor unit
Φ7 Inner grooved copper tube, 4 input and 4 output. The main purpose of the heat exchanger
modification is to reduce the charge size, and it is related to the reduction of the tube diameter. This
reduced diameter may have a positive impact on the heat transfer coefficient.
Picture 3. Configuration
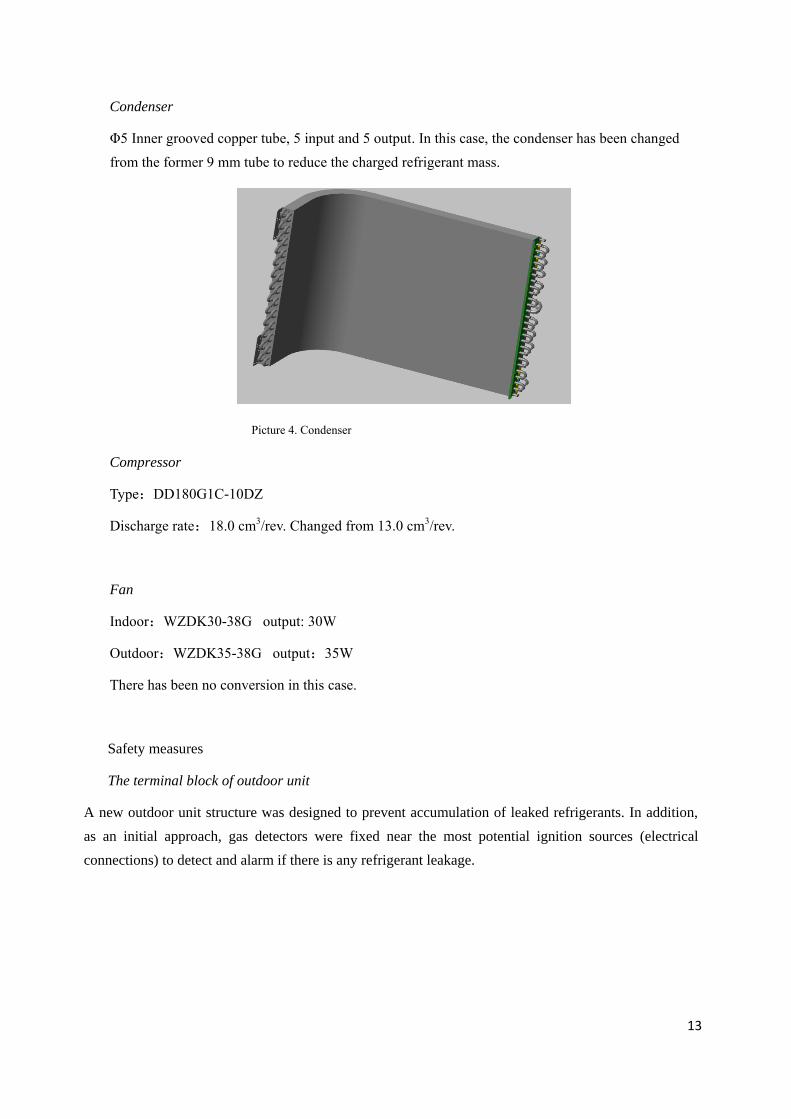
13
Condenser
Φ5 Inner grooved copper tube, 5 input and 5 output. In this case, the condenser has been changed
from the former 9 mm tube to reduce the charged refrigerant mass.
Picture 4. Condenser
Compressor
Type:DD180G1C-10DZ
Discharge rate:18.0 cm3/rev. Changed from 13.0 cm3/rev.
Fan
Indoor:WZDK30-38G output: 30W
Outdoor:WZDK35-38G output:35W
There has been no conversion in this case.
Safety measures
The terminal block of outdoor unit
A new outdoor unit structure was designed to prevent accumulation of leaked refrigerants. In addition,
as an initial approach, gas detectors were fixed near the most potential ignition sources (electrical
connections) to detect and alarm if there is any refrigerant leakage.
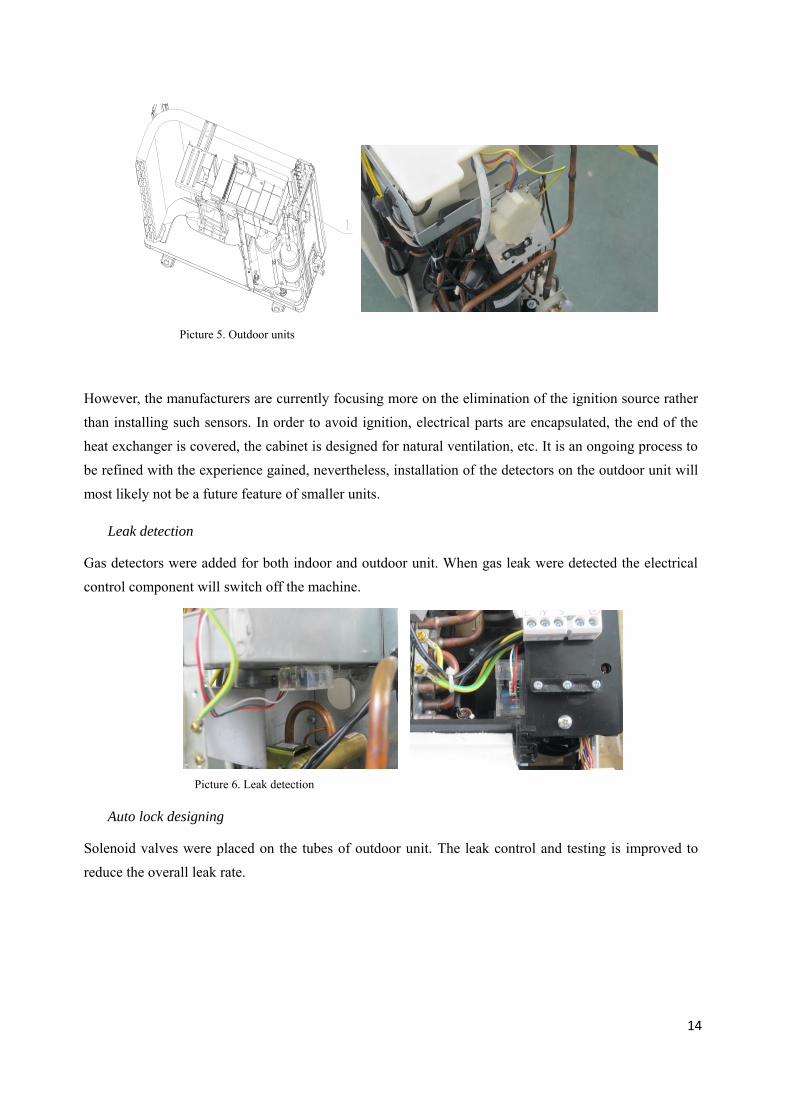
14
Picture 5. Outdoor units
However, the manufacturers are currently focusing more on the elimination of the ignition source rather
than installing such sensors. In order to avoid ignition, electrical parts are encapsulated, the end of the
heat exchanger is covered, the cabinet is designed for natural ventilation, etc. It is an ongoing process to
be refined with the experience gained, nevertheless, installation of the detectors on the outdoor unit will
most likely not be a future feature of smaller units.
Leak detection
Gas detectors were added for both indoor and outdoor unit. When gas leak were detected the electrical
control component will switch off the machine.
Picture 6. Leak detection
Auto lock designing
Solenoid valves were placed on the tubes of outdoor unit. The leak control and testing is improved to
reduce the overall leak rate.
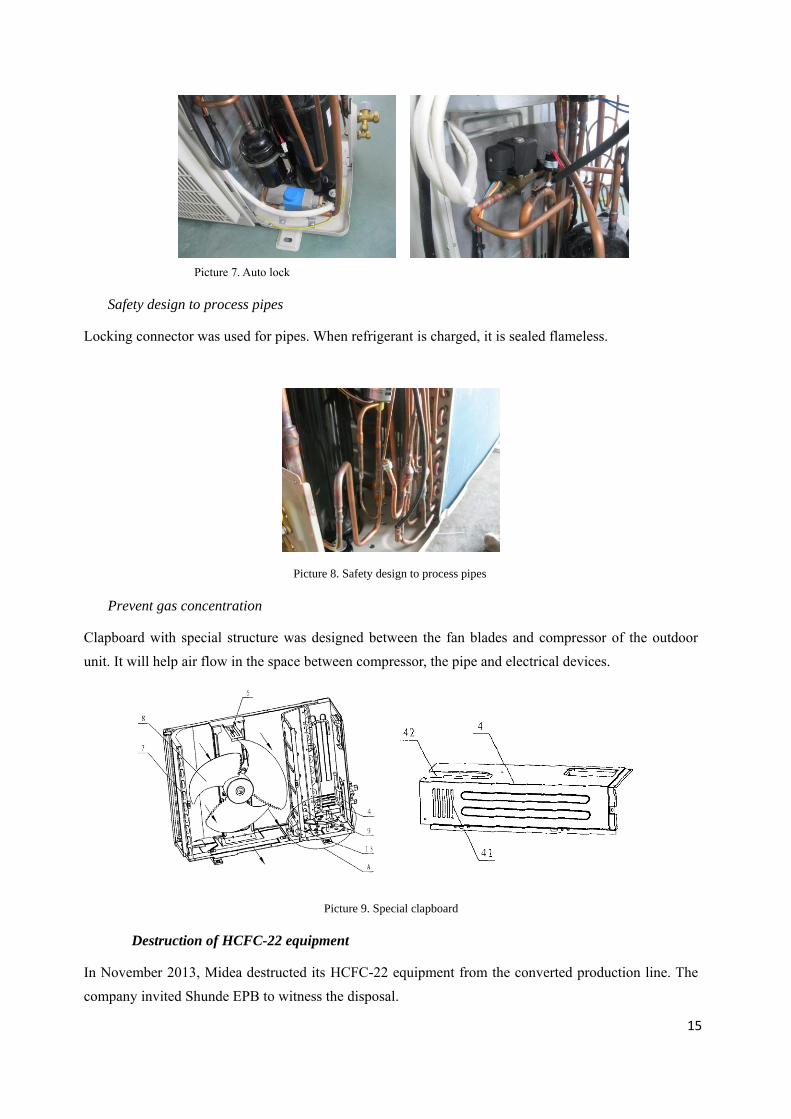
15
Picture 7. Auto lock
Safety design to process pipes
Locking connector was used for pipes. When refrigerant is charged, it is sealed flameless.
Picture 8. Safety design to process pipes
Prevent gas concentration
Clapboard with special structure was designed between the fan blades and compressor of the outdoor
unit. It will help air flow in the space between compressor, the pipe and electrical devices.
Picture 9. Special clapboard
Destruction of HCFC-22 equipment
In November 2013, Midea destructed its HCFC-22 equipment from the converted production line. The
company invited Shunde EPB to witness the disposal.
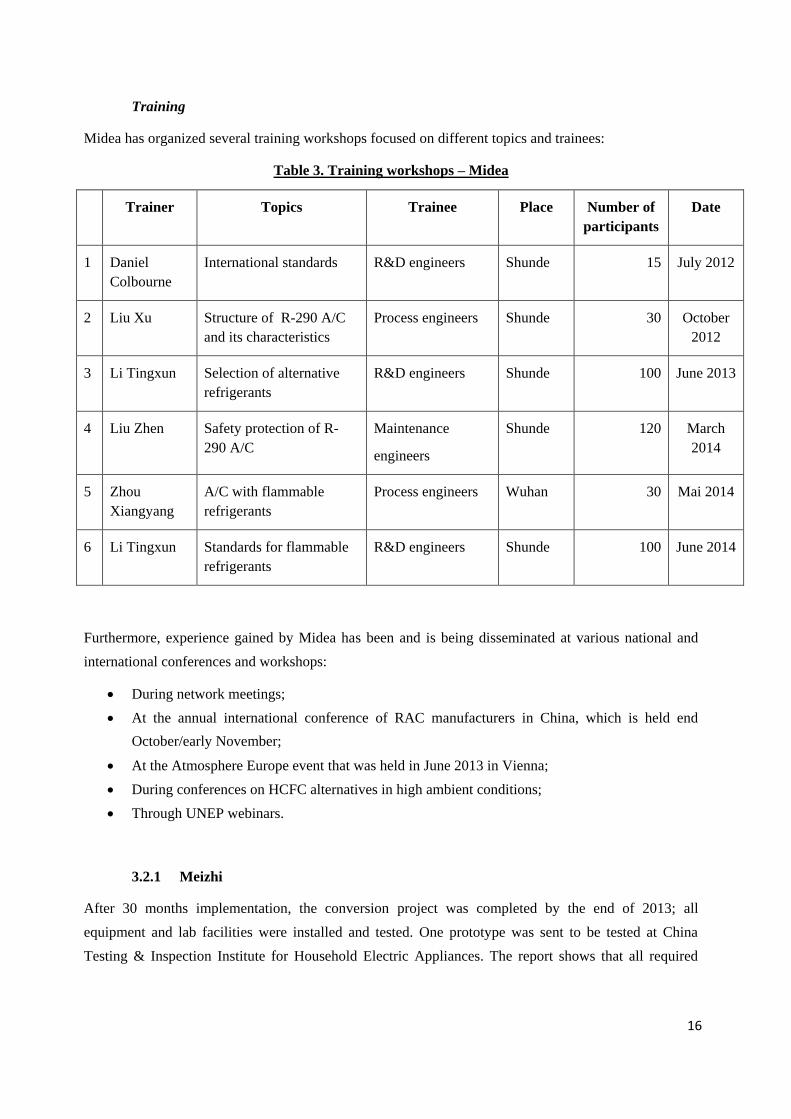
16
Training
Midea has organized several training workshops focused on different topics and trainees:
Table 3. Training workshops – Midea
Trainer Topics Trainee Place Number of
participants
Date
1 Daniel
Colbourne
International standards R&D engineers Shunde 15 July 2012
2 Liu Xu Structure of R-290 A/C
and its characteristics
Process engineers Shunde 30 October
2012
3 Li Tingxun Selection of alternative
refrigerants
R&D engineers Shunde 100 June 2013
4 Liu Zhen Safety protection of R-
290 A/C
Maintenance
engineers
Shunde 120 March
2014
5 Zhou
Xiangyang
A/C with flammable
refrigerants
Process engineers Wuhan 30 Mai 2014
6 Li Tingxun Standards for flammable
refrigerants
R&D engineers Shunde 100 June 2014
Furthermore, experience gained by Midea has been and is being disseminated at various national and
international conferences and workshops:
During network meetings;
At the annual international conference of RAC manufacturers in China, which is held end
October/early November;
At the Atmosphere Europe event that was held in June 2013 in Vienna;
During conferences on HCFC alternatives in high ambient conditions;
Through UNEP webinars.
3.2.1 Meizhi
After 30 months implementation, the conversion project was completed by the end of 2013; all
equipment and lab facilities were installed and tested. One prototype was sent to be tested at China
Testing & Inspection Institute for Household Electric Appliances. The report shows that all required

17
parameters can meet national standards. The production line is ready for final commission, which is
planned for November 20143.
The following activities were carried out in the implementation: product redesign, procurement of
necessary equipment and systems, modification of tools and parts, installation, debugging and trial of
production lines, training, pilot production and performance testing of R-290 compressor as well as
technology dissemination.
Product redesign
Three types of compressor were designed, including both fixed frequency and variable frequency. The
specifications of compressors are as below:
Table 4. Types of compressors
Type Power Capacity
(w) HP(w)*
COP (w/w)*
R-290 HCFC-
221
Minimum
requirements
DSK118D10UBZ DC INV 1700 515 3.3 --- ---
DSN180V1UDZ 220/240V/50Hz 2700 820 3.29 --- ---
DSM180V1UDZ 220/240V/50Hz 2700 830 3.25 3.15 3.10
1. There are no basic R-22 models of DSK118D and DSN180V, these two models were specially designed for R-290. The
DSM180V is developed based on R-22 model HSM180V, but the motor of DSM and HSM is different, so the result is only
for reference.
Other design changes are described and illustrated on the series of pictures of the various main parts
affected.
3 The other two prototypes will apply also the certification and the schedule depends on the market demand.

18
CYLINDER
MAIN
Change of:
Inner Diameter,
Height,
Position of bolt
holes,
Change of:
Inner Diameter,
Height,
Position of bolt
holes,
SUB
BEARING
Change of:
Height,
ROLLER
BLADE
Change of:
Inner diameter,
Change of:
Inner and outer
Change of:
Outer diameter, CRANK
STATOR
Change of:
Inner and outer
diameters,

19
P
Picture 10. Design changes on different compressor’s parts.
The conversion of the compressor was done with the following two objectives:
a) To increase compressor swept volume to offset the slightly reduced capacity of R-290, which
has also an impact on the electromotor.
b) To optimize the compressor in order to minimize the refrigerant contained in the oil. As a result
of this effort, the compressor contributed to approximately 5% charge reduction in the RAC unit
and the oil quantity was also reduced.
Lubricant selection
Besides the reduction of the charge size, one of the main challenges in the manufacturing of these
appliances was the development of a suitable lubricant4 5.
Regarding the technical aspects of oil selection, besides the basic property called for lubricant oil, the
other three key points are solubility, miscibility and viscosity.
Since R-290 has very good solubility with almost all kinds of oil, the manufacturer considers that the
lowest the solubility and the miscibility, the better.
4 Due to the changed performance of the lubricant, the anti-wear treatment of some of the components of the compressor was
modified. In this sense, for example, the wear of vane tip was too large after compressor left test, and this problem was solved
by increase the hardness of the vane tip like use the treatment CrN or DLC coating. 5 The supply of raw material, on the contrary, is not a challenge for the development of a suitable lubricant, since compressors
manufacturers in China are working together with lubricant suppliers.
Change of:
inner and outer diameters,
shape of lamination,
shape of balancer
Change of:
outer diameter
ROTOR
UPPER CASE
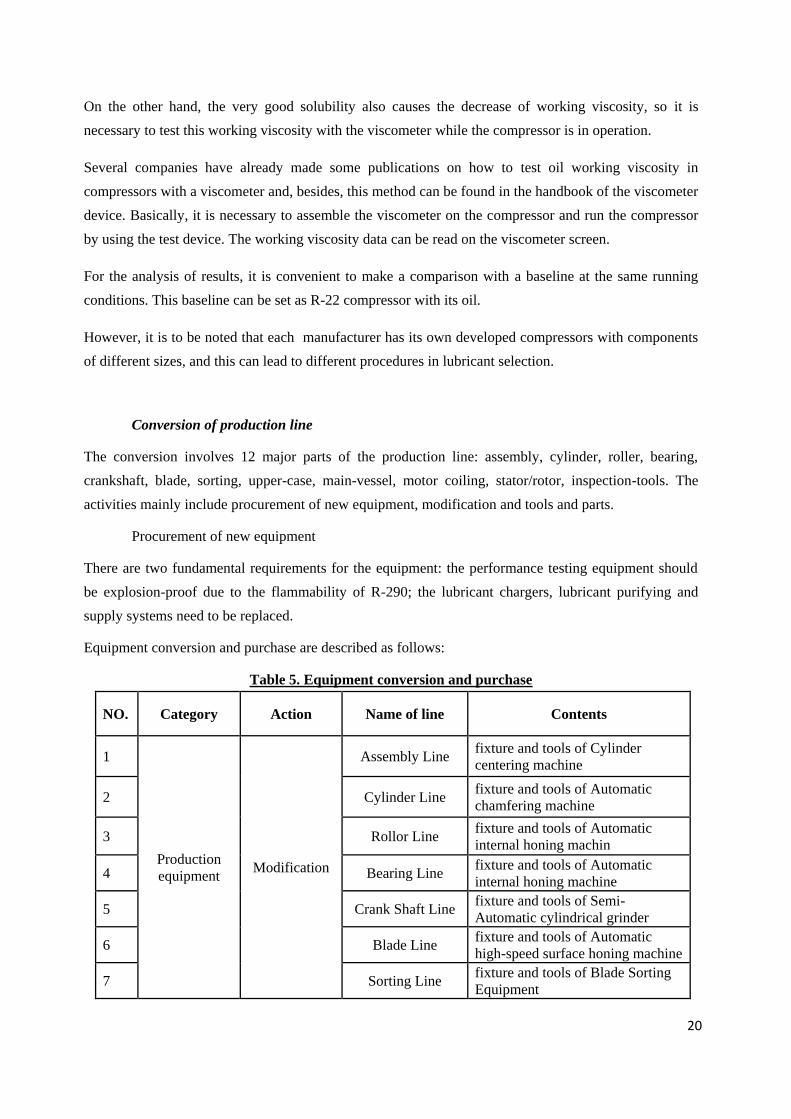
20
On the other hand, the very good solubility also causes the decrease of working viscosity, so it is
necessary to test this working viscosity with the viscometer while the compressor is in operation.
Several companies have already made some publications on how to test oil working viscosity in
compressors with a viscometer and, besides, this method can be found in the handbook of the viscometer
device. Basically, it is necessary to assemble the viscometer on the compressor and run the compressor
by using the test device. The working viscosity data can be read on the viscometer screen.
For the analysis of results, it is convenient to make a comparison with a baseline at the same running
conditions. This baseline can be set as R-22 compressor with its oil.
However, it is to be noted that each manufacturer has its own developed compressors with components
of different sizes, and this can lead to different procedures in lubricant selection.
Conversion of production line
The conversion involves 12 major parts of the production line: assembly, cylinder, roller, bearing,
crankshaft, blade, sorting, upper-case, main-vessel, motor coiling, stator/rotor, inspection-tools. The
activities mainly include procurement of new equipment, modification and tools and parts.
Procurement of new equipment
There are two fundamental requirements for the equipment: the performance testing equipment should
be explosion-proof due to the flammability of R-290; the lubricant chargers, lubricant purifying and
supply systems need to be replaced.
Equipment conversion and purchase are described as follows:
Table 5. Equipment conversion and purchase
NO. Category Action Name of line Contents
1
Production
equipment Modification
Assembly Line fixture and tools of Cylinder
centering machine
2 Cylinder Line fixture and tools of Automatic
chamfering machine
3 Rollor Line fixture and tools of Automatic
internal honing machin
4 Bearing Line fixture and tools of Automatic
internal honing machine
5 Crank Shaft Line fixture and tools of Semi-
Automatic cylindrical grinder
6 Blade Line fixture and tools of Automatic
high-speed surface honing machine
7 Sorting Line fixture and tools of Blade Sorting
Equipment
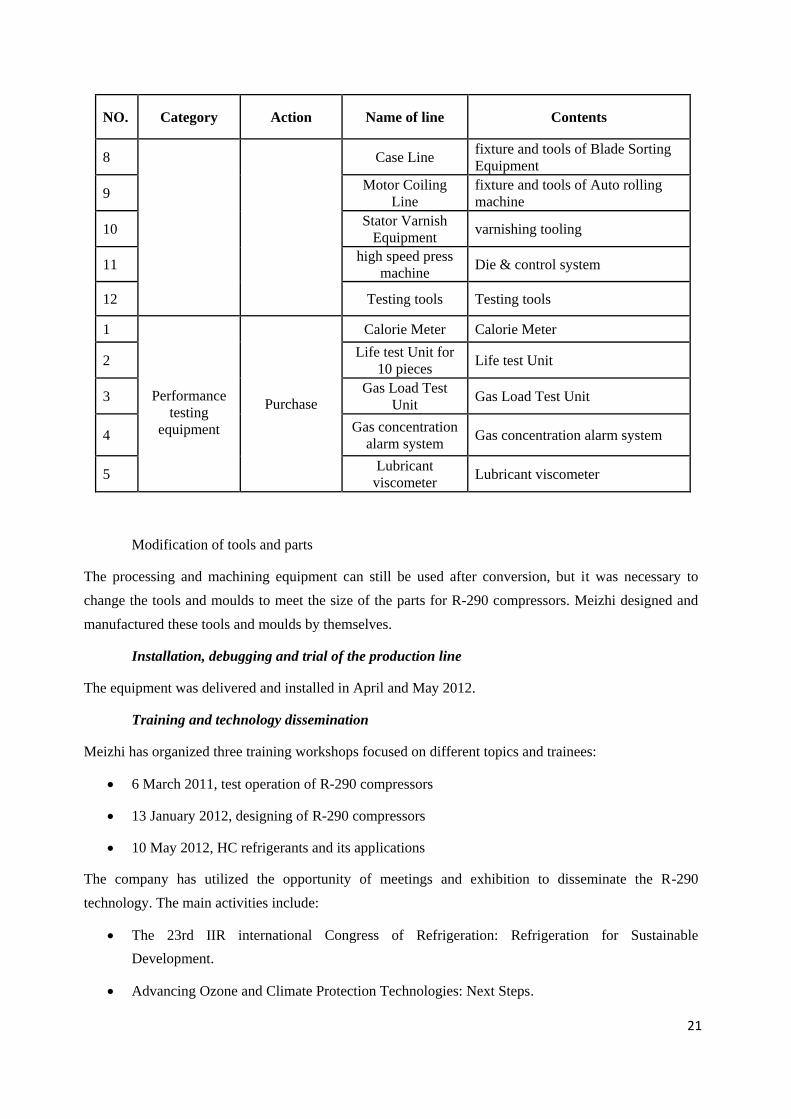
21
NO. Category Action Name of line Contents
8 Case Line fixture and tools of Blade Sorting
Equipment
9 Motor Coiling
Line
fixture and tools of Auto rolling
machine
10 Stator Varnish
Equipment varnishing tooling
11 high speed press
machine Die & control system
12 Testing tools Testing tools
1
Performance
testing
equipment
Purchase
Calorie Meter Calorie Meter
2 Life test Unit for
10 pieces Life test Unit
3 Gas Load Test
Unit Gas Load Test Unit
4 Gas concentration
alarm system Gas concentration alarm system
5 Lubricant
viscometer Lubricant viscometer
Modification of tools and parts
The processing and machining equipment can still be used after conversion, but it was necessary to
change the tools and moulds to meet the size of the parts for R-290 compressors. Meizhi designed and
manufactured these tools and moulds by themselves.
Installation, debugging and trial of the production line
The equipment was delivered and installed in April and May 2012.
Training and technology dissemination
Meizhi has organized three training workshops focused on different topics and trainees:
6 March 2011, test operation of R-290 compressors
13 January 2012, designing of R-290 compressors
10 May 2012, HC refrigerants and its applications
The company has utilized the opportunity of meetings and exhibition to disseminate the R-290
technology. The main activities include:
The 23rd IIR international Congress of Refrigeration: Refrigeration for Sustainable
Development.
Advancing Ozone and Climate Protection Technologies: Next Steps.
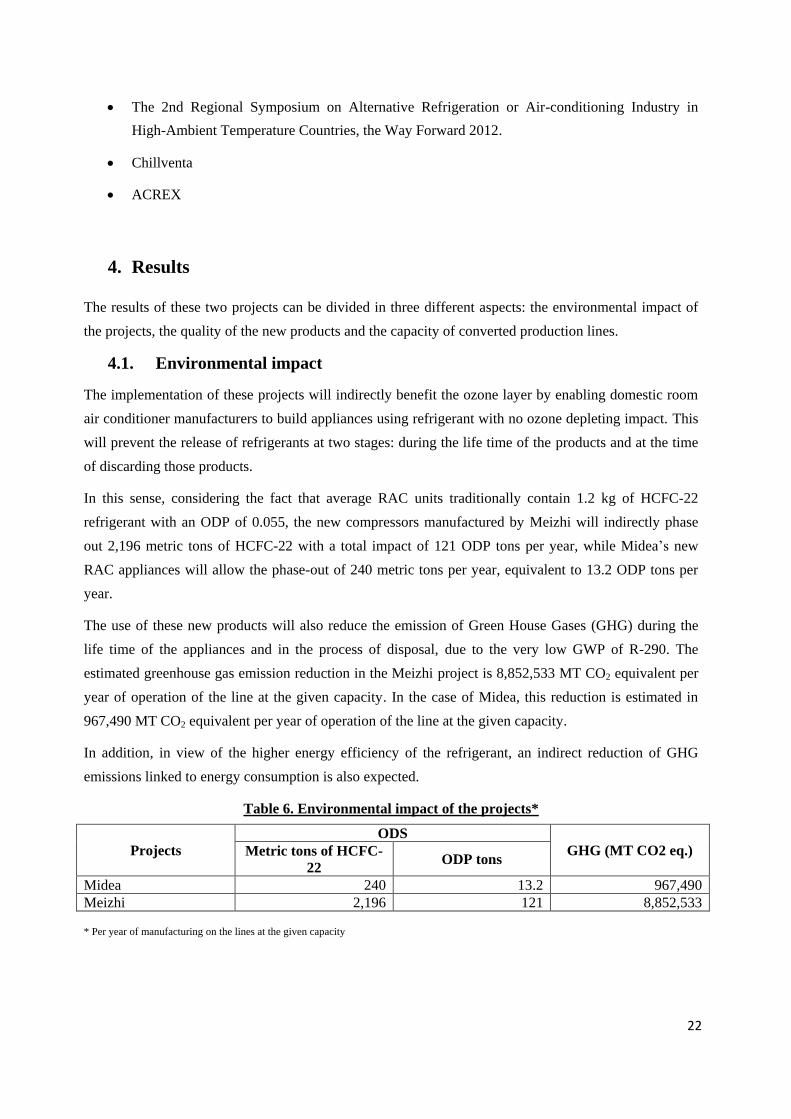
22
The 2nd Regional Symposium on Alternative Refrigeration or Air-conditioning Industry in
High-Ambient Temperature Countries, the Way Forward 2012.
Chillventa
ACREX
4. Results
The results of these two projects can be divided in three different aspects: the environmental impact of
the projects, the quality of the new products and the capacity of converted production lines.
4.1. Environmental impact
The implementation of these projects will indirectly benefit the ozone layer by enabling domestic room
air conditioner manufacturers to build appliances using refrigerant with no ozone depleting impact. This
will prevent the release of refrigerants at two stages: during the life time of the products and at the time
of discarding those products.
In this sense, considering the fact that average RAC units traditionally contain 1.2 kg of HCFC-22
refrigerant with an ODP of 0.055, the new compressors manufactured by Meizhi will indirectly phase
out 2,196 metric tons of HCFC-22 with a total impact of 121 ODP tons per year, while Midea’s new
RAC appliances will allow the phase-out of 240 metric tons per year, equivalent to 13.2 ODP tons per
year.
The use of these new products will also reduce the emission of Green House Gases (GHG) during the
life time of the appliances and in the process of disposal, due to the very low GWP of R-290. The
estimated greenhouse gas emission reduction in the Meizhi project is 8,852,533 MT CO2 equivalent per
year of operation of the line at the given capacity. In the case of Midea, this reduction is estimated in
967,490 MT CO2 equivalent per year of operation of the line at the given capacity.
In addition, in view of the higher energy efficiency of the refrigerant, an indirect reduction of GHG
emissions linked to energy consumption is also expected.
Table 6. Environmental impact of the projects*
Projects
ODS
GHG (MT CO2 eq.) Metric tons of HCFC-
22 ODP tons
Midea 240 13.2 967,490
Meizhi 2,196 121 8,852,533
* Per year of manufacturing on the lines at the given capacity

23
4.2. Quality of the new products
As mentioned before regarding Meizhi’s project, two types of R-290 compressors (fixed and variable
frequency) with 1 HP and COP of 4.12-4.33 are available for mass production6. The compressors have
been tested under the following test conditions:
Table 7. Test conditions
Parameters Temperature (deg C)
Condensing Temp. 54.4
Evaporation Temp. 7.2
Superheat 10.8
Subcooling 8.3
Tested by Midea under standard GB/T7725-2004.
The energy efficiency ratio of the R-290 compressor is 2%-3% higher than a HCFC-22 compressor7. In
order to obtain such improvements in the new products’ performance, as well as in the system
optimization, additional efforts were required in terms of co-financing by Meizhi. This was also the case
for Midea’s project.
As above mentioned, the certification authorities have already certified the consistency of new air-
conditioners with the standard GB 4706.32 (see section 7. Practical findings), which allows the use of
flammable refrigerants in RAC products in the local market (3C certificate).
Compliance with international standards has also been certified (IEC/CB and CE).
The types and models of R-290 RAC units that has been developed by Midea is shown in the table
below:
6 The actual COP is higher than the designed COP parameter (from 3.25 to 3.30), since the new compressor is a DC INV model
and the one before conversion was a fix speed compressor. In this sense, the test conditions are different and hence the results
are also different. 7 The energy efficiency of new compressors was tested with Calorie meter at Meizhi laboratory.

24
Table 8. Performance information for R-290 based air-conditioners*
Type Model Capacity
(w)
R-290 HFC-410A Minimum
requirements Certification
Charge (g) COP (w/w) Charge (g) COP (w/w) COP (w/w)
Split/VF KFR-26GW/BP3DN7Y 2600 270 4.77(APF) 980(R410A) 4.75(APF) 3.5 CCC
Split/VF KFR-35GW/BP3DN7Y 3500 360 4.73(APF) 1130(R410A) 4.75(APF) 3.5 CCC
Split/VF MS11M-09HRFN7-
QRC4 2600 310 4.0(SCOP) 1030(R410A) 4.0(SCOP) 3.3(GWP<150) CB/CE
Split/VF MS11M-12HRFN7-
QRC4 3500 350 4.0(SCOP) 1300 4.0(SCOP) 3.3(GWP<150) CB/CE
Portable
A/C
MPPD-09ERN7-
QB6G1 2600 210 3.1 430(R410A) 2.6(R410A) 2.6 CB/CE
Portable
A/C
MPPD-11ERN7-
QB6G1 3200 230 3.0 520(R410A) 2.6(R410A) 2.6 CB/CE
* The R290 products were developed based on R410A models, thus, there are no comparison data with R22. In addition,
R290’s RAC efficiency is normally 5-12% higher than R22. Charge mass is only 45% of R22.
In terms of energy efficiency, as shown in the table, the new units can reach the highest standards.
Compare to the HCFC-22 based units, the use of R-290 in the new air-conditioners leads to a reduction
of 5% to 12% in energy consumption8. According to the test result, based on tests undertaken by Midea,
in order to achieve the best performance, the 450g refrigerant would be required for a 3,500W capacity
(COP = 3.0) split unit, however, the standards allow maximum 350g with which the capacity is less than
3,400W and a COP of 2.8.
Further efficiency improvement both in compressors and AC units could be achieved if the charge sizes
specified in international standards were relaxed, since there is a relationship between charge and
efficiency, and hence also an optimal charge. Until then, efficiency improvement is mainly dependent on
the actual R&D - invested in the product in the past several years and the years to come - that was not
financed by the project, and also on system optimization, which was required as in most refrigeration
conversion activities in the past. Furthermore, given these restrictions on charge sizes, only a change of
refrigerant would have resulted in poorer performance compared to the R22 units, not to mention safety
concerns. All products under the demo projects were designed for T1 ambient conditions. After the
completion of the project, Meizhi has developed T3 compressors for high ambient regions as
well.Capacity of production lines
8 The energy efficiency of new AC units was tested at Midea laboratories.

25
The capacity of the production lines remains the same as before the conversion in both companies:
200,000 units, in the case of Midea, and 1,830,000 units, in Meizhi’s production line.
With regard to the latter, more than 20,000 R-290 compressors were produced by the end of 2013, being
most of them sold to other AC manufacturers different from Midea.
5. Incremental costs
5.1. Incremental capital costs
In both projects there have been some adjustments regarding the cost of equipment and tools purchased.
The following is a summary of these adjustments. Besides, in annexes 1 and 2, a breakdown of these
costs is presented, including explanations of the major variations from the original budget.
5.1.1. Midea
The actual cost of the combined pre-charging H2/N2 pressure- and leak test was US$ 74,444 compared to
the approved budget of US$ 32,000. The cost of the ex-proof R-290 storage room was US$ 59,841,
whereas the approved budget was US$ 32,961. The cost of R-290 storage tank and pipeline including
installation amounted to US$ 132,698 compared to an approved budget of USD 64,039.
Additional items were required, which were originally not budgeted: a booster pump that ensures that
the inlet of the charging machine is fed with sub-cooled refrigerant, Nitto quick couplings to avoid leaks
during charging and in particular testing, as well as variable frequency power supply to facilitate 110V
and 220V as required by different A5 markets. These additional items had additional costs of
US$ 60,000.
Cost of the heat exchanger conversion was 3 times higher than the approved budget, however, it needs
to be considered that funding was provided only for 60% of the estimated conversion costs, since the
production capacity of the HE was about 330,000 unit per year (before and after conversion), while the
converted production line had a capacity of only 200,000.
Cost of other items was similar to the approved budget with differences of up to +/-20%. In this sense,
the cost of the equipment purchased amounts to US$ 3,938,004, out of which US$ 2,383,967 has been
covered by the funds provided by the MLF in line with the approved project based on the eligible A5
ownership.
5.1.2. Meizhi
The actual costs in the case of Meizhi amounted to US$ 3,398,093 and were about 11% higher than the
total agreed project budget (US$ 3,049,190). However, in these costs, investments related to R&D of the
past years have not been included, which is also of significant value. High level of co-financing was
required from the enterprise to cover the costs related to the 40% A2 ownership as well as the additional
26
investments. In this sense, the funds provided by the MLF amounted to US$ 1,875,000, in line with the
approved project based on the eligible A5 ownership.
With respect to the various components, it can be concluded that costs related to the motor coiling line
and the rotor & stator line were significantly underestimated in the project document, since these parts
are crucial to the performance of the compressors and thus, high quality equipment is required9.
Conversion of these two lines alone had a cost of US$ 1,416,187. Actual cost of the conversion of
assembly line was about 30% more expensive than approved. Cost of the lubricant viscosity meter was
US$ 31,746 compared to the approved budget of US$ 11,644. It is to be noted that selection of a suitable
lubricant is essential in the reduction of the charge size.
On the other hand, investment costs related to the case line were significantly lower, since a majority of
these operations have been outsourced by the company. However, it adds operating cost to the company,
which is not eligible for funding. The cost of test tools was also much lower (about 20% of the approved
budget) and savings could be made on the purchase of the gas concentration alarm system (1/3 of the
approved budget) due to the fact that these tools were sourced domestically instead of the originally
foreseen imported equipment. The cost of other items was similar to the approved budget with
differences of up to +/-20%.
5.2. Incremental operating costs
IOC for compressor for Midea was not covered by the funds provided by the MLF, instead the
conversion of Meizhi compressor manufacturing line was financed. The cost of the new compressor
manufactured by Meizhi is US$ 7.57 higher than the HCFC-22 based compressor.
In the case of Midea, the estimated IOC for one split unit is currently US$ 41.95, as described in the
table below.
Although the actual IOC is significantly higher than the eligible USD 6.3/kg, these additional costs are
associated with the product initiation and expected to decrease in future, albeit not quite the level of the
IOC threshold. In addition, the methodology for applying the safety measures is also being refined.
UNIDO will continue to monitor the progress of the IOC as part of the RAC sector plan.
9 The high cost of these lines was due to the high quality equipment that was required in order to fulfil the technical
requirements of conversion. There was no other option for conversion and, thus, there is no difference between the cost
increases resulted from performance upgrade and those from conversion.
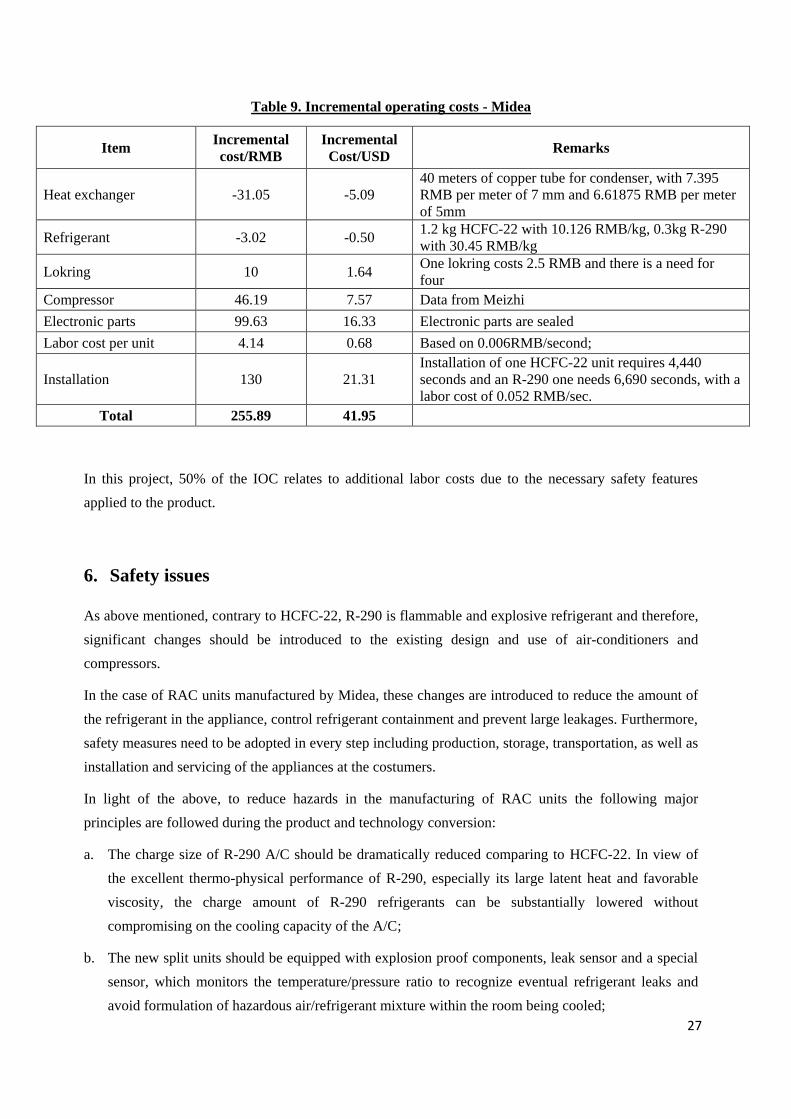
27
Table 9. Incremental operating costs - Midea
Item Incremental
cost/RMB
Incremental
Cost/USD Remarks
Heat exchanger -31.05 -5.09
40 meters of copper tube for condenser, with 7.395
RMB per meter of 7 mm and 6.61875 RMB per meter
of 5mm
Refrigerant -3.02 -0.50 1.2 kg HCFC-22 with 10.126 RMB/kg, 0.3kg R-290
with 30.45 RMB/kg
Lokring 10 1.64 One lokring costs 2.5 RMB and there is a need for
four
Compressor 46.19 7.57 Data from Meizhi
Electronic parts 99.63 16.33 Electronic parts are sealed
Labor cost per unit 4.14 0.68 Based on 0.006RMB/second;
Installation 130 21.31
Installation of one HCFC-22 unit requires 4,440
seconds and an R-290 one needs 6,690 seconds, with a
labor cost of 0.052 RMB/sec.
Total 255.89 41.95
In this project, 50% of the IOC relates to additional labor costs due to the necessary safety features
applied to the product.
6. Safety issues
As above mentioned, contrary to HCFC-22, R-290 is flammable and explosive refrigerant and therefore,
significant changes should be introduced to the existing design and use of air-conditioners and
compressors.
In the case of RAC units manufactured by Midea, these changes are introduced to reduce the amount of
the refrigerant in the appliance, control refrigerant containment and prevent large leakages. Furthermore,
safety measures need to be adopted in every step including production, storage, transportation, as well as
installation and servicing of the appliances at the costumers.
In light of the above, to reduce hazards in the manufacturing of RAC units the following major
principles are followed during the product and technology conversion:
a. The charge size of R-290 A/C should be dramatically reduced comparing to HCFC-22. In view of
the excellent thermo-physical performance of R-290, especially its large latent heat and favorable
viscosity, the charge amount of R-290 refrigerants can be substantially lowered without
compromising on the cooling capacity of the A/C;
b. The new split units should be equipped with explosion proof components, leak sensor and a special
sensor, which monitors the temperature/pressure ratio to recognize eventual refrigerant leaks and
avoid formulation of hazardous air/refrigerant mixture within the room being cooled;
28
c. In the manufacturing, repair and testing processes gas detection, monitoring and safety ventilation
systems as well as emergency power supply should be installed. The hazardous areas should be
thoroughly checked and safety risks should be eliminated, e.g. all equipment in the hazardous areas
should be made Ex-proof and properly grounded to eliminate risks arising from sparks in case of a
potential leakage of refrigerant, the plant floor in the hazardous areas should be painted with
antistatic coating for the very same reason.
d. The manufacturing, plant maintenance as well as the appliance installation and service personnel
should be thoroughly trained.
e. Special tools are to be provided to the service staff for the installation of R-290 RACs.
Developments continue post-project with the aim to minimize and simplify product modifications while
maintaining safety, in order to expand the range of products. In this sense, there are efforts on
simplifying the safety measures - like the one mentioned on the sensor for the outdoor unit – and,
furthermore, significant efforts are being made to reduce charge size without significantly compromising
the system performance, as well as extending the application to larger units.
Concerning the production of compressors, the main safety measures to be considered are as follows:
a. Electric components inside the R-290-based compressor should be sealed. This results in the
modifications of the electric components and structure of the compressor;
b. Flammability of the new refrigerant requires special explosion-proof performance testing machines,
such as calorimeter, life test units, gas load testing unit and operation testing unit for the compressor.
Besides these principles, relevant foreign standards and practices for the production of R-290-based
room air-conditioners and compressors can be a reference to Chinese manufacturers.
In conjunction with RAC sector plan, FECO has cooperated with Tianjin Firefighting Research Institute
to design and conduct a research on the flammability of R-290 refrigerant in a common use scenario.
Air-conditioners were installed in rooms of various sizes and refrigerant leaks and burning were tested
in different conditions. The experiment report was made available in May 2013 and published in
English on International Journal of Refrigeration. The experiments and assessments showed that the
possibility of fire and explosion for a wall-mounted R-290 air-conditioner is 10-8-10-9 per year under
household use conditions, which is 1/10 of the risk of a domestic refrigerator with hydrocarbon. In June,
an expert panel discussed and determined the key points of next phase’s risk assessment, including risks
in the servicing and installation processes, risks at different charges, and secondary risks from a fire.
7. Practical findings/Lessons learnt
With regard to the project, the main point to highlight is that its approval and implementation were
essential for the development of R-290 units, and have also been a basis for the RAC phase-out strategy
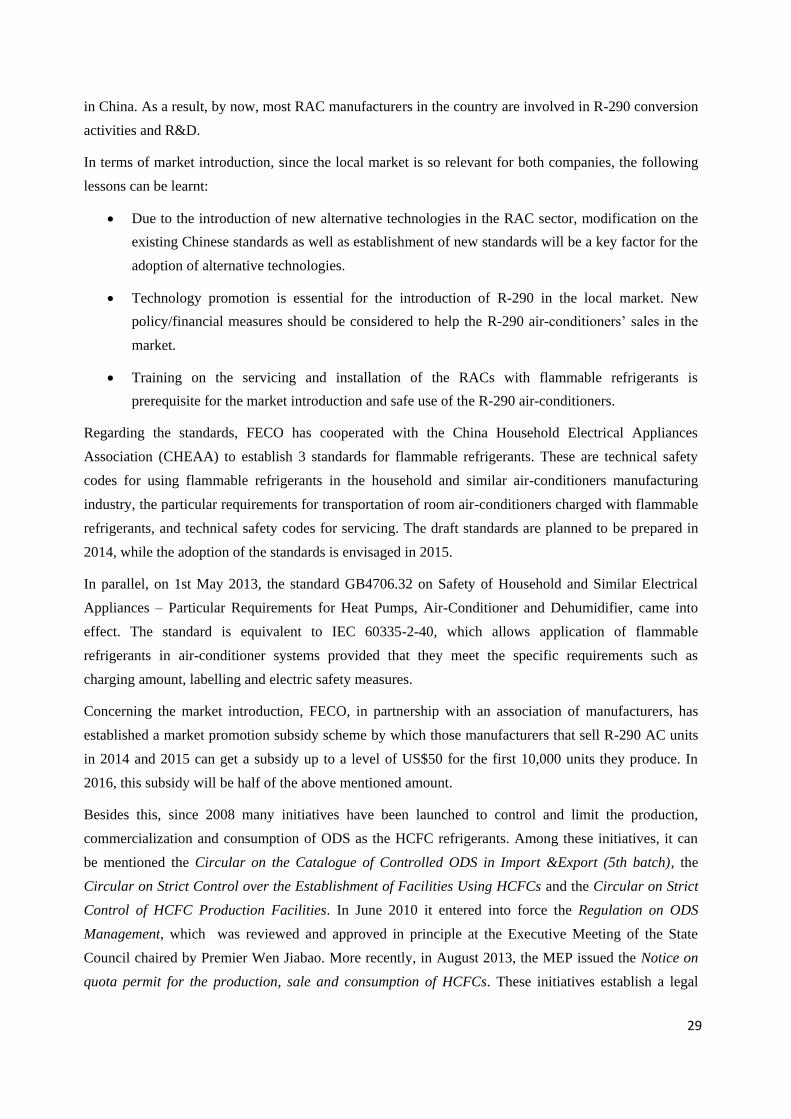
29
in China. As a result, by now, most RAC manufacturers in the country are involved in R-290 conversion
activities and R&D.
In terms of market introduction, since the local market is so relevant for both companies, the following
lessons can be learnt:
Due to the introduction of new alternative technologies in the RAC sector, modification on the
existing Chinese standards as well as establishment of new standards will be a key factor for the
adoption of alternative technologies.
Technology promotion is essential for the introduction of R-290 in the local market. New
policy/financial measures should be considered to help the R-290 air-conditioners’ sales in the
market.
Training on the servicing and installation of the RACs with flammable refrigerants is
prerequisite for the market introduction and safe use of the R-290 air-conditioners.
Regarding the standards, FECO has cooperated with the China Household Electrical Appliances
Association (CHEAA) to establish 3 standards for flammable refrigerants. These are technical safety
codes for using flammable refrigerants in the household and similar air-conditioners manufacturing
industry, the particular requirements for transportation of room air-conditioners charged with flammable
refrigerants, and technical safety codes for servicing. The draft standards are planned to be prepared in
2014, while the adoption of the standards is envisaged in 2015.
In parallel, on 1st May 2013, the standard GB4706.32 on Safety of Household and Similar Electrical
Appliances – Particular Requirements for Heat Pumps, Air-Conditioner and Dehumidifier, came into
effect. The standard is equivalent to IEC 60335-2-40, which allows application of flammable
refrigerants in air-conditioner systems provided that they meet the specific requirements such as
charging amount, labelling and electric safety measures.
Concerning the market introduction, FECO, in partnership with an association of manufacturers, has
established a market promotion subsidy scheme by which those manufacturers that sell R-290 AC units
in 2014 and 2015 can get a subsidy up to a level of US$50 for the first 10,000 units they produce. In
2016, this subsidy will be half of the above mentioned amount.
Besides this, since 2008 many initiatives have been launched to control and limit the production,
commercialization and consumption of ODS as the HCFC refrigerants. Among these initiatives, it can
be mentioned the Circular on the Catalogue of Controlled ODS in Import &Export (5th batch), the
Circular on Strict Control over the Establishment of Facilities Using HCFCs and the Circular on Strict
Control of HCFC Production Facilities. In June 2010 it entered into force the Regulation on ODS
Management, which was reviewed and approved in principle at the Executive Meeting of the State
Council chaired by Premier Wen Jiabao. More recently, in August 2013, the MEP issued the Notice on
quota permit for the production, sale and consumption of HCFCs. These initiatives establish a legal

30
framework to reduce the use of ODS and, therefore, they promote indirectly the adoption of alternative
refrigerants, as for example the R-290 that has been tested in these projects.
Finally, with respect to the training on the servicing sector, a feasibility study on the certification of
servicing workers has been initiated by FECO to standardize the operation of servicing workers and
minimize the unwanted emission and discharge of refrigerant.
8. Conclusions
- R-290 is an environmentally friendly refrigerant, since its ODP is zero and its GWP is as low as
three. With an excellent cooling performance, R-290 is considered one of the ideal alternatives
of HCFC-22 in the RAC sector after conversion of production lines.
- R-290 is available in the Chinese market.
- The conversion of two of the most important production lines of RAC units and compressors in
China has maintained the quality and performance of the appliances produced by these two
companies. Their performance is consistent with national (CCC) and international standards
(IEC/CB and CE), and this has already been certified by the authorities.
- In order to obtain such improvements in the new products’ performance, as well as in the system
optimization, significant additional efforts were required in terms of co-financing by both
companies.
- Regarding the new compressors’ performance, the energy efficiency is 2%-3% higher than
HCFC-22 compressors.
- Concerning the new RAC units’ performance, the energy efficiency is 5%-12% higher than
HCFC-22 air-conditioners.
- Further efficiency improvement both in compressors and AC units could be achieved if the
charge sizes specified in international standards were relaxed, since there is a relationship
between charge and efficiency. Until then, efficiency improvement is mainly dependent on the
actual R&D - invested in the product in the past several years and the years to come - and also
on system optimization, which was required as in most refrigeration conversion activities in the
past.
- Two types of R-290 compressors (fixed and variable frequency) with 1 HP and COP of
4.12-4.33 are available for mass production after the conversion of the production line.
- Two types of R-290 RAC units (split/VF and portable A/C) and six different models are
also available for mass production after conversion.
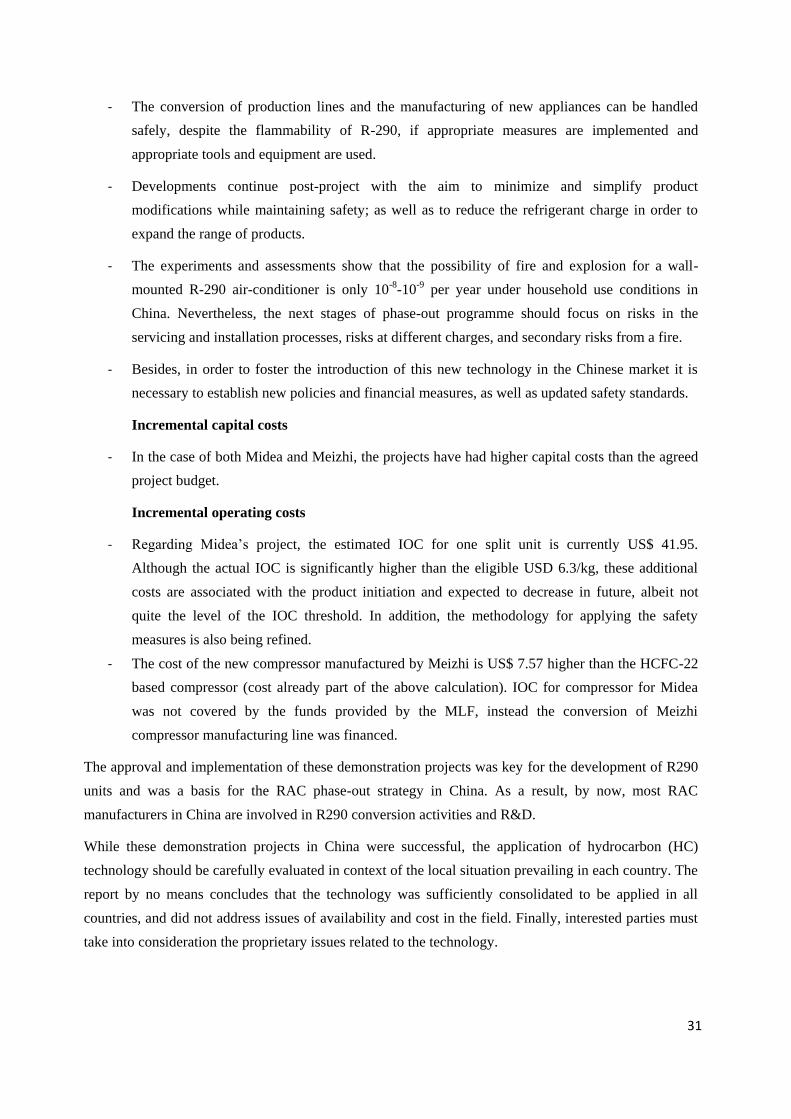
31
- The conversion of production lines and the manufacturing of new appliances can be handled
safely, despite the flammability of R-290, if appropriate measures are implemented and
appropriate tools and equipment are used.
- Developments continue post-project with the aim to minimize and simplify product
modifications while maintaining safety; as well as to reduce the refrigerant charge in order to
expand the range of products.
- The experiments and assessments show that the possibility of fire and explosion for a wall-
mounted R-290 air-conditioner is only 10-8-10-9 per year under household use conditions in
China. Nevertheless, the next stages of phase-out programme should focus on risks in the
servicing and installation processes, risks at different charges, and secondary risks from a fire.
- Besides, in order to foster the introduction of this new technology in the Chinese market it is
necessary to establish new policies and financial measures, as well as updated safety standards.
Incremental capital costs
- In the case of both Midea and Meizhi, the projects have had higher capital costs than the agreed
project budget.
Incremental operating costs
- Regarding Midea’s project, the estimated IOC for one split unit is currently US$ 41.95.
Although the actual IOC is significantly higher than the eligible USD 6.3/kg, these additional
costs are associated with the product initiation and expected to decrease in future, albeit not
quite the level of the IOC threshold. In addition, the methodology for applying the safety
measures is also being refined.
- The cost of the new compressor manufactured by Meizhi is US$ 7.57 higher than the HCFC-22
based compressor (cost already part of the above calculation). IOC for compressor for Midea
was not covered by the funds provided by the MLF, instead the conversion of Meizhi
compressor manufacturing line was financed.
The approval and implementation of these demonstration projects was key for the development of R290
units and was a basis for the RAC phase-out strategy in China. As a result, by now, most RAC
manufacturers in China are involved in R290 conversion activities and R&D.
While these demonstration projects in China were successful, the application of hydrocarbon (HC)
technology should be carefully evaluated in context of the local situation prevailing in each country. The
report by no means concludes that the technology was sufficiently consolidated to be applied in all
countries, and did not address issues of availability and cost in the field. Finally, interested parties must
take into consideration the proprietary issues related to the technology.
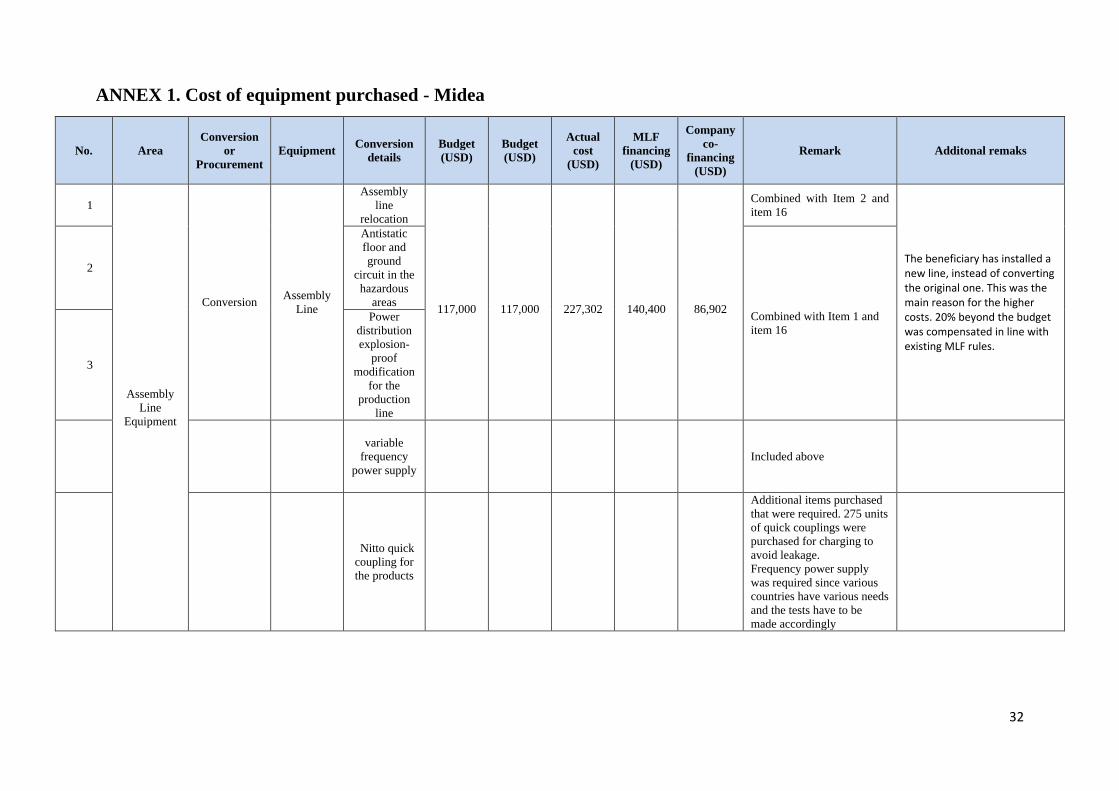
32
ANNEX 1. Cost of equipment purchased - Midea
No. Area
Conversion
or
Procurement
Equipment Conversion
details
Budget
(USD)
Budget
(USD)
Actual
cost
(USD)
MLF
financing
(USD)
Company
co-
financing
(USD)
Remark Additonal remaks
1
Assembly
Line
Equipment
Conversion Assembly
Line
Assembly
line
relocation
117,000
117,000
227,302
140,400
86,902
Combined with Item 2 and
item 16
The beneficiary has installed a new line, instead of converting the original one. This was the main reason for the higher costs. 20% beyond the budget was compensated in line with existing MLF rules.
2
Antistatic
floor and
ground
circuit in the
hazardous
areas
Combined with Item 1 and
item 16
3
Power
distribution
explosion-
proof
modification
for the
production
line
variable
frequency
power supply
Included above
Nitto quick
coupling for
the products
Additional items purchased
that were required. 275 units
of quick couplings were
purchased for charging to
avoid leakage.
Frequency power supply
was required since various
countries have various needs
and the tests have to be
made accordingly

33
No. Area
Conversion
or
Procurement
Equipment Conversion
details
Budget
(USD)
Budget
(USD)
Actual
cost
(USD)
MLF
financing
(USD)
Company
co-
financing
(USD)
Remark Additonal remaks
4 Conversion
Function
Test system
Function test
units adjusted
to the
properties of
R-290
(including
Electrical
safety tester
and new
quick
connectors)
85,000
85,000
99,365
85,000
14,365
Combined with item 5, item
12 and item 30;
30test units
difference less than 20%
30 test units
6
Procurement
Refrigerant
Charging
New
refrigerant
charging
machines
(including
the
transportation
pump in the
storage
room)
100,000
320,000
352,143
320,000
32,143
Combined with item 15,
item 17 and item 33
difference less than 20% 15 Leak
detectors
Gas detection
(IR)
(included in
the safety
system)
-
Combined with item 6, item
17 and item 33
16 Ventilation
system
Safety
ventilation
system for R-
290-based
RAC
production
line
80,000
Combined with item 1 and
item 2
17 Safety
System
Safety alarm
system for R-
140,000
Combined with item 6, item
15 and item 33

34
No. Area
Conversion
or
Procurement
Equipment Conversion
details
Budget
(USD)
Budget
(USD)
Actual
cost
(USD)
MLF
financing
(USD)
Company
co-
financing
(USD)
Remark Additonal remaks
290-based
RAC
production
line and
R290 storage
room
7
Procurement
Refrigerant
Supply
equipments
and
pipeline
Ex-proof
R290 storage
room
32,961
32,961
59,841
32,961
26,880
The beneficiary installed a bigger storage room than required for the one line in order to cater for the needs of additional R290 lines in future. 20% beyond the budget was compensated in line with existing MLF rules.
8
New storage
tank for R-
290 and New
R290
pipeline
installation
for the
production
line and
R290 storage
room
64,039
64,039
132,698
76,847
55,851 Combined with item 9
10
Procurement Vacuum
system and
vacuum
test
Ex-proof
vacuum
pumps
-
-
88,198
-
88,198
Combined with item 11
not eligible item 11
Vacuum
meter Combined with item 10
12 Conversion
Vacuum
measuring
system
modification
Combined with item 4, item
5 and item 30
13 Conversion
Helium
leak testing
system
32,000
32,000
74,444
38,400
36,044
The budget approved was not sufficient and in future higher cost should be approved for a He leak testing system. 20% beyond the budget was compensated in line with existing MLF rules.

35
No. Area
Conversion
or
Procurement
Equipment Conversion
details
Budget
(USD)
Budget
(USD)
Actual
cost
(USD)
MLF
financing
(USD)
Company
co-
financing
(USD)
Remark Additonal remaks
14 Procurement Leak
detectors
New portable
R290
detectors for
production
line/test
room/storage
and new
Helium leak
detector for
heat
exchanger
80,000
80,000
83,200
80,000
3,200 difference less than 20%
18 Procurement Sealing
machine
LOKRING
sealing
machine
60,000
60,000
11,762
11,762
-
19
Heat
Exchanger
Process
Equipment
Conversion High-speed
fin
stamping
Press
Conversion
of various
parts of the
high speed
fin press and
its stacker,
fixtures and
parts
103,700
417,850
1,646,337
459,635
1,186,702
The production capacity of the heat exchanger was about 330,000 unit per year (before and after conversion), while the converted production line had a capacity of only 200,000. For this reason, the approved budget was reduced according to the line capacity. However, the conversion of the heat exchanger producing equipment had to be done for the original full capacity (330,000 units) and thus, costs were consequently higher.
Combined with item 20
20 Procurement
Procurement
of moulds for
fin press
314,150
Combined with item 19
21
Conversion
Hair pin
tube
bending
machine
Conversion
of the Ø9.52-
sized Hair
Pin Bending
machine to
Ø5-sized one,
new tools.
24,000
24,000
62,698
24,000
38,698
Combined with item 25
22
Connection
curve
bending
machine
Conversion
of the Ø9.52-
sized
connection
curve
bending
12,000
12,000
18,651
12,000
6,651
Combined with item 23 and
item 24
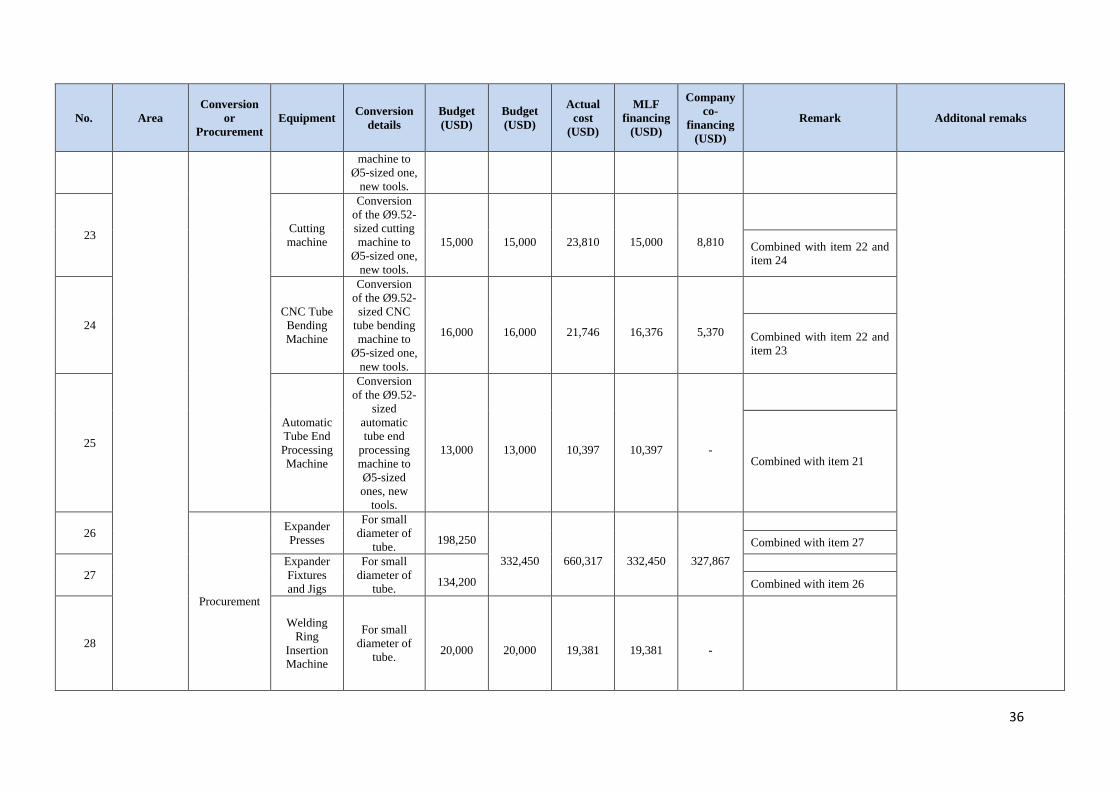
36
No. Area
Conversion
or
Procurement
Equipment Conversion
details
Budget
(USD)
Budget
(USD)
Actual
cost
(USD)
MLF
financing
(USD)
Company
co-
financing
(USD)
Remark Additonal remaks
machine to
Ø5-sized one,
new tools.
23 Cutting
machine
Conversion
of the Ø9.52-
sized cutting
machine to
Ø5-sized one,
new tools.
15,000
15,000
23,810
15,000
8,810
Combined with item 22 and
item 24
24
CNC Tube
Bending
Machine
Conversion
of the Ø9.52-
sized CNC
tube bending
machine to
Ø5-sized one,
new tools.
16,000
16,000
21,746
16,376
5,370
Combined with item 22 and
item 23
25
Automatic
Tube End
Processing
Machine
Conversion
of the Ø9.52-
sized
automatic
tube end
processing
machine to
Ø5-sized
ones, new
tools.
13,000
13,000
10,397
10,397
-
Combined with item 21
26
Procurement
Expander
Presses
For small
diameter of
tube.
198,250
332,450
660,317
332,450
327,867
Combined with item 27
27
Expander
Fixtures
and Jigs
For small
diameter of
tube.
134,200
Combined with item 26
28
Welding
Ring
Insertion
Machine
For small
diameter of
tube.
20,000
20,000
19,381
19,381
-

37
No. Area
Conversion
or
Procurement
Equipment Conversion
details
Budget
(USD)
Budget
(USD)
Actual
cost
(USD)
MLF
financing
(USD)
Company
co-
financing
(USD)
Remark Additonal remaks
29 Cleaning
Machine
New cleaning
machine for
Ø5-sized
tubes.
18,000
18,000
18,730
18,730
-
30
Operating
performance
test
equipment
Conversion Ex-proof
conversion
Explosion-
proof
modification
of the
function test
20,000
259,000
326,984
284,900
42,084
Combined with item 31 and
32
Actual costs confirm that the original budget was somewhat underestimated. For this reason, 10% beyond the budget was compensated in line with existing MLF rules.
Combined with item 31 and
32
31
Procurement
Capacity
test
Capacity test
unit suitable
for R-290
RAC
159,000
Combined with item 30 and
32
32 Life test
Unit
Life test units
suitable for
R-290 RAC
80,000
Combined with item 30 and
31
33
R290
recovery
station
Procurement
R290
recovery
station
Ex-proof
recovery
stations for
R-290
10,000
10,000
see
remarks
Combined with item 15,
item 17 and item 6
34
Tools for
Installation Procurement
Tools for
Installation
Refrigerant
Bottles
15,750
15,750
see
remarks
To be purchased as soon as
sales start and will be paid
by company co-financing.
Will be additional costs and are
required as eligible items
35
Ex-proof
vacuum
pump
180,000
180,000
see
remarks
To be purchased as soon as
sales start and will be paid
by company co-financing.
Will be additional costs and are
required as eligible items
36 LOKRINGS
tools
396,000
396,000
see
remarks
To be purchased as soon as
sales start and will be paid
by company co-financing.
Will be additional costs and are
required as eligible items

38
No. Area
Conversion
or
Procurement
Equipment Conversion
details
Budget
(USD)
Budget
(USD)
Actual
cost
(USD)
MLF
financing
(USD)
Company
co-
financing
(USD)
Remark Additonal remaks
37 Others Delivery, insurance, installation of
manufacturing equipment etc. 7.5%
189,004
189,004
see
remarks
189,004
-189,004
Total cost for this line is not
possible to identify due to
the many items and
purchases made. For this
reason, the total approved
budget is indicated for this
line item and co-financing
amount is reduced
accordingly.
38 Contingency
270,905
270,905
216,724
-216,724
Since actual costs were
higher than the original
budget (including A2
ownership), the co-financing
amount was was reduced by
the approved contingency
budget.
TOTAL 2,979,959 2,979,959 3,938,004 2,383,967 1,554,037
39% of the total equipment
cost was company co-
financing

39
ANNEX 2. Actual costs – Meizhi
Activities Total Budget US$
Actual
Expenditure
(USD)
MLF Actual
(USD)
Co-financing
(USD) Remarks
Motor coiling line 131,285 619,048 131,285 487,763
Costs have significantly increased, since higher
standard equipment was selected, as these are essential
for compressor performance;
ROTOR & STATOR
line 397,020 797,139 305,483 491,656
Costs have significantly increased, since higher
standard equipment was selected, as these are essential
for compressor performance;
Assembly Line 170,217 216,990 170,217 46,773
CASE line 132,210 3,499 0 3,499
it has been largely outsourced, that is the reason for the
under-expenditure
ROLLOR line 79,281 72,393 72,393 0
MAIN BEARING line 33,814 29,124 29,124 0
SUB BEARING line 33,814 33,965 33,965 0
CRANK SHAFT line 79,282 81,892 72,804 9,088
CYLINDER line 52,854 53,615 52,854 761
BLADE line 6,607 4,675 4,675 0
sorting line 11,653 3,425 0 3,425 domestic purchase reduced costs
Test tools 264,268 38,206 0 38,206 domestic purchase reduced costs
Calorie Meter 330,335 373,016 330,335 42,681

40
Activities Total Budget US$ Actual
Expenditure
(USD)
MLF Actual
(USD)
Co-financing
(USD) Remarks
Life test Unit 488,896 552,381 488,896 63,485 Another unit will be purchased by the company outside
the project budget
Gas Load Test Unit 158,561 115,714 0 115,714
purchased before the project was approved, so cost was
paid as co-financing, but it is in fact and actual ICC
Gas concentration
alarm system 39,000 13,270 13,270 0
domestic purchase reduced costs
Lubricant viscometer 11,644 31,746 11,644 20,102
The planned viscosity meter did not meet the
requirements and for this reason another type had to be
purchased
Sub-total 2,420,741 3,040,098 1,716,945 1,323,153
Production
trials
material
cost 42,750 49,495 42,055 7,440
costs related to prototyping
Labour
Costs 5,750 5,750 0 5,750
cost was covered from company's budget
Evaluati
on and
Testing
1,750 1,750 0 1,750
cost was covered from company's budget
Sub-total 50,250 56,995 42,055 14,940
Technical
Assistance
Costs
Design
conversi
on
Redesign of
products,
production
line,
manufacturin
g procedures
and
conversion of
specialized
software
100,000 100,000 45,000 55,000
estimated staff costs, company's co-financing
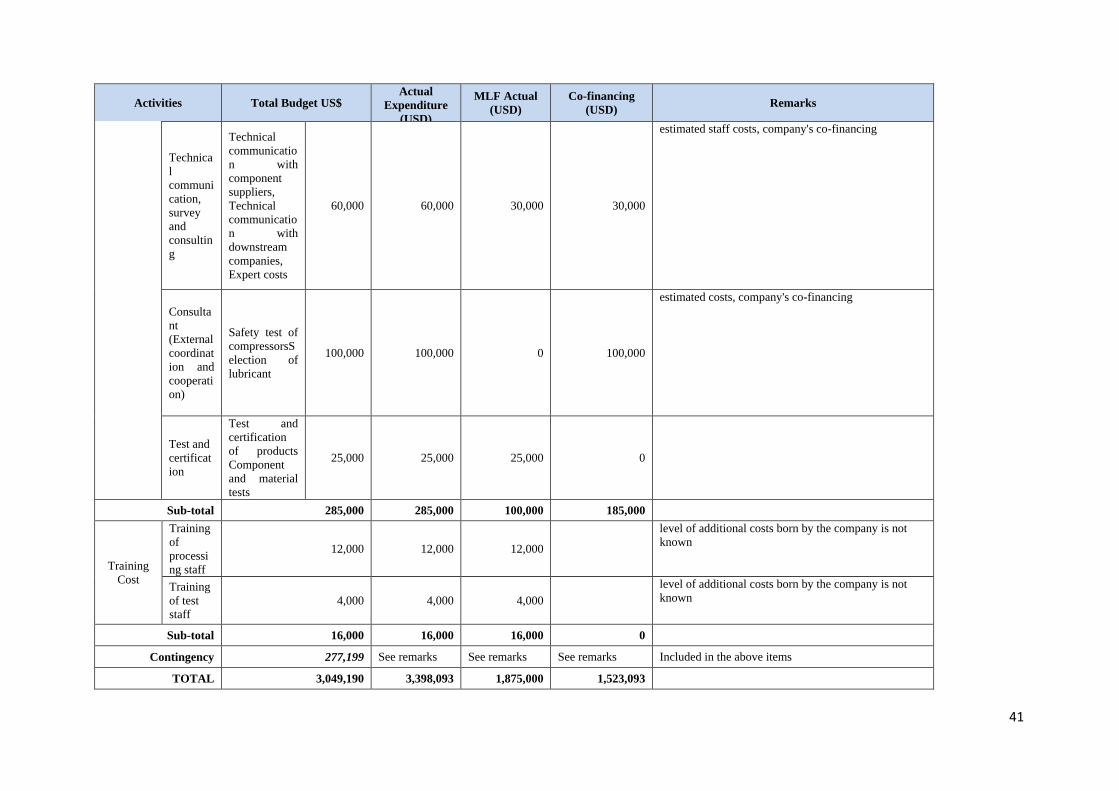
41
Activities Total Budget US$ Actual
Expenditure
(USD)
MLF Actual
(USD)
Co-financing
(USD) Remarks
Technica
l
communi
cation,
survey
and
consultin
g
Technical
communicatio
n with
component
suppliers,
Technical
communicatio
n with
downstream
companies,
Expert costs
60,000 60,000 30,000 30,000
estimated staff costs, company's co-financing
Consulta
nt
(External
coordinat
ion and
cooperati
on)
Safety test of
compressorsS
election of
lubricant
100,000 100,000 0 100,000
estimated costs, company's co-financing
Test and
certificat
ion
Test and
certification
of products
Component
and material
tests
25,000 25,000 25,000 0
Sub-total 285,000 285,000 100,000 185,000
Training
Cost
Training
of
processi
ng staff
12,000 12,000 12,000
level of additional costs born by the company is not
known
Training
of test
staff
4,000 4,000 4,000
level of additional costs born by the company is not
known
Sub-total 16,000 16,000 16,000 0
Contingency 277,199 See remarks See remarks See remarks Included in the above items
TOTAL 3,049,190 3,398,093 1,875,000 1,523,093

42
Demonstration project for conversion from HCFC-141b-based technology to iso-paraffin and siloxane (KC-6) technology for cleaning in the manufacture of medical
devices at Zhejiang Kindly Medical Devices Co. Ltd.
FINAL REPORT
August 2014
Submitted by:
Foreign Economic Cooperation Office, Ministry of Environmental Protection, China (FECO/MEP)
and
United Nations Development Programme (UNDP)
� 2
Executive Summary Demonstration project for conversion from HCFC-141b-based technology to iso-paraffin and siloxane (KC-6) technology for cleaning in the manufacture of medical devices at Zhejiang Kindly Medical Devices Co. Ltd. (KDL) was approved by the 64th Executive Committee meeting at a funding level of US$557,667 from the Multilateral Fund and $205,616 as bilateral cooperation from the Government of Japan. This demonstration project was successfully implemented, and established the suitability of KC-6 technology as a viable replacement for HCFC-141b as solvent and Silicone oil diluent in the manufacture of needles at Zhejiang Kindly Medical Devices Co. Ltd. The project activities includes product redesign and development, equipment installation and modifications safety and other measures to handle the flammability, laboratory testing and performance evaluation, product trials, biocompatibility and drug-compatibility testing, production line conversion, technical assistance and training. The successful completion of the demonstration project contributes towards promotion of this technology for medical devices production and enables cost-effective conversions at other similar manufacturers in this sub-sector.
1. Introduction In 2007, the 19th Meeting of Parties of the Montreal Protocol agreed on accelerated phase-out of HCFCs. To achieve the compliance goal, China is implementing HCFCs phase-out sector plans in the solvent sector from 2012. The KDL project was established as a demonstration earlier in 2010 for preparation and support of the sector plan implementation. The Executive Committee approved the KDL demonstration project at the 64th meeting in 2011 at a funding level of US $ 557,667. The project’s implementing agency is UNDP. Total approved funding from MLF was US $ 352,051. Additional funding of US$ 205,616 has been approved as a bilateral cooperation component with the Government of Japan, with UNDP as the implementing agency. The national agency implementing this project is Foreign Economic Cooperation Office (FECO), Ministry Of Environmental Protection, China. The objective of this demonstration project is to establish the suitability of KC-6 technology as a viable replacement for HCFC-141b as a solvent in the manufacture of needles at Zhejiang KDL Co. Ltd. As a result of the conversion project, about 27.82 tons of HCFC consumption has been phased out, reducing greenhouse gas emission by 19,613 tons CO2 eq. The implementation of the project followed the rules and procedures of National Execution (NEX). The Performance Based Payment (PBP) mechanism was applied for the implementation. 1.1 Background The major applications of HCFCs within the solvents sector in China include cleaning in the Medical, Metal (Compressors), Metal (Other), Electronics (LCD), Electronics (Precision), Electronics (Other) and Formulated Solvents sub-sectors. According to survey statistics, the HCFC consumption in the Solvents Sector in China was 4,394 metric tonnes HCFC-141b in 2009. The Medical Cleaning Applications sub-sector is important from a human health perspective and consumed about 1,700 metric tonnes of HCFC-141b in 2009, representing about 39% of the overall solvent sector consumption. The sub-sector manufactures a range of products that are applied widely and involve more than 400 enterprises. Since 1980s, along with China’s rapid economic development, the sub-sector has made great progress and

� 3
maintained an average annual growth rate of over 15%, and China has, thus, become the world’s leading medical macromolecular product manufacturer. According to statistics, in 2009, the gross sales in the sub-sector exceeded US$ 1.5 billion, 16% higher in real terms than a year earlier. The main products manufactured in this sub-sector include syringes, infusion sets, blood transfusion sets, various puncture instruments (e.g., hypodermic needles, scalp vein sets, blood collection needles, intravenous canulae, puncture needles, biopsy needles, etc.), catheters and other sanitary materials. The devices manufactured are siliconized to reduce friction and the patients’ pain; in addition, the silicification tooling used in the manufacturing of these devices needs regular cleaning, so as to prevent the tooling stained with silicone oil from polluting the joints of puncture instruments. The sub-sector comprises a large number of SMEs with limited access to alternative technologies for HCFCs and their viability depends upon accessing suitable alternative technologies at the earliest. For these reasons, China has prioritized this sector and sub-sector for early interventions to meet the 2013/2015 targets. To work out a cost-effective and sustainable alternatives to HCFC-141b technology that could be implemented in the large number of predominantly SMEs in the Medical Cleaning Applications sub-sector, the Solvent Demonstration project was prepared and submitted for the consideration at the 64th Meeting of the Executive Committee after due review and endorsement by the Government. 1.2 Silicification and its tooling cleaning process with HCFC-141b Puncture instruments, such as medical needles, need to be coated with a layer of silicone oil on the blade and the tube. This process is called silicification. The purpose of silicification is to reduce frictional resistance and the patients’ pain when the needle pierces the skin. This process is completed at the silicification working station of assembly machines. Silicification tooling refers to a special kind of working station utensil (see pic1) that is used on the assembly machines for puncture instruments. Needle assembly and silicification must be completed on this tooling. Each strip-shaped tooling contains 50 steel needle seats with unfinished needles. Each needle assembly machine usually has at least 600 such tooling. When the needles are siliconized, the tooling is contaminated by silicone oil, so it is necessary to clean the tooling on a regular basis. Otherwise, the silicone oil will stick on the inner bore of needle hubs and the outer surface. Accordingly, when needles are put on syringes, they will fall off automatically or the connection may not be secure. In case of continuous production, each tooling needs cleaning every 15-20 days. The original single-tank open-type ultrasonic cleaning machines are located in KDL’s Class 100,000 clean room which was built in May 2005. Each cleaner could clean about 200,000 stripe-times of silicification tooling every year; in 2009, the consumption of KC-3000C1 was about 33.6 tonnes (equivalent to 21.84 metric tonnes of HCFC-141b). The machines in current use are all single-cylinder ultrasonic cleaners. Workers are needed to load and unload the materials. After cleaning, the materials have to be put on the shelf for drying. There are mainly 4 processes, i.e. loading, cleaning, drying and unloading. These machines will need to be modified due to the following:
- The machines are not closed, so the operators will unavoidably have contact with solvents and inhale solvent vapors;
-There is no explosion-proof safety features and thus, the process, as set-up currently, is not suitable for the alternative solvent with slight flammability. Further, there is no solvent recovery system and as a result, the consumption is high. The cost will increase when using the alternative solvent with higher unit price.
1 KC-3000C’s main ingredient is HCFC-141b (65%) and others, much safer and better than HCFC-141b for the needle silification.

� 4
1.3 Technology Choice Some of the zero-ODP alternatives to HCFC-141b currently available for this application are listed below:
Solvent Option ODP GWP Remarks
HFC-4310 0 1,300
HFC-4310 is one of the Vertrel® series solvents launched by the US DuPont Company, with decafluoropentane as the principal component. It is non-toxic and non-flammable. As a silicone oil solvent, the boiling point, surface tension and viscosity index are ideal. If HCFC-141b is taken as the benchmark for comparison, HFC-4310 shows poor effects of CO2 emission reduction and its toxicity is higher than HCFC-141b. Moreover, it is expensive and the price is as high as US$ 70/kg
HFC-365mfc 0 840
While this option offers good solvent properties, with respect to HCFC-141b, it has a higher GWP. It is also flammable in the range of 3.5% - 9% by volume in air, thus safety becomes a significant barrier for adoption. It is also more expensive than HCFC-141b with a cost of about US$ 22/kg.
KC-3000 0 750
KC3000 is a HFC-365mfc-based mixed solvent. It is compatible with most kinds of materials, not easily flammable, non-toxic and volatile and its chemical properties are stable. Its inadequacy is that it has a certain degree of flammability. The cost is about US$ 12/kg.
HFE-7100 0 480
HFE-7100 is a fluoride based solvent launched by 3M® Corporation. It is non-toxic, non-flammable and has a relatively low GWP. As a silicone oil solvent, its boiling point, surface tension, and viscosity index are ideal. Although its boiling point is higher than HCFC-141b, its latent heat of evaporation is 40% lower than HCFC-141b, therefore, when the needle tube and the outer sleeve are silicified, the solvent is easily volatile, leaving little residue. Its surface tension is 26% lower than HCFC-141b, but its silicone oil dispersion and coating properties are better than HCFC-141b. Its GWP is lower than HCFC-141b. However, its main disadvantage is its cost, which is in the range of US$ 60/kg.
KC-6 0 <20
KC-6 is a new generation of environment-friendly medical silicone oil thinner developed by Beijing Aerospace Technology Innovation Co., Ltd., in light of the actual situation of China’s medical device industry. It is a combination of Siloxanes, Isoparaffin, etc. Its shortcomings are that it has certain degree of flammability, a high boiling point, and is less volatile as compared to the current technology. Its cost is favorable at about US$ 6.8/kg.
There are other alternatives available or under development. But due to their high GWP, flammability, performance, implement ability or costs, they were not considered to be viable. On the other hand, while adopting KC-6 as an alternative solvent, one should consider the following impacts: Safety KC-6 is flammable, although it has a higher flash point. When it is used by the medical device industry in clean rooms, particular attention needs to be given to safety due to the accumulation of solvent vapors, and necessary precautions have to be taken. With those measures taken, its flammability could be controlled. Silicification performance KC-6 has a higher boiling point; after silicification, its evaporation rate will be slower than HCFC-141b. In accordance with the current practice, as soon as the needles are silicificated, they will be turned upside down. Thus, if the solvent cannot be evaporated in time the silicification fluid will flow to the needle hub, causing the absence of silicone oil in the needle tip and the contamination of the needle hub and silicification tooling. In order not to reduce the output, air dryers will need to be installed on the assembly line.

� 5
Biocompatibility and drug compatibility Puncture instruments are devices that enter human tissues and may come into contact with blood. As KC-6 is a mixed solvent, the biocompatibility and drug compatibility of Isoparaffin, should be confirmed for patients’ safety.
2. Project Implementation The project was approved by 64th Executive Committee meeting in 2011 at a funding of US $ 557,667. Project implementation started in 2012, all the progress milestones required by the contract were reached and verified by the end of 2013. The project successfully passed national acceptance in December, 2013. This demonstration project proposed to modify a needle assembly line and an ultrasonic cleaning line at Zhejiang Kindly Medical Devices Co. Ltd. to provide a demonstration of KC-6 technology. According to the project implementation plan, the following activities were carried out:
I. Equipment redesign and installation
1. Ultrasonic cleaning line In order to realize mechanized operations with minimum operator interference, human errors and exposure, the silicification tooling has a strip shape; when it is cleaned, a container is needed to hold it. Each container can hold 30 pieces silicification tooling. Thus a mechanical lifting device, instead of the manual operation of an operator, can be used to transfer automatically the containers between different working stations. In this case, the operator will not touch the solvent. These containers are an essential equipment to realize closed and mechanized operation. In addition, the containers must be designed not to block ultrasound penetration. Otherwise, the silicification tooling held within cannot get the impact of ultrasonic, and the effectiveness and efficiency of cleaning will be significantly reduced. The ultrasonic cleaning line was designed based on the following considerations:
Pic1: Silification toolings Pic2: silification toolings with needles on To make the machine fully closed, and prevent operators from contact with solvents. To adopt the explosion-proof design, and select explosion-proof electrical appliances and equipment. To set up a solvent recovery system, so that solvent vapors in confined spaces and the polluted solvent
residue can be recovered in time, so that solvent consumption can be reduced. After cleaning with the use of KC-6, an evaluation on the cleaning effects from the aspects of appearance and
needle connection firmness needs to be conducted: - Appearance evaluation: Wipe the surface of the tooling with white paper, use a 10x magnifying glass to observe the surface of the white paper, and there should be no oil stains. - Connection firmness evaluation: Put a needle onto a cleaned silicification tooling, silicize the needle, and use a fastness tester to test its firmness to see whether the product is qualified.
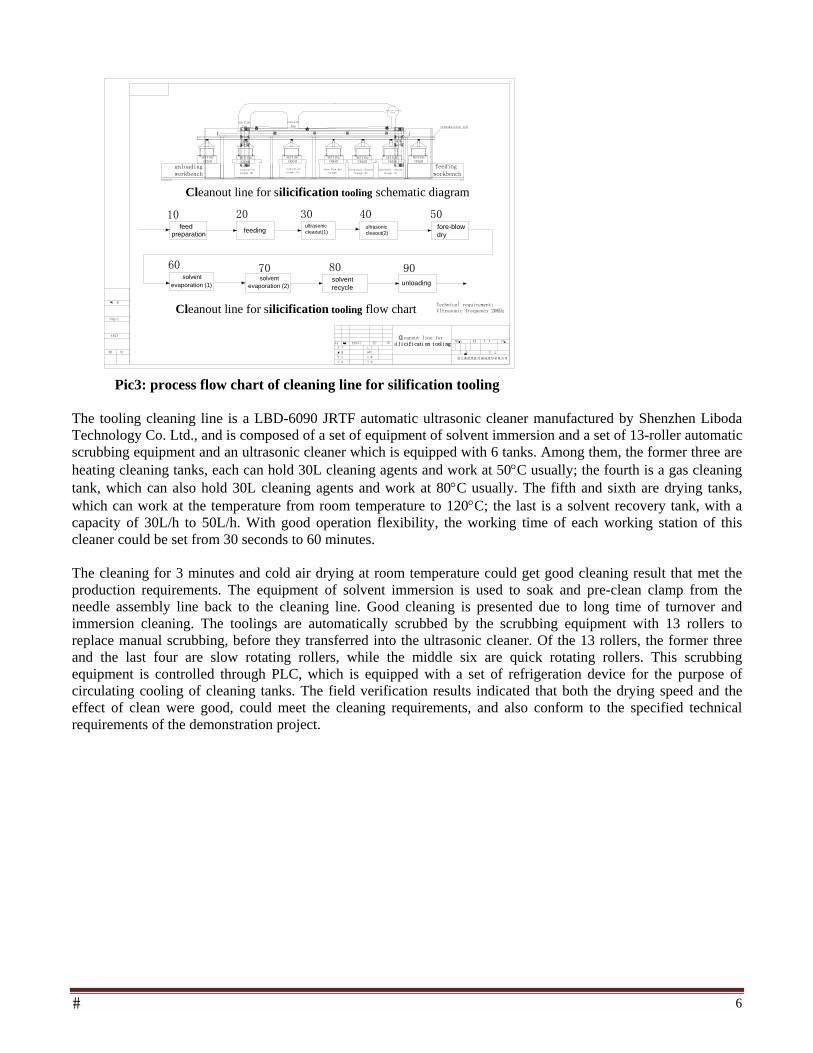
� 6
NETTING CRASH
NETTING CRASH
suction fan
suction fan
condensate recovery system
ultrasonic cleaout
trough (1)
ultrasonic cleaout
trough (2)
fore-blow dry trough
evaporation
trough (1) evaporation trough (2)
transmission rod
Cl eanout line for si l i ci f i cat i on tool i ng
Cleanout line for silicification tooling schematic diagram
Technical requirement:Ultrasonic frequency 20KHz
feed preparation
feedingultrasonic cleaout(1)
fore-blow dry
unloading
10 20 30 40 50
60 70 80solventrecycle
90
ultrasonic cleaout(2)
solvent evaporation (2)
Cleanout line for silicification tooling flow chart
solvent evaporation (1)
unloading workbench
feeding workbench
NETTING CRASH
NETTING CRASH
NETTING CRASH
NETTING CRASH
NETTING CRASH
Pic3: process flow chart of cleaning line for silification tooling
The tooling cleaning line is a LBD-6090 JRTF automatic ultrasonic cleaner manufactured by Shenzhen Liboda Technology Co. Ltd., and is composed of a set of equipment of solvent immersion and a set of 13-roller automatic scrubbing equipment and an ultrasonic cleaner which is equipped with 6 tanks. Among them, the former three are heating cleaning tanks, each can hold 30L cleaning agents and work at 50C usually; the fourth is a gas cleaning tank, which can also hold 30L cleaning agents and work at 80C usually. The fifth and sixth are drying tanks, which can work at the temperature from room temperature to 120C; the last is a solvent recovery tank, with a capacity of 30L/h to 50L/h. With good operation flexibility, the working time of each working station of this cleaner could be set from 30 seconds to 60 minutes. The cleaning for 3 minutes and cold air drying at room temperature could get good cleaning result that met the production requirements. The equipment of solvent immersion is used to soak and pre-clean clamp from the needle assembly line back to the cleaning line. Good cleaning is presented due to long time of turnover and immersion cleaning. The toolings are automatically scrubbed by the scrubbing equipment with 13 rollers to replace manual scrubbing, before they transferred into the ultrasonic cleaner. Of the 13 rollers, the former three and the last four are slow rotating rollers, while the middle six are quick rotating rollers. This scrubbing equipment is controlled through PLC, which is equipped with a set of refrigeration device for the purpose of circulating cooling of cleaning tanks. The field verification results indicated that both the drying speed and the effect of clean were good, could meet the cleaning requirements, and also conform to the specified technical requirements of the demonstration project.

� 7
Pic4: the needle-making clamp cleaning line
Pic5: Link reliability test data Pic6: cleaning quality test data
After modification, the silicification tooling cleaning lines has been adjusted according to the new features of KC-6 to meet health, safety and environment requirement. The needle assembly line The original needle assembly line includes eight major production processes, i.e. feeding of needle hub, assembly of needle canula, gluing adhesive, curing (in a tunnel oven), silicification, feeding of protective cap, pressing protective cap, and unloading products. Each of these processes is accomplished through special purpose-built automatic machines and devices of 1997-1998 vintage.
Refrigerator
Hanging basket-toolings container
Vent pipe
Dipping tank
Roller cleaner
Ultrasonic cleaner
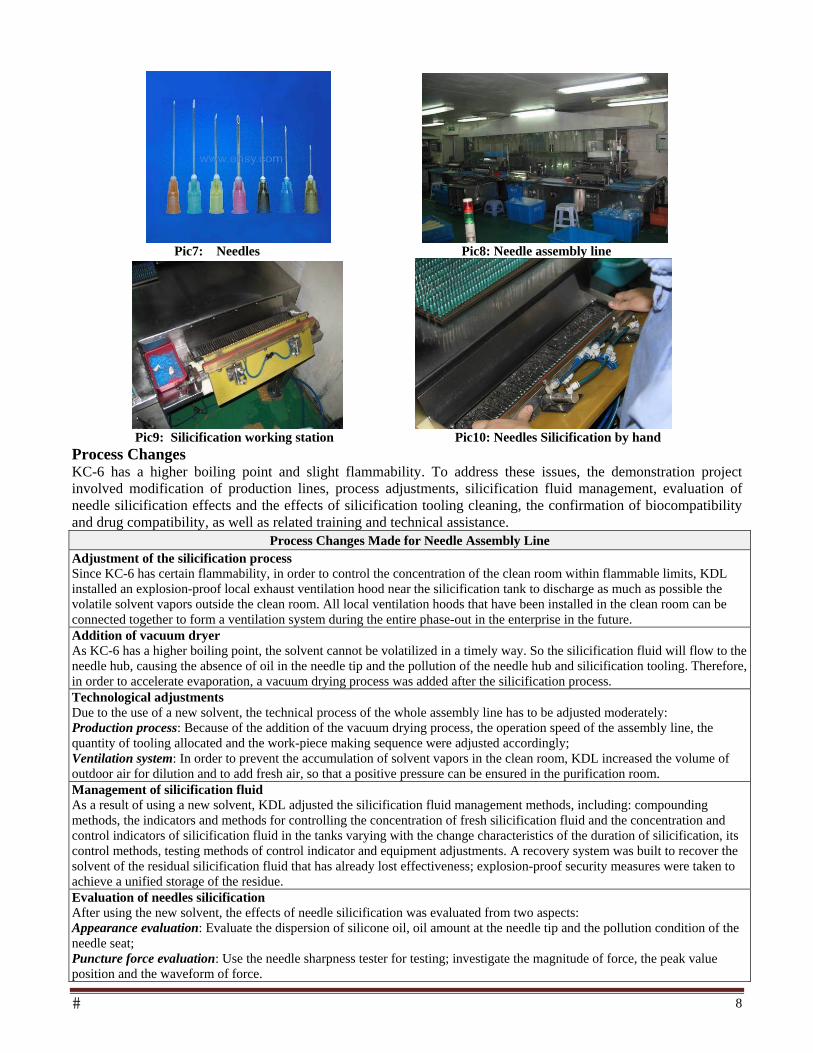
� 8
Pic7: Needles Pic8: Needle assembly line
Pic9: Silicification working station Pic10: Needles Silicification by hand Process Changes KC-6 has a higher boiling point and slight flammability. To address these issues, the demonstration project involved modification of production lines, process adjustments, silicification fluid management, evaluation of needle silicification effects and the effects of silicification tooling cleaning, the confirmation of biocompatibility and drug compatibility, as well as related training and technical assistance.
Process Changes Made for Needle Assembly Line Adjustment of the silicification process Since KC-6 has certain flammability, in order to control the concentration of the clean room within flammable limits, KDL installed an explosion-proof local exhaust ventilation hood near the silicification tank to discharge as much as possible the volatile solvent vapors outside the clean room. All local ventilation hoods that have been installed in the clean room can be connected together to form a ventilation system during the entire phase-out in the enterprise in the future. Addition of vacuum dryer As KC-6 has a higher boiling point, the solvent cannot be volatilized in a timely way. So the silicification fluid will flow to the needle hub, causing the absence of oil in the needle tip and the pollution of the needle hub and silicification tooling. Therefore, in order to accelerate evaporation, a vacuum drying process was added after the silicification process. Technological adjustments Due to the use of a new solvent, the technical process of the whole assembly line has to be adjusted moderately: Production process: Because of the addition of the vacuum drying process, the operation speed of the assembly line, the quantity of tooling allocated and the work-piece making sequence were adjusted accordingly; Ventilation system: In order to prevent the accumulation of solvent vapors in the clean room, KDL increased the volume of outdoor air for dilution and to add fresh air, so that a positive pressure can be ensured in the purification room. Management of silicification fluid As a result of using a new solvent, KDL adjusted the silicification fluid management methods, including: compounding methods, the indicators and methods for controlling the concentration of fresh silicification fluid and the concentration and control indicators of silicification fluid in the tanks varying with the change characteristics of the duration of silicification, its control methods, testing methods of control indicator and equipment adjustments. A recovery system was built to recover the solvent of the residual silicification fluid that has already lost effectiveness; explosion-proof security measures were taken to achieve a unified storage of the residue. Evaluation of needles silicification After using the new solvent, the effects of needle silicification was evaluated from two aspects: Appearance evaluation: Evaluate the dispersion of silicone oil, oil amount at the needle tip and the pollution condition of the needle seat; Puncture force evaluation: Use the needle sharpness tester for testing; investigate the magnitude of force, the peak value position and the waveform of force.
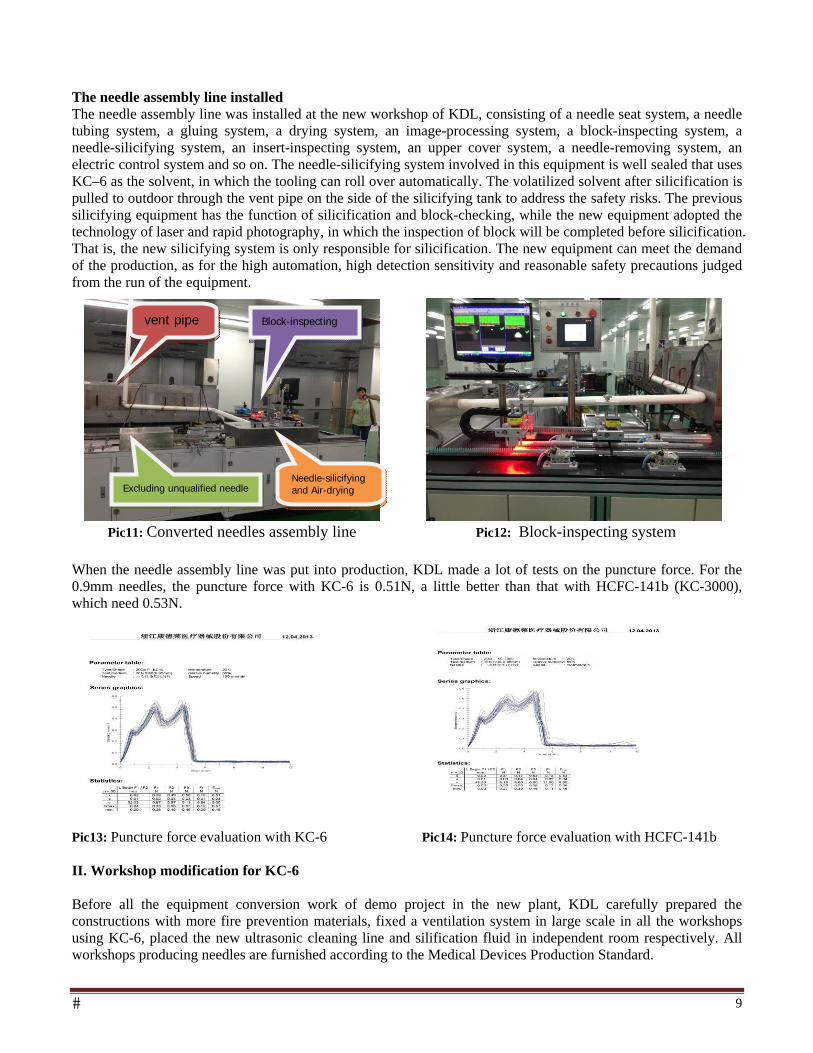
� 9
The needle assembly line installed The needle assembly line was installed at the new workshop of KDL, consisting of a needle seat system, a needle tubing system, a gluing system, a drying system, an image-processing system, a block-inspecting system, a needle-silicifying system, an insert-inspecting system, an upper cover system, a needle-removing system, an electric control system and so on. The needle-silicifying system involved in this equipment is well sealed that uses KC–6 as the solvent, in which the tooling can roll over automatically. The volatilized solvent after silicification is pulled to outdoor through the vent pipe on the side of the silicifying tank to address the safety risks. The previous silicifying equipment has the function of silicification and block-checking, while the new equipment adopted the technology of laser and rapid photography, in which the inspection of block will be completed before silicification. That is, the new silicifying system is only responsible for silicification. The new equipment can meet the demand of the production, as for the high automation, high detection sensitivity and reasonable safety precautions judged from the run of the equipment.
Pic11: Converted needles assembly line Pic12: Block-inspecting system
When the needle assembly line was put into production, KDL made a lot of tests on the puncture force. For the 0.9mm needles, the puncture force with KC-6 is 0.51N, a little better than that with HCFC-141b (KC-3000), which need 0.53N.
Pic13: Puncture force evaluation with KC-6 Pic14: Puncture force evaluation with HCFC-141b II. Workshop modification for KC-6 Before all the equipment conversion work of demo project in the new plant, KDL carefully prepared the constructions with more fire prevention materials, fixed a ventilation system in large scale in all the workshops using KC-6, placed the new ultrasonic cleaning line and silification fluid in independent room respectively. All workshops producing needles are furnished according to the Medical Devices Production Standard.
vent pipe Block-inspecting
Excluding unqualified needle Needle-silicifying and Air-drying
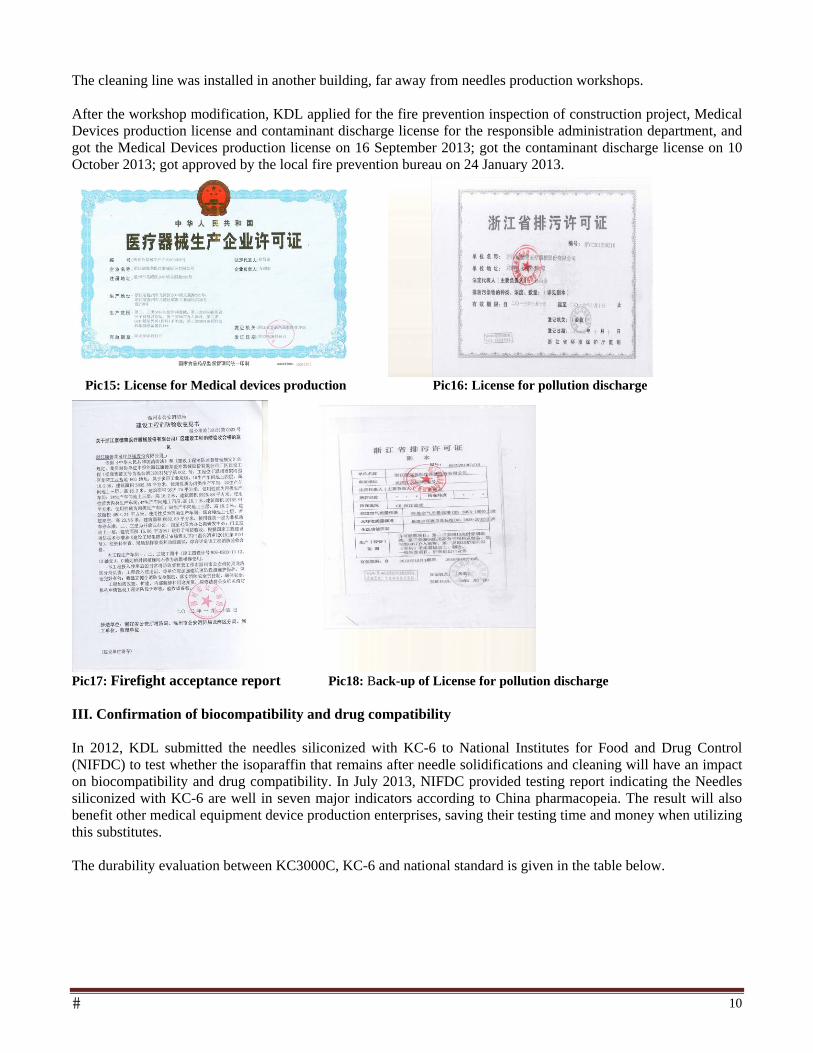
� 10
The cleaning line was installed in another building, far away from needles production workshops. After the workshop modification, KDL applied for the fire prevention inspection of construction project, Medical Devices production license and contaminant discharge license for the responsible administration department, and got the Medical Devices production license on 16 September 2013; got the contaminant discharge license on 10 October 2013; got approved by the local fire prevention bureau on 24 January 2013.
Pic15: License for Medical devices production Pic16: License for pollution discharge
Pic17: Firefight acceptance report Pic18: Back-up of License for pollution discharge III. Confirmation of biocompatibility and drug compatibility In 2012, KDL submitted the needles siliconized with KC-6 to National Institutes for Food and Drug Control (NIFDC) to test whether the isoparaffin that remains after needle solidifications and cleaning will have an impact on biocompatibility and drug compatibility. In July 2013, NIFDC provided testing report indicating the Needles siliconized with KC-6 are well in seven major indicators according to China pharmacopeia. The result will also benefit other medical equipment device production enterprises, saving their testing time and money when utilizing this substitutes. The durability evaluation between KC3000C, KC-6 and national standard is given in the table below.
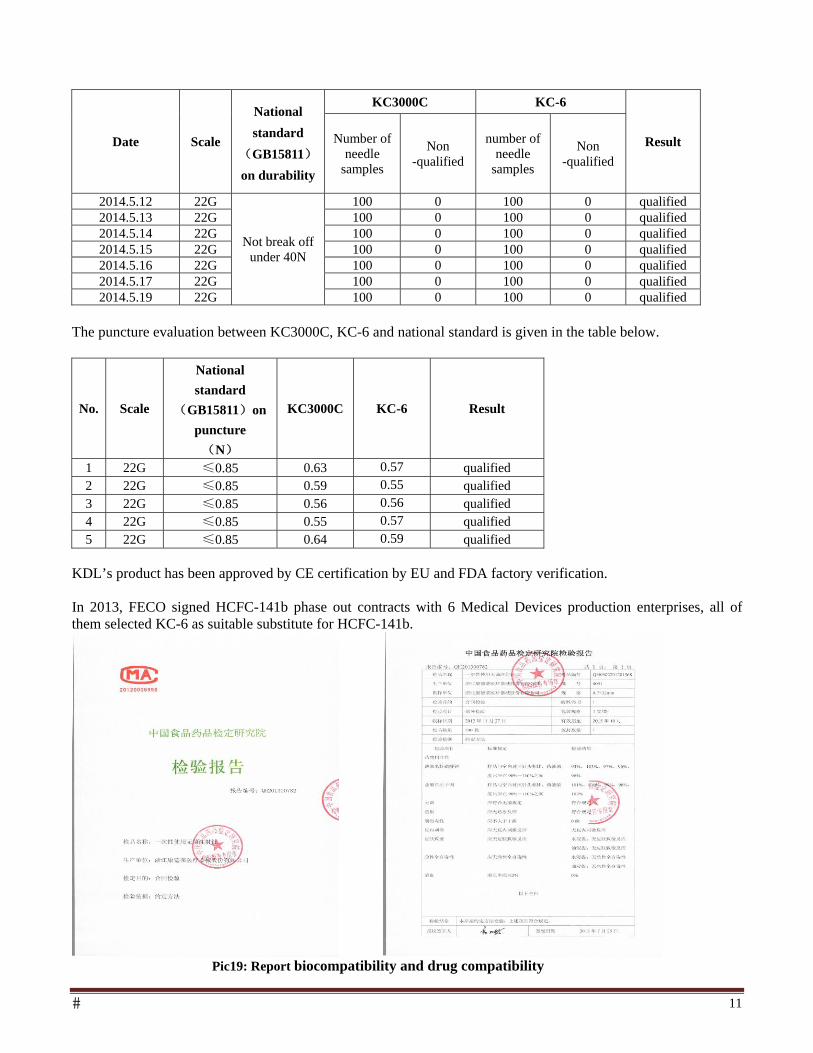
� 11
Date Scale
National
standard
(GB15811)
on durability
KC3000C KC-6
Result Number of needle
samples
Non -qualified
number of needle
samples
Non -qualified
2014.5.12 22G
Not break off under 40N
100 0 100 0 qualified 2014.5.13 22G 100 0 100 0 qualified 2014.5.14 22G 100 0 100 0 qualified 2014.5.15 22G 100 0 100 0 qualified 2014.5.16 22G 100 0 100 0 qualified 2014.5.17 22G 100 0 100 0 qualified 2014.5.19 22G 100 0 100 0 qualified
The puncture evaluation between KC3000C, KC-6 and national standard is given in the table below.
No. Scale
National
standard
(GB15811)on
puncture
(N)
KC3000C KC-6 Result
1 22G ≤0.85 0.63 0.57 qualified 2 22G ≤0.85 0.59 0.55 qualified 3 22G ≤0.85 0.56 0.56 qualified 4 22G ≤0.85 0.55 0.57 qualified 5 22G ≤0.85 0.64 0.59 qualified
KDL’s product has been approved by CE certification by EU and FDA factory verification. In 2013, FECO signed HCFC-141b phase out contracts with 6 Medical Devices production enterprises, all of them selected KC-6 as suitable substitute for HCFC-141b.
Pic19: Report biocompatibility and drug compatibility
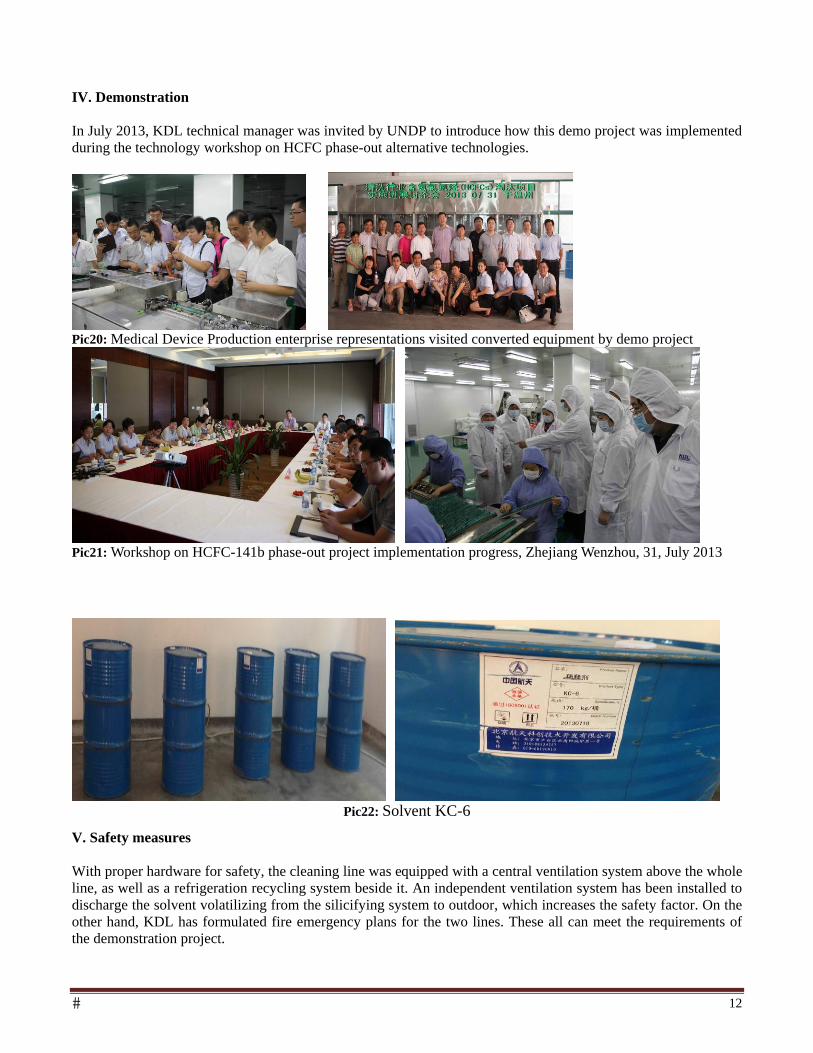
� 12
IV. Demonstration In July 2013, KDL technical manager was invited by UNDP to introduce how this demo project was implemented during the technology workshop on HCFC phase-out alternative technologies.
Pic20: Medical Device Production enterprise representations visited converted equipment by demo project
Pic21: Workshop on HCFC-141b phase-out project implementation progress, Zhejiang Wenzhou, 31, July 2013
Pic22: Solvent KC-6
V. Safety measures With proper hardware for safety, the cleaning line was equipped with a central ventilation system above the whole line, as well as a refrigeration recycling system beside it. An independent ventilation system has been installed to discharge the solvent volatilizing from the silicifying system to outdoor, which increases the safety factor. On the other hand, KDL has formulated fire emergency plans for the two lines. These all can meet the requirements of the demonstration project.
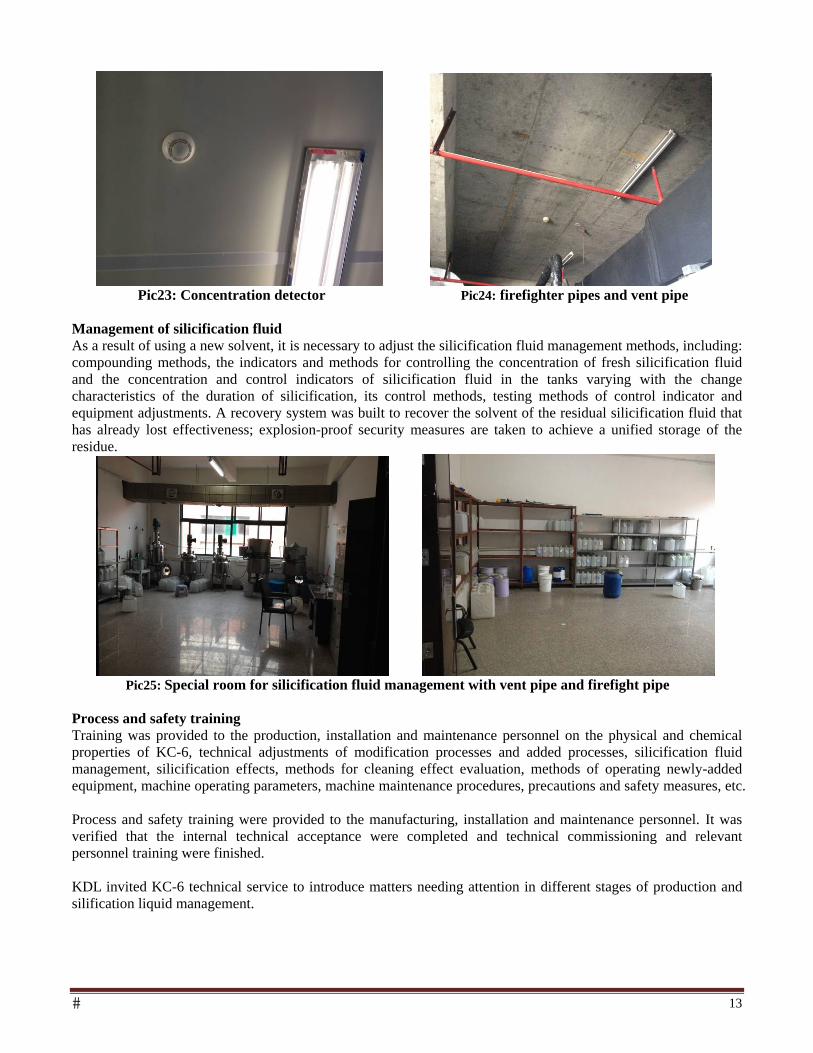
� 13
Pic23: Concentration detector Pic24: firefighter pipes and vent pipe Management of silicification fluid As a result of using a new solvent, it is necessary to adjust the silicification fluid management methods, including: compounding methods, the indicators and methods for controlling the concentration of fresh silicification fluid and the concentration and control indicators of silicification fluid in the tanks varying with the change characteristics of the duration of silicification, its control methods, testing methods of control indicator and equipment adjustments. A recovery system was built to recover the solvent of the residual silicification fluid that has already lost effectiveness; explosion-proof security measures are taken to achieve a unified storage of the residue.
Pic25: Special room for silicification fluid management with vent pipe and firefight pipe
Process and safety training Training was provided to the production, installation and maintenance personnel on the physical and chemical properties of KC-6, technical adjustments of modification processes and added processes, silicification fluid management, silicification effects, methods for cleaning effect evaluation, methods of operating newly-added equipment, machine operating parameters, machine maintenance procedures, precautions and safety measures, etc. Process and safety training were provided to the manufacturing, installation and maintenance personnel. It was verified that the internal technical acceptance were completed and technical commissioning and relevant personnel training were finished. KDL invited KC-6 technical service to introduce matters needing attention in different stages of production and silification liquid management.

� 14
Pic26: Training workshop for workers
3. Management The project was under the overall management and coordination of the Foreign Economic Cooperation Office, Ministry of Environmental Protection of China. UNDP was the implementing agency for the project, which provided international coordination and technical assistance. The project employs the Performance-based Payment (PBP) mechanism in its implementation. Under the PBP mechanism, the enterprise tasked with carrying out the conversion would play the role as a key executer, which is responsible for all the activities related to the conversion. The procurement was organized fully in line with the marketing principle ensuring cost-effective and timely installation of equipment for KC-6 based manufacturing operations. FECO and UNDP were not involved in the procurement activities of the enterprise by any means. FECO made payment to the enterprise in tranches for the costs of procurement and conversion, at agreed payment dates given in the payment schedule, and when milestones prerequisite for the tranche have all been achieved on time. Before each payment, FECO invited independent experts to verify whether the performance for each milestone that the payment is contingent on has been satisfied. The verification reports were submitted and accepted by UNDP as the main supporting documents for requesting the installment of payment. During project implementation, FECO and UNDP organized 5 verification missions combined with monitoring and evaluation at KDL factory - once in 2011, once in 2012 and 3 times in 2013. The experts group included technology experts and finance experts, FECO staff and UNDP staff as well. The experts team traced the project implementation situations, evaluated the project technical issues and progress, and verified whether the performance for each milestone of the respective payment has been satisfied. Each verification activity was carried out in a process of planning, preparation, data confirmation, technical material checking, on-the-spot investigation, result confirmation and conclusion.
4. Outcomes The project was completed and has successfully passed national acceptance in December 2013. The production line is in commercial operations, and the IOC has been disbursed to the enterprise in April.2014. The suitability of KC-6 technology as a viable replacement for HCFC-141b as a solvent in the manufacture of needles at Zhejiang KDL was established. The following are the important outcomes of the project.

� 15
The enterprise completed the redesign and production process of the needle assembly line and ultrasonic cleaning line in 2012.
Equipment for modification of ultra-sonic cleaning line and a half-automatic needle assembly line was procured in 2012.
Needle assembly line and ultra-sonic cleaning machine converted and verified in 2013. Demonstration was presented to other Medical Devices Production Enterprises in 2013. Technical commissioning was completed successfully and relevant personnel were trained in 2013. The project successfully passed national acceptance in December 2013.
5. Technical performance
KC-6 has a zero ODP and very low GWP, thus it is ozone-layer friendly but also climate-friendly. KC-6 is a mixture, whose components are easily available on the market at favorable costs through domestic
production; KC-6 has a higher boiling point than HCFC-141b; as a solvent, it is less volatile and therefore has less
dissipation and result in less consumption; KC-6 exhibits good solvent properties for silicone oil, removing silicone oil from contaminated tools quite
easily. The compound is clear and transparent, with good coating quality on the surface of needles; Due to its chemical stability and high flash point and boiling point, its comprehensive emission reduction and
environmental benefits turn out to be much better than the HCFC-141b-based solvents currently use; The compound can be used as both the silicone oil thinner and the cleaning agent, therefore, allows relatively
easy management of procurement, storage and handling; The KC-6 has been applied to other several Medical devices production enterprises in China. Thus, the
performance has potential to be promoted.
6. Project management and monitoring 6.1 Project progress The project was implementing smoothly according to the program schedule, and was completed by the end of 2013. It successfully passed national acceptance in December 2013. The capacity of the production line has been converted to use substitute solvent. Each of milestones was achieved and verified, the details are as follows:
Milestones Status
1st Signing of the contract FECO and the enterprise signed contract in March 2012
2nd KDL sign the procurement contracts with conversion equipment suppliers
Finished in October 2012
3rd Conversion equipment was installed in KDL Finished and verified in July 2013
4th The trial run of conversion equipment was verified by expert team
5th National acceptance Finished and verified in December 2013
6th Submit half-year run report and financial vouchers to FECO Finished and verified in April 2014 6.2 Conversion cost Total Project Costs The total contract amount signed with the enterprise is US$ 510,662 including ICC US$ 305,046, and IOC US$ 205,616.

� 16
Incremental Capital Costs The actual incremental capital costs for conversion was US$ 360,005 among which US$ 352,051 was funded by the MLF, and the US$ 7,954 was co-financed by the enterprise. The details of ICC are as follows:
Note: Contingency of USD15,000 was mainly disbursed for process adjustment and silicification tooling line modification (smoke detector and alarming system). The amount of USD15,000 is already included in these two line items. Incremental Operating Costs The approved total incremental operating costs calculated for one-year duration amount to US$ 205,616. The production line is in commercial operations and the IOC has been disbursed to enterprise in April.2014. The actual amount of incremental operating costs was US$ 217,600, US $ 205,616 was from bilateral cooperation of the Government of Japan. US $ 11,984 was co-financed by the enterprise. The cost for the baseline HCFC-141b based two-stage systems are summarized as below: 1. HCFC-141b price is US$ 2.66/kg 2. KC-6 price is US$ 6.8/kg (exchange rate changes a lot from 2009 to 2013)
Incremental Operating Costs Item KC-6 consumption
in one year(kg) HCFC-141b consumption in
one year(kg) Reasons
An ultrasonic Cleaning line 25,000 21,840 Tooling cleaning times frequency increased, from one time in half a month into one time in a week
A needle Assembly line 7,000 5,980 Air dryer after silification speeds solvent volatilization, the dryer took more solvent than actual coated in needle
Total 32,000 27,820
No. Item/Description Grant funds (US$) Counterpart
funds(US$) Actual cost
1. Needle assembly line modifications( Local exhaust device; air dryer; Conveyor modifications; Intermediate inspection bench; Installation and commissioning; Electronics adjustment and debugging)
96,763 0 96,763
2. Process Adjustments(Additional silicification tooling, Conveyor to transfer workpieces from silicification tooling to dryer) 10,884 7,954 18,838
3. Silicification fluid management (Closed liquid mixer ;Safety features (alarm, ex-proof electricals); Digital rotary viscometer; Residue processor)
42,950 0 42,950
4.
Silicification tooling line modifications (Modification of ultrasonic cleaning line and mechanization; Workpiece loading container; Solvent recovery system; Installation and commissioning; Electronics adjustment and debugging)
121,845 0 121,845
5. Performance evaluation (Puncture testing; Biocompatibility testing; Drug compatibility testing (statutory authorities) ;Silicification form evaluation; Silicification durability evaluation)
27,103 0 27,103
6.
Other(Design and technical expert fees, technical assistance Process; trials Process and safety training Documentation; reporting and information dissemination (UNDP) ;Project management(FECO) ;External monitoring and experts verification)
52,506 0 52,506
Total 352,051 7,954 360,005
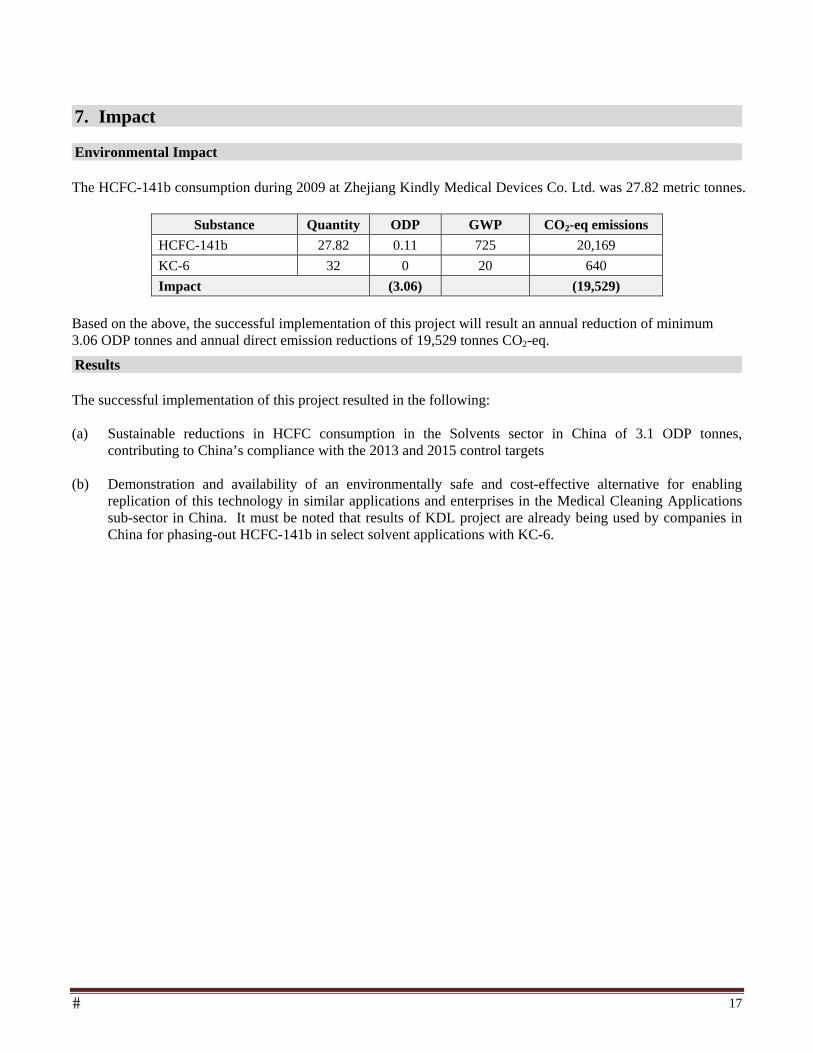
� 17
7. Impact Environmental Impact The HCFC-141b consumption during 2009 at Zhejiang Kindly Medical Devices Co. Ltd. was 27.82 metric tonnes.
Substance Quantity ODP GWP CO2-eq emissions
HCFC-141b 27.82 0.11 725 20,169
KC-6 32 0 20 640
Impact (3.06) (19,529)
Based on the above, the successful implementation of this project will result an annual reduction of minimum 3.06 ODP tonnes and annual direct emission reductions of 19,529 tonnes CO2-eq.
Results The successful implementation of this project resulted in the following: (a) Sustainable reductions in HCFC consumption in the Solvents sector in China of 3.1 ODP tonnes,
contributing to China’s compliance with the 2013 and 2015 control targets
(b) Demonstration and availability of an environmentally safe and cost-effective alternative for enabling replication of this technology in similar applications and enterprises in the Medical Cleaning Applications sub-sector in China. It must be noted that results of KDL project are already being used by companies in China for phasing-out HCFC-141b in select solvent applications with KC-6.


Establishment of a Private-Public Financing System for Disposal of ODS for Indonesia
March 2014
Prepared for
The World Bank Group 1818 H Street NW Washington, DC 20433
Prepared by
ICF International 1725 Eye Street, Suite 1000 Washington, DC 20006

blankpage
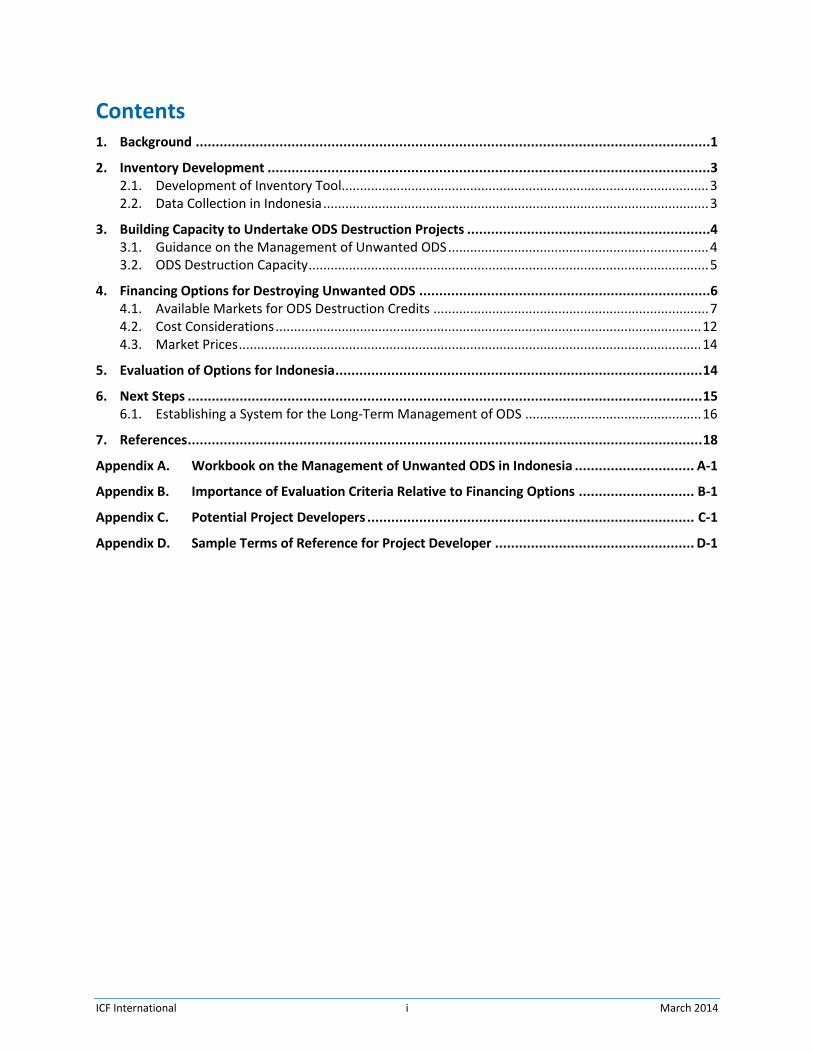
ICF International i March 2014
Contents 1. Background .................................................................................................................................1
2. Inventory Development ...............................................................................................................3 2.1. Development of Inventory Tool.................................................................................................... 3 2.2. Data Collection in Indonesia ......................................................................................................... 3
3. Building Capacity to Undertake ODS Destruction Projects .............................................................4 3.1. Guidance on the Management of Unwanted ODS ....................................................................... 4 3.2. ODS Destruction Capacity ............................................................................................................. 5
4. Financing Options for Destroying Unwanted ODS .........................................................................6 4.1. Available Markets for ODS Destruction Credits ........................................................................... 7 4.2. Cost Considerations .................................................................................................................... 12 4.3. Market Prices .............................................................................................................................. 14
5. Evaluation of Options for Indonesia ............................................................................................ 14
6. Next Steps ................................................................................................................................. 15 6.1. Establishing a System for the Long-Term Management of ODS ................................................ 16
7. References ................................................................................................................................. 18
Appendix A. Workbook on the Management of Unwanted ODS in Indonesia .............................. A-1
Appendix B. Importance of Evaluation Criteria Relative to Financing Options ............................. B-1
Appendix C. Potential Project Developers .................................................................................. C-1
Appendix D. Sample Terms of Reference for Project Developer .................................................. D-1

blankpage

Establishment of a Private-Public Financing System for Disposal of ODS for Indonesia
ICF International iii March 2014
Acronyms and Abbreviations
Acronym / Abbreviation Stands For
CCO Chemical Control Order
CDM Clean Development Mechanism
CFC chlorofluorocarbon
DRE destruction and removal efficiency
EOI expression of interest
GHG greenhouse gas
GWP global warming potential
HCFC hydrochlorofluorocarbon
HFC hydrofluorocarbon
kg kilogram
km kilometer
LVC low volume consuming country
MLF Multilateral Fund
MoE Ministry of Environment
MRV measurement, reporting, and verification
MtCO2e million metric tons carbon dioxide equivalent
NCCC National Council on Climate Change
NCPP National CFC Phase-out Management Plan
NCS Nusantara Carbon Scheme
ODS ozone depleting substance
OEWG Open-Ended Working Group
PCBs polychlorinated biphenyls
PMR Partnership for Market Readiness
PMU Project Management Unit
tCO2e metric tons carbon dioxide equivalent
TEAP Technology and Economic Assessment Panel
ToR terms of reference
UNEP United Nations Environment Programme
UNIDO United Nations Industrial Development Organization
VCS Verified Carbon Standard
VCU verified carbon unit

Establishment of a Private-Public Financing System for Disposal of ODS for Indonesia
ICF International iv March 2014
blankpage
Establishment of a Private-Public Financing System for Disposal of ODS for Indonesia
ICF International 1 March 2014
1. Background The Montreal Protocol on Substances that Deplete the Ozone Layer has been immensely effective at
reducing the production and consumption of ozone depleting substances (ODS) worldwide. While the
production and consumption of ODS has dramatically diminished, a large amount of ODS still remains in
equipment, products, and stockpiles held by country governments as well as industrial and commercial
users. Because emissions from ODS banks are not explicitly controlled by the Montreal Protocol, there
is significant risk that these ODS will be released to the atmosphere, contributing to both ozone
depletion and global climate change. Many countries have enacted regulations that prohibit the venting
of ODS; however, regulations alone are often not enough.
To prevent inadvertent or intentional emissions
of ODS banks, financial incentives must be put in
place to encourage proper management and
ensure eventual destruction of this unwanted
material. The high global warming potential
(GWP) of ODS means that their destruction has
the ability to generate significant volumes of
carbon credits. Indeed, a study prepared for the
World Bank in 2010 found that opportunity exists
for financing the destruction of ODS through the
voluntary carbon market (ICF 2010).
To help countries operating under Article 5(1) of
the Montreal Protocol take advantage of this
opportunity, ICF International was commissioned
by the World Bank to explore options for
engaging the private and public sectors in
financing the destruction of unwanted ODS in
Indonesia.1 The remainder of this report
provides a summary of the results of this effort,
including the following:
Development of an inventory of unwanted ODS (Section 2);
Building capacity (Section 3);
Exploring options for destroying unwanted ODS (Section 4);
Evaluation of options for Indonesia (Section 5); and
Next steps (Section 6).
1 As part of this work, ICF also explored options for engaging the private and public sectors in financing the destruction of unwanted ODS in the Philippines. The outcome of this activity is documented in a separate report.
Financing the Destruction of ODS through the Voluntary Carbon Market
The 2010 study prepared for the World Bank assessed opportunities for financing the destruction of unwanted ODS through the voluntary carbon market. The study concluded that there is a market for ODS destruction through frameworks such as the Verified Carbon Standard and Climate Action Reserve. The study recognized that some challenges do exist, but that overall the voluntary market is likely a win-win opportunity.
For more information, see the full report online: http://documents.worldbank.org/curated/en/2010/02/14551009/study-financing-destruction-unwanted-ozone-depleting-substances-through-voluntary-carbon-market.

Establishment of a Private-Public Financing System for Disposal of ODS for Indonesia
ICF International 2 March 2014
Long Term Approach for Recovery, Collection, and Management of ODS There are three main sources of ODS: (1) ODS stockpiles that are obtained by Customs when illegally imported into the country; (2) ODS recovered from large equipment (e.g., chillers) during decommissioning; and (3) ODS recovered from small equipment (e.g., household refrigerators, window air conditioning units) at end-of-life. A phased approach should be undertaken to ensure systems are established to properly manage each source of ODS. Phase 1: ODS Stockpiles from Illegal Imports – Destroying illegally imported stockpiles of ODS represents the first phase of ODS management. ODS stockpiles are owned by the government and are often stored at a central location, making them the easiest source of ODS to manage. However, stockpiles of ODS that are left unattended will slowly vent to the atmosphere. Therefore, prompt disposal is necessary to avoid emissions.
Phase 2: ODS Recovered from Large Equipment – The second phase of ODS management involves collection and destruction of ODS recovered from large equipment. When large pieces of equipment such as chillers are decommissioned, the refrigerant is often recovered since there is an economic incentive to reuse it for the servicing of other equipment. Additionally, many countries have regulations in place that require the recovery of ODS from large equipment. Retired chillers that use large amounts of refrigerant provide a steady stream of ODS that, if not reused, will be stockpiled and eventually vented into the atmosphere. The development of systems to collect and destroy ODS from retired large equipment is needed to ensure proper management of ODS from this source. Establishing these systems now is also important for the future management of HFCs.
Phase 3: ODS Recovered from Small Equipment – The third phase of ODS management involves ODS recovered from appliances such as refrigerators, freezers, and air conditioners, which historically used CFCs and now largely rely on HCFCs and HFCs. Individually, these pieces of equipment contain only a small amount of refrigerant (e.g., 0.13 – 2 kg). Thus, there is little economic incentive to recover this material. However, with more than 65 million households in Indonesia (Statistics Indonesia 2009), collectively, the refrigerant that can be recovered from small equipment represents a significant opportunity for generating carbon credits from destruction. To prohibit venting and ensure refrigerant is recovered at end-of-life, regulations should be established along with collection and recycling programs. The United States, Brazil, Mexico, and many countries in Europe have already established appliance recycling programs to encourage the proper management of ODS. Establishing these collection centers now is also important for the future management of HFCs.
Phase 3: Destroy ODS Recovered from Small Equipment
Phase 1: Destroy ODS Stockpiles from Illegal Imports
Phase 2: Destroy ODS Recovered from Large Equipment
Year 1 On-going
Year 3 On-going
Year 5 On-going

Establishment of a Private-Public Financing System for Disposal of ODS for Indonesia
ICF International 3 March 2014
2. Inventory Development As a first step to managing banks of unwanted ODS, an inventory detailing the quantity, type, purity,
location, and ownership of the material must be developed. This step was completed in two parts:
through (a) the development of an inventory tool and (b) data collection and tool population, as
described in the sections that follow.
2.1. Development of Inventory Tool
To assist country governments in the development of
an ODS inventory, an Excel-based inventory tool was
developed. The inventory tool is designed to collect
information on ODS contained in stockpiles, chillers,
and other equipment (e.g., refrigerators and air
conditioners). The inventory tool also includes a
summary table that auto-completes to show total
quantities of unwanted ODS held domestically. A
detailed description of the inventory tool along with
guidance on how to populate the tool is presented in
the Workbook provided in Appendix A.
2.2. Data Collection in Indonesia
To populate the inventory tool, information on stockpiles of unwanted ODS in Indonesia was compiled
by a local consultant through consultation with Indonesian Customs officials and the Indonesian Ministry
of Environment (MoE). It was identified that illegally imported ODS was seized on seven different
occasions between February 2004 and June 2009. Through further discussions, it was confirmed that all
confiscated material that was seized was refused entry into the country and no longer resides in
Indonesia. A summary of these seizures is provided in Table 1 below. Table 2 that follows summarizes
these seizures by ODS type and quantity.
Table 1: ODS Seizures by Indonesian Customs (2004-2009)*
# Port Date ODS Type Quantity (kg)
1 Tanjung Priok 2/11/2004 CFC-12 10,132
2 Tanjung Emas 3/24/2004 CFC-12 31,280
3 Tanjung Emas 9/3/2007 CFC-12 39,535.2
CFC-11 4,000
HCFC-141b 4,000
4 Tanjung Balai Karimun 10/1/2007 CFC-12 3,372.8
5 Tanjung Priok 3/25/2009 CFC-12 15,504
6 Merak 5/25/2009 CFC-12 53,883
7 Pontianak 6/2/2009 HCFC-22 15,572 * All seized imports have since been exported from Indonesia.
Source: Pasek (2013).
ODS Stockpiles
Stockpiles of ODS are generally stored in cylinders within large facilities and warehouses. These cylinders are often pressurized and can be distinguished using color, pressure, size, weight, or shape. The refrigerant industry typically universally distinguishes the type of refrigerant in a cylinder primarily based on color and pressure. These stockpiles of ODS are often consolidated into larger cylinders or storage tanks prior to destruction to avoid additional shipping expenses.
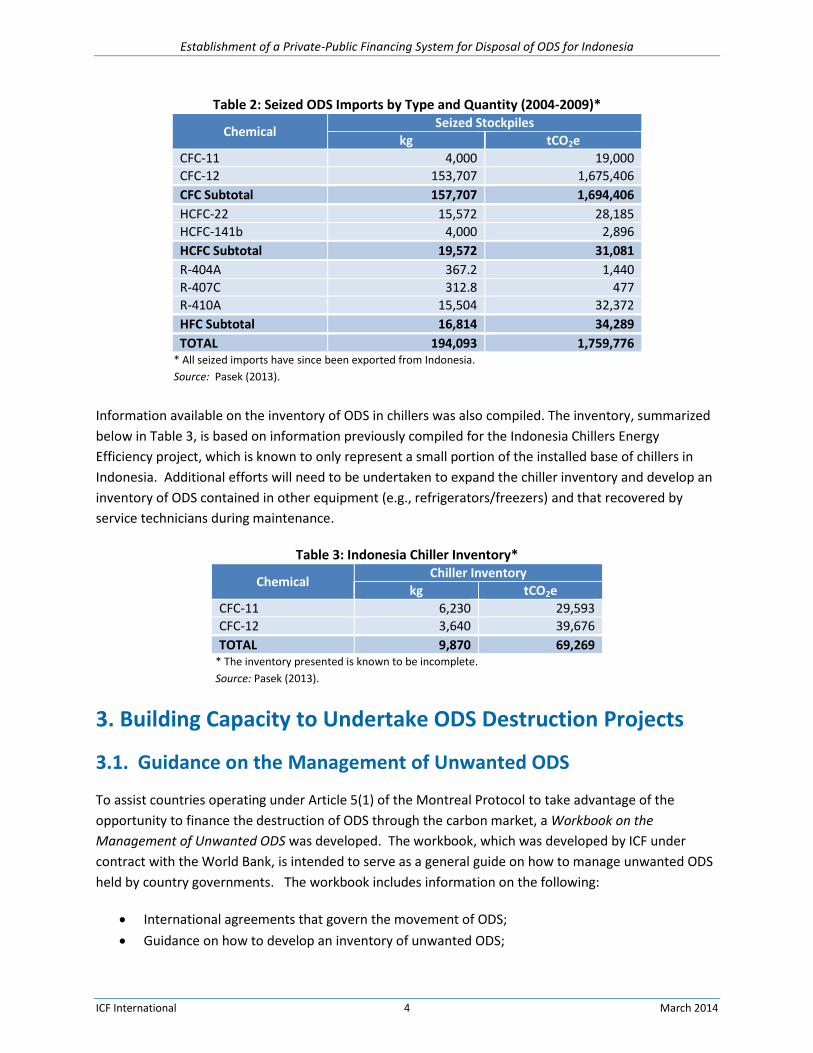
Establishment of a Private-Public Financing System for Disposal of ODS for Indonesia
ICF International 4 March 2014
Table 2: Seized ODS Imports by Type and Quantity (2004-2009)*
Chemical Seized Stockpiles
kg tCO2e
CFC-11 4,000 19,000
CFC-12 153,707 1,675,406
CFC Subtotal 157,707 1,694,406
HCFC-22 15,572 28,185
HCFC-141b 4,000 2,896
HCFC Subtotal 19,572 31,081
R-404A 367.2 1,440
R-407C 312.8 477
R-410A 15,504 32,372
HFC Subtotal 16,814 34,289
TOTAL 194,093 1,759,776 * All seized imports have since been exported from Indonesia.
Source: Pasek (2013).
Information available on the inventory of ODS in chillers was also compiled. The inventory, summarized
below in Table 3, is based on information previously compiled for the Indonesia Chillers Energy
Efficiency project, which is known to only represent a small portion of the installed base of chillers in
Indonesia. Additional efforts will need to be undertaken to expand the chiller inventory and develop an
inventory of ODS contained in other equipment (e.g., refrigerators/freezers) and that recovered by
service technicians during maintenance.
Table 3: Indonesia Chiller Inventory*
Chemical Chiller Inventory
kg tCO2e
CFC-11 6,230 29,593
CFC-12 3,640 39,676
TOTAL 9,870 69,269 * The inventory presented is known to be incomplete.
Source: Pasek (2013).
3. Building Capacity to Undertake ODS Destruction Projects
3.1. Guidance on the Management of Unwanted ODS
To assist countries operating under Article 5(1) of the Montreal Protocol to take advantage of the
opportunity to finance the destruction of ODS through the carbon market, a Workbook on the
Management of Unwanted ODS was developed. The workbook, which was developed by ICF under
contract with the World Bank, is intended to serve as a general guide on how to manage unwanted ODS
held by country governments. The workbook includes information on the following:
International agreements that govern the movement of ODS;
Guidance on how to develop an inventory of unwanted ODS;
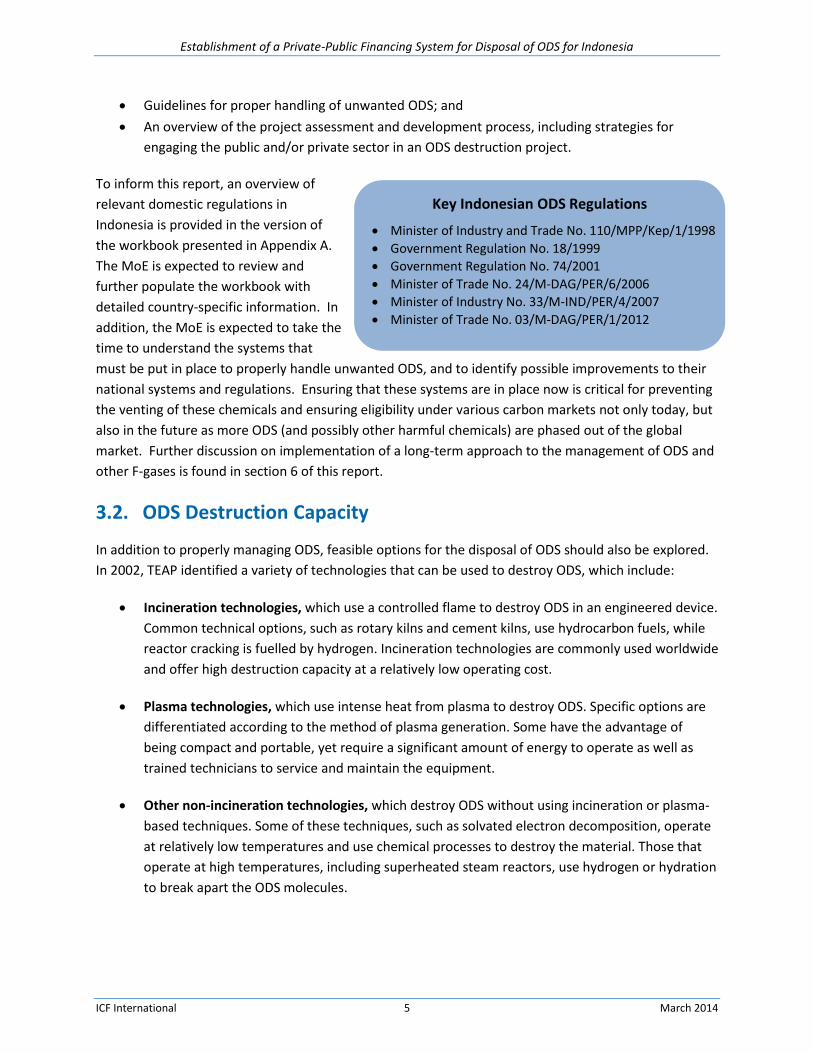
Establishment of a Private-Public Financing System for Disposal of ODS for Indonesia
ICF International 5 March 2014
Guidelines for proper handling of unwanted ODS; and
An overview of the project assessment and development process, including strategies for
engaging the public and/or private sector in an ODS destruction project.
To inform this report, an overview of
relevant domestic regulations in
Indonesia is provided in the version of
the workbook presented in Appendix A.
The MoE is expected to review and
further populate the workbook with
detailed country-specific information. In
addition, the MoE is expected to take the
time to understand the systems that
must be put in place to properly handle unwanted ODS, and to identify possible improvements to their
national systems and regulations. Ensuring that these systems are in place now is critical for preventing
the venting of these chemicals and ensuring eligibility under various carbon markets not only today, but
also in the future as more ODS (and possibly other harmful chemicals) are phased out of the global
market. Further discussion on implementation of a long-term approach to the management of ODS and
other F-gases is found in section 6 of this report.
3.2. ODS Destruction Capacity
In addition to properly managing ODS, feasible options for the disposal of ODS should also be explored.
In 2002, TEAP identified a variety of technologies that can be used to destroy ODS, which include:
Incineration technologies, which use a controlled flame to destroy ODS in an engineered device.
Common technical options, such as rotary kilns and cement kilns, use hydrocarbon fuels, while
reactor cracking is fuelled by hydrogen. Incineration technologies are commonly used worldwide
and offer high destruction capacity at a relatively low operating cost.
Plasma technologies, which use intense heat from plasma to destroy ODS. Specific options are
differentiated according to the method of plasma generation. Some have the advantage of
being compact and portable, yet require a significant amount of energy to operate as well as
trained technicians to service and maintain the equipment.
Other non-incineration technologies, which destroy ODS without using incineration or plasma-
based techniques. Some of these techniques, such as solvated electron decomposition, operate
at relatively low temperatures and use chemical processes to destroy the material. Those that
operate at high temperatures, including superheated steam reactors, use hydrogen or hydration
to break apart the ODS molecules.
Key Indonesian ODS Regulations
Minister of Industry and Trade No. 110/MPP/Kep/1/1998
Government Regulation No. 18/1999
Government Regulation No. 74/2001
Minister of Trade No. 24/M-DAG/PER/6/2006
Minister of Industry No. 33/M-IND/PER/4/2007
Minister of Trade No. 03/M-DAG/PER/1/2012
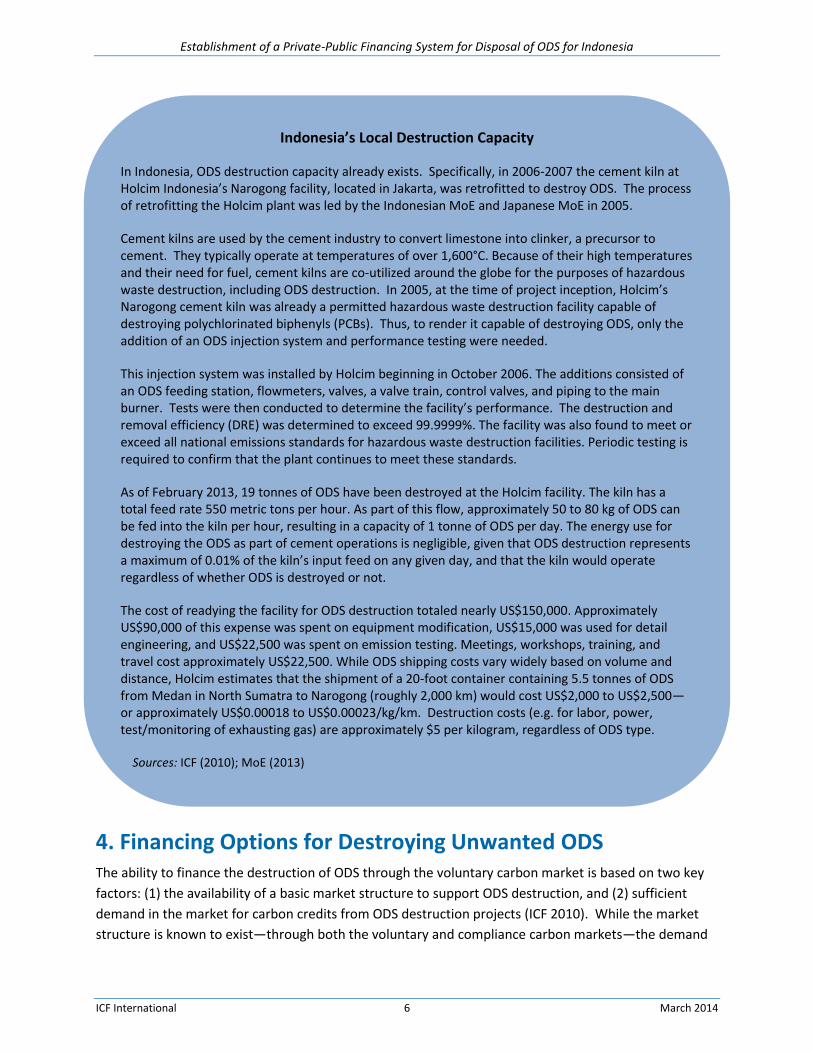
Establishment of a Private-Public Financing System for Disposal of ODS for Indonesia
ICF International 6 March 2014
4. Financing Options for Destroying Unwanted ODS The ability to finance the destruction of ODS through the voluntary carbon market is based on two key
factors: (1) the availability of a basic market structure to support ODS destruction, and (2) sufficient
demand in the market for carbon credits from ODS destruction projects (ICF 2010). While the market
structure is known to exist—through both the voluntary and compliance carbon markets—the demand
Indonesia’s Local Destruction Capacity
In Indonesia, ODS destruction capacity already exists. Specifically, in 2006-2007 the cement kiln at Holcim Indonesia’s Narogong facility, located in Jakarta, was retrofitted to destroy ODS. The process of retrofitting the Holcim plant was led by the Indonesian MoE and Japanese MoE in 2005.
Cement kilns are used by the cement industry to convert limestone into clinker, a precursor to cement. They typically operate at temperatures of over 1,600°C. Because of their high temperatures and their need for fuel, cement kilns are co-utilized around the globe for the purposes of hazardous waste destruction, including ODS destruction. In 2005, at the time of project inception, Holcim’s Narogong cement kiln was already a permitted hazardous waste destruction facility capable of destroying polychlorinated biphenyls (PCBs). Thus, to render it capable of destroying ODS, only the addition of an ODS injection system and performance testing were needed.
This injection system was installed by Holcim beginning in October 2006. The additions consisted of an ODS feeding station, flowmeters, valves, a valve train, control valves, and piping to the main burner. Tests were then conducted to determine the facility’s performance. The destruction and removal efficiency (DRE) was determined to exceed 99.9999%. The facility was also found to meet or exceed all national emissions standards for hazardous waste destruction facilities. Periodic testing is required to confirm that the plant continues to meet these standards.
As of February 2013, 19 tonnes of ODS have been destroyed at the Holcim facility. The kiln has a total feed rate 550 metric tons per hour. As part of this flow, approximately 50 to 80 kg of ODS can be fed into the kiln per hour, resulting in a capacity of 1 tonne of ODS per day. The energy use for destroying the ODS as part of cement operations is negligible, given that ODS destruction represents a maximum of 0.01% of the kiln’s input feed on any given day, and that the kiln would operate regardless of whether ODS is destroyed or not.
The cost of readying the facility for ODS destruction totaled nearly US$150,000. Approximately US$90,000 of this expense was spent on equipment modification, US$15,000 was used for detail engineering, and US$22,500 was spent on emission testing. Meetings, workshops, training, and travel cost approximately US$22,500. While ODS shipping costs vary widely based on volume and distance, Holcim estimates that the shipment of a 20-foot container containing 5.5 tonnes of ODS from Medan in North Sumatra to Narogong (roughly 2,000 km) would cost US$2,000 to US$2,500—or approximately US$0.00018 to US$0.00023/kg/km. Destruction costs (e.g. for labor, power, test/monitoring of exhausting gas) are approximately $5 per kilogram, regardless of ODS type.
Sources: ICF (2010); MoE (2013)
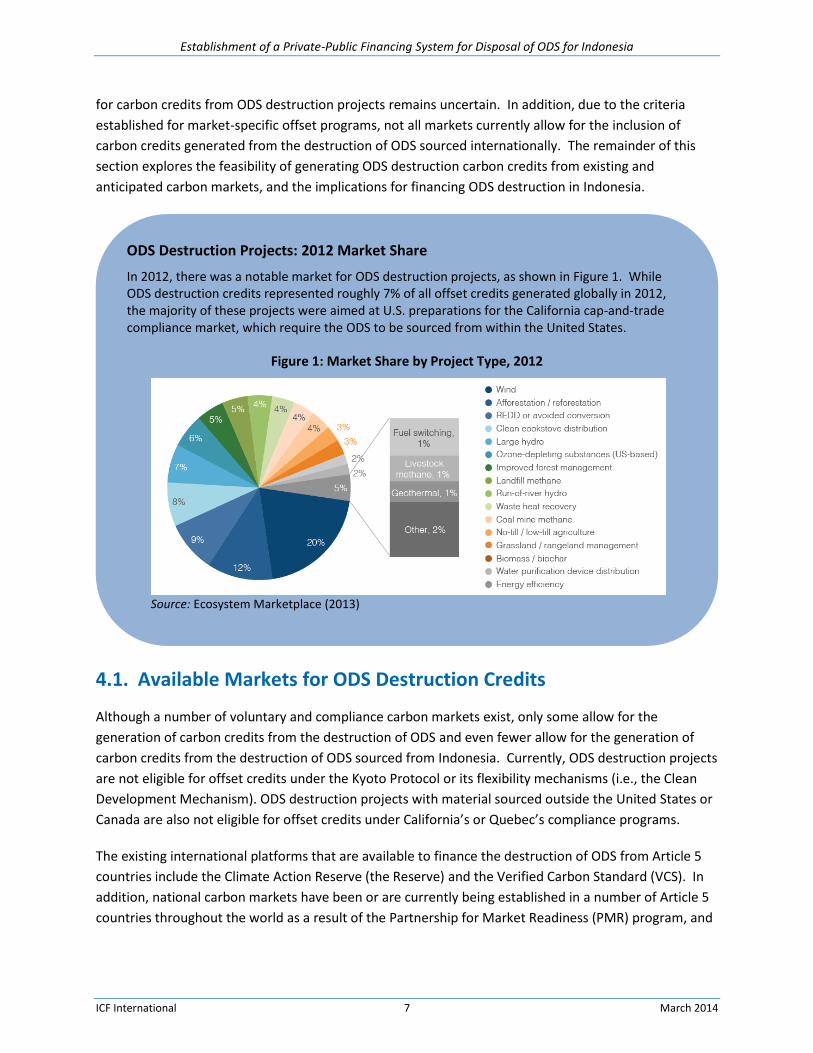
Establishment of a Private-Public Financing System for Disposal of ODS for Indonesia
ICF International 7 March 2014
for carbon credits from ODS destruction projects remains uncertain. In addition, due to the criteria
established for market-specific offset programs, not all markets currently allow for the inclusion of
carbon credits generated from the destruction of ODS sourced internationally. The remainder of this
section explores the feasibility of generating ODS destruction carbon credits from existing and
anticipated carbon markets, and the implications for financing ODS destruction in Indonesia.
4.1. Available Markets for ODS Destruction Credits
Although a number of voluntary and compliance carbon markets exist, only some allow for the
generation of carbon credits from the destruction of ODS and even fewer allow for the generation of
carbon credits from the destruction of ODS sourced from Indonesia. Currently, ODS destruction projects
are not eligible for offset credits under the Kyoto Protocol or its flexibility mechanisms (i.e., the Clean
Development Mechanism). ODS destruction projects with material sourced outside the United States or
Canada are also not eligible for offset credits under California’s or Quebec’s compliance programs.
The existing international platforms that are available to finance the destruction of ODS from Article 5
countries include the Climate Action Reserve (the Reserve) and the Verified Carbon Standard (VCS). In
addition, national carbon markets have been or are currently being established in a number of Article 5
countries throughout the world as a result of the Partnership for Market Readiness (PMR) program, and
ODS Destruction Projects: 2012 Market Share
In 2012, there was a notable market for ODS destruction projects, as shown in Figure 1. While ODS destruction credits represented roughly 7% of all offset credits generated globally in 2012, the majority of these projects were aimed at U.S. preparations for the California cap-and-trade compliance market, which require the ODS to be sourced from within the United States.
Figure 1: Market Share by Project Type, 2012
Source: Ecosystem Marketplace (2013)
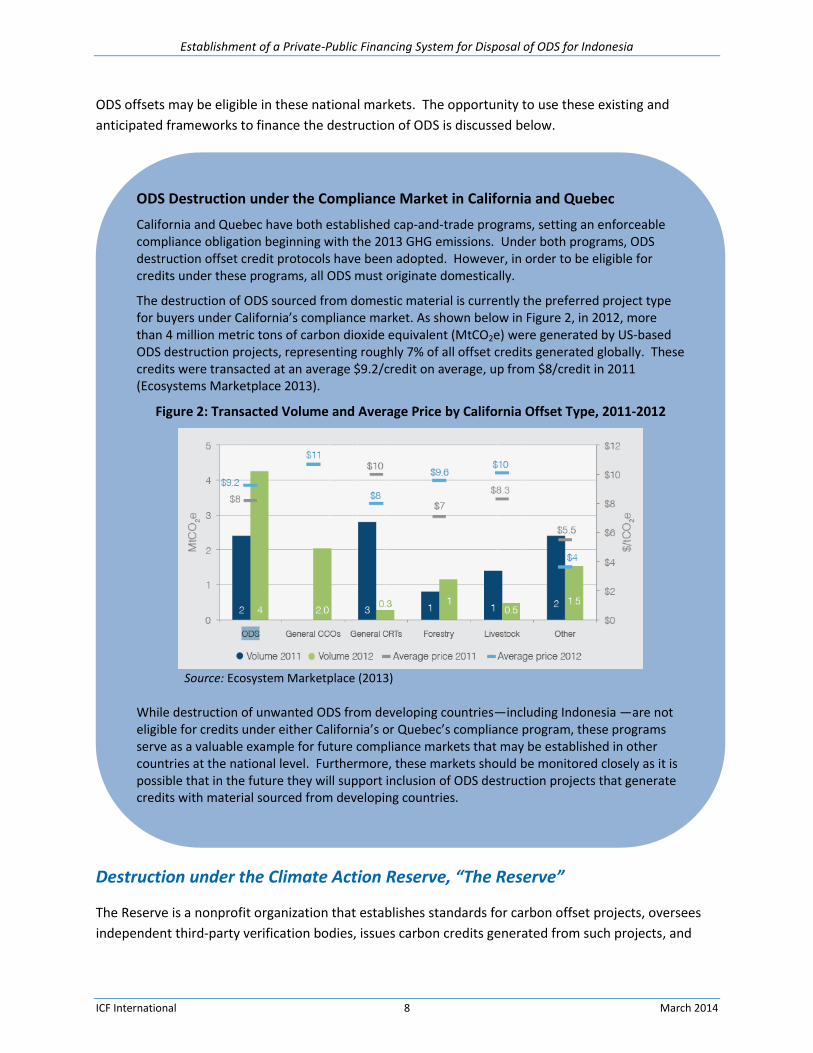
Establishment of a Private-Public Financing System for Disposal of ODS for Indonesia
ICF International 8 March 2014
ODS offsets may be eligible in these national markets. The opportunity to use these existing and
anticipated frameworks to finance the destruction of ODS is discussed below.
Destruction under the Climate Action Reserve, “The Reserve”
The Reserve is a nonprofit organization that establishes standards for carbon offset projects, oversees
independent third-party verification bodies, issues carbon credits generated from such projects, and
ODS Destruction under the Compliance Market in California and Quebec
California and Quebec have both established cap-and-trade programs, setting an enforceable compliance obligation beginning with the 2013 GHG emissions. Under both programs, ODS destruction offset credit protocols have been adopted. However, in order to be eligible for credits under these programs, all ODS must originate domestically.
The destruction of ODS sourced from domestic material is currently the preferred project type for buyers under California’s compliance market. As shown below in Figure 2, in 2012, more than 4 million metric tons of carbon dioxide equivalent (MtCO2e) were generated by US-based ODS destruction projects, representing roughly 7% of all offset credits generated globally. These credits were transacted at an average $9.2/credit on average, up from $8/credit in 2011 (Ecosystems Marketplace 2013).
Figure 2: Transacted Volume and Average Price by California Offset Type, 2011-2012
Source: Ecosystem Marketplace (2013)
While destruction of unwanted ODS from developing countries—including Indonesia —are not eligible for credits under either California’s or Quebec’s compliance program, these programs serve as a valuable example for future compliance markets that may be established in other countries at the national level. Furthermore, these markets should be monitored closely as it is possible that in the future they will support inclusion of ODS destruction projects that generate credits with material sourced from developing countries.
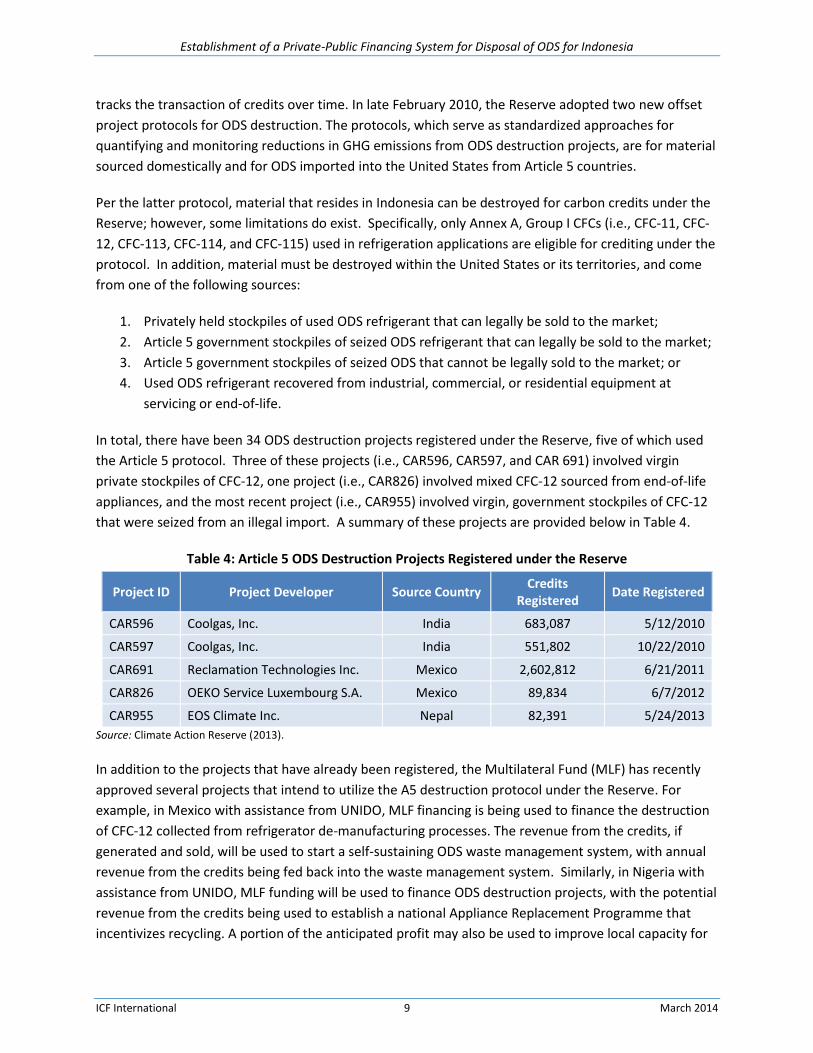
Establishment of a Private-Public Financing System for Disposal of ODS for Indonesia
ICF International 9 March 2014
tracks the transaction of credits over time. In late February 2010, the Reserve adopted two new offset
project protocols for ODS destruction. The protocols, which serve as standardized approaches for
quantifying and monitoring reductions in GHG emissions from ODS destruction projects, are for material
sourced domestically and for ODS imported into the United States from Article 5 countries.
Per the latter protocol, material that resides in Indonesia can be destroyed for carbon credits under the
Reserve; however, some limitations do exist. Specifically, only Annex A, Group I CFCs (i.e., CFC-11, CFC-
12, CFC-113, CFC-114, and CFC-115) used in refrigeration applications are eligible for crediting under the
protocol. In addition, material must be destroyed within the United States or its territories, and come
from one of the following sources:
1. Privately held stockpiles of used ODS refrigerant that can legally be sold to the market;
2. Article 5 government stockpiles of seized ODS refrigerant that can legally be sold to the market;
3. Article 5 government stockpiles of seized ODS that cannot be legally sold to the market; or
4. Used ODS refrigerant recovered from industrial, commercial, or residential equipment at
servicing or end-of-life.
In total, there have been 34 ODS destruction projects registered under the Reserve, five of which used
the Article 5 protocol. Three of these projects (i.e., CAR596, CAR597, and CAR 691) involved virgin
private stockpiles of CFC-12, one project (i.e., CAR826) involved mixed CFC-12 sourced from end-of-life
appliances, and the most recent project (i.e., CAR955) involved virgin, government stockpiles of CFC-12
that were seized from an illegal import. A summary of these projects are provided below in Table 4.
Table 4: Article 5 ODS Destruction Projects Registered under the Reserve
Project ID Project Developer Source Country Credits
Registered Date Registered
CAR596 Coolgas, Inc. India 683,087 5/12/2010
CAR597 Coolgas, Inc. India 551,802 10/22/2010
CAR691 Reclamation Technologies Inc. Mexico 2,602,812 6/21/2011
CAR826 OEKO Service Luxembourg S.A. Mexico 89,834 6/7/2012
CAR955 EOS Climate Inc. Nepal 82,391 5/24/2013
Source: Climate Action Reserve (2013).
In addition to the projects that have already been registered, the Multilateral Fund (MLF) has recently
approved several projects that intend to utilize the A5 destruction protocol under the Reserve. For
example, in Mexico with assistance from UNIDO, MLF financing is being used to finance the destruction
of CFC-12 collected from refrigerator de-manufacturing processes. The revenue from the credits, if
generated and sold, will be used to start a self-sustaining ODS waste management system, with annual
revenue from the credits being fed back into the waste management system. Similarly, in Nigeria with
assistance from UNIDO, MLF funding will be used to finance ODS destruction projects, with the potential
revenue from the credits being used to establish a national Appliance Replacement Programme that
incentivizes recycling. A portion of the anticipated profit may also be used to improve local capacity for
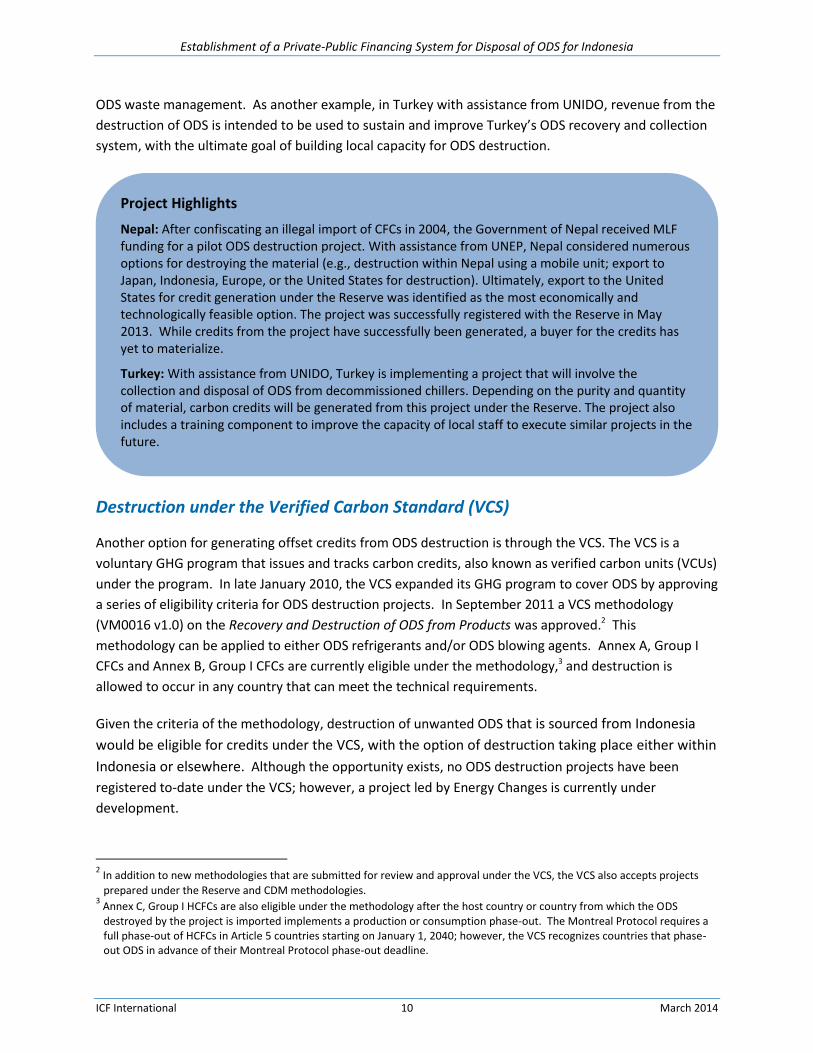
Establishment of a Private-Public Financing System for Disposal of ODS for Indonesia
ICF International 10 March 2014
ODS waste management. As another example, in Turkey with assistance from UNIDO, revenue from the
destruction of ODS is intended to be used to sustain and improve Turkey’s ODS recovery and collection
system, with the ultimate goal of building local capacity for ODS destruction.
Destruction under the Verified Carbon Standard (VCS)
Another option for generating offset credits from ODS destruction is through the VCS. The VCS is a
voluntary GHG program that issues and tracks carbon credits, also known as verified carbon units (VCUs)
under the program. In late January 2010, the VCS expanded its GHG program to cover ODS by approving
a series of eligibility criteria for ODS destruction projects. In September 2011 a VCS methodology
(VM0016 v1.0) on the Recovery and Destruction of ODS from Products was approved.2 This
methodology can be applied to either ODS refrigerants and/or ODS blowing agents. Annex A, Group I
CFCs and Annex B, Group I CFCs are currently eligible under the methodology,3 and destruction is
allowed to occur in any country that can meet the technical requirements.
Given the criteria of the methodology, destruction of unwanted ODS that is sourced from Indonesia
would be eligible for credits under the VCS, with the option of destruction taking place either within
Indonesia or elsewhere. Although the opportunity exists, no ODS destruction projects have been
registered to-date under the VCS; however, a project led by Energy Changes is currently under
development.
2 In addition to new methodologies that are submitted for review and approval under the VCS, the VCS also accepts projects
prepared under the Reserve and CDM methodologies. 3 Annex C, Group I HCFCs are also eligible under the methodology after the host country or country from which the ODS destroyed by the project is imported implements a production or consumption phase-out. The Montreal Protocol requires a full phase-out of HCFCs in Article 5 countries starting on January 1, 2040; however, the VCS recognizes countries that phase-out ODS in advance of their Montreal Protocol phase-out deadline.
Project Highlights
Nepal: After confiscating an illegal import of CFCs in 2004, the Government of Nepal received MLF funding for a pilot ODS destruction project. With assistance from UNEP, Nepal considered numerous options for destroying the material (e.g., destruction within Nepal using a mobile unit; export to Japan, Indonesia, Europe, or the United States for destruction). Ultimately, export to the United States for credit generation under the Reserve was identified as the most economically and technologically feasible option. The project was successfully registered with the Reserve in May 2013. While credits from the project have successfully been generated, a buyer for the credits has yet to materialize.
Turkey: With assistance from UNIDO, Turkey is implementing a project that will involve the collection and disposal of ODS from decommissioned chillers. Depending on the purity and quantity of material, carbon credits will be generated from this project under the Reserve. The project also includes a training component to improve the capacity of local staff to execute similar projects in the future.
Establishment of a Private-Public Financing System for Disposal of ODS for Indonesia
ICF International 11 March 2014
Destruction under National Carbon Markets
One possible alternative approach to the voluntary carbon market is to use initiatives that rely on
national carbon markets. Under this approach, baselines for certain industries are established as
country governments move towards establishing mandatory reductions for individual entities in select
industrial sectors. The Partnership for Market Readiness (PMR)—a grant-based program that provides
funding and technical assistance for the collective innovation and piloting of market-based instruments
for GHG emissions reduction—is currently being used to help develop such initiatives, providing
opportunity for companies to use ODS offset projects to meet reduction targets.
The PMR is currently made up of 13 Contributing Participants and 16 Implementing Country
Participants. As of March 2013, all 16 Implementing Country Participants have received preparation
funding to formulate a Market Readiness Proposal (MRP) while four countries have also received
implementation phase funding. The current Implementing Country Participants are listed below:
Brazil Costa Rica Mexico Thailand
Chile India Morocco Turkey
China Indonesia Peru Ukraine
Columbia Jordan South Africa Vietnam
Establishment of a National Carbon Market in Indonesia
In 2009, Indonesia committed to reducing its overall emissions by at least 26% by 2020, and with international support to further reduce emissions by an additional 15%. As one way to reach this goal, Indonesia has begun exploring the use of market-based instruments. Key activities include:
Establishment of the Nusantara Carbon Scheme (NCS): NCS is a voluntary emission reduction certification and registration scheme, intended to facilitate the development of a domestic carbon market and encourage local companies to reduce their emissions voluntarily. While still under development, the scheme is intended to function similarly to the Clean Development Mechanism (CDM), covering the six Kyoto gases, and requiring validation and verification of reductions. However, unlike CDM, the NCS plans to make sustainable development a mandatory and verifiable project requirement. Buyers of the credits will (at least initially) only consist of Indonesian entities (corporations, organizations, and individuals) who want to offset their emissions (NCCC 2013b).
Participation in the PMR Program: Indonesia first expressed interest in participating in the PMR program in 2010. Since then, Indonesia has identified a number of actions to support market readiness, outlined in the country’s MRP (NCCC 2013a). Actions include the development of a measurement, reporting, and verification (MRV) system for power generation plants and large/energy intensive industries, and piloting the MRV system on specific installations, including cement factories. This activity is intended to help the cement industry meet their mandatory reduction target of 3% from 2016-2020 relative to a 2009 baseline (Minister of Industry Decree No. 12/M-IND/PER/1/2012).

Establishment of a Private-Public Financing System for Disposal of ODS for Indonesia
ICF International 12 March 2014
4.2. Cost Considerations
One of the most important considerations in determining which ODS destruction platform is appropriate
is a comparison between the cost to implement the destruction project and the potential revenue.
Responsibilities for bearing project-related costs and accruing revenues will depend on the
arrangements for public-private financing made by government agencies in possession of unwanted
ODS. More information on these options, which include contracting out, facilitation, and serving as the
project developer, is provided in Appendix A.
The overall costs associated with implementing an ODS destruction project may include the costs of
collection and/or recovery, transportation, storage, testing, and destruction, in addition to one-time
project-related costs, such as project preparation, validation, verification, and registration and issuance
fees. The specific cost components will depend on the source of the ODS being destroyed; for example,
stockpiled materials have the lowest associated costs since the material is already recovered and stored,
while collecting and recovering ODS from equipment—especially in sparsely populated areas—presents
higher costs associated with segregation, collection, and in some cases transport of the equipment itself
(e.g., household appliances) for ODS recovery in a centralized location.
For stockpiled material (where collection costs are not applicable), the total cost from processing to
destruction is estimated to be roughly US$6–30 per kilogram. This range takes into account estimates
developed by the Technology and Economic Assessment Panel (TEAP), as requested by Decision XX/7, as
well as the estimated cost of destruction at the Indonesian Holcim plant. This range overlaps with an
estimate from one ODS destruction project developer of US$9 per kilogram, which includes US$1/kg for
transportation (and associated insurance) and US$8/kg for destruction. The higher estimate for
transportation costs likely include costs incurred during the export of the ODS, which is not accounted
for in the TEAP estimates.
Table 5: Unit Cost for Destruction of ODS from Stockpiles and Chillers
Recovery and Destruction Steps US$ per kg
Sources Stockpiles Chillers
Segregation/Collection+ -- $0–$2 TEAP 2009
Recovery Processing Costs $4–$25 $4–$25 TEAP 2009
Transport Costs (Destruction)* $0.02–$0.10 $0.02–$0.10 Adjusted, based on TEAP 2009
Destruction Costs $2.20–$5 $2.20–$5 MLF 2009; ICF 2010
Total $6.22–$30.10 $6.22–$32.10 +Segregation and collection costs are not included
* Transport costs for recovery are factored into the transport costs for destruction. This assessment estimates that ODS travels approximately 50 miles (80.5 km) to a destruction facility.
In addition to the costs associated with collecting, recovering, transporting, and destroying the ODS,
there are costs associated with preparing, verifying, and registering the project with a carbon credit
platform. These costs may vary significantly depending on the platform chosen (e.g., the Reserve, VCS,
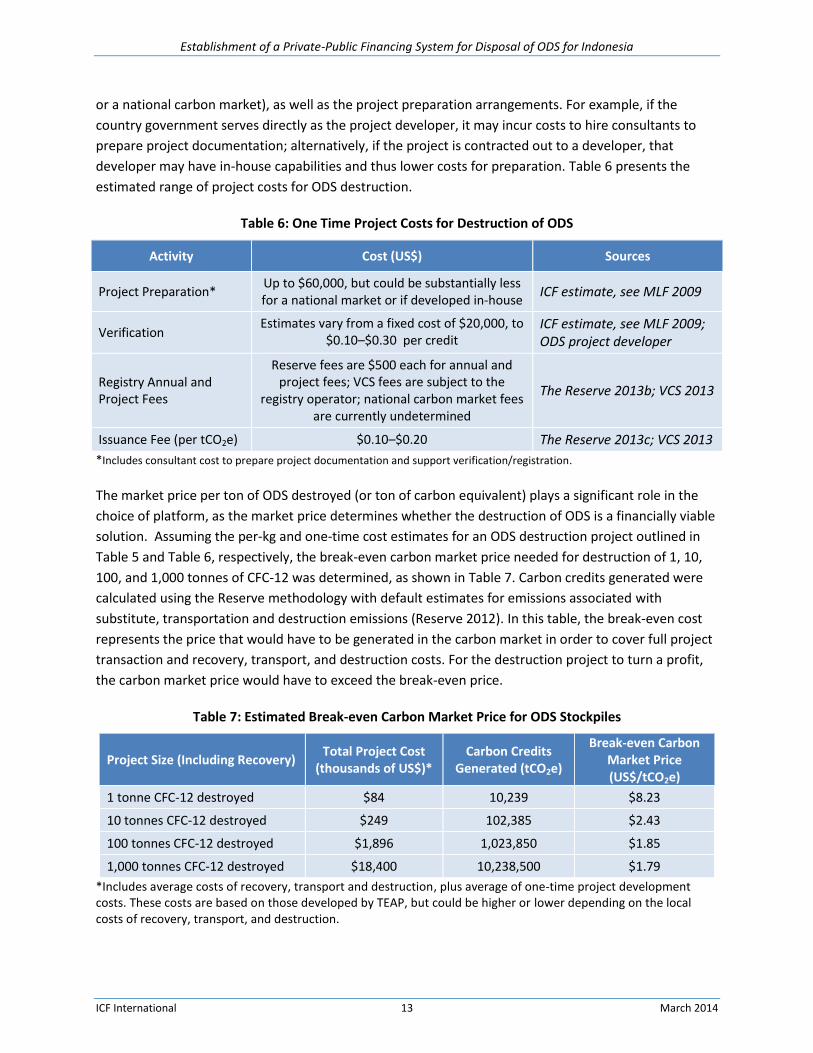
Establishment of a Private-Public Financing System for Disposal of ODS for Indonesia
ICF International 13 March 2014
or a national carbon market), as well as the project preparation arrangements. For example, if the
country government serves directly as the project developer, it may incur costs to hire consultants to
prepare project documentation; alternatively, if the project is contracted out to a developer, that
developer may have in-house capabilities and thus lower costs for preparation. Table 6 presents the
estimated range of project costs for ODS destruction.
Table 6: One Time Project Costs for Destruction of ODS
Activity Cost (US$) Sources
Project Preparation* Up to $60,000, but could be substantially less for a national market or if developed in-house
ICF estimate, see MLF 2009
Verification Estimates vary from a fixed cost of $20,000, to
$0.10–$0.30 per credit ICF estimate, see MLF 2009; ODS project developer
Registry Annual and Project Fees
Reserve fees are $500 each for annual and project fees; VCS fees are subject to the
registry operator; national carbon market fees are currently undetermined
The Reserve 2013b; VCS 2013
Issuance Fee (per tCO2e) $0.10–$0.20 The Reserve 2013c; VCS 2013
*Includes consultant cost to prepare project documentation and support verification/registration.
The market price per ton of ODS destroyed (or ton of carbon equivalent) plays a significant role in the
choice of platform, as the market price determines whether the destruction of ODS is a financially viable
solution. Assuming the per-kg and one-time cost estimates for an ODS destruction project outlined in
Table 5 and Table 6, respectively, the break-even carbon market price needed for destruction of 1, 10,
100, and 1,000 tonnes of CFC-12 was determined, as shown in Table 7. Carbon credits generated were
calculated using the Reserve methodology with default estimates for emissions associated with
substitute, transportation and destruction emissions (Reserve 2012). In this table, the break-even cost
represents the price that would have to be generated in the carbon market in order to cover full project
transaction and recovery, transport, and destruction costs. For the destruction project to turn a profit,
the carbon market price would have to exceed the break-even price.
Table 7: Estimated Break-even Carbon Market Price for ODS Stockpiles
Project Size (Including Recovery) Total Project Cost
(thousands of US$)* Carbon Credits
Generated (tCO2e)
Break-even Carbon Market Price (US$/tCO2e)
1 tonne CFC-12 destroyed $84 10,239 $8.23
10 tonnes CFC-12 destroyed $249 102,385 $2.43
100 tonnes CFC-12 destroyed $1,896 1,023,850 $1.85
1,000 tonnes CFC-12 destroyed $18,400 10,238,500 $1.79
*Includes average costs of recovery, transport and destruction, plus average of one-time project development costs. These costs are based on those developed by TEAP, but could be higher or lower depending on the local costs of recovery, transport, and destruction.
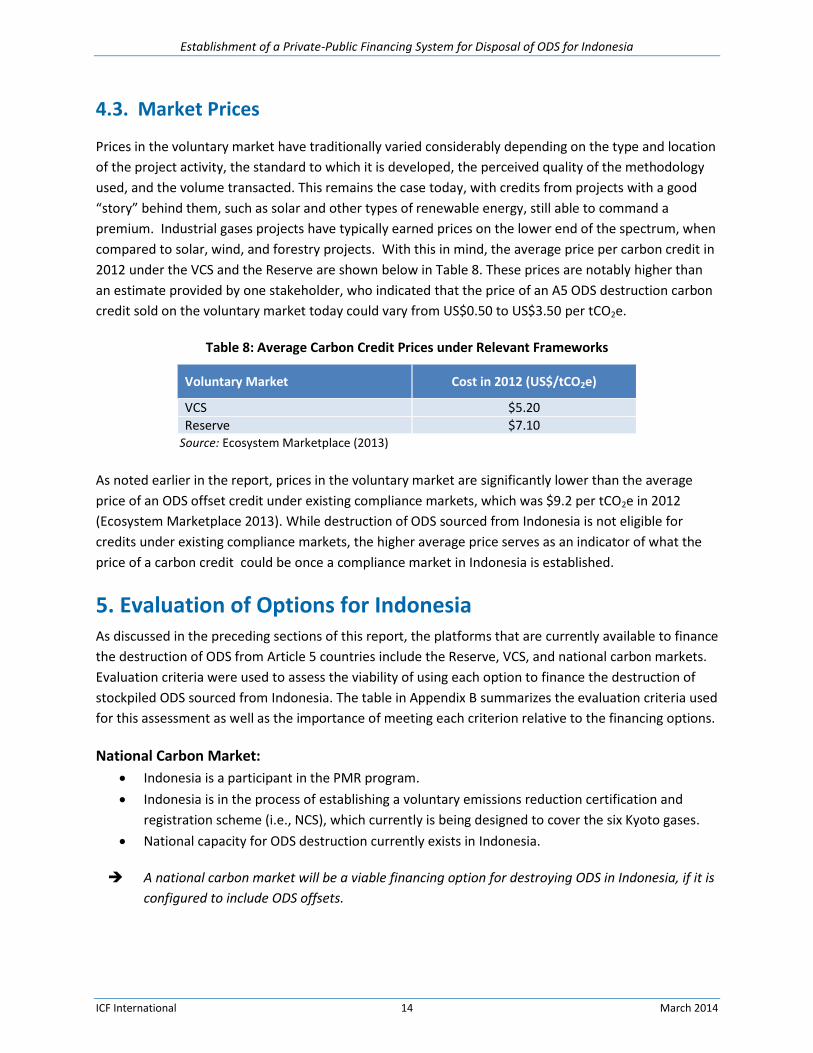
Establishment of a Private-Public Financing System for Disposal of ODS for Indonesia
ICF International 14 March 2014
4.3. Market Prices
Prices in the voluntary market have traditionally varied considerably depending on the type and location
of the project activity, the standard to which it is developed, the perceived quality of the methodology
used, and the volume transacted. This remains the case today, with credits from projects with a good
“story” behind them, such as solar and other types of renewable energy, still able to command a
premium. Industrial gases projects have typically earned prices on the lower end of the spectrum, when
compared to solar, wind, and forestry projects. With this in mind, the average price per carbon credit in
2012 under the VCS and the Reserve are shown below in Table 8. These prices are notably higher than
an estimate provided by one stakeholder, who indicated that the price of an A5 ODS destruction carbon
credit sold on the voluntary market today could vary from US$0.50 to US$3.50 per tCO2e.
Table 8: Average Carbon Credit Prices under Relevant Frameworks
Voluntary Market Cost in 2012 (US$/tCO2e)
VCS $5.20
Reserve $7.10 Source: Ecosystem Marketplace (2013)
As noted earlier in the report, prices in the voluntary market are significantly lower than the average
price of an ODS offset credit under existing compliance markets, which was $9.2 per tCO2e in 2012
(Ecosystem Marketplace 2013). While destruction of ODS sourced from Indonesia is not eligible for
credits under existing compliance markets, the higher average price serves as an indicator of what the
price of a carbon credit could be once a compliance market in Indonesia is established.
5. Evaluation of Options for Indonesia As discussed in the preceding sections of this report, the platforms that are currently available to finance
the destruction of ODS from Article 5 countries include the Reserve, VCS, and national carbon markets.
Evaluation criteria were used to assess the viability of using each option to finance the destruction of
stockpiled ODS sourced from Indonesia. The table in Appendix B summarizes the evaluation criteria used
for this assessment as well as the importance of meeting each criterion relative to the financing options.
National Carbon Market:
Indonesia is a participant in the PMR program.
Indonesia is in the process of establishing a voluntary emissions reduction certification and
registration scheme (i.e., NCS), which currently is being designed to cover the six Kyoto gases.
National capacity for ODS destruction currently exists in Indonesia.
A national carbon market will be a viable financing option for destroying ODS in Indonesia, if it is
configured to include ODS offsets.
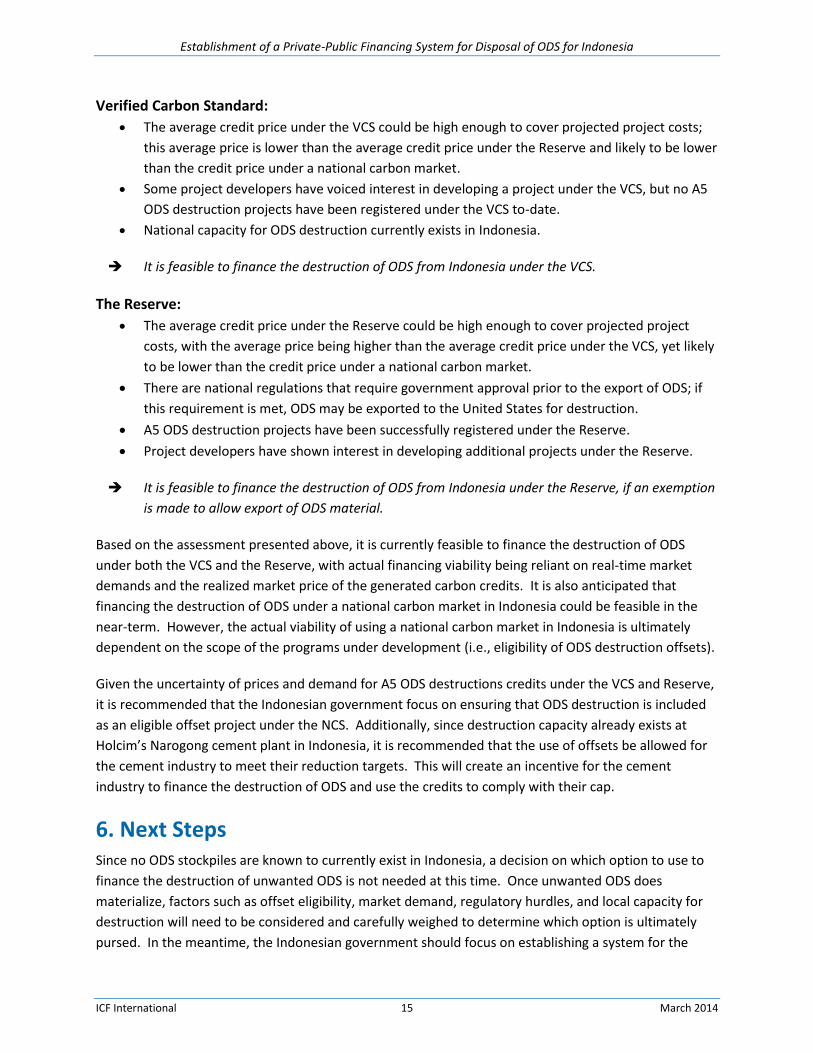
Establishment of a Private-Public Financing System for Disposal of ODS for Indonesia
ICF International 15 March 2014
Verified Carbon Standard:
The average credit price under the VCS could be high enough to cover projected project costs;
this average price is lower than the average credit price under the Reserve and likely to be lower
than the credit price under a national carbon market.
Some project developers have voiced interest in developing a project under the VCS, but no A5
ODS destruction projects have been registered under the VCS to-date.
National capacity for ODS destruction currently exists in Indonesia.
It is feasible to finance the destruction of ODS from Indonesia under the VCS.
The Reserve:
The average credit price under the Reserve could be high enough to cover projected project
costs, with the average price being higher than the average credit price under the VCS, yet likely
to be lower than the credit price under a national carbon market.
There are national regulations that require government approval prior to the export of ODS; if
this requirement is met, ODS may be exported to the United States for destruction.
A5 ODS destruction projects have been successfully registered under the Reserve.
Project developers have shown interest in developing additional projects under the Reserve.
It is feasible to finance the destruction of ODS from Indonesia under the Reserve, if an exemption
is made to allow export of ODS material.
Based on the assessment presented above, it is currently feasible to finance the destruction of ODS
under both the VCS and the Reserve, with actual financing viability being reliant on real-time market
demands and the realized market price of the generated carbon credits. It is also anticipated that
financing the destruction of ODS under a national carbon market in Indonesia could be feasible in the
near-term. However, the actual viability of using a national carbon market in Indonesia is ultimately
dependent on the scope of the programs under development (i.e., eligibility of ODS destruction offsets).
Given the uncertainty of prices and demand for A5 ODS destructions credits under the VCS and Reserve,
it is recommended that the Indonesian government focus on ensuring that ODS destruction is included
as an eligible offset project under the NCS. Additionally, since destruction capacity already exists at
Holcim’s Narogong cement plant in Indonesia, it is recommended that the use of offsets be allowed for
the cement industry to meet their reduction targets. This will create an incentive for the cement
industry to finance the destruction of ODS and use the credits to comply with their cap.
6. Next Steps Since no ODS stockpiles are known to currently exist in Indonesia, a decision on which option to use to
finance the destruction of unwanted ODS is not needed at this time. Once unwanted ODS does
materialize, factors such as offset eligibility, market demand, regulatory hurdles, and local capacity for
destruction will need to be considered and carefully weighed to determine which option is ultimately
pursed. In the meantime, the Indonesian government should focus on establishing a system for the

Establishment of a Private-Public Financing System for Disposal of ODS for Indonesia
ICF International 16 March 2014
long-term recovery, collection, and management of ODS that is confiscated in the future, originates
from servicing operations, or is recovered from large and small refrigeration and air conditioning
equipment when that equipment is retired. The remainder of this section focuses on the steps that
should be taken to establish this system.
6.1. Establishing a System for the Long-Term Management of ODS
Although no ODS stockpiles currently exist, the Indonesian government needs to plan for the future
management of unwanted ODS (and possibly other harmful chemicals, including HCFCs and HFCs). As
discussed previously, in addition to the future stream of confiscated stockpiles and mixed refrigerant
coming from service industries, there is opportunity to collect ODS from chillers and other refrigerated
appliances at end-of-life. Establishing a formal process now for the collection, transportation, storage
and disposal of unwanted ODS and other chemicals from these sources will not only prevent harmful
venting of these gases to the atmosphere, but will also maximize credit generation and potential
revenue from future destruction projects. Specific activities that should be undertaken to establish an
ODS management facility include the following:
Identify central facility for ODS aggregation and storage: A central warehouse location must be
identified to compile and store all material seized and recovered from retired or serviced
equipment. At this location, the material should be stored until a volume sufficient for
economically viable destruction has been stockpiled. Ideally, a secure and climate-controlled
facility should be used for storage.
Conduct outreach and training with source stakeholders: Customs officials, equipment service
providers, and large ODS users must be made aware that a central collection facility exists for
aggregated and safe disposal of unwanted ODS. They must also be educated about how the
materials should be stored, transported, and tracked.
Designate a program manager to manage the flow and tracking of unwanted ODS. In order for
the ODS management system to function properly, someone must be responsible for the
identification, transportation, tracking, and ultimately, the destruction of unwanted ODS. The
role of the program manager will require coordination with ODS source stakeholders, as well as
those responsible for ODS transportation, destruction, and offset project development. For
example, the program manager will need to:
o Coordinate with ODS source stakeholders—i.e., Customs officials, equipment servicing
providers, and large ODS users—to collect and transport illegal or unwanted materials
to the central storage facility when such materials become available.
o Implement a manifest system for tracking ODS during transport from the original
source to the central aggregation facility, and then to the destruction facility. Clear and
accurate documentation will be critical for compliance with offset protocol.

Establishment of a Private-Public Financing System for Disposal of ODS for Indonesia
ICF International 17 March 2014
o Coordinate with ODS offset project developers to ensure robust verification, reporting,
and monitoring activities are taking place to comply with offset protocol requirements.
o Coordinate with destruction facilities once sufficient volume of ODS has been collected
such that destruction can be undertaken in an economically viable manner.
To bolster the ODS management facility and promote its success, regulatory measures should also be
pursued. In particular, ODS recovery regulations should be developed and/or enforced to ensure that
technicians are not only recovering material from decommissioned equipment, but also systematically
identifying and tracking what is removed.
Over time, once the system is functioning well, additional infrastructure may be added to expand the
country’s capability of recovering ODS and other environmentally damaging chemicals from a broader
range of equipment—namely refrigerated appliances. A waste management system may eventually be
established for small household and commercial refrigeration and air conditioning equipment, to ensure
refrigerant is recovered from equipment at time of disposal.

Establishment of a Private-Public Financing System for Disposal of ODS for Indonesia
ICF International 18 March 2014
7. References Air-Conditioning, Heating, and Refrigeration Institute (AHRI). 2009. Containers for Recovered Non-
Flammable Fluorocarbon Refrigerants. Available at:
http://www.ahrinet.org/App_Content/ahri/files/Guidelines/AHRI%20Guideline%20K-2009.pdf
Air-Conditioning, Heating, and Refrigeration Institute (AHRI). 2012. 2012 Guideline for Assignment of
Refrigerant Container Colors. Available at:
http://www.ahrinet.org/App_Content/ahri/files/Guidelines/AHRI%20Guideline%20N-2012.pdf
Climate Action Reserve. 2013a. Project Database. Available at:
https://thereserve2.apx.com/myModule/rpt/myrpt.asp?r=111.
Climate Action Reserve. 2013b. Frequently Asked Questions: Accounts on the Reserve. Available at:
http://www.climateactionreserve.org/resources/faqs/.
Climate Action Reserve. 2013c. Submit and Register a Project. Available at:
http://www.climateactionreserve.org/how/projects/register/.
Climate Action Reserve. 2012. Article 5 ODS Project Protocol, Version 2.0. June 27, 2012. Available at:
http://www.climateactionreserve.org/wp-
content/uploads/2010/02/A5_ODS_Project_Protocol_V2.0_Package_041113.pdf.
Ecosystem Marketplace. 2013. Maneuvering the Mosaic: State of the Voluntary Carbon Markets 2013.
ICF International. 2009. ODS Destruction in the United States of America and Beyond, prepared by ICF
International for the U.S. Environmental Protection Agency. May 2009. Available at:
http://ozone.unep.org/Data_Reporting/USA-Decision-XX-7-ODS-Destruction.pdf.
ICF International. 2010. Study on Financing the Destruction of Unwanted Ozone-Depleting Substances
through the Voluntary Carbon Market, prepared by ICF International for the World Bank. February 2012.
Ministry of Environment, Indonesia (MoE). 2013. Visit to Holcim ODS Destruction Facility in Indonesia.
Presentation prepared for Australia network meeting, May 2013.
Multilateral Fund (MLF). 2009. Study on Financing the Destruction of Unwanted Ozone-Depleting
Substances through the Voluntary Carbon Market, Draft Report. Prepared by ICF International for the
World Bank. September 2009. Available at:
http://www.multilateralfund.org/sites/59/Document%20Library2/1/59Inf2.pdf.
National Council on Climate Change (NCCC) of Indonesia. 2013a. Market Readiness Proposal: Indonesia.
Available at: http://www.thepmr.org/system/files/documents/Indonesia%20MRP%20Final-
September29.pdf.

Establishment of a Private-Public Financing System for Disposal of ODS for Indonesia
ICF International 19 March 2014
National Council on Climate Change (NCCC) of Indonesia. 2013b. Nusantara Carbon Scheme. Available
at: http://www.iges.or.jp/en/archive/cdm/pdf/regional/20130306/4_Indonesia_Mr.Dicky.pdf.
Partnership for Market Readiness. 2013. Pricing Carbon and Shaping the Next Generation of Carbon
Markets. Available at: https://www.thepmr.org/system/files/documents/PMR_brochure_web.pdf.
Partnership for Market Readiness. 2013. Indonesia. Available at:
http://www.thepmr.org/country/indonesia-0. Accessed October 14, 2013.
Partnership for Market Readiness. 2013. Chairs’ Summary of the Sixth Meeting of the PMR Partnership
Assembly (PA6). May 27-28, 2013. Available at:
https://www.thepmr.org/system/files/documents/PA6_Chair's_Summary_0.pdf.
Pasek, Ari Darmawan. 2013. Inventory of Unwanted ODS in Indonesia. Report submitted to the World
Bank and ICF International on January 13, 2014.
Statistics Indonesia. 2009. The 2010 Indonesia Population Census. Available at:
http://unstats.un.org/unsd/censuskb20/Attachments/2009IDN_ISI-
GUIDfba441dd463e4ca5907f1a1ae508f3ff.pdf.
Technology and Economic Assessment Panel (TEAP). 2002. Report of the Task Force on Destruction
Technologies. April 2002. Available at:
http://ozone.unep.org/Assessment_Panels/TEAP/Reports/Other_Task_Force/TEAP02V3b.pdf.
United Nations Environment Programme (UNEP). 2013. Report on Progress and Experiences gained in
Demonstration Projects for the Disposal of Unwanted ODS. UNEP/OzL.Pro/ExCom/70/54. June 5, 2013.
United Nations Environment Programme (UNEP). 2012a. Project Proposals: Turkey.
UNEP/OzL.Pro/ExCom/66/48. March 19, 2012.
United Nations Environment Programme (UNEP). 2012b. Project Proposals: Nigeria.
UNEP/OzL.Pro/ExCom/67/27. June 19, 2012.
United Nations Environment Programme (UNEP). 2011. Project Proposals: Mexico.
UNEP/OzL.Pro/ExCom/63/42. March 9, 2011.
Verified Carbon Standard (VCS). 2013. Program Fee Schedule, Version 3.4. Available at: http://www.v-c-
s.org/sites/v-c-s.org/files/Program%20Fee%20Schedule%2C%20v3.4.pdf.
Verified Carbon Standard (VCS). 2011. Recovery and Destruction of ODS from Products, Methodology
VM0016, Version 1.0. Available at: http://www.v-c-s.org/sites/v-c-
s.org/files/Final%20version%20of%20VM0016.pdf.
Establishment of a Private-Public Financing System for Disposal of ODS for Indonesia
ICF International A-1 March 2014
Appendix A. Workbook on the Management of Unwanted ODS in Indonesia
Table of Contents
1. Introduction to the Workbook ......................................................................................................2
2. Policy and Regulatory Context ......................................................................................................2 2.1. International Agreements Governing the Movement of ODS ...................................................... 2 2.2. Regional Agreements and National Regulations .......................................................................... 4
3. National Inventory of Unwanted ODS ...........................................................................................4
4. Guidelines for Managing Unwanted ODS ......................................................................................6 4.1. Collection of ODS .......................................................................................................................... 7 4.2. Consolidation and Storage ............................................................................................................ 7 4.3. Transportation .............................................................................................................................. 7 4.4. Testing .......................................................................................................................................... 8 4.5. Destruction ................................................................................................................................... 9
5. Project Development ...................................................................................................................9 5.1. Assessing the Financial Feasibility of an ODS Destruction Project ............................................... 9 5.2. Selecting a Strategy for Project Development ........................................................................... 11 5.3. Overview of the Project Development Process .......................................................................... 12
_Toc371075838
Establishment of a Private-Public Financing System for Disposal of ODS for Indonesia
ICF International A-2 March 2014
1. Introduction to the Workbook The Montreal Protocol on Substances that Deplete the Ozone Layer has been immensely effective at
reducing the production and consumption of ozone depleting substances (ODS) worldwide. While the
production and consumption of ODS has dramatically diminished, a large amount of ODS still remains in
equipment, products, and stockpiles held by country governments as well as industrial and commercial
users. Because emissions from ODS banks are not explicitly controlled by the Montreal Protocol, there
is significant risk that these ODS will be released to the atmosphere, contributing to both ozone
depletion and global climate change.
To prevent emissions of ODS banks, many options have been explored to provide incentives for the
destruction of unwanted material. The high global warming potential (GWP) of ODS means that their
destruction has the ability to generate significant volumes of carbon credits. Indeed, a study prepared
for the World Bank in 2010 found that a significant opportunity exists for financing the destruction of
ODS through the voluntary carbon market.4 To help countries operating under Article 5(1) of the
Montreal Protocol take advantage of this opportunity, this workbook was developed to serve as a
general guide on how to manage unwanted ODS held by country governments.
Specifically, this workbook begins with a summary of international agreements and local regulations that
govern the movement of ODS; then provides guidance on how to develop an inventory of unwanted
ODS; followed by a description of guidelines for proper handling of unwanted ODS; and finally provides
an overview of the project assessment and development process, including strategies for engaging the
public and/or private sector in an ODS destruction project. This version of the workbook has been
tailored to reflect specific circumstances for Indonesia.
2. Policy and Regulatory Context
2.1. International Agreements Governing the Movement of ODS
There are several international agreements that affect the movement of unwanted ODS between
countries. These include the Basel Convention on the Control of Transboundary Movements of
Hazardous Wastes and Their Disposal, and the OECD Decision C(2001)107/Final on the Control of
Transboundary Movement of Wastes Destined for Recovery Operations. The basic provisions of these
agreements are described below.
The Basel Convention
Adopted in 1989 and brought into force in 1992, the Basel Convention on the Control of Transboundary
Movements of Hazardous Wastes and Their Disposal (the Basel Convention) was created to control the
4 ICF International. 2010. Study on Financing the Destruction of Unwanted Ozone-Depleting Substances through the Voluntary Carbon Market, prepared by ICF International for the World Bank. February 2012.
Establishment of a Private-Public Financing System for Disposal of ODS for Indonesia
ICF International A-3 March 2014
movement of hazardous waste between countries, particularly the transfer of hazardous waste from
developed to developing countries.5 Currently there are 180 Parties to the Convention.6
Under the Basel Convention, ODS are included in the definition of hazardous waste.7 As a result, any
transboundary movement of unwanted ODS for the purpose of destruction must comply with provisions
of the Convention. These provisions prohibit the shipment of hazardous wastes between Parties
without prior written consent from the proposed State of import. In addition, Parties may only
transport hazardous waste to/from non-party countries8 if they have entered into a bilateral,
multilateral, or regional agreement that provides for procedures that are as environmentally-sound as
those provided under the Convention.9
Parties to the Basel Convention must also ensure that hazardous and other wastes are managed and
disposed of in an environmentally-sound manner. To achieve this goal, Parties must minimize the
movement of hazardous waste across borders. Parties may only move hazardous wastes across borders
if the State exporting hazardous waste lacks the necessary facilities, capacity, or suitable disposal sites to
dispose the waste in an environmentally sound and efficient manner.
The OECD Decision C(2001)107/Final
In 2001, the Organisation for Economic Co-operation and Development (OECD) decided to regulate the
international movement of wastes through decision C(2001)107/Final. Under this OECD decision,
member countries can control transboundary movements of wastes destined for recovery operations,
and recovery facilities must recover wastes in an environmentally-sound manner, in accordance with
national regulations. CFCs and halons are subject to the Amber control procedure, which requires strict
documentation for transboundary movement of wastes throughout the entire process, starting with the
exporter and ending with the recovery facility. When transboundary movement or recovery operations
cannot be completed as planned, the exporter or importer must provide financial guarantees for the
environmentally-sound management of the wastes.10
5 The Basel Convention on the Control of Transboundary Movements of Hazardous Wastes and their Disposal, Texts and Annexes, available at http://www.basel.int/Portals/4/Basel%20Convention/docs/text/BaselConventionText-e.pdf.
6 Secretariat of the Basel Convention (2013), Parties to the Basel Convention, accessed June 2013, available at http://www.basel.int/Countries/StatusofRatifications/PartiesSignatories/tabid/1290/Default.aspx.
7 ODS fall under the Convention’s categories Y41 (Halogenated organic solvents) and Y45 (Organohalogen compounds other than substances referred to in the Annex).
8 Non-party countries include: Angola, Fiji, Grenada, Haiti, Myanmar, Sao Tome and Principe, Sierra Leone, Solomon Islands, South Sudan, Timor-Leste, Tuvalu, United States, and Vanuatu. Source:
http://www.basel.int/Countries/StatusofRatifications/PartiesSignatories/tabid/1290/Default.aspx. 9 Multilateral Fund (2006), Report of the Meeting of Experts to Assess the Extent of Current and Future
Requirements for the Collection and Disposition of Non-Reusable and Unwanted ODS in Article 5 Countries (Follow up to Decision 47/52). 20 March 2006. 10
OECD, Decision of the Council concerning the Transboundary Movements of Wastes Destined for Recovery Operations,
C(2001)107/FINAL, June 2001, available at http://acts.oecd.org/Instruments/ShowInstrumentView.aspx?InstrumentID=221&InstrumentPID=217&Lang=en&Book=False.

Establishment of a Private-Public Financing System for Disposal of ODS for Indonesia
ICF International A-4 March 2014
2.2. Regional Agreements and National Regulations
In addition to the international agreements described above, regional agreements and national
regulations govern the movement of ODS. As a signatory of the Montreal Protocol, Indonesia has
developed a number of domestic policies to monitor and limit consumption of ODS to meet ODS phase-
out targets that are established by the Parties to the Montreal Protocol. Of note, in 1998, Indonesia first
banned the production and import of certain ODS, including carbon tetrachloride, halon, and methyl
chloroform (Minister of Industry and Trade No. 110/MPP/Kep/1/1998). In 2006, the import of CFCs, R-
500, R-502, and methyl bromide (except in quarantine and pre-shipment applications) were also banned
(Minister of Trade No. 24/M-DAG/PER/6/2006). In 2007, a further ban on the use of CFCs, R-500, and R-
502 in the manufacture of new products was adopted, effective July 1, 2008 (Minister of Industry No.
33/M-IND/PER/4/2007).
According to Indonesian law, all CFCs, halons, and methyl bromide are classified as hazardous
substances. As such, national law requires that stocks be managed in accordance with hazardous waste
regulations (Government Regulation No. 18/1999 and Government Regulation No. 74/2001). In turn,
government approval is required for the export of unwanted ODS.
For ODS that have not yet been banned (i.e., HCFCs), when imported into the country these chemicals
are subject to a number of regulatory checks (Minister of Trade No. 03/M-DAG/PER/1/2012).
Specifically, permits are required for the import of HCFCs. Additionally, shipments must pass through
one of seven designated entry points in the country, and refrigerant identifiers are used to verify the
contents of the import.
3. National Inventory of Unwanted ODS Banks of unwanted ODS commonly reside in stockpiles and retired equipment that are largely owned or
in the possession of government agencies and private companies. As a first step to managing these
banks, an inventory detailing the quantity, type, purity, location, and ownership of the material must be
developed. This inventory can be developed through a variety of actions, including compilation of
records from Customs and/or other government agencies as well as by conducting an assessment of
stockpiled material through site visits to storage facilities. The installed base of equipment containing
ODS may also be compiled through input from end-users and industry. The approach used will depend
on the quality and robustness of data tracking systems that are already in place in Indonesia.
When compiling the information, unwanted ODS in
stockpiles and in equipment should be inventoried
separately. For ODS in equipment, Indonesia may wish to
focus on inventorying equipment with larger ODS charge
sizes, such as chillers, which often present more cost-
effective opportunities for destruction.
Eligibility
While only CFCs and other phased-out ODS are currently eligible under ODS destruction protocols in the voluntary carbon market, it is expected that the destruction of next-generation refrigerants such as HCFCs (and HFCs) will eventually be eligible for carbon credits, and thus inventorying all substances can support future projects.
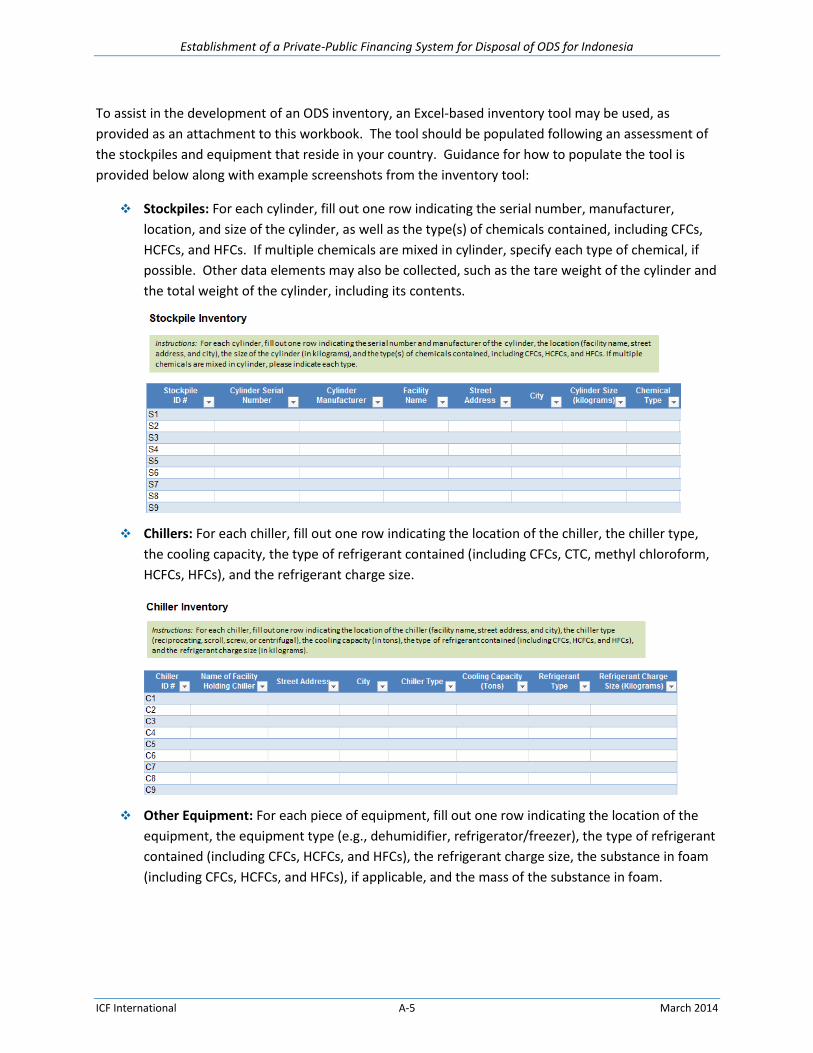
Establishment of a Private-Public Financing System for Disposal of ODS for Indonesia
ICF International A-5 March 2014
To assist in the development of an ODS inventory, an Excel-based inventory tool may be used, as
provided as an attachment to this workbook. The tool should be populated following an assessment of
the stockpiles and equipment that reside in your country. Guidance for how to populate the tool is
provided below along with example screenshots from the inventory tool:
Stockpiles: For each cylinder, fill out one row indicating the serial number, manufacturer,
location, and size of the cylinder, as well as the type(s) of chemicals contained, including CFCs,
HCFCs, and HFCs. If multiple chemicals are mixed in cylinder, specify each type of chemical, if
possible. Other data elements may also be collected, such as the tare weight of the cylinder and
the total weight of the cylinder, including its contents.
Chillers: For each chiller, fill out one row indicating the location of the chiller, the chiller type,
the cooling capacity, the type of refrigerant contained (including CFCs, CTC, methyl chloroform,
HCFCs, HFCs), and the refrigerant charge size.
Other Equipment: For each piece of equipment, fill out one row indicating the location of the
equipment, the equipment type (e.g., dehumidifier, refrigerator/freezer), the type of refrigerant
contained (including CFCs, HCFCs, and HFCs), the refrigerant charge size, the substance in foam
(including CFCs, HCFCs, and HFCs), if applicable, and the mass of the substance in foam.
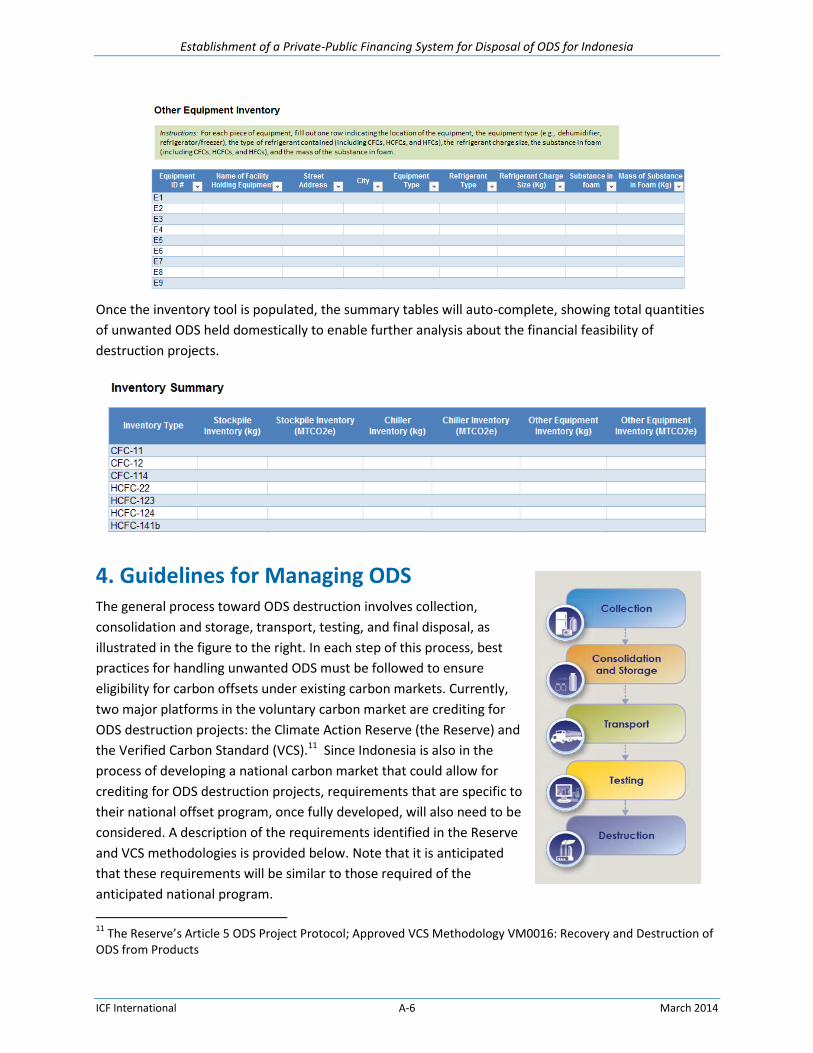
Establishment of a Private-Public Financing System for Disposal of ODS for Indonesia
ICF International A-6 March 2014
Once the inventory tool is populated, the summary tables will auto-complete, showing total quantities
of unwanted ODS held domestically to enable further analysis about the financial feasibility of
destruction projects.
4. Guidelines for Managing ODS The general process toward ODS destruction involves collection,
consolidation and storage, transport, testing, and final disposal, as
illustrated in the figure to the right. In each step of this process, best
practices for handling unwanted ODS must be followed to ensure
eligibility for carbon offsets under existing carbon markets. Currently,
two major platforms in the voluntary carbon market are crediting for
ODS destruction projects: the Climate Action Reserve (the Reserve) and
the Verified Carbon Standard (VCS).11 Since Indonesia is also in the
process of developing a national carbon market that could allow for
crediting for ODS destruction projects, requirements that are specific to
their national offset program, once fully developed, will also need to be
considered. A description of the requirements identified in the Reserve
and VCS methodologies is provided below. Note that it is anticipated
that these requirements will be similar to those required of the
anticipated national program.
11
The Reserve’s Article 5 ODS Project Protocol; Approved VCS Methodology VM0016: Recovery and Destruction of ODS from Products
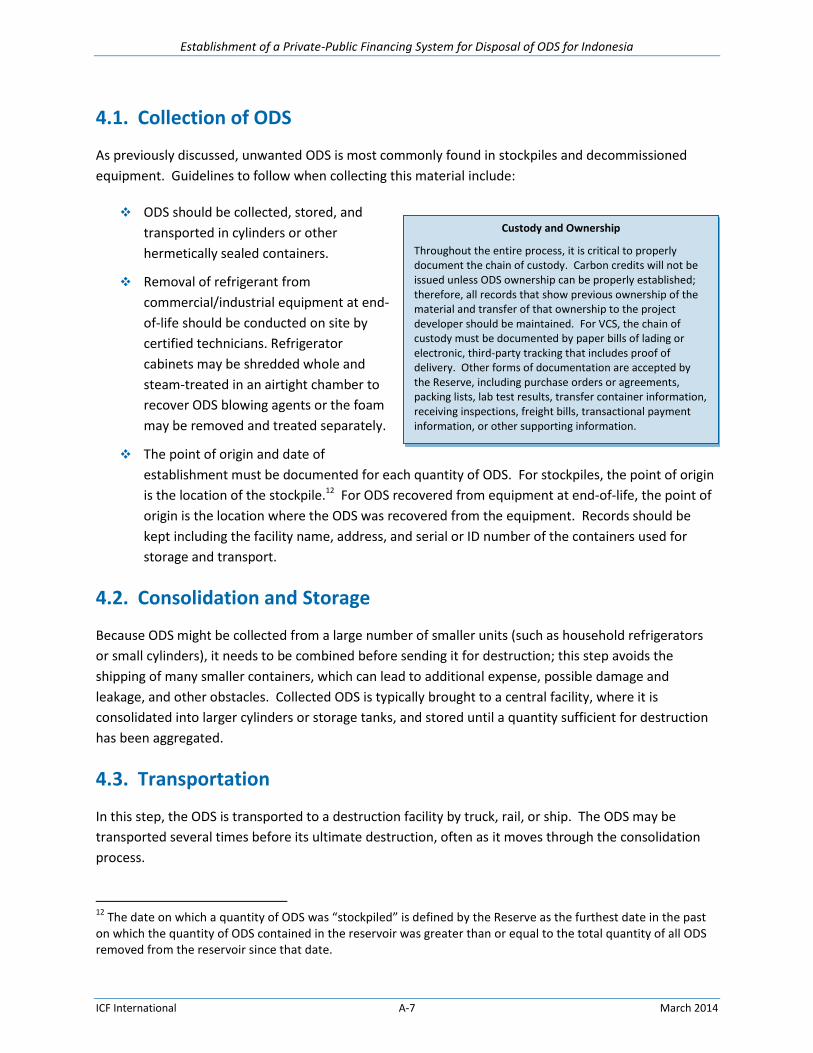
Establishment of a Private-Public Financing System for Disposal of ODS for Indonesia
ICF International A-7 March 2014
4.1. Collection of ODS
As previously discussed, unwanted ODS is most commonly found in stockpiles and decommissioned
equipment. Guidelines to follow when collecting this material include:
ODS should be collected, stored, and
transported in cylinders or other
hermetically sealed containers.
Removal of refrigerant from
commercial/industrial equipment at end-
of-life should be conducted on site by
certified technicians. Refrigerator
cabinets may be shredded whole and
steam-treated in an airtight chamber to
recover ODS blowing agents or the foam
may be removed and treated separately.
The point of origin and date of
establishment must be documented for each quantity of ODS. For stockpiles, the point of origin
is the location of the stockpile.12 For ODS recovered from equipment at end-of-life, the point of
origin is the location where the ODS was recovered from the equipment. Records should be
kept including the facility name, address, and serial or ID number of the containers used for
storage and transport.
4.2. Consolidation and Storage
Because ODS might be collected from a large number of smaller units (such as household refrigerators
or small cylinders), it needs to be combined before sending it for destruction; this step avoids the
shipping of many smaller containers, which can lead to additional expense, possible damage and
leakage, and other obstacles. Collected ODS is typically brought to a central facility, where it is
consolidated into larger cylinders or storage tanks, and stored until a quantity sufficient for destruction
has been aggregated.
4.3. Transportation
In this step, the ODS is transported to a destruction facility by truck, rail, or ship. The ODS may be
transported several times before its ultimate destruction, often as it moves through the consolidation
process.
12
The date on which a quantity of ODS was “stockpiled” is defined by the Reserve as the furthest date in the past on which the quantity of ODS contained in the reservoir was greater than or equal to the total quantity of all ODS removed from the reservoir since that date.
Custody and Ownership
Throughout the entire process, it is critical to properly document the chain of custody. Carbon credits will not be issued unless ODS ownership can be properly established; therefore, all records that show previous ownership of the material and transfer of that ownership to the project developer should be maintained. For VCS, the chain of custody must be documented by paper bills of lading or electronic, third-party tracking that includes proof of delivery. Other forms of documentation are accepted by the Reserve, including purchase orders or agreements, packing lists, lab test results, transfer container information, receiving inspections, freight bills, transactional payment information, or other supporting information.
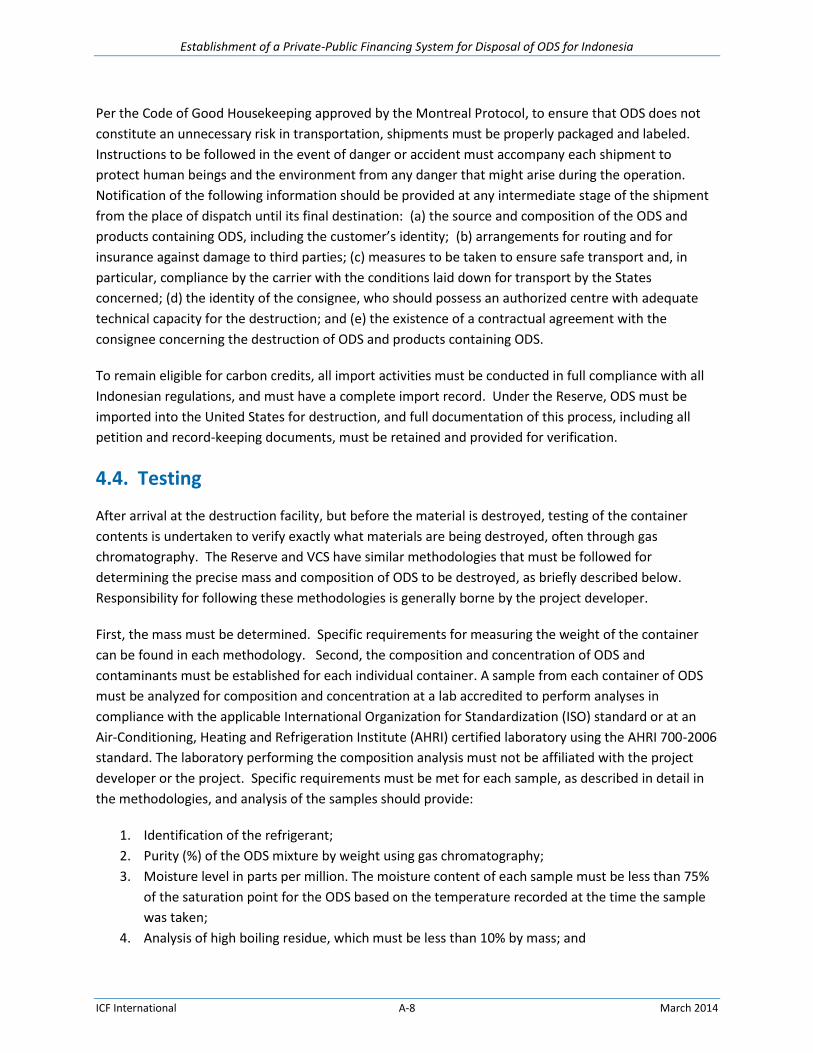
Establishment of a Private-Public Financing System for Disposal of ODS for Indonesia
ICF International A-8 March 2014
Per the Code of Good Housekeeping approved by the Montreal Protocol, to ensure that ODS does not
constitute an unnecessary risk in transportation, shipments must be properly packaged and labeled.
Instructions to be followed in the event of danger or accident must accompany each shipment to
protect human beings and the environment from any danger that might arise during the operation.
Notification of the following information should be provided at any intermediate stage of the shipment
from the place of dispatch until its final destination: (a) the source and composition of the ODS and
products containing ODS, including the customer’s identity; (b) arrangements for routing and for
insurance against damage to third parties; (c) measures to be taken to ensure safe transport and, in
particular, compliance by the carrier with the conditions laid down for transport by the States
concerned; (d) the identity of the consignee, who should possess an authorized centre with adequate
technical capacity for the destruction; and (e) the existence of a contractual agreement with the
consignee concerning the destruction of ODS and products containing ODS.
To remain eligible for carbon credits, all import activities must be conducted in full compliance with all
Indonesian regulations, and must have a complete import record. Under the Reserve, ODS must be
imported into the United States for destruction, and full documentation of this process, including all
petition and record-keeping documents, must be retained and provided for verification.
4.4. Testing
After arrival at the destruction facility, but before the material is destroyed, testing of the container
contents is undertaken to verify exactly what materials are being destroyed, often through gas
chromatography. The Reserve and VCS have similar methodologies that must be followed for
determining the precise mass and composition of ODS to be destroyed, as briefly described below.
Responsibility for following these methodologies is generally borne by the project developer.
First, the mass must be determined. Specific requirements for measuring the weight of the container
can be found in each methodology. Second, the composition and concentration of ODS and
contaminants must be established for each individual container. A sample from each container of ODS
must be analyzed for composition and concentration at a lab accredited to perform analyses in
compliance with the applicable International Organization for Standardization (ISO) standard or at an
Air-Conditioning, Heating and Refrigeration Institute (AHRI) certified laboratory using the AHRI 700-2006
standard. The laboratory performing the composition analysis must not be affiliated with the project
developer or the project. Specific requirements must be met for each sample, as described in detail in
the methodologies, and analysis of the samples should provide:
1. Identification of the refrigerant;
2. Purity (%) of the ODS mixture by weight using gas chromatography;
3. Moisture level in parts per million. The moisture content of each sample must be less than 75%
of the saturation point for the ODS based on the temperature recorded at the time the sample
was taken;
4. Analysis of high boiling residue, which must be less than 10% by mass; and

Establishment of a Private-Public Financing System for Disposal of ODS for Indonesia
ICF International A-9 March 2014
How long does an ODS destruction project take?
Once the project has been identified, it can take from about one year to several years from project development through to sale of the credits. The timeframe depends on a variety of factors including the complexity of the project, the type or design of the project (e.g., some projects are designed to be implemented over several years, such as an on-going refrigerator collection program), and many other factors, some of which can be influenced by the project developer and some which cannot.
5. Analysis of other ODS in the case of mixtures of ODS, and their percentage by mass.
For containers holding mixed ODS, a separate process must be followed. This process includes
determination of the composition and concentration of ODS on a mass basis, followed by circulation of
the mixed ODS and then sampling and analysis.
4.5. Destruction
For both the Reserve and VCS, destruction of ODS
must occur at a facility that meets all guidelines
provided in the UNEP Technology and Economic
Assessment Panel (TEAP) Task Force on Destruction
Technologies. In addition, under the Reserve,
destruction facilities must be located in the United
States and meet requirements of U.S. domestic law.
While destroying ODS material, operating parameters of the destruction unit must be monitored and
recorded in accordance with each of the methodologies and the Code of Good Housekeeping approved
by the Montreal Protocol. Like for testing, responsibility for following these methodologies is generally
borne by the project developer.
5. Project Development Because the Kyoto Protocol limits trading to non-Montreal Protocol greenhouse gases, ODS are
currently not eligible for projects under the Clean Development Mechanism. Instead, ODS destruction is
eligible to earn carbon credits in the voluntary carbon market, where organizations can offset carbon
emissions on a voluntary basis. In the voluntary carbon market, two major third-party standards are
offering credits for ODS destruction projects: the Verified Carbon Standard (VCS) and the Climate Action
Reserve (the Reserve).13 In Indonesia, a national carbon market may also eventually allow for credits
from ODS destruction projects to fulfill national requirements.
The sections below describe considerations for assessing the financial feasibility of an ODS destruction
process and for engaging with the private sector for project development, followed by an overview of
the general project development process.
5.1. Assessing the Financial Feasibility of an ODS Destruction Project
Before initiating the project development process, a preliminary assessment of the cost-effectiveness of
the project should be considered.
13
While technically there is no strict requirement to operate in accordance with a third-party standard, end consumer
requirements are driving demand for projects developed using recognized third party standards. In 2008, 96 percent of transacted VERs was verified by a third-party standard.

Establishment of a Private-Public Financing System for Disposal of ODS for Indonesia
ICF International A-10 March 2014
What are some strategies to minimize costs?
Combine ODS destruction projects with other activities or programs that are also eligible for crediting in the carbon market, such as equipment replacement for energy efficiency credits. This strategy could be effective to fund ongoing collection programs, such as municipal, utility, or retailer programs to collect refrigerators on disposal, and ensure that ODS refrigerant and foam blowing agent is destroyed.
Mainstream ODS destruction projects into larger programs and development projects, such as country ODS phaseout programs or a comprehensive waste management program.
Group or pool projects to minimize transaction costs and achieve economies of scale.
The overall cost of developing an ODS destruction project includes the costs of collection,
transportation, storage, testing, and destruction, as well as the “transaction” costs of project
preparation, validation, and verification.14 Project
costs vary widely depending on many factors such as
geographical location, nature of ODS bank and the
effort required to recover the ODS, quantity of ODS
being handled, technologies used, type of ODS, firms
contracted, and demand for services. In general, some
projects may be more costly than others to develop.
For example, collecting used CFCs from household
refrigerators is likely to be more costly than
recovering ODS from commercial air conditioning
equipment with large charge sizes, on a per kilogram
of ODS basis. Destroying existing ODS stockpiles may
be the most cost-effective project type.
Because some project costs are “fixed” (i.e., they do
not vary depending on the amount of ODS destroyed), destroying larger volumes of ODS can lead to
higher profitability. In particular, project transaction costs—such as the cost of project preparation,
verification, etc.—must be incurred regardless of the amount of ODS destroyed. Additionally, some
project implementation costs may also be realized irrespective of the amount of ODS collected and
destroyed. For example, setting up the infrastructure for a refrigerator collection program may be a
one-time cost that does not depend heavily on the number of refrigerators collected. These “fixed”
costs mean that in some cases there may be a minimum amount of ODS that must be destroyed in order
to have a financially viable project.
The profitability of the project will also strongly depend on the trading price of carbon credits verified by
each third-party standard, and the attractiveness of ODS destruction credits to buyers. Demand in the
voluntary market is driven not by regulation but by buyers’ interest in mitigating and offsetting their
emissions—which is often motivated by reputational considerations. As such, ODS projects need to be
packaged in a way that is attractive to buyers and their stakeholders. In particular, ODS project
proponents may need to differentiate themselves from other industrial gas projects that have drawn
criticism (and lower carbon prices) in the past, such as HFC-23 destruction. A good solution here is for
ODS destruction projects to tell a compelling story emphasizing that they help pay for the removal of
GHGs that would otherwise be emitted over time if left unaddressed.
From the sellers’ side of the market, uncertainty about carbon prices will be an ongoing challenge that is
inherent to the carbon market. Prices depend on a variety of factors, including the standard to which
the project is developed, the perceived robustness of the methodology used, and so on. In the past, low
14
Most of these costs are likely to borne by the project developer (or the project financier), although some upfront costs—such as those to maintain ODS stockpiles in advance of project development—are usually borne by the owner of the ODS.
Establishment of a Private-Public Financing System for Disposal of ODS for Indonesia
ICF International A-11 March 2014
prices on the Chicago Climate Exchange (CCX) market have contributed to decisions not to move
forward with an ODS destruction project, such as in the case of Argentina, where some CTC was instead
sold to Mexico for feedstock use rather than destroyed in the U.S. for crediting under CCX. If project
developers are uncertain about whether a project will earn a profit, it may not be pursued. Prices for the
over-the-counter market are not generally disclosed publicly but are available indirectly through several
sources, including an annual report published by Ecosystem Marketplace and New Carbon Finance
(available on www.ecosystemmarketplace.com).
5.2. Selecting a Strategy for Project Development
Once the decision is made to pursue an ODS destruction project, several options for structuring private-
public financing arrangements are available for government agencies in possession of unwanted ODS.
These options include:
Contracting Out—The process is managed by a private sector entity with the Government
informing the public of potential revenue streams from ODS disposal and issuing appropriate
documentation required for disposal or export for final disposal. Under this option, ownership of
the ODS would be transferred to a private entity, who would then develop an ODS destruction
project, and all project revenues would be owned by the private entity. That said, some
revenues may still accrue to the Government, if, for example, a Government chose to sell its
ODS stockpile via an auction process. This option has the lowest administrative and cost burden
on the Government.
Facilitation—The Government plays a modest administrative role and exercises its regulatory
responsibilities while working in concert with a private sector project developer to facilitate the
chain of identification, inventory development, collection, licensing, auctioning, registering and
collecting/transferring revenues to the Government. Under this option, the Government would
need to identify and hire a project developer to develop the project on its behalf, as well as
negotiate ownership of the final credits earned. In some arrangements, ownership of these
credits is fully transferred to the owner of the ODS; in other arrangements, ownership of the
credits is shared between the project developer and owner of the ODS.
Project Developer—In this option, a Government entity assumes responsibility for creating the
emission reduction credits by managing and generating credit through the chain of activities
identified above in order to generate and collect carbon revenues for the Government. This
option has the highest administrative burden for the Government, and requires the Government
entity to have significant capacity and experience in the voluntary carbon market, and to be able
to cover upfront project development costs and market the credits, in anticipation of future
revenues. While no rules restrict governments from acting as project developers, there is also
no clear precedent for national government participation in the project development side of the
voluntary market. Generally, government roles have tended to focus on facilitating market
intervention through capacity building and legislation, although there is some experience with
governments serving as the project developer and coordinating entity for a programme of
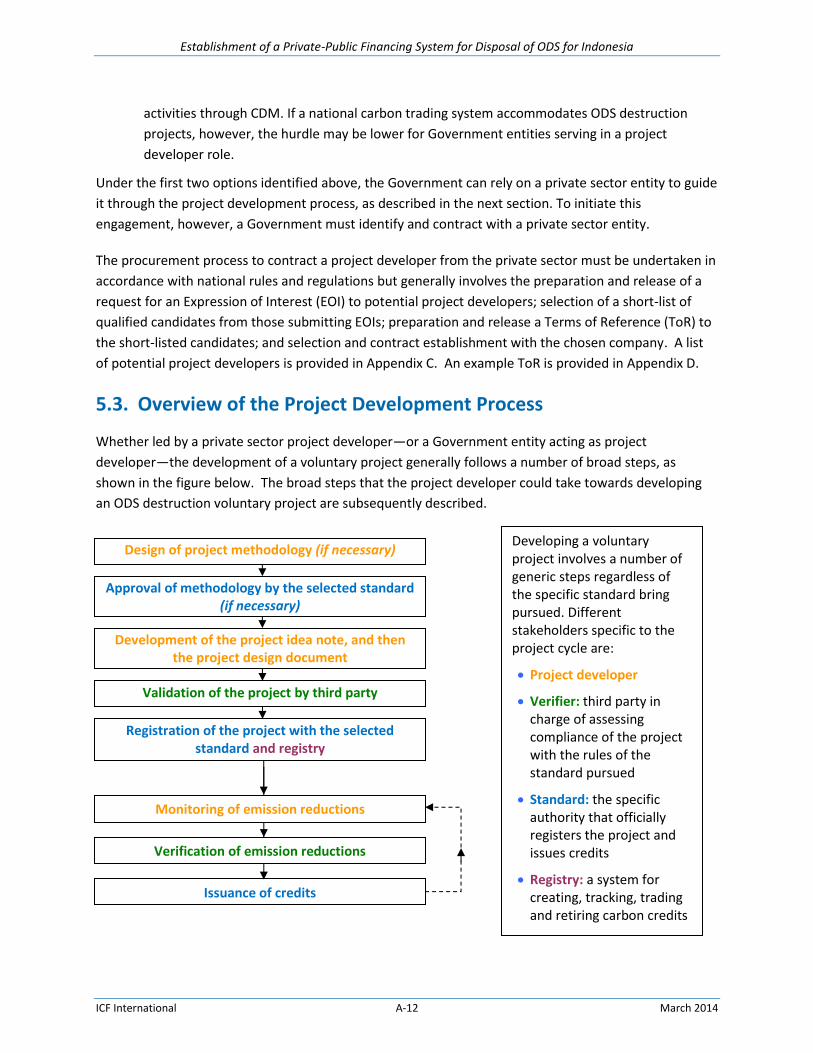
Establishment of a Private-Public Financing System for Disposal of ODS for Indonesia
ICF International A-12 March 2014
Issuance of credits
Registration of the project with the selected standard and registry
Validation of the project by third party
Development of the project idea note, and then the project design document
Verification of emission reductions
Monitoring of emission reductions
Design of project methodology (if necessary)
Approval of methodology by the selected standard (if necessary)
activities through CDM. If a national carbon trading system accommodates ODS destruction
projects, however, the hurdle may be lower for Government entities serving in a project
developer role.
Under the first two options identified above, the Government can rely on a private sector entity to guide
it through the project development process, as described in the next section. To initiate this
engagement, however, a Government must identify and contract with a private sector entity.
The procurement process to contract a project developer from the private sector must be undertaken in
accordance with national rules and regulations but generally involves the preparation and release of a
request for an Expression of Interest (EOI) to potential project developers; selection of a short-list of
qualified candidates from those submitting EOIs; preparation and release a Terms of Reference (ToR) to
the short-listed candidates; and selection and contract establishment with the chosen company. A list
of potential project developers is provided in Appendix C. An example ToR is provided in Appendix D.
5.3. Overview of the Project Development Process
Whether led by a private sector project developer—or a Government entity acting as project
developer—the development of a voluntary project generally follows a number of broad steps, as
shown in the figure below. The broad steps that the project developer could take towards developing
an ODS destruction voluntary project are subsequently described.
Developing a voluntary project involves a number of generic steps regardless of the specific standard bring pursued. Different stakeholders specific to the project cycle are:
Project developer
Verifier: third party in charge of assessing compliance of the project with the rules of the standard pursued
Standard: the specific authority that officially registers the project and issues credits
Registry: a system for creating, tracking, trading and retiring carbon credits
Establishment of a Private-Public Financing System for Disposal of ODS for Indonesia
ICF International A-13 March 2014
1. Review voluntary market third-party standards and existing methodologies for selection.
A project developer would first review the available standards to identify which one meets the needs of
the envisioned ODS destruction project (e.g., given the standard’s rules, geographical coverage, and so
on). For example, currently the Reserve limit eligible projects to those that destroy ODS in the United
States; if national regulations make it difficult to move ODS transnationally, the Reserve may not be a
viable option.
Currently, one protocol exists for ODS destruction under the Reserve (Article 5 ODS Project Protocol
Version 2.0), and one exists under VCS (VM0016). If one of these methodologies is appropriate for the
project in question (e.g., the envisioned project seems eligible under the methodology, the methodology
seems “doable”), then the project developer can move on to the next step. If this is not the case,
however, then the project developer generally has two options:
Seek a revision or deviation to an existing methodology (if allowed), or
Develop a new methodology for submission and approval by the third-party standard that is
being pursued (if the standard accepts new methodologies).
If neither option is possible, then the project developer cannot move forward under the standard
selected.
2. Develop a project idea note.
Once a methodology is selected (or approved), the project developer usually develops a project idea
note (PIN). A PIN is not required by the third-party standards, but is often used to attract financing for a
project. A PIN describes the project and sets out the business case for the voluntary credit project, as
well as the additionality case. It sets out if an existing methodology is applicable to the project or
whether a new methodology needs to be developed. It also presents the likely costs, expected number
of credits the project would produce, the voluntary standard that would be sought, and the potential
revenue that the sale of the credits could generate.
Depending on the level of in-house expertise, this, and other project documentation and support, may
be undertaken by an external consultant.
3. Establish funding.
The project developer has two main options for financing:
Fund the entire project activity itself with a view to selling the credits once the project is
registered and the credits are issued or
Use the PIN to attract interest from a financier. A financier could provide the capital required to
support the project through the cycle and fund the destruction process in return for more
favorable credit prices, or could support just the carbon costs of the project.

Establishment of a Private-Public Financing System for Disposal of ODS for Indonesia
ICF International A-14 March 2014
Verification Process
Verification of emission reductions is a critical step in the project development process that includes the following:
Testing Internal Controls
Conducting Substantive Testing
Data Validation
Aberrant Data
Reasonable Assumptions, Methodologies, and Calculations
As such, this process should be undertaken by a credible third-party to ensure validation.
4. Develop full project documentation.
Once financing is in place, the full project documentation (i.e., the project design document or its
equivalent, as defined by the third-party standard, describing the emission reduction activity) would be
developed and the validation process would begin (if required).
5. Monitor and verify emission reductions, and receive credits.
Next is the annual monitoring and verification of emission reductions generated by the project by an
external auditor. The project developer generally engages a third-party verifier to certify the validity of
the project’s emissions reductions. Upon receipt of a
completed verification report, the selected registry
issues the credits.
6. Obtain validation.
If required by the third-party standard, the project
documentation is also submitted for validation. If
successful, the project is then registered under the
selected standard. This step is not required for the
Reserve.
7. Market the credits.
Depending on the arrangements with the financier, the
credits would pass to the owner, or be shared between
the owner and the developer, as negotiated. Project developers may then sell offsets through brokers to
aggregators or final customers (e.g., companies or consumers looking to voluntarily offset their
emissions). Developers may also sell to aggregators directly or onto an exchange.
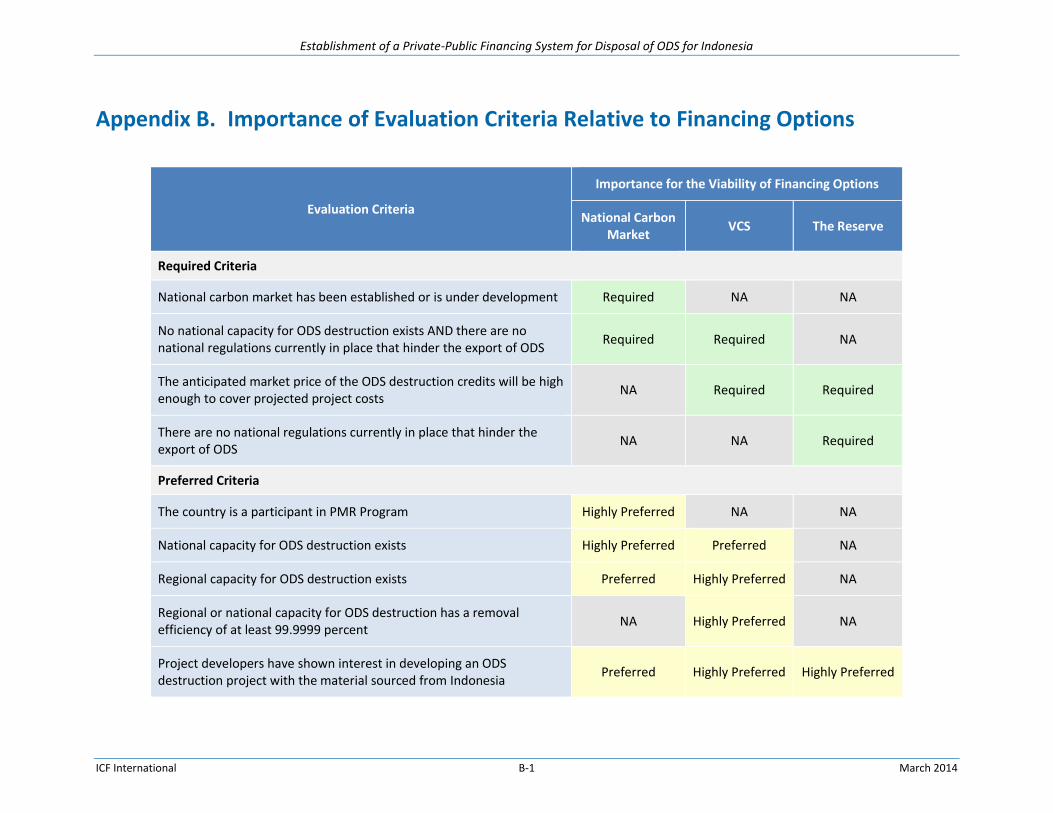
Establishment of a Private-Public Financing System for Disposal of ODS for Indonesia
ICF International B-1 March 2014
Appendix B. Importance of Evaluation Criteria Relative to Financing Options
Evaluation Criteria
Importance for the Viability of Financing Options
National Carbon Market
VCS The Reserve
Required Criteria
National carbon market has been established or is under development Required NA NA
No national capacity for ODS destruction exists AND there are no national regulations currently in place that hinder the export of ODS
Required Required NA
The anticipated market price of the ODS destruction credits will be high enough to cover projected project costs
NA Required Required
There are no national regulations currently in place that hinder the export of ODS
NA NA Required
Preferred Criteria
The country is a participant in PMR Program Highly Preferred NA NA
National capacity for ODS destruction exists Highly Preferred Preferred NA
Regional capacity for ODS destruction exists Preferred Highly Preferred NA
Regional or national capacity for ODS destruction has a removal efficiency of at least 99.9999 percent
NA Highly Preferred NA
Project developers have shown interest in developing an ODS destruction project with the material sourced from Indonesia
Preferred Highly Preferred Highly Preferred

Establishment of a Private-Public Financing System for Disposal of ODS for Indonesia
ICF International C-1 March 2014
Appendix C. Potential Project Developers The following list of project developers identifies companies that either have direct experience
developing ODS destruction projects or have other relevant experience developing regional projects
under the Reserve and/or VCS. While not an exhaustive list, the following companies are considered to
be the most likely to undertake development of an A5 ODS destruction project for Indonesia.
A-Gas RemTec 1100 Haskins Road Bowling Green, OH 43402 USA 1-800-372-1301
EOS Climate Inc. 55 Hawthorne St, Suite 610 San Francisco, CA 94105 USA 800-764-8093 [email protected]
COOLGAS, INC. 30045 FM 2978 Magnolia, TX 77354 USA 1-800-366-1356
OEKO Service Luxembourg (O.S.L.) S.A. Zone Industrielle Piret, B.P. 43 7737 Colmar-Berg, Luxembourg +352488216-1
Diversified Pure Chem, LLC 11050 South Highway 287 Rhome, TX 76078 817-636-2089 [email protected]
RapRec Refrigerants 8971 W. Bloomfield Rd. Peoria, AZ 85381 877-372-7732
Emergent Ventures India (EVI) 5th Floor, Universal Trade Tower Gurgaon- Sohna Road, Sector 49 Haryana, India, 122018 +91-124-6653100 [email protected]
Refrigerant Exchange Corp. 5263 N. 4th St. Irwindale, CA USA 626-338-1890 [email protected]
Environmental Credit Corp. 210 W. Hamilton Ave #297 State College, PA 16801 USA 607-288-4020 [email protected]
South Pole Carbon 2/22 Iyara Building, 6th Floor Chan Road, Soi 2, Thungwatdorn Sathorn, Bangkok 10120 Thailand + 66 2 678 89 79 [email protected]

Establishment of a Private-Public Financing System for Disposal of ODS for Indonesia
ICF International D-1 March 2014
Appendix D. Sample Terms of Reference for Project Developer
UNITED NATIONS INDUSTRIAL DEVELOPMENT ORGANIZATION
DEMONSTRATION PROJECT FOR DISPOSAL OF UNWANTED ODS IN MEXICO (MP/MEX/11/003 and TE/MEX/12/004)
TERMS OF REFERENCE
FOR THE SUPPLY OF SERVICES REQUIRED FOR THE DESTRUCTION OF UNWANTED ODS COLLECTED IN MEXICO
11th March 2013
I. GENERAL BACKGROUND AND OBJECTIVES The 63rd Meeting of the Executive Committee of the Multilateral Fund for the Implementation of the Montreal Protocol (4 – 8 April 2011) approved funding for the demonstration project on ODS destruction in line with decision 58/19, to be implemented by UNIDO and the Government of France. The objective of this project is to destroy 166.7 metric tons of unwanted ODS in the refrigeration sector in Mexico collected during the past 8 years: it includes all categories of activities for the disposal of ODS, namely transport, storage and destruction. The estimated project impact reflects a total reduction of greenhouse gas emission of 997,110 tons of CO2-equivalents. Since 2005 the Government of Mexico through the Ministry of Energy and Energy Saving Fund (FIDE) has successfully accelerated the replacement of old refrigeration appliances with new energy efficient equipment. In 2007, the Secretariat of Environment and Natural Resources (SEMARNAT) and UNIDO, throughout the National CFC Phase out Plan, trained and equipped 100 collecting Centers (FIDE centers) with tools to identify and recover refrigerants gases from old appliances dismantled in these centers. In 2009, FIDE established the second phase of the program for the substitution of domestic refrigerators with the goal to replace and collect 1,600,000 appliances until the end of 2012; the new phase includes 110 collecting centers.

Establishment of a Private-Public Financing System for Disposal of ODS for Indonesia
ICF International D-2 March 2014
On the other hand, in 2007 SEMARNAT and UNIDO installed a network of 14 recycling centers within Mexico in order to provide recovery, recycling and storage for destruction services to the refrigeration technicians and companies involved in the refrigeration sector. As of February 2013, the currently available stocks for destruction come from these two collection programs. Additionally, two pharmaceutical companies have remaining stocks of virgin CFC ready to send for destruction.
II. OFFER REQUIREMENTS
This Terms of Reference should be used for the preparation of a proposal to supply services
required for the collection, transport and destruction of 74.1 tons of unwanted ODS.
The destruction of unwanted ODS must be carried out in compliance with the technologies approved by the Technology and Economic Assessment Panel of Montreal Protocol (TEAP - Report of the Task Force on Destruction Technologies; http://ozone.unep.org/teap/Reports/Other_Task_Force/index.shtml) and meet the performance parameters and emissions requirements set out by TEAP, as well as comply with the applicable local regulations. The contract awarded company is required to carry out the transport for collection in order to consolidate all the quantities of ODS in one collection center which has to have all the permits for the management of this type of gases, including, but not limited to, hazardous waste management, in enough quantities to handle at least 74.1 tons. If the destruction of ODS will take place outside Mexico, the collection center selected by the awarded company will be responsible for all export procedures, including licenses, allowances, and permits to export the referred ODS. The collection and destruction of 74.1 tons of unwanted ODS has to be undertaken within one year starting from the date of signature of the contract related to these Terms of Reference. Companies must provide a detailed description of the destruction methods they will apply.
If unwanted ODS are to be destroyed in order to obtain Carbon Credits, destruction has to be
carried out through methodologies approved by the Climate Action Reserve (CAR) or the
Verified Carbon Standard (VCS). The methodologies taken into consideration must have been
approved before the date of publication of the present Terms of Reference on the UNIDO
website.
A. Technical Offer
The proposal of destruction services offered must include the following information:
1. General data of the company: - Name of the company - Address - Telephone - E- Mail

Establishment of a Private-Public Financing System for Disposal of ODS for Indonesia
ICF International D-3 March 2014
- web site (if available) - Operation records of the company for the last 2 years, demonstrating the experience
in the management and destruction of refrigerant gases and/or comparable substances.
- Listing of qualifications and brief description of experience of the personnel to be assigned to the project.
2. Detailed description of the destruction facility: - Type of ODS destruction technology approved by TEAP. - Location of the facility. - Operational procedures. - ODS handling and storage including safety procedures for containers and bulk
storage tanks for refrigerants. - ODS identification and quantification methods applied. - Preparation and feeding of gas to the destruction process. - Feed rate range (kg/hr) of gas. - Emission monitoring system. - Treatment of gaseous and aqueous effluents (when applicable).
3. Emission values of the destruction technology: - Destruction and Removal Efficiency of ODS. - Emissions of dioxins and furans. - Emissions of acidic gases (HCl and HF), particles and carbon monoxide. - Emissions of metals and other relevant pollutants.
4. Information of the Collection Center: - Name of the Center - Address - Telephone - E- Mail - web site (if available) - Number of hazardous waste collection registry delivered by SEMARNAT. - Number of all environmental authorizations required to get the export permission of
recovered ODS. - Operation records demonstrating the experience in the management of refrigerant
gases and/or comparable substances. - Listing of qualifications and brief description of experience of the personnel to be
assigned to the project.
5. Information on the Transport Company for the transport of recovered ODS: - Name of the Transport Company - Address - Telephone - E- Mail - web site (if available) - Number of all authorizations required for the transport of recovered ODS within
Mexican territory.
6. Additional information:

Establishment of a Private-Public Financing System for Disposal of ODS for Indonesia
ICF International D-4 March 2014
- If ODS are to be destroyed in order to obtain Carbon Credits, proven track record in registering projects under CAR / VCS.
7. Provide a Commitment Letter
B. Commercial Offer
Detailed description of the cost for proposed services:
1. Based upon information in Annex 1, cost for transportation from the points of origin to
the destruction facility. The quotation should include the cost of handling and the return of empty containers to the points of origin.
2. Cost for destruction per kg, including temporal storage and handling in the destruction
facility.
3. Cost of reporting (reporting requirements are specified in Section V of this Terms of
Reference).
4. If a share or the whole of the unwanted ODS are to be destroyed in order to obtain
carbon credits, registration cost under one of the two carbon market schemes considered (e.g. validation, monitoring, reporting and verification, etc.)
The proposal must include a detailed time schedule for the destruction of 74.1 metric tons of
unwanted ODS. The batches of unwanted ODS (as identified in Annex 1) have to be
destroyed in the sequence specified in Annex 2.
Companies are requested to fill the table provided in Annex 2 with an estimation of:
1. Dates when each batch of unwanted ODS will be transported from its collection point (as
detailed in Annex 1) to the destruction facility;
2. Dates when each batch of unwanted ODS will be destroyed.
III. LANGUAGE REQUIREMENTS The personnel provided by the supplier for undertaking the above-defined tasks will be required to have working knowledge of Spanish and English (both written and spoken); the ability to provide native Spanish speakers will be an asset
IV. DELIVERABLES
A. Reporting to the National Ozone Unit of Mexico
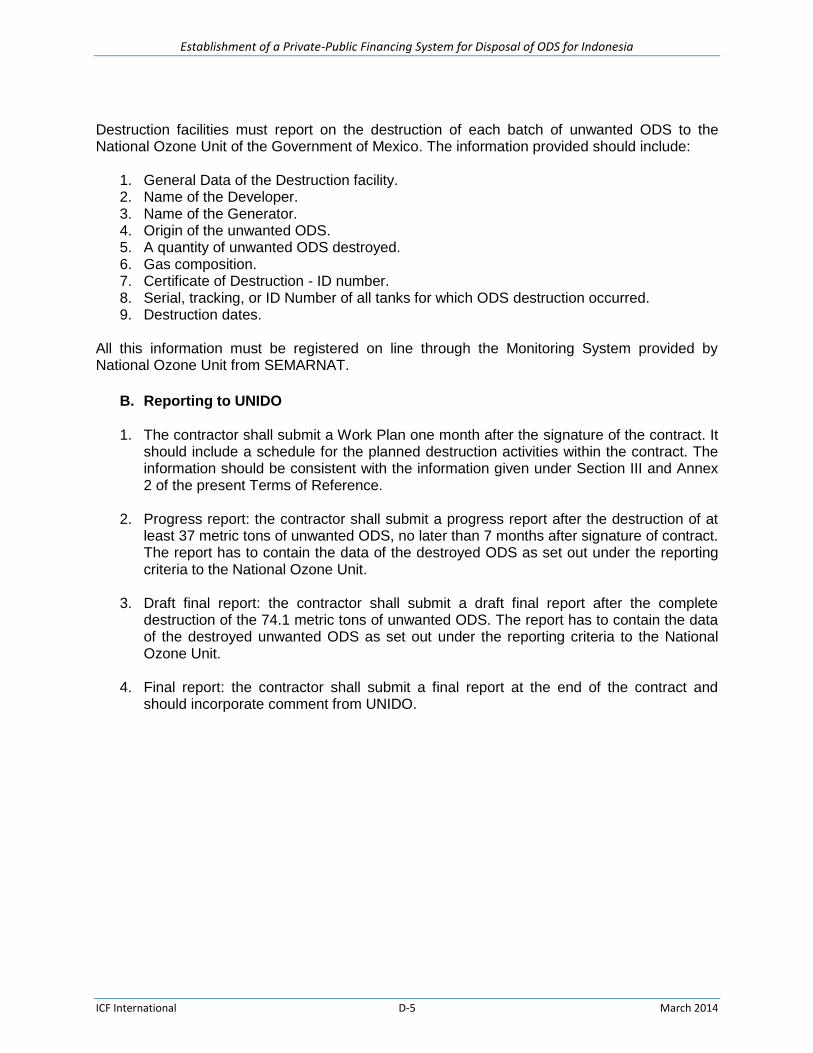
Establishment of a Private-Public Financing System for Disposal of ODS for Indonesia
ICF International D-5 March 2014
Destruction facilities must report on the destruction of each batch of unwanted ODS to the National Ozone Unit of the Government of Mexico. The information provided should include:
1. General Data of the Destruction facility. 2. Name of the Developer. 3. Name of the Generator. 4. Origin of the unwanted ODS. 5. A quantity of unwanted ODS destroyed. 6. Gas composition. 7. Certificate of Destruction - ID number. 8. Serial, tracking, or ID Number of all tanks for which ODS destruction occurred. 9. Destruction dates.
All this information must be registered on line through the Monitoring System provided by National Ozone Unit from SEMARNAT.
B. Reporting to UNIDO
1. The contractor shall submit a Work Plan one month after the signature of the contract. It should include a schedule for the planned destruction activities within the contract. The information should be consistent with the information given under Section III and Annex 2 of the present Terms of Reference.
2. Progress report: the contractor shall submit a progress report after the destruction of at
least 37 metric tons of unwanted ODS, no later than 7 months after signature of contract. The report has to contain the data of the destroyed ODS as set out under the reporting criteria to the National Ozone Unit.
3. Draft final report: the contractor shall submit a draft final report after the complete
destruction of the 74.1 metric tons of unwanted ODS. The report has to contain the data of the destroyed unwanted ODS as set out under the reporting criteria to the National Ozone Unit.
4. Final report: the contractor shall submit a final report at the end of the contract and
should incorporate comment from UNIDO.

Establishment of a Private-Public Financing System for Disposal of ODS for Indonesia
ICF International D-6 March 2014
V. RECOMMENDED TABLES OF SCOPE OF SERVICES UNIDO RFP reference No. Scope of services
Technical table
UNIDO REQUIREMENTS TO BE COMPLETED BY THE INVITEE
Item Name and required parameters Compliance*) Remarks**)
yes/no
1 General data from the company
2 Detailed description of the destruction facility and certification
3 Emission values of the destruction technology
4 Additional information
5 Provide a Commitment Letter
*) compliance must be confirmed in detail in the by the contractor’s offer and technical documentation and will be verified by UNIDO during technical evaluation; **)if not compliant with UNIDO’s required parameters, the invitee must indicate his parameters in this column
Commercial table
UNIDO REQUIREMENTS TO BE COMPLETED BY THE INVITEE
Item Name and required parameters Quantity unit price total item price
currency currency
1 Transportation costs as per Annex 1
2 Cost for destruction per kg including storage and handling
3 Cost of reporting
4 Cost of registration of destruction activities under a voluntary carbon market scheme, if applicable
Total price:

Establishment of a Private-Public Financing System for Disposal of ODS for Indonesia
ICF International D-7 March 2014
VI. EVALUATION CRITERIA The company has to provide
1. General Data from the company 2. Detailed description of the destruction facility and certification 3. Emission values of the destruction technology 4. Commitment letter 5. Transportation costs 6. Cost for destruction per kg including storage and handling 7. Cost of registration of destruction activities under a voluntary carbon market scheme,
if applicable

blankpage

Establishment of a Private-Public Financing System for Disposal of ODS for the Philippines
February 2014
Prepared for
The World Bank Group 1818 H Street NW Washington, DC 20433
Prepared by
ICF International 1725 Eye Street, Suite 1000 Washington, DC 20006

blankpage
ICF International i February 2014
Contents 1. Background .................................................................................................................................1
2. Inventory Development ...............................................................................................................3 2.1. Development of Inventory Tool.................................................................................................... 3 2.2. Data Collection and Tool Population ............................................................................................ 3
3. Building Capacity to Undertake ODS Destruction Projects .............................................................6 3.1. Workbook on the Management of Unwanted ODS ..................................................................... 6 3.2. Overview of ODS Destruction Technologies ................................................................................. 7
4. Financing Options for Destroying Unwanted ODS .........................................................................7 4.1. Available Markets for ODS Destruction Credits ........................................................................... 8 4.2. Cost Considerations .................................................................................................................... 12 4.3. Current Voluntary Market Prices ................................................................................................ 14 4.4. Potential Revenue from the Destruction of ODS in the Philippines ........................................... 15
5. Evaluation of Options for the Philippines .................................................................................... 16
6. Next Steps for Implementation .................................................................................................. 18 6.1. Implementation of Phase I: Near-Term Next Steps .................................................................... 18 6.2. Implementation of Phase II and Phase III ................................................................................... 21
7. References ................................................................................................................................. 22
Appendix A. Workbook on the Management of Unwanted ODS in the Philippines ...................... A-1
Appendix B. Importance of Evaluation Criteria Relative to Financing Options ............................. B-1
Appendix C. Potential Project Developers .................................................................................. C-1
Appendix D. Sample Terms of Reference for Project Developer .................................................. D-1

blankpage
Establishment of a Private-Public Financing System for Disposal of ODS for the Philippines
ICF International iii February 2014
Acronyms and Abbreviations
Acronym / Abbreviation Stands For
CCO Chemical Control Order
CDM Clean Development Mechanism
CFC chlorofluorocarbon
DENR Department of Environment and Natural Resources
EMB Environmental Management Bureau
EOI expression of interest
GHG greenhouse gas
GWP global warming potential
HCFC hydrochlorofluorocarbon
HFC hydrofluorocarbon
kg kilogram
km kilometer
LVC low volume consuming country
MLF Multilateral Fund
MRV measurement, reporting, and verification
MtCO2e million metric tons carbon dioxide equivalent
NCPP National CFC Phase-out Management Plan
ODS ozone depleting substance
OEWG Open-Ended Working Group
PMR Partnership for Market Readiness
PMU Project Management Unit
tCO2e metric tons carbon dioxide equivalent
TEAP Technology and Economic Assessment Panel
ToR terms of reference
UNEP United Nations Environment Programme
UNIDO United Nations Industrial Development Organization
VCS Verified Carbon Standard
VCU verified carbon unit

Establishment of a Private-Public Financing System for Disposal of ODS for the Philippines
ICF International iv February 2014
blankpage

Establishment of a Private-Public Financing System for Disposal of ODS for the Philippines
ICF International 1 February 2014
1. Background The Montreal Protocol on Substances that Deplete the Ozone Layer has been immensely effective at
reducing the production and consumption of ozone depleting substances (ODS) worldwide. While the
production and consumption of ODS has dramatically diminished, a large amount of ODS still remains in
equipment, products, and stockpiles held by country governments as well as industrial and commercial
users. Because emissions from ODS banks are not explicitly controlled by the Montreal Protocol, there
is significant risk that these ODS will be released to the atmosphere, contributing to both ozone
depletion and global climate change. Many countries have enacted regulations that prohibit the venting
of ODS; however, regulations alone are often not enough.
To prevent inadvertent or intentional emissions
of ODS banks, financial incentives must be put in
place to encourage proper management and
ensure eventual destruction of this unwanted
material. The high global warming potential
(GWP) of ODS means that their destruction has
the ability to generate significant volumes of
carbon credits. Indeed, a study prepared for the
World Bank in 2010 found that opportunity exists
for financing the destruction of ODS through the
voluntary carbon market (ICF 2010).
To help countries operating under Article 5(1) of
the Montreal Protocol take advantage of this
opportunity, ICF International was commissioned
by the World Bank to explore options for
engaging the private and public sectors in
financing the destruction of unwanted ODS in
the Philippines.1 The remainder of this report
provides a summary of the results of this effort,
including the following:
Development of an inventory of unwanted ODS (Section 2);
Building capacity (Section 3);
Exploring options for destroying unwanted ODS (Section 4);
Evaluation of options for the Philippines (Section 5); and
Next steps for implementation (Section 6).
1 As part of this work, ICF also explored options for engaging the private and public sectors in financing the destruction of unwanted ODS in Indonesia. The outcome of this activity is documented in a separate report.
Financing the Destruction of ODS through the Voluntary Carbon Market
The 2010 study prepared for the World Bank assessed opportunities for financing the destruction of unwanted ODS through the voluntary carbon market. The study concluded that there is a market for ODS destruction through frameworks such as the Verified Carbon Standard and Climate Action Reserve. The study recognized that some challenges do exist, but that overall the voluntary market is likely a win-win opportunity.
For more information, see the full report online: http://documents.worldbank.org/curated/en/2010/02/14551009/study-financing-destruction-unwanted-ozone-depleting-substances-through-voluntary-carbon-market.
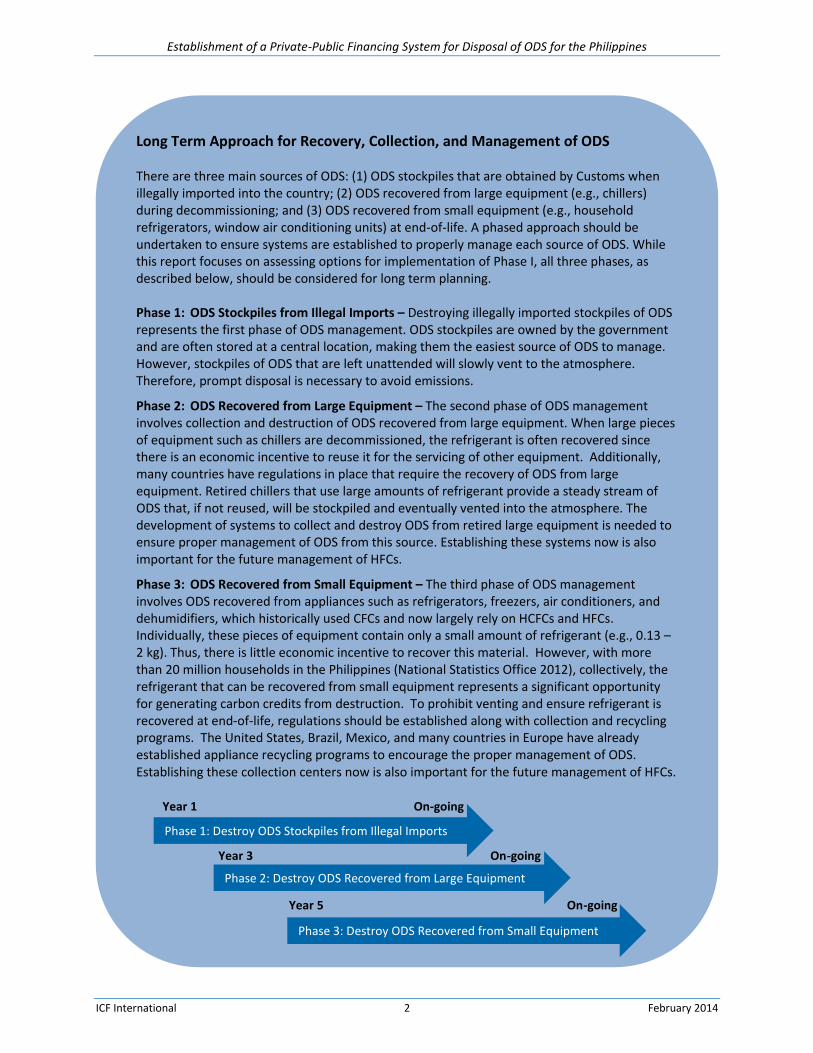
Establishment of a Private-Public Financing System for Disposal of ODS for the Philippines
ICF International 2 February 2014
Long Term Approach for Recovery, Collection, and Management of ODS There are three main sources of ODS: (1) ODS stockpiles that are obtained by Customs when illegally imported into the country; (2) ODS recovered from large equipment (e.g., chillers) during decommissioning; and (3) ODS recovered from small equipment (e.g., household refrigerators, window air conditioning units) at end-of-life. A phased approach should be undertaken to ensure systems are established to properly manage each source of ODS. While this report focuses on assessing options for implementation of Phase I, all three phases, as described below, should be considered for long term planning. Phase 1: ODS Stockpiles from Illegal Imports – Destroying illegally imported stockpiles of ODS represents the first phase of ODS management. ODS stockpiles are owned by the government and are often stored at a central location, making them the easiest source of ODS to manage. However, stockpiles of ODS that are left unattended will slowly vent to the atmosphere. Therefore, prompt disposal is necessary to avoid emissions.
Phase 2: ODS Recovered from Large Equipment – The second phase of ODS management involves collection and destruction of ODS recovered from large equipment. When large pieces of equipment such as chillers are decommissioned, the refrigerant is often recovered since there is an economic incentive to reuse it for the servicing of other equipment. Additionally, many countries have regulations in place that require the recovery of ODS from large equipment. Retired chillers that use large amounts of refrigerant provide a steady stream of ODS that, if not reused, will be stockpiled and eventually vented into the atmosphere. The development of systems to collect and destroy ODS from retired large equipment is needed to ensure proper management of ODS from this source. Establishing these systems now is also important for the future management of HFCs.
Phase 3: ODS Recovered from Small Equipment – The third phase of ODS management involves ODS recovered from appliances such as refrigerators, freezers, air conditioners, and dehumidifiers, which historically used CFCs and now largely rely on HCFCs and HFCs. Individually, these pieces of equipment contain only a small amount of refrigerant (e.g., 0.13 – 2 kg). Thus, there is little economic incentive to recover this material. However, with more than 20 million households in the Philippines (National Statistics Office 2012), collectively, the refrigerant that can be recovered from small equipment represents a significant opportunity for generating carbon credits from destruction. To prohibit venting and ensure refrigerant is recovered at end-of-life, regulations should be established along with collection and recycling programs. The United States, Brazil, Mexico, and many countries in Europe have already established appliance recycling programs to encourage the proper management of ODS. Establishing these collection centers now is also important for the future management of HFCs.
Phase 3: Destroy ODS Recovered from Small Equipment
Phase 1: Destroy ODS Stockpiles from Illegal Imports
Phase 2: Destroy ODS Recovered from Large Equipment
Year 1 On-going
Year 3 On-going
Year 5 On-going

Establishment of a Private-Public Financing System for Disposal of ODS for the Philippines
ICF International 3 February 2014
2. Inventory Development As a first step to managing banks of unwanted ODS, an inventory detailing the quantity, type, purity,
location, and ownership of the material must be developed. This step was completed in two parts:
through (a) the development of an inventory tool and (b) data collection and tool population, as
described in the sections that follow.
2.1. Development of Inventory Tool
To assist country governments in the
development of an ODS inventory, an Excel-
based inventory tool was developed. The
inventory tool is designed to collect
information on ODS contained in stockpiles,
chillers, and other equipment (e.g.,
refrigerators and air conditioners). The
inventory tool also includes a summary table
that auto-completes to show total quantities
of unwanted ODS held domestically. A
detailed description of the inventory tool along
with guidance on how to populate the tool is
presented in the Workbook provided in
Appendix A.
2.2. Data Collection and Tool Population
To populate the inventory tool, data on unwanted ODS residing in the Philippines were compiled using
multiple approaches. First, existing inventory information was requested from the Philippines
Department of Environment and Natural Resources (DENR). Sources reviewed include inspection
reports and verification reports from Bureau of Customs as well as equipment inventory summaries
compiled in support of other projects and programs under the auspices of DENR. To supplement and
verify the stockpile data, site visits to storage facilities were then conducted. During the site visits,
stockpiles were visually inspected and findings were documented.2 As a last step, information was
compared, synthesized, and transcribed into the Excel-based inventory tool. The remainder of this
section further documents the data collection experience in the Philippines, including a summary of the
country’s inventory results and data challenges and limitations.
2 No sampling of containers or other physical examination of stockpiles was conducted for this assignment. Instead, ICF relied
on previously conducted and quality controlled inventories. It is expected that if a project is developed, detailed verification will be undertaken at that time (i.e., as part of the third party MRV process).
ODS Stockpiles
Stockpiles of ODS are generally stored in cylinders within large facilities and warehouses. These cylinders are often pressurized and can be distinguished using color, pressure, size, weight, or shape. The refrigerant industry typically universally distinguishes the type of refrigerant in a cylinder primarily based on color and pressure. These stockpiles of ODS are often consolidated into larger cylinders or storage tanks prior to destruction to avoid additional shipping expenses.

Establishment of a Private-Public Financing System for Disposal of ODS for the Philippines
ICF International 4 February 2014
Data Collection in the Philippines
Working with the Philippines DENR, the following sources of information were used to populate the
inventory tool for the Philippines:
Inspection Report: A Report on the Conduct of Inspection of Seized Refrigerants under the
Custody of the Bureau of Customs was provided to ICF by DENR. The report summarizes
shipments that were seized by the Bureau of Customs and inspected at the Manila International
Container Port in North Harbor, Manila on June 19, 2012.
Email Correspondence: To supplement the information in the inspection report, DENR provided
estimates of stockpiles held by the Bureau of Customs at the Ecology Center of EMB in Quezon
City through email correspondence. A site visit of the Ecology Center was intended but not
conducted because the refrigerant cylinders stored at this facility are located inside stacked
inter-modal transport containers that are bolted shut.
Verification Report: Verification of the recovered refrigerants being held at the Delsa facility in
Muntinlupa was conducted by the NCPP Project Management Unit (PMU) in June 2013. A report
detailing the cylinder serial number, refrigerant type, tare weight, gross weight, and net weight
of each cylinder at the facility, as compiled by the PMU, was provided to ICF by DENR.
Delsa Site Visit: To supplement the verification report of the material being held at the Delsa
facility, ICF’s in-country consultant visited the Delsa facility to visually inspect the cylinders.
Through discussions with the facility manager, it was determined that a large number of the
cylinders stored at the facility contain ODS but are incorrectly or not clearly labeled. In addition,
due to inadvertent leakage over time, the quantity of the contents within each cylinder may be
lower than specified.
Installed Chiller Summary: An inventory of installed chillers was compiled in 2011 by Berkman,
a contracting company for DENR, to support the Philippines Chiller Energy Efficiency Project.
The inventory list, which is known to not be exhaustive and does not specify refrigerant type,
was cross-walked with chiller inventory data from 2006 (also compiled to support the
Philippines Chiller Energy Efficiency Project) to identify the refrigerant contained in installed
chillers, to the extent possible. In neither list was refrigerant charge size provided; however,
cooling capacity was provided, which was used as a proxy to estimate refrigerant charge.
Philippines Inventory Data Challenges and Limitations
Several assumptions were made to address gaps and inconsistencies in the data compiled from the
various sources. Challenges and limitations of note include the following:
It was not possible to identify the types of ODS found in “mixtures” or unlabeled cylinders
stored at the Delsa facility.
The actual amount of material contained within cylinders stored at the Delsa and Customs’
facilities may be lower than indicated by the labels due to inadvertent leakage of the contents

Establishment of a Private-Public Financing System for Disposal of ODS for the Philippines
ICF International 5 February 2014
over time. Experience from an ODS destruction project in Nepal, spearheaded by UNEP under
the MLF, indicates that leakage from cylinders in storage was about 10-12% over a ten plus year
time frame. This suggests that the Philippines inventory may be about 10% overstated.
Stockpiles held by the Bureau of Customs were not visually inspected by the ICF team, and an
inventory of these stockpiles was not available. Instead, information provided by email from
DENR was used to estimate the number, location, and content of storage vessels.
Some of the chillers identified in the 2006 and 2011 inventories may no longer be in service. In
addition, complete data on refrigerant type and charge size was not available in the inventories
provided. Instead, assumptions were made regarding the refrigerant type, and the cooling
capacity was used to estimate refrigerant charge size (i.e., 0.9 kilograms are required for each
tonne of cooling capacity).
Philippines Inventory Results
Using the sources described above, a preliminary inventory of ODS was developed for the Philippines, as
presented in Table 1. Given the data challenges and limitations, further inspection and verification of
the material is necessary to validate these preliminary findings. In addition, other efforts will need to be
undertaken to expand and verify the chiller inventory and develop an inventory of ODS contained in
other equipment (e.g., refrigerators/freezers).
Table 1: Summary of Preliminary Inventory of ODS in the Philippines
Chemical Stockpile Inventory Chiller Inventorya
kg tCO2e kg tCO2e
CFC-11 50 239 24,113 114,535
CFC-12 30,255 329,781 3,047 33,212
R-502 48 224 - -
CFC Subtotal 30,353 330,244 27,160 147,747
HCFC-22 7,982 14,448 106,309 192,420
HCFC-123 11 1 130,479 10,047
HCFC-141b 90 66 - -
HCFC Subtotal 8,083 14,515 236,788 202,467
HFC-134a 463 662 110,276 157,695
R-404A 161 632 - -
R-403B 17 74 - -
R-407C 6 10 - -
R-410A 23 47 - -
R-413A 9 20 - -
HFC Subtotal 679 1,445 110,276 157,695
Mixtureb 15,597 69,679 - -
Unknown 681 NA - -
TOTAL 39,115 346,204 374,224 507,909 a The chiller inventory is estimated based on the cooling capacity of equipment currently in use.
b Based on the sources consulted, it is estimated that the mixtures held at the Delsa facility contain largely HCFC-22 as well
as some CFC-11 and CFC-12. Additionally, the mixtures held by Customs are estimated to contain either a mixture of HFC-
134a/CFC-12 or HFC-134a/CFC-12/HCFC-22/HC. This information was used to estimate the tCO2e-weighted inventory.

Establishment of a Private-Public Financing System for Disposal of ODS for the Philippines
ICF International 6 February 2014
3. Building Capacity to Undertake ODS Destruction Projects
3.1. Workbook on the Management of Unwanted ODS
To assist countries operating under Article 5(1) of the Montreal Protocol to take advantage of the
opportunity to finance the destruction of ODS through the carbon market, a Workbook on the
Management of Unwanted ODS was developed. The workbook, which was developed by ICF under
contract with the World Bank, is intended to serve as a general guide on how to manage unwanted ODS
held by country governments. The workbook includes information on the following:
International agreements that govern the movement of ODS;
Guidance on how to develop an inventory of unwanted ODS;
Guidelines for proper handling of unwanted ODS; and
An overview of the project assessment and development process, including strategies for
engaging the public and/or private sector in an ODS destruction project.
The Workbook on the Management of
Unwanted ODS was disseminated to the
Philippines DENR during the 33rd Open-Ended
Working Group (OEWG) of the Parties to the
Montreal Protocol held in Bangkok in June 2013
for review by the government. Additional
conversations and meetings involving the World
Bank, ICF, and DENR have since taken place to
ensure a common understanding of the
workbook’s content and the tasks at hand.
Local consultants have also been engaged to
allow for continued support for the country
governments (i.e., support beyond ICF’s
contract with the World Bank).
To inform this report, an overview of relevant
domestic regulations in the Philippines is
provided in the version of the workbook
presented in Appendix A. DENR is expected to review and further populate the workbook with detailed
country-specific information. In addition, DENR is expected to take the time to understand the systems
that must be put in place to properly handle unwanted ODS, and to identify possible improvements to
their national systems and regulations. Ensuring that these systems are in place now is critical for
preventing the venting of these chemicals and ensuring eligibility under various carbon markets not only
today, but also in the future as more ODS (and possibly other harmful chemicals) are phased out of the
global market. Further discussion on implementation of a long-term approach to the management of
ODS and other F-gases is found in section 6.2 of this report.
Overview of Filipino ODS Regulations
Republic Act #6969, known as the "Toxic Substances and Hazardous and Nuclear Wastes Control Act of 1990" regulates, restricts, or prohibits the importation, manufacture, processing, sale, distribution, use, and disposal of chemical substances and mixtures that present unreasonable risk and/or injury to health or the environment, including ODS.
Under the Chemical Control Order (CCO) for Ozone Depleting Substances, DENR established import controls and a phase-out schedule for all substances listed under Annex A, Annex B, and Annex C of the Montreal Protocol.

Establishment of a Private-Public Financing System for Disposal of ODS for the Philippines
ICF International 7 February 2014
3.2. Overview of ODS Destruction Technologies
In addition to properly managing ODS, feasible options for the disposal of ODS should also be explored.
Currently, there is no local capacity for ODS destruction in the Philippines. As such, the Philippines
government may want to explore technical options for building local capacity to further increase future
opportunities for ODS destruction. In 2002, TEAP identified a variety of technologies that can be used to
destroy ODS, as outlined below:
Incineration technologies use a controlled flame to destroy ODS in an engineered device.
Common technical options, such as rotary kilns and cement kilns, use hydrocarbon fuels, while
reactor cracking is fuelled by hydrogen. Incineration technologies are commonly used worldwide
and offer high destruction capacity at a relatively low operating cost.
Plasma technologies use intense heat from plasma to destroy ODS. Specific technical options
are differentiated according to the method of plasma generation. Some have the advantage of
being compact and portable, yet require a significant amount of energy to operate as well as
trained technicians to service and maintain the equipment.
Other non-incineration technologies destroy ODS without using incineration or plasma-based
techniques. Some of these techniques, such as solvated electron decomposition, operate at
relatively low temperatures and use chemical processes to destroy the material. Those that
operate at high temperatures, including superheated steam reactors, use hydrogen or hydration
to break apart the ODS molecules.
See the report of the TEAP (2002)3 and ICF (2009)4 for detailed information on technology options.
4. Financing Options for Destroying Unwanted ODS The ability to finance the destruction of ODS through the voluntary carbon market is based on two key
factors: (1) the availability of a basic market structure to support ODS destruction, and (2) sufficient
demand in the market for carbon credits from ODS destruction projects (ICF 2010). While the market
structure is known to exist—through both the voluntary and compliance carbon markets—the demand
for carbon credits from ODS destruction projects remains uncertain. In addition, due to the criteria
established for market-specific offset programs, not all markets currently allow for the inclusion of
carbon credits generated from the destruction of ODS sourced internationally. The remainder of this
section explores the feasibility of generating ODS destruction carbon credits from existing and
anticipated carbon markets, and the implications for financing ODS destruction in the Philippines.
3 Available at: http://ozone.unep.org/Assessment_Panels/TEAP/Reports/Other_Task_Force/TEAP02V3b.pdf.
4 Available at: http://ozone.unep.org/Data_Reporting/USA-Decision-XX-7-ODS-Destruction.pdf.

Establishment of a Private-Public Financing System for Disposal of ODS for the Philippines
ICF International 8 February 2014
4.1. Available Markets for ODS Destruction Credits
Although a number of voluntary and compliance carbon markets exist, only some allow for the
generation of carbon credits from the destruction of ODS and even fewer allow for the generation of
carbon credits from the destruction of ODS sourced from the Philippines. Currently, ODS destruction
projects are not eligible for offset credits under the Kyoto Protocol or its flexibility mechanisms (i.e., the
Clean Development Mechanism). ODS destruction projects with material sourced outside the United
States or Canada are also not eligible for offset credits under California’s or Quebec’s compliance
programs.
The existing international platforms that are available to finance the destruction of ODS from Article 5
countries include the Climate Action Reserve (the Reserve) and the Verified Carbon Standard (VCS). In
addition, national carbon markets have been or are currently being established in a number of Article 5
countries throughout the world as a result of the Partnership for Market Readiness (PMR) program, and
ODS offsets may be eligible in these national markets. The opportunity to use these existing and
anticipated frameworks to finance the destruction of ODS is discussed below.
ODS Destruction Projects: 2012 Market Share
In 2012, there was a notable market for ODS destruction projects, as shown in Figure 1. While
ODS destruction credits represented roughly 7% of all offset credits generated globally in 2012,
the majority of these projects were aimed at U.S. preparations for the California cap-and-trade
compliance market, which require the ODS to be sourced from within the United States.
Figure 1: Market Share by Project Type, 2012
Source: Ecosystem Marketplace (2013)
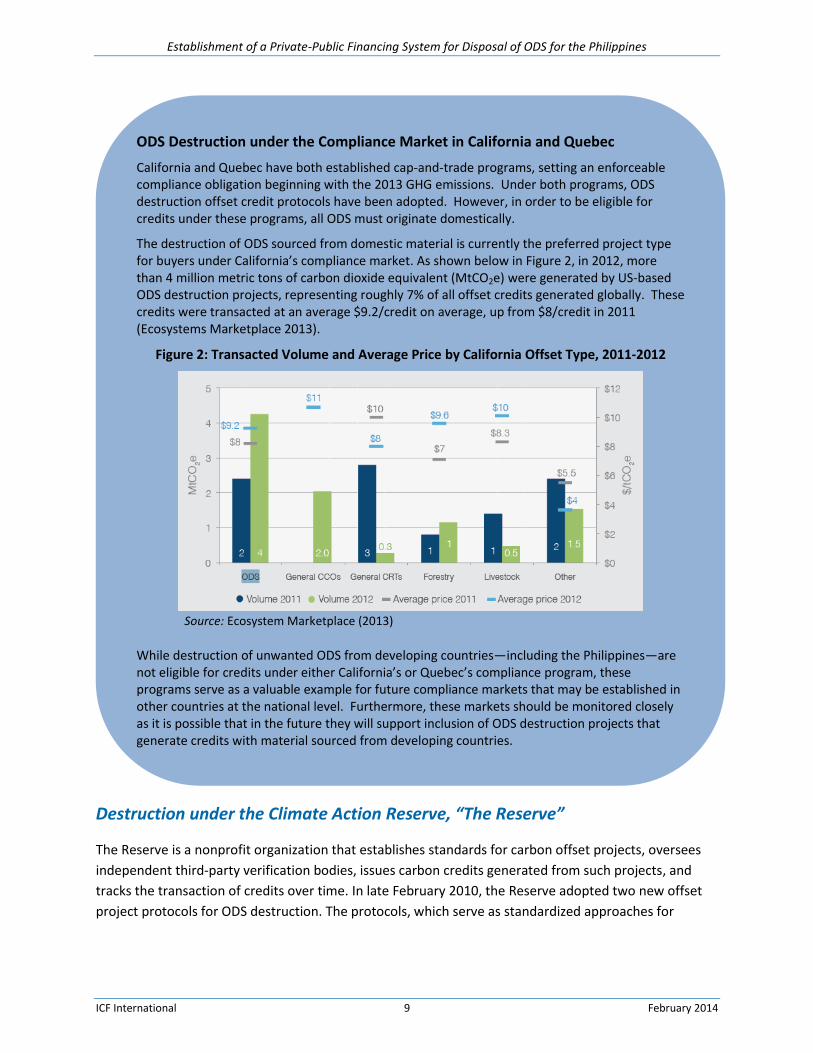
Establishment of a Private-Public Financing System for Disposal of ODS for the Philippines
ICF International 9 February 2014
Destruction under the Climate Action Reserve, “The Reserve”
The Reserve is a nonprofit organization that establishes standards for carbon offset projects, oversees
independent third-party verification bodies, issues carbon credits generated from such projects, and
tracks the transaction of credits over time. In late February 2010, the Reserve adopted two new offset
project protocols for ODS destruction. The protocols, which serve as standardized approaches for
ODS Destruction under the Compliance Market in California and Quebec
California and Quebec have both established cap-and-trade programs, setting an enforceable compliance obligation beginning with the 2013 GHG emissions. Under both programs, ODS destruction offset credit protocols have been adopted. However, in order to be eligible for credits under these programs, all ODS must originate domestically.
The destruction of ODS sourced from domestic material is currently the preferred project type for buyers under California’s compliance market. As shown below in Figure 2, in 2012, more than 4 million metric tons of carbon dioxide equivalent (MtCO2e) were generated by US-based ODS destruction projects, representing roughly 7% of all offset credits generated globally. These credits were transacted at an average $9.2/credit on average, up from $8/credit in 2011 (Ecosystems Marketplace 2013).
Figure 2: Transacted Volume and Average Price by California Offset Type, 2011-2012
Source: Ecosystem Marketplace (2013)
While destruction of unwanted ODS from developing countries—including the Philippines—are not eligible for credits under either California’s or Quebec’s compliance program, these programs serve as a valuable example for future compliance markets that may be established in other countries at the national level. Furthermore, these markets should be monitored closely as it is possible that in the future they will support inclusion of ODS destruction projects that generate credits with material sourced from developing countries.

Establishment of a Private-Public Financing System for Disposal of ODS for the Philippines
ICF International 10 February 2014
quantifying and monitoring reductions in GHG emissions from ODS destruction projects, are for material
sourced domestically and for ODS imported into the United States from Article 5 countries.
Per the latter protocol, material that resides in the Philippines can be destroyed for carbon credits under
the Reserve; however, some limitations do exist. Specifically, only Annex A, Group I CFCs (i.e., CFC-11,
CFC-12, CFC-113, CFC-114, and CFC-115) used in refrigeration applications are eligible for crediting
under the protocol. In addition, material must be destroyed within the United States or its territories,
and come from one of the following sources:
1. Privately held stockpiles of used ODS refrigerant that can legally be sold to the market;
2. Article 5 government stockpiles of seized ODS refrigerant that can legally be sold to the market;
3. Article 5 government stockpiles of seized ODS that cannot be legally sold to the market; or
4. Used ODS refrigerant recovered from industrial, commercial, or residential equipment at
servicing or end-of-life.
In total, there have been 34 ODS destruction projects registered under the Reserve, five of which used
the Article 5 protocol. Three of these projects (i.e., CAR596, CAR597, and CAR 691) involved virgin
private stockpiles of CFC-12, one project (i.e., CAR826) involved mixed CFC-12 sourced from end-of-life
appliances, and the most recent project (i.e., CAR955) involved virgin, government stockpiles of CFC-12
that were seized from an illegal import. A summary of these projects are provided below in Table 2.
Table 2: Article 5 ODS Destruction Projects Registered under the Reserve
Project ID Project Developer Source Country Credits
Registered Date Registered
CAR596 Coolgas, Inc. India 683,087 5/12/2010
CAR597 Coolgas, Inc. India 551,802 10/22/2010
CAR691 Reclamation Technologies Inc. Mexico 2,602,812 6/21/2011
CAR826 OEKO Service Luxembourg S.A. Mexico 89,834 6/7/2012
CAR955 EOS Climate Inc. Nepal 82,391 5/24/2013
Source: Climate Action Reserve (2013).
In addition to the projects that have already been registered, the Multilateral Fund (MLF) has recently
approved several projects that intend to utilize the A5 destruction protocol under the Reserve. For
example, in Mexico with assistance from UNIDO, MLF financing is being used to finance the destruction
of CFC-12 collected from refrigerator de-manufacturing processes. The revenue from the credits, if
generated and sold, will be used to start a self-sustaining ODS waste management system, with annual
revenue from the credits being fed back into the waste management system. Similarly, in Nigeria with
assistance from UNIDO, MLF funding will be used to finance ODS destruction projects, with the potential
revenue from the credits being used to establish a national Appliance Replacement Programme that
incentivizes recycling. A portion of the anticipated profit may also be used to improve local capacity for
ODS waste management. As another example, in Turkey with assistance from UNIDO, revenue from the
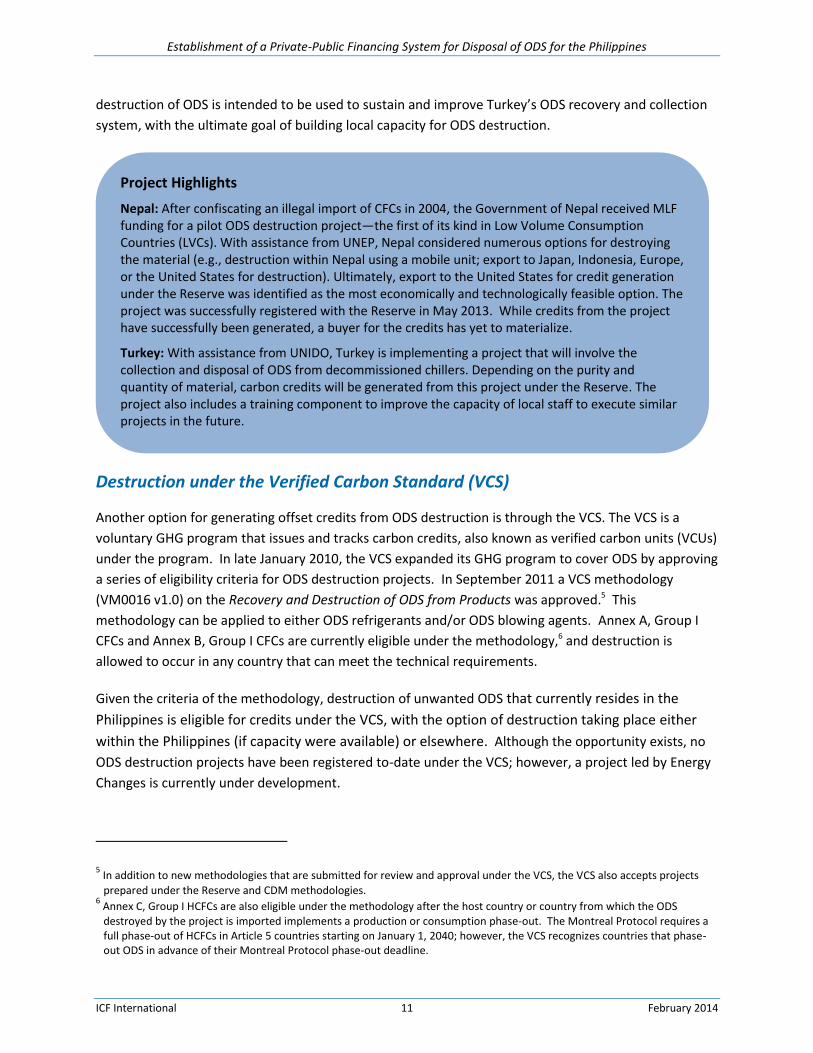
Establishment of a Private-Public Financing System for Disposal of ODS for the Philippines
ICF International 11 February 2014
destruction of ODS is intended to be used to sustain and improve Turkey’s ODS recovery and collection
system, with the ultimate goal of building local capacity for ODS destruction.
Destruction under the Verified Carbon Standard (VCS)
Another option for generating offset credits from ODS destruction is through the VCS. The VCS is a
voluntary GHG program that issues and tracks carbon credits, also known as verified carbon units (VCUs)
under the program. In late January 2010, the VCS expanded its GHG program to cover ODS by approving
a series of eligibility criteria for ODS destruction projects. In September 2011 a VCS methodology
(VM0016 v1.0) on the Recovery and Destruction of ODS from Products was approved.5 This
methodology can be applied to either ODS refrigerants and/or ODS blowing agents. Annex A, Group I
CFCs and Annex B, Group I CFCs are currently eligible under the methodology,6 and destruction is
allowed to occur in any country that can meet the technical requirements.
Given the criteria of the methodology, destruction of unwanted ODS that currently resides in the
Philippines is eligible for credits under the VCS, with the option of destruction taking place either
within the Philippines (if capacity were available) or elsewhere. Although the opportunity exists, no
ODS destruction projects have been registered to-date under the VCS; however, a project led by Energy
Changes is currently under development.
5 In addition to new methodologies that are submitted for review and approval under the VCS, the VCS also accepts projects
prepared under the Reserve and CDM methodologies. 6 Annex C, Group I HCFCs are also eligible under the methodology after the host country or country from which the ODS destroyed by the project is imported implements a production or consumption phase-out. The Montreal Protocol requires a full phase-out of HCFCs in Article 5 countries starting on January 1, 2040; however, the VCS recognizes countries that phase-out ODS in advance of their Montreal Protocol phase-out deadline.
Project Highlights
Nepal: After confiscating an illegal import of CFCs in 2004, the Government of Nepal received MLF funding for a pilot ODS destruction project—the first of its kind in Low Volume Consumption Countries (LVCs). With assistance from UNEP, Nepal considered numerous options for destroying the material (e.g., destruction within Nepal using a mobile unit; export to Japan, Indonesia, Europe, or the United States for destruction). Ultimately, export to the United States for credit generation under the Reserve was identified as the most economically and technologically feasible option. The project was successfully registered with the Reserve in May 2013. While credits from the project have successfully been generated, a buyer for the credits has yet to materialize.
Turkey: With assistance from UNIDO, Turkey is implementing a project that will involve the collection and disposal of ODS from decommissioned chillers. Depending on the purity and quantity of material, carbon credits will be generated from this project under the Reserve. The project also includes a training component to improve the capacity of local staff to execute similar projects in the future.

Establishment of a Private-Public Financing System for Disposal of ODS for the Philippines
ICF International 12 February 2014
Destruction under National Carbon Markets
One possible alternative approach to the voluntary carbon market is to use initiatives that rely on
national carbon markets. Under this approach, baselines for certain industries are established as
country governments move towards establishing mandatory reductions for individual entities in select
industrial sectors. The Partnership for Market Readiness (PMR)—a grant-based program that provides
funding and technical assistance for the collective innovation and piloting of market-based instruments
for GHG emissions reduction—is currently being used to help develop such initiatives, providing
opportunity for companies to use ODS offset projects to meet reduction targets.
The PMR is currently made up of 13 Contributing Participants and 16 Implementing Country
Participants. As of March 2013, all 16 Implementing Country Participants have received preparation
funding to formulate a Market Readiness Proposal (MRP) while four countries have also received
implementation phase funding.7 The current Implementing Country Participants are listed below:
Brazil Costa Rica Mexico Thailand
Chile India Morocco Turkey
China Indonesia Peru Ukraine
Columbia Jordan South Africa Vietnam
4.2. Cost Considerations
One of the most important considerations in determining which ODS destruction platform is appropriate
is a comparison between the cost to implement the destruction project and the potential revenue.
Responsibilities for bearing project-related costs and accruing revenues will depend on the
arrangements for public-private financing made by government agencies in possession of unwanted
ODS. More information on these options, which include contracting out, facilitation, and serving as the
project developer, is provided in Appendix A.
The overall costs associated with implementing an ODS destruction project may include the costs of
collection and/or recovery, transportation, storage, testing, and destruction, in addition to one-time
project-related costs, such as project preparation, validation, verification, and registration and issuance
fees. The specific cost components will depend on the source of the ODS being destroyed; for example,
stockpiled materials have the lowest associated costs since the material is already recovered and stored,
while collecting and recovering ODS from equipment—especially in sparsely populated areas—presents
higher costs associated with segregation, collection, and in some cases transport of the equipment itself
(e.g., household appliances) for ODS recovery in a centralized location.
As requested by Decision XX/7, the Technology and Economic Assessment Panel (TEAP) developed
estimates of the full costs of ODS disposal from collection to destruction. For stockpiled material (where
7 Although not currently a participant, there is opportunity for the Philippines to become a PMR participant in the future.

Establishment of a Private-Public Financing System for Disposal of ODS for the Philippines
ICF International 13 February 2014
collection costs are not applicable), the total cost from processing to destruction is estimated at
US$5.10–7.60 per kilogram. This is slightly less than an estimate from one ODS destruction project
developer of US$9 per kilogram, which includes US$1/kg for transportation (and associated insurance)
and US$8/kg for destruction. The higher estimate for transportation costs likely include costs incurred
during the export of the ODS, which is not accounted for in the TEAP estimates.
Table 3: Unit Cost for Destruction of ODS from Stockpiles and Chillers
Recovery and Destruction Steps US$ per kg
Sources Stockpiles Chillers
Segregation/Collection+ -- $0–$2 TEAP 2009
Recovery Processing Costs $4–$25 $4–$25 TEAP 2009
Transport Costs (Destruction)* $0.02–$0.10 $0.02–$0.10 Adjusted, based on TEAP 2009
Destruction Costs $2.20 $2.20 MLF 2008
Total $6.22–$27.30 $6.22–$29.30 +Segregation and collection costs are not included
* Transport costs for recovery are factored into the transport costs for destruction. This assessment estimates that ODS travels approximately 50 miles (80.5 km) to a destruction facility.
In addition to the costs associated with collecting, recovering, transporting, and destroying the ODS,
there are costs associated with preparing, verifying, and registering the project with a carbon credit
platform. These costs may vary significantly depending on the platform chosen (e.g., the Reserve, VCS,
or a national carbon market), as well as the project preparation arrangements. For example, if the
country government serves directly as the project developer, it may incur costs to hire consultants to
prepare project documentation; alternatively, if the project is contracted out to a developer, that
developer may have in-house capabilities and thus lower costs for preparation. Table 4 presents the
estimated range of project costs for ODS destruction.
Table 4: One Time Project Costs for Destruction of ODS
Activity Cost (US$) Sources
Project Preparation* Up to $60,000, but could be substantially less for a national market or if developed in-house
ICF estimate, see MLF 2009
Verification Estimates vary from a fixed cost of $20,000, to
$0.10–$0.30 per credit ICF estimate, see MLF 2009; ODS project developer
Registry Annual and Project Fees
Reserve fees are $500 each for annual and project fees; VCS fees are subject to the
registry operator; national carbon market fees are currently undetermined
The Reserve 2013b; VCS 2013
Issuance Fee (per tCO2e) $0.10–$0.20 The Reserve 2013c; VCS 2013
*Includes consultant cost to prepare project documentation and support verification/registration.

Establishment of a Private-Public Financing System for Disposal of ODS for the Philippines
ICF International 14 February 2014
The market price per ton of ODS destroyed (or ton of carbon equivalent) plays a significant role in the
choice of platform, as the market price determines whether the destruction of ODS is a financially viable
solution. Assuming the per-kg and one-time cost estimates for an ODS destruction project outlined in
Table 3 and Table 4, respectively, the break-even carbon market price needed for destruction of 1, 10,
100, and 1,000 tonnes of CFC-12 was determined, as shown in Table 5. Carbon credits generated were
calculated using the Reserve methodology with default estimates for emissions associated with
substitute, transportation and destruction emissions (Reserve 2012). In this table, the break-even cost
represents the price that would have to be generated in the carbon market in order to cover full project
transaction and recovery, transport, and destruction costs. For the destruction project to turn a profit,
the carbon market price would have to exceed the break-even price.
Table 5: Estimated Break-even Carbon Market Price for ODS Stockpiles
Project Size (Including Recovery) Total Project Cost
(thousands of US$)* Carbon Credits
Generated (tCO2e)
Break-even Carbon Market Price (US$/tCO2e)
1 tonne CFC-12 destroyed $84 10,239 $8.23
10 tonnes CFC-12 destroyed $249 102,385 $2.43
100 tonnes CFC-12 destroyed $1,896 1,023,850 $1.85
1,000 tonnes CFC-12 destroyed $18,400 10,238,500 $1.79 *Includes average costs of recovery, transport and destruction, plus average of one-time project development costs. These costs are based on those developed by TEAP, but could be higher or lower depending on the local costs of recovery, transport, and destruction.
4.3. Current Voluntary Market Prices
Prices in the voluntary market have traditionally varied considerably depending on the type and location
of the project activity, the standard to which it is developed, the perceived quality of the methodology
used, and the volume transacted. This remains the case today, with credits from projects with a good
“story” behind them, such as solar and other types of renewable energy, still able to command a
premium. Industrial gases projects have typically earned prices on the lower end of the spectrum, when
compared to solar, wind, and forestry projects. With this in mind, the current average price per carbon
credit under the VCS and the Reserve are shown below in Table 6.
Table 6: Average Carbon Credit Prices under Relevant Frameworks
Voluntary Market Cost in 2012 (US$/tCO2e)
Cost All Years (US$/tCO2e)
VCS $5.20 $5.00
Reserve $7.10 $6.90 Source: Ecosystem Marketplace (2013)
Based on stakeholder input, it is estimated that the price of an A5 ODS destruction carbon credit sold on
the market today could vary from US$0.50 to US$3.50 per tCO2e. As already noted, the actual price of
an A5 ODS destruction carbon credit will vary depending on a variety of factors, and can be influenced
by generating demand and interest in these types of projects.
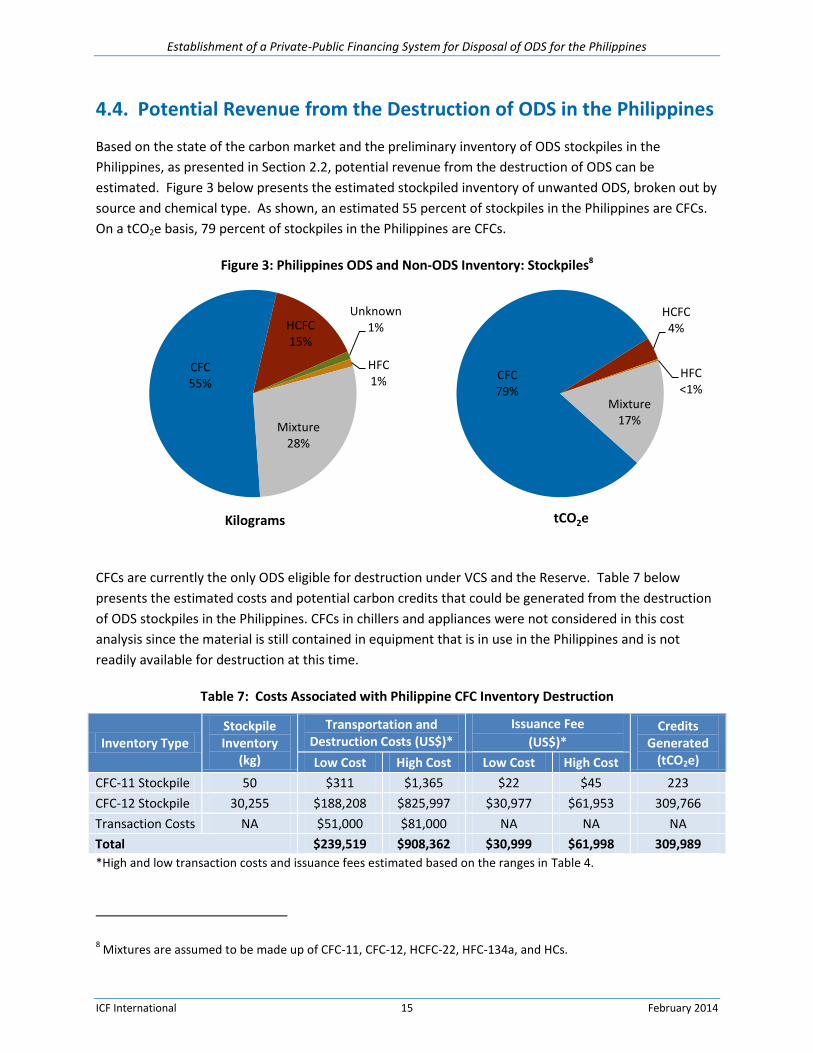
Establishment of a Private-Public Financing System for Disposal of ODS for the Philippines
ICF International 15 February 2014
4.4. Potential Revenue from the Destruction of ODS in the Philippines
Based on the state of the carbon market and the preliminary inventory of ODS stockpiles in the
Philippines, as presented in Section 2.2, potential revenue from the destruction of ODS can be
estimated. Figure 3 below presents the estimated stockpiled inventory of unwanted ODS, broken out by
source and chemical type. As shown, an estimated 55 percent of stockpiles in the Philippines are CFCs.
On a tCO2e basis, 79 percent of stockpiles in the Philippines are CFCs.
Figure 3: Philippines ODS and Non-ODS Inventory: Stockpiles8
CFCs are currently the only ODS eligible for destruction under VCS and the Reserve. Table 7 below
presents the estimated costs and potential carbon credits that could be generated from the destruction
of ODS stockpiles in the Philippines. CFCs in chillers and appliances were not considered in this cost
analysis since the material is still contained in equipment that is in use in the Philippines and is not
readily available for destruction at this time.
Table 7: Costs Associated with Philippine CFC Inventory Destruction
Inventory Type Stockpile Inventory
(kg)
Transportation and Destruction Costs (US$)*
Issuance Fee
(US$)* Credits
Generated (tCO2e) Low Cost High Cost Low Cost High Cost
CFC-11 Stockpile 50 $311 $1,365 $22 $45 223
CFC-12 Stockpile 30,255 $188,208 $825,997 $30,977 $61,953 309,766
Transaction Costs NA $51,000 $81,000 NA NA NA
Total $239,519 $908,362 $30,999 $61,998 309,989
*High and low transaction costs and issuance fees estimated based on the ranges in Table 4.
8 Mixtures are assumed to be made up of CFC-11, CFC-12, HCFC-22, HFC-134a, and HCs.
CFC 55%
HCFC 15%
Unknown 1%
HFC 1%
Mixture 28%
Kilograms
CFC 79%
HCFC 4%
HFC <1%
Mixture 17%
tCO2e

Establishment of a Private-Public Financing System for Disposal of ODS for the Philippines
ICF International 16 February 2014
Based on the costs presented in Table 7 above, the break-even costs for the Philippine CFC destruction
project were determined, as illustrated in Figure 4. As shown, the break-even cost for the “low cost”
destruction scenario is US$0.87/tCO2e and the break-even cost for the “high cost” destruction scenario
is US$3.13/tCO2e. Depending on the realized carbon market prices for an Article 5 ODS destruction
project under the VCS and the Reserve—which, based on stakeholder input, could potentially be as low
as US$0.50/tCO2e or as high as US$3.50/tCO2e—the destruction of the Philippines’ CFC-11 and CFC-12
stockpiles could result in a positive return.
Figure 4: Break-even price for Philippine CFC Destruction Project
5. Evaluation of Options for the Philippines As discussed in the preceding sections of this report, the platforms that are currently available to finance
the destruction of ODS from Article 5 countries include the Reserve, VCS, and national carbon markets.
Evaluation criteria were used to assess the viability of using each option to finance the immediate
destruction of stockpiled ODS sourced from the Philippines. The table in Appendix B summarizes the
evaluation criteria used for this assessment as well as the importance of meeting each criterion relative
to the financing options.
As highlighted in the text box on page 2, the assessment presented below focuses on Phase I of a long
term approach for the recovery, collection, and management of ODS in the Philippines. The logic flow
for determining the viability of each option for financing destruction of ODS sourced from the
Philippines is described. The approach identified here is also relevant when considering options for
destruction of material in the future (i.e., when implementing Phase II and Phase III).
$-
$0.50
$1.00
$1.50
$2.00
$2.50
$3.00
$3.50
Low Cost High Cost
US$
/tC
O2e

Establishment of a Private-Public Financing System for Disposal of ODS for the Philippines
ICF International 17 February 2014
National Carbon Market:
The Philippines is not a participant in the PMR program.
The Philippines government is not actively in the process of establishing a national carbon
market under which ODS destruction credits could be used.
A national carbon market is not a viable financing option for destroying ODS in the Philippines.
Verified Carbon Standard:
The average credit price under the VCS is currently high enough to cover projected project costs;
this average price is lower than the average credit price under the Reserve.
Some project developers have voiced interest in developing a project under the VCS, but no A5
ODS destruction projects have been registered under the VCS to-date.
No national capacity for ODS destruction currently exists in the Philippines.
Regional capacity does exist (i.e., at a Holcim Plant in Indonesia), but it is unclear whether the
destruction and removal efficiency of this facility meets the VCS standard.
There are no national regulations that limit the export of ODS to other countries with
destruction capacity.
It is feasible to finance the destruction of ODS from the Philippines under the VCS.
The Reserve:
The average credit price under the Reserve is currently high enough to cover projected project
costs, with the average price being higher than the average credit price under the VCS.
There are no national regulations that limit the export of ODS to the United States.
A5 ODS destruction projects have been successfully registered under the Reserve
Project developers have shown interest in developing additional projects under the Reserve.
It is feasible to finance the destruction of ODS from the Philippines under the Reserve.
Based on the assessment presented above, the viability of each financing option is summarized below in
Table 8. As shown, it is technically feasible to finance the destruction of ODS under both the VCS and
the Reserve. Actual financing viability, however, is reliant on real-time market demands and the realized
market price of the generated carbon credits. Additionally, other factors, such as project developer
experience and capacity for destruction may influence which option is ultimately pursued.
Table 8: Viability of Financing Options for the Philippines
Financing Option Viability
National carbon market Not Feasible
VCS Feasible
The Reserve Feasible

Establishment of a Private-Public Financing System for Disposal of ODS for the Philippines
ICF International 18 February 2014
6. Next Steps for Implementation ODS management is a multi-phased, long-term process. As the focus of this report, the following section
presents near-term next steps for the Philippines to successfully destroy their existing stockpiles of ODS.
While the current and future market demand for Article 5 ODS destruction credits remains uncertain,
the following steps should still be followed to ensure the destruction of the unwanted ODS is carried out
in compliance with the technologies, performance parameters, and emissions requirements identified
by the Technology and Economic Assessment Panel (TEAP) of the Montreal Protocol.
Following the discussion on near-term next steps, other next steps to plan for the implementation of
Phase II and Phase III of this long-term approach to ODS management are presented. These next steps
involve establishing a system for the long-term recovery, collection, and management of ODS that is
confiscated in the future, originates from servicing operations, or recovered from large and small
refrigeration and air conditioning equipment when that equipment is retired.
6.1. Implementation of Phase I: Near-Term Next Steps
A number of steps must be undertaken by the Philippines government to ensure that their existing
stockpiles of ODS are successfully destroyed in the immediate future. While it is not required that the
Philippines contract out project development responsibilities (as outlined in Section 5.2 of Appendix A),
there are many benefits to hiring an experienced project developer to execute the project. With this in
mind, recommended next steps for implementation include (1) identification of project financing, (2)
identification and onboarding of a project developer, and (3) project execution. As an optional last step,
(4) third party validation and project registration may also be undertaken.
Step 1: Identification of Project Financing
Upfront financing will be required to execute the destruction project regardless of the potential for
revenue via the voluntary carbon market. As summarized below, several financing options are available
to support project development and execution.
Multilateral or Donor Financing: Carbon funds and donor programmes that are supported by
multilateral institutions and/or country governments provide one possible source of up-front
financing for offset projects. Specific funds or donors that may be willing to provide up-front
financing include the Multilateral Fund (MLF), Global Environment Fund (GEF) and European
Commission (EC).
Private Sector Financing: Private sector developers or private carbon funds provide another possible
source of financing for offset projects. If this financing source is used, financing would likely be
provided on commercial terms. It is additionally possible that a private firm would be interested in
providing equity financing, whereby they provide upfront costs for an equity stake in the project. In
this scenario, there would be no requirement to pay back funds if the project does not generate
credits and/or revenue.

Establishment of a Private-Public Financing System for Disposal of ODS for the Philippines
ICF International 19 February 2014
Debt Financing: As a final financing option, a bank can provide debt financing in the form of a loan.
In this case, the loan would need to be repaid within a fixed amount of time.
Due to the current lack of demand for A5 ODS destruction credits, certain financing sources are more
likely to materialize than others. Specifically, it is highly unlikely that either a bank or the private sector
will be willing to finance an A5 ODS destruction project at this time. Rather, financing sources that do
not require revenue from credit generation for repayment are seen as the best path forward.
Step 2: Identification of Project Developer
Regardless of the financing structure selected, the Philippines will need to identify and onboard a
project developer. There are a number of project developers who have experience developing A5 ODS
destruction projects who have voiced interest in developing new projects, if approached. In addition,
other experienced project developers who do not have direct experience with A5 ODS destruction
projects have also expressed some interest in developing A5 ODS destruction projects. A list of potential
project developers is provided in Appendix C.
The procurement process to contract a project developer from the private sector must be undertaken in
accordance with national rules and regulations, but generally involves the (a) preparation and release of
a request for an Expression of Interest (EOI) to potential project developers; (b) selection of a short-list
of qualified candidates from those submitting EOIs; (c) preparation and release a Terms of Reference
(ToR) to the short-listed candidates; and (d) selection and contract establishment with the chosen
company. This process is outlined further below.
Upfront Buyers and Forward Crediting
Although it is currently assumed that no market demand for carbon credits generated from A5 ODS destruction projects exists, if a buyer of the credits was identified upfront and agreed to purchase the credits ex-ante—known as forward crediting—the buyer could serve as the project financer. Under this scenario, the buyer agrees to purchase a certain number of credits that have yet to be generated. In exchange for the upfront payment, the seller provides a certificate confirming the purchase. If the project under-delivers, the seller is not obligated to compensate the purchaser for the delivery shortfall, unless required to by contract.
Unfortunately, it is anticipated that identification of a buyer for A5 ODS destruction credits (upfront or after credit registration) will be a difficult task since destruction projects are generally not viewed as attractive projects. Brokers are available to assist in prearranging a buyer, and may also keep registries of potentially interested buyers. Furthermore, brokers may undertake targeted outreach to secure an interested buyer. Organizations such as the World Bank, other multi-lateral institutions, and private sector entities looking to offset their emissions to become carbon neutral could also be interested in purchasing offsets from A5 ODS destruction projects, and their actions may help stimulate market demand by casting these projects in the positive light they deserve.

Establishment of a Private-Public Financing System for Disposal of ODS for the Philippines
ICF International 20 February 2014
Preparation and release of a request for an EOI - The request for EOIs should include brief
background on ODS destruction, a short description of the ODS stockpiles held by the
Government of the Philippines and the expected role of the project developer, and a request for
interested companies to submit information related to their company qualifications, experience
managing ODS destruction projects, and proposed personnel.
Selection of a short-list of qualified candidates - After the EOIs have been received, the
Government should select a short-list of candidates by applying pre-determined evaluation
criteria and/or a ranking process that aligns with national procurement rules. These criteria
might include relevant experience managing ODS destruction projects, experience working in
the Philippines, and key staff qualifications.
Preparation and release of ToR – The ToR should elaborate on the EOI, providing additional
detail on the ODS stockpiles held, and requesting interested companies to submit a work plan
explaining how they intend to approach the project, a project schedule, a proposal for
ownership of the resulting carbon credits, and a financial proposal. The criteria for evaluating
and selecting a successful proposal should also be provided; these may be similar to those
utilized in the EOI stage, with an additional criterion related to the financials. A question-and-
answer period might be useful to ensure that project developers have the information they
need to prepare realistic proposals. An example ToR is provided in Appendix D.
Selection of company - After the proposals have been received, the Government should select
the successful candidate based on the pre-determined evaluation criteria.
Step 3: Project Execution
Once the project developer has been selected and on-boarded, they will be responsible for executing
the project, with oversight from the Philippines government. As a first step in the development process,
the project developer will need to facilitate the testing of the stockpiled material. While the preliminary
inventory compiled for this report serves as an indicator of what is likely to be available in the
Philippines for immediate destruction, testing of the material, which should be undertaken in
accordance with the management procedures described in Appendix A, is still needed to verify the
quantity of stockpiled ODS and potential for credit generation. In addition to inventory verification, the
project developer will also be responsible for arranging transportation and destruction of the material.
Such activities may require cooperation from Customs or other in-country organizations.
Step 4: Project Validation and Registration (Optional)
As an additional option, third party validation and project registration may be undertaken as an integral
part of project development and execution. These steps, which are described in Appendix A, are only
necessary if the Philippines and/or the project developer wish to generate carbon credits from the
project. While no demand for credits is known to exist today, this may change in the future, making
project validation and registration a valuable and worthwhile undertaking.
Establishment of a Private-Public Financing System for Disposal of ODS for the Philippines
ICF International 21 February 2014
6.2. Implementation of Phase II and Phase III
Beyond the near-term destruction of ODS stockpiles that are currently in their possession, the
Philippines government should also plan for the future management of unwanted ODS. As discussed
previously, in addition to the future stream of confiscated stockpiles and mixed refrigerant coming from
service industries, there is opportunity to collect ODS from chillers and other refrigerated appliances at
end-of-life. Establishing processes now to collect, track, and destroy ODS from these sources will not
only prevent harmful venting of these gases to the atmosphere, but will also maximize potential
revenue from future destruction projects.
As laid out in this report, the feasibility of financing the destruction of ODS is dependent on the state of
the carbon market, which is constantly evolving. New platforms or markets may become available in the
future for A5 ODS destruction projects. Additionally, the demand for and price of carbon credits from
destruction projects is also likely to increase, making ODS destruction projects less risky and more
profitable. Furthermore, opportunity to generate credits from the destruction of other high-GWP
greenhouse gases (e.g., HCFCs and HFCs), which are currently not eligible under existing offset
protocols, is also expected.
In short, while there are a number of variables that will affect the cost and profitability of ODS
destruction in the future, by developing systems now to recover, collect, track, and store ODS from all
sources, the Philippines government will be well-positioned to capitalize on future opportunities.

Establishment of a Private-Public Financing System for Disposal of ODS for the Philippines
ICF International 22 February 2014
7. References Air-Conditioning, Heating, and Refrigeration Institute (AHRI). 2009. Containers for Recovered Non-
Flammable Fluorocarbon Refrigerants. Available at:
http://www.ahrinet.org/App_Content/ahri/files/Guidelines/AHRI%20Guideline%20K-2009.pdf
Air-Conditioning, Heating, and Refrigeration Institute (AHRI). 2012. 2012 Guideline for Assignment of
Refrigerant Container Colors. Available at:
http://www.ahrinet.org/App_Content/ahri/files/Guidelines/AHRI%20Guideline%20N-2012.pdf
Climate Action Reserve. 2013a. Project Database. Available at:
https://thereserve2.apx.com/myModule/rpt/myrpt.asp?r=111.
Climate Action Reserve. 2013b. Frequently Asked Questions: Accounts on the Reserve. Available at:
http://www.climateactionreserve.org/resources/faqs/.
Climate Action Reserve. 2013c. Submit and Register a Project. Available at:
http://www.climateactionreserve.org/how/projects/register/.
Climate Action Reserve. 2012. Article 5 ODS Project Protocol, Version 2.0. June 27, 2012. Available at:
http://www.climateactionreserve.org/wp-
content/uploads/2010/02/A5_ODS_Project_Protocol_V2.0_Package_041113.pdf.
Ecosystem Marketplace. 2013. Maneuvering the Mosaic: State of the Voluntary Carbon Markets 2013.
ICF International. 2009. ODS Destruction in the United States of America and Beyond, prepared by ICF
International for the U.S. Environmental Protection Agency. May 2009. Available at:
http://ozone.unep.org/Data_Reporting/USA-Decision-XX-7-ODS-Destruction.pdf.
ICF International. 2010. Study on Financing the Destruction of Unwanted Ozone-Depleting Substances
through the Voluntary Carbon Market, prepared by ICF International for the World Bank. February 2012.
The Multilateral Fund (MLF). 2009. Study on Financing the Destruction of Unwanted Ozone-Depleting
Substances through the Voluntary Carbon Market, Draft Report. Prepared by ICF International for the
World Bank. September 2009. Available at:
http://www.multilateralfund.org/sites/59/Document%20Library2/1/59Inf2.pdf.
Partnership for Market Readiness. 2013. Pricing Carbon and Shaping the Next Generation of Carbon
Markets. Available at: https://www.thepmr.org/system/files/documents/PMR_brochure_web.pdf.
Partnership for Market Readiness. 2013. Indonesia. Available at:
http://www.thepmr.org/country/indonesia-0. Accessed October 14, 2013.
Establishment of a Private-Public Financing System for Disposal of ODS for the Philippines
ICF International 23 February 2014
Partnership for Market Readiness. 2013. Chairs’ Summary of the Sixth Meeting of the PMR Partnership
Assembly (PA6). May 27-28, 2013. Available at:
https://www.thepmr.org/system/files/documents/PA6_Chair's_Summary_0.pdf.
Republic of the Philippines, National Statistics Office. 2012. Household Population of the Philippines
Reaches 92.1 Million. August 30, 2012. Available at: http://www.census.gov.ph/content/household-
population-philippines-reaches-921-million.
Technology and Economic Assessment Panel (TEAP). 2002. Report of the Task Force on Destruction
Technologies. April 2002. Available at:
http://ozone.unep.org/Assessment_Panels/TEAP/Reports/Other_Task_Force/TEAP02V3b.pdf.
United Nations Environment Programme (UNEP). 2013. Report on Progress and Experiences gained in
Demonstration Projects for the Disposal of Unwanted ODS. UNEP/OzL.Pro/ExCom/70/54. June 5, 2013.
United Nations Environment Programme (UNEP). 2012a. Project Proposals: Turkey.
UNEP/OzL.Pro/ExCom/66/48. March 19, 2012.
United Nations Environment Programme (UNEP). 2012b. Project Proposals: Nigeria.
UNEP/OzL.Pro/ExCom/67/27. June 19, 2012.
United Nations Environment Programme (UNEP). 2011. Project Proposals: Mexico.
UNEP/OzL.Pro/ExCom/63/42. March 9, 2011.
Verified Carbon Standard (VCS). 2013. Program Fee Schedule, Version 3.4. Available at: http://www.v-c-
s.org/sites/v-c-s.org/files/Program%20Fee%20Schedule%2C%20v3.4.pdf.
Verified Carbon Standard (VCS). 2011. Recovery and Destruction of ODS from Products, Methodology
VM0016, Version 1.0. Available at: http://www.v-c-s.org/sites/v-c-
s.org/files/Final%20version%20of%20VM0016.pdf.
Establishment of a Private-Public Financing System for Disposal of ODS for the Philippines
ICF International A-1 February 2014
Appendix A. Workbook on the Management of Unwanted ODS in the Philippines
Table of Contents
1. Introduction to the Workbook ......................................................................................................2
2. Policy and Regulatory Context ......................................................................................................2 2.1. International Agreements Governing the Movement of ODS ...................................................... 2
The Basel Convention .................................................................................................................. 2 The OECD Decision C(2001)107/Final ......................................................................................... 3
2.2. Regional Agreements and National Regulations .......................................................................... 4 Import and Use Controls ............................................................................................................. 4 Registration Requirements ......................................................................................................... 4
3. National Inventory of Unwanted ODS ...........................................................................................5
4. Guidelines for Managing Unwanted ODS ......................................................................................7 4.1. Collection of ODS .......................................................................................................................... 7 4.2. Consolidation and Storage ............................................................................................................ 8 4.3. Transportation .............................................................................................................................. 8 4.4. Testing .......................................................................................................................................... 9 4.5. Destruction ................................................................................................................................. 10
5. Project Development ................................................................................................................. 10 5.1. Assessing the Financial Feasibility of an ODS Destruction Project ............................................. 10 5.2. Selecting a Strategy for Project Development ........................................................................... 12 5.3. Overview of the Project Development Process .......................................................................... 13

Establishment of a Private-Public Financing System for Disposal of ODS for the Philippines
ICF International A-2 February 2014
1. Introduction to the Workbook The Montreal Protocol on Substances that Deplete the Ozone Layer has been immensely effective at
reducing the production and consumption of ozone depleting substances (ODS) worldwide. While the
production and consumption of ODS has dramatically diminished, a large amount of ODS still remains in
equipment, products, and stockpiles held by country governments as well as industrial and commercial
users. Because emissions from ODS banks are not explicitly controlled by the Montreal Protocol, there
is significant risk that these ODS will be released to the atmosphere, contributing to both ozone
depletion and global climate change.
To prevent emissions of ODS banks, many options have been explored to provide incentives for the
destruction of unwanted material. The high global warming potential (GWP) of ODS means that their
destruction has the ability to generate significant volumes of carbon credits. Indeed, a study prepared
for the World Bank in 2010 found that a significant opportunity exists for financing the destruction of
ODS through the voluntary carbon market.9 To help countries operating under Article 5(1) of the
Montreal Protocol take advantage of this opportunity, this workbook was developed to serve as a
general guide on how to manage unwanted ODS held by country governments.
Specifically, this workbook begins with a summary of international agreements that govern the
movement of ODS; then provides guidance on how to develop an inventory of unwanted ODS; followed
by a description of guidelines for proper handling of unwanted ODS; and finally provides an overview of
the project assessment and development process, including strategies for engaging the public and/or
private sector in an ODS destruction project. This version of the workbook has been tailored to reflect
specific circumstances for the Philippines.
2. Policy and Regulatory Context
2.1. International Agreements Governing the Movement of ODS
There are several international agreements that affect the movement of unwanted ODS between
countries. These include the Basel Convention on the Control of Transboundary Movements of
Hazardous Wastes and Their Disposal, and the OECD Decision C(2001)107/Final on the Control of
Transboundary Movement of Wastes Destined for Recovery Operations. The basic provisions of these
agreements are described below.
The Basel Convention
Adopted in 1989 and brought into force in 1992, the Basel Convention on the Control of Transboundary
Movements of Hazardous Wastes and Their Disposal (the Basel Convention) was created to control the
9 ICF International. 2010. Study on Financing the Destruction of Unwanted Ozone-Depleting Substances through the Voluntary Carbon Market, prepared by ICF International for the World Bank. February 2012.

Establishment of a Private-Public Financing System for Disposal of ODS for the Philippines
ICF International A-3 February 2014
movement of hazardous waste between countries, particularly the transfer of hazardous waste from
developed to developing countries.10 Currently there are 180 Parties to the Convention.11
Under the Basel Convention, ODS are included in the definition of hazardous waste.12 As a result, any
transboundary movement of unwanted ODS for the purpose of destruction must comply with provisions
of the Convention. These provisions prohibit the shipment of hazardous wastes between Parties
without prior written consent from the proposed State of import. In addition, Parties may only
transport hazardous waste to/from non-party countries13 if they have entered into a bilateral,
multilateral, or regional agreement that provides for procedures that are as environmentally-sound as
those provided under the Convention.14
Parties to the Basel Convention must also ensure that hazardous and other wastes are managed and
disposed of in an environmentally-sound manner. To achieve this goal, Parties must minimize the
movement of hazardous waste across borders. Parties may only move hazardous wastes across borders
if the State exporting hazardous waste lacks the necessary facilities, capacity, or suitable disposal sites to
dispose the waste in an environmentally sound and efficient manner.
The OECD Decision C(2001)107/Final
In 2001, the Organisation for Economic Co-operation and Development (OECD) decided to regulate the
international movement of wastes through decision C(2001)107/Final. Under this OECD decision,
member countries can control transboundary movements of wastes destined for recovery operations,
and recovery facilities must recover wastes in an environmentally-sound manner, in accordance with
national regulations. CFCs and halons are subject to the Amber control procedure, which requires strict
documentation for transboundary movement of wastes throughout the entire process, starting with the
exporter and ending with the recovery facility. When transboundary movement or recovery operations
10
The Basel Convention on the Control of Transboundary Movements of Hazardous Wastes and their Disposal, Texts and Annexes, available at http://www.basel.int/Portals/4/Basel%20Convention/docs/text/BaselConventionText-e.pdf.
11 Secretariat of the Basel Convention (2013), Parties to the Basel Convention, accessed June 2013, available at http://www.basel.int/Countries/StatusofRatifications/PartiesSignatories/tabid/1290/Default.aspx.
12 ODS fall under the Convention’s categories Y41 (Halogenated organic solvents) and Y45 (Organohalogen compounds other
than substances referred to in the Annex). 13
Non-party countries include: Angola, Fiji, Grenada, Haiti, Myanmar, Sao Tome and Principe, Sierra Leone, Solomon Islands, South Sudan, Timor-Leste, Tuvalu, United States, and Vanuatu. Source:
http://www.basel.int/Countries/StatusofRatifications/PartiesSignatories/tabid/1290/Default.aspx. 14
Multilateral Fund (2006), Report of the Meeting of Experts to Assess the Extent of Current and Future Requirements for the Collection and Disposition of Non-Reusable and Unwanted ODS in Article 5 Countries (Follow up to Decision 47/52). 20 March 2006.
Establishment of a Private-Public Financing System for Disposal of ODS for the Philippines
ICF International A-4 February 2014
cannot be completed as planned, the exporter or importer must provide financial guarantees for the
environmentally-sound management of the wastes.15
2.2. Regional Agreements and National Regulations
In addition to the international agreements described above, regional agreements and national
regulations govern the movement of ODS. As a signatory of the Montreal Protocol, the Philippines has
developed domestic policies to monitor and limit consumption of ODS to meet ODS phase-out targets
that are established by the Parties to the Montreal Protocol. Since ODS are not produced in the
Philippines, these regulations primarily govern the import and sale of ODS. An overview of these
regulations is described below.
Import and Use Controls
Republic Act #6969, known as the "Toxic Substances and Hazardous and Nuclear Wastes Control Act of
1990" regulates, restricts, or prohibits the importation, manufacture, processing, sale, distribution, use,
and disposal of chemical substances and mixtures that present unreasonable risk and/or injury to health
or the environment. In addition, the Act prohibits the entry, even in transit, of hazardous and nuclear
wastes and their disposal into the Philippine territorial limits for whatever purpose, and provides
advancement and facilitates research and studies on toxic chemicals. Under this Act, the Filipino
government has the authority to monitor and regulate imports of ODS.
Through a regulation called the Chemical Control Order (CCO) for Ozone Depleting Substances, the
Filipino government established import controls and a phase-out schedule for all substances listed under
Annex A, Annex B, and Annex C of the Montreal Protocol. Substances listed under Annex E (i.e., methyl
bromide) are regulated by the Fertilizer and Pesticide Authority of the Department of Agriculture and
therefore are not subject to the controls identified in the CCO. A freeze on the consumption of Annex A,
Group I chemicals at the 1996-estimated consumption level was first implemented in the Philippines in
1999. Annual quotas for subsequent years were established as a percentage of the baseline quantity in
accordance with the Montreal Protocol phase-out schedule. The quotas are non-cumulative and are
forfeited at the end of each year if not used. Prior to the 2010 phase-out of CFCs, annual import quotas
were set for each importing company. While no import quotas have been established for HCFCs under
the CCO, a clearance from the government is required for import of these substances.
Registration Requirements
Registration is required in order to import any substances controlled under the CCO into the Philippines.
In addition to importers, dealers, retailers, and re-sellers of ODS must also register in order to determine
15
OECD, Decision of the Council concerning the Transboundary Movements of Wastes Destined for Recovery Operations,
C(2001)107/FINAL, June 2001, available at http://acts.oecd.org/Instruments/ShowInstrumentView.aspx?InstrumentID=221&InstrumentPID=217&Lang=en&Book=False.
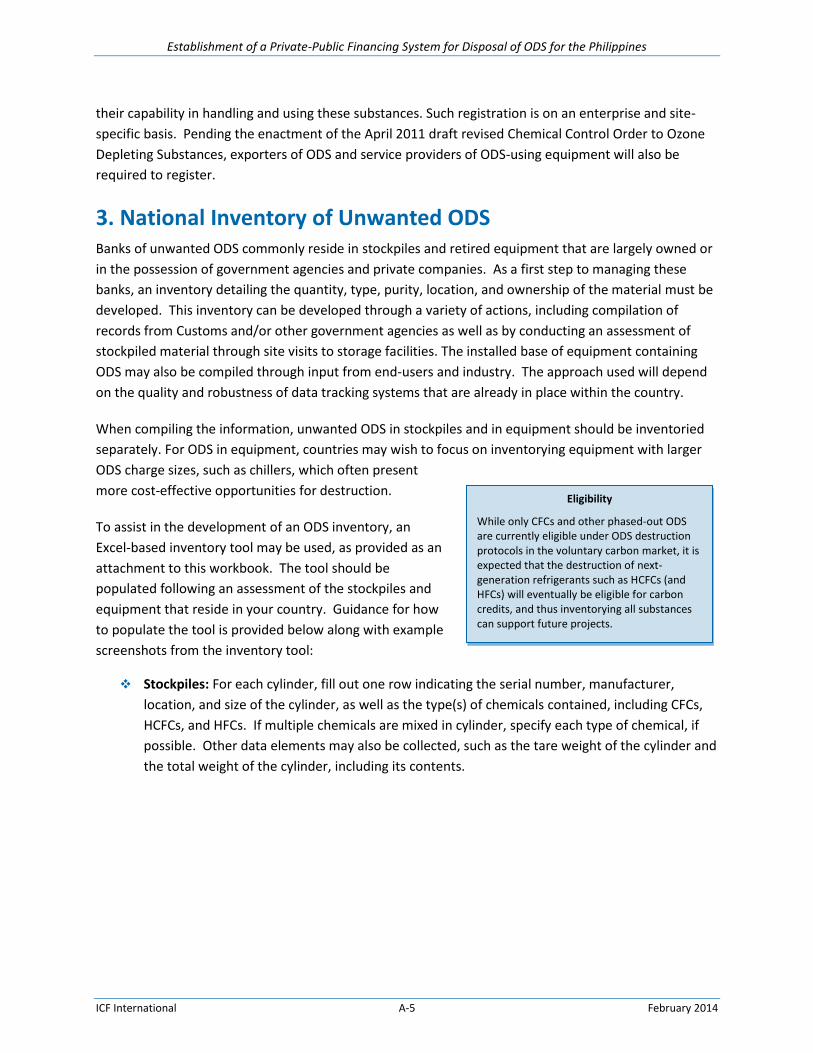
Establishment of a Private-Public Financing System for Disposal of ODS for the Philippines
ICF International A-5 February 2014
Eligibility
While only CFCs and other phased-out ODS are currently eligible under ODS destruction protocols in the voluntary carbon market, it is expected that the destruction of next-generation refrigerants such as HCFCs (and HFCs) will eventually be eligible for carbon credits, and thus inventorying all substances can support future projects.
their capability in handling and using these substances. Such registration is on an enterprise and site-
specific basis. Pending the enactment of the April 2011 draft revised Chemical Control Order to Ozone
Depleting Substances, exporters of ODS and service providers of ODS-using equipment will also be
required to register.
3. National Inventory of Unwanted ODS Banks of unwanted ODS commonly reside in stockpiles and retired equipment that are largely owned or
in the possession of government agencies and private companies. As a first step to managing these
banks, an inventory detailing the quantity, type, purity, location, and ownership of the material must be
developed. This inventory can be developed through a variety of actions, including compilation of
records from Customs and/or other government agencies as well as by conducting an assessment of
stockpiled material through site visits to storage facilities. The installed base of equipment containing
ODS may also be compiled through input from end-users and industry. The approach used will depend
on the quality and robustness of data tracking systems that are already in place within the country.
When compiling the information, unwanted ODS in stockpiles and in equipment should be inventoried
separately. For ODS in equipment, countries may wish to focus on inventorying equipment with larger
ODS charge sizes, such as chillers, which often present
more cost-effective opportunities for destruction.
To assist in the development of an ODS inventory, an
Excel-based inventory tool may be used, as provided as an
attachment to this workbook. The tool should be
populated following an assessment of the stockpiles and
equipment that reside in your country. Guidance for how
to populate the tool is provided below along with example
screenshots from the inventory tool:
Stockpiles: For each cylinder, fill out one row indicating the serial number, manufacturer,
location, and size of the cylinder, as well as the type(s) of chemicals contained, including CFCs,
HCFCs, and HFCs. If multiple chemicals are mixed in cylinder, specify each type of chemical, if
possible. Other data elements may also be collected, such as the tare weight of the cylinder and
the total weight of the cylinder, including its contents.
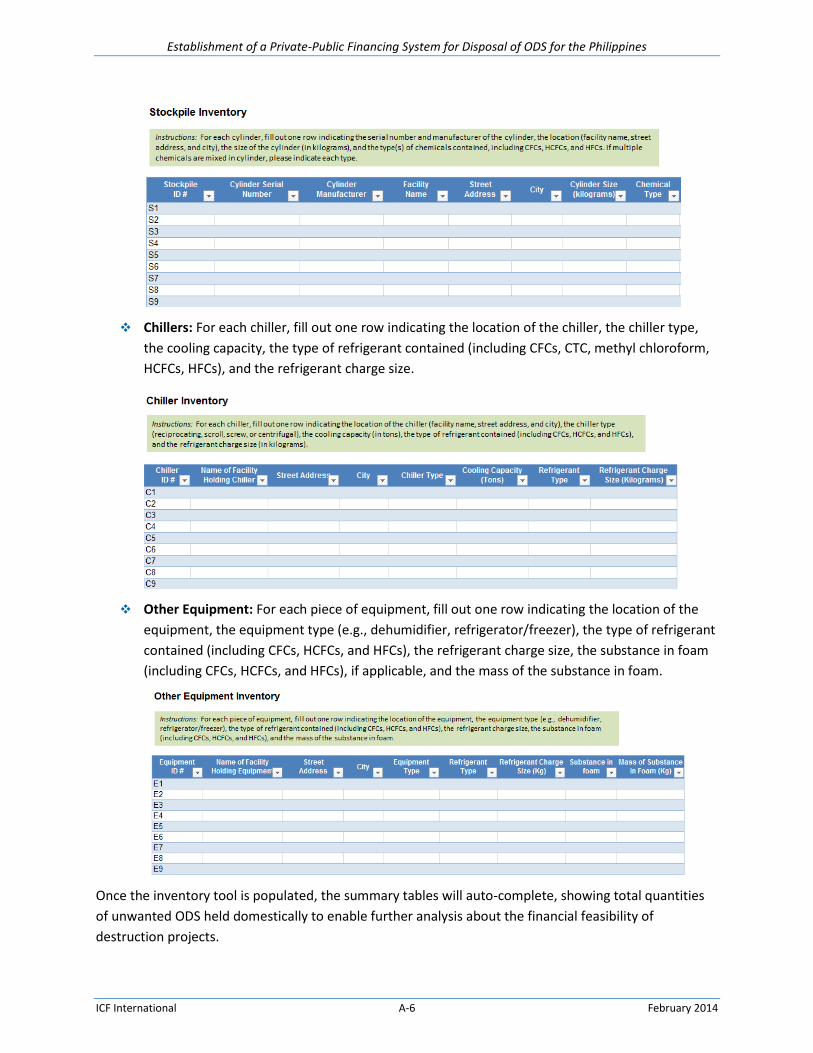
Establishment of a Private-Public Financing System for Disposal of ODS for the Philippines
ICF International A-6 February 2014
Chillers: For each chiller, fill out one row indicating the location of the chiller, the chiller type,
the cooling capacity, the type of refrigerant contained (including CFCs, CTC, methyl chloroform,
HCFCs, HFCs), and the refrigerant charge size.
Other Equipment: For each piece of equipment, fill out one row indicating the location of the
equipment, the equipment type (e.g., dehumidifier, refrigerator/freezer), the type of refrigerant
contained (including CFCs, HCFCs, and HFCs), the refrigerant charge size, the substance in foam
(including CFCs, HCFCs, and HFCs), if applicable, and the mass of the substance in foam.
Once the inventory tool is populated, the summary tables will auto-complete, showing total quantities
of unwanted ODS held domestically to enable further analysis about the financial feasibility of
destruction projects.
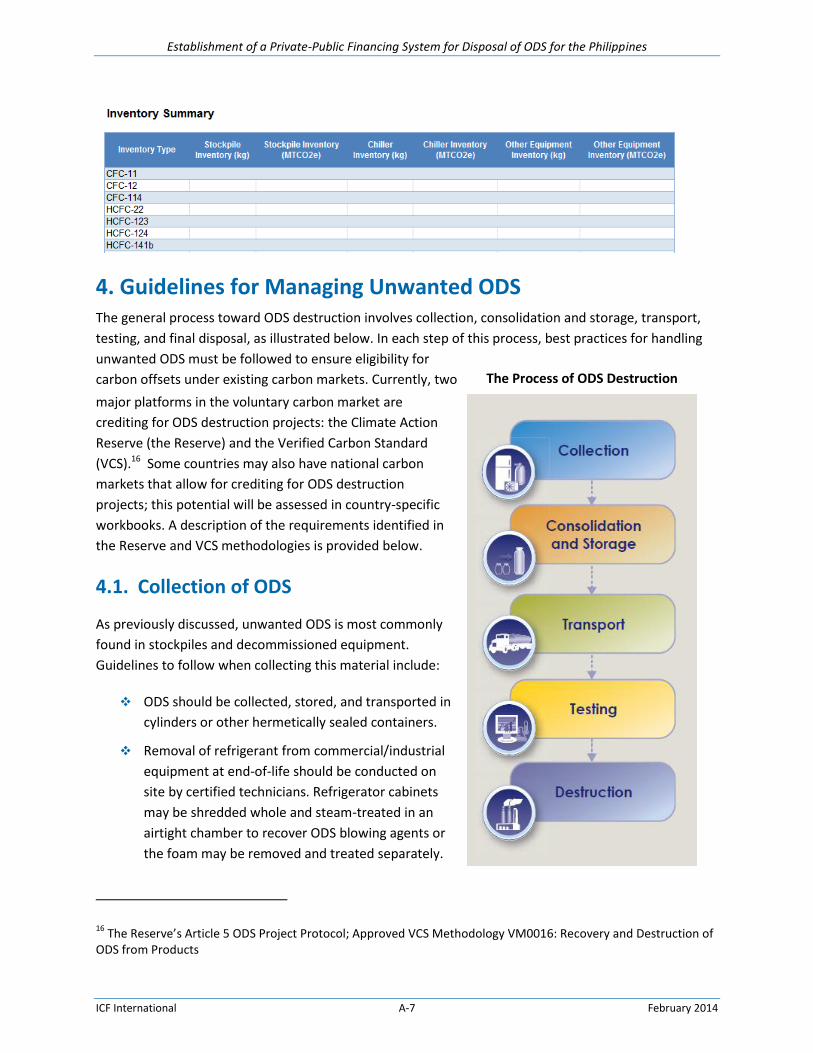
Establishment of a Private-Public Financing System for Disposal of ODS for the Philippines
ICF International A-7 February 2014
4. Guidelines for Managing Unwanted ODS The general process toward ODS destruction involves collection, consolidation and storage, transport,
testing, and final disposal, as illustrated below. In each step of this process, best practices for handling
unwanted ODS must be followed to ensure eligibility for
carbon offsets under existing carbon markets. Currently, two
major platforms in the voluntary carbon market are
crediting for ODS destruction projects: the Climate Action
Reserve (the Reserve) and the Verified Carbon Standard
(VCS).16 Some countries may also have national carbon
markets that allow for crediting for ODS destruction
projects; this potential will be assessed in country-specific
workbooks. A description of the requirements identified in
the Reserve and VCS methodologies is provided below.
4.1. Collection of ODS
As previously discussed, unwanted ODS is most commonly
found in stockpiles and decommissioned equipment.
Guidelines to follow when collecting this material include:
ODS should be collected, stored, and transported in
cylinders or other hermetically sealed containers.
Removal of refrigerant from commercial/industrial
equipment at end-of-life should be conducted on
site by certified technicians. Refrigerator cabinets
may be shredded whole and steam-treated in an
airtight chamber to recover ODS blowing agents or
the foam may be removed and treated separately.
16
The Reserve’s Article 5 ODS Project Protocol; Approved VCS Methodology VM0016: Recovery and Destruction of ODS from Products
The Process of ODS Destruction

Establishment of a Private-Public Financing System for Disposal of ODS for the Philippines
ICF International A-8 February 2014
Custody and Ownership
Throughout the entire process, it is critical to properly document the chain of custody. Carbon credits will not be issued unless ODS ownership can be properly established; therefore, all records that show previous ownership of the material and transfer of that ownership to the project developer should be maintained. For VCS, the chain of custody must be documented by paper bills of lading or electronic, third-party tracking that includes proof of delivery. Other forms of documentation are accepted by the Reserve, including purchase orders or agreements, packing lists, lab test results, transfer container information, receiving inspections, freight bills, transactional payment information, or other supporting information.
The point of origin and date of
establishment must be documented for
each quantity of ODS. For stockpiles, the
point of origin is the location of the
stockpile.17 For ODS recovered from
equipment at end-of-life, the point of
origin is the location where the ODS was
recovered from the equipment. Records
should be kept including the facility name,
address, and serial or ID number of the
containers used for storage and transport.
4.2. Consolidation and Storage
Because ODS might be collected from a large number of smaller units (such as household refrigerators
or small cylinders), it needs to be combined before sending it for destruction; this step avoids the
shipping of many smaller containers, which can lead to additional expense, possible damage and
leakage, and other obstacles. Collected ODS is typically brought to a central facility, where it is
consolidated into larger cylinders or storage tanks, and stored until a quantity sufficient for destruction
has been aggregated.
4.3. Transportation
In this step, the ODS is transported to a destruction facility by truck, rail, or ship. The ODS may be
transported several times before its ultimate destruction, often as it moves through the consolidation
process.
Per the Code of Good Housekeeping approved by the Montreal Protocol, to ensure that ODS does not
constitute an unnecessary risk in transportation, shipments must be properly packaged and labeled.
Instructions to be followed in the event of danger or accident must accompany each shipment to
protect human beings and the environment from any danger that might arise during the operation.
Notification of the following information should be provided at any intermediate stage of the shipment
from the place of dispatch until its final destination: (a) the source and composition of the ODS and
products containing ODS, including the customer’s identity; (b) arrangements for routing and for
insurance against damage to third parties; (c) measures to be taken to ensure safe transport and, in
particular, compliance by the carrier with the conditions laid down for transport by the States
concerned; (d) the identity of the consignee, who should possess an authorized centre with adequate
17
The date on which a quantity of ODS was “stockpiled” is defined by the Reserve as the furthest date in the past on which the quantity of ODS contained in the reservoir was greater than or equal to the total quantity of all ODS removed from the reservoir since that date.
Establishment of a Private-Public Financing System for Disposal of ODS for the Philippines
ICF International A-9 February 2014
technical capacity for the destruction; and (e) the existence of a contractual agreement with the
consignee concerning the destruction of ODS and products containing ODS.
To remain eligible for carbon credits, all import activities must be conducted in full compliance with the
regulations of the country in which ODS is to be destroyed, and must have a complete import record.
Under the Reserve, ODS must be imported into the United States for destruction, and full
documentation of this process, including all petition and record-keeping documents, must be retained
and provided for verification.
4.4. Testing
After arrival at the destruction facility, but before the material is destroyed, testing of the container
contents is undertaken to verify exactly what materials are being destroyed, often through gas
chromatography. The Reserve and VCS have similar methodologies that must be followed for
determining the precise mass and composition of ODS to be destroyed, as briefly described below.
Responsibility for following these methodologies is generally borne by the project developer.
First, the mass must be determined. Specific requirements for measuring the weight of the container
can be found in each methodology. Second, the composition and concentration of ODS and
contaminants must be established for each individual container. A sample from each container of ODS
must be analyzed for composition and concentration at a lab accredited to perform analyses in
compliance with the applicable International Organization for Standardization (ISO) standard or at an
Air-Conditioning, Heating and Refrigeration Institute (AHRI) certified laboratory using the AHRI 700-2006
standard. The laboratory performing the composition analysis must not be affiliated with the project
developer or the project. Specific requirements must be met for each sample, as described in detail in
the methodologies, and analysis of the samples should provide:
1. Identification of the refrigerant;
2. Purity (%) of the ODS mixture by weight using gas chromatography;
3. Moisture level in parts per million. The moisture content of each sample must be less than 75%
of the saturation point for the ODS based on the temperature recorded at the time the sample
was taken;
4. Analysis of high boiling residue, which must be less than 10% by mass; and
5. Analysis of other ODS in the case of mixtures of ODS, and their percentage by mass.
For containers holding mixed ODS, a separate process must be followed. This process includes
determination of the composition and concentration of ODS on a mass basis, followed by circulation of
the mixed ODS and then sampling and analysis.
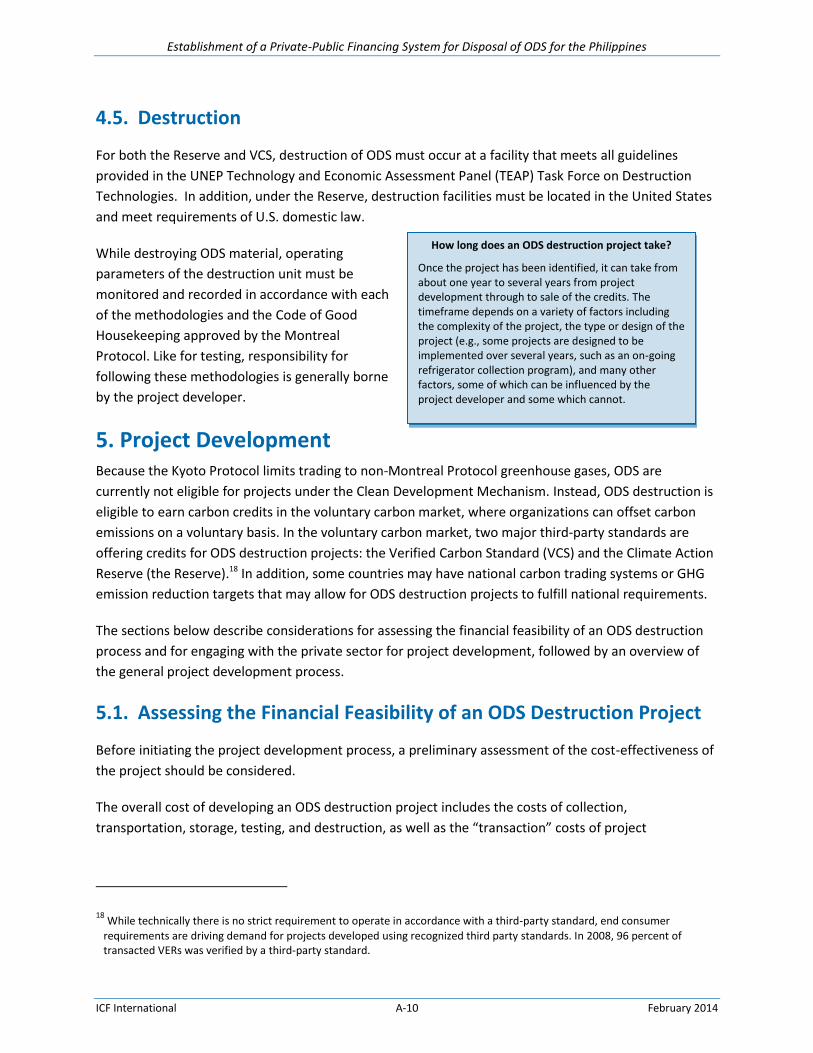
Establishment of a Private-Public Financing System for Disposal of ODS for the Philippines
ICF International A-10 February 2014
How long does an ODS destruction project take?
Once the project has been identified, it can take from about one year to several years from project development through to sale of the credits. The timeframe depends on a variety of factors including the complexity of the project, the type or design of the project (e.g., some projects are designed to be implemented over several years, such as an on-going refrigerator collection program), and many other factors, some of which can be influenced by the project developer and some which cannot.
4.5. Destruction
For both the Reserve and VCS, destruction of ODS must occur at a facility that meets all guidelines
provided in the UNEP Technology and Economic Assessment Panel (TEAP) Task Force on Destruction
Technologies. In addition, under the Reserve, destruction facilities must be located in the United States
and meet requirements of U.S. domestic law.
While destroying ODS material, operating
parameters of the destruction unit must be
monitored and recorded in accordance with each
of the methodologies and the Code of Good
Housekeeping approved by the Montreal
Protocol. Like for testing, responsibility for
following these methodologies is generally borne
by the project developer.
5. Project Development Because the Kyoto Protocol limits trading to non-Montreal Protocol greenhouse gases, ODS are
currently not eligible for projects under the Clean Development Mechanism. Instead, ODS destruction is
eligible to earn carbon credits in the voluntary carbon market, where organizations can offset carbon
emissions on a voluntary basis. In the voluntary carbon market, two major third-party standards are
offering credits for ODS destruction projects: the Verified Carbon Standard (VCS) and the Climate Action
Reserve (the Reserve).18 In addition, some countries may have national carbon trading systems or GHG
emission reduction targets that may allow for ODS destruction projects to fulfill national requirements.
The sections below describe considerations for assessing the financial feasibility of an ODS destruction
process and for engaging with the private sector for project development, followed by an overview of
the general project development process.
5.1. Assessing the Financial Feasibility of an ODS Destruction Project
Before initiating the project development process, a preliminary assessment of the cost-effectiveness of
the project should be considered.
The overall cost of developing an ODS destruction project includes the costs of collection,
transportation, storage, testing, and destruction, as well as the “transaction” costs of project
18
While technically there is no strict requirement to operate in accordance with a third-party standard, end consumer
requirements are driving demand for projects developed using recognized third party standards. In 2008, 96 percent of transacted VERs was verified by a third-party standard.

Establishment of a Private-Public Financing System for Disposal of ODS for the Philippines
ICF International A-11 February 2014
What are some strategies to minimize costs?
Combine ODS destruction projects with other activities or programs that are also eligible for crediting in the carbon market, such as equipment replacement for energy efficiency credits. This strategy could be effective to fund ongoing collection programs, such as municipal, utility, or retailer programs to collect refrigerators on disposal, and ensure that ODS refrigerant and foam blowing agent is destroyed.
Mainstream ODS destruction projects into larger programs and development projects, such as country ODS phaseout programs or a comprehensive waste management program.
Group or pool projects to minimize transaction costs and achieve economies of scale.
preparation, validation, and verification.19 Project costs vary widely depending on many factors such as
geographical location, nature of ODS bank and the effort required to recover the ODS, quantity of ODS
being handled, technologies used, type of ODS, firms contracted, and demand for services. In general,
some projects may be more costly than others to develop. For example, collecting used CFCs from
household refrigerators is likely to be more costly than recovering ODS from commercial air conditioning
equipment with large charge sizes, on a per kilogram of ODS basis. Destroying existing ODS stockpiles
may be the most cost-effective project type.
Because some project costs are “fixed” (i.e., they do not vary depending on the amount of ODS
destroyed), destroying larger volumes of ODS can lead to higher profitability. In particular, project
transaction costs—such as the cost of project preparation, verification, etc.—must be incurred
regardless of the amount of ODS destroyed. Additionally, some project implementation costs may also
be realized irrespective of the amount of ODS collected and destroyed. For example, setting up the
infrastructure for a refrigerator collection program may be a one-time cost that does not depend heavily
on the number of refrigerators collected. These “fixed” costs mean that in some cases there may be a
minimum amount of ODS that must be destroyed in order to have a financially viable project.
To assist with the financial assessment, a simple Excel-based financial tool may be used, as provided as
an attachment to this workbook.
The profitability of the project will also strongly depend on the trading price of carbon credits verified by
each third-party standard, and the attractiveness of ODS destruction credits to buyers. Demand in the
voluntary market is driven not by regulation but by buyers’ interest in mitigating and offsetting their
emissions—which is often motivated by reputational considerations. As such, ODS projects need to be
packaged in a way that is attractive to buyers and their stakeholders. In particular, ODS project
proponents may need to differentiate themselves
from other industrial gas projects that have drawn
criticism (and lower carbon prices) in the past, such
as HFC-23 destruction. A good solution here is for
ODS destruction projects to tell a compelling story
emphasizing that they help pay for the removal of
GHGs that would otherwise be emitted over time if
left unaddressed.
From the sellers’ side of the market, uncertainty
about carbon prices will be an ongoing challenge
that is inherent to the carbon market. Prices
depend on a variety of factors, including the
standard to which the project is developed, the
19
Most of these costs are likely to borne by the project developer (or the project financier), although some upfront costs—such as those to maintain ODS stockpiles in advance of project development—are usually borne by the owner of the ODS.

Establishment of a Private-Public Financing System for Disposal of ODS for the Philippines
ICF International A-12 February 2014
perceived robustness of the methodology used, and so on. In the past, low prices on the Chicago
Climate Exchange (CCX) market have contributed to decisions not to move forward with an ODS
destruction project, such as in the case of Argentina, where some CTC was instead sold to Mexico for
feedstock use rather than destroyed in the U.S. for crediting under CCX. If project developers are
uncertain about whether a project will earn a profit, it may not be pursued. Prices for the over-the-
counter market are not generally disclosed publicly but are available indirectly through several sources,
including an annual report published by Ecosystem Marketplace and New Carbon Finance (available on
www.ecosystemmarketplace.com).
5.2. Selecting a Strategy for Project Development
Once the decision is made to pursue an ODS destruction project, several options for structuring private-
public financing arrangements are available for government agencies in possession of unwanted ODS.
These options include:
Contracting Out—The process is managed by a private sector entity with the Government
informing the public of potential revenue streams from ODS disposal and issuing appropriate
documentation required for disposal or export for final disposal. Under this option, ownership of
the ODS would be transferred to a private entity, who would then develop an ODS destruction
project, and all project revenues would be owned by the private entity. That said, some
revenues may still accrue to the Government, if, for example, a Government chose to sell its
ODS stockpile via an auction process. This option has the lowest administrative and cost burden
on the Government.
Facilitation—The Government plays a modest administrative role and exercises its regulatory
responsibilities while working in concert with a private sector project developer to facilitate the
chain of identification, inventory development, collection, licensing, auctioning, registering and
collecting/transferring revenues to the Government. Under this option, the Government would
need to identify and hire a project developer to develop the project on its behalf, as well as
negotiate ownership of the final credits earned. In some arrangements, ownership of these
credits is fully transferred to the owner of the ODS; in other arrangements, ownership of the
credits is shared between the project developer and owner of the ODS.
Project Developer—In this option, a Government entity assumes responsibility for creating the
emission reduction credits by managing and generating credit through the chain of activities
identified above in order to generate and collect carbon revenues for the Government. This
option has the highest administrative burden for the Government, and requires the Government
entity to have significant capacity and experience in the voluntary carbon market, and to be able
to cover upfront project development costs and market the credits, in anticipation of future
revenues. While no rules restrict governments from acting as project developers, there is also
no clear precedent for national government participation in the project development side of the
voluntary market. Generally, government roles have tended to focus on facilitating market
intervention through capacity building and legislation, although there is some experience with
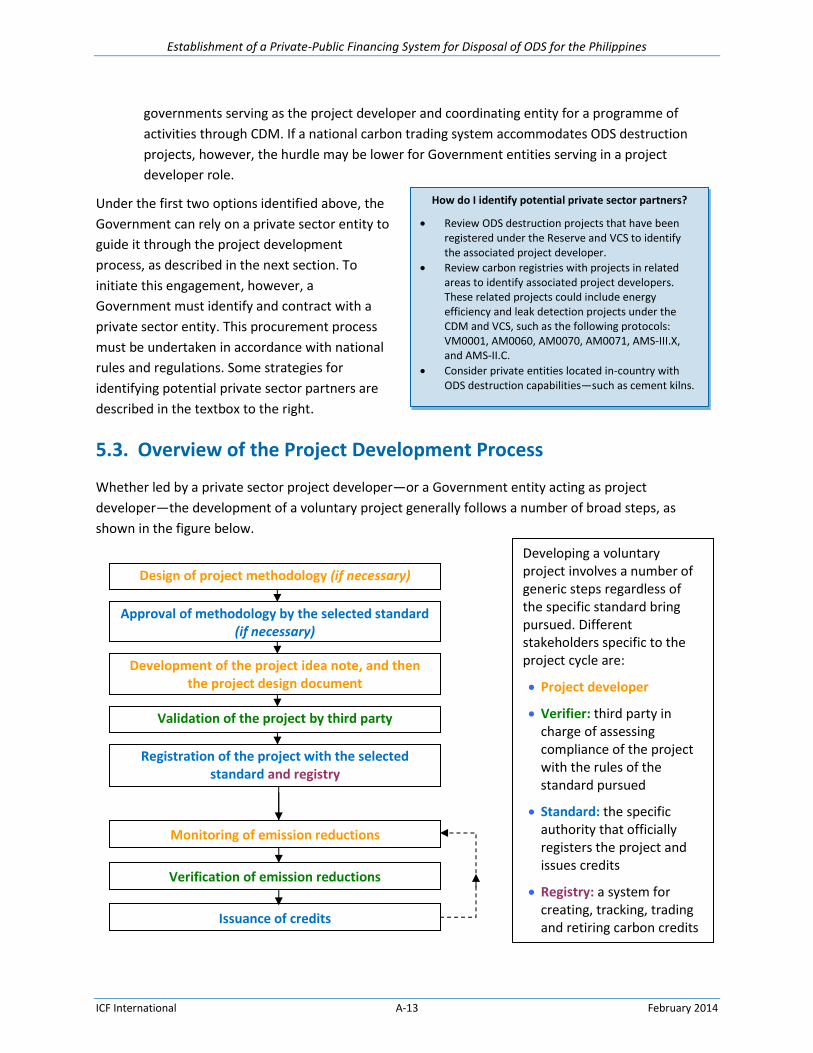
Establishment of a Private-Public Financing System for Disposal of ODS for the Philippines
ICF International A-13 February 2014
Issuance of credits
Registration of the project with the selected standard and registry
Validation of the project by third party
Development of the project idea note, and then the project design document
Verification of emission reductions
Monitoring of emission reductions
Design of project methodology (if necessary)
Approval of methodology by the selected standard (if necessary)
How do I identify potential private sector partners?
Review ODS destruction projects that have been registered under the Reserve and VCS to identify the associated project developer.
Review carbon registries with projects in related areas to identify associated project developers. These related projects could include energy efficiency and leak detection projects under the CDM and VCS, such as the following protocols: VM0001, AM0060, AM0070, AM0071, AMS-III.X, and AMS-II.C.
Consider private entities located in-country with ODS destruction capabilities—such as cement kilns.
governments serving as the project developer and coordinating entity for a programme of
activities through CDM. If a national carbon trading system accommodates ODS destruction
projects, however, the hurdle may be lower for Government entities serving in a project
developer role.
Under the first two options identified above, the
Government can rely on a private sector entity to
guide it through the project development
process, as described in the next section. To
initiate this engagement, however, a
Government must identify and contract with a
private sector entity. This procurement process
must be undertaken in accordance with national
rules and regulations. Some strategies for
identifying potential private sector partners are
described in the textbox to the right.
5.3. Overview of the Project Development Process
Whether led by a private sector project developer—or a Government entity acting as project
developer—the development of a voluntary project generally follows a number of broad steps, as
shown in the figure below.
Developing a voluntary project involves a number of generic steps regardless of the specific standard bring pursued. Different stakeholders specific to the project cycle are:
Project developer
Verifier: third party in charge of assessing compliance of the project with the rules of the standard pursued
Standard: the specific authority that officially registers the project and issues credits
Registry: a system for creating, tracking, trading and retiring carbon credits

Establishment of a Private-Public Financing System for Disposal of ODS for the Philippines
ICF International A-14 February 2014
The broad steps that the project developer could take towards developing an ODS destruction voluntary
project are further described below.
1. Review voluntary market third-party standards and existing methodologies for selection.
A project developer would first review the available standards to identify which one meets the needs of
the envisioned ODS destruction project (e.g., given the standard’s rules, geographical coverage, and so
on). For example, currently the Reserve limit eligible projects to those that destroy ODS in the United
States; if national regulations make it difficult to move ODS transnationally, the Reserve may not be a
viable option.
Currently, one protocol exists for ODS destruction under the Reserve (Article 5 ODS Project Protocol
Version 2.0), and one exists under VCS (VM0016). If one of these methodologies is appropriate for the
project in question (e.g., the envisioned project seems eligible under the methodology, the methodology
seems “doable”), then the project developer can move on to the next step. If this is not the case,
however, then the project developer generally has two options:
Seek a revision or deviation to an existing methodology (if allowed), or
Develop a new methodology for submission and approval by the third-party standard that is
being pursued (if the standard accepts new methodologies).
If neither option is possible, then the project developer cannot move forward under the standard
selected.
2. Develop a project idea note.
Once a methodology is selected (or approved), the project developer usually develops a project idea
note (PIN). A PIN is not required by the third-party standards, but is often used to attract financing for a
project. A PIN describes the project and sets out the business case for the voluntary credit project, as
well as the additionality case. It sets out if an existing methodology is applicable to the project or
whether a new methodology needs to be developed. It also presents the likely costs, expected number
of credits the project would produce, the voluntary standard that would be sought, and the potential
revenue that the sale of the credits could generate.
Depending on the level of in-house expertise, this, and other project documentation and support, may
be undertaken by an external consultant.
3. Establish funding.
The project developer has two main options for financing:
Funding the entire project activity itself with a view to selling the credits once the project is
registered and the credits are issued or

Establishment of a Private-Public Financing System for Disposal of ODS for the Philippines
ICF International A-15 February 2014
Verification Process
Verification of emission reductions is a critical step in the project development process that includes the following:
Testing Internal Controls
Conducting Substantive Testing
Data Validation
Aberrant Data
Reasonable Assumptions, Methodologies, and Calculations
As such, this process should be undertaken by a credible third-party to ensure validation.
Using the PIN to attract interest from a financier. A financier could provide the capital required
to support the project through the cycle and fund the destruction process in return for more
favorable credit prices, or could support just the carbon costs of the project.
4. Develop full project documentation.
Once financing is in place, the full project documentation (i.e., the project design document or its
equivalent, as defined by the third-party standard, describing the emission reduction activity) would be
developed and the validation process would begin (if required).
5. Monitor and verify emission reductions, and receive credits.
Next is the annual monitoring and verification of emission
reductions generated by the project by an external auditor.
The project developer generally engages a third-party verifier
to certify the validity of the project’s emissions reductions.
Upon receipt of a completed verification report, the selected
registry issues the credits.
6. Obtain validation.
If required by the third-party standard, the project
documentation is also submitted for validation. If successful,
the project is then registered under the selected standard.
This step is not required for the Reserve.
7. Market the credits.
Depending on the arrangements with the financier, the credits would pass to the owner, or be shared
between the owner and the developer, as negotiated. Project developers may then sell offsets through
brokers to aggregators or final customers (e.g., companies or consumers looking to voluntarily offset
their emissions). Developers may also sell to aggregators directly or onto an exchange.

Establishment of a Private-Public Financing System for Disposal of ODS for the Philippines
ICF International B-1 February 2014
Appendix B. Importance of Evaluation Criteria Relative to Financing Options
Evaluation Criteria
Importance for the Viability of Financing Options
National Carbon Market
VCS The Reserve
Required Criteria
National carbon market has been established or is under development Required NA NA
No national capacity for ODS destruction exists AND there are no national regulations currently in place that limit the export of ODS
Required Required NA
The anticipated market price of the ODS destruction credits will be high enough to cover projected project costs
NA Required Required
There are no national regulations currently in place that limit the export of ODS
NA NA Required
Preferred Criteria
The country is a participant in PMR Program Highly Preferred NA NA
National capacity for ODS destruction exists Highly Preferred Preferred NA
Regional capacity for ODS destruction exists Preferred Highly Preferred NA
Regional or national capacity for ODS destruction has a removal efficiency of at least 99.9999 percent
NA Highly Preferred NA
Project developers have shown interest in developing an ODS destruction project with the material sourced from the Philippines
Preferred Highly Preferred Highly Preferred
Establishment of a Private-Public Financing System for Disposal of ODS for the Philippines
ICF International C-1 February 2014
Appendix C. Potential Project Developers The following list of project developers identifies companies that either have direct experience
developing ODS destruction projects or have other relevant experience developing regional projects
under the Reserve and/or VCS. While not an exhaustive list, the following companies are considered to
be the most likely to undertake development of an A5 ODS destruction project for the Philippines.
A-Gas RemTec 1100 Haskins Road Bowling Green, OH 43402 USA 1-800-372-1301
EOS Climate Inc. 55 Hawthorne St, Suite 610 San Francisco, CA 94105 USA 800-764-8093 [email protected]
COOLGAS, INC. 30045 FM 2978 Magnolia, TX 77354 USA 1-800-366-1356
OEKO Service Luxembourg (O.S.L.) S.A. Zone Industrielle Piret, B.P. 43 7737 Colmar-Berg, Luxembourg +352488216-1
Diversified Pure Chem, LLC 11050 South Highway 287 Rhome, TX 76078 817-636-2089 [email protected]
RapRec Refrigerants 8971 W. Bloomfield Rd. Peoria, AZ 85381 877-372-7732
Emergent Ventures India (EVI) 5th Floor, Universal Trade Tower Gurgaon- Sohna Road, Sector 49 Haryana, India, 122018 +91-124-6653100 [email protected]
Refrigerant Exchange Corp. 5263 N. 4th St. Irwindale, CA USA 626-338-1890 [email protected]
Environmental Credit Corp. 210 W. Hamilton Ave #297 State College, PA 16801 USA 607-288-4020 [email protected]
South Pole Carbon 2/22 Iyara Building, 6th Floor Chan Road, Soi 2, Thungwatdorn Sathorn, Bangkok 10120 Thailand + 66 2 678 89 79 [email protected]

Establishment of a Private-Public Financing System for Disposal of ODS for the Philippines
ICF International D-1 February 2014
Appendix D. Sample Terms of Reference for Project Developer
UNITED NATIONS INDUSTRIAL DEVELOPMENT ORGANIZATION
DEMONSTRATION PROJECT FOR DISPOSAL OF UNWANTED ODS IN MEXICO (MP/MEX/11/003 and TE/MEX/12/004)
TERMS OF REFERENCE
FOR THE SUPPLY OF SERVICES REQUIRED FOR THE DESTRUCTION OF UNWANTED ODS COLLECTED IN MEXICO
11th March 2013
I. GENERAL BACKGROUND AND OBJECTIVES The 63rd Meeting of the Executive Committee of the Multilateral Fund for the Implementation of the Montreal Protocol (4 – 8 April 2011) approved funding for the demonstration project on ODS destruction in line with decision 58/19, to be implemented by UNIDO and the Government of France. The objective of this project is to destroy 166.7 metric tons of unwanted ODS in the refrigeration sector in Mexico collected during the past 8 years: it includes all categories of activities for the disposal of ODS, namely transport, storage and destruction. The estimated project impact reflects a total reduction of greenhouse gas emission of 997,110 tons of CO2-equivalents. Since 2005 the Government of Mexico through the Ministry of Energy and Energy Saving Fund (FIDE) has successfully accelerated the replacement of old refrigeration appliances with new energy efficient equipment. In 2007, the Secretariat of Environment and Natural Resources (SEMARNAT) and UNIDO, throughout the National CFC Phase out Plan, trained and equipped 100 collecting Centers (FIDE centers) with tools to identify and recover refrigerants gases from old appliances dismantled in these centers. In 2009, FIDE established the second phase of the program for the substitution of domestic refrigerators with the goal to replace and collect 1,600,000 appliances until the end of 2012; the new phase includes 110 collecting centers.
Establishment of a Private-Public Financing System for Disposal of ODS for the Philippines
ICF International D-2 February 2014
On the other hand, in 2007 SEMARNAT and UNIDO installed a network of 14 recycling centers within Mexico in order to provide recovery, recycling and storage for destruction services to the refrigeration technicians and companies involved in the refrigeration sector. As of February 2013, the currently available stocks for destruction come from these two collection programs. Additionally, two pharmaceutical companies have remaining stocks of virgin CFC ready to send for destruction.
II. OFFER REQUIREMENTS
This Terms of Reference should be used for the preparation of a proposal to supply services
required for the collection, transport and destruction of 74.1 tons of unwanted ODS.
The destruction of unwanted ODS must be carried out in compliance with the technologies approved by the Technology and Economic Assessment Panel of Montreal Protocol (TEAP - Report of the Task Force on Destruction Technologies; http://ozone.unep.org/teap/Reports/Other_Task_Force/index.shtml) and meet the performance parameters and emissions requirements set out by TEAP, as well as comply with the applicable local regulations. The contract awarded company is required to carry out the transport for collection in order to consolidate all the quantities of ODS in one collection center which has to have all the permits for the management of this type of gases, including, but not limited to, hazardous waste management, in enough quantities to handle at least 74.1 tons. If the destruction of ODS will take place outside Mexico, the collection center selected by the awarded company will be responsible for all export procedures, including licenses, allowances, and permits to export the referred ODS. The collection and destruction of 74.1 tons of unwanted ODS has to be undertaken within one year starting from the date of signature of the contract related to these Terms of Reference. Companies must provide a detailed description of the destruction methods they will apply.
If unwanted ODS are to be destroyed in order to obtain Carbon Credits, destruction has to be
carried out through methodologies approved by the Climate Action Reserve (CAR) or the
Verified Carbon Standard (VCS). The methodologies taken into consideration must have been
approved before the date of publication of the present Terms of Reference on the UNIDO
website.
A. Technical Offer
The proposal of destruction services offered must include the following information:
1. General data of the company: - Name of the company - Address - Telephone - E- Mail

Establishment of a Private-Public Financing System for Disposal of ODS for the Philippines
ICF International D-3 February 2014
- web site (if available) - Operation records of the company for the last 2 years, demonstrating the experience
in the management and destruction of refrigerant gases and/or comparable substances.
- Listing of qualifications and brief description of experience of the personnel to be assigned to the project.
2. Detailed description of the destruction facility: - Type of ODS destruction technology approved by TEAP. - Location of the facility. - Operational procedures. - ODS handling and storage including safety procedures for containers and bulk
storage tanks for refrigerants. - ODS identification and quantification methods applied. - Preparation and feeding of gas to the destruction process. - Feed rate range (kg/hr) of gas. - Emission monitoring system. - Treatment of gaseous and aqueous effluents (when applicable).
3. Emission values of the destruction technology: - Destruction and Removal Efficiency of ODS. - Emissions of dioxins and furans. - Emissions of acidic gases (HCl and HF), particles and carbon monoxide. - Emissions of metals and other relevant pollutants.
4. Information of the Collection Center: - Name of the Center - Address - Telephone - E- Mail - web site (if available) - Number of hazardous waste collection registry delivered by SEMARNAT. - Number of all environmental authorizations required to get the export permission of
recovered ODS. - Operation records demonstrating the experience in the management of refrigerant
gases and/or comparable substances. - Listing of qualifications and brief description of experience of the personnel to be
assigned to the project.
5. Information on the Transport Company for the transport of recovered ODS: - Name of the Transport Company - Address - Telephone - E- Mail - web site (if available) - Number of all authorizations required for the transport of recovered ODS within
Mexican territory.
6. Additional information:

Establishment of a Private-Public Financing System for Disposal of ODS for the Philippines
ICF International D-4 February 2014
- If ODS are to be destroyed in order to obtain Carbon Credits, proven track record in registering projects under CAR / VCS.
7. Provide a Commitment Letter
B. Commercial Offer
Detailed description of the cost for proposed services:
1. Based upon information in Annex 1, cost for transportation from the points of origin to
the destruction facility. The quotation should include the cost of handling and the return of empty containers to the points of origin.
2. Cost for destruction per kg, including temporal storage and handling in the destruction
facility.
3. Cost of reporting (reporting requirements are specified in Section V of this Terms of
Reference).
4. If a share or the whole of the unwanted ODS are to be destroyed in order to obtain
carbon credits, registration cost under one of the two carbon market schemes considered (e.g. validation, monitoring, reporting and verification, etc.)
The proposal must include a detailed time schedule for the destruction of 74.1 metric tons of
unwanted ODS. The batches of unwanted ODS (as identified in Annex 1) have to be
destroyed in the sequence specified in Annex 2.
Companies are requested to fill the table provided in Annex 2 with an estimation of:
1. Dates when each batch of unwanted ODS will be transported from its collection point (as
detailed in Annex 1) to the destruction facility;
2. Dates when each batch of unwanted ODS will be destroyed.
III. LANGUAGE REQUIREMENTS The personnel provided by the supplier for undertaking the above-defined tasks will be required to have working knowledge of Spanish and English (both written and spoken); the ability to provide native Spanish speakers will be an asset
IV. DELIVERABLES
A. Reporting to the National Ozone Unit of Mexico

Establishment of a Private-Public Financing System for Disposal of ODS for the Philippines
ICF International D-5 February 2014
Destruction facilities must report on the destruction of each batch of unwanted ODS to the National Ozone Unit of the Government of Mexico. The information provided should include:
1. General Data of the Destruction facility. 2. Name of the Developer. 3. Name of the Generator. 4. Origin of the unwanted ODS. 5. A quantity of unwanted ODS destroyed. 6. Gas composition. 7. Certificate of Destruction - ID number. 8. Serial, tracking, or ID Number of all tanks for which ODS destruction occurred. 9. Destruction dates.
All this information must be registered on line through the Monitoring System provided by National Ozone Unit from SEMARNAT.
B. Reporting to UNIDO
1. The contractor shall submit a Work Plan one month after the signature of the contract. It should include a schedule for the planned destruction activities within the contract. The information should be consistent with the information given under Section III and Annex 2 of the present Terms of Reference.
2. Progress report: the contractor shall submit a progress report after the destruction of at
least 37 metric tons of unwanted ODS, no later than 7 months after signature of contract. The report has to contain the data of the destroyed ODS as set out under the reporting criteria to the National Ozone Unit.
3. Draft final report: the contractor shall submit a draft final report after the complete
destruction of the 74.1 metric tons of unwanted ODS. The report has to contain the data of the destroyed unwanted ODS as set out under the reporting criteria to the National Ozone Unit.
4. Final report: the contractor shall submit a final report at the end of the contract and
should incorporate comment from UNIDO.
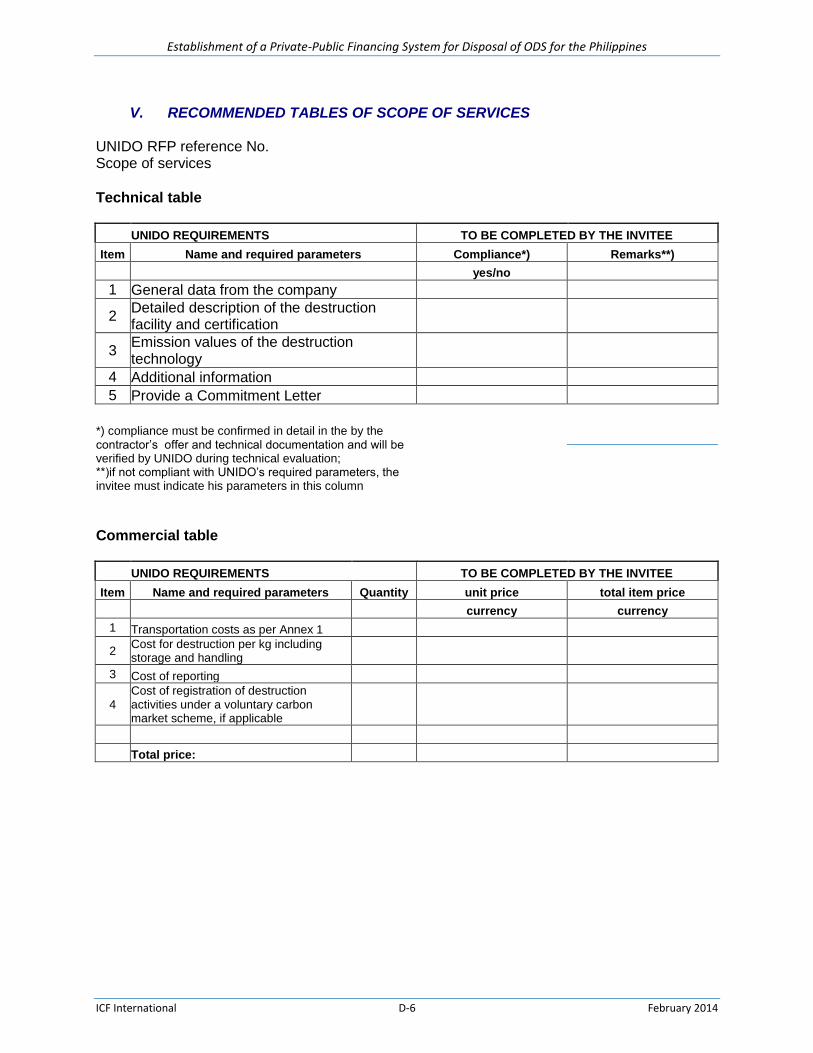
Establishment of a Private-Public Financing System for Disposal of ODS for the Philippines
ICF International D-6 February 2014
V. RECOMMENDED TABLES OF SCOPE OF SERVICES UNIDO RFP reference No. Scope of services
Technical table
UNIDO REQUIREMENTS TO BE COMPLETED BY THE INVITEE
Item Name and required parameters Compliance*) Remarks**)
yes/no
1 General data from the company
2 Detailed description of the destruction facility and certification
3 Emission values of the destruction technology
4 Additional information
5 Provide a Commitment Letter
*) compliance must be confirmed in detail in the by the contractor’s offer and technical documentation and will be verified by UNIDO during technical evaluation; **)if not compliant with UNIDO’s required parameters, the invitee must indicate his parameters in this column
Commercial table
UNIDO REQUIREMENTS TO BE COMPLETED BY THE INVITEE
Item Name and required parameters Quantity unit price total item price
currency currency
1 Transportation costs as per Annex 1
2 Cost for destruction per kg including storage and handling
3 Cost of reporting
4 Cost of registration of destruction activities under a voluntary carbon market scheme, if applicable
Total price:

Establishment of a Private-Public Financing System for Disposal of ODS for the Philippines
ICF International D-7 February 2014
VI. EVALUATION CRITERIA The company has to provide
1. General Data from the company 2. Detailed description of the destruction facility and certification 3. Emission values of the destruction technology 4. Commitment letter 5. Transportation costs 6. Cost for destruction per kg including storage and handling 7. Cost of registration of destruction activities under a voluntary carbon market scheme,
if applicable

blankpage

FINANCING OPTIONS TO ADDRESS CLIMATE CO‐BENEFITS FOR HCFC PHASE‐OUT IN LVCS WITH SERVICING SECTOR ONLY
Submitted to the 73rd Meeting of the Multilateral Fund for the Implementation of the Montreal Protocol
by
United Nations Environment Programme (UNEP)
17 September 2014

2
ACKNOWLEDGEMENTS This document was produced by UNEP Division of Technology, Industry and Economics (UNEP DTIE) OzonAction Programme as part of UNEP’s work programme under the Multilateral Fund for the Implementation of the Montreal Protocol. Researched and written by:
Ms. Jane Barton, Patterson Consulting, Ottawa, Canada Quality reviewed by:
Ms. Donnalyn Charles, National Ozone Officer, Sustainable Development & Environment Officer, Ministry of Sustainable Development, Energy, Science and Technology Saint Lucia
Mr. Steve Gorman, former Head of World Bank Montreal Protocol Unit Feedback and suggestions provided by:
National Ozone Officers and other experts who participated in the associated resource mobilisation workshops organized by UNEP.
The UNEP project team:
Dr. Shamila Nair‐Bedouelle, Head, UNEP DTIE OzonAction Branch
Mr. James S. Curlin, Network and Policy Manager, OzonAction Branch
Ms. Josephine Chona, Network Assistant, OzonAction Branch Layout and design by:
Aurélie Ek, Consultant UNEP would like to thank all of the above persons for their contributions to this document.
3
Contents ACKNOWLEDGEMENTS ...................................................................................................................................... 2
EXECUTIVE SUMMARY ....................................................................................................................................... 4
SETTING THE SCENE ........................................................................................................................................... 6
INTRODUCTION .................................................................................................................................................. 7
1. PHASE‐OUT SCHEDULE FOR HCFCs ................................................................................................................ 9
2. DESCRIPTION OF LVCs WITH REFRIGERATION SERVICING SECTOR ONLY ..................................................... 9
3. PROGRESS SO FAR ON HCFC PHASE‐OUT IN LVCs WITH SERVICING ONLY AND WHAT THAT MEANS IN TERMS OF CLIMATE ......................................................................................................................................... 14
4. OVERVIEW OF ALTERNATIVES FOR HCFC IN REFRIGERATION AND AIR CONDITIONING ............................ 17
5. FINANCING OPTIONS AVAILABLE TO LVCs SEEKING SUPPORT FOR CLIMATE BENEFITS ............................. 21
6. GUIDE FOR OZONE OFFICERS ....................................................................................................................... 35
Annex 1: Overview of UNEP’s resource mobilization project .......................................................................... 45
Annex 2: Summary of the regional resource mobilization workshops ............................................................ 48
Annex 3: Useful contacts and background information .................................................................................. 51
Annex 4: Multilateral Fund eligible incremental costs of HCFC phase‐out projects ....................................... 54
4
EXECUTIVE SUMMARY This document provides guidance for Ozone Officers in low volume HCFC‐consuming countries (LVCs) to help them understand how to seek financing outside of the Montreal Protocol’s Multilateral Fund to achieve the climate co‐benefits indicated in their national HCFC Phase‐out Management Plans (HPMPs). LVCs have certain characteristics that are unique to their circumstances that can make accessing additional this financial support for HCFC phase‐out projects particularly challenging, however the experience of some developing countries and the resource mobilisation projects of the Multilateral Fund’s Implementing Agencies demonstrate that is possible. The vast majority of the HCFCs consumed in LVCs still remains to be phased out through Multilateral Fund projects, and since HCFCs both deplete the ozone layer and are greenhouse gases, LVCs have a clear opportunity to develop phase‐out projects that meet both ozone and climate protection goals. Significant cost savings for equipment owners and governments can result when HCFC phase‐out projects are designed to provide climate benefits. In order to develop such funding proposals, it is important for HCFC‐related activities to be expressed in terms understandable by organisations that are used to climate change concepts and terminology, i.e. describing HCFCs as greenhouse gases using carbon dioxide equivalent (CO2‐eq) emissions. When developing a resource mobilization plan, Ozone Officers should identify the potential climate benefits in the servicing sector and understand who could benefit, i.e. the consumer, the equipment owner, the government and/or the environment. Climate co‐benefits are frequently driven by increased energy efficiency in equipment using alternatives for HCFCs. There is a range of potential sources of financial support for climate co‐benefits projects that an Ozone Officer should consider, including mainstreaming through Official Development Assistance, global level financial institutions with climate programmes, regional financial institutions that support climate benefits, government support for climate benefits as bilateral donors, and private sector support. A step‐by‐step guide for an Ozone Officer includes understand the refrigeration servicing sector, potential climate co‐benefits and possible barriers; persuading management to seek climate co‐financing for the HCFC phase‐out; meeting with bilateral donors, international organizations and regional organisations that work in your country, making a compelling proposal, and preparing for discussions with potential donors.

5
LIST OF ACRONYMS ACSP African Carbon Support Programme ADB Asian Development Bank AfDB African Development Bank CAS Country Assistance Strategy CDB Caribbean Development Bank CDM Clean Development Mechanism CER Certified emission reduction CFC Chlorofluorocarbon CFU Carbon Finance Unit CIF Climate Investment Funds CO2‐eq Carbon dioxide equivalent emissions EBRD European Bank for Reconstruction and Development ECA Europe and Central Asia EER Energy efficiency rating GEF Global Environment Facility GHG Greenhouse gas GWP Global warming potential HC Hydrocarbon HCFC Hydrochlorofluorocarbon HFC Hydrofluorocarbon HFO Hydrofluoroolefin HPMP HCFC Phase‐out Management Plan HVAC&R Heating, ventilation, air conditioning, and refrigeration IADB Inter‐American Development Bank IDA International Development Association IDBI Industrial Development Bank of India IEA International Energy Agency IFC International Finance Corporation IPCC Intergovernmental Panel on Climate Change LVC Low volume HCFC consuming country MDG UN Millennium Development Goal MT Metric tonnes NOU National Ozone Unit ODA Official Development Assistance ODP Ozone Depleting Potential ODS Ozone depleting substance OECD Organisation for Economic Co‐operation and Development PRSP Poverty Reduction Strategy Paper RAC Refrigeration and air conditioning SE4ALL Sustainable Energy for All Initiative SEFA Sustainable Energy Fund for Africa SIDS Small Island Developing States TEAP Technology and Economic Assessment Panel UNDAF UN Development Assistance Framework UNDP United Nations Development Programme UNEP United Nations Environment Programme UNFCCC UN Framework Convention on Climate Change UNIDO United Nations Industrial Development Organisation VLVC Very low volume HCFC consuming country

6
FINANCING OPTIONS TO ADDRESS CLIMATE CO‐BENEFITS FOR HCFC PHASE‐OUT IN LVCS WITH SERVICING SECTOR ONLY
SETTING THE SCENE The UNEP report, HFCs: A Critical Link in Protecting Climate and the Ozone Layer,1 set the scene with respect to the rapid growth of hydrofluorocarbons (HFCs) as the main replacements for hydrochlorofluorocarbons (HCFCs) under the Montreal Protocol on Substances that Deplete the Ozone Layer. It states that the ozone‐depleting substances (ODS) being phased out under the Montreal Protocol, such as chlorofluorocarbons (CFCs) and HCFCs, are not only ozone‐depleting but are also potent global warming gases. While the HFC replacement chemicals used in products such as refrigerators and air conditioners and do not deplete stratospheric ozone, many of them are also extremely powerful global warming gases that will have an adverse impact on the climate if their use as alternatives to HCFCs remains significant. Alternatives for HCFCs in refrigeration and air conditioning (RAC) applications that have less impact or no impact at all on the climate are being developed and used throughout the world as Parties to the Montreal Protocol implement their HCFC Phase‐out Management Plans (HPMPs). In developing countries with low and very low HCFC consumption, the challenges faced by Ozone Officers in meeting the HCFC phase‐out targets may be more easily met if the opportunities available through financial support for projects that benefit the climate are understood and acted on. This document aims to explain what climate‐related resource mobilization means and how it can help an Ozone Officer in a low‐volume consuming country (LVC) or very low volume consuming country (VLVC)2 meet the HCFC phase‐out targets with financial assistance from both the Multilateral Fund for the Implementation of the Montreal Protocol and other financial institutions and mechanisms. Ozone protection projects can be linked with activities to enhance energy efficiency and reduction of greenhouse gas (GHG) emissions, thereby achieving a dual benefit of ozone protection and climate change mitigation. The document provides guidance on how a LVC can seek financial support to both phase out HCFCs in the refrigeration servicing sector — which includes both the refrigeration and air conditioning sub‐sectors — through projects result in reduced energy consumption and meet a country’s climate, environmental and health‐related goals and objectives.
1 UNEP, HFCs: A Critical Link in Protecting Climate and the Ozone Layer A UNEP Synthesis Report (November 2011), http://www.unep.org/dewa/portals/67/pdf/HFC_report.pdf 2 Although there are sometimes considerable differences between low‐volume and very‐low volume consuming countries, for the purposes of this document the term LVC will be used henceforth as a generic term for both types of countries.

7
INTRODUCTION During its 60th meeting, the Executive Committee of the Multilateral Fund agreed under Decision 60/44 that for HCFC phase‐out projects to achieve the 2013 and 2015 HCFC phase‐out compliance targets, it would provide additional funding of up to 25% above the cost effectiveness threshold for projects, when needed for the introduction of low global warming potential (GWP) alternatives. This provision thus encourages Article 5 countries to use replacements for HCFCs in their RAC investment projects that have less impact or no impact on climate – thereby achieving climate co‐benefits. Given that this additional funding of up to 25% related to climate benefits is not available to Parties with no HCFC manufacturing sector, the Parties that are LVCs need information and guidance on how to access additional funding and support for their HCFC phase‐out. In recognition of this need, the Executive Committee, through Decision 63/22 (a), approved separate resource mobilization projects for each of the four implementing agencies: UNDP, UNEP, UNIDO and the World Bank. The project approved for UNEP, entitled “Resource mobilization to address climate co‐benefits for HCFCs phase‐out in LVCs with servicing sector only,” includes two elements: a paper on financing options (i.e. this document) and four regional workshops on co‐financing.3 In preparation for the UNEP resource mobilization project, the final reports of the resource mobilization projects of UNDP, UNIDO and the World Bank proved to be useful. In addition, UNEP sought and received advice from the other Implementing Agencies in relation to their experiences working with National Ozone Units (NOUs) in LVCs who were seeking opportunities for resource mobilization. The regional workshops on co‐financing also provided an opportunity for participants in LVCs to voice their needs in relation to resource mobilization and to provide their inputs to this document.4 This document is designed as guidance for Ozone Officers in LVCs to help them understand how to approach financing options to achieve climate co‐benefits of the HCFC phase out. Although this document is specifically targeted to assist LVCs that only consume HCFCs for servicing RAC equipment, the document should be useful to all LVCs. It is intended to provide practical steps to guide Ozone Officers on how to identify support for the climate co‐benefits of their HPMPs. It takes a step back and describes LVCs and the challenges and opportunities Ozone Officers in LVCs may face in identifying and accessing support to address climate co‐benefits. The paper then outlines what climate benefits are possible in refrigeration servicing. It introduces the concept of co‐financing and the various institutions that can provide support to LVCs as they phase out the HCFCs. Finally, it demonstrates how to prepare for discussions on co‐financing with potential donors to address climate co‐benefits during the HCFC phase‐out. The paper is divided into the following six sections:
3 For background about UNEP’s resource mobilization project, see Annex 1. 4 See Annex 2.
8
1. Phase‐out schedule for HCFCs. The HCFC phase‐out schedule for developing countries is outlined. 2. Description of LVCs with refrigeration servicing sector only. Countries with low or very low consumption of HCFCs are LVCs are the focus of the paper, in particular with and those with RAC servicing sector only. They are listed and described along with their unique challenges in relation to accessing financial support to implement their HPMPs. 3. Progress so far on HCFC Phase‐out in LVCs with servicing only and what that means in terms of climate. This section reviews the data available on HCFC phase‐out in LVCs with a RAC servicing sector only and sets out how much more must be achieved. It also discusses how to express HCFCs as greenhouse gases to set the stage for seeking climate benefits in HPMPs. 4. An overview of alternatives for HCFCs in refrigeration and air conditioning. The substitutes for HCFCs in the RAC sector are briefly introduced in this section along with a review of how to achieve climate benefits in the HCFC phase‐out as it relates to the servicing sector. This section also makes the case for seeking financing to support climate benefits when implementing the HPMPs. 5. Financing options available to LVCs seeking support for climate benefits. This section introduces climate financing institutions that are options for LVCs, seeking support outside of the Multilateral Fund for climate co‐benefits. It describes the kinds of support provided by the various financing institutions specific to an LVC. 6. Guide to Ozone Officers for accessing co‐financing. This part of the financing options paper is intended to be used as a step‐by‐step guide for an Ozone Officer on how to move from understanding the opportunities that climate co‐benefits can offer through to putting resource mobilization into practice.
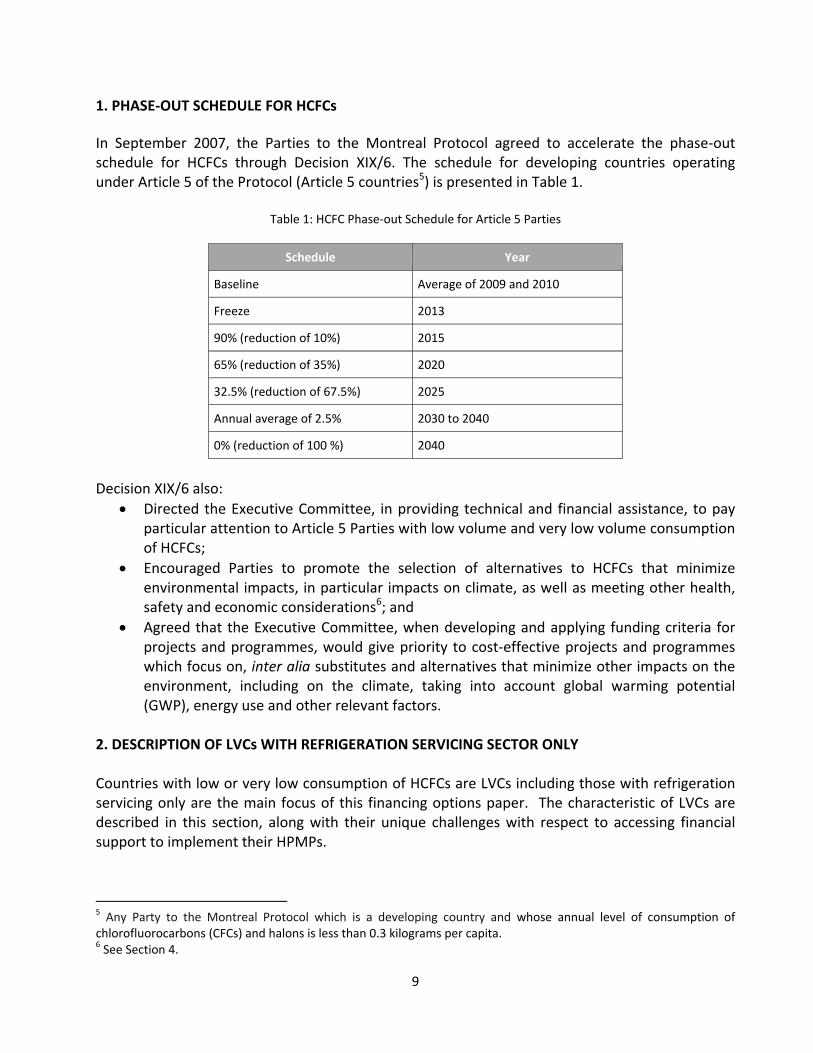
9
1. PHASE‐OUT SCHEDULE FOR HCFCs
In September 2007, the Parties to the Montreal Protocol agreed to accelerate the phase‐out schedule for HCFCs through Decision XIX/6. The schedule for developing countries operating under Article 5 of the Protocol (Article 5 countries5) is presented in Table 1.
Table 1: HCFC Phase‐out Schedule for Article 5 Parties
Schedule Year
Baseline Average of 2009 and 2010
Freeze 2013
90% (reduction of 10%) 2015
65% (reduction of 35%) 2020
32.5% (reduction of 67.5%) 2025
Annual average of 2.5% 2030 to 2040
0% (reduction of 100 %) 2040
Decision XIX/6 also:
Directed the Executive Committee, in providing technical and financial assistance, to pay particular attention to Article 5 Parties with low volume and very low volume consumption of HCFCs;
Encouraged Parties to promote the selection of alternatives to HCFCs that minimize environmental impacts, in particular impacts on climate, as well as meeting other health, safety and economic considerations6; and
Agreed that the Executive Committee, when developing and applying funding criteria for projects and programmes, would give priority to cost‐effective projects and programmes which focus on, inter alia substitutes and alternatives that minimize other impacts on the environment, including on the climate, taking into account global warming potential (GWP), energy use and other relevant factors.
2. DESCRIPTION OF LVCs WITH REFRIGERATION SERVICING SECTOR ONLY Countries with low or very low consumption of HCFCs are LVCs including those with refrigeration servicing only are the main focus of this financing options paper. The characteristic of LVCs are described in this section, along with their unique challenges with respect to accessing financial support to implement their HPMPs.
5 Any Party to the Montreal Protocol which is a developing country and whose annual level of consumption of chlorofluorocarbons (CFCs) and halons is less than 0.3 kilograms per capita. 6 See Section 4.
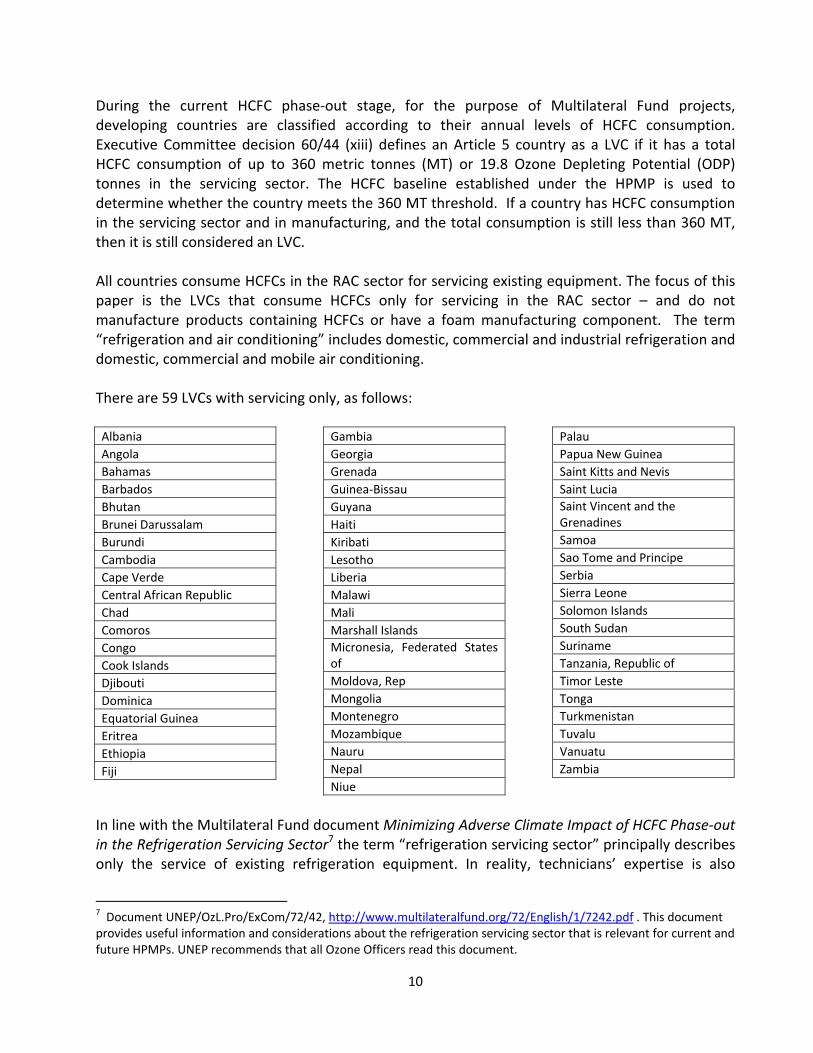
10
During the current HCFC phase‐out stage, for the purpose of Multilateral Fund projects, developing countries are classified according to their annual levels of HCFC consumption. Executive Committee decision 60/44 (xiii) defines an Article 5 country as a LVC if it has a total HCFC consumption of up to 360 metric tonnes (MT) or 19.8 Ozone Depleting Potential (ODP) tonnes in the servicing sector. The HCFC baseline established under the HPMP is used to determine whether the country meets the 360 MT threshold. If a country has HCFC consumption in the servicing sector and in manufacturing, and the total consumption is still less than 360 MT, then it is still considered an LVC. All countries consume HCFCs in the RAC sector for servicing existing equipment. The focus of this paper is the LVCs that consume HCFCs only for servicing in the RAC sector – and do not manufacture products containing HCFCs or have a foam manufacturing component. The term “refrigeration and air conditioning” includes domestic, commercial and industrial refrigeration and domestic, commercial and mobile air conditioning. There are 59 LVCs with servicing only, as follows: Albania
Angola
Bahamas
Barbados
Bhutan
Brunei Darussalam
Burundi
Cambodia
Cape Verde
Central African Republic
Chad
Comoros
Congo
Cook Islands
Djibouti
Dominica
Equatorial Guinea
Eritrea
Ethiopia
Fiji
Gambia
Georgia
Grenada
Guinea‐Bissau
Guyana
Haiti
Kiribati
Lesotho
Liberia
Malawi
Mali
Marshall Islands
Micronesia, Federated States of
Moldova, Rep
Mongolia
Montenegro
Mozambique
Nauru
Nepal
Niue
Palau
Papua New Guinea
Saint Kitts and Nevis
Saint Lucia
Saint Vincent and the Grenadines
Samoa
Sao Tome and Principe
Serbia
Sierra Leone
Solomon Islands
South Sudan
Suriname
Tanzania, Republic of
Timor Leste
Tonga
Turkmenistan
Tuvalu
Vanuatu
Zambia
In line with the Multilateral Fund document Minimizing Adverse Climate Impact of HCFC Phase‐out in the Refrigeration Servicing Sector7 the term “refrigeration servicing sector” principally describes only the service of existing refrigeration equipment. In reality, technicians’ expertise is also
7 Document UNEP/OzL.Pro/ExCom/72/42, http://www.multilateralfund.org/72/English/1/7242.pdf . This document provides useful information and considerations about the refrigeration servicing sector that is relevant for current and future HPMPs. UNEP recommends that all Ozone Officers read this document.
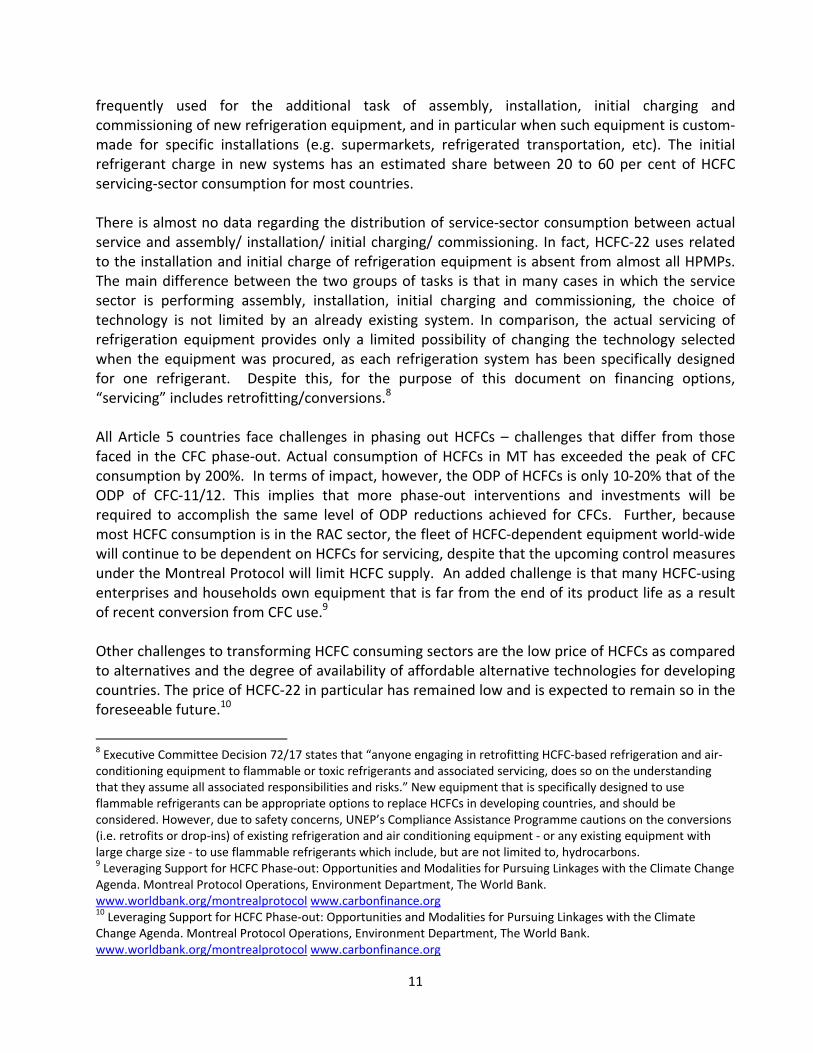
11
frequently used for the additional task of assembly, installation, initial charging and commissioning of new refrigeration equipment, and in particular when such equipment is custom‐made for specific installations (e.g. supermarkets, refrigerated transportation, etc). The initial refrigerant charge in new systems has an estimated share between 20 to 60 per cent of HCFC servicing‐sector consumption for most countries. There is almost no data regarding the distribution of service‐sector consumption between actual service and assembly/ installation/ initial charging/ commissioning. In fact, HCFC‐22 uses related to the installation and initial charge of refrigeration equipment is absent from almost all HPMPs. The main difference between the two groups of tasks is that in many cases in which the service sector is performing assembly, installation, initial charging and commissioning, the choice of technology is not limited by an already existing system. In comparison, the actual servicing of refrigeration equipment provides only a limited possibility of changing the technology selected when the equipment was procured, as each refrigeration system has been specifically designed for one refrigerant. Despite this, for the purpose of this document on financing options, “servicing” includes retrofitting/conversions.8 All Article 5 countries face challenges in phasing out HCFCs – challenges that differ from those faced in the CFC phase‐out. Actual consumption of HCFCs in MT has exceeded the peak of CFC consumption by 200%. In terms of impact, however, the ODP of HCFCs is only 10‐20% that of the ODP of CFC‐11/12. This implies that more phase‐out interventions and investments will be required to accomplish the same level of ODP reductions achieved for CFCs. Further, because most HCFC consumption is in the RAC sector, the fleet of HCFC‐dependent equipment world‐wide will continue to be dependent on HCFCs for servicing, despite that the upcoming control measures under the Montreal Protocol will limit HCFC supply. An added challenge is that many HCFC‐using enterprises and households own equipment that is far from the end of its product life as a result of recent conversion from CFC use.9 Other challenges to transforming HCFC consuming sectors are the low price of HCFCs as compared to alternatives and the degree of availability of affordable alternative technologies for developing countries. The price of HCFC‐22 in particular has remained low and is expected to remain so in the foreseeable future.10
8 Executive Committee Decision 72/17 states that “anyone engaging in retrofitting HCFC‐based refrigeration and air‐conditioning equipment to flammable or toxic refrigerants and associated servicing, does so on the understanding that they assume all associated responsibilities and risks.” New equipment that is specifically designed to use flammable refrigerants can be appropriate options to replace HCFCs in developing countries, and should be considered. However, due to safety concerns, UNEP’s Compliance Assistance Programme cautions on the conversions (i.e. retrofits or drop‐ins) of existing refrigeration and air conditioning equipment ‐ or any existing equipment with large charge size ‐ to use flammable refrigerants which include, but are not limited to, hydrocarbons. 9 Leveraging Support for HCFC Phase‐out: Opportunities and Modalities for Pursuing Linkages with the Climate Change Agenda. Montreal Protocol Operations, Environment Department, The World Bank. www.worldbank.org/montrealprotocol www.carbonfinance.org 10 Leveraging Support for HCFC Phase‐out: Opportunities and Modalities for Pursuing Linkages with the Climate Change Agenda. Montreal Protocol Operations, Environment Department, The World Bank. www.worldbank.org/montrealprotocol www.carbonfinance.org
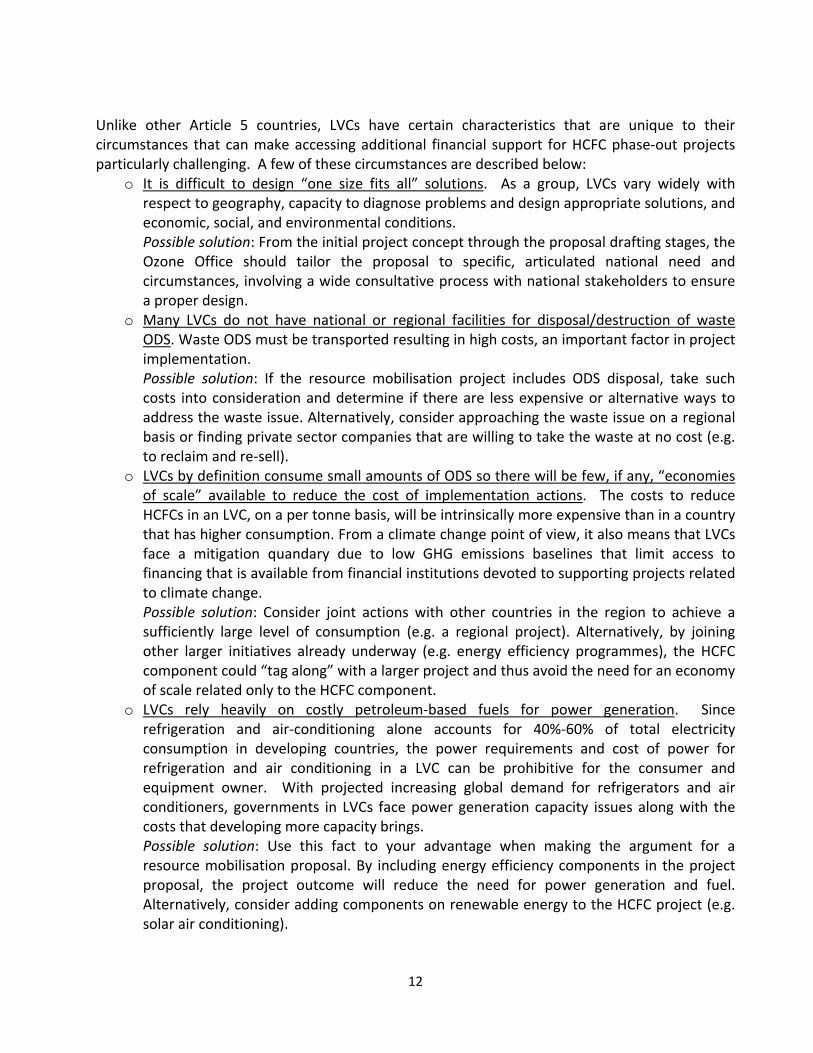
12
Unlike other Article 5 countries, LVCs have certain characteristics that are unique to their circumstances that can make accessing additional financial support for HCFC phase‐out projects particularly challenging. A few of these circumstances are described below:
o It is difficult to design “one size fits all” solutions. As a group, LVCs vary widely with respect to geography, capacity to diagnose problems and design appropriate solutions, and economic, social, and environmental conditions. Possible solution: From the initial project concept through the proposal drafting stages, the Ozone Office should tailor the proposal to specific, articulated national need and circumstances, involving a wide consultative process with national stakeholders to ensure a proper design.
o Many LVCs do not have national or regional facilities for disposal/destruction of waste ODS. Waste ODS must be transported resulting in high costs, an important factor in project implementation. Possible solution: If the resource mobilisation project includes ODS disposal, take such costs into consideration and determine if there are less expensive or alternative ways to address the waste issue. Alternatively, consider approaching the waste issue on a regional basis or finding private sector companies that are willing to take the waste at no cost (e.g. to reclaim and re‐sell).
o LVCs by definition consume small amounts of ODS so there will be few, if any, “economies of scale” available to reduce the cost of implementation actions. The costs to reduce HCFCs in an LVC, on a per tonne basis, will be intrinsically more expensive than in a country that has higher consumption. From a climate change point of view, it also means that LVCs face a mitigation quandary due to low GHG emissions baselines that limit access to financing that is available from financial institutions devoted to supporting projects related to climate change. Possible solution: Consider joint actions with other countries in the region to achieve a sufficiently large level of consumption (e.g. a regional project). Alternatively, by joining other larger initiatives already underway (e.g. energy efficiency programmes), the HCFC component could “tag along” with a larger project and thus avoid the need for an economy of scale related only to the HCFC component.
o LVCs rely heavily on costly petroleum‐based fuels for power generation. Since refrigeration and air‐conditioning alone accounts for 40%‐60% of total electricity consumption in developing countries, the power requirements and cost of power for refrigeration and air conditioning in a LVC can be prohibitive for the consumer and equipment owner. With projected increasing global demand for refrigerators and air conditioners, governments in LVCs face power generation capacity issues along with the costs that developing more capacity brings. Possible solution: Use this fact to your advantage when making the argument for a resource mobilisation proposal. By including energy efficiency components in the project proposal, the project outcome will reduce the need for power generation and fuel. Alternatively, consider adding components on renewable energy to the HCFC project (e.g. solar air conditioning).

13
o An LVC may have difficulty attracting financial support for its projects. It can be difficult for financial institutions to support projects in an LVC if the institution’s administrative fees assessed as a percentage against a small project are insufficient to cover the actual costs of the administrative support. Possible solution: This is a reality and must be taken into account during the design stage. Discuss with your Director ways in which the project could be combined with other projects to have sufficient project size that is sufficient to justify the administrative costs. Donors may also have special administrative provisions for smaller countries.
o Ozone Officers in LVCs may not have experience in resource mobilisation since it is not their traditional role. Typically there are limited human and institutional resources available in LVCs for activities such as investigation into options, donor consultations, preparation of proposals and establishment of national mechanisms (if needed) to receive funds. Possible solution: Within your limits, test the waters by pursuing one of the climate co‐benefits activities indicated in your country’s HPMPs. This will build your capacity and provide you with a baseline about how much time and effort is really involved. Consider it a learning experience.

14
3. PROGRESS SO FAR ON HCFC PHASE‐OUT IN LVCs WITH SERVICING ONLY AND WHAT THAT MEANS IN TERMS OF CLIMATE This section reviews the available data on HCFC phase‐out in LVCs with servicing only and sets out how much more must be achieved. It also discusses how to express HCFCs as greenhouse gases and makes the case for how seeking financing that has climate benefits when implementing the HPMP can open doors to financial support to supplement the Multilateral Fund. According to Montreal Protocol Article 7 data, LVCs with servicing only consume four types of HCFCs for RAC servicing:
HCFC‐22 is used as a refrigerant in several applications such as unitary air conditioners, cold storage, retail food refrigeration equipment, chillers, and industrial process refrigeration.
HCFC‐123 is used in the RAC sector mainly in centrifugal chillers for industrial process refrigeration and commercial comfort air conditioning.
HCFC‐124 is minimally used as a refrigerant; its primary use as a refrigerant is in blends in industrial processes and transport refrigeration equipment. It is used as a component in mixtures in some CFC‐12 drop‐in replacements. It replaces CFC‐114 in some heat pumps and special air conditioning equipment.
HCFC‐142b is used as a refrigerant only as a component of a few refrigerant blends. While HCFC‐142b refrigerant blends are approved as acceptable substitutes for CFC refrigerants in some end‐uses, their use is small and declining. R‐409A (composed of HFC‐125, HFC‐134a and HFC‐142a) is the most common refrigerant blend using HCFC‐142b.
Table 2 indicates the current status of consumption in LVCs with servicing only for the major HCFCs, based on the most recent data reported by countries under Article 7 of the Montreal Protocol. The table also presents the quantity of HCFCs planned to be phased out by Multilateral Fund‐supported projects that are currently being implemented, plus the remaining quantity of HCFCs still to be phased‐out (i.e. the difference of the first two columns).
Table 2. HCFC consumption status in LVCs with servicing only
Substance Consumption baseline (MT)
Quantity of HCFCs being phased out through approved projects (MT)
Quantity of HCFCs remaining to be phased out through approved
projects (MT)
HCFC‐22 209.36 82.23 127.13
HCFC‐123 .02 0.00 .02
HCFC‐124 .01 .01 .01
HCFC‐142b 1.81 1.11 .70
Total 211.2 83.35 127.86Source: Ozone Secretariat, Article 7 data
Based on these data, it is clear that 60% of the HCFC‐22, which is the vast majority of the HCFCs in LVCs with servicing only, remains to be phased out through Multilateral Fund projects. Because
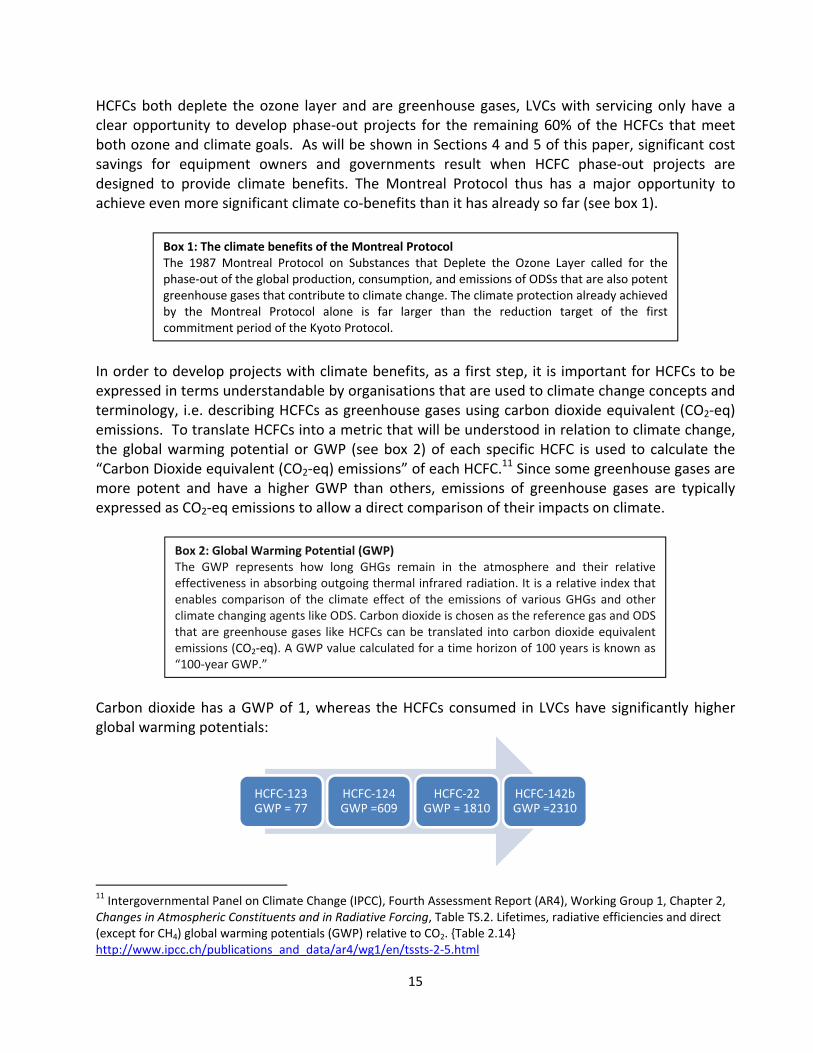
15
HCFCs both deplete the ozone layer and are greenhouse gases, LVCs with servicing only have a clear opportunity to develop phase‐out projects for the remaining 60% of the HCFCs that meet both ozone and climate goals. As will be shown in Sections 4 and 5 of this paper, significant cost savings for equipment owners and governments result when HCFC phase‐out projects are designed to provide climate benefits. The Montreal Protocol thus has a major opportunity to achieve even more significant climate co‐benefits than it has already so far (see box 1).
In order to develop projects with climate benefits, as a first step, it is important for HCFCs to be expressed in terms understandable by organisations that are used to climate change concepts and terminology, i.e. describing HCFCs as greenhouse gases using carbon dioxide equivalent (CO2‐eq) emissions. To translate HCFCs into a metric that will be understood in relation to climate change, the global warming potential or GWP (see box 2) of each specific HCFC is used to calculate the “Carbon Dioxide equivalent (CO2‐eq) emissions” of each HCFC.11 Since some greenhouse gases are more potent and have a higher GWP than others, emissions of greenhouse gases are typically expressed as CO2‐eq emissions to allow a direct comparison of their impacts on climate.
Carbon dioxide has a GWP of 1, whereas the HCFCs consumed in LVCs have significantly higher global warming potentials:
11 Intergovernmental Panel on Climate Change (IPCC), Fourth Assessment Report (AR4), Working Group 1, Chapter 2, Changes in Atmospheric Constituents and in Radiative Forcing, Table TS.2. Lifetimes, radiative efficiencies and direct (except for CH4) global warming potentials (GWP) relative to CO2. {Table 2.14} http://www.ipcc.ch/publications_and_data/ar4/wg1/en/tssts‐2‐5.html
HCFC‐123 GWP = 77
HCFC‐124 GWP =609
HCFC‐22 GWP = 1810
HCFC‐142b GWP =2310
Box 1: The climate benefits of the Montreal ProtocolThe 1987 Montreal Protocol on Substances that Deplete the Ozone Layer called for the phase‐out of the global production, consumption, and emissions of ODSs that are also potent greenhouse gases that contribute to climate change. The climate protection already achieved by the Montreal Protocol alone is far larger than the reduction target of the first commitment period of the Kyoto Protocol.
Box 2: Global Warming Potential (GWP) The GWP represents how long GHGs remain in the atmosphere and their relative effectiveness in absorbing outgoing thermal infrared radiation. It is a relative index that enables comparison of the climate effect of the emissions of various GHGs and other climate changing agents like ODS. Carbon dioxide is chosen as the reference gas and ODS that are greenhouse gases like HCFCs can be translated into carbon dioxide equivalent emissions (CO2‐eq). A GWP value calculated for a time horizon of 100 years is known as “100‐year GWP.”

16
For reference, the GWP of HFC‐134a, which is one of the main alternatives for HCFC‐22 identified in the HPMPs of LVCs, is 1430. To calculate the CO2‐eq for HCFCs, the metric tonnes of the different HCFCs are multiplied by their specific GWP.
HCFC MT x GWP = CO2‐eq Table 3 presents the total CO2‐eq emissions for HCFCs in the LVCs with servicing only in terms of the baseline, the quantity of HCFCs already being phased out through approved projects and the remaining quantity of HCFCs that can be incorporated into phase‐out projects that can achieve climate benefits.
Table 3. CO2‐eq emissions of HCFCs in LVCs with servicing only, based on their GWPs12
Substance Consumption baseline (MT)
Consumption baseline
expressed in CO2‐eq
emissions
HCFCs being phased out through approved projects
expressed in CO2‐eq
emissions
HCFCs remaining to be phased out
through approved projects
expressed in CO2‐eq
emissions
HCFC‐22 209.36 378,941.60 148,836.30 230,105.30
HCFC‐123 .02 1.50 00 1.50
HCFC‐124 .01 6.10 6.10 6.10
HCFC‐142b 1.81 4,181.10 2,564.00 1,617.00
Total 211.20 383,130.30 151,406.40 231,729.90
The 59 LVCs with servicing only have a significant quantity CO2‐eq emissions of HCFCs remaining to be phased‐out and from which climate benefits would be worth pursuing. To support Ozone Officers in their efforts to design projects that bring climate benefits and attract financial assistance for their projects, the next two sections present information and guidance on the current status of HCFC alternatives, potential climate benefits from the HCFC phase‐out and sources of financial support outside of the Multilateral Fund.
12 Most current Montreal Protocol Article 7 data and Intergovernmental Panel on Climate Change (IPCC), Fourth Assessment Report (AR4), Working Group 1, Chapter 2, Changes in Atmospheric Constituents and in Radiative Forcing, Table TS.2. Lifetimes, radiative efficiencies and direct (except for CH4) global warming potentials (GWP) relative to CO2. {Table 2.14} http://www.ipcc.ch/publications_and_data/ar4/wg1/en/tssts‐2‐5.html

17
4. OVERVIEW OF ALTERNATIVES FOR HCFC IN REFRIGERATION AND AIR CONDITIONING
The alternatives for HCFCs in the RAC sector are briefly introduced in this section along with a review of how to achieve climate benefits in the HCFC phase‐out as it relates to the servicing sector, through the selection of appropriate alternatives. This section makes the case for seeking financing to support climate benefits when implementing the HPMP. It is important that the HCFC phase‐out under the Montreal Protocol does not add to the deterioration of the climate through the use of HFCs that are potent greenhouse gases. The May 2011 Progress Report of the Technology and Economic Assessment Panel stated that “the challenge is to phase out HCFCs while avoiding high‐GWP HFCs and while achieving high energy efficiency using technology that is safe and environmentally acceptable.”13 The Executive Committee encourages Article 5 countries during the implementation of their HPMPs to consider measures to facilitate the introduction of energy efficient and climate friendly alternatives.14 According to Minimizing Adverse Climate Impact of HCFC Phase‐out in the Refrigeration Servicing Sector, when it comes to HCFC phase‐out in the refrigeration servicing sector, adverse impacts on the climate refers to an increase in emissions of GHGs (expressed in CO2‐eq. emissions) with respect to whatever is the current situation. Emissions can change with respect to “direct” emissions from the refrigeration sector that occur when GHG refrigerants are released in substantial quantities during manufacturing, installation, servicing and decommissioning/replacement of refrigeration equipment. The emissions per system tend to increase with increasing refrigerant charge of the equipment and increasing repair of the refrigeration cycle. Many of the refrigerants that are GHGs have high global warming potential. Emissions can also change with respect to “indirect” emissions from the refrigeration sector. Indirect emissions are those released by the power source when electricity is generated to run the RAC equipment. Indirect emissions can be very significant in terms of GHGs when the electric power used to power RAC equipment is generated by fossil fuel combustion (e.g. oil, diesel, coal), which is most often the case in LVCs (see box 3). Box 3: Lesson learned Savings related to electricity, whether at the individual consumer level or from avoided generation capacity, dominate. When comparing the direct climate benefit arising from reductions in emissions associated with the replacement of HCFCs (given the intrinsic global warming potential of the refrigerant) with the indirect benefit associated with energy savings from new equipment (from the lower electricity consumption), the value of the
13 Progress Report of the Technology and Economic Assessment Panel, May 2011, Volume 1 http://ozone.unep.org/Assessment_Panels/TEAP/Reports/TEAP_Reports/TEAP_Progress_Report_May_2011.pdf 14 Multilateral Fund Secretariat, Minimizing Adverse Climate Impact of HCFC Phase‐out in the Refrigeration Servicing Sector (UNEP/OzL.Pro/ExCom/72/42), para 44(c)(ii).

18
indirect benefit is larger… from a country perspective, it is energy security benefits that drive policy making directed at the RAC sector, with climate mitigation and ODS phase‐out as secondary objectives only.15
— World Bank resource mobilization project
In meeting the Montreal Protocol requirement to phase out HCFCs, HFCs, hydrofluoroolefins (HFOs) including HFO‐1234yf, HFO‐1234ze, ‐1233zd(E), blends containing HFOs and natural refrigerants are the major replacements in many RAC applications. As a general differentiation, “natural refrigerants” are substances that exist naturally in the environment, while ”non‐natural refrigerants” or “synthetic refrigerants” such as HFCs and HFOs are man‐made chemicals, not naturally occurring in nature. The most commonly used natural refrigerants today are ammonia (NH3, R717), carbon dioxide (CO2, R744), and hydrocarbons (HCs), such as propane (R290), isobutane (R600a), and propylene, also known as propene (R1270). Water and air are also used, to a lesser extent, for example in adsorption chillers and deep‐freezing applications. The alternatives for HCFC refrigerants in the RAC sector differ in terms of their GWP, energy efficiency, toxicity, flammability and cost both as refrigerants and in terms of system or design change costs required to accommodate them in existing equipment. Discussions about the alternatives and comparisons between them are being updated constantly as industry and governments look for ways to best meet the HCFC phase‐out challenge. A number of websites maintain and provide up‐to‐date information on the technology options for alternative refrigerants in the refrigeration sector including the following:
UNEP Ozone Secretariat Technology and Economic Assessment Panel (TEAP) http://ozone.unep.org/Assessment_Panels/TEAP/Reports/TEAP_Reports
Regional Networks of Ozone Officers http://www.unep.org/ozonaction/RegionalNetworks/tabid/6203/Default.aspx
OzonAction Contacts Partnerships and Information Resources http://www.unep.org/ozonaction/InformationResources/Contacts/tabid/6549/Default.aspx
Information Clearinghouse (including the OzoNews electronic news service) http://www.unep.org/ozonaction/Home/tabid/5467/Default.aspx
United States Environmental Protection Agency Greenchill partnership with food retailers to reduce refrigerant emissions and decrease their impact on the ozone layer and climate change. http://www2.epa.gov/greenchill
Wikipedia lists all the refrigerants with all the technical data http://en.wikipedia.org/wiki/List_of_refrigerants
To add to these useful information sources are studies such as the November 2013, UNIDO Guide 2013: Natural Solutions for Developing Countries including UNIDO Atmosphere Summary Report16
15 World Bank Final Report on Resource Mobilization for HCFC Phase‐out and Climate Mitigation Co–Benefits, p. iii (UNEP/OzL.Pro/ExCom/71/6/Add.1). 16 United Nations Industrial Development Organization, SHECCO SPRL. Guide 2013: Natural Solutions for Developing Countries including UNIDO Atmosphere Summary Report. November 2013 http://www.unido.org/fileadmin/user_media_upgrade/What_we_do/Topics/Multilateral_environmental_agreements/GUIDE‐UNIDO‐natural‐substances‐2013‐small.pdf
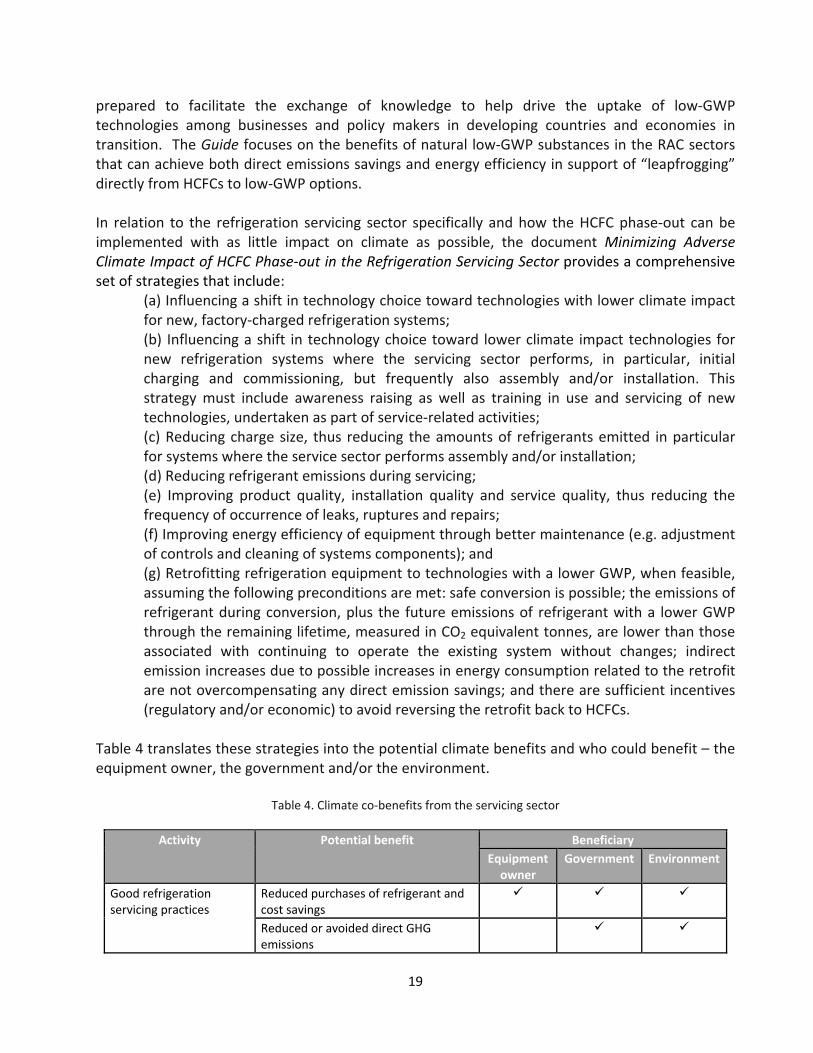
19
prepared to facilitate the exchange of knowledge to help drive the uptake of low‐GWP technologies among businesses and policy makers in developing countries and economies in transition. The Guide focuses on the benefits of natural low‐GWP substances in the RAC sectors that can achieve both direct emissions savings and energy efficiency in support of “leapfrogging” directly from HCFCs to low‐GWP options. In relation to the refrigeration servicing sector specifically and how the HCFC phase‐out can be implemented with as little impact on climate as possible, the document Minimizing Adverse Climate Impact of HCFC Phase‐out in the Refrigeration Servicing Sector provides a comprehensive set of strategies that include:
(a) Influencing a shift in technology choice toward technologies with lower climate impact for new, factory‐charged refrigeration systems; (b) Influencing a shift in technology choice toward lower climate impact technologies for new refrigeration systems where the servicing sector performs, in particular, initial charging and commissioning, but frequently also assembly and/or installation. This strategy must include awareness raising as well as training in use and servicing of new technologies, undertaken as part of service‐related activities; (c) Reducing charge size, thus reducing the amounts of refrigerants emitted in particular for systems where the service sector performs assembly and/or installation; (d) Reducing refrigerant emissions during servicing; (e) Improving product quality, installation quality and service quality, thus reducing the frequency of occurrence of leaks, ruptures and repairs; (f) Improving energy efficiency of equipment through better maintenance (e.g. adjustment of controls and cleaning of systems components); and (g) Retrofitting refrigeration equipment to technologies with a lower GWP, when feasible, assuming the following preconditions are met: safe conversion is possible; the emissions of refrigerant during conversion, plus the future emissions of refrigerant with a lower GWP through the remaining lifetime, measured in CO2 equivalent tonnes, are lower than those associated with continuing to operate the existing system without changes; indirect emission increases due to possible increases in energy consumption related to the retrofit are not overcompensating any direct emission savings; and there are sufficient incentives (regulatory and/or economic) to avoid reversing the retrofit back to HCFCs.
Table 4 translates these strategies into the potential climate benefits and who could benefit – the equipment owner, the government and/or the environment.
Table 4. Climate co‐benefits from the servicing sector
Activity Potential benefit Beneficiary
Equipment owner
Government Environment
Good refrigeration servicing practices
Reduced purchases of refrigerant and cost savings
Reduced or avoided direct GHG emissions

20
Activity Potential benefit Beneficiary
Equipment owner
Government Environment
Replacement of high‐GWP refrigerants with low‐ or zero‐GWP refrigerants
Reduced GWP of refrigerants
Replacement of vapour‐compression equipment with equipment based on different cycles (e.g. adsorption)
Reduced or avoided direct GHG emissions
Reduction of energy consumption (cost savings)
Reduced need for additional electricity generation capacity (power plants) and/or fuel imports
Improved energy efficiency of replacement technology
Reduction of energy consumption (cost savings)
Reduced need for additional electricity generation capacity (power plants) and/or fuel imports
Building design that avoids/minimizes need for refrigeration
Reduction of energy consumption (cost savings)
Reduction or avoidance of direct GHG emissions
Recovery and recycling of refrigerants
Reduced requirement for importing/purchasing new refrigerants
Destruction or disposal of waste/contaminated ODS
Reduction or avoidance of direct GHG emissions
Refrigerant conversion/retrofits
Reduction or avoidance of direct GHG emissions
Reduced need for additional electricity generation capacity (power plants) and/or fuel imports
It is clear that the main benefits of the range of activities to phase out HCFCs within the refrigeration servicing sector are fewer GHG emissions and cost savings for the consumer or equipment owner and governments. These benefits are driven by increased energy efficiency in equipment using alternatives for HCFCs that are low in GWP or are neither GHGs nor ODS (see box 4).
Box 4: Lesson learned A high and fluctuating cost of electricity is a considered to be a strong economic driver for the replacement of some types of RAC equipment, e.g. chillers. 17
— Multilateral Fund chiller project desk study
A 2007 study by the International Energy Agency (IEA) examined the potential for reducing energy use in the air conditioning sector in an importing country that had to overcome barriers from a
17 Multilateral Fund Desk Study on the Evaluation of Chiller Projects (UNEP/OzL.Pro/ExCom/68/10), para 11.

21
lack of standards enforcement or advanced technologies to market penetration of air conditioners with higher energy efficiency ratings (EER). Table 5 estimates the potential decrease in GHG emissions in two Article 5 countries that would result from improving the energy efficiency rating of air conditioners.18
Table 5. Potential GHG emission reductions from reducing energy use in air conditioners
Country Baseline EER Targeted EER Units Sold/Year CO2 Emission Reduction (MT)
Ghana 2.55 2.8 100,000 3 million
China 3.4 5.00 4‐18 million 28‐61 million
Added to the decrease in CO2 emissions due to the increased EER in the air conditioners, would be a reduction in costs for the equipment owner in relation to power consumption and reduced costs for the government in terms of power generation including imports of fuel. Some LVCs have begun exploring opportunities along these lines. For example, the Cook Islands has a programme designed to reduce energy consumption and costs to governments and consumers by replacing refrigerators and freezers with energy efficient appliances (see box 5).
5. FINANCING OPTIONS AVAILABLE TO LVCs SEEKING SUPPORT FOR CLIMATE BENEFITS The preceding sections of this document highlighted that LVCs with servicing only have unique characteristics that can make accessing financing for HPMPs challenging. They also explained how
18 Leveraging Support for HCFC Phase‐out: Opportunities and Modalities for Pursuing Linkages with the Climate Change Agenda. Montreal Protocol Operations, Environment Department, The World Bank. www.worldbank.org/montrealprotocol www.carbonfinance.org
Box 5: Fridge and Freezer Replacement Program in Cook Islands to Reduce Energy Consumption A program announced in May 2012 for the Cook Islands is intended to reduce energy consumption in the residential, commercial and public sectors through the implementation of energy efficiency measures, and to establish policy frameworks to help Cook Islands move away from fossil fuel dependency. The program will reduce electricity consumption in the Cook Islands by promoting high energy efficient fridge/freezers. The Fridge and Freezer Replacement Program will encourage households to replace old inefficient fridges and freezers of 5 years or older with high energy efficient equipment. Participating retailers in the Cook Islands are being subsidized to offer rebates between 125USD and 410USD to customers purchasing selected high efficient fridge/freezer models, in exchange for their old, working fridges and freezers of similar capacity. Estimates are that approximately 40% of household electricity costs in Cook Islands are for refrigeration and that energy efficient fridges and freezers will save the average household an estimated 165USD to 245USD per year on electricity bills which would be a reduction of electricity consumption of approximately 20‐30% for each participating household. The fridge/freezer replacement program seeks to initially target 325 households in Cook Islands over a one year period. Significant cost savings in household electricity bills and increased awareness of energy appliance labeling and the benefits of using energy efficient appliances are also expected benefits of the program. The program is co‐financed by the Asian Development Bank (ADB), the Government of Australia, the Global Environment Facility (GEF) and the Asian Clean Energy Fund under the Clean Energy Financing Partnership and includes the participation of the Government of the Cook Islands, and the white goods retailers ‐Motor Centre and the Cook Islands Trading Corporation Limited.
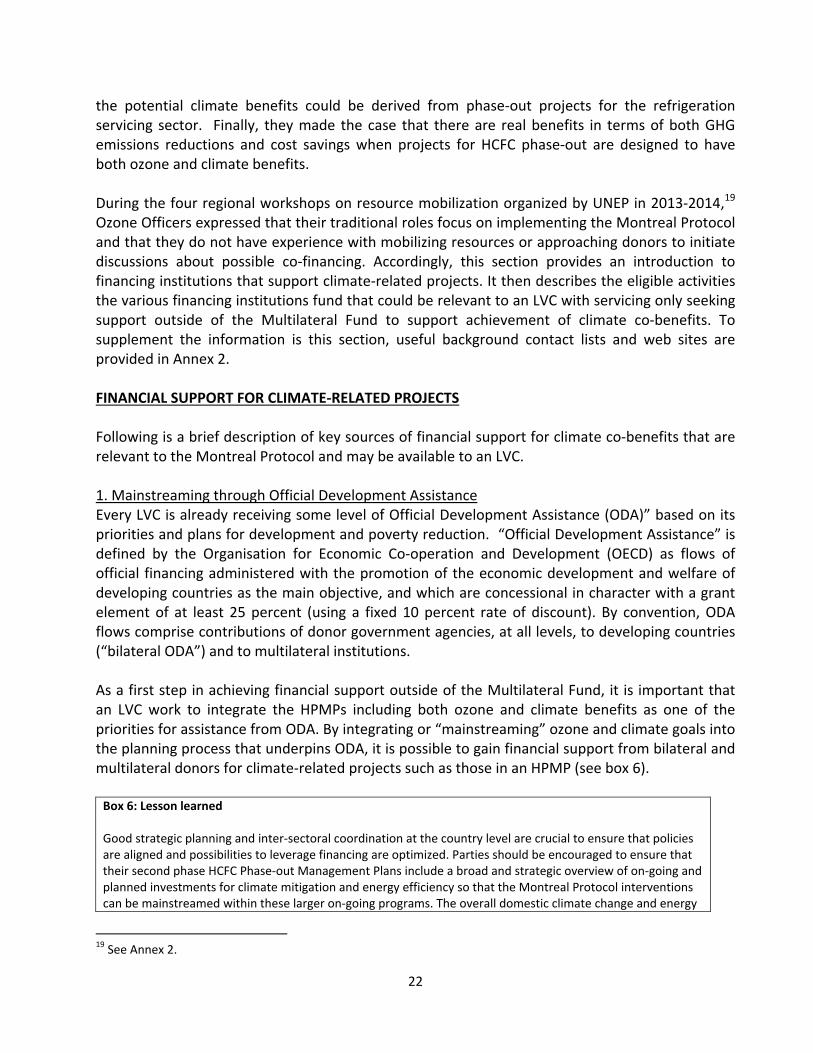
22
the potential climate benefits could be derived from phase‐out projects for the refrigeration servicing sector. Finally, they made the case that there are real benefits in terms of both GHG emissions reductions and cost savings when projects for HCFC phase‐out are designed to have both ozone and climate benefits. During the four regional workshops on resource mobilization organized by UNEP in 2013‐2014,19 Ozone Officers expressed that their traditional roles focus on implementing the Montreal Protocol and that they do not have experience with mobilizing resources or approaching donors to initiate discussions about possible co‐financing. Accordingly, this section provides an introduction to financing institutions that support climate‐related projects. It then describes the eligible activities the various financing institutions fund that could be relevant to an LVC with servicing only seeking support outside of the Multilateral Fund to support achievement of climate co‐benefits. To supplement the information is this section, useful background contact lists and web sites are provided in Annex 2. FINANCIAL SUPPORT FOR CLIMATE‐RELATED PROJECTS Following is a brief description of key sources of financial support for climate co‐benefits that are relevant to the Montreal Protocol and may be available to an LVC. 1. Mainstreaming through Official Development Assistance Every LVC is already receiving some level of Official Development Assistance (ODA)” based on its priorities and plans for development and poverty reduction. “Official Development Assistance” is defined by the Organisation for Economic Co‐operation and Development (OECD) as flows of official financing administered with the promotion of the economic development and welfare of developing countries as the main objective, and which are concessional in character with a grant element of at least 25 percent (using a fixed 10 percent rate of discount). By convention, ODA flows comprise contributions of donor government agencies, at all levels, to developing countries (“bilateral ODA”) and to multilateral institutions. As a first step in achieving financial support outside of the Multilateral Fund, it is important that an LVC work to integrate the HPMPs including both ozone and climate benefits as one of the priorities for assistance from ODA. By integrating or “mainstreaming” ozone and climate goals into the planning process that underpins ODA, it is possible to gain financial support from bilateral and multilateral donors for climate‐related projects such as those in an HPMP (see box 6). Box 6: Lesson learned Good strategic planning and inter‐sectoral coordination at the country level are crucial to ensure that policies are aligned and possibilities to leverage financing are optimized. Parties should be encouraged to ensure that their second phase HCFC Phase‐out Management Plans include a broad and strategic overview of on‐going and planned investments for climate mitigation and energy efficiency so that the Montreal Protocol interventions can be mainstreamed within these larger on‐going programs. The overall domestic climate change and energy
19 See Annex 2.
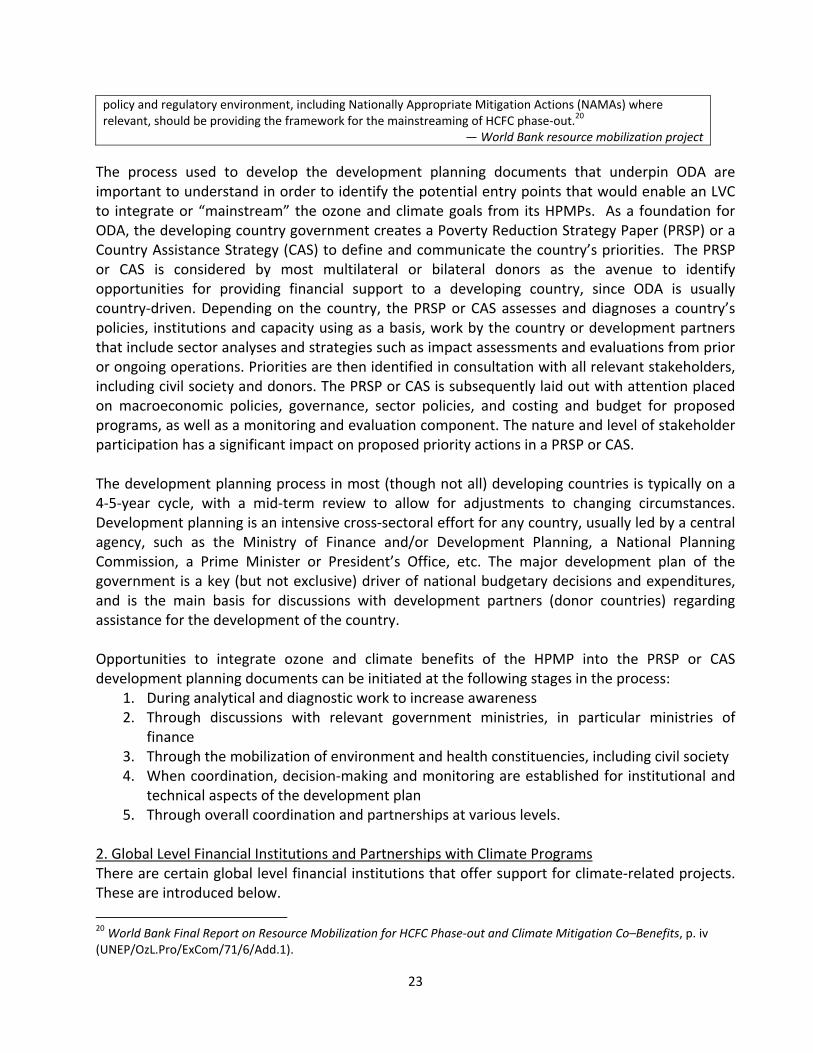
23
policy and regulatory environment, including Nationally Appropriate Mitigation Actions (NAMAs) where relevant, should be providing the framework for the mainstreaming of HCFC phase‐out.20
— World Bank resource mobilization project
The process used to develop the development planning documents that underpin ODA are important to understand in order to identify the potential entry points that would enable an LVC to integrate or “mainstream” the ozone and climate goals from its HPMPs. As a foundation for ODA, the developing country government creates a Poverty Reduction Strategy Paper (PRSP) or a Country Assistance Strategy (CAS) to define and communicate the country’s priorities. The PRSP or CAS is considered by most multilateral or bilateral donors as the avenue to identify opportunities for providing financial support to a developing country, since ODA is usually country‐driven. Depending on the country, the PRSP or CAS assesses and diagnoses a country’s policies, institutions and capacity using as a basis, work by the country or development partners that include sector analyses and strategies such as impact assessments and evaluations from prior or ongoing operations. Priorities are then identified in consultation with all relevant stakeholders, including civil society and donors. The PRSP or CAS is subsequently laid out with attention placed on macroeconomic policies, governance, sector policies, and costing and budget for proposed programs, as well as a monitoring and evaluation component. The nature and level of stakeholder participation has a significant impact on proposed priority actions in a PRSP or CAS. The development planning process in most (though not all) developing countries is typically on a 4‐5‐year cycle, with a mid‐term review to allow for adjustments to changing circumstances. Development planning is an intensive cross‐sectoral effort for any country, usually led by a central agency, such as the Ministry of Finance and/or Development Planning, a National Planning Commission, a Prime Minister or President’s Office, etc. The major development plan of the government is a key (but not exclusive) driver of national budgetary decisions and expenditures, and is the main basis for discussions with development partners (donor countries) regarding assistance for the development of the country. Opportunities to integrate ozone and climate benefits of the HPMP into the PRSP or CAS development planning documents can be initiated at the following stages in the process:
1. During analytical and diagnostic work to increase awareness 2. Through discussions with relevant government ministries, in particular ministries of
finance 3. Through the mobilization of environment and health constituencies, including civil society 4. When coordination, decision‐making and monitoring are established for institutional and
technical aspects of the development plan 5. Through overall coordination and partnerships at various levels.
2. Global Level Financial Institutions and Partnerships with Climate Programs There are certain global level financial institutions that offer support for climate‐related projects. These are introduced below.
20 World Bank Final Report on Resource Mobilization for HCFC Phase‐out and Climate Mitigation Co–Benefits, p. iv (UNEP/OzL.Pro/ExCom/71/6/Add.1).

24
The World Bank (www.worldbank.org). Financing climate change is an important part of the World Bank Group's business. This focus has resulted in financing flowing to support low‐emissions and resilient development. For example, mitigation support for the world's poorest countries through the Bank's International Development Association (IDA)21 reached USD 2.3 billion during fiscal year 2013, while the International Finance Corporation’s (IFC)22 mitigation financing increased 50 percent to USD 2.5 billion. The World Bank has demonstrated innovative ways to mobilize additional resources to finance climate action by working with partners. The most notable success has been the USD 7.3 billion Climate Investment Funds (CIFs),23 which are playing a key role in meeting international objectives regarding climate change. The World Bank is trustee of 15 carbon finance initiatives. The Carbon Finance Unit (CFU)24 supports more than 150 projects through purchase of about 220 million metric tonnes of CO2 equivalent emissions.
The World Bank helps countries to assess and manage climate risks and provide analytical guidance. Portals such as the Climate Change Knowledge Portal25 and the Climate Finance Options Platform26 provide cutting edge information, analysis, and tools on climate change. Increasingly, the Bank is engaging in strategic partnerships to both deepen the climate change knowledge base for clients and to address critical issues such as low‐GWP refrigerants. Within the context of Climate Finance is the certified emission reduction (CER) which is a unit representing one tonne of carbon dioxide‐equivalent (CO2‐e) sequestered or abated. CERs are issued to project participants in Clean Development Mechanism (CDM) projects pursuant to Article 12 of the Kyoto Protocol and the CDM modalities and procedures.27 CERs have, in the past, been important sources of financial support for climate‐related projects. In August 2008 prices for CERS were USD 20 per tonne but by October 2012, CER prices had fallen to €1.36 per tonne on the London ICE Futures Europe exchange. In October 2012 Thomson Reuters Point Carbon calculated that the oversupply of units from the CDM and Joint Implementation would be 1,400 million units for the period up to 2020.28 It is unlikely, therefore, that CERs will prove to be a feasible source of financial support for an HPMP for the coming years. Global Environment Facility (GEF) (http://www.thegef.org/gef/). The GEF has served as the largest provider of grants to address climate change for the past 20 years. Its goal is to transform the market development paths for eligible countries into trajectories with lower
21International Development Association (IDA) http://www.worldbank.org/ida/ 22International Finance Corporation (IFC) http://www.ifc.org/wps/wcm/connect/corp_ext_content/ifc_external_corporate_site/home 23 http://treasury.worldbank.org/cmd/htm/index.html 24 http://www.worldbank.org/en/topic/climatefinance 25 http://sdwebx.worldbank.org/climateportal/index.cfm?page=why_climate_change 26 http://www.climatefinanceoptions.org/cfo/index.php 27 Clean Development Mechanism: Rules, Practice and Procedures. http://cdmrulebook.org/304 28 Wikipedia, the free encyclopedia. http://en.wikipedia.org/wiki/Certified_Emission_Reduction
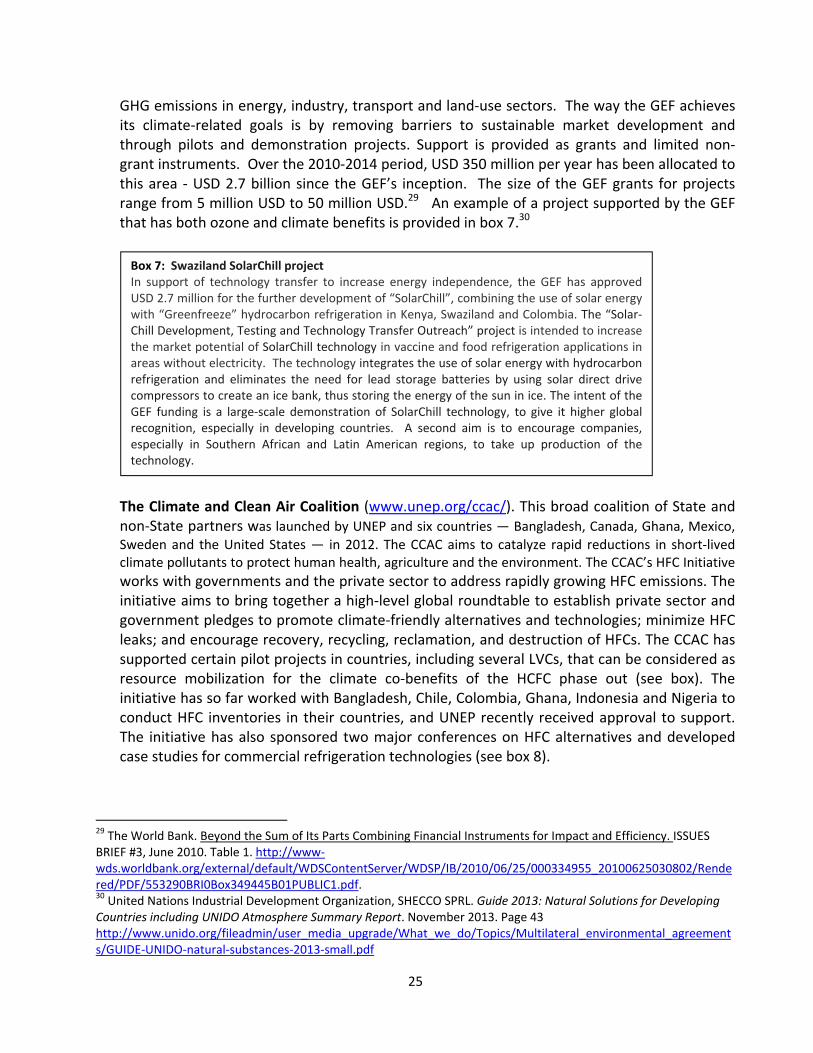
25
GHG emissions in energy, industry, transport and land‐use sectors. The way the GEF achieves its climate‐related goals is by removing barriers to sustainable market development and through pilots and demonstration projects. Support is provided as grants and limited non‐grant instruments. Over the 2010‐2014 period, USD 350 million per year has been allocated to this area ‐ USD 2.7 billion since the GEF’s inception. The size of the GEF grants for projects range from 5 million USD to 50 million USD.29 An example of a project supported by the GEF that has both ozone and climate benefits is provided in box 7.30
The Climate and Clean Air Coalition (www.unep.org/ccac/). This broad coalition of State and non‐State partners was launched by UNEP and six countries — Bangladesh, Canada, Ghana, Mexico,
Sweden and the United States — in 2012. The CCAC aims to catalyze rapid reductions in short‐lived climate pollutants to protect human health, agriculture and the environment. The CCAC’s HFC Initiative
works with governments and the private sector to address rapidly growing HFC emissions. The initiative aims to bring together a high‐level global roundtable to establish private sector and government pledges to promote climate‐friendly alternatives and technologies; minimize HFC leaks; and encourage recovery, recycling, reclamation, and destruction of HFCs. The CCAC has supported certain pilot projects in countries, including several LVCs, that can be considered as resource mobilization for the climate co‐benefits of the HCFC phase out (see box). The initiative has so far worked with Bangladesh, Chile, Colombia, Ghana, Indonesia and Nigeria to conduct HFC inventories in their countries, and UNEP recently received approval to support. The initiative has also sponsored two major conferences on HFC alternatives and developed case studies for commercial refrigeration technologies (see box 8).
29 The World Bank. Beyond the Sum of Its Parts Combining Financial Instruments for Impact and Efficiency. ISSUES BRIEF #3, June 2010. Table 1. http://www‐wds.worldbank.org/external/default/WDSContentServer/WDSP/IB/2010/06/25/000334955_20100625030802/Rendered/PDF/553290BRI0Box349445B01PUBLIC1.pdf. 30 United Nations Industrial Development Organization, SHECCO SPRL. Guide 2013: Natural Solutions for Developing Countries including UNIDO Atmosphere Summary Report. November 2013. Page 43 http://www.unido.org/fileadmin/user_media_upgrade/What_we_do/Topics/Multilateral_environmental_agreements/GUIDE‐UNIDO‐natural‐substances‐2013‐small.pdf
Box 7: Swaziland SolarChill project In support of technology transfer to increase energy independence, the GEF has approved USD 2.7 million for the further development of “SolarChill”, combining the use of solar energy with “Greenfreeze” hydrocarbon refrigeration in Kenya, Swaziland and Colombia. The “Solar‐Chill Development, Testing and Technology Transfer Outreach” project is intended to increase the market potential of SolarChill technology in vaccine and food refrigeration applications in areas without electricity. The technology integrates the use of solar energy with hydrocarbon refrigeration and eliminates the need for lead storage batteries by using solar direct drive compressors to create an ice bank, thus storing the energy of the sun in ice. The intent of the GEF funding is a large‐scale demonstration of SolarChill technology, to give it higher global recognition, especially in developing countries. A second aim is to encourage companies, especially in Southern African and Latin American regions, to take up production of the technology.
26
Box 8: Lesson learned The CCAC experience was successful with the approved feasibility study for Maldives, with an “out of the box” approach regarding technology choices, such as District Cooling. UNDP believes that once the study is finalized this demonstration project could be used by other countries, especially SIDS. 31
— UNDP resource mobilization project
3. Regional Financial Institutions that support Climate Benefits Financial institutions at the regional level that support climate‐related goals are very important to LVCs with servicing only. As discussed in Section 3, the fact that individual LVCs have less HCFCs to phase‐out and therefore less CO2 equivalent emissions to avoid can make access to financial support difficult. An LVC by itself may, therefore, not be able to find support for its own ozone and climate‐related projects. On the other hand, a regional approach for LVCs could attract more interest among financial institutions. There is, therefore, value in exploring a regional approach by collaborating with other LVCs to seek support from a financial institution that has a regional focus. Regional‐level financial institutions can also be a valuable source of advice and can bring together a number of public and private sources of finance for support in project development and implementation. An example of this is the project to promote energy efficiency in Cook Islands, Samoa, Tonga, Vanuatu and Papua New Guinea (see box 9).32
Regional Development Banks through which LVCs could find support for mitigation projects with climate co‐benefits as well as support regionally in coordinating donors and mobilizing co‐financing. o The Asian Development Bank (ADB)33, based in Manila, is dedicated to reducing poverty in Asia
and the Pacific through inclusive economic growth, environmentally sustainable growth and regional integration. Established in 1966, it is owned by 67 members – 48 from the region. In 2012, ADB assistance totaled USD 21.6 billion, including co‐financing of USD 8.3 billion. The ADB is providing financial and other assistance to implement solutions, providing technical
31 UNDP Final Report on Resource Mobilisation for Climate Co‐Benefits, p. 6 (UNEP/OzL.Pro/ExCom/71/6/Add.1). 32 Promoting Energy Efficiency in the Pacific Phase 2. http://www.ee‐pacific.net/ 33 Asian Development Bank. Mainstreaming climate change in ADB operations—Climate change implementation plan for the Pacific. Mandaluyong City, Philippines. 2009. Page 10 http://www.adb.org/publications/mainstreaming‐climate‐change‐adb‐operations‐climate‐change‐implementation‐plan‐pacific
Box 9: Promoting Energy Efficiency in the PacificThe Cook Islands, Samoa, Tonga, Vanuatu and Papua New Guinea have developed an innovative project for the GEF to be co‐financed by the Asian Development Bank (14%), Governments of Cook Islands, Samoa, Tonga, and Vanuatu (26%), Power Utilities & Private Sector (24%), Government of Australia (14%) and Government of Japan (22%). The proposed project will result in the reduction in electricity and fuel consumption due to higher energy efficiency. The electricity and fuel saved from the successful implementation of the project will lead to a reduction of carbon dioxide emissions, which is estimated at 42,851 tons of CO2 annually and an emissions reduction impact of 642,765 tons CO2 over a 15‐year period. Such an innovative regional project should provide inspiration for other countries to consider similar approaches related to the climate benefits of the HCFC phase out.

27
assistance, grants, and loans, in combination with access to mitigation funds (e.g., the in‐house Asia Pacific Carbon Fund and Future Carbon Fund) and adaptation funds (e.g., the Water Financing Partnership Facility, and Adaptation Fund). ADB is an implementing agency of the GEF. ADB plays an important role in the Pacific region in donor coordination and mobilization of co‐financing.
o Inter‐American Development Bank (IADB)34 In IADB’s International Climate Programs and Finance, the Bank has a capacity to facilitate access to international sources of climate finance. Key sources of finance include: funds under the UN Framework Convention on Climate Change (UNFCCC) such as the GEF (particularly its climate window); carbon finance including the Kyoto Protocol’s CDM; the CIF and the Adaptation Fund.
o Caribbean Development Bank (CDB)35 The CDB Strategic Plan 2010‐2014 outlines the climate change focus for the bank. Since many of the LVCs in the Caribbean region are Small Island Developing States (SIDS) that are particularly vulnerable to the effects of climate change, the CDB views assistance to its member States as support “to develop and implement mitigation and adaptation measures as a pro‐growth strategy for the longer term.” The CDB also sees the value of mainstreaming climate risk management in CAS papers and sector policies and strategies and of developing internal capacity within CDB to take on board climate change risk management, prepare and use climate risks tools, and develop external partnerships and networks.
o African Development Bank (AfDB)36 The AfDB plays a role in backing climate change mitigation
initiatives with its own resources, including leveraging financing from other sources, to incite investor confidence and participation in this emerging area. AfDB is working alongside other development partners including other Multilateral Development Banks (MDBs), UN organizations and bilateral development agencies to implement interventions that help Africa adapt to a changing climate as well as mitigate its risks. The AfDB has embarked on an ambitious program at powering a low‐carbon pathway in Africa. Through the Energy, Environment and Climate Change Department, the Bank serves as a platform to deliver advisory services necessary to mobilize transformative environment and climate finance, including assisting countries with projects to access carbon markets. Funds channeled through financing windows such as the CIF, the GEF, a recently created Sustainable Energy Fund for Africa (SEFA), the first phase of African Carbon Support Programme (ACSP), and the new Africa Hub of the Sustainable Energy for All Initiative (SE4ALL) are directly invested to support the transport, communications, agriculture, water and energy sectors. The
34 Inter‐American Development Bank. IDB Integrated Strategy for Climate Change Adaptation and Mitigation, and Sustainable and Renewable Energy. March 18, 2011. http://www.iadb.org/en/civil‐society/public‐consultations/climate‐change‐strategy/climate‐change‐strategy,6974.html 35 Caribbean Development Bank (CDB). Strategic Plan 2010 – 2014 (Approved at the Two Hundred and Forty‐First Meeting of the Board of Directors Held in The Bahamas on May 17, 2010). http://www.caribank.org/uploads/2012/03/Strategic_Plan2010_to_2014.pdf. 36 African Development Bank Group. http://www.afdb.org/en/
28
goal is to ensure that climate finance effectively reaches the continent and is tailored to Africa’s needs.37
o European Bank for Reconstruction and Development (EBRD)38 The overall goal of the EBRD is to foster transition to market economies in countries from Central and Eastern Europe to Central Asia and the Southern and Eastern Mediterranean. Underlying the work of the Bank is its Environmental and Social Policy39 in which the EBRD states its intention to “support climate change mitigation and adaptation, in particular by investing in energy efficiency and renewable energy projects and by supporting best practices in climate change adaptation.” In addition to support for projects, the EBRD also is developing financing instruments that could be of interest to an NOU seeking support for climate co‐benefits.
4. Government Support for Climate Benefits as Bilateral Donors Funding organizations from other governments also play an important role in financial support to LVCs. Bilateral projects that are organized under the auspices of the Multilateral Fund as part of a Party’s contributions to Multilateral Fund funding are not described here, since that assistance is officially part of the ODA provided to developing countries. Rather, this sub‐section describes government organizations that provide funding assistance for environmental protection measures on a bilateral or regional basis outside of the Multilateral Fund. 40 o Government funds for bilateral development and technical assistance. Many developed
countries, and an increasing number of developing countries, such as China, offer bilateral financial and technical assistance to support goals such as economic development, health and environmental protection in LVCs and other developing countries. Some of these bilateral funding organizations allocate specific funds to environmental protection programmes under which projects relevant to the Montreal Protocol and climate benefits of the HCFC phase‐out can qualify. In a number of cases, national funding agencies already support work related to ODS phase‐out under the Multilateral Fund. For example, the governments of Japan and Australia are co‐funding, with the national governments in the Cook Islands, Samoa, Tonga, and Vanuatu, the project to increase energy efficiency described in Box 3.
There is potential for a group of Montreal Protocol donor Parties to consider organizing coordinated or bilateral support for Montreal Protocol‐related activities that are beyond the scope or remit of the Multilateral Fund, e.g. for the adoption of low‐GWP alternatives to HCFCs. If
37AfDB Continues to Support Low‐carbon Development Pathways for Africa. 12/07/2013. http://www.afdb.org/en/news‐and‐events/article/afdb‐continues‐to‐support‐low‐carbon‐development‐pathways‐for‐africa‐12109 / 38 European Bank for Reconstruction and Development. http://www.ebrd.com 39 European Bank for Reconstruction and Development. http://www.ebrd.com/pages/about/what/policies/environmental/review/review.shtml 40 Touchdown Consulting. Information Paper on Funding Sources for Measures to Protect the Global Environment. December 2012. Prepared for the European Commission. Ref. Ares(2013)1410965 ‐ 27/05/2013. page 10‐12. http://ec.europa.eu/clima/policies/ozone/research/docs/funding_information_en.pdf

29
several such Parties were willing, there could be potential for formally or informally developing a strategic plan for such activities. 5. Private Sector Support Industry can be an important player in providing financial support to projects in an LVC particularly where there is an opportunity to increase market share for products including continuing the provision of parts and labour. The private sector participates in every aspect of the RAC sector including the design of RAC equipment, development of HCFC alternatives and substitutes, helping to design minimum standards for safety, health and environment, and setting costs of refrigerants and equipment. If there is an opportunity for a private sector firm to profitably participate in an LVC’s HCFC phase‐out project, there is a potential for private sector financial support (see box 10). Box 10: Lesson learned Over 90 percent of climate change finance is sourced from private markets (venture capital, asset financing, etc.), however, public finance is critical to removing barriers to climate technologies and attracting direct investment.41
— UNDP resource mobilization project
The private sector actively participated in the regional workshops on resource mobilization organized by UNEP in Australia, Macedonia and Jamaica and in each case, their contributions were related to introducing or extending their equipment and refrigerant product lines into the countries in the region. For instance, a Canadian company, Sustainable Options Limited, presented its experience with retrofitting hydrocarbon refrigerants within the English‐speaking Caribbean. In the Australia workshop, the Australian Institute of Refrigeration Air Conditioning and Heating presented “PRIME,” which is an initiative developed by a coalition of stakeholders from within the Australian heating, ventilation, air conditioning, and refrigeration (HVAC&R) industry to help reduce the environmental impact of HVAC&R. According to the presentation, a key driver for PRIME was the fact that a 2012 report showed that Australian refrigeration and air conditioning was responsible for 11.7 per cent of total national CO2‐eq emissions, with more than 45 million individual pieces of equipment consuming about 22% of all electricity used nationally. Among the outcomes of PRIME will be changes within the sector that are low cost, low carbon and low environmental impact – all of which are important components for an HCFC phase‐out project in an LVC. WHAT CAN BE FUNDED All government institutions that provide funding to developing countries have limitations with respect to what types of activities their financial support can be directed towards. While this is not the case for private sector assistance, any financing proposals to industry may need to demonstrate how the proposed activities could benefit business, at least in the long‐term. With respect to the HCFC phase‐out, the Multilateral Fund supports Article 5 countries for both the preparation and implementation of their HPMPs including projects to phase‐out HCFCs,
41 UNDP Final Report on Resource Mobilisation for Climate Co‐Benefits, p. 5 (UNEP/OzL.Pro/ExCom/71/6/Add.1).
30
strengthening their regulatory frameworks, building capacity and increasing awareness, training custom officers and refrigeration servicing technicians, promoting alternatives, recovery and recycling of ODS, etc. The Executive Committee has produced guidelines for HPMPs for Article 5 countries that includes specific criteria for LVCs.42 Co‐funding with the Multilateral Fund is necessary to achieve climate benefits since these are not supported by the Multilateral Fund. For instance, energy efficiency gains or a country’s energy independence may be outcomes of an HCFC phase‐out project but support for these benefits must be found among the financial institutions that support climate benefits. The World Bank’s India Chiller Energy Efficiency Project is an interesting example of a project focused on energy efficiency and ODS phase‐out. In that project, the Multilateral Fund, the GEF and Climate Finance under the World Bank have been combined with the Industrial Development Bank of India (IDBI) to support a common objective – sector‐wide chiller replacement – for global environmental co‐benefits.43 The four financial institutions together are able to financially support the following activities:
First component supported by the GEF: provision of incentives for investment in energy efficient chillers including providing the following incentives to remove market and techno‐economic barriers: (a) chiller owners with either: (i) an upfront financial incentive to subsidize the cost of the replacement of centrifugal chillers before end of technical life; or (ii) an annual payment from a share of certified emission reductions to be generated from the actual energy savings achieved by the new chillers; (b) an incentive for chiller manufacturers, suppliers and energy service companies to actively participate in the project.
Second component supported by the GEF and Carbon Finance: measurement, monitoring and verification of the power‐output function of old chillers to be replaced, electrical consumption of new chillers, and cooling output in order to measure energy savings and emission reductions. The methodology for this measurement is from the CDM Executive Board.44
Third component supported by Multilateral Fund: technical assistance to support project readiness and sustainability through enhancing the awareness of relevant stakeholders in energy conservation measures, enhancing the understanding of the impact on the servicing sector of the decision to accelerate the phase‐out of production of CFC, and strengthening the capacity of chiller owners and other stakeholders to monitor the performance of new chillers and to undertake refrigerant management.
Fourth component: project management through a Project Management Unit established at IDBI which is a financial intermediary and responsible for implementing all activities under the project.
42 See Annex 3. 43India Chiller Project – MP Component. http://www.worldbank.org/projects/P102790/india‐chiller‐energy‐efficiency‐project‐mp‐component?lang=en. IDBI India Chiller Project. http://www.climatefinanceoptions.org/cfo/node/65 44Clean Development Mechanism (CDM) Executive Board. https://cdm.unfccc.int/EB/index.html

31
Figure 1 depicts how the three financial institutions – the Multilateral Fund, the GEF and Climate Finance have been designed to work together within the project to achieve the results. In this particular example, the Climate Finance support is in the form of payments for CO2‐equivalent CERs which are only provided after project implementation. This means that the Multilateral Fund and the GEF provide the crucial upfront financing to initiate the replacement program, put in place the operational framework and policies and deliver technical assistance.
Figure 1: Funding Sources and Objectives45
A good discussion of how various financing instruments support different aspects of a project can be found in Beyond the Sum of Its Parts Combining Financial Instruments for Impact and Efficiency Beyond46. Table 6 is adapted from this publication suggests which financing instruments are able to finance the various components of a potential project.
45 Leveraging Support for HCFC Phase‐out: Opportunities and Modalities for Pursuing Linkages with the Climate Change Agenda. Montreal Protocol Operations, Environment Department, The World Bank. www.worldbank.org/montrealprotocol www.carbonfinance.org 46 The World Bank. Beyond the Sum of Its Parts Combining Financial Instruments for Impact and Efficiency. ISSUES BRIEF #3, June 2010. http://www‐wds.worldbank.org/external/default/WDSContentServer/WDSP/IB/2010/06/25/000334955_20100625030802/Rendered/PDF/553290BRI0Box349445B01PUBLIC1.pdf.
Increasing Market Share of Energy Efficient Non‐HCFC Products
HCFC Products
Non‐HCFC to Non‐HCFC Products with Improved Energy Efficiency
HCFC to Non‐HCFC Products Market Penetration of
Improved Energy Efficient Products
Global Environment Facility
Climate Finance Multilateral Fund
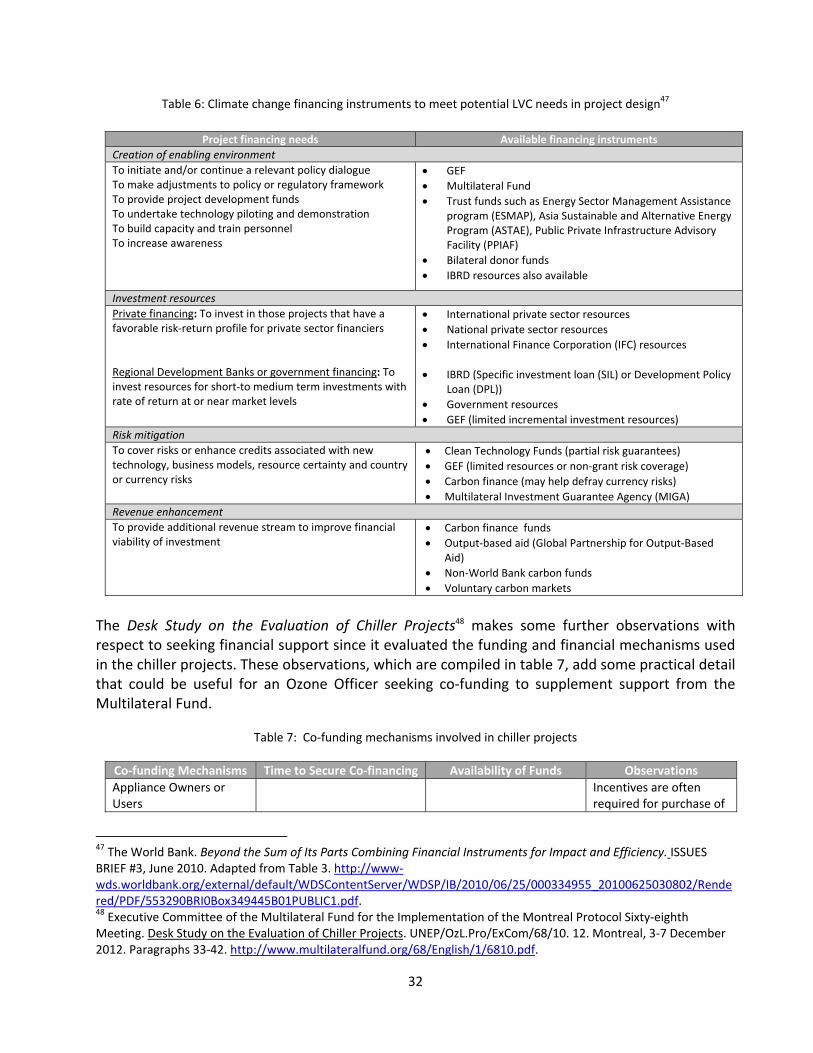
32
Table 6: Climate change financing instruments to meet potential LVC needs in project design47
Project financing needs Available financing instruments
Creation of enabling environment
To initiate and/or continue a relevant policy dialogue To make adjustments to policy or regulatory framework To provide project development funds To undertake technology piloting and demonstration To build capacity and train personnel To increase awareness
GEF
Multilateral Fund
Trust funds such as Energy Sector Management Assistance program (ESMAP), Asia Sustainable and Alternative Energy Program (ASTAE), Public Private Infrastructure Advisory Facility (PPIAF)
Bilateral donor funds
IBRD resources also available
Investment resources
Private financing: To invest in those projects that have a favorable risk‐return profile for private sector financiers Regional Development Banks or government financing: To invest resources for short‐to medium term investments with rate of return at or near market levels
International private sector resources
National private sector resources
International Finance Corporation (IFC) resources
IBRD (Specific investment loan (SIL) or Development Policy Loan (DPL))
Government resources
GEF (limited incremental investment resources)
Risk mitigation
To cover risks or enhance credits associated with new technology, business models, resource certainty and country or currency risks
Clean Technology Funds (partial risk guarantees)
GEF (limited resources or non‐grant risk coverage)
Carbon finance (may help defray currency risks)
Multilateral Investment Guarantee Agency (MIGA)
Revenue enhancement
To provide additional revenue stream to improve financial viability of investment
Carbon finance funds
Output‐based aid (Global Partnership for Output‐Based Aid)
Non‐World Bank carbon funds
Voluntary carbon markets
The Desk Study on the Evaluation of Chiller Projects48 makes some further observations with respect to seeking financial support since it evaluated the funding and financial mechanisms used in the chiller projects. These observations, which are compiled in table 7, add some practical detail that could be useful for an Ozone Officer seeking co‐funding to supplement support from the Multilateral Fund.
Table 7: Co‐funding mechanisms involved in chiller projects
Co‐funding Mechanisms Time to Secure Co‐financing Availability of Funds Observations
Appliance Owners or Users
Incentives are often required for purchase of
47 The World Bank. Beyond the Sum of Its Parts Combining Financial Instruments for Impact and Efficiency. ISSUES BRIEF #3, June 2010. Adapted from Table 3. http://www‐wds.worldbank.org/external/default/WDSContentServer/WDSP/IB/2010/06/25/000334955_20100625030802/Rendered/PDF/553290BRI0Box349445B01PUBLIC1.pdf. 48 Executive Committee of the Multilateral Fund for the Implementation of the Montreal Protocol Sixty‐eighth Meeting. Desk Study on the Evaluation of Chiller Projects. UNEP/OzL.Pro/ExCom/68/10. 12. Montreal, 3‐7 December 2012. Paragraphs 33‐42. http://www.multilateralfund.org/68/English/1/6810.pdf.

33
Co‐funding Mechanisms Time to Secure Co‐financing Availability of Funds Observations
replacement equipment.
Climate‐oriented ODA ODA funds are typically available within three months
Bilateral ODA Bilateral ODA funds typically are made available annually for Developing Country support which means that approved projects can be funded quickly.
Only a small number of countries are selected by donor countries to receive bilateral ODA. The reasons for choice of countries may be based on the current priorities of the donor country.
GEF GEF funding took up to two years after project approval.
Private sector funds using innovative funding such as mandated contributions from national third party utility companies
National private sector funds could be secured on average in about 16 months
Innovative funding arrangements (ODA + private sector and/or carbon funding) possess a superior leveraging capacity, in particular where projects create tangible benefits for the co‐financing entities.
Private sector funds using globally certified emission reduction credits in carbon markets (CDM)
Approval of a related globally applicable CDM methodology took about 30 months, but in exchange for the time lag, it created the potential for carbon market funding from verified energy savings in the future.
Finally, further observations of practical interest came from the 2010 Joint Network Meeting for Ozone Officers of the Europe and Central Asia and South Asia Regional Networks in which lessons learned in the chiller projects were discussed.49 Among the key messages given at the meeting that could be useful for Ozone Officers in LVCs who are interested in seeking financing outside of the Multilateral Fund for climate co‐benefits includes: o The Multilateral Fund and GEF have different project cycles (see box 11). o Working with two GEF implementing agencies – the UNDP and the IADB, is difficult; and o The performance guarantee fund and management structures are complex particularly
considering the number of players involved and the detail in the management structure. Box 11: Lesson learned on GEF In average, GEF full size project development processes may take 3 to 8 years, depending on many factors, including but not limited to GEF availability of resource to respond to large pipeline of climate mitigation
49UNDP. Joint Network Meeting for Ozone Officers of the Europe and Central Asia and South Africa networks Achievements and Lessons Learned Chillers Projects. Suely Carvalho, Chief Montreal Protocol & Chemicals Unit, UNDP. 26‐30 April 2010, Istanbul

34
projects, including from previous replenishment cycles. In view of the long waiting list of projects, prioritization of pipeline entry by implementing agencies is an issue to overcome.50
— UNDP resource mobilization project
50 UNDP Final Report on Resource Mobilisation for Climate Co‐Benefits, p. 5 (UNEP/OzL.Pro/ExCom/71/6/Add.1).
35
6. GUIDE FOR OZONE OFFICERS This part of the financing options paper is intended to build on the information provided in Sections 1 through to 5, presenting a step‐by‐step guide for an Ozone Officer seeking to take advantage of climate co‐benefits during the HCFC phase‐out. It should be noted that the suggestions in this guide are intended to supplement, not replace, the actions taken by an Ozone Officer in an LVC with servicing only when developing phase‐out projects to replace, recycle or destroy HCFCs in accordance with the obligations under the Montreal Protocol. STEP I – What you need to know: Understand your refrigeration servicing sector, potential climate co‐benefits and possible barriers It is important for the Ozone Officer to have the following kinds of information in order to prepare for discussions with national partners and potential donors for co‐funding. While some of the information may already be in the HPMP, it may be necessary to collect other data in order to make the climate benefits case.
Understanding the refrigeration and air conditioning servicing sector in your country o Existing Refrigeration/Air Conditioning appliances ‐ What RAC equipment is used in the
country? How many units are used in the commercial and domestic sectors? What are their capacities and efficiencies? What is the average remaining life of the equipment? What is the refrigerant leak rate? What is the current and forecast availability of different refrigerants? What is the estimated running time and average electricity consumption of the existing appliances? At what ambient temperature does the equipment operate?
o Socio‐economic context – What is the cost of electricity? Who owns the equipment? If the equipment is owned by commercial enterprises, what is the solvency of the companies? Are the owners willing to co‐fund? What is the motivation for owners to replace their RAC equipment – is it the end of life of the appliance, the lack of ODS refrigerant supply, or some other reason?
o Regulatory context – Are their existing national standards for RAC equipment? Does the country’s import/export licensing system restrict imports of HCFC‐based equipment imports? Are there any regulations or policies that promote the adoption of energy‐efficient, low‐GWP RAC technology?
o Replacement refrigeration and air conditioning – What are the energy efficiency ratings for the equipment? What are the refrigerants and their GWPs? How much electricity does the equipment consume? What is the cost of the equipment? What is the cost and availability of refrigerants? Do servicing technicians have the skills and know‐how required for servicing equipment using alternatives to HCFCs?
Estimates of potential climate co‐benefits o What are the estimated climate benefits if the existing equipment is replaced with new
equipment with higher energy efficiency ratings that also use low‐ or zero‐GWP
36
refrigerants? Such estimates could include, for example, avoided GHG emissions and cost savings for equipment owners and governments. Such estimates would depend on the specific RAC equipment and could be developed on the basis of the discussion in Sections 3 and 4 of how to calculate the CO2‐eq emissions and the potential climate benefits from the refrigeration servicing sector.
Understanding possible barriers to taking action51 While developing a program with national partners and potential donors about co‐financing opportunities, Ozone Officers should identify potential barriers and consider strategies to overcome them. The common types of barriers include:
o Technical (refrigeration) – Where there are specific technical issues that will not allow the use of a certain refrigerant, e.g. when the properties or characteristics of a refrigerant mean that it cannot be applied to a specific type of system or application.
o Technical (safety) – When there are specific safety issues that will not allow the use of a certain refrigerant, e.g. where the safety characteristics of a refrigerant are such that it cannot be applied to a particular application.
o Supply and availability – When a particular “part”, be it material, equipment, component or fluid or even a particular service (or activity), that is necessary for the operation (in‐use or service/maintenance) of a system is not physically available or will not be or cannot be supplied to the user, thereby preventing the use of a specific refrigerant.
o Commercial (investment, profit, financial incentives) – Where an enterprise establishes that the cost of adopting a specific refrigerant will incur additional costs that will reduce profits beyond what is acceptable or where insufficient finding is available for investment or adequate financial incentives are unavailable.
o Market – Where an enterprise believes that there is no customer demand for a product that uses a particular refrigerant, or where the end‐user or consumer would not accept a given refrigerant.
o Information resources – When insufficient information, know‐how, guidance, or technical data either in the form of literature or training, is available to enterprises or technicians that need the know‐how before they can embark on using a particular refrigerant.
o Regulations and standards – Where existing regulations prohibit the use of a particular refrigerant and where necessary standards do not exist within the country, or where the requirements of a regulation or standard are very restrictive thereby physically or financially (through stringent demands) prohibiting the use of the refrigerant.
o Psychological and sociological aspects – Where individuals, management of an enterprise or broader industry organisations hold a general resistance to change for the use of a particular refrigerant on the basis of rumour, influence of peer groups, or unwillingness to change to alternative technologies.
51 UNEP, Barriers to the Use of Low‐GWP Refrigerants in Developing Countries & Opportunities to Overcome These (2010), pages 11‐12, http://www.unep.fr/ozonaction/information/mmcfiles/7476‐e‐Report‐low‐GWPbarriers.pdf

37
STEP II – Who you need to convince: Persuade your management that your country should seek climate co‐financing for the HCFC phase‐out Armed with an overview of the scope and nature of HCFCs in the country’s refrigeration servicing sector, an estimate of the potential climate benefits both in terms of GHG emissions avoided and cost savings to the consumer, equipment owners and governments and a realistic view of any barriers to be overcome, an Ozone Officer can make a compelling case within the NOU and with key decision‐makers that his/her government should seek climate co‐financing for the HCFC phase‐out. STEP III ‐ Who you need to meet: Bilateral donors, international organizations and regional organisations that work in your country An important first step in accessing co‐funding for climate co‐benefits is for an Ozone Officer to become familiar with the key officials within the country and in other agencies in the government where actions of interest to the implementation of the HCFC phase‐out may be underway. Examples include actions to implement standards, labeling and energy efficiency programs. Among the contacts Ozone Officers may want to engage are the following. 1. National focal points for the GEF and any other contacts or focal points in Climate type Funds
described in Section 5.52 In an effort to promote "working with your partners on climate co‐benefits", this should be the first order of business for an Ozone Officer in a NOU seeking financial support for climate co‐benefits. Not only can there be complementary funding programs available but discussion and engagement may also reveal potential synergies or scope for cooperation between Multilateral Fund and GEF programs and projects.
2. Key individuals in central government agencies who are involved in the development of the country’s CAS or the PRSP for the purposes of receiving ODA. As is described in Section 5, the major development plan of the government serves as the main basis for discussions with donor countries regarding assistance for the development of the country. Therefore donors could be looking for climate‐related priorities in PRSPs or CASs to which their financial assistance can be targeted. The preparation of the PRSP or CAS is usually led by a central agency, such as the Ministry of Finance and/or Development Planning, a National Planning Commission, a Prime Minister or President’s Office. Experience from around the world indicates that extensive interagency and public consultation is critical to conclude a successful national development planning effort. The end result of the development planning process is the 5 year plan – the CAS or the PRSP depending on the development planning process. Through consultation with the central agencies that are developing the HPMP, it may be possible for an Ozone Officer to integrate or “mainstream” the HPMP and climate co‐benefits into the country’s sustainable development objectives and targets which could lead to support from IDA or IBRD and other global financial institutions.
52 See Annex 2.
38
Typically, development planning work starts at least 12‐18 months in advance of the conclusion of the 5‐year development plan that is in place. The following generic elements of development planning are typical:
Diagnostics to determine the highest development priorities for the country and the key issues related to those priorities (e.g. poverty assessments, sector and sub‐sector papers, assessments of technical and financial assistance needed to achieve the Millennium Development Goals (MDGs) over the long term, etc.);
Identifying policy options and choices to move towards national development objectives and targets (e.g. sectoral and cross‐sectoral policy reforms and frameworks needed to accelerate growth with equity and promote long‐term human development, etc.);
Identifying national capacity development needs to support implementation of priority actions to achieve national development objectives and targets (e.g. enable effective service delivery at the national and local levels, institutional changes, training needs, etc.);
Development of implementation plans and schedules for high priority objectives and targets; and
Investment planning and resource mobilization (costing infrastructure investments, equipment investments, micro‐finance initiatives, assessing national budgetary implications, awareness raising and discussion with development partners, etc.).
3. Regional Development Banks operating in the region and in particular those that are implementing agencies for the GEF usually have contacts that can be engaged either by email or in person to discuss needs and ideas. They may be willing to develop projects including seeking public and private co‐funding. For LVCs, a regional approach that is developed with several LVCs and implemented through a regional development bank such as the Asia Development Bank can be much more feasible than one operating individually as a country. An Ozone Officer should be able to contact their finance or development ministry for assistance in identifying representatives from these organizations.
4. Bilateral donors with an interest in assisting the countries of the region will often be national governments with a presence in the LVC and officials within the embassy or consulate that can be engaged to discuss and develop projects. Bilateral donors have specific countries that they have identified as priorities. The Ozone Officer can find this information on the national governments aid agency websites that are provided in the Annex 2. Any of these governments that are operating in an LVC could be approached by an Ozone Officer in a NOU for discussion of the HPMP implementation and achieving climate co‐benefits. Another avenue through which bilateral donors can be identified is through discussions in the margins of the Meetings of the Parties, Open‐ended Working Group, Executive Committee, and Regional Networks of Ozone Officers, as well as “corridor discussions” during climate negotiations and other regional environmental meetings and conferences.

39
5. Internationally‐recognized and reputable appliance manufacturers and their representatives that are operating in the developing country may become important players in a projects to achieve climate co‐benefits, for example for replacing refrigeration equipment. The example of the efforts of the company Dybvad Stål Industri (DSI) in the Solomon Islands is described in box 12.53 The national RAC association is an extremely important partner for the Ozone Officer in the RAC sector, and it can provide ideas and contacts for reputable RAC companies that could be approached. Additionally, an Ozone Officer can identify companies that are both active in the region and have interests in low‐GWP or zero GWP technology by researching the websites of RAC appliance manufacturers. By emailing or calling a customer relations contact in a RAC company, it should be possible to begin explorations of possible collaborations.
STEP IV – Make a compelling proposal: Calculate the climate co‐benefits of the HPMP To convince a potential donor that its support would be an effective and appropriate use of funds, Ozone Officers should link their project proposals with the national priorities and plans such as the national development strategy, the PRSP, the CAS, or UNDAF. In addition, it is important to demonstrate any benefits (especially climate benefits) from energy efficiency gains is an important tool to obtain financial support from potential donors. If possible, get the endorsement from the appropriate line ministries. An example of how to calculate the benefits is as follows: 1. Forecast the growth rate of HCFC‐22 consumption
Note: For small countries where HCFC‐22 is consumed solely for servicing refrigeration and air conditioning, an increase of HCFC‐22 consumption could mean increasing numbers of RAC units that will require servicing in the future.
2. Develop the “Case” for climate co‐benefits
Determine the popular model size of RAC appliances in kW (or Btu) and the average charge size in kg per unit.
Assume average charge for servicing in kg/year.
53 UNIDO and SHECCO SPRL, Guide 2013: Natural Solutions for Developing Countries including UNIDO Atmosphere Summary Report (November 2013), page 50, http://www.unido.org/fileadmin/user_media_upgrade/What_we_do/Topics/Multilateral_environmental_agreements/GUIDE‐UNIDO‐natural‐substances‐2013‐small.pdf
Box 12: Private sector assists with RAC investments in Solomon IslandsThe company Dybvad Stål Industri (DSI) has sold many freezers for the seafood industry in Asia. In a recent project, a freezer was installed in a fish processing plant in the Solomon Islands, freezing tuna loins. The self‐contained plate freezer DSI PFP 2810 operates on ammonia. It is equipped with a refrigeration system and needs only a power connection and cooling water to operate. The end‐users are mainly fish factories that are exporting some of their products to the USA and Europe. The DSI 2000 series has a high freezing rate and low power consumption and meets new strict hygienic standards. It is suitable for marine and land installation. Primary use is to freeze seafood such as fish, fish fillets, shrimps, roe, squid, etc.; vegetables such as chopped spinach, broccoli, carrots, etc.; pulp and concentrates.

40
Outline the HCFC Phase‐out Strategy: Describe Assumptions
refrigeration and air conditioning Charge Size Refrigeration Recharge (Service) in Kg/unit/year Useful Life in Years
Current Regional Market of refrigeration and air conditioning: Number of replacement units + Number of units for growth = Number of units in the regional market
Develop Assumptions to define climate co‐benefits of more energy efficient appliances: Carbon Intensity Factor – in Kg CO2/kWh Baseline Energy Efficiency Rating (EER) New EER Cooling Capacity (for Air Conditioning) in kW Operating Hours in hours/day CDM No. of Days in Days/Year Cost of electricity in $ per kWh If appropriate ‐ Carbon Revenue in $ per tCO2
Determine the cost and specifications for the existing stock of HCFC‐based RAC equipment: An example of costs for HCFC‐22 residential air conditioning units
Capacity (Btu) Capacity (kW) Voltage Price (USD) EER (Btu) EER (SI)
9,000 2.93 220 379 10 2.93
13,000 3.81 220 450 10 2.93
18,000 5.28 220 599 10 2.93
24,000 7.03 220 732 10 2.93
Estimate the cost and specifications of the new energy efficient low‐GWP RAC equipment that could be introduced:
An example of costs for R‐410A residential air conditioning units Capacity (Btu) Capacity (kW) Voltage Price (USD) EER (Btu) EER (SI)
9,000 2.64 110 450 14.5 4.25
12,000 3.52 220 525 13.5 3.96
18,000 5.28 220 659 13.5 3.96
24,000 7.03 220 895 13.5 3.96
3. Ban imports/production of R‐22 refrigeration and air conditioning with CDM (0% and 20% Growth) if appropriate
Example of Benefits Calculation

41
R‐22 Consumption:
R‐22 consumption for the servicing sector will be phased out within 10 years.
Energy Savings
1.5 – 5.5 million MWh in 2018
450 – 1,680 MW of Electricity Generation Saved (USD 0.9 ‐ USD 3.4 billion deferred investment)
Additional Revenues if appropriate
Energy Savings ‐USD 0.6 ‐ USD 1.7 billion
CDM Revenue If available ‐ USD 50 ‐ USD 138 million 4. Sensitivity Analysis
Example of a sensitivity analysis for residential air conditioning units
Growth Rate per Annum 0% 10% 15% 20%
Energy Consumption Reduction 1.45 million MWh 2.9 million MWh 4 million MWh 5.5 million MWh
Reduced Demand for Electricity Generation Capacity 450 MW 890 MW 1,200 MW 1,670 MW
Deferred Investment for New Capacity $1 billion $1.7 billion $2.4 billion $3.4 billion
Energy Savings (7 years) $0.6 billion $1 billion $1.3 billion $1.7 billion
CDM Revenues (7 years) If this is available $50 million $84 million $108 million $138 million
STEP V – “Making the case”: Prepare yourself for discussions with potential donors The situation faced by each Ozone Officer in preparing for discussions with potential donor partners will be unique; therefore they should consider the following suggestions in their own national and regional contexts: 1. The most important preparations will be around understanding in detail your country’s HPMP
and refrigeration sector, as outlined in Step I. 2. “Do your homework” on which potential partners exist inside your own country is equally as
important as knowing the technical details of what is contained in the HPMP and in the refrigeration sector. This “homework” includes having formal and informal discussions with colleagues who are national focal points for the GEF or other international agreements as well as public servants in other government agencies responsible for the CAS, PRSPs or UNDAF processes described in Section 5, and who may be willing to include the HPMP in those strategies as a priority. The Ozone Officer’s “homework” also includes identifying any other governments with embassies in the country, regional development banks or other international development agencies that might be willing to discuss partnering or co‐funding –
42
or other financial assistance to support climate co‐benefits of the HPMP. When researching the potential partners, do not forget to note any international private sector organizations or companies in the refrigeration sector that might be able to participate in a partnership.
3. It is important to try to estimate what the climate co‐benefits might be in improving energy
efficiency of refrigeration in your country. In many LVCs, the number of appliances may be so small that the value of the climate co‐benefits may not be sufficient to interest potential partners. In that case, a regional approach, such as that which was created with the assistance of the ADB for Cook Island, Samoa, Tonga, Vanuatu and Papua New Guinea (See Box 3) may be a worthwhile line of attack to pursue.
At this point, you should be ready to engage potential national, bilateral, regional and multilateral public and private partners to seek financial support for the climate co‐benefits of the HPMP. During the engagement, there will be certain issues and constraints that will add to the effort and time that an Ozone Officer will need to set aside to undertake the engagement. These may require strategic and targeted discussions with potential partners beyond the discussion of how to financially support climate co‐benefits of the HPMP. It may be important to discuss support for the resources required for mobilization, time required for applications, length of time from application through to receipt of financing. 54
As with the development of any projects to implement the HPMP,55 when developing project concepts and speaking with a potential financing institution or implementing partner about your project ideas, there are certain elements that should be kept in mind:
Ensure additionality. “Additionality” is a term frequently used in relation to project proposals that means the measurement of an intervention (i.e., doing something), when the intervention is compared to the baseline or status quo situation (i.e., doing nothing). This term is frequently used in relation to climate change, however it applies equally to any type of projects, including ODS phase out, chemicals and energy efficiency projects.
Transparency and good governance.56 These key principles are familiar to most civil servants, including Ozone Officers and other professionals working under international financial mechanisms like the Multilateral Fund. Design any resource mobilization project for
54 UNIDO, Chiller demonstration projects: Achievements & lessons learnt. Joint meeting of the Regional Ozone Networks for Europe & Central Asia (ECA) and South Asia (SA). Istanbul, Turkey. 26‐30 April 2010; Chiller Demonstration Projects: Achievements and Lessons Learnt. The Global Chiller Replacement Project. Mary‐Ellen Foley. Montreal Protocol Operations, The World Bank. 26‐30 April 2010. Istanbul, Turkey; Viraj Vithoontien, Montreal Protocol Operations, The World Bank Group, Strategies for HCFC Phase‐out Management Plan. Regional Workshop of Caribbean Ozone Officers. 25 March 2009. 55 UNEP/OzL.Pro/ExCom/63/L.1 7 April 2011. Para 84 (a) (ii). http://www.multilateralfund.org/63/Draft%20Report%20English/1/63L1draft‐8‐April.doc 56Good governance has 8 major characteristics. It is participatory, consensus oriented, accountable, transparent, responsive, effective and efficient, equitable and inclusive and follows the rule of law. It assures that corruption is minimized, the views of minorities are taken into account and that the voices of the most vulnerable in society are heard in decision‐making. It is also responsive to the present and future needs of society. http://www.unescap.org/pdd/prs/ProjectActivities/Ongoing/gg/governance.asp
43
Avoid “perverse incentives.” This term, which is usually applied in the context of climate change, describes a situation where an action that is supposed to achieve one result (positive) accidentally creates a problem somewhere else (negative). It is a type of unintended consequence when the impacts and outcome of a project are not considered carefully. In the context of resource mobilization related to climate co‐benefits of HPMPs, practically speaking this means that the Ozone Officer should be particularly careful during the project design stage to consider all possible outcomes (intended and unintended).
Explore possibilities of profit‐sharing, including return of funds to the Multilateral Fund. When designing a co‐funding proposal, if the project includes potential profit generation (e.g. from private sector involvement), try to consider what would happen to any new funds that might be generated. The Multilateral Fund has traditionally collected any funds generated from projects that it has financially supported (notably the chiller replacement programme), and used those new resources to finance new Multilateral Fund projects (the resource mobilization projects of all Implementing Agencies are good examples of this “recycling” process). Accordingly, when designing your resource mobilization project, consider whether any funds might be generated and if so, make a plan for how they will be collected and informed to the Multilateral Fund.
Ensure sustainability of the projects proposed. As with any good project design, the resource mobilization proposal should consider ways and means to sustain the outcome of the project after the initial funding is used. Try to identify and build such approaches into the original proposal.
Avoidance of duplication of similar projects. This is part of the due diligence process you should follow for any project proposal. It is part of your “homework” to ensure that whatever resource mobilization proposal related to climate co‐benefits of HPMPs does not duplicate any other existing project, either inside or outside of the Multilateral Fund. Make sure that what you are proposing does not duplicate activities currently funded or eligible for future funding under the Multilateral Fund (consult the Implementing Agency working with you).
Information on transaction costs. Developing, submitting and negotiating project proposals takes resources takes expertise, time, and energy. Sometimes it takes considerable effort to do it right. It is important to keep track of your estimated “transaction costs” from the start of the project concept until the project is approved (or not approved). This information is useful to provide as feedback to both your Director/management, the organization from which you are seeking financing, and also to and even the Executive Committee. Such information could be reported under the HPMP in terms of activities/resources undertaken to seek climate co‐benefits for the HCFC activities.
STEP VI ‐ Next Steps Finally, undertake the necessary final internal discussions within the country and with partners either in the public or private sector to establish the agreed terms and conditions of the project and financial support including management, monitoring, evaluation, reporting. During the project development and submission process — and even during implementation — UNEP encourages Ozone Officers to share the project experience with other NOUs through

44
presentations and discussions at the Regional Network meetings (see box 13). Such exchanges can inform and inspire colleagues to achieve similar results.
Box 13: Lesson learned Experience shows that Regional networking plays an important role in helping replicate the successful features of well‐designed co‐financing projects into future or on‐going projects. During meetings and workshops, project managers and country office personnel discuss both technical and administrative issues, share experiences and best practices, and gain a sense of how the portfolio functions at a regional level. 57
— Multilateral Fund chiller project desk study
57 Multilateral Fund Desk Study on the Evaluation of Chiller Projects (UNEP/OzL.Pro/ExCom/68/10), para 14.

45
Annex 1: Overview of UNEP’s resource mobilization project UNEP submitted a project proposal for “Resource mobilization to address climate co‐benefits for the HCFC phase‐out in LVC countries with servicing sector only” as part of its 2011 Work Programme Amendment for the consideration of the 63rd Executive Committee.58 The original project sought to prepare a detailed study outlining specific financing options, complete five regional workshops on resource mobilisation, and prepare a pilot application for one LVC for funding for activities in HPMP not covered by the Multilateral Fund, at a budget of US$ 250,000 plus programme support costs. Following discussions, the Executive Committee through Decision 63/22 (a) approved a project for UNEP59 as follows:
“a) To approve funding at the level of US $100,000, plus agency support costs of US $13,000 for UNEP, for a study on financing options, regional workshops on co‐financing, and/or one or more pilot applications of co‐financing for one or more low‐volume‐consuming countries with an approved HCFC phase‐out management plan, to be funded as resource mobilization activities on the condition that an interim report would be provided at the 66th meeting, which would include an update on the activities so far undertaken and address the following elements:
(i) Additionality of the projects proposed; (ii) Transparency and good governance, as well as covering the cash flow; (iii) Assurance that these projects would avoid perverse incentives for countries; (iv) Exploring possibilities of profit‐sharing, including return of funds to the Multilateral Fund; (v) Ensuring sustainability of the projects proposed; (vi) Avoidance of duplication of similar projects; (vii) Information on transaction costs;
(b) To request UNEP to ensure that the regional workshops were held in the context of the network meetings under UNEP’s Compliance Assistance Programme so as to ensure cost‐effectiveness, and that the timing of the workshops would be such to allow the experiences of other agencies’ resource mobilization activities to be incorporated; (c) To note that the funds approved would be taken from the budget reserved for unspecified projects that had been set aside from the funds returned from the Thai chiller project; and (d) To request UNEP to provide a final report for consideration by the Executive Committee at its 69th meeting.”
Under this revised project scope and resources, and following consultations within the CAP team and with select Ozone Officers, UNEP selected the first option in the decision, i.e. the study and regional workshops, instead of developing a pilot application the former option would have a wide impact on many LVCs. UNEP engaged an international expert in the field of resource mobilization to research and draft the study on financing options (i.e. this document), and arranged for quality review by two experts, one of whom is an Ozone Officer from an LVC. UNEP conducted the workshop component of the project over the period May 2013 to March 2014 (see Annex 2) in a way that was mutually supportive with the development of this document.
58 UNEP/OzL.Pro/ExCom/63/19. 59 GLO/SEV/63/TAS/308.

46
UNEP submitted an interim report on the project to the 66th Executive Committee meeting, which noted the report and requested UNEP to submit a more substantial report to the 68th meeting (Decision 66/15(m)). At the 68th meeting, UNEP submitted another interim report. During the discussions of the resource mobilization projects of all Implementing Agencies, the Executive Committee noted the important information on resource mobilization provided in the Desk Study on the Evaluation of Chiller Projects60 and the 68th meeting report,61 and requested that UNDP, UNEP, UNIDO and the World Bank take into account the information provided the desk study, where relevant, and incorporate such information in the final reports on resource mobilization for in the context of the terms of reference set out in decisions 63/20, 63/22, 63/23 and 63/24 (Decision 68/4 (c)). For both project components, UNEP considered the Multilateral Fund Desk Study on the Evaluation of Chiller Projects during the project development insofar as its recommendations apply to the LVC context, as per Executive Committee decision 68/4(c). UNEP also considered the information contained in the final reports on resource mobilization for climate co‐benefits submitted by UNDP,62 UNIDO,63 and World Bank64 as they became available. UNEP submitted an interim report on the project65 to the 69th meeting, which the Executive Committee noted and then urged UNEP to provide a draft of the study in the form of an information paper to the Executive Committee’s 70th meeting; to submit the final study to the 71st meeting, taking into account guidance provided by the Executive Committee at the 70th meeting; and to complete the regional workshops on co‐financing by December 2013 with a view to providing a report on their conclusions to the first meeting in 2014 (Decision 69/4 (c)). UNEP submitted to the 70th meeting of the Executive Committee (1‐5 July 2013) the Draft Annotated Outline of the Study on Financing Options to Address Climate Co‐Benefits for HCFC Phase‐out in LVCs with Servicing Sector Only.66 In that detailed submission, UNEP noted that the project was a work in progress and it welcomed any guidance or inputs (e.g. examples of successful resource mobilisation in LVCs) from Executive Committee members or others to consider during the finalization of the document. During the Committee’s deliberations, a member noted the relation between the Discussion Paper on Minimizing Adverse Climate Impact of HCFC Phase‐Out in the Refrigeration Servicing Sector67 and the study being prepared by UNEP. He encouraged the Secretariat to conduct further analysis of the issue and to engage in further discussion with UNEP and the other implementing agencies in order to exchange ideas and strategies to address the servicing sector in the most effective way possible to achieve compliance
60 UNEP/OzL.Pro/ExCom/68/10. 61 UNEP/OzL.Pro/ExCom/68/53, paragraphs 48 to 54. 62 UNEP/OzL.Pro/ExCom/71/6/Add.1. 63 UNEP/OzL.Pro/ExCom/69/5. 64 UNEP/OzL.Pro/ExCom/71/6/Add.1. 65 UNEP/OzL.Pro/ExCom/69/5. 66 UNEP/OzL.Pro/ExCom/70/Inf.3. 67 UNEP/OzL.Pro/ExCom/70/53.
47
and minimize adverse climate impact.68 The Executive Committee agreed to defer consideration of the draft annotated outline of the study.69 As the consideration of the outline was not continued during the 71st or 72nd Executive Committee meetings, UNEP proceeded with the finalization of the document on the basis of the previously‐submitted outline, the comment received during the 70th meeting, and inputs from Ozone Officers and others received during the four resource mobilisation workshops. UNEP submitted the final version of the study to the Executive Committee for consideration at its 73nd Meeting.
68 UNEP/OzL.Pro/ExCom/70/59, para 117. 69 UNEP/OzL.Pro/ExCom/70/59, para 149.
48
Annex 2: Summary of the regional resource mobilization workshops As part of the project on “Resource mobilization to address climate co‐benefits for the HCFC phase‐out in LVC countries with servicing sector only,”70 UNEP organized four regional workshops on co‐financing with the objective of bringing stakeholders and representatives of the various appropriate funding mechanisms together to build the capacity of the participating Ozone Officers from Article 5 countries on accessing these financial mechanisms. UNEP also used the workshops as an opportunity for Ozone Officers from LVCs to share their experiences/inputs and voice their needs in relation to the guidance document on financing options that UNEP was preparing in parallel to the workshops. Thus, the workshops and the document were integrated throughout the project duration. In accordance with Decision 63/22 (b), UNEP ensured that the regional workshops were held in the context of the 2013/2014 meetings of the Regional Networks of Ozone Officers under UNEP’s Compliance Assistance Programme so as to ensure cost‐effectiveness, and that the timing of the workshops would be such to allow the experiences of other agencies’ resource mobilization activities to be incorporated. Accordingly, the four workshops on “Opportunities for resource mobilization and climate benefits related to refrigeration servicing sector” were held as follows:71
Asia‐Pacific: The workshop on was organized on 8 May 2013 in Gold Coast, Australia, back to back with the Joint Meeting of the South Asia (SA), South East Asia and the Pacific (SEAP) and the Pacific Islands Countries (PIC) Regional Networks of Ozone Officers.
Europe and Central Asia: The workshop on was organized on 21 May 2013 in Ohrid, Macedonia FYR, back to back with the Annual Meeting of the ECA Network of Ozone Officers.
Latin America and the Caribbean: The workshop on was organized in Kingston, Jamaica on 30 September 2013 back to back with the Meeting of the Latin American and Caribbean Networks of Ozone Officers.
Africa: The workshop on was organized in Addis Ababa, Ethiopia on 28 March 2014, back to back with the Joint Meeting of French‐Speaking and English‐Speaking Africa.
The workshops were one half day or one day in length, depending on the preference and schedule of the respective Network meetings. Model agendas were prepared to ensure some level of standardization across the Networks, with the provision that each region could adapt the agendas as per its local requirements. The workshops were designed to be inter‐active to encourage discussion and brainstorming on the subject, and included both presentations, discussion panels, and roundtable exchanges. The workshop participants were all of the National Ozone Officers who participated in the associated Regional Network meetings. UNEP also invited the following organizations as speakers share their resource mobilization experiences: Multilateral Fund Secretariat, Ozone Secretariat, Implementing Agencies, bilateral agencies/non‐Article 5 countries, and selected Ozone Officers with relevant co‐financing experience. In all of the workshops, UNDP, UNIDO and the World Bank conveyed the results to‐date of their own resource mobilization projects separately‐approved under the Multilateral Fund, shared their
70 See Annex 1. 71 UNEP did not organize a resource mobilization in West Asia since the region does not have any low‐volume consuming country, and it is therefore outside of the scope of the approved project. However, discussions on resource mobilization for the climate co‐benefit of the HCFC phase out have taken place during the region’s Network and thematic meetings, to a certain extent.

49
extensive experiences with resource mobilization with respect to both LVCs and non‐LVCs, and participated actively in the ensuing roundtable discussions. UNEP retained external experts familiar with resource mobilization to moderate the workshops in a neutral and unbiased manner, and to make the framework presentations. During some of the workshops, other organisations also delivered presentations or moderated sessions during some of the workshops, such as the Asia‐Pacific Technical College (APTC), Colombia, Croatia, Macedonia (Former Yugoslav Republic of), Saint Lucia, United States and private sector companies. In some of the workshops, other UNEP staff members working on related issues outside of Montreal Protocol (i.e. climate change and financing) also participated as speakers or moderators. The agendas of the four workshops covered a range of topics, such as:
Overview of financing options for LVC countries with servicing sector only.
Resource mobilization to address climate co‐benefits for HCFC phase‐ out in the context of Multilateral Fund decisions and policies.
Experiences of the implementing agencies and bilateral agencies.
Clean Development Mechanism.
Global Environment Facility.
Case studies or experiences (Caribbean, Colombia, Gambia, Ghana, Macedonia FYR, Croatia, Vietnam, etc.)
European financing instrument for pre‐accession countries.
NAMAs in the refrigeration, air conditioning and foam blowing sector.
Prospects for regional development banks to contribute to resource mobilization related to the HCFC phase out in Article 5 countries.
The Africa workshop provided the Implementing Agencies with a good opportunity to share the results of their resource mobilization projects, particularly the experiences with Gambia, Ghana and Vietnam projects co‐financed with the GEF. The workshop also discussed the fundamentals of resource mobilization including development and submission of grant proposals, mobilization of national resources, and fundraising principles. The Asia‐Pacific workshop provided a good opportunity for Australia, Italy and the United States to share their experience in offsetting costs in their own domestic HCFC phase‐out program. A few countries like Fiji, Cook Island, Bangladesh noted efforts in attracting financing for the climate co‐benefits. The Europe and Central Asia workshop highlighted the keen interest by Ozone Officers in better understanding the resource mobilization opportunities with Macedonia and Croatia mentioning the creation of funding opportunities to support their Montreal Protocol programs. The Latin America and the Caribbean meeting clarified that there is a need to have a system in place that provides the most up to date information on technologies in terms of performance and alternative gases. There was also an interesting discussion on the need for a few pilot countries to demonstrate how this financing could take place. Some of the common messages received from Ozone Officers during the workshops include:
The subject of resource mobilization and climate co‐benefits is new to virtually all Ozone Officers and is not traditionally an area in which they have worked. Ozone Officers need assistance to develop their own expertise in project financing and designing project proposals. They also need assistance to further develop their capacity for making the linkages between the HCFC phase out, energy efficiency and climate co‐benefits.

50
Due to the shortage of human resources in NOUs, as well as lack of skills and knowledge in this area, resource mobilization for the climate benefits of the HCFC phase out needs more efforts. National Ozone officers highlighted the need for continued assistance from all agencies on this subject.
Resource mobilization does not necessarily mean just funds, but can also mean human resources such as training and knowledge sharing.
Ozone Officers expressed the need for project preparation funds that focus on the climate co‐benefits.
Ozone Officers should explore as a priority the opportunities for internal (i.e. domestic) resource mobilization. This can include the use of economic instruments, other government programmes and private sector resources.
51
Annex 3: Useful contacts and background information
Final reports of Implementing Agency resource mobilization projects
UNDP, Final report on resource mobilization for climate co‐benefits (UNEP/OzL.Pro/ExCom/71/6/Add.1), http://www.multilateralfund.org/71/English/1/7106a1.pdf
UNIDO, Final report on development of pilot proposals for possible co‐financing for HCFC activities, to be be funded as resource mobilization activities (UNEP/OzL.Pro/ExCom/69/5) http://www.multilateralfund.org/69/English/1/6905.pdf
World Bank, Final report on resource mobilization for HCFC phase‐out and climate mitigation co‐benefits (UNEP/OzL.Pro/ExCom/71/6/Add.1), http://www.multilateralfund.org/71/English/1/7106a1.pdf
Multilateral Fund documents
Multilateral Fund Senior Monitoring and Evaluation Officer, Desk Study on the Evaluation of Chiller Projects (UNEP/OzL.Pro/ExCom/68/10), http://www.multilateralfund.org/68/English/1/6810.pdf
Multilateral Fund Secretariat, Minimizing Adverse Climate Impact of HCFC Phase‐out in the Refrigeration Servicing Sector (UNEP/OzL.Pro/ExCom/72/42), http://www.multilateralfund.org/72/English/1/7242.pdf
GEF Focal Points GEF Focal Points play a critical coordination role regarding GEF matters at country level as well as serving as the liaison with the GEF Secretariat and Implementing Agencies while representing their constituencies on the GEF Council. The GEF Political Focal Points and Operational Focal Points have different functions, although the exact specifications of the two designations may vary from country to country. All GEF member countries have Political Focal Points, while only recipient member countries eligible for GEF project assistance have Operational Focal Points. GEF Political Focal Points are concerned primarily with issues related to GEF governance including policies and decisions, as well as relations between member countries and the GEF Council and Assembly. GEF Operational Focal Points are concerned with the operational aspects of GEF activities, such as endorsing project proposals to affirm that they are consistent with national plans and priorities and facilitating GEF coordination, integration, and consultation at country level. The list of focal points is found at http://www.thegef.org/gef/focal_points_list Climate‐related programs
Clean Development Mechanism (CDM), http://cdm.unfccc.int/
Climate and Clean Air Coalition (www.unep.org/ccac/).
Sustainable Energy for All, http://www.sustainableenergyforall.org/
The World Bank, http://www.worldbank.org/en/topic/climatechange/overview o Climate Investment Funds (CIFs), https://www.climateinvestmentfunds.org/cif/
52
o Climate Finance and Carbon Finance Unit, http://www.worldbank.org/en/topic/climatefinance
o Climate Change Knowledge Portal, http://sdwebx.worldbank.org/climateportal/index.cfm
o Climate Finance Options Platform, http://www.climatefinanceoptions.org/cfo/index.php
Regional Development Banks
The Asian Development Bank (ADB), http://www.adb.org/
Inter‐American Development Bank (IADB), www.iadb.org/
Caribbean Development Bank (CDB), www.caribank.org/
African Development Bank (AfDB), http://www.afdb.org/en/
Climate Investments Funds (CIF), http://www.afdb.org/en/topics‐and‐sectors/initiatives‐partnerships/climate‐investment‐funds‐cif/
the Global Environment Facility (GEF), http://www.afdb.org/en/topics‐and‐sectors/initiatives‐partnerships/global‐environment‐facility‐gef/
Sustainable Energy Fund for Africa (SEFA), http://www.afdb.org/en/topics‐and‐sectors/initiatives‐partnerships/sustainable‐energy‐fund‐for‐africa/
African Carbon Support Programme (ACSP), http://www.afdb.org/en/topics‐and‐sectors/initiatives‐partnerships/african‐carbon‐support‐program/
European Bank for Reconstruction and Development (EBRD), http://www.ebrd.com
Funding Organisations of National Governments Australia: Australian AID (AUSAID), http://www.ausaid.gov.au/Pages/home.aspx
Austria: Austrian Development Agency, http://www.entwicklung.at/en/
Belgium: Belgian Development Cooperation (DGDC), http://diplomatie.belgium.be/en/policy/development_cooperation/
Belgium: Belgian Technical Cooperation (BTC), http://www.btcctb.org/
Canada: Canadian International Development Agency (CIDA), http://www.acdi‐cida.gc.ca/acdi‐cida/acdi‐cida.nsf/eng/home
Denmark: Danish International Development Assistance (DANIDA), http://um.dk/en/danida‐en/
Denmark: Danish Ministry of Foreign Affairs (MOFA), http://um.dk/en
European Commission: DG Development (DG DEV) also EU Enlargement‐related funds, http://ec.europa.eu/trade/policy/countries‐and‐regions/regions/africa‐caribbean‐pacific/
France: Ministère des Affaires étrangères et européennes (MAEE), http://www.diplomatie.gouv.fr/en/
France: Direction générale de la Coopération internationale et du Développement (DGCID), http://www.irc.nl/page/6890
Finland: Ministry of Foreign Affairs (MoFA), http://formin.finland.fi/public/default.aspx?culture=en‐US&contentlan=2
Germany: Deutsche Gesellschaft für Internationale Zusammenarbeit GmbH (GIZ), http://www.giz.de/en/
Germany: Bundesministerium für Wirtschaftliche Zusammenarbeit und Entwicklung (BMZ), http://www.bmz.de/en/index.html
Ireland: Irish Aid, http://www.dci.gov.ie/
Italy: Cooperazione Italiana allo Svililuppo, http://www.cooperazioneallosviluppo.esteri.it/pdgcs/
53
Japan: International Cooperation Agency (JICA), http://www.jica.go.jp/english/ Japan: Official Development Assistance (ODA), Ministry of Foreign Affairs (MoFA),
http://www.mofa.go.jp/policy/oda Japan: Bank for International Cooperation (JBIC), http://www.jbic.go.jp/en/
Luxembourg: Ministère des Affaires Étrangères, http://www.mae.lu/en
Luxembourg: Agence Luxembourgeoise pour La Coopération Luxembourgeoise au Développement, http://luxdev.lu/en
Netherlands: Ministry of Foreign Affairs (MoFA), http://www.government.nl/ministries/bz New Zealand: New Zealand Aid (NZAid), http://www.aid.govt.nz/
Norway: Ministry of Foreign Affairs, http://www.regjeringen.no/en/dep/ud.html?id=833 Norway: Norwegian Agency for Development and Cooperation (NORAD),
http://www.norad.no/en/front‐page;jsessionid=0D0F0A6AF492616F55F671C9D9D94F11
Portugal: Instituto Português de Apoio Ao Desenvolvimento (IPAD), http://ns1.ipad.mne.gov.pt/ Spain: Agencia Española de Cooperación Internacional (AECI), http://www.aecid.es/en/aecid/
Sweden: Swedish International Development Cooperation Agency (SIDA), http://www.sida.se/english/ Switzerland: Swiss Agency for Development and Cooperation (SDC),
http://www.sdc.admin.ch/en/Home
Switzerland: State Secretariat of Foreign Affairs (SECO), http://www.seco.admin.ch/index.html?lang=en
United Kingdom: Department for International Development (DFID), https://www.gov.uk/government/organisations/department‐for‐international‐development
United State: United States Agency for International Development (USAID), http://www.usaid.gov/
United States: Millennium Challenge Corporation (MCC), http://www.mcc.gov/
Clean Development Mechanism approved methodologies
AMS‐II.O.: Dissemination of energy efficient household appliances ‐‐‐ Version 1.0, http://cdm.unfccc.int/methodologies/DB/OE502PQ0NA9ETZ5IB6HL0ZT2BBKZ35
AMS‐III.X.: Energy Efficiency and HFC‐134a Recovery in Residential Refrigerators ‐‐‐ Version 2.0, http://cdm.unfccc.int/methodologies/DB/983EQY2RSIYT5Q1KN4FIWHU2FL3MHP
AMS‐III.AB.: Avoidance of HFC emissions in Standalone Commercial Refrigeration Cabinets ‐‐‐ Version 1.0, http://cdm.unfccc.int/methodologies/DB/GZRYKNFXDOFO6WWJ3DG87GU8I4H1EZ
AM0060: Power saving through replacement by energy efficient chillers ‐‐‐ Version 1.1, http://cdm.unfccc.int/methodologies/DB/YK8TH8WJAQDX52TC32G9C627X17P38
AM0070: Manufacturing of energy efficient domestic refrigerators ‐‐‐ Version 3.1.0, http://cdm.unfccc.int/methodologies/DB/R66P8LFQUC30O9F2GX9Z9CTMN9B8W5
AM0071: Manufacturing and servicing of domestic refrigeration appliances using a low GWP refrigerant ‐‐‐ Version 2.0, http://cdm.unfccc.int/methodologies/DB/ZWFKA8F3U3CSHU75ST3VCPZMVN5VG0

54
Annex 4: Multilateral Fund eligible incremental costs of HCFC phase‐out projects72 Decision 60/43 Eligible incremental costs of HCFC phase‐out projects (f) To apply the following principles in regard to eligible incremental costs of HCFC phase‐out projects for the first stage of HPMP implementation to achieve the 2013 and 2015 HCFC phase‐out compliance targets, subject to a review in 2013: (i) When preparing HCFC phase‐out projects in the foam, refrigeration and air‐conditioning sectors, bilateral and implementing agencies shall use the technical information contained in document UNEP/OzL.Pro/ExCom/55/47 as a guide; (ii) The current cost‐effectiveness threshold values used for CFC phase‐out projects in paragraph 32 of the final report of the 16th Meeting of the Executive Committee (document UNEP/OzL.Pro/ExCom/16/20), to be measured in metric kilogrammes, shall be used as guidelines during the development and implementation of the first stage of HPMPs; (iii) That countries will have the flexibility to allocate the approved funding from incremental operating costs to incremental capital costs and to allocate up to 20 per cent of the approved funding for incremental capital costs to incremental operating costs, as long as the use of the flexibility does not change the intent of the project. Any reallocation should be reported to the Executive Committee; (iv) Funding of up to a maximum of 25 per cent above the cost effectiveness threshold will be provided for projects when needed for the introduction of low global warming potential (GWP) alternatives; HCFC phase‐out in the refrigeration and air‐conditioning manufacturing sector (viii) Incremental operating costs for projects in the air conditioning sub‐sector will be considered at USD 6.30/metric kg of HCFC consumption to be phased out at the manufacturing enterprise; (ix) Incremental operating costs for projects in the commercial refrigeration sub‐sector will be considered at USD 3.80/metric kg of HCFC consumption to be phased out at the manufacturing enterprise; (x) Consistent with decision 31/45 of the Executive Committee, incremental operating costs will not be considered for enterprises categorized under the refrigeration equipment assembly, installation and charging sub‐sector; HCFC phase‐out in the refrigeration servicing sector (xi) Article 5 countries that have total HCFC consumption of up to 360 metric tonnes must include in their HPMP, as a minimum:
a. A commitment to meeting, without further requests for funding, at least the freeze in 2013 and the 10 per cent reduction step in 2015, and if the country so decides, the 35 per cent reduction step in 2020. This shall include a commitment by the country to restrict imports of HCFC‐based equipment if necessary to achieve compliance with the reduction steps to support relevant phase‐out activities; b. Mandatory reporting, by the time funding tranches for the HPMP are requested, on the implementation of activities undertaken in the refrigeration servicing sector and in the
72Excerpt from UNEP/OzL.Pro/ExCom/60/54 www.multilateralfund.org/sites/60/Document%20Library2/1/6054.pdf
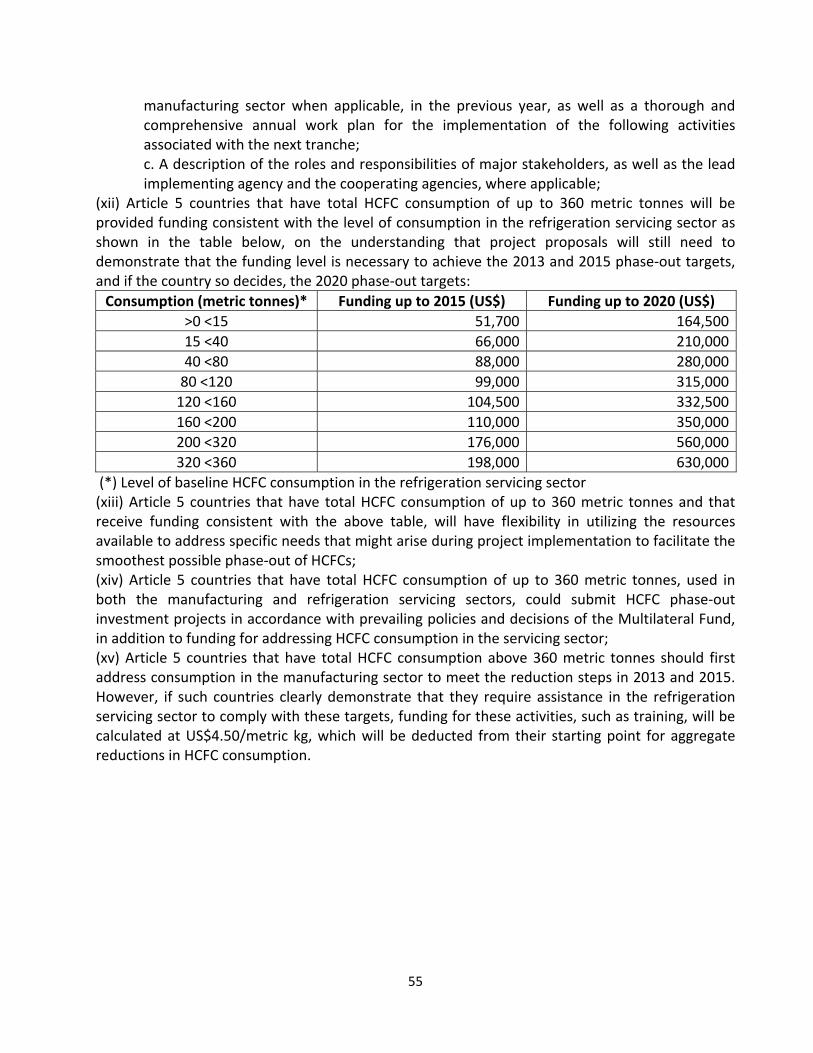
55
manufacturing sector when applicable, in the previous year, as well as a thorough and comprehensive annual work plan for the implementation of the following activities associated with the next tranche; c. A description of the roles and responsibilities of major stakeholders, as well as the lead implementing agency and the cooperating agencies, where applicable;
(xii) Article 5 countries that have total HCFC consumption of up to 360 metric tonnes will be provided funding consistent with the level of consumption in the refrigeration servicing sector as shown in the table below, on the understanding that project proposals will still need to demonstrate that the funding level is necessary to achieve the 2013 and 2015 phase‐out targets, and if the country so decides, the 2020 phase‐out targets:
Consumption (metric tonnes)* Funding up to 2015 (US$) Funding up to 2020 (US$)
>0 <15 51,700 164,500
15 <40 66,000 210,000
40 <80 88,000 280,000
80 <120 99,000 315,000
120 <160 104,500 332,500
160 <200 110,000 350,000
200 <320 176,000 560,000
320 <360 198,000 630,000
(*) Level of baseline HCFC consumption in the refrigeration servicing sector (xiii) Article 5 countries that have total HCFC consumption of up to 360 metric tonnes and that receive funding consistent with the above table, will have flexibility in utilizing the resources available to address specific needs that might arise during project implementation to facilitate the smoothest possible phase‐out of HCFCs; (xiv) Article 5 countries that have total HCFC consumption of up to 360 metric tonnes, used in both the manufacturing and refrigeration servicing sectors, could submit HCFC phase‐out investment projects in accordance with prevailing policies and decisions of the Multilateral Fund, in addition to funding for addressing HCFC consumption in the servicing sector; (xv) Article 5 countries that have total HCFC consumption above 360 metric tonnes should first address consumption in the manufacturing sector to meet the reduction steps in 2013 and 2015. However, if such countries clearly demonstrate that they require assistance in the refrigeration servicing sector to comply with these targets, funding for these activities, such as training, will be calculated at US$4.50/metric kg, which will be deducted from their starting point for aggregate reductions in HCFC consumption.