thays helena pereira borges
TRANSCRIPT

TESIS DOCTORAL Thays Helena Pereira Borges
Caracterización nutricional, físico-química y organoléptica de aceites de oliva virgen producidos en Brasil en comparación con las variedades originales españolas
DOCTORADO EN NUTRICIÓN Y CIENCIAS DE LOS ALIMENTOS
Universidad de Granada
Facultad de Farmacia
Departamento de Nutrición y Bromatología
Consejo Superior de
Investigaciones Científicas
Estación Experimental del Zaidín
Departamento de Fisiología y
Bioquímica de Nutrición Animal
Instituto Politécnico de Bragança
Departamento de Produção e Tecnologia
Vegetal
Caracterización nutricional, físico-química y organoléptica de
aceites de oliva virgen producidos en Brasil en comparación
con las variedades originales españolas
Thays Helena Pereira Borges
Programa de Doctorado en Nutrición y Ciencias de los Alimentos
DIRECTORES:
Isabel Seiquer Goméz-Pavón
José Alberto Cardoso Pereira
Granada, 2017.

Editor: Universidad de Granada. Tesis Doctorales Autora: Thays Helena Pereira BorgesISBN: 978-84-9163-753-0 URI: http://hdl.handle.net/10481/49316


La presente Memoria de Tesis Doctoral se inició en el Departamento de Nutrición y
Bromatologia de la Universidad de Granada bajo la dirección de Carmen Cabrera-Vique y ha
sido desarollada en el Departamento de Fisiología y Bioquímica de la Nutrición Animal de la
Estación Experimental de Zaídin – CSIC y Departamento de Produção e Tecnología Vegetal del
Instituto Politécnico de Bragança.
Además, algunas partes del presente estudio experimental fueron llevadas a cabo en otros
centros, concretamente en el Laboratorio Agroalimentario de Atarfe de Granada (Consejería de
Agricultura y Pesca de la Junta de Andalucía, Granada) y en Centro de Investigación Biomédica
del Parque Tecnológico de Ciencias de la Salud (Universidad de Granada).
El presente trabajo se ha financiado gracias a una beca predoctoral del programa “Ciencia sin
fronteras” de CAPES (Coordinación de Perfeccionamiento del Personal de Nivel Superior) del
Ministerio de Educación de Brasil y al contrato de apoyo tecnólogico entre la Universidad de
Granada, la Estación Experimental de Zaídin y el Consejo Regulador de la denominación de
Origen ESTEPA intitulado “Determinación de polifenoles y propiedades antioxidantes del
aceite de oliva virgen extra, variedades Arbequina y Hojiblanca, de la Comarca de Estepa”.
Las muestras utilizadas en el presente estudio fueron donadas por almazaras de Brasil y España:
Casas Hualdo
Castillo Canena
Consejo Regulador de Denominación de Origen (DOP) Estepa
Consejo Regulador de Denominación de Origen (DOP) Les Garrigues
Cortijo de Jara
Epamig (Agricultural Research Company of Minas Gerais)
Olivas do Sul
Quaryat Dillar

Los resultados de esta Tesis doctoral forman parte de las seguintes publicaciones:
Borges, T. H., Pereira, J. A., Cabrera-Vique, C., Lara, L., Oliveira, A. F., & Seiquer, I. (2017).
Characterization of Arbequina virgin olive oils produced in different regions of Brazil and
Spain: Physicochemical properties, oxidative stability and fatty acid profile. Food Chemistry,
215, 454-462.
Borges, T. H., López, L. C., Pereira, J. A., Cabrera–Vique, C., & Seiquer, I. (2017).
Comparative analysis of minor bioactive constituents (CoQ10, tocopherols and phenolic
compounds) in Arbequina extra virgin olive oils from Brazil and Spain. Journal of Food
Composition and Analysis, 63, 47-54.
Borges, T. H., Pereira, J. A., Cabrera–Vique, C., & Seiquer, I. (2017). Study of the antioxidant
potential of Arbequina extra virgin olive oils from Brazil and Spain applying combined
models of simulated digestion and cell culture markers. Journal of Functional Foods, 37,
209-218.
Borges, T. H., Ramalhosa, R.; Pereira, J. A., Cabrera–Vique, C., & Seiquer, I. (2017). Use of
Response Surface methodology (RSM) for the identification of the best extraction conditions
by headspace solid phase micro extraction (HS-SPME) of the volatile profile of cv.
Arbequina extra-virgin olive oil. En evaluación. European Journal of Lipid Science and
Technology.
Borges, T. H., António, M.P., Luis, G.D., Seiquer, I., Pereira, J. A. (2017). Application of
electronic tongue for assessing the sensory profile of Brazilian and Spanish EVOO based on
estimation of volatile and phenolic compounds. En preparación.
Igualmente, han sido presentados en los siguintes congresos:
Seiquer, I., Borges, T. H., López, L. C., & Cabrera–Vique, C. (2015). Coordenadas de color
CIELAB, pigmentos y contenido en coenzima q10 en aceites de oliva virgen extra,
variedades arbequina y hojiblanca. I Congreso Internacional, Current trends and new
challenges in olive oil sector. Murcia, España
Borges, T. H., Pereira, J. A., Cabrera–Vique, C., & Seiquer, I. (2016). Arbequina variety:
comparison between quality parameters, oxidative stability and fatty acid profile of olive oils
produced in Spain and Brazil. I Congreso Ibérico de olivicultura, V jornadas nacionales Del

grupo de olivicultura de la sociedad española de ciencias hortícolas (SECH), VII Simpósio
nacional de olivicultura da associação portuguesa de horticultura (APH). Badajoz, España
Borges, T. H., Rueda, A., & Seiquer, I. (2016). Modificaciones de las propiedades antioxidantes
del aceite de oliva virgen extra durante el proceso de digestión. Relación con el contenido de
clorofilas y carotenoides XI Reunión del Grupo Español de Investigación en Radicales
Libres (GEIRLI). Granada, España
Borges, T. H., Pereira, J. A., Cabrera–Vique, C., & Seiquer, I. (2017). Protective antioxidant
effect of bioaccessible fraction from Arbequina extra virgin olive oils in Caco-2 cells. XVIII
Simposio Científico-Técnico Internacional EXPOLIVA– Feria Internacional del Aceite de
Oliva y Industria afines. Jaén, España
Borges, T. H., Pereira, J. A., Cabrera–Vique, C., & Seiquer, I. (2017). Caracterización físico-
química de aceites de oliva virgen Arbequina producidos en diferentes regiones de Brasil y
España II Jornadas de Investigaciones en Formación: Fomentando la interdisciplinariedad
(JIFFI). Granada, España
Paralelamente durante el período doctoral fueron realizadas otras contribuiciones relacionadas al
tema estudiado en revistas científicas indexadas, libro/revista de divulgación no indexadas.y
congresos.
Publicaciones
Borges, T. H., Cabrera-Vique, C., & Seiquer, I. (2015). Antioxidant properties of chemical
extracts and bioaccessible fractions obtained from six Spanish monovarietal extra virgin
olive oils: Assays in Caco-2 cells. Food & function, 6 (7), 2375-2383.
Seiquer, I., Borges, T. H., & Cabrera-Vique, C. (2017). AOVE D.O.P. Estepa, Fuente de Salud.
Editora: © Consejo Regulador de la Denominación de Origen Estepa - Edificio Centro de
Empresas - Pol. Ind.Sierra Sur Avda. Del Mantecado s/n 41560 Estepa (Sevilla). 2017.
Borges, T. H., & Seiquer, I. (2017). “Nuestros aceites: Fuente de Salud” Ref. Revista: Frutado
Intenso, 2017, 36.

Congresos
Borges, T. H., Cabrera-Vique, C., & Seiquer, I. (2014). Total Phenolic Compounds and
Antioxidant Capacity of varieties of Spanish Extra Virgin Olive Oils. Special Issue:
Abstracts of the 37th Congress of the Spanish Society of Physiological Sciences (SECF),
Granada, Spain
Borges, T. H., Cabrera-Vique, C., & Seiquer, I. (2014). Total Phenolic Compounds and
Antioxidant Capacity of varieties of Spanish Extra Virgin Olive Oils. XXXVII Congreso de
la Sociedad Española de Ciencias Fisiológicas (SECF).Granada, España
Borges, T. H., Cabrera-Vique, C., & Seiquer, I. (2015). Antioxidant effects in Caco-2 cells after
in vitro digestion of Spanish monovarietal extra virgin olive oils. XVII Simposio Científico-
Técnico de EXPOLIVA – Feria Internacional del Aceite de Oliva e Industria afines. Jaén,
España
Borges, T. H., Serna, A., Cabrera–Vique, C., & Seiquer, I. (2015). Polifenoles y propiedades
antioxidantes del aceite de oliva virgen extra, variedad hojiblanca, antes y después de un
proceso de digestión in vitro. I Congreso Internacional, Current trends and new challenges in
olive oil sector. Murcia, España
Borges, T. H., Pereira, J. A., Cabrera–Vique, C., & Seiquer, I. (2016). Efecto del origen
geográfico en la estabilidad oxidativa y perfil de ácidos grasos de aceites de oliva virgen
extra, variedad Hojiblanca. I Congreso Ibérico de olivicultura, V jornadas nacionales del
grupo de olivicultura de la sociedad española de ciencias hortícolas (SECH), VII Simpósio
nacional de olivicultura da associação portuguesa de horticultura (APH). Badajoz, España

Agradecimentos


A mis padres
A todos que ya no están


ÍNDICE
CAPÍTULO 1. Justificación y objetivos............................................................................ 1
CAPÍTULO 2. Revisión Bibliográfica .............................................................................. 7
2.1. Historia del origen y expansión del aceite de oliva .................................................... 9
2.2. Producción, consumo e importancia del aceite de oliva a nivel mundial ................. 10
2.3. Producción, consumo e importancia del aceite de oliva en Brasil ........................... 12
2.4. Proceso de obtención y su influencia en el aceite ................................................... 14
2.4.1. Factores agronómicos ..................................................................................................... 15
2.4.1.1. Variedad ................................................................................................................................... 15
2.4.1.2. Sistema de cultivo .................................................................................................................... 16
2.4.1.3. Fertilización, manejo del suelo y poda ..................................................................................... 17
2.3.1.4. Control de plagas y daños por frio ........................................................................................... 17
2.4.1.5. Maduración .............................................................................................................................. 18
2.4.1.6. Régimen hídrico ....................................................................................................................... 19
2.4.1.7. Sistemas de recolección ........................................................................................................... 20
2.4.1.8. Transporte ................................................................................................................................ 21
2.4.1.9. Almacenamiento del fruto post cosecha .................................................................................. 21
2.4.2. Factores climáticos y factores geográficos ..................................................................... 22
2.4.3. Factores tecnológicos...................................................................................................... 23
2.4.3.1. Recepción y limpieza ............................................................................................................... 23
2.4.3.2. Molienda .................................................................................................................................. 24
2.4.3.3. Batido ....................................................................................................................................... 25
2.4.3.4. Centrifugación ......................................................................................................................... 26
2.4.3.5. Almacenamiento, filtración, y envasado .................................................................................. 28
2.5. Composición de los aceite de oliva .......................................................................... 29
2.5.1. Fracción saponificable: perfil de ácidos grasos .............................................................. 30
2.5.2. Fracción insaponificable ................................................................................................. 32
2.5.2.1 Coenzima Q10 ............................................................................................................................ 32
2.5.2.2. Compuestos fenólicos .............................................................................................................. 34
2.5.2.3. Compuestos volátiles ............................................................................................................... 37
2.5.2.4. Pigmentos ................................................................................................................................ 39
2.5.2.5. Tocoferoles .............................................................................................................................. 40
2.6. Definición y clasificación del aceite de oliva ........................................................... 42

2.7. Parámetros de calidad del aceite de oliva reglamentados......................................... 47
2.7.1. Acidez ............................................................................................................................. 47
2.7.2. Índice de Peróxidos......................................................................................................... 48
2.7.3. Coeficientes de extinción específica ............................................................................... 48
2.8. Parámetros no reglamentados ................................................................................... 49
2.8.1. Estabilidad oxidativa ...................................................................................................... 49
2.8.2. Color ............................................................................................................................... 49
2.9. Parámetros organolépticos ........................................................................................ 50
2.10. Aceites monovarietales: la variedad Arbequina ..................................................... 54
2.11. Propiedades antioxidantes ...................................................................................... 55
2.12. Biodisponibilidad de compuestos antioxidantes .................................................... 58
2.14. Aspectos beneficiosos del aceite de oliva .............................................................. 60
CAPÍTULO 3 Material y Métodos .................................................................................. 79
3.1. Muestra ..................................................................................................................... 81
3.2. Determinaciones analíticas ....................................................................................... 84
3.2.1. Parámetros de calidad y físico-químicos ........................................................................ 84
3.2.2. Composición ................................................................................................................... 84
3.2.3. Caracterización organoléptica ........................................................................................ 85
CAPÍTULO 4. Resultados ............................................................................................... 91
Artículo 1 .................................................................................................................................. 93
Artículo 2 ................................................................................................................................ 127
Artículo 3 ................................................................................................................................ 161
Artículo 4 ................................................................................................................................ 203
Artículo 5 ................................................................................................................................ 227
CAPÍTULO 5: Discusión general.................................................................................. 257
CAPÍTULO 6. Conclusiones y Resumen ...................................................................... 277

15
ÍNDICE DE FIGURAS
Figura 1. Producción (%) de aceites vegetales comestibles en el mundo en los años
2015-2016. Fuente: USDA, 2017. ............................................................................................... 10
Figura 2. Producción mundial de aceite de oliva (%) en los años 2010- 2016. Fuente:
COI, 2017A. ................................................................................................................................ 11
Figura 3. Consumo mundial de aceite de oliva (%) en los años de 2010- 2016. Fuente:
COI, 2017A. ................................................................................................................................ 12
Figura 4. Importación de aceite de oliva total (incluido aceite de orujo) en Brasil en
toneladas de 1980 -2016. Fuente: COI, 2017D. .......................................................................... 14
Figura 5. Etapas en la obtención del aceite de oliva. .................................................................. 15
Figura 6. Cambios durante proceso de maduración de la aceituna. ............................................ 19
Figura 7. Recolección mecánica por agitación del tronco. A - Agitación por vibrador de
troncos acoplado a un tractor; B - Agitación por peine acopado a un tractor. Fuente:
Sola-Guirado y col., 2014. .......................................................................................................... 21
Figura 8. A - Recepción del fruto; B - limpieza Fuente: Di Giovacchino y col., 2013 ............... 24
Figura 9. Partes de la aceituna. .................................................................................................... 25
Figura 10. A - batidora horizontal; B - etapa de batido. .............................................................. 26
Figura 11. A - Centrífuga horizontal; B - Centrífuga vertical. ................................................... 27
Figura 12. A- Almacenamiento del aceite en depósitos de acero inoxidable, B –
Envasado. .................................................................................................................................... 29
Figura 13. Composición del aceite de oliva - Fracción saponicable e insaponificable. ............. 29
Figura 14. Clasificación de los ácidos grasos de acuerdo con las propiedades
estructurales y químicas. ............................................................................................................. 31
Figura 15. Reacción redox de conversión entre forma reducida y oxidada de coenzimas
Q. Adaptado: Alcázar- Fabra y col., 2016. .................................................................................. 33
Figura 16. Estructuras químicas de las principales clases de compuestos fenólicos
encontrados en los aceite de oliva vírgenes................................................................................. 36
Figura 17. Ruta de formación de los principales volátiles encontrados en los aceites de
oliva y sus respectivos descriptores olfativos. Adaptado: Kalua y col., 2007. ............................ 38
Figura 18. A - Cambios de color durante la maduración de la aceituna, B - Colores de
aceites de oliva. ........................................................................................................................... 40
Figura 19. Estructura química de los tocoferoles. Adaptado: Lopez y col., 2014. ...................... 41

Figura 20. Tipos de aceite de oliva y orujo de Oliva comerciales. Adaptado: Mataix,
2001. ............................................................................................................................................ 44
Figura 21. Reacción de oxidación por hidrólisis y formación de los ácidos grasos libres. ......... 47
Figura 22. Esquema de peroxidación lipídica. Adaptado: Shahidi y Zhong, 2010. .................. 48
Figura 23. Esquema del principio del método de Rancimat. ....................................................... 49
Figura 24. Coordenadas del color CIELAB. ............................................................................... 50
Figura 25. Componentes del análisis mediante lengua electrónica. ............................................ 53
Figura 26. Células Caco-2. A- monocapa de células. B- Microvellosidades. ............................. 59
Figura 27. Efectos saludables de los aceites de oliva. ................................................................. 61
Figura 28.Zonas de producción de los diferentes aceites utilizados en este estudio:
España (1-9) y Brasil (10-11). ..................................................................................................... 82
Figura 29. Esquema general de las determinaciones analíticas realizadas en las muestras
de aceite. ...................................................................................................................................... 88
ÍNDICE DE TABLAS
Tabla 1. Características de los aceites de oliva y de orujo establecidas por el
Reglamento (CEE) n⁰ 2568/91 y sus modificaciones. ................................................................ 45
Tabla 2. Descripción de los atributos positivos y negativos de los aceites de oliva
vírgenes. ...................................................................................................................................... 51
Tabla 3. Coordenadas geográficas (latitud y longitud), altitud (m), temperatura media
anual (°C), precipitaciones (mm) y temperatura media mínima y máxima anual de las
diferentes zonas de producción de los aceites de España (1-9) y Brasil (10-11). ....................... 83

LISTA DE ABREVIATURAS
ABTS: Ácido 2,2.-azinobis-(3-etilbenzotiazolín-6-sulfónico).
AGMI: Ácidos grasos monoinsaturados.
AGPI: Ácidos grasos poliinsaturados.
AGS: Ácidos grasos saturados.
AO: Aceite de oliva
AOV: Aceite de oliva virgen
AOVE: Aceite de oliva virgen extra
Caco-2: Células de Adenocarcinoma de Colon humano
COI: Consejo Oleícola Internacional
DNA: Ácido desoxirribonucleico.
DPPH: 2,2-difenil-1-picrilhidrazil
EFSA: Autoridad Europea para la Seguridad de los Alimentos
FRAP: Capacidad de reducción férrica del plasma
HDL: Lipoproteínas de densidad alta
IP: Índice de peróxidos.
LDL: Lipoproteínas de densidad baja.
LOX: Ruta de la lipoxigenasa
MTT: Reducción metabólica del Bromuro de 3-(4,5-dimetiltiazol-2-ilo)-
2,5difeniltetrazol
REDOX: Reacciones de oxidación-reducción
RNA: Ácido ribonucleico.
RNS: Especies reactivas de nitrogeno
ROS: Especies reactivas de oxigeno
RSS: Especies reactivas de azufre
t-BOOH: ter-butil-hidroperóxido
TROLOX: Ácido 6-hidroxi-2,5,7,8-tetrametil-cromato-2-carboxílico.


CAPÍTULO 1. Justificación y objetivos


Justificación y objetivos
3
El aceite de oliva virgen es obtenido del fruto del olivo exclusivamente por medios
mecánicos u otros procedimientos físicos y es reconocido como el proprio zumo de la
aceituna. Se trata de un alimento enormemente apreciado por sus particulares
características organolépticas, que lo diferencian de cualquier otro aceite comestible, así
como por sus efectos beneficiosos sobre la salud. Es la grasa de elección en la dieta
mediterránea, siendo responsable de algunas de las propiedades saludables que se
atribuyen a dicha dieta.
El olivar y la producción de aceite de oliva están concentrados en la cuenca del
Mediterráneo, donde se produce el 70% del aceite de oliva mundial, destacando España
como el primer productor mundial, con una producción que supera el 40% del total.
La creciente demanda en el mercado internacional y en mercados cada vez más
especializados, juntos con las nuevas prácticas de cultivo agronómicas de cultivo han
permitido la expansión del cultivo del olivo en diferentes regiones del mundo como
Argentina, Australia, Brasil, Chile, China, Estados Unidos y otros, así como la
expansión de variedades de aceituna en regiones no autóctonas dentro de los propios
países productores.
En Brasil, el cultivo del olivo se introdujo en el siglo XIX, pero actualmente la
producción se mantiene en cifras muy reducidas, que ni siquiera aparecen en los datos
de producción mundial de aceites de oliva del Consejo Oleícola Internacional (COI).
Sin embargo, Brasil sí aparece en la lista de los países consumidores; el consumo
brasileño de aceite de oliva ha ido en aumento en los últimos años y actualmente supone
alrededor de un 2% del total en el mundo. Se produce por tanto una situación
controvertida en Brasil, ya que no tiene producción suficiente para afrontar su creciente
consumo de aceite de oliva, con lo cual las cifras de importación han alcanzado en los
últimos años valores históricos. No ha sido hasta la última década cuando ha empezado
la producción comercial de aceite de oliva en Brasil, motivada por el aumento de poder
económico y el conocimiento de las propiedades nutricionales del aceite, factores que
han favorecido el incremento del consumo.
Actualmente, el aceite brasileño producido y comercializado es predominantemente de
la variedad española Arbequina, debido a sus características particulares adaptadas a los
cultivos intensivo y súper-intensivo y a sus propiedades organolépticas. Sin embargo, su
producción es muy incipiente comparada con las necesidades del mercado y hay escasos
datos sobre su calidad y composición. Hoy día se sabe que, además del perfil en ácidos

Justificación y objetivos
4
grasos (y la especial riqueza en ácido oleico), otros componentes del aceite de oliva,
especialmente los de la fracción no saponificable, son excepcionalmente importantes
para definir la calidad y las propiedades de los aceites. Es el caso de los compuestos
fenólicos, los tocoferoles o la coenzima Q. Se hace necesario, por otra parte, recurrir a
tecnologías específicas para el adecuado análisis de los componentes minoritarios o de
las características sensoriales, como los compuestos volátiles o el uso de la llamada
lengua-electrónica. A este respecto, hay que señalar que no existe ninguna información
científica respecto a los compuestos minoritarios, el perfil organoléptico o las
propiedades antioxidantes de los aceites de oliva producidos en Brasil.
La literatura científica muestra que diferentes factores (agronómicos, climáticos,
geográficos y procesos tecnológicos) juegan un papel fundamental en la calidad y
composición de los aceites producidos. Existen evidencias sobre el efecto y las
interacciones de los factores climáticos y geográficos con la composición de los aceites
de oliva, especialmente en lo referente al perfil de ácidos grasos y a los componentes
minoritarios, que a su vez repercutirán en las propiedades sensoriales y saludables del
aceite. De esa forma, cada variable es importante en el proceso de obtención del aceite,
ya que pueden afectar a su calidad final. Además, hay que destacar que hasta la presente
fecha, hay un conocimiento científico limitado sobre las características y propiedades
de los aceites monovarietales de diferentes áreas geográficas, especialmente los
obtenidos en las nuevas zonas de producción.
Con los antecedentes expuestos, la presente memoria de tesis doctoral tiene por objetivo
general realizar un estudio comparativo amplio de los parámetros de calidad,
composición y características organolépticas de aceites de la variedad Arbequina
producidos en Brasil y procedentes de diferentes regiones españolas.
Este objetivo general se ha desglosado en los siguientes objetivos parciales:
1) Caracterizar las muestras en relación a los parámetros de calidad (acidez,
índice de peróxidos y coeficiente de extinción específica), parámetros
físico-químicos (estabilidad oxidativa y color) y composición (contenido
de pigmentos – clorofilas/carotenoides y perfil de ácidos grasos) y
aplicar análisis estadísticos multivariantes para clasificar los aceites de
acuerdo con las zonas de producción.
2) Analizar la fracción minoritaria de los aceites en cuanto a su contenido
en tocoferoles, compuestos fenólicos y coenzima Q10, evaluando además,

Justificación y objetivos
5
las posibles relaciones con los factores climáticos y geográficos de las
regiones productoras.
3) Estudiar las propiedades antioxidantes de los aceites, prestando especial
atención a las modificaciones debidas al proceso de digestión en dichas
propiedades o en los compuestos relacionados con ellas, como el
contenido en polifenoles totales. Analizar, además, las propiedades
antioxidantes de los aceites a nivel celular, mediante el uso de cultivos
celulares.
4) Evaluar de las propiedades organolépticas de los aceites, incluyendo,
además de la evaluación sensorial mediante panel de cata, el análisis de
compuestos volátiles y la aplicación del análisis potenciométrico de
lengua electrónica. Como objetivo preliminar de este apartado se incluyó
la optimización de las condiciones del método para la determinación de
compuestos volátiles.
De esa forma, esta memoria de la tesis doctoral pretende contribuir al conocimiento de
las características y propiedades de los aceites de oliva virgen, incentivando su consumo
y fortaleciendo la colaboración técnico-científica entre Brasil y España.

Justificación y objetivos
6

7
CAPÍTULO 2. Revisión Bibliográfica

8

Revisión bibliográfica
9
2.1. Historia del origen y expansión del aceite de oliva
El olivar es uno de los cultivos más antiguos del mundo, aunque su verdadero origen no
está determinado con exactitud (Vossen, 2007; Kapellakis y col., 2008). Sin embargo,
parece ser que tal como es conocido actualmente, su origen corresponde a la edad de
Bronce (3150-1200 a.C), en la región de Persia y Mesopotamia. Posteriormente, con la
expansión marítima se extendió a Siria, Palestina y norte de África, donde
concretamente en Turquía, Grecia y Egipto surgieron los primeros hallazgos sobre la
obtención del del aceite de oliva (AO). Durante el imperio Romano tuvo lugar la
expansión del cultivo y del uso del AO, aplicado a diversas finalidades como uso
farmacéutico y como fuente de energía (Vossen, 2007; Kapellakis y col., 2008).
Durante los siglos XIX y XX, con el surgimiento de otras fuentes de energía y la
obtención de los aceites de semillas, disminuyó la producción de AO y para competir en
el mercado de oleaginosas se utilizaron prácticas de adulteración como las mezclas con
otros aceites vegetales (Vossen, 2007; Kapellakis y col., 2008). En 1959, como
respuesta a las adulteraciones generalizadas, surgió el Consejo Oleícola Internacional
(COI) (Vossen, 2007), una organización internacional asociativa entre los países
productores con el objetivo de fortalecer, normalizar y promocionar el sector oleícola.
Actualmente, según datos del Departamento de Agricultura de los Estados Unidos
(USDA) (USDA, 2017), el AO representa 2% de la producción mundial de aceites
vegetales (Figura 1). Las perspectivas de crecimiento son alentadoras, en parte debido a
la disminución reciente de la demanda de otros aceites dominantes en el mercado
alimentario como el aceite de palma y a la búsqueda de alternativas más sostenibles.
Otros factores positivos son la labor de promoción del COI en los países potenciales de
consumo, la popularidad de la dieta mediterránea y el creciente conocimiento de sus
propiedades saludables en detrimento de otras grasas animales/vegetales y las
características sensoriales únicas de los aceites de oliva (Huang y Sumpio, 2008; Barjol,
2013).
De esa forma, a día de hoy, el AO es uno de los aceites comestibles de mayor valor
económico entre los aceites vegetales, moviendo una cifra importante, más de 9 billones
de euros a nivel mundial con respecto al consumo de 2015/2016 (COI, 2017A; COI,
2017B).

Revisión bibliográfica
10
2%
33%
4%
3%16%
29%
9%
SojaPalma
Girasol
Palmiste
Cacahuete
Colza
Coco Algodón
Oliva
Figura 1. Producción (%) de aceites vegetales comestibles en el mundo en los años 2015-2016.
Fuente: USDA, 2017.
2.2. Producción, consumo e importancia del aceite de oliva a nivel mundial
Según Vossen (2013), el olivar ocupa una superficie de más de 9 millones de hectáreas
a nivel mundial, de los cuales, alrededor de 2 millones de hectáreas están situadas en
España.
De acuerdo con los datos del COI de 2010-2016, detallados en la Figura 2, la
producción a nivel mundial se concentra en los países de la Unión Europea representado
aproximadamente el 70%. Destaca la Cuenca del Mediterráneo, siendo España
considerada el primer productor con el 43% de la producción mundial, seguido por
Italia (14%), Grecia (10%) y Portugal (3%), mientras los países extra comunitarios,
representan alrededor del 30%.

Revisión bibliográfica
11
Asimismo, España es el mayor exportador mundial y en los últimos años hay una
aumento de las exportaciones de AO para países extra comunitarios, de
aproximadamente 20% en la última campaña de 2015/2016 (COI, 2017A).
Otros
9%
Marruecos
4% Tunez
6%
Turquía
6%
UE
70%
Siria
5%
Otros países
productores
0,5%
España: 43%
Italia:14%
Grecia:10%
Portugal:3%
Albania, Algeria, Argentina, Croacia, Egipto,
Irán, Israel, Jordania, Líbano, Libia, Australia,
Chile, China, EUA, Palestina
Figura 2. Producción mundial de aceite de oliva (%) en los años 2010- 2016. Fuente: COI,
2017A.
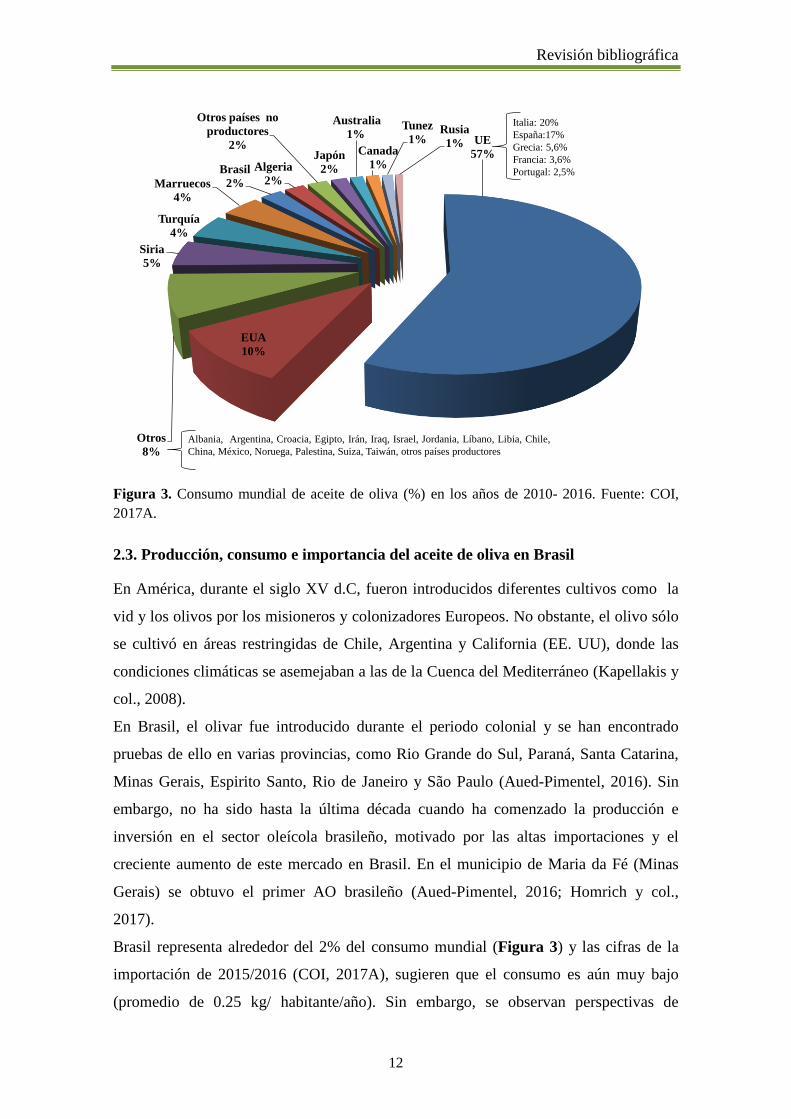
Respecto al consumo mundial de AO, los datos recientes proporcionados por el COI
(2017A) (Figura 3), revelan que la Unión Europea (UE) es el principal consumidor
(57%) y dentro de la UE el orden creciente del consumo es Italia (20%), España (17%),
Grecia (5,6%), Francia (3,6) y Portugal (2,5%).
Por otro lado, se ha observado un incremento mundial del consumo (COI, 2017A) en
países extra comunitarios liderando Estados Unidos con un 10%, proveniente
principalmente de importación, ya que tiene producción escasa. Además, otros países
presentan un gran potencial de consumo como Brasil (2%), Japón (2%), Australia (1%)
y Rusia (1%) (Figura 3).
Revisión bibliográfica
12
UE
57%
EUA
10%
Otros
8%
Siria
5%
Turquía
4%
Marruecos
4%
Brasil
2%
Algeria
2%
Otros países no
productores
2%Japón
2%
Australia
1%
Canada
1%
Tunez
1%Rusia
1%
Italia: 20%
España:17%
Grecia: 5,6%
Francia: 3,6%
Portugal: 2,5%
Albania, Argentina, Croacia, Egipto, Irán, Iraq, Israel, Jordania, Líbano, Libia, Chile,
China, México, Noruega, Palestina, Suiza, Taiwán, otros países productores
Figura 3. Consumo mundial de aceite de oliva (%) en los años de 2010- 2016. Fuente: COI,
2017A.
2.3. Producción, consumo e importancia del aceite de oliva en Brasil
En América, durante el siglo XV d.C, fueron introducidos diferentes cultivos como la
vid y los olivos por los misioneros y colonizadores Europeos. No obstante, el olivo sólo
se cultivó en áreas restringidas de Chile, Argentina y California (EE. UU), donde las
condiciones climáticas se asemejaban a las de la Cuenca del Mediterráneo (Kapellakis y
col., 2008).
En Brasil, el olivar fue introducido durante el periodo colonial y se han encontrado
pruebas de ello en varias provincias, como Rio Grande do Sul, Paraná, Santa Catarina,
Minas Gerais, Espirito Santo, Rio de Janeiro y São Paulo (Aued-Pimentel, 2016). Sin
embargo, no ha sido hasta la última década cuando ha comenzado la producción e
inversión en el sector oleícola brasileño, motivado por las altas importaciones y el
creciente aumento de este mercado en Brasil. En el municipio de Maria da Fé (Minas
Gerais) se obtuvo el primer AO brasileño (Aued-Pimentel, 2016; Homrich y col.,
2017).
Brasil representa alrededor del 2% del consumo mundial (Figura 3) y las cifras de la
importación de 2015/2016 (COI, 2017A), sugieren que el consumo es aún muy bajo
(promedio de 0.25 kg/ habitante/año). Sin embargo, se observan perspectivas de

Revisión bibliográfica
13
aumento en las importaciones (Figura 4), llegando a un nivel máximo de 75 mil
toneladas en 2012. Durante esos años, varios factores fueron determinantes para
intensificar las importaciones, principalmente la apertura comercial, aumento de la clase
media brasileña y conocimiento de los beneficios para la salud del aceite de oliva
(Aued-Pimentel, 2016). Por otro lado, los hábitos alimenticios brasileños y la influencia
de la inmigración colaboran con el uso culinario del AO (Aued-Pimentel, 2016) y su
creciente interés por el mercado oleícola.
Durante los últimos años (2015-2016), ha habido una disminución de poder económico,
llevando a una inestabilidad política que justifica la caída en las tasas de importación,
pero las últimas cifras del COI (octubre 2016-junio de 2017), muestran un incremento
importante de las importaciones en Brasil en aproximadamente un 29% (COI, 2017E).
De esa forma, a día de hoy, el AO y el aceite de orujo consumidos en Brasil es
importado de Europa (Portugal, España, Italia y Grecia) y Sudamérica (Argentina y
Chile), propiciando un elevado precio del mismo y haciéndolo casi inaccesible para la
mayoría de la población (Ballus y col., 2014). Con esos antecedentes, Brasil está
empezando la producción del aceite con el objetivo de proporcionar un producto a
precio más bajo para los consumidores en el futuro y aumentar las oportunidades en el
mercado agrícola (Ballus y col., 2014).
La expansión de la olivicultura en Brasil ha comenzado en dos zonas principales:
Suroeste y Sur de Brasil, correspondiente a las provincias de Minas Gerais y Rio
Grande do Sul (De Oliveira da Silva y col., 2012), donde existen aproximadamente 60
productores en la región de Mantiqueira (frontera entre las provincias de São Paulo y
Minas Gerais), con aproximadamente 1800 hectáreas cultivadas, el 90% centradas en la
producción de aceite de oliva. La producción estimada para 2017 es de 45 toneladas de
aceitunas y 50 mil litros de aceite de oliva (Homrich y col., 2017). En Rio Grande do
Sul, hay alrededor de 2000 hectáreas y 160 productores, aunque muchos de los olivares
considerados todavía se encuentran en fase inicial de crecimiento (SEAPI, 2017) y
según los últimos datos disponibles la producción fue estimada en 400 toneladas de
aceitunas y 45 mil litros de aceite (Governo do Estado do Rio Grande do Sul, 2017).
En relación a las variedades plantadas, según De Oliveira da Silva y col., (2012), el 50%
de la variedad cultivada en Minas Gerais en 2012 era la variedad española Arbequina,
mientras los datos más recientes revelan que el 70% de la cosecha de esta región es de
la variedad Arbequina (Olive Oil Times, 2017). Sin embargo, todos los datos de

Revisión bibliográfica
14
producción son incipientes todavía, existiendo solamente cinco marcas comerciales
(Olive Oil Times, 2017), lo cual confirma que la producción nacional todavía es muy
baja frente la demanda creciente del mercado Brasileño.
0
10.000
20.000
30.000
40.000
50.000
60.000
70.000
80.000
Ca
nti
da
d (
ton
ela
da
s)
Año
Figura 4. Importación de aceite de oliva total (incluido aceite de orujo) en Brasil en toneladas
de 1980 -2016. Fuente: COI, 2017D.
2.4. Proceso de obtención y su influencia en el aceite
Para la elaboración del AO, se debe tener en cuenta que una multitud de factores juegan
un papel fundamental en la calidad y composición del AO producido (Figura 5). Esos
factores pueden clasificarse como factores agronómicos y tecnológicos. Los primeros
engloban aquellos que difícilmente pueden modificase (intrínsecos), como la variedad y
las condiciones geográficas y climáticas, y aquellos que pueden controlarse con relativa
facilidad por el agricultor (extrínsecos), como la fertilización del suelo, recolección,
transporte, etc. De esa forma, cada variable es importante en el proceso de obtención del
aceite y consecuentemente pueden afectar la clasificación comercial del mismo.

Revisión bibliográfica
15
Separación Líquido-Sólido
(Centrifugación)
Separación Líquido-Líquido
(Decantación)
Recolección Transporte Molienda Batido
FiltraciónEnvasado
Recepción y limpieza
Comercialización
Figura 5. Etapas en la obtención del aceite de oliva.
2.4.1. Factores agronómicos
Previo a la recolección del fruto, diferentes factores agronómicos y técnicas
agronómicas son fundamentales en la calidad de los AO que serán producidos, entre
ellos la variedad, el sistema de cultivo, la fertilización y manejo del suelo, la poda, el
control de plagas e injurias por el frio, la maduración, el régimen de agua, los sistema de
recolección y el transporte.
2.4.1.1. Variedad
Uno de los primeros factores a ser considerados es la variedad. La composición y el
perfil sensorial del aceite dependen de la interacción entre el potencial genético con las
condiciones de cultivo, que implican una compleja interacción con el medio (clima,
temperatura, precipitaciones, tasa de humedad) y con los factores agronómicos (carga
de cultivo, poda, fertilización, riego, proporción del hojas/fruto y madurez del fruto),
siendo todos esos factores determinantes para la expresión fenotípica consistente
(Inglese y col., 2011; Vossen, 2013).
De esa forma, el contenido de componentes fundamentales del aceite, como la
proporción de ácidos grasos, los pigmentos, o los compuestos fenólicos y volátiles, está
ampliamente relacionado con la interacción de la variedad y las condiciones de cultivo
(Angerosa y col., 2004; Inglese y col., 2011).

Revisión bibliográfica
16
De acuerdo con Vossen, (2013), cuando una misma variedad es cultivada en diferentes
regiones geográficas, algunas de sus características pueden mantenerse mientras que
otras pueden variar significativamente. Así, la elección de una variedad es uno de los
factores determinantes para los nuevos cultivos.
De las 1200 variedades cultivadas en el mundo, solamente 30 predominan en la
producción del AO (Vossen, 2013), entre las que destacan las variedades españolas
picual, arbequina y hojiblanca.
2.4.1.2. Sistema de cultivo
Los sistemas de cultivo no tienen una influencia directa en la calidad de los aceites, pero
permiten maximizar la cantidad y calidad de las aceitunas, tieniendo influencia en la
recolección (Vossen, 2007; Vossen, 2013).
Los sistemas de cultivo del olivo son:
Tradicional: Es un sistema antiguo típico de la cuenca del Mediterráneo. Los
espaciamientos entre árboles son de 8-18 m, poseen una densidad muy baja de
alrededor de 30-173 árboles/hectáreas y rendimientos muy bajos (0,5-4
toneladas/h). La cosecha es considerada ineficaz, realizada manualmente por
vareo o mecánica con uso de vibradores mecánicos.
Intensivo: Sistema desarrollado en los años 80 de espaciamientos variables,
pero generalmente con 7-8 m de distancia entre árboles, permitiendo que el
centro esté abierto y con densidad de 250-555 árboles/hectáreas. Es adaptable a
la variedad, tipo de suelo, terreno o tipo de cosecha. Las cosechas en ese sistema
pueden ser manuales o mecánicas y tardan de media 6-7 años para llegar al pico
productivo.
Súper-Intensivo: Sistema pionero en España en los años 90, implantado
inicialmente en Cataluña y que actualmente cuenta con más de 80.000 ha en
todo mundo. Se utiliza sobre todo para variedades precoces como Arbequina,
Arbosana y Koroneiki. La variedad Arbequina es la variedad más plantada en
ese sistema debido al tamaño del fruto y vigor del árbol. Las distancias entre
árboles son de 1-1,5 m dentro de la fila y de 3-5 m entre las filas, generando una
alta densidad de 1655-2990 árboles/ hectáreas, de producción precoz requiriendo
un manejo agronómico adecuado.
Revisión bibliográfica
17
2.4.1.3. Fertilización, manejo del suelo y poda
Los fertilizantes químicos (nitrógeno, fosfato y potasio) son convencionalmente
empleados en el olivar para la mejora del suelo. La concentración a la que son aplicados
parece tener una estrecha relación con la calidad del AO y el rendimiento óptimo,
siendo dependientes de la variedad, pero también el tipo de suelo puede influir en la
composición de los aceites (Luna y Aparicio, 2002; Dag y col., 2009).
Diversos estudios muestran que la fertilización puede afectar a la composición en ácidos
grasos, el contenido en compuestos fenólicos y tocoferoles (Fernández-Escobar y col.,
2006; Dag y col., 2009; Romero y col., 2016). Además, Romero y col., (2016),
estudiando diferentes variedades producidas en Chile han concluido que el suelo y clima
tiene un gran influencia en los compuestos volátiles.
Con relación a los sistemas de manejo de suelo los principales tipos son convencional,
integrado y ecológico y se diferencian en el modelo de control de plagas, tipo de
fertilizantes empleados (biológico, químico) y rotación de cultivos. Ninfali y col.,
(2008), en un estudio comparativo entre los sistemas de manejo convencional versus
ecológico durante 3 años, mostró que no hay un efecto consistente en los parámetros
físico químicos, actividad antioxidante, composición en tocoferoles, compuestos
fenólicos y volátiles de los AO evaluados. No obstante, datos más recientes indican que
el sistema de manejo (convencional o ecológico) puede influir en el contenido de
compuestos fénolicos, volátiles y en a las características sensoriales de los aceites
(Jiménez y col., 2017).
Otro aspecto agronómico importante en el olivar es la poda que tiene por objetivo
equilibrar la distribución de la luz dentro de la copa del árbol. Los umbrales de
requerimiento de luz para un aceite de calidad no están definidos en la literatura
científica, aunque se ha descrito un aumento del contenido en polifenoles y clorofilas en
una variedad Italiana (Inglese y col., 2011).
2.3.1.4. Control de plagas y daños por frio
En general, las plagas tienen un efecto negativo en la calidad físico-química y
organoléptica de los aceites de oliva (Angerosa y col, 2004; Inglese y col., 2011;
Vossen, 2013). Una de las plagas más comunes que dañan la aceituna es la mosca del
olivo (Bactrocera oleae) que ataca el fruto permitiendo la penetración de larvas que
conlleva a la rotura de tejido y la exposición al oxígeno, pudiendo desarrollarse hongos

Revisión bibliográfica
18
y bacterias, que aceleran su caída (Inglese y col., 2011). Estudios anteriores han
comprobado que la infestación por la mosca del olivo afecta a los parámetros físico-
químicos (acidez, índice de peróxidos y estabilidad a la oxidación), el perfil en volátiles
y fenoles, teniendo un efecto variable de acuerdo con la variedad (Pereira y col., 2004;
Gómez-Caravaca y col., 2008; Vossen, 2013; Malheiro y col, 2015).
Aparte de las plagas, los daños causados por el frio en las aceitunas afectan a diferentes
parámetros de los aceites, como el contenido en pigmentos (clorofila, carotenoides), el
color, la fracción fenólica, la estabilidad oxidativa y el perfil sensorial (Morelló y col.,
2003).
2.4.1.5. Maduración
La aceituna es un fruto no climatérico, es decir, todo el proceso de maduración ocurre el
árbol y una vez realizada la cosecha no hay evolución de la madurez. De esa forma, es
primordial considerar, que al seleccionar el momento de la cosecha, el productor está
decidiendo directamente la cantidad y la calidad de la producción anual, por lo que el
punto óptimo de recolección es clave para la obtención un aceite de calidad de acuerdo
con los parámetros establecidos de clasificación, las características deseables y la
proporción equilibrada de grasa/humedad (Ranalli y col., 1998; Dag y col., 2011;
Jiménez y col., 2013).
Durante la maduración del fruto, ocurren muchas transformaciones bioquímicas:
(Figura 6) aumento del mesocarpio, cambio de textura (firmeza), resistencia al
desprendimiento, disminución de la relación pulpa/hueso, aumento del peso, cambios de
color del endocarpio/mesocarpio relacionados con disminución de los niveles de
pigmentos (clorofila y carotenoides) y el aumento de las antocianinas; aumento de la
proporción de aceite, cambios en la composición química (ácidos grasos, tocoferoles,
polifenoles, esteroles, triglicéridos, escaleno), perfil organoléptico y actividad
enzimática (Ranalli y col., 1998; Salvador y col., 2001; Morelló y col., 2004A; Baccouri
y col., 2008, Gómez-Rico y col., 2008; Dag y col., 2011; Jiménez y col., 2013; Hbaieb y
col., 2016B).
Además, diversos estudios revelan que los parámetros físico químicos pueden verse
afectados, como el índice de peróxidos, índice de acidez, valor nutricional y estabilidad
oxidativa (Ranalli y col., 1998; Salvador y col., 2001; Baccouri y col., 2008; Dag y col.,
2011). La magnitud de estos cambios depende de la variedad, clima, área geográfica,

Revisión bibliográfica
19
disponibilidad de agua, prácticas agronómicas y otros factores que son variables en cada
cosecha anual (Morelló y col., 2004A; Dag y col., 2011).
Verde
•Tamaño y textura
•Relación pulpa/hueso
•Actividad enzimática
• Cantidad de aceite
• Composición (ácidos grasos,
fenoles, tocoferoles, esteroles)
• Pigmentos
• Perfil organoléptico
Cambios durante la maduración
Maduro
Figura 6. Cambios durante proceso de maduración de la aceituna.
2.4.1.6. Régimen hídrico
Tradicionalmente, el régimen hídrico usado en los olivares de la cuenca del
Mediterráneo es un régimen de secano (sin uso del riego), excepto por las
precipitaciones del inverno (Tovar y col., 2002; Berenguer y col., 2006). Este régimen
es el predominante en Andalucía, región de mayor producción mundial, en donde
representa aproximadamente el 62% (Olimerca, 2017).
Sin embargo, actualmente la práctica del regadío se está ampliando, ya que la misma
favorece el crecimiento vegetativo del árbol en un corto periodo de tiempo, aumentando
la densidad de producción y la producción total de aceite (Tovar y col., 2002; Berenguer
y col., 2006; Caruso y col., 2014).
Muchos estudios han evaluado el efecto del sistema y nivel de riego en la calidad y
composición de los AO (Tovar y col., 2001; Luna y Aparicio, 2002; Tovar y col., 2002;
Berenguer y col., 2006; Stefanoudaki y col., 2009; Caruso y col, 2014). Así, se ha
encontrado un efecto pronunciado sobre el contenido en compuestos fenólicos, el perfil
organoléptico (verde, amargo, astringente), índice de amargor y la estabilidad oxidativa
de los AO, pero también algunos de los estudios relacionan que pueden influir en el
contenido en tocoferoles y tener un efecto de variable dependiente en los compuestos
volátiles (Tovar y col., 2001; Luna y Aparicio, 2002; Tovar y col., 2002; Baccouri y col,

Revisión bibliográfica
20
2008; Stefanoudaki y col., 2009; Dabbou y col, 2011; Caruso y col., 2014; Romero y
col., 2016). En contra punto, se ha descrito un efecto positivo del secano en el contenido
de fenoles que puede ser atribuidos a cambios en la actividad enzimática, destacando la
enzima fenilalanina amonio liasa (PAL), enzima clave en la biosíntesis de fenoles que
se afecta negativamente por el regadío (Stefanoudaki y col., 2009). Por otro lado, el
efecto en otros parámetros de calidad y composición de ácidos grasos es controvertido
(Tovar y col., 2002; Berenguer y col., 2006; Stefanoudaki y col., 2009; Caruso y col.,
2014). Según Stefanoudaki y col., (2009), los efectos del régimen de agua sobre las
propiedades de los AO son muy complejos y sinérgicos pudiendo variar por las
condiciones agronómicas y climatológicas, debiendo tenerse en cuenta muchos factores
al hacer uso del modelo hídrico empleado.
2.4.1.7. Sistemas de recolección
La recolección del olivo es un factor clave que afecta tanto a la calidad del producto
como a la rentabilidad (Sola-Guirado y col., 2014), debiendo en este proceso ser
evitados daños al fruto.
De acuerdo con Bernardi y col., (2016), la recolección supone cerca de 50% del valor
del producto, por ser un proceso laborioso y demandar muchos trabajadores,
principalmente en olivos tradicionales. Por otro lado, el sistema mecánico permite la
reducción de costes y es ideal para los cultivos súper-intensivos (Jiménez y Carpio,
2008; Sola-Guirado y col., 2014). A día de hoy, los sistemas de recolección se pueden
dividir en dos tipos: manual (por vareo y ordeño) y mecánico (Jiménez y Carpio, 2008;
Sola-Guirado y col., 2014).
Recolección manual
Por Vareo: los frutos son recogidos por operadores que usan palos largos, es
conocido como método más agresivo por causar daños apreciables al árbol al
desprenderse una gran cantidad de ramas y brotes.
Por ordeño: forma tradicionalmente usada en que los frutos son cogidos
directamente con la mano, predominante en la aceituna de mesa.
Recolección mecánica
Vibrador de ramas: vibración forzada de las ramas del árbol mediante un
agitador manual alimentado por un motor.
Revisión bibliográfica
21
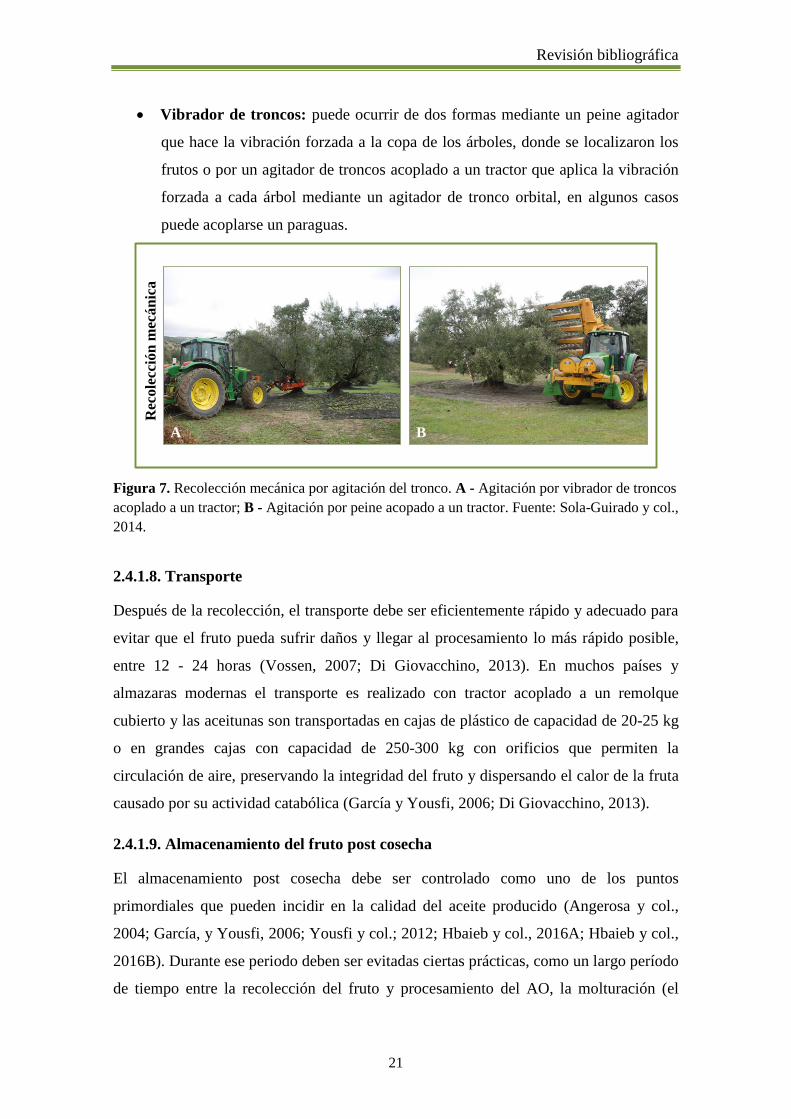
Vibrador de troncos: puede ocurrir de dos formas mediante un peine agitador
que hace la vibración forzada a la copa de los árboles, donde se localizaron los
frutos o por un agitador de troncos acoplado a un tractor que aplica la vibración
forzada a cada árbol mediante un agitador de tronco orbital, en algunos casos
puede acoplarse un paraguas.
Rec
ole
cció
n m
ecán
ica
A B
Figura 7. Recolección mecánica por agitación del tronco. A - Agitación por vibrador de troncos
acoplado a un tractor; B - Agitación por peine acopado a un tractor. Fuente: Sola-Guirado y col.,
2014.
2.4.1.8. Transporte
Después de la recolección, el transporte debe ser eficientemente rápido y adecuado para
evitar que el fruto pueda sufrir daños y llegar al procesamiento lo más rápido posible,
entre 12 - 24 horas (Vossen, 2007; Di Giovacchino, 2013). En muchos países y
almazaras modernas el transporte es realizado con tractor acoplado a un remolque
cubierto y las aceitunas son transportadas en cajas de plástico de capacidad de 20-25 kg
o en grandes cajas con capacidad de 250-300 kg con orificios que permiten la
circulación de aire, preservando la integridad del fruto y dispersando el calor de la fruta
causado por su actividad catabólica (García y Yousfi, 2006; Di Giovacchino, 2013).
2.4.1.9. Almacenamiento del fruto post cosecha
El almacenamiento post cosecha debe ser controlado como uno de los puntos
primordiales que pueden incidir en la calidad del aceite producido (Angerosa y col.,
2004; García, y Yousfi, 2006; Yousfi y col.; 2012; Hbaieb y col., 2016A; Hbaieb y col.,
2016B). Durante ese periodo deben ser evitadas ciertas prácticas, como un largo período
de tiempo entre la recolección del fruto y procesamiento del AO, la molturación (el

Revisión bibliográfica
22
amontonamiento del fruto para la espera del procesamiento) y las altas temperaturas de
almacenamiento que conllevan a procesos degenerativos microbiológicos y enzimáticos
(acción de lipasas, lipoxigenasas y liasas) en el fruto. Como consecuencia de las
prácticas inadecuadas descritas, los AO pueden presentar alto índice de oxidación,
compuestos volátiles indeseados y defectos sensoriales como atrojado, avinagrado y
moho (Angerosa y col., 2004; García y Yousfi, 2006; Yousfi y col.; 2012; Hbaieb y
col., 2016A; Hbaieb y col., 2016B).
Según Hbaieb y col., (2016B), las altas temperaturas de almacenamiento influyen en los
procesos de oxidación e hidrólisis de enzimas endógenas como polifenol oxidasa,
peroxidasa y β-glucosidasa, reduciendo el contenido de compuestos fenólicos.
De esa forma, datos recientes consideran que el almacenamiento en frio es una
alternativa viable al gran flujo de producción en las almazaras modernas en las que la
cosecha mecánica permite la recogida de una gran cantidad de frutos en poco tiempo.
Así, condiciones controladas de tempo y temperatura parecen favorecer la calidad del
fruto y del AO (Yousfi y col.; 2012; Hbaieb y col., 2016A).
2.4.2. Factores climáticos y factores geográficos
El efecto y las interacciones entre los factores climáticos/geográficos y la composición
de los AO, especialmente en lo referente a los ácidos grasos y compuestos minoritarios
es un tema de gran interés en la actualidad.
Recientemente, estos estudios han ganado importancia debido a la expansión del
cultivo de variedades en los países no tradicionalmente productores y a la implantación
de las nuevas prácticas de cultivo en otras zonas autóctonas como, por ejemplo, la
expansión de los cultivos súper intensivos de la variedad Arbequina (Aguilera y col.,
2005; Torres y col., 2009; García-González y col., 2010; Dabbou y col., 2011;
Rondanini y col., 2011; Ballus y col., 2014, Farinelli y Tombesi, 2015; Romero y col.,
2016).
Esos estudios son cruciales para el sector oleícola y el mercado, que requieren cada vez
más información sobre la adaptación de las variedades a diversas características
climáticas (precipitaciones, temperatura, humedad) y geográficas (latitud y altitud), que
pueden ser muy distintas de las zonas de cultivo originales y pueden repercutir en la
composición/calidad de los AO producidos en las diferentes áreas.

Revisión bibliográfica
23
En general, se acepta que los parámetros climáticos y geográficos puedan tener una gran
influencia en muchos aspectos, debido especialmente a su efecto sobre la actividad
enzimática de los frutos que, a su vez, determina la composición química y el perfil
organoléptico de los aceites, estando relacionada con la composición en ácidos grasos y
tocoferoles, estabilidad oxidativa contenido de pigmentos, perfil de volátiles,
compuestos fenólicos y perfil sensorial (Luna y Aparicio, 2002; Angerosa y col., 2004;
Aguilera y col., 2005; Torres y col., 2009; García-González y col., 2010; Mailer y
col.,2010; Rondanini y col., 2011; Romero y col., 2016).
No obstante, esos efectos son complejos y sinérgicos, no debiendo ser evaluados sin
considerar factores como genotipo y otros aspectos agronómicos (Inglese y col., 2011).
Según estudios previos, algunas variedades como Arbequina parecen ser especialmente
afectadas por variaciones climáticas y geográficas (Tous y col., 1997; Torres y col.,
2009; Rondanini y col., 2011). Esos estudios apoyan que altas temperaturas durante el
periodo de síntesis de los ácidos grasos afectan negativamente la actividad enzimática
resultando en alteraciones del perfil lipídico de los aceites obtenidos que presentan
índices de ácido oleico muy bajos y en algunos casos no cumplen con el reglamento de
calidad establecido (Torres y col., 2009; Rondanini y col., 2011). Según un estudio de
Romero y col., (2016), que evaluó diferentes aceites producidos en Chile, el suelo y el
clima tienen más influencia que la variedad de aceituna en la composición del aceite.
Respecto a la altitud, parece ser que los cambios en la composición de los AO pueden
estar asociados a una menor susceptibilidad a los cambios de temperatura en altitud
elevadas, lo cual supone una maduración del fruto más lenta (Luna y Aparicio, 2002)
El olivar es un cultivo resistente al estrés hídrico y la necesidad de agua del árbol es
dependiente del clima y de la edad del árbol (Vossen, 2013).
2.4.3. Factores tecnológicos
Los factores tecnológicos son los relacionados con las etapas dentro de la almazara,
desde la recepción y limpieza del fruto hasta el envasado del aceite, pudiendo cada uno
de ellos tener su propia influencia en el AO producido.
2.4.3.1. Recepción y limpieza
En la recepción se realizan procesos preliminares de clasificación según la variedad,
verificación de la procedencia, estado sanitario, control de peso y toma de muestras. A

Revisión bibliográfica
24
continuación, las aceitunas son descargadas en una tolva de alimentación conectada por
una cinta móvil donde son realizadas las operaciones de eliminación de materias
extrañas (hojas, ramas, piedras y otros desechos) que generalmente se lleva a cabo con
el uso de soplador de aire y/o vibración. Además algunas almazaras aplican también el
lavado por circulación de agua, evitándose en este caso, el uso de agua caliente que
puede afectar los compuestos volátiles (Angerosa y col., 2004; Vossen, 2007;
Kapellakis y col., 2008; Di Giovacchino, 2013). Otras optan, cuando la producción
proviene de aceitunas en un estadio inicial de madurez, por no hacer uso del lavado,
únicamente eliminando las hojas, por interferir en el perfil sensorial (Vossen, 2007;
Kapellakis y col., 2008; Di Giovacchino, 2013).
Rec
epci
ón
y l
imp
ieza
A B
Figura 8. A - Recepción del fruto; B - limpieza Fuente: Di Giovacchino y col., 2013
2.4.3.2. Molienda
La molienda es el primer paso del procesamiento para la obtención del aceite y consiste
en romper los diferentes tejidos celulares de la aceituna, favoreciendo la extracción del
aceite que se encuentra principalmente en el mesocarpio del fruto (Figura 9)
(Kapellakis y col., 2008; Clodoveo, 2012).

Revisión bibliográfica
25
Epicarpio (piel)
Mesocarpio (pulpa)
Endocarpio
(hueso, semilla)
Figura 9. Partes de la aceituna.
Diferentes tipos de trituradores se han utilizado a lo largo de los años, pero a nivel
industrial actualmente, entre los más comunes puede destacarse el molino de martillo
(Inarejos-García y col., 2011). Las condiciones de molienda, como control de diámetros
del cribo y velocidad, son establecidas dependiendo de la madurez del fruto, variedad y
características deseables (Inarejos-García y col., 2011). Es conocido que la molienda
puede afectar a los componentes minoritarios del aceite, principalmente los compuestos
fenólicos, ya que muchos de ellos, como los secoiridoides, son originados durante este
proceso por hidrólisis y catálisis, habiendo también un efecto sinérgico de las enzimas
endógenas en las diferentes partes de la aceituna, como peroxidasas y polifenoloxidasa
(Servili y col., 2004; Servili y col., 2007). Además, en algunos estudios el perfil de
volátiles, perfil sensorial y contenido de pigmentos pueden verse afectados con los
posibles cambios de temperatura durante el proceso (Angerosa y col., 2004; Inarejos-
García y col., 2011).
2.4.3.3. Batido
El batido consiste en batir la pasta preparándola para la separación del aceite,
proporcionando la aglutinación de las gotas de aceite de la pasta, aumentando el
rendimiento de la extracción y ayudando a la posterior separación de las fases
(Clodoveo y col., 2012). El proceso ocurre a través de batidoras verticales u
horizontales, siendo estas usadas más comúnmente (Figura 10).

Revisión bibliográfica
26
Ba
tid
o
A B
Figura 10. A - Batidora horizontal; B - Etapa de batido.
La influencia de las condiciones de batido como tiempo, temperatura, composición de la
atmósfera de contacto con la pasta, adición de agua u otros coadyuvantes en la calidad,
rendimiento y composición de los AO ha sido ampliamente estudiada en la literatura
científica (Kalua y col., 2006; Servili y col., 2008; Peres y col., 2014; Reboredo-
Rodríguez y col., 2014; Raffo y col., 2015). De manera que hay una fuerte relación
entre las condiciones del batido con el perfil de volátiles y el perfil sensorial de los AO
(Angerosa y col., 2004; Kalua y col, 2006; Reboredo-Rodríguez y col., 2014; Raffo y
col., 2015), pudiendo también incidir en el contenido de fenoles (Kalua y col, 2006;
Servili y col., 2008; Peres y col., 2014).
Por lo tanto, el control de las condiciones de batido, principalmente la temperatura, el
tiempo y la composición del aire son cruciales, ya que pueden afectar negativamente al
perfil de volátiles asociados a la inactivación enzimática en su ruta de formación,
favorecer la oxidación de la pasta por la exposición del oxígeno prolongada y llevar a la
pérdida de compuestos fenólicos por el efecto sobre la actividad de las enzimas
endógenas (Servili y col., 2008; Reboredo-Rodríguez y col., 2014).
De este modo, las nuevas tecnologías y las condiciones ideales como reducción de nivel
de oxígeno, uso de otras atmósferas y coadyuvantes, pueden ser fundamentales en la
optimización de las condiciones de proceso, equilibrando un buen rendimiento y un
perfil deseable del aceite.
2.4.3.4. Centrifugación
Actualmente, la separación de las fases sólido – liquido se hace comúnmente por uso de
centrífugas, sobre todo por el sistema de centrifugación de dos fases, conocidas como

Revisión bibliográfica
27
centrífugas horizontales o decanter (Figura 11A). Este sistema, fue introducido en los
años 90 y es el principal sistema utilizado, representando más de 95% de las almazaras
de España (Vossen, 2007; Kapellakis y col., 2008; Di Giovacchino, 2013). Su
funcionamiento es sencillo, basándose en la fuerza centrífuga generada por un motor de
aproximadamente 3000 gn que hace girar sobre un eje horizontal y permite la
separación por diferencias de densidad del AO de la pasta, saliendo por un lado el aceite
y por el otro el agua de vegetación (alpechín) juntamente con la pasta (orujo) o en
conjunto denominado como alperujo (Di Giovacchino y col., 2001; Vossen, 2007;
Kapellakis y col., 2008). Comparado a otros sistemas como el sistema de tres fases o
por presión posee muchas ventajas como menor generación de aguas residuales ya que
no requiere adición de agua, mayor retención de compuestos fenólicos, mayor
estabilidad oxidativa y AO con perfil organoléptico deseable (más amargos y picantes),
no afectando los parámetros de calidad (Di Giovacchino y col., 2001; Vossen, 2007;
Kapellakis y col., 2008).
Posteriormente, la fase acuosa de aceite obtenida pasa por un proceso adicional de
centrifugación con el uso de una centrifuga vertical (Figura 11B), que a baja velocidad
separa el aceite obtenido de la fase acuosa que todavía pueda estar en contacto con el
aceite (Kapellakis y col., 2008).
Cen
trif
ugaci
ón
A B
Figura 11. A - Centrífuga horizontal; B - Centrífuga vertical.

Revisión bibliográfica
28
2.4.3.5. Almacenamiento, filtración, y envasado
Después del procesamiento, el AO es almacenado hasta la comercialización,
generalmente en tanques de acero inoxidable dentro de la bodega (Figura 12) (Vossen,
2007; Di Giovacchino, 2013).
Durante el almacenamiento, es usual el control de materia orgánica que se deposita por
decantación como forma de evitar los procesos de oxidación (Di Giovacchino, 2013).
Otros factores también son controlados como la temperatura de bodega (recomendable
13-18°C), incidencia de luz, limpieza previa de los depósitos y nivel del aceite en
depósitos. Recientemente, para evitar efectos no deseables de estos factores, el uso de
gases inertes en los depósitos de decantación como el nitrógeno en sustitución al
oxígeno se está implantando en muchas almazaras (Di Giovacchino, 2013).
Todos los factores mencionados son críticos ya que los metales, la luz, el oxígeno, el
tiempo prolongado de almacenamiento y la temperatura son inductores de los procesos
oxidativos del aceite e inciden directamente en los parámetros físico químicos,
composición del aceite, cambios del perfil sensorial y de volátiles (Angerosa y col.,
2004; Morelló y col., 2004B; Kalua y col., 2007; Sinesio y col., 2015).
Previamente a la comercialización, puede ser aplicado el proceso de filtración con la
finalidad de eliminar cualquier residuo en suspensión y/o humedad, evitando de esa
forma los defectos sensoriales relacionados con la fermentación de la materia orgánica y
prolongando la estabilidad oxidativa de esos aceites en el mercado. La filtración,
además, proporciona al aceite un color uniforme y brillante, aunque también puede
promover cambios en la fracción minoritaria de los aceites, como reducción de
compuestos fenólicos, compuestos volátiles (aldehídos, cetonas y esteres) y contenido
de clorofila (Angerosa y col., 2004; Vossen, 2007; Lozano-Sánchez y col., 2010).
Finalmente la última etapa en la almazara es el embotellado del aceite, generalmente en
condiciones de anaerobiosis (Lozano-Sánchez y col., 2010).

Revisión bibliográfica
29
Alm
acen
am
ien
to y
en
va
sad
o
A B
Figura 12. A- Almacenamiento del aceite en depósitos de acero inoxidable, B – Envasado.
2.5. Composición de los aceite de oliva
El aceite de oliva está compuesto por dos fracciones principales: fracción saponificable
(mayoritaria) que representa más del 98% de su composición y fracción insaponificable,
aproximadamente el 2% (Lopez y col., 2014). Cada una de esas fracciones incluye
diferentes compuestos (Figura 13).
Saponificable
Ácidos grasos libres
Diglicérideos
Monoglicérideos
Triglicéridos
InsaponificableCoenzimas
Compuestos fenólicos
Compuestos volátiles
Pigmentos
Tocoferoles
Otros
Figura 13. Composición del aceite de oliva - Fracción saponicable e insaponificable.

Revisión bibliográfica
30
2.5.1. Fracción saponificable: perfil de ácidos grasos
Los ácidos grasos (AG) existen mayoritariamente como un complejo en la forma de
triglicéridos (un éster derivado de glicerol asociado a tres ácidos grasos) y su contenido
en el AO es responsable de su hidrofobicidad (Lopez y col., 2014).
Asimismo, los ácidos grasos simples pueden ser definidos como ácidos carboxílicos de
cadena larga alifática no ramificada que presentan un grupo carboxílico en un extremo,
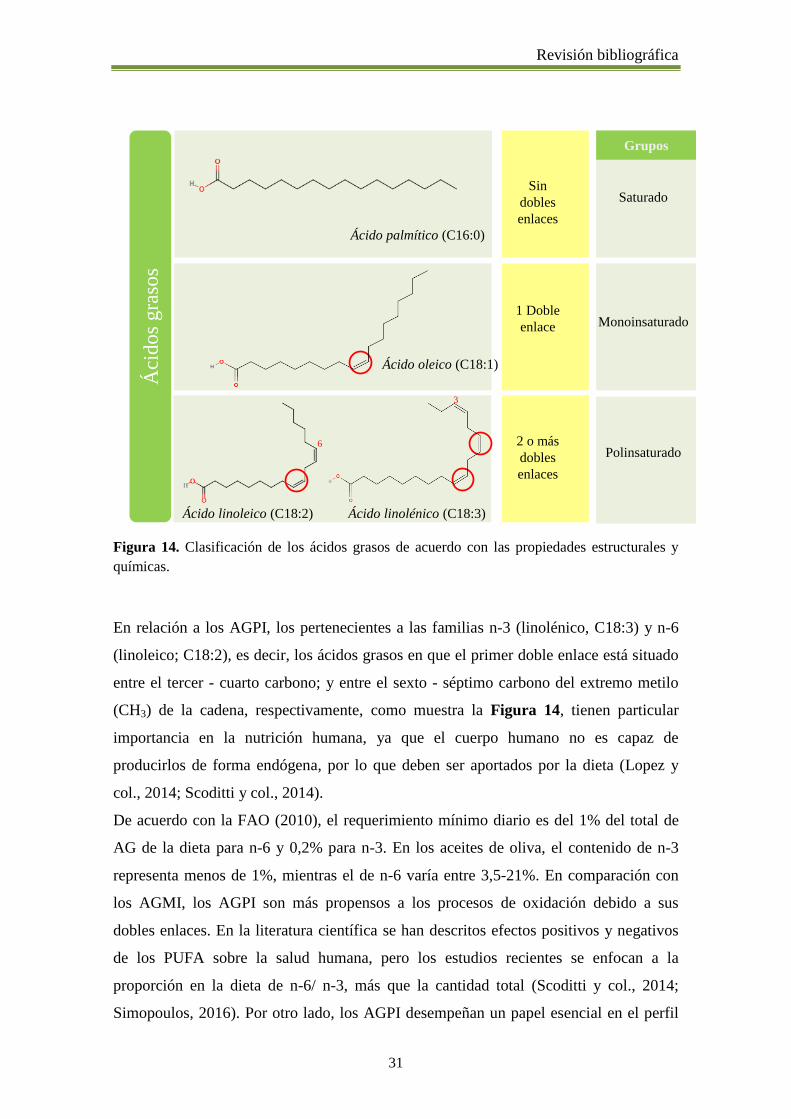
pudiendo clasificarse según sus propiedades estructurales y químicas (Figura 14) como
saturados (AGS), monoinsaturados (AGMI) y poliinsaturados (AGPI) (Lopez y col.,
2014).
Los principales AGS encontrados en el aceite de oliva son ácido palmítico (C16:0) y
ácido esteárico (C18:0), aproximadamente 7,5-20% y 0,5-5,0, respectivamente, mientras
los otros AGS se encuentran en cantidades muy inferiores (≤0,3%).
Los AGMI componen la principal fracción de ácidos grasos del AO, particularmente el
ácido oleico, que representa entre 55-83% de los ácidos grasos totales. El perfil
mayoritario de AGMI es uno de los factores que disminuyen la susceptibilidad del
aceite de oliva a la oxidación (Covas y col., 2007). A lo largo de los años, muchos
estudios fueron y siguen siendo realizados en diferentes países como Grecia, Italia y
España, con la finalidad de estudiar los efectos beneficiosos de la fracción saponificable
del AO. El alto contenido de AGMI y bajo de AGS, en particular del aceite de oliva
virgen extra (AOVE), se considera mayormente responsable de diferentes propiedades
saludables, como menor riesgo y prevención de enfermedades coronarias, mejora del
perfil lipídico sanguíneo asociado a la reducción de los niveles de lipoproteínas de baja
densidad (LDL) e incremento de los niveles de lipoproteínas de alta densidad (HDL), y
de otras evidencias como la mejora tensión arterial o el papel protector en las
enfermedades neurodegenerativas (Covas y col., 2007; Huang y Sumpio, 2008; Guasch-
Ferré y col., 2014; Lopez y col., 2014).
Revisión bibliográfica
31
Áci
do
s g
raso
s
Sin
dobles
enlaces
Saturado
Grupos
Ácido palmítico (C16:0)
Ácido oleico (C18:1)
Ácido linoleico (C18:2) Ácido linolénico (C18:3)
Monoinsaturado
Polinsaturado6
1 Doble
enlace
2 o más
dobles
enlaces
3
Figura 14. Clasificación de los ácidos grasos de acuerdo con las propiedades estructurales y
químicas.
En relación a los AGPI, los pertenecientes a las familias n-3 (linolénico, C18:3) y n-6
(linoleico; C18:2), es decir, los ácidos grasos en que el primer doble enlace está situado
entre el tercer - cuarto carbono; y entre el sexto - séptimo carbono del extremo metilo
(CH3) de la cadena, respectivamente, como muestra la Figura 14, tienen particular
importancia en la nutrición humana, ya que el cuerpo humano no es capaz de
producirlos de forma endógena, por lo que deben ser aportados por la dieta (Lopez y
col., 2014; Scoditti y col., 2014).
De acuerdo con la FAO (2010), el requerimiento mínimo diario es del 1% del total de
AG de la dieta para n-6 y 0,2% para n-3. En los aceites de oliva, el contenido de n-3
representa menos de 1%, mientras el de n-6 varía entre 3,5-21%. En comparación con
los AGMI, los AGPI son más propensos a los procesos de oxidación debido a sus
dobles enlaces. En la literatura científica se han descritos efectos positivos y negativos
de los PUFA sobre la salud humana, pero los estudios recientes se enfocan a la
proporción en la dieta de n-6/ n-3, más que la cantidad total (Scoditti y col., 2014;
Simopoulos, 2016). Por otro lado, los AGPI desempeñan un papel esencial en el perfil

Revisión bibliográfica
32
sensorial del aceite de oliva virgen (AOV), participando en la ruta de la lipoxigenasa
(LOX), en la que los AGPI sufren muchas reacciones y desencadenan la generación de
los compuestos volátiles (Angerosa y col., 2004; Kalua y col., 2007), información que
se ampliará posteriormente (2.5.2.2).
Con respecto a las variaciones del perfil de ácidos grasos encontradas en los AO,
pueden explicarse por muchos factores como factores climáticos, geográficos, variedad
e índice de madurez de la aceituna (Boskou y col., 2006). Principalmente entre los
factores climáticos, la temperatura es un punto de suma importancia en la regulación de
las enzimas que participan activamente en la síntesis de ácidos grasos (Hernández y
col., 2011).
2.5.2. Fracción insaponificable
La fracción minoritaria de los AO es compleja y extensa, presentando más de 230
compuestos menores responsables en gran medida de sus propiedades y características
organolépticas y que, al contrario que en otros aceites vegetales, no han sido
modificados por la extracción con solventes (Lopez y col., 2014; Servili y col., 2014).
De esa forma, aliado al aporte de ácidos grasos mencionado anteriormente, los
componentes menores del aceite de oliva también son responsables de la popularidad de
los AO, debido a su importancia nutricional, sus propiedades saludables y sus
características organolépticas que los distinguen entre los aceites vegetales. Algunos de
los compuestos destacables de esa fracción son la coenzima Q10, compuestos fenólicos,
compuestos volátiles, pigmentos y tocoferoles.
2.5.2.1 Coenzima Q10
Las coenzimas Q (CoQ) son compuestos lipófilos endógenos presentes de manera
natural en las membranas celulares y las mitocondrias de mamíferos. En la naturaleza
puede ser encontrados diferentes grupos (CoQ6-Q10), que diferen en su función y en
relación al número de carbonos de la cadena lateral isoprenoide unida al anillo de
benzoquinona, siendo la CoQ10 la forma predominante en humanos, principalmente en
órganos que demandan más energía como el corazón, los riñones y el hígado
(Thanatuksorn y col., 2009; Pravst y col., 2010; Pyo, 2010; Zmitek y col., 2014;
Jankowski y col., 2016).

Revisión bibliográfica
33
En el cuerpo humano, la CoQ10 pueden existir en dos formas oxidada (ubiquinona) o
reducida (ubiquinol), habiendo una constante conversión entre ambas (Figura 15)
(Pravast, y col., 2010; Alcázar y col., 2016).
Su principal función está en la cadena respiratoria mitocondrial y la producción de ATP,
como la única enzima portadora de electrones, pero también es un reconocido
antioxidante en las membranas lipídicas, sobre todo en su forma reducida, aunque no se
puede descartar un papel antioxidante de la forma oxidada (Turunen, y col., 2004;
Pravst y col., 2010; Jankowski y col., 2016). Además de las funciones mencionadas, la
CoQ10 también es responsable de otras importantes funciones de modulación y
regulación al nivel celular (Turunen y col., 2004).
n=6 - 10
n=10 CoQ10
[CH2CH=CCH2]nH
Ubiquinona
Forma oxidada
CH3CH3O
CH3O
CH3
CH3O
CH3O
OH
OH
CH3
[CH2CH=CCH2]nH
CH3
UbiquinolForma reducida
+2e-
+ 2H+
-2e-
-2H+
Figura 15. Reacción redox de conversión entre forma reducida y oxidada de coenzima Q.
Adaptado: Alcázar- Fabra y col., 2016.
Aunque existe una síntesis endógena de CoQ, sus niveles disminuyen progresivamente
con la edad, debiendo ser reemplazados diariamente por el aporte en los alimentos. En
otros casos, la suplementación es aconsejada debido a sus efectos beneficiosos en
diferentes enfermedades como diabetes, insuficiencia cardiaca y enfermedades
genéticas (Jankowski y col., 2016). Asimismo, es importante considerar que el 25% de
los niveles de CoQ10 son reemplazados diariamente por la vía endógena y exógena, por

Revisión bibliográfica
34
lo que la ingesta de alimentos con un alto contenido en CoQ10 puede ser un aporte
importante para la salud humana (Venegas y col., 2011).
En los alimentos la CoQ se encuentra mayoritariamente en productos de origen animal,
pero también en nueces, semillas y aceites vegetales, particularmente el AO que puede
ser considerado una fuente dietética importante (Pravst y col., 2010; Venegas y col.,
2011; Zmitek y col., 2014). De acuerdo con Zmitek y col., (2014), el aporte de CoQ10
basado en 20 g de consumo diarios de AO puede variar entre 0,08 y 3,3 mg.
De acuerdo con estudios previos, el contenido variable de CoQ10 en aceites vegetales es
explicado por diferentes factores como la variedad, el índice de madurez y parámetros
tecnológicos de extracción; además, se ha sugerido que se necesitan más estudios
científicos que determinen si otros parámetros pueden afectar los niveles de CoQ10 en
aceites de oliva, como factores agronómicos, climáticos y geográficos (Venegas y col.,
2010; Zmitek y col., 2014).
2.5.2.2. Compuestos fenólicos
Los compuestos fenólicos son metabolitos secundarios de las plantas e incluyen una
amplia variedad de moléculas, aproximadamente 8000 compuestos, que presentan un
anillo fenólico unido a un grupo hidroxilo (fenoles simples) o una estructura
polifenólica (es decir, más de un anillo aromático unido a uno o más grupo hidroxilo)
(Ignat y col., 2011; Lopez y col., 2014).
En las plantas, estos compuestos tienen muchas funciones biológicas, como actuar
protegiendo contra la luz UV, contra patógenos, depredadores o atrayentes para
polinizadores, entre otras (Ignat y col., 2011; Lopez y col., 2014).
En los aceites de oliva, esos compuestos son liberados del mesocarpio y epicarpio de la
aceituna durante el proceso de extracción, siendo considerados una de las fracciones
minoritarias más importantes de los AOV, ya que se relacionan con muchas propiedades
biológicas, características sensoriales (amargo, picante y astringente) y capacidad
antioxidante, siendo específicamente responsable de la extensión de la vida útil del
producto (Servili y col., 2014; Talhaoui y col., 2016).
Por otra parte, la afinidad hidrofílica de los compuestos fenólicos facilita que se
conjuguen con el agua de vegetación y al parecer, sólo un 2% presentes en la aceituna
son transferidos al AO (Talhaoui y col., 2016).
El contenido total de fenoles en los AOV varía entre amplios márgenes (50-940 mg/kg),
según la literatura científica (Servili y col., 2014). Sin embargo, como ya se ha

Revisión bibliográfica
35
mencionado anteriormente, muchos factores influyen en su contenido como técnicas
agronómicas, aspectos tecnológicos o factores climáticos y geográficos (Bakhouche y
col., 2013; Kalogeropoulos y Tsimidou, 2014; Lopez y col., 2014).
Los principales grupos de compuestos fenólicos encontrados en los AOV son: ácidos
fenólicos y derivados, alcoholes fenólicos, hidroxi-isocromas, flavonoides, lignanos y
secoridoides (Lopez y col., 2014; Servili y col., 2014; Talhaoui y col., 2016). Algunos
de sus estructuras se representan en la Figura 16.
Los mecanismos antioxidantes de compuestos fenólicos incluyen diferentes reacciones
como la reducción de la concentración de oxígeno, la inactivación de radicales libres,
descomposición de productos primarios de oxidación en especies no radicales y
reducción de la sustracción de hidrógeno por parte de sustratos y quelantes de metales
(Lopez y col., 2014).
De esa forma, los compuestos fenólicos del AO poseen acción antiinflamatoria y
quimio-preventiva y son capaces de actuar previniendo contra los daños oxidativos en el
organismo humano (ADN, lípidos y proteínas), lo cual justifica su asociación a la
reducción del riesgo de desarrollo de muchas enfermedades degenerativas (Dimitrios,
2006; Martín-Peláez y col., 2013; Servili y col., 2014).
Por lo tanto, actualmente el AOV es el único alimento reconocido por la Autoridad
Europea para la Seguridad de los Alimentos (EFSA) por sus niveles de hidroxitirosol y
tirosol. Sin embargo, las limitaciones existentes en relación a las técnicas analíticas de
extracción, separación, identificación y cuantificación de estos compuestos no permiten,
a día de hoy, el etiquetado adecuado en relación a las alegaciones reconocidas, ya que
no hay un método oficial establecido o patrones comerciales para todos los compuestos.
Este tema es por lo tanto una prioridad para la comunidad científica, que sigue
trabajando en su desarrollo (Carrasco-Pancorbo y col., 2005; Bakhouche y col., 2013;
Lopez y col., 2014; Reboredo-Rodríguez y col., 2016).

Revisión bibliográfica
36
Áci
do
s fe
nó
lico
s
Estructura química Compuestos
Estructura química
Ácido cinámico/derivados
1
23
4
5 6
OH
Compuestos4 532
H
H
H
OH
OH
OH
H
H
1
23
4
5 6OH
4 532
H
H
OH
OCH
3
OH
OH
OH
H
Ácido benzoico/derivados
p-cumárico
Ácido cafeico
Ácido gálico
Ácido vanilico
Alc
oh
ole
s fe
nó
lico
s Estructura química
OH
H
OH
OH
Compuestos
OH
1
23
4
5 6
43
Hidroxitirosol
Tirosol
Fla
vo
no
ides
Estructura química R2
OH
OH
H
OH
Compuestos
R1
R2
R3
OH
OH
R1 R3
H
H
Apigenina
Luteolina
Figura 16. Estructuras químicas de las principales clases de compuestos fenólicos encontrados
en los aceite de oliva vírgenes.

Revisión bibliográfica
37
2.5.2.3. Compuestos volátiles
Los compuestos volátiles en el reino vegetal son considerados metabolitos provenientes
de la ruta biogenética intracelular, incluyendo un amplio grupo de compuestos de bajo
peso molecular (< 300 Da) susceptibles a la evaporación como aldehídos, alcoholes,
cetonas, hidrocarburos y ésteres (Angerosa, 2002; Kalua y col., 2007).
Estos compuestos son directamente responsables del aroma de los alimentos, siendo
capaces de estimular el epitelio olfativo, disolviéndose en la mucosa y adhiriéndose a
los receptores olfativos generando percepciones por via orto nasal (Angerosa, 2002;
Kalua y col., 2007; Barbieri y col., 2015).
El término aroma mantiene una relación singular con el término “flavor” que se refiere
al efecto combinado entre la percepción orto nasal y retro nasal, o sea, olor y sabor
(Barbieri y col., 2015).
En los AO, los compuestos volátiles son primordiales en la evaluación del perfil
organoléptico (aromas positivos y negativos) y el grado de oxidación, por lo que
influyen en la aceptabilidad del consumidor, aunque su determinación no pertenezca a
los parámetros oficiales de calidad de la legislación europea para los aceites de oliva y
derivados (Angerosa, 2002; Kalua y col., 2007; Barbieri y col., 2015).
Con respecto a su producción, esos compuestos son generados en dos etapas: durante el
período climatérico de la aceituna y en el proceso de extracción del aceite,
primordialmente durante la molienda y el batido, siendo afectada por esos dos factores,
pero también por la variedad, área geográfica, clima y otros parámetros
agronómicos/tecnológicos (Angerosa y col., 2004; Kalua y col., 2007).
La síntesis de los volátiles relacionados con los aromas positivos de los AOV tiene
lugar a través en una serie de reacciones bioquímicas secuenciales, en las cuales los
ácidos grasos linoleico (n-6) y linolénico (n-3) mediante la acción de enzimas como
lipoxigenasas (LOX), hidroperoxido-liasa (HPL), alcohol deshidrogenasa (ADH),
alcohol-aciltransferasa (ATT) y reacciones de isomerización, dan lugar a los principales
volátiles encontrados en los aceites de oliva (Figura 17).
Así, los niveles de compuestos volátiles encontrados en el AO dependen de la actividad
de las enzimas involucradas, siendo los asociados con aromas positivos (verde, hojas,
almendra, banana) los que pertenecen a los grupos C6 y C5 y derivan de la ruta LOX,
mientras que los defectos más comunes (atrojado, moho, humedad, avinagrado y rancio)
están asociados con una inadecuada preservación de la aceituna que conlleva a procesos

Revisión bibliográfica
38
de fermentación, desarrollo de contaminación microorganismos anaeróbicos,
producción de aminoácidos o inadecuado procesamiento/almacenamiento generando
productos de la oxidación del aceite (Angerosa y col., 2004, Morales y col., 2005; Kalua
y col, 2007).
Otro aspecto que debe ser considerado es que los atributos sensoriales percibidos surgen
de la influencia y la interacción de varios compuestos volátiles, más que de la acción de
un solo compuesto y la alta concentración de volátiles no siempre resulta en una
respuesta del olor, debiendo ser evaluados por cálculos del umbral como valor de la
actividad odorante (Luna y Aparicio, 2002; Kalua y col., 2007; Angerosa y Campestre,
2013).
Hexanal
verde//dulce
Hexanol Hexyl Acetate
Linoleico
Linolenico
(Z)-Hex-3-enal(Z)-Hex-3-enol (Z)-Hexyl Acetate
ISOMERASE
(E)-Hex-2-enal (E)-Hex-2-enol(E)-2-Hexenyl
Acetate
ADH
ATT
Lipoxigenasa(LOX)
HPL
ADH
ATT
ATT
ADH
banana/indeseado verde/frutado/dulce
verde/hoja verde
verde/manzana/almendra verde/hoja cortada
verde/banana
n.i. en aceites
Figura 17. Ruta de formación de los principales volátiles encontrados en los aceites de oliva y
sus respectivos descriptores olfativos. Adaptado: Kalua y col., 2007.

Revisión bibliográfica
39
2.5.2.4. Pigmentos
Los pigmentos naturales se encuentran en diferentes organismos vivos, particularmente
en plantas, donde desempeñan un papel fundamental en la fotosíntesis. Pueden ser
definidos por su capacidad de absorber la luz en el rango de longitudes de onda de la
región visible, produciendo un color de acuerdo con su estructura específica molecular
(cromóforo), siendo esa estructura responsable por captar la energía y reflejarla,
posibilitando así la percepción por el ojo humano (Delgado –Vargas y col., 2000;
Tanaka y col., 2008).
Entre los grupos predominantes destacan las clorofilas y los carotenoides, que se
diferencian en relación a su estructura funcional, ya que las clorofilas pertenecen al
grupo de tetrapirólicos y los carotenoides se caracterizan como isoprenoides. Ambos
comparten un papel importante en la estabilidad oxidativa de muchos alimentos, debido
a sus propiedades antioxidantes en condiciones específicas como en la oscuridad,
aunque también pueden ser pro-oxidantes en presencia de la luz y el aire (Delgado –
Vargas y col., 2000; Psomiadou y Tsimidou, 2001; Criado y col., 2008; Moyano y col.,
2010).
En la aceituna, los cambios de color del epicarpio y mesocarpio durante la maduración
están asociados a las transformaciones bioquímicas de los pigmentos, siendo la clorofila
y los carotenoides responsables del color verde/ amarillo del fruto que con la
maduración progresivamente dan lugar a las antocianinas (Gandul- Rojas y col., 2013)
(Figura 18A).
Durante la extracción del aceite solamente los pigmentos liposolubles (carotenoides y
clorofilas) son transferidos desde la aceituna, confiriéndole los colores característicos
del aceite de oliva, que pueden variar desde verde intenso a amarillo dorado (Figura
18B) (Gandul-Rojas y col., 2000; Moyano y col., 2010; Gandul- Rojas y col., 2013).
Aunque, el color no es un parámetro de calidad oficial del aceite es un factor
determinante en la elección del consumidor (Moyano y col., 2010) y ha sido incluido
como parámetro evaluado por el departamento de agricultura de Estados Unidos en los
aceites comerciales de este país para garantizar que el color sea propio del aceite de
oliva (USDA ,2010).

Revisión bibliográfica
40
(-) (+)Maduración
Ca
mb
ios
de
colo
rA
B
Figura 18. A - Cambios de color durante la maduración de la aceituna, B - Colores de
aceites de oliva.
Muchos estudios se han dedicado a establecer relaciones entre el contenido de los
pigmentos con parámetros de color de los AOV, incluyendo los aceites monovarietales
procedentes de diferentes regiones, además, estos parámetros se han utilizado para
predecir la caducidad de los aceites y determinar los diferentes fac85tores que pueden
influenciar sus niveles (Gandul-Rojas y col., 2000; Psomiadou y Tsimidou, 2001;
Morelló y col., 2004A; Meléndez-Martínez y col., 2007; Criado y col., 2008; Moyano y
col., 2008; Peres y col.,2014).
2.5.2.5. Tocoferoles
Los tocoferoles son compuestos liposolubles y que sumados a los tocotrienoles
pertenecen al grupo conocido por el término general de vitamina E, micronutriente
esencial en la dieta humana, y son sintetizados por organismos fotoautótrofos,
incluyendo las plantas, a través una serie de reacciones enzimáticas (Munné-Bosch y
Alegre, 2002; Beltrán y col., 2010; Colombo, 2010; Georgiadou y col., 2015).
En general, los tocoferoles presentan en su estructura química un anillo central
cromanol (posee un grupo fenol) al que se une una cadena lateral saturada isoprenoide
denominada fitol, diferenciándose de los tocotrienoles solamente por la cadena lateral
saturada (Psomiadou y col., 2000; Colombo, 2010; Lopez y col., 2014). Existen 4
isómeros de los tocoferoles (α-, β-, γ- y δ) que se distinguen en función de número y

Revisión bibliográfica
41
posición de los grupos metilo del anillo cromanol, según la Figura 19, siendo el α-
tocoferol la forma predominante y reconocida como la más activa biológicamente entre
los isómeros (Beltrán y col., 2010; Lopez y col., 2014).
Toco
fero
les
R1
R2
Estructura química
R1 R2
CH3
CH3
H
H
CH3
H
CH3
H
α Tocoferol
β Tocoferol
µ Tocoferol
δ Tocoferol
Isómeros
CH3
Figura 19. Estructura química de los tocoferoles. Adaptado: Lopez y col., 2014.
En relación a su ocurrencia en los alimentos, los aceites vegetales como el AOV, son
considerados una de las fuentes excepcionalmente ricas en α-tocoferol, con un promedio
alrededor de 90-95% de total (Kalogeropoulos y Tsimidou, 2014).
Es destacable su función como antioxidante en diversos sistemas biológicos, tanto en las
propias plantas y en los alimentos como in vivo (Munné-Bosch y Alegre, 2002).
La capacidad antioxidante de los tocoferoles se explica por su capacidad de donar un
hidrogeno del anillo fenol para los radicales libres provenientes principalmente de la
oxidación lipídica, neutralizando así la formación del radical peroxil y evitando su
propagación, pero también es un secuestrador del oxígeno singlete 1O2, un radical muy
reactivo que oxida el ADN, los lípidos y otras sustancias (Munné-Bosch y Alegre,
2002). Otro rol desempeñado por los tocoferoles es el mantenimiento de la integridad de
las membranas celulares, regulando su fluidez, así como antioxidante natural de las
propias plantas, incluso como respuesta a condiciones de estrés y regulador de
hormonas vegetales (Munné-Bosch y Alegre, 2002; Beltrán y col., 2010; Lopez y col.,
2014).
En los AOV también actúan como antioxidantes naturales, pudiendo variar sus niveles
como los otros compuestos minoritarios mencionados en función de diferentes aspectos
como factores genéticos, agronómicos, geográficos, climáticos y factores tecnológicos
(Psomiadou y col., 2000; Beltrán y col., 2010; Lopez y col., 2014; Kalogeropoulos y
Tsimidou, 2014;Georgiadou y col., 2015).

Revisión bibliográfica
42
Debido a sus propiedades antioxidantes, hay evidencias del efecto beneficioso de la
vitamina E en enfermedades cardiovasculares, cáncer y enfermedades
neurodegenerativas (Colombo, 2010; Lopez y col., 2014).
Además de las funciones y mecanismos descritos, los tocoferoles y especialmente el α-
tocoferol, interaccionan con otros compuestos bioactivos como vitamina C, β caroteno y
CoQ10, posiblemente mediante mecanismos de regeneración (Munné-Bosch y Alegre,
2002; Guille y col., 2008). No se descarta su efecto pro oxidante en situaciones
específicas como en presencia de luz, oxígeno, pH alcalino o trazas de iones de metales
de transición (Munné-Bosch y Alegre, 2002; Guille y col., 2008; León-Camacho y col.,
2013; Kalogeropoulos y Tsimidou, 2014).
2.6. Definición y clasificación del aceite de oliva
Los productos del olivar son controlados con referencia a su designación, autenticidad,
calidad, pureza y otros aspectos comerciales por diferentes normativas de la Comunidad
Europea, acuerdos internacionales del COI, Codex Alimentarius y las legislaciones
propias de cada país.
De acuerdo con la definición obligatoria de comercialización del Reglamento UE n⁰
1308/2013 y la definición del COI T/15 n⁰3/2015, se pueden establecer dos grupos
generales con fines comerciales: i) aceites de oliva y ii) aceites de orujo de oliva,
categorías que incluyen a su vez diferentes tipos de aceite, según esquema de la Figura
20.
De esa forma, dentro de los aceites de oliva tenemos las siguientes denominaciones:
(a) Aceite de oliva vírgenes: aceite obtenido del fruto del olivo exclusivamente
por medios mecánicos u otros procedimientos físicos aplicados en condiciones
que excluyen toda alteración del producto, y que no se ha sometido a ningún otro
tratamiento que no sea su lavado, decantación, centrifugado o filtración, excluidos
los aceites obtenidos con el uso de disolventes o de coadyuvantes de acción
química o bioquímica, por un procedimiento de re esterificación o como resultado
de cualquier mezcla con aceites de otros tipos.
Este grupo engloba:
Aptos para consumo: aceite de oliva virgen extra (AOVE) y aceite de oliva
virgen (AOV).

Revisión bibliográfica
43
No aptos para consumo: aceite de oliva lampante (AOL).
(b) Aceite de oliva refinado: aceite de oliva obtenido del refinado de aceite de
oliva virgen lampante.
(c) Aceite de oliva: aceite de oliva obtenido por la mezcla de aceite de oliva
refinado y aceite de oliva vírgenes distinto del lampante.
Mientras que los aceites de orujo engloban los siguientes tipos:
(a) Aceite de orujo de oliva crudo: aceite que se obtiene del orujo de oliva
mediante un tratamiento con disolventes o empleando medios físicos, o que
corresponde, salvo en determinadas características, al aceite de oliva lampante.
(b) Aceite de orujo de oliva refinado: aceite obtenido del refino de aceite de
orujo de oliva crudo.
(c) Aceite de orujo de oliva: aceite obtenido mezclando aceite de orujo de oliva
refinado y aceite de oliva virgen distinto del lampante.
Además los aceites de oliva y aceites de orujo descritos en las referidas normativas
tienen fijados la acidez libre expresada en ácido oleico para cada categoría.
Los parámetros de pureza y calidad de los aceites de oliva son establecidos por el
Reglamento (CEE) n⁰ 2568/91 y sus modificaciones posteriores como el Reglamento
(CEE) n⁰1348/2013, que definen los limites en cada parámetro y los métodos de análisis
que se deben aplicar (Tabla 1). Asimismo, es importante tener en cuenta que el aceite
de oliva es el único producto entre las grasas animales y vegetales del mundo que tiene
su propio acuerdo internacional y en el que la evaluación organoléptica es necesaria
para la clasificación de los aceites (Aparicio y col., 2013; Vossen, 2013).

Revisión bibliográfica
44
Aceite de oliva virgen
Aceite de oliva virgen extra
Aceite lampante
Productos de la almazara
Vír
gen
es
Aceite de Oliva
Aptos para consumo No aptos para consumo
Ref
ina
do
Mezcla con aceite de oliva virgen
Aceite de oliva
Orujo
Aceite de oliva refinado
Extracción
Aceite de
orujo crudo
Refinería
Aceite de orujo refinado
Ref
inad
o
Aceite de Oliva de orujo
Aptos para consumo
Figura 20. Tipos de aceite de oliva y orujo de Oliva comerciales. Adaptado: Mataix, 2001.

45
Tabla 1. Características de los aceites de oliva y de orujo establecidas por el Reglamento (CEE) n⁰ 2568/91 y sus modificaciones.
Aceite de
oliva virgen
extra
Aceite de oliva
virgen
Aceite de oliva
lampante
Aceite de oliva
refinado
Aceite de oliva
(refinado
+ virgen)
Aceite
de orujo
de oliva
crudo
Aceite de
orujo de
oliva
refinado
Aceite de
orujo de oliva
Pa
rám
etro
s d
e
cali
da
d
Acidez (%) ≤ 0,8 ≤ 2,0 > 2,0 ≤ 0,3 ≤ 1,0 ---- ≤ 0,3 ≤ 1,0
Índice de peróxidos
(mEq O2/kg)
≤ 20 ≤ 20 --- ≤ 5 ≤ 15 --- ≤ 5 ≤ 15
K232 ≤ 2,50 ≤ 2,60 ---
K270 o K268 ≤ 0,22 ≤ 0,25 --- ≤ 1,10 ≤ 0,90 --- ≤ 2,00 ≤ 1,70
ΔK ≤ 0,01 --- ≤ 0,16 ≤ 0,15 --- ≤ 0,20 ≤ 0,18
Pu
reza
Ceras (mg/kg) ≤ 150 ≤ 300(3)
≤ 350 > 350(4)
> 350 > 350
Monopalmitato de
2-glicerillo (%)
≤ 0,9 si C16:0 ≤ 14%
≤ 1,0 si C16:0 > 14%
≤ 0,9 si C16:0 ≤ 14%
≤ 1,1 si C16:0 > 14%
≤ 0,9 si C16:0 ≤ 14%
≤ 1,0 si C16:0 > 14%
≤ 1,4
≤ 1,2
Estigmastadieno
(mg/kg) (1)
≤ 0,05 ≤ 0,50 ---
Diferencia ECN42
(HPLC) y ECN42
(cálculo teórico)
≤ ǀ0,2ǀ ≤ ǀ0,3ǀ ≤ ǀ0,6ǀ ≤ ǀ0,5ǀ
Sen
sori
al Mediana
de defecto (Md)
Md = 0 Md ≤ 3,5 Md > 3,5(2)
---
Mediana
de frutado (Mf)
Mf > 0 Mf > 0 ---
Áci
do
s g
raso
s2 (%
)
Palmítico (C16:0) 7,5-20
Palmítoleico
(C16:1)
0,3-3,5
Heptadecanoico
(C17:0)
≤ 0,3
Esteárico (C18:0) 0,5-5,0
Oleico (C18:1) 55- 83
Mirístico (C14:0) ≤ 0,03

Revisión bibliográfica
46
Linoleico (C18:2) 3,5-21
Linolenico (C18:3) ≤ 1,0
Araquídico (C20:0) ≤ 0,6
Eicosenoico
(C20:1)
≤ 0,4
Behénico (C22:0) ≤ 0,2 ≤ 0,3
Lignocérico
(C24:0)
≤ 0,2
Σ Isómeros
transoleicos
≤ 0,05 ≤ 0,10 ≤ 0,20 ≤ 0,40
Σ Transoleicos +
translinolenicos
≤ 0,05 ≤ 0,10 ≤ 0,30 ≤ 0,10 ≤ 0,35
Est
ero
les
(%)
Colesterol ≤ 0,50
Brasicasterol ≤ 0,10 ≤ 0,20
Campesterol ≤ 4,0
Estigmatesrol < Campesterol --- < Campesterol --- < Campesterol
β Sitosterol (5) ≥ 93,0
Δ-7-Estigmatenol ≤ 0,5
Esteroles totales (mg/kg) ≥ 1000 ≥ 2500 ≥ 1800 ≥ 1600
Eritrodiol/ Uvaol (%) ≤ 4,5 ≤ 4,5(6)
≤ 4,5 > 4,5(7)
> 4,5
Total de isómeros que han podido (o no han podido separase en columna capilar)(2) Debe estar en conformidad con el método establecido en anexo. (3) Se considera los aceites con
contenido de ceras entre 300 - 350 mg/kg son aceite de oliva lampante si el contenido de alcoholes alifáticos totales es ≤ 350 mg/kg o si el contenido de eritrodiol y uvaol es ≤ 3,5%. (4)
Se considera los aceites con contenido de ceras entre 300 - 350 mg/kg son aceite de orujo de oliva crudos si el contenido de alcoholes alifáticos totales es ≤ 350 mg/kg y si el contenido
de eritrodiol y uvaol es ≥ 3,5. (5) Suma de: Δ-5-23-estigmastadienol + clerosterol + beta-sitosterol + sitostanol + delta-5-avanesterol + delta 5-24-estigmastadienol (6) Se considera que los
aceites con contenido en ceras entre 300 y 350 mg/kg se consideran aceite de oliva lampante si el contenido en alcoholes alifáticos totales es ≤ a 350 mg/kg o si el contenido en eritrodiol
y uvaol es ≤ a 3,5%. (7) Los aceites con un contenido en ceras entre 300 y 350 mg/kg se consideran aceite de orujo de oliva crudo si el contenido en alcoholes alifáticos totales es > a 350
mg/kg y si el porcentaje de eritrodiol y uvaol es superior a 3,5%. (8) Esteres etílicos de los ácidos grasos (FAEEs) mg/kg para AOVE ≤35 (campaña 2014/2015); ≤30 (campañas
posteriores a 2015).
Adaptado: Reglamento (CEE) n⁰ 2568/91 y sus modificaciones (Reglamento (CEE) n⁰1348/2013).

Revisión bibliográfica
47
2.7. Parámetros de calidad del aceite de oliva reglamentados
Los parámetros de calidad del aceite de oliva descritos por el reglamento (CEE) n°
2568/91 y sus modificaciones, incluyen determinaciones analíticas que se refieren a los
procesos hidrolíticos de degradación como acidez, procesos de oxidación primaria y
secundaria determinados por los índice de peróxidos y coeficientes de extinción
especifica (K232, K20 y ΔK). Según el reglamento, se debe seguir un esquema de
decisiones para la comprobación de la conformidad de una muestra de AO con la
categoría declarada, empezado por los parámetros de calidad y la evaluación
organoléptica, y considerando a continuación el contenido en ácidos grasos, ECN42,
esteroles, eritrodiol/uvaol y ceras.
2.7.1. Acidez
Método volumétrico de titulación colorimétrico que determina los ácidos grasos libres
en el aceite de oliva por la reacción de hidrólisis de los triglicéridos y diglicéridos
conllevando a la ruptura de la ligación éster, conforme la reacción de la Figura 21. La
determinación se basa en la disolución del aceite en una mezcla de disolventes y la
valoración mediante una solución etanólica de hidróxido potásico, empleando como
indicador de color la fenolftaleína y expresando los resultados en relación al porcentaje
en ácido oleico (ácido graso mayoritario), es decir % m/m en ácido oleico.
De esa forma, el método es un indicador del grado de hidrólisis del aceite relacionado
con aceites provenientes de aceitunas en una etapa avanzada de madurez y /o que
experimentan degradación enzimática (lipasas) o AO proveniente de un largo tiempo de
espera entre cosecha y procesamiento (Borges y col, 2015; Reboredo-Rodríguez y col.,
2015).
Hidrólisis
H2C
H2C
HC O
O
O C
C
C
R1
R2
R3
= O
= O
H2C
H2C
HC OH
OH
OH
+
R1
R2
R3
HO
= O
C
C
C
= O
= OHO
HO
Triglicérideos Glicerol Ácidos grasos libres
= O
Figura 21. Reacción de oxidación por hidrólisis y formación de los ácidos grasos libres.

Revisión bibliográfica
48
2.7.2. Índice de Peróxidos
Método volumétrico de titulación que determina los productos primarios de oxidación,
los hidroperóxidos (Figura 22) expresado en mEq de O2/kg. Su principio se basa en la
disolución de la muestra en solución de ácido acético: cloroformo, tratándose con
yoduro potásico y valorando con solución de tiosulfato sódico, reacción que conlleva la
oxidación del yoduro potásico.
R1˙IniciaciónR1H
IniciadorH ˙+
O2 O2˙-HOO ˙
R1HR1˙ + H2O2
y/o
Iniciador
Hidroperoxil
Propagación
R1˙ O2R1OO˙
R1OOH
Luz, calor
R2˙ O2R2OO˙ R3˙ O2˙-
R3OO˙R2H R3H RnH Rn
R1O˙ + ˙OH
RmH
Rm˙ Rx˙
RxH
R2OOH
Oxidando Metales
R2OO˙ + H +
RyH
Ry˙ H2O
˙OH + R3O˙
Rz˙
Reduzindo Metales
R2OOH
Radical libre
Terminación ROO˙
RO˙
RO˙
Productos estables no radicalares (R-R; ROR; ROOR)
Hidroperóxido
Ácido olefinico
Peróxido
Oxidación secundária
Figura 22. Esquema de peroxidación lipídica. Adaptado: Shahidi y Zhong, 2010.
2.7.3. Coeficientes de extinción específica
Prueba espectrofotométrica en el ultravioleta que indica el estado de conservación del
aceite y las modificaciones inducidas por los procesos tecnológicos. Las absorciones en
las longitudes de onda indicadas en el método se deben a la presencia de sistemas
diénicos y triénicos conjugados, es decir los productos secundarios de oxidación
(Figura 22). Los valores de estas absorciones se expresan en extinción específica. Su
principio se basa en la disolución de la muestra en la solución requerida y se determina
a las longitudes de onda prescritas.

Revisión bibliográfica
49
2.8. Parámetros no reglamentados
2.8.1. Estabilidad oxidativa
El método de Rancimat es una medida acelerada de la resistencia a la oxidación
empleada en diferentes tipos de aceites vegetales, muy popular por su facilidad y
reproducibilidad. Este método es capaz de predecir la vida útil del aceite, basándose en
la inducción de la oxidación de una cantidad fija de aceite con temperatura y flujo de
aire constantes y midiendo los cambios de conductividad en el agua producidos al
generar ácidos orgánicos volátiles (productos de la oxidación final) y determinando el
periodo de inducción oxidativa en horas (Figura 23) (Farhoosh, 2007; Farhoosh y col.,
2008; García-Moreno y col., 2013).
Aire
Oxidación inducida
por calentamiento
(120�C)
Aceite
Flujo de volátiles
Agua miliQ
(solución de absorción)
Salida de
volátiles
Electrodo de
conductividad
Figura 23. Esquema del principio del método de Rancimat.
2.8.2. Color
Como se ha mencionado anteriormente, el color se relaciona con el contenido en
pigmentos y no es un parámetro de calidad establecido en las normativas vigentes para
los AO o para la valoración organoléptica, pero puede influenciar la aceptabilidad de los
consumidores (Moyano y col., 2010).
La evaluación instrumental del color se realiza mediante los sistemas CIELUV y
CIELAB (Moyano y col., 2008). El CIELAB es ampliamente utilizado en alimentos,
incluidos los AO, presentando una alta correlación con los pigmentos y el índice de

Revisión bibliográfica
50
maduración (Melendéz-Martínez y col., 2007; Moyano y col., 2008). Las medidas de
color del CIELAB, son establecidas de acuerdo con coordenadas en el espacio de
cromaticidad determinado como a* (color rojo – al color verde) y b* (color amarillo- al
azul), mientras la coordenada L* es considerada una estimación de luminosidad en que
0 correspondiente al negro y 100 que se refiere al blanco (Figura 24) (Moyano y col.,
2010).
L* = 100
(Claro)
L* = 0
(Oscuro)
+a* = 0
(Rojo)
+b* = 0
(Amarillo)
-a*
(Verde)
-b* = 0
(Azul)
Figura 24. Coordenadas del color CIELAB.
2.9. Parámetros organolépticos
La valoración organoléptica para la clasificación de los aceites de oliva es parámetro
oficial obligatorio de acuerdo con el reglamento (CEE) n⁰ 2568/91 y sus modificaciones
posteriores vigentes establecidas en el Reglamento (UE) nº 1348/2013. Dicha
reglamentación describe el procedimiento de evaluación, el método y las indicaciones
para el etiquetado de los aceites.
Asimismo, establece que la clasificación de los AO debe ser realizada por un panel de
catadores entrenados (8-12 personas) en una sala ambientalmente aislada entre 20°- 25°
C en copas adecuadas calentadas a 28 ± 2°C cumpliendo todas condiciones para tal
finalidad, siendo aplicable para los AOV los limites descritos en la Tabla 1, por la
existencia del atributo frutado y la intensidad de defectos.

Revisión bibliográfica
51
Además, la normativa hace una descripción detallada de los atributos positivos y
negativos (Tabla 2), estableciendo también los atributos positivos en función de la
intensidad y de la percepción en: intenso > 6; medio 3-6 y ligero >3.
Tabla 2. Descripción de los atributos positivos y negativos de los aceites de oliva vírgenes.
Atributos positivos
Frutado
Conjunto de sensaciones olfativas características del aceite, dependientes de la
variedad de las aceitunas, procedentes de frutos sanos y frescos, verdes o maduros,
y percibidas por vía directa y/o retronasal.
Amargo Sabor elemental característico del aceite obtenido de aceitunas verdes o en envero.
Se percibe en las papilas circunvaladas de la uve lingual.
Picante
Sensación táctil de picor, característica de los aceites obtenidos al comienzo de la
campaña, principalmente de aceitunas todavía verdes. Puede ser percibido en toda
la cavidad bucal, especialmente en la garganta.
Atributos negativos
Atrojado/borras
Flavor característico del aceite obtenido de aceitunas amontonadas o almacenadas
en condiciones tales que han sufrido un avanzado grado de fermentación anaerobia
o del aceite que ha permanecido en contacto con los lodos de decantación, que
también han sufrido un proceso de fermentación anaerobia en trujales y depósitos
Moho-humedad
Flavor característico del aceite obtenido de frutos en las que se han desarrollado
abundantes hongos y levaduras a causa de haber permanecido amontonadas con
humedad varios días, o aceite obtenido de las aceitunas que han sido recogidas con
tierra o barro y que no han sido lavadas.
Avinado –
avinagrado/
Ácido-agrio
Flavor característico de algunos aceites que recuerda al vino o vinagre. Es debido
fundamentalmente a un proceso fermentativo aerobio de las aceitunas o de los
restos de pasta de aceitunas en capachos que no han sido limpiados adecuadamente,
que da lugar a la formación de ácido acético, acetato de etilo y etanol.
Rancio Flavor de los aceites que han sufrido un proceso oxidativo intenso.
Aceitunas
congeladas
(madera mojada)
Flavor característico de aceites que han sido extraídos de aceitunas que han sufrido
un proceso de congelación en el árbol
Cocido o
quemado
Flavor característico del aceite originado por un excesivo y/o prolongado
calentamiento durante el procesado, muy particularmente durante el termo-batido
de la pasta, si este se realiza en condiciones térmicas inadecuadas.
Heno-madera Flavor característico de algunos aceites procedentes de aceitunas secas.
Basto Sensación buco-táctil densa y pastosa producida por algunos aceites viejos.
Lubricante Flavor del aceite que recuerda al gasóleo, a la grasa de lubricar o al aceite mineral.
Alpechín Flavor adquirido por el aceite a causa de un contacto prolongado con alpechín que
han sufrido procesos fermentativos.
Salmuera Flavor del aceite extraído de aceitunas conservadas en salmuera.

Revisión bibliográfica
52
Metálico
Flavor que recuerda a los metales. Es característico del aceite que ha permanecido
en contacto, durante tiempo prolongado, con superficies metálicas, durante los
procesos de molienda, batido, prensado o almacenamiento.
Esparto
Flavor característico del aceite obtenido de aceitunas prensadas en capachos nuevos
de esparto. El flavor puede ser diferente si el capacho está fabricado con esparto
verde o si lo está con esparto seco
Gusano Flavor característico del aceite obtenido de aceitunas fuertemente atacadas por
larvas de mosca del olivo (Bactrocera oleae).
Pepino
Flavor que se produce en el aceite cuando se mantiene en un envase hermético
durante un tiempo excesivo, particularmente en hojalata, que se atribuye a la
formación de 2,6-nonadienal.
Es importante destacar que las características sensoriales positivas se deben
mayoritariamente a los compuestos volátiles, pero también los atributos amargo y
picante se correlacionan con el contenido de compuestos fenólicos (Luna y Aparicio,
2002; Aguilera y col., 2005; Stefanoudaki y col., 2009; Jiménez y col., 2013; Barbieri y
col., 2015).
Por otro lado, hay que tener en cuenta que el perfil sensorial se ve fuertemente afectado
por la variedad, composición y otros aspectos como índice de maduración y condiciones
de extracción (Luna y Aparicio, 2002; Angerosa y Campestre, 2013). De acuerdo con
Romero y col., (2016), en variedades adaptadas en Chile el suelo y el clima tiene más
influencia en las características sensoriales que la propia variedad, justo lo contrario de
los aceites producidos en la Cuenca del Mediterráneo, mostrando un perfil sensorial
diferente de los aceites producidos en regiones fuera del Mediterráneo.
Actualmente, a pesar de que el análisis sensorial sea aceptado como una herramienta
potente para la valoración organoléptica para la clasificación de los tipos de aceite de
oliva vírgenes y lampante, nuevas herramientas como los métodos basados en sensores
artificiales conocidos por lengua electrónica, nariz electrónica y sistemas de visión
artificial están siendo propuestas como auxiliares en la clasificación, evaluación de la
calidad y diferenciación de los AO (Oliveri y col., 2009; Dias y col., 2014; Rodrigues y
col., 2016; Di Rosa, 2017; Slim y col., 2017).
La lengua electrónica es definida como una herramienta analítica formada por una serie
de sensores electroquímicos no específicos acoplados a un dispositivo de adquisición de
señales que, a su vez, está conectado a un ordenador/portátil para análisis de las señales
electroquímicas generadas (Di Rosa, 2017) (Figura 25).

Revisión bibliográfica
53
Ordenador
Adquisición de señales
Sensores
Muestra
Electrodo
Agitador
Figura 25. Componentes del análisis mediante lengua electrónica.
Diferentes sensores como electroquímicos (voltimétricos, potenciométricos,
amperométricos y otros), ópticos o biosensores pueden ser utilizados, siendo más
frecuentes los sensores electroquímicos (Di Rosa, 2017). Los sensores electroquímicos
están constituidos por membranas poliméricas lipídicas con propiedades
electroquímicas no específicas que son capaces de generar una señal a los compuestos
polares en contacto con una solución hidroalcohólica sin emisión de una corriente
eléctrica (Dias y col., 2014; Slim y col., 2017). Dichas soluciones son ricas en
compuestos polares (esteroles, compuestos fenólicos, tocoferoles) y la señal generada
por los compuestos pueden proporcionar una aproximación de las complejas funciones
de los receptores gustativos humanos, mimetizando sensaciones gustativas como acidez,
salinidad, dulzor, amargo y umami, pero también sensaciones táctiles como picantes
(Dias y col., 2014; Di Rosa, 2017; Slim y col., 2017).
En los últimos años se ha aplicado con éxito en los aceites de oliva para distinguir los
aceites función de su calidad, clasificación comercial, variedad y origen geográfico,
incluyendo la discriminación entre los diferentes países (Apetrei y col., 2010, Dias et
al., 2014; Olivieri et al., 2009; Rodrigues y col., 2016; Slim y col., 2017). Además, por
su estrecha relación con los compuestos volátiles, se ha propuesto como una
herramienta útil para complementar la evaluación organoléptica de los alimentos (Slim
Revisión bibliográfica
54
y col., 2017), que se define por un efecto combinado y sinérgico de diferentes
sensaciones y percepciones.
Esta metodología tiene muchas ventajas como bajo coste, rapidez, portabilidad,
simplicidad y precisión (Dias y col., 2014; Di Rosa y col., 2017).
2.10. Aceites monovarietales: la variedad Arbequina
A día de hoy, el mercado del AOV está cada vez más especializado y los aceites
denominados monovarietales, es decir, aceites producidos a partir de una única variedad
de aceituna, están ganando un hueco en el mercado oleícola. Estos aceites son de gran
interés desde un punto de vista científico y comercial por diferentes aspectos,
particularmente en el mercado internacional (Japón, Brasil, Estados Unidos), donde el
aceite de oliva representa todavía un producto de selección (“gourmet”). Por otra parte,
el consumo especializado de los aceites monovarietales están también direccionados a
productos de una determinada zona geográfica y con certificados de origen, así, el
productor comparte el interés de los consumidores por distinguir su producción,
destacando las peculiaridades de cada genotipo para diferentes combinaciones
gastronómicas (Cecchi y Alfei, 2013). Otro aspecto destacable de los aceites
monovarietales es su papel en las mezclas de aceites conocidos por “coupages” o
“blends” (Luna y Aparicio, 2002).
Entre los aceites monovarietales más conocidos y cultivados mundialmente, hay que
señalar los aceites provenientes de la variedad Arbequina. Esta variedad es autóctona de
las regiones del noreste de España (Tarragona y Lleida), específicamente hace
referencia en su nombre al pueblo de Arbeca localizado en Lleida (Vossen, 2007).
Actualmente, está siendo cultivada en diferentes partes del mundo como Argentina,
Australia, Brasil, Chile, Estados Unidos, Túnez y Turquía (Berenguer y col., 2006;
Torres y col., 2009; García- González y col, 2010.; Mailer y col., 2010; Dabbou y col.,
2011; Rondanini y col., 2011; Ballus y col., 2014, Romero y col., 2016; Uluata y col.,
2016).
Su expansión mundial se explica por las características del fruto, del árbol y del aceite.
Los olivos de la variedad Arbequina se caracterizan por su alta resistencia al frio,
precocidad (producción entre 2-3 años), baja fuerza de desprendimiento, alta
flexibilidad y buena productividad, mientras la aceituna es pequeña (alrededor de 1,9 g),
por lo tanto con baja proporción pulpa/hueso y con alto rendimiento de aceite

Revisión bibliográfica
55
(aproximadamente 20.5%) (Bakhouche y col., 2013; Vossen, 2013). Estos aspectos la
convierten en la variedad predominante de los sistemas de cultivo intensivo y súper
intensivo.
Sumados a esos factores, los aceites producidos a partir de esa variedad son altamente
apreciados en el mercado internacional por sus aspectos sensoriales tradicionales
establecidos como frutados y dulces, ligeramente amargos y picantes (Tous y col., 1997;
Luna y Aparicio, 2002), aunque más recientemente los aceites Arbequina son más
verdes, debido a su cosecha temprana, pero es relevante considerar que las nuevas
plantaciones de diferentes regiones pueden producir cambios inesperados en la calidad
sensorial (García-González y col., 2010).
2.11. Propiedades antioxidantes
El término “radicales libres” se refiere a átomos, moléculas o iones definidos por su
inestabilidad química, ya que poseen un electrón desapareados en su órbita y
consecuentemente son muy inestables y reactivos, característica que favorece las
reacciones con otras moléculas para captar el electrón que les falta (Carocho y Ferreira,
2013; Sindhi y col., 2013). Son derivados de tres principales elementos, oxígeno,
nitrógeno y azufre, dando lugar a las especies reactivas de oxígeno, especies reactivas
de nitrógeno y especies reactivas de azufre, términos conocidos por las siglas en inglés
ROS, RNS y RSS (Carocho y Ferreira, 2013)
En el cuerpo humano, los radicales libres son producidos continuamente de forma
endógena dentro de las mitocondrias durante las reacciones metabólicas aérobicas,
como la obtención de energía y otras reacciones de desintoxicación, señalización
química y función inmune (Dimitrios, 2006; Carocho y Ferreira, 2013). Pero también
pueden ser generados por vía exógena, bien por factores oxidantes externos (alcohol,
drogas, contaminación ambiental, radiación UV, tabaco, ejercicios físicos intensos) y/o
durante severos procesos de infección/inflamación (Mitjavila y Moreno, 2010; Carocho
y Ferreira, 2013; Sindhi y col., 2013). En este sentido los ROS se destacan por su
predominancia en el organismo humano, incluyendo diferentes especies como oxígeno
singlete (O2), radical anión superóxido (O2•-), peróxido de hidrógeno (H2O2), radical
hidroxilo (OH-) y óxido nítrico (NO) (Carocho y Ferreira, 2013).
Cuando ocurre una sobreproducción de estas especies, es decir, un desbalance oxidativo
en favor de los radicales libres sea relacionado con una incapacidad del sistema de

Revisión bibliográfica
56
defensa o por la sobreexposición a los factores oxidantes, se produce una situación
conocida como estrés oxidativo, que puede suponer daños en el ADN/ARN y en otras
biomoléculas (lípidos, proteínas, hidratos de carbono) (Dimitrios, 2006; Sindhi y col.,
2013). Hay que destacar que la actuación de estas moléculas en los lípidos conlleva a la
peroxidación lipídica, proceso que se inicia por la abstracción de un átomo de hidrogeno
de la cadena lateral del ácido graso (esquema representado en la Figura 22, apartado
2.7).
Los daños oxidativos están relacionados con el desarrollo de muchas enfermedades
crónicas como el aterosclerosis, cáncer, diabetes, enfermedades cardiovasculares,
neurodegenerativas (Alzheimer y Parkinson), procesos de envejecimiento y otras
severas patologías (Dimitrios, 2006; Carocho y Ferreira, 2013; Sindhi y col., 2013).
Los compuestos conocidos como antioxidantes son sustancias que aún en bajas
concentraciones retardan, inhiben o previenen las reacciones de oxidación de las
moléculas diana, evitando el daño oxidativo y actuando en ocasiones en la regulación de
las defensas antioxidantes endógenas (que incluyen las enzimas superóxido dismutasa,
catalasa, glutatión peroxidasa, glutatión reductasa, glucosa-6-fosfato deshidrogenasa) y
la coenzima CoQ (Pravast, y col., 2010; Carocho y Ferreira, 2013; Sindhi y col., 2013;
Farzaneh y Carvalho, 2015).
De acuerdo con Carocho y Ferreira, (2013), los mecanismos de acción de los
antioxidantes son los siguientes:
i) Inhibidores de las reacciones de oxidación de radicales libres, es decir como
preventivos inhibiendo la formación de derivados de la oxidación lipídica.
ii) Interrumpiendo la propagación de la reacción en cadena de la peroxidación
lipídica
iii) Inactivando el oxígeno singlete mediante la sinergia con otros antioxidantes
iv) Como agentes reductores conviertiendo los hidroperóxidos en compuestos
estables
v) Como agentes quelantes, formando compuestos estables con los metales pro-
oxidantes (hierro y cobre)
vi) Inhibidores de las enzimas pro-oxidantes, como las lipooxigenasas.
(lipooxigenasas).

Revisión bibliográfica
57
Así, estos compuestos desempeñan un papel fundamental para reducir los procesos
oxidativos tanto el cuerpo humano como en los alimentos, en los que pueden prevenir y
retardar el deterioro ayudando a mantener el sabor, la textura y el color del producto
durante el almacenamiento (Sindhi y col., 2013).
Las fuentes de antioxidantes de origen natural como frutas, verduras, vino, té, especias y
el aceite de oliva han sido muy estudiadas, ya que desde un punto de vista nutricional,
las dietas ricas en alimentos con alto potencial antioxidante favorecen el equilibrio
oxidativo y la protección endógena del organismo bajo condiciones de estrés, principio
que relaciona el consumo de fuentes de antioxidantes de la dieta a la protección y/o
reducción de muchas enfermedades como las mencionadas anteriormente (Dimitrios,
2006; Servili y col., 2014; Farzaneh y Carvalho, 2015).
Según la literatura científica, las principales clases de antioxidantes que se encuentran
de forma natural en los alimentos son las vitaminas (A, C, E y K), los pigmentos
(antocianinas y carotenoides) y los compuestos fenólicos (flavonoides, ácidos fenólicos,
lignanos y estilbeno) (Farzaneh y Carvalho, 2015; Oroian y Escriche, 2015).
Numerosos estudios, tanto in vivo como in vitro o ex vivo han demostrado una elevada
capacidad antioxidante del AOV y de muchos de sus compuestos aislados (Sanchéz,
2007; Castañer y col., 2012; Fadda y col., 2012; Franco y col., 2014; Servili y col.,
2014; Chiesi y col., 2015; Incani y col., 2016). Los principales compuestos responsables
de dichas propiedades en los AOV son los compuesto fenólicos, la vitamina E, los
carotenoides y la CoQ10, entre otros (Carocho y Ferreira, 2013; Lopez y col., 2014;
Servili y col., 2014) que posiblemente actúan de manera sinérgica y mediante diferentes
mecanismos. Por ejemplo, se ha descrito la capacidad de la CoQ10 para recuperar la
vitamina E, la regeneración de la vitamina E a través de los niveles de vitamina C
(Carocho y Fereira, 2013), o la participación del hidroxitirosol en el aumento de los
niveles endógenos de vitamina C (Lopez-Huertas y Fonollá, 2017).
Actualmente, no hay un método universal para evaluar la actividad antioxidante de los
alimentos debido a la complejidad de los procesos de oxidación-reducción, y lo ideal es
utilizar varios métodos que dan una idea de la actividad global, basándose en diferentes
mecanismos de acción.
Entre los diversos métodos que existen, los más frecuentemente empleados en la
evaluación de las propiedades antioxidantes de los alimentos son los métodos in vitro,
que tradicionalmente comprenden una etapa previa de extracción de los compuestos

Revisión bibliográfica
58
antioxidantes por su afinidad química con uso de solventes orgánicos. En la literatura
científica es posible encontrar diferentes procedimientos para diferentes métodos de
extracción, separación y cuantificación, con una amplia variedad de solventes y
condiciones de extracción (Oroian y Escriche, 2015).
A continuación, la actividad antioxidante se puede determinar mediante reacciones
colorimétricas basadas en la transferencia de electrones conocidos como captadores de
radicales libres, con el uso de compuestos artificiales como son los ensayos ABTS
(Ácido 2,2.-azinobis-(3-etilbenzotiazolín-6-sulfónico) y DPPH (2,2-difenil-1
picrilhidracil) o por la reducción de los iones de hierro (FRAP) (Carocho Ferreira, 2013;
Farzaneh y Carvalho 2015; Oroian y Escriche, 2015). Los cambios de color
consecuencia de la neutralización de los radicales libres sintéticos o de la capacidad
para reducir los iones Fe3+
a Fe2+
son evaluados por espectrofotometría, obteniendo
valores de absorbancia a diferentes longitudes de onda en un tiempo fijo y comparando
con un derivado sintético de la vitamina E (6-hidroxi- Ácido 2,5,7,8 - tetrametilcroman
- 2 – carboxílico o Trolox).
2.12. Biodisponibilidad de compuestos antioxidantes
Aunque los métodos tradicionales de extracción para la determinación de la actividad
antioxidante in vitro sean considerados medidas relevantes, no son suficiente para la
predicción de los potenciales efectos antioxidantes in vivo (Etcheverry y col., 2012;
Carbonell-Capella y col., 2014). A este respecto, muchos estudios proponen los
métodos de digestión in vitro como paso previo a la evaluación de las propiedades
antioxidantes, con la finalidad de obtener una aproximación más fisiológica en la
determinación del potencial antioxidante de los alimentos (Pastoriza y col., 2011).
La digestión in vitro es un método que mimetiza las transformaciones sufridas por la
matriz alimentaria durante el proceso digestión, teniendo en cuenta la presencia de
enzimas digestivas y sus concentraciones, pH, tiempo de digestión y concentraciones de
sales, entre otros factores (Minekus y col., 2014).
En este sentido, hay dos conceptos fundamentales relacionados a la digestión de la
matriz alimentaria y el estudio del potencial bioactivo de los alimentos: la
bioaccesibilidad y la biodisponibilidad. La bioaccesbilidad implica que una
determinada fracción del alimento o dieta para tener un función biológica, debe ser
liberada de la matriz alimentaria durante la digestión, convirtiéndose en disponible para

Revisión bibliográfica
59
la absorción a nivel intestinal, mientras que la biodisponibilidad se refiere a la parte del
alimento que alcanza la circulación sistémica y es utilizada para las funciones
fisiológicas, lo cual incluye la digestión, absorción por las células intestinales y el
transporte a las células del cuerpo (Carbonell-Capella y col., 2014).
En las últimas décadas, los cultivos celulares están siendo aplicados a los estudios de
biodisponibilidad con el objetivo de simular las condiciones intestinales de absorción
(Seiquer y col. 2001), y hoy en día se presentan como una alternativa viable a los
estudio con animales o humanos, que son más complejos, caros y de larga duración
(Soler y col., 2010). Acoplados a los métodos de digestión in vitro, los cultivos
celulares suponen una herramiento útil para elucidar el impacto potencial de algunos
compuestos y/o de toda la matriz alimentaria en la salud humana.
En este sentido se utiliza con éxito la línea celular Caco-2 (Figura 26), derivada de
adenocarcinoma de colon humano, cuyas células en cultivo se diferencian
espontáneamente en enterócitos maduros, con la morfología y características
funcionales del epitelio intestinal (Figura 26B) (Gonzales y col., 2015). Este modelo de
línea celular acoplado a la digestión in vitro, ha sido utilizado como modelo de
absorción intestinal de compuestos bioactivos, incluyendo los compuestos fenólicos de
AOV y además, ha sido empleado para estudios de citotoxicidad y marcadores
antioxidantes a nivel celular (Deiana y col., 2010; Soler y col., 2010; Rodríguez-Ramiro
y col., 2011; Rubió at al., 2014; Chiesi y col., 2015; Incani y col., 2016).
No obstante, existen pocos estudios relacionados con la fracción antioxidante de los
AOV que consideren las transformaciones digestivas de toda matriz alimentaria, sus
metabolitos y el efecto sinérgico de los compuestos antioxidantes presentes en los
aceites (Borges y col., 2015; Seiquer y col., 2015).
Lín
ea c
elu
lar
Ca
co-2
A B
Figura 26. Células Caco-2. A- Monocapa de células. B- Microvellosidades.

Revisión bibliográfica
60
2.14. Aspectos beneficiosos del aceite de oliva
Desde las primeras evidencias epidemiológicas referidas en el estudio de los siete países
(Keys, 1970) hasta los datos científicos más recientes indicados por diferentes
investigaciones como el estudio del efecto del consumo de aceite de oliva en
poblaciones europeas (EUROLIVE), el Estudio prospectivo Europeo sobre la dieta,
cáncer y salud (EPIC), el estudio Prevención con Dieta Mediterránea (PREDIMED) y
otros numerosos estudios incluyendo modelos in vivo (animales y humanos), el
consumo de aceite de oliva como fuente de grasa de la dieta mediterránea ha sido
asociado a múltiples efectos beneficiosos sobre la salud humana particularmente cuando
se trata de aceite de oliva virgen (Visioli y col., 2001; Covas y col., 2006; Covas y col.,
2007; Barter y col., 2007; Buckland y col., 2011; Psaltopoulou y col., 2011; Castañer y
col., 2012; Guasch-Ferré y col., 2015; Rodríguez-Morató y col., 2015; Toledo y col.,
2015; Casas y col., 2016; García- Gavilán y col., 2017).
Estos estudios son evidencias epidemiológicas reconocidas por la comunidad científica
que hacen posible el establecimiento de alegaciones nutricionales por las autoridades de
seguridad alimentaria a nivel internacional. Sin embargo, las investigaciones continúan
para comprobar efectos beneficiosos todavía no elucidados y establecer los mecanismos
de acción de cada uno de ellos. Algunas de los aspectos beneficiosos del AOV se
resumen en la Figura 27.
La propiedad más reconocida se relaciona con la prevención de la enfermedad
cardiovascular, clásicamente atribuida al perfil de AGMI de los AO, rico en ácido
oleico, pero que es un efecto complejo, que resulta de efectos sinérgicos y convergentes
del perfil lipídico y de los compuestos minoritarios del AO, especialmente los
compuestos fenólicos (Covas y col., 2007; González- Santiago y col., 2010; Martín-
Peláez y col., 2013; Capurso y col., 2014; Buckland y col., 2015). Los estudios
muestran que dietas ricas en AOV reducen los niveles y la oxidación de las LDL,
manteniendo los niveles de HDL (Visioli y col., 2001; Covas y col., 2006; Barter y col.,
2007; Castañer y col., 2012). De esta forma, disminuye el riesgo de las enfermedades
cardiacas y vasculares, ya que el aumento de los niveles de LDL oxidadas es
responsable del acumulo del colesterol y de la formación de la placa aterosclerótica en
el endotelio de los vasos sanguíneos, lo cual desencadena las patologías vasculares,
incluyendo infarto del miocardio y accidente cerebrovascular (Covas y col., 2007;
Huang y col., 2008; Martín-Peláez y col., 2013). Además, estas propiedades están

Revisión bibliográfica
61
relacionadas con sus efectos beneficiosos en la tensión arterial, propiedades anti-
trombosis y funciones endoteliales (Stark y Madar, 2002; Covas y col., 2007; Servili y
col., 2014).
A nivel digestivo
Anti-microbiano
Diabetes/Obesidad
Efecto cardiovascular
Efecto neuro-protector
Anticancerígeno
quimioprotector
Antihipertensivo
Antinflamatorio/Antioxidante
Sistema inmune
Enfermedades óseas
Figura 27. Efectos saludables de los aceites de oliva.
Con respecto a sus alegaciones en la prevención de las enfermedades coronarias, la
agencia estadounidense Food and Drug Administration (FDA) recomienda el consumo
de 23g de AO al día, relacionando estas propiedades al contenido de AGMI (FDA,
2004). Posteriormente, la EFSA avaló que existe una relación de causa-efecto entre el
consumo de fenoles del aceite de oliva y la protección de las LDL al daño oxidativo,
refiriendo esta declaración a los aceites de oliva que contengan un mínimo de 5 mg de
hidroxitirosol y sus derivados (tirosol y derivados de la oleuropeina) por 20 g de AO
(EFSA, 2011).
En la última década, se están conociendo datos científicos prometedores, aunque no
definitivos, en relación al efecto beneficioso del consumo de aceite de oliva en la
prevención de varios tipos de cáncer, particularmente sobre el cáncer de mama y del
sistema digestivo (Martín-Peláez y col., 2013; Psaltopoulou y col., 2011; Servili y col.,
2014; Buckland y col., 2015). Aunque no se conocen en su totalidad los compuestos
responsables del efecto quimioprotector, la oleuropeína y sus derivados, compuestos
fenólicos del AO perteneciente a la familia de los secoiroides, han sido propuestos
como uno de los principales moduladores de los procesos cancerosos, asi como el
escualeno y el ácido oleanólico (Buckland y col., 2015; Ahmad Farooqi y col., 2017).

Revisión bibliográfica
62
Asimismo, se han propuesto diferentes mecanismos para explicar los efectos
encontrados, siendo uno de los principales el alto potencial antioxidante de algunos
compuestos como los compuestos fenólicos, es decir, menor susceptibilidad a la
oxidación y estabilización de los niveles de ROS y RNS a nivel celular, como factores
clave para prevenir el daño a las biomoléculas del organismo humano y el efecto
mutágeno (Stark y Madar, 2002; Psaltopoulou y col., 2011; Martín-Peláez y col. 2013;
Servili y col., 2014; Buckland y col., 2015).
De la misma manera, los efectos beneficiosos neuroprotectores del AO, particularmente
sobre las enfermedades crónicas como el Parkinson y Alzheimer, están siendo
investigados por la comunidad científica. En este sentido, estudios in vivo e in vitro han
mostrado resultados positivos en cuanto a su poder antiinflamatorio (similar al
ibuprofeno) implicado en estas enfermedades y han sido atribuidos a los compuestos
minoritarios del aceite de oliva, especialmente los compuestos fenólicos como el
oleocantal (Martín-Peláez y col. 2013; Sindhi y col., 2013; Servili y col., 2014;
Rodríguez-Morató y col., 2015).
En la última década, en relación al sistema inmune se han encontrado evidencias que
sugieren que el consumo de aceite de oliva puede tener un impacto en la respuesta
inmune (Cárdeno y col., 2014; Aparicio-Soto y col., 2016; Medina-Remón y col.,
2017), pudiendo tener un papel positivo algunas las enfermedades auto-inmunes como
artritis reumatoide, lupus eritematoso sistémico, esclerosis y enfermedad inflamatoria
intestinal, pero todavía son necesarios muchos esfuerzos para aclarar esos efectos y
establecer la dosis adecuada, entre otros aspectos (Aparicio-Soto y col., 2016).
Además, existen pruebas del efecto antimicrobiano de los aceites de oliva y de su
influencia sobre el equilibrio de la microbiota humana. Los compuestos fenólicos
resultantes de la digestión del aceite no son absorbidos completamente en el intestino
delgado, y parte de los mismos puede alcanzar el intestino grueso, siendo metabolizados
por la microflora intestinal y pudiendo en este sentido afectar los procesos inflamatorios
modulados por patógenos intestinales (Cicerale y col., 2012; Martín-Peláez y col. 2013;
Servili y col., 2014).
Otros estudios relacionan la dieta mediterránea y el consumo del aceite oliva con la
menor incidencia de diabetes, sobrepeso/obesidad y enfermedades óseas como la
osteoporosis (Trichopoulou y col., 1997; Cicerale y col., 2012; Capurso y col., 2014;
García-Martínez y col., 2014; Buckland y col., 2015; Santangelo y col., 2016).
Revisión bibliográfica
63
Referencias
Aguilera, M. P., Beltrán, G., Ortega, D., Fernández, A., Jiménez, A., Uceda, M. (2005).
Characterisation of virgin olive oil of Italian olive cultivars: Frantoio 'and Leccino', grown
in Andalusia. Food Chemistry, 89(3), 387-391.
Ahmad Farooqi, A., Fayyaz, S., Silva, A. S., Sureda, A., Nabavi, S. F., Mocan, A., ... &
Bishayee, A. (2017). Oleuropein and Cancer Chemoprevention: The Link is Hot.
Molecules, 22(5), 705.
Alcázar-Fabra, M., Navas, P., Brea-Calvo, G. (2016). Coenzyme Q biosynthesis and its role in
the respiratory chain structure. Biochimica et Biophysica Acta (BBA)-Bioenergetics,
1857(8), 1073-1078.
Angerosa, F. (2002). Influence of volatile compounds on virgin olive oil quality evaluated by
analytical approaches and sensor panels. European Journal of Lipid Science and
Technology, 104(9‐10), 639-660.
Angerosa, F., Campestre, C. (2013). Sensory Quality: Methodologies and Applications. En:
Handbook of Olive Oil (pp. 523-560). Springer US.
Angerosa, F., Servili, M., Selvaggini, R., Taticchi, A., Esposto, S., Montedoro, G. (2004).
Volatile compounds in virgin olive oil: occurrence and their relationship with the quality.
Journal of Chromatography A, 1054(1), 17-31.
Aparicio, R., Conte, L. S., Fiebig, H. J. (2013). Olive oil authentication. En: Handbook of olive
oil (pp. 589-653). Springer US.
Aparicio-Soto, M., Sánchez-Hidalgo, M., Rosillo, M. Á., Castejón, M. L., & Alarcón-de-la-
Lastra, C. (2016). Extra virgin olive oil: a key functional food for prevention of immune-
inflammatory diseases. Food & Function, 7(11), 4492-4505.
Apetrei, C., Apetrei, I. M., Villanueva, S., De Saja, J. A., Gutierrez-Rosales, F., & Rodriguez-
Mendez, M. L. (2010). Combination of an E-nose, an E-tongue and an e-eye for the
characterisation of olive oils with different degree of bitterness. Analytica Chimica Acta,
663(1), 91-97.
Aued-Pimentel, S. (2016). Olive Oil in Brazil: Economic and Regulatory Control Aspects. En:
Products from Olive Tree. InTech, DOI: 10.5772/64539.
<https://www.intechopen.com/books/products-from-olive-tree/olive-oil-in-brazil-
economic-and-regulatory-control-aspects>, Junio, 2017.
Baccouri, O., Guerfel, M., Baccouri, B., Cerretani, L., Bendini, A., Lercker, G., ... Miled, D. D.
B. (2008). Chemical composition and oxidative stability of Tunisian monovarietal virgin
olive oils with regard to fruit ripening. Food Chemistry, 109(4), 743-754.
Bakhouche, A., Lozano-Sánchez, J., Beltrán-Debón, R., Joven, J., Segura-Carretero, A.,
Fernández-Gutiérrez, A. (2013). Phenolic characterization and geographical classification

Revisión bibliográfica
64
of commercial Arbequina extra-virgin olive oils produced in southern Catalonia. Food
Research International, 50(1), 401-408.
Ballus, C. A., Meinhart, A. D., de Souza Campos, F. A., da Silva, L. F. D. O., de Oliveira, A. F.,
Godoy, H. T. (2014). A quantitative study on the phenolic compound, tocopherol and fatty
acid contents of monovarietal virgin olive oils produced in the southeast region of Brazil.
Food Research International, 62, 74-83.
Barbieri, S., Bendini, A., Valli, E., Toschi, T. G. (2015). Do consumers recognize the positive
sensorial attributes of extra virgin olive oils related with their composition? A case study
on conventional and organic products. Journal of Food Composition and Analysis, 44, 186-
195.
Barjol, J. (2013). Introduction. En: Handbook of Olive Oil (pp. 1-17). Springer US.
Barter, P. J., Caulfield, M., Eriksson, M., Grundy, S. M., Kastelein, J. J., Komajda, M., ...
Shear, C. L. (2007). Effects of torcetrapib in patients at high risk for coronary events. New
England Journal of Medicine, 357(21), 2109-2122.
Beltrán, G., Jiménez, A., del Rio, C., Sánchez, S., Martínez, L., Uceda, M., Aguilera, M. P.
(2010). Variability of vitamin E in virgin olive oil by agronomical and genetic factors.
Journal of Food Composition and Analysis, 23(6), 633-639.
Berenguer, M. J., Vossen, P. M., Grattan, S. R., Connell, J. H., Polito, V. S. (2006). Tree
irrigation levels for optimum chemical and sensory properties of olive oil. HortScience,
41(2), 427-432.
Bernardi, B., Benalia, S., Fazari, A., Zimbalatti, G., Stillitano, T., De Luca, A. I. (2016).
Mechanical harvesting in traditional olive orchards: Oli-picker case study. Agronomy
Research, 14(3), 683-688.
Borges, T. H., Cabrera-Vique, C., Seiquer, I. (2015). Antioxidant properties of chemical
extracts and bioaccessible fractions obtained from six Spanish monovarietal extra virgin
olive oils: Assays in Caco-2 cells. Food & Function, 6(7), 2375-2383.
Borges, T. H., Malheiro, R., de Souza, A. M., Casal, S., Pereira, J. A. (2015). Microwave
heating induces changes in the physicochemical properties of baru (Dipteryx alata Vog.)
and soybean crude oils. European Journal of Lipid Science and Technology, 117(4), 503-
513.
Boskou, D., Blekas, G., Tsimidou, M. (2006). Olive oil composition. En: Olive oil: Chemistry
and Technology, 4. AOCS, Press.
Buckland, G., & Gonzalez, C. A. (2015). The role of olive oil in disease prevention: a focus on
the recent epidemiological evidence from cohort studies and dietary intervention trials.
British Journal of Nutrition, 113(S2), S94-S101.

Revisión bibliográfica
65
Buckland, G., Agudo, A., Travier, N., Huerta, J. M., Cirera, L., Tormo, M. J., ... & Barricarte,
A. (2011). Adherence to the Mediterranean diet reduces mortality in the Spanish cohort of
the European Prospective Investigation into Cancer and Nutrition (EPIC-Spain). British
Journal of Nutrition, 106(10), 1581-1591.
Capurso, C., Massaro, M., Scoditti, E., Vendemiale, G., Capurso, A. (2014). Vascular effects of
the Mediterranean diet part I: anti-hypertensive and anti-thrombotic effects. Vascular
Pharmacology, 63(3), 118-126.
Carbonell‐Capella, J. M., Buniowska, M., Barba, F. J., Esteve, M. J., Frígola, A. (2014).
Analytical methods for determining bioavailability and bioaccessibility of bioactive
compounds from fruits and vegetables: A review. Comprehensive Reviews in Food Science
and Food Safety, 13(2), 155-171.
Cárdeno, A., Magnusson, M. K., Strid, H., de La Lastra, C. A., Sánchez-Hidalgo, M., & Öhman,
L. (2014). The unsaponifiable fraction of extra virgin olive oil promotes apoptosis and
attenuates activation and homing properties of T cells from patients with inflammatory
bowel disease. Food Chemistry, 161, 353-360.
Carocho, M., Ferreira, I. C. (2013). A review on antioxidants, prooxidants and related
controversy: natural and synthetic compounds, screening and analysis methodologies and
future perspectives. Food and Chemical Toxicology, 51, 15-25.
Carrasco‐Pancorbo, A., Cerretani, L., Bendini, A., Segura‐Carretero, A., Gallina‐Toschi, T.,
Fernández‐Gutiérrez, A. (2005). Analytical determination of polyphenols in olive oils.
Journal of Separation Science, 28(9‐10), 837-858.
Caruso, G., Gucci, R., Urbani, S., Esposto, S., Taticchi, A., Di Maio, I., ... Servili, M. (2014).
Effect of different irrigation volumes during fruit development on quality of virgin olive oil
of cv. Frantoio. Agricultural Water Management, 134, 94-103.
Casas, R., Sacanella, E., Urpí-Sardà, M., Corella, D., Castañer, O., Lamuela-Raventos, R. M., ...
& Estruch, R. (2016). Long-Term Immunomodulatory Effects of a Mediterranean Diet in
Adults at High Risk of Cardiovascular Disease in the PREvención con DIeta MEDiterránea
(PREDIMED) Randomized Controlled Trial. The Journal of Nutrition, 146(9), 1684-1693.
Castañer, O., Covas, M. I., Khymenets, O., Nyyssonen, K., Konstantinidou, V., Zunft, H. F., ...
Fitó, M. (2012). Protection of LDL from oxidation by olive oil polyphenols is associated
with a downregulation of CD40-ligand expression and its downstream products in vivo in
humans. The American Journal of Clinical Nutrition, 95(5), 1238-1244.
Cecchi, T., Alfei, B. (2013). Volatile profiles of Italian monovarietal extra virgin olive oils via
HS-SPME–GC–MS: Newly identified compounds, flavors molecular markers, and terpenic
profile. Food Chemistry, 141(3), 2025-2035.

Revisión bibliográfica
66
Chiesi, C., Fernandez-Blanco, C., Cossignani, L., Font, G., Ruiz, M. J. (2015). Alternariol-
induced cytotoxicity in Caco-2 cells. Protective effect of the phenolic fraction from virgin
olive oil. Toxicon, 93, 103-111.
Cicerale, S., Lucas, L. J., Keast, R. S. J. (2012). Antimicrobial, antioxidant and anti-
inflammatory phenolic activities in extra virgin olive oil. Current Opinion in
Biotechnology, 23(2), 129-135.
Clodoveo, M. L. (2012). Malaxation: Influence on virgin olive oil quality. Past, present and
future–An overview. Trends in Food Science & Technology, 25(1), 13-23.
Colombo, M. L. (2010). An update on vitamin E, tocopherol and tocotrienol—perspectives.
Molecules, 15(4), 2103-2113.
Commission Regulation (ECC) (1991) Official Journal of the Commission of the European
Communities. Regulation n° 2658/91, L248, 5 Sept 1991.
Commission Regulation (ECC) (2013) Official Journal of the Commission of the European
Communities. Regulation n° 1348/13, L338/31, 17 Dec 2013.
Consejo Oleicola Internacional (COI) (2015) Trade standard applying to olive oils and olive-
pomace oils. COI/T.15/N°3, rev. 8, Feb 2015.
Consejo Oleícola Internacional (COI). (2017A). Cifras de aceite de oliva
<http://www.internationaloliveoil.org/estaticos/view/131-world-olive-oil-
figures?lang=es_ES>. Junio, 2017.
Consejo Oleícola Internacional (COI). (2017B). Precios en origen UE.
<http://www.internationaloliveoil.org/estaticos/view/133-eu-producer-prices>. Junio, 2017.
Consejo Oleícola Internacional (COI). (2017C). Balances de aceite de oliva.
<http://www.internationaloliveoil.org/estaticos/view/134-approved-balances> Junio, 2017.
Consejo Oleícola Internacional (COI). (2017D). Importaciones por países (Brasil)
<http://www.internationaloliveoil.org/estaticos/view/135-imports-by-selected-markets>.
Junio, 2017
Consejo Oleícola Internacional (COI). (2017E). Newsletter- Mercado oleicola.
<http://www.internationaloliveoil.org>. Septiembre, 2017.
Covas, M. I. (2007). Olive oil and the cardiovascular system. Pharmacological Research, 55(3),
175-186.
Covas, M. I., de la Torre, K., Farré-Albaladejo, M., Kaikkonen, J., Fitó, M., López-Sabater, C.,
... de la Torre, R. (2006). Postprandial LDL phenolic content and LDL oxidation are
modulated by olive oil phenolic compounds in humans. Free Radical Biology and
Medicine, 40(4), 608-616.

Revisión bibliográfica
67
Criado, M. N., Romero, M. P., Casanovas, M., Motilva, M. J. (2008). Pigment profile and
colour of monovarietal virgin olive oils from Arbequina cultivar obtained during two
consecutive crop seasons. Food Chemistry, 110(4), 873-880.
Dabbou, S., Brahmi, F., Selvaggini, R., Chehab, H., Dabbou, S., Taticchi, A., ... Hammami, M.
(2011). Contribution of irrigation and cultivars to volatile profile and sensory attributes of
selected virgin olive oils produced in Tunisia. International Journal of Food Science
Technology, 46(9), 1964-1976.
Dag, A., Ben‐David, E., Kerem, Z., Ben‐Gal, A., Erel, R., Basheer, L., Yermiyahu, U. (2009).
Olive oil composition as a function of nitrogen, phosphorus and potassium plant nutrition.
Journal of the Science of Food and Agriculture, 89(11), 1871-1878.
Dag, A., Kerem, Z., Yogev, N., Zipori, I., Lavee, S., Ben-David, E. (2011). Influence of time of
harvest and maturity index on olive oil yield and quality. Scientia Horticulturae, 127(3),
358-366.
De Oliveira da Silva, L. F., de Oliveira, A. F., Pio, R., Custódio Alves, T., Ruiz Zambon, C.
(2012). Variação na qualidade do azeite em cultivares de oliveira. Bragantia, 71(2).
Deiana, M., Corona, G., Incani, A., Loru, D., Rosa, A., Atzeri, A., ... Dessì, M. A. (2010).
Protective effect of simple phenols from extravirgin olive oil against lipid peroxidation in
intestinal Caco-2 cells. Food and Chemical Toxicology, 48(10), 3008-3016.
Delgado-Vargas, F., Jiménez, A. R., Paredes-López, O. (2000). Natural pigments: carotenoids,
anthocyanins, and betalains—characteristics, biosynthesis, processing, and stability.
Critical reviews in Food Science and Nutrition, 40(3), 173-289.
Di Giovacchino, L. (2013). En: Handbook of Olive Oil (pp. 57-96). Springer US.
Di Giovacchino, L., Costantini, N., Serraiocco, A., Surricchio, G., Basti, C. (2001). Natural
antioxidants and volatile compounds of virgin olive oils obtained by two or three‐phases
centrifugal decanters. European Journal of Lipid Science and Technology, 103(5), 279-
285.
Di Rosa, A. R., Leone, F., Cheli, F., Chiofalo, V. (2017). Fusion of electronic nose, electronic
tongue and computer vision for animal source food authentication and quality assessment–
A review. Journal of Food Engineering, 210, 62-75.
Dias, L. G., Fernandes, A., Veloso, A. C., Machado, A. A., Pereira, J. A., Peres, A. M. (2014).
Single-cultivar extra virgin olive oil classification using a potentiometric electronic tongue.
Food Chemistry, 160, 321-329.
Dimitrios, B. (2006). Sources of natural phenolic antioxidants. Trends in Food Science
Technology, 17(9), 505-512.
EFSA Panel on Dietetic Products Nutrition and Allergens, Scientific opinion on the
substantiation of health claims related to polyphenols in olive and protection of LDL

Revisión bibliográfica
68
particles from oxidative damage (ID 1333, 1638, 1639, 1696, 2865), maintenance of
normal blood HDL cholesterol concentrations (ID 1639), maintenance of normal blood
pressure (ID 3781), “anti-inflammatory properties” (ID 1882), “contributes to the upper
respiratory tract health” (ID 3468), “can help to maintain a normal function of
gastrointestinal tract”(3779), and “contributes to body defences against external agents”
(ID 3467) pursuant to Article 13(1) of Regulation (EC) No 1924/2006. EFSA J. 2011,
9,2033–2058.doi:10.2903/j.efsa.2011.2033.
Etcheverry, P., Grusak, M. A., Fleige, L. E. (2012). Application of in vitro bioaccessibility and
bioavailability methods for calcium, carotenoids, folate, iron, magnesium, polyphenols,
zinc, and vitamins B6, B12, D, and E. Frontiers in Physiology, 3.
Fadda, C., Del Caro, A., Sanguinetti, A. M., Urgeghe, P. P., Vacca, V., Arca, P. P., & Piga, A.
(2012). Changes during storage of quality parameters and in vitro antioxidant activity of
extra virgin monovarietal oils obtained with two extraction technologies. Food Chemistry,
134(3), 1542-1548.
FAO (2010) Fats and Fatty Acids in Human Nutrition. Report of an expert consultation.
Geneva, November 10-14, 2008.
Farhoosh, R. (2007). The effect of operational parameters of the Rancimat method on the
determination of the oxidative stability measures and shelf-life prediction of soybean oil.
Journal of the American Oil Chemists' Society, 84(3), 205-209.
Farhoosh, R., Niazmand, R., Rezaei, M., & Sarabi, M. (2008). Kinetic parameter determination
of vegetable oil oxidation under Rancimat test conditions. European Journal of Lipid
Science and Technology, 110(6), 587-592.
Farinelli, D., Tombesi, S. (2015). Performance and oil quality of ‘Arbequina’and four Italian
olive cultivars under super high density hedgerow planting system cultivated in central
Italy. Scientia Horticulturae, 192, 97-107.
Farzaneh, V., Carvalho, I. S. (2015). A review of the health benefit potentials of herbal plant
infusions and their mechanism of actions. Industrial Crops and Products, 65, 247-258.
Fernández-Escobar, R., Beltrán, G., Sánchez-Zamora, M. A., García-Novelo, J., Aguilera, M.
P., Uceda, M. (2006). Olive oil quality decreases with nitrogen over-fertilization.
HortScience, 41(1), 215-219.
Food and Drug Administration (FDA) Press Release P04-100.
<https://www.fda.gov/food/ingredientspackaginglabeling/labelingnutrition/ucm072963>
Agosto, 2017.
Franco, M. N., Galeano-Díaz, T., López, Ó., Fernández-Bolaños, J. G., Sánchez, J., De Miguel,
C., ... & Martín-Vertedor, D. (2014). Phenolic compounds and antioxidant capacity of
virgin olive oil. Food Chemistry, 163, 289-298.

Revisión bibliográfica
69
Gandul-Rojas, B., Cepero, M. R. L., Mínguez-Mosquera, M. I. (2000). Use of chlorophyll and
carotenoid pigment composition to determine authenticity of virgin olive oil. Journal of the
American Oil Chemists' Society, 77(8), 853-858.
Gandul-Rojas, B., Gallardo-Guerrero, L., Roca, M., Aparicio-Ruiz, R. (2013). Chromatographic
methodologies: compounds for olive oil color issues. En: Handbook of Olive Oil (pp. 219-
259). Springer US.
García, J. M., Yousfi, K. (2006). The postharvest of mill olives. Grasas y Aceites, 57(1), 16-24.
García-Gavilán, J. F., Bulló, M., Canudas, S., Martínez-González, M. A., Estruch, R., Giardina,
S., ... & Salas-Salvado, J. (2017). Extra virgin olive oil consumption reduces the risk of
osteoporotic fractures in the PREDIMED trial. Clinical Nutrition.
<https://doi.org/10.1016/j.clnu.2016.12.030>.
García-González, D. L., Romero, N., Aparicio, R. (2010). Comparative study of virgin olive oil
quality from single varieties cultivated in Chile and Spain. Journal of Agricultural and
Food Chemistry, 58(24), 12899-12905.
García-Martínez, O., Rivas, A., Ramos-Torrecillas, J., De Luna-Bertos, E., Ruiz, C. (2014).
The effect of olive oil on osteoporosis prevention. International Journal of Food Sciences
and Nutrition, 65(7), 834-840.
García-Moreno, P. J., Pérez-Gálvez, R., Guadix, A., Guadix, E. M. (2013). Influence of the
parameters of the Rancimat test on the determination of the oxidative stability index of cod
liver oil. LWT-Food Science and Technology, 51(1), 303-308.
Georgiadou, E. C., Goulas, V., Manganaris, G. A., Kalaitzis, P., Fotopoulos, V. (2015).
Temporal analysis reveals a key role for VTE5 in vitamin E biosynthesis in olive fruit
during on-tree development. Frontiers in Plant Science, 6.
Gille, L., Rosenau, T., Kozlov, A. V., & Gregor, W. (2008). Ubiquinone and tocopherol:
dissimilar siblings. Biochemical pharmacology, 76(3), 289-302.
Gómez-Caravaca, A.M., L. Cerretani, A. Bendini, A. Segura-Carretero, A. Fernandez-Gutierrez,
M. Del Carlo, D. Compagnone, and A. Cichelli. (2008). Effects of fly attack (Bactrocera
oleae) on the phenolic profile and selected chemical parameters of olive oil. Journal of
Agricultural and Food Chemistry, 56, 4577-4583.
Gómez-Rico, A., Fregapane, G., Salvador, M. D. (2008). Effect of cultivar and ripening on
minor components in Spanish olive fruits and their corresponding virgin olive oils. Food
Research International, 41(4), 433-440.
Gonzales, G. B., Van Camp, J., Vissenaekens, H., Raes, K., Smagghe, G., Grootaert, C. (2015).
Review on the Use of Cell Cultures to Study Metabolism, Transport, and Accumulation of
Flavonoids: From Mono‐Cultures to Co‐Culture Systems. Comprehensive Reviews in Food
Science and Food Safety, 14(6), 741-754.
Revisión bibliográfica
70
González-Santiago, M., Fonollá, J., & Lopez-Huertas, E. (2010). Human absorption of a
supplement containing purified hydroxytyrosol, a natural antioxidant from olive oil, and
evidence for its transient association with low-density lipoproteins. Pharmacological
research, 61(4), 364-370.
Governo do Estado do Rio Grande do Sul (2017)
<http://www.rs.gov.br/conteudo/255228/producao-de-azeitonas-no-rio-grande-do-sul-vem-
aumentando-a-cada-ano>.Septiembre, 2017.
Guasch-Ferré, M., Hu, F. B., Martínez-González, M. A., Fitó, M., Bulló, M., Estruch, R., Fiol,
M. (2014). Olive oil intake and risk of cardiovascular disease and mortality in the
PREDIMED Study. BMC Medicine, 12(1), 78.
Hbaieb, R. H., Kotti, F., Cortes-Francisco, N., Caixach, J., Gargouri, M., Vichi, S. (2016B).
Ripening and storage conditions of Chétoui and Arbequina olives: Part II. Effect on olive
endogenous enzymes and virgin olive oil secoiridoid profile determined by high resolution
mass spectrometry. Food Chemistry, 210, 631-639.
Hbaieb, R. H., Kotti, F., Gargouri, M., Msallem, M., Vichi, S. (2016A). Ripening and storage
conditions of Chétoui and Arbequina olives: Part I. Effect on olive oils volatiles profile.
Food Chemistry, 203, 548-558.
Hernández, M. L., Padilla, M. N., Sicardo, M. D., Mancha, M., Martínez-Rivas, J. M. (2011).
Effect of different environmental stresses on the expression of oleate desaturase genes and
fatty acid composition in olive fruit. Phytochemistry, 72(2), 178-187.
Homrich, A. S., Theodoro, D. S., de Carvalho, M. M. (2017). PSS Creating Business for
Sustainability: The Brazilian Olive Oil Case in Mantiqueira Community. Procedia CIRP,
64, 405-410.
Huang, C. L., Sumpio, B. E. (2008). Olive oil, the mediterranean diet, and cardiovascular
health. Journal of the American College of Surgeons, 207(3), 407-416.
Ignat, I., Volf, I., Popa, V. I. (2011). A critical review of methods for characterisation of
polyphenolic compounds in fruits and vegetables. Food Chemistry, 126(4), 1821-1835.
Inarejos-García, A. M., Fregapane, G., Salvador, M. D. (2011). Effect of crushing on olive paste
and virgin olive oil minor components. European Food Research and Technology, 232(3),
441-451.
Incani, A., Serra, G., Atzeri, A., Melis, M. P., Serreli, G., Bandino, G., ... Deiana, M. (2016).
Extra virgin olive oil phenolic extracts counteract the pro-oxidant effect of dietary oxidized
lipids in human intestinal cells. Food and Chemical Toxicology, 90, 171-180.
Inglese, P., Famiani, F., Galvano, F., Servili, M., Esposto, S., Urbani, S. (2011). Factors
Affecting Extra-Virgin Olive Oil Composition. En: Horticultural Reviews, 38, 83.

Revisión bibliográfica
71
Jankowski, J., Korzeniowska, K., Cieślewicz, A., Jabłecka, A. (2016). Coenzyme Q10–A new
player in the treatment of heart failure?. Pharmacological Reports, 68(5), 1015-1019.
Jiménez, B., Carpio, A. (2008). La cata de aceites. Aceite de oliva virgen. Características
organolépticas y análisis sensorial. (pp. 32-75), Junta de Andalucía, Instituto de
Investigación y Formación Agraria y Pesquera, Sevilla.
Jiménez, B., Rivas, A., Lorenzo, M. L., & Sánchez-Ortiz, A. (2017). Chemosensory
characterization of virgin olive oils obtained from organic and conventional practices
during fruit ripening. Flavour and Fragrance Journal, 32(4), 294-304.
Jiménez, B., Sánchez-Ortiz, A., Lorenzo, M. L., Rivas, A. (2013). Influence of fruit ripening on
agronomic parameters, quality indices, sensory attributes and phenolic compounds of
Picudo olive oils. Food Research International, 54(2), 1860-1867.
Kalogeropoulos, N., Tsimidou, M. Z. (2014). Antioxidants in Greek virgin olive oils.
Antioxidants, 3(2), 387-413.
Kalua, C. M., Allen, M. S., Bedgood, D. R., Bishop, A. G., Prenzler, P. D., Robards, K. (2007).
Olive oil volatile compounds, flavour development and quality: A critical review. Food
Chemistry, 100(1), 273-286.
Kalua, C. M., Bedgood, D. R., Bishop, A. G., Prenzler, P. D. (2006). Changes in volatile and
phenolic compounds with malaxation time and temperature during virgin olive oil
production. Journal of Agricultural and Food Chemistry, 54(20), 7641-7651.
Kapellakis, I. E., Tsagarakis, K. P., Crowther, J. C. (2008). Olive oil history, production and by-
product management. Reviews in Environmental Science and Biotechnology, 7(1), 1-26.
Keys, A. (1970). Coronary heart disease in seven countries. Circulation, 41(1), 186-195.
León-Camacho, M., Morales, M. T., Aparicio, R. (2013). Chromatographic methodologies:
compounds for olive oil traceability issues. En: Handbook of Olive Oil (pp. 163-217).
Springer US.
Lopez, S., Bermudez, B., Montserrat-de la Paz, S., Jaramillo, S., Varela, L. M., Ortega-Gomez,
A.,. Muriana, F. J. (2014). Membrane composition and dynamics: a target of bioactive
virgin olive oil constituents. Biochimica et Biophysica Acta (BBA)-Biomembranes,
1838(6), 1638-1656.
Lopez-Huertas, E., & Fonolla, J. (2017). Hydroxytyrosol supplementation increases vitamin C
levels in vivo. A human volunteer trial. Redox biology, 11, 384-389.
Lozano-Sánchez, J., Cerretani, L., Bendini, A., Segura-Carretero, A., Fernández-Gutiérrez, A.
(2010). Filtration process of extra virgin olive oil: effect on minor components, oxidative
stability and sensorial and physicochemical characteristics. Trends in Food Science
Technology, 21(4), 201-211.

Revisión bibliográfica
72
Luna, G., Aparicio, R. (2002). Characterisation of monovarietal virgin olive oils. European
Journal of Lipid Science and Technology 104, 614-627.
Mailer, R. J., Ayton, J., Graham, K. (2010). The influence of growing region, cultivar and
harvest timing on the diversity of Australian olive oil. Journal of the American Oil
Chemists' Society, 87(8), 877-884.
Malheiro, R., Casal, S., Cunha, S. C., Baptista, P., Pereira, J. A. (2015). Olive volatiles from
Portuguese cultivars Cobrançosa, Madural and Verdeal Transmontana: role in oviposition
preference of Bactrocera oleae (Rossi) (Diptera: Tephritidae). PloS one, 10(5), e0125070.
Martín‐Peláez, S., Covas, M. I., Fitó, M., Kušar, A., Pravst, I. (2013). Health effects of olive oil
polyphenols: recent advances and possibilities for the use of health claims. Molecular
Nutrition Food Research, 57(5), 760-771.
Mataix, J. (2001). Aceite de oliva virgen: nuestro patrimonio alimentario. Universidad de
Granada-Puleva Food, Granada.
Medina‐Remón, A., Casas, R., Tressserra‐Rimbau, A., Ros, E., Martínez‐González, M. A., Fitó,
M., ... & Estruch, R. (2017). Polyphenol intake from a Mediterranean diet decreases
inflammatory biomarkers related to atherosclerosis: a substudy of the PREDIMED trial.
British Journal of Clinical Pharmacology, 83(1), 114-128.
Meléndez-Martínez, A. J., Britton, G., Vicario, I. M., Heredia, F. J. (2007). Relationship
between the colour and the chemical structure of carotenoid pigments. Food Chemistry,
101(3), 1145-1150.
Minekus, M., Alminger, M., Alvito, P., Ballance, S., Bohn, T. O. R. S. T. E. N., Bourlieu, C., ...
Dufour, C. (2014). A standardised static in vitro digestion method suitable for food–an
international consensus. Food & Function, 5(6), 1113-1124.
Mitjavila, M.T., Moreno, J.J. (2010). Olive Oil Components on Oxidative Stress and
Arachidonic Acid Metabolism. En: Olives and olive oil in health and disease prevention.
Preedy, V. R., Watson, R. R. (Eds.). Academic press.
Morales, M. T., Luna, G., Aparicio, R. (2005). Comparative study of virgin olive oil sensory
defects. Food Chemistry, 91(2), 293-301.
Morelló, J. R., Motilva, M. J., Ramo, T., Romero, M. P. (2003). Effect of freeze injuries in
olive fruit on virgin olive oil composition. Food Chemistry, 81(4), 547-553.
Morelló, J. R., Motilva, M. J., Tovar, M. J., Romero, M. P. (2004A). Changes in commercial
virgin olive oil (cv Arbequina) during storage, with special emphasis on the phenolic
fraction. Food Chemistry, 85(3), 357-364.
Morelló, J. R., Romero, M. P., Motilva, M. J. (2004B). Effect of the maturation process of the
olive fruit on the phenolic fraction of drupes and oils from Arbequina, Farga, and Morrut
cultivars. Journal of Agricultural and Food Chemistry, 52(19), 6002-6009.

Revisión bibliográfica
73
Moyano, M. J., Heredia, F. J., Meléndez‐Martínez, A. J. (2010). The color of olive oils: the
pigments and their likely health benefits and visual and instrumental methods of analysis.
Comprehensive Reviews in Food Science and Food Safety, 9(3), 278-291.
Moyano, M. J., Meléndez-Martínez, A. J., Alba, J., Heredia, F. J. (2008). A comprehensive
study on the colour of virgin olive oils and its relationship with their chlorophylls and
carotenoids indexes (II): CIELUV and CIELAB uniform colour spaces. Food Research
International, 41(5), 513-521.
Munné-Bosch, S., Alegre, L. (2002). The function of tocopherols and tocotrienols in plants.
Critical Reviews in Plant Sciences, 21(1), 31-57.
Ninfali, P., Bacchiocca, M., Biagiotti, E., Esposto, S., Servili, M., Rosati, A., Montedoro, G.
(2008). A 3-year study on quality, nutritional and organoleptic evaluation of organic and
conventional extra-virgin olive oils. Journal of the American Oil Chemists' Society, 85(2),
151-158.
Olimerca (2017). <http://www.olimerca.com/noticiadet/el-olivar-andaluz-crece-en-mas-de-
80000-hectareas-en-diez-anos/7c26cd1b43490a0920f7d0cd48b7d150>. Septiembre, 2017.
Olive Oil Times (2017). Brazil Looks for Its Own Olive. <https://www.oliveoiltimes.com/olive-
oil-business/brazil-looks-olive/55413>. Junio, 2017.
Oliveri, P., Baldo, M. A., Daniele, S., Forina, M. (2009). Development of a voltammetric
electronic tongue for discrimination of edible oils. Analytical and Bioanalytical Chemistry,
395(4), 1135-1143.
Oroian, M., & Escriche, I. (2015). Antioxidants: characterization, natural sources, extraction
and analysis. Food Research International, 74, 10-36.
Pastoriza, S., Delgado-Andrade, C., Haro, A., Rufián-Henares, J. A. (2011). A physiologic
approach to test the global antioxidant response of foods. The GAR method. Food
Chemistry, 129(4), 1926-1932.
Pereira, J. A., Alves, M. R., Casal, S., Oliveira, M. B. P. P. (2004). Effect of olive fruit fly
infestation on the quality of olive oil from cultivars Cobrançosa, Madural and Verdeal
Transmontana.Italian Journal of Food Science, 16(3), 355-365.
Peres, F., Martins, L. L., Ferreira‐Dias, S. (2014). Laboratory‐scale optimization of olive oil
extraction: Simultaneous addition of enzymes and microtalc improves the yield. European
Journal of Lipid Science and Technology, 116(8), 1054-1062.
Pravst, I., Zmitek, K., Zmitek, J. (2010). Coenzyme Q10 contents in foods and fortification
strategies. Critical Reviews in Food Science and Nutrition, 50(4), 269-280.
Psaltopoulou, T., Kosti, R. I., Haidopoulos, D., Dimopoulos, M., Panagiotakos, D. B. (2011).
Olive oil intake is inversely related to cancer prevalence: a systematic review and a meta-

Revisión bibliográfica
74
analysis of 13800 patients and 23340 controls in 19 observational studies. Lipids in Health
and Disease, 10(1), 1-16.
Psomiadou, E., Tsimidou, M. (2001). Pigments in Greek virgin olive oils: occurrence and
levels. Journal of the Science of Food and Agriculture, 81(7), 640-647.
Psomiadou, E., Tsimidou, M., Boskou, D. (2000). α-Tocopherol content of Greek virgin olive
oils. Journal of Agricultural and Food Chemistry, 48(5), 1770-1775.
Pyo, Y. H. (2010). Coenzyme Q 10 and Q 9 contents in 6 commercial vegetable oils and their
average daily intakes in Korea. Food Science and Biotechnology, 19(3), 837-841.
Raffo, A., Bucci, R., D’Aloise, A., Pastore, G. (2015). Combined effects of reduced malaxation
oxygen levels and storage time on extra-virgin olive oil volatiles investigated by a novel
chemometric approach. Food Chemistry, 182, 257-267
Ranalli, A., Tombesi, A., Ferrante, M. L., De Mattia, G. (1998). Respiratory rate of olive drupes
during their ripening cycle and quality of oil extracted. Journal of the Science of Food and
Agriculture, 77(3), 359-367.
Reboredo-Rodríguez, P., González-Barreiro, C., Cancho-Grande, B., Simal-Gándara, J. (2014).
Improvements in the malaxation process to enhance the aroma quality of extra virgin olive
oils. Food Chemistry, 158, 534-545.
Reboredo-Rodríguez, P., González-Barreiro, C., Cancho-Grande, B., Fregapane, G., Salvador,
M. D., Simal-Gándara, J. (2015). Characterisation of extra virgin olive oils from Galician
autochthonous varieties and their co-crushings with Arbequina and Picual cv. Food
Chemistry, 176, 493-503.
Reboredo‐Rodríguez, P., Valli, E., Bendini, A., Di Lecce, G., Simal‐Gándara, J., Gallina
Toschi, T. (2016). A widely used spectrophotometric assay to quantify olive oil biophenols
according to the health claim (EU Reg. 432/2012). European Journal of Lipid Science and
Technology, 118(10), 1593-1599.
Rodrigues, N., Dias, L. G., Veloso, A. C., Pereira, J. A., & Peres, A. M. (2016). Monitoring
olive oils quality and oxidative resistance during storage using an electronic tongue. LWT-
Food Science and Technology, 73, 683-692.
Rodríguez-Morató, J., Xicota, L., Fito, M., Farre, M., Dierssen, M., de la Torre, R. (2015).
Potential role of olive oil phenolic compounds in the prevention of neurodegenerative
diseases. Molecules, 20(3), 4655-4680.
Rodríguez-Ramiro, I., Martín, M. Á., Ramos, S., Bravo, L., Goya, L. (2011). Olive oil
hydroxytyrosol reduces toxicity evoked by acrylamide in human Caco-2 cells by
preventing oxidative stress. Toxicology, 288(1), 43-48.
Romero, N., Saavedra, J., Tapia, F., Sepúlveda, B., Aparicio, R. (2016). Influence of
agroclimatic parameters on phenolic and volatile compounds of Chilean virgin olive oils

Revisión bibliográfica
75
and characterization based on geographical origin, cultivar and ripening stage. Journal of
the Science of Food and Agriculture, 96(2), 583-592.
Rondanini, D. P., Castro, D. N., Searles, P. S., Rousseaux, M. C. (2011). Fatty acid profiles of
varietal virgin olive oils (Olea europaea L.) from mature orchards in warm arid valleys of
Northwestern Argentina (La Rioja). Grasas y Aceites, 62(4), 399-409.
Rubió, L., Macià, A., Castell-Auví, A., Pinent, M., Blay, M. T., Ardévol, A., ... Motilva, M. J.
(2014). Effect of the co-occurring olive oil and thyme extracts on the phenolic
bioaccesibility and bioavailability assessed by in vitro digestion and cell models. Food
Chemistry, 149, 277-284.
Salvador, M. D., Aranda, F., Fregapane, G. (2001). Influence of fruit ripening on
‘Cornicabra’virgin olive oil quality A study of four successive crop seasons. Food
Chemistry, 73(1), 45-53.
Sánchez, C. S., González, A. T., García-Parrilla, M. C., Granados, J. Q., De La Serrana, H. L.
G., & Martínez, M. L. (2007). Different radical scavenging tests in virgin olive oil and their
relation to the total phenol content. Analytica Chimica Acta, 593(1), 103-107.
Santangelo, C., Filesi, C., Varì, R., Scazzocchio, B., Filardi, T., Fogliano, V., ... Masella, R.
(2016). Consumption of extra-virgin olive oil rich in phenolic compounds improves
metabolic control in patients with type 2 diabetes mellitus: a possible involvement of
reduced levels of circulating visfatin. Journal of Endocrinological Investigation, 39(11),
1295-1301.
Scoditti, E., Capurso, C., Capurso, A., Massaro, M. (2014). Vascular effects of the
Mediterranean diet-Part II: Role of omega-3 fatty acids and olive oil polyphenols. Vascular
Pharmacology, 63(3), 127-134.
Secretaria da agricultura, pecuária e irrigação do Estado do Rio grande do sul (SEAPI) (2017).
<http://www.agricultura.rs.gov.br/pro-oliva>. Sept. 2017.
Seiquer, I., Aspe, T., Vaquero, P., & Navarro, P. (2001). Effects of heat treatment of casein in
the presence of reducing sugars on calcium bioavailability: in vitro and in vivo assays.
Journal of Agricultural and Food Chemistry, 49(2), 1049-1055.
Seiquer, I., Rueda, A., Olalla, M., Cabrera-Vique, C. (2015). Assessing the bioavailability of
polyphenols and antioxidant properties of extra virgin argan oil by simulated digestion and
Caco-2 cell assays. Comparative study with extra virgin olive oil. Food Chemistry, 188,
496-503.
Servili, M., Selvaggini, R., Esposto, S., Taticchi, A., Montedoro, G., Morozzi, G. (2004). Health
and sensory properties of virgin olive oil hydrophilic phenols: agronomic and technological
aspects of production that affect their occurrence in the oil. Journal of Chromatography A,
1054(1), 113-127.

Revisión bibliográfica
76
Servili, M., Sordini, B., Esposto, S., Urbani, S., Veneziani, G., Di Maio, I., ... Taticchi, A.
(2014). Biological activities of phenolic compounds of extra virgin olive oil. Antioxidants,
3(1), 1-23.
Servili, M., Taticchi, A., Esposto, S., Urbani, S., Selvaggini, R., Montedoro, G. (2008).
Influence of the decrease in oxygen during malaxation of olive paste on the composition of
volatiles and phenolic compounds in virgin olive oil. Journal of Agricultural and Food
Chemistry, 56(21), 10048-10055.
Servili, M., Taticchi, A., Esposto, S., Urbani, S., Selvaggini, R., Montedoro, G. (2007). Effect
of olive stoning on the volatile and phenolic composition of virgin olive oil. Journal of
Agricultural and Food chemistry, 55(17), 7028-7035.
Shahidi, F., Zhong, Y. (2010). Lipid oxidation and improving the oxidative stability. Chemical
Society Reviews, 39(11), 4067-4079.
Simopoulos, A. P. (2016). An increase in the omega-6/omega-3 fatty acid ratio increases the
risk for obesity. Nutrients, 8(3), 128.
Sindhi, V., Gupta, V., Sharma, K., Bhatnagar, S., Kumari, R., Dhaka, N. (2013). Potential
applications of antioxidants–A review. Journal of Pharmacy Research, 7(9), 828-835.
Sinesio, F., Moneta, E., Raffo, A., Lucchetti, S., Peparaio, M., D'Aloise, A., Pastore, G. (2015).
Effect of extraction conditions and storage time on the sensory profile of monovarietal
extra virgin olive oil (cv Carboncella) and chemical drivers of sensory changes. LWT-Food
Science and Technology, 63(1), 281-288.
Slim, S., Rodrigues, N., Dias, L. G., Veloso, A. C., Pereira, J. A., Oueslati, S., & Peres, A. M.
(2017). Application of an electronic tongue for Tunisian olive oils’ classification according
to olive cultivar or physicochemical parameters. European Food Research and Technology,
1-12.
Sola-Guirado, R. R., Castro-García, S., Blanco-Roldán, G. L., Jiménez-Jiménez, F., Castillo-
Ruiz, F. J., Gil-Ribes, J. A. (2014). Traditional olive tree response to oil olive harvesting
technologies. Biosystems Engineering, 118, 186-193.
Soler, A., Romero, M. P., Macià, A., Saha, S., Furniss, C. S., Kroon, P. A., Motilva, M. J.
(2010). Digestion stability and evaluation of the metabolism and transport of olive oil
phenols in the human small-intestinal epithelial Caco-2/TC7 cell line. Food Chemistry,
119(2), 703-714.
Stark, A. H., Madar, P. Z. (2002). Olive oil as a functional food: epidemiology and nutritional
approaches. Nutrition reviews, 60(6), 170-176.
Stefanoudaki, E., Williams, M., Chartzoulakis, K., Harwood, J. (2009). Effect of irrigation on
quality attributes of olive oil. Journal of Agricultural and Food Chemistry, 57(15), 7048-
7055.

Revisión bibliográfica
77
Talhaoui, N., Gómez-Caravaca, A. M., León, L., De la Rosa, R., Fernández-Gutiérrez, A.,
Segura-Carretero, A. (2016). From olive fruits to olive oil: Phenolic compound transfer in
six different olive cultivars grown under the same agronomical conditions. International
Journal of Molecular Sciences, 17(3), 1-14.
Tanaka, Y., Sasaki, N., Ohmiya, A. (2008). Biosynthesis of plant pigments: anthocyanins,
betalains and carotenoids. The Plant Journal, 54(4), 733-749.
Thanatuksorn, P., Kawai, K., Hayakawa, M., Hayashi, M., Kajiwara, K. (2009). Improvement
of the oral bioavailability of coenzyme Q 10 by emulsification with fats and emulsifiers
used in the food industry. LWT-Food Science and Technology, 42(1), 385-390.
Toledo, E., Salas-Salvadó, J., Donat-Vargas, C., Buil-Cosiales, P., Estruch, R., Ros, E., ... &
Gómez-Gracia, E. (2015). Mediterranean diet and invasive breast cancer risk among
women at high cardiovascular risk in the PREDIMED trial: a randomized clinical trial.
JAMA internal medicine, 175(11), 1752-1760.
Torres, M. M., Pierantozzi, P., Cáceres, M. E., Labombarda, P., Fontanazza, G., Maestri, D. M.
(2009). Genetic and chemical assessment of Arbequina olive cultivar grown in Córdoba
province, Argentina. Journal of the Science of Food and Agriculture, 89(3), 523-530.
Tous, J., Romero, A., Plana, J., Guerrero, L., Díaz, I., Hermoso, J. F. (1997). Características
químico-sensoriales de los aceites de oliva «Arbequina» obtenidos en distintas zonas de
España. Grasas y aceites, 48(6), 415-424.
Tovar, M. J., Motilva, M. J., Romero, M. P. (2001). Changes in the phenolic composition of
virgin olive oil from young trees (Olea europaea L. cv. Arbequina) grown under linear
irrigation strategies. Journal of Agricultural and Food Chemistry, 49(11), 5502-5508.
Tovar, M. J., Romero, M. P., Alegre, S., Girona, J., Motilva, M. J. (2002). Composition and
organoleptic characteristics of oil from Arbequina olive (Olea europaea L) trees under
deficit irrigation. Journal of the Science of Food and Agriculture, 82(15), 1755-1763.
Trichopoulou, A., Georgiou, E., Bassiakos, Y., Lipworth, L., Lagiou, P., Proukakis, C.,
Trichopoulos, D. (1997). Energy intake and monounsaturated fat in relation to bone
mineral density among women and men in Greece. Preventive medicine, 26(3), 395-400.
Turunen, M., Olsson, J., Dallner, G. (2004). Metabolism and function of coenzyme Q.
Biochimica et Biophysica Acta (BBA)-Biomembranes, 1660(1), 171-199.
Uluata, S., Altuntaş, Ü., & Özçelik, B. (2016). Biochemical Characterization of Arbequina
Extra Virgin Olive Oil Produced in Turkey. Journal of the American Oil Chemists' Society,
93(5), 617-626.
United States Department of Agriculture (USDA) (2010) Standards for grades of olive oil and
olive-pomace oil. Fed Regist 75(81):22363-22366.

Revisión bibliográfica
78
United States Department of Agriculture (USDA) (2017).
<https://www.fas.usda.gov/data/oilseeds-world-markets-and-trade>. Junio, 2017
Venegas, C., Cabrera-Vique, C., García-Corzo, L., Escames, G., Acuña-Castroviejo, D., López,
L. C. (2011). Determination of coenzyme Q10, coenzyme Q9, and melatonin contents in
virgin argan oils: Comparison with other edible vegetable oils. Journal of Agricultural and
Food Chemistry, 59(22), 12102-12108.
Visioli, F., Caruso, D., Plasmati, E., Patelli, R., Mulinacci, N., Romani, A., ... Galli, C. (2001).
Hydroxytyrosol, as a component of olive mill waste water, is dose-dependently absorbed
and increases the antioxidant capacity of rat plasma. Free Radical Research, 34(3), 301-
305.
Vossen, P. (2007). Olive oil: history, production, and characteristics of the world's classic oils.
HortScience, 42(5), 1093-1100.
Vossen, P. (2013). Growing Olives for Oil. En: Handbook of Olive Oil (pp. 19-56). Springer
US.
Yousfi, K., Weiland, C. M., Garcıa, J. M. (2012). Effect of harvesting system and fruit cold
storage on virgin olive oil chemical composition and quality of superintensive cultivated
‘Arbequina’olives. Journal of Agricultural and Food Chemistry, 60(18), 4743-4750.
Zmitek, K., Rodríguez Aguilera, J. C., Pravst, I. (2014). Factors influencing the contents of
coenzyme Q10 and Q9 in olive oils. Journal of Agricultural and Food Chemistry, 62(14),
3211-3216.

79
CAPÍTULO 3 Material y Métodos

80

Material y Métodos
81
CAPÍTULO 3 Material y Métodos
3.1. Muestra
Todas las muestras de aceite evaluadas en la presente memoria corresponden a AOVE
de la variedad Arbequina.
Se seleccionaron diferentes zonas geográficas de España (Granada, Jaén, Málaga,
Cádiz, Sevilla, Albacete, Toledo, Valladolid y Lérida) y dos regiones productoras de
Brasil (Rio Grande do Sul y Minas Gerais). En la Figura 28 se muestra la localización
de las zonas productoras en España y Brasil y la Tabla 3 recoge la información sobre
las coordenadas geográficas, la altitud y algunas características climáticas, como nivel
de precipitaciones y temperatura. Los datos climáticos se refieren a la media anual del
año de producción, asimismo aportamos los datos de temperatura media mínima y
máxima. Los datos han sido obtenidos de la Agencia Española de meteorología (Aemet,
2015) y el Instituto de meteorología de Brasil (INMET, 2015). Los datos de
coordenadas geográficas se refieren al punto de la zona de producción (latitud, longitud
and altitud) obtenidos con el programa Google Earth (Google Inc, USA).
Los aceites fueron donados directamente por los productores, y desde estas páginas
queremos expresar nuestro agradecimiento al Consejo Regulador de Denominación de
Origen Estepa, la Denominación de Origen Protegida Les Garrigues, Casas Hualdo,
Castillo Canena, Cortijo de Jara, Quaryat Dillar, EPAMIG y a Olivas do Sul.
Se obtuvieron 3 muestras de cada una de las zonas productoras, todas correspondientes
a aceites de las primeras etapas de la cosecha y obtenidos mediante el sistema de
extracción de dos fases. Las muestras españolas fueron obtenidas entre Octubre y
Noviembre de 2014, mientras las muestras brasileñas lo fueron entre Marzo y Abril de
2015. Los aceites fueron enviados a los laboratorios del Departamento de Fisiología y
Bioquímica de la Nutrición Animal de la Estación Experimental del Zaidín-CSIC
(Granada, España), donde fueron almacenados en frascos de vidrio de topacio
adecuadamente para preservarlos de la luz y las altas temperaturas en refrigeración a
4°C y para preservar mejor las muestras fue inyectado nitrógeno en los frascos, las
muestras han permanecido en estas condiciones hasta la realización de los análisis.
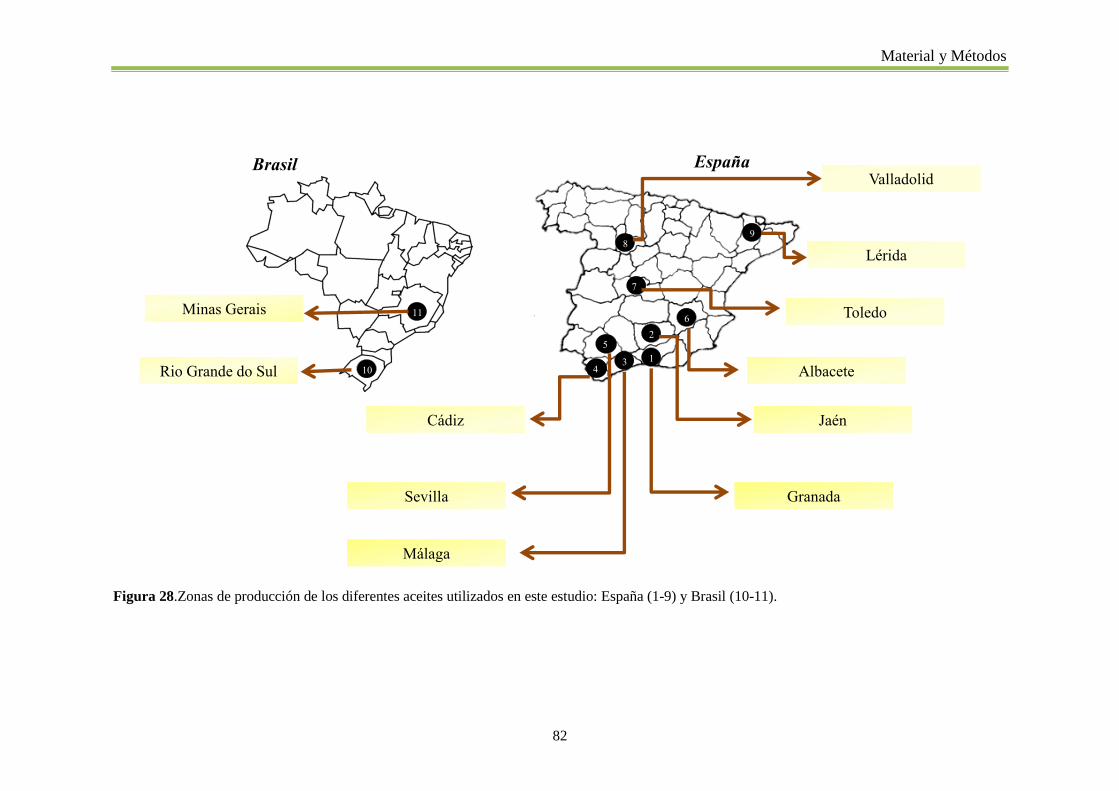
Material y Métodos
82
Rio Grande do Sul
Minas Gerais 11
10 4
52
13
98
6
7
Brasil España
Lérida
Albacete
Valladolid
Toledo
Jaén
Granada
Málaga
Sevilla
Cádiz
Figura 28.Zonas de producción de los diferentes aceites utilizados en este estudio: España (1-9) y Brasil (10-11).

Material y Métodos
83
Tabla 3. Coordenadas geográficas (latitud y longitud), altitud (m), temperatura media anual (°C), precipitaciones (mm) y temperatura media mínima y
máxima anual de las diferentes zonas de producción de los aceites de España (1-9) y Brasil (10-11).
Muestra Latitud Longitud Altitud Temperatura media Precipitaciones Temperatura
mínima
Temperatura
máxima
1 37� 03ʾ N 3� 36ʾ W 905 17 385 7 26
2 38� 03ʾ N 3� 29ʾ W 580 17 422 9 26
3 37� 06ʾ N 4� 22ʾ W 883 20 411 13 27
4 36� 43ʾ N 6� 01ʾ W 47 19 636 13 24
5 37� 17ʾ N 4� 53ʾ W 416 19 598 11 27
6 39� 00ʾ N 1� 54ʾ W 677 13 293 6 25
7 39� 53ʾ N 4� 28ʾ W 459 14 391 7 26
8 41� 53ʾ N 5� 00ʾ. W 845 13 394 -1 27
9 41� 36ʾ N 0� 35ʾ W 168 14 677 6 21
10 30� 00ʾ S 52� 52ʾ W 88 16 1691 3 22
11 22� 18ʾ S 42� 22ʾW 1310 17 1330 14 21

Material y Métodos
84
3.2. Determinaciones analíticas
Las determinaciones analíticas realizadas en la presente memoria de tesis doctoral son
descritas a la continuación.
En la Figura 28 se muestra un esquema de las determinaciones analíticas realizadas en
las muestras de aceite. A continuación, se exponen de manera resumida los métodos y
las técnicas analíticas utilizadas para cada una de las determinaciones realizadas, que
son explicadas con más detalle en las correspondientes publicaciones que se incluyen en
la presente memoria.
3.2.1. Parámetros de calidad y físico-químicos
Acidez e índice de peróxidos: por titulación de acuerdo con los métodos
estandarizados por la Unión Europea y recogidos en el reglamento (CEE) n° 2568/91.
Coeficiente de extinción específica en el UV: por espectrofotometría de acuerdo con
el reglamento (CEE) n° 2568/91.
Estabilidad oxidativa: determinado por la estimación del tiempo de inducción a la
oxidación utilizando el aparato Rancimat 743.
Color: las coordenadas de color CIELAB (L*, a*, b*) fueron determinados por
medida directa empleando un colorímetro Minolta (CR-400, Konica., Japón).
3.2.2. Composición
Pigmentos: los pigmentos (clorofilas y carotenoides) fueron determinados por
espectrofotometría según el método descrito por Minguez-Mosquera y col. (1991).
Perfil de ácidos grasos: se determinó según el reglamento europeo (Anexos II y IX,
CEE nº 2568/91), tras la obtención de los ésteres metílicos de los AG con solución
metanólica de hidróxido potásico, y fueron evaluados mediante cromatografía de
gases.
Tocoferoles: determinados por HPLC (cromatografía liquida de alta resolución) de
acuerdo en método descrito por Rueda y col. (2016).
Compuestos fenólicos: esta fracción individual minoritaria fue obtenida por
extracción metanol: agua (80:20v/v) (COI, 2009) y los extractos fueron analizados por
UPLC (cromatografía liquida de ultra alta resolución) según Rivas y col., (2013).

Material y Métodos
85
Coenzima Q10: los extractos fueron obtenidos de acuerdo con Venegas et al. (2011)
y evaluados por HPLC.
3.2.3. Caracterización organoléptica
Análisis sensorial: realizada según los parámetros establecidos en el reglamento
(CEE) n⁰ 1348/13 por el panel de cata oficial del laboratorio Agroalimentario de
Granada (Atarfe, Granada, España).
Compuestos volátiles: los volátiles fueron extraídos por la técnica de espacio de
cabeza empleando la microextracción en fase sólida (HS-SPME) y la fracción volátil
fue determinada por cromatografía de gases masa (GC-MS) con técnica desarrollada
durante la presente tesis doctoral.
Lengua electrónica: fueron obtenidos extractos etanólicos que posteriormente fueron
analizados empleando una lengua electrónica que es formada por diferentes sensores
electroquímicos capaces de identificar las especies químicas presentes en las muestras,
de acuerdo con la metodología descrita por Días y col., (2014).
3.1.4. Propiedades antioxidantes
La actividad antioxidante se determinó, por una parte, en los extractos químicos de los
aceites y, por otra, en las fracciones residual y bioaccesible obtenidas tras la digestión in
vitro, con el objeto de estudiar el efecto del proceso digestivo sobre las propiedades
antioxidantes de los aceites (Figura 28). La fracción bioaccesible se utilizó, además,
para la realización de los experimentos en las células Caco-2. Dichos experimentos
consistieron en ensayos de absorción intestinal y en la evaluación de marcadores de
estrés oxidativo a nivel celular. En los ensayos de absorción se analizó la actividad
antioxidante absorbida a través de la monocapa de células tras la incubación con los
aceites y como marcadores de estrés se estudiaron los efectos sobre la integridad celular
y la generación de ROS. Estos dos últimos aspectos se analizaron en condiciones
basales y ante un estrés oxidativo inducido.
En paralelo a la determinación de la actividad antioxidante (llevada a cabo en los
extractos químicos, fracciones resultantes de la digestión in vitro y soluciones obtenidas
en los ensayos de absorción) se analizó también el contenido de polifenoles totales, por
la relación de dichos compuestos con las propiedades antioxidantes.

Material y Métodos
86
Extracción química: los extractos de los aceites fueron obtenidos con uso de
solución de metanol: agua (80:20 v/v), según Borges y col. (2015).
Digestión in vitro: La digestión gástrica e intestinal de las muestras se realizó
tratando de mimetizar las condiciones fisiológicas de temperatura, pHy oscilaciones
intestinales y empleando enzimas específicas para cada una de las etapas según se ha
descrito en Borges y col. (2015). Tras la digestión y centrifugación de las muestras, se
obtuvieron dos fracciones diferenciadas: residual (no soluble) y bioaccesible (soluble),
que se conservaron a -80°C y en atmósfera de nitrógeno hasta los posteriores análisis.
Actividad antioxidante: La actividad antioxidante de las muestras se evaluó
mediante su capacidad para neutralizar radicales libres (ensayos ABTS y DPPH) y la
determinación de su poder reductor (método FRAP). Se trata de reacciones coloreadas
cuya absorbancia final se leyó en un espectrofotómetro con lector de placas multipocillo
de acuerdo con la metodología descrita en Borges y col. (2015).
Polifenoles totales: Se utilizó el método de Folin – Ciocalteu de acuerdo con la
metodología descrita en Borges y col. (2015).
Ensayos en cultivos celulares (Caco-2): las células fueron adquiridas a la Colección
Europea de Cultivos Celulares (ECACC), a través del Banco de Células de la
Universidad de Granada (España) y durante el mantenimiento y la realización de
experimentos se mantuvieron en condiciones controladas de aire/CO2 (95:5), humedad
(90%) y temperatura (37°C). Se utilizó como medio base de cultivo el medio mínimo
esencial modificado de Dulbecco (DMEM).
Marcadores antioxidantes a nivel celular. La integridad celular fue evaluada por
espectrofotometría empleando el método MTT (reducción metabólica del Bromuro de
3-(4,5-dimetiltiazol-2-ilo)-2,5-difeniltetrazol), que cuantifica las células viables y
metabólicamente activas. La generación de ROS se cuantificó mediante la medida de
fluorescencia según el ensayo de la diclorofluorescina, descrito por Seiquer y col.
(2015).
a. Ensayos de absorción. Para los ensayos de absorción las células se sembraron en
placas bicamerales Transwell, y se aplicó la metodología desarrollada por nuestro
grupo (Seiquer y col. 2015). Este ensayo supone el último paso en el estudio de la

Material y Métodos
87
biodisponibilidad en condiciones ex vivo, ya que combina la digestión in vitro y la
absorción a través de células en cultivo de tipo intestinal

Material y Métodos
88
Muestras de aceite de oliva
Parámetros de calidad y físico-
químicos
•Acidez
•Peróxidos
•Coeficiente de extinción
•Estabilidad oxidativa
•Color
Composición
•Pigmentos
•Perfil de ácidos grasos
•Tocoferoles
•Compuestos fenólicos
•Coenzima Q10
Propiedades antioxidantes
Extracción química
Extracto químico
Digestión in vitro
Fracción residualFracción
bioaccesible
Caracterización organoléptica
•Análisis sensorial
•Volátiles
•Lengua electrónica
Ensayos en cultivos celulares (Caco-2)
Absorción de antioxidantesMarcadores
antioxidantes
(ROS, Viabilidad)
Actividad antioxidante
(ABTS, DPPH, FRAP)
Polifenoles totales
Figura 29. Esquema general de las determinaciones analíticas realizadas en las muestras de aceite.

Material y Métodos
89
Referencias
Aemet, 2015. Agencia Estatal de Meteorología (2015) Climate monitoring Spain.
www.aemet.es/en/serviciosclimaticos/www.aemet.es/en/serviciosclimaticos/vigilancia_cli
ma/resumenes?w=0>. Noviembre, 2015.
Borges, T. H., Cabrera-Vique, C., & Seiquer, I. (2015). Antioxidant properties of chemical
extracts and bioaccessible fractions obtained from six Spanish monovarietal extra virgin
olive oils: Assays in Caco-2 cells. Food & function, 6(7), 2375-2383.
Dias, L. G., Fernandes, A., Veloso, A. C., Machado, A. A., Pereira, J. A., & Peres, A. M.
(2014). Single-cultivar extra virgin olive oil classification using a potentiometric electronic
tongue. Food chemistry, 160, 321-329.
Commission Regulation (ECC) (1991) Official Journal of the Commission of the European
Communities. Regulation n° 2658/91, L248, 5 Sept 1991.
Commission Regulation (ECC) (2013) Official Journal of the Commission of the European
Communities. Regulation n° 1348/13, L338/31, 17 Dec 2013
INMET (2015). Instituto Nacional de Metereologia. www.inmet.gov.br/portal/. Noviembre,
2015.
Consejo Oleícola Internacional (COI), 2009. Document COI/T.20/DOC. 29. International Olive
Oil Council, Madrid.
Minguez-Mosquera, M. I., Rejano-Navarro, L., Gandul-Rojas, B., SanchezGomez, A. H., &
Garrido-Fernandez, J. (1991). Color-pigment correlation in virgin olive oil. Journal of the
American Oil Chemists Society, 68(5), 332-336.
Rivas, A., Sanchez‐ Ortiz, A., Jimenez, B., García‐ Moyano, J., & Lorenzo, M. L. (2013).
Phenolic acid content and sensory properties of two Spanish monovarietal virgin olive oils.
European Journal of Lipid Science and Technology, 115(6), 621-630.
Rueda, A., Samaniego-Sánchez, C., Olalla, M., Giménez, R., Cabrera-Vique, C., Seiquer, I., &
Lara, L. (2016). Combination of analytical and chemometric methods as a useful tool for
the characterization of extra virgin argan oil and other edible virgin oils. Role of
polyphenols and tocopherols. Journal of AOAC International, 99(2), 489-494.
Seiquer, I., Rueda, A., Olalla, M., & Cabrera-Vique, C. (2015). Assessing the bioavailability of
polyphenols and antioxidant properties of extra virgin argan oil by simulated digestion and
Caco-2 cell assays. Comparative study with extra virgin olive oil. Food chemistry, 188,
496-503.
Venegas, C., Cabrera-Vique, C., García-Corzo, L., Escames, G., Acuña-Castroviejo, D., &
López, L. C. (2011). Determination of coenzyme Q10, coenzyme Q9, and melatonin
contents in virgin argan oils: Comparison with other edible vegetable oils. Journal of
agricultural and food chemistry, 59(22), 12102-12108.

90

91
CAPÍTULO 4. Resultados

92

Resultados
93
CAPÍTULO 4. Resultados
Artículo 1
General Paper
Characterization of Arbequina virgin olive oils produced
in different regions of Brazil and Spain: Physicochemical
properties, oxidative stability and fatty acid profile
Thays H. Borges, José Alberto Pereira, Carmen Cabrera-Vique, Luis Lara, Adelson F.
Oliveira, Isabel Seiquer.
______________________________________________________________________
Food Chemistry, 2017, 215:454-462
Received 28 April 2016
Accepted 29 July 2016

94

Resultados
95
Characterization of Arbequina virgin olive oils produced in different regions of
Brazil and Spain: Physicochemical properties, oxidative stability and fatty acid
profile
Thays H. Borges a,b
, José Alberto Pereira c, Carmen Cabrera-Vique
b, Luis Lara
a,
Adelson F. Oliveira d, Isabel Seiquer
a,*
a Departamento de Fisiología y Bioquímica de la Nutrición Animal, Estación
Experimental del Zaidín, Consejo Superior de Investigaciones Científicas (CSIC),
Camino del Jueves, 18100 Armilla, Granada, Spain.
b Departamento de Nutrición y Bromatología, Facultad de Farmacia, Universidad de
Granada, Campus de Cartuja 18012 Granada, Spain.
c REQUIMTE-LAQV, School of Agriculture, Polytechnic Institute of Bragança,
Campus de Santa Apolónia, 5300-253 Bragança, Portugal.
dAgricultural and Livestock Research Corporation of the State of Minas Gerais
(EPAMIG), South of Minas Regional Unity, 37200-000 Lavras, MG, Brazil.
* Corresponding author: Isabel Seiquer, Departamento de Fisiología y Bioquímica de la
Nutrición Animal, Estación Experimental del Zaidín (CSIC), Camino del Jueves s/n,
18100 Armilla, Granada, Spain
Tlf. +34-958572757
Fax: +34-958572753
E-mail address: [email protected]

Resultados
96
Abstract
Production of virgin olive oil is beginning in Brazil. This paper analyzes the
characteristics of the EVOO Arbequina from Brazil in comparison with Spanish
Arbequina from different regions. Quality parameters, oxidative stability, pigments,
colour and fatty acid profile were assessed, and relationships with geographic and
climatic conditions were studied. All the samples presented good quality and met EU
standards for extra-virgin olive oil, but there were significant differences between
regions and countries for many of the parameters evaluated. Major differences between
Brazilian and Spanish samples were observed for free acidity and colour of the oils, as
well as minor variations in the fatty acid profile. The colour differences were related to
rainfall, whereas the fatty acid content was strongly influenced by altitude and
temperature. These results highlight the fact that geographic area and environmental
factors influence the characteristics of Arbequina oil and play an important role in
newly introduced cultivars.
Keywords: Arbequina, virgin olive oil, oxidative stability, colour coordinates, fatty
acids, Brazil, Spain, climatic conditions.

Resultados
97
1. Introduction
The olive oil production has extended in recent years beyond the Mediterranean
basin to non-traditional regions in the southern hemisphere (Rondanini, Castro, Searles,
& Rousseaux, 2014). As an example of this trend, olive cultivation is gradually being
introduced into Brazil, where small areas (around 500 ha) are currently being cultivated
in the south and southeast of the country, in the regions of Minas Gerais and Rio Grande
do Sul, respectively (Ballus et al., 2015). Nowadays, Brazil imports most of its olive oil
and the final price is relatively high, making it inaccessible to a large part of the
population (Ballus et al., 2014). Furthermore, in Brazil there is a risk of adulteration of
olive oil, which further hinders access to a safe, high-quality product with nutritional
benefits. Moreover, to date only very limited data have been reported about the quality
and the composition of Brazilian olive oils, and from different cultivars (Ballus et al.,
2014; Ballus et al., 2015).
The expansion of olive production requires the adaptation of cultivars to climate
characteristics (rainfall, temperature, humidity) associated with latitudes and altitudes
different from those corresponding to the olive autochthonous regions. In consequence,
the oil obtained from environments outside the Mediterranean Basin could differ in
quality and composition of those arising from traditional Mediterranean regions
(García-González & Aparicio, 2010; Rondanini et al., 2014; Romero, Saavaedra, Tapia,
Sepúlveda, & Aparicio, 2016). In addition to climate conditions and geographic area,
many other factors, such as cultivar, fruit ripeness and agricultural practices, may also
influence the composition and quality of olive oils (Bakhouche et al., 2013; Dabbou et
al., 2009, 2010; Rondanini, Castro, Searles, & Rousseaux, 2011; Torres, et al., 2009).
Among chemical parameters affecting the quality of olive oils, the fatty acid profile is
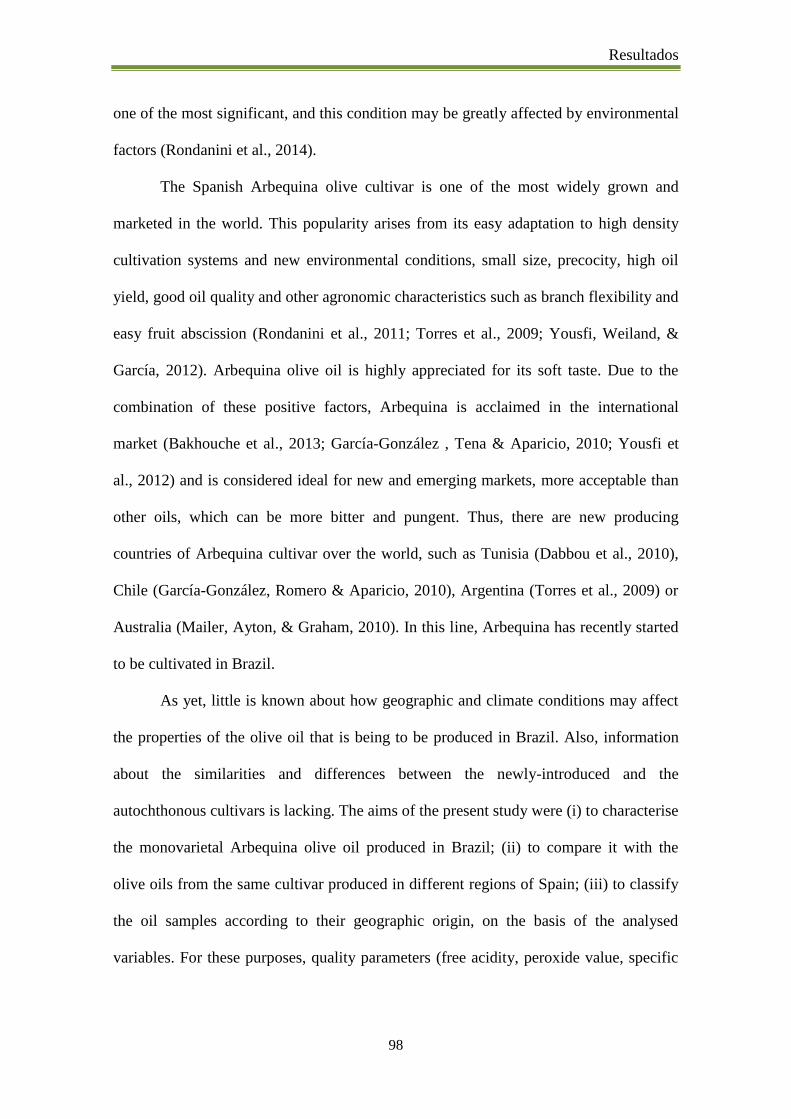
Resultados
98
one of the most significant, and this condition may be greatly affected by environmental
factors (Rondanini et al., 2014).
The Spanish Arbequina olive cultivar is one of the most widely grown and
marketed in the world. This popularity arises from its easy adaptation to high density
cultivation systems and new environmental conditions, small size, precocity, high oil
yield, good oil quality and other agronomic characteristics such as branch flexibility and
easy fruit abscission (Rondanini et al., 2011; Torres et al., 2009; Yousfi, Weiland, &
García, 2012). Arbequina olive oil is highly appreciated for its soft taste. Due to the
combination of these positive factors, Arbequina is acclaimed in the international
market (Bakhouche et al., 2013; García-González , Tena & Aparicio, 2010; Yousfi et
al., 2012) and is considered ideal for new and emerging markets, more acceptable than
other oils, which can be more bitter and pungent. Thus, there are new producing
countries of Arbequina cultivar over the world, such as Tunisia (Dabbou et al., 2010),
Chile (García-González, Romero & Aparicio, 2010), Argentina (Torres et al., 2009) or
Australia (Mailer, Ayton, & Graham, 2010). In this line, Arbequina has recently started
to be cultivated in Brazil.
As yet, little is known about how geographic and climate conditions may affect
the properties of the olive oil that is being to be produced in Brazil. Also, information
about the similarities and differences between the newly-introduced and the
autochthonous cultivars is lacking. The aims of the present study were (i) to characterise
the monovarietal Arbequina olive oil produced in Brazil; (ii) to compare it with the
olive oils from the same cultivar produced in different regions of Spain; (iii) to classify
the oil samples according to their geographic origin, on the basis of the analysed
variables. For these purposes, quality parameters (free acidity, peroxide value, specific

Resultados
99
extinction coefficients), oxidative stability, pigments (chlorophylls and carotenoids),
colour coordinates and the fatty acid profile were assessed.
2. Material and methods
2.1. Chemicals
All chemicals were analytical reagent grade or higher purity and Milli Q water
(Millipore, Bedford, MA) was used throughout the assays. Methanol, cyclohexane and
n-heptane were supplied by Sigma (Sigma-Aldrich, St. Louis, MO). Acetic acid,
chloroform, diethyl ether, ethanol 95%, phenolphthalein, potassium hydroxide, sodium
hydroxide, potassium iodate, starch and sodium thiosulphate were acquired from
Panreac (Barcelona, Spain). The fatty acid methyl ester standard mixture (Supelco 37
FAME Mix) was acquired from Supelco (Bellefonte, USA).
2.2. Sampling
Extra virgin olive oil (EVOO) from Arbequina cultivar was analysed. Two regions
in Brazil (Minas Gerais and Rio Grande do Sul) and nine representative regions of olive
oil production in Spain (Granada, Jaén, Málaga, Cádiz, Sevilla, Albacete, Toledo,
Valladolid and Lérida) were selected to obtain the EVOO samples. Locations of the
Spanish (samples 1-9) and Brazilian (samples 10 and 11) regions are shown in Fig. 1;
geographic and climate characteristics of the production areas are shown in Table 1.
Table 1 also classifies the areas according to the Köppen system, which divides the
world’s climates into major categories based on the global temperature profile and
precipitations related to latitude (Kottek, Grieser, Beck, Rudol, & Rubel, 2006).

Resultados
100
Figure 1. Geographic location of Arbequina virgin olive oils from Spain (1-9) and Brazil (10,
11). Numbers correspond to the description in Table 1 (1-Granada; 2-Jaén; 3-Málaga; 4-Cádiz;
5-Sevilla; 6-Albacete; 7-Toledo; 8-Valladolid; 9-Lérida; 10-Rio Grande do Sul; 11-Minas
Gerais).
11
10 4
52
13
98
6
7
Brazil Spain

Resultados
101
Table 1. Geographic coordinates (latitude and longitude), altitude (m), annual mean temperatures (◦C), annual rainfalls (mm) and minimum and
maximum mean temperatures (◦C) of the different locations of Arbequina virgin olive oils from Spain (1-9) and Brazil (10, 11).
Oil
Sample Region Latitude Longitude Altitude
Mean
Temperature Rainfall
Minimum
Temperature
Maximum
Temperature Kooper Classification
1 Granada 37� 03ʾ N 3� 36ʾ W 905 17 385 7 26 Warm temperate climate with dry and
hot summer (Csa)
2 Jaén 38� 03ʾ N 3� 29ʾ W 580 17 422 9 26 Warm temperate climate with dry and
hot summer (Csa)
3 Málaga 37� 06ʾ N 4� 22ʾ W 883 20 411 13 27 Warm temperate climate with dry and
hot summer (Csa)
4 Cádiz 36� 43ʾ N 6� 01ʾ W 47 19 636 13 24 Warm temperate climate with dry and
hot summer (Csa)
5 Sevilla 37� 17ʾ N 4� 53ʾ W 416 19 598 11 27 Warm temperate climate with dry and
hot summer (Csa)
6 Albacete 39� 00ʾ N 1� 54ʾ W 677 13 293 6 25 Steppe climate of mid/high altitude
(Bsk)
7 Toledo 39� 53ʾ N 4� 28ʾ W 459 14 391 7 26 Steppe climate of mid/high altitude
(Bsk)
8 Valladolid 41� 53ʾ N 5� 00ʾ. W 845 13 394 -1 27 Warm temperate climate with dry and
warm summer (Csb)
9 Lérida 41� 36ʾ N 0� 35ʾ W 168 14 677 6 21 Steppe climate of mid/high altitude
(Bsk)
10 Río Grande 30� 00ʾ S 52� 52ʾ W 88 16 1691 3 22 Warm temperate climate with dry
seasons and hot summer (Cfa)
11 Minas Gerais 22� 18ʾ S 42� 22ʾW 1310 17 1330 14 21 Warm temperate climate with dry
winter and temperate summer (Cwb)
Geographic coordinates (latitude, longitude and altitude) proximate to olive grove were found using Google Earth program (Google Inc, USA).
Temperature and rainfall values in Spain were supplied by the Spanish Meteorology Agency (Aemet, 2015). Climate values for Brazil were calculated
from data provided by the National Meteorology Institute of Brazil (INMET, 2015).

Resultados
102
All the oils, kindly provided by the producers, were obtained under a two-phase
extraction system and correspond to the same crop harvest (2014/15). After extraction,
the samples were sent to CSIC laboratories (Granada, Spain) for performing the
analysis. Samples were adequately packaged for preserving for light and high
temperatures and promptly sent by courier service. The corresponding customs
permission was obtained for Brazilian samples to avoid delay at the frontier. A total of
33 olive oil samples were evaluated (n=3 from each producing region) and the analyses
were carried out in triplicate. All samples were stored in dark glass bottles with nitrogen
gas and maintained at 4° C until analysis.
2.3. Quality parameters
The quality parameters assessed were free acidity (FA, expressed as percentage of
oleic acid), peroxide value (PV, expressed as mEq. O2/kg of oil) and specific extinction
coefficients at 232 and 270 nm (K232, K270 and ΔK). All quality parameters were
determined according to EU standard methods (Annexes II and IX of European
Community Regulation EEC/2568/91).
2.4. Oxidative stability
The oxidative stability was measured by estimating the oxidation induction time, in
a Rancimat 743 apparatus (Metrohm CH, Switzerland). A sample of olive oil (3g) was
heated to 120 ± 1.6 °C and subjected to an inflow of air (filtered, cleaned, and dried) at
20 L/h. The resulting volatile compounds were collected in water, and the increasing
water conductivity was continuously measured. The time (in hours) taken to reach
conductivity inflection was recorded.

Resultados
103
2.5. Pigments (chlorophylls and carotenoids)
The pigments (chlorophylls and carotenoids) were assessed following the method
described by Minguez-Mosquera, Rejano, Gandul, Sánchez, & Garrido (1991). The oil
samples were dissolved with cyclohexane (1.5:5 w/v) and absorbance was measured
using a UV spectrophotometer (Pharmaspec UV 1700, Shimadzu). The chlorophyll
fraction was determined at 670 nm and the carotenoid fraction at 470 nm. The results
obtained are expressed as mg of pheophytin ‘‘a’’ and lutein per kg of oil, respectively.
2.6. Colour
Instrumental colour (CIE L*, a*, b*) was measured directly in the olive oil samples
using a Minolta Colorimeter (CR-400, Konica Minolta Corp., Japan) with illuminant
D65. The colorimeter was calibrated before use with a white ceramic tile. L* is a
measure of luminance or the lightness component, which ranges from 0 to 100 (black to
white). Parameters a* and b* are termed opponent colour axes; a* represents red
(positive) versus green (negative) colours, b* is positive for yellow and negative for
blue. Colour features were obtained as the average of three measurements performed on
each oil sample.
2.7. Fatty acid profile
The fatty acid profile was determined according to EU standard methods (Annexes
II and IX of European Community Regulation EEC/2568/91). The methyl esters
(FAME) were obtained by cold alkaline transesterification with methanolic potassium
hydroxide solution and extracted with n-heptane. The fatty acid profile was determined
with a Focus GC, Thermo Scientific (Milan, Italy) chromatograph equipped with a
split/splitless injector, a FID detector and a SP-2560 fused silica capillary column (100

Resultados
104
m x 0.25 cm i.d. x 0. 0.2μm film thickness, Supelco, USA). Helium was used as carrier
gas at an internal pressure of 110 kPa. The temperatures of the detector and injector
were 275 ºC and 260 ºC, respectively. The oven temperature was programmed at 70 ºC
during the first 4 min, increasing to 110 ºC at 8 ºC/min, then increasing to 170 ºC at 5
ºC/min and holding for 10 min, finally increasing to 250 ºC at 4 ºC/min and holding for
15 min. The split ratio was 1:50 and the injected volume was 1 μL. The results are
expressed as the relative percentage of each fatty acid, calculated by internal
normalisation of the chromatographic peak area eluting between myristic and lignoceric
acid methyl esters. A control sample of fatty acid methyl ester standard mixture
(Supelco 37 FAME Mix) was used for calibration and for the identification of the
FAME by their retention times (Sigma, Spain).
2.8. Statistical analysis
The data obtained were analysed using analysis of variance (one-way ANOVA),
with the geographic origin of oils (regions 1-11) as the main factor. Tukey’s test was
used to compare mean values between oils from the different regions, and differences
were established at P<0.05. Moreover, the data were grouped by countries, and the
overall differences between Brazilian and Spanish oils were also studied by ANOVA.
The relationships of the different variables with the climate characteristics and the
altitude of the producing regions were evaluated by Pearson’s coefficient. In addition, a
principal component analysis (PCA) was applied for reducing the number of variables
analysed (oxidative stability, 2 variables corresponding to pigments, 3 to colour
parameters and 18 variables of FA profile, with a total of 24 variables) to a smaller
number (principal components or factors). Furthermore, using the new variables as
dimensions, it allowed recognizing patterns in the data by plotting them in a

Resultados
105
multidimensional space. All statistical calculations were carried out using SPSS version
21.0 (IBM Corporation, New York, USA).
3. Results and Discussion
Pearson’s coefficient correlations between climate/geographical variables (altitude)
and analytical parameters (quality parameters, pigments, colour coordinates and fatty
acid profile) are presented as supplementary data in Table S1.
3.1. Quality parameters and oxidative stability
The quality parameters (FA, PV and specific extinction coefficients at K232, K270
and ΔK) and oxidative stability are shown in Table 2.
FA, expressed as % of oleic acid, provides information about the state of the
fruit, i.e., how the fruit was handled prior to processing and the length of time from
harvest to milling. FA reports the degree of hydrolysis in the oil (Borges, Malheiro, de
Souza, Casal, & Pereira, 2015; Reboredo-Rodríguez et al., 2015). According to the EU
regulation (EEC 2568/91), FA content of EVOO must not exceed 0.8%. All of the
samples analysed complied with this limit. The highest value was found for location 10,
and differed significantly from those of the other samples (P<0.05). The average FA
values from the Brazilian and Spanish oils were compared, and a large difference was
recorded (P<0.001), mainly due to the high value for sample 10.

Resultados
106
Table 2. Quality parameters - Free fatty acids - FA (% oleic acid), Peroxide value - PV(mEq O₂/ Kg), specific extinction coefficients (K232, K270 and
ΔK) - and oxidative stability (hours) of Spanish (samples 1-9) and Brazilian (samples 10-11) Arbequina EVOO (mean ± SD).
Oil sample FA PV K232 K270 ΔK Oxidative stability
1 0.15 ± 0.00 a 3 ± 0.3
a,b 1.50 ± 0.13
a,b 0.14 ± 0.01
a -0.003 ± 0.001 10.02 ± 0.18
c
2 0.18 ± 0.02 a 4 ± 1.8
b,c 1.93 ± 0.42
b,c 0.20 ± 0.01
c -0.013 ± 0.016 9.55 ± 2.16
c
3 0.25 ± 0.00 a,b
11 ± 0.6 e 2.07 ± 0.22
b,c 0.20 ± 0.00
a -0.002 ± 0.000 15.85 ± 0.09
d
4 0.32 ± 0.01 b 11 ± 0.9
e 2.35 ± 0.16
c 0.20 ± 0.02
c -0.014 ± 0.004 5.32 ± 0.01
a
5 0.15 ± 0.05 a 7 ± 1.5
d 1.87 ± 0.28
a,b,c 0.12 ± 0.01
a -0.002 ± 0.001 9.72 ± 1.48
c
6 0.24 ± 0.04 a,b
4 ± 0.2 b,c
1.52 ± 0.35 a,b
0.13 ± 0.03 a -0.002 ± 0.000 8.07 ± 0.07
b,c
7 0.16 ± 0.01 a 3 ± 0.1
a,b 1.70 ± 0.17
a,b,c 0.14 ± 0.00
a,b -0.002 ± 0.001 8.61 ± 0.02
b,c
8 0.16 ± 0.02 a 1 ± 0.1
a 1.18 ± 0.02
a 0.11 ± 0.01
a -0.002 ± 0.001 19.73 ± 0.67
e
9 0.18 ± 0.02 a 3 ± 0.4
a,b 1.51 ± 0.08
a,b 0.12 ± 0.00
a -0.002 ± 0.002 6.82 ± 1.19
a,b
10 0.75 ± 0.04 c 14 ± 1.4
f 1.94 ± 0.21
b,c 0.17 ± 0.01
b,c -0.007 ± 0.001 9.53 ± 0.14
c
11 0.15 ± 0.00 a 4 ± 0.5
c,d 2.29 ± 0.29
c 0.13 ± 0.01
a -0.002 ± 0.000 6.21± 0.22
a,b
p-value a
Spain × Brazil *** ** * ns ns ns
Means within a column with different superscripts differ significantly (P < 0.05). a ns, not significant;*P<0.05; **P < 0.01;***P< 0.001.

Resultados
107
Another mandatory quality parameter is PV, which reflects the onset of
oxidation. For EVOO, the maximum PV acceptable is 20 mEq of O2/kg. In our study,
all samples showed values below this limit, ranging from 1 mEq/kg in Spanish sample
number 8 to 14 mEq/kg in Brazilian sample number 10. Significant differences were
found among samples (P<0.05) and between countries (P<0.01). K232, K270 and ΔK,
were measured in the UV region at the wavelengths of 232 nm, 270 nm and 266-274
nm, respectively, corresponding to the maximum absorption of the conjugated dienes
and trienes. All samples complied with the regulation that specific extinction
coefficients must be lower than 2.50, 0.22 and 0.01 for K232, K270, and ΔK, respectively,
in the EVOO category. The K270 and ΔK values did not differ between the countries.
Among Arbequina oils cultivated over the world, the highest values of FA (0.70
% oleic acid) and PV (11 mEq O2/kg) have been observed in Argentina (Torres et al.,
2009), whereas oil from other countries show lower values, always within quality
regulations. According to Dabbou et al. (2009), the geographic origin does not
significantly influence the quality parameters of oils, although they may be affected by
aspects such as the health of the fruit, storage conditions, harvesting system and
transport. Our findings corroborate this statement, since the global quality of the oils
was basically unchanged regardless of the location, and all of the samples can be
considered EVOO. However, positive correlations were found between FA, PV and
K232 with annual temperature and rainfalls, and negative with altitude (Table S1).
Supporting these relationships, oils from the areas with high rainfall, warm average
temperatures and low altitude, such as number 4 (Cádiz, Spain) and number 10 (Rio
Grande do Sul, Brazil), had the highest PV and FA values. The negative influence of
excessive water on olive oil quality has been reported previously in comparative studies
of experimental irrigation (Berenguer et al., 2006).

Resultados
108
Rancimat is a useful method for measuring resistance to oxidation, and provides
important information on the shelf life of olive oils, which could be influenced by the
fatty acid profile and the presence of antioxidant compounds (Dabbou et al., 2010). In
our study, Arbequina olive oils ranged between 5 to 20 hours of oxidative stability at
120°C, with significant differences between the samples. The lowest stability was found
for location 4 and the highest for location 8. The average values did not differ
significantly between the two countries, probably due to the large variations between
samples. The oxidative stability of the Arbequina olive oils analysed in this study was
similar to the values of 5-14 h of induction time reported for the same cultivar grown in
Catalonia, Spain (Morelló, Motilva, Tovar, & Romero et al., 2004), and higher than
those observed in other countries such as Tunisia (0.68 h) (Dabbout et al., 2010).
The Rancimat results were negatively correlated (P<0.05) with the K232 (r= -
0.436) and K270 (r= -0.430) values, although no relationship was observed with the other
quality markers (FA and PV), which concurs with the results of other authors (Dabbou
et al., 2010). It has been reported that the oil stability measured by the Rancimat method
increases in line with altitude (Aparicio & Lune, 2002); however, like Aguilera et al.
(2005), we observed no such correlation. On the other hand, significant correlations
were found between oxidative stability and climate factors, such as minimum and
maximum temperatures (Table S1).
3.2. Pigments and colour
Table 3 shows the pigment content (chlorophylls and carotenoids) and
chromatic coordinates measured by the CIELAB method (L*, a*, b*) for the different
oils.

Resultados
109
Table 3. Pigments chlorophylls and carotenoids (mg kg-1
), and colour coordinates evaluated by the CIELAB method (L*, a*, b*) of Spanish (samples
1-9) and Brazilian (samples 10-11) Arbequina EVOO (mean ± SD).
Oil sample Chlorophylls Carotenoids L* a* b*
1 2.89 ± 0.18 a,b,c
4.55 ± 0.38 a 24.67 ± 0.03
c -0.550 ± 0.03
g 11.54 ± 0.02
c
2 2.07 ± 0.29 a 3.70 ±0.33
a 25.72 ± 0.52
d -2.06 ± 0.01
b,c 12.43 ± 0.21
c,d,e
3 2.57 ± 0.17 a,b
4.78 ± 0.27 a 25.65 ± 0.02
d -1.74 ± 0.05
d 12.56 ± 0.04
d,e,f
4 3.89 ± 1.76 b,c
9.09 ± 4.56 b 26.08 ± 0.04
d,e -2.14 ± 0.06
a,b,c 12.28 ± 0.15
c,d,e
5 2.03 ± 0.18 a 3.76 ± 0.12
a 26.28 ± 0.06
e,f -2.22 ± 0.06
a,b 11.75 ± 0.79
c,d
6 1.67 ± 0.06 a 2.80 ± 0.19
a 26.09 ± 0.18
d,e -1.89 ± 0.20
c,d 13.13 ± 0.04
e,f
7 2.06 ± 0.21 a 2.50 ± 0.09
a 26.16 ± 0.02
d,e,f -1.97 ± 0.07
b,c,d 13.39 ± 0.02
f
8 4.38 ± 0.25 c 6.26 ± 0.43
a,b 25.69 ± 0.02
d -1.38 ± 0.03
e 12.87 ± 0.04
e,f
9 1.41 ± 0.38 a 2.42 ± 0.71
a 26.69 ± 0.27
f -2.37 ± 0.12
a 11.82 ± 0.60
c,d
10 1.73 ± 0.16 a 3.85 ± 0.32
a 19.54 ± 0.05
a 0.06 ± 0.07
h 4.36 ± 0.04
a
11 1.39 ± 0.02 a 2.17 ± 0.05
a 24.00 ± 0.01
b -0.84 ± 0.04
f 9.74 ± 0.00
b
p-value a
Spain × Brazil ns * *** *** ***
Means within a column with different superscripts differ significantly (P < 0.05). a ns, not significant;*P<0.05; **P < 0.01;***P< 0.001.

Resultados
110
Although colour is not included among quality standards, it plays an important
role in the perceptions and preferences of consumers and may also be related to the
maturation stage of the fruit. Consumers associate a dark green colour with high quality
and pale yellow with refined and lower-quality olive oils (Gandul-Rojas, Gallardo-
Guerrero, Roca, & Aparicio-Ruiz, 2013). According to our results, the colour of the
Brazilian EVOO clearly differed from that of the Spanish samples (P<0.001). On
average, the Brazilian samples were less green (higher a* values) and paler yellow
(lower b* values) than the Spanish ones, which in addition had more luminosity (higher
L* values). Some previous studies of Spanish Arbequina olive oils (Criado, Romero,
Casanovas, & Motilva, 2008; Morelló et al., 2004) have reported higher values for L*
and b* and similar a* values, in comparison with ours, while another reported similar
values for a* and b* (Moyano, Meléndez-Martínez, Heredia, 2008). On the other hand,
colour parameters were strongly correlated with rainfall (Table S1), i.e. high levels of
rainfall (as occurring in Brazil) tend to produce oils with lower lightness and greenness
intensity. To the best of our knowledge, no data have been reported about colour
measured by instrumental methods of Brazilian olive oils.
The colour parameters of olive oils are mainly the result of chloroplast pigments,
i.e. chlorophylls and carotenoids, which play an essential role in oxidative stability
(Criado et al., 2008). The chlorophyll content in the Arbequina oils analysed ranged
from 1.39 to 4.38 mg/kg, with significant differences among locations (P<0.05).
Although Spanish oils showed on average higher chlorophyll content than Brazilian
ones, differences between countries did not reach statistical significance (Table 3). The
carotenoid content presented a wide range, from 2.42 to 9.09 mg/kg, with significant
differences between areas and countries (P<0.05). Therefore, not only cultivar (Moyano
et al., 2008) but also geographic and climate characteristics seem to affect the pigment
Resultados
111
content of olive oils. However, in the present study, the only significant relationships
found were those between carotenoids and maximum temperatures (Table S1).
Values of chlorophylls found in the present study are lower than those reported
in Arbequina EVOO from Tunisia and Catalonia (Spain), whereas levels of carotenoids
are similar than those shown in olive oils from Tunisia (Dabbou et al., 2010; Morelló et
al., 2004). An association between colours and pigments of oils has been proposed in
the literature (Moyano et al. 2008); on accordance, in the present study, Brazilian oils,
which showed lower average values of chlorophylls and carotenoids than Spanish ones,
were also less green and yellow (higher a* and lower b* values), although we have not
found statistical correlations between these parameters. Thus, factors other than pigment
content could have affected the colour variation of the oils, as colour is also associated
with other chemical and physical properties, mainly related with the quality of the
product (Moyano, Heredia & Melendez-Martinez, 2010).
The antioxidant properties of the pigments are known to affect oxidative stability
of oils (Criado et al., 2008). Our analysis showed that Rancimat correlated with
carotenoid levels (r= 0.487, P<0.01), but not with chlorophylls (Table S1), in
accordance with findings of Dabbou et al. (2010).
3.3. Fatty acid profile
The fatty acid profile (% weight of methyl esters), the sums of total saturated (SFA),
monounsaturated (MUFA) and polyunsaturated (PUFA) fatty acids and the n6/n3,
MUFA/PUFA and PUFA/SFA ratios are presented in Table 4.

Resultados
112
Table 4. Fatty acid profile (% weight of methyl esters) of Spanish (samples 1-9) and Brazilian (samples 10-11) Arbequina EVOO (mean ± SD).
1 2 3 4 5 6 7 8 9 10 11 Pa
C16:0 11.99 ± 0.10b 17.43 ± 0.05e 14.14 ± 0.03c 16.98 ± 0.68e 17.34 ± 0.18e 15.19 ± 0.53d 19.55 ± 0.16f 9.44 ± 0.20a 13.97 ± 0.27c 19.08 ± 0.42f 14.15 ± 0.046c ns
C16:1 1.05 ± 0.01 b 1.89 ± 0.28 d 1.08 ± 0.05 b 1.59 ± 0.00 c,d 1.51 ± 0.09 c 1.64 ± 0.06 c,d 1.55 ± 0.01 c 0.58 ± 0.01 a 1.13 ± 0.11 b 3.16 ± 0.11 e 1.72 ± 0.02 c,d **
C17:0 0.11 ± 0.01b,c 0.10 ± 0.01a,b,c 0.13 ± 0.00c 0.11 ± 0.01b,c 0.12 ± 0.00c 0.10 ± 0.00a,b,c 0.10 ± 0.03a,b,c 0.10 ± 0.02a,b,c 0.11 ± 0.01b,c 0.07 ± 0.00a 0.08 ± 0.00a,b **
C17:1 0.24 ± 0.01 c,d 0.21 ± 0.00a,b,c 0.24 ± 0.01d 0.21 ± 0.01a,b,c 0.23 ± 0.01b,c,d 0.23 ± 0.01b,c,d 0.22 ± 0.03b,c,d 0.23 ± 0.01b,c,d 0.21 ± 0.01b,c,d 0.17 ±0.00a 0.20 ± 0.01a,b **
C18:0 1.92 ± 0.02d,e 1.81 ± 0.04c,d 2.02 ± 0.02f 1.89 ± 0.07d,e 1.82 ± 0.03c,d 1.78 ± 0.01c 1.61 ± 0.04b 2.13 ± 0.03h 1.93 ± 0.02e,f 1.56 ± 0.01b 1.44 ± 0.04a **
C18:1 75.22 ± 0.20 c 64.09 ± 1.36 a 71.66 ± 0.07 c 63.12 ± 0.72 a 63.85 ± 0.09 a 66.69 ±1.77 b 64.66±0.15 a.b 79.68 ±0.13 d 70.60 ± 0.04 c 64.29 ± 0.28 a 70.64 ± 0.04 c ns
C18:2 8.04 ± 0.02b 13.17 ±1.19e 9.51 ± 0.00c 14.76 ± 0.01f 13.77 ± 0.13e.f 13.24 ± 0.77e 11.04 ± 0.08d 6.56 ± 0.02a 10.82 ± 0.11d 10.49 ± 0.07c.d 10.29 ± 0.04c.d ns
C18:3 0.58 ± 0.01c 0.56 ± 0.01b,c 0.46 ± 0.01a 0.55 ± 0.02b,c 0.56 ± 0.03c 0.60 ± 0.04c 0.55 ± 0.01b,c 0.46 ± 0.01a 0.48 ± 0.02a 0.51 ± 0.00a,b 0.69 ± 0.00d ns
C20:0 0.34 ± 0.01b,c,d 0.34 ± 0.01b,c,d 0.35 ± 0.00c,d 0.36 ± 0.01d 0.35 ± 0.01d 0.34 ± 0.02b,c,d 0.32 ± 0.01a,b 0.36 ± 0.00d 0.35 ± 0.00c,d 0.30 ± 0.00a 0.32 ± 0.01a,b,c **
C20:1 0.29 ± 0.00c,d 0.25 ± 0.02a,b 0.25 ± 0.01a,b 0.25 ± 0.01a,b 0.25 ± 0.02a,b 0.26 ± 0.01a,b,c 0.24 ± 0.02a,b 0.27 ± 0.00b,c,d 0.25 ± 0.01a,b 0.23 ± 0.00a 0.31 ±0.01d ns
C22:0 0.11 ± 0.00c,d 0.10 ± 0.00a,b 0.10 ± 0.00b,c 0.11 ± 0.01c,d 0.11 ± 0.00c,d 0.11 ± 0.00b,c 0.10 ± 0.00b,c 0.12 ± 0.00d 0.11 ± 0.00b,c 0.09 ± 0.00a 0.10 ± 0.01b,c **
C24:0 0.04 ± 0.01a 0.05 ± 0.00a,b 0.05 ± 0.00a,b 0.05 ± 0.00a,b 0.05 ± 0.01a,b 0.05 ± 0.00a,b 0.05 ± 0.00a,b 0.05 ± 0.00a,b 0.05 ± 0.01a,b 0.05 ± 0.00a,b 0.05 ± 0.00b ns
SFA 14.57 ± 0.11b 19.84 ± 0.10e 16.80 ± 0.03c,d 19.51 ± 0.74e 19.81 ± 0.15e 17.58 ± 0.54d 21.73 ± 0.14f 12.21 ± 0.17a 16.51 ± 0.26c 21.14 ± 0.42f 16.15 ± 0.07c ns
MUFA 76.81 ± 0.09e 66.43 ± 1.10a,b 73.24 ± 0.03d 65.17 ± 0.72a 65.86 ±0.07a 68.58 ±1.34c 66.67 ± 0.09a,b 80.76 ± 0.15f 72.20 ± 0.14d 67.85 ± 0.34b,c 72.87 ± 0.03d ns
PUFA 8.62 ± 0.02b 13.73 ± 1.20e 9.97 ± 0.01c 15.32 ± 0.02f 14.33 ± 0.10e,f 13.84 ± 0.81e 11.60 ± 0.08d 7.02 ± 0.03a 11.29 ± 0.13d 11.00 ± 0.08c,d 10.99 ± 0.04c,d ns
n6/n3 13.76 ± 0.10a 23.52 ± 1.74d 20.74 ± 0.32b,c 26.74 ± 0.99e 24.43 ± 1.57d,e 22.07 ± 0.61b,c.,d 20.05± 0.44b 14.31 ± 0.14a 22.77 ± 0.62c,d 20.54 ± 0.04b,c 14.86 ± 0.11a ns
Index 1 8.91 ± 0.02f 4.88 ± 0.51b 7.35 ± 0.01e 4.25 ± 0.04a 4.59 ± 0.03a,b 4.98 ± 0.39b 5.75 ± 0.03c 11.5 ± 0.02g 6.40 ± 0.06d 6.17 ± 0.01c,d 6.63 ± 0.02d ns
Index 2 0.59 ± 0.01b 0.69 ± 0.06c 0.59 ± 0.00b 0.79 ± 0.03d 0.72 ± 0.01c,d 0.79 ± 0.02d 0.54 ± 0.01a,b 0.57 ± 0.01a,b 0.68 ± 0.02c 0.52 ± 0.01a 0.68 ± 0.01c ns
Index 1. MUFA/PUFA
Index 2. PUFA/SFA
Means within each file with different superscripts differ significantly (P < 0.05). a P value for Spain × Brazil (ns, not significant;*P<0.05; **P < 0.01).

Resultados
113
Twelve fatty acids of Arbequina olive oils were identified, 6 of them SFA, 4 MUFA
and 2 PUFA. The major fatty acid found was oleic acid (C18:1), the content of which
ranged from 63.12 % (sample 4) to 79.68 % (sample 8), followed by palmitic acid (9-
20%), linoleic acid (7-15%), stearic acid (1-2%) and palmitoleic acid (0.6-3%). Other
fatty acids were found at a concentration of less than 1%. All samples complied with
European regulations for EVOO. The trans isomers were not detected.
A significant effect (P<0.05) of the geographic area was observed in the fatty acid
profile. The oil from location 8 presented the highest content in MUFA and the lowest
content in PUFA and, consequently, the highest MUFA/PUFA ratio. This sample had
the lowest susceptibility to oxidation, as measured by the Rancimat test, thus
confirming that the MUFA/PUFA ratio is associated with the oxidative stability of oils
(Reboredo-Rodriguez et al., 2014; Reboredo-Rodriguez et al., 2015). In the present
study, the statistical correlation observed between Rancimat and the MUFA/PUFA ratio
(r= 0.754, P<0.001) supports this statement. Moreover, other relationships between
Rancimat and the fatty acid profile of oils were found (P<0.01), such as those with SFA
(r= -0.521), MUFA (r= 0.650) and PUFA (r= -0.686), showing that samples with a
higher content of MUFA and lower PUFA and SFA values have the best oxidative
stability. These findings, taken together, confirm that oxidative stability is not
dependent on a single parameter but is mainly influenced by the overall fatty acid
composition of the oil (Dabbou et al., 2010).
The comparison between countries revealed significant differences for some minor
fatty acids but not for the major ones, such as oleic, palmitic and linoleic acids. As a
consequence, the indexes and ratios calculated from the fatty acid profile did not differ
between the Brazilian and Spanish oils.

Resultados
114
The fatty acid profile has been widely examined in olive oils, and scientific evidence
has shown that the quality of the fat content has a strong impact on oil quality and thus
on consumer health (Rueda, Seiquer, Olalla, Gimenez, Lara & Cabrera-Vique, 2014).
The fat composition of Arbequina virgin olive oils from different regions of Spain and
under different agronomic and production conditions, have revealed contents of oleic
acid (58-79%) and palmitic acid (12-18%) and values of SFA, MUFA and PUFA
similar to those found in our study (Yousfi, Weliard, & García, 2012; Reboredo-
Rodriguez et al., 2015). Studies of Brazilian Arbequina oil (Minas Gerais region) have
reported values of linoleic and linolenic acids close to those found in the present assay,
and different data concerning oleic acid content, ranging from 61.3% to 75% (De
Oliveira, Ramos, Pio & Cardoso, 2012; Ballus et al., 2014).
According to studies of Arbequina olive oils recently produced in Australia,
Argentina and Tunisia, different cultivation and environmental conditions may have a
strong effect on the fatty acid composition of oils, with oleic and palmitic acids being
especially affected (Dabbou et al., 2010; Mailer et al., 2010; Rondanini et al., 2011;
Torres et al., 2009). Among the environmental factors considered, temperature plays an
essential role in the fatty acid composition of oils, by regulating fatty acid desaturases
(Hernández et al., 2011). It has been shown that low temperatures increase the
polyunsaturated fatty acid content of plants, thus maintaining the fluidity of biological
membranes (Los & Murata, 1998). Corroborating this relationship, in the present study
a significant association (P<0.05) was recorded between minimum temperatures and the
C18:2 and C18:3 content of the oils analysed, whereas maximum temperatures were
mainly correlated with the percentages of saturated fatty acids (Table S1).
In Arbequina oils from Argentina, it has been observed that the oleic acid content is
dependent on the mean temperature during fruit growth, and can decrease by up to 2%

Resultados
115
for each °C of increased temperature (Rondanini et al., 2011). Therefore, the low oleic
acid content found in those oils, compared with the Spanish, has been attributed to high
temperatures (Rondanini et al., 2011; Torres et al., 2009). In our study, no relationship
between mean temperature and oleic acid content in oils was found, but a significant
negative correlation was observed between this fatty acid and minimum ambient
temperature (Table S1).
It has been suggested that environmental factors other than temperature may play a
role in the fatty acid composition of oils (Romero, Tovar, Ramo, & Motilva, 2003). In
the present study, we verified significant correlations (P<0.01) between altitude and
levels of palmitic, oleic and linoleic acid, and also with SFA, MUFA, PUFA, n6/n3 and
MUFA/PUFA ratios. According to our results, altitude was positively related to the
amount of oleic acid and negatively related to PUFA content, which is in apparent
disagreement with the observations of previous studies (Aparicio & Luna, 2002).
However, the latter authors explain that changes in the fatty acid profile due to altitude
have a minimal effect on oxidative stability of oils. In agreement, in the present study
no relationship was found between altitude and oxidative stability, measured by the
Rancimat method, despite the effects on the FA profile (Table S1). Thus, the
temperature and especially the altitude were the environmental factors mainly related to
the differences in the fatty acid profile found among oils of the present study.
In addition to the geographical and climate conditions considered in the present
study, other factors such as agronomic aspects (ripeness index, storage conditions,
processing) or further environmental variables (light intensity, humidity, evapo-
transpiration, soil) may also influence the chemical composition of olive oil (Romero et
al., 2016; Aparicio & Luna, 2002; Hernandez et al.; 2011; Rondanini et al., 2014).

Resultados
116
3.4. Principal Component Analysis (PCA)
To obtain a global discrimination of oils from different geographic areas and to
reduce the number of variables, a PCA was performed including oxidative stability,
pigments (chlorophylls and carotenoids), colour (coordinates L*, a* and b*) and fatty
acid profile.
A
PC1
PC
2
8
1
11
10
3 9
7
4
2
6
5
PC1
PC
2
B
PC1
1. Granada (S)
2. Jaén (S)
3. Málaga (S)
4. Cádiz (S)
5. Sevilla (S)
6. Albacete (S)
7. Toledo (S)
8 Valladolid (S)
9. Lérida (S)
10. Rio Grande do Sul (B)
11. Minas Gerais (B)
Figure 2. Graphic representation of the PCA obtained from the oxidative stability, pigments,
colour and fatty acid profile. A) Vector arrows of the different variables. Identification of
variables as described in the text. B) Distribution of the oils. (S) Spain, (B) Brazil.

Resultados
117
The two main components obtained explained 66.97 % of the total variance (40.97 %
PC1 and 26.00 % PC2). Figure 2A depicts the vector arrows of the variables, showing
their contribution to PC1 and PC2. The first component was mainly explained by the
fatty acid profile, with C18:1, MUFA, MUFA/PUFA, C16:0, SFA and PUFA producing
the greatest influence, (loadings of -0.923, -0.923, -0.912, 0.908, 0.907 and 0.887,
respectively). Rancimat values, highly related with fatty acid composition, were also an
important contributor to PC1 (loading -0.685). The second component was clearly
governed by colour parameters (L* 0.852, a* -0.863, b* 0.839 of loading). Figure 2B
represents the spatial distribution of the oils from the different locations according to
PC1 and PC2 (the values of each oil were grouped for greater clarity). Taking into
account factor 1, we can see that sample 8 is located in the extreme left-hand side of the
graph, followed by samples 1, 3 and 9, while there is evident proximity among the oils
from Spanish locations 2, 4, 5, 6, 7 and Brazilian locations 10 and 11, which are all
located on the right-hand side of the graph. This distribution is associated with the fat
composition of the oils, and particularly to the oleic acid content. According to factor 2,
Brazilian samples 10 and 11 are located in the lower part of the graph, mainly due to
differences in colour coordinates compared with the Spanish oils. Spanish sample 1,
with similar a* values than Brazilian oils, is also represented in the negative region of
PC2. Considering both components together, the oils from Brazil are located in the
lower right quadrant and separated from the other oils, but separation among the
Spanish samples is also evident (i.e. samples 1 and 8 from the other Spanish oils, and
the considerable distance between samples 2 and 8). Therefore, the differences between
the samples, based on the parameters evaluated in the present assay, do not allow us to
clearly separate the oils according to their countries of origin.

Resultados
118
4. Conclusions
The results obtained provide useful data on the characteristics of Arbequina olive
oils from Brazil and Spain and show that the geographic area of cultivation may affect
the physicochemical properties and composition of olive oils. Although the parameters
evaluated were within the limits established in EU regulations for EVOO, significant
differences between Spanish and Brazilian oils were observed, and also among oils
from the same country. Rainfall was showed as the most influential climate feature on
colour of oils; thus Brazilian oils, produced in regions of heavy rainfall, had lower green
intensity and were paler yellow that Spanish oils, produced in drier regions. The fatty
acid composition of oils was also strongly related to environmental factors, particularly
with altitude. Thus, findings of the present study reveal that geographic and climate
aspects of producing areas may significantly influence the quality and composition of
Arbequina olive oil.
Acknowledgements
We are grateful to the CAPES Foundation – Ministry of Education, Brazil for
scholarship support provided to the first author. This work is part of the doctoral thesis
of Thays Helena Borges, Ph.D. student from the Official Doctoral Program “Nutrition
and Food Sciences” of the Granada University. The authors also would like to thank
Consejo Regulador de Denominación de Origen (DOP) Estepa and DOP Les Garrigues;
Casas Hualdo, Castillo Canena, Cortijo de Jara, Quaryat Dillar and Olivas do Sul for the
donation of samples.
Resultados
119
References
Aemet, 2015. Agencia Estadual de Metereologica. (2015) Climate monitoring Spain.
Available from: <www.aemet.es/en/serviciosclimaticos/www.aemet.es/en
/serviciosclimaticos/ vigilancia_clima/resumenes?w=0>. Accessed at: November
2015.
Aguilera, M. P., Beltrán, G., Ortega, D., Fernández, A., Jiménez, A., & Uceda, M.
(2005). Characterisation of virgin olive oil of Italian olive cultivars: Frantoio' and
Leccino', grown in Andalusia. Food Chemistry, 89(3), 387-391.
Aparicio, R., & Luna, G. (2002). Characterisation of monovarietal virgin olive oils.
European Journal of Lipid Science and Technology, 104(9‐10), 614-627.
Ballus, C. A., Meinhart, A. D., de Souza Campos, F. A., da Silva, L. F. D. O., de
Oliveira, A. F., & Godoy, H. T. (2014). A quantitative study on the phenolic
compound, tocopherol and fatty acid contents of monovarietal virgin olive oils
produced in the southeast region of Brazil. Food Research International, 62, 74-83.
Ballus, C. A., Quirantes-Piné, R., Bakhouche, A., da Silva, L. F. D. O, de Oliveira, A.
F., Coutinho, E. F., & Godoy, H. T. (2015). Profile of phenolic compounds of
Brazilian virgin olive oils by rapid resolution liquid chromatography coupled to
electrospray ionisation time-of-flight mass spectrometry (RRLC–ESI-TOF-MS).
Food chemistry, 170, 366-377.
Bakhouche, A., Lozano-Sánchez, J., Beltrán-Debón, R., Joven, J., Segura-Carretero, A.,
& Fernández-Gutiérrez, A. (2013). Phenolic characterization and geographical
classification of commercial Arbequina extra-virgin olive oils produced in southern
Catalonia. Food Research International, 50(1), 401-408.

Resultados
120
Berenguer, M. J., Vossen, P. M., Grattan, S. R., Connell, J. H., & Polito, V. S. (2006).
Tree irrigation levels for optimum chemical and sensory properties of olive oil.
HortScience, 41(2), 427-432.
Borges, T. H., Malheiro, R., de Souza, A. M., Casal, S., & Pereira, J. A. (2015).
Microwave heating induces changes in the physicochemical properties of baru
(Dipteryx alata Vog.) and soybean crude oils. European Journal of Lipid Science and
Technology, 117(4), 503-513.
Commission Regulation (EEC) nº 2568/91: on the characteristics of olive oil and
olivepomace oil and on the relevant methods of analysis. Official Journal of
European Union, 1991, L248, 1-82.
Criado, M. N., Romero, M. P., Casanovas, M., & Motilva, M. J. (2008). Pigment profile
and colour of monovarietal virgin olive oils from Arbequina cultivar obtained during
two consecutive crop seasons. Food Chemistry, 110(4), 873-880.
Dabbou, S., Issaoui, M., Esposto, S., Sifi, S., Taticchi, A., Servili, M., ... & Hammami,
M. (2009). Cultivar and growing area effects on minor compounds of olive oil from
autochthonous and European introduced cultivars in Tunisia. Journal of the Science
of Food and Agriculture, 89(8), 1314-1325.
Dabbou, S., Brahmi, F., Taamali, A., Issaoui, M., Ouni, Y., Braham, M., & Hammami,
M. (2010). Extra virgin olive oil components and oxidative stability from olives
grown in Tunisia. Journal of the American Oil Chemists' Society, 87(10), 1199-1209.
De Oliveira, M. C., Ramos, J. D., Pio, R., & das Graças Cardoso, M. (2012).
Características fenológicas e físicas e perfil de ácidos graxos em oliveiras no sul de
Minas Gerais. Pesquisa Agropecuária Brasileira, 47(1), 30-35
INMET, 2015.Instituto Nacional de Metereologia. Available from:
www.inmet.gov.br/portal/. Accessed at: November 2015.

Resultados
121
Gandul-Rojas, B., Gallardo-Guerrero, L., Roca, M., & Aparicio-Ruiz, R. (2013).
Chromatographic methodologies: compounds for olive oil color issues. In Handbook
of Olive Oil (pp. 219-259). Springer US.
García-González, D. L., & Aparicio, R. (2010). Research in olive oil: challenges for the
near future. Journal of agricultural and food chemistry, 58(24), 12569-12577.
García-González, D. L., Tena, N., & Aparicio, R. (2010). Quality characterization of the
new virgin olive oil var. Sikitita by phenols and volatile compounds. Journal of
agricultural and food chemistry, 58(14), 8357-8364.
García-González, D. L., Romero, N., & Aparicio, R. (2010). Comparative study of
virgin olive oil quality from single varieties cultivated in Chile and Spain. Journal of
agricultural and food chemistry, 58(24), 12899–12905.
Hernández, M. L., Padilla, M. N., Sicardo, M. D., Mancha, M., & Martínez-Rivas, J. M.
(2011). Effect of different environmental stresses on the expression of oleate
desaturase genes and fatty acid composition in olive fruit. Phytochemistry, 72(2),
178-187.
Kottek, M., Grieser, J., Beck, C., Rudolf, B., & Rubel, F. (2006). World map of the
Köppen-Geiger climate classification updated. Meteorologische Zeitschrift, 15(3),
259-263.
López-Cortés, I., Salazar-García, D. C., Velázquez-Martí, B., & Salazar, D. M. (2013).
Chemical characterization of traditional varietal olive oils in East of Spain. Food
Research International, 54(2), 1934-1940.
Los, D.A., Murata, N., 1998. Structure and expression of fatty acid desaturases.
Biochim. Biophys. Acta 1394, 3–15.

Resultados
122
Mailer, R. J., Ayton, J., & Graham, K. (2010). The influence of growing region, cultivar
and harvest timing on the diversity of Australian olive oil. Journal of the American
Oil Chemists' Society, 87(8), 877-884.
Morelló, J. R., Motilva, M. J., Tovar, M. J., & Romero, M. P. (2004). Changes in
commercial virgin olive oil (cv Arbequina) during storage, with special emphasis on
the phenolic fraction. Food Chemistry, 85(3), 357-364.
Mosquera, M.M.L., Rejano, N.L., Gandul, R.B., Sánchez, G.A.,& Garrido, F.J. (1991).
Color-pigment correlation in virgin olive oil. Journal of the American Oil Chemists’
Society, 68, 332–336.
Moyano, M. J., Meléndez-Martínez, A. J., Alba, J., & Heredia, F. J. (2008). A
comprehensive study on the colour of virgin olive oils and its relationship with their
chlorophylls and carotenoids indexes (II): CIELUV and CIELAB uniform colour
spaces. Food Research International, 41(5), 513-521.
Moyano, M. J., Heredia, F. J.& Meléndez-Martínez, A. J. (2010). The color of olive
oils: the pigments and their likely health benefits and visual and instrumental
methods of analysis. Comprehensive Reviews in Food Science and Food Safety, 9,
278-291.
Reboredo-Rodríguez, P., González-Barreiro, C., Cancho-Grande, B., & Simal-Gándara,
J. (2014). Quality of extra virgin olive oils produced in an emerging olive growing
area in north-western Spain. Food Chemistry, 164, 418-426
Reboredo-Rodríguez, P., González-Barreiro, C., Cancho-Grande, B., Fregapane, G.,
Salvador, M. D., & Simal-Gándara, J. (2015). Characterisation of extra virgin olive
oils from Galician autochthonous varieties and their co-crushings with Arbequina
and Picual cv. Food chemistry, 176, 493-503.

Resultados
123
Romero, M. P., Tovar, M. J., Ramo, T., & Motilva, M. J. (2003). Effect of crop season
on the composition of virgin olive oil with protected designation of origin “Les
Garrigues”. Journal of the American Oil Chemists' Society, 80(5), 423-430.
Rondanini, D. P., Castro, D. N., Searles, P. S., & Rousseaux, M. C. (2011). Fatty acid
profiles of varietal virgin olive oils (Olea europaea L.) from mature orchards in warm
arid valleys of Northwestern Argentina (La Rioja). Grasas y aceites, 62(4), 399-409.
Rondanini, D. P., Castro, D. N., Searles, P. S., & Rousseaux, M. C. (2014). Contrasting
patterns of fatty acid composition and oil accumulation during fruit growth in several
olive varieties and locations in a non-Mediterranean region. European Journal of
Agronomy, 52, 237-246.
Romero, N., Saavedra, J., Tapia, F., Sepúlveda, B., & Aparicio, R. (2016). Influence of
agroclimatic parameters on phenolic and volatile compounds of Chilean virgin olive
oils and characterization based on geographical origin, cultivar and ripening stage.
Journal of the Science of Food and Agriculture, 96(2), 583-592.
Rueda, A., Seiquer, I., Olalla, M., Giménez, R., Lara, L., & Cabrera-Vique, C. (2014).
Characterization of fatty acid profile of argan oil and other edible vegetable oils by
gas chromatography and discriminant analysis. Journal of Chemistry, Article ID
843908, doi:10.1155/2014/843908.
Torres, M. M., Pierantozzi, P., Cáceres, M. E., Labombarda, P., Fontanazza, G., &
Maestri, D. M. (2009). Genetic and chemical assessment of Arbequina olive cultivar
grown in Córdoba province, Argentina. Journal of the Science of Food and
Agriculture, 89(3), 523-530.
Yousfi, K., Weiland, C. M., & Garcıa, J. M. (2012). Effect of harvesting system and
fruit cold storage on virgin olive oil chemical composition and quality of

Resultados
124
superintensive cultivated ‘Arbequina’olives. Journal of agricultural and food
chemistry, 60(18), 4743-4750.

Resultados
125
Supplementary data. Table S1. Pearson’s correlation coefficient (r) between climate
variables and altitude and analytical parameters (quality parameters, pigments, color
coordinates and fatty acid profile).*p<0.05 **p<0.01
Altitude Temperature Rainfalls Minimum
Temperature Maximum
Temperature FA -0.506** 0.070 0.683
** -0.216 -0.322
PV -0.329 0.623**
0.602**
0.384* -0.190
K232 -0.055 0.647**
0.393* 0.726
** -0.241
K270 -0.486** 0.260 0.210 0.174 -0.140
ΔK 0.341 -0.237 -0.061 -0.132 0.014
L* 0.09 -0.048 -0.836**
0.231 0.402*
a* 0.262 -0.015 0.643**
-0.280 -0.303
b* 0.225 -0.105 -0.923**
0.146 0.528**
Carotenoids -0.006 0.079 -0.338 -0.207 0.407*
Chlorophylls -0.237 0.315 -0.146 0.040 0.236
Rancimat 0.332 -0.091 -0.301 -0.442**
0.589**
C16:0 -0.570** 0.209 0.298 0.299 -0.085
C16:1 -0.405* 0.098 0.733**
0.040 -0.403*
C17:0 -0.023 0.337 -0.653**
0.247 0.596**
C17:1 0.361* 0.091 -0.753**
0.083 0.636**
C18:0 -0.043 0.019 -0.666**
-0.256 0.560**
C18:1 0.595** -0.278 -0.218 -0.409* 0.090
C18:2 -0.504** 0.297 -0.021 0.508**
-0.036
C20:0 0.019 0.239 -0.553**
0.152 0.414*
C20:1 0.713** -0.012 0.001 0.141 -0.200
C18:3 0.408* 0.085 0.217 0.434* -0.314
C22:0 0.202 -0.064 -0.577**
-0.045 0.341
C24:0 -0.086 0.087 0.219 0.306 -0.165
ΣSFA -0.599** 0.225 0.254 0.298 -0.041
ΣMUFA 0.594** -0.281 -0.139 -0.434* 0.046
ΣPUFA -0.488** 0.297 -0.015 0.515**
-0.045
n6/n3 -0.731** 0.301 -0.094 0.355* 0.069
MUFAS/PUFAS 0.488** -0.314 -0.120 -0.565**
0.155
PUFAS/SFA -0.110 0.162 -0.230 0.435* -0.084

Resultados
126

Resultados
127
Artículo 2
General Paper
Comparative analysis of minor bioactive constituents
(CoQ10, tocopherols and phenolic compounds) in
Arbequina extra virgin olive oils from Brazil and Spain
Thays H. Borges, Luis Carlos López, José Alberto Pereira, Carmen Cabrera-Vique,
Isabel Seiquer
______________________________________________________________________
Journal of Food Composition and Analysis, 2017, 63:47-54
Received 9 February 2017
Accepted 22 July 2017

Resultados
128

Resultados
129
Comparative analysis of minor bioactive constituents (CoQ10, tocopherols and
phenolic compounds) in Arbequina extra virgin olive oils from Brazil and Spain
Thays H. Borges a,b
, Luis Carlos López c, José Alberto Pereira
d, Carmen Cabrera–
Vique b, Isabel Seiquer
a,*
a Departamento de Fisiología y Bioquímica de la Nutrición Animal, Estación
Experimental del Zaidín, Consejo Superior de Investigaciones Científicas (CSIC),
Camino del Jueves, 18100 Armilla, Granada, Spain.
b Departamento de Nutrición y Bromatología, Facultad de Farmacia, Universidad de
Granada, Campus de Cartuja 18012 Granada, Spain.
c Instituto de Biotecnología y Departamento de Fisiología, Centro de Investigación
Biomédica, Parque Tecnológico de Ciencias de la Salud, Universidad de Granada,
Granada, Spain.
d REQUIMTE-LAQV, School of Agriculture, Polytechnic Institute of Bragança,
Campus de Santa Apolónia, 5300-253 Bragança, Portugal.
* Corresponding author: Isabel Seiquer, Departamento de Fisiología y Bioquímica de la
Nutrición Animal, Estación Experimental del Zaidín (CSIC), Camino del Jueves s/n,
18100 Armilla, Granada, Spain
Tlf. +34-958572757
Fax: +34-958572753
E-mail address: [email protected]
Resultados
130
ABSTRACT
There is currently an emerging production of olive oil in Brazil but it is still poorly
characterized. In this study, we performed a comparative analysis of minor bioactive
constituents (CoQ10, tocopherols and phenolic compounds) in extra virgin olive oil from
different regions of Brazil and Spain, of Arbequina cultivar. Significant variations (P <
0.05) in the concentration of the compounds analyzed were observed among oils from
the different growing areas, not only between Spanish and Brazilian samples but also
within zones of the same country. All the oils analyzed showed a high content of CoQ10,
which ranged from 48 to 85 mg/L. The α – tocopherol was the major isomer quantified
and three main groups of phenolic compounds were identified: flavonoids (apigenin,
luteolin), phenolic acids (naringenin, p-coumaric acid, vanillic acid) and phenolic
alcohols (hydroxytyrosol). Climatic and geographic factors of the production zones
greatly influenced the minor fraction composition; positive relationships between
altitude and the level of CoQ10, tocopherols and phenolic compounds of the oils were
observed, whereas a negative correlation with rainfalls was found. Chemometric
analyses demonstrated that oils were differentiated by the chemical composition and
origin area and that polyphenols (particularly hydroxytyrosol) had the major weight in
the oil classification.
Keywords: Food composition; Food analysis; Arbequina; Virgin olive oil; Coenzyme
Q10; Tocopherols; Polyphenols; Chemometric analysis.
Abbreviations
CoQ10, coenzyme Q10; EVOO, extra virgin olive oil; EFSA, food safety authority; HCA,
hierarchical cluster analysis.

Resultados
131
1. Introduction
It is well-known that chemical composition of olive oils consists of major
(saponifiable fraction) and minor constituents (unsaponifiable fraction). The minor
constituents, despite present in lower amounts (up to 2%), are a complex mixture of
more than 230 compounds (Lopez et al., 2014; Servili et al., 2014). Among them,
phenolic compounds and tocopherols are of great interest, mainly due to their nutritional
value, antioxidant potential and health benefits.
The phenolic compounds are secondary plant metabolites that have one phenol
ring (phenolic acids/ phenolic alcohol) or several aromatic rings with one or more
hydroxyl groups (polyphenols) (Ignat et al., 2011; Lopez et al., 2014). Over the last few
decades, multiple biological properties, providing antioxidant, anti-inflammatory,
chemopreventive and anti-cancer benefits, as well as sensorial proprieties has been
attributed to phenol compounds of olive oils (Servili et al., 2014). Recently, their
protective effect over blood lipids from oxidative stress has been recognized by the
European Food Safety Authority (EFSA,2011), thus stimulating, even more, the interest
for olive oil polyphenols and allowing the use of its health claims (Reboredo-Rodriguez
et al., 2016; Martín‐Peláez et al., 2013). Tocopherols are known as lipophilic phenols
that include 8 occurring forms: 4 tocopherols and 4 tocotrienols (α, β, γ and δ). In extra
virgin olive oil (EVOO), the most predominant is the α-tocopherol (up to 90% of total),
recognized as the most active form of vitamin E in mammals , although different factors
such as cultivar and geographic location of the olive trees may influence its
concentration (Lopez et al., 2014; Kalogeropoulos and Tsimidou 2014). These natural
antioxidants not only provide nutritional value to virgin olive oils but also contribute to
its stability, protecting from oxidation (Lopez et al., 2014; Kalogeropoulos and
Tsimidou 2014).

Resultados
132
Another minor compound with great value is the coenzyme Q10 (CoQ10), an
endogenous lipophilic compound that is involved in essential cell regulations and
modulations, mainly in the mitochondrial respiratory chain (Jankowski et al., 2016;
Thanatuksorn et al., 2009). In the body it exists in either oxidized (ubiquinone) or
reduced form (ubiquinol); mainly in its reduced form it is recognized as an effective
endogenous antioxidant, although an antioxidant role of the oxidized form cannot be
discarded (Pravst et al., 2010; Jankowski et al., 2016). Additionally, it has the ability to
recycle α-tocopherol by sparing or regeneration (Pyo, 2010). Due to redox reactions,
continuous conversion between ubiquinone and ubiquinol takes place in vivo and,
moreover, ubiquinone is also reduced during or following the intestinal absorption
(Pravst et al., 2010). Therefore, the functions of CoQ10 are not affected by the form in
which it is consumed (Pravst et al., 2010). Most of the CoQ10 in the human body is from
endogenous synthesis, but levels decline progressively with increasing age and should
be replaced daily by nourishment (Jankowski et al., 2016). In this sense, the EVOO
consumption may be a dietary natural source for increasing intake of CoQ10 (Venegas et
al., 2011; Zmitek et al., 2014). A wide range of possible benefits for human health has
been reported for CoQ10 (Pravst et al., 2010; Jankowski et al., 2016; Turunen et al.,
2004). The levels of these minor bioactive constituents are variable in EVOO. These
variations have been attributed to different factors, including agronomic and
technological practices, cultivar, ripening stage, climate conditions and geographic
origin (Servili et al., 2009; Laincer et al., 2016). Nevertheless, factors influencing the
CoQ10 content of olive oils have been scarcely investigated (Zmitek et al., 2014).
In recent years, the demand of olive oils is rising over the world, and emerging
countries such as Brazil are beginning to produce it. Actually, the Arbequina cultivar is
one of the most cultivated in Brazil, and data on physicochemical proprieties, oxidative
Resultados
133
stability and fatty acid profile of Arbequina Brazilian oils have been recently published
by our research group (Borges et al., 2017). However, little is known about how
geographic and climate conditions may affect the minor components of the olive oils in
Brazil (Ballus et al., 2014, 2015). Also, there is a lack of information about the
similarities and differences between the newly-introduced and the autochthonous
cultivars. Moreover, to our knowledge, nothing has been published about CoQ10 levels
of Brazilian olive oil and very little about specific varieties in Spain (Zmitek et al.,
2014). Finally, there is also a lack of information of the relationship between CoQ10
with other bioactive constituents such as phenolic compounds and tocopherols. With
this background, the aims of this work were: i) to characterize the minor constituents
CoQ10, tocopherols and individual phenolic compounds of monovarietal Arbequina
olive oil produced in Brazil; (ii) to compare it with the olive oils from the same cultivar
produced in different regions of Spain and (iii) to classify the oil samples according to
their geographic origin, on the basis of the analyzed variables and by applying
chemometric analysis.
2. Materials and methods
2.1. Chemicals
All chemical products, standards and solvents for the analysis performed were
analytical reagent grade or higher purity (Sigma-Aldrich, St. Louis, MO, USA) and
Milli Q water (Millipore, Bedford, MA) was used throughout the assays. CoQ10 from
Sigma-Aldrich (code: C9538) was used to prepare standard solutions of different
concentrations.

Resultados
134
2.2. Samples
EVOO from Arbequina cultivar was analyzed. Nine regions of olive oil
production in Spain (Granada, Jaén, Málaga, Cádiz, Sevilla, Albacete, Toledo,
Valladolid and Lérida, samples 1 to 9) and two regions in Brazil (Rio Grande do Sul
and Minas Gerais, samples 10 and 11) were selected to obtain the EVOO samples. The
olives were harvested always at the early stage of harvest; the harvest date was: late
October to mid-November of 2014 for Spanish samples and March to early April of
2015 for Brazilian samples. The oil was extracted within 24h, under a two-phase
extraction system.The oils (n=3 from each producing region) were directly donated by
the producers, adequately packaged for preserving from light and high temperatures and
sent to CSIC laboratories (Granada, Spain) to perform the analysis. As was shown
previously (Borges et al., 2017), samples meet quality standards established by the
European Union regulation n° 2568/91 for extra virgin olive oil. The geographic
coordinates (latitude and longitude), altitude (m), annual mean temperatures (°C),
annual rainfalls (mm) and minimum and maximum mean temperatures (°C) of the
different producing areas of Arbequina virgin olive oils are depicted in Table 1.

Resultados
135
Table 1. Geographic coordinates (Latitude and Longitude), altitude (m), annual mean temperatures (◦C), annual rainfalls (mm) and minimum and
maximum mean temperatures (◦C) of the different locations of Arbequina virgin olive oils from Spain (1-9) and Brazil (10, 11).
Oil Sample Location Latitude Longitude Altitude Mean
Temperature Rainfall
Minimum
Temperature
Maximum
Temperature
1 Granada 37� 03ʾ N 3� 36ʾ W 905 17 385 7 26
2 Jaén 38� 03ʾ N 3� 29ʾ W 580 17 422 9 26
3 Málaga 37� 06ʾ N 4� 22ʾ W 883 20 411 13 27
4 Cádiz 36� 43ʾ N 6� 01ʾ W 47 19 636 13 24
5 Sevilla 37� 17ʾ N 4� 53ʾ W 416 19 598 11 27
6 Albacete 39� 00ʾ N 1� 54ʾ W 677 13 293 6 25
7 Toledo 39� 53ʾ N 4� 28ʾ W 459 14 391 7 26
8 Valladolid 41� 53ʾ N 5� 00ʾ. W 845 13 394 -1 27
9 Lérida 41� 36ʾ N 0� 35ʾ W 168 14 677 6 21
10 Rio Grande do
Sul 30� 00ʾ S 52� 52ʾ W 88 16 1691 3 22
11 Minas Gerais 22� 18ʾ S 42� 22ʾW 1310 17 1330 14 21
Geographic coordinates (latitude, longitude and altitude) proximate to olive grove were found using Google Earth program (Google Inc, USA). Climatic
data of temperature and rainfall were supplied by the Spanish Meteorology Agency (Aemet, 2015) and the National Meteorology Institute of Brazil
(INMET, 2015).

Resultados
136
2.3. Determination of CoQ10
The samples were analyzed according to Venegas et al. (2011). A quantity of 990 μL of
1-propanol was mixed with 10 μL of the oil, vortex and centrifuged at 11300g for 5 min
at room temperature. The subsequent supernatant was diluted 1/500 in 1-propanol prior
to HPLC injection. CoQ10 present in the oil extract were separated by reversed-phase
high-performance liquid chromatography (HPLC, Gilson, WI) with a C18 symmetry
column (3.5 μm, 4.6 x 150 mm) (Waters Chromatography, Barcelona, Spain) using a
mobile phase consisting of methanol, ethanol, 2-propanol, acetic acid glacial
(500:500:15:15), and 50 mM sodium acetate at a flow rate of 0.9 mL/min. The
electrochemical detector consisted of an ESA Coulochem III with the following setting:
guard cell (upstream of the injector) at +900 mV and conditioning cell at -600 mV
(downstream of the column) followed by the analytical cell at +350 mV. While this
method is able to detect CoQ10 in its reduced (ubiquinol) and oxidized (ubquinone)
form, ubiquinol was not detected in our conditions of extraction and analysis. The
CoQ10 concentrations of the oxidized form were estimated by comparison of the peak
areas with those of standard solutions of known concentrations (0, 25, 100, 300, and
600 ng/mL). Values of calibration curve are reported in Supplementary Table. S1 in the
online version at DOI: http://dx.doi.org/10.1016/j.jfca.2017.07.036. The results were
expressed in mg per L of sample.
2.4. Determination of Tocopherols
The tocopherols isomers were determined as described by Rueda et al. (2016).
Briefly, 1 g of oil was dissolved in 25 mL n-hexane. The samples were analyzed by an
HPLC system (Water Alliance 2695 separations module, Milford, MA) equipped with a
silica column (4 mm × 250 mm) and eluted with hexane: isopropanol (99.25:0.75 v/v) at

Resultados
137
a flow rate of 1 mL/min during 25 min. The tocopherols were detected by fluorescence
(Water 2475) with excitation wavelength at 290 nm and emission wavelength at 330
nm. A calibration curve using external standards (α-, β-, γ-, and δ-tocopherols) was used
for quantification. The results were expressed as mg per kg of sample.
2.5. Individual phenolic compounds
The individual phenolic fraction of samples was performed after an extraction
with methanol/water (80:20) according to the International Olive Oil Council (IOOC,
2009). The extracts were analysed by UPLC-TOF-MS following the method validated
by Rivas et al. (2013). The UPLC system consisted of a AcQuity UPLC equipped with a
binary pump system (Waters, Milford, MA, USA) using a AcQuity UPLC BEH C18
column (1.7mm, 2.1 mm x 100 mm inner diameter). The column was kept at 40°C and
the flow rate was 0.4 mL/min. The mobile phase was composed by eluent A, MilliQ
water with formic acid (0.1%) and eluent B, methanol with formic acid (0.1%). The
elution started at 5% of eluent B for 1 min, then was linearly increased to 100% of
eluent B in 11 min and kept isocratic for 5 min; then, it got back to initial conditions in
0.1 min; the equilibration time was 2.9 min. The injection volume was 7µL, and all
samples were filtered through 0.22 mm before chromatography. The UPLC was coupled
to a Micromass/Waters LCTPremier XE benchtop orthogonal acceleration time-of-flight
(oa-TOF) mass spectrometer equipped with an ESI interface. Parameters for analysis
were set using negative ion mode with spectra acquired over a mass range from m/z 100
to 1000. The optimum values of the electrospray ionization MS parameters were as
follows: capillary voltage 2.6 kv; drying gas temperature 200°C, desolvation gas flow
800 L/h. For optimum detection resolution, a solution was prepared of 1 mg/L leucine
enkephalin in acetotrinile/H2O (1:1, v/v) containing 0.1% formic acid continuously

Resultados
138
infused at a flow rate of 0.05 mL/min by an external rotary pump. This solution was
also used for continuous calibration of the equipment, as its perfusion is simultaneous to
that of the sample and served as a reference. Mass calibration was performed using a
solution of sodium formate (containing 0.05 of formic acid and 5 mM of sodium
hydroxide in iso- propanol/H2O 9:1, v/v). Accurate mass data of molecular ions were
processed with MassLynxs (Waters).
Analytical parameters of the methods used are shown as supplementary file.
2.6. Statistical analysis
Results were analyzed by analysis of variance (one-way ANOVA), with the
geographic origin of oils (regions 1–11) as the main factor. Tukey’s test was used to
compare mean values between oils from the different regions, and differences were
established at P < 0.05. The relationships of the different variables with the climate
characteristics and the altitude of the producing regions were evaluated by Pearson’s
coefficient. These statistical calculations were carried out using SPSS version 21.0
(IBM Corporation, New York, USA).
In addition, chemometric analysis was performed including all the minor
bioactive compounds evaluated in the present study (CoQ10; tocopherols - α, β, γ and
phenolic compounds). In a first explorative step a hierarchical clustering analysis (HCA)
was carried out to identify eventual similarities between the olive oils samples of
different geographic origin, by calculating multidimensional squared Euclidean
distances of scores applying the single linkage-clustering method. Posteriorly, to reduce
the variables into a small number of factors and explore the contribution of variables to
oil differentiation, a factorial analysis (FA) using a varimax rotation was applied. All

Resultados
139
the chemometric analysis were performed using Stat Graphics Centurion XV software
(Stat Point Technologies, Inc., USA, 2006).
3. Results and discussion
3.1. CoQ10
The levels of CoQ10 are shown in Figure 1. According to Pravst et al (2010),
foods containing over than 46 mg CoQ10/L of olive oil are considered a very rich source
of CoQ10. Therefore, all the samples evaluated in the present study may be classified as
very rich CoQ10 sources. As shown in Figure 1, statistical differences (P < 0.01) were
found among CoQ10 content of the samples ranging between 85.3 ± 5.8 mg/L (region 1,
corresponding to Granada, Spain) and 48.7 ± 1.6 mg/L (region 9, Lérida, Spain) (mean
± SE). Brazilian oils showed intermediate values of 49.5 ± 2.3 mg/L and 60.0 ± 1.9
mg/L, for areas 10 and 11, respectively. There is limited information about CoQ10
content in monovarietal EVOO. A previous study comparing different cultivars from
several countries (Zmitek et al., 2014) showed that CoQ10 is greatly driven by genetic
factors; the highest content was observed in the cultivar Hojiblanca (98 mg/L) followed
by Picual (63 mg/L) and Arbequina (58 mg/L). Values of 77.5 mg/L of CoQ10 content
have been found in Spanish EVOO of Picual cultivar (Venegas et al., 2011), similarto
the highest levels detected among oils in the present assay (samples from Spanish
locations 1, 2, 3 and 6). Higher values, above 90 mg/L, have been observed in
commercial Italian EVOO (Cabrini et al., 2001).

Resultados
140
0
50
100
1 2 3 4 5 6 7 8 9 10 11
Co
Q1
0 (
mg
/L)
Oil samples
a a,b
a,b,ca,b,c
a,b,ca,b,c,d a,b,c,db,c,d
c,dc,d
d
Figure 1. Coenzyme Q10 levels of Arbequina olive oils from Spain (1-9) and Brazil (10-11).
(values are means ± SE, n=3). Different letters indicate significant differences (ANOVA and
Tukey test, P < 0.05).
These findings support that EVOOs are one of the best natural sources of dietary
CoQ10 (Zmitek et al., 2014). Since the current intake of CoQ10 in developed countries is
not sufficient to compensate the age-related decline (Zmitek et al., 2014), promoting the
intake of EVOO may be a good alternative to supplementation.
In addition to genetic factors, the CoQ10 content of oils may be affected by
geographic and climate conditions, as was supported by the results of the present assay,
in which significant differences were found between oils from the same cultivar. In this
sense, statistical correlations (P < 0.01) were found between CoQ10 content and geo
climate factors of production areas, positive with altitude (r= 0.461) and maximum
temperature (r= 0.484) and negative with rainfalls (r= -0.494). Accordingly, the areas of
low rainfall and high altitude (Table 1), such as Granada (region 1), produced the oil
with the highest CoQ10 content. In the same line, high rainfall levels in Brazilian
growing areas (regions 10 and 11) could have a negative effect on the CoQ10 content of

Resultados
141
oils, although in the case of oil from region 11 this effect seems to be partly
counteracted by the positive influence of the high altitude.
3.2. Tocopherols
Table 2 shows tocopherols content (α, β, γ and total) for Arbequina EVOO from
Spain (1-9) and Brazil (10-11). The major isomer quantified was α - tocopherol,
representing more than 98% of the total, ranging from 92 to 208 mg/kg of oil, followed
by lower amounts of β (0.8 - 1.9 mg/kg ) and γ (0.7 - 2.15 mg/kg ) fractions. No
detectable values of δ- tocopherol were observed.
The content of the tocopherol fractions differed between EVOO samples from
the different regions (P < 0.05). Values of Brazilian oils were within the range found for
Spanish samples, with the only exception of the γ –isomer, which was lower among
Brazilian oils. Thus, it was shown that the Arbequina oils newly introduced in Brazil
have similar tocopherol content that the oils from the autochthonous Spanish cultivar.
In general, α - tocopherol concentration found in the present assay is similar to
values reported for Arbequina EVOO from Spain and the introduced from Argentina,
Tunisia and Turkey, which vary from 150 to 300 mg/kg (Beltrán et al., 2010; Dabbou et
al., 2010; López-Cortés et al., 2013; Torres et al., 2009; Uluata et al., 2016; Yousfi et
al., 2012). The lowest contents of α - tocopherol among samples of the present study
were found in Spanish locations 4 (Cádiz) and 9 (Lérida). The low tocopherol level in
oil of location 4 could be related to the low oxidative stability (5.32 hours, measured by
the Rancimat method) previously described in oils from this region (Borges et al.,
2017). Large variations in α-tocopherol content have been observed in Brazilian
Arbequina EVOO from Minas Gerais depending on the harvest year (62 and 201 mg/kg
for crop years 2010 and 2011, respectively) (Ballus et al., 2014). Thus, values of 147

Resultados
142
and 171 mg/kg found in Brazilian samples in the present study (zones of Rio Grande do
Sul and Minas Gerais, respectively) were within this wide range.
Table 2. Tocopherols content (mg/kg) of Arbequina olive oils from Spain (1-9) and Brazil (10-
11).
α - Tocopherol β- Tocopherol γ - Tocopherol Total
Regions
1 179 e 1.00 a,b,c 1.90 e 182 e
2 202 f 1.03 b,c 0.90 a,b,c 204 f
3 157 c,d 0.85 a,b 1.15 d 159 c,d
4 92 a 0.80 a 0.75 a 93 a
5 164 d 0.90 a,b,c 0.73 a 166 d
6 198 f 1.05 b,c 1.13 c,d 200 f
7 208 f 0.85 a,b 1.00 b,c,d 210 f
8 167 d,e 0.85 a,b 2.15 f 170 d,e
9 128 b 0.75 a 1.05 c,d 130 b
10 147 c 0.85 a,b 0.70 a 148 c
11 171 d,e 0.90 a,b,c 0.80 a,b 173 d,e
SEM 0.87 0.01 0.01 0.86
Means values in each column with different letters are significantly different between regions or
countries (n=3, ANOVA and Tukey test, P < 0.05).
Some previous data show that tocopherol content of olive oils has a genetic
component, i.e., it is highly depending on cultivar, but it may also be affected by
climatic conditions, mainly temperature, rainfalls and altitude (Beltrán et al, 2010;
Dabbou et al., 2009; Ilyasoglu et al., 2016). Therefore, the growing location area, with
different conditions of rainfall and temperature, influence the tocopherol content and
composition of the oils (Aguilera et al., 2005), in agreement with present results. In
addition, significant correlations were verified relating geo climate conditions with
tocopherol content of the samples (Table 4). In concordance with previous research
reporting increased tocopherol levels in dry crop seasons (Beltrán et al., 2010;
Ilyasoglu et al., 2016), our findings show a negative relationship between rainfalls and
γ (P<0.01) and total tocopherol content (P<0.05). On the contrary, some authors do not

Resultados
143
observe a consistent influence of rainfalls on tocopherol levels in Tunisian oils (Dabbou
et al., 2009), since the effects of climatic conditions on tocopherols seem to be cultivar-
dependent (Beltrán et al., 2010).
Relationships between the temperature of the growing area and tocopherols have
been scarcely studied. In the present study, conflictive correlations among temperature
and tocopherols were found, since they were negative with the mean (for α-, γ- and
total) and minimum temperatures (for γ-) and positive with maximum temperatures (for
α- and total tocopherols) (Table 4). That means that annual mean temperature of the
growing zone significantly affects the tocopherol content, but peaks of cold and heat
also seem to disturb this variable. Regarding the altitude effects, some authors observe
increased tocopherol content in olive oils with increasing the altitude (Dabbou et al.,
2009) and, thus, altitude has been proposed as an important factor to be considered in
tocopherol level of oils (Kalogeropoulos and Tsimidou, 2014). In this line, positive
correlations of altitude with tocopherol concentration of the oils have been found in our
study (Table 4). However, oils from areas with the highest altitude were not those with
the highest tocopherol content, which suggests that altitude has not a definitive
influence and could be counteracted by effects of other geo climatic factors.
As was reported before, the climate conditions have primarily an effect on
biochemical reactions during growth and ripening, mainly in some enzymatic reactions
that are essential for the tocopherol synthesis (Beltrán et al., 2010; Ilyasoglu et al.,
2016). In this sense, increasing the tocopherol content could be an auto-protection
mechanism of plants against some stress conditions, such as water stress (Beltrán et al.,
2010). However, there is a maximum level depending on the fruit development
(Georgiadou et al., 2015). In this line, our results show that climate factors are linked to

Resultados
144
tocopherols content and may impact them, but the influence of other factors providing
synergic or antagonist effects, as the maturation index, cannot be discarded.
3.3. Phenolic compounds
The concentration of phenolic compounds (apigenin, luteolin, naringenin, p-
coumaric acid, vanillic acid and hydroxytyrosol) of olive oil samples from different
geographical areas of Spain and Brazil is shown in Table 3. Statistical differences
between samples (P < 0.05) were found in all individual compounds. Strong differences
were observed between Brazilian oils, being the content of all phenolic compounds
always higher in sample 10 than sample 11. Three main groups of phenolic compounds
were identified: flavonoids (apigenin, luteolin), phenolic acids (naringenin, p-coumaric
acid, vanillic acid) and phenolic alcohols (hydroxytyrosol). Flavonoids were the major
group, ranging from 93 to 36% of the total quantified, followed by phenolic acids (10-
30 % of the total), with the exception of samples from location 3 (with 14 % of
flavonoids and only 2% of phenolic acids). The highest levels of hydroxytyrosol were
found in oils from Spanish locations 3 (1500 µg/kg, contributing 83 % to the total
phenols examined) and Brazilian region 10 (1050 µg/kg, 31 % of the total). The
Brazilian sample 11 showed a different profile of phenolic compounds in comparison
with the other samples; with equilibrate quantities of the quantified phenolic groups.

Resultados
145
Table 3. Phenolic content (µg/kg) of Arbequina olive oils from Spain (1-9) and Brazil (10-11).
Phenolic content
Flavonoids Phenolic acids Phenol alcohols
Apigenin Luteolin Naringenin p-Coumaric acid Vanillic acid Hydroxytyrosol
Regions
1 265 e,f 858 c,d 25.0 a,b 55.0 c 119 c 90.0 a,b
2 309 f,g 1054 d,e 51.5 c,d 59.0 c 59.5 b 287 d,e
3 26.0 a 241 a,b 30.0 b n.d n.d 1500 g
4 204 b,c 773 c 16.5 a 24.5 a,b 28.5 a 3.00 a
5 161 b 463 b 63.5 d 13.5 a n.d 379 e
6 326 g 1257 f,g 50.0 c 97.0 e 124 c 251 c,d,e
7 424 h 1148 e 56.0 c,d 94.0e 121 c 161 b,c,d
8 184 b,c 748 c 16.0 a 91.0 e n.d 204 b,c,d
9 236 d,e 1236 f,g 58.5 c,d 31.0 b 70.0 b 149 b,c
10 398 h 1482 g 133 e 228 f n.d 1050 f
11 15.0 a 92.0 a 21.0 a,b 74.0 d n.d 92.0 a,b
SEM 40.3 133 10.1 18.7 16.2 8.1
Means values in each column with different letters are significantly different between regions or countries (ANOVA and Tukey test, P < 0.05).
Resultados
146
Current data show a large variation of phenolic content for EVOO samples,
ranging between 50-940 mg/kg (Servili et al., 2014). Nevertheless, available data in the
literature are very difficult to compare, since different methods have been used to
separate, identify and quantify the phenolic compounds in EVOO samples around the
world (Ballus et al., 2015). Besides, commercial standards are not totally available and
some of these compounds are identified and quantified on the basis of other ones with
similar structures (Ballus et al., 2015; Bakhouche et al., 2013). In this sense, nowadays
there is not an official method able to show a complete profile of phenolic compounds
and satisfy the new health claims on olive oil phenols, although the scientific
community has been working on developing it (Reboredo-Rodriguez et al., 2016).
In accordance with data of the present study, flavonoids (apigenin, luteolin) and
phenolic acids (p-coumaric acid, vanillic acid) have been previously found in Arbequina
cultivar (Bakhouche et al., 2013, Rivas et al., 2013; Yousfi et al., 2012). However, up to
our knowledge, naringenin was not reported yet in Arbequina oil, but was recently
detected in oleaster, leaves, olive barks, wastewater and EVOO of Empeltre and Arauco
cultivars from Argentina (Bouarroudj et al., 2016, De Fernandez et al., 2014,
Leouifoudi et al., 2014; Tóth et al., 2015). On the other hand, hydroxytyrosol is one of
the most important phenolic compounds in olive oils (Bakhouche et al., 2013) and it has
been widely associated with the high antioxidant capacity in EVOO (Servili et al.,
2014). Accordingly, Arbequina oils from region 3 (Málaga, Spain) have a high
resistance to oxidation (15.85 hours of oxidative stability, by the Rancimat method)
(Borges et al., 2017). The health beneficial properties of hydroxytyrosol have been
recognized by the EFSA (EFSA, 2011). Concerning geographical area and climate
conditions, several authors have studied the relationship of phenolic compounds with
them (Bakhouche et al., 2013; Dabbou et al., 2009; Ilyasoglu et al., 2016). In this line,

Resultados
147
positive correlations between altitude and some of the analyzed phenolic compounds
such as naringenin (r=0.458), p-coumaric acid (r=0.578) and hydroxytyrosol (r=0.618)
were found in our study (Table 4). In agreement, Dabbou et al. (2009) attribute
variations of phenolic profile of Tunisian EVOO to the geographic area characteristics,
particularly to altitude. Furthermore, scientific data have shown that water status also
influence the phenolic profile of the olive oils, but the effect may differ depending on
the compounds, since the enzymes involved in the biosynthetic pathway of phenolic
compounds are affected by water stress conditions in a different way (Ilyasoglu et al.,
2010; Stefanoudaki et al., 2009). Thus, correlations between climatic conditions and
minor olive oil compounds may be mainly explained by the effects in enzymatic activity
reactions during the growth and ripening of olive fruits (Ilyasoglu et al., 2016).
Accordingly, relationships between climate variables of temperature and rainfalls and
phenol composition of oils were found in the present assay (Table 4).

Resultados
148
Table 4. Pearson’s correlation coefficient (r) between climate variables and altitude and analytical parameters (Coenzyme Q10, Tocopherols and
Phenolic content).
Symbols indicate significant correlations (* P <0.05, ** P < 0.01).
Altitude Temperature Rainfalls Minimum temperature Maximum temperature
Coenzyme Q10 0.461** 0.060 -0.494**
0.073 0.484**
α Tocopherol 0.543** -0.361* -0.316 -0.219 0.385*
β Tocopherol 0.376* -0.074 -0.257 -0.020 0.307
γ Tocopherol 0.437** -0.396* -0.446** -0.588** 0.309
Total 0.547** -0.365* -0.321* -0.226 0.389*
Apigenin 0.314 -0.390* -0.249 0.097 -0.179
Luteolin 0.315 -0.456**
-0.207 0.075 -0.374*
Naringenin 0.458**
0.000 0.286 0.439* -0.440
*
p-Coumaric acid 0.578**
-0.364* 0.417
* -0.021 -0.534
*
Vanillic acid -0.037 -0.470**
-0.511**
-0.191 0.066
Hydroxytyrosol 0.618**
0.466**
0.064 0.563**
0.066

Resultados
149
3.4. Chemometric analyses.
A hierarchical cluster analysis (HCA) was applied as an initial approach for
grouping samples that share common characteristics according to the analyzed
variables. HCA was obtained using the Euclidean distance of scores as a similarity
criterion and the results are shown in Figure 2.A. The dendogram plot defined five
distinctive clusters. Firstly, three separated cluster were observed for samples from Rio
Grande do Sul (10), Valladolid (8) and Málaga (3).The fourth cluster was composed by
the oils from Cádiz (4), Lérida (9), Sevilla (5) and Minas Gerais (11). The last one was
represented by the samples from Granada (1), Jáen (2), Albacete (6) and Toledo (7). It
was observed that oil from Rio Grande do Sul showed the biggest Euclidean distance
(high significance clustering), i.e the lowest similarities comparing with the other
groups.
In the factorial analysis, three factors justifying 76% of total variance were
obtained (F1 33%, F2 29%, F3 14%). F1 was mainly explained by phenolic compounds
(apigenin 0.92; luteolin 0.92; naringenin 0.81 and p-coumaric acid 0.77), F2 was
composed by CoQ10 (0.84) and tocopherols (α 0.83; β 0.83 and γ 0.36), while F3 was
mainly characterized by hydroxytyrosol (-0.87) and vanillic acid (0.66). According to
these factors, a spatial representation of the oils was obtained (Figure 2.B). A clear
separation of sample 10 was observed mainly due to F1 and F3, and thus, related with
the different content of polyphenols in this oils compared with the other samples,
particularly luteolin, p-coumaric acid and hydroxytyrosol. Also according to F1 and F3,
samples from locations 1, 2, 6 and 7 showed evident proximity. The remainder oils were
relatively grouped but, among them, samples from Málaga (3) were slightly away from
the other locations, which may be associated with its high level of hydroxytyrosol. This
entirely means that F2 (governed by CoQ10 and tocopherols) was not able to

Resultados
150
differentiate EVOO samples clearly, according to the content of lipophilic compounds
in the samples. However, F2 and particularly F3, with a strong impact of
hydroxytyrosol, could classify the samples in three separated blocks, as commented.
Thus, phenolic compounds were a useful tool to delimitate EVOO samples from the
different geographic area. In general terms, HCA was confirmed by the factorial
analysis, which in turn showed the weight of the variables in the classification of the oil
samples.
0
4
8
12
16
20
24
Eu
cled
ian
Dis
tan
ce
1 5 10831192 6 7 4
-6-3
03
69F1: 33%
-4,1
-2,1
-0,1
1,9
3,9
5,9
F2:14%-4,2
-2,2
-0,2
1,8
3,8
F 3
:14
%
1
2
3
4
5
6
7
8
9
10
11
A
B
1-Granada; 2-Jaén;3-Málaga; 4-Cádiz; 5-Sevilla;6-Albacete;7-Toledo;
8-Valladolid; 9-Lérida;10-Rio Grande do Sul; 11-Minas Gerais.
Figure 2. A- Dendrogram plot showing the conglomeration of olive oil samples from Spain (1-
9) and Brazil (10-11) obtained by clustering of CoQ10; tocopherols - α, β, γ and phenolic
compounds showing. B- PCA 3D plot obtained from CoQ10; tocopherols - α, β, γ and phenolic

Resultados
151
compounds representing the distribution of olive oil samples from Spain (1-9) and Brazil (10-
11).
4. Conclusions
Findings of the present study contribute to increasing the knowledge of the
EVOO grown in Brazil, a country with an incipient production of olive oil but with
great potential for its cultivation. In addition, comparative information with the original
cultivar produced in Spain is reported. Significant differences in the minor fraction
composition (CoQ10, tocopherols and phenolic compounds) were observed not only
between Spanish and Brazilian Arbequina oils but also between oils from the different
producing areas within each country. A high level of CoQ10 content of olive oils was
observed, especially among Spanish oils. Climatic and geographic factors of the
production zones seem to greatly affect the content of the parameters analyzed; positive
relationships of the altitude with the level of CoQ10, tocopherols and phenolics of the
oils were observed, whereas negative correlation with rainfalls were also shown.
Chemometric analyses demonstrated that oils were differentiated according to chemical
composition and origin area and that polyphenols (particularly hydroxytyrosol) had the
major weight in the oil classification.
The influence of other factors than those considered in the present study, such as
the ripeness index of olives, cannot be discarded, and therefore, the lack of this
information may be considered as a limitation of the study.
Conflicts
The authors declare no competing financial interest.

Resultados
152
Acknowledgements
We are grateful to the CAPES Foundation, (Ministry of Education) Brazil, for
scholarship support provided to the first author. LCL is supported by the “Ramón y
Cajal” National Programme (RYC‐2011‐07643) and the grants SAF2013‐47761‐R and
SAF2015‐65786‐R, Ministerio de Economía y Competitividad, Spain, and the ERDF.
This work is part of the doctoral thesis of Thays Helena Borges, Ph.D. student from the
Official Doctoral Program ‘‘Nutrition and Food Sciences” of the Granada University.
The authors also would like to thank Consejo Regulador de Denominación de Origen
(DOP) Estepa and DOP Les Garrigues; Casas Hualdo, Castillo Canena, Cortijo de Jara,
Quaryat Dilar and Olivas do Sul for the donation of samples. We would like to dedicate
to the memory of Carmen Cabrera-Vique.
References
Aemet, 2015. Agencia Estadual de Metereologica. (2015) Climate monitoring Spain.
Available from:
http://www.aemet.es/es/serviciosclimaticos/vigilancia_clima/resumenes. (Accessed
November 2015).
Aguilera, M. P., Beltrán, G., Ortega, D., Fernández, A., Jiménez, A., & Uceda, M.
(2005). Characterisation of virgin olive oil of Italian olive cultivars:Frantoio'and
Leccino', grown in Andalusia. Food chemistry, 89(3), 387-391.
Bakhouche, A., Lozano-Sánchez, J., Beltrán-Debón, R., Joven, J., Segura-Carretero,
A., Fernández-Gutiérrez, A. (2013). Phenolic characterization and geographical
classification of commercial Arbequina extra-virgin olive oils produced in southern
Catalonia. Food Research International, 50(1), 401-408.

Resultados
153
Ballus, C. A., Meinhart, A. D., de Souza Campos, F. A., da Silva, L. F. D. O., de
Oliveira, A. F., Godoy, H. T. (2014). A quantitative study on the phenolic compound,
tocopherol and fatty acid contents of monovarietal virgin olive oils produced in the
southeast region of Brazil. Food Research International, 62, 74-83.
Ballus, C. A., Quirantes-Piné, R., Bakhouche, A., da Silva, L. F. D. O., de Oliveira,
A. F., Coutinho, E. F., Godoy, H. T. (2015). Profile of phenolic compounds of Brazilian
virgin olive oils by rapid resolution liquid chromatography coupled to electrospray
ionisation time-of-flight mass spectrometry (RRLC–ESI-TOF-MS). Food Chemistry,
170, 366-377.
Beltrán, G., Jiménez, A., del Rio, C., Sánchez, S., Martínez, L., Uceda, M., Aguilera,
M. P. (2010). Variability of vitamin E in virgin olive oil by agronomical and genetic
factors. Journal of food composition and analysis, 23(6), 633-639.
Borges, T. H., Pereira, J. A., Cabrera-Vique, C., Lara, L., Oliveira, A. F., Seiquer, I.
(2017). Characterization of Arbequina virgin olive oils produced in different regions of
Brazil and Spain: Physicochemical properties, oxidative stability and fatty acid profile.
Food Chemistry, 215, 454-462.
Bouarroudj, K., Tamendjari, A., Larbat, R. (2016). Quality, composition and
antioxidant activity of Algerian wild olive (Olea europaea L. subsp. Oleaster) oil.
Industrial Crops and Products, 83, 484-491.
Cabrini, L., Barzanti, V., Cipollone, M., Fiorentini, D., Grossi, G., Tolomelli, B.,
Landi, L. (2001). Antioxidants and total peroxyl radical-trapping ability of olive and
seed oils. Journal of Agricultural and Food Chemistry, 49(12), 6026-6032.
Dabbou, S., Issaoui, M., Esposto, S., Sifi, S., Taticchi, A., Servili, M., Hammami, M.
(2009). Cultivar and growing area effects on minor compounds of olive oil from

Resultados
154
autochthonous and European introduced cultivars in Tunisia. Journal of the Science of
Food and Agriculture, 89(8), 1314-1325.
Dabbou, S., Brahmi, F., Taamali, A., Issaoui, M., Ouni, Y., Braham, M., ... &
Hammami, M. (2010). Extra virgin olive oil components and oxidative stability from
olives grown in Tunisia. Journal of the American Oil Chemists' Society, 87(10), 1199-
1209.
De Fernandez, M. D. L. A., SotoVargas, V. C., Silva, M. F. (2014). Phenolic
compounds and antioxidant capacity of monovarietal olive oils produced in argentina.
Journal of the American Oil Chemists' Society, 91(12), 2021-2033.
EFSA Panel on Dietetic Products Nutrition and Allergens, Scientific opinion on the
substantiation of health claims related to polyphenols in olive and protection of LDL
particles from oxidative damage (ID 1333, 1638, 1639, 1696, 2865), maintenance of
normal blood HDL cholesterol concentrations (ID 1639), maintenance of normal blood
pressure (ID 3781), “anti-inflammatory properties” (ID 1882), “contributes to the upper
respiratory tract health” (ID 3468), “can help to maintain a normal function of
gastrointestinal tract”(3779), and “contributes to body defences against external agents”
(ID 3467) pursuant to Article 13(1) of Regulation (EC) n° 1924/2006. EFSA J. 2011, 9,
2033–2058.
Georgiadou, E. C., Goulas, V., Manganaris, G. A., Kalaitzis, P., Fotopoulos, V.
(2015). Temporal analysis reveals a key role for VTE5 in vitamin E biosynthesis in
olive fruit during on-tree development. Frontiers in plant science, 6.
Ignat, I., Volf, I., Popa, V. I. (2011). A critical review of methods for characterisation
of polyphenolic compounds in fruits and vegetables. Food Chemistry, 126(4), 1821-
1835.

Resultados
155
Ilyasoglu, H., Ozcelik, B., Van Hoed, V., Verhe, R. (2010).Characterization of
Aegean olive oils by their minor compounds. Journal of the American Oil Chemists'
Society, 87(6), 627-636.
INMET, 2015. Instituto Nacional de Meteorología. Available from:
www.inmet.gov.br/portal/. (Accessed November 2015).
International Olive Oil Council (IOOC) (2009). Document COI/T.20/DOC. 29.
International Olive Oil Council, Madrid.
Jankowski, J., Korzeniowska, K., Cieślewicz, A., Jabłecka, A. (2016). Coenzyme
Q10–A new player in the treatment of heart failure? Pharmacological Reports, 68(5),
1015-1019.
Kalogeropoulos, N., Tsimidou, M. Z. (2014). Antioxidants in Greek virgin olive oils.
Antioxidants, 3(2), 387-413.
Laincer, F., Iaccarino, N., Amato, J., Pagano, B., Pagano, A., Tenore, G., Ritieni, A.
(2016). Characterization of monovarietal extra virgin olive oils from the province of
Béjaïa (Algeria). Food Research International, 89, 1123-1133.
Leouifoudi, I., Zyad, A., Amechrouq, A., Oukerrou, M. A., Mouse, H. A., Mbarki,
M. (2014). Identification and characterisation of phenolic compounds extracted from
Moroccan olive mill wastewater. Food Science and Technology (Campinas), 34(2),
249-257.
Lopez, S., Bermudez, B., Montserrat-de la Paz, S., Jaramillo, S., Varela, L. M.,
Ortega-Gomez, A., Muriana, F. J. (2014). Membrane composition and dynamics: a
target of bioactive virgin olive oil constituents. Biochimica et Biophysica Acta (BBA)-
Biomembranes, 1838(6), 1638-1656.

Resultados
156
López-Cortés, I., Salazar-García, D. C., Velázquez-Martí, B., Salazar, D. M. (2013).
Chemical characterization of traditional varietal olive oils in East of Spain. Food
research international, 54(2), 1934-1940.
Martín‐Peláez, S., Covas, M. I., Fitó, M., Kušar, A., & Pravst, I. (2013). Health
effects of olive oil polyphenols: recent advances and possibilities for the use of health
claims. Molecular nutrition & food research, 57(5), 760-771
Pravst, I., Zmitek, K., Zmitek, J. (2010). Coenzyme Q10 contents in foods and
fortification strategies. Critical reviews in food science and nutrition, 50(4), 269-280.
Pyo, Y. H. (2010). Coenzyme Q10 and Q9 contents in 6 commercial vegetable oils
and their average daily intakes in Korea. Food Science and Biotechnology, 19(3), 837-
841.
Reboredo-Rodríguez, P., Valli, E., Bendini, A., Di Lecce, G., Simal-Gándara, J. and
Gallina Toschi, T. (2016), A widely used spectrophotometric assay to quantify olive oil
biophenols according to the health claim (EU Reg. 432/2012). European Journal of
Lipid Science and Technology, 118: 1593–1599. http://dx.doi:10.1002/ejlt.201500313.
Rivas, A., Sanchez‐Ortiz, A., Jiménez, B., García‐Moyano, J., Lorenzo, M. L.
(2013). Phenolic acid content and sensory properties of two Spanish monovarietal
virgin olive oils. European Journal of Lipid Science and Technology, 115(6), 621-630.
Rueda, A., Samaniego-Sánchez, C., Olalla, M., Giménez, R., Cabrera-Vique, C.,
Seiquer, I., Lara, L. (2016). Combination of Analytical and Chemometric Methods as a
Useful Tool for the Characterization of Extra Virgin Argan Oil and Other Edible Virgin
Oils. Role of Polyphenols and Tocopherols. Journal of AOAC International, 99(2), 489-
494.

Resultados
157
Servili, M., Sordini, B., Esposto, S., Urbani, S., Veneziani, G., Di Maio, I., Taticchi,
A. (2014). Biological activities of phenolic compounds of extra virgin olive oil.
Antioxidants, 3(1), 1-23.
Stefanoudaki, E., Williams, M., Chartzoulakis, K., Harwood, J. (2009). Effect of
irrigation on quality attributes of olive oil. Journal of agricultural and food chemistry,
57(15), 7048-7055.
Thanatuksorn, P., Kawai, K., Hayakawa, M., Hayashi, M., Kajiwara, K. (2009).
Improvement of the oral bioavailability of coenzyme Q 10 by emulsification with fats
and emulsifiers used in the food industry. LWT-Food Science and Technology, 42(1),
385-390.
Torres, M. M., Pierantozzi, P., Cáceres, M. E., Labombarda, P., Fontanazza, G.,
Maestri, D. M. (2009). Genetic and chemical assessment of Arbequina olive cultivar
grown in Córdoba province, Argentina. Journal of the Science of Food and Agriculture,
89(3), 523-530.
Tóth, G., Alberti, Á., Sólyomváry, A., Barabás, C., Boldizsár, I., Noszál, B. (2015).
Phenolic profiling of various olive bark-types and leaves: HPLC–ESI/MS study.
Industrial Crops and Products, 67, 432-438.
Turunen, M., Olsson, J., Dallner, G. (2004). Metabolism and function of coenzyme
Q. Biochimica et Biophysica Acta (BBA)-Biomembranes, 1660(1), 171-199.
Uluata, S., Altuntaş, Ü., Özçelik, B. (2016). Biochemical Characterization of
Arbequina Extra Virgin Olive Oil Produced in Turkey. Journal of the American Oil
Chemists' Society, 93(5), 617-626.
Venegas, C., Cabrera-Vique, C., García-Corzo, L., Escames, G., Acuña-Castroviejo,
D., López, L. C. (2011). Determination of coenzyme Q10, coenzyme Q9, and melatonin
Resultados
158
contents in virgin argan oils: Comparison with other edible vegetable oils. Journal of
agricultural and food chemistry, 59(22), 12102-12108.
Yousfi, K., Weiland, C. M., Garcıa, J. M. (2012). Effect of harvesting system and
fruit cold storage on virgin olive oil chemical composition and quality of superintensive
cultivated ‘Arbequina’olives. Journal of agricultural and food chemistry, 60(18), 4743-
4750.
Zmitek, K., Rodríguez Aguilera, J. C., Pravst, I. (2014). Factors influencing the
contents of coenzyme Q10 and Q9 in olive oils. Journal of agricultural and food
chemistry, 62(14), 3211-3216.

Resultados
159
Table . Analytical parameters of methods: tocopherols, polyphenols and coenzyme Q10.
Compound Chemical Formula RT (min) LOQ (μg/Kg) Calibration (mg/L) R2
Phenols
Hydroxytyrosol C8H10O3 2.74 10 y=0.17x+0.99 0.999
Apigenin C15H10O5 7.30 10 y=0.97x+62.08 0.933
Naringenin C15H12O5 6.77 10 y=0.86x+22.73 0.988
Luteolin C15H10O6 6.84 10 y=0.68x+36.192 0.95
Syringic acid C9H10O5 4.26 10 y=0.08x+1.83 0.991
p-Coumaric acid C9H8O3 4.69 10 y=0.26x+0.008 1
Gallic acid C7H6O5 1.38 10 y=0.15x+0.45 0.999
Vanillic acid C8H8O4 3.93 10 y=0.05x-0.30 0.999
Ferulic acid C10H10O4 4.98 10 y=0.43x-0.90 0.994
Tocopherols
Compound Chemical Formula RT (min) LOQ (mg/Kg) Calibration (mg/L) R2
Tocopherol C29
H50
O2 5.358 50 y=2.88·10
5x+3.41·10
4 0.999
Tocopherol C28
H48
O2 9.507 2.5 y=3.83·10
5 x-3.34·10
3 0.999
Tocopherol C28
H48
O2 9.976 5 y=3.67·10
5 x-5.62·10
3 0.999
Tocopherol C27
H46
O2 15.278 2.5 y=4.29·10
5 x-3.76·10
3 0.999
Coenzyme Q10 Compound Chemical Formula RT (min) LOQ (ng/mL) Calibration (mg/L) R
2
Q10 C59H90O4 16.2 2.5 y=3.27·10-5
x-2.59 0,996

Resultados
160
EVOO from
Spain and Brazil HPLC
CoQ10,
Tocopherols
Phenolic compounds
Chemometric analysis
Spain Brazil
GRAPHICAL ABSTRACT

Resultados
161
Artículo 3
General Paper
Study of the antioxidant potential of Arbequina extra
virgin olive oils from Brazil and Spain applying combined
models of simulated digestion and cell culture markers
Thays H. Borges, José Alberto Pereira, Carmen Cabrera-Vique, Isabel Seiquer.
______________________________________________________________________
Journal of Functional Foods, 2017, 37:209-21
Received 19 April 2017
Accepted 25 July 2017

Resultados
162

Resultados
163
Study of the antioxidant potential of Arbequina extra virgin olive oils from Brazil
and Spain applying combined models of simulated digestion and cell culture
markers
Thays H. Borges a,b
, José Alberto Pereira c, Carmen Cabrera–Vique
b, Isabel Seiquer
a*
a Departamento de Fisiología y Bioquímica de la Nutrición Animal, Estación
Experimental del Zaidín, Consejo Superior de Investigaciones Científicas (CSIC),
Camino del Jueves, 18100 Armilla, Granada, Spain.
b Departamento de Nutrición y Bromatología, Facultad de Farmacia, Universidad de
Granada, Campus de Cartuja 18012 Granada, Spain.
c REQUIMTE-LAQV, School of Agriculture, Polytechnic Institute of Bragança,
Campus de Santa Apolónia, 5300-253 Bragança, Portugal.
* Corresponding author: Isabel Seiquer, Departamento de Fisiología y Bioquímica de la
Nutrición Animal, Estación Experimental del Zaidín (CSIC), Camino del Jueves s/n,
18100 Armilla, Granada, Spain.
Tlf. +34-958572757
Fax: +34-958572753
E-mail address: [email protected]
Short title: Antioxidant potential of Arbequina extra virgin olive oil

Resultados
164
ABSTRACT
A physiological approach to assessing the antioxidant potential of Arbequina EVOO
from different zones of Brazil and Spain was performed, applying a combined model of
simulated digestion and cell cultures, using the Caco-2 cell line. Our results showed an
increasing of total phenolic content (TPC) and antioxidant properties promoted by the in
vitro digestion. Preincubating Caco-2 cells with bioaccessible fractions of oils
counteracted the cytotoxic effect promoted by an oxidising agent (t-BOOH), preserving
cell viability and reducing the generation of reactive oxygen species (ROS). The
protective effect on ROS production was associated with the antioxidant activity (DPPH
assay), but no relation with the TPC of the digested samples was found. Differences in
the parameters evaluated were observed among the samples, which were related to
climatic characteristics of the production zones. It was concluded that transformations
during the digestive process are important for establishing the antioxidant potential of
the oils.
Keywords: Extra virgin olive oil, Antioxidant properties, Polyphenols, Digestion,
Caco-2 cells, ROS.
Abbreviations: ABTS, 2,2-azinobis-(3-ethylbensothiazoline)-6-sulfonic acid; BF,
bioaccessible fraction; DMEM, Dulbecco’s modified minimal essential medium; DPPH,
2,2-diphenyl-1-picrylhydrazyl; EVOO, extra virgin olive oil; FRAP, ferric reducing
power; FBS, heat-inactivated fetal bovine serum; MTT, 3-(4,5-dimethylthiazol-2-yl)-
2,5-diphenyltetrazolium bromide; RF, residual fraction; ROS, reactive oxygen species;
t-BOOH, tert –butylhydroperoxide; TPC, total polyphenol content.

Resultados
165
1. Introduction
Extra virgin olive oil (EVOO) consumption has been intensely associated with multiple
healthy properties, such as prevention of coronary and degenerative disease (Chiesi,
Fernandez-Blanco, Cossignani, Font, & Ruiz, 2015; Servili et al., 2013). These
beneficial effects have been mainly attributed to polyphenols, which are powerful
antioxidants, and also possess other potent biological activities such as anti-
inflammatory, anti-cancer, antimicrobial, antiviral, anti-atherogenic or hypoglycemic
(Barbaro et al., 2014). Special attention has received the study of the antioxidants of
EVOO, due to their importance from health, biological and sensory points of view
(Servili et al., 2014)
Several studies have been focused on the characterisation of phenolic content
and antioxidant capacity of monovarietal olive oils of different areas from the
Mediterranean basin and, more recently, from newly introduced varieties worldwide
(Bouarroudj, Tamendjari & Larbat, 2016; Dabbou et al., 2010; Köseoğlu, Sevim &
Kadiroğlu, 2016; Uluata et al., 2016; Xiang et al., 2017). In this regard, Brazil has
beginning to cultivate olives and has shown a huge potential to produce olive oil.
Currently, 70% of Brazilian olive oil production is from Arbequina cultivar (Olive Oil
Times, 2017); however, information on the antioxidant power of Brazilian virgin olive
oil is still lacking.
Antioxidant properties of oils have been traditionally studied in chemical
extracts by applying assays to evaluate radical scavenging capacity (DPPH and ABTS)
and ferric-reducing power (FRAP) (Kalogeropoulos et al., 2014; Samaniego Sánchez et
al., 2007). Nevertheless, the use of extraction procedures using organic solvents may
not be a real physiological approach to measure the potential in vivo effects of the oils,
owing to that the first requirement for a dietary compound to exert a biological activity

Resultados
166
is the maintenance of its properties after the digestion process (Pastoriza, Delgado-
Andrade, Haro & Rufián-Henares, 2011). This statement implies that bioactive
compounds must be bioaccessible, i.e., released from the food matrix during digestion
and, thus, available to be absorbed by the intestinal cells (Carbonell-Capella,
Buniowska, Barba, Esteve & Frígola, 2014). The in vitro static methods simulating
gastrointestinal digestion allow mimicking physiological conditions in vivo, taking into
account the presence of digestive enzymes and their concentrations, pH, digestion time
and salt concentrations, among other factors (Minekus et al., 2014). In addition,
coupled to cell line models enable studies of antioxidant cell markers and intestinal
absorption, elucidating the potential impact of these compounds on human health
(Borges, Cabrera-Vique & Seiquer, 2015; Soler et al., 2010). Previously, our research
group has applied successfully Caco-2 cell lines as a model to study absorption and
metabolism in small intestine of minerals and trace elements, products of Maillard
reaction and phenolic compounds from various foodstuff, including EVOO (Mesías ,
Seiquer & Navarro, 2009; Rueda, Cantarero, Seiquer, Cabrera-Vique & Olalla, 2017;
Ruiz-Roca, Navarro & Seiquer, 2008; Seiquer, Rueda, Olalla, & Cabrera-Vique, 2015).
Antioxidant and chemoprotective properties of individual components of olive
oil extracts and olive byproducts have been reported in cell cultures such as Caco-2,
HepG2 and red blood cells, as well as the protective effects against induced oxidative
stress (Chiesi et al., 2015; Deiana et al., 2010; Incani et al., 2016; Paiva- Martins et al.,
2015; Rubió et al., 2014). However, there is scarce information concerning the potential
antioxidant effect of all complex bioactive components of EVOO and their metabolites
after the digestive process, or about the subsequent intestinal absorption.
The influence of different factors on the antioxidant properties of EVOO has
been well-documented, such as cultivar, storage period, stages of olives ripening and

Resultados
167
technologic aspects of oil production (Köseoğlu, Sevim & Kadiroğlu, 2016; Uluata et
al., 2016). However, up to the date, there are limited data regarding the antioxidant
activity of monovarietal EVOO from different geographical areas, after the
biotransformation underwent during gastrointestinal digestion. In a previous paper we
have shown that some characteristics of Arbequina EVOO, such as oxidative stability or
colour, are related with geographic and climatic factors of the production zones (Borges
et al., 2017). Thus, it is possible that antioxidant properties of oils could also be
influenced by geoclimatic conditions.
Therefore, the aim of the current study was to perform a physiological approach
of the antioxidant potential of Arbequina EVOO from different Brazilian and Spanish
producing regions. With this purpose, a combined model of in vitro digestion and cell
cultures was applied. The antioxidant activities of oils after digestion have been studied
by in vitro assays (DPPH, ABTS and FRAP) and cell antioxidant markers (cell
proliferation and reactive oxygen species production), testing, moreover, the protective
effect against an induced oxidative stress. Finally, the absorption of polyphenols and
antioxidant activity across Caco-2 monolayers was also performed.
2. Materials and methods
2.1. Chemicals
All chemicals were analytical reagent grade or high purity. Bidistilled deionized water
was obtained from a Milli-Q purification system (Millipore, Bedford, MA). Folin –
Ciocalteau reagent, 6-hydroxy-2,5,7,8-tetramethyl-chroman-2-carboxylic acid (Trolox),
2,2-diphenyl-1-picrylhydrazyl (DPPH), pepsin, pancreatin, bile salts, HEPES and tert -
butylhydroperoxide (t-BOOH), as were all cell culture media and cell culture-grade

Resultados
168
chemicals were provided by Sigma (Sigma–Aldrich, St. Louis, MO). 2,2-azinobis-(3-
ethylbensothiazoline)-6-sulfonic acid (ABTS) was obtained from Amresco (Solon,
USA). Ethanol and methanol were purchased from VWR (Barcelona, Spain). Sodium
bicarbonate, acetate sodium, sodium carbonate, hydrochloric acid (37%), caffeic acid,
hydrochloric acid, anhydrous sodium carbonate and potassium hexacyanoferrate(III)
were obtained from Merck (Darmstad, Germany). 2,4,6-Tri(2-pyridyl)-s-triazine
(TPTZ) and iron (III) chloride for the ferric reducing power (FRAP) method was
obtained from Fluka Chemicals (Fluka Chemicals, Madrid, Spain).
2.2. Samples
A total of 33 samples of Arbequina EVOO from 11 different geographic zones (n = 3
from each producing region) were studied. Nine regions of olive oil production in Spain
(Granada, Jaén, Málaga, Cádiz, Sevilla, Albacete, Toledo, Valladolid and Lérida,
samples 1 to 9) and two regions in Brazil (Rio Grande do Sul and Minas Gerais,
samples 10 and 11) were selected. The olives were harvested always at the early stage
of harvest; the harvest dates were: late October to mid-November of 2014 for Spanish
samples and March to early April of 2015 for Brazilian samples. The oil was extracted
within 24h, under a two-phase extraction system. The oils were directly donated by the
producers, adequately packaged for preserving from light and high temperatures and
sent to CSIC laboratories (Granada, Spain) to perform the analysis. Information on the
geographic coordinates and geo climate characteristics of the different locations of the
oils is shown as supplementary material (S1). All the samples were according with the n

Resultados
169
ormative established by the European Union regulation n° 2568/91 for extra virgin olive
oil, as was showed previously (Borges et al., 2017). The scheme of the general
procedure applied on the EVOO samples in the present assay can be observed in Fig. 1.
All the determinations were done in triplicate, unless otherwise stated.
EVOO Sample
Chemical Extraction
Total phenolic content, Antioxidant activity
Sample + n-hexane
MeOH:Water (80:20)
Centrifugation
Lipidic Metanolic
MeOH:Water
Centrifugation
Metanolic
Chemicalextract
In vitro digestion
Sample + Water (1:10)
Gastric digestion
Intestinal digestion
Residual fraction
Centrifugation
Bioacesiblefraction
Caco-2 cells assays
Absorption Antioxidant
Markers
Viability ROS
pH 7
Fig. 1. Scheme of the general procedure applied to the EVOO samples.
2.3. In vitro digestion
The in vitro digestion was performed as described by Borges et al (2015), including
sequential steps of gastric and intestinal digestion. Briefly, the oil samples were mixed
with Mili-Q water (1:10, w/v) and subjected to gastric (pH 2, pepsin solution) and
intestinal (pH 7, pancreatin/bile salts solution) phases (110 oscillations/ min; 37 °C, 2

Resultados
170
h). The samples were then centrifuged at 10000 rpm for 30 min at 4°C (Sorvall RC 6
Plus centrifuge) to separate the soluble or bioaccessible fraction (BF) and the residual
fraction (RF). The samples were protected from light all over the process and submitted
to sonication previous to each step. Blanks with no sample were run in parallel and
analysed to discard interferences due to the reagents of the digestion process.
The BF and RF were stored at -80 °C in bottles protected from the light under a nitrogen
blanket until used to determine the total polyphenol content (TPC) and antioxidant
activity. Aliquots of the BF were also used for Caco-2 cell experiments.
2.4. Chemical extraction
The chemical extraction was carried out previous to analysis of TPC and antioxidant
assays, in oil samples and in the RF obtained after the in vitro digestion. Two grams of
oil, or the total RF, were mixed with 1 mL of n-hexane and the mixture was vigorously
shaken. Then, 2 mL of methanol/water (80: 20 v/v) were added in order to assay the
polar fraction. The solution was centrifuged at 4000 rpm for 5 min (Sorvall RC 6 Plus
centrifuge, Thermo Scientific, Madrid, Spain), the extraction was repeated in the
lipophilic part and the methanolic extracts were combined to obtain the chemical
extract.
2.5. Total phenolic content and antioxidant activity
The methodologies previously described by Borges et al (2015) were followed. TPC
was determined using the Folin – Ciocalteu reactive and measuring the absorbance at
750 nm in a Victor X3 multilabel plate reader (Waltham, Massachusetts, USA). The
results were expressed in mg of caffeic acid equivalents (CAE) per kg of sample.

Resultados
171
To study the antioxidant capacity of the samples the ABTS and DPPH assays
(for measuring the free radical scavenger activity) and the FRAP method (for assessing
the reducing power) were performed. The final absorbance was measured at 750, 520
and 595 nm, for ABTS, DPPH and FRAP assays, respectively, using the Victor
multilabel plate reader. A calibration curve of Trolox was performed in each method
and the results were expressed in mM of Trolox equivalents per kg of sample.
2.6. Cell culture assays
Caco-2 cells were purchased from the European Collection of Cell Cultures (ECACC)
through the Cell Bank of Granada University (Spain). Culture flasks were purchased
from Corning Costar (Cambridge, MA, USA). The cells were maintained by serial
passage in 75 cm² plastic flasks containing high-glucose Dulbecco’s modified minimal
essential medium (DMEM), with heat-inactivated fetal bovine serum (FBS) (10%),
NaHCO3 (3.7 g/L), nonessential amino acids (1%), HEPES (15 mM), bovine insulin
(0.1 UI/mL), and 1% antibiotic-antimycotic solution. The cells were grown under
atmosphere of air/CO2 (95:5) at 90% humidity and 37°C and given fresh medium every
3 days.
2.6.1 Antioxidant cell markers
The antioxidant potential of the digested oils (BF) was also assessed at the cell level,
performing two assays: modifications on cell proliferation and reactive oxygen species
(ROS) generation. Determinations were carried out both at basal conditions and against
an induced oxidative stress.
The viability and quantification of cell proliferation of the Caco-2 cells was
assessed by the colorimetric MTT assay (3-(4,5-dimethylthiazol-2-yl)-2,5-

Resultados
172
diphenyltetrazolium bromide , Roche, Mannheim, Germany). Cells were seeded in 96-
well microtiter plates at a density of 25 × 10 4 cells/mL (100 µL/well) and incubated for
24 hours at 37° C to allow adherence. Basal effect of the samples on cell viability was
studied at different concentrations BF: DMEM FBS-free (1:2 and 1:3, v/v). Spent
medium was removed and the diluted samples (100 μL/well) were added to the cells and
incubated during 2h. The control wells received DMEM FBS-free. Immediately, 10 μL
of MTT were incorporated followed by 4h of incubation. Finally, 100 μL of
solubilisation solution were added to each well and the plates were stood overnight in
incubation, prior to measure cell viability. To study the protective effect against
oxidative damage, after 2 hours of initial exposure with the diluted BF, samples
solutions were removed and 100 μL of tert-butyl hydroperoxide (t-BOOH) at different
concentrations (3 mM and 5 mM) were added as oxidising agent, and incubated for 1h.
Then, the same procedure as above was applied. After overnight incubation, the plates
were mixed during 1 hour in a plate stirrer until complete solubilisation of the purple
formazan crystals and the absorbance was measured at 595 nm using a Victor X3
multilabel plate reader. The cell viability was expressed as a percentage of the data
obtained from control wells. Data are means from at least two independent experiments
(n = 6 per experiment).
For determination of ROS generation we used the dichlorofluorescin (DCFH)
assay as described by Seiquer Rueda et al (2015). In presence of free radicals (ROS),
the DCFH become dichlorofluorescein (DCF) and emit fluorescence; thus, quantifying
fluorescence under different situations (basal conditions and oxidizing conditions with
t-BOOH) the ROS production may be estimated. The data were expressed as
fluorescence units, from at least two independent experiments (n = 3 per experiment).

Resultados
173
2.6.2. Absorption assays
Trypsinization, seeding into permeable supports (Transwell, 24 mm diameter, 4.7 cm2
area, 3 μm pore size, Costar) and absorption assays across Caco-2 cell monolayers were
performed as described elsewhere (Seiquer et al., 2015). BF were used for the Caco-2
experiments diluted 1:3 (v:v) with DMEM FBS-free, since cell viability after 2 h of
exposure to the samples in such conditions, assessed by MTT, was never < 90%. After
the incubation period, the buffer from the basolateral chamber was removed and used to
determinate total polyphenols and antioxidant activity (DPPH and FRAP), according to
the methods described. Absorption across the cell monolayers was expressed as the
percentage (%) transported/well from the initial solution added to the apical chamber.
2.7. Statistical analysis
The data obtained were analysed applying analysis of variance (one-way ANOVA),
with the geographic origin of oils (regions 1–11) as the main factor. Tukey’s test was
used to compare mean values between oils from the different regions, and differences
were established at P < 0.05. Moreover, the data were grouped by countries, and the
overall differences between Brazilian and Spanish oils were also studied by ANOVA.
The relationships between the different variables and with the climate characteristics
and the altitude of the producing regions were evaluated by Pearson’s coefficient. All
statistical calculations were carried out using SPSS version 21.0 (IBM Corporation,
New York, USA).
3. Results and Discussion
3.1. TPC and antioxidant capacity before and after gastrointestinal digestion

Resultados
174
Total phenolic content and antioxidant activity of oils were measured before and after
the in vitro digestion, i.e. in the chemical extracts and in the fractions obtained from the
digestive process, both bioaccessible and residual (BF and RF).
3.1.1. Chemical extracts
Results of TPC and antioxidant activity (ABTS, DPPH and FRAP) in chemical
extracts are shown in Table 1. TPC of the Arbequina EVOO analysed presented a large
range of variation between 75 and 302 mg CAE/ kg oil, concerning samples 11 (Minas
Gerais, Brazil) and 3 (Málaga, Spain) respectively (P < 0.05). Likewise, a wide range of
phenolic compound content in EVOO (from 50 to more than 1000 mg/kg oil) and
different chemical structures have been reported in literature, linked to numerous factors
such as cultivar, geo-climatic conditions, degree of fruit ripeness and processing
methods (Samaniego Sánchez et al., 2007; Servili et al., 2014). Previous data on
Arbequina virgin olive oil show TPC values comparable with those of the present assay
(Borges et al., 2015; Uluata et al., 2016).
The antioxidant activity measured in the chemical extracts of the oils was
significantly affected by growing regions (P < 0.05). The lowest values were observed
for samples 4 (Cádiz, Spain) and 11, whereas Spanish oils 3 (Málaga) and 8
(Valladolid) presented the highest antioxidant capacity. It has been shown than
geographic and climatic conditions of production areas may affect the quality and
composition of olive oils (Mailer, Ayton, & Graham, 2010). Therefore, relationships of
TPC and antioxidant properties with altitude, maximum and minimum temperature and
rainfalls of the different region were analysed in the current assay. It was found that the
maximum temperature of the growing zone was positively related (P<0.001) with the
TPC (r= 0.801) and with antioxidant properties of the oil extracts (ABTS r=0.624;

Resultados
175
DPPH r=0.715 and FRAP r=0.664), whereas rainfalls correlated negatively with TPC
(P<0.01, r = -0.520). On accordance, Brazilian oils, produced in regions with high
levels of rainfalls (Table S1), showed on average lower values of TPC than Spanish
oils. No global differences of antioxidant activity were found between oils from the
different countries.
The antioxidant effect of EVOO has been mainly ascribed to polyphenols
(Samaniego-Sánchez et al, 2007) and, in agreement, strong relationships (P<0.001)
were found in chemical extracts between TPC and ABTS (r= 0.673), DPPH (r=0.709)
and FRAP (r=0.786) assays.
3.1.2. Bioaccessible fractions
Measuring TPC and antioxidant properties in the BF may be indicative of the
impact of the digestive process and provides complementary information comparing
with chemical analysis of foods (Soler et al., 2010).
The present study found a positive effect of the digestive process in TPC and
antioxidant properties of all the samples (Table 2), showing increased values of these
parameters in the BF compared with the chemical extracts. These results agree with
previous studies that found a rise of TPC and antioxidant capacity after digestion of oils
(Borges et al., 2015; Seiquer et al., 2015) and other food matrices (Arques, Pastoriza,
Delgado-Andrade, Clemente, & Rufián-Henares, 2016; Pastoriza et al., 2011; Szawara-
Nowak, Bączek & Zieliński, 2016), although negative effects have been also shown
(Dinnella, Minichino, D'Andrea & Monteleone, 2007). Thus, our results support that in
vitro digestion is a crucial step that releases a high amount of phenolic and antioxidant
compounds, which seem difficult to extract from the food matrix with the solvents
traditionally used (Szawara-Nowak et al., 2016).

Resultados
176
Significant variations were found in bioaccessible TPC between oils, but no
relationships with altitude or climatic factors of the regions were detected, contrary to
those observed in the chemical extracts. Thus, the negative effect of high rainfall in
EVOO TPC (Inglese et al. 2010) was only found in the chemical extracts, but no in the
BF of the oils.

Resultados
177
Table 1
Total phenolic content (TPC, mg of CAE per kilogram of oil) and antioxidant activity (ABTS, DPPH and FRAP, mmol of Trolox per
kilogram of oil) determined in the chemical extract of Arbequina EVOO from Spain (samples 1-9) and Brazil (samples 10 and 11).
Oil sample TPC ABTS DPPH FRAP
1 168 ± 1.14b,c
0.41 ± 0.04b,c
0.93 ± 0.05b,c,d
0.93 ± 0.02a,b
2 163 ± 13.519b,c
0.59 ± 0.14c,d,e
1.45 ± 0.18e 1.35 ± 0.40
b,c
3 302 ± 29.45e 0.73 ± 0.01
e 1.58 ± 0.01
e 2.22 ± 0.23
e
4 196 ± 13.5c,d
0.20 ± 0.01a 0.52 ± 0.02
a 0.54 ± 0.03
a
5 227 ± 9.27d 0.60 ± 0.13
d,e 1.22 ± 0.30
d,e 1.35 ± 0.38
b,c
6 197 ± 13.5c,d
0.46 ± 0.05b,c,d
0.74 ± 0.05a,b,c
0.83 ± 0.05a,b
7 174 ± 2.85b,c
0.46 ± 0.03b,c,d
0.81 ± 0.03a,b,c
0.90 ± 0.09a,b
8 290 ± 15.61e 0.73 ± 0.01
e 1.52 ± 0.04
e 1.64 ± 0.14
c,d
9 104 ± 21.3a 0.34 ± 0.01
a,b 0.65 ± 0.20
a,b,c 0.70 ± 0.24
a
10 151 ± 4.44b 0.56 ± 0.02
c,d,e 0.97 ± 0.01
c,d 1.06 ± 0.02
a,b,c
11 75.0 ± 2.18a 0.33 ± 0.01
a,b 0.56 ± 0.06
a,b 0.57 ± 0.01
a
P-value
Spain × Brazil ** n.s n.s n.s
Values are expressed as mean ± SE. Means values in each column with different letters are significantly different (p < 0.05). Comparing countries: ns, not significant
P>0.05; * P < 0.05; ** P < 0.01.
Resultados
178
Polyphenols are strongly affected during the digestive process, mainly due to
changes of pH and interactions with other compounds, which differ depending on their
chemical structure (Dinnella, Minichino, D'Andrea & Monteleone, 2007). Some of the
major olive oil phenols (tyrosol, hydroxytyrosol and lignans) are relatively stable after
gastrointestinal digestion and are able to generate derivate compounds owing to
digestion, whereas other (flavonoids and secoiridoids) are unstable (Soler et al., 2010).
Hydroxytyrosol seems to be decisive for phenolic bioaccessibility, as during digestion it
is released from its precursors, the secoiridois, and its bioaccessibility may be over
100% (Rubió et al., 2014). A limitation of this study is that individual phenols were not
characterised, but, according to previous bibliography, phenol profile within genotype
may be affected by environmental conditions of oil producing regions (Inglese et al.,
2010). Therefore, probably due to the different composition, the phenolic fraction of the
oils of the current assay underwent different bio-transformation rates during digestion.
As a result, TPC and antioxidant activity after digestion of the oils were different
comparing with values found in the chemical extracts, and statistical differences
between samples also varied.
Average values of antioxidant activity after digestion of Spanish oils differed
significantly from Brazilian samples, being DPPH values higher and FRAP values
lower in Brazilian BF than in Spanish samples. This suggests that in biological systems
compounds than scavenge free radicals are not necessarily capable of reducing oxidants
(Frankel & Meyer, 2000) and that transformations during the digestive process are
decisive for establishing the antioxidant potential of the oils.
Relationships of antioxidant activity in the BF with climatic factors were also
different than those observed in the chemical extracts, since bioaccessible DPPH was
negatively correlated with maximum temperature (P<0.01, r= -0.697) and positively

Resultados
179
with rainfalls (P<0.01, r= 0.583). Moreover, whereas antioxidant properties were
strongly related with TPC in oil extracts, no relationships was found in the BF after the
digestive process, suggesting that after digestion other compounds than polyphenols
could also be responsible for antioxidant properties. In agreement, other authors have
found that correlations between TPC and antioxidant activity (measured by ABTS,
DPPH and FRAP assays) are reduced after the digestion of fruits, compared with the
initial values in chemical extracts (Chen et al., 2014).
3.3.3. Residual fractions
After in vitro digestion of Arbequina EVOO significant amounts of TPC and
antioxidant activity were detected in the RF (Table 2). This fraction accounted a 20% of
TPC, 19% ABTS, 7% DPPH and 39% FRAP from the total recovered after digestion
(Fig. 2).
Traditionally, the residual fraction after digestion is not considered when
studying phenolic bioavailability, but certain absorption cannot be discarded as it has
been described that polyphenols that remain in the large intestine after digestion may be
transformed by the intestinal microbiota into a series of low molecular- structures
potentially absorbable (Cardona, Andres-Lacuerva, Tulipania, Tinahonesb & Queipo-
Ortuno, 2013). In fact, certain polyphenols are very poorly absorbed in the small
intestine in their intact forms, but are extensively catabolized buy the gut microbiota
and the products are efficiently absorbed through the colonic epithelium (Williamson &
Clifford, 2017). Moreover, these residues deserve to be considered in the global
antioxidant power of the digested oils, especially as a source of reducing capacity agents
(Seiquer et al., 2015), as it has been suggested by others after digestion of different food
matrices (Pastoriza et al., 2011; Szawara-Nowak, Bączek & Zieliński, 2016). It has also
been shown that unabsorbed polyphenols may exert beneficial local effects at the
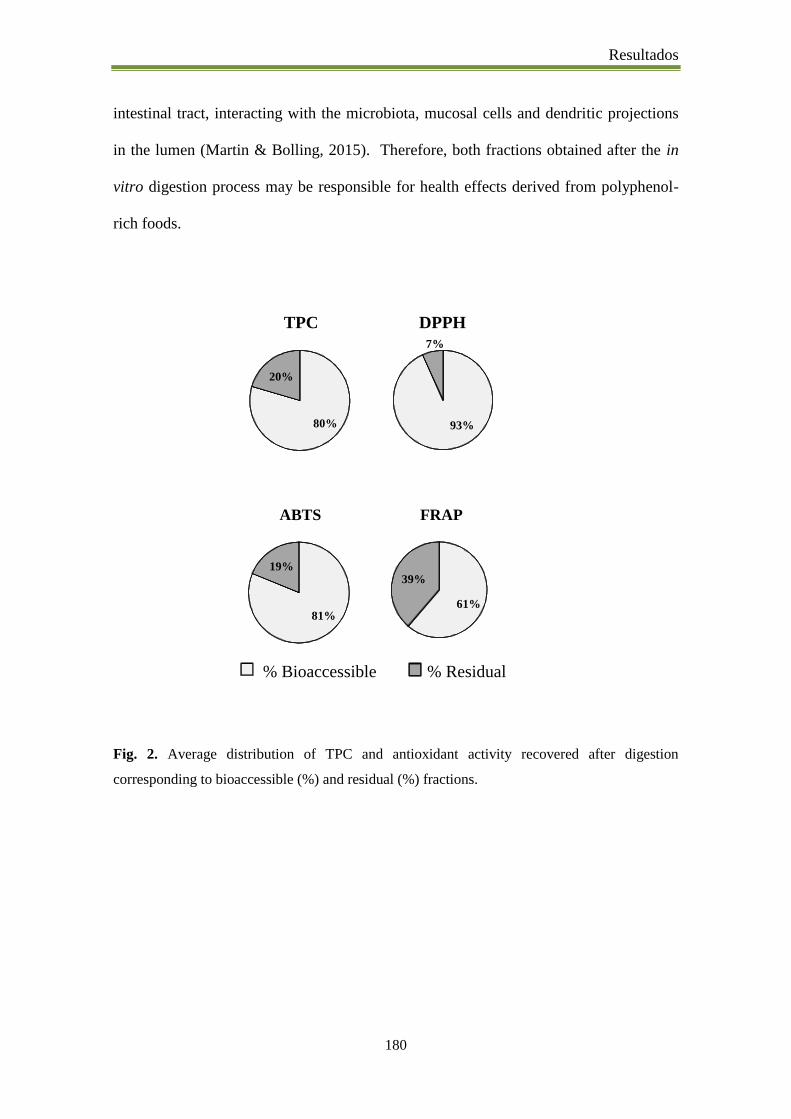
Resultados
180
intestinal tract, interacting with the microbiota, mucosal cells and dendritic projections
in the lumen (Martin & Bolling, 2015). Therefore, both fractions obtained after the in
vitro digestion process may be responsible for health effects derived from polyphenol-
rich foods.
Fig. 2. Average distribution of TPC and antioxidant activity recovered after digestion
corresponding to bioaccessible (%) and residual (%) fractions.
80%
20%
TPC
93%
7%
DPPH
81%
19%
ABTS
61%
39%
FRAP
% Bioaccessible % Residual

Resultados
181
Table 2
Total phenolic content (TPC, mg of CAE per kilogram of oil) and antioxidant activity (ABTS, DPPH and FRAP, mmol of Trolox per
kilogram of oil) determined in bioaccessible fraction and residual fraction after in vitro digestion of Arbequina EVOO from Spain (samples
1-9) and Brazil (samples 10 and 11).
Oil
sample
TPC ABTS DPPH FRAP
Bioaccessible
fraction
Residual
fraction
Bioaccessible
fraction
Residual
fraction
Bioaccessible
fraction
Residual
fraction
Bioaccessible
fraction
Residual
fraction
1 451 ± 29.8a,b,c,d
110 ± 12.7a,b
4.70 ± 0.31 1.35 ± 0.10d,e
2.58 ± 0.31b,c
0.38 ± 0.07c 4.04 ± 0.42
d,e 1.53 ± 0.13
a,b
2 538 ± 53.1c,d
101 ± 25.1a,b
4.53 ± 0.12 0.92 ± 0.17a,b,c
2.27 ± 0.45b 0.42 ± 0.02
c 3.58 ± 0.79
c,d,e 1.51 ± 0.22
a,b
3 506 ± 3.06a,b,c,d
140 ± 16.2b,c
4.42 ± 0.13 1.01 ± 0.14a,b,c,d
0.99 ± 0.08a - 2.54 ± 0.40
b,c 2.14 ± 0.17
b,c,d
4 392 ± 66.1a 67.7 ± 24.8
a 4.59 ± 0.09 1.03 ± 0.02
a,b,c,d,e 2.54 ± 0.13
b,c 0.41 ± 0.04
c 3.08 ± 0.44
c,d 1.39 ± 0.21
a
5 411 ± 48.0a,b
194 ± 33.6c 4.28 ± 0.10 0.71 ± 0.20
a 2.08 ± 0.27
b - 3.25 ± 0.10
c,d 2.26 ± 0.24
c,d
6 566 ± 38.9d 127 ± 41.2
a,b 4.45 ± 0.10 0.99 ± 0.18
a,b,c 2.56 ± 0.19
b,c 0.18 ± 0.18
a,b 3.85 ± 0.39
d,e 2.47 ± 0.25
d
7 436 ± 4.02a,b,c
109 ± 12.2a,b
4.53 ± 0.19 1.37 ± 0.06e 1.91 ± 0.24
b 0.29 ± 0.04
b,c 3.68 ± 0.52
c,d,e 2.14 ± 0.41
b,c,d
8 432 ± 18.9a,b,c
136 ± 15.7b,c
4.26 ± 0.12 1.27 ± 0.03c,d,e
2.33 ± 0.12b,c
- 4.62 ± 0.35e 2.19 ± 0.24
c,d
9 391 ± 81.1a 96.8 ± 16.1
a,b 4.56 ± 0.05 1.19 ± 0.11
b,c,d,e 2.51 ± 0.07
b,c 0.35 ± 0.04
b,c 3.51 ± 0.15
c,d,e 1.73 ± 0.05
a,b,c
10 531 ± 12.1b,c,d
121 ± 9.21a,b
4.29 ± 0.16 0.80 ± 0.08a 2.97 ± 0.26
c,d - 1.40 ± 0.18
a,b 1.63 ± 0.18
a,b,c
11 473 ± 41.6a,b,c,d
92.6 ± 4.83a,b
4.39 ± 0.15 0.85 ± 0.04a,b
3.30 ± 0.12d - 1.24 ± 0.18
a 1.52 ± 0.16
a,b
P-value
Spain × Brazil n.s n.s n.s * ** n.s ** n.s
Values are expressed as mean ± SE. Means values in each column with different letters are significantly different (p < 0.05). Comparing
countries: ns, not significant P>0.05; * P < 0.05; ** P < 0.01.

Resultados
182
3.2. Antioxidant cell markers
In order to assess the effects of the BF of the oils at the cellular level, two antioxidant
markers on Caco-2 cells were studied: cell viability and ROS generation, both at basal
conditions and against induced oxidative stress.
Firstly, BF was mixed with increasing proportions of DMEM FBS-free to
evaluate the effect of the sample concentration in the viability of Caco-2 cells. Fig. 3. A
shows the viability obtained, expressed as percentage in relation to the control value
(DMEM FBS-free), after 2 h of incubation with dilutions 1:2 and 1:3 (v/v) BF: DMEM
FBS-free (differences are not indicated to avoid overlapping). When samples were
diluted 1:2 (v/v), statistical differences of cell proliferation were observed after
exposure to the different samples (P < 0.01), ranging from 70% (corresponding to
Brazilian sample 11) to 130% (in Spanish sample 3). Treatment with BF from samples 2
(Jaén), 6 (Albacete), 7 (Toledo), 9 (Lérida), 10 (Rio Grande do Sul) and 11 (Minas
Gerais) led to cell viability values lower than 85%, showing that monovarietal oils from
different producing areas had different effects on cell integrity. When dilution of BF
was increased to 1:3, high values of viable cells were observed after exposure to all
samples (≥90%) and, therefore, dilution 1:3 was selected for further assays, as it was
shown not damage cellular integrity in any case.
To evaluate the protective effect on cell viability, an induced oxidative stress
was promoted by t-BOOH at different concentrations, 3 mM and 5 mM (Fig. 3.B).
When a slight damage was caused (t-BOOH 3 mM), control cells showed a drastic
reduction in cell viability (67%), while cells preincubated with the samples were able to
preserve the viability (>80%), thereby preventing cell damage due to the oxidising
agent, without significant differences among oils. At stronger oxidising conditions (t-
BOOH 5 mM) the proportion of viable cells was reduced to approximately 62%, and

Resultados
183
pretreatment for 2h with the digested oils also neutralised the oxidative damage and
improved the cell proliferation. However, in such conditions, certain differences were
observed between samples, and some of them (samples 6 and 7) did not reach
significant protective effects compared to control oxidized cells. Similar protective
effect of cell viability has been shown with digested samples of Picual EVOO and also,
although to a lesser extent, of extra virgin argan oil (Seiquer et al., 2015). Other studies
have confirmed a protective effect in Caco-2 cells viability of EVOO extracts and
phenolic compounds such as oleuropein and tyrosol, against the cytotoxic damage
promoted by the mycotoxin alternariol or a pro-oxidant agent (Chiesi et al., 2015; Incani
et al., 2016). It has been suggested that ingested polyphenols have a direct protective
effect in the gastrointestinal tract by scavenging reactive species and/or preventing their
formation (Halliwell, Rafter & Jenner, 2005). However, in the present assay no
relationships were found among bioaccessible TPC of the samples and cell proliferation
under stressed conditions.

Resultados
184
0
20
40
60
80
100
120
140
160
Via
bil
ity (
%)
A
1 2 3 4 5 6 7 8 9 10 111 2 3 4 5 6 7 8 9 10 11
1:2 1:3
0
20
40
60
80
100
Via
bil
ity (
%) a
c,d,e
b
a
ed,e e
a,ba,b,c b,c
b,c,d
B
1 2 3 4 5 6 7 8 9 10 11
Co
ntr
ol
1 2 3 4 5 6 7 8 9 10 11
Co
ntr
ol
5 mM3 mM
Fig. 3. A: Cell viability (%) in Caco-2 cells after 2 hours of incubation with bioaccessible
fractions of Arbequina EVOO from Spain (samples 1-9) and Brazil (samples 10 and 11), diluted
1:2 and 1:3 (v/v) with DMEM FBS-free. B: Cell viability in Caco-2 cells preincubated with the
different samples and oxidized with t-BOOH 3 mM and 5 mM. (mean ± SE, n = 6). Bars with
different minor letters differ significantly within 3 mM or 5 mM t-BOOH effect (P < 0.05).
The ROS generation by Caco-2 cells after exposure to the different Arbequina
samples is shown in Fig. 4. Under basal conditions, a slight ROS cell production was
detected, as result of the normal cell functionality. In such conditions, a reduction of the
ROS levels was obtained after exposure to BF of oils compared to control wells,

Resultados
185
ranging from 16 to 47%. Statistically significant reductions were observed for samples 4
(Cádiz), 5 (Sevilla), 8 (Valladolid), 9 (Lérida), 10 (Rio Grande do Sul) and 11 (Minas
Gerais) in relation to control (P<0.05), showing that digested oils are able to modify the
redox status of intestinal cells, even under non-stressed conditions. The intestinal tract is
continually attacked by luminal microbes and by oxidized compounds from the diet,
exposing it to frequent oxidative changes and, thus, there is a need of maintenance of
the redox intestinal homeostasis (Biasi et al., 2014). Although homeostatic mechanisms
is one of the uncontrolled aspects in cell cultures, decreasing intracellular levels of ROS
can act as biological signal molecules to regulate the redox homeostasis in vivo and
should be considered positive in the antioxidant cell response.
In order to induce an oxidative injury, Caco-2 cells were treated with t-BOOH (5
mM for 2 h). The damage produced by t-BOOH caused a drastic increasing of ROS
generation in the cells (Fig. 4) and, thus, the possible protective effect of oils was
evaluated. Preincubating the cells with BF of oils prevented the free radical production
due to the pro-oxidant agent from 16 % (sample 6, Seville) to 53% (sample 10, Rio
Grande do Sul), although in some cases (oils 5 and 6) differences comparing with
oxidised cells were not significant. Our results are in line with previous data that relate a
protective effect on induced ROS production of digested samples from different
monovarietal EVOO (Borges et al., 2015). The beneficial effect of EVOO at intestinal
level has been directly related to the presence of phenolic compounds, able to exert
antioxidant actions (Biasi , Astegiano, Maina, Leonarduzzi & Poli, 2011) or preserving
the cellular antioxidant defences (Di Benedetto et al., 2007). Thus, several studies have
been mainly focused on exploring the role of individual polyphenols (Chiesi et al.,
2015; Di Benedetto et al., 2007; Rodríguez-Ramiro, Martín, Ramos, Bravo & Goya,
2011) or methanolic extracts from EVOO (Incani et al., 2016) and olive leaves (Difonzo

Resultados
186
et al., 2017) in preventing oxidative damage in cell cultures. A clear difference between
the referred studies and the present assay is that the complete bioaccessible fraction
obtained after digestion of EVOO, instead of chemical extracts o isolated compounds,
was used, as a more physiological approach to probe the protective role of oils at
intestinal level. In the current study, no relationship was found between the positive role
of the samples on preventing ROS generation and the phenolic content in the BF.
However, a correlation was observed with the DPPH assay (P <0.01; r= -0.450), i.e., the
higher the DPPH value, the lower the ROS production in stressed conditions (see
samples 10 and 11- Table 2 and Figure 4). Thus, compounds originated from the
EVOO digestion may prevent or delay the progression of intestinal diseases
characterized by oxidative stress, as it has been shown that diet components, together
with antioxidant enzymes, are involved in the intestinal mucosa response aimed at
preventing oxidative damage (Biasi et al., 2014)
When data were grouped by countries, it was observed that cells treated with
Brazilian oils were on average more protected against t-BOOH- induced ROS
generation than those exposed to Spanish oils (P<0.001), according to the highest
DPPH values found in Brazilian BF.
Our data suggest that, after biotransformations undergone during the digestive
process, the resulting phenolic fraction of oils could not be the only responsible for
protecting cells from oxidation, which was also supported by the lack of correlation
between TPC and antioxidant activity found in the BF of oils (commented in section
3.1.2). Further studies on the phenolic profile of the oils of the present study could help
to elucidate the possible role of individual compounds in the protective effect against
oxidation.

Resultados
187
0
20000
40000
60000
Flu
ore
scen
ceIn
ten
sity
b,ca,b,c a,b a,b,c
b,c a,b
a
c
f
c,d
e,f
b,c,da,b,c
a
c,d
a,b
1 2 3 4 5 6 7 8 9 10 11 1 2 3 4 5 6 7 8 9 10 11
Co
ntr
ol
Basal effect Protective effect
Co
ntr
ol
Fig. 4. ROS generation in Caco-2 cells expressed as fluorescence intensity at 90 minutes after
incubation (basal effect) with bioaccessible fractions of Arbequina EVOO from Spain (samples
1-9) and Brazil (samples 10 and 11) or preincubated with samples and oxidized with t-BOOH 5
mM (protective effect). Control cells received culture medium. (Mean ± SE, n = 3). Bars with
different minor letters differ significantly within basal or protective effect (P < 0.05).
3.3. Absorption across Caco-2 cells
The Caco2 cell lines derived from human intestinal epithelial adenocarcinoma is a
suitable model system for the evaluation of intestinal functions and nutrient absorption
(Mesías et al., 2009; Seiquer et al., 2015). In this study, the absorption of TPC and
antioxidant properties of digested oils across Caco2 cell monolayers was studied. For
the scavenging ability the DPPH assay was selected, due to DPPH
activity was mainly
located in the bioaccessible fraction (93%) and also due to its positive relationships with
the protecting effect from oxidative damage. Non-significant amounts of FRAP activity
(less than 0.1% in all the cases) were recovered in basolateral chambers after incubation
(data not shown), probably due to that significant proportions of reducing activity

Resultados
188
(nearly 40 %) remains in the residual fractions after digestion or to a short time of
exposure at experimental conditions (2h).
Results are presented in Table 3. Total TPC and DPPH activity recovered in
basal chambers after incubation was measured and absorption was calculated as the
percentage of the total initial content exposed to cell monolayers.
Absorption of TPC ranged from 32.5 to 110%, corresponding to samples 6 and
8, respectively with statistically significant differences between oils (P < 0.05). Average
absorption of phenolic compounds was higher (P<0.05) from Brazilian oils than from
Spanish oils (97% vs 67%, respectively). Low proportions of TPC absorption (32-55%)
were observed for samples 1, 2, 3, 4 and 6, despite the high bioaccessibility previously
detected (Table 1). However, it must be taken into account that phenolic compounds
could continue the absorption process in the lower digestive tract, as it has been recently
suggested (Pereira- Caro et al., 2015). On the other hand, incubation with samples 5 and
8 surpassed 100% of TPC absorption. This finding could be explained by two
hypotheses. Firstly, Folin - Ciocalteu method is a not a selective assay, determining all
kinds of phenolic molecules and, thus, a variety of compounds may interfere with the
reactive to give apparently elevated phenolic concentrations (Cerretini & Bendini,
2010). Secondly, the metabolites present in the basal medium could have been produced
intracellularly and excreted to the exterior or produced directly by secreted enzymes
(Soler et al., 2010). In this sense, different mechanism has been described in the Caco-2
cell model to evaluated the permeability of phenolic compounds (passive paracellular
transport or active efflux process) and potential interference by either efflux or
metabolic process have been described for some compounds, causing deviation from the
predicted permeability (Farrell, Poquet, Dew, Barber & Williamson, 2012). Previous
studies on the transport of polyphenols from olive oil extracts through Caco-2 cells have

Resultados
189
shown that compounds present a high conjugation rate (including methylation,
sulphation and glucuronidation) that, in some cases, such as hydroxytyrosol, led to
almost complete metabolic conversion (Rubió et al., 2014).
The present findings support that olive oil phenolics could be well absorbed at
the intestinal level (Tuck, Freeman, Hayball, Stretch & Stupans, 2001). Moreover,
depending on the phenolic profile, conjugation may affect the efflux of phenols from
inside the enterocyte (Soler et al., 2010). The majority of previous studies have been
performed with individual phenolic compounds or chemical extracts, although
absorption through intestinal cells after digestion of oils has been scarcely investigated.
In an earlier study, we have found a percentage of phenolic absorption of 25 % from
digested samples of Picual EVOO (Seiquer et al., 2015), lower than reported in the
current study with oils from Arbequina cultivar.
Antioxidant compounds were well absorbed across cell monolayers, leading to
30-52% of DPPH activity recovered in the basal chambers. Statistical differences (P >
0.05) were found between individual samples and between countries (51 % vs 43% for
Brazilian and Spanish oils, respectively). The results suggest a good bioavailability of
the antioxidant properties of oils, which were maintained and absorbed after digestion.
Although this assay does not identify the compounds responsible for the activity, other
than polyphenols should be implicated, as no correlation was observed between
absorption of DPPH and TPC.
In general, the data concerning absorption of antioxidant compounds from
digested foods are very limited. Additionally, the knowledge about which compounds
could be responsible for the potential biological effects in vivo is controversial. Several
authors related that one of major compounds linked to beneficial effects in vitro,
hydroxytyrosol, in spite to be well absorbed in the intestinal tract, has really a poor

Resultados
190
bioavailability in its free form due to an important presystemic metabolism in gut,
leading to the formation of sulfate and glucuronide conjugates (Miro - Casas et al.,
2003; Pastor et al., 2016; Pérez - Mañá et al., 2015;). According to Pastor et al. (2016),
the concentration of hydroxytyrosol in body fluids is too low to explain the observed
biological activities in in vitro and in vivo models at higher doses/concentrations. Thus,
without discarding the activity of secondary phenolic metabolites, it may be postulated
that antioxidant properties recovered at the intestinal level are also due to compounds
other than polyphenols, with could be able to cross the intestinal barrier in an effective
manner. In this regard, all the bioactive compounds (tocopherols, polyphenols,
carotenoids, coenzyme Q10 ) could be linked to the antioxidant activity found in the
present study.
Results of the current assay support the use of in vitro gastrointestinal digestion
coupled to Caco-2 cells as a reliable tool for investigating antioxidant properties of the
oils at the digestive level. However, aspects others than those controlled in these
experiments, such as homeostatic modulation of redox status, presence of oxidative
stress conditions or the impact of the intestinal microflora in the digestive process,
could affect the in vivo produced metabolites as well as the resulting antioxidant effect
of the EVOO studied.
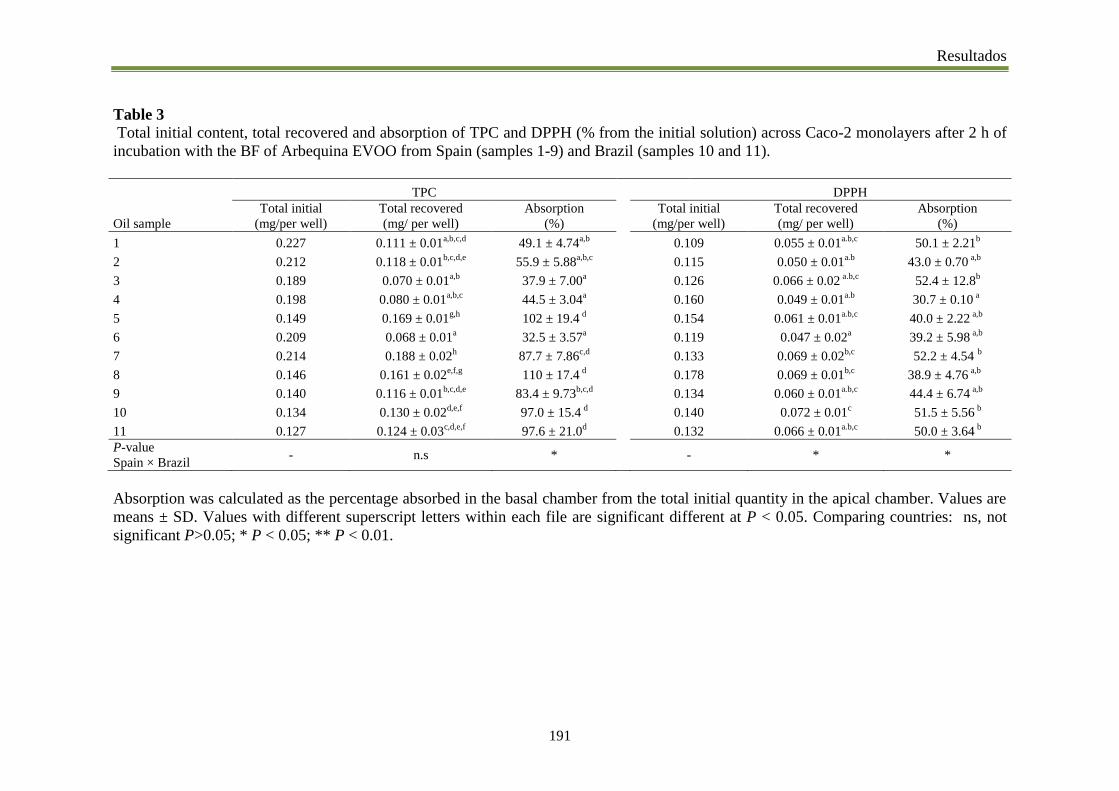
Resultados
191
Table 3
Total initial content, total recovered and absorption of TPC and DPPH (% from the initial solution) across Caco-2 monolayers after 2 h of
incubation with the BF of Arbequina EVOO from Spain (samples 1-9) and Brazil (samples 10 and 11).
TPC DPPH
Oil sample
Total initial
(mg/per well)
Total recovered
(mg/ per well)
Absorption
(%)
Total initial
(mg/per well)
Total recovered
(mg/ per well)
Absorption
(%)
1 0.227 0.111 ± 0.01a,b,c,d
49.1 ± 4.74a,b
0.109 0.055 ± 0.01a.b,c
50.1 ± 2.21b
2 0.212 0.118 ± 0.01b,c,d,e
55.9 ± 5.88a,b,c
0.115 0.050 ± 0.01a.b
43.0 ± 0.70 a,b
3 0.189 0.070 ± 0.01a,b
37.9 ± 7.00a 0.126 0.066 ± 0.02
a.b,c 52.4 ± 12.8
b
4 0.198 0.080 ± 0.01a,b,c
44.5 ± 3.04a 0.160 0.049 ± 0.01
a.b 30.7 ± 0.10
a
5 0.149 0.169 ± 0.01g,h
102 ± 19.4 d 0.154 0.061 ± 0.01
a.b,c 40.0 ± 2.22
a,b
6 0.209 0.068 ± 0.01a 32.5 ± 3.57
a 0.119 0.047 ± 0.02
a 39.2 ± 5.98
a,b
7 0.214 0.188 ± 0.02h 87.7 ± 7.86
c,d 0.133 0.069 ± 0.02
b,c 52.2 ± 4.54
b
8 0.146 0.161 ± 0.02e,f,g
110 ± 17.4 d 0.178 0.069 ± 0.01
b,c 38.9 ± 4.76
a,b
9 0.140 0.116 ± 0.01b,c,d,e
83.4 ± 9.73b,c,d
0.134 0.060 ± 0.01a.b,c
44.4 ± 6.74 a,b
10 0.134 0.130 ± 0.02d,e,f
97.0 ± 15.4 d 0.140 0.072 ± 0.01
c 51.5 ± 5.56
b
11 0.127 0.124 ± 0.03c,d,e,f
97.6 ± 21.0d 0.132 0.066 ± 0.01
a.b,c 50.0 ± 3.64
b
P-value
Spain × Brazil - n.s * - * *
Absorption was calculated as the percentage absorbed in the basal chamber from the total initial quantity in the apical chamber. Values are
means ± SD. Values with different superscript letters within each file are significant different at P < 0.05. Comparing countries: ns, not
significant P>0.05; * P < 0.05; ** P < 0.01.

Resultados
192
4. Conclusions
For the first time, antioxidant activity performed by different methods and combined
with cellular models of Brazilian EVOO was evaluated. At the same time, the current
study contributes to the database of antioxidant proprieties of Spanish Arbequina
EVOO. The in vitro digestion promoted the release of bioactive compounds leading to
an increase of TPC and antioxidant potential in all samples, after the biotransformations
undergone by the digestive process of EVOO. Thus, the bioaccessible fractions obtained
after the in vitro digestion of oils protected cell integrity from oxidative damage, and
were able to reduce the ROS generation by the cells. On average, Arbequina Brazilian
oils showed higher values of antioxidant activity (measured by the DPPH assay) after
digestion, and better protective effects against induced ROS production, than Spanish
oils.
Findings of the present study support that modifications during digestion are
decisive to establish the antioxidant potential of the oils, which is linked, among other
biological activities, to the health properties of the EVOO. The results also show that
climatic conditions, especially rainfalls, affected the antioxidant behavior of oils
produced in different producing zones. The influence of other factors than those
considered in the present study, such as the ripeness index and further environmental
variables (light intensity, humidity, evapo-transpiration, soil) cannot be discarded.
The lack of information of phenolic profile of the oils is a limitation of this
study. Current studies of our group are aimed at determining the composition of the
minor fraction of the oils, including, phenolic compounds, tocopherols and coenzyme
Q10 Thus, further papers could give additional information on the compounds
responsible for the antioxidant properties examined in the present assay.

Resultados
193
Conflicts
The authors declare no competing financial interest.
Acknowledgments
We are grateful to the CAPES Foundation, (Ministry of Education, Brazil), for
scholarship support provided to the first author (grant number 6073/13-1) . This work is
part of the doctoral thesis of Thays Helena Borges, Ph.D. student from the Official
Doctoral Program ‘‘Nutrition and Food Sciences” of the Granada University. The
authors also would like to thank Consejo Regulador de Denominación de Origen (DOP)
Estepa and DOP Les Garrigues; Casas Hualdo, Castillo Canena, Cortijo de Jara,
Quaryat Dillar, EPAMIG and Olivas do Sul for the donation of samples. We would like
to dedicate to the memory of Carmen Cabrera-Vique.
References
Arques, M. C., Pastoriza, S., Delgado-Andrade, C., Clemente, A., & Rufián-Henares, J.
A. (2016). Relationship between Glycation and Polyphenol Content and the
Bioactivity of Selected Commercial Soy Milks. Journal of Agricultural and Food
Chemistry, 64(8), 1823-1830.
Barbaro, B., Toietta, G., Maggio, R., Arciello, M., Tarocchi, M., Galli, A., & Balsano,
C. (2014). Effects of the olive-derived polyphenol oleuropein on human health.
International Journal of Molecular Sciences, 15(10), 18508-18524.
Biasi, F., Astegiano, M., Maina, M., Leonarduzzi, G., & Poli, G. (2011). Polyphenol
supplementation as a complementary medicinal approach to treating inflammatory
bowel disease. Current Medicinal Chemistry, 18(31), 4851-4865.

Resultados
194
Biasi, F., Deiana, M., Guina, T., Gamba, P., Leonarduzzi, G., & Poli, G. (2014). Wine
consumption and intestinal redox homeostasis. Redox Biology, 2, 795–802
Borges, T. H., Cabrera-Vique, C., & Seiquer, I. (2015). Antioxidant properties of
chemical extracts and bioaccessible fractions obtained from six Spanish
monovarietal extra virgin olive oils: Assays in Caco-2 cells. Food & Function, 6(7),
2375-2383.
Borges, T. H., Pereira, J. A., Cabrera-Vique, C., Lara, L., Oliveira, A. F., & Seiquer, I.
(2017). Characterization of Arbequina virgin olive oils produced in different regions
of Brazil and Spain: Physicochemical properties, oxidative stability and fatty acid
profile. Food Chemistry, 215, 454-462.
Bouarroudj, K., Tamendjari, A., & Larbat, R. (2016). Quality, composition and
antioxidant activity of Algerian wild olive (Olea europaea L. subsp. Oleaster) oil.
Industrial Crops and Products, 83, 484-491.
Carbonell‐Capella, J. M., Buniowska, M., Barba, F. J., Esteve, M. J., & Frígola, A.
(2014). Analytical methods for determining bioavailability and bioaccessibility of
bioactive compounds from fruits and vegetables: A review. Comprehensive Reviews
in Food Science and Food Safety, 13(2), 155-171.
Cardona, F., Andres-Lacuerva, C., Tulipania, S., Tinahonesb, F. J., & Queipo-Ortuno,
M. I. (2013). Benefits of polyphenols on gut microbiota and implications in human
health. Journal of Nutritional Biochemistry, 24, 1415–1422.
Cerretini, L., & Bendini, A. (2010). Rapid Assays to Evaluate the Antioxidant Capacity
of Phenols in Virgin Olive Oil. In: V. Preedy, & R.R. Watson, Olives and Olive Oil
in Health and Disease Prevention, (pp.625-635). London: Elsevier Inc.

Resultados
195
Chen, G. L., Chen, S. G., Zhao, Y. Y., Luo, C. X., Li, J., & Gao, Y. Q. (2014). Total
phenolic contents of 33 fruits and their antioxidant capacities before and after in
vitro digestion. Industrial Crops and Products, 57, 150-157.
Chiesi, C., Fernandez-Blanco, C., Cossignani, L., Font, G., & Ruiz, M. J. (2015).
Alternariol-induced cytotoxicity in Caco-2 cells. Protective effect of the phenolic
fraction from virgin olive oil. Toxicon, 93, 103-111.
Dabbou, S., Chehab, H., Faten, B., Dabbou, S., Esposto, S., Selvaggini, R., ... &
Hammami, M. (2010). Effect of three irrigation regimes on Arbequina olive oil
produced under Tunisian growing conditions. Agricultural Water Management,
97(5), 763-768.
Deiana, M., Corona, G., Incani, A., Loru, D., Rosa, A., Atzeri, A., ... & Dessì, M. A.
(2010). Protective effect of simple phenols from extravirgin olive oil against lipid
peroxidation in intestinal Caco-2 cells. Food and Chemical Toxicology, 48(10),
3008-3016.
Di Benedetto, R., Varì, R., Scazzocchio, B., Filesi, C., Santangelo, C., Giovannini, C.,
... & Masella, R. (2007). Tyrosol, the major extra virgin olive oil compound,
restored intracellular antioxidant defences in spite of its weak antioxidative
effectiveness. Nutrition, Metabolism and Cardiovascular Diseases, 17(7), 535-545.
Difonzo, G., Russo, A., Trani, A., Paradiso, V. M., Ranieri, M., Pasqualone, A., ... &
Caponio, F. (2017). Green extracts from Coratina olive cultivar leaves: Antioxidant
characterization and biological activity. Journal of Functional Foods, 31, 63-70.
Dinnella, C., Minichino, P., D'Andrea, A. M., & Monteleone, E. (2007).
Bioaccessibility and antioxidant activity stability of phenolic compounds from
extra-virgin olive oils during in vitro digestion. Journal of Agricultural and Food
Chemistry, 55(21), 8423-8429.
Resultados
196
Farrell, T. L., Poquet, L., Dew, T. P., Barber, S., & Williamson, G. (2012). Predicting
phenolic acid absorption in Caco-2 cells: a theoretical permeability model and
mechanistic study. Drug Metabolism and Disposition, 40(2), 397-406.
Frankel, E. N., & Meyer, A. S. (2000). The problems of using one‐dimensional methods
to evaluate multifunctional food and biological antioxidants. Journal of the Science
of Food and Agriculture, 80(13), 1925-1941.
Halliwell, B., Rafter, J., & Jenner, A. (2005). Health promotion by flavonoids,
tocopherols, tocotrienols, and other phenols: direct or indirect effects? Antioxidant or
not?. The American Journal of Clinical Nutrition, 81(1), 268S-276S.
Incani, A., Serra, G., Atzeri, A., Melis, M. P., Serreli, G., Bandino, G., ... & Deiana, M.
(2016). Extra virgin olive oil phenolic extracts counteract the pro-oxidant effect of
dietary oxidized lipids in human intestinal cells. Food and Chemical Toxicology, 90,
171-180.
Inglese, P., Famiani, F., Galvano, F., Servili, M., Esposto, S. & Urbani, S. (2010)
Factors Affecting Extra-Virgin Olive Oil Composition, in Horticultural Reviews,
Volume 38 (ed J. Janick), John Wiley & Sons, Inc., Hoboken, NJ, USA. Pp. 83-147.
doi: 10.1002/9780470872376.ch3.
Kalogeropoulos, N., Kaliora, A. C., Artemiou, A., & Giogios, I. (2014). Composition,
volatile profiles and functional properties of virgin olive oils produced by two-phase
vs three-phase centrifugal decanters. LWT-Food Science and Technology, 58(1),
272-279
Köseoğlu, O., Sevim, D., & Kadiroğlu, P. (2016). Quality characteristics and
antioxidant properties of Turkish monovarietal olive oils regarding stages of olive
ripening. Food Chemistry, 212, 628-634.

Resultados
197
Mailer, R. J., Ayton, J., & Graham, K. (2010). The influence of growing region, cultivar
and harvest timing on the diversity of Australian olive oil. Journal of the American
Oil Chemists' Society, 87(8), 877-884.
Martin, D. A., & Bolling, B. W. (2015). A review of the efficacy of dietary polyphenols
in experimental models of inflammatory bowel diseases. Food & Function, 6(6),
1773-1786.
Mesías, M., Seiquer, I., & Navarro, M. P. (2009). Influence of diets rich in Maillard
reaction products on calcium bioavailability. Assays in male adolescents and in
Caco-2 cells. Journal of Agricultural and Food Chemistry, 57, 9532–953.
Minekus, M., Alminger, M., Alvito, P., Ballance, S., Bohn, T. O. R. S. T. E. N.,
Bourlieu, C., ... & Dufour, C. (2014). A standardised static in vitro digestion method
suitable for food–an international consensus. Food & function, 5(6), 1113-1124.
Miro-Casas, E., Covas, M., Farre, M., Fito, M., Ortuño, J., Weinbrenner, T. (2003).
Hydroxytyrosol disposition in humans. Clinical Chemistry, 49(6), 945–952.
Olive Oil Times. Brazil looks for its own Olive (2017).
https://www.oliveoiltimes.com/olive-oil-business/brazil-looks-olive/55413. Access
12.06.2017
Paiva-Martins, F., Gonçalves, P., Borges, J. E., Przybylska, D., Ibba, F., Fernandes, J.,
& Santos-Silva, A. (2015). Effects of the olive oil phenol metabolite 3, 4-DHPEA-
EDAH 2 on human erythrocyte oxidative damage. Food & Function, 6(7), 2350-
2356.
Pastor, A., Rodríguez-Morató, J., Olesti, E., Pujadas, M., Pérez-Mañá, C., Khymenets,
O., & Farré, M. (2016). Analysis of free hydroxytyrosol in human plasma following
the administration of olive oil. Journal of Chromatography A, 1437, 183-190.

Resultados
198
Pastoriza, S., Delgado-Andrade, C., Haro, A., & Rufián-Henares, J. A. (2011). A
physiologic approach to test the global antioxidant response of foods. The GAR
method. Food Chemistry, 129(4), 1926-1932.
Pereira-Caro, G., Oliver, C. M., Weerakkody, R., Singh, T., Conlon, M., Borges, G., ...
& Augustin, M. A. (2015). Chronic administration of a microencapsulated probiotic
enhances the bioavailability of orange juice flavanones in humans. Free Radical
Biology and Medicine, 84, 206-214.
Pérez‐Mañá, C., Farré, M., Rodríguez‐Morató, J., Papaseit, E., Pujadas, M., Fitó, M., ...
& Escudier, J. L. (2015). Moderate consumption of wine, through both its phenolic
compounds and alcohol content, promotes hydroxytyrosol endogenous generation in
humans. A randomized controlled trial. Molecular nutrition & Food Research,
59(6), 1213-1216.
Rodríguez-Ramiro, I., Martín, M. Á., Ramos, S., Bravo, L., & Goya, L. (2011). Olive
oil hydroxytyrosol reduces toxicity evoked by acrylamide in human Caco-2 cells by
preventing oxidative stress. Toxicology, 288(1), 43-48.
Rubió, L., Macià, A., Castell-Auví, A., Pinent, M., Blay, M. T., Ardévol, A., ... &
Motilva, M. J. (2014). Effect of the co-occurring olive oil and thyme extracts on the
phenolic bioaccesibility and bioavailability assessed by in vitro digestion and cell
models. Food Chemistry, 149, 277-284.
Rueda, A., Cantarero, S., Seiquer, I., Cabrera-Vique, C., & Olalla, M. (2017).
Bioaccessibility of individual phenolic compounds in extra virgin argan oil after
simulated gastrointestinal process. LWT-Food Science and Technology, 75, 466-
472.
Ruiz-Roca, B., Navarro, M. P., & Seiquer, I. (2008). Antioxidant properties and metal
chelating activity of glucose-lysine heated mixtures. Relationships with mineral

Resultados
199
absorption across Caco-2 cell monolayers. Journal of Agricultural and Food
Chemistry, 56, 9056-9063.
Samaniego Sanchez, C., Troncoso Gonzalez, A.M., Garcıa-Parrilla, M.C., Quesada
Granados, J.J., Lopez Garcıa de la Serrana, H., & Lopez Martınez, M.C. (2007).
Different radical scavenging tests in virgin olive oil and their relation to the total
phenol content. Analytica Chimica Acta, 593,103–107.
Seiquer, I., Rueda, A., Olalla, M., & Cabrera-Vique, C. (2015). Assessing the
bioavailability of polyphenols and antioxidant properties of extra virgin argan oil by
simulated digestion and Caco-2 cell assays. Comparative study with extra virgin
olive oil. Food Chemistry, 188, 496-503.
Servili, M., Sordini, B., Esposto, S., Urbani, S., Veneziani, G., Di Maio, I., ... &
Taticchi, A. (2014). Biological activities of phenolic compounds of extra virgin
olive oil. Antioxidants, 3(1), 1-23.
Soler, A., Romero, M. P., Macià, A., Saha, S., Furniss, C. S., Kroon, P. A., & Motilva,
M. J. (2010). Digestion stability and evaluation of the metabolism and transport of
olive oil phenols in the human small-intestinal epithelial Caco-2/TC7 cell line. Food
Chemistry, 119(2), 703-714.
Szawara-Nowak, D., Bączek, N., & Zieliński, H. (2016). Antioxidant capacity and
bioaccessibility of buckwheat-enhanced wheat bread phenolics. Journal of Food
Science and Technology, 53(1), 621-630.
Tuck, K. L., Freeman, M. P., Hayball, P. J., Stretch, G. L., & Stupans, I. (2001). The in
vivo fate of hydroxytyrosol and tyrosol, antioxidant phenolic constituents of olive
oil, after intravenous and oral dosing of labeled compounds to rats. The Journal of
nutrition, 131(7), 1993-1996.

Resultados
200
Uluata, S., Altuntaş, Ü., & Özçelik, B. (2016). Biochemical Characterization of
Arbequina Extra Virgin Olive Oil Produced in Turkey. Journal of the American Oil
Chemists' Society, 93(5), 617-626.
Williamson, G & Clifford, M.N. (2017). Role of the small intestine, colon and
microbiota in determining the metabolic fate of polyphenols, Biochemical
Pharmacology, http://dx.doi.org/10.1016/j.bcp.2017.03.012.
Xiang, C., Xu, Z., Liu, J., Li, T., Yang, Z., & Ding, C. (2016). Quality, composition,
and antioxidant activity of virgin olive oil from introduced varieties at Liangshan.
LWT-Food Science and Technology, 78, 226-234.

Resultados
201
EVOO
from Brazil
and Spain
In vitro digestion Caco-2 assays
Total phenol content, Antioxidant activiy
Bioaccessible
fraction
Residual extractChemical extract
Viability
ROS
Chemical extraction
Apical
Basolateral
Caco-2
Monolayer
Absorption
GRAPHICAL ABSTRACT

Resultados
202

Resultados
203
Artículo 4
General Paper
Use of Response Surface methodology (RSM) for the
identification of the best extraction conditions by
headspace solid phase micro extraction (HS-SPME) of the
volatile profile of cv. Arbequina extra-virgin olive oil
Thays H. Borges, Elsa Ramalhosa, Isabel Seiquer, Carmen Cabrera-Vique, José
Alberto Pereira.
______________________________________________________________________
En evaluación: European Journal of Lipid Science and Technology

Resultados
204

Resultados
205
Use of Response Surface methodology (RSM) for the identification of the best
extraction conditions by headspace solid phase micro extraction (HS-SPME) of the
volatile profile of cv. Arbequina extra-virgin olive oil
Thays H. Borges a,b
; Elsa Ramalhosa c; Isabel Seiquer
a; Carmen Cabrera-Vique
b; José
Alberto Pereira c
a Dpto. de Fisiología y Bioquímica de la Nutrición Animal, Estación Experimental del
Zaidín, Consejo Superior de Investigaciones Científicas (CSIC), Camino del Jueves,
18100 Armilla, Granada, Spain.
b Dpto. de Nutrición y Bromatología, Facultad de Farmacia, Universidad de Granada,
Campus de Cartuja, 18012 Granada, Spain.
c Centro de Investigação de Montanha (CIMO), ESA, Instituto Politécnico de Bragança,
Campus de Santa Apolónia, 5300-253 Bragança, Portugal
Corresponding author: José Alberto Pereira, Centro de Investigação de Montanha
(CIMO), ESA, Instituto Politécnico de Bragança, Campus de Santa Apolónia, 5300-253
Bragança, Portugal
Tlf.:+351273303277
Fax: +351273325405
E-mail address: [email protected]
Abbreviations: CCD, Central Composite Design; DVB/CAR/PDMS,
divinylbenzene/carboxen/polydimethylsiloxane; EVOO, Extra virgin olive oil; HS-
SPME,headspace solid-phase microextraction; RSM, Response surface methodology.

Resultados
206
Abstract
The effect of the experimental conditions for assessing the global volatile profile of
extra virgin olive oils (EVOO) by headspace solid phase microextraction/gas
chromatography - mass spectrometry (HS-SPME/GC–MS) was studied, in order to
obtain the maximisation of total peak areas of the compounds. Response surface
methodology (RSM) was applied to Arbequina EVOO and influence of oil quantity,
extraction time and extraction temperature on total area and extraction of the major
desirable compounds was analysed. The experimental data were adequately fitted into
second-order polynomial models with non-significant lacks of fit (p>0.05), coefficients
of determination (R2) higher to 0.88 and R
2-adjusted >0.78. A strong similarity was
found between the predicted values and the experimental ones. Furthermore, the surface
plots showed that when increasing the extraction temperature, time and oil quantity, the
extraction of the volatile compounds was favoured. The conditions to obtain the
maximum response in the extraction of “green” volatile compounds of Arbequina olive
oil by HS-SPME placed in 50 ml vials were 4.6 g of oil, 43 min and 59 °C.
Practical applications: Findings of the present work show that specific conditions of
HS-SPME/GC–MS affect the extraction of volatile compounds of cv. Arbequina olive
oil and establish the optimum extraction parameters to determine more efficiently the
global profile of this fraction, taking into account the organoleptic characteristics of the
cultivar. The results also contribute to the knowledge of the volatile profile of
monovarietal olive oil cv. Arbequina, which is one of most cultivated and consumed
worldwide.
Keywords: Headspace solid phase microextractio/ Gas chromatography-mass
spectrometry/Aroma/Extraction conditions/ Monovarietal Olive oil.

Resultados
207
1 Introduction
The aroma of olive oils is attributed to a complex mixture of volatile compounds,
mainly aldehydes, alcohols, ketones, hydrocarbons and esters. Compounds of six and
five carbon atoms represent the most important fraction and are generated from
polyunsaturated fatty acids by the lipoxygenase pathway (LOX) [1]. The production of
volatiles occurs in low amounts during the climacteric period of olives and at a high
level in the oil extraction process, particularly during the crushing and malaxation steps
[1-2].
Sensory properties play an important role to discriminate different types of edible oils,
categories and monovarietal olive oils. In this sense, volatile compounds are decisive to
check olive oil quality and to assess their degree of oxidation [2]. Consequently, these
compounds affect the sensory perception and acceptability of consumers [2-4].
The headspace solid phase microextraction (HS-SPME) technique consists in extracting
volatile substances by exposing a fibre coated with a stationary phase (adsorbent), to the
vapour phase (headspace) in equilibrium with the olive oil contained in a thermostated
vial, sealed with a perforable septum. The analysis is performed by thermal desorption
by inserting the fibre directly into the GC injector at a suitable temperature [1].
Nevertheless, only an adequate SPME sampling condition enables a high efficiency and
sensitivity of the method of analysis [5]. In this way, optimal microextraction conditions
are linked to sample quantity, temperature, time and type of fibre [5].
Several studies have been published using HS-SPME to characterize the profile of
volatile compounds of olive oils [6-13]. However, a wide range of conditions have been
used, concerning quantity (1 - 20 g) [14-15], time (10 minutes - 6 hours) [8-14] and
temperature of extraction (25⁰C - 100⁰C) [5-14]. For this reason, comparison between
bibliographic data and the definition of a sensorial profile of olive oils implies great
difficulty. Nowadays, a complete validation of the current methodologies is still lacking
and none of these methods based on SPME–GC can be considered fully established;
therefore, quantification of volatiles may be subjected to significant errors that hinder
the sensory interpretation from the chemical data [13]. Thus, standardizing the
extraction conditions, taking into account the specificities of each monovarietal olive
oil, is an interesting challenge that has not been reported before.
The response surface methodology (RSM) is a mathematical and statistical tool that has
been applied to study the effects of multiple factors and their interactions on one or
Resultados
208
more response variables, being very effective to reduce the number of experiments and
with high reproducibility [16]. Even though this methodology has been successfully
applied to different types of foods such as lettuce, olive paste and beef [17- 19], few
studies exist on olive oil or mixture of olive oil with other food ingredients [16, 20-21].
However, of our knowledge, until now RSM has not been applied to extraction
conditions of volatiles of olive oil.
Concerning monovarietal olive oils, cv. Arbequina is cultivated in different regions and
is popular worldwide [15,22]. Moreover, it is very appreciated due to organoleptic
characteristics such as: fresh, herbal and green; tomato flavour, notes of apple and
banana; sweet almond and artichoke undertones, in general with a low-medium
intensity of pungency and bitterness [3, 9, 12, 15, 23].
Thus, the present study aimed to model and to study the effect of extraction conditions
of HS-SPME, i.e. the quantity of sample, time and temperature, in order to obtain the
maximisation of total peak areas from the major volatile compounds of the
monovarietal Arbequina olive oil. For this purpose, the RSM was used.
1 Materials and methods
2.1 Sample
Monovarietal Arbequina extra virgin olive oil (EVOO) was used in the present study.
The oil was directly obtained from producers in the 2014/2015 harvest and was stored
protected from light at 4 °C until analysis. The Arbequina orchard was located in the
Valladolid province (Spain), and the harvest of the fruits occurred on 2.5 ripening
index. The olive oil was classified as extra virgin olive oil according to legal
requirements (European Regulation 2568/91) performed in our laboratory previously,
showing free acidity of 0.2% oleic acid, peroxide value of 3.7 mEq O2/kg, K232 = 1.50,
K270 = 0.16, K = -0.01, median intensity of sensory defects = 0 and median intensity of
fruity positive attribute > 0 on sensory analysis.
2.2 Volatile headspace solid-phase microextraction (HS-SPME)
For the headspace solid-phase microextraction (HS-SPME) a fibre of 2 cm coated with
divinylbenzene/carboxen/polydimethylsiloxane (DVB/CAR/PDMS; 50/30 μm) from
Supelco (Bellefonte, USA) was used. This type of fibre has been widely used for

Resultados
209
determination of volatiles in olive oils, showing good effectiveness and reproducibility
and high affinity with compounds of low and medium molecular weight [5,24,29]. The
olive oil sample was placed in 50 ml vials to avoid any contact of samples with fibre
and to provide efficient extraction, according to previous studies in a different food
matrix [30]. Then, 4-methyl-2-pentanol was added as internal standard (100 ppm in
methanol; 10 μl) and the vials were sealed with a polypropylene cap with silicon
septum. The volatiles were released at the selected extraction temperature in a water
bath and vigorously stirred with a stir bar (350 rpm) during the time required to allow
the equilibration in the headspace. After the equilibrium time (5 min), the
DVB/CAR/PDMS fibre was exposed during a precise extraction time for volatiles
adsorption and immediately inserted into the injection port of the GC system for thermal
desorption and reconditioning (10 min at 280 °C). Experiments were performed at
different conditions of quantity of sample, extraction temperature and extraction time
(see below).
2.3 Gas chromatography-mass spectrometry (GC-MS) conditions
Chromatographic analysis was performed on a Shimadzu GC-2010 Plus equipped with
a mass spectrometer Shimadzu GC/MS-QP2010 SE detector. A TRB-5MS (30 m × 0.25
mm × 0.25 μm) column (Teknokroma, Spain) was used. The injector was set at 220 °C
and the manual injections were made in splitless mode. The mobile phase consisted in
helium (Praxair, Portugal) at a linear velocity of 30 cm/s and a total flow of 24.4
mL/min. The oven temperatures were the following: 40 °C during1 min; up to 220 °C
with a rate of 2°C/min during 30 min. The ionization source was maintained at 250 °C
with ionization energy of 70 eV, and with an ionization current of 0.1 kV. All mass
spectra were acquired by electron ionization. The ionization was left off during the first
2 minutes. The MS spectra fragments were compared with those obtained from a
database (NIST 11), and also with comparison of GC retention index. Furthermore,
retention indices were obtained using commercial n-alkanes C7-C30 (Sigma-Aldrich, St.
Louis, U.S.A.) by direct splitless liquid injection (1 μL) while all further conditions of
GC and MS as settled for the volatile analysis. The identification was also performed
considering for tentative of identification at least 90-95% of match spectra and for
identification at least 98%. For semi-quantification purposes, the areas of the
chromatographic peaks were determined integrating the re-constructed chromatogram

Resultados
210
from the full scan chromatogram using for each compound the ion base (m/z intensity
100%). For optimisation purposes, each individual ion peak area and the total area were
calculated.
2.4. Experimental design and data analysis
The response surface methodology (RSM) of Minitab® software (version 16, Coventry,
England) was used to determine the best extraction conditions for the major volatiles of
the cv. Arbequina extra virgin olive oil. A Central Composite Design (CCD), full-
factorial (α=1,682), with three independent factors, namely, quantity of oil (X1), time
(X2) and temperature (X3) was applied. The response variables were the total area of the
peaks and the main compounds peaks, namely, Z-3-hexenal, E-2-hexenal, Z-3-hexen-1-
ol, 1-hexanol, Z-3-hexen-1-ol acetate, hexyl acetate and E-2-hexen-1-ol acetate. Table 1
shows the range and centre point values of the three independent variables that have
been coded to 5 levels: -1.682, -1, 0, +1 and + 1.682. The experimental design consists
of six axial points at a distance of ±1.682 from the centre, six replicates of the central
point that are used to determine the experimental error for data reproducibility, and
eight cube points (Table 2). The experimental runs were randomized in order to
minimize the effects of unexpected variability in the observed responses. Furthermore,
each point of the CCD was carried out in duplicate as described previously to optimise
extraction antioxidant properties [18].
The experimental data from the CCD was analyzed using response surface regression
and fitted to a second-order polynomial model, as indicated in Eq. (1).
(1)
where Y is the predicted dependent variable; β0 is the model constant that fixes the
response at the central point of the experiment (intercept); βi is the regression coefficient
for the linear effect terms; βii is the quadratic effect term; βij is the interaction effect
term of variables i and j; Xi and Xj are the independent variables. The adequacy of the
model was predicted through the analysis of variance (ANOVA) including the F-ratio,
which established the lack-of-fit of the model and the determination coefficients (R2)
and adjusted R2. Additionally, the experimental and predicted values for each dependent
variable were compared. The significant factors affecting each dependent variable were
selected according to the Student t-test at 95% confidence level. On the basis of the

Resultados
211
responses obtained previously, the optimum point was determined by applying the
“Response Optimizer” tool of Minitab® with the goal of obtaining simultaneously all
the maximal responses of peak areas considering the compounds identified and the total
area. Moreover, the desirability function was applied for optimization of response and
establish the best condition for all the peaks simultaneously, i.e, applying this function
is possible the transformation of each response into a dimensionless individual
desirability (di) scale [25].In this sense, the scale of the individual desirability function
ranges between d = 0, for a completely undesirable response, and d = 1, for a fully
desired response [25].
Table 1. Coded and uncoded (true) values of variables of CCD model.
Coded units
-1.682 -1 0 1 +1.682
True values
Oil, X1 (g) 1.3 2.0 3.0 4.0 4.7
Time, X2 (min) 13.18 20.00 30.00 40.00 46.82
Temperature, X3 (ºC) 33.18 40.00 50.00 60.00 66.82
3 Results and discussion
3.1 Effects of SPME conditions on the volatile composition of cv. Arbequina olive
oil
In olive oil the six straight-chain carbon compounds (C6) are among the most important
ones for aroma, being aldehydes and alcohols mainly linked to green-fruity notes and
esters to fruity and aromatic flavour [24,26 27].
In the present work, the main volatiles found were C6 compounds as aldehydes (Z-3-
hexenal, E-2-hexenal), alcohols (1-hexanol, Z-3-hexen-1-ol) and the corresponding
esters (Z-3-hexen-1-ol acetate, hexyl Acetate and E-2-hexen-1-ol acetate). Our results
are in concordance with previous studies showing a high content of C6 compounds in
cv. Arbequina olive oils from the Mediterranean basin [9-10, 12, 15, 22]. According to
Pérez et al., [26], the content of C6 is on average 2–160 times higher than that of the
rest of the groups of volatile compounds in the oils. All the volatile compounds
identified in the present work were related with positive sensorial characteristics such
as: almonds, apple, astringent, banana, bitter, fresh, green-fruity, green leaves, pungent,
sweet and tomato [1, 3, 28]. Besides, E-2-hexenal is also considered as an index of
freshness of olive oils [4, 29].

Resultados
212
In the analyzed cv. Arbequina olive oil, the seven most representative identified volatile
compounds were Z-3-hexenal, E-2-hexenal, Z-3-hexen-1-ol, 1-hexanol, Z-3-hexen-1-ol
acetate, hexyl acetate and E-2-hexen-1-ol acetate (Table 2).
Regarding experimental values of total area, it was observed the highest peak area for
condition 9 (1.32g/30 min/50ºC) and slightly lower values were found for the conditions
7 (4g/40 min/60ºC) and 18 (2g/40min/60ºC). In all cases, high temperatures (50-60 °C)
and long times of extraction (30-40 min) were effective in providing high total peak
areas.
Moreover, the condition 7 (4g/40 min/60ºC) showed the highest peak values for E-2-
hexenal, Z-3-hexen-1-ol acetate, hexyl Acetate and E-2-hexen-1-ol Acetate. On the
other hand, the best condition for extracting Z-3-hexenal, Z-3-hexen-1-ol and 1-
hexanol compounds, was the 17 (4.68g/30 min/50ºC). In this sense, the results obtained
indicated that the peaks area increased with increasing temperature and time.
Furthermore, Nonanal was detected in all conditions tested (data not shown) in between
0.09-2.6 ng of internal standard.g-1
of olive oil. This compound, when detected in higher
quantities than in the present assay, has been associated with signs of rancidity [2,1].
Other studies also reported low values of nonanal previously for Arbequina olive oils
[10,15]. At the same time, the temperature conditions seem not to be the responsible for
the low content of nonanal found due to the fact that we did not observe a marked effect
or any tendency linked to temperature conditions.
In addition, hexanal was not detected in our analytical conditions as well as recent study
that didn’t detected in commercial olive oils from Spain, Italia and France [32]. Possible
reasons may be: a very low level of this compound (traces) exists in the sample, in a
similar way than described for olive oil from Tunisian cultivars [31] or associated with
the time of retention close to the internal standard in our experimental conditions hinder
the identification.

Resultados
213
Table 2. Observed responses and predicted values for total area and major volatile peaks compounds in cv. Arbequina olive oil.
Co
nd
itio
n
Oil
(g
)
Tim
e (m
in)
T (
°C)
To
tal
are
a
(x1
08)
Z-3
-
hex
ena
l
(x1
07)
E-2
-
hex
ena
l
(x1
07)
Z-3
-hex
en-
1-o
l (x
10
7)
1-h
exa
no
l
(x1
06)
Z-3
-hex
en-
1-o
l
Ace
tate
(x1
07)
hex
yl
ace
tate
(x1
06)
E-2
hex
en-
1-o
l a
ceta
te
(x1
06)
E P E P E P E P E P E P E P E P
1 3.0 30. 50.00 6.48 6.28 1.10 1.19 3.32 3.27 1.13 1.06 2.55 2.39 3.05 2.92 1.63 1.58 0.99 0.95
2 2.0 40.00 40.00 6.38 5.70 1.03 1.03 2.92 3.27 0.91 0.90 2.01 2.00 2.25 2.59 1.19 1.44 0.71 0.61
3 4.0 20.00 40.00 4.93 5.51 1.16 1.19 2.35 2.64 0.84 0.78 1.82 1.71 1.33 1.68 0.61 0.65 0.45 0.52
4 2.0 20.00 40.00 5.09 5.70 0.92 1.03 2.02 2.37 0.68 0.67 1.51 1.45 1.18 1.68 0.55 0.56 0.40 0.49
5 3.0 30.00 50.00 6.31 6.28 1.27 1.19 3.32 3.27 1.06 1.06 2.45 2.39 2.84 2.92 1.50 1.58 0.93 0.95
6 3.0 30.00 33.18 5.11 5.04 1.22 1.26 2.36 3.22 0.78 0.77 1.65 1.66 1.28 1.60 0.62 0.76 0.38 0.44
7 4.0 40.00 60.00 6.81 6.07 1.17 1.19 3.59 3.49 1.09 1.08 2.42 2.39 4.62 4.69 2.69 2.59 1.56 1.69
8 4.0 20.00 60.00 5.76 6.07 1.17 1.19 3.06 3.09 1.03 1.04 2.29 2.33 2.97 2.71 1.65 1.72 0.96 0.83
9 1.3 30.00 50.00 6.92 6.60 0.87 0.88 2.70 2.73 0.82 0.85 1.83 1.89 2.58 2.92 1.47 1.42 0.81 0.72
10 2.0 20.00 60.00 6.02 6.45 0.94 0.95 2.76 2.69 0.90 0.87 2.01 1.93 1.51 2.71 0.84 1.53 0.52 0.86
11 3.0 13.18 50.00 4.83 5.77 1.01 1.07 2.28 2.31 0.82 0.83 1.81 1.85 1.46 1.70 0.69 0.84 0.52 0.54
12 3.0 30.00 66.82 6.24 6.31 0.96 1.12 3.08 3.32 0.93 0.94 2.04 2.05 4.04 4.24 2.20 0.24 1.52 1.46
13 3.0 46.82 50.00 6.71 5.77 1.15 1.07 3.44 3.40 1.06 1.05 2.39 2.36 3.74 4.14 2.08 0.23 1.28 1.36
14 3.0 30.00 50.00 6.02 6.28 1.14 1.19 3.13 3.27 1.01 1.06 2.28 2.39 2.69 2.92 1.40 1.58 0.92 0.95
15 3.0 30.00 50.00 6.09 6.28 1.18 1.19 3.18 3.27 1.03 1.06 2.25 2.39 2.77 2.92 1.49 1.58 0.87 0.95
16 4.0 40.00 40.00 5.76 5.32 1.23 1.27 3.18 3.67 1.05 1.07 2.36 2.40 2.22 2.59 1.15 1.62 0.69 0.86
17 4.7 30.00 50.00 5.96 5.96 1.30 1.28 3.44 3.41 1.14 1.13 2.60 2.56 2.77 2.92 1.48 1.73 0.89 0.91
18 2.0 40.00 60.00 6.78 6.45 0.95 0.95 2.97 3.08 0.90 9.06 1.93 1.99 3.95 4.69 2.29 2.41 1.41 1.44
19 3.0 30.00 50.00 6.29 6.28 1.18 1.19 3.29 3.27 1.04 1.06 2.36 2.39 3.08 2.92 1.75 1.58 0.97 0.95
20 3.0 30.00 50.00 6.47 6.28 1.26 1.19 3.37 3.27 1.08 1.06 2.49 2.39 3.07 2.92 1.68 1.58 1.03 0.95
Average of duplicate extractions. E- Experimental values; P - Predicted values

Resultados
214
3.2 Model fitting using Response Surface Methodology (RSM)
The experimental and predictive values for total area and major volatile compounds
peaks at each extraction conditions are shown in Table 2. The predicted values were
determined according to the quadratic models obtained; based on the independent
factors, namely, quantity of oil (X1), time (X2) and temperature (X3). Thus, the predicted
values (Y) (Z-3-hexenal, E-2-hexenal, Z-3-hexen-1-ol, 1-hexanol, Z-3-hexen-1-ol
acetate, hexyl acetate and E-2-hexen-1-ol acetate) were assessed as a function of the
significant linear, quadratic and interaction effects (p<0.05), as shown in Table 3. The
response surface models obtained with a 0.05 level of significance were the following
(Eqs. 2-9):
(2)
(3)
(4)
(5)
(6)
(7)
(8)
(9)
The values obtained experimentally for all response variables were similar to the
predicted values (Table 2), indicating that values fitted the models in a satisfactory way.
The quality of the models for total area and major volatile compounds was evaluated by
the lack-of-fit, R2
and adjusted R2 values (Table 3). The p-values of lack-of-fit higher

Resultados
215
than 0.05 indicate that the variation between samples is mainly due to the factors
selected for the model and the pure error [18]. Furthermore, R2
and adjusted R2
values
closer to unity indicate that the empirical models fit satisfactorily the real data. All
models showed non-significant lack-of-fit values (p>0.05). Also, high values for R2
and
adjusted R2
were observed, ranging from 0.882 to 0.981 and 0.777 to 0.964,
respectively.
In general, the three factors studied had a significant role on the response variables
studied, with the exceptions of oil quantity (X1) on Z-3-hexen-1-ol acetate and
extraction time (X2) on Z-3-hexenal. Furthermore, in almost all situations, oil quantity,
extraction time and temperature presented a positive linear effect on the responses
analyzed. Individually, the extraction temperature (X3) had the most significant impact
on Z-3-hexen-1-ol acetate, hexyl acetate and E-2-hexen-1-ol-acetate confirmed for the
higher coefficient values observed in Table 3, although the quantity of oil showed the
highest effect on Z-3-hexen-1-ol and 1-hexanol. On the other hand, the extraction time
had the highest effect on total area and E-2-hexenal.
Some response surface plots of total area and major volatiles present in cv. Arbequina
olive oil are shown in Figures 1 and 2. The application of high times and temperatures
increased the total area, while the effect of oil quantity was less evident.
The major volatile compounds detected were Z-3-hexen-1-ol acetate and E-2-hexenal.
These compounds have been reported previously in some studies of cv. Arbequina olive
oils [9-10, 12, 15, 22, 28]. In earlies studies, oils from this cultivar were associated with
ripe fruit aroma, slight oily odour and sweet taste [33], but, according to García-
González, Romero and Aparicio [22], the market tendency with a high demand of
greener and bitterer oils has favoured the production of monocultivar Arbequina oils
from low ripened olives and, as a results, increasing sensorial descriptors as cut-green,
tomato and a medium bitter taste, sensory traits associated to the predominance of Z-3-
hexen-1-ol acetate and E-2-hexenal. For these reasons, we selected the surface plots of
Z-3-hexen-1-ol acetate and E-2-hexenal to illustrate the behaviour of the major
compounds (Fig 2.A, Fig 2.B). For the former compound, it was stated by the quadratic
model (Eq. 7) that only time and temperature influenced the extraction of this
compound. On the contrary, all the factors influenced E-2-hexanal extraction, the
highest linear coefficients being obtained for time and temperature. Nevertheless, in the
case of E-2-hexenal, a slight decrease on the total area was observed at 60 °C and 40
min of extraction time onwards.

Resultados
216
Concerning Z-3-hexen-1-ol, (Fig 2.C), after fixing the quantity of olive oil in 3 g , a
similar behaviour to E-2-hexenal was observed. Regarding the oil quantity (Fig 2.D),
when it increased, the area of the peak of this compound also increased, showing that
the region of higher oil quantity and extraction time would promote the extraction of
this compound. Furthermore, we found that all the other compounds presented similar
behaviours to those described above (data not shown).
Thereby, our results suggest that high values of each one of the three analysed variables
is individually favourable for a better extraction; however, for some compounds, the
simultaneous application of higher temperature and longer time of extraction might
favour their degradation, decreasing the peak area. These results are in concordance
with Beltran, Aguilera and Gordon [6], who showed a significantly increase of volatile
compounds in the headspace of olive oils emulsions with increasing temperature. The
higher concentration is mainly attributed to the rise of vapour pressure due to
temperature increase that enhances the mass transference of analytes, increasing their
concentration in the gas phase [5-6].

Resultados
217
Table 3. ANOVA for the quadratic models developed to describe the influence of oil quantity (X1), time (X2) and temperature (X3) on total area
and major volatile compounds peaks from cv. Arbequina olive oil.
Term
constant Total area (x107)
Z-3-hexenal
(x105)
E-2-hexenal
(x106)
Z-3-hexen-1-ol
(x105)
1-hexanol
(x105)
Z-3-hexen-1-ol
acetate (x106)
hexyl acetate
(x104)
E-2-hexen-1-ol
acetate (x104)
Coefficient p Coefficient p Coefficient p Coefficient p Coefficient p Coefficient p Coefficient p Coefficient p
Constant 62.80 0.000 119 0.000 32.7 0.000 106 0.000 23.9 0.000 29.2 0.000 158 0.000 95.2 0.000
X1 -1.90 0.004 11.8 0.000 2.02 0.000 8.52 0.000 1.99 0.000 1.87 0.148 9.21 0.035 5.50 0.025
X2 5.18 0.000 3.28 0.076 3.23 0.000 6.60 0.000 1.52 0.000 7.24 0.000 43.9 0.000 24.4 0.000
X3 3.75 0.000 -4.01 0.036 2.27 0.000 5.04 0.000 1.17 0.001 7.83 0.000 48.6 0.000 30.1 0.000
X1² 0.51 0.286 -3.81 0.040 -0.705 0.010 -2.46 0.019 -0.601 0.038 -1.11 0.651 -4.65 0.236 -4.79 0.040
X2² -1.80 0.005 -4.00 0.033 -1.46 0.000 -4.13 0.001 -1.02 0.002 -1.38 0.095 -7.60 0.066 -3.11 0.158
X3² -2.13 0.002 -3.56 0.052 -1.95 0.000 -7.10 0.000 -1.91 0.000 -1.17 0.284 -6.78 0.095 -1.22 0.561
X1. X2 -0.21 0.767 -0.738 0.740 0.324 0.300 0.558 0.647 0.317 0.369 -1.21 0.692 -6.43 0.223 -4.80 0.109
X1. X3 0.70 0.330 0.078 0.972 0.416 0.191 0.106 0.930 0.127 0.714 2.51 0.592 14.9 0.013 7.00 0.028
X2. X3 -0.39 0.580 -2.00 0.378 -1.25 0.020 -4.75 0.002 -1.23 0.004 2.67 0.009 16.4 0.008 11.6 0.002
Lack-of-fit
0.504
0.637
0.687
0.919
0.831
0.229
0.428
0.154
R2 0.952
0.882
0.981
0.965
0.952
0.976
0.970
0.975
R2 adjusted 0.908
0.777
0.964
0.933
0.910
0.954
0.940
0.952

Resultados
218
Oil quantity
6.5
5.5
5
30
40
50
60
10
20
40
30
1 23 4
10 20 30
Extraction time
40
1 23 4 30
40
50
60
Oil quantity
Total Area
A
B
C
Figure 1. Response surface plots of total area considering middle values for oil quantity
(3 g) (Fig 1-A), temperature (50°C) (Fig 1.B) and time (30 min) (Fig 1.C).

Resultados
219
D
A
B
10
8
6
4
Z-3-hexen-1-ol Acetate
Extraction time
2030 40
3
2
1
Z-3- hexen-1-ol
E-2-hexenal
C
6
4
2
0
40
50
60
20
403020 30
40
40
50
60
Extraction time
Extraction time
20 3040
12
10
8
62
3 440
50
60
Oil quantity
Z-3- hexen-1-ol
40
50
60
Figure 2. Response surface plots of Z-3-hex-1-ol Acetate (Fig 2-A), E-2-hexenal (Fig
2.B) and Z-3-hexan-1-ol (Fig 2.C) fixing the middle value for oil quantity (3 g).
Response surface plot of Z-3-hexan-1-ol fixing temperature (50°C) (Fig 2.D)

Resultados
220
3.3 Optimisation of volatiles extraction and verification of the models
The optimal extraction point was 4.6 g of oil, 43 min and 59 °C with 0.88 of desirability
(D). The predicted and experimental values of each compound peak, the calculated
desirability (D) and the percentage of error are depicted in Table 4. The scale of the
individual desirability function ranges between 0 for a completely undesirable response,
and 1 for a fully desired response. Hence, a global D value of 0.88 predicted in the
present work, is quite acceptable to target the ideal extraction conditions to define the
volatile profile of cv. Arbequina olive oils. The experimental values were obtained by
conducting assays in triplicate under the recommended optimum conditions. Table 4
shows close similarity between the predicted values of the responses and the
experimental models, with low errors (<15%) and good desirability (0.65-1.00). The
high values of desirability showed that our goal to maximise the extraction of the
volatile compounds studied in the present work was successfully achieved.
Table 4. Validation of the optimal point of extraction.
D
1
Y
Predicted
Y
Experimental
Error
(%)2
Total area (x108)
0.72 6.63 6.73 1.51
Z-3-hexenal (x107)
0.65 1.16 1.21 4.31
E-2-hexenal (x107)
1.00 3.62 3.54 2.21
Z-3-hexen-1-ol (x107)
0.88 1.10 1.06 3.63
1-hexanol (x106)
0.86 2.49 2.42 2.81
Z-3-hexen-1-ol acetate (x106)
1.00 4.62 4.82 4.33
hexyl acetate (x106)
0.97 2.67 2.80 4.87
E-2 hexen-1-ol acetate (x106)
1.00 1.56 1.77 13.46
1
D refers to desirability. 2
Error (%) was calculated by the equation:
Resultados
221
4 Conclusions
The temperature was the extraction condition of HS-SPME/GC–MS which mainly
affected the volatile profile of cv. Arbequina olive oils; however, the time also
presented a strong influence on the extraction of aroma compounds. Furthermore, the
control of the proposed parameters allows an optimal extraction of desirable volatile
compounds improving the total areas of the peaks. The maximum response for all
volatile compounds analysed was obtained using 4.6 g of oil; 43min and 59 °C. The
results obtained through the developed quadratic models show that that RSM was a
good and adequate tool to study the behaviour of volatiles depending on the factors
considered, to maximise the aroma profile analysis in monovarietal olive oil. However,
the extraction conditions must be optimised for each kind of varietal olive oil, since
each one could present specific volatile compounds. In a future work, we aim to
evaluate the different profile of Arbequina olive oils to study the possible differences of
global volatile profiles applying the current parameters.
Acknowledgements
We are grateful to the CAPES Foundation – Ministry of Education, Brazil for the
scholarship support provided to the first author. This work is part of the doctoral thesis
of Thays Helena Borges, Ph.D. student from the Official Doctoral Program “Nutrition
and Food Sciences” of the Granada University. The authors are also grateful to the
Foundation for Science and Technology (FCT, Portugal) and FEDER under Programme
PT2020 for financial support to CIMO (UID/AGR/00690/2013). We dedicate this work
to the memory of Carmen Cabrera Vique.

Resultados
222
References
[1] Angerosa, F., Servili, M., Selvaggini, R., Taticchi, A., Esposto, S., Montedoro, G.
(2004). Volatile compounds in virgin olive oil: occurrence and their relationship with
the quality. J. Chromatogr. A, 1054(1), 17-31.
[2] Kalua, C. M., Allen, M. S., Bedgood, D. R., Bishop, A. G., Prenzler, P. D.,
Robards, K. (2007). Olive oil volatile compounds, flavour development and quality: A
critical review. Food Chem., 100(1), 273-286.
[3] Luna, G., Aparicio, R. (2002). Characterisation of monovarietal virgin olive oils.
Eur. J. Lipid Sci. Technol., 104, 614-627.
[4] Sinesio, F., Moneta, E., Raffo, A., Lucchetti, S., Peparaio, M., D'Aloise, A.,
Pastore, G. (2015). Effect of extraction conditions and storage time on the sensory
profile of monovarietal extra virgin olive oil (cv Carboncella) and chemical drivers of
sensory changes. LWT- Food Sci. Technol., 63(1), 281-288.
[5] Vichi, S., Pizzale, L., Conte, L. S., Buxaderas, S., López-Tamames, E. (2005).
Simultaneous determination of volatile and semi-volatile aromatic hydrocarbons in
virgin olive oil by headspace solid-phase microextraction coupled to gas
chromatography/mass spectrometry. J. Chromatogr. A, 1090(1), 146-154.
[6] Beltrán, G., Aguilera, M. P., Gordon, M. H. (2005). Solid phase microextraction of
volatile oxidation compounds in oil-in-water emulsions. Food Chem., 92(3), 401-406.
[7] Bubola, K. B., Koprivnjak, O., Sladonja, B. (2012). Influence of filtration on volatile
compounds and sensory profile of virgin olive oils. Food Chem., 132(1), 98-103.
[8]Cecchi, T., Alfei, B. (2013). Volatile profiles of Italian monovarietal extra virgin
olive oils via HS-SPME–GC–MS: Newly identified compounds, flavors molecular
markers, and terpenic profile. Food Chem., 141(3), 2025-2035.

Resultados
223
[9] Dabbou, S., Brahmi, F., Selvaggini, R., Chehab, H., Dabbou, S., Taticchi, A., ...
Hammami, M. (2011). Contribution of irrigation and cultivars to volatile profile and
sensory attributes of selected virgin olive oils produced in Tunisia. Int. J. of Food Sci.
Technol., 46(9), 1964-1976.
[10] Hbaieb, R. H., Kotti, F., Gargouri, M., Msallem, M., Vichi, S. (2016). Ripening
and storage conditions of Chétoui and Arbequina olives: Part I. Effect on olive oils
volatiles profile. Food Chem., 203, 548-558.
[11] Oliver-Pozo, C., Aparicio-Ruiz, R., Romero, I., García-González, D. L. (2015).
Analysis of Volatile Markers for Virgin Olive Oil Aroma Defects by SPME-GC/FID:
Possible Sources of Incorrect Data. J. Agric. Food Chem., 63(48), 10477-10483.
[12] Reboredo-Rodríguez, P., González-Barreiro, C., Cancho-Grande, B., Fregapane,
G., Salvador, M. D., Simal-Gándara, J. (2015). Characterisation of extra virgin olive
oils from Galician autochthonous varieties and their co-crushings with Arbequina and
Picual cv. Food Chem., 176, 493-503.
[13] Romero, I., García-González, D. L., Aparicio-Ruiz, R., Morales, M. T. (2015).
Validation of SPME–GCMS method for the analysis of virgin olive oil volatiles
responsible for sensory defects. Talanta, 134, 394-401.
[14] Cavalli, J. F., Fernandez, X., Lizzani-Cuvelier, L., Loiseau, A. M. (2004).
Characterization of volatile compounds of French and Spanish virgin olive oils by HS-
SPME: Identification of quality-freshness markers. Food Chem., 88(1), 151-157.
[15] García-González, D. L., Tena, N., Aparicio, R. (2010). Quality characterization of
the new virgin olive oil var. Sikitita by phenols and volatile compounds. J. Agric. Food
Chem., 58(14), 8357-8364.
[16] Espínola, F., Moya, M., Fernández, D. G., Castro, E. (2011). Modelling of virgin
olive oil extraction using response surface methodology. Intern. J. Food Sci. Tech.,
46(12), 2576-2583.
Resultados
224
[17] Bejaoui, M. A., Beltran, G., Aguilera, M. P., Jimenez, A. (2016). Continuous
conditioning of olive paste by high power ultrasounds: Response surface methodology
to predict temperature and its effect on oil yield and virgin olive oil characteristics.
LWT-Food Sci. Technol., 69, 175-184.
[18] Gomes, T., Delgado, T., Ferreira, A., Pereira, J. A., Baptista, P., Casal, S.,
Ramalhosa, E. (2013). Application of response surface methodology for obtaining
lettuce (Lactuca sativa L.) by-products extracts with high antioxidative properties. Ind.
Crops Prod., 44, 622-629.
[19] Ma, Q. L., Hamid, N., Bekhit, A. E. D., Robertson, J., Law, T. F. (2013).
Optimization of headspace solid phase microextraction (HS-SPME) for gas
chromatography mass spectrometry (GC–MS) analysis of aroma compounds in cooked
beef using response surface methodology. Microchem. J., 111, 16-24.
[20] Caporaso, N., Genovese, A., Burke, R., Barry-Ryan, C., Sacchi, R. (2016a). Effect
of olive mill wastewater phenolic extract, whey protein isolate and xanthan gum on the
behaviour of olive O/W emulsions using response surface methodology. Food
Hydrocoll., 61, 66-76.
[21] Caporaso, N., Genovese, A., Burke, R., Barry-Ryan, C., Sacchi, R. (2016b).
Physical and oxidative stability of functional olive oil-in-water emulsions formulated
using olive mill wastewater biophenols and whey proteins. Food Funct., 7(1), 227-238.
[22] García-González, D. L., Romero, N., Aparicio, R. (2010). Comparative study of
virgin olive oil quality from single varieties cultivated in Chile and Spain. J. Agric.
Food Chem., 58(24), 12899-12905.
[23] Bakhouche, A., Lozano-Sánchez, J., Beltrán-Debón, R., Joven, J., Segura-
Carretero, A., Fernández-Gutiérrez, A. (2013). Phenolic characterization and
geographical classification of commercial Arbequina extra-virgin olive oils produced in
southern Catalonia. Food Res. Int., 50(1), 401-408.

Resultados
225
[24] Cavalli, J. F., Fernandez, X., Lizzani-Cuvelier, L., Loiseau, A. M. (2003).
Comparison of static headspace, headspace solid phase microextraction, headspace
sorptive extraction, and direct thermal desorption techniques on chemical composition
of French olive oils. J. Agric. Food Chem., 51(26), 7709-7716.
[25] Bezerra, M. A., Santelli, R. E., Oliveira, E. P., Villar, L. S., & Escaleira, L. A.
(2008). Response surface methodology (RSM) as a tool for optimization in analytical
chemistry. Talanta, 76(5), 965-977.
[26] Pérez, A. G., de la Rosa, R., Pascual, M., Sánchez-Ortiz, A., Romero-Segura, C.,
León, L., Sanz, C. (2016). Assessment of volatile compound profiles and the deduced
sensory significance of virgin olive oils from the progeny of Picual × Arbequina
cultivars. J. Chromatogr. A, 1428, 305-315.
[27] Procida, G., Cichelli, A., Lagazio, C., Conte, L. S. (2016). Relationships between
volatile compounds and sensory characteristics in virgin olive oil by analytical and
chemometric approaches. J. Sci. Food Agr., 96(1), 311-318.
[28] Luna, G., Morales, M. T., Aparicio, R. (2006). Characterisation of 39 varietal
virgin olive oils by their volatile compositions. Food Chem., 98(2), 243-252.
[29] Vichi, S., Guadayol, J. M., Caixach, J., López-Tamames, E., Buxaderas, S. (2007).
Comparative study of different extraction techniques for the analysis of virgin olive oil
aroma. Food Chem., 105(3), 1171-1178.
[30] Malheiro, R., de Pinho, P. G., Soares, S., da Silva Ferreira, A. C., Baptista, P.
(2013). Volatile biomarkers for wild mushrooms species discrimination. Food Res. Int.,
54(1), 186-194.
[31] Issaoui, M., Flamini, G., Brahmi, F., Dabbou, S., Hassine, K. B., Taamali, A.,
Hammami, M. (2010). Effect of the growing area conditions on differentiation between
Chemlali and Chétoui olive oils. Food Chem., 119(1), 220-225.

Resultados
226
[32] Fortini, M., Migliorini, M., Cherubini, C., Cecchi, L., & Calamai, L. (2017).
Multiple internal standard normalization for improving HS-SPME-GC-MS quantitation
in virgin olive oil volatile organic compounds (VOO-VOCs) profile. Talanta, 165, 641-
652.
[33] Aparicio, R., Morales, M. T., & Alonso, V. (1997). Authentication of European
virgin olive oils by their chemical compounds, sensory attributes, and consumers'
attitudes. J. Agric. Food Chem., 45(4), 1076-1083.

Resultados
227
Artículo 5
General Paper
Application of electronic tongue for assessing the sensory
profile of Brazilian and Spanish EVOO based on
estimation of volatile and phenolic compounds
Thays H. Borges, António M. Peres, Luís G. Dias, Isabel Seiquer, José Alberto
Pereira.
______________________________________________________________________

Resultados
228

Resultados
229
Application of electronic tongue for assessing the sensory profile of Brazilian and
Spanish EVOO based on estimation of volatile and phenolic compounds
Thays H. Borges a,b
, António M. Peres c*
, Luís G. Dias d,e
, Isabel Seiquer a, José Alberto
Pereiraf
a Departamento de Fisiología y Bioquímica de la Nutrición Animal, Estación
Experimental del Zaidín, Consejo Superior de Investigaciones Científicas (CSIC),
Camino del Jueves, 18100 Armilla, Granada, Spain.
b Departamento de Nutrición y Bromatología, Facultad de Farmacia, Universidad de
Granada, Campus de Cartuja 18012, Granada, Spain.
c Laboratory of Separation and Reaction Engineering - Laboratory of Catalysis and
Materials (LSRE-LCM), Escola Superior Agrária, Instituto Politécnico de Bragança,
Campus Santa Apolónia, 5300-253 Bragança, Portugal.
d Escola Superior Agrária, Instituto Politécnico de Bragança, Campus Santa Apolónia,
5300-253 Bragança, Portugal.
e CQ-VR, Centro de Química – Vila Real, UTAD, Apartado 1013, 5001-801 Vila Real,
Portugal.
f Centro de Investigação de Montanha (CIMO), ESA, Instituto Politécnico de Bragança,
Campus de Santa Apolónia, 5300-253 Bragança, Portugal.
* Corresponding author: António M. Peres, Laboratory of Separation and Reaction
Engineering - Laboratory of Catalysis and Materials (LSRE-LCM), Escola Superior
Agrária, Instituto Politécnico de Bragança, Campus Santa Apolónia, 5300-253
Bragança, Portugal. E-mail address: [email protected]

Resultados
230
ABSTRACT
It is well-known that the global organoleptic characteristics of olive oil are based upon
the combined effect of odour, taste and chemical responses. In this sense, E-tongue is a
new powerful tool that combined with chemometric analysis has been proposed to
improve the quality assessment and the adequate classification of olive oils.
Nevertheless, the E-tongues have been scarcely applied for the indirect assessment of
volatile or phenolic compounds. In this work, we propose to use the E-tongue for
assessing parameters related to the global organoleptic profile of Arbequina EVOO
based on the potentiometric fingerprints of the olive oil’s hydroethanolic extracts from
different regions of Brazil and Spain. Among volatile compounds detected, E-2-hexanal
and Z-3-hexenyl acetate, which are linked to desirable odour descriptors such as green,
green astringent, bitter, apple-like, banana-like and fruity, showed the highest levels.
The multiple linear regression (MLR) models based on 8-15 sensor signals were able to
assess the phenolic contents with good accuracy (R2≥ 0.930 - repeated K-fold-CV) and
also showed a promising potential for the evaluation of the volatile profiles of
Arbequina EVOO (R2≥ 0.818 - repeated K-fold-CV). The findings of this study showed
that the E- tongue is a helpful analytical tool and enabled preliminary insights regarding
the organoleptic profile of the Arbequina olive oil.
Keywords: Electronic tongue; Volatiles; Phenols; Arbequina.

Resultados
231
1. Introduction
Olive oil is a food product with recognized healthy and nutritional properties, mainly
due to their composition in phenolic compounds such as flavonoids, phenolic acids and
phenol alcohols (Lopez et al., 2014; Servili et al., 2014). These chemical compounds are
not only responsible for the olive oil antioxidant capacity but also by several gustatory
positive sensations, including bitterness, pungency and astringency. In addition, the
volatile compounds usually found in olive oil are responsible for the positive olfactory
attributes (Fortini et al., 2017; Kalua et al., 2007). The overall organoleptic quality
assessment of olive oil is based upon the perception of flavour, which is the combined
effect of odour (perceived via ortho-nasal and retronasal routes), taste and chemical
responses (pungency) (Barbieri et al., 2015). The unique organoleptic characteristics
make extra virgin olive oils (EVOO) distinguishable from other vegetable oils (Barbieri
et al., 2015; Procida et al, 2016), in this sense, a sensory evaluation carried out
according to a trained panel is required as part of the legal control classification of the
olive oils according to established by the European regulation (ECC, 2013). However,
although being the only homologated method for the organoleptic evaluation of olive
oils, the use of trained panellists may present several disadvantages namely, the cost
price of the formation and training of a panel, the impossibility to evaluate large number
of samples and the delay of results for several days, and the certain degree of
subjectivity (Apetrei et al., 2010). Usually, the determination of phenolic compounds in
olive oils is carried out by ultra-performance chromatographic and mass spectrometry
methods (Rivas et al., 2013); and the volatile profile is evaluated by headspace solid-
phase microextraction gas chromatography-mass spectrometry (HS-SPME-GC-MS)
(Fortini et al., 2017). These analytical approaches, as well as the sensory analysis by
trained panellists, are time-demanding and expensive. Thus, electronic sensor devices
have been proposed to directly or indirectly evaluate olive oil odour and taste, namely
electronic noses and tongues (E-noses and E-tongues, respectively).
Some electrochemical devices combined with chemometric tools have been proposed to
improve the quality assessment and authentication of foods, namely voltammetric or
potentiometric electronic tongues (E-tongues). E-tongues are powerful instruments that
allow the extraction of representative chemical fingerprints of liquid food matrices
based on the electrochemical signals recorded (Di Rosa et al., 2017). The E-tongue
employment has many advantages such as low-cost, simple, portable, fast, accurate,

Resultados
232
reliable and robust (Dias et al., 2014; Di Rosa et al., 2017). In regard to olive oils, it has
been successfully applied for their classification according to the olive cultivar,
geographical origin (within different regions of the same country or different countries),
physicochemical quality (EVOO, VOO or LOO) and/or sensory attributes (level of
positive sensations such as degree of bitterness and fruitiness, or the presence and
intensity of organoleptic defects such as rancid, winey-vinegary, musty and fusty),
providing an additional support for trained sensory panels (Apetrei et al., 2010; Dias et
al., 2014, 2016; Oliveri et al., 2009; Slim et al., 2017, Souayah et al., 2017; Veloso et
al., 2016, 2018). Thus, the E-tongue could also be envisaged as a taste sensor device to
complement the phenolic and volatile profile characterization of olive oil, since the
organoleptic profile is defined by a combined and synergic effect of different olfactory
gustatory–retronasal positive sensations and perceptions, to which phenolic and volatile
chemical species are related. Indeed, voltammetric E-tongues have been successfully
applied to evaluate the bitterness index of EVOO as well as to quantify the total
polyphenolic contents and the concentrations of phenolic compounds and phenols
detected in EVOO, using partial least square (PLS1 and PLS2) models (Apetrei et al.,
2007, 2010; Apetrei & Apetrei, 2013; Rodríguez-Méndez et al., 2008). In contrast, to
our best knowledge, potentiometric E-tongues have been scarcely applied as a
quantitative analytical tool for assessing EVOO’s phenolic contents, although their
capability for monitoring the contents of quality physicochemical data and oxidative
stability during EVOO storage has been previously demonstrated (Rodrigues et al.,
2016). Also, it has been reported the feasibility of applying potentiometric E-tongues,
comprising lipid polymeric membranes, to determine the concentration of standard
solutions that mimic sensory positive attributes usually perceived in olive oils namely,
bitterness, fruitiness and green sensations (Slim et al., 2017;Veloso et al., 2016). On the
other hand, no attempt has been made to evaluate the possibility of using E-tongue
devices (potentiometric or voltammetric) for the indirect assessment of volatile
compounds levels (e.g., alcohols, aldehydes, hydrocarbons, esters and terpenes), which
are related to the olfactory positive sensations usually perceived in olive oils.
Thus, the aim of the present study was to apply the E-tongue for assessing parameters
related to the global organoleptic profile of Arbequina EVOO produced in different
regions of Spain and Brazil, such as levels of phenolic and volatile compounds. The E-
tongue was equipped with lipid polymeric sensor membranes with cross-sensibility
towards chemical species that mimic positive and negative sensory sensations usually

Resultados
233
perceived in olive oils, and its performance against the experimental phenolic and
volatile data determined using chromatographic techniques (i.e., liquid chromatography
coupled to time-of-flight mass spectrometry and gas chromatography-mass
spectrometry with headspace solid-phase microextraction, respectively) was checked.
2. Materials and methods
2.1. Chemicals
All chemicals were analytical reagent grade or higher purity. Bidistilled deionized water
was obtained from a Milli-Q purification system (Millipore, Bedford, MA). ). The
internal standard 4-methyl-2-pentanol was provided by Sigma (Sigma-Aldrich, St.
Louis, MO). For E-tongue analysis the chemicals (plasticizers (bis(1-butylpentyl)
adipate, dibutyl sebacate, 2-nitrophenyl octylether, tris(2-ethylhexyl)phosphate and
dioctyl phenylphosphonate) and additives (octadecylamine, oleyl alcohol,
methyltrioctylammonium chloride and oleic acid) were obtained from Fluka with high
purity ≥97%. A polyvinyl chloride with high molecular was used to support the
polymer.
2.2 Samples
A total of 33 samples of Arbequina EVOO from 11 different geographic zones (n = 3
from each producing region) were studied. Nine regions of olive oil production in Spain
(Granada, Jaén, Málaga, Cádiz, Sevilla, Albacete, Toledo, Valladolid and Lérida,
samples 1 to 9) and two regions in Brazil (Rio Grande do Sul and Minas Gerais,
samples 10 and 11) were selected. The olives were harvested always at the early stage
of harvest; the harvest date was: late October to mid-November of 2014 for Spanish
samples and mid-March to early Abril of 2015 for Brazilian samples. The oil was
extracted within 24h, under a two-phase extraction system. The oils were directly
donated by the producers, adequately packaged for preserving from light and high
temperatures and sent to CSIC laboratories (Granada, Spain) to perform the analysis.
The samples were transported in adequately conditions for Polytechnic Institute of
Bragança to perform the volatile and E-tongue analysis. All the samples were according
to the regulation established by the European Union regulation n° 2568/91 for extra
virgin olive oil, as was showed previously (Borges et al., 2017a). Furthermore, to
confirm the classification as EVOO a sensory analysis was performed by the Official
Resultados
234
Panel of Laboratorio Agroalimentario de Granada (Atarfe, Granada, Spain) according to
European Regulation (2013). The samples showed values for fruit sensation, bitterness
and pungency ranging between 4.4-6.5, 1.8-3.3 and 2.3-3.7, respectively, and none of
the oils presented any sensory defect.
2.3. Phenolic compounds determination
Total phenol content was assessed by the Folin-Ciocalteau method, as reported by
Borges et al. (2017b). The final results were expressed as mg of caffeic acid equivalents
per kg of olive oil (mg CAE/kg). The determination of the individual phenolic fraction
of samples was performed after an extraction with methanol/water (80:20) according to
the International Olive Oil Council (IOOC, 2009). The extracts were analysed by
UPLC-TOF-MS following the method validated by Rivas et al. (2013) and described by
Borges et al. (2017c). Briefly, the UPLC system consisted of a AcQuity UPLC
equipped with a binary pump system (Waters, Milford, MA, USA) using a AcQuity
UPLC BEH C18 column (1.7mm, 2.1 mm x 100 mm inner diameter). The system was
coupled to a Micromass/Waters LCTPremier XE benchtop orthogonal acceleration
time-of-flight (oa-TOF) mass spectrometer equipped with an ESI interface. A
calibration curve using a solution of sodium formate (containing 0.05 of formic acid and
5 mM of sodium hydroxide in isopropanol/H2O 9:1, v/v) was used for quantification
and accurate mass data of molecular ions were processed with MassLynxs (Waters).
2.3.1. Volatile headspace solid-phase microextraction (HS-SPME) and Gas
chromatography-mass spectrometry (GC-MS) conditions
For the headspace solid-phase microextraction (HS-SPME) a fibre of 2 cm coated with
divinylbenzene/carboxen/polydimethylsiloxane (DVB/CAR/PDMS; 50/30 μm) from
Supelco (Bellefonte, USA) was used. This type of fibre has been widely used for
determination of volatiles in olive oils, showing good effectiveness and reproducibility
and high affinity with compounds of low and medium molecular weight (Cavalli et al.,
2003; Vichi et al., 2005, 2007). The olive oil sample was weight (4.6g) placed in 50 ml
vials to avoid any contact of samples with fibre and to provide efficient extraction, all
the conditions for cv. Arbequina olive oils were studied previously. Then, 4-methyl-2-
pentanol was added as internal standard (100 ppm in methanol; 10 μl) and the vials
were sealed with a polypropylene cap with silicon septum. The volatiles were released

Resultados
235
at the selected extraction temperature in a water bath and vigorously stirred with a stir
bar (350 rpm) during the time required to allow the equilibration in the headspace. After
the equilibrium time (5 min), the DVB/CAR/PDMS fibre was exposed during a precise
extraction time for volatiles adsorption and immediately inserted into the injection port
of the GC system for thermal desorption and reconditioning (10 min at 280 °C). All the
samples extractions were carried out in triplicate. The chromatographic analysis was
performed on a Shimadzu GC-2010 Plus equipped with a mass spectrometer Shimadzu
GC/MS-QP2010 SE detector. A TRB-5MS (30 m × 0.25 mm × 0.25 μm) column
(Teknokroma, Spain) was used. The injector was set at 220 °C and the manual
injections were made in splitless mode. The mobile phase consisted in helium (Praxair,
Portugal) at a linear velocity of 30 cm/s and a total flow of 24.4 mL/min. The oven
temperatures were the following: 40 °C/1 min; 2 °C/min until 220 °C; 220 ºC during 30
min. The ionization source was maintained at 250 °C with ionization energy of 70 eV,
and with an ionization current of 0.1 kV. All mass spectra were acquired by electron
ionization. The ionization was left off during the first 2 minutes. The MS spectra
fragments were compared with those obtained from a database (NIST 11), and also with
comparison of GC retention index. Furthermore, retention indices were obtained using
commercial n-alkanes C7-C30 (Sigma-Aldrich, St. Louis, U.S.A.) by direct splitless
liquid injection (1 μL) while all further conditions of GC and MS as settled for the
volatile analysis. The identification was also performed, considering for tentative of
identification at least 95% of match spectra and for identification at least 98% according
with Cecchi & Alfei 2013. The quantification purposes were carried out in relation to
the internal standard method, i.e.; the area of each compound was divided by the area of
the internal standard. All the content is show as ng of internal standard. g -1
of olive oil.
2.2. E-tongue analysis
The samples were extracted using a hydroethanolic solution and electrochemically
analyzed in a random order, as previously described (Dias et al., 2014). In each assay, 5
g of olive oil were mixed to 50 mL of ethanol–water solutions (80:20 v/v) during 5–10
min under strong agitation. This process allowed extracting polar compounds. The
mixture was left at ambient temperature during 60 min, after which, 40 mL of the
supernatant solution was removed and immediately analyzed with the E-tongue. The E-
tongue included two print-screen potentiometric arrays containing 40 sensors (diameter:

Resultados
236
3.6 mm; thickness: 0.3 mm) obtained from the combination of 4 lipid additives
(octadecylamine, oleyl alcohol, methyltrioctylammonium chloride and oleic acid; ≈3%);
5 plasticizers (bis (1-butylpentyl) adipate, dibutyl sebacate, 2-nitrophenyl-octylether,
tris(2-ethylhexyl)phosphate and dioctyl phenylphosphonate; ≈65%) and high molecular
weight polyvinyl chloride (PVC; ≈32%) (Dias et al., 2014). The type of sensors and
polymeric membrane compositions (relative percentage of additive, plasticizer and
PVC) were selected based on previous works considering the satisfactory signal
stability over time (%RSD < 5%, for 5 min signal record) and intra- and inter-day
repeatability (0.5% < %RSD < 15%) and the capability to provide qualitative and
quantitative responses towards basic taste attributes (sweet, acid, bitter, salty and
umami) (Dias et al., 2009; Marx et al., 2017) as well as to positive and negative sensory
sensations usually perceived in olive oil (Slim et al., 2017; Veloso et al., 2018). Each
sensor is identified with a letter S (for sensor) followed by a code for the sensor array
(1: or 2) and the number of the membrane (1 to 20, corresponding to different
combinations of plasticizer and additive used). The electrochemical analysis took 5 min
enabling to record several electrochemical scans, being the last one used assuming that
it corresponded to a pseudo-equilibrium state. Electrochemical assays were performed
in duplicate for each olive oil sample, being a third assay carried out if the coefficients
of variation of the potentiometric signals generated by the E-tongue sensors were
greater than 20% (Rodrigues et al., 2016). To minimize the risk of overoptimistic
results, for data split (training and internal-validation sets) and modeling purposes, only
one electrochemical “average” signal profile per sample was used, avoiding that results
from duplicate assays of the same olive oil sample could be included into both training
and validation sets.
2.3. Statistical analysis
Since the potentiometric E-tongue profiles may led to complex chemical fingerprints of
the olive oils under study, it is required the use of qualitative and/or quantitative
multivariate statistical techniques coupled with variable selection algorithms to avoid
the inclusion of collinear sensor signals in the final multivariate predictive models.
Thus, in this work, multiple linear regression (MLR) models were used to estimate
and/or predict the contents of phenolic and volatile compounds of olive oil (determined
by conventional chromatography techniques), which are known to influence the sensory

Resultados
237
quality of EVOO. The MLR models were only established for assessing the content of a
specific chemical compound if it was chromatographically detected and quantified in
the majority of the olive oil samples evaluated. Furthermore, the most representative
and non-collinear sub-sets of sensor signal profiles among those generated by the 40
lipid sensor membranes comprised in the E-tongue were selected, in each case, by
applying the simulated annealing (SA) meta-heuristic algorithm, which has been
previously successfully applied as a powerful variable selection algorithm, for both
qualitative (Dias et al., 2014, 2016; Slim et al., 2017; Souayah et al., 2017; Veloso et al.,
2016, 2018) and quantitative (Rodrigues et al., 2016) evaluation of olive oil using
potentiometric taste sensor devices. The selection was performed using as a quality
criterion the maximization of the coefficient of determination (R2) and the minimization
of the root-mean-square error (RMSE) for the lowest number of sensors with non-
collinear potentiometric signals responses, established for the leave-one-out (LOO)
cross-validation (CV) procedure (Cadima et al. 2004,2012; Cortez, 2014).
Furthermore, a repeated K-fold-CV procedure was also applied (which is a suitable CV
variant when the dataset does not allow the establishment of a representative external
data sub-set) for comparison purposes with the LOO-CV technique results, and to infer
about possible overfitting issues that could occur for the latter CV variant. So, in this
study 4 folds with 10 repeats were chosen (K=4; repeats=10), resulting into 40
independent internal validation evaluations for each sub-set of sensors previously
established using the SA algorithm. In a run, the data is randomly divided into K folds
(set equal to 4 in this study), being K-1 folds used, at each time, for training purposes
(to establish the best E-tongue-MLR-SA model) and the data of the remaining fold used
for test purposes (internal validation). This process is repeated until all folds were used
for internal validation. The procedure is then randomly repeated (10 times in this work)
leading to the formation of other data folds containing different sets of olive oil
samples. The E-tongue has been scarcely applied for the estimation of polyphenols in
olive oils (Apretei & Apretei, 2013) and, therefore, the possibility of using the selected
E-tongue-MLR-SA models (for both LOO-CV and repeated K-fold-CV procedures) as
complementary tools for the quantification of the phenolic and volatile composition of
Arbequina EVOO from Spain and Brazil, was checked in the present work. The
checking technique involved the establishment of the 95% intervals of confidence (IC)
for the slope and intercept values of the single linear regression (LR) obtained by
plotting the chemical contents predicted by the E-tongue-MLR-SA models versus the

Resultados
238
respective experimental data determined by chromatographic techniques. The proposed
E-tongue based approach could be foreseen as a satisfactory tool, since the 95% IC
contained the theoretic values of “zero” and “one” for the intercept and slope values,
respectively (Roig & Thomas 2003a, b).
All statistical analysis were performed using the Subselect (Cadima et al., 2004, 2012)
and MASS (Venables & Ripley 2002) packages of the open source statistical program R
(version 2.15.1), at a 5% significance level.
3. Results and discussion
3.1. Phenolic profile
As reported and discussed by Borges et al. (2017b, 2017c), the total phenolic content in
the 33 Arbequina EVOO produced in Spain and Brazil ranged between 74 and 335 mg
CAE/kg oil, and it was possible to chromatographically detect and quantify individual
phenolic fractions namely flavonoids (apigenin, 14-453 g/kg; luteolin, 84-1615 g/kg;
and naringenin, 15-143 g/kg), phenolic acids (p-coumaric acid, 0-239 g/kg; and
vanillic acid, 0-133 g/kg) and phenols alcohols (hydroxytyrosol, 3-1620 g/kg).
Figure 1 shows the relative proportion of the three phenolic classes of the Arbequina
EVOO from each of the 11 different geographical production areas (9 from Spain,
number 1 to 9; and 2 from Brazil, number 10 and 11). The results pointed out the quite
different phenolic composition profiles of the Arbequina olive oil according to the
production region, which may contribute to different sensory sensations, requiring their
fast and cost-effective assessment using portable and in-situ measuring devices.

Resultados
239
0
10
20
30
40
50
60
70
80
90
100
1 2 3 4 5 6 7 8 9 10 11
Ph
eno
lic
cla
sses
(%
)
Samples
Flavonoids Phenolic acids Phenol alcohol
Figure 1. Amount (%) of the phenolic classes of Arbequina extra virgin olive oils obtained
from different regions of Spain (samples 1-9) and Brazil (samples 10 and 11).
3.2. Volatile profile
Nineteen volatile compounds were identified in the EVOO samples (Table 1), being
grouped according to six chemical classes: alcohols, aldehydes, hydrocarbons, esters,
terpenes and phenols (Figure 2).
In general, the highest concentrations values were obtained for aldehydes and esters,
mainly from the LOX pathway, with E-2-hexanal (48-380 g/kg) and Z-3-hexenyl
acetate (9-250 g/kg) having higher levels. The high concentrations of these individual
compounds are linked to desirable odour descriptors such as green, green astringent;
bitter, apple-like, banana-like and fruity (Aparicio & Morales, 1998; García-González et
al., 2010; Luna & Aparicio, 2002; Luna, Morales & Aparicio, 2006). Moreover, the
predominance of these individual volatile compounds agrees with previous studies that
showed them as more remarkable in Arbequina olive oils from Spain and Tunisia
(García- González et al., 2010; Reboredo- Rodríguez et al., 2015). Particularly, E-2-
hexanal seems to be one of the main contributors of the aroma in olive oils from
different cultivars due to the low odour threshold of this compound (Luna, Morales &
Aparicio, 2006; Pérez et al, 2016). In the Brazilian olive oil 11, which showed high
vales of E-2-hexanal, the alcohol E-2-hexen-1-ol was also quantified (Table 1). A

Resultados
240
similar behaviour was observed in Arbequina oils from Chile and Italia which showed
mainly E-2-hexanal and others alcohols such as hexanol and ethanol as major volatile of
olive oils (García- González et al., 2010; Procida et al., 2016). The E-2-hexen-1-ol has
been linked to undesirable attributes described as green, grassy and sweet (Aparicio &
Morales,1998), in spite of the fact that E-2-hexen-1-ol is a stable compound that came
from the LOX pathway and depend on the level of the specific enzymes such as
hydroperoxide lyase and alcohol dehydrogenase (Procida et al., 2016).
0
10
20
30
40
50
60
70
80
90
100
1 2 3 4 5 6 7 8 9 10 11
Vo
lati
le c
lass
es (
%)
Samples
Alcohols Aldehydes Hydrocarbon Esters Terpenes Phenols
Figure 2. Amount (%) of the volatile classes of Arbequina extra virgin olive oils obtained
from different regions of Spain (samples 1-9) and Brazil (samples 10 and 11).

Resultados
241
Table 1. Volatile compounds content (µg/kg of olive oil) in Spanish (samples 1-9) and Brazilian (samples 10-11) Arbequina olive oils
(mean±SD).
OO 1 OO 2 OO 3 OO 4 OO 5 OO 6 OO 7 OO 8 OO9 OO 10 OO 11
Alcohols
1-heptanol - - - 0.77 ± 0.77 - - - - - - -
1-octanol - 0.47 ± 0.18 1.38 ± 0.11c 0.66 ± 0.24 0.40 ± 0.04 1.48 ± 0.45 0.76 ± 0.06 - 1.37 ± 0.18 0.54 ± 0.05 0.67 ± 0.04
1-nonanol - 0.28 ± 0.28 0.43 ± 0.08 0.49 ± 0.49b 0.15 ± 0.14 0.57 ± 0.12 0.32 ± 0.02 - 0.97 ± 0.25 - -
E-2-hexen-1-ol - - - - - - - - - - 44.0 ± 0.41
phenylethyl alcohol - 1.99 ± 1.98 3.22 ± 0.21 4.76 ± 2.29 4.65 ± 1.67 3.32 ± 0.06 - 1.76± 0.16 4.46 ± 0.73 - 8.72 ± 0.39
Aldehydes
E-2-hexanal 55.5 ± 10.6 165 ± 30.1 37.1 ± 2.84 149 ± 3.10 222 ± 79.5 163 ± 3.62 288 ± 2.11 48.0 ± 4.40 209 ± 15.5 188 ± 0.70 380 ± 4.65
oxohex-2-enal 37.8 ± 0.84 - - - - - - - - - -
nonanal 1.61± 0.92 2.90 ± 0.70 6.86 ± 0.58 2.63 ± 0.66 3.33 ± 0.52 7.59 ± 2.62 5.48 ± 0.02 1.69 ± 0.21 6.23 ± 0.99 3.26 ± 0.41 6.46 ± 0.32
octanal - - 2.80 ± 0.15 - - - - - - - -
Hydrocarbon 3- ethyl-1,5-
octadiene 24.2 ±3.95 15.5 ± 8.00 8.49 ± 0.10 9.94 ± 4.27 22.8 ± 1.76
10.37 ±
1.31 - - 16.4 ± 4.51 - -
Nonane - - - - - - 3.74 ± 0.09 - - - -
Heptane - - - - - - 21.1 ± 0.35 - - - -
Esters
Z-3 hexenyl acetate 107 ± 9.90 21.3 ± 5.96 95.1 ± 4.28 6.75 ± 6.51 53.2 ± 19.9 48.4 ± 3.78
57.66 ±
0.14 250 ± 10.2 68.8 ± 23.6 - -
hexyl acetate 17.4 ± 1.22 8.82 ± 0.15 21.6 ± 1.06 7.70 ± 0.44 16.0 ±8.53 16.0 ±1.06 - 14.0±0.32 26.5 ± 1.37 8.85 ± 0.34 9.78 ±0.21
E-2 hexenyl acetate - - - - - - - 9.67 ± 0.89 - - -
Methyl ester
benzoate - 0.81 ± 0.7 - - 1.26 ± 1.2 - - - 2.11 ± 0.18 4.32 ± 0.56 -
Terpenes
B-ocimene - 1.20 ± 1.21 0.99 ± 0.07 1.16 ± 0.35 1.62 ± 0.22 2.84 ± 0.32 - - 6.10 ± 1.30 3.07 ± 0.23 24.2 ± 0.81

Resultados
242
copaeno 0.75 ± 0.12 - 1.07 ± 0.15 - - 0.26 ± 0.26 - - - - -
farneseno - 0.53 ± 0.53 0.38 ± 0.11 1.02 ± 0.48 0.78 ± 0.07 1.32 ± 0.19 0.49 ± 0.02 - 1.31 ± 0.56 0.97 ± 0.11 5.29 ± 0.38
Phenols
Guaiacol - - - 3.42 ± 3.40 - - - - - - -

Resultados
243
3.3. Assessment of olive oil phenolic and volatile profiles using a potentiometric E-
tongue-MLR-SA approach
The predictive capability of the established E-tongue-MLR-SA models (based on 8 to
15 sensor signals from the 40 potentiometric profiles recorded during the analysis of the
olive oil hydroethanolic extracts) to quantify the contents of phenolic and volatile
compounds found in Arbequina EVOO was evaluated using LOO-CV and repeated K-
fold-CV procedures. The latter CV variant has been implemented with 4 folds and for
10 repetitions, allowing minimizing the risk of overfitting, which could result in
overoptimistic results due to the use of unrealistic prediction models. The last
procedure, randomly splits the initial dataset into 4 data subsets (4 folds containing each
25 % of the data) being each one used at a time for internal-validation purposes of the
model established with the other 75% of the data. Since, the process is repeated 10
times (value set in this work); the internal-validation process is carried out 40 times
(i.e., 4 folds × 10 repeats). The predictive performances of the selected E-tongue-MLR-
SA models are shown in Table 2, as well as detailed information (number and type of
sensors included in the MLR models) concerning the predictors used for assessing
chemical compound.
Regarding the assessment of the phenolic contents the overall R2 and RMSE values
obtained for LOO-CV (0.967 ≤ R2 ≤ 0.995 and 6.2 ≤ RMSE ≤ 109.0 μg/kg of olive oil)
and repeated K-fold-CV (0.930 ± 0.031 ≤ R2 ≤ 0.983 ± 0.017 and 7.2 ± 2.4 ≤ RMSE ≤
126.0 ± 26.6 μg/kg of olive oil) show the practical possibility of applying the proposed
E-tongue-chemometric approach as a successful tool for the quantification of total
polyphenols content, flavonoids, phenolic acids and phenol alcohols found in Arbequina
EVOO, which are related to the positive olive oil gustatory sensations. Moreover, the
results also show that the potentiometric E-tongue is able to quantify the olive oil
polyphenols or total polyphenolic contents and other phenolic families with similar or
greater accuracy when compared to the performance of voltammetric E-tongues or
combined electrochemical devices, fusing voltammetric E-tongues and E-noses. Indeed,
the complex voltammograms gathered by the E-tongues allowed a satisfactory
quantification of the polyphenols (Apetrei et al., 2007, 2010; Apetrei & Apetrei, 2013;
Rodríguez-Méndez et al., 2008) and, in combination with an E-nose, allow the
estimation of polyphenols, flavonoids, phenolic acids and other phenolic fractions

Resultados
244
(Apetrei et al., 2010), extracted from EVOO (0.773 ≤ R2 ≤ 0.977 and 0.1 ≤ RMSE ≤
111.0 μg/kg of olive oil; for full cross-validation, i.e., LOO-CV).
Finally, the potential of applying the E-tongue-MLR-SA models as a complementary
tool of the conventional chromatographic techniques, for quantifying the phenolic
contents of olive oil, was further investigated (Apetrei & Apetrei, 2013). For that, it was
evaluated if the slope and intercept values of the single linear regression model
established between the contents predicted by the E-tongue-MLR-SA, for LOO-CV or
repeated K-fold-CV, and the total polyphenols content, determined by Folin-Ciocalteau
method, and flavonoids, phenolic acids and phenol alcohols contents determined by
chromatography were statistically equal to one and zero (as expected theoretically for a
perfect linear fit), respectively. The parameters of the single linear regressions including
the determination coefficients (R2), the slope and intercept values and the respective
95% confidence intervals, for LOO-CV and repeated K-fold-CV, are given in Table 3.
The results show that, at 5% significance level, the slope and intercept values were
statistically equal to the expected theoretic values, since the confidence intervals contain
the values one and zero, respectively. These results pointed out that the potentiometric
fingerprints gathered by the E-tongue together with the MLR-SA modelling could
accurately assess the phenolic contents of olive oil, with a similar quantitative
performance as that of the chromatographic conventional technique.
On the other hand, and from the results shown in Table 2, the proposed E-tongue-MLR-
SA approach, based on the potentiometric fingerprints of the olive oil’s hydroethanolic
extracts, showed a less promising potential for the evaluation of the volatile profiles of
Arbequina EVOO (LOO-CV: 0.895 ≤ R2 ≤ 0.993 and 0.2 ≤ RMSE ≤ 33.7 μg/kg of olive
oil; repeated K-fold-CV: 0.818 ± 0.118 ≤ R2 ≤ 0.941 ± 0.075 and 0.2 ± 0.1 ≤ RMSE ≤
34.4 ± 9.7 μg/kg of olive oil). Furthermore, the results presented in Table 3 allow
verifying that, the potentiometric device used is not an alternative to the
chromatographic analysis, since for the majority of the volatile compounds evaluated;
the slope and the intercept values were not statistically equal to the expected theoretic
values. This less satisfactory performance can be partially explained since, contrary to
the assessment of the phenolic compounds, which contents are directly related to the
concentration found in the liquid extracts, the volatile levels are indirectly evaluated
through the analysis of the same liquid extract, which may not be an accurate
representation of the olive oil volatile fractions. Even so, the possibility obtaining a

Resultados
245
preliminary insight of both phenolic and volatile profiles of olive oil with a single
potentiometric assay, still is of practical interest.

Resultados
246
Table 2. Predictive capability of the E-tongue-MLR-SA models established to quantify the concentration of the major volatile and phenolic
compounds detected in the 11 Arbequina olive oils evaluated, 9 from Spain and 2 from Brazil (n=33: 11 olive oils × 3 independent samples).
Chemical compound Concentration
range
(μg/kg of olive oil)a
E-tongue-MLR-SA modelsb
Nº of
sensorsc
Determination coefficient (R2) Root-mean-square errors
(RMSE, μg/kg of olive oil)
LOO-CVd Repeated K-fold-CV
e LOO-CV
d Repeated K-fold-CV
e
Phenolics
Total content [74, 335] (×103) 13
f 0.967 0 954 ± 0 028 17.6 17.7 ± 5.4
Flavonoids Apigenin [14, 453] 14g 0.981 0.962 ± 0.019 25.9 28.6 ± 5.9
Luteolin [84, 1615] 13h 0.969 0.930 ± 0.031 109.0 126.0 ± 26.6
Naringenin [15, 143] 15i 0.982 0.958 ±0.035 6.2 7.2 ± 2.4
Phenolic acids p-Coumaric acid [0, 239] 14j 0.995 0.974 ± 0.05 6.3 8.6 ± 6.6
Vanillic acid [0, 133] 13k 0.992 0.982 ± 0.014 6.8 8.5 ± 3.1
Phenol alcohols Hydroxytyrosol [3, 1620] 12l 0.988 0.983 ± 0.017 70.1 73.9 ± 21.7
Volatile compounds
Alcohols 1-heptanol Only quantified in one olive oil
1-octanol [0, 2] 13z 0.932 0.881 ±0.071 0.192 0.20 ± 0.10
1-nonanol Only quantified in few olive oils
E-2-hexen-1-ol Only quantified in one olive oil
Phenylethyl alcohol [0, 9] 10y 0.903 1.19
Total [0, 54] 13q 0.993 0.860 ± 0.218 1.80 1.9 ± 0.6
Aldehydes E-2-hexanal [45, 386] 13x 0.947 0.909 ± 0.072 33.7 31.7 ± 15.9
Oxohex-2-enal Only quantified in one olive oil
Nonanal [0.6, 10] 13w 0.895 0.818 ± 0.118 1.0 1.1 ± 0.4
Octanal Only quantified in one olive oil
Total [45, 392] 8p 0.943 0.897 ± 0.079 29.4 34.4 ± 9.7
Hydrocarbons 3- ethyl-1,5-octadiene [0, 27] 10v 0.934 0.871 ±0.103 3.4 3.6 ±1.2
Nonane Only quantified in one olive oil
Heptane Only quantified in one olive oil

Resultados
247
Total [0, 27] 10o 0.929 0.865 ± 0.105 3.6 3.7 ± 1.3
Esters Z-3 hexenyl acetate [0, 262] 14u 0.980 0.935 ± 0.068 10.6 15.8 ± 4.3
Hexyl acetate [0, 28] 11r 0.914 0.857 ± 0.110 3.1 3.2 ± 1.5
E-2 hexenyl acetate Only quantified in one olive oil
Methyl ester benzoate Only quantified in four olive oils
Total [7, 286] 12m 0.976 0.941 ±0.05 16.6 17.6 ± 3.4
Terpenes -ocimene [0, 25] 14t 0.993 0.941 ± 0.075 0.8 0.9 ± 0.5
Copaeno Only quantified in three olive oils
Farnesene [0, 6] 10s 0.975 0.862 ± 0.172 0.3 0.3 ± 0.2
Total [0, 31] 12n 0.990 0.905 ± 0.136 1.2 1.4 ± 0.6
Phenols Guaiacol Only quantified in one olive oil aExperimental concentration range levels found in the Arbequina olive oil (Borges et al., 2017) bMultivariate linear regression (MLR) model based on sub-sets of potentiometric sensors, established using the simulated annealing (SA) algorithm, selected among the 40 possible signal profiles obtained with the
electronic tongue (E-tongue) during the analysis of the olive oil hydroethanolic extracts cNumber of signals included in the E-tongue-MLR-SA model, selected from the 40 electrochemical signals recorded by E-tongue during analysis of each olive oil hydroethanolic extract dLOO-CV: leave-one-out cross validation procedure eRepeated K-fold-CV: cross-validation procedure with 4 folds, ensuring that at least 25% of the original data are used for internal validation, and 10 repetitions fE-tongue sensor signals included in the E-tongue-MLR-SA model: S1:1, S1:2, S1:8, S1:9, S1:11, S1:12, S1:13, S1:14, S1:20, S2:2, S2:5, S2:7 and S2:15 gE-tongue sensor signals included in the E-tongue-MLR-SA model: S1:2, S1:4, S1:7, S1:8, S1:11, S1:13, S1:14, S1:20, S2:1, S2:5, S2:9, S2:17, S2:18 and S2:20 hE-tongue sensor signals included in the E-tongue-MLR-SA model: S1:2, S1:3, S1:4, S1:6, S1:12, S2:1, S2:2, S2:8, S2:9, S2:11, S2:14, S2:15 and S2:18 iE-tongue sensor signals included in the E-tongue-MLR-SA model: S1:1, S1:6, S1:7, S1:8, S1:10, S1:11, S1:14, S1:16, S1:17, S1:18, S2:2, S2:8, S2:9, S2:13 and S2:14 jE-tongue sensor signals included in the E-tongue-MLR-SA model: S1:1, S1:4, S1:7, S1:12, S1:16, S1:17, S1:20, S2:2, S2:4, S2:9, S2:10, S2:17, S2:18 and S2:20 kE-tongue sensor signals included in the E-tongue-MLR-SA model: S1:3, S1:7, S1:10, S1:11, S1:15, S1:20, S2:1, S2:2, S2:6, S2:7, S2:14, S2:17 and S2:19 lE-tongue sensor signals included in the E-tongue-MLR-SA model: S1:4, S1:5, S1:9, S1:13, S1:15, S1:19, S1:20, S2:2, S2:3, S2:4, S:7 and S2:17 mE-tongue sensor signals included in the E-tongue-MLR-SA model: S1:1, S1:2, S1:3, S1:6, S1:9, S1:10, S1:11, S1:20, S2:5, S2:13, S2:15 and S2:19 nE-tongue sensor signals included in the E-tongue-MLR-SA model: S1:1, S1:2, S1:6, S1:16, S1:19, S2:2, S2:3, S2:5, S2:10, S2:12, S2:15 and S2:17 oE-tongue sensor signals included in the E-tongue-MLR-SA model: S1:1, S1:3, S1:8, S1:13, S1:15, S1:19, S1:20, S2:2, S2:5 and S2:11 pE-tongue sensor signals included in the E-tongue-MLR-SA model: S1:2, S1:12, S1:19, S1:20, S2:2, S2:6, S2:14 and S2:20 qE-tongue sensor signals included in the E-tongue-MLR-SA model: S1:4, S1:9, S1:10, S1:12, S1:14, S1:15, S1:17, S2:3, S2:5, S2:10, S2:14, S2:16 and S2:19 rE-tongue sensor signals included in the E-tongue-MLR-SA model: S1:2, S1:3, S1:5, S1:7, S1:8, S1:9, S1:20, S2:2, S2:5,S2:6 and S2:12 sE-tongue sensor signals included in the E-tongue-MLR-SA model: S1:6, S1:9, S1:11, S1:17, S2:3, S2:5, S2:10, S2:16, S2:19 and S2:20 tE-tongue sensor signals included in the E-tongue-MLR-SA model: S1:1, S1:2, S1:6, S1:7, S1:10, S1:16, S2:2, S2:3, S2:5, S2:8, S2:10, S2:12, S2:14 and S2:15 uE-tongue sensor signals included in the E-tongue-MLR-SA model: S1:5, S1:9, S1:12, S1:15, S1:17, S2:1, S2:4, S2:8, S2:9, S2:11, S2:13, S2:17, S2:18 and S2:19 vE-tongue sensor signals included in the E-tongue-MLR-SA model: S1:6, S1:9, S1:12, S1:15, S2:2, S2:5, S2:8, S2:10, S2:18 and S2:19 wE-tongue sensor signals included in the E-tongue-MLR-SA model: S1:4, S1:8, S1:13, S1:14, S1:15, S1:16, S2:5, S2:8, S2:9, S2:10, S2:11, S2:17 and S2:19 xE-tongue sensor signals included in the E-tongue-MLR-SA model: S1:1, S1:5, S1:7, S1:8, S1:13, S1:14, S2:1, S2:5, S2:10, S2:15, S2:17, S2:18 and S2:20 yE-tongue sensor signals included in the E-tongue-MLR-SA model: S1:6, S1:8, S1:10, S1:18, S1:19, S1:20, S2:5, S2:8, S2:11 and S2:13 zE-tongue sensor signals included in the E-tongue-MLR-SA model: S1:1, S1:2, S1:3, S1:5, S1:6, S1:8, S1:12, S1:18, S1:20, S2:4, S2:7, S2:15 and S2:19

Resultados
248
Table 3. Parameters of the single linear regression established between the values of concentration levels predicted by E-tongue-MLR-AS
models (LOO-CV and repeated K-fold-CV) and the respective experimental concentration values quantified by the conventional
chromatographic techniques samples: coefficient of determination (R2); slopes, intercept values and respective confidence intervals (CI) at 95%.
Chemical compound LOO-CVa Repeated K-fold-CV
b
R2 Slope Slope CI
a Intercept Intercept CI
b R
2 Slope Slope CI
a Intercept Intercept CI
b
Phenolics
Total content 0.967 0.980 [0.885, 1.076] 3.26 [-15.57, 22.08] 0.926 0.978 [0.948, 1.008] 3.88 [-2.07, 9.84]
Flavonoids Apigenin 0.981 0.951 [0.881, 1.020] 4.51 [-13.90, 22.92] 0.951 0.953 [0.929, 0.977] 4.30 [-1.93, 10.53]
Luteolin 0.969 0.962 [0.872, 1.052] 13.50 [-72.04, 99.04] 0.914 0.962 [0.930, 0.994] 12.44 [-18.04, 42.93]
Naringenin 0.982 0.942 [0.876, 1.008] 1.00 [-2.79, 4.79] 0.946 0.949 [0.924, 0.973] 0.66 [-0.74, 2.07]
Phenolic acids p-Coumaric acid 0.995 0.979 [0.942, 1.016] 0.17 [-3.21, 3.55] 0.967 0.971 [0.951, 0.990] 0.41 [-1.37, 2.20]
Vanillic acid 0.992 0.970 [0.924, 1.016] 0.08 [-3.14, 3.31] 0.971 0.958 [0.940, 0.976] 0.09 [-1.17, 1.35]
Phenol alcohols Hydroxytyrosol 0.988 0.960 [0.906, 1.014] 5.72 [-26.00, 37.43] 0.971 0.962 [0.944, 0.981] 5.39 [-5.25, 16.03]
Volatile compounds
Alcohols 1-octanol 0.932 0.892 [0.765, 1.020] 0.073 [-0.038, 0.184] 0.841 0.905 [0.862, 0.947] 0.057 [0.020, 0.094
phenylethyl alcohol 0.903 0.867 [0.716, 1.019] 0.47 [-0.14, 1.07] 0.752 0.870 [0.816, 0.924] 0.31 [0.094, 0.529]
Total 0.993 0.977 [0.934, 1.020] 0.30 [-0.42, 1.02] 0.982 0.991 [0.976, 1.010] 0.241 [-0.002, 0.484]
Aldehydes E-2-hexanal 0.947 0.956 [0.838, 1.075] 9.17 [-14.65, 32,98] 0.887 0.969 [0.931, 1.006] 6.78 [-0.74, 14.31]
nonanal 0.895 0.861 [0.704, 1.018] 0.61 [-0.16, 0.70] 0.734 0.878 [0.820, 0.935] 0.6 [0.27, 0.83]
Total 0.943 0.909 [0.791, 1.027] 16.09 [-8.24, 40.42] 0.871 0.905 [0.867, 0.943] 17.0 [9.17, 24.77]
Hydrocarbons 3- ethyl-1,5-octadiene 0.934 0.912 [0.784, 1.040] 0.80 [-0.91, 2.51] 0.840 0.924 [0.880, 0.968] 0.6 [-0.04, 1.14]]
Total 0.929 0.902 [0.770, 1.034] 0.898 [-1.13, 2.92] 0.836 0.907 [0.863, 0.951] 0.61 [-0.06, 1.28]
Esters Z-3 hexenyl acetate 0.980 0.995 [0.920, 1.070] 2.542 [-4.50, 9.58] 0.946 0.989 [0.964, 1.015] 2.77 [0.36, 5.18]
hexyl acetate 0.914 0.903 [0.756, 1.051] 1.563 [-0.68, 3.81] 0.792 0.919 [0.868, 0.970] 1.56 [0.78, 2.34]
Total 0.976 0.994 [0.912, 1.076] 2.08 [-6.79, 10.96] 0.945 1.001 [0.980, 1.032] 1.26 [-1.58, 4.11]
Terpenes -ocimene 0.993 0.968 [0.924, 1.011] 0.165 [-0.17, 0.50] 0.974 0.970 [0.953, 0.987] 0.12 [-0.01, 0.25]
farnesene 0.975 0.934 [0.856, 1.012] 0.08 [-0.06, 0.22] 0.934 0.927 [0.901, 0.954] 0.07 [0.03, 0.12]
Total 0.990 0.959 [0.910, 1.008] 0.23 [-0.24, 0.69] 0.965 0.951 [0.931, 0.971] 0.18 [-0.01, 0.37] aLOO-CV (leave-one-out cross-validation);
bRepeated K-fold-CV (4 folds × 10 repeats);
c95% slope confidence interval;
d95% intercept confidence interval

Resultados
249
Conclusions
The study allowed verifying the successful combination of a potentiometric electronic
tongue with multiple linear regression models for assessing the contents of phenolic and
volatile compounds found in olive oil, which are responsible for positive gustatory and
olfactory sensations. The work showed that the potentiometric fingerprints of olive oil
hydroethanolic extracts could be satisfactorily used to quantify the phenolic levels (total
polyphenols content, flavonoids, phenolic acids and phenol alcohol) found in Arbequina
olive oil, produced in different countries (Spain and Brazil). Moreover, the accuracy of
the lab-made potentiometric device was similar to that achieved with ultra-performance
liquid chromatography coupled to time-of-flight mass spectrometry as well as to those
previously reported for voltammetric electronic tongues. Furthermore, it was also
verified the possibility of using this potentiometric device, as an indirect tool, to assess
the levels of olive oil volatile compounds, based on the signals profiles recorded during
the analysis of the olive oil liquid extracts. Although, the accuracy achieved was lower
compared to the gas chromatography-mass spectrometry with headspace solid-phase
microextraction, the information gathered by the electronic tongue enabled extracting
preliminary insights regarding the volatile composition of the Arbequina olive oil. Thus,
considering the low-cost, the analysis time and the simplicity of the electrochemical-
chemometric procedure, together with the versatility of evaluating in a single assay the
levels of both phenolic and volatile compounds, the proposed approach can be
envisaged as a helpful analytical tool for olive oil analysis.
Conflicts
The authors declare no competing financial interest.

Resultados
250
Acknowledgments
We are grateful to the CAPES Foundation, (Ministry of Education, Brazil), for
scholarship support provided to the first author (grant number 6073/13-1). This work is
part of the doctoral thesis of Thays Helena Borges, Ph.D. student from the Official
Doctoral Program ‘‘Nutrition and Food Sciences” of the Granada University. The
authors also would like to thank Consejo Regulador de Denominación de Origen (DOP)
Estepa and DOP Les Garrigues; Casas Hualdo, Castillo Canena, Cortijo de Jara,
Quaryat Dilar, EPAMIG and Olivas do Sul for the donation of samples. We would like
to dedicate to the memory of Carmen Cabrera-Vique. This work was also financially
supported by Project POCI-01–0145-FEDER-006984–Associate Laboratory LSRE-
LCM, Project UID/QUI/00616/2013–CQ-VR, and UID/AGR/00690/2013–CIMO all
funded by FEDER - Fundo Europeu de Desenvolvimento Regional through
COMPETE2020-Programa Operacional Competitividade e Internacionalização (POCI)
– and by national funds through FCT - Fundação para a Ciencia e a Tecnologia,
Portugal.

Resultados
251
References
Aparicio, R., & Morales, M. T. (1998). Characterization of olive ripeness by green
aroma compounds of virgin olive oil. Journal of Agricultural and Food Chemistry,
46(3), 1116-1122.
Apetrei, C., Apetrei, I. M., Villanueva, S., De Saja, J. A., Gutierrez-Rosales, F., &
Rodriguez-Mendez, M. L. (2010). Combination of an e-nose, an e-tongue and an e-eye
for the characterisation of olive oils with different degree of bitterness. Analytica
Chimica Acta, 663(1), 91-97.
Apetrei, C., Gutierez, F., Rodriguez-Mendez, M. L., & De Saja, J. A. (2007). Novel
method based on carbon paste electrodes for the evaluation of bitterness in extra virgin
olive oils. Sensors and Actuators B: Chemical, 121(2), 567-575.
Apetrei, I. M., & Apetrei, C. (2013). Voltammetric e-tongue for the quantification of
total polyphenol content in olive oils. Food research international, 54(2), 2075-2082.
Barbieri, S., Bendini, A., Valli, E., & Toschi, T. G. (2015). Do consumers recognize
the positive sensorial attributes of extra virgin olive oils related with their composition?
A case study on conventional and organic products. Journal of Food Composition and
Analysis, 44, 186-195.
Borges, T. H., López, L. C., Pereira, J. A., Cabrera–Vique, C., & Seiquer, I. (2017c).
Comparative analysis of minor bioactive constituents (CoQ10, tocopherols and phenolic
compounds) in Arbequina extra virgin olive oils from Brazil and Spain. Journal of Food
Composition and Analysis, 63, 47-54.
Borges, T. H., Pereira, J. A., Cabrera–Vique, C., & Seiquer, I. (2017b). Study of the
antioxidant potential of Arbequina extra virgin olive oils from Brazil and Spain
applying combined models of simulated digestion and cell culture markers. Journal of
Functional Foods, 37, 209-218.
Borges, T. H., Pereira, J. A., Cabrera-Vique, C., Lara, L., Oliveira, A. F., & Seiquer,
I. (2017a). Characterization of Arbequina virgin olive oils produced in different regions
of Brazil and Spain: Physicochemical properties, oxidative stability and fatty acid
profile. Food Chemistry, 215, 454-462.
Resultados
252
Cadima, J., Cerdeira, J. O., & Minhoto, M. (2004). Computational aspects of
algorithms for variable selection in the context of principal components. Computational
statistics & data analysis, 47(2), 225-236.
Cadima, J., Cerdeira, J.O, Silva, P.D, & Minhoto M (2012) The subselect R package.
http://cran.rproject.org/web/packages/subselect/vignettes/subselect.pdf Accessed 15 Feb
2016
Cavalli, J. F., Fernandez, X., Lizzani-Cuvelier, L., & Loiseau, A. M. (2003).
Comparison of static headspace, headspace solid phase microextraction, headspace
sorptive extraction, and direct thermal desorption techniques on chemical composition
of French olive oils. Journal of agricultural and food chemistry, 51(26), 7709-7716.
Cecchi, T., & Alfei, B. (2013). Volatile profiles of Italian monovarietal extra virgin
olive oils via HS-SPME–GC–MS: Newly identified compounds, flavors molecular
markers, and terpenic profile. Food Chemistry, 141(3), 2025-2035.
Cortez, P. (2014). Modern Optimization with R, New York: Springer-Cham.
Di Rosa, A. R., Leone, F., Cheli, F., & Chiofalo, V. (2017). Fusion of electronic
nose, electronic tongue and computer vision for animal source food authentication and
quality assessment–A review. Journal of Food Engineering, 210, 62-75.
Dias, L. A., Peres, A. M., Veloso, A. C., Reis, F. S., Vilas-Boas, M., & Machado, A.
A. (2009). An electronic tongue taste evaluation: Identification of goat milk adulteration
with bovine milk. Sensors and Actuators B: Chemical, 136(1), 209-217.
Dias, L. G., Fernandes, A., Veloso, A. C., Machado, A. A., Pereira, J. A., & Peres, A.
M. (2014). Single-cultivar extra virgin olive oil classification using a potentiometric
electronic tongue. Food Chemistry, 160, 321-329.
Dias, L. G., Rodrigues, N., Veloso, A. C., Pereira, J. A., & Peres, A. M. (2016).
Monovarietal extra-virgin olive oil classification: a fusion of human sensory attributes
and an electronic tongue. European Food Research and Technology, 242(2), 259-270.
European Communities (EC) (2013) Official Journal of the Commission of the
European Communities. Regulation n° 1348/13, L338/31, 17 Dec 2013.

Resultados
253
Fortini, M., Migliorini, M., Cherubini, C., Cecchi, L., & Calamai, L. (2017). Multiple
internal standard normalization for improving HS-SPME-GC-MS quantitation in virgin
olive oil volatile organic compounds (VOO-VOCs) profile. Talanta, 165, 641-652.
García-González, D. L., Romero, N., Aparicio, R. (2010). Comparative study of
virgin olive oil quality from single varieties cultivated in Chile and Spain. Journal of
agricultural and food chemistry, 58(24), 12899-12905.
Kalua, C. M., Allen, M. S., Bedgood, D. R., Bishop, A. G., Prenzler, P. D., &
Robards, K. (2007). Olive oil volatile compounds, flavour development and quality: A
critical review. Food Chemistry, 100(1), 273-286.
Lopez, S., Bermudez, B., Montserrat-de la Paz, S., Jaramillo, S., Varela, L. M.,
Ortega-Gomez, A.,. Muriana, F. J. (2014). Membrane composition and dynamics: a
target of bioactive virgin olive oil constituents. Biochimica et Biophysica Acta (BBA)-
Biomembranes, 1838(6), 1638-1656.
Luna, G., & Aparicio, R. (2002). Characterisation of monovarietal virgin olive oils.
Eur. J. Lipid Sci. Technol, 104, 614-627.
Luna, G., Morales, M. T., & Aparicio, R. (2006). Characterisation of 39 varietal
virgin olive oils by their volatile compositions. Food Chemistry, 98(2), 243-252.
Marx, Í. M., Rodrigues, N., Dias, L. G., Veloso, A. C., Pereira, J. A., Drunkler, D.
A., & Peres, A. M. (2017). Quantification of table olives' acid, bitter and salty tastes
using potentiometric electronic tongue fingerprints. LWT-Food Science and
Technology, 79, 394-401.
Oliveri, P., Baldo, M. A., Daniele, S., & Forina, M. (2009). Development of a
voltammetric electronic tongue for discrimination of edible oils. Analytical and
Bioanalytical Chemistry, 395(4), 1135-1143.
Pérez, A. G., de la Rosa, R., Pascual, M., Sánchez-Ortiz, A., Romero-Segura, C.,
León, L., & Sanz, C. (2016). Assessment of volatile compound profiles and the deduced
sensory significance of virgin olive oils from the progeny of Picual× Arbequina
cultivars. Journal of Chromatography A, 1428, 305-315.
Procida, G., Cichelli, A., Lagazio, C., & Conte, L. S. (2016). Relationships between
volatile compounds and sensory characteristics in virgin olive oil by analytical and

Resultados
254
chemometric approaches. Journal of the Science of Food and Agriculture, 96(1), 311-
318.
Reboredo-Rodríguez, P., González-Barreiro, C., Cancho-Grande, B., Fregapane, G.,
Salvador, M. D., & Simal-Gándara, J. (2015). Characterisation of extra virgin olive oils
from Galician autochthonous varieties and their co-crushings with Arbequina and Picual
cv. Food Chemistry, 176, 493-503.
Rivas, A., Sanchez‐Ortiz, A., Jimenez, B., García‐Moyano, J., & Lorenzo, M. L.
(2013). Phenolic acid content and sensory properties of two Spanish monovarietal
virgin olive oils. European Journal of Lipid Science and Technology, 115(6), 621-630.
Rodrigues, N., Dias, L. G., Veloso, A. C., Pereira, J. A., & Peres, A. M. (2016).
Monitoring olive oils quality and oxidative resistance during storage using an electronic
tongue. LWT-Food Science and Technology, 73, 683-692.
Rodríguez-Méndez, M. L., Apetrei, C., & De Saja, J. A. (2008). Evaluation of the
polyphenolic content of extra virgin olive oils using an array of voltammetric sensors.
Electrochimica Acta, 53(20), 5867-5872.
Roig, B., & Thomas, O. (2003). Rapid estimation of global sugars by UV
photodegradation and UV spectrophotometry. Analytica Chimica Acta, 477(2), 325-
329.
Roig, B., & Thomas, O. (2003). UV monitoring of sugars during wine making.
Carbohydrate research, 338(1), 79-83.
Servili, M., Sordini, B., Esposto, S., Urbani, S., Veneziani, G., Di Maio, I., ... &
Taticchi, A. (2014). Biological activities of phenolic compounds of extra virgin olive
oil. Antioxidants, 3(1), 1-23.
Slim, S., Rodrigues, N., Dias, L. G., Veloso, A. C., Pereira, J. A., Oueslati, S., &
Peres, A. M. (2017). Application of an electronic tongue for Tunisian olive oils’
classification according to olive cultivar or physicochemical parameters. European
Food Research and Technology, 1-12.
Souayah, F., Rodrigues, N., Veloso, A. C., Dias, L. G., Pereira, J. A., Oueslati, S., &
Peres, A. M. (2017). Discrimination of Olive Oil by Cultivar, Geographical Origin and
Quality Using Potentiometric Electronic Tongue Fingerprints. Journal of the American
Oil Chemists' Society, 1-13.

Resultados
255
Veloso, A. C., Dias, L. G., Rodrigues, N., Pereira, J. A., & Peres, A. M. (2016).
Sensory intensity assessment of olive oils using an electronic tongue. Talanta, 146, 585-
593.
Veloso, A. C., Silva, L. M., Rodrigues, N., Rebello, L. P., Dias, L. G., Pereira, J. A.,
& Peres, A. M. (2018). Perception of olive oils sensory defects using a potentiometric
taste device. Talanta, 176, 610-618.
Vichi, S., Guadayol, J. M., Caixach, J., López-Tamames, E., & Buxaderas, S. (2007).
Comparative study of different extraction techniques for the analysis of virgin olive oil
aroma. Food Chemistry, 105(3), 1171-1178.
Vichi, S., Pizzale, L., Conte, L. S., Buxaderas, S., & López-Tamames, E. (2005).
Simultaneous determination of volatile and semi-volatile aromatic hydrocarbons in
virgin olive oil by headspace solid-phase microextraction coupled to gas
chromatography/mass spectrometry. Journal of Chromatography A, 1090(1), 146-15

Resultados
256

257
CAPÍTULO 5: Discusión general

258

Discussión general
259
CAPÍTULO 5: Discusión general
Durante los últimos años, Brasil ha experimentado un aumento creciente en el consumo
de aceite de oliva virgen, promovido por el interés del consumidor hacia un producto
saludable y con unas excelentes características organolépticas. Si bien hoy día la mayor
parte del AOV consumido en Brasil es importado, el incremento del consumo ha
estimulado una producción propia, actualmente incipiente pero que empieza a
desarrollarse a gran velocidad. Hay que tener en cuenta, por otra parte, que las
especiales condiciones climáticas y geográficas de Brasil, un país de considerable
extensión y clima diverso, podrían influir en las características de los aceites
producidos, hecho que ya se ha observado en estudios anteriores con la expansión del
cultivo del olivo en otros países (Torres y col., 2009; Rondanini y col., 2011). Todas
estas circunstancias hacen necesario un estudio completo del AOV brasileño, con objeto
de ofrecer al consumidor un producto de características conocidas, que además, sea
competitivo en el mercado oleícola internacional. Las exigencias del sector hacen que
actualmente, además de establecer los parámetros de calidad reglamentados para los
aceites de oliva, sean convenientes estudios más amplios que analicen los componentes
minoritarios o las propiedades antioxidantes, que van a repercutir en los efectos
saludables del aceite y a su vez van a suponer un estímulo más para su consumo. Bajo
estas premisas surgió el presente trabajo, que ha pretendido llenar en parte un vacío
existente en la literatura científica.
Los aceites brasileños analizados en esta memoria, corresponden a dos zonas de
producción, Río Grande do Sul y Minas Gerais, situadas respectivamente al sur y al
suroeste del país, sometidas a condiciones climáticas y situaciones geográficas distintas.
Los aceites españoles proceden de 9 de las regiones productoras del país y están
distribuidas prácticamente por toda la geografía española. Aunque España sea un país
relativamente pequeño, se dan en él diferentes climatologías y topografías. Por otra
parte, ambos países están enormemente distanciados y localizados en diferentes
hemisferios. Con este escenario, la presente memoria de tesis doctoral pretendió
realizar un estudio comparativo amplio de los parámetros de calidad, composición y
características organolépticas de aceites de la variedad Arbequina producidos en Brasil
y procedentes de diferentes regiones españolas. Se intentaron unificar otros factores
esenciales en la calidad y composición de los aceites, tales como la variedad

Discussión general
260
(Arbequina) etapa de recogida de la aceituna (fase temprana de recolección) y sistema
de extracción del aceite (extracción en dos fases).
Todos los aceites analizados en el presente estudio, tanto españoles como brasileños,
cumplieron los requisitos establecidos por la legislación europea (CEE/2568/91) para su
clasificación como AOVE (artículo 1, Tabla 2) en cuanto a acidez (no superior a 0.8%
expresado en ácido oleico), índice de peróxidos (inferior a 20 mEq O2/kg), coeficientes
de extinción específica y perfil de ácidos grasos (el contenido en oleico varió entre 63 y
80%). Además, el panel oficial de cata confirmó la misma categoría para todas las
muestras, según la evaluación sensorial (mediana de defectos igual a 0 y mediana de
frutado superior a 0) (artículo 5). Por tanto, de acuerdo con nuestros resultados, el
origen geográfico de las muestras no perjudicó la calidad global de los aceites, como ya
había sido sugerido por otros autores (Dabbou y col., 2009), ya que todos fueron
clasificados como virgen extra. Ahora bien, aunque dentro de los límites establecidos,
se observaron diferencias significativas entre los distintos aceites en los parámetros
mencionados de grado de acidez, índice de peróxidos y coeficientes de extinción K232 y
K270. Además, se mostró que dichas diferencias tenían relación con las condiciones geo-
climáticas de las áreas de producción, ya que se encontraron correlaciones significativas
positivas de las variables mencionadas con el nivel de precipitaciones y la temperatura
media anual, y negativas con la altitud.
La composición en ácidos grasos de los aceites, de gran impacto en la calidad de los
mismos y en sus propiedades saludables (Rueda y col., 2014), presentó ciertas
diferencias significativas entre las muestras de las distintas zonas geográficas. Ahora
bien, cuando las diferencias eran estudiadas agrupando los aceites según el país de
procedencia, el perfil de los ácidos grasos mayoritarios no se vio afectado (artículo 1,
Tabla 4). Es de destacar que se confirmó la relación entre la composición en AG de las
muestras y su estabilidad oxidativa (Reboredo-Rodríguez y col., 2014; Reboredo-
Rodríguez y col., 2015), ya que se observó que los aceites con mayor contenido en
AGMI y menores valores de AGPI y AGS eran más resistentes a la oxidación, medida
por el método Rancimat.
Además, se detectó que la altitud y la temperatura de las zonas productoras podrían
afectar al perfil lipídico de las muestras, lo cual puede estar asociado a que la
temperatura es capaz de regular la actividad de las enzimas desaturasas y por tanto juega

Discussión general
261
un papel esencial en el perfil lipídico de los aceites (Torres y col., 2009; Hernández y
col., 2011; Rondanini y col., 2011).
El color de los aceites, aunque no se incluye entre los parámetros de calidad, juega un
papel importante en las preferencias y la elección por parte del consumidor (Moyano y
col., 2010) y es el resultado de dos pigmentos principales: clorofilas y carotenoides, que
a su vez están relacionados con la estabilidad oxidativa del aceite (Criado y col., 2008).
El presente trabajo puso de manifiesto que el color de los AOVE brasileños y españoles
(medido por las coordenadas CIELAB) era significativamente distinto, ya que las
muestras procedentes de Brasil tuvieron menos luminosidad (L*) y tonalidades más
alejadas del verde (valores a* superiores) y del amarillo (valores de b* inferiores) que
los aceites españoles. Precisamente el nivel de precipitaciones, mucho más elevado en
las zonas de Brasil, resultó estar estrechamente asociado a las tres coordenadas de color.
Es conocido que el consumidor asocia el tono verdoso y amarillo-dorado con los aceites
de calidad, y el color amarillo más claro con los aceites refinados y de menor calidad
(Gandul-Rojas y col., 2013). Por tanto, la cantidad de lluvia es una circunstancia
importante a tener en cuenta en la expansión del cultivo del olivo.
El análisis multivariante de las variables analizadas hasta ese momento, mostró que los
aceites podían ser clasificados en base a dos componentes principales: el primero,
claramente definido por la composición en AG, principalmente la proporción de ácido
oleico y la relación AGMI/AGPI, y el segundo, por los parámetros de color. En base a
ambos componentes, se obtuvo una representación gráfica en la que los aceites
brasileños estaban separados de los españoles, pero también se observó una separación
evidente entre los aceites españoles. Es decir, las diferencias en los parámetros
estudiados, asociadas en muchos casos a factores climáticos y geográficos, permitieron
la clasificación de las muestras según la zona de producción, independientemente del
país de origen.
Además de la fracción mayoritaria saponificable, existe en el aceite de oliva una
fracción insaponificable formada por componentes minoritarios que, aunque solo
supone aproximadamente un 2%, contiene multitud de compuestos, muchos de ellos
esenciales para la calidad y las propiedades de los aceites (Lopez et al., 2014). Por su
especial importancia, han sido investigados en este trabajo los compuestos fenólicos, los
tocoferoles y la CoQ10.

Discussión general
262
Los aceites analizados mostraron cantidades de CoQ10 entre 48 y 85 mg/L, cifras que
permiten que sean clasificados como “alimentos ricos en CoQ10” (Pravst y col., 2010).
La importancia de este hecho radica en que la CoQ10 es un compuesto esencial para la
cadena respiratoria mitocondrial y al que se le han atribuido muchas propiedades
saludables (Pravst y col., 2010; Jankowski y col., 2016), pero cuya síntesis endógena
disminuye progresivamente con la edad, hecho que ha de ser compensado con la ingesta
en la dieta (Zmitek y col., 2014). Por tanto, los aceites Arbequina evaluados pueden ser
propuestos como buenas fuentes alimentarias para mantener los niveles de CoQ10 en el
organismo.
El contenido en tocoferoles mostró cifras similares a las observadas en estudios previos
con aceites Arbequina españoles y de otros países, como Argentina, Túnez y Turquía
(Beltrán y col., 2010; Dabbou y col., 2010; López-Cortés y col., 2013; Torres y col.,
2009; Uluata y col., 2016; Yousfi y col., 2012), entre 92 – 208 mg/kg para la fracción α-
tocoferol; y, al igual que en el caso del CoQ10, los aceites brasileños tuvieron valores
intermedios entre los de aceites españoles. Según nuestros datos, el aceite que presentó
los valores inferiores de α-tocoferol tuvo también una estabilidad oxidativa menor
(artículo 1, artículo 2, muestra 4 - Cádiz), lo cual confirmó que el α-tocoferol, fracción
mayoritaria de los tocoferoles en los AOV, no solo proporciona un enorme valor
nutricional al aceite, sino que contribuye a la estabilidad del mismo, protegiéndolo de la
oxidación.
Los compuestos fenólicos del AOV han recibido en las últimas décadas una gran
atención ya que, además de estar estrechamente relacionados con las características
sensoriales, se consideran responsables de muchas propiedades beneficiosas sobre la
salud, hasta el punto de que su efecto protector sobre el estrés oxidativo ha sido
reconocido oficialmente por la Agencia Europea de seguridad Alimentaria (EFSA,
2011). El análisis de compuestos fenólicos sigue siendo hoy día un desafío entre los
investigadores, ya que no existe un método estandarizado de forma oficial, y las
diversas metodologías empleadas para separar, identificar y cuantificar estos
componentes suelen mostrar datos variables que hacen difíciles las comparaciones
(Ballus y col., 2015). En el presente estudio se identificaron tres grupos principales de
compuestos fenólicos: flavonoides (apigenina, luteolina), ácidos fenólicos (naringenina,
ácido p-cumárico, ácido vanílico) y alcoholes fenólicos (hidroxitirosol). En nuestras
condiciones experimentales se identificó un flavonoide, la naringenina, no detectado

Discussión general
263
hasta la fecha en aceites de Arbequina al que se le han atribuido efectos beneficiosos en
el tratamiento de la osteoporosis, cáncer y enfermedad cardiovascular (Patel y col.,
2014). Por otra parte, se encontraron valores muy variables de hidroxitirosol (3-1050
µg/kg), uno de los polifenoles más importantes de los AOVE por su reconocida
capacidad antioxidante (Servili et al., 2014) y su capacidad para actuar como
estimulante de otros antioxidantes endógenos, como la vitamina C (Lopez-Huertas y
Fonollá, 2017). Especialmente llamativa fue la diferencia del contenido en
hidroxitirosol entre los aceites brasileños, ya que los valores en las muestras de Rio
Grande do Sul superaron en más de 10 veces los del aceite procedente de Minas Gerais
(artículo 2).
Hay que destacar que los flavonoides fueron el principal grupo detectado en los aceites
estudiados (93-36% del total), seguido de los ácidos fenólicos (10-30% del total), con
excepción de la muestra 3 (aceite de Málaga), en la que el alcohol fenólico
hidroxitirosol contribuyó con 83% del total de compuestos fenólicos.
Las diferencias encontradas en los componentes minoritarios entre los distintos aceites
analizados, nos animaron a estudiar la posible influencia de las condiciones geo-
climáticas de las zonas de producción en dicha fracción, que ya había sido propuesta por
algunos autores (Dabbou y col., 2009; Bakhouche y col., 2013; Ilyasoglu y col., 2016).
Se observó, por una parte, una relación positiva de la altitud con los parámetros
estudiados: CoQ10, tocoferoles y algunos de los compuestos fenólicos, especialmente el
hidroxitirosol. Por otra parte, la cantidad de precipitaciones pareció tener un efecto
negativo en la mayoría de los componentes minoritarios estudiados, mientras que la
relación con la temperatura media de las zonas fue en general positiva. Estos hallazgos
confirmaron que la fracción no saponificable, además de depender en gran medida de la
variedad de la aceituna, se ve afectada por otros factores, entre los que están las
condiciones climáticas y la altitud de las áreas de cultivo. Este hecho puede ser debido a
que el clima tiene un efecto primordial en las reacciones enzimáticas que se desarrollan
durante el crecimiento y la maduración del fruto, particularmente en las que son
esenciales para la síntesis de componentes minoritarios como los tocoferoles o
polifenoles (Ilyasoglu y col., 2016). Se ha sugerido que el incremento de estos
compuestos podría ser un mecanismo de defensa de las plantas ante condiciones de
estrés (Beltrán y col., 2010; Ilyasoglu y col., 2016). De todas formas, las relaciones
entre los distintos factores geo-climáticos son complejas y el efecto de uno de ellos

Discussión general
264
puede verse compensado por otro; tal es el caso de la altitud, cuya influencia puede no
ser definitiva si se ve contrarrestada con el efecto de otros factores..
Con el objeto de promover una aproximación entre los aceites con características
similares, de nuevo se aplicaron análisis quimiométricos (artículo2, figura 2). El
dendrograma fue capaz de definir tres grupos y se observó que la muestra brasileña 10
(Río Grande do Sul) mostró según los parámetros evaluados la mayor distancia
euclidiana con los otros grupos, es decir, menores similitudes. Igualmente, el análisis
factorial permitió explicar el 76% de la variación obtenida en el estudio y además,
confirmo la separación la muestra 10 y el impacto del contenido de hidroxitirosol en la
clasificación de las muestras en el presente estudio.
Como se ha comentado en esta memoria, las propiedades antioxidantes son uno de los
aspectos más valorados en los alimentos, ya que existen hoy día multitud de patologías
relacionadas con un aumento de radicales libres, situaciones en las que los antioxidantes
de la dieta cobran especial importancia, particularmente desde un punto de vista
preventivo. Entre los alimentos con un mayor potencial antioxidante está el AOVE,
reconocido desde hace años por sus propiedades beneficiosas sobre la salud. Por estos
motivos, nos propusimos en esta memoria el estudio del potencial antioxidante de los
aceites de oliva de las diferentes zonas estudiadas, aportando por la primera vez datos
sobre las propiedades antioxidantes de los aceites producidos en Brasil (artículo 3).
Las propiedades antioxidantes de los aceites se estudiaron en paralelo con el contenido
de polifenoles totales, por su estrecha relación con la actividad antioxidante. Para la
evaluación de dichos aspectos del AOV Arbequina de diferentes zonas de Brasil y
España se aplicaron diferentes métodos.
En primer lugar, se estudió la actividad antioxidante y el contenido en fenoles en los
extractos químicos obtenidos mediante disolventes orgánicos de los aceites. Pero
además, ya que la primera condición de un componente de la dieta para ejercer un
efecto biológico in vivo es el mantenimiento de sus propiedades durante el proceso de
digestión (Pastoriza y col., 2011), se analizaron dichas propiedades tras someter a las
muestras a un proceso de digestión in vitro en dos fases, gástrica e intestinal. Tras este
proceso, se obtienen dos fracciones, una soluble o bioaccesible, que contiene los
componentes disponibles para ser absorbidos por las células intestinales, y otra no
soluble o residual. Ambas fracciones fueron analizadas y la fracción bioaccesible se

Discussión general
265
utilizó, además, para posteriores ensayos de absorción a través de células Caco-2 y para
el estudio de marcadores antioxidantes a nivel celular (Figura 1, artículo 3).
El contenido de polifenoles totales en los extractos varió en un rango de 75 – 302 mg de
equivalentes de ácido cafeico/ kg de aceite, cifra similar a estudios anteriores en aceites
de oliva (Borges y col., 2015; Uluata y col., 2016). Con respecto a la actividad
antioxidante determinada en los extractos químicos, se encontraron diferencias
significativas entre los aceites evaluados, pero no sé detecto una diferencia global entre
los países. Además, se observaron correlaciones entre los parámetros analizados en los
extractos químicos de las muestras y los factores climáticos/geográficos, destacando la
encontrada entre la temperatura máxima de la zona con el contenido de polifenoles
totales (r=0.801) y las propiedades antioxidantes, determinadas mediante los métodos
ABTS, DPPH y FRAP.
La digestión in vitro promovió un incremento en la actividad antioxidante evaluada y en
el contenido de polifenoles totales respecto a los resultados encontrados en los extractos
químicos (artículo 3, Tabla 1-2), apoyando estudios anteriores en aceites realizados por
nuestro grupo de investigación (Borges y col., 2015; Seiquer y col., 2015). Estas
diferencias son debidas a las transformaciones biológicas del aceite durante el proceso
de digestión, que al parecer suponen una liberación de los compuestos responsables de
la actividad antioxidante respecto de la matriz alimentaria y que, por tanto, son
esenciales para evaluar el potencial antioxidante de los aceites. Hay que señalar que, al
contrario de lo observado en los extractos químicos, en la fracción bioaccesible obtenida
tras el proceso digestivo de los aceites no se detectó relación estadística entre la
actividad antioxidante y la cantidad total de polifenoles. Esto podría indicar que durante
la digestión se producen otros compuestos, bien liberados de la matriz o bien resultado
de transformaciones intestinales, que también son responsables de las propiedades
antioxidantes.
Por otro lado, se debe destacar que en el presente estudio se detectaron en la fracción
residual tras la digestión niveles significativos de actividad antioxidante,
(aproximadamente 19% ABTS, 7% DPPH y 39% FRAP, calculando respecto a la
actividad total en la muestra digerida) y de polifenoles totales (un 20%). Por tanto esta
fracción, que tradicionalmente se descarta en estudios de biodisponibilidad, merece ser
tenida en cuenta en la valoración del potencial antioxidante de los aceites, ya que
algunos compuestos residuales pueden ser catabolizados por la microbiota intestinal y

Discussión general
266
posteriormente ser absorbidos por el epitelio del colon (Williamson y Clifford, 2017).
Además, no se descarta una acción beneficiosa a nivel local de la fracción residual, en
virtud de sus propiedades antioxidantes (Martin y Bolling, 2015). La actividad
antioxidante de los aceites tras la digestión se analizó también a nivel celular,
estudiando los efectos sobre la proliferación celular y sobre la generación de ROS. Estas
determinaciones se realizaron tras la incubación de las células Caco-2 durante 2h con la
fracción bioaccesible de las muestras, y se estudió tanto el efecto en condiciones basales
como la capacidad de prevención ante un estrés oxidativo inducido.
Cuando las células fueron sometidas a un estrés moderado (t-BOOH 3 mM), la
preincubación con los aceites digeridos logró una recuperación significativa de la
viabilidad, al comparar con las células control. Al forzar las condiciones pro-oxidantes
(t-BOOH 5 mM) también se observó un efecto protector en las células previamente
tratadas con las muestras, aunque en algunos casos (muestras españolas 6 y 7) la
recuperación del daño celular no llegó a ser significativa (Figura 3 del artículo 3). Ante
estas condiciones de estrés inducido se observó una reducción en la generación de ROS
cuando las células habían sido pre-incubadas con los aceites, significativa en todos los
casos (excepto con la muestra 6) al comparar con los niveles producidos en células
control estresadas (Figura 4). Esto supone una respuesta positiva en la prevención del
daño oxidativo, ya que la disminución de los niveles de ROS actúa como una señal
biológica en la regulación del metabolismo redox celular. El tratamiento de las células
con los aceites procedentes de Brasil supuso una mayor reducción de la generación de
radicales libres, lo que estuvo asociado con una mayor actividad antioxidante de la
fracción bioaccesible medida por el método DPPH.
A diferencia de otros estudios, realizados con los polifenoles individuales del AOV o
con los extractos químicos (Chiesi y col., 2015; Rodríguez-Ramiro y col., 2011; Incani
y col, 2016), nuestros ensayos suponen una aproximación más fisiológica en el estudio
del papel antioxidante de los aceites a nivel intestinal, ya que se consideran las
modificaciones sufridas por los mismos durante el proceso de digestión.
La absorción de compuestos fenólicos totales y las propiedades antioxidantes de los
aceites de oliva Arbequina también fue estudiada en el modelo celular Caco-2. El
porcentaje de absorción de los polifenoles totales fue de 32-110%, con diferencias
significativas entre las diferentes regiones y entre países (97 % Brasil y 67% España).
Aunque la incubación con algunas de las muestras, como las llamadas 1,2,3,4,6 dio

Discussión general
267
lugar a una absorción relativamente bajo de polifenoles totales, hay que tener en cuenta
que la absorción de esos compuestos podría continuar en el intestino grueso (Pereira-
Caro y col., 2015) y que otros metabolitos, potencialmente absorbibles, pueden ser
generados por las interacciones con la microbiota intestinal.
No obstante, la absorción de antioxidantes a través de las monocapas de células Caco-2,
evaluada por el método DPPH, mostró porcentajes de 30-52%, sugiriendo una buena
biodisponibilidad de las propiedades antioxidantes, que se han mantenido tras la
digestión y ha sido absorbidas por las células intestinales, aunque con diferencias
estadísticas entre las muestras. Los datos científicos sobre la absorción de compuestos
antioxidantes en alimentos tras la digestión es muy escasa y la información sobre
cuáles son los compuestos responsables del potencial bioactivo es controvertida. Los
resultados obtenidos en el presente estudio sugieren que, además de los polifenoles
totales, otros compuestos bioactivos, como los tocoferoles, carotenoides o la CoQ10,
podrían estar implicados y posiblemente actúen de manera sinérgica y compleja.
Las características organolépticas de los aceites son determinantes en la valoración de
los AOV por el consumidor y, por tanto, también merecen especial consideración de los
productores. La evaluación sensorial de las muestras en este estudio supuso, además de
la cata oficial por un panel acreditado, que es preceptiva para la clasificación de los
aceites en las distintas categorías según la reglamentación europea (CEE, 2013) la
aplicación de la lengua electrónica y la determinación de compuestos volátiles.
Las sensaciones aromáticas olfativas son atribuidas a los compuestos volátiles
representados principalmente por aldehídos, alcoholes, cetonas, hidrocarbonos y esteres.
Aunque su determinación no sea considerada un parámetro reglamentado juegan un
papel fundamental en la clasificación comercial de los aceites de oliva en las diferentes
categorías, además de representar un factor clave en la calidad y para evaluar el grado
de oxidación, pudiendo afectar la percepción sensorial y su aceptación por los
consumidores (Luna y Aparicio, 2002; Kalua y col., 2007; Sinesio y col., 2015). Como
parte preliminar para establecer un perfil global de esta fracción, se realizó la puesta a
punto de la técnica, los volátiles fueron extraídos por la técnica de espacio de cabeza
(Headspace Sampling - HS) empleando la microextracción en fase sólida (SPME), y la
fracción volátil fue evaluada por cromatografía de gases masa (GC-MS), teniendo en

Discussión general
268
cuenta las características organolépticas específicas del AOVE monovarietal Arbequina
(artículo 4). Se utilizó para ello una muestra obtenida directamente del productor
(Valladolid) y clasificada como AOVE de acuerdo con los parámetros establecidospor
la legislación europea (CEE/2568/91). Se estudiaron las condiciones de análisis de
extracción de compuestos volátiles (cantidad de aceite, temperatura y tiempo),
aplicando con este objeto la metodología estadística de superficie de respuesta (RSM) y
se optimizaron las condiciones mencionadas para el área total de los picos y para
algunos de los compuestos volátiles asociados, según estudios previos, con los atributos
positivos (almendras, manzana, astringente, plátano, amargo, fresco, verde-afrutado,
hojas verdes, picante, dulce y tomate) (Luna y col., 2002; Angerosa y col., 2004; Luna y
col., 2006), como Z-3-hexenal, E-2-hexenal, 1-hexanol, Z-3-hexen-1-ol, Z-3-hexen-1-ol
acetate, hexyl Acetate y E-2-hexen-1-ol).
Los valores experimentales obtenidos para el área total y para los compuestos volátiles
estudiados indicaron que la alta temperatura (50-60°C) y prolongado tiempo de
extracción (30-40 minutos) fueron más efectivos para maximizar el área de los picos.
Los valores experimentales fueron similares a los valores predictivos, indicando un
ajuste adecuado de los modelos matemáticos (artículo 4, Tabla 2). Por otra parte, los
gráficos de superficie de respuesta confirmaron que el tiempo y especialmente, la
temperatura, tienen más impacto en el área total evaluada que la cantidad de muestra, El
punto óptimo considerado como la condición más favorable para maximizar el área total
y de los compuestos se ha establecido en 4,6 g de AOVE Arbequina, 43 minutos y 59
°C.
Los aceites del presente trabajo fueron sometidos al análisis sensorial mediante cata por
el Panel Oficial Acreditado del Laboratorio Agroalimentario de Granada (Consejería de
Agricultura, Pesca y Desarrollo Rural de la Junta de Andalucía) y todos ellos fueron
clasificados como virgen extra. Para las sensaciones de frutado, amargo y picante se
obtuvieron valores de 4.4-6.5, 1.8-3.3 y 2.3-3.7, respectivamente.
Los compuestos volátiles, como se ha comentado, se analizaron mediante HS-SPME/
GC-MS, en las condiciones previamente seleccionadas. Se identificaron 19 compuestos
volátiles en las muestras evaluadas, agrupados en 6 clases: alcoholes, aldehídos,
hidrocarburos, esteres, terpenos y fenoles (artículo 5). En general, destacaron los
contenidos de aldehídos y esteres, principalmente de E-2-hexanal (48-380 µg/kg) and Z-

Discussión general
269
3-hexenyl acetato (9-250 µg/kg). Estos compuestos son obtenidos por la ruta de la
lipoxigenasa (LOX) y se asocian a atributos postivos como verde y frutado (Angerosa y
col., 2004; García-González y col., 2010).
Tanto los compuestos volátiles como los compuestos fenólicos, también analizados en
la presente Memoria, están estrechamente relacionados con las características
organolépticas de los aceites de oliva. Ahora bien, el análisis de ambos requiere una
infraestructura especializada y las determinaciones correspondientes suponen una gran
inversión de tiempo y dinero. Como contrapunto, existen hoy día instrumentos que
consisten en un conjunto de sensores electroquímicos que, con un sistema adecuado de
reconocimiento de patrones, son capaces de reconocer olores y sabores; son las
llamadas nariz y lengua electrónicas que, de una forma más sencilla y rápida, podrían
contribuir a la evaluación sensorial de los alimentos. En los últimos años, el análisis
potenciométrico de lengua electrónica ha sido propuesto como una herramienta
novedosa para evaluación de la calidad y autenticidad de los alimentos (Di Rosa y col.,
2017). El empleo de esta técnica tiene muchas ventajas y se ha mostrado útil en la
clasificación de los aceites según su variedad, origen geográfico, características físico-
químicas y/o atributos sensoriales (Oliveriy col.., 2009; Apetrei y col., 2010; Dias y
col., 2014; Slim y col., 2017, Souayah y col., 2017; Veloso y col., 2018). Sin embargo,
la lengua electrónica ha sido poco empleada en la evaluación indirecta de compuestos
volátiles o fenólicos con el objeto de obtener un perfil organoléptico global de los
aceites de oliva vírgenes.
Para la aplicación de la lengua electrónica en el presente trabajo, se utilizaron matrices
potenciométricas que contenían 40 sensores, obtenidos a partir de diferentes
combinaciones de aditivos grasos, plastificantes y PVC. Los sensores fueron
seleccionados, además de por la estabilidad y repetitividad de sus señales, en base a su
capacidad para proporcionar respuestas cualitativas y cuantitativas hacia los atributos
básicos del sabor (dulce, ácido, amargo, salado y umami) y las sensaciones sensoriales
positivas y negativas percibidas normalmente en los aceites de oliva (Dias et al., 2009;
Slim et al., 2017; Veloso et al., 2018). Sobre las señales potenciométricas obtenidas de
las diferentes muestras, se aplicaron modelo de regresión lineal múltiple, con la
finalidad de estimar y/o predecir el contenido en polifenoles y volátiles, previamente
determinado. Además, se seleccionaron en cada caso aquellas señales más
representativas (entre 8 y 15) de entre las generadas por los 40 sensores aplicando

Discussión general
270
algoritmos metaheurísticos, y utilizando como criterio de calidad la maximización del
coeficiente de determinación (R2) y la minimización del error de raíz cuadrática media
(RMSE) (Cortez, 2014). El valor predictivo del método se estableció al 95% de
intervalo de confianza (IC) para los valores de pendiente e intersección de la regresión
lineal simple (LR) obtenida entre los contenidos químicos predichos por la lengua
electrónica versus los respectivos datos experimentales de concentración de volátiles y
polifenoles.
La combinación de las determinaciones analíticas y el tratamiento estadístico mostró
que la aplicación de la lengua electrónica supone una aproximación adecuada en la
predicción del contenido total de polifenoles y de los niveles de polifenoles
individuales, según los valores obtenidos de R2, RMSE y la validación de interacciones
cruzadas (k-fold) (0.967 ≤ R2 ≤ 0.995; 6.2 ≤ RMSE ≤ 109.0 μg/kg de aceite de oliva;
0.930 ± 0.031 ≤ R2 ≤ 0.983 ± 0.017 y 7.2 ± 2.4 ≤ RMSE ≤ 126.0 ± 26.6 μg/kg de aceite
de oliva). Además, el ajuste del modelo fue comprobado por los valores teóricos
esperados de pendiente e intersección obtenidos en la regresión lineal.
Igualmente, se observó un gran potencial en la capacidad predictiva de la lengua
electrónica para los compuestos volátiles, con valores de R2 y RMSE adecuados. Sin
embargo, hay que señalar que el poder de esta herramienta para predecir los volátiles
fue menor que el observado para los polifenoles, ya que para la mayoría de los
compuestos volátiles evaluados; la pendiente y los valores de intersección no fueron
estadísticamente iguales a los valores teóricos esperados (artículo 5, Tabla 3).
Aun así, la posibilidad de obtener una estimación preliminar de los perfiles fenólicos y
volátiles del aceite de oliva con un único ensayo potenciométrico es de un gran interés
práctico. Teniendo en cuenta, además, el bajo costo y la relativa simplicidad del
procedimiento electroquímico-quimiométrico, la metodología propuesta puede ser
considerada como una herramienta útil en el análisis del aceite de oliva.

Discussión general
271
Referencias
Angerosa, F., Servili, M., Selvaggini, R., Taticchi, A., Esposto, S., Montedoro, G. (2004).
Volatile compounds in virgin olive oil: occurrence and their relationship with the quality.
Journal of Chromatography A, 1054(1), 17-31.
Apetrei, C., Apetrei, I. M., Villanueva, S., De Saja, J. A., Gutierrez-Rosales, F., & Rodriguez-
Mendez, M. L. (2010). Combination of an e-nose, an e-tongue and an e-eye for the
characterisation of olive oils with different degree of bitterness. Analytica Chimica Acta,
663(1), 91-97.
Bakhouche, A., Lozano-Sánchez, J., Beltrán-Debón, R., Joven, J., Segura-Carretero, A.,
Fernández-Gutiérrez, A. (2013). Phenolic characterization and geographical classification
of commercial Arbequina extra-virgin olive oils produced in southern Catalonia. Food
Research International, 50(1), 401-408.
Ballus, C. A., Quirantes-Piné, R., Bakhouche, A., da Silva, L. F. D. O., de Oliveira, A. F.,
Coutinho, E. F., ... & Godoy, H. T. (2015). Profile of phenolic compounds of Brazilian
virgin olive oils by rapid resolution liquid chromatography coupled to electrospray
ionisation time-of-flight mass spectrometry (RRLC–ESI-TOF-MS). Food chemistry, 170,
366-377.
Beltrán, G., Jiménez, A., del Rio, C., Sánchez, S., Martínez, L., Uceda, M., Aguilera, M. P.
(2010). Variability of vitamin E in virgin olive oil by agronomical and genetic factors.
Journal of food composition and analysis, 23(6), 633-639.
Borges, T. H., Cabrera-Vique, C., & Seiquer, I. (2015). Antioxidant properties of chemical
extracts and bioaccessible fractions obtained from six Spanish monovarietal extra virgin
olive oils: Assays in Caco-2 cells. Food & Function, 6(7), 2375-2383.
Chiesi, C., Fernandez-Blanco, C., Cossignani, L., Font, G., & Ruiz, M. J. (2015). Alternariol-
induced cytotoxicity in Caco-2 cells. Protective effect of the phenolic fraction from virgin
olive oil. Toxicon, 93, 103-111.
Criado, M. N., Romero, M. P., Casanovas, M., & Motilva, M. J. (2008). Pigment profile and
colour of monovarietal virgin olive oils from Arbequina cultivar obtained during two
consecutive crop seasons. Food Chemistry, 110(4), 873-880.
Dabbou, S., Brahmi, F., Taamali, A., Issaoui, M., Ouni, Y., Braham, M., ... & Hammami, M.
(2010). Extra virgin olive oil components and oxidative stability from olives grown in
Tunisia. Journal of the American Oil Chemists' Society, 87(10), 1199-1209.
Dabbou, S., Issaoui, M., Esposto, S., Sifi, S., Taticchi, A., Servili, M., ... & Hammami, M.
(2009). Cultivar and growing area effects on minor compounds of olive oil from
autochthonous and European introduced cultivars in Tunisia. Journal of the Science of
Food and Agriculture, 89(8), 1314-1325.

Discussión general
272
Di Rosa, A. R., Leone, F., Cheli, F., & Chiofalo, V. (2017). Fusion of electronic nose, electronic
tongue and computer vision for animal source food authentication and quality assessment–
A review. Journal of Food Engineering, 210, 62-75.
Dias, L. G., Fernandes, A., Veloso, A. C., Machado, A. A., Pereira, J. A., & Peres, A. M.
(2014). Single-cultivar extra virgin olive oil classification using a potentiometric electronic
tongue. Food Chemistry, 160, 321-329.
European Communities (EC) (1991) Official Journal of the Commission of the European
Communities. Regulation n° 2658/91, L248, 5 Sept 1991.
European Communities (ECC) (2013) Official Journal of the Commission of the European
Communities. Regulation n° 1348/13, L338/31, 17 Dec 2013.
EFSA Panel on Dietetic Products Nutrition and Allergens, Scientific opinion on the
substantiation of health claims related to polyphenols in olive and protection of LDL
particles from oxidative damage (ID 1333, 1638, 1639, 1696, 2865), maintenance of
normal blood HDL cholesterol concentrations (ID 1639), maintenance of normal blood
pressure (ID 3781), “anti-inflammatory properties” (ID 1882), “contributes to the upper
respiratory tract health” (ID 3468), “can help to maintain a normal function of
gastrointestinal tract”(3779), and “contributes to body defences against external agents”
(ID 3467) pursuant to Article 13(1) of Regulation (EC) No 1924/2006. EFSA J. 2011,
9,2033–2058.doi:10.2903/j.efsa.2011.2033.
Gandul-Rojas, B., Gallardo-Guerrero, L., Roca, M., & Aparicio-Ruiz, R. (2013).
Chromatographic methodologies: compounds for olive oil color issues. In Handbook of
Olive Oil (pp. 219-259). Springer US.
García-González, D. L., Romero, N., Aparicio, R. (2010). Comparative study of virgin olive oil
quality from single varieties cultivated in Chile and Spain. Journal of agricultural and food
chemistry, 58(24), 12899-12905.
Hernández, M. L., Padilla, M. N., Sicardo, M. D., Mancha, M., & Martínez-Rivas, J. M. (2011).
Effect of different environmental stresses on the expression of oleate desaturase genes and
fatty acid composition in olive fruit. Phytochemistry, 72(2), 178-187.
Ilyasoglu, H., Ozcelik, B., Van Hoed, V., Verhe, R. (2010).Characterization of Aegean olive
oils by their minor compounds. Journal of the American Oil Chemists' Society, 87(6), 627-
636.
Incani, A., Serra, G., Atzeri, A., Melis, M. P., Serreli, G., Bandino, G., & Deiana, M. (2016).
Extra virgin olive oil phenolic extracts counteract the pro-oxidant effect of dietary oxidized
lipids in human intestinal cells. Food and Chemical Toxicology, 90, 171-180.
Jankowski, J., Korzeniowska, K., Cieślewicz, A., Jabłecka, A. (2016). Coenzyme Q10–A new
player in the treatment of heart failure? Pharmacological Reports, 68(5), 1015-1019.

Discussión general
273
Kalua, C. M., Allen, M. S., Bedgood, D. R., Bishop, A. G., Prenzler, P. D., Robards, K. (2007).
Olive oil volatile compounds, flavour development and quality: A critical review. Food
chemistry, 100(1), 273-286.
Lopez, S., Bermudez, B., Montserrat-de la Paz, S., Jaramillo, S., Varela, L. M., Ortega-Gomez,
A., Muriana, F. J. (2014). Membrane composition and dynamics: a target of bioactive
virgin olive oil constituents. Biochimica et Biophysica Acta (BBA)-Biomembranes,
1838(6), 1638-1656.
López-Cortés, I., Salazar-García, D. C., Velázquez-Martí, B., Salazar, D. M. (2013). Chemical
characterization of traditional varietal olive oils in East of Spain. Food research
international, 54(2), 1934-1940.
Lopez-Huertas, E., & Fonolla, J. (2017). Hydroxytyrosol supplementation increases vitamin C
levels in vivo. A human volunteer trial. Redox biology, 11, 384-389
Luna, G., Aparicio, R. (2002). Characterisation of monovarietal virgin olive oils. Eur. J. Lipid
Sci. Technol, 104, 614-627.
Luna, G., Morales, M. T., & Aparicio, R. (2006). Characterisation of 39 varietal virgin olive oils
by their volatile compositions. Food Chemistry, 98(2), 243-252.
Martin, D. A., & Bolling, B. W. (2015). A review of the efficacy of dietary polyphenols in
experimental models of inflammatory bowel diseases. Food & Function, 6(6), 1773-1786.
Moyano, M. J., Heredia, F. J.& Meléndez-Martínez, A. J. (2010). The color of olive oils: the
pigments and their likely health benefits and visual and instrumental methods of analysis.
Comprehensive Reviews in Food Science and Food Safety, 9, 278-291.
Oliveri, P., Baldo, M. A., Daniele, S., & Forina, M. (2009). Development of a voltammetric
electronic tongue for discrimination of edible oils. Analytical and Bioanalytical Chemistry,
395(4), 1135-1143.
Pastoriza, S., Delgado-Andrade, C., Haro, A., & Rufián-Henares, J. A. (2011). A physiologic
approach to test the global antioxidant response of foods. The GAR method. Food
Chemistry, 129(4), 1926-1932.
Patel, K., Singh, G. K., & Patel, D. K. (2014). A review on pharmacological and analytical
aspects of naringenin. Chinese journal of integrative medicine, 1-13.
Pereira-Caro, G., Oliver, C. M., Weerakkody, R., Singh, T., Conlon, M., Borges, G., ... &
Augustin, M. A. (2015). Chronic administration of a microencapsulated probiotic enhances
the bioavailability of orange juice flavanones in humans. Free Radical Biology and
Medicine, 84, 206-214
Pravst, I., Zmitek, K., Zmitek, J. (2010). Coenzyme Q10 contents in foods and fortification
strategies. Critical reviews in food science and nutrition, 50(4), 269-280.

Discussión general
274
Reboredo-Rodríguez, P., González-Barreiro, C., Cancho-Grande, B., & Simal-Gándara, J.
(2014). Quality of extra virgin olive oils produced in an emerging olive growing area in
north-western Spain. Food Chemistry, 164, 418-426
Reboredo-Rodríguez, P., González-Barreiro, C., Cancho-Grande, B., Fregapane, G., Salvador,
M. D., & Simal-Gándara, J. (2015). Characterisation of extra virgin olive oils from
Galician autochthonous varieties and their co-crushings with Arbequina and Picual cv.
Food chemistry, 176, 493-503.
Rodríguez-Ramiro, I., Martín, M. Á., Ramos, S., Bravo, L., & Goya, L. (2011). Olive oil
hydroxytyrosol reduces toxicity evoked by acrylamide in human Caco-2 cells by
preventing oxidative stress. Toxicology, 288(1), 43-48.
Rondanini, D. P., Castro, D. N., Searles, P. S., & Rousseaux, M. C. (2011). Fatty acid profiles
of varietal virgin olive oils (Olea europaea L.) from mature orchards in warm arid valleys
of Northwestern Argentina (La Rioja). Grasas y aceites, 62(4), 399-409
Rueda, A., Seiquer, I., Olalla, M., Giménez, R., Lara, L., & Cabrera-Vique, C. (2014).
Characterization of fatty acid profile of argan oil and other edible vegetable oils by gas
chromatography and discriminant analysis. Journal of Chemistry, Article ID 843908,
doi:10.1155/2014/843908.
Seiquer, I., Rueda, A., Olalla, M., & Cabrera-Vique, C. (2015). Assessing the bioavailability of
polyphenols and antioxidant properties of extra virgin argan oil by simulated digestion and
Caco-2 cell assays. Comparative study with extra virgin olive oil. Food Chemistry, 188,
496-503.
Servili, M., Sordini, B., Esposto, S., Urbani, S., Veneziani, G., Di Maio, I., ... & Taticchi, A.
(2014). Biological activities of phenolic compounds of extra virgin olive oil. Antioxidants,
3(1), 1-23.
Sinesio, F., Moneta, E., Raffo, A., Lucchetti, S., Peparaio, M., D'Aloise, A., Pastore, G. (2015).
Effect of extraction conditions and storage time on the sensory profile of monovarietal
extra virgin olive oil (cv Carboncella) and chemical drivers of sensory changes. LWT-Food
Science and Technology, 63(1), 281-288.
Slim, S., Rodrigues, N., Dias, L. G., Veloso, A. C., Pereira, J. A., Oueslati, S., & Peres, A. M.
(2017). Application of an electronic tongue for Tunisian olive oils’ classification according
to olive cultivar or physicochemical parameters. European Food Research and Technology,
1-12.
Souayah, F., Rodrigues, N., Veloso, A. C., Dias, L. G., Pereira, J. A., Oueslati, S., & Peres, A.
M. (2017). Discrimination of Olive Oil by Cultivar, Geographical Origin and Quality
Using Potentiometric Electronic Tongue Fingerprints. Journal of the American Oil
Chemists' Society, 1-13.

Discussión general
275
Torres, M. M., Pierantozzi, P., Cáceres, M. E., Labombarda, P., Fontanazza, G., & Maestri, D.
M. (2009). Genetic and chemical assessment of Arbequina olive cultivar grown in Córdoba
province, Argentina. Journal of the Science of Food and Agriculture, 89(3), 523-530.
Uluata, S., Altuntaş, Ü., Özçelik, B. (2016). Biochemical Characterization of Arbequina Extra
Virgin Olive Oil Produced in Turkey. Journal of the American Oil Chemists' Society,
93(5), 617-626
Veloso, A. C., Silva, L. M., Rodrigues, N., Rebello, L. P., Dias, L. G., Pereira, J. A., & Peres,
A. M. (2018). Perception of olive oils sensory defects using a potentiometric taste device.
Talanta, 176, 610-618.
Williamson, G & Clifford, M.N. (2017). Role of the small intestine, colon and microbiota in
determining the metabolic fate of polyphenols, Biochemical Pharmacology,
http://dx.doi.org/10.1016/j.bcp.2017.03.012.
Yousfi, K., Weiland, C. M., Garcıa, J. M. (2012). Effect of harvesting system and fruit cold
storage on virgin olive oil chemical composition and quality of superintensive cultivated
‘Arbequina’olives. Journal of agricultural and food chemistry, 60(18), 4743-4750.
Zmitek, K., Rodríguez Aguilera, J. C., Pravst, I. (2014). Factors influencing the contents of
coenzyme Q10 and Q9 in olive oils. Journal of agricultural and food chemistry, 62(14),
3211-3216.

Discussión general
276

277
CAPÍTULO 6. Conclusiones y Resumen

278

Conclusiones
279
CAPÍTULO 6. Conclusiones y Resumen
A partir de resultados de la presente memoria de Tesis Doctoral se pueden obtener las
siguientes conclusiones:
1. Los aceites de la variedad Arbequina recientemente implantados en Brasil, así como
los aceites españoles evaluados en el presente trabajo, cumplen la normativa para
ser clasificados como virgen extra en cuanto a los parámetros de calidad,
composición en ácidos grasos y evaluación sensorial, independientemente de la
zona de procedencia.
2. Entre los compuestos minoritarios determinados destacan los altos niveles de
Coenzima Q10, lo que sugiere que los aceites analizados son una buena fuente
dietética de este compuesto. Los aceites brasileños presentan en general niveles
intermedios de los componentes menores respecto a los españoles, aunque con
diferencias muy marcadas entre las dos zonas productoras analizadas.
3. El proceso de digestión de los aceites promueve el aumento de la actividad
antioxidante y del contenido en polifenoles totales en todos los casos, mostrando
que las modificaciones a nivel digestivo son decisivas para establecer el potencial
antioxidante de los mismos.
4. Los ensayos en cultivos celulares muestran que la fracción bioaccesible obtenida tras
la digestión de los aceites, es capaz de ejercer un efecto preventivo ante un estrés
oxidativo inducido, reduciendo la producción de ROS y protegiendo la integridad
celular, en diferente medida según el origen geográfico de las muestras.
5. Los factores climáticos y geográficos de las regiones productoras pueden afectar a
los parámetros estudiados, particularmente las coordenadas de color, la fracción
minoritaria y la actividad antioxidante de los aceites, por lo que sus efectos merecen
ser considerados en las nuevas zonas de expansión del cultivo del olivo.
6. El uso de nuevos métodos instrumentales, como la lengua electrónica, puede
contribuir a la evaluación organoléptica de los aceites, ya que mimetiza los
atributos sensoriales normalmente percibidos y es capaz, además, de relacionarlos
con posibles compuestos responsables, como los compuestos volátiles o fenólicos.

Conclusiones
280
CONCLUSIONS
The findings of the present Doctoral Thesis allow obtaining the following conclusions:
1. The Arbequina olive oils recently introduced in Brazil, as well as the Spanish olive
oils evaluated in the present work, are within the limits established in the regulation
for extra virgin olive oils regarding quality parameters, fatty acids composition and
sensory analysis, without concerning the area of origin.
2. Among the minor compounds analyzed, the high levels of Coenzyme Q10 are
remarkable, suggesting that oils evaluated in the present study are a good dietary
source of this compound. In general, Brazilian olive oils show intermediate levels
of the minor components in comparison with the Spanish oils, although with strong
differences between both geographical areas studied.
3. The digestive process promote the increase of the antioxidant activity and the
polyphenols content in all the cases, showing that the transformations at the
intestinal level are decisive to establish the antioxidant potential of olive oils.
4. Assays in cell cultures showed that the bioaccessible fraction obtained after the in
vitro digestion of oils are able to protect against an induced oxidative stress,
reducing the generation of ROS and protecting the cells integrity, with significant
differences according to the geographical origin of the samples.
5. The climate and geographic conditions of the producing regions may affect the
parameters studied, especially colour, minor compounds and antioxidant activity. In
this sense, these effects must be taken into account in newly introduced cultivation
areas.
6. The use of new instrumental methods, since the Electronic tongue can contribute in
the organoleptic evaluation of olives oils, since it mimics the sensory attributes
normally perceived and it allows the prediction of related compounds, such as
volatile and phenolic fraction.

Resumen
281
Resumen
La producción de aceite de oliva es tradicional de la cuenca del mediterráneo,
destacando España como el primer productor mundial. Por otro lado, la creciente
demanda en el mercado internacional, el conocimiento de las propiedades saludables,
las particulares características organolépticas de los aceites de oliva y el avance de
nuevas prácticas de cultivo y producción han permitido, en los últimos años, la
expansión del olivar y la producción de aceite de oliva en regiones no tradicionales,
como Brasil. Actualmente, la producción de aceite en Brasil es muy incipiente
comparada con las necesidades del mercado y hay escasos datos sobre su calidad y
composición. Además, hay que destacar que hasta la presente fecha, hay un
conocimiento científico limitado sobre las características y propiedades de los aceites
monovarietales de diferentes áreas geográficas, especialmente los obtenidos en las
nuevas zonas de producción. De esta forma, el presente trabajo doctoral tiene por objeto
realizar un estudio amplio de los parámetros de calidad, composición y características
sensoriales de aceites de la variedad Arbequina producidos en Brasil, en comparación
con los procedentes de diferentes regiones españolas. Con ese propósito, se
seleccionaron dos regiones productoras de Brasil y nueve regiones de España. En
primer lugar, se evaluaron los parámetros de calidad (acidez, índice de peróxidos y
coeficiente de extinción específica), parámetros físico-químicos (estabilidad oxidativa y
color), el contenido en pigmentos (clorofilas y carotenoides) y el perfil de ácidos grasos.
A continuación, se determinó la composición de la fracción minoritaria insaponificable
de los aceites (tocoferoles, compuestos fenólicos y Coenzima Q10). Posteriormente, se
llevó a cabo un estudio de las propiedades antioxidantes y del contenido de polifenoles
totales de los aceites con especial énfasis en su potencial antioxidante tras un proceso de
digestión gastrointestinal, estudiando, además, los marcadores y la absorción de
antioxidantes a nivel celular.
Con relación a los parámetros organolépticos, los aceites fueron sometidos en primer
lugar a la cata mediante panel oficial acreditado. Se realizó también la determinación de
compuestos volátiles, para lo que fue necesario optimizar las condiciones analíticas
teniendo en cuenta las especificidades del aceite monovarietal Arbequina. Dentro de
este apartado, se aplicó el análisis potenciómetico de lengua electrónica para estimar el
perfil de compuestos volátiles y el contenido en compuestos fenólicos, empleando
técnicas estadísticas multivariantes.

Resumen
282
Los resultados obtenidos muestran que todos los aceites evaluados cumplían los límites
establecidos en la normativa de la Unión Europea para aceites de oliva virgen extra
(AOVE) en los parámetros reglamentados de calidad, perfil de ácidos grasos y
características sensoriales. Se encontraron diferencias significativas entre las muestras
de distinta procedencia y ciertas diferencias globales al agrupar los aceites por países en
algunos de los parámetros evaluados, principalmente en relación al color. Los hallazgos
del primer estudio revelan que los factores climáticos y el área geográfica de las zonas
productoras juegan un papel importante en las variedades recién introducidas.
Asimismo, se han observado diferencias significativas entre los aceites en relación a los
compuestos minoritarios. Es de destacar que todos los aceites analizados mostraron
altas cantidades de CoQ10 (entre 48 y 85 mg/L) y el α-tocoferol supuso la fracción
mayoritaria (algo más del 98%) entre los isómeros de tocoferol cuantificados. Tres
grupos principales de compuestos fenólicos fueron identificados: flavonoides
(apigenina, luteolina), ácidos fenólicos (naringenina, ácido p-cumárico, ácido vanílico)
y alcoholes fenólicos (hidroxitirosol). Además, al igual que en el primer estudio, se
observaron relaciones estadísticas entre los compuestos minoritarios y las condiciones
climáticas y geográficas de las zonas productoras de las muestras, siendo de especial
importancia la altitud y la cantidad de lluvias. Igualmente, los análisis quimiométricos
mostraron que, considerando los componentes minoritarios evaluados, las muestras de
diferentes procedencias podían ser clasificadas de acuerdo con su origen, siendo el
contenido de hidroxitirosol el compuesto que tuvo mayor impacto en esta clasificación.
El estudio de las propiedades antioxidantes mostró que la digestión in vitro promueve
un incremento en las propiedades antioxidantes de los aceites, así como en el contenido
de polifenoles totales. Los ensayos realizados en cultivos celulares revelaron que la
preincubación con los aceites digeridos fue capaz de prevenir el efecto citotóxico
promovido por las condiciones pro-oxidantes (t-BOOH), preservando la viabilidad
celular y reduciendo la generación de radicales libres. Aunque se observaron diferencias
significativas en la actividad antioxidante de las distintas muestras, nuestros ensayos
ponen de manifiesto que las transformaciones del proceso digestivo son fundamentales
para estudiar el potencial antioxidante de los aceites.
La determinación de compuestos volátiles implicó la previa puesta a punto de la técnica
de HS-SPME/ GC-MS, mediante la selección de las condiciones experimentales
idóneas y aplicando la metodología estadística de superficie de respuesta (RSM). Se

Resumen
283
establecieron los valores de cantidad de muestra, tiempo y temperatura de extracción
con los que se obtenía la máxima respuesta.
Con objeto de evaluar el perfil organoléptico global de los aceites, se estudió la
posibilidad de aplicar el análisis potenciométrico de lengua electrónica para la
estimación del perfil de volátiles y de los compuestos fenólicos. Se utilizaron matrices
potenciométricas que contenían 40 sensores, seleccionados en base a su capacidad para
reproducir las sensaciones sensoriales normalmente percibidas en los aceites de oliva.
Aplicando modelos matemáticos se demostró que la aplicación de la lengua electrónica
supuso una aproximación adecuada en la predicción del contenido total de polifenoles y
de los niveles de polifenoles individuales, y en menor medida, de los compuestos
volátiles. Los resultados sugieren que la lengua electrónica es una herramienta analítica
útil, ya que permite evaluar en un único ensayo potenciométrico los compuestos
relacionados con el perfil organoléptico de los aceites.
El presente estudio ha supuesto una oportunidad única para la evaluación de los AOVE
de la variedad Arbequina producidos en Brasil y para su comparación con las
variedades españolas. El empleo de multitud de técnicas analíticas y la cooperación de
diversos centros de investigación ha permitido la obtención de resultados valiosos que
contribuyen al conocimiento de las características de los aceites de oliva. Esperamos
que, además, este trabajo consiga favorecer su consumo y suponga un estímulo para
investigaciones futuras.

Resumen
284
Abstract
The olive oil production is traditionally from the Mediterranean area; mainly Spain is
recognized as the first producer in worldwide. On the other hand, the increasing
demands of the international market, the knowledge of healthy proprieties, the particular
organoleptic characteristics of olive oils and the development of new cultivation
practices and systems of production allowed, in the last years, the olive cultivation
expansion and olive oil production in no traditional regions, such as Brazil. Recently,
the Brazilian olive oil production is in an initial stage in comparison with the market
necessities and there is a lack of data about the quality and composition. In addition, it
is remarkable that to the present date, there is limited scientific knowledge about
monovarietal olive oil characteristics and proprieties from different geographic areas,
especially from those obtained from new production regions. In this sense, the present
doctoral work aims to carry out a comprehensive study of the quality parameters,
composition and sensorial characteristics of Arbequina olive oils produced in Brazil, in
comparison with those produced in different Spanish regions. For this purpose, two
producing regions of Brazil and nine regions of Spain were selected. Firstly, quality
parameters (acidity, peroxide index and specific extinction coefficient), physical-
chemical parameters (oxidative stability and colour), pigment content (chlorophylls and
carotenoids) and fatty acid profile were evaluated. Secondly, the composition of the
minor unsaponifiable fraction of oils (tocopherols, phenolic compounds and Coenzyme
Q10) was determined. Then, a study of the antioxidant properties and the total
polyphenol content of the oils was carried out, emphasizing on their antioxidant
potential after a gastrointestinal digestion process, also studying the markers and the
absorption of antioxidants at the cellular level.
Regarding the organoleptic parameters, the olive oils were evaluated by an official
sensory panel. Moreover, the determination of volatile compounds was also carried out,
for which it was necessary to optimize the analytical conditions taking into account the
specificities of the monovarietal Arbequina olive oils. Within this section, the analysis
of the potentiometric electronic tongue was applied to estimate the profile of volatile
compounds and the content of phenolic compounds, using multivariate statistical
techniques.
The results showed that all olive oils analyzed complied the limit established by
European regulation for extra virgin olive oils (EVOO) concerning quality parameters,

Resumen
285
fatty acids profile and sensory characteristics. Statistical differences were found
between samples from different origin and also between countries regarding some
parameters evaluated, mainly for colour. The findings of this first study revealed that
the climate conditions and geographic area play an important role in the newly
introduced varieties production.
Moreover, significant differences were found between oils in relation to minor
compounds. It is noteworthy that all analyzed oils presented high amounts of CoQ10
(48-85 mg/L) and α-tocopherol was the major fraction found (>98%) among the
quantified tocopherol isomers.
Three main groups of phenolic compounds were identified: flavonoids (apigenin,
luteolin), phenolic acids (naringenin, p-coumaric acid, vanillic acid) and phenolic
alcohols (hydroxytyrosol). In addition, in the same line of the first study, statistical
relationships were observed between minor compounds and geoclimate conditions of
the production areas of samples, mainly in relation to altitude and rainfalls.
Similarly, the chemometric analysis performed, considering the minor compounds
evaluated, allowed the classification of samples according to their origin, having the
hydroxytyrosol content the highest impact in this classification.
The study of antioxidant properties proved that the in vitro digestion promotes an
increase in the antioxidant activity of oils and in the total polyphenol content. The cell
culture assays revealed that the preincubation with the digested oils was able to prevent
the cytotoxic damage generated by the pro-oxidant conditions (t-BOOH), preserving
cell viability and reducing the ROS generation. Although significant differences were
observed in the antioxidant activity of samples, the assays performed confirmed that
transformations during the digestive process are vital to study the antioxidant potential
of oils.
The volatile compounds determination implied the prior development of the HS-
SPME/GC-MS technique, by the selection of the optimum experimental conditions of
extraction and applying statistical methodologies of response surface model (RSM). The
response was obtained for the quantity of sample, time and temperature conditions were
established.
In order to evaluate the global organoleptic profile of oils, it was studied the possibility
of applying the electronic tongue potentiometric analysis for prediction of the volatile
profile and the phenolic compounds. potentiometric signals based on 40 sensors were

Resumen
286
used, on the basis of their ability to reproduce the sensory sensations normally
perceived in olive oils. Mathematical models were carried out and it was found that the
employment of the electronic tongue was an adequate approach in the prediction of the
total content of polyphenols and the levels of individual phenols, but less accuracy of
volatile compounds was verified. In summary, the results suggest that the electronic
tongue is a useful analytical tool since it allows evaluating in a single analysis the
compounds related to the organoleptic profile of the oils.
The present study has provided a unique opportunity for evaluation of Arbequina
EVOO produced in Brazil and for the comparison with original Spanish variety. The
employment of many analytical techniques and the collaboration of several research
centres allowed the valuable results that contribute to the knowledge about the olive oil
characteristics. We believed that this work could promote its consumption and
encourage future research.

Granada, 2017.