tesis doctoral maría estela matos segura dirigida por: dra
TRANSCRIPT

FORMULACIÓN Y DESARROLLO DE PRODUCTOS HORNEADOS LIBRES DE GLUTEN A BASE DE HARINA DE ARROZ ENRIQUECIDOS CON PROTEÍNAS
TESIS DOCTORAL María Estela Matos Segura
Dirigida por:
Dra. Cristina Molina Rosell Valencia, marzo de 2013
Dedicatoria
A mis padres por mostrarme el camino de la superación y despertar mi amor al estudio.
A la Divina Presencia, mi fuente de conocimiento y fortaleza.

vii
Agradecimientos
Esta investigación ha sido posible gracias a la financiación
procedente del Consejo Superior de Investigaciones Científicas (CSIC), el
Ministerio de Economía y Competitividad (Proyectos AGL2008-
00092/ALI, AGL2011-23802), la Generalitat Valenciana (Proyecto Grupo
de Excelencia Prometeo 2012/064), Fondos Europeos para el Desarrollo
(FEDER) y la Asociación de Celíacos de Madrid (VII Premio Nacional de
Investigación Básica y Aplicada sobre la Enfermedad Celíaca).
Deseo expresar mi más sincero agradecimiento a todas aquellas
personas e instituciones que de una u otra forma contribuyeron a la realización
de este trabajo de investigación, y muy especialmente a:
Al Consejo Superior de Investigaciones Científicas (CSIC) y al
Instituto de Agroquímica y Tecnología de Alimentos (IATA) por aportar la
infraestructura científica, las instalaciones y los recursos necesarios para
llevar a cabo esta investigación.
A la Ilustre Universidad Central de Venezuela, Alma Mater de
hombres y mujeres comprometidos con la Academia. Institución a la cual
pertenezco, debo mi formación profesional y mi orgullo de ser Ucevista.
Al Consejo de Desarrollo Científico y Humanístico de la Universidad
Central de Venezuela por otorgarme la Beca Estudio Exterior para la
realización de mis estudios de doctorado en España.
viii
A la Universidad Politécnica de Valencia por aceptarme en el
programa de Doctorado en Ciencia y Tecnología de Alimentos. Y a los
profesores que tuve la oportunidad de conocer durante el periodo de
formación. Muy especialmente a los profesores Amparo Chiralt, Isabel
Hernando, Daniel Vidal, Gemma Moraga y Pau Talens. Gracias por
ratificar mi amor por la docencia.
A la Dra. Cristina Molina Rosell, por confiar en mí y brindarme la
valiosa oportunidad de realizar esta investigación bajo su excelente
dirección. Gracias Cristina por tu profesionalismo, entrega, dedicación y
entusiasmo durante todos estos años. Por estar siempre presente en todas y
cada una de las etapas de este proceso.
A los evaluadores externos y a los miembros del Tribunal evaluador
de por sus aportes y dedicación a la evaluación de la memoria de esta tesis
doctoral.
A la Dra. Teresa Sanz y la Dra. Susana Fiszman por el apoyo y
asesoramiento durante mi estancia en el Grupo de Propiedades Físicas y
Sensoriales del IATA.
A la Dra. Concha Collar, por brindarme su aprecio desde el primer
momento, por sus atinados consejos y palabras de apoyo ¡Gracias!
A la Dra. Mónika Haros por brindarme su amistad y su extraordinaria
solidaridad ¡Gracias!
A todos y cada uno de los compañeros de los laboratorios 109 y 107

ix
del IATA, porque cada uno en su momento supo darme apoyo y estímulo para
continuar avanzando. Y muy especialmente a Juan Mario, Rossana, Ester,
Izaskun, Elvira, Consuelo, Fina, Encarna, Ade y Ángela.
A todo el personal del Grupo de Propiedades Físicas y Sensoriales del
IATA, muy especialmente a Ana, Sandra y Laura, por brindarme apoyo y
asesoramiento durante mi estancia en el laboratorio de Propiedades Físicas y
Sensoriales del IATA.
A mis muy queridos amigos del “Poli” con quienes compartí largas
horas de estudio y gratos momentos de diversión. Muy especialmente a
Emmy, Lina, Ingrid y José.
A mis hermanos por quererme, apoyarme y acompañarme siempre, a
pesar de los miles de kilómetros de distancia…
A Jesús mi compañero, gracias por quererme, cuidarme y ser paciente
en mis largas horas de estudio.
A Dios, por guiarme, sostenerme y estar siempre presente en mi vida.
María Estela Matos S.

xi
Resumen
La creciente demanda de productos libres de gluten ha favorecido el
desarrollo de numerosos productos de panadería buscando imitar las
características de calidad de sus homólogos elaborados con trigo. Sin
embargo, en dichos desarrollos ha primado la calidad tecnológica y se han
obviado otros aspectos como el nutricional. El objetivo de este estudio ha
sido el diseño científico de productos horneados sin gluten (panes y
magdalenas) elaborados utilizando harina de arroz, integrando aspectos
tecnológicos, sensoriales y nutricionales. El estudio incluyó la evaluación de
panes libres de gluten de origen comercial y el diseño de nuevas
formulaciones sobre las cuales establecer correlaciones entre las
propiedades de las masas y los parámetros tecnológicos de los productos
horneados. En el diseño de magdalenas se puso especial énfasis a la
evaluación del rol de las proteínas sobre las propiedades reológicas de las
masas formuladas y las características tecnológicas del producto final. Los
panes sin gluten comerciales mostraron un perfil nutricional muy variable,
en general con un bajo contenido en proteína y alto en grasa. Los productos
formulados, tanto panes como magdalenas sin gluten presentaron un buen
contenido de proteínas y gran variabilidad en las características
tecnológicas. El análisis reológico de las masas libres de gluten y los
parámetros tecnológicos y sensoriales de los productos horneados
resultantes permitieron establecer correlaciones positivas entre las
propiedades de hidratación de la miga y algunos parámetros de textura, y
entre la dureza-TPA y los parámetros reológicos de las masas
caracterizadas mediante el Mixolab, los cuales podrían utilizarse como
xii
predictores de la calidad para los panes libres de gluten. El estudio reológico
de las mezclas formuladas para elaborar magdalenas a base de harina de
arroz demostró que las propiedades reológicas de las masas-batidas
estuvieron gobernadas por el tipo de proteína utilizada en cada formulación.
En general, la presencia de clara de huevo confiere propiedades
viscoelásticas a la masa-batida basada en harina arroz que permitieron
obtener magdalenas con mejores características tecnológicas.

xiii
Resum
La creixent demanda de productes lliures de gluten ha afavorit el
desenvolupament de nombrosos productes de forn buscant imitar les
característiques de qualitat dels seus homòlegs elaborats amb blat. No
obstant això, en estos desenvolupament ha primat la qualitat tecnològica i
s'han obviat altres aspectes com el nutricional. L'objectiu d'este estudi ha
sigut el disseny científic de productes enfornats sense gluten (pans i
magdalenes) elaborats utilitzant farina d'arròs, integrant aspectes
tecnològics, sensorials i nutricionals. L'estudi va incloure l'avaluació de
pans lliures de gluten d'origen comercial i el disseny de noves formulacions
sobre les quals establir correlacions entre les propietats de les masses i els
paràmetres tecnològics dels productes enfornats. En el disseny de
magdalenes es va posar especial èmfasi a l'avaluació del rol de les proteïnes
sobre les propietats reològiques de les masses formulades i les
característiques tecnològiques del producte final. Els pans sense gluten
comercials van mostrar un perfil nutricional molt variable, en general amb
un davall contingut en proteïna i alt en greix. Els productes formulats, tant
pans com magdalenes sense gluten van presentar un bon contingut de
proteïnes i gran variabilitat en les característiques tecnològiques. L'anàlisi
reológic de les masses lliures de gluten i els paràmetres tecnològics i
sensorials dels productes enfornats resultants van permetre establir
correlacions positives entre les propietats d'hidratació de la molla i alguns
paràmetres de textura, i entre la dureza-TPA i els paràmetres reològiques de
les masses caracteritzades per mitjà del Mixolab, els quals podrien utilitzar-
se com a predictors de la qualitat per als pans lliures de gluten.

xiv
L'estudi reològic de les mescles formulades per a elaborar magdalenes a
base de farina d'arròs va demostrar que les propietats reológicas de les
masses- batudes van estar governades pel tipus de proteïna utilitzada en
cada formulació. En general, la presència de clara d'ou conferix propietats
viscoelastiques a la massa-batuda basada en farina arròs que van permetre
obtindre magdalenes amb millors característiques tecnològiques.
xv
Abstract
The increasing demand of gluten free products has prompted the launching
of numerous bakery gluten free products with similar quality to their wheat
containing counterparts. Nevertheless, those products are mainly design
focused on the technological quality and without considering the nutritional
quality. The objective of this research was the scientific design of baked
gluten free products (breads and muffins) based on rice flour, from
technological, sensorial and nutritional point of view. The study included
the evaluation of commercial gluten free breads and the design of new
formulations to establish the correlations between the dough properties and
the technological parameters of the baked products. In the muffins design,
special emphasis was put on determining the role of proteins on the
rheological properties of the formulated doughs and the product
characteristics. Commercial gluten free breads showed great variation in the
nutritional profile; in general they had low protein content and high content
in fats. The formulated products, gluten free both breads and muffins, had
adequate protein content and great variability in the technological
characteristics. The rheological analysis of the gluten free doughs and the
technological and sensorial parameters of the baked goods, allowed
establishing positive correlations between the hydration properties of the
crumb and some textural parameters and also between the TPA-hardness
and the dough rheological parameters obtained with the Mixolab, which can
be used as quality predictors for gluten free breads. The rheology of the
formulated doughs for making muffins based on rice flour confirmed that
the rheological properties of the batters are governed by the type of protein

xvi
added. In general, the egg white protein conferred to the batter the necessary
viscoelastic properties for obtaining the best quality muffins.

xvii
Índice General
Agradecimientos vii
Resumen xi
Introducción 1
Objetivos 42
Capítulo 1: Chemical composition and starch digestibility of
different gluten-free breads 47
Capítulo 2: Relationship between instrumental parameters and
sensory characteristics in gluten-free breads 71
Capítulo 3: Quality indicators of rice based gluten free bread-like
products: relationships between dough rheology and quality
characteristics 103
Capítulo 4: Understanding the function of proteins on the
rheological and quality properties of rice based batters and
muffins 139
Discusión general 182
Conclusiones 207

INTRODUCCIÓN
Introducción
3
La presente introducción describe algunos aspectos fundamentales que
contribuirán a un mayor entendimiento del tema y a una mejor ubicación
en el entorno actual de lo concerniente a lo “libre de gluten”. Se define
gluten y se refiere su importancia como componente fundamental en la
elaboración de panes y productos de panadería, su composición química
y su funcionalidad, lo cual le confiere la calidad única de formar una
masa viscoelástica capaz de ser horneada para producir el pan. Se definen
los productos libres de gluten (de acuerdo al Reglamento (CE) No
41/2009 de la Comisión de las Comunidades Europeas y a la Norma
Codex relativa a los alimentos para regímenes especiales destinados a
personas intolerantes al gluten, adoptada por la Comisión del Codex
Alimentarius en su 31ª sesión de julio de 2008), señalando los límites
permitidos en la cantidad de gluten, y los cereales que lo contienen. Se
define la enfermedad celiaca (EC), el colectivo especial que la sufre, su
incidencia a nivel mundial y en España. Por otro lado se presenta
información relacionada con las tendencias de consumidores y de
mercado en relación a los productos libres de gluten, lo cual refleja la
realidad de la creciente demanda de este tipo de productos y la necesidad
de mejorar su calidad sensorial, nutricional y su abastecimiento; tomando
en cuenta que la percepción del consumidor que compra este tipo de
productos es que los mismos son “más saludables que su contraparte”, a
pesar de que esto no es necesariamente cierto. Seguidamente se presenta
una breve y actualizada revisión de los aspectos que limitan la
elaboración de productos horneados libres de gluten, a partir de harinas y
otros ingredientes que no lo contienen, pero que han sido diseñados para
Introducción
4
satisfacer las necesidades específicas de personas con intolerancia al
gluten. Finalmente se presenta algunos antecedentes derivados de
recientes estudios científicos en relación al diseño de productos
horneados libres de gluten (panes y magdalenas) utilizando harina de
arroz, almidones de diferentes fuentes, hidrocoloides y proteínas, entre
otros, como sustitutos funcionales del gluten. Es importante destacar que
en todos estos estudios se ha puesto énfasis en evaluar el efecto de los
ingredientes sobre las propiedades de las masas o sobre las características
de los productos finales, pero no se han establecido claras relaciones
entre ambas; dejando así un vacío en el entendimientos del
comportamiento de estos complejos sistemas panarios. Aunado a ello, y
a pesar de la importancia que tienen estos productos como sustitutos de
un producto básico en la alimentación, como lo es el pan, es poca la
información científica publicada en relación al estudio y mejora de la
calidad nutricional de los productos libres de gluten que se desarrolla y
diseñan. En tal sentido, y con miras a contribuir al avance del
conocimiento científico, tecnológico y nutricional de los productos libres
de gluten y tomando en cuenta la real y creciente demanda por parte de
los consumidores, de productos con mejor sabor y textura que lo ya
existentes, y dada la importancia de mejorar la pobre calidad nutricional
de la mayoría de los productos que existen en el mercado, se han
establecido y realizado los objetivos que justifican el desarrollo de esta
Tesis Doctoral.
Introducción
5
1. Gluten
De acuerdo al Reglamento No 41/2009 de la Comisión de las
Comunidades Europeas sobre la composición y etiquetado de productos
alimenticios apropiados para personas con intolerancia al gluten (con
aplicación a partir del 1 de enero de 2012). En su artículo 2:
Se entenderá por «gluten»: una fracción proteínica del trigo, el centeno,
la cebada, la avena o sus variedades híbridas y derivados de los mismos,
que algunas personas no toleran y que es insoluble en agua y en solución
de cloruro sódico de 0,5 M.
Y se entenderá por «trigo»: cualquier especie de Triticum.
En términos generales, el gluten es una mezcla compleja de proteínas de
almacenamiento presentes en el trigo (Hoseney, 1986; Catassi y Fassano,
2008) y en otros granos de cereales, tales como el triticale, la cebada, el
centeno. Actualmente, la avena está considerada como un cereal que
contiene gluten, debido a la posible contaminación que puede presentar
con trigo, cebada o centeno.
Las proteínas de almacenamiento del trigo son capaces de formar el
gluten. La formación del gluten es un artefacto del procesamiento de la
harina, se forma como resultado de la interacción de las dos principales
clases de proteínas las gliadinas y las gluteninas, las cuales interactúan
cuando la harina es mezclada con agua para formar la masa viscoelástica.
Aunque las proteínas de almacenamiento están presentes en otros
cereales (triticale, cebada y centeno y avena), el comportamiento
viscoelástico de gluten de trigo y su funcionalidad lo distingue de otros
granos o proteínas vegetales (Hoseney, 1986).

Introducción
6
El gluten está definido como un gel formado por las proteínas de
almacenamiento del grano de trigo cuando se trabaja mecánicamente una
mezcla de harina y agua. Está formado por un 80% de proteína y un 8%
de lípidos, base sustancia seca, con un resto de hidratos de carbono y
cenizas (Hoseney, 1986).
En general, las proteínas que constituyen el gluten son: las gliadinas, que
contribuyen esencialmente a la viscosidad y a la extensibilidad de la
masa (Don y col., 2003) y las gluteninas, que son responsables de la
fuerza y elasticidad de la masa (Xu y col., 2007). Esta estructura
distintiva es crucial para las características de la textura y de la miga del
pan del trigo (Hüttner y Arendt, 2010).
1.1. Importancia tecnológica del gluten
Debido a la naturaleza única de su propiedad viscoelástica, el gluten
ofrece un sin número de propiedades funcionales para ser utilizado en
sistemas alimenticios. Las propiedades funcionales del trigo son amplias,
entre ellas se encuentran: la capacidad de desarrollar viscoelásticidad, la
capacidad de formar películas, sus propiedades termoestables y su
capacidad de absorción de agua (IWGA, 2012).
La capacidad del gluten de trigo para formar una masa viscoelástica
cuando está totalmente hidratado lo distingue de las demás proteínas
vegetales disponibles en el mercado. La propiedad formadora de película
del gluten es una consecuencia de su viscoelásticidad.

Introducción
7
La formación de película es una de las propiedades que proporciona la
capacidad para que la masa retenga partículas sólidas en suspensión. La
formación de película también es importante para atrapar las burbujas de
gas producidas durante la fermentación del pan, lo cual resulta en una
miga de textura deseable (uniforme) y la expansión del volumen. La
estabilidad de las burbujas de gas depende de la elasticidad y de la fuerza
de la película de gluten que forma las paredes de las burbujas. El colapso
individual de las burbujas de gas puede conducir a la formación de
grandes agujeros (cavidades) en la masa o resultar en panes con poco
volumen. Por otra parte, la retención de humedad en masas y en la
corteza durante el horneado es importante para permitir la expansión en
el volumen de la masa y del pan. La capacidad de retener humedad del
gluten también es clave en la obtención de la textura húmeda en la miga
de productos horneados (Khan y Nygard, 2006).
Ningún área de procesamiento de alimentos goza de mayores beneficios
de la funcionalidad del gluten que la industria de la panadería. Las
propiedades de viscoelásticas exclusivas del gluten de trigo mejoran la
fuerza de la masa, la tolerancia al mezclado y a la manipulación. Su
capacidad de formar película proporciona retención de gas y expansión
controlada lo cual permiten mejorar el volumen, la uniformidad y la
textura, sus propiedades termoestables contribuyen a la rigidez de la
estructura necesaria y a las características de la mordida; su capacidad de
absorción de agua mejora el rendimiento del producto horneado,
permitiendo obtener productos más suaves, y con mayor vida útil
(IWGA, 2012). Las proteínas del gluten juegan un papel primordial en la

Introducción
8
determinación de las características únicas del trigo durante el horneado,
debido a que le confieren capacidad reabsorción de agua, cohesividad,
viscosidad, extensibilidad, elasticidad, resistencia al estiramiento,
tolerancia al mezclado, y capacidad de retener gas (Lazaridou y col.,
2007).
2. Alimentos libres de gluten
2.1. Definición de alimentos libres de gluten
A efectos del Reglamento (CE) No 41/2009 de la Comisión de las
Comunidades Europeas (vigente a partir del 2012) sobre la composición
y etiquetado de productos alimenticios apropiados para personas con
intolerancia al gluten (artículos 2, 3 y 4), se entenderá por:
- «Productos alimenticios para personas intolerantes al gluten»: los
productos alimenticios destinados a una alimentación particular
elaborados, tratados o preparados especialmente para responder a las
necesidades nutricionales particulares de las personas intolerantes al
gluten.
- Los productos antes definidos que se comercializan como tales, deben
llevar la indicación «contenido muy reducido de gluten» o «exentos de
gluten» de conformidad con las disposiciones establecidas en el referido
reglamento. Estas disposiciones pueden ser logradas mediante el uso de
productos alimenticios tratados especialmente para reducir el contenido
de gluten de uno o varios ingredientes que contienen gluten o productos

Introducción
9
alimenticios cuyos ingredientes con gluten han sido sustituidos por otros
ingredientes exentos de forma natural.
Productos alimenticios para personas con intolerancia al gluten.
Los productos alimenticios para personas con intolerancia al gluten,
constituidos por uno o más ingredientes procedentes del trigo, el centeno,
la cebada, la avena o sus variedades híbridas, que hayan sido tratados de
forma especial para eliminar el gluten, no contendrán un nivel de gluten
que supere los 100 mg/kg en los alimentos tal como se venden al
consumidor final.
El etiquetado, la publicidad y la presentación de los productos con un
nivel de gluten que no supere los 100 mg/kg, llevarán la mención
«contenido muy reducido de gluten».
Pueden llevar el término «exento de gluten» si el contenido de gluten no
sobrepasa los 20 mg/kg en total, medido en los alimentos tal como se
venden al consumidor final.
La avena contenida en alimentos para personas con intolerancia al gluten
debe ser producida, preparada o tratada de forma especial para evitar la
contaminación por el trigo, el centeno, la cebada, o sus variedades
híbridas y su contenido de gluten no debe sobrepasar los 20 mg/kg.
Los productos alimenticios para personas con intolerancia al gluten
constituidos por uno o más ingredientes que sustituyan el trigo, el
centeno, la cebada, la avena o sus variedades híbridas, no contendrán un
nivel de gluten que supere los 20 mg/kg en los alimentos tal como se
venden al consumidor final. El etiquetado, la presentación y la publicidad
de esos productos deberá llevar la mención «exento de gluten».
Introducción
10
Los términos «contenido muy reducido de gluten» o «exento de gluten»
deberán aparecer muy cerca del nombre comercial del producto.
Otros productos alimenticios adecuados para las personas con
intolerancia al gluten.
El etiquetado, la publicidad y la presentación de los siguientes productos
alimenticios pueden llevar el término «exento de gluten» si el contenido
de gluten no sobrepasa los 20 mg/kg, medido en los alimentos tal como
se venden al consumidor final:
a) productos alimenticios para el consumo normal;
b) productos alimenticios destinados a una alimentación particular
elaborados, tratados o preparados especialmente para responder a las
necesidades nutricionales particulares distintas de las de las personas con
intolerancia al gluten pero que son sin embargo adecuados, en virtud de
su composición, para cubrir las necesidades dietéticas especiales de las
personas con intolerancia al gluten.
El etiquetado, la publicidad y la presentación de estos alimentos no
llevarán la mención «contenido muy reducido de gluten».
De acuerdo al CODEX ALIMENTARIO (CODEX STAN 118 – 1979):
La norma Codex relativa a los alimentos para regímenes especiales
destinados a personas intolerantes al gluten, adoptada por la Comisión
del Codex Alimentarius en su 31ª sesión de julio de 2008, indica que:
- Los alimentos libres de gluten son alimentos dietéticos:
a) consiste en uno o más ingredientes que no contengan trigo (es decir,
todos las especies de Triticum, como el trigo, espelta y kamut), centeno,

Introducción
11
cebada, avena o sus variedades, y el nivel de gluten no bebe exceder de
20 mg/kg en total, basado en el alimento tal y como es vendido o
distribuido al consumidor,
b) consisten de uno o más ingredientes provenientes de trigo (es decir,
todos las especies Triticum, como el trigo, espelta y kamut), centeno,
cebada, avena o sus variedades, que hayan sido especialmente procesados
para eliminar el gluten, y el nivel de gluten no debe superar los 20 mg/kg
en total, basado en el alimento tal y como es vendido o distribuido al
consumidor.
- Alimentos especialmente procesados para reducir el contenido de gluten
a un nivel por encima de 20 y hasta 100 mg/kg.
Estos alimentos consisten en uno o más ingredientes de trigo (es decir,
todos las especies de Triticum, como el trigo, espelta y kamut), centeno,
cebada, avena o sus variedades mestizas, que se han procesado
especialmente para reducir el contenido de gluten a un nivel por encima
de 20 y hasta 100 mg/kg en total, basados en el alimento tal y como es
vendido o distribuido al consumidor.
Tanto el REGLAMENTO (CE) No 41/2009 como en la norma adoptada
por el Codex Alimentario establecen los límites de presencia de gluten
entre 20 mg/kg y 100 mg/kg. Sin embargo, a diferencia del Codex
Alimentario, en el REGLAMENTO (CE) No 41/2009, se establece que el
etiquetado, la publicidad y la presentación de estos productos llevará la
mención «exento de gluten» si el contenido de gluten no sobrepasa los 20
mg/kg y la mención «contenido muy reducido de gluten» si el contenido
Introducción
12
de gluten no sobrepasa los 100 mg/kg en total, medido en los alimentos
tal como se venden al consumidor final.
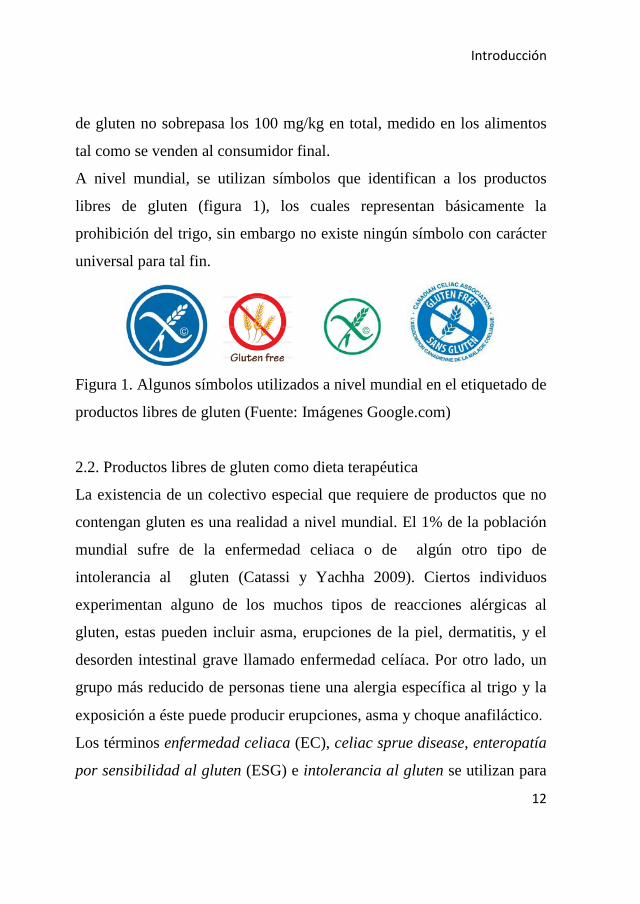
A nivel mundial, se utilizan símbolos que identifican a los productos
libres de gluten (figura 1), los cuales representan básicamente la
prohibición del trigo, sin embargo no existe ningún símbolo con carácter
universal para tal fin.
Figura 1. Algunos símbolos utilizados a nivel mundial en el etiquetado de
productos libres de gluten (Fuente: Imágenes Google.com)
2.2. Productos libres de gluten como dieta terapéutica
La existencia de un colectivo especial que requiere de productos que no
contengan gluten es una realidad a nivel mundial. El 1% de la población
mundial sufre de la enfermedad celiaca o de algún otro tipo de
intolerancia al gluten (Catassi y Yachha 2009). Ciertos individuos
experimentan alguno de los muchos tipos de reacciones alérgicas al
gluten, estas pueden incluir asma, erupciones de la piel, dermatitis, y el
desorden intestinal grave llamado enfermedad celíaca. Por otro lado, un
grupo más reducido de personas tiene una alergia específica al trigo y la
exposición a éste puede producir erupciones, asma y choque anafiláctico.
Los términos enfermedad celiaca (EC), celiac sprue disease, enteropatía
por sensibilidad al gluten (ESG) e intolerancia al gluten se utilizan para
Introducción
13
describir la enfermedad celiaca. La EC es una enteropatía inmune sufrida
por la ingestión de gluten en individuos genéticamente susceptibles
(Brussone y Asp 1999; Wrigley y Bietz 1988). Quienes padecen la EC
pueden sufrir una reacción autoinmune al ingerir incluso pequeñas
cantidades de gluten. La enfermedad celiaca es una enfermedad digestiva
autoinmune que daña la vellosidad del intestino delgado e interfiere en la
absorción de nutrientes del alimento. Esta lesión disminuye la superficie
disponible para la absorción de nutrientes incluyendo hierro, ácido fólico,
calcio y vitaminas solubles en agua (Catassi y Fasano, 2008), trayendo
como consecuencia carencias nutricionales
Específicamente, los granos que provocan las reacciones celiacas
incluyen trigos hexaploides y trigos durum, triticale, centeno, cebada,
espelta, Kamut, escaña (“einkorn”), avena y las variedades híbridas de
los referidos cereales. En particular, los pacientes celiacos son
intolerantes a algunas prolaminas presentes en algunos cereales, dichas
prolaminas contienen una secuencia tóxica específica de oligopéptidos.
La fracción gliadina en el trigo, secalina en el centeno, hordeína en la
cebada; y la avenina en algunas variedades de avena (Comino y col.,
2011), son las prolaminas que están involucradas en el mecanismo de la
enfermedad celiaca (Wrigley y Bietz, 1988; Brussone y Asp, 1999;
Comino y col. 2011).
En el presente, el único tratamiento efectivo para el tratamiento de la EC
es mantener una estricta dieta libre de gluten. Sin embargo, el
seguimiento de esta pauta dietética no es sencillo, considerando que los
granos que contienen gluten, especialmente el trigo, son el principal

Introducción
14
ingrediente en la elaboración de alimentos populares de consumo masivo
de muchas culturas, tales como panes, pasta y pasteles. Por otra parte,
estos granos y sus derivados son ampliamente utilizados como aditivos,
conservantes, ligantes y espesantes en una vasta mayoría de alimentos
procesados (caldos, salsas, carnes procesadas, alimentos enlatados,
gelatinas y medicamentos).
Afortunadamente, tanto el conocimiento médico, como la calidad de la
dieta libre de gluten continúan mejorando en la medida que aumenta la
conciencia del incremento de la EC a lo largo del mundo (Cureton y
Fasano, 2009).
2.3. Prevalencia de la Enfermedad Celiaca
La distribución geográfica de la EC estuvo principalmente restringida a
Europa y otros los países desarrollados, tales como Estados Unidos,
Canadá y Australia. Sin embargo, nuevos estudios epidemiológicos han
revelado que este desorden es común en muchos países en desarrollo;
además han demostrado que la “aldea global de la enfermedad celiaca”
tiene de hecho una distribución mundial. En consecuencia la EC es uno
de los desórdenes crónicos más comunes, y afecta a cerca del 1% de la
población mundial (Catassi y Yachha, 2009). Se ha estimado que en
Europa, dependiendo del país que se trate, una de cada 85-500 personas
sufre la EC (Farrell y Kelly, 2001). Recientemente, se ha conducido un
estudio en una amplia muestra de la población europea (Finlandia,
Alemania, Italia y Reino Unido), incluyendo niños y adultos, para

Introducción
15
investigar si la prevalencia de EC varía significativamente entre las
diferentes zonas del continente europeo (Mustalahti y col., 2010). Los
resultados indican que la prevalencia global de EC (previamente
diagnosticada) es de 1.0%. Por otra parte, en sujetos de 30 a 64 años la
prevalencia fue del 2,4% en Finlandia, de 0,3% en Alemania y de 0,7%
en Italia. Adicionalmente, el 68% de las personas estudiadas mostraron
cambios en la mucosa del intestino típicos para la EC. Los investigadores
concluyen que la EC es común en Europa y que la prevalencia de esta
enfermedad en la edad adulta muestra grandes e inexplicables diferencias
entre las poblaciones de los diferentes países europeos. En la población
del Reino Unido, la prevalencia de la enfermedad celíaca está estimada
en 0,8 a 1,9 %, estudios internacionales reportan hallazgos similares
(NICE, 2009).
Recientemente Packaged Facts (2011), ha publicado algunas cifras que
ponen de manifiesto la incidencia de la enfermedad celiaca en los
Estados Unidos de América:
• Uno de cada 133 americanos tiene la enfermedad celiaca.
• 3 millones de americanos de todas las razas, edades y géneros
sufren la EC.
• Se estima que el 85% de los americanos que tienen enfermedad
celiaca no ha sido diagnosticado o ha sido diagnosticado con
otras afecciones.
• Del 5 al 22% de pacientes celiacos tienen un miembro inmediato
de la familia (pariente del primer grado) que también tiene la EC.
Introducción
16
Particularmente en España, la prevalencia de la EC oscila entre 1 de cada
80 adultos y 1 de cada 300 menores de 15 años, con gran variabilidad
regional, atribuible a diversos sesgos en los procedimientos de
diagnóstico, y un predominio de las formas silentes frente a las formas
clásicas con síntomas. Así, señaló la Dra. Enriqueta Román (Hospital
Puerta de Hierro, Majadahonda, Madrid) al presentar los datos más
novedosos recogidos en el Registro Español de Pacientes Celíacos
(REPAC) (SEEC, 2010).
El incremento en la incidencia de la EC, y el resultante incremento en la
demanda de productos libres de gluten, ha originado un creciente interés
por parte de muchas compañías en investigar y desarrollar una amplia
gama de productos sustitutos, los cuales puedan presentar una alta
aceptabilidad sensorial. Hasta hace algunas décadas, incluso encontrar
algunos productos alimenticios convenientes para los celiacos era una
preocupación importante. Una vez superado este problema, la
investigación se ha centrado en identificar las materias primas que sean
tecnológicamente similares a la harina de trigo, el cual es el ingrediente
principal en la dieta occidental (Pagliarini y col., 2010).
3. Productos libres de gluten: Tendencia de consumidores y de
mercado
Los productos libres de gluten originalmente fueron destinados a
personal con intolerancia al gluten, no obstante son aptos para toda la

Introducción
17
población. Son productos con características propias y distintas a las de
sus homólogos hechos con harina de trigo.
Una gama de consumidores siguen dietas sin gluten, incluyendo aquellos
con enfermedad celíaca, sensibilidad de gluten, autismo, condiciones
neurológicas, síndrome de intestino irritable, esclerosis múltiple, cáncer y
aquellos que lo ven como una dieta "saludable" (Nachay, 2010).
En los últimos años la expresión “¿Es usted libre de gluten?”, describe,
más que al sector industrial de los productos alimenticios y de las
bebidas, a la sensación de un colectivo especial que ha transformado en
tendencia esta dieta en apenas algunos años. Mucha gente es “libre de
gluten” por necesidad, debido a que sufre de enfermedad celiaca o de una
alergia del alimentos. Pero un número creciente es “libre de gluten” por
elección propia, ya que emerge la evidencia de que esta dieta puede tratar
las condiciones médicas que se extienden desde el autismo en niños a la
artritis reumatoide en adultos. Otros encuentran que “una vida libre de
gluten” simplemente les hace sentir mejor. Recientemente, un informe
del mercado de los alimentos y las bebidas libres de gluten realizado en
los Estados Unidos por Packaged Facts (2011), una división de
MarketResearch.com, reveló que la motivación número uno para
comprar productos alimenticios libres de gluten es que estos productos
están considerados más sanos que sus homólogos convencionales.
Adicionalmente, el informe señala que las ventas de productos libres de
gluten alcanzaron más de 2,6 mil millones de dólares a finales de 2010.
(http://www.marketwire.com). Packaged Facts, adicionalmente proyecta
que en Estados Unidos las ventas de alimentos y de bebidas libres de
Introducción
18
gluten excederán los 5 billones de dólares antes de 2015 y los 6,6
billones de dólares en 2017.
El incremento en el diagnóstico de la enfermedad celiaca y de las alergias
por consumo de alimentos, el aumento en la conciencia de estas
dolencias entre pacientes, el personal médico y el público en general, la
disponibilidad de más y mejores productos, y la tendencia que tienen los
familiares y amigos de los pacientes celiacos -para dar apoyo- de comer
productos libres de gluten, están entre los factores que estimulan la
continua expansión del mercado de productos libre de gluten. No
obstante, la convicción de que los productos sin gluten son generalmente
más saludables es la principal motivación de compra para los
consumidores de estos productos.
El mercado de alimentos "libres de" ha crecido en los Estados Unidos y
Europa Occidental, según una nueva investigación de Leatherhead Food
Research. De acuerdo a este informe, en términos de declaraciones de
propiedades saludables, “sin gluten” es la de más rápido crecimiento, lo
que indica que este mercado tiene gran potencial de crecimiento en los
próximos años. El mercado de los alimentos sin gluten en los Estados
Unidos y Europa occidental tuvo un valor estimado de 3.500 millones de
dólares en 2010. Gran parte del crecimiento previsto en el sector “libre de
gluten” está vinculado a las percepciones saludables de los alimentos sin
gluten, especialmente entre los grupos de consumidores que cada vez son
más conscientes de su dieta, salud y bienestar, que por lo tanto buscan
Introducción
19
activamente productos “adecuados para"/"libres de” sin tener una alergia
diagnosticada (Nachay, 2010).
Es una realidad que los productos libres de gluten están en auge. La
cantidad de productos comercializados como libres de gluten continúa
aumentando en el mercado internacional. Más del 5% de los
lanzamientos de alimentos y bebidas identificados por Innova Market
Insights en el 2009 se comercializaron como libres de gluten, porcentaje
que supera el 10% en Australia y Nueva Zelanda y cae a menos del 1%
en Asia. En el Reino Unido, el interés por estos productos también ha
sido incentivado por los minoristas líderes, que en su mayoría ofrecen sus
propios productos “libres de”, incluyendo la categoría libre de gluten.
Estados Unidos posiblemente sea el mercado para alimentos libres de
gluten más grande del mundo, con ventas estimadas en más de 1.500
millones de dólares anuales. La mayoría de los mercados europeos son
mucho más pequeños, lo que refleja la existencia no solo de poblaciones
más reducidas en general sino además de mercados de alimentos
procesados mucho menos desarrollados (www.innovadatabase.com).
4. Limitaciones en el diseño de los productos libres de gluten
Aunque la industria de alimentos ha asumido los desafíos asociados a la
eliminación del gluten en las formulaciones y un considerable número de
productos está disponible en el mercado, muchas de las formulaciones
libres de gluten todavía poseen baja calidad tecnológica y nutricional
(Mariotti y col., 2013). A menudo, los productos de panadería sin gluten
tienen inferior textura, poco color y corta vida útil (Gallager y col.,

Introducción
20
2004). Sin embargo, la demanda de los consumidores de estos productos
está presionando a los fabricantes a mejorar la calidad del producto
(O'Neill, 2010).
Como ha sido discutido previamente, las propiedades únicas que presenta
la harina de trigo para formar una masa cohesiva que puede ser horneada
para producir pan o para formar pastas, son derivadas de las proteínas
presentes en el gluten (Gómez y col., 2007). La ausencia del gluten a
menudo resulta en una mezcla líquida, más parecida a las masas batidas,
de consistencia semi-líquida, producidas para elaborar tartas y pasteles
que a una masa panaria. Las masas libres de gluten son mucho menos
cohesivas y elásticas que las masas provenientes del trigo, presentan
textura lisa, son más pegajosas y pastosas y difíciles de manipular. En la
literatura, con frecuencia estas masas libres de gluten son llamadas
“batter ó batidos” en lugar de masas. Estas masas-batidas no son
realmente amasadas, sino mezcladas mecánicamente (Houben y col.,
2012). La masa de pan sin gluten solamente puede retener gas si otro gel
reemplaza al gluten. Es por ello que, los productos libres de gluten, y en
especial los tipo pan, requieren de sustancias poliméricas que mimeticen
las características viscoelásticas del gluten. El uso de almidones, gomas e
hidrocoloides es la estrategia más antigua y la más ampliamente utilizada
para mimetizar las propiedades del gluten en la elaboración de productos
horneados libres de gluten, debido a las propiedades que tienen estos
ingredientes para actuar como agentes estructurantes y enlazadores de
agua, previniendo el envejecimiento del pan y la retención de las

Introducción
21
burbujas de aire producidas durante la fermentación (Gallagher y col.,
2004; Schober, 2009). De acuerdo con la evolución en el desarrollo de
panes libres de gluten descrita en la literatura, los primeros panes se
hicieron a partir de formulaciones simples basadas principalmente en la
combinación de almidones puros con algún tipo de hidrocoloide,
posteriormente se desarrollaron fórmulas incorporando primeramente
harinas de cereales libres de gluten (sorgo y arroz) y posteriormente otras
harinas de cereales, pseudocereales y sus mezclas (maíz, amaranto)
siempre en combinación con hidrocoloides. En los desarrollos más
avanzados y novedosos se utilizan mezclas complejas de ingredientes
resultantes de la combinación de harinas, almidones e hidrocoloides con
proteínas de diferentes fuentes, fibras y enzimas a fin de obtener panes de
mejor calidad tecnológica, sensorial y nutricional (Marco y Rosell,
2008a;b).
Recientemente se han publicado extensas revisiones que incluyen
numerosos estudios científicos dirigidos a evaluar la optimización de
formulaciones, el uso de ingredientes y técnicas que permitan desarrollar
diferentes tipos de productos de panadería libres de gluten (panes, pizzas,
pastas, galletas, pasteles, etc.) con mejor calidad tecnológica y sensorial
(Schober, 2009; Hüttner y Arendt, 2010; Houben y col., 2012).
El arroz es uno de los cereales más adecuado para preparar alimentos
libres de gluten (Rosell y Gómez, 2006; Rosell y Marco, 2008a), ya que
su harina se caracteriza por tener un sabor suave y color blanco, es fácil
de digerir y adicionalmente es hipoalergénica, debido al tipo de proteínas
que contiene. Además presenta bajo contenido de sodio y alto contenido

Introducción
22
de carbohidratos fácilmente digeribles (Rosell y Gómez, 2006). Sin
embargo, la calidad de productos horneados a base de arroz es inferior a
la de productos preparados con trigo debido a la carencia de gluten. Por
ello, el uso de sustancias poliméricas tales como hidrocoloides, es
requerido a menudo para mejorar la calidad de los productos a base de
arroz (Rosell y Gómez, 2006). La cantidad relativamente pequeña de
prolaminas presentes en el arroz, conlleva a la necesidad de utilizar algún
tipo de aditivo o ingrediente tales como, hidrocoloides, emulsificante,
enzimas o productos lácteos, que junto con la harina del arroz, permitan
obtener apropiadas características viscoelásticas (Rosell y Gómez, 2006;
Marco y Rosell, 2008b).
5. Diseño con base científica de panes y magdalenas libres de gluten.
Panes
En la última década ha sido notable el incremento en el número de
estudios publicados dirigidos al desarrollo de panes libres de gluten
(Gujral y col., 2003a;b; Gujral y Rosell, 2004 a,b,c; Lazaridou y col.,
2007; Pruska-Kedzior y col., 2008; Sciarini y col., 2008; Marco y Rosell,
2008a; Korus y col., 2009; Rosell y col., 2009; Rosell, 2009; Demirkesen
y col., 2010; Brites y col., 2010; Krupa y col., 2010; Sciarini y col., 2010;
2012a,b; Onyango 2011; Sabanis y Tzia, 2011; Smith y col., 2012;
Mariotti y col., 2009; 2013). El objetivo de estos estudios ha sido la
incorporación de almidones (trigo, maíz, patata, tapioca), gomas e
hidrocoloides - goma xantana, carboximetilcelulosa (CMC),

Introducción
23
hidroxipropilmetilcelulosa (HPMC), goma guar, β-glucanos, entre otras -
, proteínas (soja, guisante, huevo, leche) y otras harinas de cereales
(arroz, maíz, sorgo) o pseudocereales (amaranto, trigo sarraceno) en una
mezcla libre de gluten con la intención de mimetizar las características
viscoelásticas del gluten y obtener panes de buena calidad.
Las formulaciones diseñadas para elaborar panes libres de gluten,
contienen principalmente harinas de arroz o maíz combinadas con
almidones de trigo, patata o maíz (Gallagher y col., 2004; Gujral y
Rosell, 2004a; Sabanis y col., 2009; Demirkesen y col., 2010; Pagliarini
y col., 2010; Torbica y col., 2010; Brites y col., 2010; Sciarini y col.,
2010; 2012a,b; Crockett y col., 2011). Para elaborar panes libres de
gluten de buena calidad se ha descrito es uso de la harina del arroz en
combinación con hidrocoloides (Kadan y col., 2001; Gujral y col.,
2003a,b; McCarthy y col., 2005; Ahlborn y col., 2005; Moore y col.,
2006; Lazaridou y col., 2007; Marco y Rosell, 2008 a,b; Pruska-Kędzior
y col., 2008; Demirkesen y col., 2010; Sciarini y col., 2010; 2012). Entre
todos los hidrocoloides estudiados el HPMC es el más adecuado ya que
rinde panes con óptima expansión de volumen y masas con propiedades
similares a las obtenidos con trigo (Gujral y Rosell, 2004a,b; Marco y
Rosell, 2008a; Sabanis y Tzia, 2011; Smith y col., 2012; Mariotti y col.,
2013). El uso de HPMC, permite el incremento de la viscosidad de la
masa durante el mezclado; y promueve la dispersión de las burbujas de
gas durante la fermentación, y en el horneado incrementa la capacidad de
retener el gas; en consecuencia se puede incrementar en el volumen del
pan (Rosell y Gómez, 2006).

Introducción
24
Para obtener una red similar a la desarrollada por el gluten en la
producción de pan, además de los hidrocoloides, las proteínas pueden ser
añadidas en las formulaciones (Marco y Rosell, 2008a), obteniéndose
adicionalmente el beneficio de mejorar el valor nutricional de los
productos. Los panes producidos a partir de la mezcla de almidones y
gomas con alguna proporción de harinas de cereales libres de gluten
tienen muy bajo contenido de proteínas y son deficientes en lisina. Las
proteínas de diversas fuente pueden ser añadidas con el objetivo de
introducir un agente estructurante, incrementar el valor nutricional de los
productos libres de gluten y mejorar la apariencia, el volumen y en
algunos casos los aspectos sensoriales del pan (Gallagher y col., 2003;
Moore y col., 2006; Crockett y col., 2011). Para incrementar el papel
estructurante de las proteínas se ha propuesto la combinación de
proteínas (albúmina de huevo, suero de leche) o aislados proteicos (soja y
guisantes) con enzimas entrecruzantes (transglutaminasa, glucosa
oxidasa) (Gujral y Rosell, 2004 a,b; Marco y col., 2007; Marco y Rosell,
2008 a,b) con miras a obtener panes con mejor calidad tecnológica y
nutricionalmente enriquecidos (Marco y Rosell, 2008c).
Recientemente, Crockett y col (2011) formularon panes libres de gluten a
partir de harina de arroz, almidón de tapioca, levadura instantánea, azúcar
y HPMC (methocel E15), con adición de aislado de proteína de soja
(APS) y clara de huevo en polvo (CHP). El estudio tuvo como objetivo
evaluar el efecto de la adición de APS y CHP sobre la distribución del
agua y las propiedades reológicas de las masas; así como caracterizar los

Introducción
25
atributos de calidad de los panes resultantes. Los resultados obtenidos en
el estudio permitieron concluir que la adición de APS a la mezcla harina-
almidón-HPMC redujo la estabilidad de la masa por supresión de la
funcionalidad del HPMC, alterando la distribución del agua dentro de la
masa, debilitando la interacción del HPMC con la matriz de almidón y
reduciendo la estabilidad de la espuma. Por otra parte, encontraron que
la adición de CHP produjo un efecto antagónico similar con el HPMC en
la masa. Sin embargo, a concentraciones de 15% de adición, la CHP se
convirtió en el principal estructurante de la masa y superó las
interacciones negativas con la HPMC. Se logró mediante la formación de
una matriz interconectada mejorar la regularidad en la miga y el volumen
del pan. Sin embargo, esta formulación requiere de optimización en el
sabor y la humedad percibida en el producto final.
Magdalenas
Contrariamente al pan, en la literatura hay un número limitado de
estudios en otros productos horneados libres de gluten, tales como pizzas,
pastas, galletas, pasteles, tartas y magdalenas (Turabi y col., 2008 a,b;
Gularte y col., 2011; Park y col., 2012; de la Hera y col., 2012). En todos
estos productos horneados también se utilizan mezclas de ingredientes
(almidones de trigo, maíz o patata, harinas de arroz o maíz y sus mezclas,
harina de soja, harinas de pseudocereales, gomas como guar o xantana,
proteínas de soja o huevo, y otros ingredientes propios de la formulación
de cada producto similares a los utilizados en la elaboración de panes
libres de gluten, pero en las proporciones que establecen las

Introducción
26
formulaciones y los procesos tecnológicos específicos (Gallagher, 2008;
Schober, 2009; Turabi y col., 2008).
Al igual que el pan libre de gluten, las magdalenas, tartas y otros
productos horneados libres de gluten son fabricados comercialmente
tratando de parecerse a aquellos hechos con harina de trigo. Sin embargo,
los productos de bollería comerciales sin gluten suelen presentan defectos
en la calidad sensorial (sabor, color, textura) y bajo valor nutritivo. Las
recetas de magdalenas, bizcochos y tartas sin gluten contienen harina de
arroz como ingrediente principal o almidones de diferentes fuentes
(arroz, maíz, patata y trigo); así como otros ingredientes (azúcar, polvo
de huevo o huevo líquido, leche, levadura, aceite vegetal, sal,
hidrocoloides y emulgentes) que contribuyen a mejorar la calidad final
del producto. En los últimos años se ha enfatizado la investigación en el
desarrollo de productos dulces sin gluten (tartas, pasteles y bizcochos),
con miras a mejorar su textura, sensación en la boca, aceptabilidad, vida
útil y calidad nutricional (Gularte y col., 2011; Park y col., 2012; de la
Hera y col., 2012). Otras investigaciones se han direccionado hacia la
evaluación del efecto de la adición de gomas e hidrocoloides sobre las
propiedades reológicas de las masas y la calidad tecnológica del producto
final (Turabi y col., 2008b; Ronda y col., 2011) y en la optimización de
procesos alternativos de horneado (Turabi y col., 2008a). Estudios
recientes han evaluado la incorporación de proteínas como aislados
proteico de soja (Ronda y col., 2011), harinas de soja y otras legumbres
(Gularte y col., 2011), huevo y remplazadores del huevo (Geera y col.,

Introducción
27
2011) en las formulación de este tipo de productos de repostería, con el
objetivo de mejorar su calidad nutricional. Los resultados reportados en
todos estos trabajos dejan ver que en la mayoría de los casos se han
obtenido productos finales de calidad aceptable, sin embargo aún
prevalecen algunos defectos tecnológicos y de calidad sensorial (sabor,
color, textura).
Las magdalenas son un tipo de producto horneado que se consumen
popularmente en el desayuno o merienda. Son productos de bollería
dulces, y con alto nivel calórico, muy apreciados por los consumidores
debido a su sabor y textura suave. La receta tradicional española de
magdalenas se basa principalmente en harina de trigo, azúcar, aceite
vegetal, huevo y leche (Sanz y col., 2009). En muchos productos de
repostería, tales como bizcochos, pasteles, “muffins” o magdalenas no es
deseable el completo desarrollo del gluten, en lugar de ello son los
ingredientes como el huevo, la grasa y el azúcar quienes juegan un papel
primordial en el logro de la estructura física del producto final. Esta es
una ventaja cuando se trata de diseñar productos de bollería libres de
gluten. A priori, es esperable que la formulación y elaboración de
magdalenas a partir de harinas libres de gluten presente menos
problemas, en todo caso las limitaciones tecnológicas pueden derivarse
más de las formulaciones que de la necesidad del desarrollo del gluten.
En estos productos, otros aspectos, tales como el color y el sabor
deseados, son los que constituyen el principal reto (Schober, 2009).
Existe escasa información relacionada con la producción de magdalenas
libres de gluten. Schamne y col. (2010) formularon magdalenas

Introducción
28
utilizando harina de arroz y almidones de maíz y tapioca y derivados de
soja para obtener aceptación sensorial y buen valor nutricional del
producto. La formulación óptima para la aceptación sensorial fue 20% de
harina de arroz, 30% de almidón de tapioca y 50% de almidón de maíz.
La adición de concentrado de soja incremento el contenido de proteínas
sin alterar la calidad sensorial de las magdalenas. Geera y col. (2011)
evaluaron el efecto del reemplazo del huevo en la formulación de
magdalenas, utilizaron huevo líquido, huevo en polvo y tres tipos
diferentes de reemplazadores de huevo comerciales. Las características
físicas (color, textura. volumen y altura) y las propiedades sensoriales de
las magdalenas fueron evaluadas. Los resultados indicaron que no fue
posible el reemplazo del 100% del huevo en las formulaciones, debido a
que no se obtiene las características deseadas para la aceptabilidad de las
magdalenas. Sin embargo, se desconoce el papel de las proteínas en este
tipo de sistemas libres de gluten.
De la revisión y análisis de la información científica disponible en la
literatura consultada se desprende que aunque se ha estudiado el
comportamiento de las masas sin gluten y las características de los
productos finales, en ninguna de las investigaciones previamente citadas
se han obtenido conclusiones, ni se han establecido relaciones que
permitan predecir las características del producto final, partiendo de los
resultados obtenidos en la optimización de las formulaciones y los
procesos.
Introducción
29
Únicamente, Pagliarini y col. (2010) describieron la existencia de una
buena correlación entre las mediciones sensoriales y las instrumentales
utilizadas para identificar los descriptores sensoriales que mejor pudieran
caracterizar panes libres de gluten. Las variables más significativas que
permitieron discriminar entre las muestras fueron los descriptores
sensoriales porosidad, color de la corteza y de la miga, suavidad al tacto
y en la boca, olor a queso, olor a maíz y olor a fermentado, dulce, salado,
adhesivo y gomoso; mientras que los parámetros instrumentales fueron
los asociados al color de la corteza y de la miga y la textura.
Por otra parte existe un considerable número de investigaciones dirigidas
al diseño de formulaciones con diversos sustitutos del trigo que evalúan
las propiedades tecnológicas y en algunos casos los atributos sensoriales
que determinan la calidad del producto final (Ahlborn y col.,2005; Brites
y col., 2010; Torbica y col., 2010; Sabanis y Tzia, 2011; Laureati y col.,
2012), sin embargo no se han encontrado estudios que separada o
simultáneamente evalúan la calidad nutricional de los productos finales
provenientes de las formulaciones diseñadas.
En general se puede decir, que es evidente la escasa atención que se ha
dado al estudio nutricional de los panes libres de gluten provenientes de
los numerosos desarrollos encontrados en la literatura consultada, a pesar
de que este aspecto es uno de los que presenta más necesidad de
evaluación considerando que en general los productos libres de gluten
presentan un desequilibrio en el contenido de nutrientes (Thompson y
col, 2005) y en consecuencia considerables deficiencias nutricionales
(Catassi y Fasano, 2008; Thompson y col., 2005).

Introducción
30
Por todo lo antes expuesto, en el presente estudio se evaluaron
nutricionalmente tanto muestras de panes comerciales como aquellas
desarrolladas a nivel de laboratorio. Adicionalmente se puso especial
énfasis primeramente en establecer relaciones entre los parámetros
instrumentales de calidad y las características sensoriales de muestras
comerciales de panes libres de gluten. Y en segundo lugar en establecer
posibles indicadores de calidad a través de la relación entre las
características reológicas de la masa y las propiedades tecnológicas y
sensoriales del producto tipo pan obtenido a partir de formulaciones
complejas basadas en harina de arroz y diferentes tipos de proteínas, las
cuales fueron diseñadas para tal fin. Finalmente se diseñaron
formulaciones dulces para obtener productos horneados no fermentados
del tipo magdalenas, a partir de mezclas complejas basadas en harina de
arroz y diferentes tipos de proteínas, con miras a ampliar el
entendimiento de la función de las proteínas sobre la reología de las
masas-batidas y las propiedades de calidad del producto obtenido,
considerando el doble papel, tanto nutricional como funcional que tienen
las proteínas en estos sistemas.
Referencias
Ahlborn GJ, Pike OA, Hendrix SB, Hess WM, Huber CS. 2005. Sensory,
mechanical, and microscopic evaluation of staling in low-protein and
gluten-free breads. Cereal Chemistry 82, 328-335.
Introducción
31
Arendt EK, Morrissey A, Moore MM, Dal Bello F. 2008. Gluten-free
breads. In: Gluten-free Cereal Products and Beverages, 1st. Eds Arendt
E.K, Dal Bello F. 2008. Academic Press Elsevier, London, UK. ISBN:
978-0-12373739-7. Pp 289-320.
Brites C, Trigo MJ, Santos C, Collar C, Rosell CM. 2010. Maize-based
gluten-free bread: Influence of processing parameters on sensory and
instrumental quality. Food Bioprocess Technology 3, 707-715.
Brussone CM, Asp EH. 1999. The cereal science and disease etiology of
gluten-sensitive enteropathy. Cereal Foods World 44, 109-114.
Calderón de la Barca AM, Rojas-Martínez ME, Islas-Rubio AR, Cabrera-
Chávez F. 2010. Gluten-free breads and cookies of raw and popped
amaranth flours with attractive technological and nutritional qualities.
Plants Foods For Human Nutrition 65,241–246.
Catassi C , Fassano A. 2008. Celiac disease. In: Gluten-Free Cereal
Products and Beverages. Eds Arendt EK, Dal Bello F. 2008. Academic
Press Elsevier, London, UK. ISBN: 978-0-12373739-7. Pp: 1-27.
Catassi C, Yachha SK. 2009. The epidemiology of celiac disease. In: The
science of gluten-free foods and beverages. Eds Arendt E.K, Dal Bello F.
2009. MN,USA: AACC International. Pp: 1-13.
Codex standard for foods for special dietary use for persons intolerant to
gluten. CODEX STAN 118 – 1979. Pp1-3
(http://www.codexalimentarius.net)
Comino I, Real A, de Lorenzo L, Cornell H, López-Casado MA, Barro F,
Lorite P, Torres MI, Cebolla A, Sousa C. 2011. Diversity in oat potential
Introducción
32
immunogenicity: basis for the selection of oat varieties with no toxicity
in coeliac disease. Gut 60, 915-922. DOI:10.1136/gut.2010.225268.
Crockett R, Ie Pauline, Vodavotz Y. 2011. Effects of soy protein isolate
and egg white solids on the physicochemical properties of gluten-free
bread. Food Chemistry 129, 84–91.
Cureton P, Fasano A. 2009. The increasing incidence of celiac disease
and the range of gluten-free products in the marketplace. In: Gluten-free
Food Science and Technology. Ed. Gallagher E. 2009. Wiley-Blackwell
Publishing, Oxford, UK. Pp 1-15. ISBN: 978-1-4054-5915-9.
de la Hera E, Martinez M, Oliete B, Gómez M. 2012. Influence of Flour
article Size on Quality of Gluten-Free Rice Cakes. Food Bioprocess
Technology. DOI 10.1007/s11947-012-0922-6.
Demirkesen I, Mert B, Sumnu G, Sahin S. 2010. Rheological properties
of gluten-free bread formulations. Journal of Food Engineering 96, 295-
303.
Don C, Lichtendonk WJ, Pfijter JJ, Hamer RJ. 2003. Glutenin
macropolymer: a gel formed by glutenin particles. J Cereal Sci. 37, 1-7.
Farrell, RJ, Kelly, CP. 2001. Celiac sprue. The American Journal of
Gastroenterology 96: 3237-3246.
Gallagher E, Gormley TR, Arendt EK. 2004. Recent advances in the
formulation of gluten-free cereal-based products. Trends in Food Science
and Technology 15, 143-152.
Gallagher E, Kunkel A, Gormley TR, Arent, EK. 2003. The effect of
dairy and rice powder addition on loaf and crumb characteristics, and

Introducción
33
shelf life (intermediate and long-term) of gluten-free stored in a modified
atmosphere. European Food Research and Technology 218, 44-48.
Gallagher E. 2008. Formulation and nutritional aspects of gluten-free
cereal products and infant foods. In: Gluten-free Cereal Products and
Beverages, First ed. Eds Arendt E.K, Dal Bello F. 2008. Academic Press
Elsevier, London, UK. ISBN: 978-0-12373739-7. Pp: 321-346.
Geera B, Reiling JA, Hutchison MA, Rybak D, Santha B, Ratnayake WS.
2011. A comprehensive evaluation of egg and egg replacers on the
product quality of muffins. Journal of Food Quality 34, 333–342.
Gómez M, León AE, Rosell, CM. 2007. Trigo. En: De tales harinas, tales
panes. Granos, harina y productos de panificación en Iberoamérica. Leon,
AE- Rosell CM (Editores). Cap1. ISBN 97898771311071.
Gujral H, Haros M, Rosell CM. 2004c. Improving the texture and
delaying staling in rice flour chapati with hydrocolloids and alfa-
amylase. Journal Food Engineering 65, 89-94.
Gujral H, Rosell CM. 2004a. Functionality of rice flour modified by
microbial transglutaminase. Journal Cereal Science 39, 225-230.
Gujral H, Rosell CM. 2004b. Improvement of the breadmaking quality of
rice flour by glucose oxidase. Food Research International 37, 75-81.
Gujral HS, Guardiola I, Carbonell JV, Rosell CM. 2003a. Effect of
cyclodextrin glycoxyl transferase on dough rheology and bread quality
from rice flour. Journal Agriculture Food Chemistry 51, 3814-3818.
Gujral HS, Haros M, Rosell CM. 2003b. Starch hydrolyzing enzymes for
retarding the staling of rice bread. Cereal Chemistry 80, 750-754.
Introducción
34
Gularte MA, Gómez M, Rosell CM. 2011. Impact of legume flours on
quality and in vitro digestibility of starch and protein from gluten-free
cakes. Food Bioprocess Technology: An International Journal 5, 3142-
3150.
Hamer RJ. 2005. Coeliac disease: background and biomedical aspect.
Biotechnology Advances 23, 401-408.
Hoseney RC. 1986. Principles of Cereal Science and Technology, 2nd
edn. P. 327. Minnesota, USA: American Association of Cereal Chemists,
Inc.
Houben A, Höchstötter A, Becker T. 2012. Possibilities to increase the
quality in gluten-free bread production: an overview. European Food
Research and Technology 235,195–208. DOI 10.1007/s00217-012-1720-
0
Hüttner, EK, Arendt EK. 2010. Recent advances in gluten-free baking
and the current status of oats. Trends in Food Science and Technology
21, 303-312.
Kadan RS, Robinson MG, Thibodeaux DP, Pepperman AB.
2001.Texture and other physicochemical properties of whole rice bread.
Journal of Food Science 66, 940-944.
Khan K, Nygard G. 2006. Gluten. In: Bakery Products. Science and
Technology. Ed Y.H. Hui. 2006. Blackwell Publishing, Ames, Iowa.
USA. Pp: 97-122. ISBN: 978-0-8138-0187-2
Introducción
35
Korus J, Witczak M, Ziobro R, Juszczak L. 2009. The impact of resistant
starch on characteristics of gluten-free dough and bread. Food
Hydrocolloids 23, 988–995.
Krupa U, Rosell CM, Sadowska J, Soral-Śmietana M. 2110. Bean starch
as ingredient for gluten free bread. Journal of Food Processing and
Preservation 34, 501-518.
Laureati M, Giussani B, Pagliarini E. 2012. Sensory and hedonic
perception of gluten-free bread: Comparison between celiac and non-
celiac subjects. Food Research International 46, 326–333.
Lazaridou A, Duta D, Papageorgiou M, Belc N, Biliaderis CG. 2007.
Effects of hydrocolloids on dough rheology and bread quality parameters
in gluten-free formulations. Journal of Food Engineering 79, 1033-1047.
Leatherhead Food Research. 2012. Reporte de Leatherhead. Alergías e
intolerancias alimentarias: percepciones de los consumidores y
oportunidades de mercado para los alimentos “libres de”.
(www.leatherheadfood.com/).
Marco C, Rosell, CM. 2008c. Modification of rice proteins functionality
by crosslinking with different protein isolates. Journal of Food
Engineering 84, 132-139.
Marco C, Rosell CM. 2008a. Breadmaking performance of protein
enriched, gluten-free breads. European Food Research and Technology
227, 1205-1213.
Marco C, Rosell CM. 2008b. Functional and rheological properties of
protein enriched gluten-free composite flours. Journal of Food
Engineering 88, 94-103.
Introducción
36
Marco C, Pérez G, Ribotta P, Rosell, CM. 2007. Effect of microbial
transglutaminase on the protein fractions of rice, pea and their blends.
Journal of Science Food Agriculture 87, 2576–2582.
Mariotti M, Lucisano M, Pagani MA, Ng PKW. 2009. The role of corn
starch, amaranth flour, pea isolate, and Psyllium flour on the rheological
properties and the ultrastructure of gluten-free doughs. Food Research
International 42, 963–975.
Mariotti M, Pagani MA, Lucisano M. 2013. The role of buckwheat and
HPMC on the breadkmaking properties of some comercial gluten-free
bread mixtures. Food Hydrocolloids 30, 393-400.
McCarthy DF, Gallagher E, Gormley TR, Schober TJ, Arendt EK. 2005.
Application of response surface methodology in the development of
gluten-free bread. Cereal Chemistry 82, 609-615.
Moore MM, Heinbockel M, Dockery P, Ulmer HM, Arendt EK .2006.
Network formation in gluten-free bread with application of
transglutaminase. Cereal Chemistry 83, 28-36.
Mustalahti K, Catassi C, Reunanen A, Fabiani E, Heier M, McMillan S,
Murray L, Metzger MH, Gasparin M, Bravi E, Mäki M. 2010. The
prevalence of celiac disease in Europe: results of a centralized,
international mass screening project. Coeliac EU Cluster, Project
Epidemiology. Annals of Medicine 42, 587-95. DOI:
10.3109/07853890.2010.505931.
Nachay K. 2010. Gluten-free offerings increase. Food Technology 64,
13-14.

Introducción
37
National Institute for Health and Clinical Excellence (NICE) 2009.
Coeliac disease: recognition and assessment of coeliac disease (NICE
guideline). (www.nice.org.uk).
O'Neill, J.O. 2010. Foods: Trends, Challenges, and Solutions. Cereal
Foods World 55, 220-223.
Onyango C, Mutungi C, Unbehend, G, Lindhauer, MG. 2011.
Modification of gluten-free sorghum batter and bread using maize,
potato, cassava or rice starch. LWT - Food Science and Technology 44,
681-686.
Packaged Facts. 2011. Gluten-Free Foods and Beverages in the U.S., 4th
Edition. Packaged Facts October 17, 2012, 168 Pages - SKU:
LA4880536 (http://www.marketresearch.com).
Pagliarini E, Laureati M, Lavelli V. 2010. Sensory evaluation of gluten-
free breads assessed by a trained panel of celiac assessors. European
Food Research and Technology 231, 37-46. DOI 10.1007/s00217-010-
1249-z.
Park SJ, Ha Ki-Y, Shin M. 2012. Properties and Qualities of Rice Flours
and Gluten-free Cupcakes Made with Higher-yield Rice Varieties in
Korea. Food Science Biotechnology 21, 365-372. DOI 10.1007/s10068-
012-0048-7.
Pruska-Kędzior A, Kędzior Z, Gorący M, Pietrowska K, Przybylska A,
Spychalska K. 2008. Comparison of rheological, fermentative and baking
properties of gluten-free dough formulations. European Food Research
and Technology 227, 1523-1536.

Introducción
38
Reglamento (CE) No 41/2009 de la Comisión de las Comunidades
Europeas (vigente a partir del 2012).
Ronda F, Oliete B, Gómez M, Caballero PA, Pando V. 2011. Rheological
study of layer cake batters made with soybean protein isolate and
different starch sources. Journal of Food Engineering 102, 272–277.
Rosell CM, Cortez G, Repo-Carrasco R. 2009. Breadmaking use of the
Andean crops quinoa (Chenopodium quinoa), kañiwa (Chenopodium
pallidicaule), kiwicha (Amaranthus caudatus), and tarwi (Lupinus
mutabilis). Cereal Chemistry 86, 386-392.
Rosell CM, Gómez M. Rice. In: Bakery products: Science and
Technology. Ed Y.H. Hui. 2006. Blackwell Publishing, Ames, Iowa.
USA. Pp 123-133. ISBN: 978-0-8138-0187-2.
Rosell CM. Enzymatic manipulation of gluten-free bread. In: Gluten-free
Food Science and Technology. Ed E. Gallagher. 2009. Wiley-Blackwell
Publishing Ltd, Oxford, UK. ISBN: 9781405159159. Pp: 83-98.
Sabanis D, Lebesi D, Tzia C. 2009. Effect of dietary fibre enrichment on
selected properties of gluten-free bread. LWT-Food Science and
Technology 42, 1380–1389.
Sabanis D, Tzia C. 2011. Effect of hydrocolloids on selected properties
of gluten-free dough and bread. Food Science and Technology
International 17, 279-291. DOI: 10.1177/1082013210382350.
Sanz T, Salvador A, Baixauli R, Fiszman SM. 2009. Evaluation of four
types of resistant starch in muffins. II. Effects in texture, colour and
Introducción
39
consumer response. European Food Research and Technology 229, 197–
204. DOI 10.1007/s00217-009-1040-1.
Schamne C, Dutcosky SD, Demiate IM. 2010. Obtention and
characterization of gluten-free baked products. Ciência e Tecnologia de
Alimentos, Campinas 30, 741-750.
Schober, TJ. Manufacture of gluten-free specialty breads and
confectionery products. In: Gluten-free Food Science and Technology.
Ed. Gallagher E. 2009. Wiley-Blackwell Publishing, Oxford, UK. Pp
130-176. ISBN: 978-1-4054-5915-9.
Sciarini LS, Ribotta PD, León AE, Pérez GT. 2010. Influence of gluten-
free flours and their mixtures on batter properties and bread quality. Food
Bioprocess Technology 3, 577–585. DOI: 10.1007/s11947-008-0098-2.
Sciarini LS, Ribotta PD, León AE, Pérez GT. 2012b. Incorporation of
several additives into gluten free breads: Effect on dough properties and
bread quality. Journal of Food Engineering 111, 590–597.
Sciarini LS, Pérez GT, Lamballerie M, León AE, Ribotta PD. 2012a.
Partial-Baking Process on Gluten-Free Bread: Impact of Hydrocolloid
Addition. Food Bioprocess Technology 5, 1724–1732. DOI
10.1007/s11947-011-0529-3.
Smith BM, Bean SR, Herald TJ, Aramouni FM. 2012. Effect of HPMC
on the Quality of Wheat-Free Bread Made from Carob Germ Flour-
Starch Mixtures. Journal of Food Science 77, 684-689.
Thompson T. 2000. Folate, iron and dietary fiber contents of the gluten
free diet. Journal American Diet Association 100, 1389-1396.

Introducción
40
Thompson T, Dennis M, Higgins LA, Lee AR, Sharret MK (2005)
Gluten-free diet survey: are Americans with celiac disease consuming
recommended amounts of fibre, iron, calcium and grain foods? Journal of
Human Nutrition and Dietetics 18,173–179.
Torbica A, Hadnadev M, Dapčević T. 2010. Rheological, textural and
sensory properties of gluten-free formulations based on rice and
buckwheat flour. Food Hydrocolloids 24, 626-632.
Turabi E, Sumnu G, Sahin S. 2008b. Optimization of baking of rice
cakes in infrared-microwave combination oven by response surface
methodology. Food and Bioprocess Technology 1, 64–73. DOI:
10.1007/s11947-007-0003-4.
Turabi E, Sumnu G, Sahin S. 2008a. Rheological properties and quality
of rice cakes formulated with different gums and an emulsifier blend.
Food Hydrocolloids 22, 305–312.
Wrigley CW, Bietz JA. 1988. Proteins and amino acids. In: Wheat:
Chemistry and Technology, 3er edition, Vol. 1. Ed. Pomeranz Y. St.
Paul, MN: American Association of Cereal Chemists. Pp. 159-275.
Xu J, Bietz JA, Carriere CJ. 2007. Viscoelastic properties of wheat
gliadin and glutenin supensions. Food Chemistry 101, 1025-1030.
Direcciones WEB
-Packaged Facts, a division of MarketResearch.com.
http://www.marketresearch.com/Packaged-Facts-v768/Gluten-Free-
Foods-Beverages-Edition-7144767/ (último acceso: 14/12/12).
Introducción
41
-International Wheat Gluten Association (IWGA): http://www.iwga.net.
CODEX ALIMENTARIO: http://www.codexalimentarius.net (ultimo
acceso: 12/12/12).
-National Center for Biotechnology Information (NCBI):
http://www.ncbi.nlm.nih.gov/pubmed/21070098. (último acceso:
18/12/12).
-National Institute for Health and Clinical Excellence (www.nice.org.uk)
http://www.cks.nhs.uk/coeliac_disease/background_information/prevalen
ce (último acceso18/12/12).
-Sociedad Española de la Enfermedad Celiaca(SEEC)
http://www.seec.es/noticiasver.php?not_id=23 ). Resumen II Congreso
de la Sociedad Española de Enfermedad Celíaca, Arona (Tenerife), 25-27
noviembre 2010 (último acceso: 18/12/12).
-www.innovadatabase.com (último acceso: 14/12/12).
-http://www.leatherheadfood.com/ (último acceso: 14/12/12).
-http://www.clubdarwin.net/seccion/ingredientes/los-productos-libres-de-
gluten-estan-en-auge (último acceso: 14/12/12).
-http://www.marketwire.com/press-release/us-market-for-gluten-free
foods-reached-26-billion-in-2010-1400404.htm (último acceso:
14/12/12).

OBJETIVOS

Objetivos
45
Objetivo General
Formular, desarrollar y caracterizar productos horneados libres de gluten
elaborados a base de harina de arroz y enriquecidos con proteínas.
Objetivos Específicos
• Identificar el patrón de calidad instrumental, nutricional y sensorial de
los productos libres de gluten comerciales tipo pan. Este objetivo incluye
evaluar la calidad nutricional (composición química, contenido de fibra
dietética y digestibilidad del almidón) de muestras comerciales de panes
libres de gluten consumidos en España; y establecer posibles relaciones
entre parámetros instrumentales de calidad y características sensoriales
de panes libres de gluten.
• Definir posibles predictores de calidad de los productos libres de gluten
tipo pan a través de la relación entre las características reológicas de la
masa y las propiedades tecnológicas y sensoriales del producto horneado
obtenido. Asimismo, diseñar formulaciones complejas basadas en harina
de arroz y diferentes tipos de proteínas para obtener productos horneados
libres de gluten tipo pan, con miras a evaluar el efecto de la incorporando
de las proteínas sobre las propiedades reológicas de las masas
formuladas.
• Investigar la funcionalidad de las proteínas en productos dulces libres
de gluten, especialmente sobre la reología de las masas-batidas y las
propiedades de calidad de los productos tipo magdalenas obtenidos. Este
objetivo incluyó el diseño de formulaciones complejas basadas en harina

Objetivos
46
de arroz y diferentes tipos de proteínas para obtener productos libres de
gluten dulces no fermentados tipo magdalenas.
CAPÍTULO 1
CHEMICAL COMPOSITION AND STARCH
DIGESTIBILITY OF DIFFERENT GLUTEN-FREE
BREADS
María E. Matos and Cristina M. Rosell
Plant Food for Human Nutrition 66 (2011) 224-230

CAPÍTULO 1
49
Abstract
The increasing demand for gluten free products has favoured the design of
numerous gluten free bakery products which intended to mimic the quality
characteristics of wheat bakery products. The objective of this study was to
evaluate the nutritional pattern of gluten free breads representative of the
Spanish market for this type of products. The protein, fat and mineral
content of the gluten free breads showed great variation, ranging from
0.91g/100g to 15.05g/100g, 2.00g/100g-26.10g/100g and 1.10g/100g to
5.43g/100g, respectively. Gluten free breads had very low contribution to
the recommended daily protein intake, with a high contribution to the
carbohydrate dietary reference intake. Dietary fiber content also showed
great variation varying from 1.30g/100g to 7.20g/100g. In vitro enzymatic
hydrolysis of starch showed that the most predominant fraction was the
rapidly digestible starch that varied from 75.6 g/100g to 92.5g/100g.
Overall, gluten free breads show great variation in the nutrient composition,
being starchy based foods low in proteins and high in fat content, with high
glycaemic index.
Key words Gluten free bread, Nutrient composition, Fibers, Starch
digestibility.

CAPÍTULO 1
50
1. Introduction
Bread has been regarded for centuries as one of the most popular and
appealing food product both because of its relative high nutritional value
and its unique sensory characteristics (texture, taste, and flavor). However,
an increasing number of individuals are suffering from celiac disease (CD),
the life-long intolerance to the gluten fraction of wheat, rye and barley. In
particular, celiac patients are intolerant to some cereal prolamins containing
specific toxic oligopeptide sequences. The gliadin fraction of wheat,
secalins of rye, hordeins of barley, and possibly avenins of oats are involved
in the CD mechanism.
In CD patients, ingestion of gluten leads to inflammation and mucosal
damage of the small intestine. The typical lesion in the small intestinal
epithelium is villous atrophy with crypt hyperplasia, leading to
malabsorption of most nutrients including iron, folic acid, calcium, and fat-
soluble vitamins [1]. This can lead to associated diseases such as
osteoporosis, anaemia and type I diabetes and skin disorders [2]. An
acceptable treatment is strict adherence to a 100g/100g gluten-free diet for
life, which results in clinical and mucosal recovery. Nevertheless, the
manufacture of bread without gluten results in major problems for bakers,
and currently, many gluten free products available on the market are of low
quality.
In recent years there has been increasing interest on gluten-free breads. A
large number of flour and starches as well as many ingredients such as
gums, enzymes, soybean proteins, and have been used to mimic the
viscoelastic properties of gluten and contribute to improved structure

CAPÍTULO 1
51
mouthfeel, acceptability, and shelf life of gluten free breads [3-6]. In such
studies various technological parameters and formulations have been
extensively investigated for making good quality gluten free bread.
However, the nutritional concept of the gluten free baked goods has been
scarcely addressed. Some approaches have considered the use of mixed
amaranth flours for making gluten free breads and cookies [7] or even
blends of plantain and legume flours [8], obtaining gluten free products with
high nutritional value and acceptable quality , and also protein enrichment
of gluten free breads has been carried out by incorporating soy protein
isolates [9].
Historically, nutrition counseling for celiac disease has focused on the foods
to avoid in a gluten free diet but they should be advised on the nutritional
quality of gluten- free. There are growing concerns over the nutritional
adequacy of the GF dietary pattern because it is often characterized by an
excessive consumption of proteins, and fats, and a reduced intake of
complex carbohydrates, dietary fibre, vitamins and minerals [1,10] . As a
consequence, the long life adherence to gluten free products has been
associated to undernourished and also minerals deficiencies that could
conduct to anemia, osteopenia or osteoporosis [10].
The aim of this work was to evaluate the nutritional pattern of gluten free
breads regarding their chemical composition in order to determine their
contribution to the daily intake of nutrients. Special emphasis has been
addressed to the fiber content of those breads and also to the in vitro starch
digestibility due to their always high content in starch.
CAPÍTULO 1
52
2. Materials and Methods
2.1. Materials
Gluten-free breads (GFB) from the major brands of these specialties were
acquired in the Spanish market. Those breads were representative of the
most consumed products in Spain. Eleven kinds of gluten-free breads were
selected and purchased in general and specialized supermarkets. Duplicates
of each sample from different batch were used for the characterization.
Information on the ingredient composition, according to the labeling, is
given in Table 1. α-Amylase from porcine pancreas (Pancreatin, Cat. No. P-
1625, activity 3_USP/g) was purchased from Sigma Chemical Company (St.
Louis, MO, USA). Amyloglucosidase (EC 3.2.1.3., 3300 U/mL) and
glucose oxidase–peroxidase assay kit GOPOD (Cat. No. K-GLUC) were
purchased from Megazyme (Megazyme International Ireland Ltd., Bray,
Ireland).
2.2. Analytical methods
The chemical composition of GFB samples was determined according to
ICC corresponding standard methods [11]. Total carbohydrates were
determinate by difference subtracting 100 g minus the sum of protein, ash
and fat expressed in grams/100 grams [12]. For the estimation of dietary
fiber, samples were finally powdered to pass through a sieve of 250 µm.
Total dietary fiber (TDF), insoluble dietary fiber (IDF) and soluble dietary
fiber (SDF) contents were determined following the AACC method [13]
AACC International (2000) . Determinations were done in triplicate for
obtaining mean values.

CAPÍTULO 1
53
2.3. In vitro starch digestibility and estimated glycaemic index
Gluten free breads were frozen, freeze-dried and ground in a blender. Starch
digestibility of gluten free bread was determined in the powders using
AACC methods [13], with the modification reported by Gularte and Rosell
[14]. According to the hydrolysis rate of starch, three different fractions
were quantified as suggested Englyst et al. [15]. Rapidly digestible starch
(RDS) was referred to the percentage of total starch that was hydrolyzed
within 30 min of incubation, slowly digestible starch (SDS) was the
percentage of total starch hydrolyzed within 30 and 120 min, and resistant
starch (RS) was the starch remaining unhydrolyzed after 16 h of incubation.
The percentage of total starch hydrolyzed at 90 minutes (H90) was also
calculated.
The in vitro digestion kinetics was calculated in accordance with the
procedure established by Goñi et al. [16]. A non-linear model following the
equation [C = C∞(1 – e-kt)] was applied to describe the kinetics of enzymatic
hydrolysis, where C was the concentration at t time, C∞ was the equilibrium
concentration or maximum hydrolysis extent, k was the kinetic constant and
t was the time chosen. The hydrolysis index (HI) was obtained by dividing
the area under the hydrolysis curve (0–180 min) of the sample by the area of
a standard material (white bread) over the same period of time. The
expected glycaemic index (eGI) was calculated using the equation described
by Granfeldt et al. [17]: eGI = 8.198 + 0.862HI.
2.4. Statistical analysis
CAPÍTULO 1
54
The results were expressed as mean values ± standard deviation. Datawere
analyzed using one-way analysis of variance (ANOVA) to determine
whether there was significant difference between gluten-free breads types
by using Statgraphics Plus V 7.1 program (Statistical Graphics Corporation,
UK). Fisher’s least significant differences (LSD) test was used to
differentiate means with 95% confidence.
3. Results and discussion
3.1. Chemical Composition
Commercial gluten free breads, according to suppliers’ information (Table
1), were based on corn starch, potato starch, or rice flour, either enriched
with milk solids, soy protein, eggs or lupine proteins. All of them contained
corn starch as main ingredient, with the exception of GFB4 that was based
on potato starch and GFB6 also contained rice flour. Other differences
among breads were encountered in the protein
source. Eggs were the most common source of proteins, but also caseinate
(GFB4), soy (GFB4) or lupine proteins (GFB6) were present.
Some types of bread (GFB8, GFB9, GFB10 and GFB11) did not contain
any source of proteins among the ingredients. Vegetable oil or margarine
was present in the formulations, with exception of GFB8 and GFB9 that did
not contain any fat source. Yeast and raising agents were used in
combination as leaving agents, with the exception of GFB2, GFB3 and
GFB4 that only contained yeast. In addition, salt, emulsifiers,

CAPÍTULO 1
55
Table 1. Ingredients in gluten free breads (GFBs) according to the producer
labelling.
Product code Ingredients
GFB1
Corn starch, water, sugar, egg, vegetal margarine, acidifier, preservative, aromas and colorant, yeast, thickener, emulsifier, salt, preservative, raising agents, antioxidants. May contain traces of soy.
GFB2
Corn starch, water, vegetal margarine, emulsifiers, salt, acidifier, preservative, antioxidants, aromas and colouring (betacarotene), egg, sugar, yeast, dextrose, humidifier, stabilizers, salt.
GFB3 Corn starch, water, vegetal margarine, emulsifiers, salt, acidifier, preservative, antioxidants, aromas and colorant, egg, sugar, yeast, dextrose, humidifier, stabilizers, salt.
GFB4 Potato starch, water, corn starch, caseinate (milk protein), sugar, vegetal oil, corn flour, yeast, soy protein, stabilizers, salt, preservative.
GFB5
Corn starch, water, sugar, egg, vegetal margarine, acidifier, preservative, aromas and colorant, stabilizers, yeast, emulsifiers, salt, raising agents, anise, cinnamon, and antioxidant.
GFB6 Corn starch, water, rice flour, vegetal oil, sugar, stabilizer, lupine protein, yeast, salt, vegetal fibre, aroma, emulsifiers.
GFB7 Corn starch, water, sugar, egg, vegetal margarine, acidifier, preservative, aromas and colorant, yeast, thickener, emulsifier, salt, raising agents, antioxidants. May contain traces of soy.
GFB8
Corn starch, water, sugar, yeast, thickeners, salt, raising agent, preservative.
GFB9 Corn starch, water, sugar, thickeners, emulsifier, salt, yeast, preservative, raising agents, antioxidants. May contain traces of egg.
GFB10 Corn starch, vegetal margarine, salt, sugar, emulsifier, raising agents, antioxidant, thickener, preservative, and yeast.
GFB11 Corn starch, vegetal margarine, salt, sugar, emulsifier, raising agents, antioxidant, thickener, preservative, and yeast.

CAPÍTULO 1
56
preservatives and a variety of other food grade additives were present in the
formulations. There was important significant differences (p<0.05)
among the proximate composition of all the GFB samples (Table 2). The
protein content of GBF, which ranged from 0.91g/100g to 15.05g/100g, was
found to be the highest in GFB4 while GFB9 closely followed by GFB8
showed the lowest values. This increase in the protein content must be
associated to the presence of milk and soy proteins in the formulation, since
those ingredients are used as protein sources in gluten free breads [9, 18].
GFB8 and GFB9 presented the lowest values of fat content (2.00g/100g),
which agrees with the absence of fat ingredient in the formulation.
Conversely, GFB10 showed the highest fat value (26.10g/100g), followed
by GFB11, GFB2 and GFB3 due to the contribution of the vegetal oil or
margarine in these gluten free bread formulations. Large variations were
observed in ash contents that ranged from 1.10g/100g to 5.43g/100g. GFB9
had the highest ash content, mainly derived from the level of salt. The total
carbohydrate content varied from 68.42g/100g to 92.96g/100g. The different
proximal composition of GFB commercial samples studies could be affected
by many factors such as the wide range of complex ingredients added and
their combinations, besides the additives used to improve the structure,
mouthfeel, acceptability and shelf-life of these products [4, 9].
Recently, Yazynima et al. [19] reported the nutritional composition of two
kinds of gluten free crispy breads, which contained 3.5-6.0g/100g of
proteins, 3.0-6.5g/100g of fats and 80-71g/100g of carbohydrates. The
present study shows that marketed gluten free breads are carbohydrate
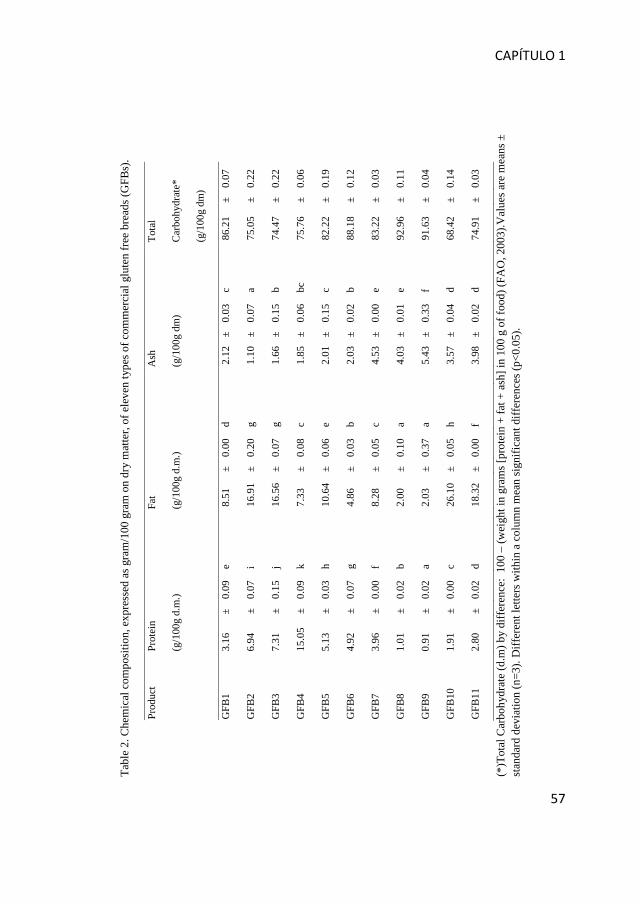
CAPÍTULO 1
57
Tabl
e 2.
Che
mic
al c
ompo
sitio
n, e
xpre
ssed
as g
ram
/100
gra
m o
n dr
y m
atte
r, of
ele
ven
type
s of c
omm
erci
al g
lute
n fr
ee b
read
s (G
FBs)
.
Prod
uct
Prot
ein
(g/1
00g
d.m
.)
Fat
(g/1
00g
d.m
.)
A
sh
(g/1
00g
dm)
Tot
al
Car
bohy
drat
e*
(g/1
00g
dm)
GFB
1 3.
16
± 0.
09
e
8.51
±
0.00
d
2.
12
± 0.
03
c 86
.21
± 0.
07
GFB
2 6.
94
± 0.
07
i
16.9
1 ±
0.20
g
1.
10
± 0.
07
a 75
.05
± 0.
22
GFB
3 7.
31
± 0.
15
j
16.5
6 ±
0.07
g
1.
66
± 0.
15
b 74
.47
± 0.
22
GFB
4 15
.05
± 0.
09
k
7.33
±
0.08
c
1.
85
± 0.
06
bc
75.7
6 ±
0.06
GFB
5 5.
13
± 0.
03
h
10.6
4 ±
0.06
e
2.
01
± 0.
15
c 82
.22
± 0.
19
GFB
6 4.
92
± 0.
07
g
4.86
±
0.03
b
2.
03
± 0.
02
b 88
.18
± 0.
12
GFB
7 3.
96
± 0.
00
f
8.28
±
0.05
c
4.
53
± 0.
00
e 83
.22
± 0.
03
GFB
8 1.
01
± 0.
02
b
2.00
±
0.10
a
4.
03
± 0.
01
e 92
.96
± 0.
11
GFB
9 0.
91
± 0.
02
a
2.03
±
0.37
a
5.
43
± 0.
33
f 91
.63
± 0.
04
GFB
10
1.91
±
0.00
c
26
.10
± 0.
05
h
3.57
±
0.04
d
68.4
2 ±
0.14
GFB
11
2.80
±
0.02
d
18
.32
± 0.
00
f
3.98
±
0.02
d
74.9
1 ±
0.03
(*)T
otal
Car
bohy
drat
e (d
.m) b
y di
ffer
ence
: 10
0 –
(wei
ght i
n gr
ams [
prot
ein
+ fa
t + a
sh] i
n 10
0 g
of fo
od) (
FAO
, 200
3).V
alue
s are
mea
ns ±
st
anda
rd d
evia
tion
(n=3
). D
iffer
ent l
ette
rs w
ithin
a c
olum
n m
ean
sign
ifica
nt d
iffer
ence
s (p<
0.05
).
CAPÍTULO 1
58
based products. They have great variation in their protein, fat and mineral
content, in contrast to the very narrow variation in the proximate
composition observed in wheat based bread products [20].
3.2. Contribution to dietary reference intakes (DRIs)
Table 3 shows the contribution of macronutrients, protein and carbohydrates
intakes (%), to the relevant DRIs consuming an average portion (200g) of
gluten free breads. Considering the Dietary Reference Intakes (DRIs) (NRC,
2001) [21] of an adult male and female, an average daily portion of bread
(200g) would meet 2.2-39.2% and 2.7- 47.7% of DRIs for proteins,
respectively (Table 3). GFB4 showed the highest value of DRIs for proteins
on both male (39.2% and female (47.7%). Only that sample gives a similar
protein contribution to that reported for white wheat bread (35.7% and
43.5% of DRI for male and female when consuming a 200g portion,
respectively) [22]. Very low contribution to the recommended daily protein
intake could be obtained with the consumption of the other evaluated
breads. Regarding the intakes for carbohydrates, the contribution to DRIs
ranged from 53.7% to 109.2%, obtaining the highest value with GFB8.
Considering that white wheat bread provide an average of 43% of
carbohydrate [20] and thus the contribution of a 200 g portion to the
carbohydrate DRI will be around 66%, studied gluten free breads are richer
in carbohydrates, with the exception of GFB10 and GFB11. Therefore, 200-
gram portion of gluten free breads has higher contribution to the
carbohydrate dietary reference intake than their wheat containing
counterparts.

CAPÍTULO 1
59
Tabl
e 3.
Con
tribu
tion
of m
acro
nutri
ent i
ntak
es (%
) to
the
rele
vant
DR
Is*
cons
umin
g an
ave
rage
por
tion
of 2
00g
of g
lute
n fr
ee b
read
s (G
FB)
Mac
ronu
trien
t G
ende
r D
RIs
(*)
(g/d
ay)
Con
tribu
tion
to D
RIs
(%) o
f GFB
1 2
3 4
5 6
7 8
9 10
11
Prot
eins
M
ale
56
7.9
17.0
18.
4 39
.2
13.5
10
.3
9.4
2.9
2.2
4.3
5.8
Fe
mal
e 46
9.
7 20
.6 2
2.4
47.7
16
.4
12.5
11.
4 3.
5 2.
7 5.
3 7.
1
Car
bohy
drat
es
Adu
lts
130
78.4
71.
2 77
.9 7
4.6
85.4
71
.0 7
0.6
109.
2 86
.1 5
4.6
53.7
(*) S
ours
e: N
RC
(Nat
iona
l Res
earc
h C
ounc
il) D
ieta
ry R
efer
ence
Inta
kes (
DR
Is) f
or p
rote
in a
nd c
arbo
hydr
ate
(200
2/20
05).
This
repo
rt m
ay b
e ac
cess
ed v
ia h
ttp://
ww
w.n
ap.e
du

CAPÍTULO 1
60
3.3. Soluble, insoluble and total dietary fibre
TDF ranged from 3.60g/100g to 7.20g/100g, except for GFB3 (1.30g/100g)
and GFB8 (2.00g/100g) samples, showing that all gluten- free breads
contained good amount of dietary fiber (>3g/100g) (Figure 1). High values
of TDF and SDF were obtained in GFB7, GFB10 and GFB11 samples. In
general, gluten free bread samples showed higher amount of soluble dietary
fiber than insoluble dietary fraction. The clear exception to the last
statement was GFB4 and GFB9, in which 83% and 71% of the total dietary
fiber were insoluble, respectively. Values obtained for these gluten free
breads slightly differ from those reported by Korus et al. [23], when studied
the addition of resistant starch to gluten free formulations as fiber source.
Those authors found values of IDF, SDF and TDF in gluten free breads that
ranged 2.77- 4.99g/100g, 1.23-1.45g/100g and 3.61-6.30g/100g,
respectively. Formulations of GFB usually contain gums or hydrocolloids
used as thickeners or stabilizers. Hydrocolloids like xanthan gum, guar gum,
carboxymethylcellulose (CMC), hydroxypropylmethylcellulose (HPMC),
pectin, or varied combinations of those hydrocolloids contained in the
formulations might improve the content of TDF, contributing to increase the
level of soluble dietary fibers.
Thompson [24] reported values of dietary fiber in commercial gluten free
bread samples from 1.2 to 5.6 g/100g, whereas in fiber enriched bread those
values varied from 6.1 to 9.6 g/100. Only for comparative purposes, it is
worthy to note that white bread contains 0.81g/100g, 3.13g/100g and
3.84g/100g of IDF, SDF and TDF, respectively [25].

CAPÍTULO 1
61
Figure 1. Total, soluble and insoluble dietary fiber (TDF, SDF and IDF) content, expressed as gram/100 grams (as is basis), in different gluten free breads (GFBs). 3.4. Starch digestibility in gluten free breads
The most predominant starch fraction was the RDS that varied from 75.6
g/100g to 92.5g/100g of the total starch (Figure 2). This pattern agrees with
the one reported for starchy foods, where starch is highly gelatinised and
product structure is very porous, resulting in rapid degradation of starch in
small intestine and very rapid rise of blood glucose level (high GI) [26].
SDS and RS of GFB samples ranged between from 2.4g/100g -
21.1g/100g, and 1.0g/100g -2.9g/100g, respectively. GFB9 showed the
highest value of SDS content (21.1g/100g), which is more desirable than

CAPÍTULO 1
62
RDS. SDS is slowly digested in the small intestine and induces gradual
increase of postprandial plasma glucose and insulin levels [27], although
Englyst et al. [15] reported that the breakdown of solid starchy foods could
predict the postprandial response in vivo but SDS has limited effect on the
glycaemic response although it is available as sugar.
Figure 2. Starch digestibility in different gluten free breads (GFBs) determined by in vitro enzymatic hydrolysis. RDS: rapidly digestible starch; SDS: slowly digestible starch; RS: resistant starch, expressed as gram/100 grams (as is basis).
3.5. Kinetic of the in vitro starch hydrolysis and expected glycaemic
index.
CAPÍTULO 1
63
Primary and secondary parameters derived from the in vitro digestion of the
gluten free breads evaluated are listed in Table 4. The maximum hydrolysis,
C∞, or hydrolysis degree when the enzymatic reaction reaches a plateau, of
gluten free breads was very high, which was associated with the high levels
of rapidly hydrolyzed starch. The kinetic constant (k), indicative of the
hydrolysis rate in the early stage, showed significant differences among the
GFBs. The lowest values were observed in GFB9 and GFB11, which were
the samples with higher fractions of slowly digested starch. Gelencsér et al
[28] reported values of rate constant comprised between 0.015 and 0.025
(min-1) in pasta products and the addition of resistant starch did not
significantly modify that constant. Therefore, higher kinetic constant is
obtained for gluten free breads than those determined for pasta, showing the
high susceptibility of these starchy products to enzymatic hydrolysis. The
hydrolysis index (HI) of GFBs ranged from 87 to 100 and estimated
glycaemic index (eGI) values were between 83.3 and 96.1. All samples
showed very high in vitro starch digestibility index, being practically
hydrolyzed between 60 to 90 min of assay, as indicated the H90.
Differences among breads should be attributed to variations in composition
(Table 1 and 2). Bernal et al. [29] also observed slightly higher digested
starch in gluten free infant cereals. That result was due to the higher starch
digestibility of rice and corn (103.98g/100g for rice and 107.05g/100g for
corn) compared to white bread (100g/100g) [28]. Therefore, although GFBs
are mainly starchy foodstuff, the very complex formulation of those breads
might be responsible of the reduction observed in those values. In fact, the

CAPÍTULO 1
64
Table 4. Kinetic parameters of the in vitro starch hydrolysis and
estimated glycaemic index
Samples C∞
(g/100g)
k (min-1) AUC 180 H90 HI eGI
GFB1 90.7 b 0.0782 c 22345 b 91 b 91 b 87 b
GFB2 94.9 c 0.1218 e 23764 d 95 cd 95 d 90 d
GFB3 86.9 a 0.1458 f 21664 a 86 a 87 a 83 a
GFB4 91.2 b 0.0973 d 22587 b 91 b 91 b 87 b
GFB5 97.8 d 0.0713 b 23740 d 97 e 97 e 91 e
GFB6 96.4 cd 0.0756 c 23653 d 96 e 96 e 91 e
GFB7 95.8 c 0.0723 b 23608 d 96 d 96 d 91 e
GFB8 93.2 b 0.0768 c 23100 c 93 d 93 c 89 c
GFB9 100.1 e 0.0527 a 24732 e 100 f 102 f 96 f
GFB10 94.8 c 0.1232 e 23797 d 95 cd 94 c 89 cd
GFB11 92.0 b 0.0574 a 22127 b 91 b 92 b 87 b
a Mean of four replicates. Values followed by different letters in each column and each starch indicate significant differences (p ≤ 0.05). b C∞, equilibrium concentration; k, kinetic constant; HI, hydrolysis index; AUC 180, area under curve; eGI, estimated glycaemic index. glycaemic response to bread varies widely according to the type of bread
studied [30]. Low to moderate GI (<70) are considered favorable to health.
The glycaemic index could vary from 27 (barley bread with 75g/100g
substitution) to 95 (extremely porous French baguette). This extreme
variability reflects very different rates of starch digestion. The starch from a
French baguette is rapidly digested, leading to glycaemic response close to
CAPÍTULO 1
65
that of glucose (GI=100), whereas starch from bread containing intact cereal
grains is digested more slowly [30].The results obtained in the present study
showed that all samples could be considered as food with rapidly digested
starch and high glycaemic index. The number and variety of ingredients of
gluten free bread can be considered important factors that will determine the
starch digestibility.
4. Conclusions
The nutritional evaluation of different commercial gluten free breads
revealed that they are mainly starchy foods with great divergences in fat and
protein composition, due to the occasional protein enrichment. In
consequence, these products have very low contribution to the
recommended daily protein intake, but higher contribution to the
carbohydrate dietary reference intake than their gluten containing
counterpart. The majority of gluten free breads evaluated contained good
amount of dietary fiber (>3g/100g), and in most cases the amount of soluble
dietary fiber was higher than the insoluble dietary fraction. The presence of
hydrocolloids needed in the formulation of these products could be partially
responsible of that pattern. The in vitro hydrolysis of the starch of the gluten
free breads showed that RDS was the major starch fraction distantly
followed by SDS and RS, indicating the high starch digestibility. The
estimated glycaemic index of the gluten free breads varied between 83.3 and
96.1, thus all samples could be considered as food with high glycaemic
index. Overall, gluten free breads shows great variation in the nutrient
CAPÍTULO 1
66
composition, being starchy based foods low in proteins and high in fat
content.
Acknowledgments
Authors acknowledge the financial support of Association of Coeliac
Patients (Madrid, Spain), Spanish Scientific Research Council (CSIC) and
the Spanish Ministerio de Ciencia e Innovación (Project AGL2008-
00092/ALI). ME Matos would like to thank predoctoral grant by the
Council of Scientific and Humanistic Development of University Central
of Venezuela (Caracas, Venezuela).
References
1 Catassi C, Fasano A (2008) Celiac disease. In Arendt EA, Dal Bello F
(eds), Gluten-Free Cereal Products and Beverages.
Amsterdam/Boston/Heidelberg/London/New York/Oxford/Paris/San
Diego/San Francisco/Singapore/Sydney/Tokyo: Elsevier, pp 1-27.
2. Pruska-Kędzior A, Kędzior Z, Gorący M, Pietrowska K, Przybylska A,
Spychalska K (2008) Comparison of rheological, fermentative and baking
properties of gluten-free dough formulations. Eur Food Res Technol
227:1523-1536.
3. Gujral H, Rosell CM (2004) Functionality of rice flour modified by
microbial transglutaminase. J Cereal Sci 39:225-230.
4. Lazaridou A, Duta D, Papageorgiou M, Belc N, Biliaderis CG (2007)
Effects of hydrocolloids on dough rheology and bread quality parameters in
gluten-free formulations. J Food Eng 79:1033-1047.

CAPÍTULO 1
67
5. Marco C, Rosell CM (2008a) Functional and rheological properties of
protein enriched gluten free composite flours. J Food Eng 88:94-103.
6. Ribotta PD, Ausar SF, Morcillo MH, Pérez GT, Beltrano DM, León AE
(2004) Production of gluten-free bread using soybean flour. J Sci Food
Agric 84:1969-1974.
7. Calderón de la Barca AM, Rojas-Martínez ME, Islas-Rubio AR, Cabrera-
Chávez F (2010) Gluten-free breads and cookies of raw and popped
amaranth flours with attractive technological and nutritional qualities. Plant
Food Hum Nutr 65:241–246.
8. Akubor PI, Adamolekun FO, Oba CA, Obari H, Abudu IO (2003)
Chemical composition and functional properties of cowpea and plantain
flour blends for cookie production. Plant Foods Hum Nutr 58:1-9.
9. Marco C, Rosell CM (2008b) Breadmaking performance of protein
enriched, gluten-free breads. Eur Food Res Technol 227:1205-1213.
10. Thompson T, Dennis M, Higgins LA, Lee AR, Sharret MK (2005)
Gluten-free diet survey: are Americans with celiac disease consuming
recommended amounts of fibre, iron, calcium and grain foods? J Hum Nutr
Dietetics 18:173–179.
11. ICC (1994) Official Methods of Analysis, Vienna: International
Association for Cereal Chemistry.
12. FAO (2003) Food energy-methods of analysis and conversion factors,
Rome: Food and Agriculture Organization of the United Nations.
13. AACC International (2000) Approved Methods, 11th edn. St Paul, MN:
American Association of Cereal Chemists International.

CAPÍTULO 1
68
14. Gularte AM, Rosell CM (2011) Physicochemical properties and
enzymatic hydrolysis of different starches in the presence of hydrocolloids.
Carbohyd Polym 85:237-244.
15. Englyst HN, Veenstra J, Hudson GJ (1996) Measurement of rapidly
available glucose (RAG) in plant foods: a potential in vitro predictor of the
glycaemic response. Br J Nutr 75:327-337.
16. Goñi I, Garcia-Alonso A, Saura-Calixto F (1997) A starch hydrolysis
procedure to estimate glycemic index. Nutr Res 17:427-437.
17. Granfeldt Y, Björck I, Drews A, Tovar J (1992) An in vitro procedure
based on chewing to predict metabolic responses to starch in cereal and
legume products. Eur J Clin Nutr 46:649–660.
18. Moore MM, Schober TJ, Dockery P, Arendt EK (2004) Textural
comparisons of gluten-free and wheat-based doughs, batters, and breads.
Cereal Chem 81:567-575.
19. Yazynina E, Johansson M, Jägerstad M, Jastrebova J (2008) Low folate
content in gluten-free cereal products and their main ingredients. Food
Chem 111:236–242.
20. Rosell CM (2011) The science of doughs and bread quality. In Preedy
VR, Watson RR, Patel VB (eds), Flour and Breads and Their Fortification in
Health and Disease Prevention. London/Burlington/San Diego: Elsevier, pp
3-14.
21. NRC (2001) Dietary reference Intakes table-The complete set
http:www.iom.edu/?id=21381.

CAPÍTULO 1
69
22. Škrbić B, Milovac S, Dodig D, Filipčev B (2009) Effects of hull-less
barley flour and flakes on bread nutritional composition and sensory
properties. Food Chem 115:982-988.
23. Korus J, Witczak M, Ziobro R, Juszczak L (2009) The impact of
resistant starch on characteristics of gluten-free dough and bread. Food
Hydrocolloids 23:988–995.
24. Thompson T (2000) Folate, iron, and dietary fiber contents of the
gluten-free diet. J Am Diet Assoc 100:1389-1396.
25. Saura-Calixto F, García-Alonso A, Goñi I, Bravo L (2000) In vitro
determination of the indigestible fraction in foods: An alternative to dietary
fiber analysis. J Agric Food Chem 48:3342-3347.
26. Poutanen K, Flander L, Katina K (2009) Sourdough and cereal
fermentation in a nutritional perspective. Food Microbiol 26:693–699.
27. Jenkins DJA, Wolever TMS, Leeds AR, Gassull MA, Haisman P,
Dilawari J, Goff DV, Metz GL, Alberti KM (1978) Dietary fibres, fibre
analogues, and glucose tolerance: importance of viscosity. Br Med J 1:1392-
1394.
28. Gelencsér T, Gál V, Hódsági M, Salgó A (2008) Evaluation of quality
and digestibillity characteristics of resistant starch-enriched pasta. Food
Bioprocess Tech 1:171-179.
29. Bernal MJ, Periago MJ, Ros G (2002) Effects of processing on dextrin,
total starch, dietary fiber and starch digestibility in infant cereals. J Food Sci
67:1249-1254.
CAPÍTULO 1
70
30. Fardet A, Leenhardt F, Lioger D, Scalbert A, Rémésy C (2006).
Parameters controlling the glycaemic response to breads. Nutr Res Rev
19:18–25
CAPÍTULO 2
RELATIONSHIP BETWEEN INSTRUMENTAL
PARAMETERS AND SENSORY CHARACTERISTICS
IN GLUTEN-FREE BREADS
María E. Matos and Cristina M. Rosell
European Food Research and Technology 235 (2012) 107-117

CAPÍTULO 2
73
Abstract
Numerous bread-like gluten free products have been lately developed due
to the rising demand on wheat free foods. A range of parameters has been
used to describe these products, but there is no general agreement about
the most suitable assessment to characterize them. The objective of this
research was to characterize diverse gluten free like breads (GFB) in
order to discriminate them and to establish possible correlations among
descriptive parameters of GFB features determined by instrumental
methods and sensory analysis. Statistical analysis showed that all
physical, physicochemical characteristics (specific volume, moisture
content, water activity, L*, a*, b*, hue and chroma), hydration properties
(swelling, water holding capacity and water binding capacity), texture
profile analysis (TPA) parameters (hardness, springiness, chewiness,
cohesiveness and resilience) and structural analysis of the crumbs
(number of cells and total area) significantly (p<0.05) discriminated
between the GFB types tested. Sensory analysis revealed great
divergences in crumb appearance, odour, springiness, crumbliness and
colour of samples, but not significant differences (p<0.05) in flavour,
aftertaste and hardness of them. Certain significant correlations were
established within the parameters determined by instrumental methods.
Hydration properties of the crumb showed to be positively correlated
with cohesiveness and resilience. Significant correlations, but
scientifically meaningless, were observed among the instrumental and
sensory parameters, because correlation coefficients were rather low,
which represent very weak or low linear correlations (r≤0.35). The
CAPÍTULO 2
74
principal component analysis showed that sensory parameters described
in this study and also hydration properties besides texture parameters
would be suitable for characterizing bread like gluten free products.
Key words: gluten-free, bread, quality, crumb, sensory characteristics.

CAPÍTULO 2
75
1. Introduction
Celiac disease (CD), also known as gluten-sensitive enteropathy, is a
chronic disorder of the small intestine caused by exposure to gluten in the
genetically predisposed individuals [1,2]. It is characterized by a strong
immune response to certain amino acid sequences found in the prolamin
fractions of wheat, barley, rye, and certain varieties of oats, resulting in
inflammation and damage of the small-intestine mucosa and leading to
malabsorption of nutrients [1,3]. Nowadays, the general prevalence of
CD was estimated to be 1 in 300, although population-based screening
studies carried out in 2008 suggest that the prevalence may be 1 in 100
[4]. Persons with CD are unable to consume some of the most common
products in the market, including breads, baked goods, and other food
products made with wheat flour. Until now, the only effective treatment
for CD is strict adherence to gluten-free (GF) diet throughout the
patient’s lifetime [4].
The apparent or real increase in celiac disease or other allergic reactions
and intolerances to gluten consumption has prompted the rising demand
for gluten-free products. A range of bread-like gluten-free products has
been designed trying to resemble wheat bread. The gluten-free bread
recipes contain mainly rice or maize flours combined with potato, maize
or wheat starches [5-7]. In recent years there has been extensive research
for the development of gluten-free bread, involving diverse approaches,
like the use of different starches (maize, potato, cassava or rice), dairy
products, gums and hydrocolloids, emulsifiers, other non-gluten proteins,
prebiotics or combinations thereof, as alternatives to gluten, to improve

CAPÍTULO 2
76
the structure, mouthfeel, acceptability and shelf-life of gluten-free bakery
products [5-6, 8-16]. The development of such bread is frequently
difficult having in mind that gluten is the main structure-forming protein
in wheat flour, responsible for the elastic and extensible properties to
produce good quality bread [17].
In those researches, different features of the gluten free breads have been
evaluated to assess their quality. Despite the different characteristics of
the gluten free bread compared to its wheat counterparts, the same
evaluation methods have been usually applied. Instrumentals analysis,
including loaf weight and volume, specific volume, colour parameters,
and textural parameters have been frequently used to characterize gluten-
free breads [12, 14, 16, 18-22]. Sensory analysis has been also considered
in some of the studies when developing gluten-free breads [7, 10, 13-15,
20, 23, 24]. Other researchers have also characterized the crumb
microstructure by using image analysis [19, 23] or scanning electron
microscopy [12].
Therefore, instrumental measurements and sensory analysis have been
applied to characterize gluten free breads. However, no correlation
between instrumental parameters and sensory analysis has been
previously established in this type of products, which would be very
helpful for defining the best quality attributes of gluten-free breads.
Additionally, principal components analysis (PCA) could be used to
identify the best parameters or descriptors of the quality of gluten-free
breads that allow the discrimination among bread features.
CAPÍTULO 2
77
The aim of this research was to characterize a range of gluten free breads
in order to establish possible correlations among descriptive parameters
of gluten free bread like features determined by instrumental methods
and sensory analysis. For that purpose, eleven gluten-free breads like
products, which represent a large range of commercial gluten-free breads,
were evaluated regarding physicochemical analysis, hydration properties,
crumb microstructure, crumb texture and sensory analysis.
2. Materials and methods
2.1. Materials
Eleven specialties of gluten-free breads (GFB) with either loaf or sliced
presentations were selected and purchased in general and specialized
supermarkets. Gluten-free breads are marketed in polyethylene pouches
and packaged under modified atmosphere for keeping their
characteristics during at least four months. All breads were purchased
within the first month after its production. Breads were kept at 20ºC till
analysis. Information on the ingredients of each bread type, according to
the labeling is given in Table 1. Due to commercial sensitivity the
branded bread (n=11) varieties were labeled as GFB. Abbreviations of
the samples are listed in Table 1. Samples from two different batches
were used for the characterization.
2.2. Physicochemical analysis
Bread moisture content was determined following the ICC Standard Methods (110/1) [25]. Volume was determined by rapeseed displacement
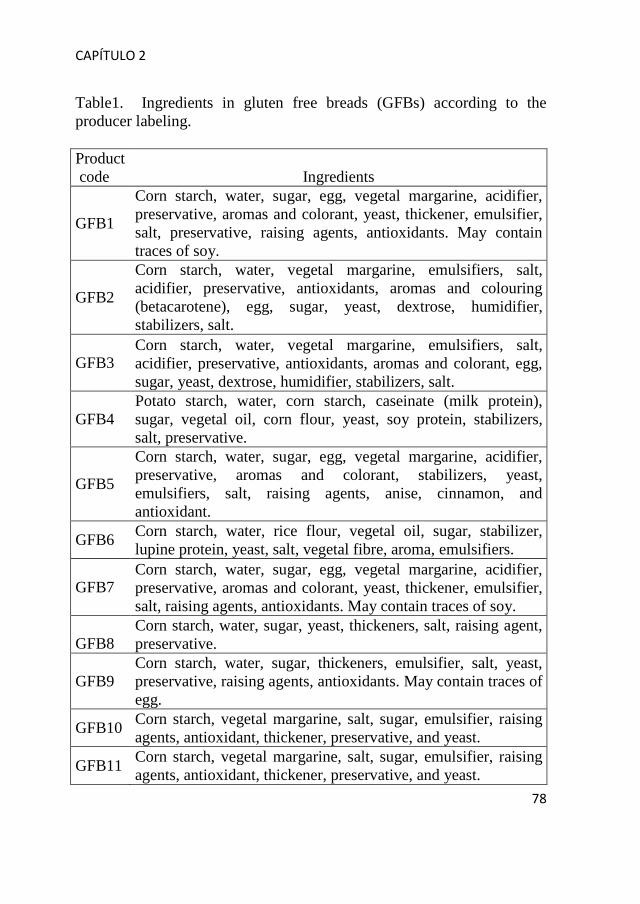
CAPÍTULO 2
78
Table1. Ingredients in gluten free breads (GFBs) according to the producer labeling. Product code Ingredients
GFB1
Corn starch, water, sugar, egg, vegetal margarine, acidifier, preservative, aromas and colorant, yeast, thickener, emulsifier, salt, preservative, raising agents, antioxidants. May contain traces of soy.
GFB2
Corn starch, water, vegetal margarine, emulsifiers, salt, acidifier, preservative, antioxidants, aromas and colouring (betacarotene), egg, sugar, yeast, dextrose, humidifier, stabilizers, salt.
GFB3 Corn starch, water, vegetal margarine, emulsifiers, salt, acidifier, preservative, antioxidants, aromas and colorant, egg, sugar, yeast, dextrose, humidifier, stabilizers, salt.
GFB4 Potato starch, water, corn starch, caseinate (milk protein), sugar, vegetal oil, corn flour, yeast, soy protein, stabilizers, salt, preservative.
GFB5
Corn starch, water, sugar, egg, vegetal margarine, acidifier, preservative, aromas and colorant, stabilizers, yeast, emulsifiers, salt, raising agents, anise, cinnamon, and antioxidant.
GFB6 Corn starch, water, rice flour, vegetal oil, sugar, stabilizer, lupine protein, yeast, salt, vegetal fibre, aroma, emulsifiers.
GFB7 Corn starch, water, sugar, egg, vegetal margarine, acidifier, preservative, aromas and colorant, yeast, thickener, emulsifier, salt, raising agents, antioxidants. May contain traces of soy.
GFB8
Corn starch, water, sugar, yeast, thickeners, salt, raising agent, preservative.
GFB9 Corn starch, water, sugar, thickeners, emulsifier, salt, yeast, preservative, raising agents, antioxidants. May contain traces of egg.
GFB10 Corn starch, vegetal margarine, salt, sugar, emulsifier, raising agents, antioxidant, thickener, preservative, and yeast.
GFB11 Corn starch, vegetal margarine, salt, sugar, emulsifier, raising agents, antioxidant, thickener, preservative, and yeast.

CAPÍTULO 2
79
method and specific volume (cm3 /g) of the individual loaf was
calculated by dividing volume by weight. Water activity (aw) of bread
samples was measured using an Aqua Lab Series 3 (Decagon devices
Pullman, USA) at 22ºC. The colour of the bread crumbs was measured at
three different locations by using a Minolta colorimeter (Chromameter
CR-400/410. Konica Minolta. Japan) after standardization with a white
calibration plate (L*= 96.9, a*= -0.04, b*=1.84). The colour was
recorded using CIE-L*a*b* uniform colour space (CIE-Lab) where L*
indicates lightness, a* indicates hue on a green (-) to red (+) axis, and b*
indicates hue on a blue (-) to yellow (+) axis. Data from three slices per
bread were averaged. Additionally the cylindrical coordinates: hue or hue
angle (hab) and Chroma (C*ab) were defined by the following equations:
C*ab = √ ((a*)2 + (b*)2)
hab = arc tan (b*/a*)
Hue angle is the angle for a point calculated from a* and b* coordinates
in the colour space. Chroma is the quantitative component of the colour
[26], which reflected the purity of colour in the CIELAB space.
2.3. Hydration properties
Swelling or the volume occupied by a known weight of sample was
evaluated by mixing 5g (±0.1 mg) of dried gluten-free bread with 100
mL distilled water and allowing it to hydrate during 16h. Water holding
capacity (WHC) defined as the amount of water retained by the sample
without being subjected to any stress was determined by suspending 5g
(±0.1 mg) of commercial gluten-free bread sample with 100mL distilled

CAPÍTULO 2
80
water and allowing them to hydrate overnight. After removing the excess
of water, the hydrated solid was weighed and expressed per one gram of
solid. Water binding capacity (WBC) or the amount of water retained by
the bread after being subjected to centrifugation was measured as
described the AACC International method (56-30.01) [27].
2.4. Crumb cell analysis
Images of the gluten-free bread slice (10-mm thick) were captured using
a flatbed scanner equipped with the software HP PrecisoScan Pro version
3.1 (HP scanjet 4400C, Hewlett–Packard, USA). The default settings for
brightness (midtones 2.2) and contrast (highlights 240, midtones 2.2, and
shadows 5) of the scanner software were used for acquiring the images.
The images were scanned full scale at 1200 pixels per inch and analysed
in levels of grey (8 bits, readout 0–255) and captured in jpeg format for
each measurement. A 30x30-mm square field of view (FOV) was
evaluated for each image. This FOV captured the majority of the crumb
area of each slice. Images were analysed by Image J software (National
Institutes of Health, Bethesda, MD, USA) using the Otsu’s algorithm for
assessing the threshold according to Gonzales-Barron and Butler [28].
Data derived from the crumb structure analysis included: number of cells
or alveoli, average cells area and cell circularity, and were used for
comparing purposes among different samples. Circularity was calculated
using the following equation:
Circularity = 4 x π x area / (perimeter)2. A value of 1.0 indicates a
perfect circle.

CAPÍTULO 2
81
2.5. Crumb texture analysis
Crumb texture analysis was measured on uniform slices of 10mm
thickness. Three slices from the center of each loaf were taken for
evaluation [29]. Texture profile analysis (TPA) was performed using a
universal testing machine TA-XT2i (Stable Micro Systems, Surrey, UK)
equipped with a 30 Kg load cell and 25 mm aluminium cylindrical probe.
The settings used were test speed of 2.0 mm/s with a trigger force of 5 g
to compress the middle of the bread crumb to 50% of its original height
at a crosshead speed of 1mm/s. Values were the mean of three replicates.
2.6. Sensory evaluation
A descriptive sensory analysis was performed for evaluating the sensory
characteristics of commercial gluten-free breads. Bread slices, including
crust and crumb, were presented (1cm thick) on plastic dishes coded and
served in randomised order. A quantitative descriptive sensory analysis
was carried out with twelve trained panellists under normal lightening
conditions and at room temperature. The range of time that test panellist
had participated in descriptive analysis and scale rating of a wide range
of bread products varied from 3 to 20 years. Preliminary training test was
performed, in which they were sat in a round table and after evaluating
the sample, an open discussion was initiated for defining and describe the
best descriptors for characterizing the product. Evaluation included
perception at first glance of the bread slice (crust and crumb included)
and mastication with the molar teeth up to swallowing. The attributes
assessors finally agree were appearance (by observing the product slice),

CAPÍTULO 2
82
flavour, colour, taste, aftertaste (taste remaining in the mouth after
swallowing), texture attributes during chewing and springiness (ability to
regain original shape after pressing down the crumb with the middle
finger). The descriptors for each attributes were appearance (visually
liking or disliking), flavour (scale goes from high when typical of bread
or bakery products to low, uncharacteristic of bakery products), colour
(scales goes from high yellow/beige to low when brown or grey), taste
(scale goes from high when typical taste of bread or bakery products to
low, uncharacteristic of bakery products), aftertaste (scale goes from high
when agreeable taste to low when distaste after swallowing), texture
attributes during chewing (scales goes from hard-soft, crumbly-
cohesive). Attribute intensity was scored on a scale varying from 1
(disliked extremely) to 5 (like extremely). Two samples were evaluated
during one session. Breads were considered acceptable if their means
score for overall acceptance were above 2.5.
2.7. Statistical analysis
The results were expressed as mean values. For each quality parameter, a
one way analysis of variance (ANOVA) was applied using Statgraphics
Plus V 7.1 (Statistical Graphics Corporation, UK). Fisher’s least (LSD)
test was used to assess significant differences (p<0.05) among samples
that might allow discrimination among them. Simple correlations were
performed using Statgraphics V.7.1 software. Principal component
analysis (PCA) was also performed to determine the number of principal
components that significantly (p< 0.05) discriminated samples.
CAPÍTULO 2
83
3. Results and discussion
3.1. Technological and sensory characteristics of gluten free bread
The characterization of diverse gluten-free breads was carried out to
identify the most discriminating parameters. With that purpose, an in-
depth analysis of the gluten free breads was carried out (Table 2, 3). The
analysis included physical, physicochemical properties, crumb structure
analysis, also hydration properties of the crumb and sensory analysis.
Mean values from two different batches for each sample are showed in
table 2. Analysis of data collated using ANOVA showed that all
physicochemical characteristics significantly (p<0.05) discriminated
between the breads tested. GFB samples presented specific volume
values that ranged from 1.54 to 4.79 mL/g. Those agree with the ones
reported by Sabanis, Lebesi and Tzia [13] when they evaluated
enrichment of gluten-free baked products with different cereal fibres (2.7
to 3.9 mL/g), or with Marco and Rosell [12] findings (1.57 to 2.71
mL/g). Moisture content values ranged from 21.10 g/100g (GFB8) to
42.03 g/100g (GFB11). The present study included a range of marketed
GFB specialties, thus probably differences might be attributed to the
different bread formulations. In general, the moisture content values
reported for gluten-free breads obtained from different formulations are
rather high, for instance rice based bread enriched with proteins showed
values of 41.66- 46.13 g/100g [12] and the enrichment of gluten-free
breads with fibres even enhances those values (49-53 g/100g) [13]. Water
activity values of crumb were also high (Table 2). Those values agree
with the findings of Lazaridou, Duta, Papageorgiou, Belc and Biliaderis

CAPÍTULO 2
84
Tab
le 2
. Diff
eren
t qua
lity
char
acte
ristic
s of d
iffer
ent g
lute
n-fr
ee b
read
s.
Sam
ple
Spec
ific
volu
me
M
oist
ure
a w
Swel
ling
WH
C
WB
C
L*
a*
b*
Chr
oma
H
ue
angl
e
code
s m
l/g
g/10
0g
m
l/g
g w
ater
/g
solid
g
wat
er/g
so
lid
º
GFB
1 3.
37
cd e 29
.63
d 0.
91
b 1.
49
a
2.55
ab
2.31
a
64
.71
a
-2.0
1 cd
11
.85
a 12
.02
a -8
0.36
de
f
GFB
2 3.
47
de
31.6
3 f
0.95
e
1.58
bc
2.63
ab
2.47
ab
72
.93
f
0.50
d
21.7
8 g
21.7
8 f
88.6
7 h
GFB
3 1.
54
a 29
.50
d 0.
94
d 1.
49
a
2.41
a
2.
39
a
71.8
6 ef
0.97
d
19.8
6 f
19.8
8 e
87.2
0 g
GFB
4 4.
79
f 27
.17
c 0.
94
d 1.
38
a
2.50
ab
2.60
bc
65
.77
a
-1.6
3 ab
c 10
.72
a 10
.84
a -8
1.37
cd
G
FB5
3.88
e
26.2
7 b
0.89
a
1.99
de
3.23
c
2.
90
d
67.9
5 b
-0
.25
bcd
15.9
7 de
15
.97
c -8
9.10
a
GFB
6 2.
89
c 41
.66
i 0.
97
g 1.
59
ab
2.
84
b
2.70
c
72
.77
f
-2.7
4 a
17.1
7 e
17.3
9 d
-80.
93
cd e G
FB7
3.14
cd
33
.60
g 0.
94
d 1.
79
bc
2.
72
ab
2.
41
ab
69.2
1 bc
-2.4
4 a
13.9
7 b
14.1
8 b
-80.
09
ef
GFB
8 4.
77
f 21
.10
a 0.
92
c 2.
58
e
3.49
c
3.
19
e
83.8
3 h
-2
.21
a 11
.92
a 12
.13
a -7
9.44
f
GFB
9 2.
31
b 31
.33
e 0.
96
f 3.
48
f
3.86
d
3.
35
e
80.2
0 g
-2
.28
a 15
.86
de
16.0
2 cd
-8
1.82
c
GFB
10
3.70
e
36.1
3 h
0.97
g
2.09
d
3.
25
c
2.78
cd
71
.13
de
-1
.99
a 14
.09
bc
14.2
3 b
-81.
99
bc
GFB
11
3.47
de
42
.03
j 0.
97
g 1.
90
cd
3.
24
c
2.72
cd
70
.37
cd
-1
.90
ab
15.4
4 cd
15
.55
bc
-83.
00
b p-
valu
e 0.
000
0.
000
0.
000
0.
000
0.00
0
0.
000
0.00
0
0.
000
0.
000
0.
000
0.
000
Fo
r eac
h pa
ram
eter
val
ues f
ollo
wed
by
the
sam
e le
tter a
re n
ot si
gnifi
cant
ly d
iffer
ent a
t p≤
0.0
5.
WH
C: w
ater
hol
ding
cap
acity
(ml/g
); W
BC
: wat
er b
indi
ng c
apac
ity (g
wat
er/g
solid
).

CAPÍTULO 2
85
Tab
le 3
. Ana
lysi
s of c
rum
b m
icro
stru
ctur
e an
d te
xtur
e.
Sam
ple
Num
ber o
f al
veol
i/cm
2
Tota
l are
a al
veol
i
Har
dnes
s
Sprin
gine
ss
C
hew
ines
s
Coh
esiv
enes
s
Res
ilien
ce
code
s
mm
2/cm
2
N
N
GFB
1 4
ab
9.07
a
20.5
0 e
0.95
de
5.77
d
0.29
b
0.11
abc
G
FB2
6 ab
7.
53 a
80
.20
g 0.
95 d
e 32
.90
g 0.
43 c
0.
17 d
G
FB3
6 ab
36
.70
b 14
.53
c 0.
85 b
c 3.
53 a
bc
0.29
b
0.09
ab
GFB
4 6
ab
24.2
6 ab
14
.60
cd
0.90
cd
4.83
cd
0.37
c
0.13
bcd
G
FB5
2 a
2.50
a
11.2
7 ab
c 0.
76 a
2.
33 a
b 0.
24 a
b 0.
08 a
b G
FB6
16 c
13
0.03
c
11.4
7 ab
c 0.
88 c
4.
04 b
cd
0.37
c
0.15
cd
GFB
7 2
a 8.
80 a
10
.83
ab
0.79
ab
1.69
a
0.20
a
0.06
a
GFB
8 5
ab
18.7
0 ab
18
.23
de
1.00
f
14.9
4 e
0.82
d
0.39
e
GFB
9 4
ab
23.5
0 ab
32
.77
f 0.
96 d
e 24
.07
f 0.
77 d
0.
40 e
GFB
10
7 b
21.3
3 ab
12
.57
bc
0.95
de
3.74
abc
d 0.
38 c
0.
15 c
d G
FB11
6
ab
3.17
a
8.47
a
0.87
c
3.60
abc
0.
44 c
0.
18 d
p-
valu
e 0.
000
0.
000
0.
000
0.
000
0.
000
0.
000
0.
000
Fo
r eac
h pa
ram
eter
val
ues f
ollo
wed
by
the
sam
e ar
e no
t sig
nific
antly
diff
eren
t at p
≤
0.05
.

CAPÍTULO 2
86
[10], that reported water activity values of GFB crumb in the range of
0.97-0.99. Likely, the high water activity as well as the moisture
retention might be ascribed to the high water holding capacity of the
incorporated hydrocolloids [30] that are usually added to GFB
formulations as thickeners for improving volume (see Table 1). It has
been reported 0.95 as typical aw value for breads [31]. Therefore, GFB
samples tested, according to the above results, covered a good range of
characteristics previously reported for this type of breads.
The colour of the crumb has been also an important parameter for
characterising GFB. Lower L* value indicates darker crumb, a* positive
value is associated with crumb redness, whereas b* positive value
indicates yellow colour. To obtain a good characterisation of the colour,
it is necessary to bear in mind the psychophysical parameters, which
correspond with the cylindrical coordinates: hue (hab) and chroma (C*ab).
Great variability was observed in lightness. GFB8 and GFB9 showed the
highest values (83.83 and 80.20, respectively), indicating more
reflectance of light when compared with the rest of the breads.
Additionally, darker crumb was observed for GFB1, GFB4, GFB5 and
GFB7. The darkening of the crumb colour is desirable as gluten-free
breads usually tend to have lighter colour than wheat breads [23], and
darker bread are usually associated with whole grains and
wholesomeness [15]. Regarding a*, only GFB2 and GFB3 showed low
positive value indicating hue on red axis, whereas the other breads
presented negative a* value (hue on green axis). In addition, all samples
presented positive b* value (indicating hue on yellow axis), showing
CAPÍTULO 2
87
significant differences among them (p<0.05). In relation to hue (hab) and
chroma (C*ab) colour attributes, great variation was observed (Table 3).
The majority of the GFB samples presented negative hue values that
reflected yellow-greenish hue, with the exception of GFB2 and GFB3
samples that presented hue positive values, which reflected yellow-
orange hue. Chroma is the quantitative component of the colour
associated to the colour purity in the CIELAB space. Both GFB2 and
GFB3 showed chroma values higher than the other samples, which
revealed its higher purity of colour related to major intensity of the
yellow component (Figure 1).
Gluten-free breads have low ability to retain moisture during storage
[11], thus hydration properties of the bread crumbs might be interesting
properties to characterize this type of products. Hydration parameters are
generally used for assessing the water uptake ability of different
ingredients like hydrocolloids or fibers. GFB9 exhibited the highest
values for swelling, WHC and WBC indicating that it can retain
significantly more water than the other breads (Table 2). In addition,
GFB4 showed the lowest value for swelling while GFB3 presented
lowest values to WHC and WBC. In GFB, dietary fibre (mainly
hydrocolloids incorporated as ingredient into gluten-free bread
formulations) might be a major determinant of the water retention
capacity of these products. Significant differences were found among the
samples, which could be useful for discriminating GFB and maybe those
properties could be related to sensory attributes. Presumably, water
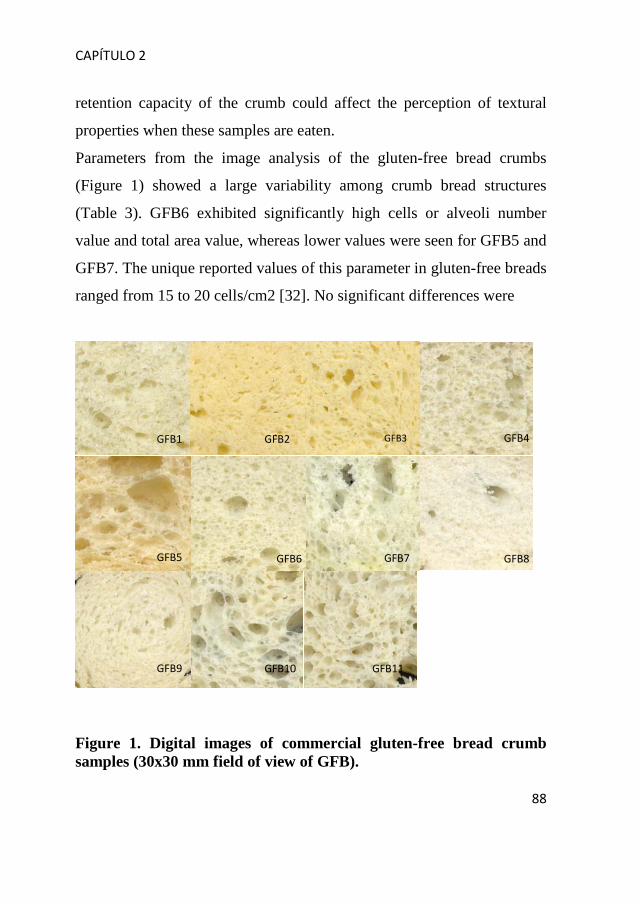
CAPÍTULO 2
88
retention capacity of the crumb could affect the perception of textural
properties when these samples are eaten.
Parameters from the image analysis of the gluten-free bread crumbs
(Figure 1) showed a large variability among crumb bread structures
(Table 3). GFB6 exhibited significantly high cells or alveoli number
value and total area value, whereas lower values were seen for GFB5 and
GFB7. The unique reported values of this parameter in gluten-free breads
ranged from 15 to 20 cells/cm2 [32]. No significant differences were
Figure 1. Digital images of commercial gluten-free bread crumb samples (30x30 mm field of view of GFB).
GFB1 GFB2 GFB3 GFB4
GFB5 GFB6
GFB9
GFB8 GFB7
GFB10 GFB11
CAPÍTULO 2
89
observed for average cell area (mm2). Nevertheless, significant
differences were found for circularity values (p<0.05). It has been
described that up to certain limit, the number of cells/cm2 increases as
HPMC and water increase [24]. Nonetheless, the combination of high
levels of both decreases the cell/cm2, likely due to the coalescence of
many gas cells into one large cell. Carboxymethyl cellulose and xanthan
gum has been associated with higher cell average size, while breads with
carrageenan and alginate had smaller cell sizes [22]. Gluten free crumbs
had circularity values ranging from 0.60 to 0.81, indicating less uniform
shape (Figure 1). Beside, cell (air) total area of bread crumbs showed
significant differences among gluten-free breads.
In addition, significant differences were observed in the crumb texture
properties of the different gluten free breads (Table 3). Gluten free bread
like products due to their complex formulation, mainly based in
carbohydrates [33], present high crumb hardness, which agree with the
results of crumb image analysis. The majority of GFBs presented
hardness values ranging from 10.33N to 14.60N; however GFB2 and
GFB11 had the highest and lowest values, respectively. With respect to
springiness, GFB8 showed the highest value, while GFB5 presented the
lowest. Springiness is associated to a fresh and elastic product; therefore
high quality bread will be related to high springiness values. Marco and
Rosell [12] found springiness values that ranged from 0.77 to 0.94 when
study the protein enrichment of rice based gluten-free breads. Low
springiness value is indicative of brittleness and this reflects the tendency
of the bread to crumble when is sliced [24]. Cohesiveness characterises

CAPÍTULO 2
90
the extent to which a material can be deformed before it ruptures,
reflecting the internal cohesion of the material. Bread with high
cohesiveness is desirable because it forms a bolus rather than
disintegrates during mastication, whereas low cohesiveness indicates
increased susceptibility of the bread to fracture or crumble [16]. With the
exception of the GFB8 and GFB9, low cohesiveness values (0.20-0.44)
were observed, which implies that lower compression energy was
required and consequently those breads more easily crumbled. Chewiness
varied from 1.69 to 32.90 N, but the majority of breads presented values
comprised between 2.33 to 5.77 N and only GFB2 showed higher value.
Therefore, the time required masticating a bread piece prior to swallow
showed great variation. Low chewing value means easy break of the
bread in the mouth like a biscuit. It was also observed that hardness and
chewiness showed similar traits for all breads. Resilience values showed
that GFB7 had the lowest elasticity, whereas GFB8 and GFB9 presented
the highest values. It has been reported that the reduction in resilience or
springiness characterizes loss of elasticity [16].
A quantitative descriptive analysis was performed for the sensory
evaluation of the breads. Although 50 panellists are recommended for
this analysis, in this study 12 long trained judges participate in the
sensory evaluation, which agree with method of Heenan et al [34].
According to ANOVA results, the gluten-free breads differed
significantly (p<0.05) in crumb appearance, odour, springiness and
crumbliness, also significant differences (p<0.1) were found in colour
(Table 4). Conversely, no significant differences were observed in taste,

CAPÍTULO 2
91
Tab
le 4
. Se
nsor
y an
alys
is o
f diff
eren
t glu
ten-
free
bre
ad li
ke p
rodu
cts.
Sam
ple
code
s C
rum
b ap
pear
ance
Ta
ste
Odo
ur
C
olor
A
fterta
ste
Sprin
gine
ss
Har
dnes
s C
rum
blin
es
GFB
1 2.
57
bc
2.71
2.
28
bc
3.43
3.
14
1.86
a
3.14
2.
29
ab
GFB
2 2.
83
abc
2.33
2.
67
c 3.
00
2.67
3.
33
bc
2.67
3.
00
bc
GFB
3 2.
33
ab
2.66
3.
00
c 3.
00
3.33
2.
50
ab
3.33
2.
50
ab
GFB
4 2.
83
bcd
1.33
2.
00
abc
3.50
2.
50
4.83
d
4.17
1.
33
a G
FB5
3.33
bc
d 3.
00
2.16
ab
c 3.
83
2.67
2.
67
ab
3.67
3.
83
c G
FB6
4.00
d
2.66
2.
83
c 3.
83
3.83
4.
17
cd
3.67
2.
50
ab
GFB
7 3.
50
bcd
2.83
3.
00
c 3.
50
3.33
3.
33
bc
3.16
2.
33
ab
GFB
8 3.
16
bcd
2.66
2.
66
c 3.
17
3.50
4.
33
cd
3.33
2.
00
ab
GFB
9 1.
16
a 2.
16
1.16
a
1.83
2.
67
2.17
ab
2.
16
2.83
bc
G
FB10
3.
50
bcd
1.83
1.
50
ab
2.83
1.
83
1.33
a
2.17
2.
33
ab
GFB
11
3.67
cd
2.
50
2.66
c
3.67
3.
83
4.17
cd
3.
83
2.33
ab
p-
valu
e 0.
01
0.
24
0.03
0
0.07
8 0.
101
0.00
0
0.13
0 0.
033
Fo
r eac
h pa
ram
eter
val
ues f
ollo
wed
by
the
sam
e ar
e no
t sig
nific
antly
diff
eren
t at p
≤
0.05
.
CAPÍTULO 2
92
aftertaste and hardness. GFB6 showed the highest appearance score. The
less intense odour was perceived in GFB9. GFB4 received the highest
score for springiness. In general, GFB6 was scored higher for majority of
the sensorial attributes evaluated. Conversely, GFB9 and GFB10 were
scored lower for most of the sensory attributes. These results clearly
revealed great variability on sensory quality.
3.2. Relationship among technological and sensory parameters of
gluten free bread like products
The assessment of technological or instrumental quality is the most
preferred analysis for characterizing gluten-free breads because they are
not subjected to consumer perceptions, which are greatly dependent on
individual backgrounds, locations and so on. Therefore, the establishment
of possible relationship between sensory and quality parameters or within
the technological parameters would be very useful. With that purpose
multivariate data handling was applied by using Pearson correlation
analysis.
Significant correlations were observed within the parameters used for
characterizing gluten free bread like products, but they were mainly
obtained within the instrumental parameters (Table 5). Strong linear
relationships were observed within the colour parameters, but also a
strong positive linear relationship was obtained between L* and
cohesiveness (p<0.001) and resilience (p<0.001). Presumably, crumb
structure has great influence on the texture properties and the luminosity
of the crumb. The initial observation about the hardness and chewiness
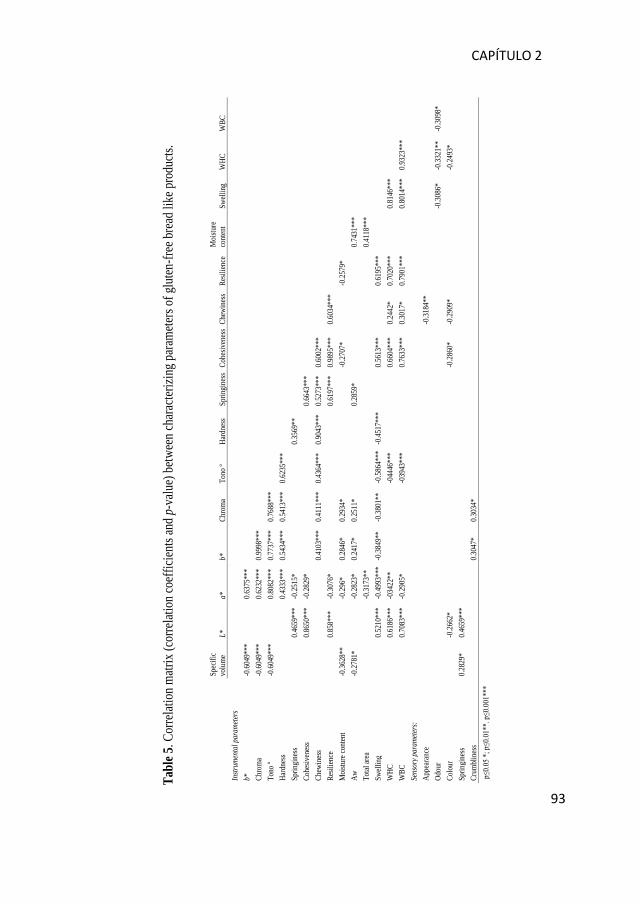
CAPÍTULO 2
93
Tabl
e 5. C
orrel
ation
matr
ix (c
orrel
ation
coef
ficien
ts an
d p-v
alue)
betw
een c
hara
cteriz
ing p
aram
eters
of gl
uten
-free
brea
d lik
e pro
ducts
.
Spec
ific
volu
me
L*
a*
b*
Chro
ma
Tono
º Ha
rdne
ss
Sprin
gine
ss
Cohe
siven
ess
Chew
ines
s Re
silien
ce
Moi
sture
co
nten
t Sw
ellin
g W
HC
WBC
In
strum
enta
l par
amete
rs
b*
-0.60
49**
*
0.637
5***
Ch
rom
a -0
.6049
***
0.6
232*
**
0.999
8***
Tono
º -0
.6049
***
0.8
082*
**
0.773
7***
0.7
688*
**
Hard
ness
0.4
333*
**
0.543
4***
0.5
413*
**
0.623
5***
Sprin
gine
ss
0.4
659*
**
-0.25
15*
0.3
569*
*
Co
hesiv
enes
s 0.8
650*
**
-0.28
29*
0.664
3***
Chew
ines
s
0.410
3***
0.4
111*
**
0.436
4***
0.9
043*
**
0.527
3***
0.6
002*
**
Resil
ience
0.858
***
-0.30
76*
0.619
7***
0.9
895*
**
0.603
4***
Moi
sture
cont
ent
-0.36
28**
-0.29
6*
0.284
6*
0.293
4*
-0
.2707
*
-0.25
79*
Aw
-0.27
81*
-0
.2823
* 0.2
417*
0.2
511*
0.2
859*
0.743
1***
Total
area
-0
.3173
**
0.411
8***
Swell
ing
0.5
210*
**
-0.49
93**
* -0
.3849
**
-0.38
01**
-0
.5864
***
-0.45
17**
*
0.561
3***
0.619
5***
W
HC
0.6
186*
**
-034
22**
-0
4446
***
0.660
4***
0.2
442*
0.7
020*
**
0.8
146*
**
WBC
0.708
3***
-0
.2905
*
-0
3943
***
0.763
3***
0.3
017*
0.7
901*
**
0.8
014*
**
0.932
3***
Sens
ory p
aram
eters
:
Ap
pear
ance
-0.31
84**
Odou
r
-0
.3086
* -0
.3321
**
-0.30
98*
Colo
ur
-0
.2662
*
-0
.2860
* -0
.2909
*
-0.24
93*
Sp
ringi
ness
0.2
829*
0.4
659*
**
Cr
umbl
ines
s
0.304
7*
0.303
4*
p≤0.0
5 *; p
≤0.01
**. p
≤0.00
1***

CAPÍTULO 2
94
trend was confirmed with the high relationship (r<0.9043) detected
between those parameters. Additionally, cohesiveness was strongly linear
related to resilience (r<0.9895), showing the importance of the internal
cohesion of the crumb on the ability to recover after compressing. In this
type of products, water activity showed a significant positive relationship
with the moisture content. It must be highlighted the relationships
observed among the crumb hydration properties and some other
parameters, since those properties have not been previously determined
in bread crumbs. Water hydration properties (swelling, WHC and WBC)
were significant positively related within them. Moreover, strong positive
relationships were observed between the WHC with resilience (r<0.7020)
and between WBC with cohesiveness (r<0.7633) and resilience
(r<0.7901).
Some relationships between sensorial parameters and instrumental
parameters were statistically significant, although the correlation
coefficients were rather low, which represent very weak or low linear
correlations (r≤0.35). With these types of products no linear relationships
were detected between the instrumental and sensory parameters likely
due to their complex formulations.
In order to propose a small number of parameters that allow gluten free
bread characterization, a principal component analysis (PCA) with the
significant quality parameters was carried out. Significant quality
parameters analysed by PCA indicated that six principal components
significantly (p< 0.05) discriminated between breads, which accounted
for 91% of the variability in the original data (data not showed). This
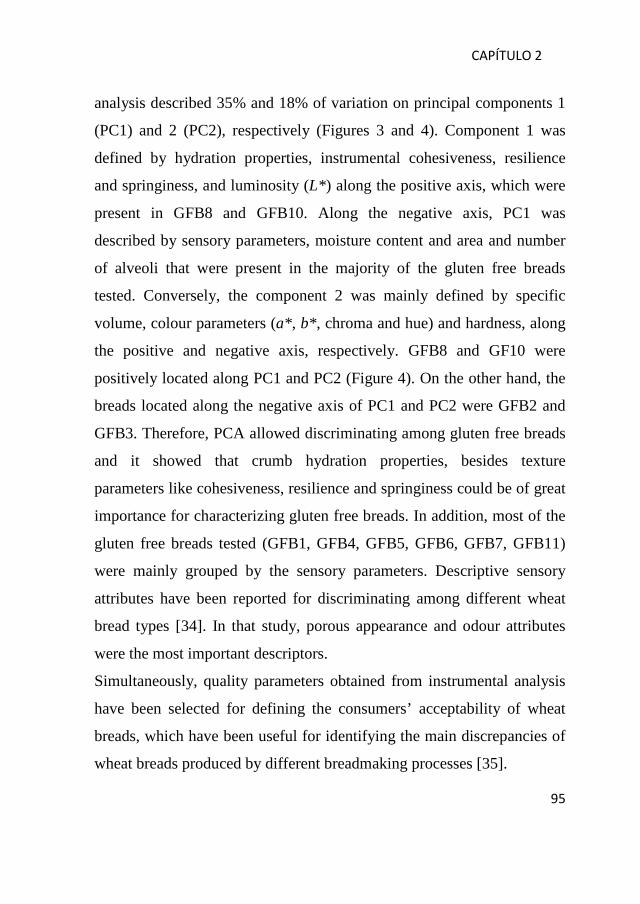
CAPÍTULO 2
95
analysis described 35% and 18% of variation on principal components 1
(PC1) and 2 (PC2), respectively (Figures 3 and 4). Component 1 was
defined by hydration properties, instrumental cohesiveness, resilience
and springiness, and luminosity (L*) along the positive axis, which were
present in GFB8 and GFB10. Along the negative axis, PC1 was
described by sensory parameters, moisture content and area and number
of alveoli that were present in the majority of the gluten free breads
tested. Conversely, the component 2 was mainly defined by specific
volume, colour parameters (a*, b*, chroma and hue) and hardness, along
the positive and negative axis, respectively. GFB8 and GF10 were
positively located along PC1 and PC2 (Figure 4). On the other hand, the
breads located along the negative axis of PC1 and PC2 were GFB2 and
GFB3. Therefore, PCA allowed discriminating among gluten free breads
and it showed that crumb hydration properties, besides texture
parameters like cohesiveness, resilience and springiness could be of great
importance for characterizing gluten free breads. In addition, most of the
gluten free breads tested (GFB1, GFB4, GFB5, GFB6, GFB7, GFB11)
were mainly grouped by the sensory parameters. Descriptive sensory
attributes have been reported for discriminating among different wheat
bread types [34]. In that study, porous appearance and odour attributes
were the most important descriptors.
Simultaneously, quality parameters obtained from instrumental analysis
have been selected for defining the consumers’ acceptability of wheat
breads, which have been useful for identifying the main discrepancies of
wheat breads produced by different breadmaking processes [35].
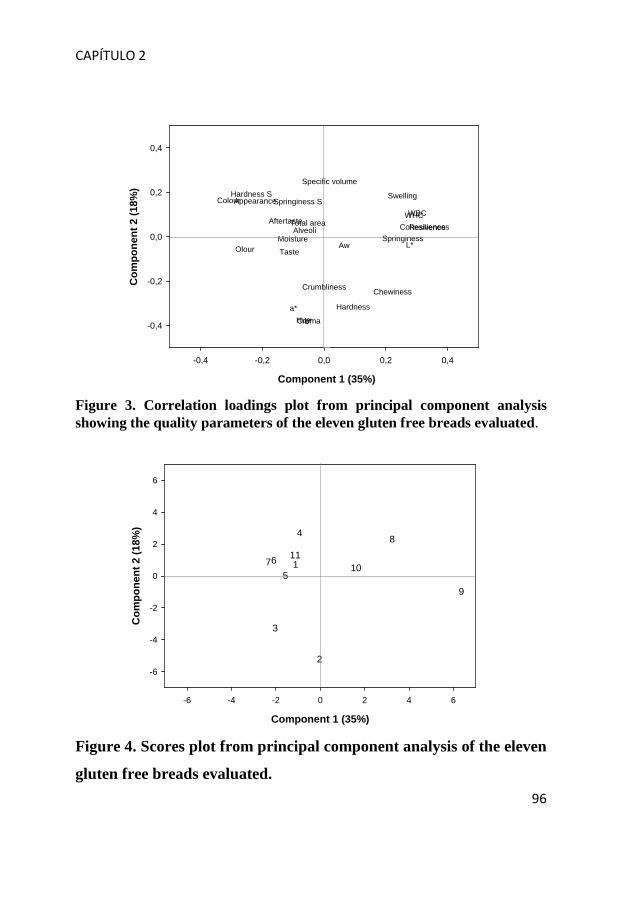
CAPÍTULO 2
96
Component 1 (35%)
-0,4 -0,2 0,0 0,2 0,4
Com
pone
nt 2
(18%
)
-0,4
-0,2
0,0
0,2
0,4
Specific volume
L*
a*b*CromaHue
Hardness
SpringinessCohesiveness
Chewiness
ResilienceMoisture
Aw
AlveoliTotal area
Swelling
WHCWBCAppearance
TasteOlour
Colour
Aftertaste
Springiness SHardness S
Crumbliness
Figure 3. Correlation loadings plot from principal component analysis showing the quality parameters of the eleven gluten free breads evaluated.
Component 1 (35%)
-6 -4 -2 0 2 4 6
Com
pone
nt 2
(18%
)
-6
-4
-2
0
2
4
6
1
2
3
4
567
8
9
1011
Figure 4. Scores plot from principal component analysis of the eleven
gluten free breads evaluated.
CAPÍTULO 2
97
Conclusions
The assessment of the physicochemical, hydration properties, crumb
texture and microstructure of a range of gluten free breads showed great
divergence among their properties and the same observation was
perceived in the sensory analysis. Sensory analysis revealed also great
divergences in crumb appearance, odour, springiness, crumbliness and
colour. Among all the assessed parameters, from the correlation matrix it
was observed that colour, texture and hydration parameters were highly
correlated within them. In addition, hydration properties were
significantly positive correlated with cohesiveness and resilience.
Significant but scientifically meaningless correlations were found
between sensory and instrumental parameters. According to the principal
component analysis, gluten free breads could be classified along the first
component on the basis of sensory properties (negative side) and
hydration properties, instrumental cohesiveness, resilience and
springiness (positive side). Therefore, sensory parameters described in
this study and also hydration properties besides texture parameters would
be suitable for characterizing bread-like gluten free products.
Acknowledgments
Authors acknowledge the financial support of Association of Celiac
Patients (Madrid, Spain), Spanish Scientific Research Council (CSIC)
and the Spanish Ministerio de Ciencia e Innovación (Project
AGL2008-00092/ALI). M.E. Matos would like to thank predoctoral

CAPÍTULO 2
98
grant from the Council of Scientific and Humanistic Development of
University Central of Venezuela (Caracas, Venezuela).
References
1. Murray JA (1999) The widening spectrum of celiac disease. Am J Clin
Nutr 69:354-365
2. Hamer RJ (2005) Coeliac disease: background and biomedical aspect.
Biotechnol Adv 23: 401-408
3. Hill ID, Dirks MH, Liptak GS, Colletti RB, Fasano A, Guandalini S
(2005) Guideline for the diagnosis and treatment of celiac disease in
children: recommendations of the North American Society for pediatric
gastroenterology, hepatology and nutrition. J Pediatr Gastroenterol Nutr
40:1-19.
4. Catassi C, Fasano A (2008) Celiac disease. In: EA Arendt, Dal Bello F
(Eds.) Gluten-Free Cereal Products and Beverages, pp.1-27.
Amsterdam/Boston/Heidelberg/London/New York/Oxford/Paris/San
Diego/San Francisco/Singapore/Sydney/Tokyo, Elsevier.
5. Gujral HS, Guardiola I, Carbonell, JV, Rosell, CM (2003) Effect of
cyclodextrin glycoxyl transferase on dough rheology and bread quality
from rice flour. J Agric Food Chem 51:3814-3818
6. Gallagher E, Gormley TR, Arent EK (2004) Recent advances in the
formulation of gluten-free cereal-based products. Trends in Food Science
and Technology 15:143-152
7. Demirkesen I, Mert B, Sumnu, G, Sahin S (2010) Rheological
properties of gluten-free bread formulations. J Food Eng 96: 295-303

CAPÍTULO 2
99
8. Gujral HS, Rosell CM (2004a) Functionality of rice flour modified by
microbial transglutaminase J Cereal Sci 39:225-230
9. Gujral HS, Rosell CM (2004b) Improvement of the breadmaking
quality of rice flour by glucose oxidase. Food Res Int 37: 75-81
10. Lazaridou A, Duta D, Papageorgiou M, Belc N, Biliaderis CG (2007)
Effects of hydrocolloids on dough rheology and bread quality parameters
in gluten-free formulations. J Food Eng 79: 1033-1047
11. Hathorn CS, Biswas MA, Gichuhi PN, Bowell-Benjamin AC (2008)
Comparison of chemical, physical, micro-structural, and microbial
properties of breads supplemented with sweet potato flour and high-
gluten dough enhancers. LWT Food Sci Technol 41:803-815
12. Marco C, Rosell CM (2008) Functional and rheological properties of
protein enriched gluten free composite flours. J Food Eng 88: 94-103
13. Sabanis D, Lebesi D, Tzia C (2009) Effect of dietary fibre enrichment
on selected properties of gluten-free bread. LWT Food Sci Technol
42:1380–1389
14. Brites C, Trigo MJ, Santos C, Collar C, Rosell CM (2010) Maize-
based gluten free: influence of processing parameters on sensory and
instrumental quality. Food Bioprocess Technol 3:707-715
15. Kim Y, Yokoyama W (2011) Physical and sensory properties of all-
barley and all-oat breads with additional hydroxypropyl methylcellulose
(HPMC) and β-glucan. J Agric Food Chem 59: 741-746
16. Onyango C, Mutungi C, Unbehend, G, Lindhauer, MG (2011)
Modification of gluten-free sorghum batter and bread using maize,
potato, cassava or rice starch. LWT Food Sci Technol 44: 681-686

CAPÍTULO 2
100
17. Khatkar BS, Bell AE, Schofield JD (1995) The dynamic rheological
properties of glutens and gluten sub-fractions from wheats of good and
poor breadmaking quality. J Cereal Sci 22: 29-44
18. Kadan RS, Robinson MG, Thibodeaux DP, Peperman AB (2001)
Texture and other physicochemical properties of whole rice bread. J Food
Sci 66: 940-944
19. Moore MM, Schober TJ, Dockery P, Arendt EK (2004) Textural
comparisons of gluten-free and wheat-based doughs, batters, and breads.
Cereal Chem 81: 567-575.
20. Pruska-Kędzior A, Kędzior Z, Gorący M, Pietrowska K, Przybylska
A, Spychalska K (2008) Comparison of rheological, fermentative and
baking properties of gluten-free dough formulations. Eur Food Res
Technol 227: 1523-1536
21. Clerice MTPS, Airoldi C, El-Dash AA (2009) Production of acidic
extruded rice flour and its influence on the qualities of gluten-free bread.
LWT- Food Sci Technol 42:618-623
22. Sciarini LS, Ribotta PD, León AE, Pérez GT (2010) Influence of
gluten-free flours and their mixtures on batter properties and bread
quality. Food Bioprocess Technol 3: 577–585 Doi: 10.1007/s11947-008-
0098-2.
23. Gallagher E, Kunkel A, Gormley TR, Arent, EK. (2003) The effect
of dairy and rice powder addition on loaf and crumb characteristics, and
shelf life (intermediate and long-term) of gluten-free stored in a modified
atmosphere. Eur Food Res Technol 218: 44-48

CAPÍTULO 2
101
24. McCarthy DF, Gallagher E, Gormley TR, Schober TJ, Arendt EK
(2005) Application of response surface methodology in the development
of gluten-free bread. Cereal Chem 82: 609-615
25. ICC (1994) Approved Methods of Analysis. Method 110/1
Determination of the Moisture Content of Cereals and Cereal Products
(Practical method). Approved 1960, revised 1976. International
Association of Cereal Science and Technology. Vienna, Austria
26. Kane AM, Lyon BG, Swanson RB, Savage EM (2003) Comparison
of two sensory and two instrumental methods to evaluated cookie colour.
J Food Sci 68:1831-1837
27. AACC International (2001) Approved Methods of Analysis (11th ed).
Method 56 30.01. Water Hydration Capacity of Protein Materials. AACC
International, St. Paul, MN, U.S.A
28. Gonzales-Barron U, Butler F (2006) A comparison of seven
thresholding techniques with the k-means clustering algorithm for
measurement of bread-crumb features by digital image analysis. J Food
Eng 74: 268-278
29. Armero E, Collar C (1997) Texture properties of formulated wheat
doughs. Relationships with dough and bread technological quality. Z
Lebensm Unters Forsch 204:136-145
30. Rosell CM, Rojas JA, Benedito C (2001) Influence of hydrocolloids
on dough rheology and bread quality. Food Hydrocolloids 15:75-81
31. Food Science Australia Fact Sheet. (2005). Water activity.
(http:/www/foodscience. afisc. csiro.au/water_fs-text.htm). pp. 1-6.

CAPÍTULO 2
102
32. Moore MM, Heinbockel M, Dockery P, Ulmer HM, Arendt EK
(2006) Network formation in gluten-free bread with application of
transglutaminase Cereal Chem 83: 28-36
33. Matos ME, Rosell CM (2011) Chemical composition and starch
digestibility of different gluten free breads. Plant Food Human Nutr 66:
224-230 Doi: 10.1007/s11130-011-0244-2.
34. Heenan SP, Dufour JP, Hamid N, Harvey W, Delahunty CM (2008)
The sensory quality of fresh bread: Descriptive attributes and consumer
perceptions. Food Res Int 41: 989-997
35. Curic D, Novotni D, Skevin D, Collar C, Le Bail A, Rosell CM
(2008) Design of a quality index for the objective evaluation of bread
quality. Application to wheat breads using selected bake off technology
for bread making. Food Res Int 41:714-719.

CAPÍTULO 3
QUALITY INDICATORS OF RICE BASED GLUTEN
FREE BREAD-LIKE PRODUCTS: RELATIONSHIPS
BETWEEN DOUGH RHEOLOGY AND QUALITY
CHARACTERISTICS
María E. Matos and Cristina M. Rosell
Food Bioprocess Technology (2012)
DOI 10.1007/S11947-012-0903-9

CAPÍTULO 3
105
Abstract
The design of gluten-free bread-like products involves the study of gluten-
free dough rheology and the resulting baked product characteristics, but
little information has been obtained connecting dough and baked product
properties. The aim of this study was to determine quality predictors of
gluten-free bread like products at dough level by defining possible
correlations between dough rheological properties and both instrumental
parameters and sensory characteristics of the those products. Diverse rice
based gluten-free doughs were defined and rheologically characterized at
dough level and the technological and sensorial quality of the resulting
baked products was investigated. Dough Mixolab® parameters, bread-like
quality parameters (moisture content, specific volume, water activity,
colour, and crumb texture), and chemical composition significantly
(P<0.05) discriminated between the samples tested. In general, the highest
correlation coefficients (r>0.70) were found when quality instrumental
parameters of the baked products were correlated with the dough Mixolab®
parameters, and lower correlation coefficients (r<0.70) were found when
sensory characteristics were correlated with dough rheology or instrumental
parameters. Dough consistency during mixing (C1), amplitude and dough
consistency after cooling (C5) would be useful predictors of crumb
hardness; and C5 would be also predictor of perceived hardness of gluten-
free bread-like products.
Key words: Rice flour; Gluten-free; Wheat free; Dough behaviour; Bread
quality
CAPÍTULO 3
106
1. Introduction
Gluten-free breads are products initially designed for people who have
intolerance to some specific peptides comprised in the gluten proteins
(Catassi & Fasano, 2008). Nevertheless, there is an increasing number of
people interested in wheat free foods motivated by health concern or
because they want to avoid wheat in the diet. Particularly, gluten from
wheat, rye, barley, triticale, and some varieties of oats (Comino et al., 2011)
must be eliminated from the diet of individuals suffering from celiac
disease.
Cereal products, especially breads, are basic components of the diet in many
countries due to their sensory characteristics or/and nutritional quality.
However, the manufacture of bread-like products without gluten results in
major technological problems for bakers. In fact, many gluten-free products
available on the market are often of poor technological quality, exhibiting
low volume, poor color, and crumbling crumb, besides great variation in the
nutrient composition, with low protein and high fat contents (Matos &
Rosell, 2011). A range of bread-like gluten-free products has been designed
to provide coeliac disease sufferers or wheat free diet eaters with bread
substitutes. The term gluten-free bread is generally used for referring to a
gluten-free bakery product that is eaten as bread substitute, but has different
characteristics than wheat bread, because of that, the term gluten-free bread-
like products was preferred in this manuscript. The gluten-free bread recipes
contain mainly rice or maize flours combined with potato, maize or wheat
starches (Gujral & Rosell, 2004; Gallagher et al., 2004; Demirkesen et al.,
2010; Matos & Rosell, 2011).
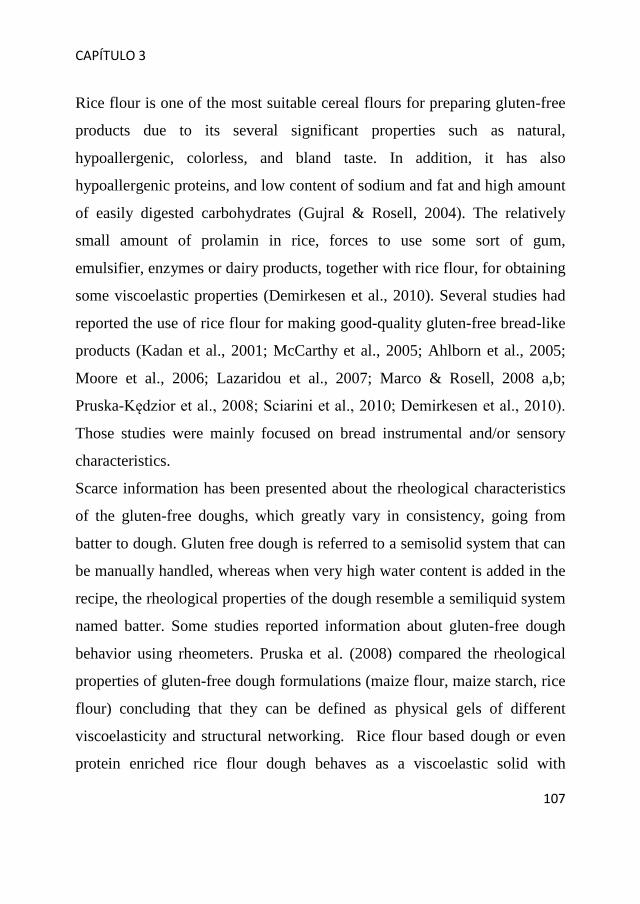
CAPÍTULO 3
107
Rice flour is one of the most suitable cereal flours for preparing gluten-free
products due to its several significant properties such as natural,
hypoallergenic, colorless, and bland taste. In addition, it has also
hypoallergenic proteins, and low content of sodium and fat and high amount
of easily digested carbohydrates (Gujral & Rosell, 2004). The relatively
small amount of prolamin in rice, forces to use some sort of gum,
emulsifier, enzymes or dairy products, together with rice flour, for obtaining
some viscoelastic properties (Demirkesen et al., 2010). Several studies had
reported the use of rice flour for making good-quality gluten-free bread-like
products (Kadan et al., 2001; McCarthy et al., 2005; Ahlborn et al., 2005;
Moore et al., 2006; Lazaridou et al., 2007; Marco & Rosell, 2008 a,b;
Pruska-Kędzior et al., 2008; Sciarini et al., 2010; Demirkesen et al., 2010).
Those studies were mainly focused on bread instrumental and/or sensory
characteristics.
Scarce information has been presented about the rheological characteristics
of the gluten-free doughs, which greatly vary in consistency, going from
batter to dough. Gluten free dough is referred to a semisolid system that can
be manually handled, whereas when very high water content is added in the
recipe, the rheological properties of the dough resemble a semiliquid system
named batter. Some studies reported information about gluten-free dough
behavior using rheometers. Pruska et al. (2008) compared the rheological
properties of gluten-free dough formulations (maize flour, maize starch, rice
flour) concluding that they can be defined as physical gels of different
viscoelasticity and structural networking. Rice flour based dough or even
protein enriched rice flour dough behaves as a viscoelastic solid with
CAPÍTULO 3
108
storage modulus (G′) higher than loss modulus (G″) (Gujral & Rosell 2004;
Marco & Rosell, 2008b). The incorporation of resistant starch increases
storage (G′) and loss (G″) moduli of gluten-free doughs, increasing their
elastic behaviour (Korus et al., 2009). Other researchers have studied the
rheological properties of different gluten-free doughs by extrusion and
penetration tests using a Texture Analyzer (Moore et al., 2006; Sciarini et
al., 2010; Onyango et al., 2011) and the average force after reaching a
plateau was used as indicator of batter firmness or consistency. Rapid Visco
Analyzer (Kim & Yokoyama, 2011) and Viscoamylograph (Sciarini et al.,
2010) also gave information about the pasting properties of the batters.
Additionally, mixing and pasting behaviour of different rice flour based
doughs were studied using the Mixolab® (Marco & Rosell, 2008a).
Nevertheless, the information about dough or batter rheological properties
has rarely been exploited when designing or developing gluten-free bread
like products, neither it has been used for predicting bread characteristics.
The main objective of this study was to define predictors of the quality of
gluten-free bread-like products at dough level. With that aim, different
gluten-free rice based doughs were defined to cover a range of gluten-free
doughs with different rheological features, and in consequence, to obtain
gluten-free bread like products with diverse technological and sensorial
quality. The Mixolab® was used to obtain a complete characterization of the
gluten-free dough behaviour by recording the mechanical changes during
mixing and heating simulating the mechanical work as well as the heat
conditions that might be expected during the baking process. Different

CAPÍTULO 3
109
correlations between rheological dough properties and quality parameters of
gluten-free bread-like products were established.
2. Materials and methods
2.1. Materials
Commercial gluten-free blend (corn starch, whole egg powder, sugar,
xanthan gum and salt) was generously donated by Huici-Leidan SA (Huarte,
Spain). Commercial rice flour, supplied by Harinera Los Pisones (Zamora,
Spain), had moisture and protein contents of 11.5g/100g and 6g/100g,
respectively. Soybean protein isolate was from Trades SA (Barcelona,
Spain). The soybean protein isolate had moisture, protein, lipid, ash and
carbohydrates (calculated by difference) contents of 6.9, 80.8, 0.2, 3.6 and
8.5 g/100g, respectively. Composition of the different ingredients was
determined following the ICC Standard Methods (1994). Corn starch, potato
starch, skim milk powder and whole egg powder were obtained from EPSA,
(Valencia, Spain). HPMC (Methocel K4M) was obtained from Dow
Chemical (Pittsburg, USA). Xanthan gum food grade from Jungbunzlauer
(Ladenburg, Germany) has an apparent viscosity of 6.0 mPas at 24ºC. Pectin
(GENU®pectin 150 USASAG type Baking, PKelco) was provided by
Puratos (Groot-Bijgaarden, Belgium). Vegetal seed oil, compressed yeast,
commercial sugar and salt were purchased from local market. All reagents
were of analytical grade.
2.2. Mixolab® Measurements

CAPÍTULO 3
110
Mixing and pasting behaviour of the gluten-free flour blends were studied
using the Mixolab® (Chopin, Tripette et Renaud, Paris, France), which
allows mixing the dough under controlled temperature and also a
temperature sweep until 90ºC followed by a cooling step. It measured in real
time the torque (expressed in Nm) produced by passage of dough between
the two kneading arms, thus allowing the study of its physico-chemical
behaviour. All ingredients used on each formulation (Table 1), with the
exception of yeast, were introduced into the Mixolab® bowl and mixed. The
settings used in the test were 8 min for initial mixing, temperature increase
at 2.3 ºC/min until 90 ºC, 7 min holding at 90 ºC, temperature decrease at
4ºC/min until 50ºC, and 5 min holding at 50ºC; and the mixing speed during
the entire assay was 80 rpm. Three replicates were carried out for each
formulation. The following parameters were obtained from the recorded
curve: initial consistency (C1), stability (min) or elapsed time at which the
torque produced is kept constant, minimum torque (Nm) or the minimum
value of torque produced by dough passage subjected to mechanical and
thermal constraint (C2), peak torque (Nm) or the maximum torque during
the heating stage (C3), the minimum torque during the heating period (Nm)
(C4) and the torque obtained after cooling at 50ºC (C5). Additionally,
derived parameters were calculated: cooking stability range (C4-C3) and
cooling setback or gelling (C5-C4). Detailed description of physical changes
that occurred along Mixolab® measurement (mixing, pasting and

CAPÍTULO 3
111
Tab
le 1
. Glu
ten-
free
dou
gh fo
rmul
atio
ns
+ In
gred
ient
pre
sent
in th
e co
mm
erci
al b
lend
Ingr
edie
nts
F1
F2
F3
F4
F5
F6
F7
Com
mer
cial
GF
blen
d, g
10
00
- -
- -
- -
Ric
e flo
ur, g
-
1000
10
00
350
400
696
500
Cor
n st
arch
+
- -
225
200
130
- Po
tato
star
ch
- -
- 30
0 40
0 17
4 50
0 Fr
esh
yeas
t, g
50
30
28
20
50
22
50
Salt,
g
- 18
24
17
15
17
20
Su
gar,
g 10
30
12
0 10
60
78
50
Veg
etal
oil,
g
- 60
56
-
30
52
60
Skim
milk
pow
der,
g -
- -
- -
39
100
Who
le e
gg p
owde
r, g
+
- -
- -
174
- So
y pr
otei
n, g
-
- -
125
- -
- X
anth
an g
um, g
+
- -
10
- 16
-
HPM
C, g
-
40
28
- -
4 22
Pe
ctin
, g
- -
- -
50
- -
Wat
er (m
L)
600
1100
10
60
1050
90
0 56
5 79
0

CAPÍTULO 3
112
gelling) was gathered by Rosell et al. (2007). Recently, detailed information
about Mixolab® parameters has been reported by Marco & Rosell (2008a)
and Rosell et al. (2010).
2.3. Breadmaking Process
Different gluten-free rice formulations were initially selected to cover a
range of gluten-free doughs with different rheological features, and in
consequence, gluten-free bread like products with diverse technological and
sensorial quality. Bread formulations were based on reported recipes (Marco
& Rosell, 2008a; McCarthy et al., 2005; Kadan et al., 2001; Moore et al.,
2006; Pruska-Kędzior et al., 2008; Ahlborn et al., 2005; Sciarini et al., 2010;
Demirkesen et al., 2010), which were modified according to preliminary
rheological results. Seven formulations were used to obtain gluten-free
bread-like products (BF), one was based on corn starch (commercial blend)
and in the other, rice flour was the major ingredient, present individually or
blended with potato or corn starch. They contained different ingredients
(starches, proteins, other hydrocolloids) widely used in the design of gluten-
free bread type products. The formulations used are showed in Table 1,
which were based on the following: 1000g of corn starch (F1); 1000g of rice
flour (F2, F3); 1000g of blend of rice flour + corn and potato starches (F4,
F5, F6); and 1000g of blend of rice flour + potato starch (F7). Gluten-free
batters or doughs were prepared in a spiral mixer (AV18/2, Vimar Industries
1900, S.L., Sabadell, Spain) by mixing all or part of the flour and the other
ingredients with the water determined in preliminary test (Table 2). Dough
pieces (400g) or batters (400g) were placed into regular metallic, lard coated

CAPÍTULO 3
113
pans and proofed in a cabinet at 85% relative humidity during the time
(min) and temperature (ºC) detailed in Table 2. The batter or dough pieces
were baked in an electric convection oven (Eurofours, Gommegnies,
France) as described in Table 2. After baking, loaves were removed from
the pans and kept at room temperature for 2 hours to cool down. Loaves
packed in polyethylene bags to prevent drying were stored at 24 ºC for 24
hours and then used for bread quality assessment. Four loaves were obtained
from each formulation. Duplicates were carried out in different days.
2.4. Quality Assessment of Gluten-free Bread-like Products
2.4.1. Instrumental quality parameters
The moisture content of gluten-free bread-like samples was determined
following the ICC (1994). Volume was determined by the rapeseed
displacement method. Specific volume (cm3 /g) of the individual loaf was
calculated by dividing volume by weight. Water activity of samples was
measured using an Aqua Lab Series 3 (Decagon devices Pullman, USA) at
22ºC. The colour of the crumb samples was measured at three different
locations by using a Minolta colorimeter (Chromameter CR-400/410,
Konica Minolta, Tokyo, Japan) after standardization with a white calibration
plate (L*= 96.9, a*= -0.04, b*=1.84). The colour was recorded using CIE-
L*a*b* uniform colour space (CIE-Lab) where L* indicates lightness, a*
indicates hue on a green (-) to red (+) axis, and b*

CAPÍTULO 3
114
Tab
le 2
Bre
adm
akin
g pr
oces
s con
ditio
ns fo
r ea
ch g
lute
n-fr
ee d
ough
form
ulat
ions
B
reak
mak
ing
F1
F2
F3
F4
F5
F6
F7
Mix
ing
Proc
edur
e M
ix a
ll in
gred
ient
s
a) M
ix 5
00g
rice
flour
with
550
ml
boili
ng w
ater
for
5min
, coo
l dow
n til
l 35º
C.
b) A
dd th
e re
st o
f in
gred
ient
s
a) M
ix w
ater
, ric
e flo
ur a
nd o
il
b) M
ix o
ther
dry
in
gred
ient
s c)
Mix
(a+b
)
a)M
ix y
east
in
a so
lutio
n of
suga
r and
w
ater
b)
Add
the
rest
of
ingr
edie
nts
Mix
all
ingr
edie
nts
a)M
ix y
east
in
a so
lutio
n of
suga
r an
d w
ater
b)
Add
slow
ly
xant
han
gum
and
H
PMC
dur
ing
3min
mix
ing
c) A
dd re
st o
f in
gred
ient
s
a)M
ix y
east
with
w
ater
and
then
oil
b) M
ix d
ry
ingr
edie
nts f
or 1
min
c)
Mix
a+b
Tim
e (m
in)
5 5
10
10
3 5
(then
hol
d 10
m
in),
3
2
Ferm
enta
tion
Tim
e (m
in)
45
60
40
30
40
50
35
Tem
pera
ture
(º
C)
30
30
35
30
35
30
40
Bak
ing
Ti
me
(min
) 25
60
45
45
30
50
25
Te
mpe
ratu
re
(ºC
) 21
0 17
5 19
0 19
0 20
0 19
0 23
0

CAPÍTULO 3
115
indicates hue on a blue (-) to yellow (+) axis. Data from three slices per
sample were averaged.
The crumb hardness was measured on uniform slices of 10mm thickness.
Three slices from the centre of each loaf were used for texture evaluation.
Texture profile analysis (TPA) was performed using a universal testing
machine TAXT2i (Stable Micro Systems, Surrey, UK) equipped with a 30-
Kg load cell and 25-mm aluminium cylindrical probe. Crumbcharacteristics
were assessed using a texture analyser (TAXT2i texture analyser Stable
Micro Systems, Surrey, UK). The settings used were a test speed of 2.0
mm/s with a trigger force of 5 g to compress the middle of the bread crumb
to 50% of its original height at a crosshead speed of 1mm/s. Values were the
mean of at least three replicates.
2.4.2. Chemical Composition
The chemical composition of the samples was determined according to ICC
corresponding standard methods (ICC, 1994), namely, the moisture content
(ICC standard 110/1), fat (ICC 136), proteins (N x 6.25) (ICC 105/2) and
ash (ICC 104/1). Total carbohydrates were determined by difference
subtracting 100 g minus the sum of protein, ash and fat expressed in
grams/100 grams FAO (2003). Determinations were carried out in triplicate.
2.4.3. Sensorial Analysis
A descriptive sensory analysis was performed for evaluating the sensory
characteristics of the gluten-free bread-like products. Sensory analysis was
carried out with ten trained panellists under normal lightening conditions
CAPÍTULO 3
116
and at room temperature. The range of time that the test panellist had
participated in descriptive analysis and scale rating of a wide range of bread
products varied from 3 to 20 years. Samples were presented in slices (1cm
thick) on plastic dishes coded and served in a randomised order. Preliminary
training test was performed to define the best descriptors for characterizing
the product. Panellists were sat in a round table and after evaluating the
sample, an open discussion was initiated to define the best descriptors for
characterizing the product. Evaluation included perception at first glance of
the bread slice (crust and crumb included) and mastication with the molar
teeth up to swallowing. The attributes assessors finally agree were
appearance (by observing the product slice), odour, colour, taste, texture
attributes during chewing and springiness (ability to regain original shape
after pressing down the crumb with the middle finger). The descriptors for
each attributes were appearance (visually liking or disliking), odour (scale
goes from high when typical of bread or bakery products to low,
uncharacteristic of bakery products), colour (scales goes from high
yellow/beige to low when brown or grey), taste (scale goes from high when
typical taste of bread or bakery products to low, uncharacteristic of bakery
products), texture attributes during chewing (scales goes from hard-soft,
crumbly-cohesive). Attribute intensity was scored on a scale varying from 1
to 5. Samples were considered acceptable if their mean score for overall
acceptance was above 3.0 (neither like nor dislike).
2.5. Statistical Analysis

CAPÍTULO 3
117
For each quality parameter, a one way analysis of variance (ANOVA) was
applied using Statgraphics Plus V 7.1 (Statistical Graphics Corporation,
UK). Fisher’s least significant differences (LSD) test was used to assess
significant differences (P<0.05) among samples that might allow
discrimination among them. Additionally, Pearson correlation analysis was
applied to establish possible relationships between the rheological dough
properties and both instrumentals and sensorial quality parameters of the
gluten-free bread-like products.
3. Results and discussion
3.1. Mixing and Pasting Properties of Gluten-free Doughs
Figure 1 show the curves obtained from the Mixolab® corresponding to the
seven gluten-free dough formulations evaluated. Plots reflected the dough
changes due to both the mixing force and the temperature. The patterns
obtained during mixing, overmixing, pasting and gelling greatly varied with
the mixture composition, which was expected considering the complex
blend of ingredients (Table 1). The presence of different proteins and
starches modifies protein-protein interactions and also the starch
gelatinization and the gelling processes (Rosell et al., 2007; Marco &
Rosell, 2008a; Rosell et al., 2010). All Mixolab® parameters significantly
(P<0.05) discriminated among the formulated dough tested (Table 3).
During the mixing and overmixing, significant variation was observed in the
dough maximum consistency, time to reach that consistency and the
stability (Table 3). Some formulations yielded
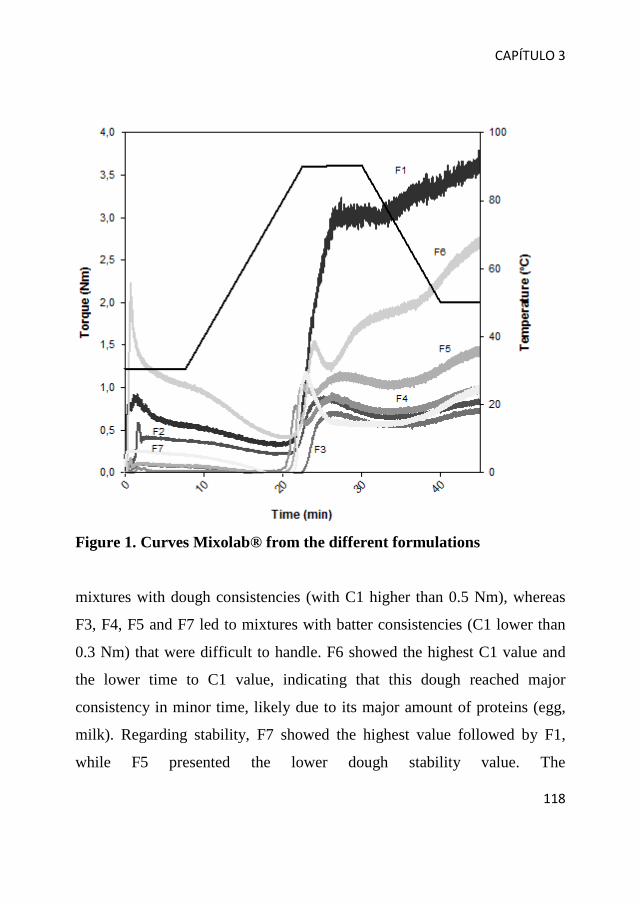
CAPÍTULO 3
118
Figure 1. Curves Mixolab® from the different formulations
mixtures with dough consistencies (with C1 higher than 0.5 Nm), whereas
F3, F4, F5 and F7 led to mixtures with batter consistencies (C1 lower than
0.3 Nm) that were difficult to handle. F6 showed the highest C1 value and
the lower time to C1 value, indicating that this dough reached major
consistency in minor time, likely due to its major amount of proteins (egg,
milk). Regarding stability, F7 showed the highest value followed by F1,
while F5 presented the lower dough stability value. The

CAPÍTULO 3
119
Tabl
e 3
Ric
e-ba
sed
doug
h ch
arac
teris
tics d
urin
g m
ixin
g an
d he
atin
g de
term
ined
by
usin
g th
e M
ixol
ab®
F11.
37±0
.05
bc0.
88±0
.10
d2.
49±0
.30
e0.
07±0
.01
b0.
33±0
.01
b3.
07±0
.03
e2.
99±0
.04
d3.
64±0
.6e
-0.0
8±0.
00d
0.65
±0.0
5d
F21.
79±0
.03
c0.
56±0
15c
0.51
±0.0
8b
0.07
±0.0
0 b
0.22
±0.0
1b
0.87
±0.0
1b
0.65
±0.0
6ab
0.84
±0.0
8a
-0.2
2±0.
00b
0.19
±0.0
2a
F31.
01±0
.10
ab0.
14±0
.20
ab1.
29±0
.15
d0.
01±0
.00
a0.
01±0
.00
a0.
69±0
.05
a0.
56±0
.07
a0.
74±0
.07
a-0
.13±
0.00
c0.
18±0
.02
aF4
1.70
±0.1
1c
0.05
±0.1
8a
1.00
±0.2
1c
0.01
±0.0
0a
0.02
±0.0
1a
0.77
±0.0
3ab
0.70
±0.0
4b
1.00
±0.0
5b
-0.0
8±0.
00d
0.30
±0.0
5b
F50.
75±0
.19
a0.
14±0
.15
ab0.
09±0
.13
a0.
04±0
.02
ab0.
01±0
.00
a1.
05±0
.07
c1.
03±0
.05
c1.
45±0
.04
c-0
.02±
0.00
e0.
42±0
.05
cF6
0.67
±0.2
1a
1.77
±0.1
3e
0.48
±0.0
3b
0.29
±0.0
1c
0.23
±0.0
1b
1.30
±0.0
6d
1.07
±0.0
3c
2.61
±0.0
7d
-0.2
3±0.
01b
1.54
±0.0
6e
F71.
03±0
.15
ab0.
26±0
.09
b5.
46±0
.27
f0.
02±0
.01
a0.
00±0
.00
a1.
15±0
.05
c0.
57±0
.03
a1.
00±0
.06
b-0
.58±
0.02
a0.
43±0
.04
cp-
valu
e0.
0024
0.00
000.
0000
0.00
000.
0003
0.00
000.
0000
0.00
000.
0000
0.00
00
Gelli
ng, C
4-C3
, Nm
Dou
gh
Code
sCo
okin
g st
abili
ty
rang
e,C4
-C3,
Nm
C4,
Nm
C5, N
mC3
, Nm
Am
plitu
de, N
mC2
, Nm
C1, N
mSt
abili
ty, m
inTi
me
to C
1, m
in
V
alue
s are
mea
ns ±
stan
dard
dev
iatio
n. D
iffer
ent l
ette
rs w
ithin
a c
olum
n m
ean
sign
ifica
nt d
iffer
ence
s (P<
0.05
). C
1: in
itial
con
sist
ency
; C2:
min
imum
torq
ue; C
3: m
axim
um to
rque
dur
ing
the
heat
ing;
C4:
min
imum
torq
ue d
urin
g th
e he
atin
g pe
riod;
C5:
to
rque
obt
aine
d af
ter c
oolin
g at
50º
C.

CAPÍTULO 3
120
amplitude, indicative of the role of water in the lubrication during mixing
(Rosell & Collar, 2009) showed also significant differences, and thus
different extensional properties of the evaluated doughs. The simultaneous
mechanical shear stress and temperature led to a minimum torque that has
been related to protein unfolding or protein weakening (Rosell et al., 2007).
The values for C2 were quite low compared with the ones detected for
wheat dough (0.4-0.5 Nm). That result might be ascribed to the protein
thermal properties rather than to the amount of proteins, since some gluten-
free doughs had very high protein content (F4 and F6). As temperature
increases, starch gelatinization occurs and therefore viscosity increases,
which is detected as an increase in torque (Rosell et al., 2007). As was
expected F1 showed the highest C3 value, likely due to its highest starch
content, specifically corn starch (Table 1). In the case of F2 and F3 (only
with rice flour as starch source), a delayed peak corresponding to starch
gelatinization was observed, derived from the high gelatinization
temperature of the rice starch. It should be remarked that two gelatinization
peaks were observed in F4, F5 and F6. Those peaks resulted from the
presence of different starches (rice, corn and potato) with diverse pasting
temperatures, being 65.4ºC for potato starch, 69.9ºC for corn starch and
70.2ºC for rice flour. Furthermore, it must be taken into account that
hydrocolloids like xanthan gum, HPMC or pectin, contained in the doughs
can retain water, competing with the starch for the available water, limiting
the starch granule swelling and, therefore promoting a delay in the pasting
process (Rosell et al., 2011).

CAPÍTULO 3
121
During temperature holding at 90ºC, a reduction in consistency occurred,
which is related to the physical breakdown of the starch granules. F1
showed the highest value, likely due to the high content of corn starch in
this dough.
After cooling, F1 presented the highest C5 value followed by F6 and F5.
The cooling process was accompanied by an enhancement of dough
consistency associated to starch gelling, due to amylose chains
crystallization, which is greatly dependent on the starch type and the
presence of gelling additives or ingredients with water binding ability
(Rosell et al., 2007; Rosell et al., 2010). Regarding the secondary
parameters, all doughs showed very low cooking stability range (C4-C3);
whereas the cooling setback (C4-C5) was only significantly higher for F1
and F6 (Table 3). High setback value suggests that dough presents high
retrogradation tendency and, consequently the baked product prepared from
this dough would undergo high staling rate over storage.
Some studies have been published about the effect of gelling agents and
proteins on the mechanical properties of wheat dough due to dual mixing
and temperature constraint using the Mixolab® (Collar et al., 2007; Marco &
Rosell, 2008a, Rosell & Collar, 2009; Rosell et al., 2010). Those studies
concluded that the effect of gelling or thickening agents on the mechanical
properties greatly depends on the nature of the added polymer and the type
of interaction among them. Moreover, the addition of proteins to wheat or
rice flour also led to changes on the mechanical and baking properties,
depending on the protein source (Bonet et al., 2006; Marco & Rosell,
2008a).
CAPÍTULO 3
122
3.2. Bread Quality Assessment
Gluten-free bread-like products (BF1-BF7) obtained from the formulated
doughs (F1-F7) presented important crumb differences regarding colour,
appearance, shape, size and volume (Figure 2). The values obtained for
specific volume, crumb colour, moisture content, water activity,
height/width ratio and hardness are showed in Table 4. All instrumental
quality parameters tested significantly (P<0.05) discriminated among
samples. Specific volume values ranged from 1.44 to 3.03 cm3/g, except for
BF2 (4.48 cm3/g) and BF7 (5.07 cm3/g), which showed the highest alues of
specific volume. In general, values of specific volume obtained in this study
agree with previous reports (Hathorn et al., 2008, Marco & Rosell, 2008a;
Sabanis et al., 2009, Sciarini et al., 2010).
The L*, a* and b* values for crumb colour showed significant (P<0.05)
differences among gluten-free bread-like products (Table 4). The lower
values of L* (lightness) were obtained for BF4 and BF6, which had in
common the presence of xanthan gum, and proteins blend (soybean protein
in BF4 or skim milk powder and whole egg powder in BF6). Likely,
soybean proteins and egg powder could be responsible of decreasing
lightness, since BF7, containing only skim milk powder as protein source
showed the highest L* value. Regarding a*, all showed negative (green hue)
values, with exception of BF6. The b* scale showed positive value (yellow
hue) for all samples evaluated. BF6 exhibited significantly higher b* value
than the other samples, derived from the original yellow pigment of the egg
powder added as ingredient in this formulation.
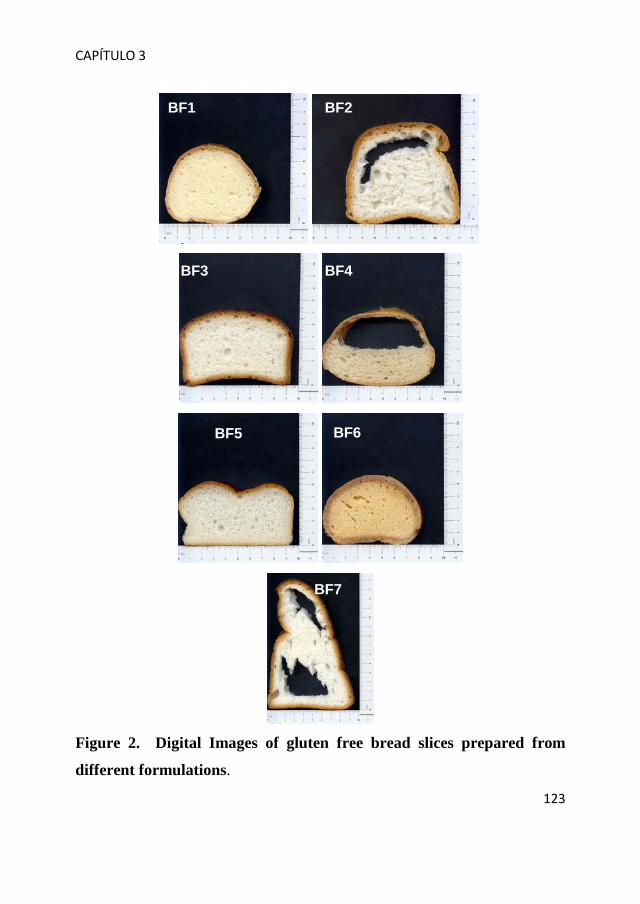
CAPÍTULO 3
123
Figure 2. Digital Images of gluten free bread slices prepared from
different formulations.
BF5 BF6
BF7
BF3 BF4
BF1 BF2

CAPÍTULO 3
124
Tab
le 4
. In
stru
men
tal q
ualit
y pa
ram
eter
s of t
he g
lute
n-fr
ee b
read
-like
pro
duct
s V
alue
s are
mea
ns ±
stan
dard
dev
iatio
n. D
iffer
ent l
ette
rs w
ithin
a c
olum
n m
ean
sign
ifica
nt d
iffer
ence
s (P<
0.05
). TP
A-H
ardn
ess:
Cru
mb
hard
ness
mea
sure
d w
ith a
text
urom
eter
.
Cru
mb
colo
ur p
aram
eter
s
Sa
mpl
es
code
s
Spec
ific
V
olum
e,
cm3 /g
L*
a*
b*
Moi
stur
e
cont
ent,
%
W
ater
ac
tivity
TP
A-H
ardn
ess,
N
BF1
1.
91
± 0.
05
b
78.3
1 ±
0.76
d
-2
.59
± 0.
17
a
14.4
7 ±
0.79
d
37
.17
± 0.
07
c
0.96
±
0.00
c
84
.90
± 3.
07
c B
F2
4.48
±
0.02
f
72
.17
± 1.
01
c
-1.2
1 ±
0.20
bc
7.13
±
1.02
b
37
.97
± 0.
04
d
0.96
±
0.00
c
1.
33
± 0.
33
a B
F3
3.03
±
0.04
e
73
.79
± 2.
87
c
-0.8
9 ±
0.16
cd
6.30
±
0.25
b
37
.40
± 0.
17
c
0.95
±
0.00
b
2.
30
± 0.
30
a B
F4
2.52
±
0.04
d
62
.24
± 0.
81
a
-0.8
0 ±
0.15
d
12
.15
± 0.
54
c
43.5
3 ±
0.32
f
0.
97
± 0.
00
d
36.2
7 ±
2.93
b
BF5
2.
41
± 0.
04
c
65.7
7 ±
0.27
b
-1
.22
± 0.
02
bc
5.
06
± 0.
12
a
39.3
0 ±
0.08
e
0.
97
± 0.
00
d
7.53
±
0.46
a
BF6
1.
44
± 0.
03
a
63.4
0 ±
0.62
a
1.
72
± 0.
43
e
21.8
9 ±
0.37
e
25
.67
± 0.
30
a
0.92
±
0.00
a
14
7.50
±
11.1
2 d
BF7
5.
07
± 0.
08
g
81.5
0 ±
0.09
e
-1
.53
± 0.
04
bc
6.
47
± 0.
15
b
33.3
3 ±
0.06
b
0.
95
± 0.
00
b
5.43
±
0.51
a
P- v
alue
0.
000
0.00
0
0.
000
0.00
0
0.
000
0.00
0
0.
000

CAPÍTULO 3
125
Significant differences (P<0.05) in crumb moisture and water activity were
found among the different gluten-free bread-like samples (Table 4).
Differences in water activity and moisture content could be attributed to
differences in the recipes. In fact, BF6 showed the lowest water activity and
moisture content, which can be ascribed to the presence of whole egg
powder in the formulation. The highest moisture content was observed in
BF4 that contained soy protein, which agrees with results of Marco &
Rosell (2008a) when incorporating soybean proteins to gluten-free breads.
Overall, the crumb moisture contents were lower than those reported by
other researchers (Sabanis et al., 2009; Marco & Rosell 2008a; Matos &
Rosell, 2011).
Wide variation in the crumb hardness (1.3 N to 147.5 N) was observed
among the gluten-free bread-like samples (Table 4). These results reflect
large differences depending on type of formulation used for obtaining the
experimental gluten-free baked products. Frequently, gluten-free bread-like
products due to their complex formulation, mainly based in carbohydrates
(Matos & Rosell, 2011), present high crumb hardness when compared to
standard wheat bread.
Table 5 shows the macronutrients compositions of the seven gluten-free
bread specialities evaluated in this study. Analysis of data collected using
ANOVA showed that all chemical composition significantly (P<0.05)
discriminated between the baked samples. Protein and fat content ranged
between 3.30-14.97 g/100g, and 0.20-9.57 g/100g, respectively. In regard to
protein content, it was high in the gluten-free bread-like samples BF4 and
BF6 which contained more proteins, while BF6 and BF7 were the

CAPÍTULO 3
126
Tab
le 5
. Pr
oxim
ate
com
posi
tion
of th
e gl
uten
-fre
e br
ead-
like
prod
ucts
(*)T
otal
Car
bohy
drat
e (d
m) b
y di
ffer
ence
: 10
0 –
(wei
ght i
n gr
ams [
prot
ein
+ fa
t + a
sh] i
n 10
0 g
of fo
od) (
FAO
. 200
3).
V
alue
s are
mea
ns ±
stan
dard
dev
iatio
n. D
iffer
ent l
ette
rs w
ithin
a c
olum
n m
ean
sign
ifica
nt d
iffer
ence
s (P<
0.05
).
Sam
ple
Cod
es
Prot
ein,
g/
100g
, dm
Fat,
g/
100g
, dm
M
iner
als,
g/
100g
, dm
To
tal C
arbo
hydr
ate*
g/
100g
, dm
B
F1
3.30
±
0.00
a
0.9
7 ±
0.02
b
1.37
± 0
.12
bc
94.3
6 ±
0.16
f
BF2
7.
57
± 0.
12 e
3
.40
± 0.
01 d
1.
13 ±
0.0
8 a
87.9
0 ±
0.08
d
BF3
7.
10
± 0.
04 c
3
.70
± 0.
00 e
1.
31 ±
0.0
0 b
87.8
9 ±
0.18
d
BF4
14
.97
± 0.
00 g
0
.20
± 0.
02 a
1.
47 ±
0.0
3 c
83.3
6 ±
0.31
b
BF5
3.
63
± 0.
03 b
1
.87
± 0.
01 c
1.
03 ±
0.0
6 a
93.4
7 ±
0.06
e
BF6
12
.33
± 0.
03 f
9
.57
± 0.
00 g
1.
46 ±
0.0
1 c
76.6
4 ±
0.29
a
BF7
7.
43
± 0.
03 d
4
.77
± 0.
04 f
1.41
± 0
.14
bc
86.3
9 ±
0.17
c
P- v
alue
0.
0000
0.00
00
0.00
01
0.00
00
CAPÍTULO 3
127
specialties with higher fat content. Total carbohydrate was the major
component in gluten-free bread-like products based on flours and/or
starches. These results agree with those recently reported by Matos & Rosell
(2011) who evaluated in detail the chemical composition of many types of
gluten-free bread like products.
Sensory analysis of the different types of gluten-free bread-like samples is
presented in Table 6. According to ANOVA results, these bread-like
products differed significantly (P<0.05) in crumb appearance, taste, colour,
springiness, hardness and crumbliness. Conversely, no significant
differences were observed in odour. The highest score for crumb
appearance, colour and perceived hardness was obtained for BF3 and BF5.
Additionally, the best taste was perceived in BF3, and BF5 received the
highest score for springiness, indicating major elasticity. In general, BF3,
which did not contain any additional protein source, was scored high for
most of the sensorial attributes evaluated, including hardness and
crumblines. On the contrary, BF6 was scored low for most of the sensory
attributes evaluated. It seems that the addition of whole egg powder as
unique source of proteins affected negatively the sensory perception of this
product. The results obtained from sensory test clearly revealed great
variability on sensory quality of the gluten-free bread-like products tested.
3.3. Relationships among the Rheological Properties of Formulated
Doughs and the Instrumental and Sensory Characteristics of the
Gluten-free Bread-like Products.

CAPÍTULO 3
128
Tab
le 6
. Se
nsor
ial a
naly
sis o
f the
glu
ten-
free
bre
ad li
ke p
rodu
cts
Val
ues a
re m
eans
± st
anda
rd d
evia
tion.
Diff
eren
t let
ters
with
in a
col
umn
mea
n si
gnifi
cant
diff
eren
ces (
P<0.
05)
Sam
ple
Cod
es
Cru
mb
appe
aran
ce
Ta
ste
O
dour
C
olou
r
Sprin
gine
ss
Har
dnes
s C
rum
blin
es
BF1
2.
67 ±
1.2
1 bc
1.33
± 0
.52
a
2.17
± 1
.17
3
.00
± 0.
89 b
c
1.50
±
1.22
a
1.
50 ±
1.2
2 a
1.
67 ±
0.8
2 a
BF2
2.
67 ±
0.5
2 bc
2.50
± 0
.84
b
3.17
± 0
.75
3
.67
± 1.
03 b
c
1.33
±
0.52
a
3.
83 ±
0.7
5 b
3.
67 ±
1.3
7 bc
B
F3
4.50
± 0
.55
d
3.67
± 1
.14
c
3.33
± 1
.48
4
.33
± 0.
45 c
2.00
±
0.71
ab
4.
17 ±
0.8
4 b
4.
00 ±
1.0
0 c
BF4
1.
33 ±
0.8
9 a
1.
17 ±
0.4
5 a
1.
83 ±
0.8
4
2.6
7 ±
0.89
ab
3.
00 ±
1.
87 b
c
2.00
± 1
.22
a
1.33
± 0
.55
a B
F5
4.50
± 0
.55
d
2.50
± 0
.55
b
3.33
± 1
.03
4
.33
± 0.
82 c
3.33
±
1.03
c
3.
67 ±
0.5
2 b
2.
17 ±
0.7
5 ab
B
F6
1.83
± 1
.17
ab
2.
50 ±
0.8
4 b
2.
33 ±
1.2
1
1.6
7 ±
0.82
a
1.
17 ±
0.
41 a
1.50
± 0
.84
a
1.50
± 0
.84
a B
F7
3.17
± 0
.41
c
3.33
± 1
.21
bc
2.
83 ±
1.3
3
3.
67 ±
1.2
1 bc
2.
33 ±
1.
37 a
bc
4.33
± 1
.21
b
3.00
± 0
.63
bc
P-va
lue
0.00
00
0.00
00
0.12
18
0.00
02
0.00
89
0.00
00
0.00
00
CAPÍTULO 3
129
Relationship among the rheological properties of formulated doughs
recorded from Mixolab®, and the product instrumental and sensory
characteristics were analyzed. Table 7 illustrates the broad range of
correlations found between parameters obtained during the heating and
cooling cycles with the Mixolab® and the instrumental quality parameters
(specific volume, water activity, moisture content and TPA-hardness) of the
bread-like baked products. Water activity and moisture content were highly
significant and negatively correlated with C1, amplitude and gelling (C5-
C4) parameters. Specific volume showed high and negative correlation with
cooking stability range (C4-C3) and C5 parameters, which are associated to
the cooling stage of the Mixolab®. Presumably, high dough or batter
consistencies limit the expansion during proofing, reducing the specific
volume. Nevertheless, a positive correlation between apparent viscosity and
loaf volume (r = 0.83, P<0.05) and also between porosity and loaf volume
values (r = 0.81, P <0.05) in gluten free breads has been reported by Sabanis
et al., (2009). There were good correlations between TPA-hardness values
and Mixolab® parameters. The relationships between the TPA-hardness and
C1, amplitude, C5 and gelling (C5-C4) parameters were found to be
particularly highly significant (P <0.001) and positive. This could indicate
that the TPA-hardness values are strongly correlated (r >0.70) with
parameters characterising both protein and starch cooling behaviours. It is
important to remark that wheat dough viscosity characteristics determined
with the Rapid Viscoanalyzer (RVA) have been also correlated with wheat
bread texture parameters (Collar 2003). The pasting profile during cooking
and cooling of wheat dough has been highly correlated with bread staling

CAPÍTULO 3
130
Tabl
e 7.
Cor
rela
tion
mat
rix b
etw
een
instr
umen
tal q
ualit
y pa
ram
eter
s of g
lute
n-fre
e br
ead-
like
prod
ucts
and
doug
h/ba
tter r
heol
ogic
al p
aram
eter
s de
term
ined
with
the
Mix
olab
®
Corre
latio
ns in
dica
ted
by r
valu
es. *
**P-
valu
e <0
.001
, **P
-val
ue <
0.01
, *P-
val
ue <
0.05
. C1
: ini
tial c
onsis
tenc
y; C
2: m
inim
um to
rque
; C3:
max
imum
torq
ue d
urin
g th
e he
atin
g; C
4: m
inim
um to
rque
dur
ing
the
heat
ing
perio
d; C
5:
torq
ue o
btai
ned
afte
r coo
ling
at 5
0ºC.
In
strum
enta
l qua
lity
para
met
ers
Mix
olab
® p
aram
eter
s Sp
ecifi
c vo
lum
e W
ater
activ
ity
Moi
sture
co
nten
t TP
A-H
ardn
ess
Tim
e to
C1
0.
5101
* 0.
5422
*
C1
-0.4
816*
-0
.783
3***
-0
.819
3***
0.
8969
***
Stab
ility
0.
5579
**
A
mpl
itude
-0
.515
1*
-0.7
768*
**
-0.8
113*
**
0.86
71**
* C2
0.59
16**
C3
0.48
80*
C4
-0.5
112*
0.
4868
* C5
-0
.659
4**
0.78
49**
* Co
okin
g sta
b ra
nge
C4-C
3 -0
.701
6***
0.47
49*
G
ellin
g C5
-C4
-0.5
906*
* -0
.801
3***
-0
.835
5***
0.
9287
***
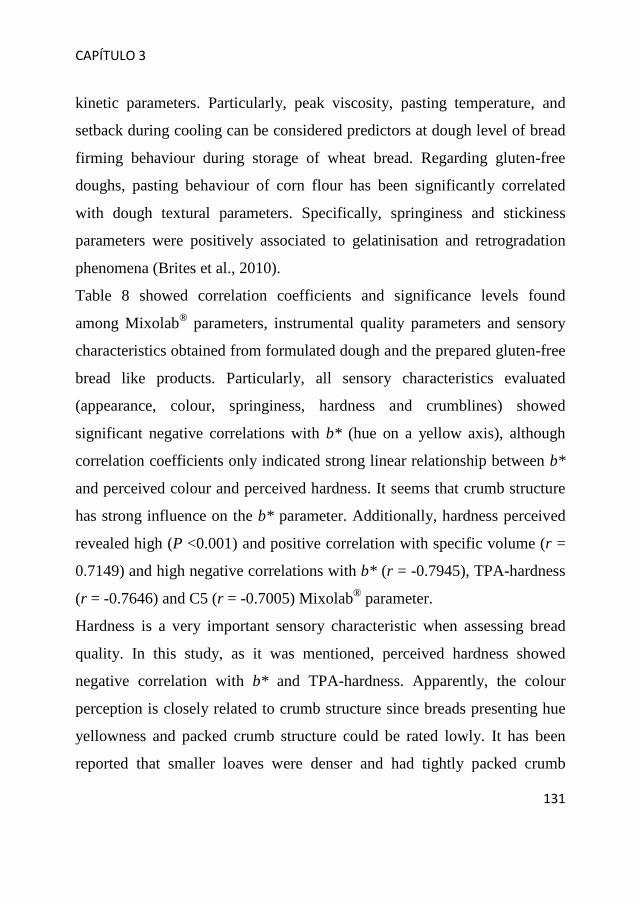
CAPÍTULO 3
131
kinetic parameters. Particularly, peak viscosity, pasting temperature, and
setback during cooling can be considered predictors at dough level of bread
firming behaviour during storage of wheat bread. Regarding gluten-free
doughs, pasting behaviour of corn flour has been significantly correlated
with dough textural parameters. Specifically, springiness and stickiness
parameters were positively associated to gelatinisation and retrogradation
phenomena (Brites et al., 2010).
Table 8 showed correlation coefficients and significance levels found
among Mixolab® parameters, instrumental quality parameters and sensory
characteristics obtained from formulated dough and the prepared gluten-free
bread like products. Particularly, all sensory characteristics evaluated
(appearance, colour, springiness, hardness and crumblines) showed
significant negative correlations with b* (hue on a yellow axis), although
correlation coefficients only indicated strong linear relationship between b*
and perceived colour and perceived hardness. It seems that crumb structure
has strong influence on the b* parameter. Additionally, hardness perceived
revealed high (P <0.001) and positive correlation with specific volume (r =
0.7149) and high negative correlations with b* (r = -0.7945), TPA-hardness
(r = -0.7646) and C5 (r = -0.7005) Mixolab® parameter.
Hardness is a very important sensory characteristic when assessing bread
quality. In this study, as it was mentioned, perceived hardness showed
negative correlation with b* and TPA-hardness. Apparently, the colour
perception is closely related to crumb structure since breads presenting hue
yellowness and packed crumb structure could be rated lowly. It has been
reported that smaller loaves were denser and had tightly packed crumb
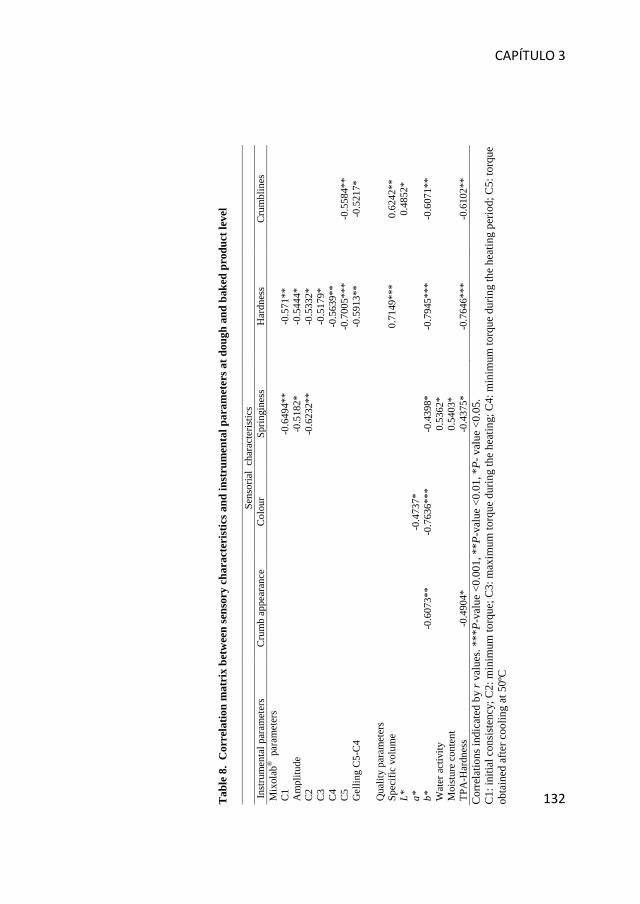
CAPÍTULO 3
132
Tab
le 8
. C
orre
latio
n m
atri
x be
twee
n se
nsor
y ch
arac
teri
stic
s and
inst
rum
enta
l par
amet
ers a
t dou
gh a
nd b
aked
pro
duct
leve
l
Se
nsor
ial
char
acte
ristic
s
In
stru
men
tal p
aram
eter
s C
rum
b ap
pear
ance
C
olou
r Sp
ringi
ness
H
ardn
ess
Cru
mbl
ines
M
ixol
ab® p
aram
eter
s
C1
-0.6
494*
* -0
.571
**
A
mpl
itude
-0
.518
2*
-0.5
444*
C2
-0.6
232*
* -0
.533
2*
C
3
-0.5
179*
C4
-0
.563
9**
C
5
-0.7
005*
**
-0.5
584*
* G
ellin
g C
5-C
4
-0.5
913*
* -0
.521
7*
Qua
lity
para
met
ers
Sp
ecifi
c vo
lum
e
0.71
49**
* 0.
6242
**
L*
0.48
52*
a*
-0
.473
7*
b*
-0
.607
3**
-0.7
636*
**
-0.4
398*
-0
.794
5***
-0
.607
1**
Wat
er a
ctiv
ity
0.53
62*
Moi
stur
e co
nten
t
0.
5403
*
TP
A-H
ardn
ess
-0.4
904*
-0.4
375*
-0
.764
6***
-0
.610
2**
Cor
rela
tions
indi
cate
d by
r va
lues
. ***
P-va
lue
<0.0
01, *
* P-v
alue
<0.
01, *
P- v
alue
<0.
05.
C1:
initi
al c
onsi
sten
cy; C
2: m
inim
um to
rque
; C3:
max
imum
torq
ue d
urin
g th
e he
atin
g; C
4: m
inim
um to
rque
dur
i ng
the
heat
ing
perio
d; C
5: to
rque
ob
tain
ed a
fter c
oolin
g at
50º
C
CAPÍTULO 3
133
structure, resulting in higher crumb firmness (Sabanis et al., 2009); this
drives to think that bread with compact crumb could be perceived as hard.
Sabanis et al. (2009) reported a negative correlation between crumb
firmness and loaf volume (r = -0.89, P >0.05).
In general, many relationships were found (Table 8), however the
correlation coefficients were higher between dough properties and
instrumental bread parameters (r >0.70) than among instrumental
parameters and sensory characteristics (r < 0.70).
4. Conclusions
The patterns obtained during mixing, overmixing, pasting and gelling
greatly varied depending on the gluten-free dough or batter composition. All
Mixolab® parameters significantly (P<0.05) discriminated among the
doughs evaluated. Additionally, differences found in the rheological dough
properties from Mixolab® were mainly associated with the presence/
absence of protein and starch sources in the dough. Instrumental quality
parameters evaluated in the gluten-free bread-like products significantly
(P <0.05) discriminated among the samples.
Several relationships were found among the rheological properties of
formulated gluten-free dough/batter, the instrumental quality parameters and
sensory characteristics of the bread-like products. In general, the highest
correlation coefficients (r >0.70) were obtained between the Mixolab®
rheological properties at dough level and the instrumental quality
parameters of the fresh baked products. Conversely, lower correlation
coefficients (r <0.70) were found when correlations were established with
CAPÍTULO 3
134
sensory characteristics. Particularly, dough/batter consistency during mixing
(C1), amplitude and dough consistency after cooling (C5) would be useful
predictors of TPA crumb hardness of baked product; and C5 would be also
predictor of perceived hardness of gluten-free bread-like products.
Acknowledgments
Authors acknowledge the financial support of Association of Coeliac
Patients (Madrid, Spain), Spanish Scientific Research Council (CSIC) and
the Spanish Ministry of Economy and Sustainability (Project AGL2008-
00092/ALI and AGL2011-23802). M.E. Matos would like to thank
predoctoral grant by the Council of Scientific and Humanistic
Development of University Central of Venezuela (Caracas, Venezuela).
References
Ahlborn GJ, Pike OA, Hendrix SB, Hess WM & Huber CS (2005) Sensory,
mechanical, and microscopic evaluation of staling in low-protein and
gluten-free breads. Cereal Chemistry, 82, 328-335.
Bonet A, Blaszczak W & Rosell CM (2006) Formation of homopolymers
and heteropolymers between wheat flour and several protein sources by
transglutaminase-catalyzed cross-linking. Cereal Chemistry, 83, 655-662.
Brites C, Trigo MJ, Santos C, Collar C & Rosell CM (2010). Maize-based
gluten-free bread: Influence of processing parameters on sensory and
instrumental quality. Food Bioprocess Technology, 3, 707-715.

CAPÍTULO 3
135
Catassi C, & Fasano A (2008) Celiac disease. In: Arent EA, Dal Bello F
(eds) Gluten-Free Cereal Products and Beverages, pp 1-27. Elsevier,
London/San Diego.
Collar C (2003) Significance of viscosity profile of pasted and gelled
formulated wheat doughs on bread staling. European Food Research
Technology, 216, 505-513.
Collar C, Bollain C & Rosell CM (2007) Rheological behaviour of
formulated bread doughs during mixing and heating. Food Science and
Technology International, 13, 99-107. DOI: 10.1177/1082013207078341.
Comino I, Real A, de Lorenzo L, Cornell H, López-Casado MA, Barro F,
Lorite P, Torres MI, Cebolla A, & Sousa C (2011) Diversity in oat potential
immunogenicity: basis for the selection of oat varieties with no toxicity in
coeliac disease. Gut, 60, 915-922. DOI:10.1136/gut.2010.225268.
Demirkesen I, Mert B, Sumnu G & Sahin S (2010) Rheological properties
of gluten-free bread formulations. Journal of Food Engineering, 96, 295-
303.
FAO. Food and Nutrition Paper 77 (2003) Food energy-methods of analysis
and conversion factors. FAO. Rome: Food and Agriculture Organization of
the United Nation. ISSN 0254-4725.
Gallagher E, Gormley TR & Arendt EK (2004) Recent advances in the
formulation of gluten-free cereal-based products. Trends in Food Science
and Technology, 15, 143-152.
Gujral HS & Rosell CM (2004) Improvement of the breadmaking quality of
rice flour by glucose oxidase. Food Research International, 37, 75-81.

CAPÍTULO 3
136
Hathorn CS, Biswas MA, Gichuhi PN & Bowell-Benjamin AC (2008)
Comparison of chemical, physical, micro-structural, and microbial
properties of breads supplemented with sweet potato flour and high-gluten
dough enhancers. LWT-Food Science and Technology, 41, 803-815.
ICC. International Association for Cereal Chemistry (ICC) (1994) Standard
No 110/1, 105/2, 104/1, 136.
Kadan RS, Robinson MG, Thibodeaux DP & Pepperman AB (2001)
Texture and other physicochemical properties of whole rice bread. Journal
of Food Science, 66, 940-944.
Kim Y & Yokoyama W (2011) Physical and sensory properties of all-barley
and all-oat breads with additional hydroxypropyl methylcellulose (HPMC)
and β-glucan. Journal of Agricultural and Food Chemistry, 59, 741-746.
Korus J, Witczak M, Ziobro R & Juszczak L (2009) The impact of resistant
starch on characteristics of gluten-free dough and bread. Food
Hydrocolloids, 23, 988–995.
Lazaridou A, Duta D, Papageorgiou M, Belc N & Biliaderis CG (2007)
Effects of hydrocolloids on dough rheology and bread quality parameters in
gluten-free formulations. Journal of Food Engineering, 79, 1033-1047.
Marco C & Rosell CM (2008a) Breadmaking performance of protein
enriched, gluten-free breads. European Food Research and Technology, 227,
1205-1213.
Marco C & Rosell, CM (2008b) Functional and rheological properties of
protein enriched gluten-free composite flours. Journal of Food Engineering,
88, 94-103.
CAPÍTULO 3
137
Matos ME & Rosell CM (2011) Chemical composition and starch
digestibility of different gluten-free breads. Plant Food for Human Nutrition,
66, 224-230. DOI: 10.1007/s11130-011-0244-2.
McCarthy DF, Gallagher E, Gormley TR, Schober TJ & Arendt EK (2005)
Application of response surface methodology in the development of gluten-
free bread. Cereal Chemistry, 82, 609-615.
Moore MM, Heinbockel M, Dockery P, Ulmer HM & Arendt EK (2006)
Network formation in gluten-free bread with application of
transglutaminase. Cereal Chemistry, 83, 1, 28-36.
Pruska-Kędzior A, Kędzior Z, Gorący M, Pietrowska K, Przybylska A &
Spychalska K (2008) Comparison of rheological, fermentative and baking
properties of gluten-free dough formulations. European Food Research
Technology, 227, 1523-1536.
Rosell CM, Collar C & Haros M (2007) Assessment of hydrocolloid effects
on the thermo-mechanical properties of wheat using the Mixolab®. Food
Hydrocolloids, 21, 452-462.
Rosell CM & Collar C (2009) Effect of temperature and consistency on
wheat dough performance. International Journal of Food Science &
Technology, 44, 493-502.
Rosell CM, Santos E & Collar C (2010) Physical characterization of fiber-
enriched bread doughs by dual mixing and temperature constraint using the
Mixolab®. European Food Research Technology, 231, 535-544
Rosell CM, Yokoyama W & Shoemaker C (2011) Rheology of different
hydrocolloids-rice starch blends. Effect of successive heating-cooling

CAPÍTULO 3
138
cycles. Carbohydrate Polymers, 84, 373-382.
DOI:10.1016/j.carbpol.2010.11.047.
Sabanis D, Lebesi D & Tzia C (2009) Effect of dietary fibre enrichment on
selected properties of gluten-free bread. LWT-Food Science and
Technology, 42, 1380–1389.
Sciarini LS, Ribotta PD, León AE & Pérez GT (2010) Influence of gluten-
free flours and their mixtures on batter properties and bread quality. Food
Bioprocess Technology, 3, 577–585. DOI: 10.1007/s11947-008-0098-2.

CAPÍTULO 4
UNDERSTANDING THE FUNCTION OF PROTEINS
ON THE RHEOLOGICAL AND QUALITY
PROPERTIES OF RICE BASED BATTERS AND
MUFFINS
María E. Matos, Teresa Sanz and Cristina M. Rosell
Food Hydrocolloids
(enviado: diciembre,2012)

CAPÍTULO 4
141
Abstract
The incorporation of proteins has been long established in the bakery
industry to obtain enriched products, but they also take active part on the
making process of sweet baked goods. This study was focused on
assessing the role of proteins on the rheology and quality of wheat free
muffins by using rice flour. Six rice based formulations were used:
without added protein (Control) and with different protein sources: soy
protein isolate (SPI), pea protein isolate (PPI), egg white protein (EWP),
casein(C), and for comparing purposes vital wheat gluten (VWG) was
included. Proteins effects were established by evaluating the rheological
behaviour of batters measuring the storage modulus (G′) and the loss
modulus (G″), and the technological characteristics of the muffins
obtained (specific volume, colour, and texture). The overall results
indicated that both the rheological properties of the batters and the
technological characteristics of the muffin are dominated by the presence
of the type of protein used in the formulations. The addition of SPI, PPI
and C significantly (P<0.05) increased G′, but it was not modified in
batters containing EWP. Casein and EWP increased the specific volume
of the muffins. SPI did not have effect on hardness, springiness,
cohesiveness, chewiness, and resilience of the muffin, while PPI
containing muffins were softer and springier. This study has allowed the
development of whole egg-free and milk-free muffins; however the
optimization of this type of formulations is fundamental to ensure the
proper texture and good taste of these products.

CAPÍTULO 4
142
Keywords: Gluten-free; Muffins; Rice flour; Protein sources; Batter,
Rheology; Quality.

CAPÍTULO 4
143
1. Introduction
Muffin is a popular breakfast or afternoon snack food, which is sold in
many bakeries. Muffins are sweet, high-calorie baked products highly
appreciated by consumers due to their good taste and soft texture.
Muffins batter is a complex fat-in-water emulsion composed of an egg-
sugar-water-fat mixture as the continuous phase and bubbles as the
discontinuous phase in which flour particles are dispersed. Muffins are
characterized by a typical porous structure and high volume, which
confer a spongy texture. To obtain such a final structure, a stable batter
lodging many tiny air bubbles is required (Martínez-Cervera, Sanz,
Salvador, & Fiszman, 2012). Therefore, a large number of small cells
provide high volume if the continuous phase of the batter is capable of
retaining them during the baking process (Gómez, Ronda, Caballero,
Blanco, & Rosell, 2007).
Traditionally, muffins recipe is mainly based on wheat flour, sugar,
vegetal oil, egg and milk (Sanz, Salvador, Baixauli, & Fiszman, 2009).
For this reason, persons with celiac disease (CD) are unable to consume
this type of baked product since they are made with wheat flour. Gluten-
free products were initially designed for people who have celiac disease.
Nevertheless, there is an increasing number of people interested in
wheat-free foods motivated by health concern or because they want to
avoid wheat in the diet. However, the manufacture of baked goods
products without gluten results in major technological problems for
bakers. In fact, many gluten-free products available on the market are
often of poor technological quality, exhibiting low volume, poor colour

CAPÍTULO 4
144
and crumbling crumb, besides great variation in the nutrient composition,
with low protein and high fat contents (Matos & Rosell, 2011),
particularly when compared to their wheat counterparts (Mariotti,
Lucisano, Pagani, & Ng, 2009). Like bread, gluten-free muffins, cakes
and other gluten-free baked goods have been commercially manufactured
trying to resemble those made from wheat flour. However, these types of
gluten-free baked products often present quality defects and low
nutritional value.
Consumers adhered to gluten free products demand having gluten free
counterparts for all the gluten baked goods. As consequence, in recent
years, there has been extensive research for the development of gluten-
free sweet bakery products aimed to improve the structure, mouth feel,
acceptability, shelf-life and nutritional quality of the finished products
(Turabi, Sumnu, & Sahin, 2008a,b; Gularte, de la Hera, Gómez, &
Rosell, 2012a,b; Park, Ha, & Shin, 2012). The gluten-free muffins, cake
or cupcakes recipes contain rice flour as principal ingredient (Turabi et
al., 2008a,b; Gularte et al., 2012a,b; de la Hera, Martinez, Oliete, &
Gómez, 2012; Park et al., 2012), or different starches sources, such as
rice, corn, potato and wheat (Ronda, Oliete, Gómez, Caballero, & Pando,
2011). Additionally, other ingredients such as sugar, egg white powder or
egg white liquid, milk, baking powder, salt, vegetal oil, hydrocolloids
and emulsifiers, can be incorporated on their formulations to improve the
final quality product (Turabi et al., 2008a,b; Ronda et al., 2011; de la
Hera et al., 2012; Park et al., 2012).
CAPÍTULO 4
145
It is well known that rice (Oryza sativa L) is seek out by people adhered
to gluten-free diet, because it contains neither gluten nor gliadin and that
makes rice hypoallergenic and easily digestible (Marco & Rosell, 2008).
Rice also has low levels of sodium, fat and protein, and rice flour milled
from white rice is very bland in taste. Thus, rice is one of the most
convenient cereals in designing gluten-free products. However,
regardless of its numerous advantages, rice flour shows an important
drawback from the technological point of view, since its proteins do not
develop the appropriate viscoelastic network necessary to retain gas
produced during the fermentation process, resulting in low-quality
products (Marco & Rosell, 2008). Therefore, some food additives such
starch, gums, hydrocolloids, and dairy products are required for obtaining
high volume, desired texture, colour, and crumb structure (Turabi et al.,
2008b). The incorporation of dairy proteins has been long established in
the bakery industry, but legumes such as soybean, can be also a good
supplement for cereal based foods since they increased the protein
content and complement the nutritional value of cereal proteins (Mariotti
et al., 2009; Ronda et al., 2011; Gularte et al., 2012b). However, nutrition
is not the only aim when adding proteins; they play a functional role,
especially in muffins. In fact, Geera, Reiling, Hutchison, Rybak, Santha
and Ratnayake (2011), when looking for egg replacers in wheat muffins,
stated that egg is a critical ingredient in the muffins formulation to obtain
expected product quality characteristics. Partial replacement of egg with
commercial egg replacer changed product characteristics altering

CAPÍTULO 4
146
moisture retention, bulk volume, colour, texture and flavour, although
those differences were not readily detected by sensory panellist.
Lots of people are strict vegans or vegetarians, and many others choose
simply not to eat eggs, for myriad reasons – health, culture/religion, and
likings. For this reason is also recommended the use of other proteins as
egg substitutes when making muffins. Actuality, food manufacturers are
seeking for alternatives to egg in baked product formulations to reduce
production cost and to make health claims, such as to reduce fat and
cholesterol content, and protein allergies. Most widely used egg replacers
are whey protein isolates, soy ingredients, wheat gluten and different
types of gums to obtain specific properties in targeted products (Geera et
al., 2011). In general, research has been focused in the study of the
effects of some proteins sources, usually of vegetal origin, on the
technological or nutritional quality of the finished product. However,
studies focused on the fundamental role of the proteins, as ingredients in
the conventional muffins formulation and on the properties of the gluten-
free muffins have not been found in the published literature.
The use of vegetable or animal proteins for total substitution of egg and
milk in gluten-free-muffins formulations could be an interesting
alternative, especially considering that there are people with specific
dietary needs or retractions, as is the case of persons with celiac disease;
vegans, vegetarian or high cholesterol people. For this reason, the present
work was focused on the study of the role of proteins in the rheology and
quality of muffins by using rice flour, in order to scientifically develop
gluten free products. For other hand, the Rheometer was used to obtain a

CAPÍTULO 4
147
complete characterization of the gluten-free batter behaviour by
recording the mechanical changes during mixing and heating simulating
the mechanical work as well as the heat conditions that might be
expected during the baking process.
2. Materials and Methods
2.1. Materials
Commercial rice flour was supplied by Harinera Derivats del Blat de
Moro, S.L. (Parets del Vallés, Spain) had moisture and protein contents
of 12.19 g/100g and 7.22 g/100g, respectively. Five commercial protein
sources (all in dry powder form) were employed. Soybean protein isolate
(Vicoprot) was from Trade, S.A (Barcelona, Spain). The soybean protein
isolate had moisture and protein contents of 9.25 and 80.49 g/100g,
respectively. Pea protein isolate (Pisane C9) from Cosucra Group
Warcoing (Warcoing, Belgium) had moisture; protein contents 4.45
g/100g and 77.85g/100g, respectively. Vital Wheat Gluten from Roquette
(Keokuk, IL) had moisture, protein contents 9.23g/100g and 72.4 4
g/100g, respectively. Casein from Cargill (Spain) had moisture and
protein contents of 5.43g/100g and 84.54 g/100g, respectively. Egg white
protein (EWP) from EPSA Aditivos Alimentarios (Valencia, Spain) had
moisture, protein contents 6.83 g/100g and 79.38 g/100g, respectively.
Composition of the different ingredients was determined following the
AACCI Approved Methods (2000). Xanthan gum (Satiaxane CX-91)
food grade was supplied from Cargill (Spain). Sodium bicarbonate and
citric acid were purchased from Martínez SA (Valencia, Spain). Refined
CAPÍTULO 4
148
sunflower oil was acquired from Coosur (Jaen, Spain). Sugar and salt
were purchased from local market. All reagents were of analytical grade.
Batters containing both rice flour and different vegetal protein sources
(VPS): Vital wheat gluten (VWG), Soy protein isolate (SPI) and Pea
protein isolate (PPI); and batters containing rice flour and different
animal protein sources (APS): Egg white protein (EWP), and Casein(C)
were prepared.
2.2 Methods
2.2.1 Batter preparation
Rice flour-based batters were prepared without protein source (Control)
and with five different protein sources: Vital wheat gluten (VWG), Soy
protein isolate (SPI), Pea protein isolate (PPI), Egg white protein (EWP),
and Casein (C). The ingredients (g/100g flour) used in the preparation of
the muffins batters were based on traditional Spanish recipe. The amount
of added protein was calculated based on the percentage of protein
provided by both milk and egg in the traditional formulation (13%). On
the other hand, it was considered a contribution of 75% of protein for the
selected protein sources. In this way, the amount of protein that should be
added to each formulation was obtained [(13 x 100)/75 = 17.3 g]. In
addition, this amount of added protein kept the same solid content in all
formulations. The samples were identified as Control, VWG, SPI, PPI,
EWP, and C, according to the type of protein added.
The rice flour-based batters were prepared by the modified method of
Sanz et al. (2009). The formulation of batters included 114.4g rice flour

CAPÍTULO 4
149
(10.8% moisture, 6.69 % protein); 100g water; 17.3 g protein added
(75% protein); 75g sugar; 46g refined sunflower oil; 4g sodium
bicarbonate; 3g citric acid; 1.5g salt; 0.5g xanthan gum.
The batters were prepared in a mixer (Kenwood major Classic, UK), in
which the rice flour, protein (depending on the formulation), sodium
bicarbonate, sugar, citric acid, salt and xanthan gum, were incorporated in
the first place, and sunflower oil was gradually dripped in; finally the
water was added. The batter was beaten for 10 min to speed 4 (380 rpm)
until smooth. The batter was used for both the rheological test and to
prepare the gluten-free muffin. Each formulation was prepared twice
(two replicates), on different days.
2.2.2. Batter properties
The specific gravity (SG) of batter was measured as the ratio of the
weight of a standard container filled with batter (W2) to that of the same
container filled with water (W1). Two different batches were employed
and each formulation was measured in triplicate.
The rheological behaviour of the batter was evaluated. Properties of the
rice flour-based batter were studied using an AR G2 controlled-stress
rheometer (TA Instruments, Crawley, UK). The batters were all kept at
25°C for 60 min after batter preparation before the rheological test. The
samples were allowed to rest in the measurement cell for 5 min as
stabilization time. Parallel plate geometry (60 mm diameter) with 1 mm
gap between the plates was employed.
CAPÍTULO 4
150
Apparent viscosity at 25ºC was measured as a function of shear rate over
the 0.01 to 100 s-1 range for 5 min; 100 points with a logarithmic
distribution were recorded. Two replicates of each flow curve were run
with samples prepared on different days. The flow curves were adjusted
to the Oswald model: η= KẎn-1. Where η is the apparent viscosity, K is
the consistency index, gamma dot (Ẏ) is the shear rate and “n” is the flow
index. Results are means of two replications from different batches of
each formulation.
An oscillatory stress sweep was made at a constant frequency of 1 Hz
over an oscillatory stress range of 1.0x10⁻³ to 20 Pa for each batter
sample. Frequency sweep test was performed from 0.01 to 10 Hz at a
constant oscillatory stress within the linear viscoelastic range at 25°C.
The oscillatory stress applied was selected to guarantee the existence of a
linear viscoelastic range of each batter sample. The applied oscillatory
stress varied among formulations and was between 0.12 and 0.32 Pa. To
study the effect of heating in the batter structure, temperature sweeps
were performed from 25°C to 95°C at a heating rate of 1.0°C/min and a
constant strain. The strain applied was selected to guarantee the existence
of linear viscoelasticity along the complete temperature range according
to previous stress sweeps. The applied strain varied from 1.0x10⁻⁴ to
3.8x10⁻⁴, depending on the specific batter sample. Vaseline oil (Panreac,
Spain) was applied to the exposed surfaces of all the samples, in order to
prevent evaporation during the measurements. The storage modulus (G′),
loss modulus (G″), phase angle, and loss tangent (tanδ), were measured.
Three replicates of each test were run with samples prepared on different

CAPÍTULO 4
151
days. Results are means of three replications from different batches of
each formulation.
2.2.3. Rice flour-based muffins preparation
Rice flour-based muffins were prepared according to methods described
by Sanz et al. (2009). Muffins without added protein (Control) and with
different protein sources (VWG, SPI, PPI, EWP, and C) were prepared
from the gluten-free muffin batters. The batter was poured into a dosing
machine (Edhard Corp., Hackettstown, USA). Quantity of batter
dispensed was of 65.0±0.2 g in each 60 mm diameter and 36 mm muffin
paper cups. Twelve cups were arranged in three rows of four in a baking
tray and baked for 20 min at 180 ºC in a conventional electric oven
(Fagor Elegance 2H-114B, Guipúzcua, Spain) that had been preheated to
this temperature for 10 min. The oven, the tray and the tray position in
the oven were identical in each case.
The muffins were left to cool down at room temperature for 1h on rack.
Then, they were packed in polypropylene bags (O2 permeability at 23°C
= 1650 cm3/m2.day; water vapour permeability at 38°C and 90%
humidity = 9 g/m2 day; thickness=65μm) and stored at 20ºC for 1day,
until determinations were conducted. The muffins from each formulation
were prepared twice, on different days, with 12 muffins in each batch.
2.2.4. Rice flour-based muffins properties
Samples were directly milled prior analytical determinations.
Determinations were done in triplicate for obtaining mean values. The

CAPÍTULO 4
152
moisture and protein content were determined according to ICC
corresponding standard methods (ICC, 1994). The muffins were weighed
before baking (W3) and after baking and 1-h cooling (W4). The weight
loss upon baking was calculated (W3-W4). Height was measured with a
digital calliper from the highest point of the muffin to the bottom of the
paper cup after cooling for 1-h cooling at room temperature. Volume was
determined by rapeseed displacement. Specific volume of individual
muffins was calculated by dividing volume by weight. Images of the
muffins were captured using a flatbed scanner equipped with the
software HP PrecisoScan Pro version 3.1 (HP Scanjet 4400C, Hewlett–
Packard, USA). Values were the mean of at least three replicates for each
formulation.
A Konica Minolta CM-3500 spectrocolorimeter was used to measure the
crumb colour parameters (L*, a*, b*) of the muffins. The results were
expressed in accordance with the CIELAB system (D65 illuminant and
10° viewing angle). The measurements were made with a 30 mm
diameter diaphragm inset with optical glass. The parameters measured
were L* (L*= 0 [black], L*=100[white] indicates lightness, a* indicates
hue on a green (-a*) to red (+a*) axis, and b* indicates hue on a blue (-
b*) to yellow (+b*) axis. Additionally, hue or hue angle (h) and Chroma
(C*) values were obtained. Hue angle is the angle for a point calculated
from a* and b* coordinates in the colour space. Chroma is the
quantitative component of the colour, which reflected the purity of colour
in the CIELAB space. The muffins were cut in half on a plane parallel to
CAPÍTULO 4
153
its base and the colour of crumb was measured at several points on the
cut surface. Data from three slices per sample were averaged.
The instrumental texture measurements of the muffin samples were made
with a TA.XT.plus Texture Analyzer (Stable Microsystems, Godalming,
UK) provided with Texture expert software. The muffins were cut
horizontally at the height of the cup, the upper half was discarded and the
1.5 cm high lower halves were removed from paper cup. A double
compression test (texture profile analysis) was performed with a 75 mm
diameter flat-ended cylindrical probe (P/75) and compression to 50% of
the initial height at a speed of 1 mm/s with 5s waiting time between the
two cycles. The parameters obtained from the curves were hardness,
springiness, cohesiveness, chewiness, and resilience. Values were the
mean of at least three replicates for each formulation, which were
prepared twice (two batch), on different days.
2.2.5. Statistical analysis
For each parameter evaluated, a one way analysis of variance (ANOVA)
was applied using Statgraphics Plus V 7.1 (Statistical Graphics
Corporation, UK). Fisher’s least significant differences (LSD) test was
used to assess significant differences (P<0.05) among samples that might
allow discrimination among them.
3. Results and Discussions
To determine the role of proteins in gluten free batters and muffins
making, several proteins from different sources were selected and wheat
gluten was used for comparison purposes.
CAPÍTULO 4
154
3.1. Effect of protein source on specific gravity, flow properties and
dynamic viscoelastic properties of rice flour-based batters
3.1.1. Specific gravity
According to the ANOVA results, it was observed that SG was
significantly affected (P<0.05) by the protein type (Table 1). A
significant increase in SG was found with VWG, SPI, PPI, and C batter
formulations when compared with control (without protein added). This
increase in SG implies a reduction in the retained amount of air into those
batters and the intensity of this effect depended on the protein source.
Batters containing SPI and PPI did not show significant differences
between them, indicating a similar behaviour in relation to the retention
of air of these batters. Nature of the leguminous proteins might be
responsible of that effect. The highest SG value was obtained in the
batter prepared with casein protein (C). On the contrary, batter in
presence of egg white protein (EWP) had the lowest SG of all the batters,
which showed that more air was incorporated and retained during
mixing. In general, lower batter density means high air quantity into
batter (Turabi et al., 2008; Ronda et al., 2011; Martínez-Cervera et al.,
2011). Although EWP and C are from animal origin, they showed a
completely distinct effect. Conversely VWG, PPI and SPI all from
vegetable sources, showed similar effect on the SG. Differences observed
ascribed to the protein origin could be attributed to the functional
properties of the proteins, like emulsifying activity or foam stability. The

CAPÍTULO 4
155
Tabl
e 1.
Con
sist
ency
inde
x (K
), flo
w b
ehav
iour
inde
x (n
) and
spec
ific
grav
ity (S
G) f
or m
uffin
bat
ters
pre
pare
d w
ith d
iffer
ent p
rote
in so
urce
s
Sam
ple
K (P
a.sn )
n
SG
(g/m
L)
C
ontro
l 46
.51
± 3.
23
a
0.36
±
0.01
a
1.03
±
0.01
b
VW
P 73
.45
± 1.
86
b
0.37
±
0.00
a
1.05
±
0.01
d
SPI
122.
32
± 11
.5
c
0.41
±
0.00
b
1.04
±
0.01
c
PPI
166.
10
± 7.
04
d
0.39
±
0.01
b
1.04
±
0.01
c
EWP
52.7
8 ±
4.28
a
0.
41
± 0.
01
b
0.
97
± 0.
00
a C
nd
nd
1.08
±
0.00
e
P- v
alue
0.
0000
0.
0003
0.00
00
M
eans
± st
anda
rd d
evia
tion
valu
es fo
llow
ed b
y di
ffer
ent l
ette
rs w
ithin
a c
olum
n de
note
sign
ifica
ntly
diff
eren
t lev
els (
P<0.
05) (
n=4)
; n.a
.: no
t ava
ilabl
e
Con
trol:
rice
flour
; VW
G: v
ital w
heat
glu
ten;
SPI
: soy
pro
tein
isol
ate;
PPI
: pea
pro
tein
isol
ate;
EW
P: e
gg w
hite
pro
tein
; C: c
asei
n

CAPÍTULO 4
156
presence of egg albumen or whey proteins increased the emulsifying
activity of rice flour, while pea and soybean proteins hardly modified this
parameter. The stability of the emulsion significantly decreased when
egg albumen and whey proteins were present (Marco & Rosell, 2008).
3.1.2. Flow behaviour
The viscosity versus shear rate values showed a shear thinning
(pseudoplastic) behaviour for all batters, which means that the apparent
viscosity decreases as the shear rate increases. Experimental data in the
studied shear rate range provided a good fit (R2= 0.9939-0.9987) for the
Ostwald model (Table 1). Flow index (n) of all batters ranged from 0.36
to 0.41. Control and VWG batters did not show significant differences
between them, whereas SPI, PPI and EWP batters increased the n values
significantly (P<0.05) (values closer to 1). The addition of casein
produced a large increase in the batter viscosity, because of that the
viscosity versus shear rate values are not available.
The consistency index (K), was significantly affected (P<0.01) by the
type of protein source. For the vegetal proteins, higher increase in K was
found when compared with the control batter. The presence of PPI
increased the batter consistency, with a more noticeable increment than
the one observed with SPI; while the batter prepared with EWP showed
similar consistency than the batter made from rice flour (control).
Similarly, other authors have found an increase in the consistency of
layer cake batter with proteins and this effect was more evident in the
presence of soy protein isolate than when using wheat protein (Ronda et

CAPÍTULO 4
157
al., 2011). In our study, the increase in K in the presence of pea and
soybean protein isolates could be attributed to their high water binding
capacity (data not showed). It has been reported that the increase in the
water binding capacity of ingredients reduces the amount of free water
available to facilitate the movement of particles in batters and
consequently it gives high apparent viscosity values (Ronda et al., 2011).
3.1.3. Batter Viscoelastic behaviour
The viscoelastic properties of the rice-based muffins batter containing
different protein sources were studied by dynamic oscillatory test. The
mechanical spectra of all the batters (Figure 1 and 2) revealed the typical
behaviour of soft gels with values of the storage modulus (G′) higher
than the values of loss modulus (G″) and slight dependence of both
moduli with frequency (Figure 1). The same behaviour has been
described for rice dough containing different protein isolate (Gujral &
Rosell, 2004). Marco and Rosell (2008) reported that the mechanical
spectra of rice flour dough samples (without and with protein isolate)
showed G′ values higher than G″ at the frequency range tested
(0.1-1 Hz), suggesting a viscoelastic solid behaviour of the dough.
The addition of the proteins affected the batter viscoelastic behaviour and
the extent of the effect was protein source dependent. The presence of all
vegetable proteins modified the elastic and viscous component of the
rice-based muffins batter, inducing a hardening effect (increase in G′ and
G″) on the batters. Batters containing PPI and SPI showed the highest
increase in G′ and G″ values, whereas VWG batter only showed values
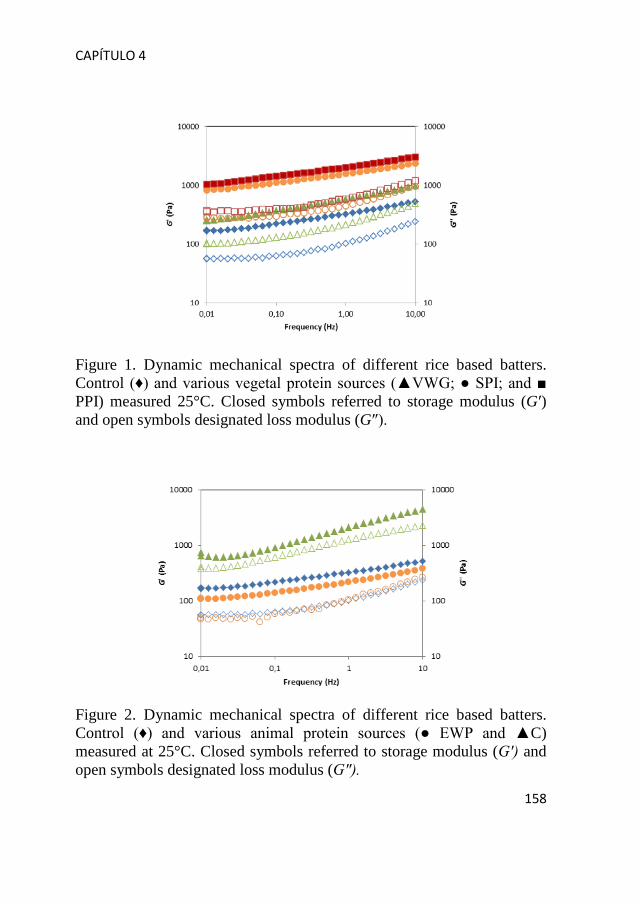
CAPÍTULO 4
158
Figure 1. Dynamic mechanical spectra of different rice based batters. Control (♦) and various vegetal protein sources (▲VWG; ● SPI; and ■ PPI) measured 25°C. Closed symbols referred to storage modulus (G′) and open symbols designated loss modulus (G″).
Figure 2. Dynamic mechanical spectra of different rice based batters. Control (♦) and various animal protein sources (● EWP and ▲C) measured at 25°C. Closed symbols referred to storage modulus (G′) and open symbols designated loss modulus (G″).

of G′ and G″ slightly higher to those obtained with the control batter.
Therefore, leguminous proteins induced a major hardening effect on the
batter structure.
The animal proteins also modified the dynamic mechanical spectra of the
rice based muffin batter, with a clear different trend between egg white
powder and casein (Figure 2). The addition of casein induced a very
noticeable change in the batter viscoelastic behaviour. In C batter both
moduli showed higher frequency dependence than in the control and
EWP batters. Also the predominance of G′ over G″ was lower in the C
batter indicating a more viscous and less elastic behaviour of this batter
in comparison to control and EWP. However, values of both moduli in
the C batter were higher than the control.
Viscoelastic data at a frequency of 1 Hz were submitted to analysis of
variance to determine the main effects of the protein isolates on
viscoelastic properties of rice based muffin batters (Table 2). The
presence of the different protein types significantly (P<0.05) changed the
viscoelastic properties of the batter. As already mentioned, values of G′
were always higher than values of G″. The presence of SPI, PPI and C,
significantly (P<0.05) increased the G′ modulus, and the other proteins
tested did not modify it. The extent of the effect of the added protein was
greatly dependent on the nature of the added protein. Batters containing
vegetable proteins had higher G′ value, although in the case of cereal
protein it was not significant, indicating similarities between the gluten
protein and the rice proteins. The presence of leguminous proteins
induced a large increase of the G′ modulus, being higher with PPI. Those

CAPÍTULO 4
160
Tabl
a 2:
Vis
coel
astic
par
amet
ers a
t 25º
C a
nd 1
Hz
(6.2
8 ra
d/s)
of m
uffin
bat
ters
pre
pare
d w
ith d
iffer
ent p
rote
in so
urce
s
Sam
ple
G′
(Pa)
G
″ (Pa
)
G
* (P
a)
Loss
tang
ent
Ph
ase
angl
e
(° )
Con
trol
294.
40
± 52
.34
ab
10
1.86
±
20.7
1 a
31
1.53
±
56.2
1 ab
0.34
±
0.01
b
19
.02
± 0.
59
b V
WG
57
9.60
±
16.9
6 b
21
6.27
±
8.82
a
61
8.63
±
19.0
1 b
0.
37
± 0.
00
c
20.4
6 ±
0.23
c
SPI
1576
.67
± 10
1.30
c
44
6.70
±
12.7
3 b
16
38.6
7 ±
99.2
9 c
0.
28
± 0.
01
a
15.8
5 ±
0.78
a
PPI
2020
.50
± 10
5.36
d
58
7.75
±
24.6
8 b
21
04.5
0 ±
108.
19
d
0.29
±
0.00
a
16
.22
± 0.
16
a EW
P 23
3.53
±
30.3
0 a
98
.81
± 16
.21
a
253.
57
± 34
.19
a
0.42
±
0.01
d
22
.88
± 0.
68
d C
20
86.0
0 ±
347.
39
d
1284
.00
± 18
5.95
c
24
50.0
0 ±
392.
17
d
0.62
±
0.02
e
31
.67
± 0.
74
e P-
val
ue
0.00
00
0.00
00
0.00
00
0.00
00
0.00
00
M
eans
± st
anda
rd d
evia
tion
valu
es fo
llow
ed b
y di
ffer
ent l
ette
rs w
ithin
a c
olum
n de
note
sign
ifica
nt d
iffer
ence
s (P<
0.05
) (n=
4).
C
ontro
l: ric
e flo
ur; V
WG
: vita
l whe
at g
lute
n; S
PI: s
oy p
rote
in is
olat
e; P
PI: p
ea p
rote
in is
olat
e; E
WP:
egg
whi
te p
rote
in; C
: cas
ein

results agree with Ronda et al. (2011) and Marco and Rosell (2008).
Regarding animal proteins, C induced a significant increase of G′,
whereas it was not significantly modified by EWP. The same tendency
was observed for the G″. Complex modulus (G*) significantly increased
due to the addition of proteins, and it showed the same trend observed in
G′, indicating low contribution of the viscous component (G″) to the
viscoelastic properties of the batter systems.
The loss tangent (tanδ) was also significantly (P<0.05) modified by the
presence of the protein isolates. Considering that all batter showed
G′>G″, the loss tangent was lower than 1. Both animal proteins
significantly decreased the batter viscoelasticity (values of tanδ closer to
1), being the effect much more evident for casein. Contrarily, the
vegetable proteins, SPI and PPI induced a significant reduction in the
loss tangent with no significant differences between them.
Therefore, EWP and specially C led to structures with less solid like
character than the rice batter alone, whereas leguminous protein isolates
led to more structured and solid like (lower tanδ) batters. In general,
bread dough, even those gluten-free which are usually more fluid,
showed tanδ values lower than 1. In cake batters made of wheat flour,
also values of tanδ lower than 1 has been reported (Baixauli, Sanz,
Salvador, & Fiszman, 2007). The presence of protein in layer cake batter
decreased significantly the loss tangent, with a major diminution when
using the SPI than the wheat protein (Ronda et al., 2011). In all batters
evaluated, phase angle was lower than 45°, which indicates that the
material behaves more like a solid (Rosell & Foegeding, 2007). SPI and

CAPÍTULO 4
162
PPI batters showed the lowest values of the phase angle, without
significant differences between them. Nevertheless, the presence of the
other protein significantly (P<0.05) increased the phase angle, with a
major increase in the batter containing C (31.67), reflecting, as already
mentioned that in the presence of casein the rice based batter increases its
viscous component.
3.2. Effect of protein source on the viscoelastic properties of batters
during heating
In order to understand the effect of protein type in the changes occurred
during the thermal treatment of the rice-based batters, the viscoelastic
properties were studied during the application of a temperature sweep.
The storage modulus (G′) values during heating from 25 °C to 95°C are
shown in Figures 3 and 4.
The presence of vegetable proteins produced changes in the slope of the
heating curves that have been associated with starch gelatinization and
protein coagulation processes in different muffin batter formulas
(Martinez-Cervera et al., 2011; 2012). As expected, control batter
exhibited an early onset of starch gelatinization (61-78 °C). A similar
behaviour was displayed by the batter containing gluten protein, but in
this case the onset of gelatinization was reached in the range 70 and
83°C. It is well known that the gelatinization of rice starch occurs at
around 70-71°C; while the protein denaturation occurs at temperature
above 60 °C, depending of each protein type. Rosell and Foegeding
(2007) reported that when heating gluten a decrease of G′ is produced,

CAPÍTULO 4
163
Figure 3. Storage modulus (G′ ) as a function of increasing temperature in different rice flour batters. Control (◊) and various vegetal proteins (∆ VWG ;○ SPI; and □ PPI)
Figure 4. Storage modulus (G′) as a function of increasing temperature in different rice flour batters. Control (◊) and various animal proteins (∆ EWP and □ C).

reaching a minimum at 57°C, and further increase of the temperature
induced the formation of a more elastic gluten network, as indicated the
increase of G′. These authors explained that gluten proteins show a
progressive loss of strength due to protein unfolding, resulting in a
decrease of the elastic modulus and undergoes a thermal transition
around 60°C.
It is well known that rheological behaviour is directly related to food
formulation. In this study, the conformational changes experimented by
both the rice starch and the added proteins were largely responsible for
the predominant elastic behaviour of the batters. The addition of wheat
proteins did not drastically affected the rheological properties of the
batter at temperatures lower than 70°C; however at higher temperatures
that batter showed less elastic behaviour, reflecting the development of
hindered rice starch three-dimensional internal structure. Additionally,
the underlining phenomena that determine the observed reduction in
rigidity would be the dissociation and denaturation of the proteins
(Sorgentini, Wagner, Arrese, & Añón, 1991) in this case wheat protein,
and consequently the formation of a less elastic protein network (Kokini,
Cocero, Madeka, & de Graaf, 1994). The starch dilution effect also
would explain the storage modulus decrease of the batter containing
gluten protein.
SPI batter showed a progressive increase of G′ as the temperature rises,
indicating the formation of a more rigid network (Figure 3). In general,
G′ increased with SPI, which can be associated with the development of
an internal SPI structure. The heating of SPI dissociated the compact
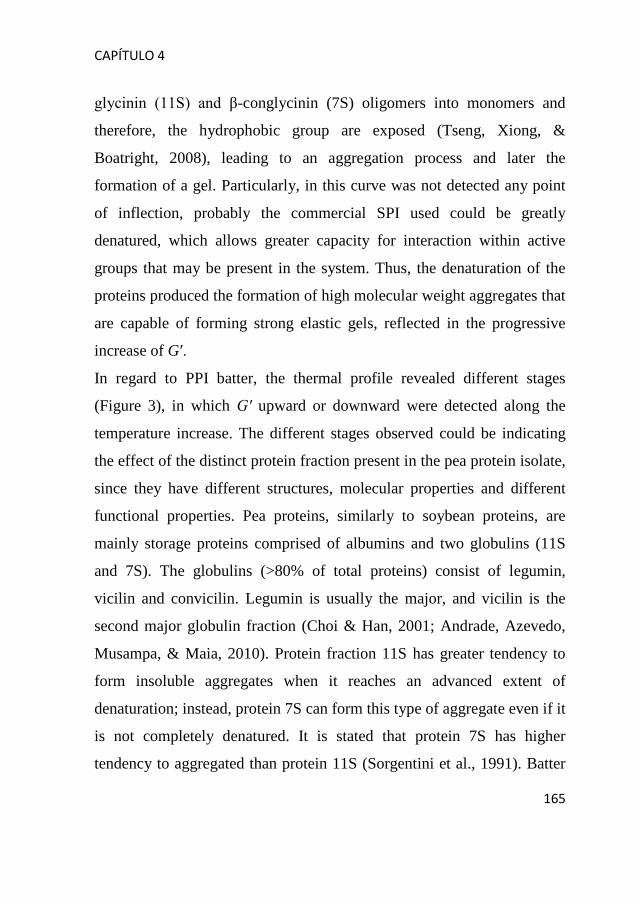
CAPÍTULO 4
165
glycinin (11S) and β-conglycinin (7S) oligomers into monomers and
therefore, the hydrophobic group are exposed (Tseng, Xiong, &
Boatright, 2008), leading to an aggregation process and later the
formation of a gel. Particularly, in this curve was not detected any point
of inflection, probably the commercial SPI used could be greatly
denatured, which allows greater capacity for interaction within active
groups that may be present in the system. Thus, the denaturation of the
proteins produced the formation of high molecular weight aggregates that
are capable of forming strong elastic gels, reflected in the progressive
increase of G′.
In regard to PPI batter, the thermal profile revealed different stages
(Figure 3), in which G′ upward or downward were detected along the
temperature increase. The different stages observed could be indicating
the effect of the distinct protein fraction present in the pea protein isolate,
since they have different structures, molecular properties and different
functional properties. Pea proteins, similarly to soybean proteins, are
mainly storage proteins comprised of albumins and two globulins (11S
and 7S). The globulins (>80% of total proteins) consist of legumin,
vicilin and convicilin. Legumin is usually the major, and vicilin is the
second major globulin fraction (Choi & Han, 2001; Andrade, Azevedo,
Musampa, & Maia, 2010). Protein fraction 11S has greater tendency to
form insoluble aggregates when it reaches an advanced extent of
denaturation; instead, protein 7S can form this type of aggregate even if it
is not completely denatured. It is stated that protein 7S has higher
tendency to aggregated than protein 11S (Sorgentini et al., 1991). Batter

CAPÍTULO 4
166
containing PPI showed a marked inflection peak around 88°C, which
could be associated with the pea protein coagulation, which ranged from
88.9 to 94.5°C (Choi & Han, 2001). The results indicate that the
behaviour of batter containing mainly SPI and PPI is notably dominated
by the presence of the protein network. Though both SPI and PPI are
leguminous proteins, these proteins yielded different response on heating,
likely due to the distinct thermal stability of the protein fractions
(Sorgentini et al., 1991; Sirtori, Isak,, Resta, Boschin, & Arnoldi, 2012).
The animal proteins also influenced the development of storage modulus
of the rice-based muffin batters (Figure 4). At 25°C only the batter
containing casein, showed G′ values higher than those obtained in the
control batter. EWP containing batter showed similar trend than control
at temperature lower than 65°C and a rapid increase was observed from
84°C until the end of the experiment, indicating the formation of a more
rigid network. This increase might result from the progressive formation
of higher molecular weight products (Kokini et al., 1994). The thermal
profile revealed that, again the process of protein denaturation governs
the evolution of the storage modulus. Egg white contains as many as 40
different proteins, among them; the major proteins imparting
functionality are ovalbumin (54%), conalbumin (12%), ovomucoid
(11%) and lysozyme (3.5%). Ovalbumin is the main constituent
responsible for the egg white functionality. It has been reported that, the
denaturation temperature of ovalbumin is close to 84°C, while
conalbumin (ovotransferrin) denaturation occurs about 60°C and the
denaturation temperature of lysozyme is around 70-75°C (Arzeni, Pérez,
CAPÍTULO 4
167
& Pilosof, 2012). Therefore, the changes observed in G′ behaviour
clearly can be associated with the coagulation phenomena of the different
egg white proteins. Regarding to batter containing casein, it showed a
completely different behaviour. As heating progresses, the storage
modulus value rose until approximately 70°C, where a maximum was
detected, then decreased rapidly indicating that the structure was highly
prone to weakening. Clearly, in this case, the presence of denatured
casein could be inducing a drastic effect on the structure of the batter,
yielding a weak gel. However, G′ has a plateau value from 85°C until the
end of the experiment, indicating that the gel structure behaves stable in
this temperature range.
3.3. Effect of protein source on quality characteristics of rice flour-
based muffins.
3.3.1. Protein and moisture contents of the gluten-free muffins
As it was expected, the addition of the different protein sources increased
the protein content of the muffins. Muffins containing SPI, EWP and C
showed the highest protein content (11.55 g/100g, dm); VWG and PPI
containing muffins had 10.43 and 10.96 g/100g dm, respectively.
Significant differences were also observed in the moisture content of the
muffins (results not showed).
3.3.2. Height, weight loss, and specific volume
Rice flour-based muffins obtained from different recipes presented
important differences in relation to height, weight loss, and specific
CAPÍTULO 4
168
volume (Table 3). Muffin height was significantly (P<0.001) affected by
the protein type. The biggest effect on height was found with EWP,
which caused a significant increase in this parameter. The incorporation
of proteins did not significantly affect the weight loss parameter, with
exception of the decrease observed when casein was added, indicating
that casein containing muffin was more capable of binding water during
baking. The control sample and the muffins containing vegetal protein
source (VWG, SPI and PPI) did not differ significantly (P<0.01) in
specific volume. Conversely, muffins with the highest specific volume
were those prepared with animal protein sources, and the greatest effect
was observed with EWP, likely due to that more air was incorporated and
retained during mixing and baking. Geera et al. (2011) reported that
muffins made with dry whole egg formulation had the highest height and
volume and the lowest density. Park et al. (2012) found that the specific
volume of the rice cupcakes ranged from 2.97 to 3.25 mL/g; while Turabi
et al. (2008a) found specific volume ranged from 1.08 to 1.66 mL/g in
rice cake formulated with different gums and an emulsifier blend. In
another study, Gularte et al. (2012b) found that the incorporation of
legume flour (chickpea, pea, lentil and bean) did not significantly affect
the weight loss of the cake; but with the exception of chickpea cake, all
legumes flour increased the specific volume. Ronda et al. (2011)
evaluated layer rice cake made with SPI and wheat protein reporting that
SPI did not modify volume but wheat proteins improved volume.

CAPÍTULO 4
169
Tabl
e 3.
Ph
ysic
al c
hara
cter
istic
s of p
rote
in e
nric
hed
muf
fin p
repa
red
with
diff
eren
t pro
tein
sour
ces
Sam
ple
Hei
ght (
mm
)
Wei
ght l
oss (
g)
Sp
ecifi
c vo
lum
e (m
L/g)
Con
trol
37.1
0 ±
1.08
bc
7.51
±
0.33
b
1.
56
± 0.
04
a
VW
G
38.1
6 ±
1.04
c
7.
57
± 0.
21
b
1.54
±
0.05
a
SPI
35.2
5 ±
1.29
a
7.
55
± 0.
29
b
1.54
±
0.04
a
PPI
36.3
8 ±
0.86
b
7.
54
± 0.
24
b
1.54
±
0.05
a
EWP
43.1
9 ±
2.23
d
7.
43
± 0.
28
b
2.19
±
0.05
c
C
36.7
4 ±
1.33
b
7.
19
± 0.
37
a
1.74
±
0.05
b
P- v
alue
0.
0000
0.
0220
0.
0000
Mea
ns ±
stan
dard
dev
iatio
n va
lues
follo
wed
by
diff
eren
t let
ters
with
in a
col
umn
deno
te si
gnifi
cant
diff
eren
ces
(P<0
.05)
(n=6
). C
ontro
l: ric
e flo
ur; V
WG
: vita
l whe
at g
lute
n; S
PI: s
oy p
rote
in is
olat
e; P
PI: p
ea p
rote
in is
olat
e; E
WP:
eg
g w
hite
pr
otei
n; C
: cas
ein.

CAPÍTULO 4
170
3.3.3. Colour parameters
Results from the crumb colour parameters are presented in Table 4. The
L*, a* and b* values for crumb colour showed significant (P<0.05)
differences among the different protein enriched muffins. Lightness of
muffin crumb was significantly (P<0.05) decreased by VWG, SPI, PPI
and C proteins; while the EWP addition increased L* value. The lowest
L* was obtained for PPI containing muffin, which was due to the darker
colour of the protein isolate (data no showed). Consequently, the L*
values can be associated to the original colour of both rice flour and
protein isolates. Colour in baked goods comes from two sources: intrinsic
colour imparted by individual ingredients (Gularte et al., 2012b) and
developed colour resulting from the interaction of ingredients (Acosta,
Cavender, & Kerr, 2011), since the increase in temperature is not high
enough to give Maillard or caramelization reactions (Gómez, Moraleja,
Oliete, Ruiz, & Caballero, 2010). Regarding a* values, all samples
showed positive a* values, indicating hue on red axis, and all were
higher than those of the control, with the exception of EWP sample that
showed negative a*. The b* scale showed positive values (yellow hue)
for all samples evaluated. However, EWP muffin did not exhibite
significant (P<0.05) differences when compared to control sample. PPI,
followed by SPI showed higher b* value than the other samples, it could
be derived from the original yellowish pigment of the pea and soy protein
powder added as ingredient in each formulation. Results agree with
previous studies (Gómez et al., 2010; Gularte et al., 2012b). In relation to
hue angle (h) and chroma (C*) colour attributes, great variation was

CAPÍTULO 4
171
Tabl
e 4.
Crum
b co
lour
par
amet
ers o
f pro
tein
enric
hed
muf
fins.
Mea
ns ±
stan
dard
dev
iatio
n va
lues
follo
wed
by
diffe
rent
lette
rs w
ithin
a co
lum
n de
note
sign
ifica
ntly
diff
eren
t lev
els (
P<0.
05) (
n=9)
Cont
rol:
rice f
lour
; VW
G: v
ital w
heat
glu
ten;
SPI
: soy
pro
tein
isol
ate;
PPI
: pea
pro
tein
isol
ate;
EW
P: eg
g w
hite
pro
tein
; C: c
a sei
n
Co
lour
par
amet
ers
Sam
ple
L*
a*
b*
C*
h (º)
Co
ntro
l 78
.13
± 0.
59
e
0.38
±
0.10
b
15
.88
± 0.
37 a
15.8
8 ±
0.37
a
88
.62
± 0.
34 e
V
WG
73.8
2 ±
0.29
c
1.
82
± 0.
08 d
20.2
9 ±
0.26
c
20
.37
± 0.
26 c
84.8
7 ±
0.19
c
SPI
73.2
7 ±
0.40
b
2.
57
± 0.
12 e
21.3
6 ±
0.36
d
21
.52
± 0.
36 d
83.1
5 ±
0.27
b
PPI
72.8
3 ±
0.60
a
3.
87
± 0.
30
f
26.2
8 ±
0.55
e
26
.57
± 0.
59 e
81.6
4 ±
0.45
a
EWP
86.4
0 ±
0.30
f
-0
.60
± 0.
04 a
15.6
6 ±
0.27
a
15
.67
± 0.
27 a
92.2
0 ±
0.16
f
C 77
.18
± 0.
48
d
0.66
±
0.13
c
17
.22
± 0.
51 b
17.2
3 ±
0.52
b
87
.83
± 0.
37 d
P-
val
ue
0.00
00
0.00
00
0.00
00
0.00
00
0.00
00

CAPÍTULO 4
172
observed (Table 4). All the muffins presented positive hue angle values
(81.64 - 92.29°) reflecting their yellow-orange hue. Additionally, the PPI
and SPI muffins increased chroma compared with all other samples,
which revealed their higher purity of colour related to major intensity of
the yellow component.
3.3.4. Global appearance of the muffins
Muffin images clearly revealed differences among crumb muffins
samples, mainly related to shape, crumb porosity, crumb colour and
degree of collapse on surface of muffins by effect of type of protein
added (Figure 5). Great variation in the appearance of the crumb
structure between the samples was observed. Control and VWG
containing muffin showed denser matrix, indicating more compact crumb
than other muffins samples. Contrarily, muffins containing EWP and C
protein showed higher number of air bubbles than control, showing more
spongy and light structure. Addition of casein produced muffins with
stable network structure with homogeneous air cell but showed higher
degree of collapse on surface, in addition these muffins showed a soft
and humid appearance. SPI and PPI muffins did not show collapse during
baking, but presented compact crumb.
3.3.5. Instrumental texture
The effect of protein on the texture parameters of rice flour-based muffins is shown in Table 5. According to ANOVA results, muffins differed significantly (P<0.05) in crumb hardness, springiness,

CAPÍTULO 4
173
Figure 5. Photographs of cross and longitudinal sections of control and
protein enriched muffins. VWG: vital wheat gluten; SPI: soy protein
isolate; PPI: pea protein isolate; EWP: egg white protein; and C: casein.
EWP C
SPI PPI
Control VWG

CAPÍTULO 4
174
Tabl
e 5.
Tex
ture
par
amet
ers o
f pro
tein
enr
iche
d m
uffin
s pre
pare
d w
ith d
iffer
ent p
rote
in so
urce
s
TP
A pa
ram
eter
s
Sam
ple
Har
dnes
s (N
)
Sprin
gine
ss
C
ohes
iven
ess
C
hew
ines
s (N
)
Res
ilien
ce
Con
trol
103.
83
± 10
.56
ab
0.
56
± 0.
04
a
0.41
±
0.01
a
23
.99
± 2.
07
a
0.19
±
0.01
a
VW
G
103.
83
± 8.
00
ab
0.
64
± 0.
05
c
0.46
±
0.01
b
30
.63
± 4.
29
b
0.19
±
0.01
a
SPI
114.
17
± 14
.25
bc
0.
57
± 0.
04 a
b
0.41
±
0.01
a
27
.07
± 4.
57 a
b
0.18
±
0.01
a
PPI
96.9
1 ±
15.4
4 a
0.
61
± 0.
03 b
c
0.45
±
0.03
b
26
.58
± 4.
32 a
b
0.19
±
0.01
a
EWP
113.
71
± 11
.33
bc
0.
82
± 0.
05
e
0.67
±
0.06
d
62
.51
± 9.
71
d
0.28
±
0.04
c
C
122.
56
± 5.
19
c
0.69
±
0.03
d
0.
49
± 0.
01 c
41.5
3 ±
2.67
c
0.
21
± 0.
00 b
P-
val
ue
0.00
13
0.00
00
0.00
00
0.00
00
0.00
00
M
eans
± st
anda
rd d
evia
tion
valu
es fo
llow
ed b
y di
ffer
ent l
ette
rs w
ithin
a c
olum
n de
note
sign
ifica
nt d
iffer
ence
s (P<
0.05
) (n=
4)
Con
trol:
rice
flour
; VW
G: v
ital w
heat
glu
ten;
SPI
: soy
pro
tein
isol
ate;
PPI
: pea
pro
tein
isol
ate;
EW
P: e
gg w
hite
pro
tein
; C: c
asei
n

CAPÍTULO 4
175
cohesiveness, chewiness and resilience. The incorporation of protein
sources increased significantly (P<0.05) springiness and cohesiveness of
muffins samples, except with addition of SPI, which showed the same
values as the control sample. The hardness significantly (P<0.05)
increased only in presence of casein. It was also observed that hardness
and chewiness showed similar trend for all samples, with exception of
muffins containing EWP, which had the highest chewiness value.
In general, the addition of vegetal protein sources did not induce a clear
tendency on crumb hardness. However, PPI containing muffins showed
the lowest hardness, and the highest springiness value among the samples
made from vegetable proteins. A significant (P<0.05) increase in the
springiness and cohesiveness was observed in VWG and PPI containing
muffins, while only the sample containing VWG showed a significant
(P<0.05) increase in the chewiness, indicating more difficulty in chewing
the sample. All muffins containing vegetal proteins showed low
resilience value; however no significant differences were observed in this
parameter when compared with control. Dense masses with lower
number of gas cell led to lower resilience values, implying that it will
take more time for the structure of the muffins to recover after
compression (Martinez-Cervera et al., 2011). It has been reported that the
incorporation of legumes flour (chickpea, pea, lentil and bean)
significantly (P<0.05) increased the hardness and chewiness in rice based
cakes, except with the addition of lentil (Gularte et al., 2012b).
Regarding the animal proteins, a significant (P<0.01) increase in the
hardness was observed in C containing muffins. Additionally, a

CAPÍTULO 4
176
significant (P<0.05) increase in the springiness, cohesiveness, and
resilience was observed in the presence of EWP and C muffins,
indicating more elasticity. The increase in springiness, cohesiveness and
resilience values could be also reflecting higher specific volume values,
and more aerated structure, which was found for these samples. It is
known that, springiness is associated to fresh, aerated and elastic product,
and in the case of muffins high springiness values are linked to high
quality (Sanz et al., 2009).
In general, muffins made from animal proteins were springier, more
cohesive and chewy than those made from vegetal protein source. Results
clearly revealed great variability on texture quality of the rice-based
muffins made from different protein sources.
4. Conclusions
Results obtained allow concluding that both the rheological properties of
the batters and the technological characteristics of the muffins obtained
are notably dominated by the type of protein used in the formulations. All
vegetal protein sources had similar effect on specific gravity of the
batters, and increase the consistency index (K), while EWP decreased the
specific gravity. The presence of SPI, PPI and C significantly (P<0.05)
increased the storage modulus. In general, G′ showed large increase with
the temperature when SPI, PPI and EWP were added. These differences
can be attributed to the nature and the denaturation pattern of the protein
fractions comprised within each protein isolate. Regarding the muffins
quality, EWG increases the height and specific volume, and muffins

CAPÍTULO 4
177
colour was dominated by the colour of the added proteins. Concerning
texture, PPI containing muffins were the softest and springier than the
control and casein gave the hardest muffin. In general, muffins with best
visual appearance were those containing egg white protein or casein.
The development of whole egg-free and milk-free muffins by using
different proteins as an alternative of sweet-baked gluten-free product is
possible. However, it is necessary to keep in mind that the use of other
proteins as egg and milk replacements, like soybean protein isolate, pea
protein isolate, affects texture of baked goods. Therefore, the
optimization of this type of formulations is fundamental to ensure the
proper texture and good taste of these new products. Additionally, future
studies will be undertaken to determine the sensory quality and consumer
acceptance of gluten-free muffins.
Acknowledgements
The authors acknowledge the financial support of Spanish Scientific
Research Council (CSIC), the Spanish Ministry of Economy and
Sustainability (Project AGL2011-23802), and the Generalitat Valenciana
(Project Prometeo 2012/064). M.E. Matos would like to thank
predoctoral grant by the Council of Scientific and Humanistic
Development of University Central of Venezuela (Caracas, Venezuela).
References
AACCI Approved Methods. (2000). Approved methods, 11th edn.
American Association of Cereal Chemists International, St Paul.

CAPÍTULO 4
178
Acosta, K., Cavender, G., & Kerr, W.L. (2011). Sensory and physical
properties of muffins made with waxy whole wheat flour. Journal of
Food Quality, 34, 343–351.
Andrade, R.J., Azevedo, A.G., Musampa, R.M., & Maia, J.M. (2010).
Thermo-rheological behavior of model protein–polysaccharide mixtures.
Rheological Acta, 49, 401–410. DOI 10.1007/s00397-010-0431-3.
Arzeni, C., Pérez, O.E., & Pilosof, A. M.R. (2012). Functionality of egg
white proteins as affected by high intensity ultrasound. Food
Hydrocolloids, 29, 308-316.
Baixauli, R., Sanz, T., Salvador, A., Fiszman, S.M. (2007). Influence of
the dosing process on rheological and microstructural properties of a
bakery product. Food Hydrocolloids, 21, 230-236.
Choi, W-S., & Han, J.H. (2001). Physical and Mechanical Properties of
Pea-Protein-based Edible Films. Journal of Food Science, 66, 319-322.
de la Hera, E., Martinez, M., Oliete, B., & Gómez, M. (2012) Influence
of Flour Particle Size on Quality of Gluten-Free Rice Cakes. Food
Bioprocess Technology. DOI 10.1007/s11947-012-0922-6.
Geera, B., Reiling, J.A., Hutchison, M.A., Rybak, D., Santha, B. &
Ratnayake, W.S. (2011). A comprehensive evaluation of egg and egg
replacers on the product quality of muffins. Journal of Food Quality, 34,
333–342.
Gómez, M., Moraleja, A., Oliete, B., Ruiz, E., & Caballero, P. A. (2010).
Effect of fibre size on the quality of fibre-enriched layer cakes. LWT -
Food Science and Technology, 43, 33-38.
CAPÍTULO 4
179
Gómez, M., Ronda, F., Caballero, P.A., Blanco, C.A., & Rosell, C.M.
(2007). Functionality of different hydrocolloids on the quality and shelf-
life of yellow layer cakes. Food Hydrocolloids, 21, 167–173.
Gujral, H. S., & Rosell, C. M. (2004). Improvement of the breadmaking
quality of rice flour by glucose oxidase. Food Research International, 37,
75–81
Gularte, M.A., de la Hera, E., Gómez, M., & Rosell, C.M. (2012a).
Effect of different fibers on the enrichment of gluten-free layer cake.
LWT - Food Science and Technology, 48, 209-214.
Gularte, M.A., Gómez, M., & Rosell, C.M. (2012b). Impact of legume
flours on quality and in vitro digestibility of starch and protein from
gluten-free cakes. Food Bioprocess Technology: An International
Journal, 5, 3142-3150.
ICC (1994). Official Methods of Analysis. International Association for
Cereal Chemistry,Vienna. ICC Standard No. 105/2, 110/1.
Kokini, J.L., Cocero, A.M., Madeka, H., & de Graaf, E. (1994). The
development of state diagrams for cereal proteins. Trend in Food Science
and Technology, 5, 281-288.
Marco, C., & Rosell, C.M. (2008). Functional and rheological properties
of protein enriched gluten-free composite flours. Journal of Food
Engineering, 88, 94–103.
Marco, C., Pérez, G., Ribotta, P., & Rosell, C.M. (2007). Effect of
microbial transglutaminase on the protein fractions of rice, pea and their
blends. Journal of Science Food Agriculture, 87, 2576–2582.
CAPÍTULO 4
180
Mariotti, M., Lucisano, M., Pagani, M.A., & Ng, P.K.W. (2009). The
role of corn starch, amaranth flour, pea isolate, and Psyllium flour on the
rheological properties and the ultrastructure of gluten-free doughs. Food
Research International, 42, 963–975.
Martínez-Cervera, S., Salvador, A., Muguerza, B., Moulay, L., &
Fiszman, S.M. (2011). Cocoa fibre and its application as a fat replacer in
chocolate muffins. LWT- Food Science and Technology, 44, 729-736.
Martínez-Cervera, S., Sanz, T., Salvador, A., & Fiszman, S. M. (2012).
Rheological, textural and sensorial properties of low-sucrose muffins
reformulated with sucralose/polydextrose. LWT- Food Science and
Technology, 45, 213–220.
Matos, M.E., & Rosell, C.M. (2011). Chemical composition and starch
digestibility of different gluten-free breads. Plant Food for Human
Nutrition, 66, 224–230. DOI:10.1007/s11130-011-0244-2.
Park, S.J., Ha, Ki-Y., & Shin, M. (2012). Properties and Qualities of Rice
Flours and Gluten-free Cupcakes Made with Higher-yield Rice Varieties
in Korea. Food Science Biotechnology, 21, 365-372. DOI
10.1007/s10068-012-0048-7.
Ronda, F., Oliete, B., Gómez, M., Caballero, P.A., & Pando, V. (2011).
Rheological study of layer cake batters made with soybean protein isolate
and different starch sources. Journal of Food Engineering, 102, 272–277.
Rosell, C.M., & Foegeding, A. (2007). Interaction of
hydroxypropylmethylcellulose with gluten proteins: Small deformation
properties during thermal treatment. Food Hydrocolloids, 21, 1092–1100.

CAPÍTULO 4
181
Sanz, T., Salvador, A., Baixauli, R., & Fiszman, S.M. (2009). Evaluation
of four types of resistant starch in muffins. II. Effects in texture, colour
and consumer response. European Food Research and Technology, 229,
197–204. DOI 10.1007/s00217-009-1040-1.
Sirtori, E., Isak, I., Resta, D., Boschin, G., & Arnoldi, A. (2012).
Mechanical and thermal processing effects on protein integrity and
peptide fingerprint of pea protein isolate. Food Chemistry, 134, 113–121.
Sorgentini, D.A., Wagne,r J.R., Arrese, E.L., & Añón, M.C. (1991).
Water imbibing capacity of soy protein isolates: Influence of protein
denaturation. Journal of Agricultural and Food Chemistry, 39, 1386-
1391.
Tseng, Y-C., Xiong, Y.L., & Boatright, W.L. (2008.) Effects of
inulin/oligofructose on the thermal stability and acid-induced gelation of
soy proteins. Journal of Food Science, 73, 44-50.
Turabi, E., Sumnu, G., Sahin, S. (2008a) Rheological properties and
quality of rice cakes formulated with different gums and an emulsifier
blend. Food Hydrocolloids, 22, 305–312.
Turabi, E., Sumnu, G., & Sahin, S. (2008b). Optimization of baking of
rice cakes in infrared-microwave combination oven by response surface
methodology. Food and Bioprocess Technology, 1, 64–73. DOI:
10.1007/s11947-007-0003-4.

DISCUSIÓN GENERAL

Discusión General
185
El diseño y desarrollo de productos horneados a base de cereales sin
gluten, que presenten un perfil funcional y sensorial aceptable, ha
constituido una necesidad para la ciencia y la tecnología de los cereales y
para el sector industrial a nivel mundial. Tradicionalmente, los productos
dirigidos a la población celiaca se han diseñado atendiendo únicamente a
la ausencia de alérgenos, utilizando mezclas de polímeros que pudieran
originar productos con características sensoriales similares a los que
contienen gluten. Sin embargo, como se ha puesto de manifiesto en la
introducción de la presente tesis doctoral, el valor nutricional de los
productos libres de gluten derivados de cereales ha recibido escasa
atención por parte de la comunidad científica y empresas.
Las pautas terapéuticas o recomendaciones nutricionales para su
tratamiento restringen la alimentación de los celiacos a productos libres
de gluten. La adherencia a dietas libres de gluten afecta
significativamente al consumo de productos alimenticios derivados de
granos (Bardella y col., 2000). Esta afirmación adquiere grandes
dimensiones cuando se considera que los productos alimenticios
derivados de granos proporcionan alrededor del 30% de los
requerimientos diarios de fibras, hierro, ácido fólico, niacina, riboflavina
y tiamina (Subar y col., 1998). Thompson (2000) describió que los
alimentos libres de gluten aportan distintos niveles de vitaminas del
grupo-B, hierro y fibra dietética que sus homólogos con gluten,
detectándose deficiencias en alguno de estos nutrientes (Thompson,
1999).

Discusión General
186
Por tanto, la sustitución de productos que contengan gluten por otros
libres de gluten no asegura una correcta ingesta de todos los nutrientes, lo
que puede provocar graves consecuencias tras periodos prolongados
(Thompson y col., 2005). Investigaciones realizadas en este sentido
alcanzan conclusiones contradictorias. Collins y col. (1986) describieron
niveles normales en adultos celiacos. En contraposición, Mariani y col.,
(1998) encontraron elevados niveles de ingesta de proteínas y grasas, y
bajos niveles de calcio y fibra dietética en pacientes adolescentes. Un
estudio posterior realizado en Suecia con pacientes celiacos adultos
concluyó que los pacientes celiacos ingieren la misma energía que la
población sana, pero tienen una menor ingesta de fibras, niacina, folatos,
vitamina B12, calcio, fósforo y zinc (Grehn y col., 2001). Por tanto, es
necesario mejorar los hábitos dietéticos de los pacientes celiacos para
asegurar una ingesta adecuada de todos los nutrientes y conocer el aporte
de nutrientes que proporcionan los alimentos libres de gluten.
Dado que los productos de panadería son de consumo básico frecuente,
en el presente estudio se evaluó la calidad nutricional de panes libres de
gluten de origen comercial, con miras a definir sus características en
cuanto al aporte nutricional que se deriva de su consumo. Para tal fin se
adquirieron 11 tipos de panes sin gluten, todos provenientes de las
principales marcas comerciales disponibles en el mercado español. La
calidad nutricional de las muestras se estableció en términos de la
determinación de la composición química, con énfasis en el contenido de
proteínas, carbohidratos y grasas, y del contenido de fibra dietética.
Adicionalmente se determinó la contribución del consumo de cada tipo

Discusión General
187
de pan a la ingesta dietética de referencia (DRIs) de los principales
macronutrientes (proteínas y carbohidratos), considerando una porción de
consumo de 200g (cantidad recomendada de pan por la Organización
Mundial de la Salud).
Los resultados derivados de este estudio han permitido caracterizar desde
un punto de vista nutricional los diferentes tipos de panes comerciales
disponibles en el mercado español, y han contribuido a corroborar la
existencia, en la mayoría de los casos, de deficiencias nutricionales en
términos del contenido de proteínas y/o del desbalance entre los demás
nutrientes (carbohidratos, grasa y minerales). Las marcadas diferencias
encontradas en el patrón nutricional de los panes libres de gluten de
origen comercial, pueden estar determinadas principalmente por la
diversidad de ingredientes utilizados como base en sus formulaciones
(almidones y rara vez harinas, hidrocoloides, aceites y/o margarina). Lo
cual conlleva a que exista entre las mismas gran variabilidad en sus
características nutricionales; pudiendo encontrar tanto panes libres de
gluten que tienen un contenido de proteína considerablemente alto (hasta
15g/100g) debido a la incorporación de ingredientes con alto valor
proteico como soja, huevo o lupino, y otros panes que prácticamente
carecen de este nutriente; pero que contienen grandes cantidades de
carbohidratos (más específicamente almidón), y de grasas (hasta 26
g/100g). En general, el consumo de la mayoría de estos panes está lejos
de contribuir a la ingesta recomendada de proteínas. En este estudio
solamente una muestra presentó alta contribución a la IDRs para las
proteínas debido a su mayor contenido proteico. Sin embargo con la

Discusión General
188
excepción de dos de las muestras, todos los panes evaluados son ricos en
carbohidratos, presentando alta contribución de estos nutrientes a la
IDRs. Como aspecto positivo, la mayoría de los panes libres de gluten
evaluados presentaron buen contenido de fibra dietética total (3,6 g/100g
- 7,20 g/100g), debido principalmente a la contribución de los
hidrocoloides y gomas utilizados como ingredientes en sus
formulaciones.
El estudio de la digestibilidad in vitro del almidón permitió derivar
aportes interesantes. La fracción de almidón predominante fue la del
almidón rápidamente digerible (ARD), lo cual refleja la rápida
degradación enzimática favorecida por el alto grado de gelatinización del
almidón y la prevalencia de la estructura porosa propia de estos
productos. Todas las muestras presentaron altos valores para la
concentración de equilibrio (C∞) lo cual está asociado con los altos
niveles de almidón rápidamente hidrolizado, adicionalmente la constante
cinética (k) mostró diferencias significativas entre las muestras,
indicando la existencia de variaciones en la velocidad de la hidrólisis
durante la etapa temprana de la digestión enzimática que dependen del
tipo de pan. Todos los panes libres de gluten evaluados presentaron
valores de IGe altos (83.3 – 96.1). El número y la variedad de
ingredientes que conforman un producto son factores importantes que
podrían estar determinando la digestibilidad del almidón (Bernal y col.,
2002), así como su composición.
En general, muchas de las formulaciones comerciales utilizadas en la
elaboración de panes libres de gluten, todavía están basadas en el uso de
Discusión General
189
almidones puros y/o sus mezclas combinados con algún tipo de
hidrocoloides, en consecuencia los productos finales resultantes se
caracterizan por presentar bajos contenidos de proteínas, fibra y
minerales, y altos contenidos de grasas y carbohidratos. Estos resultados
coinciden con los obtenidos al evaluar muestras de panes libres de gluten
comerciales vendidos en Italia (Pagliarini y col., 2010).
Tomando en cuenta los resultados obtenidos en la caracterización
nutricional de los panes libres de gluten comerciales y principalmente en
lo relativo al bajo aporte proteico que se deriva de su consumo, en la
presente investigación se extendió el estudio de la caracterización
nutricional a una serie de panes libres de gluten “formulados” basados en
harina de arroz y enriquecidos en proteínas (aislado proteico de soja,
huevo y leche entera). En general la composición química de los panes
experimentales mejoró en comparación con la de los panes de origen
comercial. El contenido de proteína y de grasa varió considerablemente
en función de los ingredientes y de las proporciones utilizadas en cada
una de las formulaciones (Tabla 1, Capítulo 2). En general los panes
libres de gluten que contienen soja y huevo presentaron altos contenidos
de proteína (>12 g/100g), pero el huevo incrementa el aporte de grasa. Es
importante considerar que la sola incorporación de la harina de arroz en
las formulaciones mejoró el balance en nutrientes de los panes,
resultando en intervalos moderados de proteínas (7,6 g/100g) y de grasa
(3,70 g/100g). Los resultados obtenidos para la composición química de
los panes libres de gluten experimentales, reflejan claramente la
Discusión General
190
influencia de los ingredientes presentes en las distintas formulaciones
sobre la composición de los productos finales.
La combinación “fundamentada” de los distintos ingredientes para
formular panes sin gluten permite mejorar su calidad nutricional. No
obstante, muchas veces la adición de algunas proteínas y otros aditivos
puede alterar tanto la textura como características sensoriales de sabor
y/u olor de los panes, haciéndolos poco apetecibles a la hora de
consumirlos. Este comportamiento ha sido referido también por Marco y
Rosell (2008a), quienes encontraron que la incorporación de aislado
proteico de soja en masas libres de gluten basadas en harina de arroz,
incrementó la dureza de la miga y disminuyó el volumen específico de
los panes. Por ello resulta necesaria la evaluación tecnológica de los
productos resultantes.
La complejidad de las formulaciones de panes libres de gluten ha
obligado a investigar las características de las masas y de los productos
horneados resultantes. Sin embargo, pocos estudios han sido enfocados
en evaluar la conexión entre las propiedades de la masa y las
características tecnológicas del producto horneado. Por otra parte, muy
pocas correlaciones han sido establecidas entre los parámetros
instrumentales y los atributos sensoriales en este tipo de productos
(Pagliarini y col., 2010), lo cual podría ser muy útil para definir cuáles
son los mejores atributos de calidad de los productos finales. Es por ello
que, como parte importante de esta investigación se realizó la
caracterización tecnológica y sensorial de diversos tipos de productos
libres de gluten tipo pan, comerciales y formulados, y la reología de las

Discusión General
191
masas, con la finalidad de establecer posibles correlaciones entre los
parámetros descriptivos de las características de los panes libres de
gluten determinados a través de métodos instrumentales y del análisis
sensorial, o bien para establecer relaciones entre los parámetros que
permitan predecir la calidad de los panes a nivel de la masa.
Los panes libres de gluten se caracterizan por tener baja capacidad de
conservar la humedad durante el almacenamiento es por ello que se
determinaron las propiedades de hidratación de la miga en la
caracterización de los panes. En el presente estudio se encontraron
diferencias significativas (P<0,05) entre las muestras al evaluar las
propiedades de hidratación de la miga. De los resultados se deriva, que
las propiedades de hidratación medidas en las muestras de pan, están
fuertemente gobernadas por la complejidad de las formulaciones y en
particular por la presencia de diferentes tipos de proteínas e hidrocoloides
(Rosell y col., 2001; Moore y col., 2004; Gallagher y col., 2004; Arendt y
Moore, 2006; Lazaridou y col.,2007; Sabanis y col., 2009; Crockett y
col., 2011; Houben y col., 2012), los cuales al parecer le confieren al
producto final sus propiedades de hidratación y muy particularmente su
alta capacidad de enlazar agua. Todas las características fisicoquímicas
evaluadas discriminaron significativamente (P<0,05) entre las muestras.
Tanto las muestras de origen comercial como los panes experimentales
presentaron valores de volumen específico que se encuentran dentro de
los rangos reportados para este tipo de productos (Sabanis y col., 2009;
Marco y Rosell, 2008a). La mayoría de los panes de origen comercial
presentaron valores más bajos para el contenido de humedad de la miga
Discusión General
192
que los encontrados en la mayoría de las muestras experimentales. Estos
resultados coinciden con los reportados por Marco y Rosell (2008a) y
Sabanis y col. (2009), quienes describieron valores muy altos para el
contenido de humedad en panes libres de gluten enriquecidos en
proteínas y en fibras.
El color también es un parámetro importante en la caracterización de
panes libres de gluten. Los parámetros de color (L*, a* y b*) obtenidos
para el color de la miga mostraron diferencias significativas (P<0.05)
entre las muestras y la mayor variabilidad la presentó la luminosidad
(L*). En general los valores más bajos para el parámetro L* fueron
obtenidos en los panes provenientes de formulaciones donde uno o varios
ingredientes aportaron su color natural, principalmente proteínas de soja,
polvo de huevo y la goma xantana; en consecuencia estos ingredientes
podrían ser los responsables de la disminución en la claridad o
luminosidad de los panes. Valores más altos de L* se observaron en
aquellas muestras basadas en almidones o en harina de arroz y almidón
sin la adición de huevo o soja como ingredientes. Sin embargo, el
obscurecimiento del color de miga podría ser una característica deseable,
ya que en general los panes libres de gluten tienden a presentar un color
más claro que los panes de trigo (Gallagher y col., 2003).
Los resultados obtenidos en relación a los parámetros fisicoquímicos
indicaron que las muestras de panes libres de gluten evaluadas además de
discriminar entre ellas y presentar claras diferencias significativas entre
los parámetros fisicoquímicos determinados, también cubren una buena
gama de las características reportadas previamente en la literatura para

Discusión General
193
este tipo de panes (Brites y col., 2010, Onyango y col., 2011; Sciarini y
col, 2010; 2012).
La dureza de la miga es uno de los parámetros de calidad más
importantes en la evaluación y caracterización de los panes libres de
gluten, ya que a menudo puede representar un factor de aceptación
rechazo por parte de los consumidores. En este estudio la dureza de la
miga discriminó significativamente (P< 0,05) entre las muestras. Los
resultados obtenidos mostraron considerables diferencias dependiendo
del origen de las muestras y también del tipo de formulación utilizada en
la elaboración de los respectivos panes libres de gluten. Los resultados
obtenidos ratifican que los panes de origen comercial presentan baja
calidad tecnológica, caracterizándose principalmente por presentar migas
duras y secas, fácilmente disgregables y en consecuencia poco elásticas y
con corta vida de almacenamiento (Moore y col., 2004; Gallager y col.,
2004). En relación a los panes experimentales, la mayoría presentaron
valores de dureza bajos (1,33N a 7,53N), sin embargo los valores
obtenidos fueron más altos cuando se incorporó aislado proteico de soja
o huevo entero en polvo en las formulaciones. En las muestras
comerciales no se reflejó esta tendencia. En general las grandes
diferencias observadas en las características tecnológicas de las diversas
muestras evaluadas dependieron del tipo de formulación usada para la
obtención de los panes libres de gluten. Tanto los panes de origen
comercial, como los panes obtenidos a partir de las masas formuladas
presentaron importantes diferencias en relación a color, apariencia,
forma, tamaño, volumen y dureza de la miga. Resultados similares en

Discusión General
194
variabilidad han sido reportados en otros estudios al evaluar la calidad
tecnológica de diferentes tipos de panes libres de gluten (Kadan y col.,
2001; Moore y col., 2004; Lazaridou y col., 2007; Marco y Rosell,
2008a, Pruska-Kędzior y col., 2008; Brites y col., 2010, Onyango y col.,
2011; Sciarini y col, 2010; 2012; Sabanis y Tzia, 2011; Mariotti y col.,
2013).
Los resultados del análisis descriptivo cuantitativo realizado para la
evaluación sensorial de los panes libres de gluten, permitieron establecer
que todas las muestras evaluadas se diferenciaron significativamente
(P<0,05) para los atributos apariencia de rebanada, capacidad de
recuperación y disgregabilidad; lo que sugiere que estos atributos
particularmente podrían ser de utilidad en la caracterización de panes
libres de gluten. Adicionalmente los atributos olor y color (P<0,01)
permitieron diferenciar entre las muestra comerciales y gusto, color, y
dureza entre las muestras experimentales. Contrariamente, no se
observaron diferencias significativas (P<0,05) en la percepción del gusto,
el regusto y la dureza entre las diferentes muestras comerciales; ni para el
olor entre las muestras experimentales. Otros investigadores han descrito
que en la evaluación de panes libres de gluten la preferencia de los
consumidores tanto celiacos como no celiacos está positivamente influida
por los atributos sensoriales suavidad, uniformidad en la porosidad de la
miga y sabor dulce, y parcialmente por aroma y sabor a maíz (Pagliarini
y col., 2010).
Algunos de los resultados obtenidos en la evaluación sensorial de las
muestras comerciales presentaron discrepancias con aquellos obtenidos

Discusión General
195
en la evaluación tecnológica a través de análisis instrumentales. Por un
lado la dureza de la miga medida instrumentalmente presentó diferencias
significativas que permitieron discriminar entre las muestras; que no
fueron percibidas en la evaluación sensorial. Un resultado similar se
observó en relación al color de los panes comerciales. Esto sugiere, que
en panes almacenados estos dos atributos al parecer no permiten
discriminar sensorialmente entre muestras.
Correlaciones significativas fueron observadas dentro de los parámetros
usados para caracterizar los panes libres de gluten de origen comercial,
pero estas correlaciones fueron obtenidas principalmente con los
parámetros instrumentales. Fuertes correlaciones lineales fueron
observadas entre los diferentes parámetros de color, pero también se
observó una fuerte correlación lineal entre L* y cohesividad (P<0,001) y
la resiliencia (P<0,001). Presumiblemente, la estructura de la miga tiene
gran influencia sobre las propiedades de textura y luminosidad de la
miga. En tal sentido ha sido reportado que panes más pequeños
resultaron más densos y con estructura más apretada de la miga,
produciendo migas con mayor firmeza (Sabanis y col., 2009). Esto lleva
a pensar que los panes con migas compactas podrían ser percibidos como
duros. Sabanis y col. (2009) también reportaron una correlación negativa
entre la firmeza de la miga y el volumen del pan (r = -0,89, P>0,05). En
este tipo de productos, la actividad de agua muestra una significante
relación positiva con el contenido de humedad. Es importante destacar
las relaciones observadas entre las características de la hidratación de la
miga y algunos otros parámetros, puesto que esas características no se
Discusión General
196
han determinado previamente en pan. Las características de hidratación
de la miga (hinchamiento, WHC y WBC) fueron significativa y
positivamente relacionadas entre ellas. Por otra parte, fuertes relaciones
positivas fueron observadas entre WHC con resiliencia (r<0,7020) y
entre WBC con cohesividad (r<0,7633) y resiliencia (r<0,7901). Algunas
relaciones entre los parámetros sensoriales y los parámetros
instrumentales resultaron significativas, aunque los coeficientes de
correlación fueron bajos, indicando correlaciones lineares muy débiles o
bajas (r ≤0,35), probablemente debido a la complejidad de las
formulaciones.
Adicionalmente se encontraron relaciones altamente significativas
(P<0,001) y positivas entre la dureza-TPA y los parámetros reológicos de
las masas libres de gluten caracterizadas mediante el Mixolab. Esto
podría indicar que los valores de dureza-TPA están fuertemente
correlacionados (r>0,70) con parámetros que caracterizan el
comportamiento durante el enfriamiento tanto de almidones como de
proteínas. Es importante destacar que las características de la viscosidad
de masas de trigo determinadas con el Viscoanalizador Rápido (RVA)
también han sido correlacionadas con los parámetros de textura del pan
de trigo (Collar 2003). El perfil de formación de pasta durante la cocción
y el enfriamiento de la masa de trigo han sido altamente correlacionados
con los parámetros de la cinética del envejecimiento del pan.
Particularmente, la viscosidad pico, la temperatura de formación de pasta
y el setback durante el enfriamiento pueden ser considerados predictores
a nivel de la masa reafirmando el comportamiento de pan de trigo

Discusión General
197
durante el almacenamiento. También se han descrito correlaciones
positivas entre la viscosidad aparente de la masa y el volumen de pan
(r = 0,83, P< 0,05) y también entre la porosidad y el volumen del pan
(r = 0,81, P< 0.05) (Sabanis y col., 2009). Con respecto a las masas libres
de gluten, el comportamiento de la pasta de harina de maíz ha sido
significativamente correlacionado con parámetros de textura de la masa
(Brites y col., 2010).
En general, los coeficientes de correlación más altos se obtuvieron entre
las propiedades de la masa y los parámetros instrumentales de los panes
(r >0,70), en comparación con los obtenidos entre los parámetros
instrumentales y las características sensoriales (r < 0,70). No se
encontraron relaciones coincidentes con coeficiente altos (r> 0,70) entre
los parámetros instrumentales y las características sensoriales. Las pocas
correlaciones comunes encontradas entre los parámetros que
caracterizaron los panes libres de gluten evaluados fueron correlaciones
negativas y bajas (r< 0,60) entre uno o varios de los parámetros de color
(L*, a*,b*, croma) con la apariencia de la miga, el color percibido, y la
capacidad de recuperación percibida; y otras positivas y bajas con la
disgregabilidad percibida.
El pan es el producto libre de gluten de mayor consumo, no obstante en
los últimos años también se ha generado la demanda de productos libres
de gluten que se consumen por placer, sin buscar satisfacer necesidades
nutricionales. A este tipo de productos también se les conoce como
“alimentos indulgentes” o “alimentos hedónicos”, y entre ellos se
encuentran los productos dulces de bollería como las magdalenas.

Discusión General
198
Las magdalenas, además de ser uno de los productos dulces de bollería
más consumidos, podrían considerarse un sistema ideal de estudio ya que
desde un punto de vista tecnológico su desarrollo requiere procesos
diferentes a los utilizados en la elaboración del pan. Por tanto a través de
la formulación y el desarrollo de este tipo de productos es posible evaluar
un comportamiento reológico distinto de las mezclas libres de gluten. En
esta investigación se utilizó la harina de arroz con miras a ampliar el
conocimiento de su aplicación en la elaboración de productos libres de
gluten dulces horneados no fermentados y enriquecidos con proteínas de
distintas fuentes; desde un enfoque científico, para avanzar en el
conocimiento del rol de las proteínas en el comportamiento reológico de
las masas-batidas y sobre las características de calidad del producto final.
El estudio reológico de las mezclas formuladas para elaborar magdalenas
a base de harina de arroz demostró que las propiedades reológicas de las
masas-batidas estuvieron gobernadas en gran medida por el tipo de
proteína utilizada en cada formulación. En general, las formulaciones que
contenían proteínas de origen vegetal (gluten vital de trigo, aislado
proteico de soja y aislado proteico de guisantes) presentaron
comportamientos reológicos diferentes a las de aquellas que contenían
proteína de origen animal (clara de huevo y caseína). Adicionalmente, se
observaron comportamientos distintos entre las masas-batidas que
contenían proteínas del mismo origen. Particularmente los efectos de la
adición de la clara de huevo y de la caseína resultaron prácticamente
opuestos al compararlas entre ellas; mientras que a diferencia de las
proteínas de legumbres, la presencia del gluten vital de trigo presentó un
Discusión General
199
comportamiento similar a la masa-batida control en la mayoría de las
características reológicas evaluadas.
La adición de proteína de legumbres en la masa-batida basada en harina
de arroz produjo un gran incremento en el índice de consistencia, siendo
este efecto más marcado en presencia de aislado proteico de guisantes.
De forma similar, otros autores han encontrado incremento en la
consistencia de las masas-batidas de bizcochos por efecto de la adición
de proteínas, siendo mayor en presencia de aislado proteico de soja que
en presencia de proteína de trigo (Ronda y col., 2011). En el presente
estudio, el incremento observado en la consistencia de la masa-batida en
presencia de aislado proteico de guisante y de soja podría ser atribuido a
la gran capacidad de enlazar agua de estas proteínas, la cual al parecer es
conferida a la masa-batida. La gravedad específica de la masa-batida
también se vio afectada por la presencia de las proteínas vegetales, y
entre ellas el mayor incremento fue observado en presencia de gluten
vital de trigo. Sin embargo, las masas-batidas que contenían aislado
proteico de soja o aislado proteico de guisantes no presentaron
diferencias significativas entre sí para la gravedad específica, lo cual
indica que las mismas tiene un comportamiento similar en relación a la
capacidad de retención de aire; esto puede ser atribuido a la naturaleza de
las proteínas de legumbres. Por otra parte, un comportamiento
completamente diferente fue observado entre las proteínas de origen
animal. La adición de clara de huevo incorporó y retuvo más aire dentro
de la masa durante el mezclado. En general, las masas-batidas con menor
densidad suelen tener mayor cantidad de aire incorporado (Turabi y col.,

Discusión General
200
2008a,b; Ronda y col., 2011; Martínez-Cervera y col., 2011), lo cual es
deseable en la elaboración de magdalenas.
Las diferencias observadas entre las proteínas del mismo origen pueden
ser atribuidas a las propiedades funcionales de las proteínas, tales como
actividad emulgente o estabilizador de espuma. En este sentido, Marco y
Rosell (2008b) encontraron que la presencia de proteínas de albumen de
huevo o proteína de suero incrementa la actividad emulgente de harina de
arroz, mientras que las proteínas de soja o de guisantes modificaron
fuertemente este parámetro. Adicionalmente, indicaron que la estabilidad
de la emulsión disminuyó significativamente en presencia de las
proteínas de huevo o de suero.
Los valores obtenidos para los parámetros de viscoelásticidad indicaron
que la presencia de los diferentes tipos de proteínas produjo cambios
significativos (P<0,05) sobre las propiedades viscoelásticas de la masa-
batida control. Una vez más se pone de manifiesto que la extensión del
efecto de la adición de proteínas sobre las propiedades viscoelásticas de
la masa-batida depende en gran medida de la naturaleza de la proteína
añadida. Las masas-batidas que contenían proteína vegetal produjeron
valores más altos de G′ en comparación con los del control, aunque en el
caso del gluten vital de trigo el incremento no fue significativo,
indicando similitudes entre las proteínas del gluten y las del arroz.
Resultados similares han sido reportados por Ronda y col. (2011) y
Marco y Rosell (2008b). La adición de caseína produjo un incremento
significativo (P<0,05) de G′, similar al producido por efecto de la adición
de aislado proteico de guisante. Sin embargo, G′ no fue
Discusión General
201
significativamente modificado por la presencia de clara de huevo,
indicando un comportamiento similar al de la masa-batida control.
En general, la adición de proteínas también modificó significativamente
(P<0,05) las características tecnológicas de las magdalenas obtenidas a
partir de las masas-batidas formuladas y la dimensión del efecto estuvo
influida por el tipo de proteína. Las magdalenas preparadas con proteínas
de origen animal presentaron el volumen específico más alto, y el mayor
efecto fue observado con clara de huevo; al parecer debido a que esta
masa-batida fue capaz de incorporar y retener más aire durante la mezcla
y el horneado (Geera y col., 2011). En consecuencia, las magdalenas que
contenían huevo o caseína presentaron un mayor número de burbujas de
aire, resultando en una estructura más esponjosa y ligera. La dureza
aumentó significativamente (P<0,05) sólo en presencia de la caseína.
Además, se observó un aumento significativo (P< 0,05) de la capacidad
de recuperación, la cohesividad y la elasticidad por efecto de la presencia
de proteínas de origen animal, indicando más elasticidad. Se sabe que la
elasticidad está asociada al producto fresco, aireado y elástico y en el
caso de las magdalenas valores altos de elasticidad están vinculados a
alta calidad de producto final (Sanz et al., 2009). Mientras que masas
densas con menor número de células de aire conducen a valores bajos de
elasticidad, lo que implica que se requiere más tiempo para que la
estructura se recupere después de la compresión (Martínez-Cervera y
col., 2011).
En general, las magdalenas elaboradas a partir de proteínas de origen
animal fueron más elásticas y cohesivas que las elaboradas utilizando

Discusión General
202
proteínas de origen vegetal. Los resultados de este estudio revelaron
claramente gran variabilidad en la calidad de la textura de las magdalenas
elaboradas a partir de harina de arroz y enriquecidas con diferentes
fuentes de proteínas.
Referencias
Arendt EK, Moore M. 2006. Gluten-free cereal-based products. In: Hui
YH, Corke H, de Leyn I, Nip W-K, Cross N (eds) Bakery products:
science and technology , 1st edn. Blackwell, Ames, pp 471-496.
Bardella MT, Fredella C, Prampolini L, Molteni N, Giunta, AM, Bianchi
PA. 2000. Body composition and dietary intakes in adult celiac disease
patients consuming a strict gluten free diet. Journal American Diet
Association 102, 993-1000.
Bernal MJ, Periago MJ, Ros G. 2002. Effects of processing on dextrin,
total starch, dietary fiber and starch digestibility in infant cereals. Journal
Food Science 67, 1249-1254.
Brites C, Trigo MJ, Santos C, Collar C, Rosell CM. 2010. Maize-based
gluten free: influence of processing parameters on sensory and
instrumental quality. Food Bioprocess Technology 3,707-715.
Collar C. 2003. Significance of viscosity profile of pasted and gelled
formulated wheat doughs on bread staling. European Food Research
Technology 216, 505-513.
Collins BJ, Bell PM, Thomson JM, Fee DB, Wilson EA, Love AHG.
1986. Dietary history and nutritional state in treated coeliac patients.
Journal of the Royal Society of Medicine 79, 206-209.

Discusión General
203
Crockett R, Ie Pauline, Vodavotz Y. 2011. Effects of soy protein isolate
and egg white solids on the physicochemical properties of gluten-free
bread. Food Chemistry 129, 84–91.
Gallagher E, Gormley TR, Arendt EK. 2004. Recent advances in the
formulation of gluten-free cereal-based products. Trends in Food Science
and Technology 15, 143-152.
Gallagher E, Kunkel A, Gormley TR, Arent, EK. 2003. The effect of
dairy and rice powder addition on loaf and crumb characteristics, and
shelf life (intermediate and long-term) of gluten-free stored in a modified
atmosphere. European Food Research and Technology 218, 44-48.
Geera B, Reiling JA, Hutchison MA, Rybak D, Santha B, Ratnayake WS.
2011. A comprehensive evaluation of egg and egg replacers on the
product quality of muffins. Journal of Food Quality 34, 333–342.
Grehn S, Fridell K, Lilliecreutz M, Hallert C. 2001. Dietary habits of
Swedish adult celiac patients treated by a gluten-free diet for 10 years.
Scandinavian Journal of Nutrition 45, 178-182.
Houben A, Höchstötter A, Becker T. 2012. Possibilities to increase the
quality in gluten-free bread production: an overview. European Food
Research Technology 235, 195–208 DOI 10.1007/s00217-012-1720-0.
Kadan RS, Robinson MG, Thibodeaux DP, Peperman AB. 2001.Texture
and other physicochemical properties of whole rice bread. Journal of
Food Science and Technology 66, 940-944.
Lazaridou A, Duta D, Papageorgiou M, Belc N, Biliaderis CG. 2007.
Effects of hydrocolloids on dough rheology and bread quality parameters
in gluten-free formulations. Journal of Food Engineering 79, 1033-1047.

Discusión General
204
Marco C, Rosell CM. 2008a. Breadmaking performance of protein
enriched, gluten-free breads. European Food Research and Technology
227, 1205-1213.
Marco C, Rosell CM. 2008b. Functional and rheological properties of
protein enriched gluten free composite flours. Journal of Food
Engineering 88, 94-103.
Mariani P, Grazia Viti M, Monturoi M, La Vecchia A, Cipolletta E,
Calvani L. 1998. The gluten free diet: A nutritional risk factor for
adolescents with celiac disease. Journal of Pediatric Gastroenterology
and Nutrition 27, 457-461.
Mariotti M, Pagani MA, Lucisano M. 2013. The role of buckwheat and
HPMC on the breadkmaking properties of some comercial gluten-free
bread mixtures. Food Hydrocolloids 30, 393-400.
Martínez-Cervera S, Salvador A, Muguerza B, Moulay L, Fiszman SM.
2011. Cocoa fibre and its application as a fat replacer in chocolate
muffins. LWT- Food Science and Technology 44, 729-736.
Moore MM, Schober TJ, Dockery P, Arendt EK. 2004. Textural
comparisons of gluten-free and wheat-based doughs, batters, and breads.
Cereal Chemistry 81: 567-575.
Onyango C, Mutungi C, Unbehend, G, Lindhauer, MG. 2011.
Modification of gluten-free sorghum batter and bread using maize,
potato, cassava or rice starch. LWT- Food Science and Technology 44,
681-686.

Discusión General
205
Pagliarini E, Laureati M, Lavelli V. 2010. Sensory evaluation of gluten
free-breads assessed by a trained panel of celiac assessors. European
Food Research and Technology 231, 37-46.
Pruska-Kędzior A, Kędzior Z, Gorący M, Pietrowska K, Przybylska A,
Spychalska K. 2008. Comparison of rheological, fermentative and baking
properties of gluten-free dough formulations. European Food Research
and Technology 227, 1523-1536.
Ronda F, Oliete B, Gómez M, Caballero PA, Pando V. 2011. Rheological
study of layer cake batters made with soybean protein isolate and
different starch sources. Journal of Food Engineering 102, 272–277.
Rosell CM, Rojas JA, Benedito C. 2001. Influence of hydrocolloids on
dough rheology and bread quality. Food Hydrocolloids 15, 75-81.
Sabanis D, Lebesi D, Tzia C. 2009. Effect of dietary fibre enrichment on
selected properties of gluten-free bread. LWT-Food Science and
Technology 42, 1380–1389.
Sabanis D, Tzia C. 2011. Effect of hydrocolloids on selected properties
of gluten-free dough and bread. Food Science and Technology
International 17, 279-291. DOI: 10.1177/1082013210382350
Sanz T, Salvador A, Baixauli R, Fiszman SM. 2009. Evaluation of four
types of resistant starch in muffins. II. Effects in texture, colour and
consumer response. European Food Research and Technology, 229, 197–
204. DOI 10.1007/s00217-009-1040-1.
Sciarini LS, Ribotta PD, León AE, Pérez GT. 2010. Influence of gluten-
free flours and their mixtures on batter properties and bread quality. Food
Bioprocess Technology 3: 577–585 Doi: 10.1007/s11947-008-0098-2.

Discusión General
206
Sciarini LS, Pérez GT, Lamballerie M, León AE, Ribotta PD. 2012.
Partial-Baking Process on Gluten-Free Bread: Impact of Hydrocolloid
Addition. Food Bioprocess Technology 5: 1724–1732. DOI
10.1007/s11947-011-0529-3.
Subar AF, Krebs-Smith SM, Cook A, Kahle LL. 1998. Dietary sources of
nutrients among US adults, 1989-1991. Journal of the American Dietetic
Association 98, 537-547.
Thompson T, Dennis M, Higgins LA, Lee AR, Sharrett MK. 2005.
Gluten-free diet survey: are Americans with celiac disease consuming
recommended amounts of fibre, iron, calcium and grain foods?. British
Dietetic Association 18, 163-169.
Thompson T. 1999. Thiamine, riboflavin, and niacin contents of the
gluten free diet: is there cause for concern?. Journal American Diet
Association 99, 858-862.
Thompson T. 2000. Folate, iron and dietary fiber contents of the gluten
free diet. Journal American Diet Association 100, 1389-1396.
Turabi E, Sumnu G, Sahin S. 2008a. Rheological properties and quality
of rice cakes formulated with different gums and an emulsifier blend.
Food Hydrocolloids 22, 305–312.
Turabi E, Sumnu G, Sahin S. 2008b. Optimization of baking of rice
cakes in infrared-microwave combination oven by response surface
methodology. Food Bioprocess Technology 1, 64–73. DOI:
10.1007/s11947-007-0003-4.

CONCLUSIONES

Conclusiones
209
A continuación se presentan las conclusiones más relevantes de esta
Tesis Doctoral:
- La evaluación nutricional de diferentes tipos de pan libres de gluten de
origen comercial reveló que estos son alimentos amiláceos con gran
divergencia en la composición de proteínas y grasas; y de alto índice
glucémico.
- De acuerdo al análisis de componentes principales los atributos
sensoriales, así como las propiedades de hidratación y parámetros de
textura descritos en este estudio serían los más adecuados para
caracterizar productos libres de gluten tipo pan.
- El diseño de formulaciones de mezclas libres de gluten basadas en
harina de arroz y enriquecidas en proteínas condujo a la obtención de
distintos tipos de pan, los cuales discriminaron ampliamente en el
contenido de proteínas y grasa. Adicionalmente, los parámetros
instrumentales de calidad evaluados y las características sensoriales
discriminaron entre los diferentes panes libres de gluten formulados.
Tales diferencias pueden ser atribuidas a la complejidad y la composición
de las formulaciones.
- Entre todos los panes libres de gluten diseñados, el formulado a base de
harina de arroz y HPMC presentó buen balance de nutrientes (7,10
g/100g de proteínas, 3,70 g/100g de lípidos; minerales 1,31 g/100g, y
87,89 g/100g de carbohidratos, bs), las mejores características
tecnológicas y la mayor aceptación sensorial. En general los panes

210
enriquecidos en proteínas presentaron mayor dureza y menor aceptación
global.
-El estudio reológico de la amplia gama de masas/masas-batidas
formuladas a base de harina de arroz y enriquecidas en proteínas reveló
que todos los parámetros obtenidos a partir del Mixolab® discriminaron
significativamente (P<0,05) entre las masas evaluadas. Adicionalmente,
las diferencias encontradas en las propiedades reológicas de las masas
fueron asociadas principalmente a la presencia o ausencia de proteínas y
almidón.
-Las correlaciones con los coeficientes más altos fueron obtenidas entre
las propiedades reológicas de las masas y los parámetros instrumentales
de calidad de los productos horneados frescos. Particularmente, la
consistencia de la masa/masa-batida durante el mezclado (C1), la
amplitud y la consistencia de la masa/masa-batida después del
enfriamiento (C5) podrían ser predictores adecuados del parámetro
dureza de la miga en los panes libres de gluten.
-En lo concerniente al estudio del rol de las proteínas en el desarrollo de
productos tipo magdalenas, los resultados obtenidos permitieron concluir
que tanto las propiedades viscoelásticas de las masas-batidas como las
características tecnológicas del producto horneado final están dominadas
por la naturaleza de las proteínas utilizadas en la formulación. La adición
de clara de huevo disminuyó la gravedad específica de la masa-batida.
Por otra parte, la presencia de aislado proteico de soja, de aislado
proteico de guisantes y de caseína incrementó el módulo de

Conclusiones
211
almacenamiento (G′) modificando fuertemente el comportamiento
viscoelástico de la masa-batida basada en harina de arroz. En general, la
adición de aislado proteico de soja, de aislado proteico de guisantes y de
clara de huevo produjo un gran incremento en G′ por efecto del
calentamiento. Estas diferencias pueden atribuirse a la naturaleza y al
patrón particular de la desnaturalización que presentan las diferentes
fracciones de proteínas presentes en cada tipo de proteína utilizada.
-Con respecto a la calidad tecnológica de las magdalenas la adición de
aislado proteico de guisantes produjo magdalenas más suave y elásticas
que las elaboradas con la masa-batida control y las proteínas de origen
animal; mientras que las proteínas de origen animal produjeron
magdalenas con mejor apariencia.
-Los resultados obtenidos en la presente investigación permiten concluir
que es viable elaborar productos horneados (panes y magdalenas) libres
de gluten basados en harina de arroz y enriquecidos en proteínas con
características nutricionales, tecnológicas y sensoriales mejores que los
disponibles en el mercado. Sin embargo, es necesario tener en cuenta que
el uso de harina de arroz como sustituto de la harina de trigo, y de
proteínas de origen vegetal como soja o guisantes en sustitución del
huevo en este tipo de productos, produce cambios notables en la calidad
tecnológica y sensorial de los productos finales. Por lo tanto, la
optimización de este tipo de formulaciones y la selección fundamentada
de los ingredientes y su combinación es necesaria para garantizar la
adecuada textura y aceptación de estos productos libres de gluten
alternativos.