revista mexicana de geoenergÍa · issn 0186...
TRANSCRIPT

.
.
REVISTA MEXICANA DE GEOENERGÍA · ISSN 0186 5897
Volumen 26, No.2 Julio-Diciembre 2013
CONTENIDO
Editorial 1
Case history of los Azufres conceptual modeling in a mexican geothermal field 3 Abraham III Molina Martínez
Acid stimulation of geothermal wells in México, El Salvador and The Philippines 17 Lilibeth Morales Alcalá
Micro seismic monitoring during production. Utilization and case examples for México 33 Efrén Cruz Noé, Cecilia Lorenzo Pulido, Jorge Soto Peredo y Saúl Pulido Arreola
Central Solar Fotovoltaica Santa Rosalía 1 MW. Primer año de operación 46 Roberto Cadenas Tovar, Carlos Sánchez Cornejo, Ángel Antonio Zapata López
Estudio Petrográfico del Pozo H-43, Los Humeros, Puebla.: 52 Interpretación e indicadores mineralógicos de acidez
Julio César Viggiano Guerra, Magaly del C. Flores Armenta, Víctor Santiago Rocha López, Fernando Sandoval Medina
Prevención de probable inestabilidad de una plataforma de perforación 62 del Campo Geotérmico de Los Azufres. Mich., mediante inyección de cemento Héctor Pérez Esquivias, Gelasio Vargas Benítez, Ana M. Garciadiego Martínez,. Emigdio Casimiro Espinoza y Francisco Fernández Romero
FORO: Energía Solar 72 María Teresa Ortega Méndez y Heber Didier Diez León
Instrucciones de Publicación de la Revista Geotermia 79
La revista GEOTERMIA es un órgano virtual de información técnica publicado por la Gerencia de Proyectos Geotermoeléctricos (GPG) de la Comisión Federal de Electricidad (CFE), de edición semestral. Su certificado de licitud de título es el número 2784 del 2 de octubre de 1985, y su licitud de contenido es el número 2514 del 1 de diciembre de 1986, ambos expedidos por la Comisión Calificadora de Publicaciones y Revistas Ilustradas de la Secretaría de Gobernación, México.
GEOTERMIA REVISTA MEXICANA DE GEOENERGÍA es nombre registrado en la Dirección General de Derechos de Autor de la Secretaría de Educación Pública de México, con la Reserva 01.86. Reservados todos los derechos de reproducción del material publicado. Registro ISSN 0186-5897.
Ni la CFE, la GPG o la AGM asumen responsabilidad alguna con relación a la veracidad o exactitud de los datos o conclusiones presentados en los artículos. Tampoco avalan ni sugieren el uso de productos comerciales que pueden ser citados eventualmente sólo con fines descriptivos.
La autorización para citar fuentes ajenas a la CFE corre a cargo de los autores. Las opiniones vertidas son responsabilidad exclusiva de ellos y no reflejan necesariamente las opiniones, políticas o programas oficiales de la CFE.
EDITORES
Director: Raúl Maya González (CFE)
Consejo Editorial: Magaly Flores Armenta Alejando Becerril Zavala Manuel Pinette Gaona Hugo Palma Guzmán
Miguel Ramírez Montes Cecilia Lorenzo Pulido
Heber Didier Diez León Jorge Soto Peredo
Ma. Teresa Ortega Méndez Christian Ordaz Méndez
Cristina Carachure Aguilar Georgina Zavala Esparza
Mónica Ivette Ortega Pineda
Editores Asociados:
Víctor Arellano Gómez (IIE) Víctor Hugo Garduño Monroy (UMSNH)
Susan F. Hodgson (Historiadora de temas geotérmicos y petroleros) Alfredo Mañón Mercado (Consultor)
José Manuel Romo Jones (CICESE) Mario César Suárez Arriaga (UMSNH)
Luis C. A. Gutiérrez Negrín (AGM)
Responsable de sitio en página de la UMSNH:
Julio Agustín Barrera Mendoza Jorge Armando Tinoco Michel
Oficinas:
Alejandro Volta 655 Col. Electricistas Morelia, Mich.
CP 58290 Tel. (443) 322-7000
Correos: [email protected]
El Consejo Editorial agradece el apoyo directo e indirecto de todas las personas que participaron en esta edición.
Esta es una revista digital que puede descargarse de manera gratuita de los portales públicos siguientes:
www.geotermia.org.mx www.geothermal.org
Fotografía de portada proporcionada por la Gerencia de Comunicación Social CFE. Autor: Fernando Franco Sevilla
EDITORIAL Estimados lectores, llegó el tiempo de presentarles la segunda publicación de GEOTERMIA para este 2013 y aprovechamos para mostrarles un nuevo formato de la revista, con la finalidad de hacer que su lectura sea agradable. Hemos tenido diversas experiencias en la edición de ésta y es muy probable que continuemos efectuándole cambios hasta que resulte práctica para todos los que participamos en su publicación y sobre todo grata para usted como usuario final. Hablando del ámbito geotérmico nacional la CFE, en busca de la optimización del recurso geotérmico y el incremento de generación de electricidad con energía limpia, desarrolló los proyectos Humeros II y Azufres III, que consisten en el incremento de la capacidad instalada. Destacamos que Humeros II, en diciembre de 2012 y marzo de 2013, puso en operación comercial dos unidades de 25 MW cada una, alcanzando una capacidad instalada de 78 MW, así también es importante mencionar que en diciembre de 2012 inició la construcción del proyecto Azufres III en el que se construye una nueva unidad de 50 MW y que reporta un avance del 28%, estimándose que inicie operación comercial a finales del 2014 y con lo que la capacidad instalada del campo geotérmico de Los Azufres se incrementará a 215 MW. Por otro lado, como ya es bien conocido por la mayoría de nosotros, próximamente se llevará a cabo el vigésimo primer congreso de la Asociación Geotérmica Mexicana (AGM) que será celebrado del 24 al 26 de octubre del presente en la hermosa ciudad de Morelia, teniendo como evento previo un interesante taller técnico (workshop) sobre “Técnicas Geoquímicas e Isotópicas en Geotermia” financiado por la IGA, así que si usted quiere asistir, no dude en que la experiencia será sumamente enriquecedora. En el ámbito internacional destacamos como actividades relevantes el cambio del Consejo Directivo de la International Geothermal Association (IGA) para el periodo del 2013-2016 y la próxima Reunión General Anual de ésta. Como parte de las actividades de expansión de la IGA, extendemos una especial felicitación a nuestros amigos de El Salvador por el establecimiento de la nueva Oficina Geotérmica Regional (RGO) en ese país. GEOTERMIA, la revista; en este segundo número del 2013 publica seis interesantes artículos, dos de ellos fueron presentados en marzo pasado en la ciudad de San Salvador en El Salvador durante el curso que año con año celebra LaGeo y la Universidad de las Naciones Unidas mediante el Programa de Entrenamiento Geotérmico (UNU-GTP) y del cual, compañeros de la CFE participaron compartiendo trabajos de vanguardia en geofísica y modelado conceptual desarrollados en nuestro país, dos artículos más sobre aspectos geológicos de Los Azufres y Los Humeros presentados durante el vigésimo congreso de la Asociación Geotérmica Mexicana (AGM) y Primer Congreso Geotérmico Latinoamericano, un quinto artículo es el resultado de un trabajo de especialización de personal de CFE en el programa UNU-GTP en Islandia, sobre estimulación de pozos geotérmicos. Finalmente, gracias al impulso que la CFE está dando a los proyectos de energía verde, se presenta un sexto artículo sobre la construcción y experiencias del primer año de operación del proyecto piloto de 1 MW de Santa Rosalía, que es la primera planta de generación fotovoltaica para el servicio público en México, el cual tomamos como inspiración para el tópico del foro de esta edición "Energía Solar". El Consejo Editorial desea que este número sea de su interés, reiterándoles que sus comentarios y/o sugerencias son bienvenidas.
Atte.
Ing. Raúl Maya González
Gerente de Proyectos Geotermoeléctricos CFE
1
EDITORIAL Dear readers, it is the time to present the second edition of Geotermia magazine for this 2013 and we took the opportunity to introduce a new format, with the only purpose of providing an enjoyable reading. We have had several experiences in this editing and it is very likely that we will continue making changes until we come up with a practical and convenient presentation for all of us that participate on the publication and above all, for you as a final user. Speaking about the national geothermal field, the CFE in search of the geothermal resource optimization and growth of clean generation energy projects has developed Los Humeros II and Los Azufres III projects, which consist in the increase of installed capacity. We highlight that Humeros II, on december 2012 and march 2013, put in commercial operation two 25 MW power plants units each one, reaching an installed capacity of 78 MW, so it is important to mention that in december 2012 begans Azufres III project which builds a new unit of 50 MW and shows a progress of 28%, estimated to begin commercial operation in late 2014 increasing the installed capacity of Los Azufres geothermal field to 215 MW. On the other hand, as it is well known by most of us, the twenty-first congress of the Asociación Geotérmica Mexicana (AGM) will take place from October 24 to 26 this year, in the beautiful city of Morelia. As a previous event, a technical workshop entitled “Geochemical and Isotopic Techniques in Geothermal”; sponsored by the IGA, will be held. If you wish to attend, do not hesitate that it will be an enriching experience. Internationally we highlight the change of the Council of Directors of the International Geothermal Association (IGA) for the 2013-2016 period and the next annual General Meeting as relevant, so we also want to congratulate our friends from El Salvador for the establishment of the new Regional Geothermal Office (RGO) in their country. GEOTERMIA, the magazine; in this 2013 second issue publishes six interesting articles, two of which were presented in the city of San Salvador, El Salvador in March, during the course that every year celebrates LaGeo and the United Nations University through the Geothermal Training Programme (UNU-GTP) in which, CFE staff attending participated sharing the cutting-edge work in geophysics and conceptual modeling developed in our country, two more articles on the geology of Los Azufres and Los Humeros fields are shown here, after being presented during the twentieth Congress of the Asociación Geotérmica Mexicana (AGM) and First Latin-American Geothermal Congress, a fifth article on geothermal well stimulation techniques is the result of one of our CFE colaborators training course in the UNU-GTP. Finally, thanks to the boost that CFE is giving to green energy projects, a sixth article concerning the construction and the experiences of the first year of operation of the Santa Rosalia 1MW Pilot project, which is the first photovoltaic generation plant for public service in Mexico. This has been taken as an inspiration for the forum topic of this edition “Solar Energy". The Editorial Board hopes that this issue is of your interest, reiterating that your comments and/or suggestions are appreciated and welcomed.
Atte.
Raúl Maya González Geothermal Project Manager
CFE 2
CASE HISTORY OF LOS AZUFRES CONCEPTUAL MODELLING IN A MEXICAN GEOTHERMAL FIELD
Abraham III Molina Martínez
"Alejandro Volta 655, Col. Electricistas, Morelia, Michoacán. C.P. 58290, México" [email protected]
Resumen
El modelo conceptual proporciona una representación descriptiva de un sistema geotérmico, basado en la información geológica, geofísica y geoquímica, además del análisis de los datos y mediciones realizadas en los pozos perforados, con el fin de definir las principales características del yacimiento, tales como su forma, límites, dimensiones, recarga probable, áreas de descarga y la distribución de la temperatura y presión. En este trabajo se presenta el modelo conceptual del yacimiento geotérmico Los Azufres. Este campo geotérmico es un complejo formado por extrusión de una serie de lavas con una extensión de 20 km
2, de composición basáltica y ácida de edad cuaternaria y una base de composición
andesítica del terciario. La unidad de Mil Cumbres andesita es la que contiene al yacimiento, mientras que la unidad de Agua Fría riolita opera localmente como una roca sello. La alteración hidrotermal es típica de un sistema geotérmico de alta temperatura. Las Fallas geológicas han ocurrido a lo largo de tres tendencias principales NW-SE, NE-SW y EW, siendo esta última la más joven. La composición química del fluido es de tipo clorurado-sódico. El líquido parece fluir vertical con movimiento lateral limitado, un cuerpo de roca de alta resistividad existe en el centro del campo y separa al yacimiento geotérmico en los sectores norte y sur. Las zonas de producción de los pozos en la mayor parte de los casos se encuentran en la intercepción de una zona asociada con una estructura permeable. El estado termodinámico se conceptualiza como un yacimiento con tres zonas diferentes, la más profunda compuesta por líquido comprimido, la del medio líquido en estado de saturación y la más somera de vapor dominante.
"Palabras Clave: Modelo conceptual; Yacimiento geotérmico"
Abstract The conceptual model provides a descriptive representation of a geothermal system, based on geological, geophysical and geochemical information and the analysis of data and measurements made in the drilled wells in order to define the main reservoir characteristics such as shape, limits, dimensions, probable recharge and discharge areas and temperature and pressure distribution. In this paper, the conceptual model of Los Azufres geothermal reservoir is presented. This geothermal field is a complex formed by extruding a series of lavas with an extension of 20 km
2, of basaltic and acidic quaternary age composition on a basement of tertiary andesitic composition.
The unit Mil Cumbres andesite is the one that contains the reservoir while the unit Agua Fria rhyolite operates locally as a cap rock. The hydrothermal alteration is typical of a high-temperature geothermal system. Faulting has occurred along three principal trends NW-SE, NE-SW and the youngest E-W. The chemical composition of the fluid is sodium chloride type. The fluid seem to flow vertical with limited lateral movement, a high resistivity rock body existing at the central of the field, separates the geothermal reservoir as the north and the south sectors. The production zones of the wells in most of the cases are located to intercept a zone associated with a permeable structure. The thermodynamic state is conceptualized as a reservoir with three different areas, the deepest one composed of compress liquid, the middle one of two phases layer of liquid dominated reservoir and the shallow one of two phases steam dominated reservoir. "Keywords: Conceptual model; Geothermal reservoir"
1. Introduction
Conceptual models are based on the integration of data from different disciplines to explain in our case a geothermal reservoir, in other words is a descriptive representation of a geothermal system based on the geological, geophysical and geochemical surface and data analysis and measurements made in boreholes.
The considerable amount of investigation that has been conducted in the Los Azufres field, combined
with the extensive information available from the large number of wells drilled, has allowed a reliable model of the geothermal reservoir to be developed in order to create a numerical model. This conceptual model is described and discussed in the sections that follow.
3
"Abraham III Molina Martínez" / Revista Geotermia Vol. 26, Num. 2 Julio-Diciembre de 2013
1.1. The Los Azufres geothermal field
Los Azufres geothermal system is located in the State of Michoacán to 80 km east of the city of Morelia and 16 km northwest of Ciudad Hidalgo, this geothermal field was explored in the mid 70 and since 1982 it has been in development, in the natural state was classified as conventional liquid-dominated high temperature system but during the long term of exploitation several thermodynamic studies have shown that the reservoir has three zones: dominant vapour in the upper reservoir, liquid saturation in the middle and liquid compressed in the bottom part of the reservoir. This field is located at an altitude above sea level ranging from 2500 to 3000 m, surrounded by valleys.
At the present time Los Azufres geothermal field have 43 production wells, 6 injections wells producing 14.7 million tonnes of vapour and generating 185 MW from 1 condensing unit of 50 MW, 4 condensing units of 25 MW each, 7 back-pressure units of 5 Mw each. In the present time there is under construction one 50 MW condensing unit in the northern part of the field that will replace 4 unit of 5 MW for a total electric generation of 215 MW.
1.2. Previous work
Several geological, geochemical and geophysical studies have been conducted since 1975, being in 1984 when the first geothermal conceptual model of the field was prepared, revealing the volume, reserves and reservoir boundaries, based on the above studies and complementary data produced from wells drilled to date (De la Cruz, 1984). In February 1987, new exploration data was available and an update of the conceptual model was done (Lira, H., 1987), in this work, configurations of isotherms were performed every 50 °C from the 150 °C to 300 °C, for elevations of 500 masl to 2500 masl, from the interpolation and extrapolation of the stabilized temperatures of 52 wells. Also, the configuration of the top of the epidote was conducted in the same levels as the isotherms, taking into account the 10% lower limit of the presence of epidote. And finally, the boundaries of the reservoir were defined taking into account the isotherm of 225 °C, the minimum resistive of geothermal interest, epidote settings and production wells.
Another redefinition of the conceptual mode was made in 1996 but only in the northern-east part of the
field (Flores, et, al., 1996), while the conceptual model of the south part was made in 1997 and it mentioned that the reservoir is made up of three lithological units (andesite, dacite and rhyolite), rhyolite is functioning as a caprock, also mention that the production zone in most cases appears to intersect one permeable zone associated to the E-W structure or a influence zone between the interval from the top of the epidote and amphibole. It should be clear that the overall thickness was calculated by averaging the calculation from the correlation of the obtained permeable zones and the difference between the top of the amphibole and epidote. In addition it is mentioned that the fluid is spread vertically through faults and the direction of the preferential fluid flow is NW-SE according to plan distribution of total gas, ratio of CO2/H2S, isotopy, pressure and temperature.
In 2003 CFE hired the services of GeothermEx, Inc. to update the conceptual and numerical model of the
geothermal field of Los Azufres and in 2007 West Japan Engineering Consultants, Inc. (West JEC) and Japan Bank for International Cooperation (JBIC) reinterpret the conceptual model in the feasibility study of the Los Azufres III geothermal energy expansion project which is the most recently reinterpretation of the model with no big changes from the last one.
4
"Abraham III Molina Martínez" / Revista Geotermia Vol. 26, Num. 2 Julio-Diciembre de 2013
2. Surface Manifestations
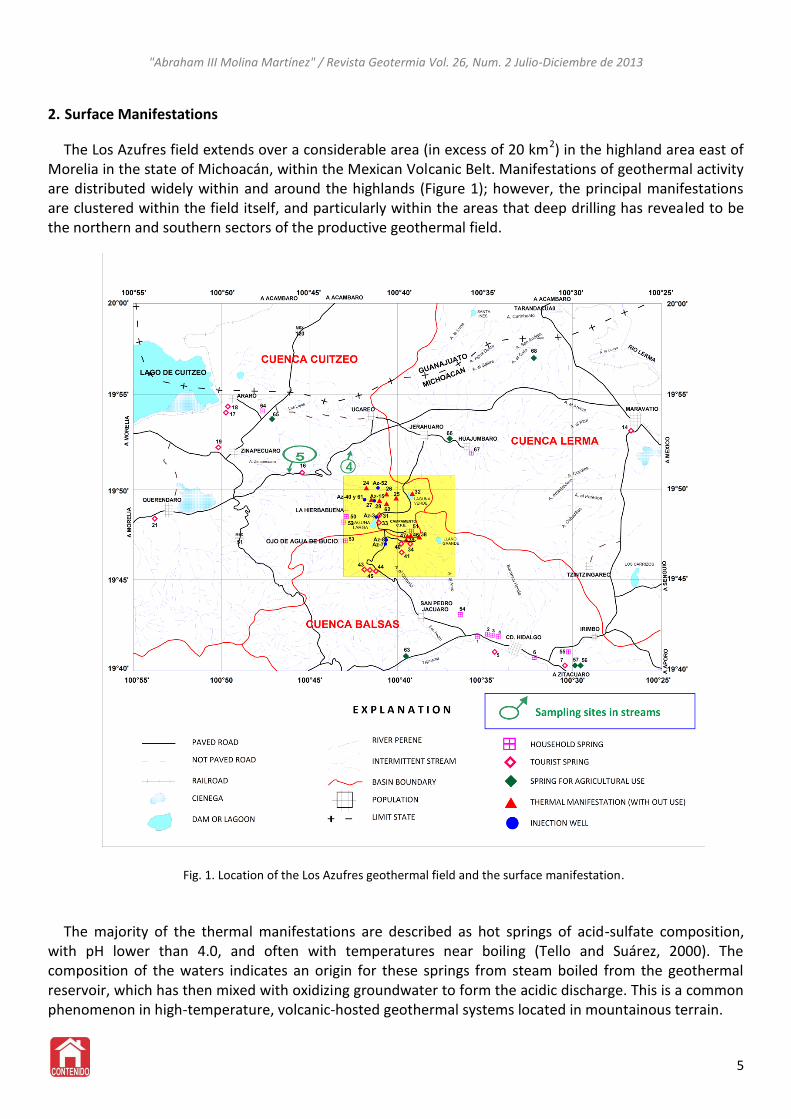
The Los Azufres field extends over a considerable area (in excess of 20 km2) in the highland area east of Morelia in the state of Michoacán, within the Mexican Volcanic Belt. Manifestations of geothermal activity are distributed widely within and around the highlands (Figure 1); however, the principal manifestations are clustered within the field itself, and particularly within the areas that deep drilling has revealed to be the northern and southern sectors of the productive geothermal field.
Fig. 1. Location of the Los Azufres geothermal field and the surface manifestation.
The majority of the thermal manifestations are described as hot springs of acid-sulfate composition,
with pH lower than 4.0, and often with temperatures near boiling (Tello and Suárez, 2000). The composition of the waters indicates an origin for these springs from steam boiled from the geothermal reservoir, which has then mixed with oxidizing groundwater to form the acidic discharge. This is a common phenomenon in high-temperature, volcanic-hosted geothermal systems located in mountainous terrain.
5
"Abraham III Molina Martínez" / Revista Geotermia Vol. 26, Num. 2 Julio-Diciembre de 2013
Some springs located around the periphery of the field are of sodium chloride type, indicating a more
direct discharge of liquid water from the reservoir to the surface. Still other springs are of sodium bicarbonate type, with low geothermometer temperatures, indicating a significant degree of mixing with cooler waters or other interaction with the shallow environment. Again, these types of manifestations are typical of volcanic-hosted geothermal systems in which the reservoir fluid is fundamentally neutral sodium-chloride water.
Many, though not all, of the superficial manifestations are located along the mapped traces of major
faults that transect the field. Leakage of steam and water from the geothermal reservoir toward the surface may occur principally along faults, but the surface locations could be controlled by a combination of structure and lithostratigraphy (permeable volcanic formations), with the interaction of the two creating a complex arrangement of thermal discharges. The manifestations provide a certain amount of evidence regarding patterns of flow within and from the geothermal reservoir; this is discussed further in subsequent sections (GeothermEx, 2003).
3. Geology
The geology of the Los Azufres field has been studied in exhaustive detail, both by means of geologic mapping and other studies conducted at the surface, and by analysis of drill cuttings, cores and other data from the numerous deep wells in the field. This section summarizes the geologic characteristics of the field that are pertinent to the development of a reliable numerical model.
3.1. Stratigraphy Los Azufres geothermal field is one of several Pleistocene silicic volcanic zones with geothermal systems
in the Trans Mexican Volcanic Belt (TMVB). The volcanic rocks in Los Azufres geothermal field are mainly divided into four principal units.
Mil Cumbres Andesitic Unit - This unit occurs throughout the field, and is the thickest unit of an average
of 2700 m, accounting for all of the reservoir rocks and extending below sea level. This volcanic sequence comprising andesitic rocks with some paleo-soil layers, basaltic rocks and volcanic agglomerates of 18 to 1.0 My age forms local basement in the field.
Agua Fría Rhyolite Unit - This unit is a silicic sequence up to 1,000 m thick and overlies the Mil Cumbres
Unit, and consists mainly of a spherulitic rhyolite lava with ages between 1 and 0.15 My. It is present at shallow levels, often outcropping, and is found mainly in the southern and central part of the field.
Dacita Tejamaniles - These young lavas occur locally in the southern sector of the field, and overlie the
Agua Fría Ryolite.
Tuff (pumice flow deposits) - This unit is considered to include a variety of young, superficial pyroclastics deposits, which have originated from relatively young volcanic activity in the vicinity of the field.
6
"Abraham III Molina Martínez" / Revista Geotermia Vol. 26, Num. 2 Julio-Diciembre de 2013
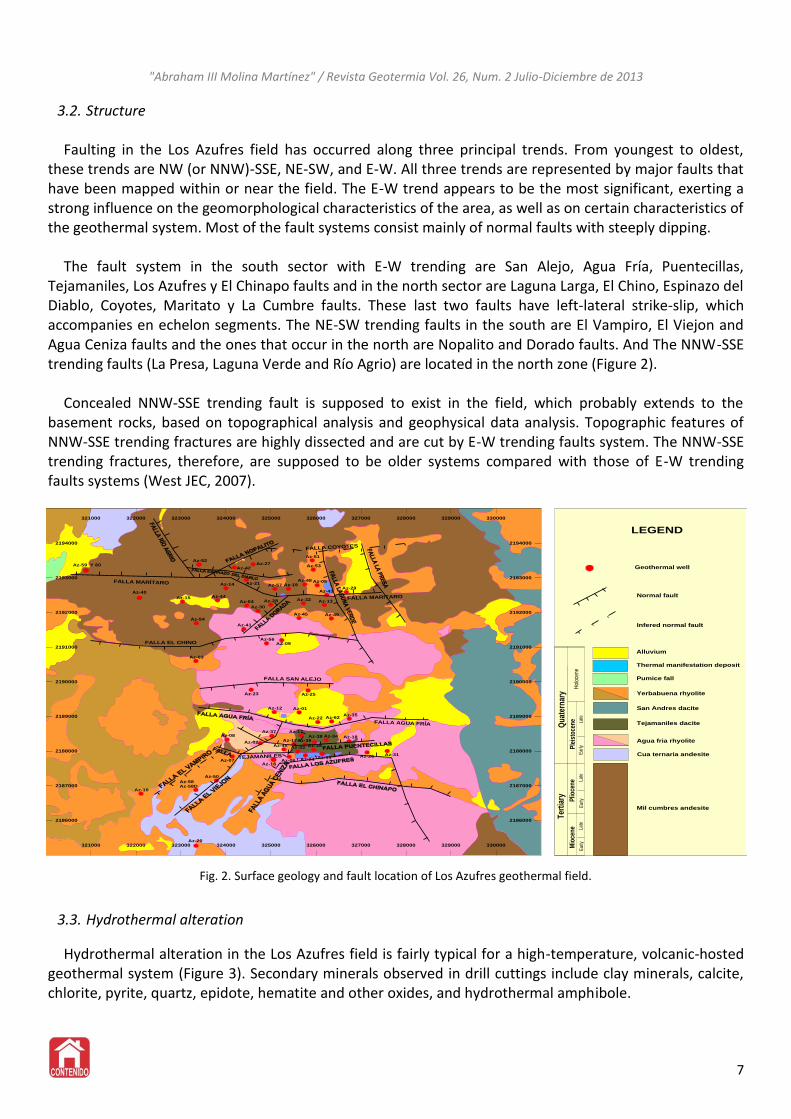
3.2. Structure Faulting in the Los Azufres field has occurred along three principal trends. From youngest to oldest,
these trends are NW (or NNW)-SSE, NE-SW, and E-W. All three trends are represented by major faults that have been mapped within or near the field. The E-W trend appears to be the most significant, exerting a strong influence on the geomorphological characteristics of the area, as well as on certain characteristics of the geothermal system. Most of the fault systems consist mainly of normal faults with steeply dipping.
The fault system in the south sector with E-W trending are San Alejo, Agua Fría, Puentecillas,
Tejamaniles, Los Azufres y El Chinapo faults and in the north sector are Laguna Larga, El Chino, Espinazo del Diablo, Coyotes, Maritato y La Cumbre faults. These last two faults have left-lateral strike-slip, which accompanies en echelon segments. The NE-SW trending faults in the south are El Vampiro, El Viejon and Agua Ceniza faults and the ones that occur in the north are Nopalito and Dorado faults. And The NNW-SSE trending faults (La Presa, Laguna Verde and Río Agrio) are located in the north zone (Figure 2).
Concealed NNW-SSE trending fault is supposed to exist in the field, which probably extends to the
basement rocks, based on topographical analysis and geophysical data analysis. Topographic features of NNW-SSE trending fractures are highly dissected and are cut by E-W trending faults system. The NNW-SSE trending fractures, therefore, are supposed to be older systems compared with those of E-W trending faults systems (West JEC, 2007).
Fig. 2. Surface geology and fault location of Los Azufres geothermal field.
3.3. Hydrothermal alteration Hydrothermal alteration in the Los Azufres field is fairly typical for a high-temperature, volcanic-hosted
geothermal system (Figure 3). Secondary minerals observed in drill cuttings include clay minerals, calcite, chlorite, pyrite, quartz, epidote, hematite and other oxides, and hydrothermal amphibole.
7
321000 322000 323000 324000 325000 326000 327000 328000 329000 330000
2186000
2187000
2188000
2189000
2190000
2191000
2192000
2193000
2194000
FALLA MARÍTARO
FALLA MARITARO
FALLA COYOTES
FALLA EL CHINO
FALLA SAN ALEJO
FALLA AGUA FRÍA
TEJAMANILES
Az-59 Y 60
Az-40
Az-51
Az-53
Az-48 Az-05
Az-43Az-29
Az-52
Az-42Az-27
Az-21 Az-57 Az-19
Az-15 Az-44
Az-14
Az-04
Az-30
Az-28 Az-32 Az-13
Az-49Az-45
Az-41
Az-54
AZ-09Az-56
Az-03
Az-23 Az-25
Az-12 Az-01
Az-22 Az-62Az-35
Az-08
Az-07
Az-02
Az-37
Az-10
Az-58Az-58D
Az-50
Az-46
Az-17
Az-17
Az-16Az-06
Az-33
Az-36Az-38 Az-34
Az-39
Az-24 Az-11
Az-18
Az-26 Az-31
Ear
lyLa
te
Mio
cen
e
Ear
lyLa
te
Plio
cen
e
Ter
tiar
y
Ear
lyLa
te
Ple
isto
cen
eH
oloc
ene
Qu
ater
nar
y
Mil cumbres andesite
Agua fria rhyolite
Tejamaniles dacite
San Andres dacite
Yerbabuena rhyolite
Pumice fall
Thermal manifestation deposit
Alluvium
Infered normal fault
Normal fault
Geothermal well
LEGEND
Cua ternaria andesite
Az-20
321000 322000 323000 324000 325000 326000 327000 328000 329000 330000
2186000
2187000
2188000
2189000
2190000
2191000
2192000
2193000
2194000
"Abraham III Molina Martínez" / Revista Geotermia Vol. 26, Num. 2 Julio-Diciembre de 2013
Several zones of different hydrothermal mineral assemblages have been identified; these are
distinguished principally on the basis of the first appearance (as a function of depth in the well) of epidote and hydrothermal amphibole. The appearance of epidote has been found to correlate with formation temperatures of about 250°C, whereas the first appearance of amphibole tends to coincide with temperatures near 300°C. The surface of first appearance of epidote has also been correlated with the top of the productive reservoir zone, while the first appearance of amphibole has been inferred to correspond with the base of the productive reservoir.
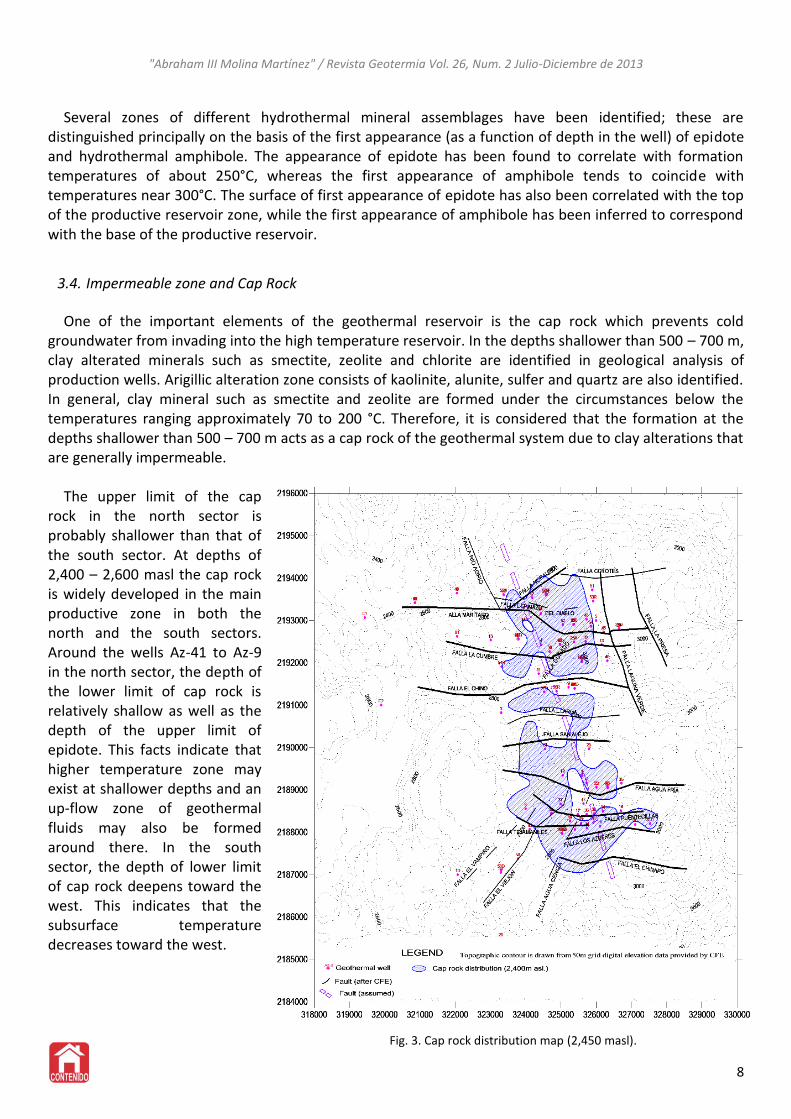
3.4. Impermeable zone and Cap Rock One of the important elements of the geothermal reservoir is the cap rock which prevents cold
groundwater from invading into the high temperature reservoir. In the depths shallower than 500 – 700 m, clay alterated minerals such as smectite, zeolite and chlorite are identified in geological analysis of production wells. Arigillic alteration zone consists of kaolinite, alunite, sulfer and quartz are also identified. In general, clay mineral such as smectite and zeolite are formed under the circumstances below the temperatures ranging approximately 70 to 200 °C. Therefore, it is considered that the formation at the depths shallower than 500 – 700 m acts as a cap rock of the geothermal system due to clay alterations that are generally impermeable.
The upper limit of the cap
rock in the north sector is probably shallower than that of the south sector. At depths of 2,400 – 2,600 masl the cap rock is widely developed in the main productive zone in both the north and the south sectors. Around the wells Az-41 to Az-9 in the north sector, the depth of the lower limit of cap rock is relatively shallow as well as the depth of the upper limit of epidote. This facts indicate that higher temperature zone may exist at shallower depths and an up-flow zone of geothermal fluids may also be formed around there. In the south sector, the depth of lower limit of cap rock deepens toward the west. This indicates that the subsurface temperature decreases toward the west.
Fig. 3. Cap rock distribution map (2,450 masl).
8
"Abraham III Molina Martínez" / Revista Geotermia Vol. 26, Num. 2 Julio-Diciembre de 2013
In the south sector, the distribution of the cap rock disappears around El Chinapo at the south. In the
north sector, the distribution of the cap rock disappears around the Laguna Verde fault at the east, and around both the Coyotes and the Nopalito faults at the north. In the Central zone the cap rock is relatively weak as well as the subsurface manifestations. These limitations seem to represent the distribution of the geothermal system in the field
4. Geochemestry
The geochemistry of the Los Azufres system has been interpreted from analyses of numerous samples of fluids (water and steam) from the various deep wells in the field, as well as analyses of discharges from surface manifestations.
4.1. Impermeable zone and Cap Rock
The water and steam from all the wells in The Los Azufres are of neutral sodium-chloride composition typical of geothermal fluids in the world. So far, it hasn´t been reported acidic waters in the reservoir. Chloride is dominant among major anions and although these vary considerably from one well to another, the water concentrations separated at atmospheric pressure is around 2,500 – 4,000 ppm at the initial stage of exploitation. This reflects in part the variable distribution of phases within the reservoir, particularly in the southern sector.
In the case of the non-condensable gas (NCG) the concentration in reservoir liquid may be as low as 1% by weight or less, while NCG concentrations in the steam phase range between 2% and 8% by weight (Suarez, et al., 2000). Carbon dioxide (CO2) is the main component of NCG and its content is over 90 mole% in NCG at most wells. Other NCG that are measured but in lower concentrations are H2S (0.5 – 18 mole%), N2, NH3, H2, CH4, Ar and He. Gas concentrations in the southern sector have always been larger than in the north sector. It should be mentioned that the chemical geothermometry of waters produced from the reservoir zone is generally consistent with temperatures interpreted from measured downhole temperature profiles, with maximum geothermometer temperatures well in excess of 300°C.
4.2. Origin of fluid At the beginning of the project (1980 - 1987) measurements of isotopic composition of the fluid from
the wells indicate a combination of process water - rock interaction and admixing of magmatic water (including the andesitic water) with meteoric water. The meteoric water that is main constituent of reservoir fluid is believed to be fossil meteoric water infiltrated into subsurface during pre-historic time.
One of the important characteristics of the well fluids in Los Azufres is that show high concentrations of
boron in comparison to other geothermal fields, this could be interpreted by the interaction of deep fluid with sedimentary rock with a high content of boron. And although none of the wells intercepted sedimentary rock (including the well Az-44 which is the deepest with 3,500 m), the regional basement at Los Azufres is built up by metamorphosed sediments. Relatively high NH3 content up to 3.5 mole% in NCG of the well steams also indicates the contribution of sedimentary rocks to the reservoir fluids.
9
"Abraham III Molina Martínez" / Revista Geotermia Vol. 26, Num. 2 Julio-Diciembre de 2013
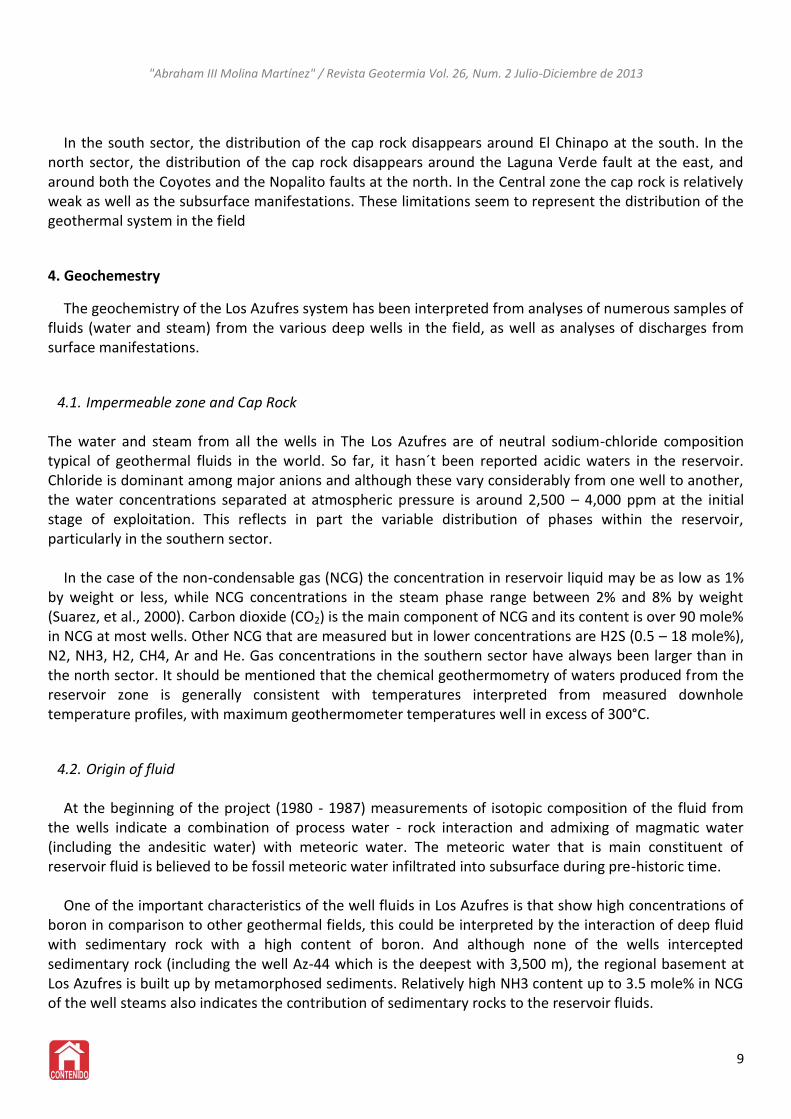
4.3. Fluid flow pattern The parental fluid is found at a great depth within or over the metamorphic and sedimentary basement
rocks and even though no one knows for sure what geologic structure controls the flow of fluid, but there are tectonic history that suggest that high permeable zones associated with faults control fluid flow. The NNW-SSE trending faults assumed by geological and geophysical data is one possibility for controlling the northwestward regional fluid flow of parental fluid at deeper depth.
The parental fluid ascends through the high permeable zones developed along the faults and stored in
andesitic rocks. The high resistivity rock body existing at the central part of the field, separates the geothermal reservoir as the north and south sectors (Figure 4). The main direction of movement of the flow in both areas at intermediate depths appears to be vertical with very limited lateral movement. The ascending hot fluid yield convective circulation systems beneath the cap rock in both sectors. The fluids reaching shallower part of the reservoir boil and provide two–phases or vapor dominated reservoir. This is more significant in the south sector than in the north. Partial steam condensation at the shallowest part of the reservoir in the south sector yields gas rich zones.
Fig. 4. Fluid flow model of Los Azufres reservoir.
Outflows are limited compared with many geothermal systems, however we can consider the Araro
hydrothermal system is a part of outflow from Los Azufres system even though is 20 km NW away. Also another important outflow can be located in the SW in the north sector of the field; nevertheless, it could be present other unidentified flows.
5. Geophysics
In Los Azufres there have been various geophysical studies such as gravimetry, magnetometry, passive seismic and geoelectrical prospecting, including vertical electric soundings (VES) and a magnetotelluric survey of part of the field. Of these methods, the geoelectrical survey have been of the most direct use for delineating the productive geothermal field.
Maps of apparent resistivity for progressive electrode spacing show that, in the shallow part of the field,
zones of low resistivity are concentrated within the central part of the northern and southern sectors of the field and a high resistivity in the central part of the field (Figure 5). With increasing depth, this zone expand outward, forming a more generalized conductive layer joining both sectors of the field.
10
"Abraham III Molina Martínez" / Revista Geotermia Vol. 26, Num. 2 Julio-Diciembre de 2013
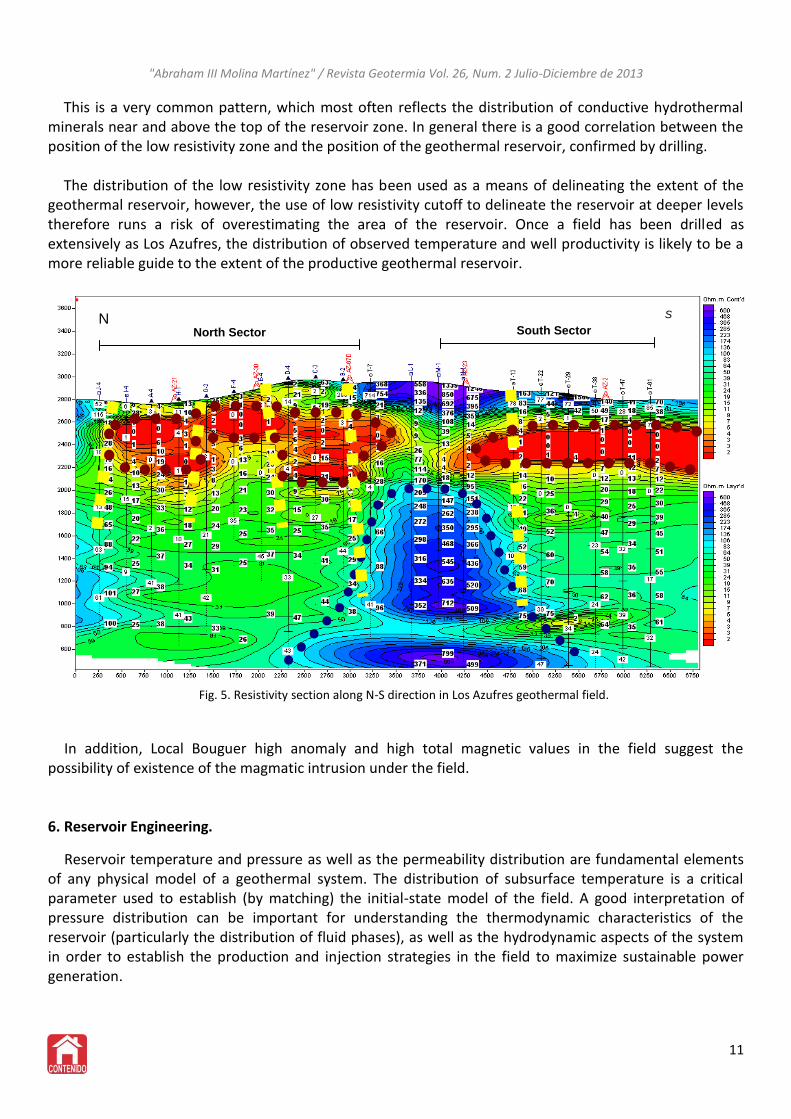
This is a very common pattern, which most often reflects the distribution of conductive hydrothermal minerals near and above the top of the reservoir zone. In general there is a good correlation between the position of the low resistivity zone and the position of the geothermal reservoir, confirmed by drilling.
The distribution of the low resistivity zone has been used as a means of delineating the extent of the
geothermal reservoir, however, the use of low resistivity cutoff to delineate the reservoir at deeper levels therefore runs a risk of overestimating the area of the reservoir. Once a field has been drilled as extensively as Los Azufres, the distribution of observed temperature and well productivity is likely to be a more reliable guide to the extent of the productive geothermal reservoir.
Fig. 5. Resistivity section along N-S direction in Los Azufres geothermal field.
In addition, Local Bouguer high anomaly and high total magnetic values in the field suggest the
possibility of existence of the magmatic intrusion under the field.
6. Reservoir Engineering.
Reservoir temperature and pressure as well as the permeability distribution are fundamental elements of any physical model of a geothermal system. The distribution of subsurface temperature is a critical parameter used to establish (by matching) the initial-state model of the field. A good interpretation of pressure distribution can be important for understanding the thermodynamic characteristics of the reservoir (particularly the distribution of fluid phases), as well as the hydrodynamic aspects of the system in order to establish the production and injection strategies in the field to maximize sustainable power generation.
11
N S
North Sector South Sector
LEGEND
N
C C'S
3,000
ASL (m)
2,000
1,000
0
-1,000
3,000
ASL (m)
2,000
1,000
0
-1,000
0 1 km
Southern sectorNorthern sector
Geothermal well Low resistivity zone
High resistivity zone
"Abraham III Molina Martínez" / Revista Geotermia Vol. 26, Num. 2 Julio-Diciembre de 2013
6.1. Fluid flow pattern
Reservoir permeability in volcanic-hosted geothermal systems is, in nearly all cases, a product of fractured competent rocks, rather than a result of rock porosity. Fracturing can result from a variety of mechanisms, including original rock emplacement (e.g. fracturing of a lava flow), rupture along or adjacent to major faults, more generalized tectonic stress (not necessarily associated with major fault zones), and hydraulic forces.
Zones of higher permeability in the Los Azufres reservoir has been interpreted to be localized, at least in
large part, along major faults, particularly of the E-W-trending set, or their zones of influence. Also temperature pattern correlation indicates a fairly rapid drop in permeability with distance to the south and to the west of the zone of highest temperature in the southern sector. Because the reservoir appears to terminate rather than extending along the trends of the major mapped faults, the possibility could be considered that several of the major faults act as permeability barriers that serve to localize the reservoir.
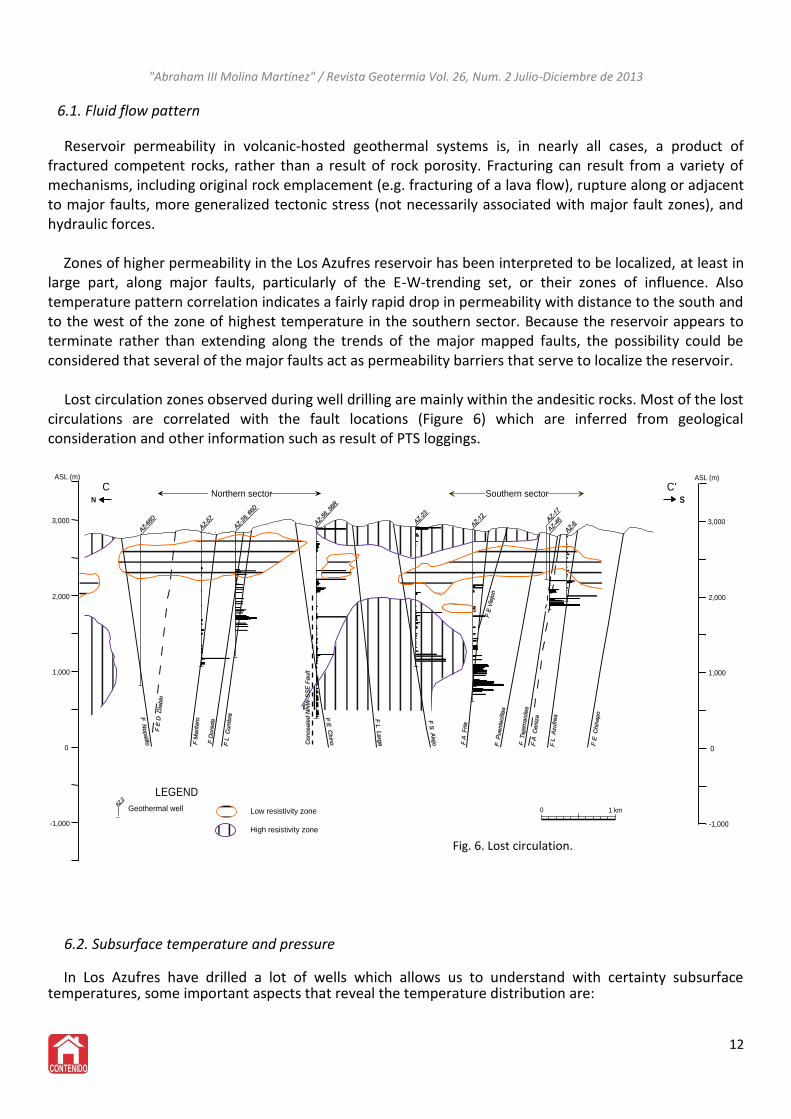
Lost circulation zones observed during well drilling are mainly within the andesitic rocks. Most of the lost
circulations are correlated with the fault locations (Figure 6) which are inferred from geological consideration and other information such as result of PTS loggings.
Fig. 6. Lost circulation.
6.2. Subsurface temperature and pressure
In Los Azufres have drilled a lot of wells which allows us to understand with certainty subsurface temperatures, some important aspects that reveal the temperature distribution are:
12
"Abraham III Molina Martínez" / Revista Geotermia Vol. 26, Num. 2 Julio-Diciembre de 2013
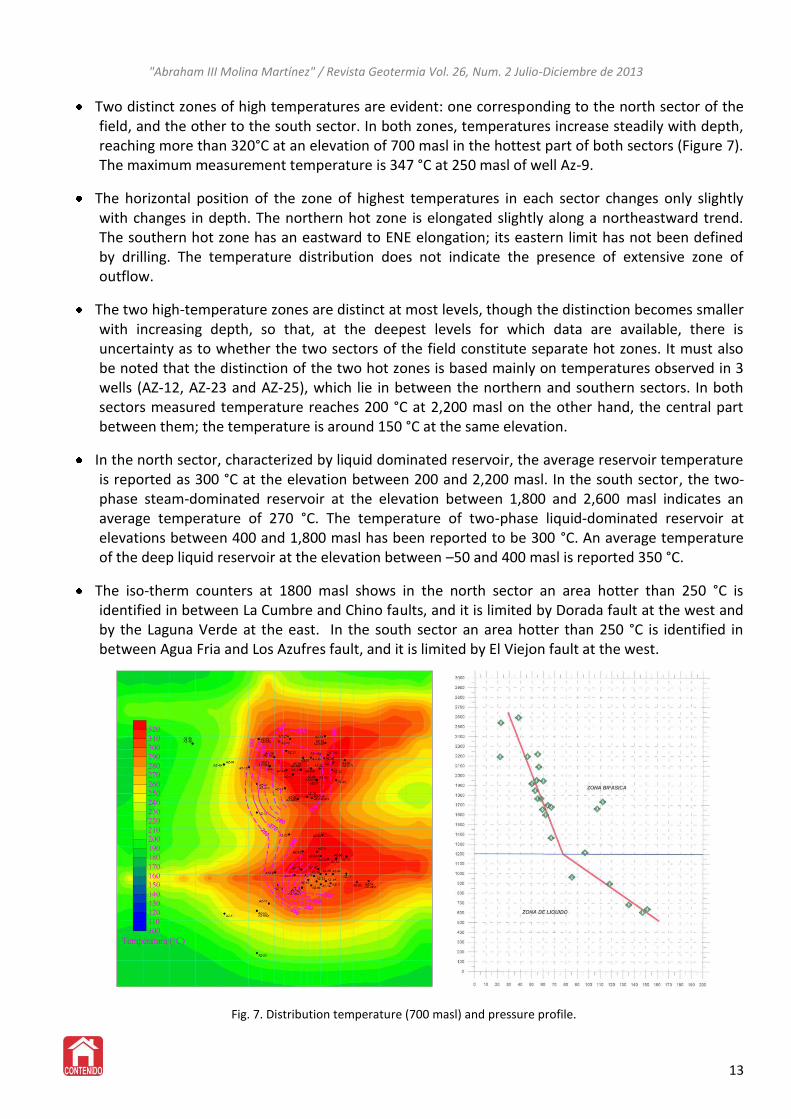
Two distinct zones of high temperatures are evident: one corresponding to the north sector of the field, and the other to the south sector. In both zones, temperatures increase steadily with depth, reaching more than 320°C at an elevation of 700 masl in the hottest part of both sectors (Figure 7). The maximum measurement temperature is 347 °C at 250 masl of well Az-9.
The horizontal position of the zone of highest temperatures in each sector changes only slightly with changes in depth. The northern hot zone is elongated slightly along a northeastward trend. The southern hot zone has an eastward to ENE elongation; its eastern limit has not been defined by drilling. The temperature distribution does not indicate the presence of extensive zone of outflow.
The two high-temperature zones are distinct at most levels, though the distinction becomes smaller with increasing depth, so that, at the deepest levels for which data are available, there is uncertainty as to whether the two sectors of the field constitute separate hot zones. It must also be noted that the distinction of the two hot zones is based mainly on temperatures observed in 3 wells (AZ-12, AZ-23 and AZ-25), which lie in between the northern and southern sectors. In both sectors measured temperature reaches 200 °C at 2,200 masl on the other hand, the central part between them; the temperature is around 150 °C at the same elevation.
In the north sector, characterized by liquid dominated reservoir, the average reservoir temperature is reported as 300 °C at the elevation between 200 and 2,200 masl. In the south sector, the two-phase steam-dominated reservoir at the elevation between 1,800 and 2,600 masl indicates an average temperature of 270 °C. The temperature of two-phase liquid-dominated reservoir at elevations between 400 and 1,800 masl has been reported to be 300 °C. An average temperature of the deep liquid reservoir at the elevation between –50 and 400 masl is reported 350 °C.
The iso-therm counters at 1800 masl shows in the north sector an area hotter than 250 °C is identified in between La Cumbre and Chino faults, and it is limited by Dorada fault at the west and by the Laguna Verde at the east. In the south sector an area hotter than 250 °C is identified in between Agua Fria and Los Azufres fault, and it is limited by El Viejon fault at the west.
Fig. 7. Distribution temperature (700 masl) and pressure profile.
13
"Abraham III Molina Martínez" / Revista Geotermia Vol. 26, Num. 2 Julio-Diciembre de 2013
Liquid geothermometry using the NaKCa and silica (quartz) temperatures indicate the reservoir fluid
temperature from 250 to 330 °C for initial stage. Gas chemical temperatures of TCO2/Ar and TH2/Ar for the well gases are relatively scattered within a range from 200 to 350 °C. The parental fluid assumed at deeper depth is estimated as 300-330 °C.
Initial static bottomhole pressures in wells of varying depth provide a useful indication of the
distribution of initial static pressures in the geothermal system. In the southern sector, there is a clear transition from a single-phase-liquid pressure gradient below an elevation of about 1,200 masl, to a lesser pressure gradient above this level (Figure 7); this indicates the presence of two-phase conditions in the upper zone, which (based on the overall evidence) transitions to a steam-dominated zone in the shallowest part of the reservoir. In the northern sector, no such distinct transition of pressure gradient is observed, indicating that the reservoir in the northern sector was initially single-phase throughout, except perhaps in its shallowest part.
6.3. Production and reinjection
At present, more than 43 production wells are producing steam and connected to the power plants. The fluid enthalpy is relatively high for most of the production wells, while some of the production wells are producing only steam but without water, so that the fluid enthalpy is very high in these wells. Among the wells that show medium enthalpy, the increasing trend of the enthalpy value can be observed in wells AZ-4, AZ-5, AZ-13, AZ-18, AZ-26, AZ-28, AZ-43 etc.
The reinjection capacity at present is around 2000 t/h, there are 6 wells accepting separated water and
condensed water. The total reinjection amount is around 700-800 t/h. The capacity of existing reinjection well is much larger than actual reinjection amount, which means additional drilling of reinjection well is not necessary at the moment (West JEC, et al,. 2007).
7. Conclusions (Geothermal Reservoir Conceptual Model) The Los Azufres geothermal reservoir includes a broad zone, at least 20 km2 in extent, in which the
geothermal fluids are stored in high permeable zones, associated to faults in andesitic rocks accompanied with rhyolites that act as cap rock and are formed at depths between 500 – 700 m from subsurface, and mainly due to clay alteration zone. This cap rock prevents cold groundwater from infiltrated into the high temperature reservoir.
The heat source of the system is presumably related to young volcanic activity of the area. Heat may be
supplied to the system by a cooling magma chamber or intrusive body of rock; however, the precise characteristics of such a source cannot be determined from available data even though a Local Bouguer high anomaly and high total magnetic values in the field suggest the possibility of existence of the magmatic intrusion under the field. Similarly, the nature of the source of upwelling fluids feeding the system cannot be determined with complete precision. Based on the temperature distribution conclude that the high temperature fluid (>320 °C) is caused mainly by the meteoric water circulation at deep levels that enter to the system and mix with magmatic water. The concealed NNW-SSE trending faults probably extend to the basement rocks and are supposed to control the deep geothermal fluid flow supply and discharge of fluids towards Araro; however, other unidentified outflows may be present.
14
"Abraham III Molina Martínez" / Revista Geotermia Vol. 26, Num. 2 Julio-Diciembre de 2013
The geothermal reservoir is divided in two productive zones, the north and the south sectors, this two sector are separated by a low permeability zone which shows high resistivity characteristics. The production zones are located where the wells intersects to the E-W trend faults, and within a depth interval defined approximately between the first appearance of epidote and the top of the amphibole (Perez, 2001). In the south sector, the geothermal fluids at depth are considered to be up-flowing around the conjunction trending faults (Puentecillas, Tejamaniles, Los Azufres) and NE-SW trending fault (Agua Ceniza) and in the north sector, the geothermal fluids seem to be up-flowing around El Chino, La Cumbre and Dorada faults and spreading along high permeable zones defined by E-W trending faults. Around wells Az-41 and Az-9 the geothermal fluids seem to be ascending to shallower levels. Presence of fracture zone (en echelon fractures) caused by strike slip of La Cumbre and Maritaro faults is assumed to exist and probably this fracture zone controls the ascension and spread of geothermal fluid (West JEC, et al., 2007).
In consideration of the faulting geometry, cap rock development, subsurface temperature etc., the
productive area of the reservoir extent in the north sector is delineated by Laguna Verde fault at the east, and by Coyotes and Nopalito faults at the north. In the south sector, the reservoir extent is bounded by El Chinapo at the south and El Viejon at the west. In the central zone, between San Alejo and Agua Fria faults where the permeability and subsurface temperatures in volcanic rocks are estimated to be lower compared with those of the north and the south sectors.
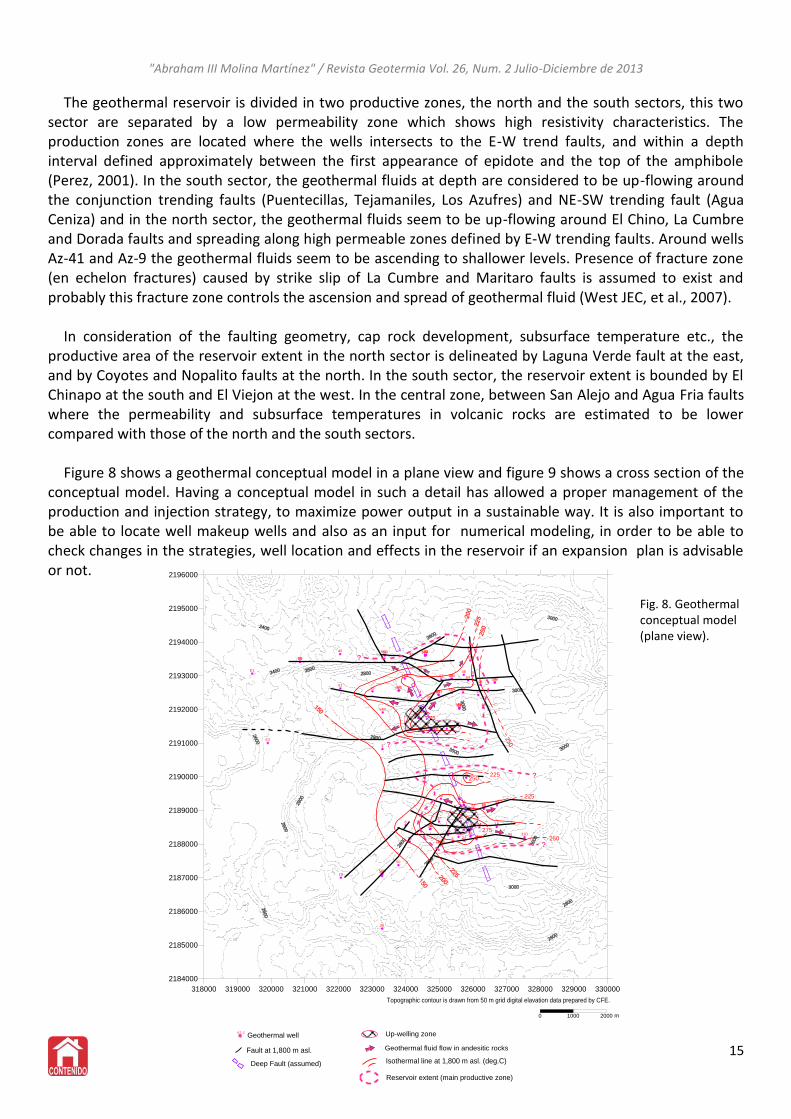
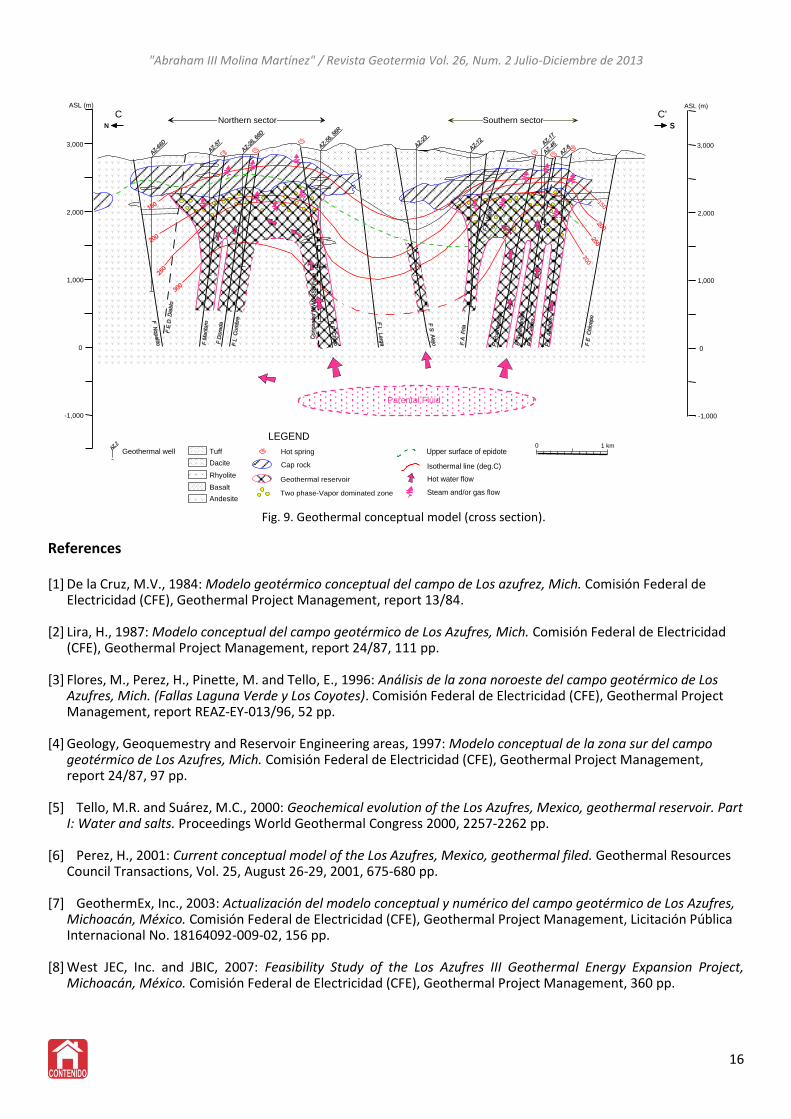
Figure 8 shows a geothermal conceptual model in a plane view and figure 9 shows a cross section of the
conceptual model. Having a conceptual model in such a detail has allowed a proper management of the production and injection strategy, to maximize power output in a sustainable way. It is also important to be able to locate well makeup wells and also as an input for numerical modeling, in order to be able to check changes in the strategies, well location and effects in the reservoir if an expansion plan is advisable or not.
Fig. 8. Geothermal conceptual model (plane view).
15
Topographic contour is drawn from 50 m grid digital elavation data prepared by CFE.
318000 319000 320000 321000 322000 323000 324000 325000 326000 327000 328000 329000 330000
2184000
2185000
2186000
2187000
2188000
2189000
2190000
2191000
2192000
2193000
2194000
2195000
2196000
1
1A
E1
E2
22A
3
4
5
677a
8
9 9A9AD
10
11
12
13
14D
15
16D16AD
1718
1919D
20
21
22
23
24
25
26
2727A
28 28A
2929D
30
31D
32
33
34
35
36
37
38
39
40
41
42
43
44
45
46
47
48
49
50
515252D
53R
54R
55
56R
57
5858D
5960
61
62
64
65D66D
67
67D
68D
69D
m0 1000 2000
N
250
275
225250
250
275
225
?
?
?
?
Geothermal wellAZ-2
Fault at 1,800 m asl.
Up-welling zone
Geothermal fluid flow in andesitic rocks
Isothermal line at 1,800 m asl. (deg.C)
Reservoir extent (main productive zone)
Deep Fault (assumed)
"Abraham III Molina Martínez" / Revista Geotermia Vol. 26, Num. 2 Julio-Diciembre de 2013
Fig. 9. Geothermal conceptual model (cross section).
References
[1] De la Cruz, M.V., 1984: Modelo geotérmico conceptual del campo de Los azufrez, Mich. Comisión Federal de Electricidad (CFE), Geothermal Project Management, report 13/84.
[2] Lira, H., 1987: Modelo conceptual del campo geotérmico de Los Azufres, Mich. Comisión Federal de Electricidad (CFE), Geothermal Project Management, report 24/87, 111 pp.
[3] Flores, M., Perez, H., Pinette, M. and Tello, E., 1996: Análisis de la zona noroeste del campo geotérmico de Los Azufres, Mich. (Fallas Laguna Verde y Los Coyotes). Comisión Federal de Electricidad (CFE), Geothermal Project Management, report REAZ-EY-013/96, 52 pp.
[4] Geology, Geoquemestry and Reservoir Engineering areas, 1997: Modelo conceptual de la zona sur del campo
geotérmico de Los Azufres, Mich. Comisión Federal de Electricidad (CFE), Geothermal Project Management, report 24/87, 97 pp.
[5] Tello, M.R. and Suárez, M.C., 2000: Geochemical evolution of the Los Azufres, Mexico, geothermal reservoir. Part
I: Water and salts. Proceedings World Geothermal Congress 2000, 2257-2262 pp.
[6] Perez, H., 2001: Current conceptual model of the Los Azufres, Mexico, geothermal filed. Geothermal Resources Council Transactions, Vol. 25, August 26-29, 2001, 675-680 pp.
[7] GeothermEx, Inc., 2003: Actualización del modelo conceptual y numérico del campo geotérmico de Los Azufres,
Michoacán, México. Comisión Federal de Electricidad (CFE), Geothermal Project Management, Licitación Pública Internacional No. 18164092-009-02, 156 pp.
[8] West JEC, Inc. and JBIC, 2007: Feasibility Study of the Los Azufres III Geothermal Energy Expansion Project,
Michoacán, México. Comisión Federal de Electricidad (CFE), Geothermal Project Management, 360 pp.
16
LEGEND
N
C C'S
3,000
ASL (m)
2,000
1,000
0
-1,000
3,000
ASL (m)
2,000
1,000
0
-1,000
0 1 km
150
300
Parental Fluid
Cap rock
Geothermal reservoir
Two phase-Vapor dominated zone
Hot spring
Isothermal line (deg.C)
Hot water flow
Steam and/or gas flow
Upper surface of epidote
Southern sectorNorthern sector
Geothermal well Tuff
Dacite
Rhyolite
Basalt
Andesite
ACID STIMULATION OF GEOTHERMAL WELLS IN MEXICO, EL SALVADOR AND THE PHILIPPINES
Lilibeth Morales Alcalá
"Alejandro Volta 655, Col. Electricistas, Morelia, Michoacán. C.P. 58290, México" [email protected]
Resumen
Los tratamientos ácidos son los tratamientos más comúnmente empleados para remover daño en la formación de los pozos, debido a la su habilidad para disolver depositación de minerales causantes de un decremento en la producción de fluido en pozos productores y perdida en la capacidad de aceptación en pozos inyectores, así como incrementar la permeabilidad en pozos no dañados. Uno de los tratamientos ácidos es llamado acidificación matricial, en el cual es una técnica que envuelve la inyección de ácidos a la formación a través del pozo a presiones por debajo de la fractura de la roca. En varios países como México, El Salvador y Las Filipinas, esta técnica de estimulación se ha llevado a cabo desde hace varios años, tanto en pozos productores como en pozos inyectores con excelentes resultados. Aunque la técnica de acidificación matricial empleada en cada país se basa en los mismos fundamentos, existen algunas diferencias en la operación. Una de las principales diferencias consiste en la concentración de ácidos inyectados y el volumen de los mismos en cada etapa del tratamiento. Otras variaciones incluyen la omisión de la etapa de postlavado en Las Filipinas y algunas ocasiones en El Salvador y el uso de agua dulce inyectada en lugar de agua geotérmica. Algunos pozos de El Salvador y también en Las Filipinas, han sido tratados con Sandstone Acid (RPHF) en lugar HCl comúnmente usado durante la etapa principal del tratamiento o también llamado Mud Acid, esta podría ser la diferencia más importante entre el diseño del tratamiento en México y otros países.
Tratamiento acido;Acificación matricial;Etapas del tratamiento;concentración de acidos
Abstract
The acid treatments are among the most common treatments used for increasing formation permeability in undamaged wells as well as
removing formation damage, due to the ability of the acid to dissolve depositions of minerals that cause decreased mass flow rate or low
injection capacity. One of the acid treatments is called matrix acidizing, which is a technique that involves the injection of acid into the
formation through the well at pressure below the pressure at which a fracture can be opened. In several countries such as México, El Salvador
and the Philippines, this stimulation technique has been used for several years, in both production and injection wells with successful results.
Although the matrix acidizing technique applied in each country is based on the same treatment, there exist differences among them. The
main differences consist of the injected acid concentration and volume used in each stage. Other variations include the omission of postflush
in the Philippines and also in some cases in El Salvador, and use of fresh water for the overflush in El Salvador and the Philippines, whereas
geothermal water is used in México. Some wells in El Salvador and also in the Philippines have been treated with Sandstone Acid (RPHF)
instead of HCl as is used in regular Mud Acid for the mainflush, and that could be the most important difference between the treatment design
in México and the other countries.
1. Introduction
The key issue in a geothermal development, with respect to generating electricity, is the ability to reach formations with sufficient flow (steam or brine) and storage capacity that can provide fluids (steam) with sufficient energy to drive a surface turbine to generate electricity for a long enough period of time to make the project economically viable.
Unfortunately during long-term production the mass or production rates decline. These changes in the geothermal wells can be caused by several reasons, e.g. effects of lack of connectivity to main fluid conduits or formation damage due to sedimentation in the casing and/or in the feed zones surrounding the well (Flores and Morales, 2012).
Stimulation techniques have the potential to increase formation permeability and remove damage in the formation which causes low flow-rate in the well. Low productivity, due to lack of communication with the naturally occurring main conduits for fluid flow, can be improved by cleaning and by thermal and/or hydraulic fracturing of the wells, which are usually applied at the end of the drilling. Sometimes it is necessary to treat damages due to mud invasion into open fractures, blocked pores or minor flow channels present in the host rock or sedimentation problems. These problems can be reduced with an acid job at the end of drilling, or later during the well‘s production lifespan (Flores et al., 2005).
17
“Lilibeth Morales Alcalá”/ Revista Geotermia Vol. 26, Num. 2 Julio-Diciembre de 2013
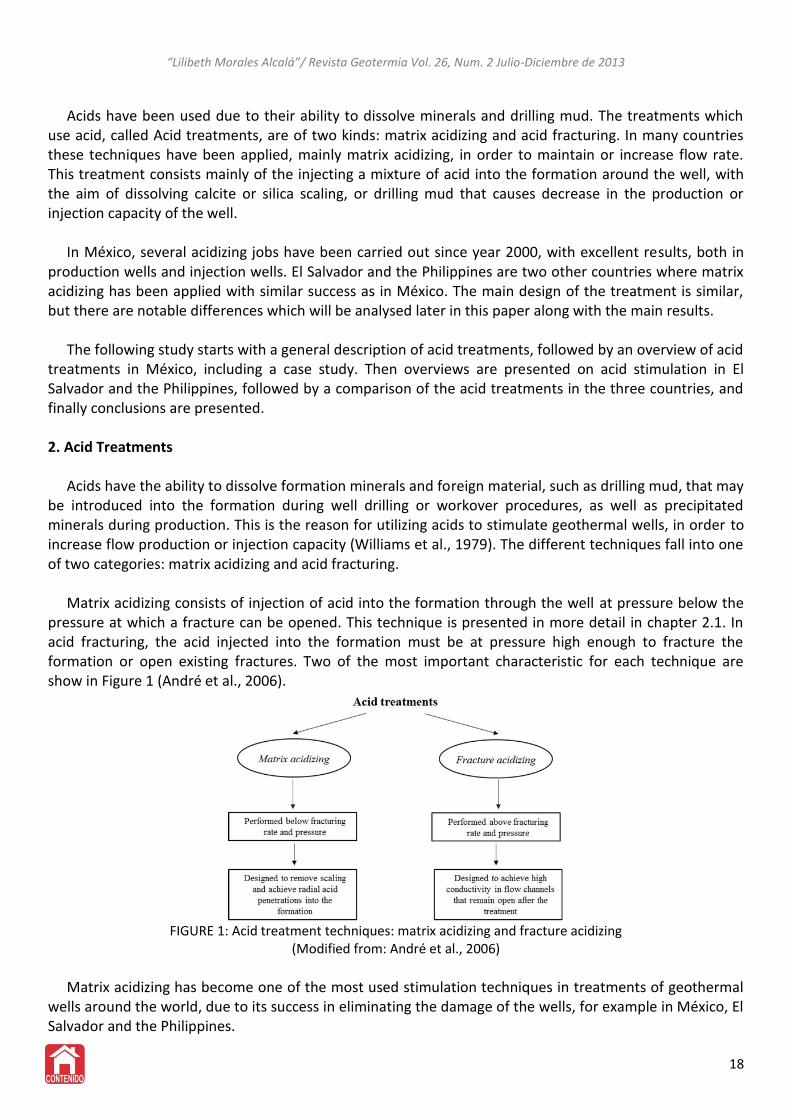
Acids have been used due to their ability to dissolve minerals and drilling mud. The treatments which use acid, called Acid treatments, are of two kinds: matrix acidizing and acid fracturing. In many countries these techniques have been applied, mainly matrix acidizing, in order to maintain or increase flow rate. This treatment consists mainly of the injecting a mixture of acid into the formation around the well, with the aim of dissolving calcite or silica scaling, or drilling mud that causes decrease in the production or injection capacity of the well. In México, several acidizing jobs have been carried out since year 2000, with excellent results, both in production wells and injection wells. El Salvador and the Philippines are two other countries where matrix acidizing has been applied with similar success as in México. The main design of the treatment is similar, but there are notable differences which will be analysed later in this paper along with the main results. The following study starts with a general description of acid treatments, followed by an overview of acid treatments in México, including a case study. Then overviews are presented on acid stimulation in El Salvador and the Philippines, followed by a comparison of the acid treatments in the three countries, and finally conclusions are presented. 2. Acid Treatments Acids have the ability to dissolve formation minerals and foreign material, such as drilling mud, that may be introduced into the formation during well drilling or workover procedures, as well as precipitated minerals during production. This is the reason for utilizing acids to stimulate geothermal wells, in order to increase flow production or injection capacity (Williams et al., 1979). The different techniques fall into one of two categories: matrix acidizing and acid fracturing. Matrix acidizing consists of injection of acid into the formation through the well at pressure below the pressure at which a fracture can be opened. This technique is presented in more detail in chapter 2.1. In acid fracturing, the acid injected into the formation must be at pressure high enough to fracture the formation or open existing fractures. Two of the most important characteristic for each technique are show in Figure 1 (André et al., 2006).
FIGURE 1: Acid treatment techniques: matrix acidizing and fracture acidizing
(Modified from: André et al., 2006)
Matrix acidizing has become one of the most used stimulation techniques in treatments of geothermal wells around the world, due to its success in eliminating the damage of the wells, for example in México, El Salvador and the Philippines.
18
“Lilibeth Morales Alcalá”/ Revista Geotermia Vol. 26, Num. 2 Julio-Diciembre de 2013
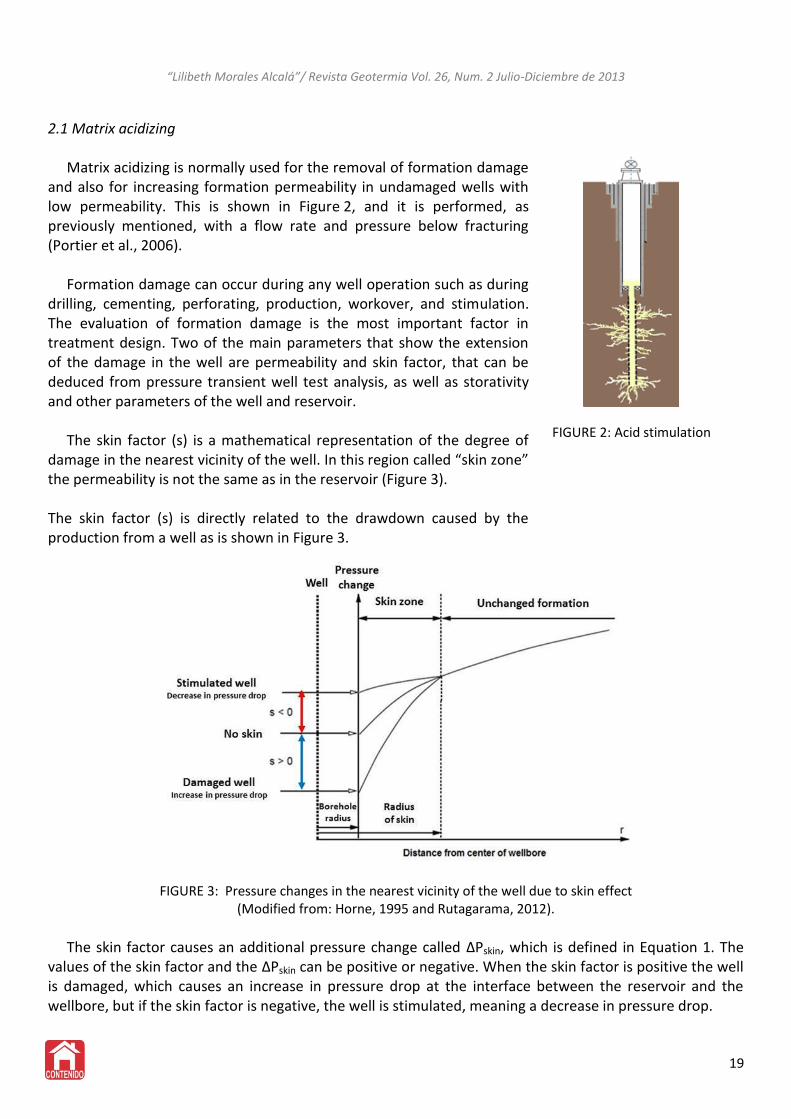
2.1 Matrix acidizing Matrix acidizing is normally used for the removal of formation damage and also for increasing formation permeability in undamaged wells with low permeability. This is shown in Figure 2, and it is performed, as previously mentioned, with a flow rate and pressure below fracturing (Portier et al., 2006). Formation damage can occur during any well operation such as during drilling, cementing, perforating, production, workover, and stimulation. The evaluation of formation damage is the most important factor in treatment design. Two of the main parameters that show the extension of the damage in the well are permeability and skin factor, that can be deduced from pressure transient well test analysis, as well as storativity and other parameters of the well and reservoir. The skin factor (s) is a mathematical representation of the degree of damage in the nearest vicinity of the well. In this region called “skin zone” the permeability is not the same as in the reservoir (Figure 3). The skin factor (s) is directly related to the drawdown caused by the production from a well as is shown in Figure 3.
FIGURE 3: Pressure changes in the nearest vicinity of the well due to skin effect (Modified from: Horne, 1995 and Rutagarama, 2012).
The skin factor causes an additional pressure change called ΔPskin, which is defined in Equation 1. The values of the skin factor and the ΔPskin can be positive or negative. When the skin factor is positive the well is damaged, which causes an increase in pressure drop at the interface between the reservoir and the wellbore, but if the skin factor is negative, the well is stimulated, meaning a decrease in pressure drop.
19
FIGURE 2: Acid stimulation
“Lilibeth Morales Alcalá”/ Revista Geotermia Vol. 26, Num. 2 Julio-Diciembre de 2013
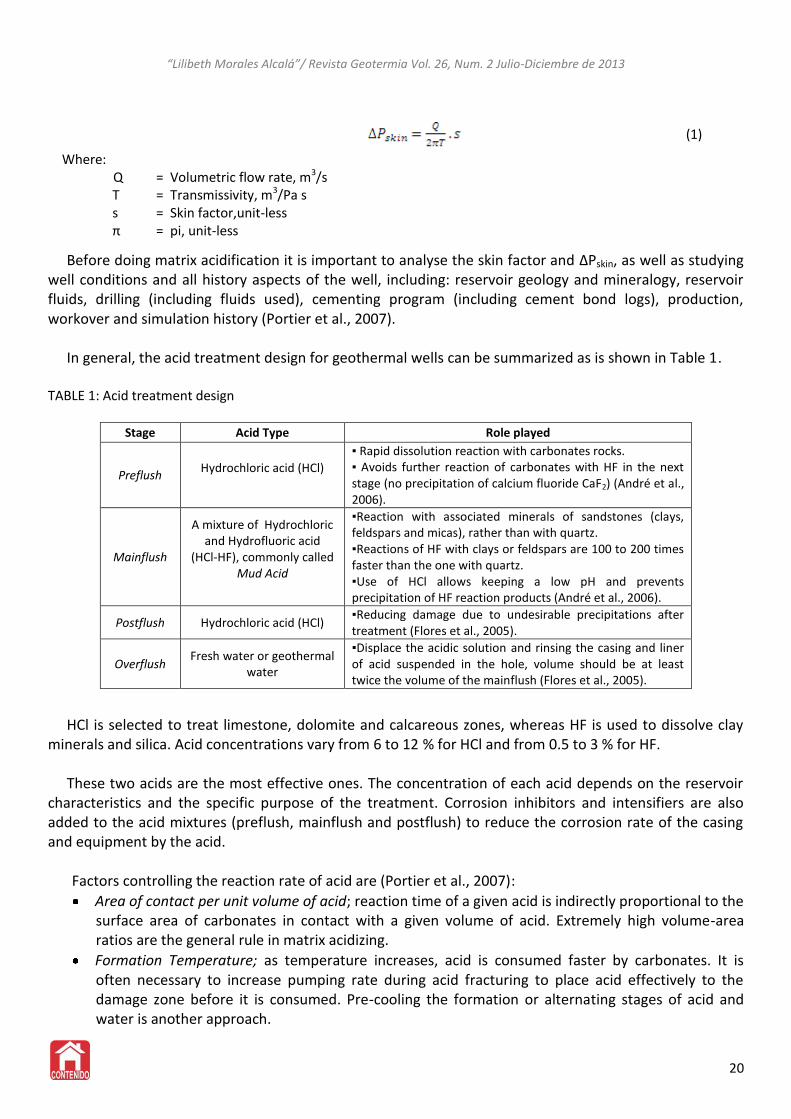
Before doing matrix acidification it is important to analyse the skin factor and ΔPskin, as well as studying well conditions and all history aspects of the well, including: reservoir geology and mineralogy, reservoir fluids, drilling (including fluids used), cementing program (including cement bond logs), production, workover and simulation history (Portier et al., 2007). In general, the acid treatment design for geothermal wells can be summarized as is shown in Table 1. TABLE 1: Acid treatment design
Stage Acid Type Role played
Preflush Hydrochloric acid (HCl)
▪ Rapid dissolution reaction with carbonates rocks. ▪ Avoids further reaction of carbonates with HF in the next stage (no precipitation of calcium fluoride CaF2) (André et al., 2006).
Mainflush
A mixture of Hydrochloric and Hydrofluoric acid
(HCl-HF), commonly called Mud Acid
▪Reaction with associated minerals of sandstones (clays, feldspars and micas), rather than with quartz. ▪Reactions of HF with clays or feldspars are 100 to 200 times faster than the one with quartz. ▪Use of HCl allows keeping a low pH and prevents precipitation of HF reaction products (André et al., 2006).
Postflush Hydrochloric acid (HCl) ▪Reducing damage due to undesirable precipitations after treatment (Flores et al., 2005).
Overflush Fresh water or geothermal
water
▪Displace the acidic solution and rinsing the casing and liner of acid suspended in the hole, volume should be at least twice the volume of the mainflush (Flores et al., 2005).
HCl is selected to treat limestone, dolomite and calcareous zones, whereas HF is used to dissolve clay minerals and silica. Acid concentrations vary from 6 to 12 % for HCl and from 0.5 to 3 % for HF. These two acids are the most effective ones. The concentration of each acid depends on the reservoir characteristics and the specific purpose of the treatment. Corrosion inhibitors and intensifiers are also added to the acid mixtures (preflush, mainflush and postflush) to reduce the corrosion rate of the casing and equipment by the acid.
Factors controlling the reaction rate of acid are (Portier et al., 2007):
Area of contact per unit volume of acid; reaction time of a given acid is indirectly proportional to the surface area of carbonates in contact with a given volume of acid. Extremely high volume-area ratios are the general rule in matrix acidizing.
Formation Temperature; as temperature increases, acid is consumed faster by carbonates. It is often necessary to increase pumping rate during acid fracturing to place acid effectively to the damage zone before it is consumed. Pre-cooling the formation or alternating stages of acid and water is another approach.
20
(1)
Where: Q = Volumetric flow rate, m3/s
T = Transmissivity, m3/Pa s s = Skin factor,unit-less π = pi, unit-less
“Lilibeth Morales Alcalá”/ Revista Geotermia Vol. 26, Num. 2 Julio-Diciembre de 2013
Pressure; An increase in pressure up to 34 bar will increase reaction time for HCl. Above this pressure, only a very small increase in reaction rate time can be expected with increase in pressure.
Acid concentration and type; as concentration of HCl increases, acid reaction time increases because acid of higher strength dissolves a greater volume of carbonate rocks. This reaction releases greater volumes of CaCl2 and CO2, which further retards HCl.
Physical and chemical properties of formation rocks are a major factor in determining reaction time. Generally, the reaction rate of limestone is more than twice that of dolomite; however, at high temperatures reaction rates tend to be nearly equal.
Flow velocity of acid; HCl and HF are two acids reacting quickly with carbonates and silicates. Rapid reaction means that the acid does not penetrate very far into the formation before it is spent. In fracture acidizing, an increase in pumping rate increases fracture width. This decreases volume-area ratio, thereby increasing acid reaction time.
Geothermal wells that are candidates for acidizing are for example those which have been damaged by drilling mud and/or drill cuttings lost into the formation fractures or scaling (calcium carbonate, silica, calcium sulphate, and mixtures). In order to make the most of acidizing, the acid treatment process must be carefully planned. The general approach is as follows (Portier et al., 2007): a) Select an appropriate well for stimulation. b) Design an effective treatment. c) Monitor the treatment for subsequent improvement.
3. Acid stimulation in México
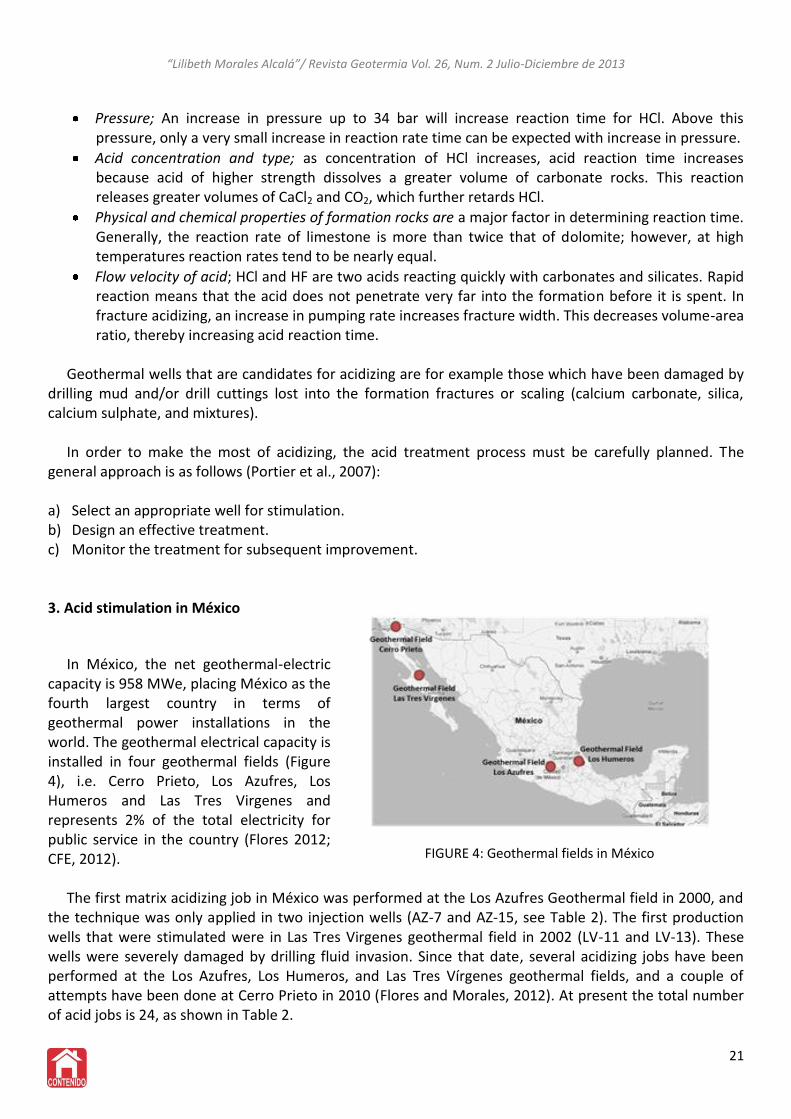
In México, the net geothermal-electric capacity is 958 MWe, placing México as the fourth largest country in terms of geothermal power installations in the world. The geothermal electrical capacity is installed in four geothermal fields (Figure 4), i.e. Cerro Prieto, Los Azufres, Los Humeros and Las Tres Virgenes and represents 2% of the total electricity for public service in the country (Flores 2012; CFE, 2012). The first matrix acidizing job in México was performed at the Los Azufres Geothermal field in 2000, and the technique was only applied in two injection wells (AZ-7 and AZ-15, see Table 2). The first production wells that were stimulated were in Las Tres Virgenes geothermal field in 2002 (LV-11 and LV-13). These wells were severely damaged by drilling fluid invasion. Since that date, several acidizing jobs have been performed at the Los Azufres, Los Humeros, and Las Tres Vírgenes geothermal fields, and a couple of attempts have been done at Cerro Prieto in 2010 (Flores and Morales, 2012). At present the total number of acid jobs is 24, as shown in Table 2.
21
FIGURE 4: Geothermal fields in México
“Lilibeth Morales Alcalá”/ Revista Geotermia Vol. 26, Num. 2 Julio-Diciembre de 2013
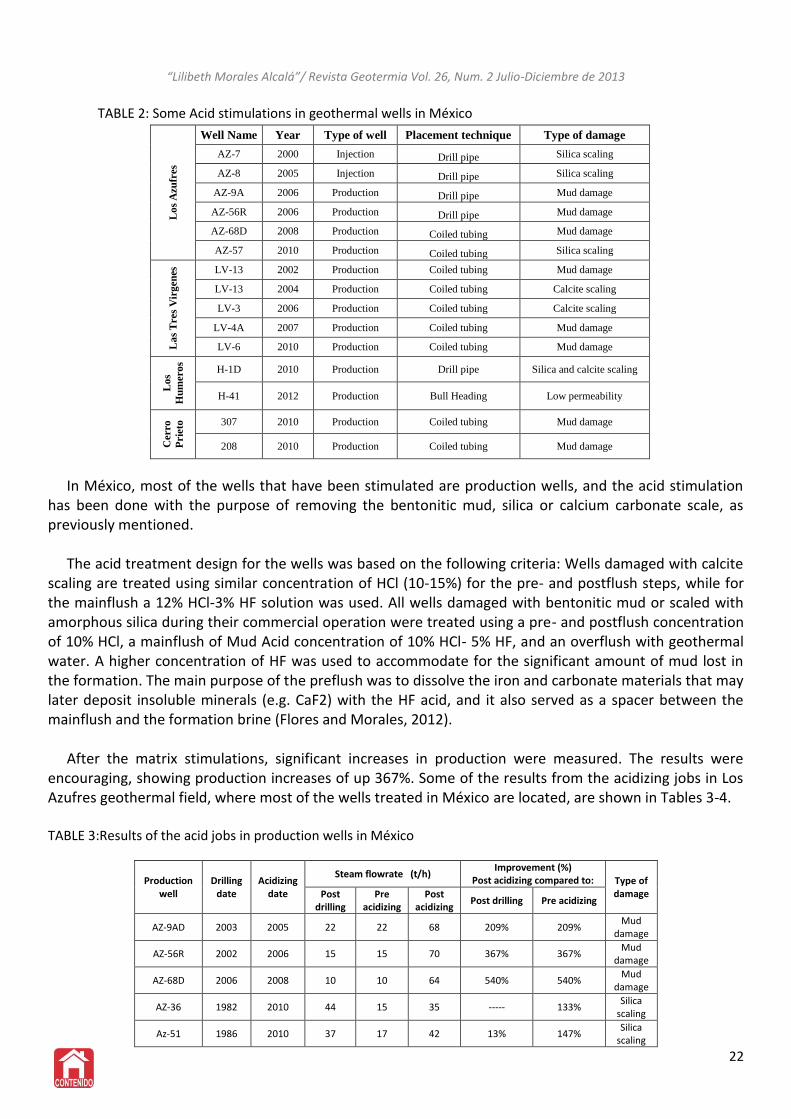
In México, most of the wells that have been stimulated are production wells, and the acid stimulation has been done with the purpose of removing the bentonitic mud, silica or calcium carbonate scale, as previously mentioned. The acid treatment design for the wells was based on the following criteria: Wells damaged with calcite scaling are treated using similar concentration of HCl (10-15%) for the pre- and postflush steps, while for the mainflush a 12% HCl-3% HF solution was used. All wells damaged with bentonitic mud or scaled with amorphous silica during their commercial operation were treated using a pre- and postflush concentration of 10% HCl, a mainflush of Mud Acid concentration of 10% HCl- 5% HF, and an overflush with geothermal water. A higher concentration of HF was used to accommodate for the significant amount of mud lost in the formation. The main purpose of the preflush was to dissolve the iron and carbonate materials that may later deposit insoluble minerals (e.g. CaF2) with the HF acid, and it also served as a spacer between the mainflush and the formation brine (Flores and Morales, 2012). After the matrix stimulations, significant increases in production were measured. The results were encouraging, showing production increases of up 367%. Some of the results from the acidizing jobs in Los Azufres geothermal field, where most of the wells treated in México are located, are shown in Tables 3-4.
TABLE 3:Results of the acid jobs in production wells in México
Production well
Drilling date
Acidizing date
Steam flowrate (t/h) Improvement (%)
Post acidizing compared to: Type of damage Post
drilling Pre
acidizing Post
acidizing Post drilling Pre acidizing
AZ-9AD 2003 2005 22 22 68 209% 209% Mud
damage
AZ-56R 2002 2006 15 15 70 367% 367% Mud
damage
AZ-68D 2006 2008 10 10 64 540% 540% Mud
damage
AZ-36 1982 2010 44 15 35 ----- 133% Silica
scaling
Az-51 1986 2010 37 17 42 13% 147% Silica
scaling
22
TABLE 2: Some Acid stimulations in geothermal wells in México
Lo
s A
zu
fres
Well Name Year Type of well Placement technique Type of damage
AZ-7 2000 Injection Drill pipe Silica scaling
AZ-8 2005 Injection Drill pipe Silica scaling
AZ-9A 2006 Production Drill pipe Mud damage
AZ-56R 2006 Production Drill pipe Mud damage
AZ-68D 2008 Production Coiled tubing Mud damage
AZ-57 2010 Production Coiled tubing Silica scaling
La
s T
res
Vir
gen
es
LV-13 2002 Production Coiled tubing Mud damage
LV-13 2004 Production Coiled tubing Calcite scaling
LV-3 2006 Production Coiled tubing Calcite scaling
LV-4A 2007 Production Coiled tubing Mud damage
LV-6 2010 Production Coiled tubing Mud damage
Lo
s
Hu
mero
s
H-1D 2010 Production Drill pipe Silica and calcite scaling
H-41 2012 Production Bull Heading Low permeability
Cerro
Prie
to
307 2010 Production Coiled tubing Mud damage
208 2010 Production Coiled tubing Mud damage
“Lilibeth Morales Alcalá”/ Revista Geotermia Vol. 26, Num. 2 Julio-Diciembre de 2013
TABLE 4:Results of the acid jobs in injection wells in México
Injection
well
Drilling
date
Injection capacity (t/h) Improvement (%)
Post acidizing compared to: Type of
damage Post
drilling
Pre
acidizing
Post
acidizing
Post
drilling
Pre
acidizing
AZ-8 1988 290 180 410 41% 128% Silica scaling
AZ-52 1987 350 70 170 ------ 143% Silica scaling
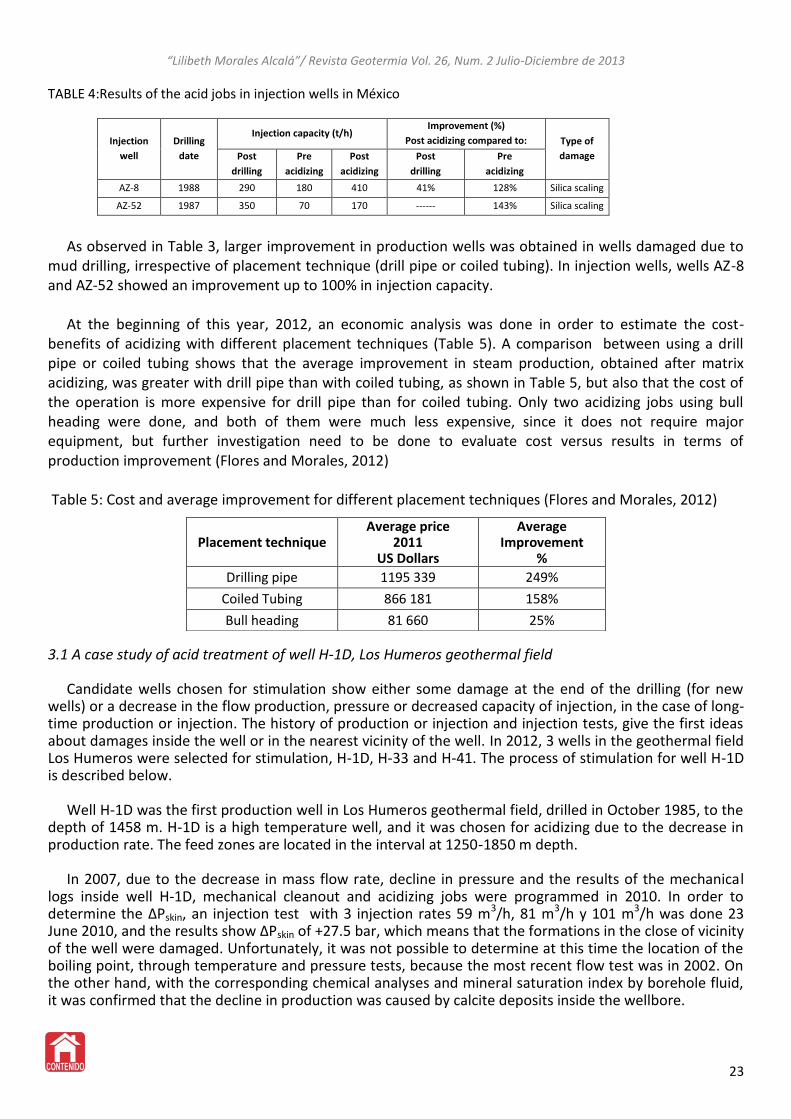
As observed in Table 3, larger improvement in production wells was obtained in wells damaged due to mud drilling, irrespective of placement technique (drill pipe or coiled tubing). In injection wells, wells AZ-8 and AZ-52 showed an improvement up to 100% in injection capacity. At the beginning of this year, 2012, an economic analysis was done in order to estimate the cost-benefits of acidizing with different placement techniques (Table 5). A comparison between using a drill pipe or coiled tubing shows that the average improvement in steam production, obtained after matrix acidizing, was greater with drill pipe than with coiled tubing, as shown in Table 5, but also that the cost of the operation is more expensive for drill pipe than for coiled tubing. Only two acidizing jobs using bull heading were done, and both of them were much less expensive, since it does not require major equipment, but further investigation need to be done to evaluate cost versus results in terms of production improvement (Flores and Morales, 2012) Table 5: Cost and average improvement for different placement techniques (Flores and Morales, 2012)
3.1 A case study of acid treatment of well H-1D, Los Humeros geothermal field
Candidate wells chosen for stimulation show either some damage at the end of the drilling (for new wells) or a decrease in the flow production, pressure or decreased capacity of injection, in the case of long-time production or injection. The history of production or injection and injection tests, give the first ideas about damages inside the well or in the nearest vicinity of the well. In 2012, 3 wells in the geothermal field Los Humeros were selected for stimulation, H-1D, H-33 and H-41. The process of stimulation for well H-1D is described below. Well H-1D was the first production well in Los Humeros geothermal field, drilled in October 1985, to the depth of 1458 m. H-1D is a high temperature well, and it was chosen for acidizing due to the decrease in production rate. The feed zones are located in the interval at 1250-1850 m depth.
In 2007, due to the decrease in mass flow rate, decline in pressure and the results of the mechanical logs inside well H-1D, mechanical cleanout and acidizing jobs were programmed in 2010. In order to determine the ∆Pskin, an injection test with 3 injection rates 59 m3/h, 81 m3/h y 101 m3/h was done 23 June 2010, and the results show ∆Pskin of +27.5 bar, which means that the formations in the close of vicinity of the well were damaged. Unfortunately, it was not possible to determine at this time the location of the boiling point, through temperature and pressure tests, because the most recent flow test was in 2002. On the other hand, with the corresponding chemical analyses and mineral saturation index by borehole fluid, it was confirmed that the decline in production was caused by calcite deposits inside the wellbore.
23
Placement technique Average price
2011 US Dollars
Average Improvement
%
Drilling pipe 1195 339 249%
Coiled Tubing 866 181 158%
Bull heading 81 660 25%
“Lilibeth Morales Alcalá”/ Revista Geotermia Vol. 26, Num. 2 Julio-Diciembre de 2013
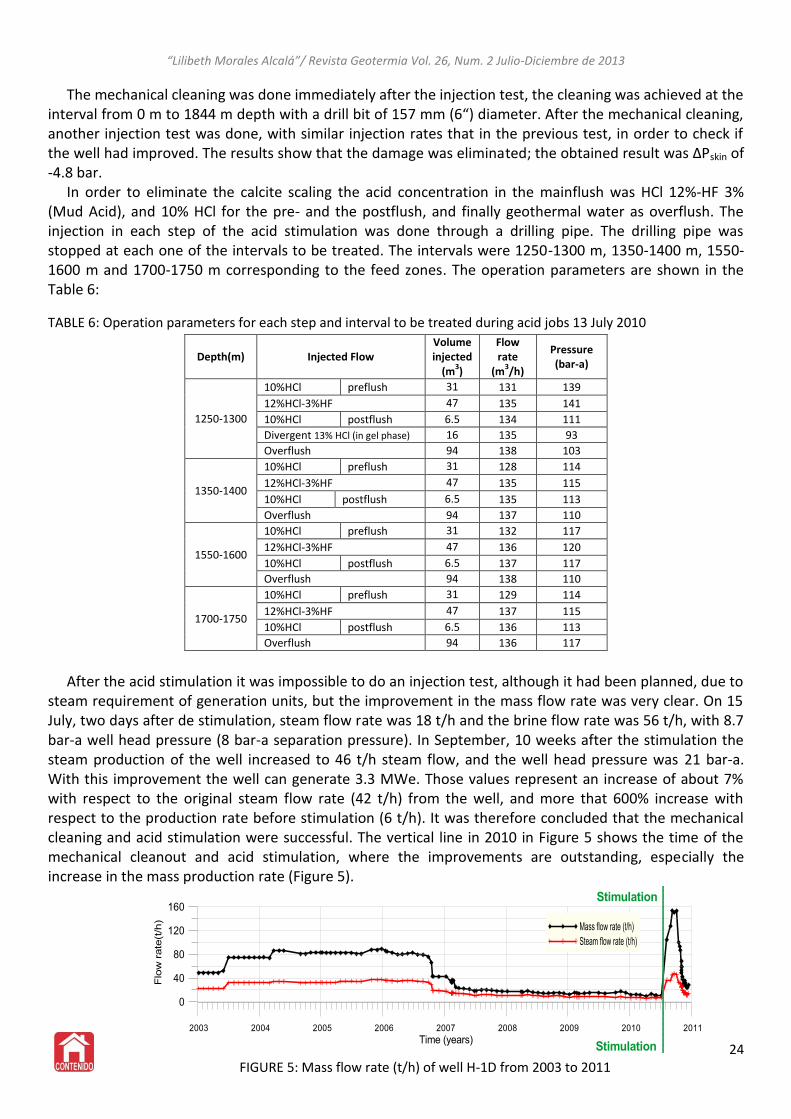
The mechanical cleaning was done immediately after the injection test, the cleaning was achieved at the interval from 0 m to 1844 m depth with a drill bit of 157 mm (6“) diameter. After the mechanical cleaning, another injection test was done, with similar injection rates that in the previous test, in order to check if the well had improved. The results show that the damage was eliminated; the obtained result was ∆Pskin of -4.8 bar. In order to eliminate the calcite scaling the acid concentration in the mainflush was HCl 12%-HF 3% (Mud Acid), and 10% HCl for the pre- and the postflush, and finally geothermal water as overflush. The injection in each step of the acid stimulation was done through a drilling pipe. The drilling pipe was stopped at each one of the intervals to be treated. The intervals were 1250-1300 m, 1350-1400 m, 1550-1600 m and 1700-1750 m corresponding to the feed zones. The operation parameters are shown in the Table 6:
TABLE 6: Operation parameters for each step and interval to be treated during acid jobs 13 July 2010
Depth(m) Injected Flow Volume injected
(m3)
Flow rate
(m3/h)
Pressure (bar-a)
1250-1300
10%HCl preflush 31 131 139
12%HCl-3%HF 47 135 141
10%HCl postflush 6.5 134 111
Divergent 13% HCl (in gel phase) 16 135 93
Overflush 94 138 103
1350-1400
10%HCl preflush 31 128 114
12%HCl-3%HF 47 135 115
10%HCl postflush 6.5 135 113
Overflush 94 137 110
1550-1600
10%HCl preflush 31 132 117
12%HCl-3%HF 47 136 120
10%HCl postflush 6.5 137 117
Overflush 94 138 110
1700-1750
10%HCl preflush 31 129 114
12%HCl-3%HF 47 137 115
10%HCl postflush 6.5 136 113
Overflush 94 136 117
After the acid stimulation it was impossible to do an injection test, although it had been planned, due to steam requirement of generation units, but the improvement in the mass flow rate was very clear. On 15 July, two days after de stimulation, steam flow rate was 18 t/h and the brine flow rate was 56 t/h, with 8.7 bar-a well head pressure (8 bar-a separation pressure). In September, 10 weeks after the stimulation the steam production of the well increased to 46 t/h steam flow, and the well head pressure was 21 bar-a. With this improvement the well can generate 3.3 MWe. Those values represent an increase of about 7% with respect to the original steam flow rate (42 t/h) from the well, and more that 600% increase with respect to the production rate before stimulation (6 t/h). It was therefore concluded that the mechanical cleaning and acid stimulation were successful. The vertical line in 2010 in Figure 5 shows the time of the mechanical cleanout and acid stimulation, where the improvements are outstanding, especially the increase in the mass production rate (Figure 5).
24 FIGURE 5: Mass flow rate (t/h) of well H-1D from 2003 to 2011
“Lilibeth Morales Alcalá”/ Revista Geotermia Vol. 26, Num. 2 Julio-Diciembre de 2013
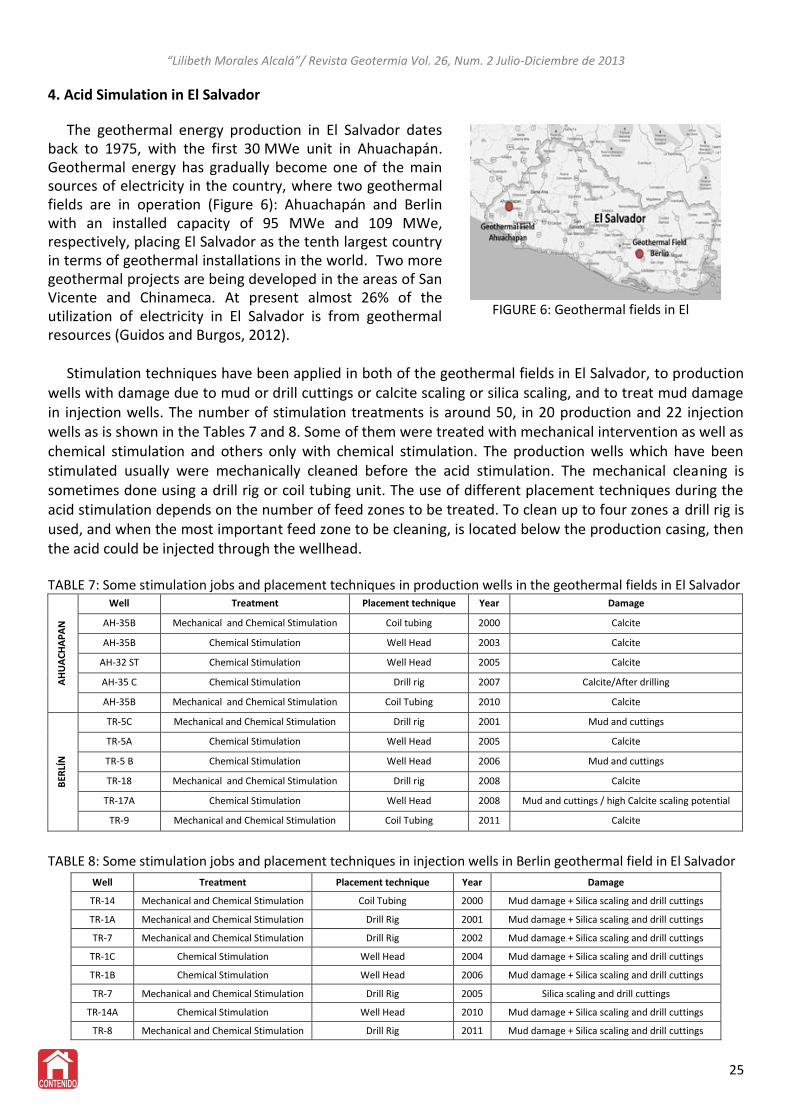
4. Acid Simulation in El Salvador
The geothermal energy production in El Salvador dates back to 1975, with the first 30 MWe unit in Ahuachapán. Geothermal energy has gradually become one of the main sources of electricity in the country, where two geothermal fields are in operation (Figure 6): Ahuachapán and Berlin with an installed capacity of 95 MWe and 109 MWe, respectively, placing El Salvador as the tenth largest country in terms of geothermal installations in the world. Two more geothermal projects are being developed in the areas of San Vicente and Chinameca. At present almost 26% of the utilization of electricity in El Salvador is from geothermal resources (Guidos and Burgos, 2012). Stimulation techniques have been applied in both of the geothermal fields in El Salvador, to production wells with damage due to mud or drill cuttings or calcite scaling or silica scaling, and to treat mud damage in injection wells. The number of stimulation treatments is around 50, in 20 production and 22 injection wells as is shown in the Tables 7 and 8. Some of them were treated with mechanical intervention as well as chemical stimulation and others only with chemical stimulation. The production wells which have been stimulated usually were mechanically cleaned before the acid stimulation. The mechanical cleaning is sometimes done using a drill rig or coil tubing unit. The use of different placement techniques during the acid stimulation depends on the number of feed zones to be treated. To clean up to four zones a drill rig is used, and when the most important feed zone to be cleaning, is located below the production casing, then the acid could be injected through the wellhead. TABLE 7: Some stimulation jobs and placement techniques in production wells in the geothermal fields in El Salvador
AH
UA
CH
AP
AN
Well Treatment Placement technique Year Damage
AH-35B Mechanical and Chemical Stimulation Coil tubing 2000 Calcite
AH-35B Chemical Stimulation Well Head 2003 Calcite
AH-32 ST Chemical Stimulation Well Head 2005 Calcite
AH-35 C Chemical Stimulation Drill rig 2007 Calcite/After drilling
AH-35B Mechanical and Chemical Stimulation Coil Tubing 2010 Calcite
BER
LÍN
TR-5C Mechanical and Chemical Stimulation Drill rig 2001 Mud and cuttings
TR-5A Chemical Stimulation Well Head 2005 Calcite
TR-5 B Chemical Stimulation Well Head 2006 Mud and cuttings
TR-18 Mechanical and Chemical Stimulation Drill rig 2008 Calcite
TR-17A Chemical Stimulation Well Head 2008 Mud and cuttings / high Calcite scaling potential
TR-9 Mechanical and Chemical Stimulation Coil Tubing 2011 Calcite
TABLE 8: Some stimulation jobs and placement techniques in injection wells in Berlin geothermal field in El Salvador
Well Treatment Placement technique Year Damage
TR-14 Mechanical and Chemical Stimulation Coil Tubing 2000 Mud damage + Silica scaling and drill cuttings
TR-1A Mechanical and Chemical Stimulation Drill Rig 2001 Mud damage + Silica scaling and drill cuttings
TR-7 Mechanical and Chemical Stimulation Drill Rig 2002 Mud damage + Silica scaling and drill cuttings
TR-1C Chemical Stimulation Well Head 2004 Mud damage + Silica scaling and drill cuttings
TR-1B Chemical Stimulation Well Head 2006 Mud damage + Silica scaling and drill cuttings
TR-7 Mechanical and Chemical Stimulation Drill Rig 2005 Silica scaling and drill cuttings
TR-14A Chemical Stimulation Well Head 2010 Mud damage + Silica scaling and drill cuttings
TR-8 Mechanical and Chemical Stimulation Drill Rig 2011 Mud damage + Silica scaling and drill cuttings
25
FIGURE 6: Geothermal fields in El
Salvador
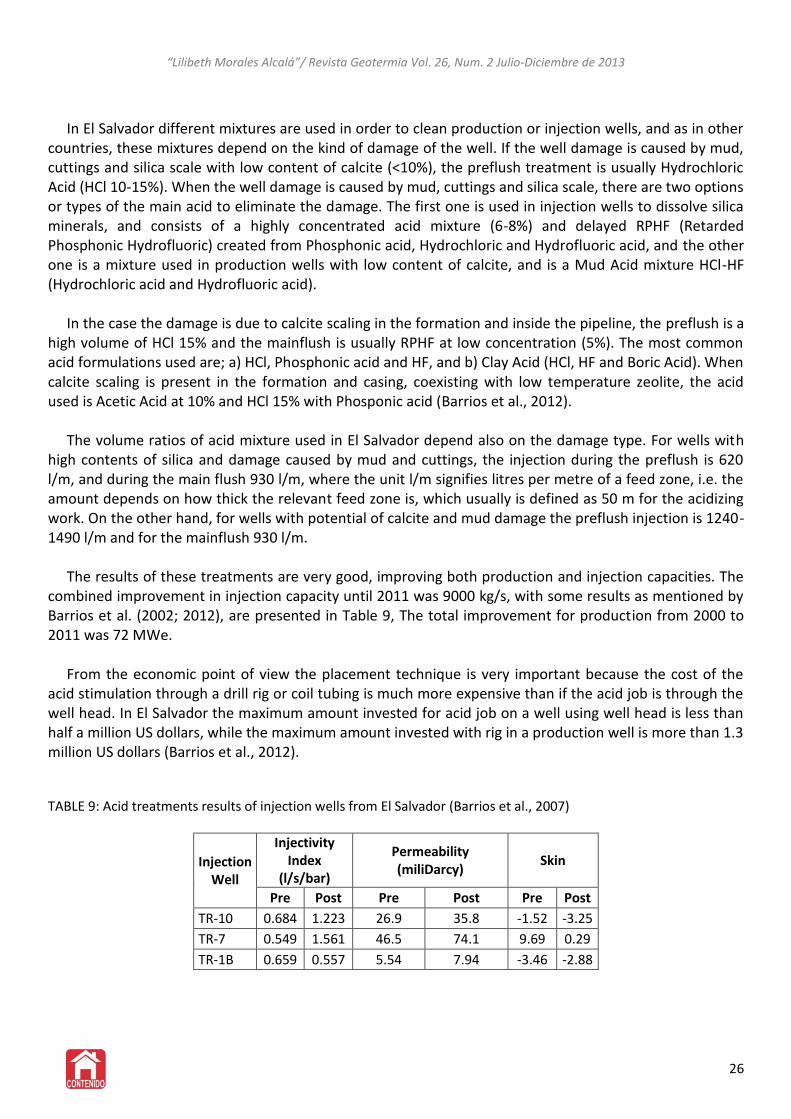
“Lilibeth Morales Alcalá”/ Revista Geotermia Vol. 26, Num. 2 Julio-Diciembre de 2013
In El Salvador different mixtures are used in order to clean production or injection wells, and as in other countries, these mixtures depend on the kind of damage of the well. If the well damage is caused by mud, cuttings and silica scale with low content of calcite (<10%), the preflush treatment is usually Hydrochloric Acid (HCl 10-15%). When the well damage is caused by mud, cuttings and silica scale, there are two options or types of the main acid to eliminate the damage. The first one is used in injection wells to dissolve silica minerals, and consists of a highly concentrated acid mixture (6-8%) and delayed RPHF (Retarded Phosphonic Hydrofluoric) created from Phosphonic acid, Hydrochloric and Hydrofluoric acid, and the other one is a mixture used in production wells with low content of calcite, and is a Mud Acid mixture HCl-HF (Hydrochloric acid and Hydrofluoric acid). In the case the damage is due to calcite scaling in the formation and inside the pipeline, the preflush is a high volume of HCl 15% and the mainflush is usually RPHF at low concentration (5%). The most common acid formulations used are; a) HCl, Phosphonic acid and HF, and b) Clay Acid (HCl, HF and Boric Acid). When calcite scaling is present in the formation and casing, coexisting with low temperature zeolite, the acid used is Acetic Acid at 10% and HCl 15% with Phosponic acid (Barrios et al., 2012). The volume ratios of acid mixture used in El Salvador depend also on the damage type. For wells with high contents of silica and damage caused by mud and cuttings, the injection during the preflush is 620 l/m, and during the main flush 930 l/m, where the unit l/m signifies litres per metre of a feed zone, i.e. the amount depends on how thick the relevant feed zone is, which usually is defined as 50 m for the acidizing work. On the other hand, for wells with potential of calcite and mud damage the preflush injection is 1240-1490 l/m and for the mainflush 930 l/m. The results of these treatments are very good, improving both production and injection capacities. The combined improvement in injection capacity until 2011 was 9000 kg/s, with some results as mentioned by Barrios et al. (2002; 2012), are presented in Table 9, The total improvement for production from 2000 to 2011 was 72 MWe. From the economic point of view the placement technique is very important because the cost of the acid stimulation through a drill rig or coil tubing is much more expensive than if the acid job is through the well head. In El Salvador the maximum amount invested for acid job on a well using well head is less than half a million US dollars, while the maximum amount invested with rig in a production well is more than 1.3 million US dollars (Barrios et al., 2012). TABLE 9: Acid treatments results of injection wells from El Salvador (Barrios et al., 2007)
Injection Well
Injectivity Index
(l/s/bar)
Permeability (miliDarcy)
Skin
Pre Post Pre Post Pre Post
TR-10 0.684 1.223 26.9 35.8 -1.52 -3.25
TR-7 0.549 1.561 46.5 74.1 9.69 0.29
TR-1B 0.659 0.557 5.54 7.94 -3.46 -2.88
26
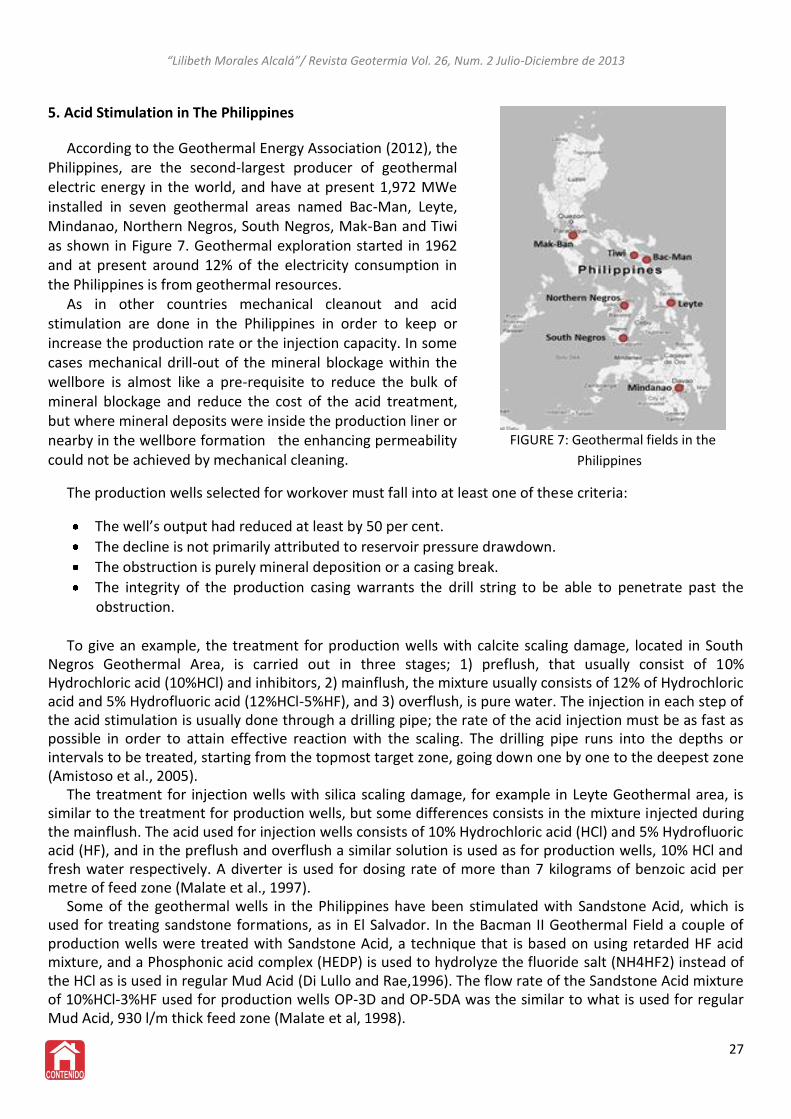
“Lilibeth Morales Alcalá”/ Revista Geotermia Vol. 26, Num. 2 Julio-Diciembre de 2013
5. Acid Stimulation in The Philippines
According to the Geothermal Energy Association (2012), the Philippines, are the second-largest producer of geothermal electric energy in the world, and have at present 1,972 MWe installed in seven geothermal areas named Bac-Man, Leyte, Mindanao, Northern Negros, South Negros, Mak-Ban and Tiwi as shown in Figure 7. Geothermal exploration started in 1962 and at present around 12% of the electricity consumption in the Philippines is from geothermal resources. As in other countries mechanical cleanout and acid stimulation are done in the Philippines in order to keep or increase the production rate or the injection capacity. In some cases mechanical drill-out of the mineral blockage within the wellbore is almost like a pre-requisite to reduce the bulk of mineral blockage and reduce the cost of the acid treatment, but where mineral deposits were inside the production liner or nearby in the wellbore formation the enhancing permeability could not be achieved by mechanical cleaning.
The production wells selected for workover must fall into at least one of these criteria:
The well’s output had reduced at least by 50 per cent.
The decline is not primarily attributed to reservoir pressure drawdown.
The obstruction is purely mineral deposition or a casing break.
The integrity of the production casing warrants the drill string to be able to penetrate past the obstruction.
To give an example, the treatment for production wells with calcite scaling damage, located in South Negros Geothermal Area, is carried out in three stages; 1) preflush, that usually consist of 10% Hydrochloric acid (10%HCl) and inhibitors, 2) mainflush, the mixture usually consists of 12% of Hydrochloric acid and 5% Hydrofluoric acid (12%HCl-5%HF), and 3) overflush, is pure water. The injection in each step of the acid stimulation is usually done through a drilling pipe; the rate of the acid injection must be as fast as possible in order to attain effective reaction with the scaling. The drilling pipe runs into the depths or intervals to be treated, starting from the topmost target zone, going down one by one to the deepest zone (Amistoso et al., 2005). The treatment for injection wells with silica scaling damage, for example in Leyte Geothermal area, is similar to the treatment for production wells, but some differences consists in the mixture injected during the mainflush. The acid used for injection wells consists of 10% Hydrochloric acid (HCl) and 5% Hydrofluoric acid (HF), and in the preflush and overflush a similar solution is used as for production wells, 10% HCl and fresh water respectively. A diverter is used for dosing rate of more than 7 kilograms of benzoic acid per metre of feed zone (Malate et al., 1997). Some of the geothermal wells in the Philippines have been stimulated with Sandstone Acid, which is used for treating sandstone formations, as in El Salvador. In the Bacman II Geothermal Field a couple of production wells were treated with Sandstone Acid, a technique that is based on using retarded HF acid mixture, and a Phosphonic acid complex (HEDP) is used to hydrolyze the fluoride salt (NH4HF2) instead of the HCl as is used in regular Mud Acid (Di Lullo and Rae,1996). The flow rate of the Sandstone Acid mixture of 10%HCl-3%HF used for production wells OP-3D and OP-5DA was the similar to what is used for regular Mud Acid, 930 l/m thick feed zone (Malate et al, 1998).
27
FIGURE 7: Geothermal fields in the
Philippines
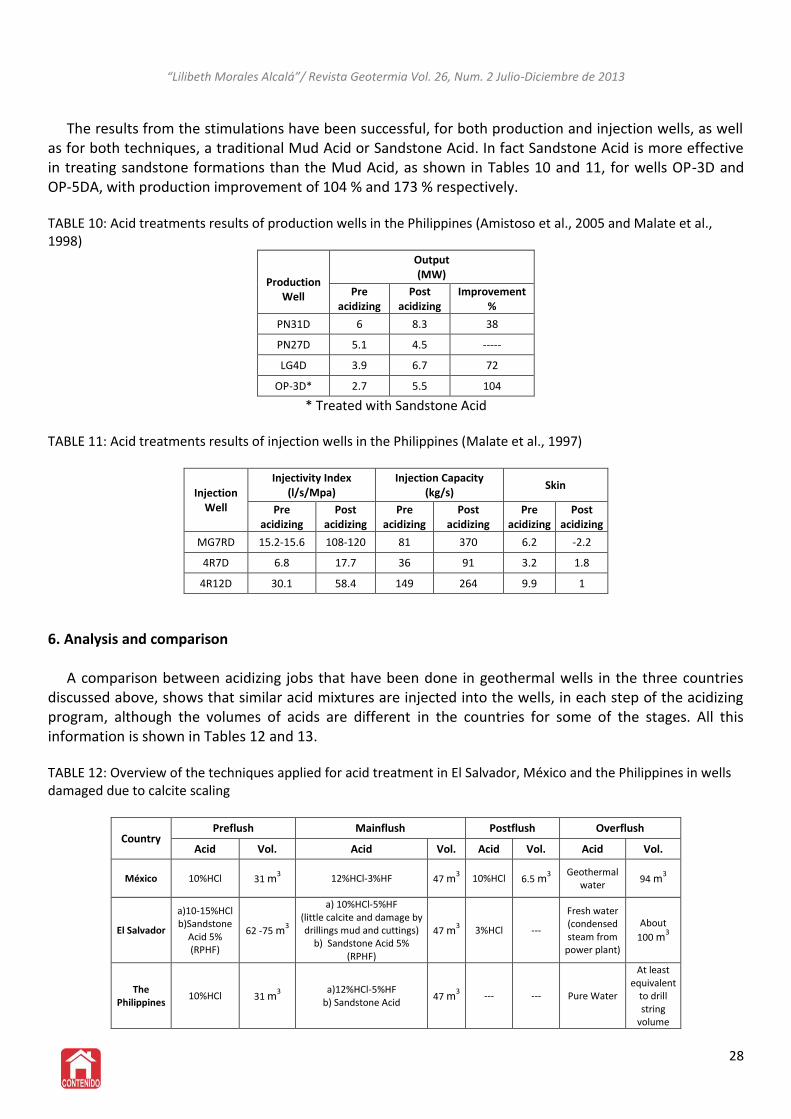
“Lilibeth Morales Alcalá”/ Revista Geotermia Vol. 26, Num. 2 Julio-Diciembre de 2013
The results from the stimulations have been successful, for both production and injection wells, as well as for both techniques, a traditional Mud Acid or Sandstone Acid. In fact Sandstone Acid is more effective in treating sandstone formations than the Mud Acid, as shown in Tables 10 and 11, for wells OP-3D and OP-5DA, with production improvement of 104 % and 173 % respectively. TABLE 10: Acid treatments results of production wells in the Philippines (Amistoso et al., 2005 and Malate et al., 1998)
Production
Well
Output (MW)
Pre acidizing
Post acidizing
Improvement %
PN31D 6 8.3 38
PN27D 5.1 4.5 -----
LG4D 3.9 6.7 72
OP-3D* 2.7 5.5 104
* Treated with Sandstone Acid TABLE 11: Acid treatments results of injection wells in the Philippines (Malate et al., 1997)
Injection Well
Injectivity Index (l/s/Mpa)
Injection Capacity (kg/s)
Skin
Pre acidizing
Post acidizing
Pre acidizing
Post acidizing
Pre acidizing
Post acidizing
MG7RD 15.2-15.6 108-120 81 370 6.2 -2.2
4R7D 6.8 17.7 36 91 3.2 1.8
4R12D 30.1 58.4 149 264 9.9 1
6. Analysis and comparison A comparison between acidizing jobs that have been done in geothermal wells in the three countries discussed above, shows that similar acid mixtures are injected into the wells, in each step of the acidizing program, although the volumes of acids are different in the countries for some of the stages. All this information is shown in Tables 12 and 13. TABLE 12: Overview of the techniques applied for acid treatment in El Salvador, México and the Philippines in wells damaged due to calcite scaling
Country Preflush Mainflush Postflush Overflush
Acid Vol. Acid Vol. Acid Vol. Acid Vol.
México 10%HCl 31 m3 12%HCl-3%HF 47 m
3 10%HCl 6.5 m3 Geothermal
water 94 m
3
El Salvador
a)10-15%HCl b)Sandstone
Acid 5% (RPHF)
62 -75 m3
a) 10%HCl-5%HF (little calcite and damage by drillings mud and cuttings)
b) Sandstone Acid 5% (RPHF)
47 m3 3%HCl ---
Fresh water (condensed steam from
power plant)
About
100 m3
The Philippines
10%HCl 31 m3 a)12%HCl-5%HF
b) Sandstone Acid 47 m
3 --- --- Pure Water
At least equivalent
to drill string
volume
28
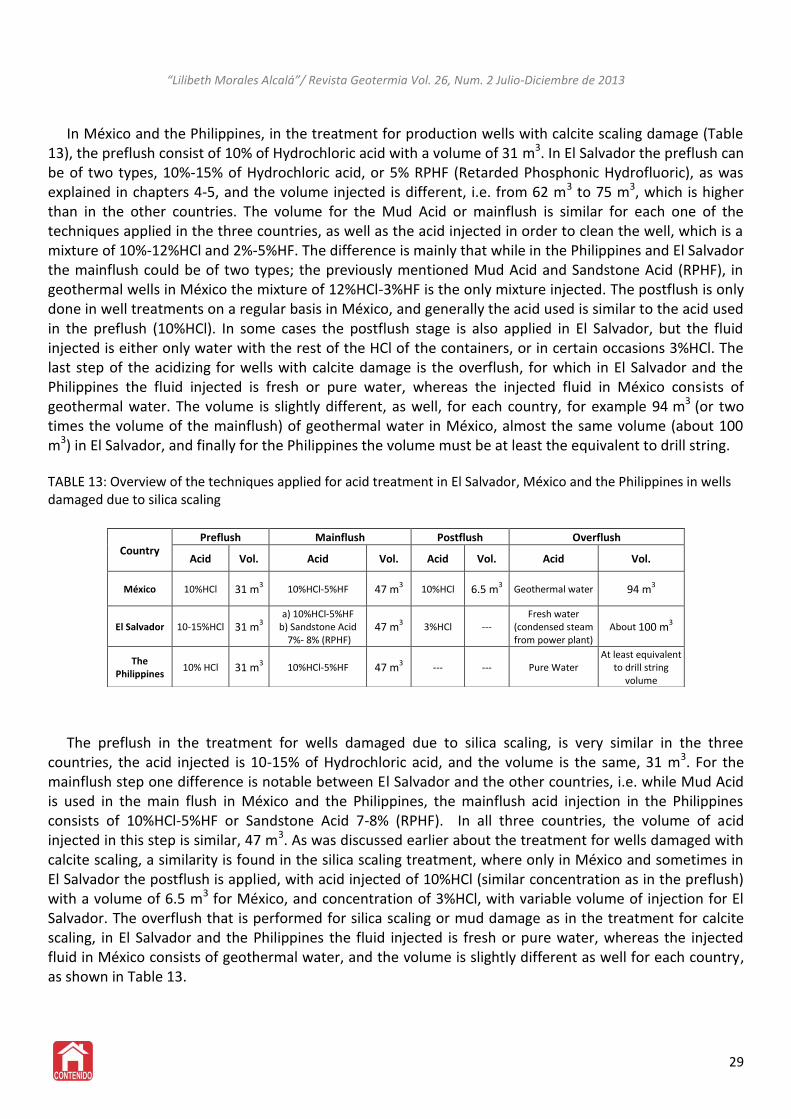
“Lilibeth Morales Alcalá”/ Revista Geotermia Vol. 26, Num. 2 Julio-Diciembre de 2013
In México and the Philippines, in the treatment for production wells with calcite scaling damage (Table 13), the preflush consist of 10% of Hydrochloric acid with a volume of 31 m3. In El Salvador the preflush can be of two types, 10%-15% of Hydrochloric acid, or 5% RPHF (Retarded Phosphonic Hydrofluoric), as was explained in chapters 4-5, and the volume injected is different, i.e. from 62 m3 to 75 m3, which is higher than in the other countries. The volume for the Mud Acid or mainflush is similar for each one of the techniques applied in the three countries, as well as the acid injected in order to clean the well, which is a mixture of 10%-12%HCl and 2%-5%HF. The difference is mainly that while in the Philippines and El Salvador the mainflush could be of two types; the previously mentioned Mud Acid and Sandstone Acid (RPHF), in geothermal wells in México the mixture of 12%HCl-3%HF is the only mixture injected. The postflush is only done in well treatments on a regular basis in México, and generally the acid used is similar to the acid used in the preflush (10%HCl). In some cases the postflush stage is also applied in El Salvador, but the fluid injected is either only water with the rest of the HCl of the containers, or in certain occasions 3%HCl. The last step of the acidizing for wells with calcite damage is the overflush, for which in El Salvador and the Philippines the fluid injected is fresh or pure water, whereas the injected fluid in México consists of geothermal water. The volume is slightly different, as well, for each country, for example 94 m3 (or two times the volume of the mainflush) of geothermal water in México, almost the same volume (about 100 m3) in El Salvador, and finally for the Philippines the volume must be at least the equivalent to drill string. TABLE 13: Overview of the techniques applied for acid treatment in El Salvador, México and the Philippines in wells damaged due to silica scaling
The preflush in the treatment for wells damaged due to silica scaling, is very similar in the three countries, the acid injected is 10-15% of Hydrochloric acid, and the volume is the same, 31 m3. For the mainflush step one difference is notable between El Salvador and the other countries, i.e. while Mud Acid is used in the main flush in México and the Philippines, the mainflush acid injection in the Philippines consists of 10%HCl-5%HF or Sandstone Acid 7-8% (RPHF). In all three countries, the volume of acid injected in this step is similar, 47 m3. As was discussed earlier about the treatment for wells damaged with calcite scaling, a similarity is found in the silica scaling treatment, where only in México and sometimes in El Salvador the postflush is applied, with acid injected of 10%HCl (similar concentration as in the preflush) with a volume of 6.5 m3 for México, and concentration of 3%HCl, with variable volume of injection for El Salvador. The overflush that is performed for silica scaling or mud damage as in the treatment for calcite scaling, in El Salvador and the Philippines the fluid injected is fresh or pure water, whereas the injected fluid in México consists of geothermal water, and the volume is slightly different as well for each country, as shown in Table 13.
29
Country Preflush Mainflush Postflush Overflush
Acid Vol. Acid Vol. Acid Vol. Acid Vol.
México 10%HCl 31 m3 10%HCl-5%HF 47 m3
10%HCl 6.5 m3 Geothermal water 94 m3
El Salvador 10-15%HCl 31 m3 a) 10%HCl-5%HF
b) Sandstone Acid 7%- 8% (RPHF)
47 m3 3%HCl ---
Fresh water (condensed steam from power plant)
About 100 m3
The Philippines
10% HCl 31 m3 10%HCl-5%HF 47 m3
--- --- Pure Water At least equivalent
to drill string volume
“Lilibeth Morales Alcalá”/ Revista Geotermia Vol. 26, Num. 2 Julio-Diciembre de 2013
7. Conclusions
Acid stimulations, due to the ability of dissolving formation minerals, depositions and foreign material, have the potential to increase formation permeability and remedy damage in the geothermal well formation, which causes low and decreased flow-rate in the well, such as drilling mud which may be introduced into the formation during drilling or workover procedures and scales formed during production or injection. Matrix acidizing has become one of the most used stimulation techniques in treatments of geothermal wells around the world due to the excellent results after the treatment for production wells as well as injection wells. The matrix acidizing consists of injecting a specific mixture of acid into the well, usually in three or four stages (preflush, mainflush, postflush and overflush). The most important factor in treatment design is the evaluation of formation damage. The decision of which acid, acid concentration, and how much volume should be injected, depends on the type of damage. México is one of the countries in which matrix acidizing has been applied in several wells with very good results. To give an example, in 2010 well H-1D was stimulated and the steam production improvement showed an increase of about 7% with respect to the original steam flow rate from the well, and more that 600% increase with respect to the production rate just before stimulation. The results are also very good in El Salvador and the Philippines. The technique applied in each country is similar, but there are some differences in the concentration of the injected acids and the volumes. For treatments of wells damaged due to calcite scaling, the preflush stages are very similar in México and the Philippines. In El Salvador the preflush can be of two types of acids, and the injected volume is approximately twice that in the other countries. In the mainflush the volume is similar in the three countries but the acid concentration differs a little between all of the countries. Additionally, both in El Salvador and the Philippines, the mainflush can consist of Sandstone Acid or Mud Acid whereas only Mud Acid is injected in México. The postflush and overflush are also different, because while in México the postflush is always performed, in El Salvador it is often omitted and it is not performed at all in the Philippines. The overflush is applied in all of the countries, but the main difference is that in México the overflush consists of geothermal water while in the other countries fresh or pure water is injected. For wells, damaged due to silica scaling or mud damage, the preflush in the treatment is similar in the three countries, both the acids injected and the volumes are the same. Regular Mud Acid is most often used in the mainflush in all of the countries, the only difference is that in El Salvador sometimes Sandstone Acid is used as well. The similarities and differences of the post and overflush stages are similar to what applies to the treatment for calcite scaling. The cost of acid treatments varies between 0.5 to 1.3 M USD per treatment, as shown in an economic analysis for México and El Salvador (Flores and Morales, 2012; Barrios et al., 2012). The placement technique directly affects the cost of the acid stimulation, as it is more expensive when a drill rig or coiled tubing are used, compared to acidizing through the well head. On the other hand, in the case of México the success is also usually better when injecting the acid through the more expensive techniques, i.e. using the drill rig or the coiled tubing, probably because the injected acid is placed directly into the feed zones.
30
“Lilibeth Morales Alcalá”/ Revista Geotermia Vol. 26, Num. 2 Julio-Diciembre de 2013
As a result of this study it is suggested that a consideration is given in México to the operational parameters of the acidizing treatment in the two other countries. As an example, removing the stage of the postflush, using fresh or pure water instead of geothermal water in the overflush, is advised in order to analyse if these modifications would bring some production and economic benefits. The efficiency of the use of Sandstone Acid in the mainflush in geothermal wells in México is something that should be studied carefully due the type of rock formation of each geothermal field.
References
[1] Amistoso, A.E., Aqui, A.R., Yglopaz, D.M., and Malate, R.C.M, 2005: Sustaining Steam supply in Palinpinon I production field, Southern Negros geothermal project, Philippines. Proceedings of the World Geothermal Congress 2005, Antalya, Turkey, 5 pp.
[2] André, L., Fritz, B., and Vuataz, F.-D., 2006. Overview of chemical stimulations of EGS and non EGS reservoirs.
Proceedings of the Engine Launching Conference, Orléans, France, 4-12. [3] Barrios, L.A., Guerra, E., Jacobo P., and Mayorga, H., 2012: Acid stimulation of geothermal reservoirs. Paper
presented at “Short Course on Geothermal Development and Geothermal Wells”, organized by UNU-GTP and LaGeo, Santa Tecla, El Salvador, 12 pp.
[4] Barrios, L.A., Quijano, J.E., Guerra, E., Mayorga, H., Rodriguez, A., Romero, R., 2007: Injection improvements in
low permeability and negative skin wells, using mechanical cleanout and chemical stimulation, Berlin geothermal field, El Salvador. Geothermal Resources Counc., Trans., 31, 141-146.
[5] Barrios, L.A., Quijano, J.E., Romero, R.E., Mayorga, H., Castro, M., and Caldera, J., 2002: Enhanced permeability by
chemical stimulation at the Berlin geothermal field, El Salvador. Geothermal Resources Council, Trans., 26, 73-78.
[6] CFE, 2012: CFE - statistics on generation (in Spanish). Comisión Federal de Electricidad, México, website:
www.cfe.gob.mx/ConoceCFE/1_AcercadeCFE/Estadisticas/Paginas/Generacion.aspx. [7] Di Lullo, G., and Rae, P., 1996: A new acid for true stimulation of sandstone reservoirs. Proceedings of the 6th
International Asia, Pacific Oil & Gas Conference. Adelaide, Australia. [8] Flores Armenta, M., 2012: Geothermal activity and development in México - Keeping the production going. Paper
presented at the “Short Course on Geothermal Development and Geothermal Wells”, Santa Tecla, El Salvador, 12 pp.
[9] Flores Armenta, M., Davies, D., Pálsson, B., 2005: Stimulation of geothermal wells, can we afford it?, Proceedings
of the World Geothermal Congress, Antalya, Turkey. [10] Flores Armenta, M., and Morales, A, L., 2012: How much stimulation can we afford?, Paper presented at the
“Short Course on Geothermal Development and Geothermal Wells”, Santa Tecla, El Salvador, 12 pp. [11] Geothermal Energy Association, 2012: International market overview report, May 2012. Geothermal Energy Ass.
26 pp, website: www.geo-energy.org/pdf/reports/2012-GEA_International_Overview.pdf.
31
“Lilibeth Morales Alcalá”/ Revista Geotermia Vol. 26, Num. 2 Julio-Diciembre de 2013
[12] Guidos, J. and Burgos, J., 2012: Geothermal activity and development in El Salvador - producing and developing.
Paper presented at the “Short Course on Geothermal Development and Geothermal Wells”, Santa Tecla, El Salvador, 12 pp.
[13] Horne, R.N. (1995). Modern well test analysis, a computer aided approach (2nd ed.). Petroway Inc., USA, 257 pp. [14] Malate, R.C.M, Austria, J.J.C., Sarmiento, Z.F., Di Lullo, G., Sookprasong, P.A. and Francia, E.S., 1998: Matrix
stimulation treatment of geothermal wells using sandstone acid. Proceedings of the 23rd Workshop on Geothermal Reservoir Engineering, Stanford University, Stanford, CA, 375-378.
[15] Malate, R.C.M, Yglopaz, D.M., Austria, J.J.C., Lacanilao, A.M. and Sarmiento, Z.F., 1997: Acid stimulation of
injection wells in the Leyte geothermal power project, Philippines, Proceedings of the 22nd Workshop on Geothermal Reservoir Engineering, Stanford University, Stanford, CA, 267-272.
[16] Portier, S., André, L., and Vuataz, F.-D., 2006: Modelling geochemical effects of acid treatments and comparison
with field observations at Soultz-sous-Forêts geothermal site. Proceedings of the ENGINE – Enhanced Geothermal Innovative Network for Europe, Workshop 3, Stimulation of Reservoir and Microseismicity, Zürich, 13 pp.
[17] Portier, S., André, L., and Vuataz, F.-D, 2007: Review on chemical stimulation techniques in oil industry and
applications to geothermal systems. Proceedings of the ENGINE – Enhanced Geothermal Innovative Network for Europe, Workshop 4, Drilling, Stimulation and Reservoir Assessment, Switzerland, 32 pp.
[18] Rutagarama, U., 2012: The role of well testing in geothermal resource assessment. University of Iceland, School
of Engineering and Natural Sciences, Faculty of Earth Sciences, MSc. Thesis, UNU-GTP, report 2, 86 pp. [19] Williams, B.B., Gidley, L.J., Schechter, S.R., 1979: Acidizing fundamentals. Society of Petroleum Engineers of
AIME, NY, 1979, 123 pp.
32
MICRO SEISMIC MONITORING DURING PRODUCTION
-UTILIZATION AND CASE EXAMPLES FOR MEXICO-
Efrén Cruz-Noéa, Cecilia Lorenzo-Pulidoa, Jorge Soto-Peredoa y Saúl Pulido-Arreolaa. a"Alejandro Volta 655, Col. Electricistas, Morelia, Michoacán. C.P. 58290, México"
Resumen
Las redes sísmicas en los campos geotérmicos de México han operado desde la década de los 90’s. En este trabajo se presentan los resultados y aplicaciones de los registros de microsismicidad en los campos Geotérmicos Los Azufres, Los Humeros y Las Tres Vírgenes. La información generada en este periodo es de gran utilidad ya que la microsismicidad es un apoyo para la definición de objetivos para la perforación de pozos productores e inyectores. Las zonas de mayor permeabilidad tienen gran importancia en el desarrollo y rentabilidad de los yacimientos geotérmicos y es donde ocurre preferencialmente la sismicidad.
Palabras Clave: Fracturamiento; Microsismicidad; Permaebilidad; Sistema Estructural
Abstract Seismic networks in the geothermal fields of México have operated since the 1990's. This paper reports the results and applications of the micro seismicity recordings in Los Azufres, Los Humeros and Las Tres Virgenes Geothermal fields in México. The information generated in those fields is useful since microseismicity is a support tool for defining drill targets of production and injection wells, as well as to identify fluid movement in the subsurface, which can be related to permeable zones. Keywords: Fractured zones; Microseismicity; Permable zones; Structural Systems
1. Introduction
Geothermal energy in México is almost entirely used to produce electricity, since its direct uses are still under development and currently remain restricted to bathing and swimming. The net installed geothermal-electric capacity in México as of December 2010 is 958 megawatts (MW). This capacity is currently operating in four geothermal fields: Cerro Prieto (720 MW), Los Azufres (188 MW), Los Humeros (40 MW) and Las Tres Vírgenes (10 MW). However, the running capacity is less than that, because of production decline mainly at Cerro Prieto geothermal field, one of the largest geothermal fields in the world. All of the geothermal fields and power plants are owned and operated by the governmental agency CFE (Comisión Federal de Electricidad). Electric uses of geothermal are planned, developed and operated by the Gerencia de Proyectos Geotermoeléctricos – the geothermal division of the CFE, Flores-Armenta, 2012 [1]. In 2013, 214 production and 28 injection wells were operating in México at the geothermal fields of Cerro Prieto, Los Azufres, Los Humeros and Las Tres Vírgenes. Gerencia de Proyectos Geotermoeléctricos (GPG), 2012 [2].
During the operation of a geothermal reservoir, stress changes occur which can be generated for several
reasons; sudden release of energy in the ground, by the collapse of a geological structure, reactivation of geological structures, by exploitation of the geothermal resource and re-injection; these changes can be measured using the technique of micro seismicity.
The use of geothermal micro seismicity is significant since it is a powerful tool when combined with
other subsurface measurements, resulting in an increase of the knowledge of the reservoir, useful for decisions making, when the exploitation strategy and the reservoir response is linked; in this way it can be observed that zones with high seismicity can be related to high permeability zones, those zones are very important in the development and profitability of the projects.
33
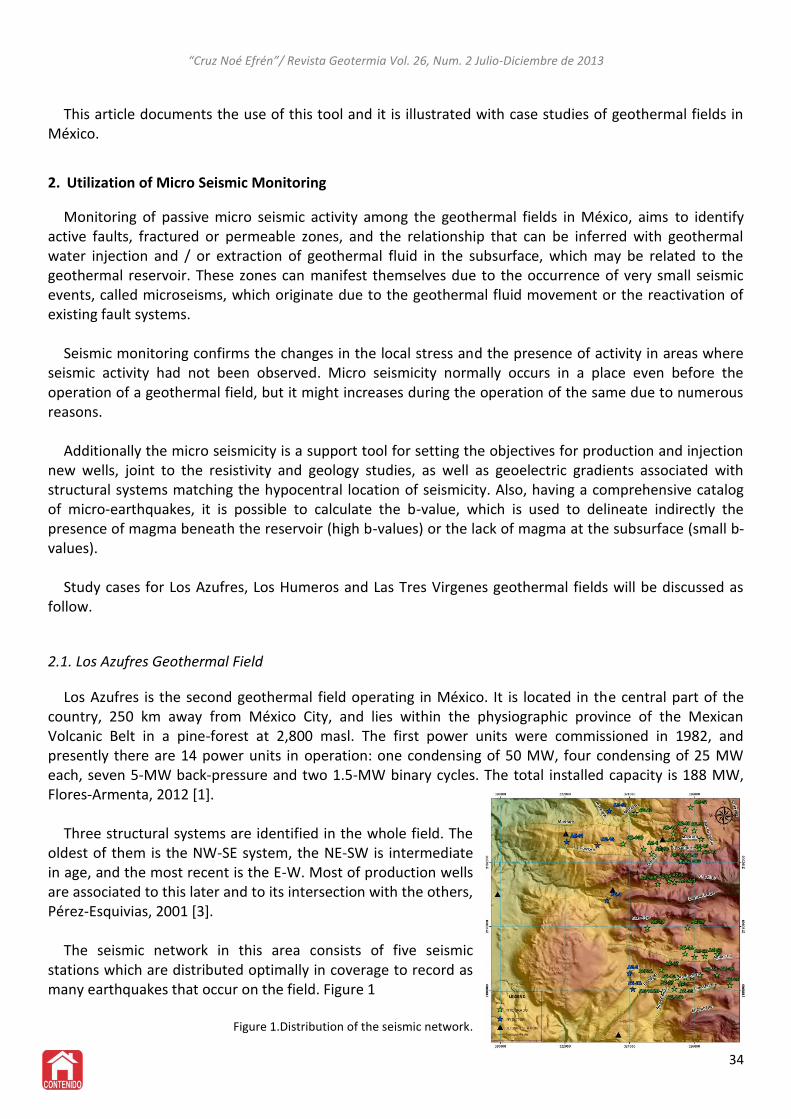
“Cruz Noé Efrén”/ Revista Geotermia Vol. 26, Num. 2 Julio-Diciembre de 2013
This article documents the use of this tool and it is illustrated with case studies of geothermal fields in
México.
2. Utilization of Micro Seismic Monitoring
Monitoring of passive micro seismic activity among the geothermal fields in México, aims to identify active faults, fractured or permeable zones, and the relationship that can be inferred with geothermal water injection and / or extraction of geothermal fluid in the subsurface, which may be related to the geothermal reservoir. These zones can manifest themselves due to the occurrence of very small seismic events, called microseisms, which originate due to the geothermal fluid movement or the reactivation of existing fault systems.
Seismic monitoring confirms the changes in the local stress and the presence of activity in areas where
seismic activity had not been observed. Micro seismicity normally occurs in a place even before the operation of a geothermal field, but it might increases during the operation of the same due to numerous reasons.
Additionally the micro seismicity is a support tool for setting the objectives for production and injection
new wells, joint to the resistivity and geology studies, as well as geoelectric gradients associated with structural systems matching the hypocentral location of seismicity. Also, having a comprehensive catalog of micro-earthquakes, it is possible to calculate the b-value, which is used to delineate indirectly the presence of magma beneath the reservoir (high b-values) or the lack of magma at the subsurface (small b-values).
Study cases for Los Azufres, Los Humeros and Las Tres Virgenes geothermal fields will be discussed as
follow.
2.1. Los Azufres Geothermal Field
Los Azufres is the second geothermal field operating in México. It is located in the central part of the country, 250 km away from México City, and lies within the physiographic province of the Mexican Volcanic Belt in a pine-forest at 2,800 masl. The first power units were commissioned in 1982, and presently there are 14 power units in operation: one condensing of 50 MW, four condensing of 25 MW each, seven 5-MW back-pressure and two 1.5-MW binary cycles. The total installed capacity is 188 MW, Flores-Armenta, 2012 [1].
Three structural systems are identified in the whole field. The
oldest of them is the NW-SE system, the NE-SW is intermediate in age, and the most recent is the E-W. Most of production wells are associated to this later and to its intersection with the others, Pérez-Esquivias, 2001 [3].
The seismic network in this area consists of five seismic
stations which are distributed optimally in coverage to record as many earthquakes that occur on the field. Figure 1
Figure 1.Distribution of the seismic network.
34
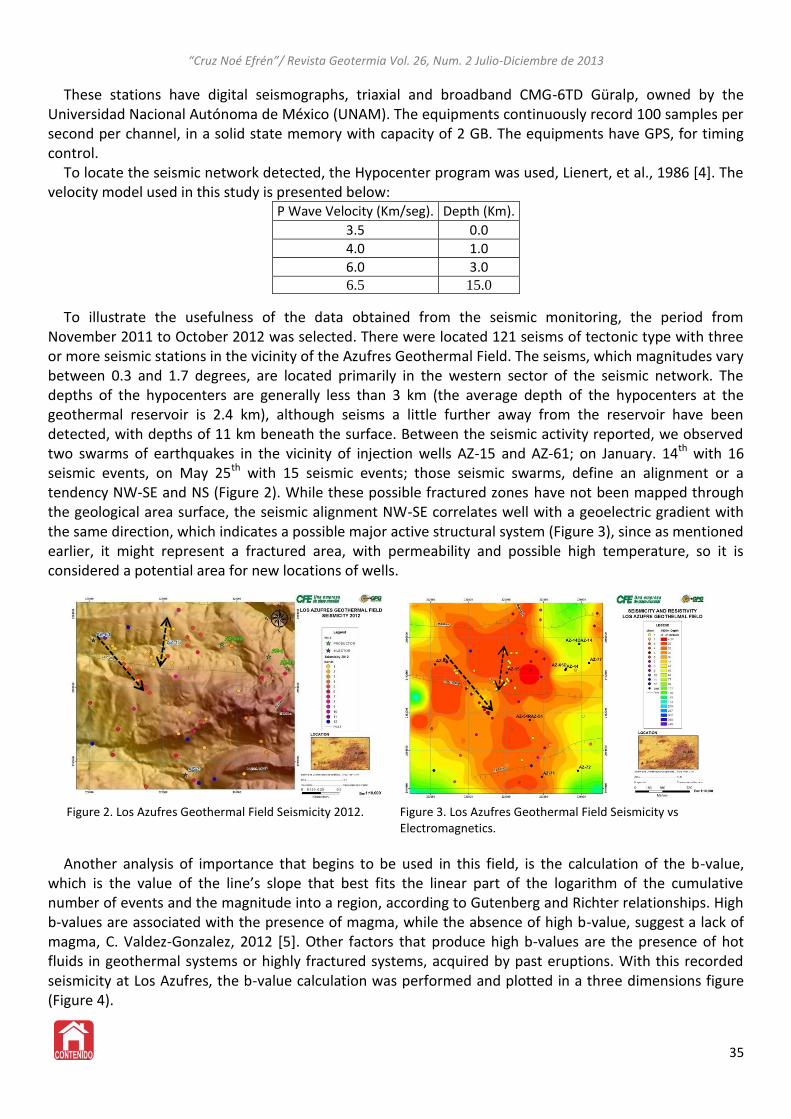
“Cruz Noé Efrén”/ Revista Geotermia Vol. 26, Num. 2 Julio-Diciembre de 2013
These stations have digital seismographs, triaxial and broadband CMG-6TD Güralp, owned by the Universidad Nacional Autónoma de México (UNAM). The equipments continuously record 100 samples per second per channel, in a solid state memory with capacity of 2 GB. The equipments have GPS, for timing control.
To locate the seismic network detected, the Hypocenter program was used, Lienert, et al., 1986 [4]. The velocity model used in this study is presented below:
P Wave Velocity (Km/seg). Depth (Km).
3.5 0.0
4.0 1.0
6.0 3.0 6.5 15.0
To illustrate the usefulness of the data obtained from the seismic monitoring, the period from November 2011 to October 2012 was selected. There were located 121 seisms of tectonic type with three or more seismic stations in the vicinity of the Azufres Geothermal Field. The seisms, which magnitudes vary between 0.3 and 1.7 degrees, are located primarily in the western sector of the seismic network. The depths of the hypocenters are generally less than 3 km (the average depth of the hypocenters at the geothermal reservoir is 2.4 km), although seisms a little further away from the reservoir have been detected, with depths of 11 km beneath the surface. Between the seismic activity reported, we observed two swarms of earthquakes in the vicinity of injection wells AZ-15 and AZ-61; on January. 14th with 16 seismic events, on May 25th with 15 seismic events; those seismic swarms, define an alignment or a tendency NW-SE and NS (Figure 2). While these possible fractured zones have not been mapped through the geological area surface, the seismic alignment NW-SE correlates well with a geoelectric gradient with the same direction, which indicates a possible major active structural system (Figure 3), since as mentioned earlier, it might represent a fractured area, with permeability and possible high temperature, so it is considered a potential area for new locations of wells.
Figure 2. Los Azufres Geothermal Field Seismicity 2012. Figure 3. Los Azufres Geothermal Field Seismicity vs
Electromagnetics.
Another analysis of importance that begins to be used in this field, is the calculation of the b-value, which is the value of the line’s slope that best fits the linear part of the logarithm of the cumulative number of events and the magnitude into a region, according to Gutenberg and Richter relationships. High b-values are associated with the presence of magma, while the absence of high b-value, suggest a lack of magma, C. Valdez-Gonzalez, 2012 [5]. Other factors that produce high b-values are the presence of hot fluids in geothermal systems or highly fractured systems, acquired by past eruptions. With this recorded seismicity at Los Azufres, the b-value calculation was performed and plotted in a three dimensions figure (Figure 4).
35
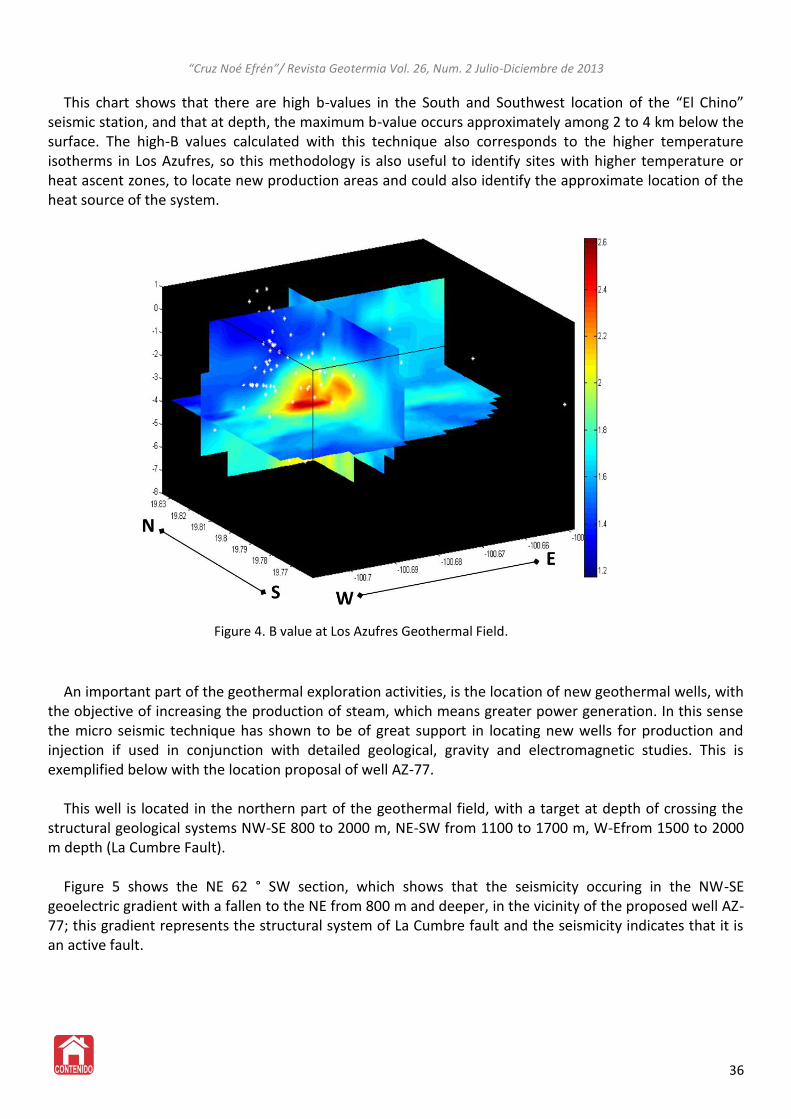
“Cruz Noé Efrén”/ Revista Geotermia Vol. 26, Num. 2 Julio-Diciembre de 2013
This chart shows that there are high b-values in the South and Southwest location of the “El Chino” seismic station, and that at depth, the maximum b-value occurs approximately among 2 to 4 km below the surface. The high-B values calculated with this technique also corresponds to the higher temperature isotherms in Los Azufres, so this methodology is also useful to identify sites with higher temperature or heat ascent zones, to locate new production areas and could also identify the approximate location of the heat source of the system.
Figure 4. B value at Los Azufres Geothermal Field.
An important part of the geothermal exploration activities, is the location of new geothermal wells, with
the objective of increasing the production of steam, which means greater power generation. In this sense the micro seismic technique has shown to be of great support in locating new wells for production and injection if used in conjunction with detailed geological, gravity and electromagnetic studies. This is exemplified below with the location proposal of well AZ-77.
This well is located in the northern part of the geothermal field, with a target at depth of crossing the
structural geological systems NW-SE 800 to 2000 m, NE-SW from 1100 to 1700 m, W-Efrom 1500 to 2000 m depth (La Cumbre Fault).
Figure 5 shows the NE 62 ° SW section, which shows that the seismicity occuring in the NW-SE
geoelectric gradient with a fallen to the NE from 800 m and deeper, in the vicinity of the proposed well AZ-77; this gradient represents the structural system of La Cumbre fault and the seismicity indicates that it is an active fault.
36
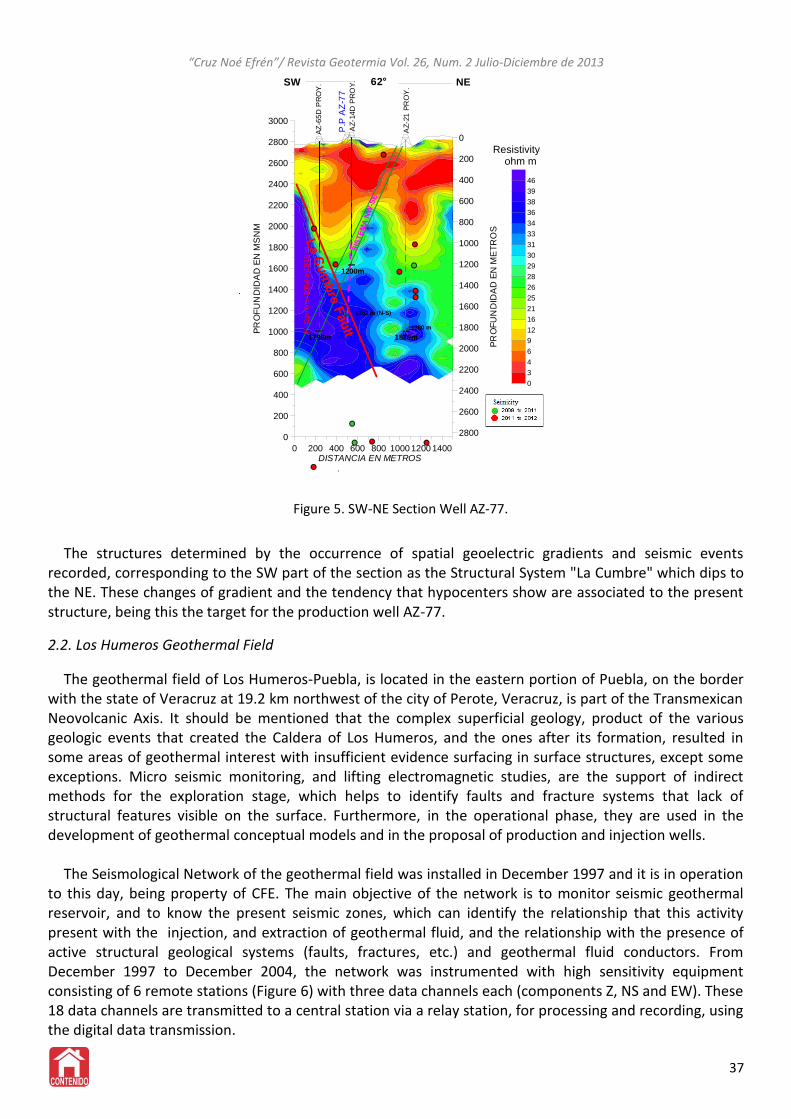
“Cruz Noé Efrén”/ Revista Geotermia Vol. 26, Num. 2 Julio-Diciembre de 2013
The structures determined by the occurrence of spatial geoelectric gradients and seismic events
recorded, corresponding to the SW part of the section as the Structural System "La Cumbre" which dips to the NE. These changes of gradient and the tendency that hypocenters show are associated to the present structure, being this the target for the production well AZ-77.
2.2. Los Humeros Geothermal Field The geothermal field of Los Humeros-Puebla, is located in the eastern portion of Puebla, on the border
with the state of Veracruz at 19.2 km northwest of the city of Perote, Veracruz, is part of the Transmexican Neovolcanic Axis. It should be mentioned that the complex superficial geology, product of the various geologic events that created the Caldera of Los Humeros, and the ones after its formation, resulted in some areas of geothermal interest with insufficient evidence surfacing in surface structures, except some exceptions. Micro seismic monitoring, and lifting electromagnetic studies, are the support of indirect methods for the exploration stage, which helps to identify faults and fracture systems that lack of structural features visible on the surface. Furthermore, in the operational phase, they are used in the development of geothermal conceptual models and in the proposal of production and injection wells.
The Seismological Network of the geothermal field was installed in December 1997 and it is in operation
to this day, being property of CFE. The main objective of the network is to monitor seismic geothermal reservoir, and to know the present seismic zones, which can identify the relationship that this activity present with the injection, and extraction of geothermal fluid, and the relationship with the presence of active structural geological systems (faults, fractures, etc.) and geothermal fluid conductors. From December 1997 to December 2004, the network was instrumented with high sensitivity equipment consisting of 6 remote stations (Figure 6) with three data channels each (components Z, NS and EW). These 18 data channels are transmitted to a central station via a relay station, for processing and recording, using the digital data transmission.
37
0
3
4
6
9
12
16
21
25
26
28
29
30
31
33
34
36
38
39
46
0 200 400 600 800 1000 1200 1400DISTANCIA EN METROS
0
200
400
600
800
1000
1200
1400
1600
1800
2000
2200
2400
2600
2800
3000
PR
OF
UN
DID
AD
EN
MS
NM
2800
2600
2400
2200
2000
1800
1600
1400
1200
1000
800
600
400
200
0
PR
OF
UN
DID
AD
EN
ME
TR
OS
1200m
AZ
-21
PR
OY
.
SW NE
.
.
1820m
AZ
-14
D P
RO
Y. 62°
1780 m
AZ
-65
D P
RO
Y.
1798m 1800mP
.P A
Z-7
7
1762 m (N-S)
F.
Cu
mb
re 1
05
4 a
18
10
m
Resistivity ohm m
Figure 5. SW-NE Section Well AZ-77.
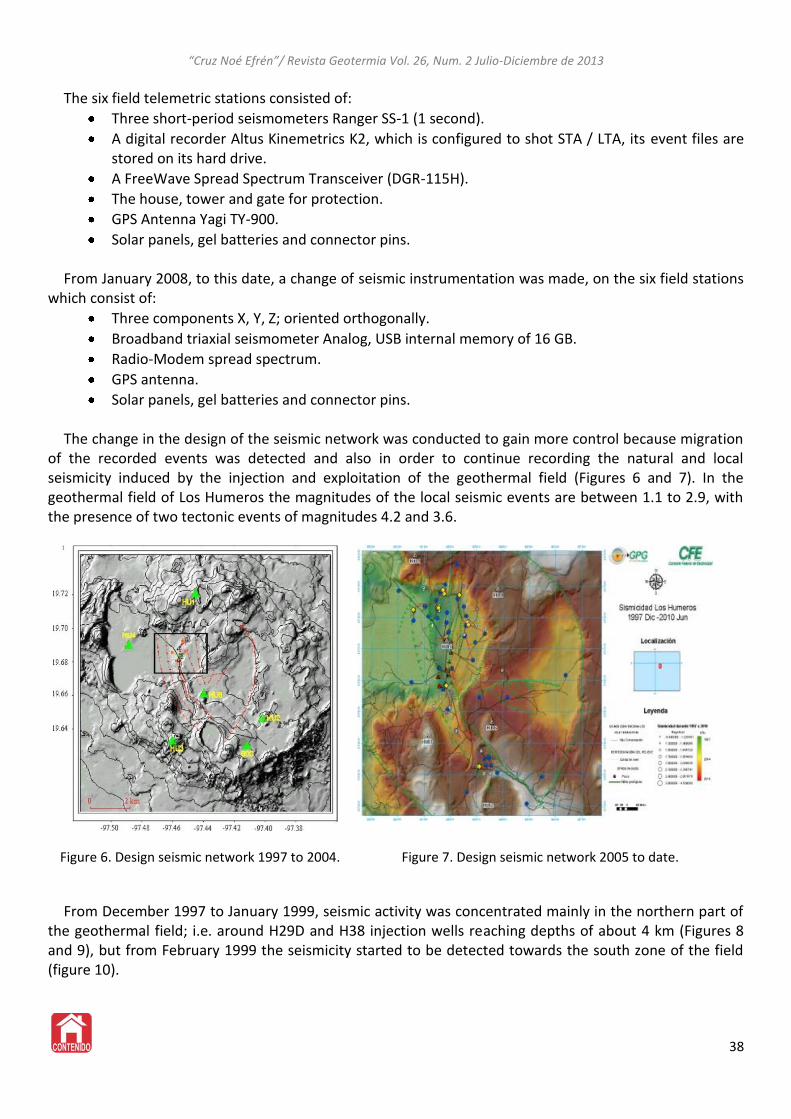
“Cruz Noé Efrén”/ Revista Geotermia Vol. 26, Num. 2 Julio-Diciembre de 2013
The six field telemetric stations consisted of:
Three short-period seismometers Ranger SS-1 (1 second).
A digital recorder Altus Kinemetrics K2, which is configured to shot STA / LTA, its event files are stored on its hard drive.
A FreeWave Spread Spectrum Transceiver (DGR-115H).
The house, tower and gate for protection.
GPS Antenna Yagi TY-900.
Solar panels, gel batteries and connector pins.
From January 2008, to this date, a change of seismic instrumentation was made, on the six field stations which consist of:
Three components X, Y, Z; oriented orthogonally.
Broadband triaxial seismometer Analog, USB internal memory of 16 GB.
Radio-Modem spread spectrum.
GPS antenna.
Solar panels, gel batteries and connector pins. The change in the design of the seismic network was conducted to gain more control because migration
of the recorded events was detected and also in order to continue recording the natural and local seismicity induced by the injection and exploitation of the geothermal field (Figures 6 and 7). In the geothermal field of Los Humeros the magnitudes of the local seismic events are between 1.1 to 2.9, with the presence of two tectonic events of magnitudes 4.2 and 3.6.
Figure 6. Design seismic network 1997 to 2004. Figure 7. Design seismic network 2005 to date.
From December 1997 to January 1999, seismic activity was concentrated mainly in the northern part of
the geothermal field; i.e. around H29D and H38 injection wells reaching depths of about 4 km (Figures 8 and 9), but from February 1999 the seismicity started to be detected towards the south zone of the field (figure 10).
38
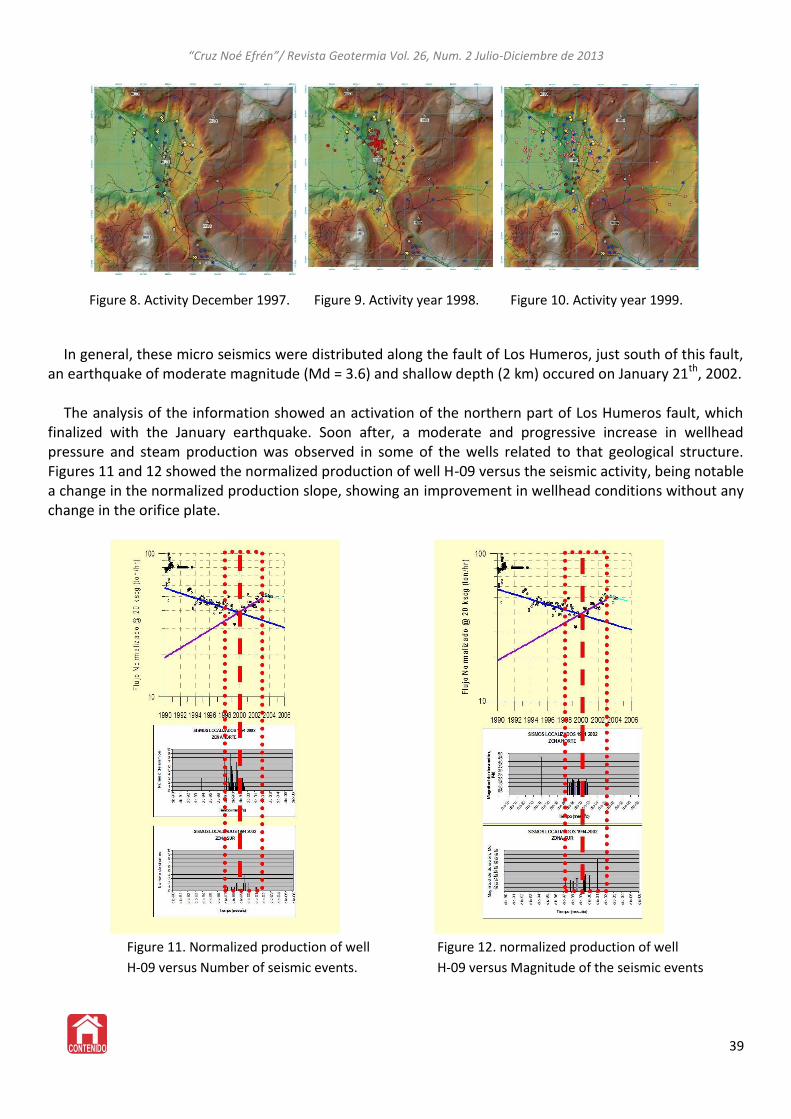
“Cruz Noé Efrén”/ Revista Geotermia Vol. 26, Num. 2 Julio-Diciembre de 2013
Figure 8. Activity December 1997. Figure 9. Activity year 1998. Figure 10. Activity year 1999.
In general, these micro seismics were distributed along the fault of Los Humeros, just south of this fault,
an earthquake of moderate magnitude (Md = 3.6) and shallow depth (2 km) occured on January 21th, 2002. The analysis of the information showed an activation of the northern part of Los Humeros fault, which
finalized with the January earthquake. Soon after, a moderate and progressive increase in wellhead pressure and steam production was observed in some of the wells related to that geological structure. Figures 11 and 12 showed the normalized production of well H-09 versus the seismic activity, being notable a change in the normalized production slope, showing an improvement in wellhead conditions without any change in the orifice plate.
Figure 11. Normalized production of well
H-09 versus Number of seismic events.
Figure 12. normalized production of well
H-09 versus Magnitude of the seismic events
39
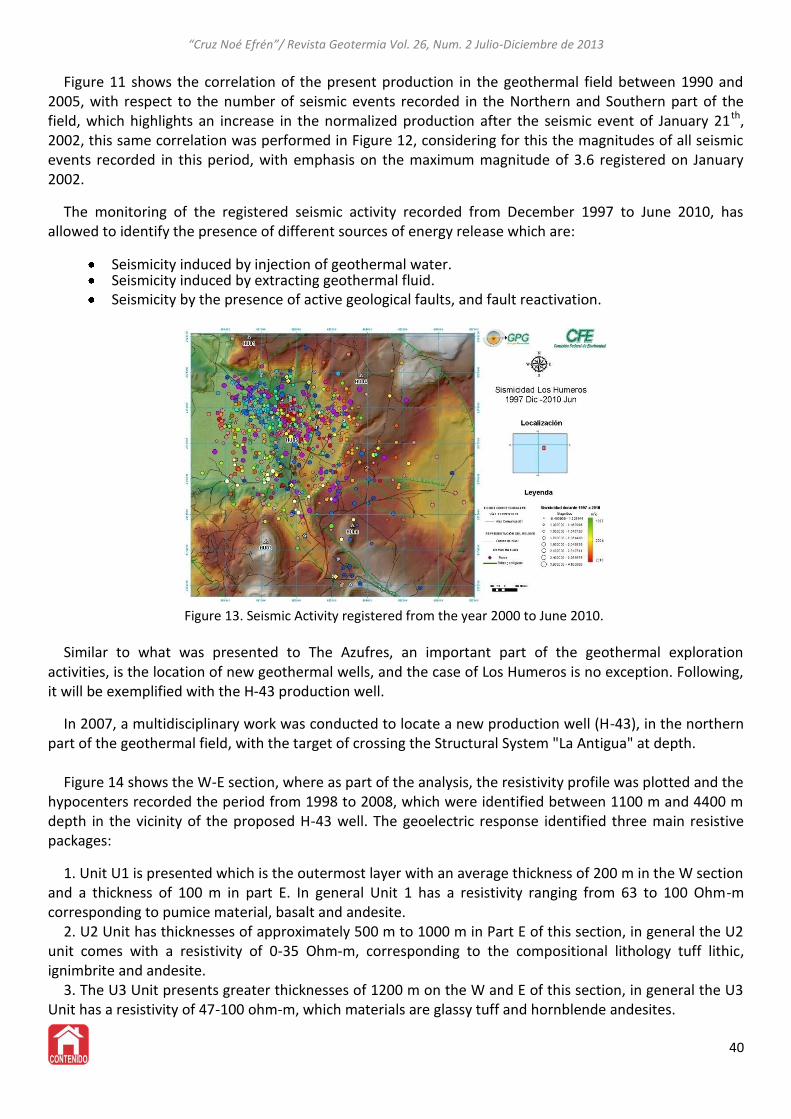
“Cruz Noé Efrén”/ Revista Geotermia Vol. 26, Num. 2 Julio-Diciembre de 2013
Figure 11 shows the correlation of the present production in the geothermal field between 1990 and
2005, with respect to the number of seismic events recorded in the Northern and Southern part of the field, which highlights an increase in the normalized production after the seismic event of January 21th, 2002, this same correlation was performed in Figure 12, considering for this the magnitudes of all seismic events recorded in this period, with emphasis on the maximum magnitude of 3.6 registered on January 2002.
The monitoring of the registered seismic activity recorded from December 1997 to June 2010, has allowed to identify the presence of different sources of energy release which are:
Seismicity induced by injection of geothermal water. Seismicity induced by extracting geothermal fluid. Seismicity by the presence of active geological faults, and fault reactivation.
Figure 13. Seismic Activity registered from the year 2000 to June 2010.
Similar to what was presented to The Azufres, an important part of the geothermal exploration activities, is the location of new geothermal wells, and the case of Los Humeros is no exception. Following, it will be exemplified with the H-43 production well.
In 2007, a multidisciplinary work was conducted to locate a new production well (H-43), in the northern part of the geothermal field, with the target of crossing the Structural System "La Antigua" at depth.
Figure 14 shows the W-E section, where as part of the analysis, the resistivity profile was plotted and the
hypocenters recorded the period from 1998 to 2008, which were identified between 1100 m and 4400 m depth in the vicinity of the proposed H-43 well. The geoelectric response identified three main resistive packages:
1. Unit U1 is presented which is the outermost layer with an average thickness of 200 m in the W section and a thickness of 100 m in part E. In general Unit 1 has a resistivity ranging from 63 to 100 Ohm-m corresponding to pumice material, basalt and andesite.
2. U2 Unit has thicknesses of approximately 500 m to 1000 m in Part E of this section, in general the U2 unit comes with a resistivity of 0-35 Ohm-m, corresponding to the compositional lithology tuff lithic, ignimbrite and andesite.
3. The U3 Unit presents greater thicknesses of 1200 m on the W and E of this section, in general the U3 Unit has a resistivity of 47-100 ohm-m, which materials are glassy tuff and hornblende andesites.
40
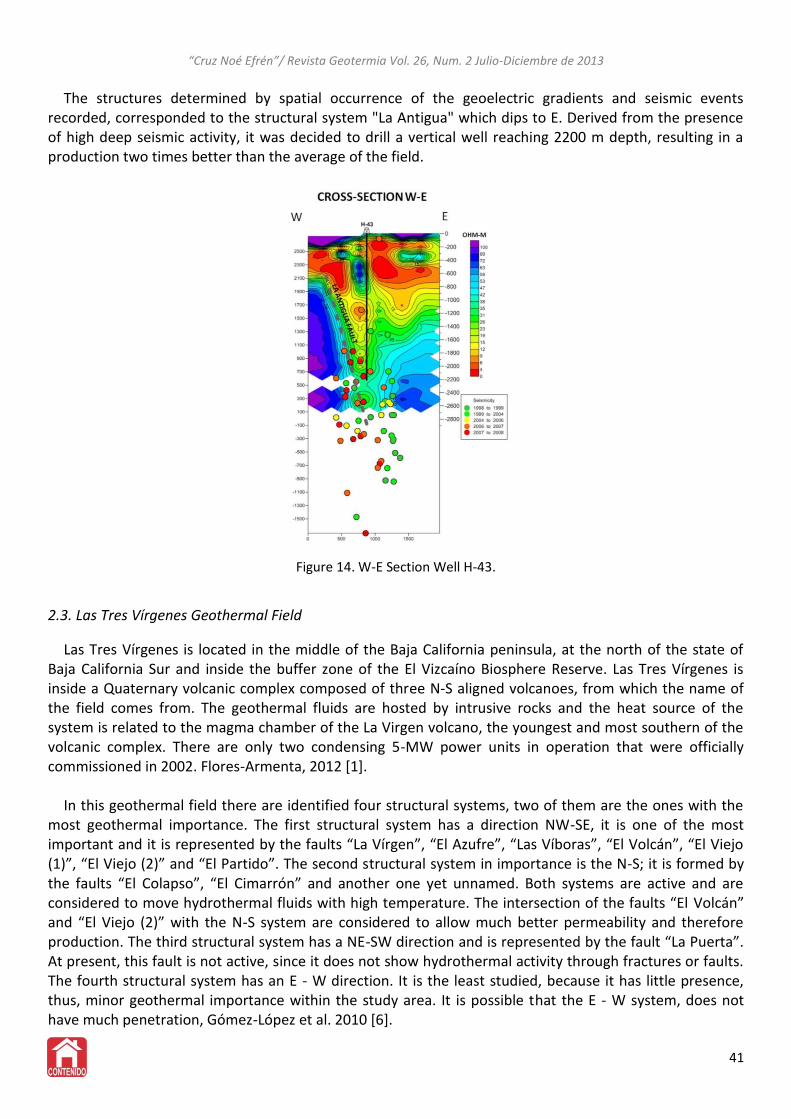
“Cruz Noé Efrén”/ Revista Geotermia Vol. 26, Num. 2 Julio-Diciembre de 2013
The structures determined by spatial occurrence of the geoelectric gradients and seismic events
recorded, corresponded to the structural system "La Antigua" which dips to E. Derived from the presence of high deep seismic activity, it was decided to drill a vertical well reaching 2200 m depth, resulting in a production two times better than the average of the field.
Figure 14. W-E Section Well H-43.
2.3. Las Tres Vírgenes Geothermal Field
Las Tres Vírgenes is located in the middle of the Baja California peninsula, at the north of the state of Baja California Sur and inside the buffer zone of the El Vizcaíno Biosphere Reserve. Las Tres Vírgenes is inside a Quaternary volcanic complex composed of three N-S aligned volcanoes, from which the name of the field comes from. The geothermal fluids are hosted by intrusive rocks and the heat source of the system is related to the magma chamber of the La Virgen volcano, the youngest and most southern of the volcanic complex. There are only two condensing 5-MW power units in operation that were officially commissioned in 2002. Flores-Armenta, 2012 [1].
In this geothermal field there are identified four structural systems, two of them are the ones with the
most geothermal importance. The first structural system has a direction NW-SE, it is one of the most important and it is represented by the faults “La Vírgen”, “El Azufre”, “Las Víboras”, “El Volcán”, “El Viejo (1)”, “El Viejo (2)” and “El Partido”. The second structural system in importance is the N-S; it is formed by the faults “El Colapso”, “El Cimarrón” and another one yet unnamed. Both systems are active and are considered to move hydrothermal fluids with high temperature. The intersection of the faults “El Volcán” and “El Viejo (2)” with the N-S system are considered to allow much better permeability and therefore production. The third structural system has a NE-SW direction and is represented by the fault “La Puerta”. At present, this fault is not active, since it does not show hydrothermal activity through fractures or faults. The fourth structural system has an E - W direction. It is the least studied, because it has little presence, thus, minor geothermal importance within the study area. It is possible that the E - W system, does not have much penetration, Gómez-López et al. 2010 [6].
41
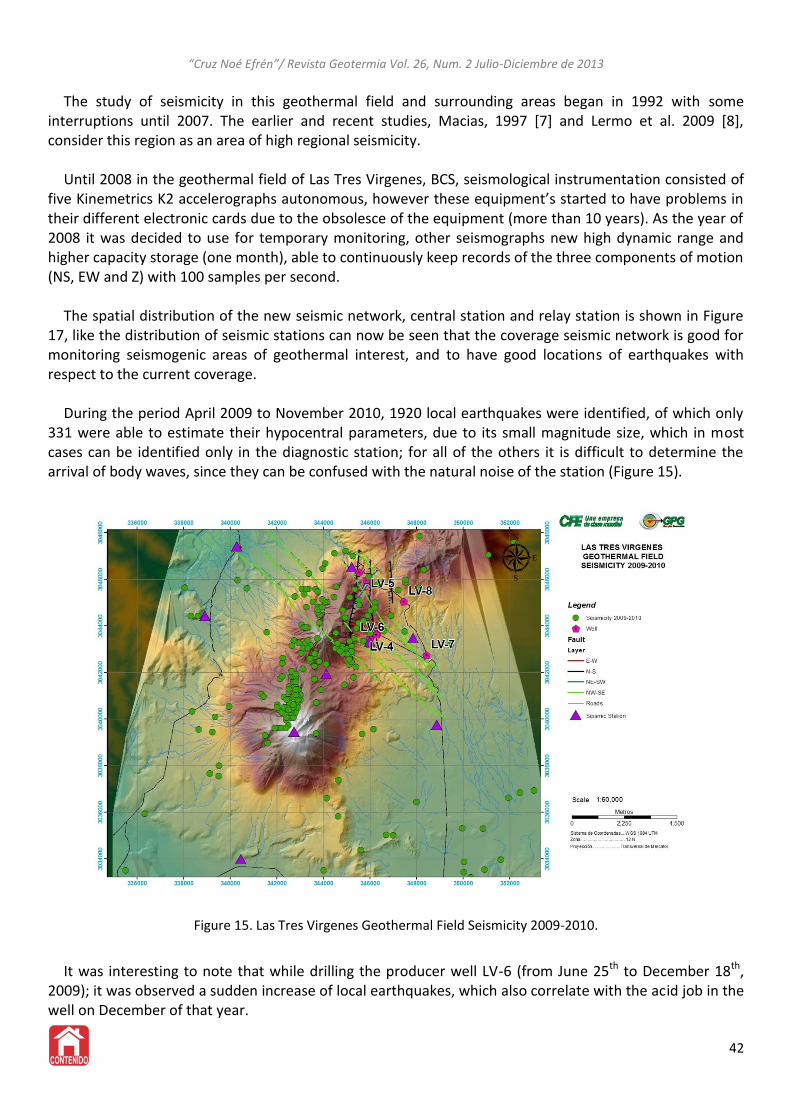
“Cruz Noé Efrén”/ Revista Geotermia Vol. 26, Num. 2 Julio-Diciembre de 2013
The study of seismicity in this geothermal field and surrounding areas began in 1992 with some
interruptions until 2007. The earlier and recent studies, Macias, 1997 [7] and Lermo et al. 2009 [8], consider this region as an area of high regional seismicity.
Until 2008 in the geothermal field of Las Tres Virgenes, BCS, seismological instrumentation consisted of
five Kinemetrics K2 accelerographs autonomous, however these equipment’s started to have problems in their different electronic cards due to the obsolesce of the equipment (more than 10 years). As the year of 2008 it was decided to use for temporary monitoring, other seismographs new high dynamic range and higher capacity storage (one month), able to continuously keep records of the three components of motion (NS, EW and Z) with 100 samples per second.
The spatial distribution of the new seismic network, central station and relay station is shown in Figure
17, like the distribution of seismic stations can now be seen that the coverage seismic network is good for monitoring seismogenic areas of geothermal interest, and to have good locations of earthquakes with respect to the current coverage.
During the period April 2009 to November 2010, 1920 local earthquakes were identified, of which only
331 were able to estimate their hypocentral parameters, due to its small magnitude size, which in most cases can be identified only in the diagnostic station; for all of the others it is difficult to determine the arrival of body waves, since they can be confused with the natural noise of the station (Figure 15).
It was interesting to note that while drilling the producer well LV-6 (from June 25th to December 18th,
2009); it was observed a sudden increase of local earthquakes, which also correlate with the acid job in the well on December of that year.
42
Figure 15. Las Tres Virgenes Geothermal Field Seismicity 2009-2010.
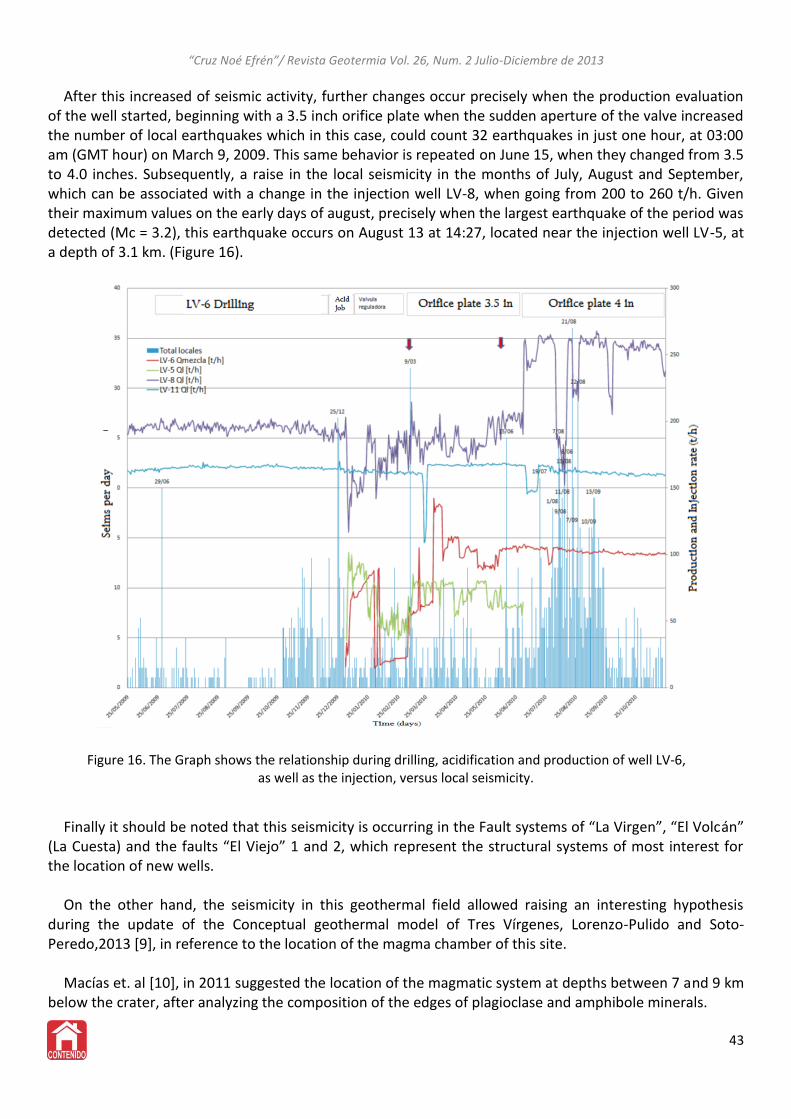
“Cruz Noé Efrén”/ Revista Geotermia Vol. 26, Num. 2 Julio-Diciembre de 2013
After this increased of seismic activity, further changes occur precisely when the production evaluation of the well started, beginning with a 3.5 inch orifice plate when the sudden aperture of the valve increased the number of local earthquakes which in this case, could count 32 earthquakes in just one hour, at 03:00 am (GMT hour) on March 9, 2009. This same behavior is repeated on June 15, when they changed from 3.5 to 4.0 inches. Subsequently, a raise in the local seismicity in the months of July, August and September, which can be associated with a change in the injection well LV-8, when going from 200 to 260 t/h. Given their maximum values on the early days of august, precisely when the largest earthquake of the period was detected (Mc = 3.2), this earthquake occurs on August 13 at 14:27, located near the injection well LV-5, at a depth of 3.1 km. (Figure 16).
Finally it should be noted that this seismicity is occurring in the Fault systems of “La Virgen”, “El Volcán” (La Cuesta) and the faults “El Viejo” 1 and 2, which represent the structural systems of most interest for the location of new wells.
On the other hand, the seismicity in this geothermal field allowed raising an interesting hypothesis
during the update of the Conceptual geothermal model of Tres Vírgenes, Lorenzo-Pulido and Soto-Peredo,2013 [9], in reference to the location of the magma chamber of this site.
Macías et. al [10], in 2011 suggested the location of the magmatic system at depths between 7 and 9 km
below the crater, after analyzing the composition of the edges of plagioclase and amphibole minerals.
43
Figure 16. The Graph shows the relationship during drilling, acidification and production of well LV-6, as well as the injection, versus local seismicity.
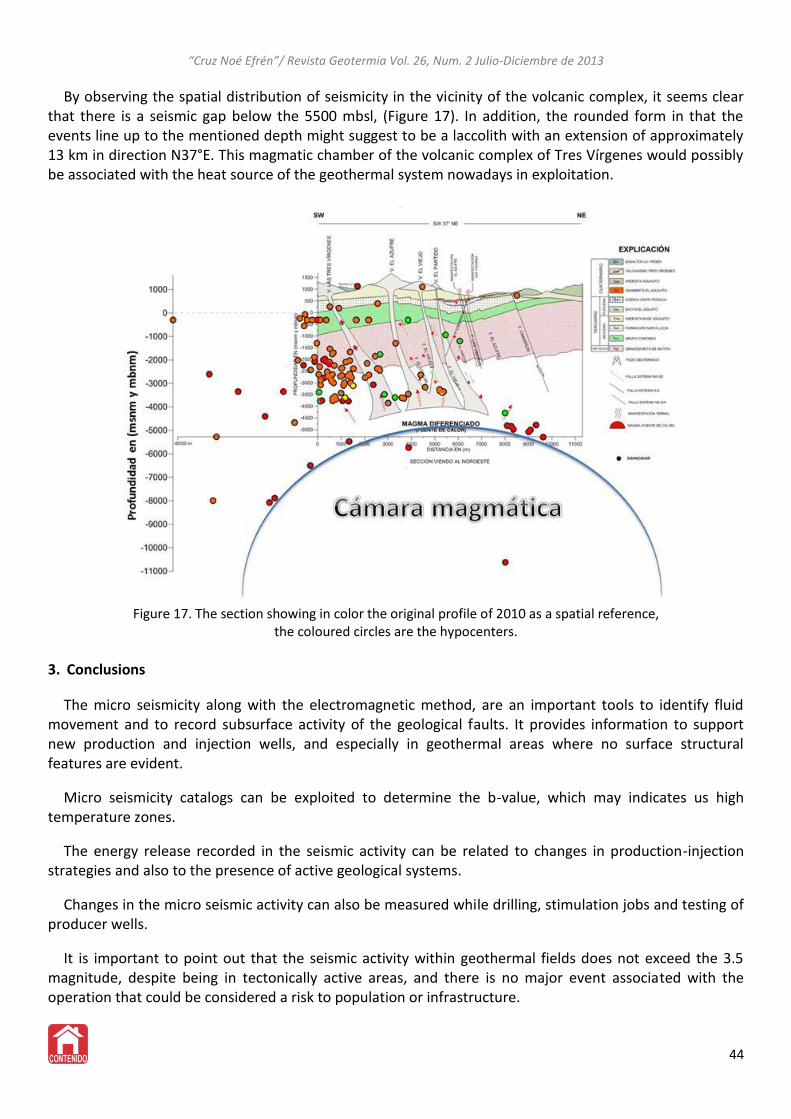
“Cruz Noé Efrén”/ Revista Geotermia Vol. 26, Num. 2 Julio-Diciembre de 2013
By observing the spatial distribution of seismicity in the vicinity of the volcanic complex, it seems clear that there is a seismic gap below the 5500 mbsl, (Figure 17). In addition, the rounded form in that the events line up to the mentioned depth might suggest to be a laccolith with an extension of approximately 13 km in direction N37°E. This magmatic chamber of the volcanic complex of Tres Vírgenes would possibly be associated with the heat source of the geothermal system nowadays in exploitation.
3. Conclusions
The micro seismicity along with the electromagnetic method, are an important tools to identify fluid movement and to record subsurface activity of the geological faults. It provides information to support new production and injection wells, and especially in geothermal areas where no surface structural features are evident.
Micro seismicity catalogs can be exploited to determine the b-value, which may indicates us high temperature zones.
The energy release recorded in the seismic activity can be related to changes in production-injection strategies and also to the presence of active geological systems.
Changes in the micro seismic activity can also be measured while drilling, stimulation jobs and testing of producer wells.
It is important to point out that the seismic activity within geothermal fields does not exceed the 3.5 magnitude, despite being in tectonically active areas, and there is no major event associated with the operation that could be considered a risk to population or infrastructure.
44
Figure 17. The section showing in color the original profile of 2010 as a spatial reference,
the coloured circles are the hypocenters.
“Cruz Noé Efrén”/ Revista Geotermia Vol. 26, Num. 2 Julio-Diciembre de 2013
References [1]Flores-Armenta, M. Geothermal Activity and Development in Mexico – Keeping the production going; 2012. [2]Gerencia de Proyectos Geotermoeléctricos, Tablero de control de la Gerencia de Proyectos Geotermoeléctricos;
2013 [3] Pérez-Esquivias, H. Modelo conceptual del Campo Geotérmico de Los Azufres,Michoacan; 2001. [4]Barry R. Lienert, E. Berg and L. Neil Frazer: HYPOCENTER: An earthquake location method using centered, scaled,
and adaptively damped least squares; 1986.
[5] Valdez-González, C. Estudio de Sísmica Pasivap período 2012 en el Campo Geotérmico Los Azufres; 2012. [6] Gómez-Lopez J., Pulido-Arreola, S.,Soto-Peredo, J., Sandoval-Medina, F. Actualización del Modelo Geotérmico de
las Tres Vírgenes; 2010 [7]Macías, M.Analisis de los datos sismicos en el Campo Geotérmico Las Tres Virgenes, B.C.S. 1997. [8] Lermo-Samaniego, J., Cruz-Noe, E., Hernández-Lagunas, P., Nuñez, F., Urban, E., and Espitia, G. Estudio de sismica
pasiva en el Campo Geotérmico Las Tres Virgenes, B.C.S. 2009. [9]Lorenzo-Pulido, C. y Soto-Peredo, J.Sismicidad en el Complejo Volcánico de Las Tres. Geotermia, Vol. 26, No.1,
Enero-Junio de 2013, p. 27 – 36
[10] Macías-Vázquez, J.L.,Arce-Saldaña J. L., Garduño-Monroy, V. H., Ramón-Avellán, D., García-Sánchez, L., Reyes-Agustín, G., Rangel E., Saucedo-Girón R., Cisneros-Máximo, G., Navarrete,J. A.Estudio de estratigrafía y geología del Complejo Volcánico Las Tres Vírgenes B.C.S. 2012
45
CENTRAL SOLAR FOTOVOLTAICA SANTA ROSALIA 1 MW Primer Año de Operación
Cadenas Tovar Robertoa, Sánchez Cornejo Carlosa, Zapata López Angel Antonioa*
a"Alejandro Volta 655, Col. Electricistas, Morelia, Michoacán. C.P. 58290, México"
[email protected] [email protected]
Resumen
La Comisión Federal de Electricidad (CFE) con el propósito de contribuir a diversificar las fuentes primarias de generación de electricidad para el servicio público y de fomentar el aprovechamiento de fuentes renovables de energía tanto ambientalmente sustentables como socialmente aceptables, puso en operación comercial el 28 de abril del 2012 la Central Solar Fotovoltaica Piloto de 1 MW en Santa Rosalía, BCS, primera central fotovoltaica en México conectada a la red eléctrica para el servicio público. Dicha Central forma parte de un sistema eléctrico aislado único en el país, en donde la energía geotérmica y ahora la solar, proporcionan más del 74% de la electricidad total consumida anualmente.
Palabras Clave: Sustentable; Renovable; Fotovoltaica; Geotérmia; Comisión Federal de Electricidad.
Abstract
In order to promote the diversification of the energy sources on the national grid, and the use of alternate energy sources, the Mexican Utility CFE completed the construction of the Pilot Photovoltaic Plant of 1 MW in Santa Rosalía BCS on April 2012. This is the first grid connected solar photovoltaic plant in the Mexican grid exclusively for public service. This PV plant is part of the isolated grid of Santa Rosalía, where a geothermal plant of 10 MW and now the photovoltaic plant, produce more than 74% of the total yearly consumed energy. Keywords: Sustainable; Renewable; Photovoltaic; Geothermal; Mexican Utility.
1. Introducción Con el propósito de contribuir a diversificar las fuentes primarias de generación de electricidad para el
servicio público y a fomentar el aprovechamiento de fuentes renovables de energía, la Comisión Federal de Electricidad (CFE) por medio de la Gerencia de Proyectos Geotermoeléctricos (GPG), llevó a cabo en el 2011, la construcción de la primera central fotovoltaica de 1 MW en las cercanías de la población de Santa Rosalía, BCS. Sitio que se ubica dentro de una de las mejores regiones con altos niveles de incidencia de radiación solar en México.
Santa Rosalía es la cabecera municipal de uno de los 5 municipios del estado de Baja California Sur,
Mulegé, el cual cuenta con una población total de 59 114 habitantes en una extensión territorial de 32 000 km2. Santa Rosalía es la segunda localidad más poblada del municipio con 11 765 habitantes [1] y sus principales actividades económicas son la minería y la pesca.
La Central Geotermoeléctrica de Las Tres Vírgenes (CGTV) y la Central Solar Fotovoltaica Piloto de 1 MW
(CFS) generaron aproximadamente el 75% de la electricidad total consumida por el sistema de Santa Rosalía en su primer año de operación conjunta.
El objetivo del presente artículo es el describir los resultados obtenidos en el primer año de operación
de la CFS (Abril 2012-Abril 2013) y su impacto en el sistema eléctrico de Santa Rosalía.
46
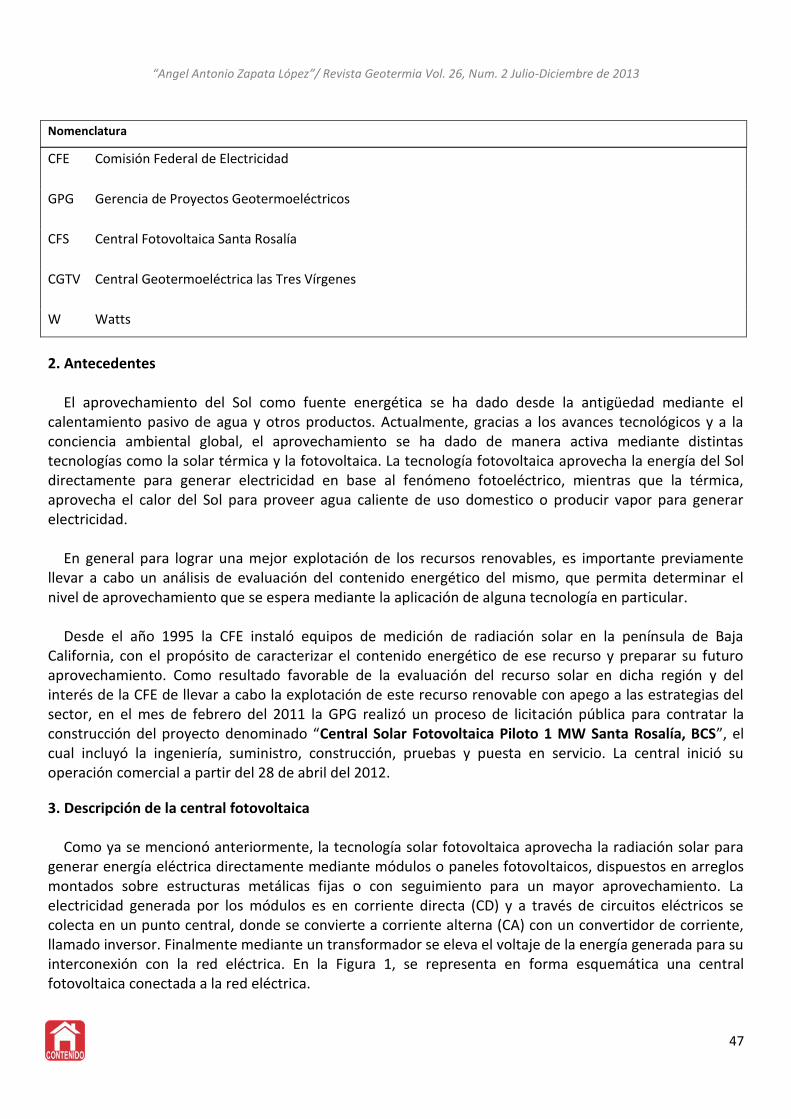
“Angel Antonio Zapata López”/ Revista Geotermia Vol. 26, Num. 2 Julio-Diciembre de 2013
Nomenclatura
CFE Comisión Federal de Electricidad
GPG Gerencia de Proyectos Geotermoeléctricos
CFS Central Fotovoltaica Santa Rosalía
CGTV Central Geotermoeléctrica las Tres Vírgenes
W Watts
2. Antecedentes El aprovechamiento del Sol como fuente energética se ha dado desde la antigüedad mediante el
calentamiento pasivo de agua y otros productos. Actualmente, gracias a los avances tecnológicos y a la conciencia ambiental global, el aprovechamiento se ha dado de manera activa mediante distintas tecnologías como la solar térmica y la fotovoltaica. La tecnología fotovoltaica aprovecha la energía del Sol directamente para generar electricidad en base al fenómeno fotoeléctrico, mientras que la térmica, aprovecha el calor del Sol para proveer agua caliente de uso domestico o producir vapor para generar electricidad.
En general para lograr una mejor explotación de los recursos renovables, es importante previamente
llevar a cabo un análisis de evaluación del contenido energético del mismo, que permita determinar el nivel de aprovechamiento que se espera mediante la aplicación de alguna tecnología en particular.
Desde el año 1995 la CFE instaló equipos de medición de radiación solar en la península de Baja
California, con el propósito de caracterizar el contenido energético de ese recurso y preparar su futuro aprovechamiento. Como resultado favorable de la evaluación del recurso solar en dicha región y del interés de la CFE de llevar a cabo la explotación de este recurso renovable con apego a las estrategias del sector, en el mes de febrero del 2011 la GPG realizó un proceso de licitación pública para contratar la construcción del proyecto denominado “Central Solar Fotovoltaica Piloto 1 MW Santa Rosalía, BCS”, el cual incluyó la ingeniería, suministro, construcción, pruebas y puesta en servicio. La central inició su operación comercial a partir del 28 de abril del 2012.
3. Descripción de la central fotovoltaica Como ya se mencionó anteriormente, la tecnología solar fotovoltaica aprovecha la radiación solar para
generar energía eléctrica directamente mediante módulos o paneles fotovoltaicos, dispuestos en arreglos montados sobre estructuras metálicas fijas o con seguimiento para un mayor aprovechamiento. La electricidad generada por los módulos es en corriente directa (CD) y a través de circuitos eléctricos se colecta en un punto central, donde se convierte a corriente alterna (CA) con un convertidor de corriente, llamado inversor. Finalmente mediante un transformador se eleva el voltaje de la energía generada para su interconexión con la red eléctrica. En la Figura 1, se representa en forma esquemática una central fotovoltaica conectada a la red eléctrica.
47
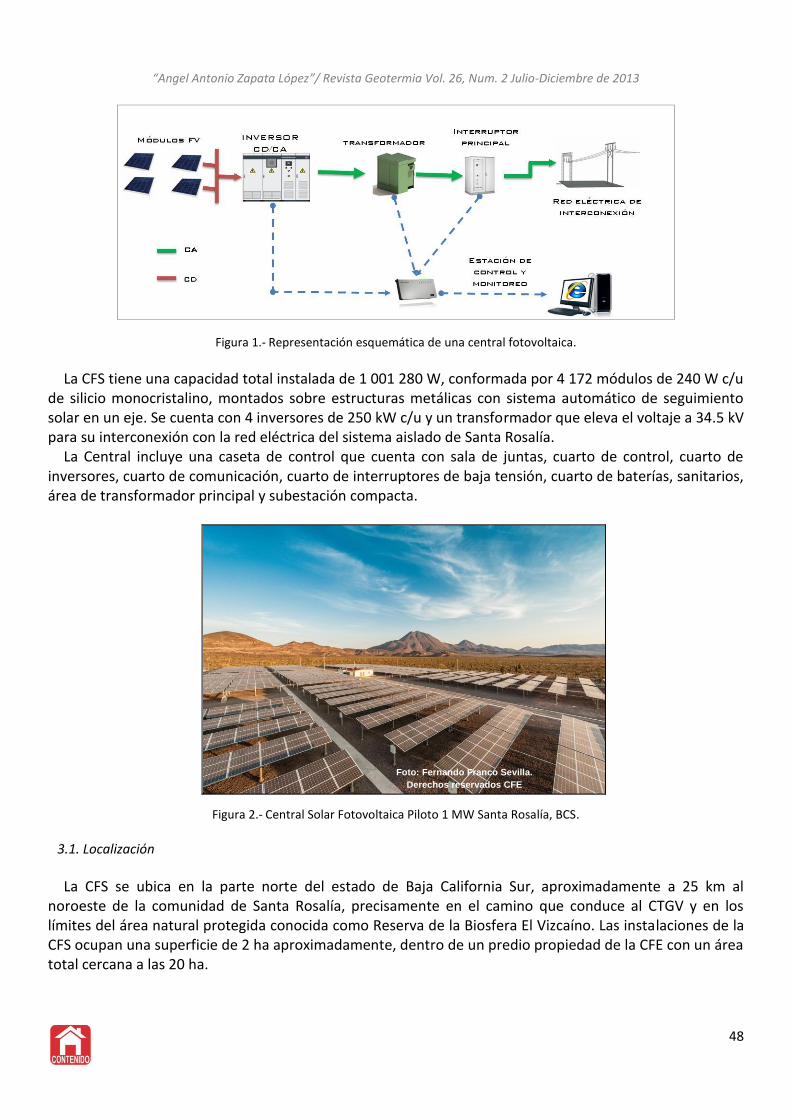
“Angel Antonio Zapata López”/ Revista Geotermia Vol. 26, Num. 2 Julio-Diciembre de 2013
Figura 1.- Representación esquemática de una central fotovoltaica.
La CFS tiene una capacidad total instalada de 1 001 280 W, conformada por 4 172 módulos de 240 W c/u
de silicio monocristalino, montados sobre estructuras metálicas con sistema automático de seguimiento solar en un eje. Se cuenta con 4 inversores de 250 kW c/u y un transformador que eleva el voltaje a 34.5 kV para su interconexión con la red eléctrica del sistema aislado de Santa Rosalía.
La Central incluye una caseta de control que cuenta con sala de juntas, cuarto de control, cuarto de inversores, cuarto de comunicación, cuarto de interruptores de baja tensión, cuarto de baterías, sanitarios, área de transformador principal y subestación compacta.
Figura 2.- Central Solar Fotovoltaica Piloto 1 MW Santa Rosalía, BCS.
3.1. Localización La CFS se ubica en la parte norte del estado de Baja California Sur, aproximadamente a 25 km al
noroeste de la comunidad de Santa Rosalía, precisamente en el camino que conduce al CTGV y en los límites del área natural protegida conocida como Reserva de la Biosfera El Vizcaíno. Las instalaciones de la CFS ocupan una superficie de 2 ha aproximadamente, dentro de un predio propiedad de la CFE con un área total cercana a las 20 ha.
48
Foto: Fernando Franco Sevilla.
Derechos reservados CFE
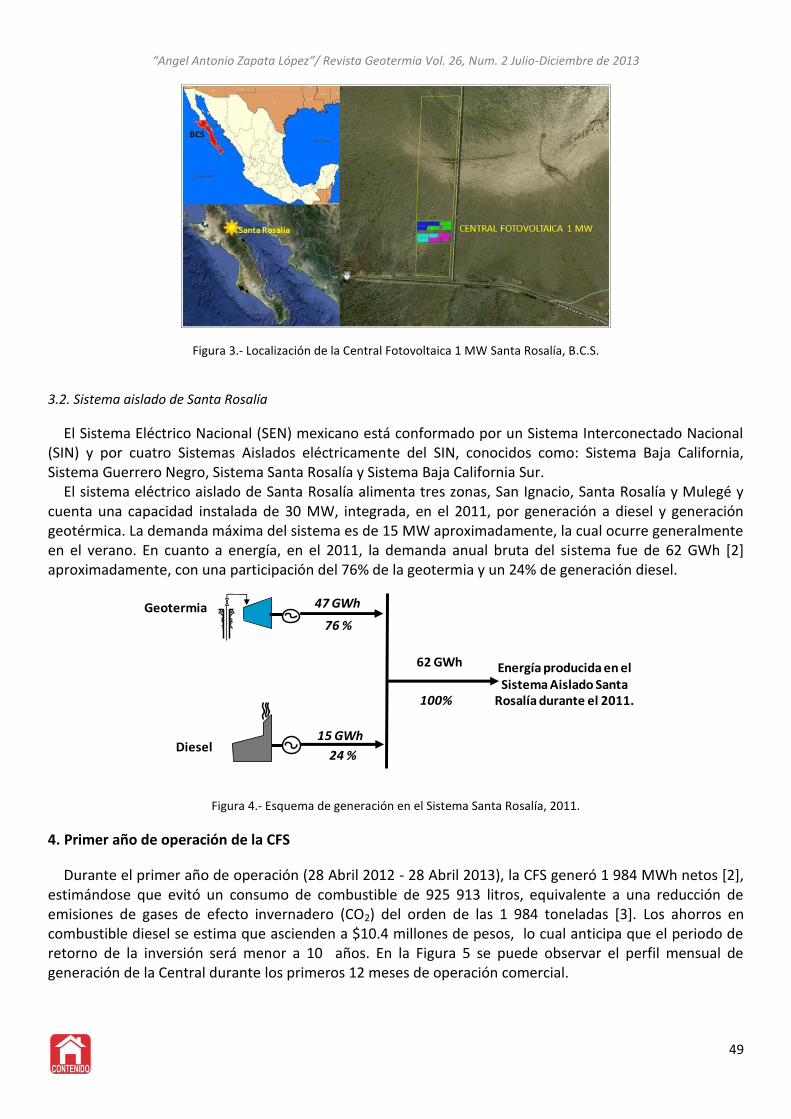
“Angel Antonio Zapata López”/ Revista Geotermia Vol. 26, Num. 2 Julio-Diciembre de 2013
Figura 3.- Localización de la Central Fotovoltaica 1 MW Santa Rosalía, B.C.S.
3.2. Sistema aislado de Santa Rosalía El Sistema Eléctrico Nacional (SEN) mexicano está conformado por un Sistema Interconectado Nacional
(SIN) y por cuatro Sistemas Aislados eléctricamente del SIN, conocidos como: Sistema Baja California, Sistema Guerrero Negro, Sistema Santa Rosalía y Sistema Baja California Sur.
El sistema eléctrico aislado de Santa Rosalía alimenta tres zonas, San Ignacio, Santa Rosalía y Mulegé y cuenta una capacidad instalada de 30 MW, integrada, en el 2011, por generación a diesel y generación geotérmica. La demanda máxima del sistema es de 15 MW aproximadamente, la cual ocurre generalmente en el verano. En cuanto a energía, en el 2011, la demanda anual bruta del sistema fue de 62 GWh [2] aproximadamente, con una participación del 76% de la geotermia y un 24% de generación diesel.
15 GWh
24 %Diesel
Geotermia
76 %
47 GWh
62 GWh
100%
Energía producida en el Sistema Aislado Santa
Rosalía durante el 2011.
Figura 4.- Esquema de generación en el Sistema Santa Rosalía, 2011.
4. Primer año de operación de la CFS Durante el primer año de operación (28 Abril 2012 - 28 Abril 2013), la CFS generó 1 984 MWh netos [2],
estimándose que evitó un consumo de combustible de 925 913 litros, equivalente a una reducción de emisiones de gases de efecto invernadero (CO2) del orden de las 1 984 toneladas [3]. Los ahorros en combustible diesel se estima que ascienden a $10.4 millones de pesos, lo cual anticipa que el periodo de retorno de la inversión será menor a 10 años. En la Figura 5 se puede observar el perfil mensual de generación de la Central durante los primeros 12 meses de operación comercial.
49
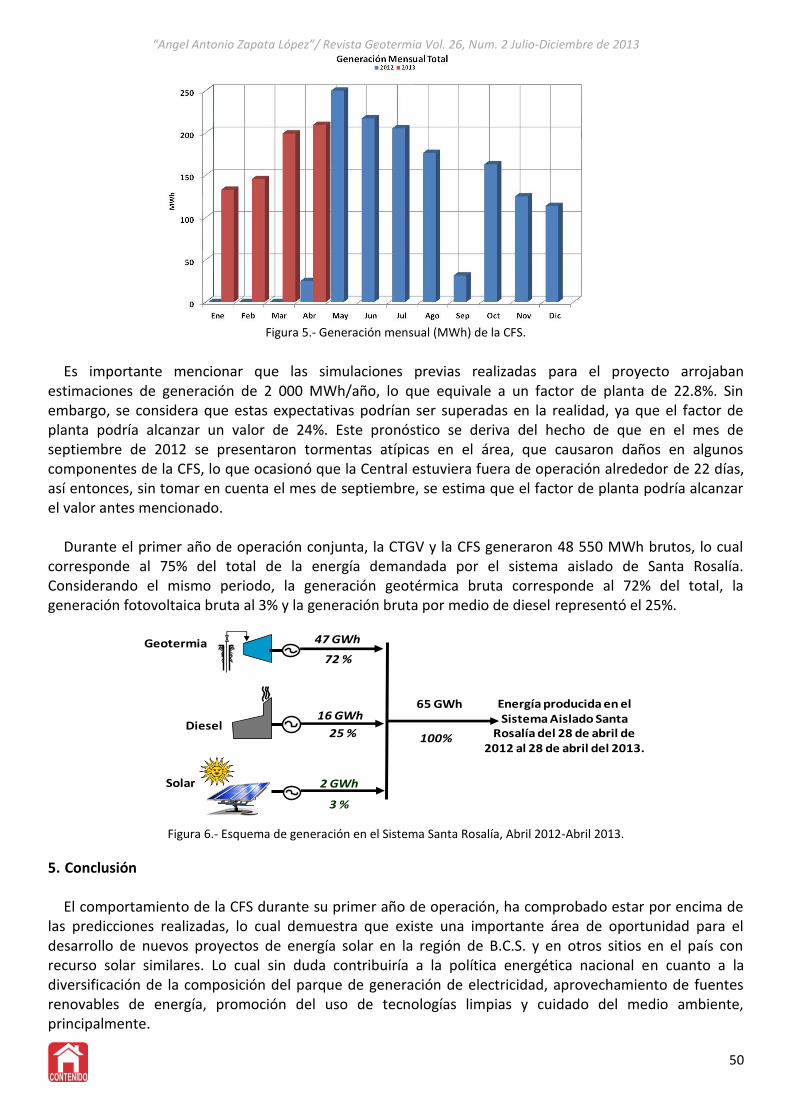
“Angel Antonio Zapata López”/ Revista Geotermia Vol. 26, Num. 2 Julio-Diciembre de 2013
Figura 5.- Generación mensual (MWh) de la CFS.
Es importante mencionar que las simulaciones previas realizadas para el proyecto arrojaban estimaciones de generación de 2 000 MWh/año, lo que equivale a un factor de planta de 22.8%. Sin embargo, se considera que estas expectativas podrían ser superadas en la realidad, ya que el factor de planta podría alcanzar un valor de 24%. Este pronóstico se deriva del hecho de que en el mes de septiembre de 2012 se presentaron tormentas atípicas en el área, que causaron daños en algunos componentes de la CFS, lo que ocasionó que la Central estuviera fuera de operación alrededor de 22 días, así entonces, sin tomar en cuenta el mes de septiembre, se estima que el factor de planta podría alcanzar el valor antes mencionado.
Durante el primer año de operación conjunta, la CTGV y la CFS generaron 48 550 MWh brutos, lo cual
corresponde al 75% del total de la energía demandada por el sistema aislado de Santa Rosalía. Considerando el mismo periodo, la generación geotérmica bruta corresponde al 72% del total, la generación fotovoltaica bruta al 3% y la generación bruta por medio de diesel representó el 25%.
16 GWh
25 %Diesel
Geotermia
72 %
47 GWh
65 GWh
100%
Energía producida en el Sistema Aislado Santa
Rosalía del 28 de abril de 2012 al 28 de abril del 2013.
Solar 2 GWh
3 %
Figura 6.- Esquema de generación en el Sistema Santa Rosalía, Abril 2012-Abril 2013.
5. Conclusión
El comportamiento de la CFS durante su primer año de operación, ha comprobado estar por encima de las predicciones realizadas, lo cual demuestra que existe una importante área de oportunidad para el desarrollo de nuevos proyectos de energía solar en la región de B.C.S. y en otros sitios en el país con recurso solar similares. Lo cual sin duda contribuiría a la política energética nacional en cuanto a la diversificación de la composición del parque de generación de electricidad, aprovechamiento de fuentes renovables de energía, promoción del uso de tecnologías limpias y cuidado del medio ambiente, principalmente.
50
“Angel Antonio Zapata López”/ Revista Geotermia Vol. 26, Num. 2 Julio-Diciembre de 2013
Por otro lado, las características del sistema aislado de Santa Rosalía, donde el 75% de la energía es generada por fuentes renovables, proporciona una amplia ventana de oportunidad para la creación de un modelo que sirva de base para futuros desarrollos de sustentabilidad a nivel nacional.
Debido a los excelentes resultados observados y a las características únicas del sistema aislado de Santa
Rosalía, la Gerencia de Proyectos Geotermoeléctricos está realizando gestiones para la ampliación de la capacidad instalada de la CFS con el propósito de incrementar la participación de la energía renovable (geotermia+solar) y reducir el consumo de combustible fósil al mínimo.
Agradecimientos
A todos los involucrados en el proceso que dio como resultado la primera Central Solar Fotovoltaica de 1 MW destinada al servicio público de energía eléctrica, conectada al Sistema Eléctrico Nacional mexicano.
Referencias [1] Instituto Nacional de Estadística y Geografía (2010). Principales resultados por localidad 2010 (ITER). [2] Informe Anual 2010 y 2011, Subárea Santa Rosalía, CENACE. [3] Environmental Costs of Electricity, Oceana Publications, Inc.
51
ESTUDIO PETROGRÁFICO DEL POZO H-43, LOS HUMEROS, PUEBLA.: Interpretación e indicadores mineralógicos de acidez
Julio César Viggiano-Guerraa, Magaly del C. Flores-Armentab, Víctor Santiago Rocha-Lópezb, Fernando Sandoval-Medinab
a
Facultad de Ingeniería Civil, UMSNH, Morelia, Mich. E-mail: [email protected]. bComisión Federal de Electricidad, Gerencia de Proyectos Geotermoeléctricos, Morelia, Mich.
Resumen
El pozo H-43, perforado en el Colapso Central del campo geotérmico de Los Humeros, Pue., México, alcanzó 2200 m de profundidad y temperaturas superiores a 300°C. Debido a su ubicación, se cree que la acidez y la incrustación podrían ser dos problemas inminentes y muy serios para el desarrollo del mismo. En este estudio se reporta la interpretación petrológico-geoquímica, basada en la petrografía microscópica de 206 muestras de canal recuperados a intervalos de 10 m durante la perforación. Las unidades litológicas corresponden a las ya conocidas con algunas variaciones menores en litología, a saber: Unidad I, Unidad II, Unidad III y Unidad IV. En la Unidad IV se detectaron diques diabásicos promotores de la permeabilidad y del acarreo del fluido desde las zonas más profundas. El zoneamiento hidrotermal es en esencia el general del campo geotérmico: zona de zeolitas, zona de epidota y zona de anfíbol, aunque en este estudio se proporciona una evolución del nivel de fluido ácido sulfatado (en la zona vadosa), en el que se alternan minerales tanto producto de los fluidos ácido-sulfatados como de los bicarbonatados que han reaccionado con fluidos superficiales de origen meteórico. Esta evolución debe estar presente en otros sitios pero no se había reparado en ella. Lo importante de este hallazgo es el sobresaliente protagonismo del CO2 en el sistema, no sólo en la parte superior sino en las zonas profundas. Se infiere un abatimiento del nivel estático debido muy probablemente a la explotación del campo. Se observó un comportamiento muy cercano a la zona de vapor en el perfil de temperaturas. Por otro lado, se estima un valor de pH entre 2 y 3 en el fondo del pozo, con base en la evolución de la mineralogía autigénica o hidrotermal (principalmente la calcita, micas, pirita y pirrotita), complementada con diagramas de equilibrio. Estos minerales, indicadores de pH y del estado de óxido-reducción del sistema, parecen ser los más proclives a ser depositados como incrustaciones. La estimación del pH es un argumento de bastante peso para el manejo de los controladores del mismo y de los inhibidores de las incrustaciones. Se sugiere calcular a la brevedad, los índices de saturación de los minerales y su estado de equilibrio en el yacimiento, para conocer y prever mejor el problema de la acidez y de las probables incrustaciones.
Palabras clave: Los Humeros, pozo H-43, unidades litológicas, diabasas, fluidos ácidos, mineralogía hidrotermal, incrustación.
Abstract
The well H-43, drilled in the Colapso Central (Central Collapse) of the geotermal field of Los Humeros, Pue., Mexico, reached 2200 m depth and temperatures above 300 °C. Due to its location, it is believed that acidity and scaling may be two serious and imminent problems for it develop. In this study we report petrological-geochemical interpretation, based on microscopic petrography of 206 cutting samples recovered at 10 m intervals during drilling. Lithological units are already known with some minor variations in lithology, namely: Unit I, Unit II, Unit III and Unit IV. In Unit IV diabasic dikes were detected, promoters of permeability and of carry fluid from the deeper areas. The hydrothermal zoning is essentially the general of the geothermal field: area of zeolites, epidote zone and amphibole zone, although in this study provides an evolution of sulfated acid fluid level (in the vadose zone), in which are alternating the minerals both product of acid-sulfated fluids as well as bicarbonatados in which are alternating the minerals both product of acid-sulfated fluids as well as bicarbonatados that have reacted with superficial fluids of meteoric origin. This evolution must be present at other sites but had not noticed it. The importance of this find is the outstanding role of CO2 in the system, not only at the top but in too deep. It is inferred a decreasing of the static level due most probably to the exploitation of the field. It was observed a behavior very close to the vapor area in the temperatures profile. By other side, it is estimated a pH value between 2 and 3 at downhole, with basis on the evolution of the authigenic or hydrothermal mineralogy (mainly the calcite, mica, pyrite and pyrrhotite), complemented with equilibrium diagrams. These minerals, pH indicators and redox state of the system, appear to be the most prone to be deposited as scale. PH estimation is an argument of considerable weight for handling controllers thereof and scale inhibitors. It is suggested brevity calculate the saturation index of minerals and their equilibrium state at the reservoir for know and anticipate better the problem of acidity and of the probably scale.
Keywords: Los Humeros, well H-43, lithological units, diabase, acidic fluids, hydrothermal mineralogy, scaling.
1. Introducción
El pozo H-43 fue perforado a 2200 m de profundidad en el campo de Los Humeros, Puebla entre los pozos H-16 y H-35 (Fig. 1). Durante la perforación se obtuvieron 206 recortes de las rocas atravesadas a intervalos de 10 m que fueron preparados en Los Azufres para su estudio petrográfico e interpretación correspondiente. A continuación se proporcionan algunos datos importantes, calculados a 5 días de su apertura.
52
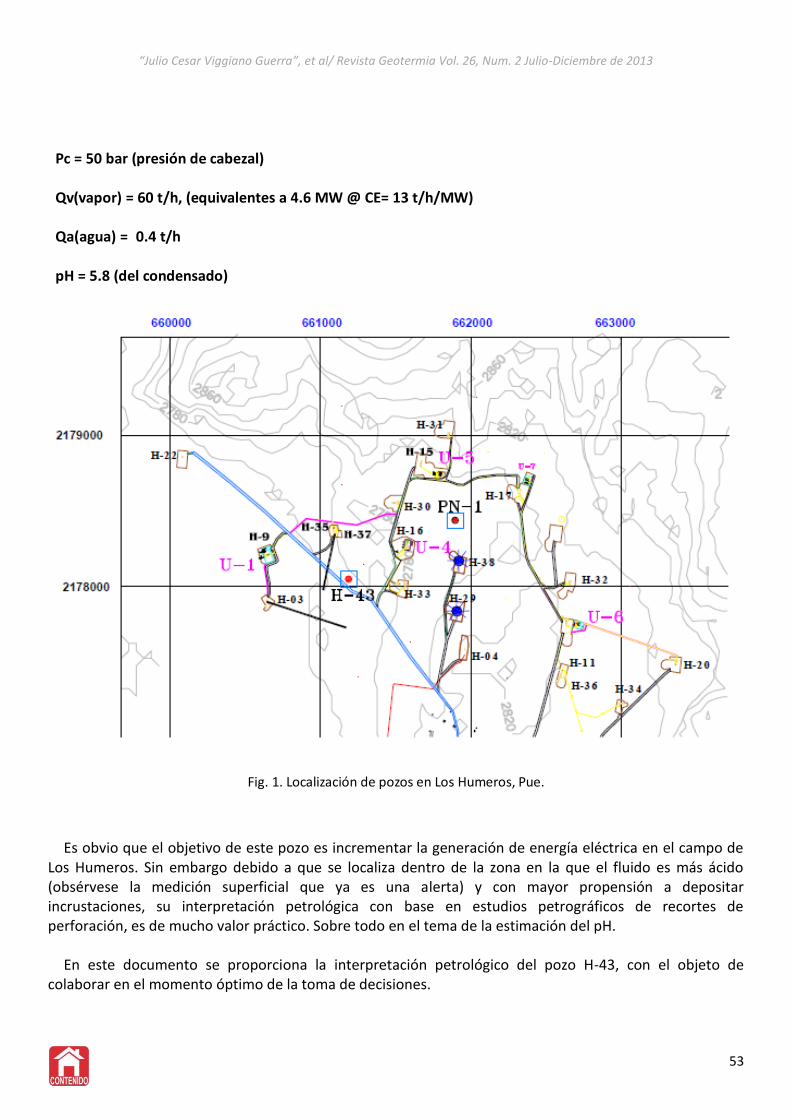
“Julio Cesar Viggiano Guerra”, et al/ Revista Geotermia Vol. 26, Num. 2 Julio-Diciembre de 2013
Pc = 50 bar (presión de cabezal)
Qv(vapor) = 60 t/h, (equivalentes a 4.6 MW @ CE= 13 t/h/MW) Qa(agua) = 0.4 t/h pH = 5.8 (del condensado)
Fig. 1. Localización de pozos en Los Humeros, Pue.
Es obvio que el objetivo de este pozo es incrementar la generación de energía eléctrica en el campo de Los Humeros. Sin embargo debido a que se localiza dentro de la zona en la que el fluido es más ácido (obsérvese la medición superficial que ya es una alerta) y con mayor propensión a depositar incrustaciones, su interpretación petrológica con base en estudios petrográficos de recortes de perforación, es de mucho valor práctico. Sobre todo en el tema de la estimación del pH.
En este documento se proporciona la interpretación petrológico del pozo H-43, con el objeto de
colaborar en el momento óptimo de la toma de decisiones.
53
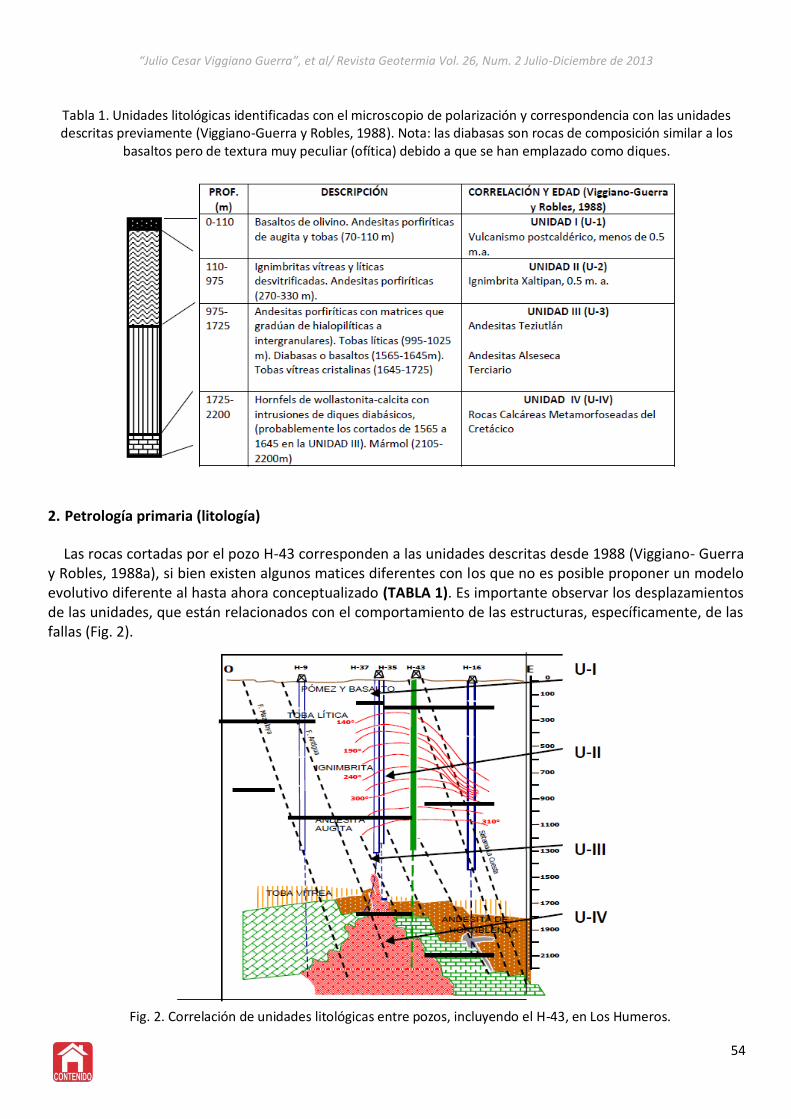
“Julio Cesar Viggiano Guerra”, et al/ Revista Geotermia Vol. 26, Num. 2 Julio-Diciembre de 2013
Tabla 1. Unidades litológicas identificadas con el microscopio de polarización y correspondencia con las unidades descritas previamente (Viggiano-Guerra y Robles, 1988). Nota: las diabasas son rocas de composición similar a los
basaltos pero de textura muy peculiar (ofítica) debido a que se han emplazado como diques.
2. Petrología primaria (litología) Las rocas cortadas por el pozo H-43 corresponden a las unidades descritas desde 1988 (Viggiano- Guerra
y Robles, 1988a), si bien existen algunos matices diferentes con los que no es posible proponer un modelo evolutivo diferente al hasta ahora conceptualizado (TABLA 1). Es importante observar los desplazamientos de las unidades, que están relacionados con el comportamiento de las estructuras, específicamente, de las fallas (Fig. 2).
Fig. 2. Correlación de unidades litológicas entre pozos, incluyendo el H-43, en Los Humeros.
54
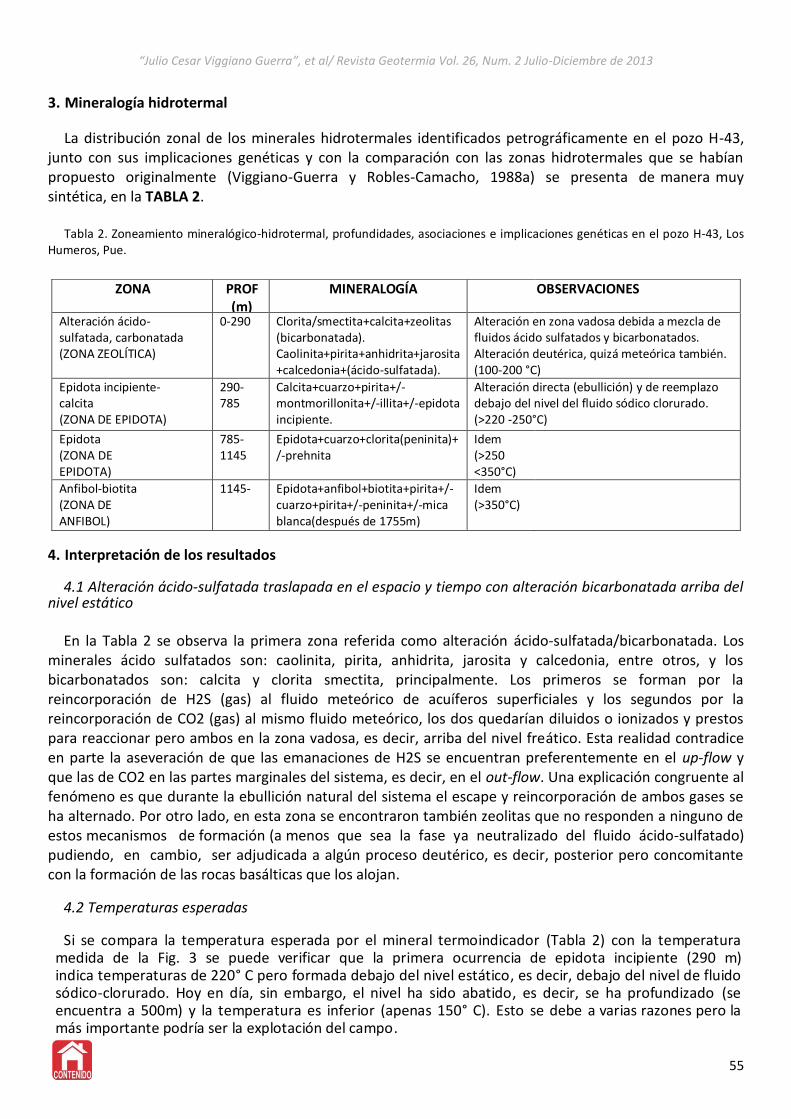
“Julio Cesar Viggiano Guerra”, et al/ Revista Geotermia Vol. 26, Num. 2 Julio-Diciembre de 2013
3. Mineralogía hidrotermal La distribución zonal de los minerales hidrotermales identificados petrográficamente en el pozo H-43,
junto con sus implicaciones genéticas y con la comparación con las zonas hidrotermales que se habían propuesto originalmente (Viggiano-Guerra y Robles-Camacho, 1988a) se presenta de manera muy sintética, en la TABLA 2.
Tabla 2. Zoneamiento mineralógico-hidrotermal, profundidades, asociaciones e implicaciones genéticas en el pozo H-43, Los
Humeros, Pue.
4. Interpretación de los resultados
4.1 Alteración ácido-sulfatada traslapada en el espacio y tiempo con alteración bicarbonatada arriba del nivel estático
En la Tabla 2 se observa la primera zona referida como alteración ácido-sulfatada/bicarbonatada. Los
minerales ácido sulfatados son: caolinita, pirita, anhidrita, jarosita y calcedonia, entre otros, y los bicarbonatados son: calcita y clorita smectita, principalmente. Los primeros se forman por la reincorporación de H2S (gas) al fluido meteórico de acuíferos superficiales y los segundos por la reincorporación de CO2 (gas) al mismo fluido meteórico, los dos quedarían diluidos o ionizados y prestos para reaccionar pero ambos en la zona vadosa, es decir, arriba del nivel freático. Esta realidad contradice en parte la aseveración de que las emanaciones de H2S se encuentran preferentemente en el up-flow y que las de CO2 en las partes marginales del sistema, es decir, en el out-flow. Una explicación congruente al fenómeno es que durante la ebullición natural del sistema el escape y reincorporación de ambos gases se ha alternado. Por otro lado, en esta zona se encontraron también zeolitas que no responden a ninguno de estos mecanismos de formación (a menos que sea la fase ya neutralizado del fluido ácido-sulfatado) pudiendo, en cambio, ser adjudicada a algún proceso deutérico, es decir, posterior pero concomitante con la formación de las rocas basálticas que los alojan.
4.2 Temperaturas esperadas Si se compara la temperatura esperada por el mineral termoindicador (Tabla 2) con la temperatura
medida de la Fig. 3 se puede verificar que la primera ocurrencia de epidota incipiente (290 m) indica temperaturas de 220° C pero formada debajo del nivel estático, es decir, debajo del nivel de fluido sódico-clorurado. Hoy en día, sin embargo, el nivel ha sido abatido, es decir, se ha profundizado (se encuentra a 500m) y la temperatura es inferior (apenas 150° C). Esto se debe a varias razones pero la más importante podría ser la explotación del campo.
55
ZONA PROF (m)
MINERALOGÍA OBSERVACIONES
Alteración ácido- sulfatada, carbonatada (ZONA ZEOLÍTICA)
0-290 Clorita/smectita+calcita+zeolitas (bicarbonatada). Caolinita+pirita+anhidrita+jarosita +calcedonia+(ácido-sulfatada).
Alteración en zona vadosa debida a mezcla de fluidos ácido sulfatados y bicarbonatados. Alteración deutérica, quizá meteórica también. (100-200 °C)
Epidota incipiente- calcita (ZONA DE EPIDOTA)
290- 785
Calcita+cuarzo+pirita+/- montmorillonita+/-illita+/-epidota incipiente.
Alteración directa (ebullición) y de reemplazo debajo del nivel del fluido sódico clorurado. (>220 -250°C)
Epidota (ZONA DE EPIDOTA)
785- 1145
Epidota+cuarzo+clorita(peninita)+ /-prehnita
Idem (>250 <350°C)
Anfibol-biotita (ZONA DE ANFIBOL)
1145- Epidota+anfibol+biotita+pirita+/- cuarzo+pirita+/-peninita+/-mica blanca(después de 1755m)
Idem (>350°C)
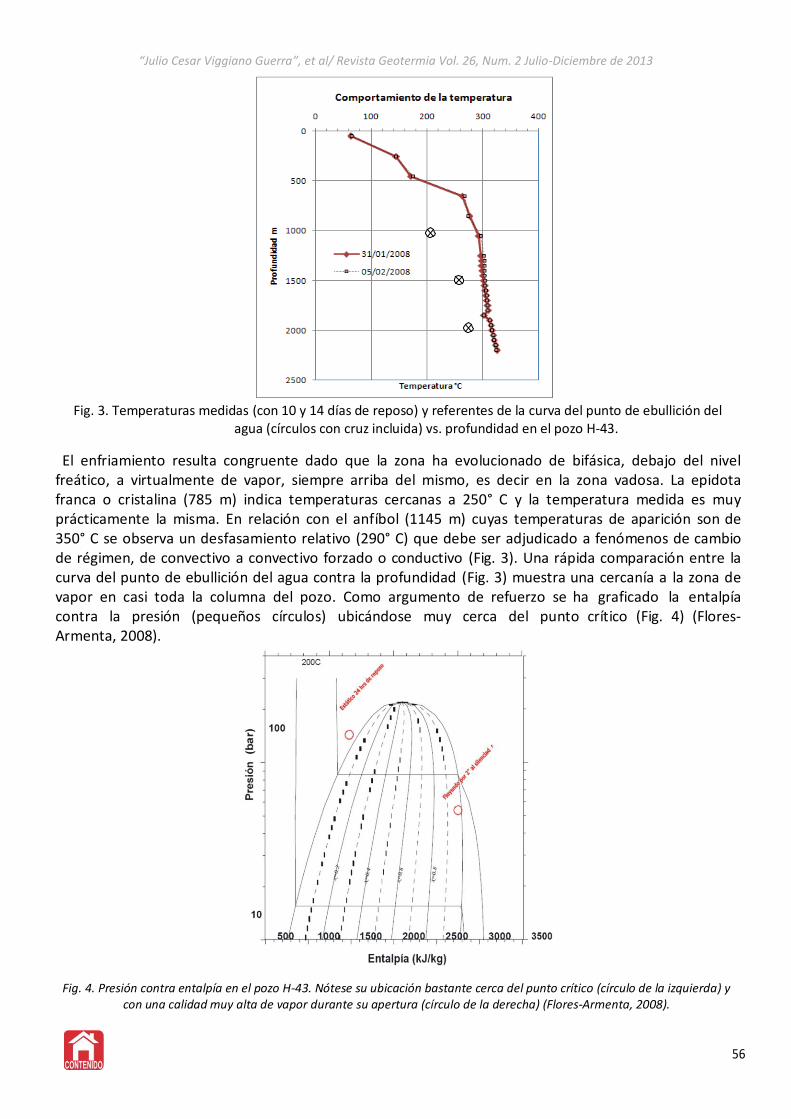
“Julio Cesar Viggiano Guerra”, et al/ Revista Geotermia Vol. 26, Num. 2 Julio-Diciembre de 2013
Fig. 3. Temperaturas medidas (con 10 y 14 días de reposo) y referentes de la curva del punto de ebullición del agua (círculos con cruz incluida) vs. profundidad en el pozo H-43.
El enfriamiento resulta congruente dado que la zona ha evolucionado de bifásica, debajo del nivel freático, a virtualmente de vapor, siempre arriba del mismo, es decir en la zona vadosa. La epidota franca o cristalina (785 m) indica temperaturas cercanas a 250° C y la temperatura medida es muy prácticamente la misma. En relación con el anfíbol (1145 m) cuyas temperaturas de aparición son de 350° C se observa un desfasamiento relativo (290° C) que debe ser adjudicado a fenómenos de cambio de régimen, de convectivo a convectivo forzado o conductivo (Fig. 3). Una rápida comparación entre la curva del punto de ebullición del agua contra la profundidad (Fig. 3) muestra una cercanía a la zona de vapor en casi toda la columna del pozo. Como argumento de refuerzo se ha graficado la entalpía contra la presión (pequeños círculos) ubicándose muy cerca del punto crítico (Fig. 4) (Flores-Armenta, 2008).
Fig. 4. Presión contra entalpía en el pozo H-43. Nótese su ubicación bastante cerca del punto crítico (círculo de la izquierda) y con una calidad muy alta de vapor durante su apertura (círculo de la derecha) (Flores-Armenta, 2008).
56
“Julio Cesar Viggiano Guerra”, et al/ Revista Geotermia Vol. 26, Num. 2 Julio-Diciembre de 2013
4.3 Estimación del pH en el yacimiento por métodos mineralógicos La estimación del pH es muy importante porque ayuda en la prevención de la acidez mediante la
aplicación de controladores del pH. La medición de este parámetro en la superficie, no es representativa de la zona de aporte.
Por otro lado, los cálculos termodinámicos de especiación hasta ahora elaborados, cuyo cometido, entre otras cosas, es el conocimiento del pH a condiciones de yacimiento, son relativamente cercanos al neutro (Viggiano-Guerra y Quijano, 1989; Tello, 2005) lo cual resulta incongruente si se asume que la corrosión observada en las tuberías de algunos pozos se debe a pHs muy ácidos.
Las asociaciones de minerales dependientes del pH, del estado de oxidación y por supuesto de la
temperatura y la presión del yacimiento son una gran herramienta en este sentido. Por ejemplo la calcita y la mica blanca potásica, dos minerales identificados en este pozo , son claves e imprescindibles en la predicción de dicho parámetro. En adición, el par pirita-pirrotita se puede utilizar en la determinación del estado oxido-reducción del yacimiento. A continuación un análisis breve al respecto.
Comportamiento de la calcita La calcita se registra desde los 60 y desaparece bruscamente a 785m. De 60 a 290m de profundidad su
formación es en la zona vadosa (zona de vapor) como ya se apuntó, pero debajo de ésta su aparición es en la zona bifásica habiéndose formado por ebullición en parte (a la profundidad de 615 m se observó el hábito “platy” típico de ebullición) suministrando en consecuencia parte del CO2 residual hacia la zona vadosa. Sin embargo resulta muy clara su desaparición a partir de los 785m justo al inicio de las andesitas. Su formación es obvia y explícita arriba de esa profundidad pero su ausencia es muy extraña debajo de la misma. La única razón para que la calcita no se forme es la no disponibilidad de iones de Ca++ o la falta de HCO3- y este no parece ser el caso, basta echar un vistazo a los minerales neoformados que requieren calcio para su nucleación como la epidota, entre otros, que se han identificados en el yacimiento. Desde el punto de vista de estabilidad, la calcita tiene restricciones de pH en su formación. Efectivamente, a 300° C y aun a menor temperatura, sólo se forma en condiciones de pH>5, y curiosamente esta línea corresponde con la estabilidad de la mica potásica o blanca. Lo que ocurre en la restricción de la formación de la calcita es que la relación H2CO3/H+ aumenta a mayor temperatura. El H2CO3 puede, incluso, alcanzar el estado gaseoso en la medida en la que la temperatura aumenta hasta llegar a la zona de saturación. Este proceso se facilita a bajas permeabilidades porque el poco líquido puede evaporarse y difundirse por los microespacios, incluso ya con el CO2 gasificado. Si la permeabilidad es más alta, predomina el fluido y entonces el H+ es más soluble dando lugar a la disolución del H2CO3 (a la forma HCO3-) que al unirse al Ca++ generará la nucleación de cristales de calcita (FIGURA 4). Las reacciones que sustentan el fenómeno previamente mencionado son:
CO32- + 2H+→ HCO3
-+ H+→ H2CO3 (líquido)→H2O + CO2 (gas) DISMINUYE
pH, AUMENTA LA TEMPERATURA
pH
pH=5
Ca++ + 2 HCO3- → CaCO3 + CO2 + H2O
57
“Julio Cesar Viggiano Guerra”, et al/ Revista Geotermia Vol. 26, Num. 2 Julio-Diciembre de 2013
En otras palabras para que la calcita deposite a esta temperatura (300° C) el pH tiene que ser superior a 5, de lo contrario su deposición no se lleva a cabo y en cambio aparecerá la mica blanca pero sin que necesariamente tenga relación química esta fase con la otra (Fig. 5). De esta suerte, la desaparición de calcita junto con la aparición de mica blanca indica pHs menores de 5. Esto sustenta, una vez más, el porqué la superficie que delimita la calcita (calcita-out) se ha considerado desde hace muchos años como indicadora de acidez (pH<5) en Los Humeros. En relación con la baja permeabilidad requerida para el proceso de la ausencia de calcita, se ha verificado en esas profundidades que el estilo de mineralización es de reemplazamiento, originado en condiciones de baja permeabilidad.
Presencia de micas: biotita y mica potásica o blanca
La aparición de biotita y de mica blanca o potásica responde a un ámbito no sólo de alta temperatura sino de acidez si bien la mica blanca se forma en condiciones aun de mayor acidez que la biotita. Los diagramas de equilibrio entre fases no refieren a la biotita como tal debido a su difícil estequiometría (fórmula muy compleja) para el manejo de la misma en el ámbito del equilibrio termodinámico. Lo mismo ocurre con la epidota que es referida como zoisita. No obstante, a la mica blanca se le puede encontrar como margarita a altas temperaturas y presiones como es el ambiente en este yacimiento, y justamente, en condiciones de acidez (Bird y Helgeson, 1981) habida cuenta de que la acidez en el fluido la genera una mezcla de gases magmáticos condensados como SO2, HCl, HF,
etc. Coincidentalmente, la calcita desaparece con la presencia de biotita aunque la coincidencia no es súbita, de modo que en la profundidad a la que desaparece la calcita y aparece la biotita el pH es de 5. De ahí a mayor profundidad decrecerá aún más por el incremento de temperatura y por la no liberación de gases sobretodo de CO2 a menos que pase a la zona de vapor, por encima de la línea de
saturación. En estas condiciones la fugacidad del CO2 (fCO2) aumenta y el gas se torna altamente
corrosivo. El aumento en la fCO2 es directamente proporcional al incremento en la tasa de corrosión
(Pérez y González-Partida, 2007). Además, si el pH se mantuviera en 5 la calcita seguiría apareciendo quizá alternada o asociándose con la mica, como en el caso de Las Tres Vírgenes (Viggiano-Guerra et al., 2008). Pero este no es el caso ya que la calcita desaparece por completo. De esta suerte es muy confiable suponer valores de pH que fluctúan al menos entre 2 y 3 en lo más profundo de la zona de alimentación. Por otro lado al rebasar esta línea de pH=5 con los neutralizadores de pH se correrá el riesgo de propiciar el depósito del susodicho carbonato (calcita) tal como ha ocurrido de manera natural en el litotipo ignimbrítico (entre 290 y 785m). De manera similar sucederá con la anhidrita u otros minerales como los polimorfos de la sílice aunque de acuerdo a la petrografía estas fases son menos proclives a depositar. Conviene advertir que si esto es cierto, una vez superado el pH=5, por flasheo durante la perforación o por la aplicación de controladores, la incrustación de calcita será a menor profundidad en la tubería de lo que ha sido en el yacimiento (entre 290 y 785m) porque la despresurización es más profunda.
El par pirita-pirrotita: predominio de vapor y baja permeabilidad
Este par de minerales es sumamente clave para indicar las condiciones de oxido-reducción del yacimiento y también de permeabilidad sin soslayar que cuando se asocian alternativamente indican temperaturas de formación de más de 300° C (McKibben, 1981). La pirita (bastante común en el pozo) se forma en condiciones de pHs inferiores al neutro (7) y en condiciones de oxidación bajas aunque no demasiado como la pirrotita misma que también se forma debajo del pH neutro (Fig. 5). Desafortunadamente la pirrotita no es fácilmente identificable con el microscopio óptico y será necesario emplear un microscopio mineragráfico para su ratificación.
58
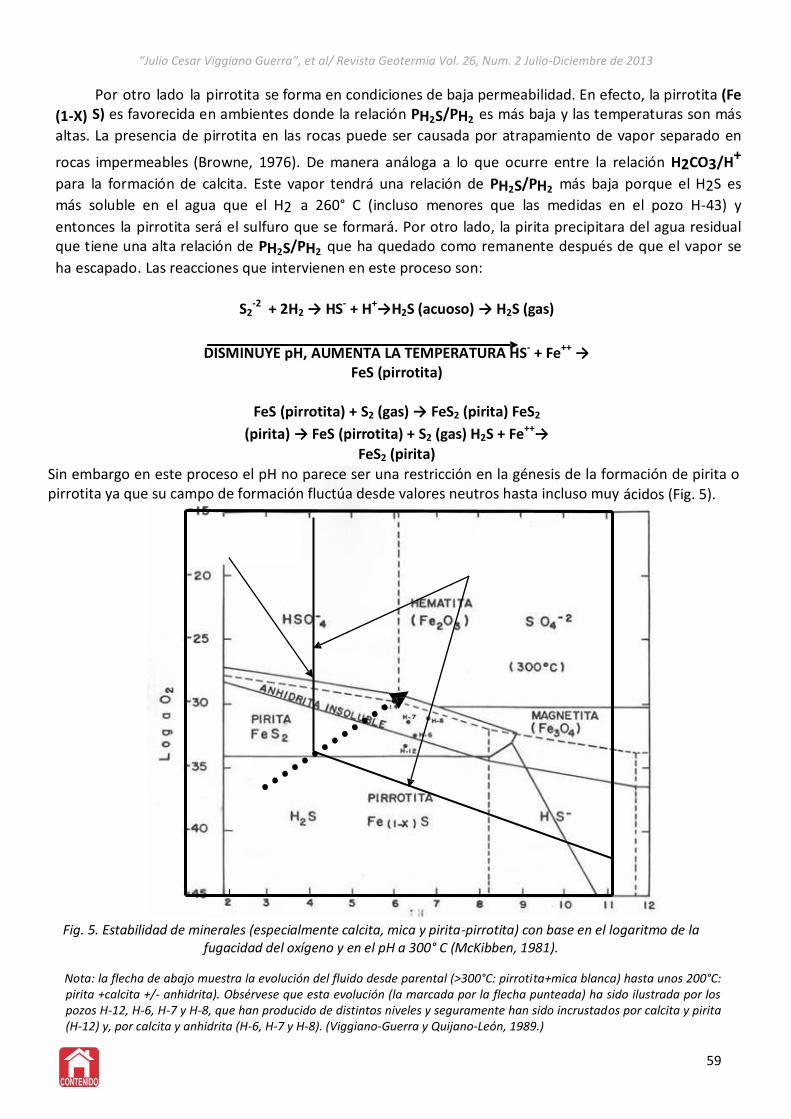
“Julio Cesar Viggiano Guerra”, et al/ Revista Geotermia Vol. 26, Num. 2 Julio-Diciembre de 2013
Por otro lado la pirrotita se forma en condiciones de baja permeabilidad. En efecto, la pirrotita (Fe
(1-X) S) es favorecida en ambientes donde la relación PH2S/PH2 es más baja y las temperaturas son más
altas. La presencia de pirrotita en las rocas puede ser causada por atrapamiento de vapor separado en
rocas impermeables (Browne, 1976). De manera análoga a lo que ocurre entre la relación H2CO3/H+
para la formación de calcita. Este vapor tendrá una relación de PH2S/PH2 más baja porque el H2S es
más soluble en el agua que el H2 a 260° C (incluso menores que las medidas en el pozo H-43) y
entonces la pirrotita será el sulfuro que se formará. Por otro lado, la pirita precipitara del agua residual que tiene una alta relación de PH2S/PH2 que ha quedado como remanente después de que el vapor se
ha escapado. Las reacciones que intervienen en este proceso son:
S2-2 + 2H2 → HS- + H+→H2S (acuoso) → H2S (gas)
DISMINUYE pH, AUMENTA LA TEMPERATURA HS- + Fe++ → FeS (pirrotita)
FeS (pirrotita) + S2 (gas) → FeS2 (pirita) FeS2
(pirita) → FeS (pirrotita) + S2 (gas) H2S + Fe++→
FeS2 (pirita)
Sin embargo en este proceso el pH no parece ser una restricción en la génesis de la formación de pirita o pirrotita ya que su campo de formación fluctúa desde valores neutros hasta incluso muy ácidos (Fig. 5).
Fig. 5. Estabilidad de minerales (especialmente calcita, mica y pirita-pirrotita) con base en el logaritmo de la fugacidad del oxígeno y en el pH a 300° C (McKibben, 1981).
Nota: la flecha de abajo muestra la evolución del fluido desde parental (>300°C: pirrotita+mica blanca) hasta unos 200°C: pirita +calcita +/- anhidrita). Obsérvese que esta evolución (la marcada por la flecha punteada) ha sido ilustrada por los pozos H-12, H-6, H-7 y H-8, que han producido de distintos niveles y seguramente han sido incrustados por calcita y pirita (H-12) y, por calcita y anhidrita (H-6, H-7 y H-8). (Viggiano-Guerra y Quijano-León, 1989.)
59
“Julio Cesar Viggiano Guerra”, et al/ Revista Geotermia Vol. 26, Num. 2 Julio-Diciembre de 2013
4.4 Permeabilidad en el hornfels, erróneamente denominado caliza
Como se ha descrito en páginas anteriores, después de 1725 m aparece la Unidad IV, erróneamente denominada caliza. Se trata, sí, de rocas carbonatadas pero sometidas a un proceso de metamorfismo de contacto no contemporáneo, por supuesto, con el ciclo volcánico actual responsable del proceso hidrotermal reciente. El metamorfismo de contacto se genera en rocas cercanas (encajonantes) a un magma en enfriamiento cuyo calor es transferido conductivamente a ellas, en un sistema, termodinámicamente hablando, cerrado. Este calor recristaliza los fragmentos originales de calcita (CaCO3) que constituyen la caliza, o bien provoca transferencias químicas, si hay disponibilidad
de sílice por ejemplo en la caliza original, para constituir wollastonita (CaSiO3). El problema no es sólo conceptual y semántico; tiene impacto en las propiedades físicas de la roca porque aumenta la densidad y reduce tanto la permeabilidad como la porosidad. También incrementa el módulo de Young y por ende la respuesta de las rocas a la compresión, tracción, esfuerzo de cizalla, etcétera. Cuando se asimilen estos conceptos básicos, la expectativa de “producir en calizas” sensu stricto, tendrá que ser manejada con precaución. Así, la permeabilidad en estas rocas (después de 1725 m) se debe a la presencia de diques diabásicos (composición similar al basalto) que se han emplazado a través del sistema estructural predominante según se han observado las evidencias de cizalla (textura cataclástica). Sin embargo, esto ocurre hasta 2005 m porque después de esa profundidad desaparecen los diques y el hornfels está totalmente inalterado hidrotermalmente, lo cual significa que carece de permeabilidad y de porosidad primarias. Debe aclararse que tampoco arriba de esta profundidad esta alterado, la alteración se ha emplazado en los diques que a su vez cruzan los hornfels. En las hojas de descripción petrográfica se puede ratificar este hecho. Por otro lado la presencia de mica blanca de difícil designación genética por su aislamiento en el hornfels parece ser una luz ámbar, adicional, en la prevención de la acidez.
5. Conclusiones
Las unidades litológicas identificadas microscópicamente corresponden a las ya conocidas en el campo de Los Humeros. Hay, sin embargo, algunos matices locales que resultan insuficientes como para plantear un modelo evolutivo diferente al previamente concebido, desde el punto de vista de la petrología primaria. Los saltos en la correlación de los litotipos dan cuenta del comportamiento estructural del sistema y contribuyen a la afinación del modelo en este sentido.
En la zona vadosa, arriba del nivel estático, se ha verificado la alternancia de fluido sódico- clorurado con bicarbonatado de acuerdo a las asociaciones mineralógicas correspondientes. Además el nivel estático ha descendido ensanchando más la zona vadosa o de vapor en la parte superior, probablemente debido a la explotación del campo.
Con la ayuda de la mineralogía hidrotermal y de diagramas de equilibrio entre fases, pero también de observaciones empíricas, es posible predecir un pH menor de 5 desde la última ocurrencia de calcita (785 m) y de la primera aparición de biotita o de mica blanca (muscovita o pirofilita). En adición, se asume un decremento del mismo, que podrá presentar valores fluctuantes entre 2 y 3, conforme se incrementan tanto la profundidad como la temperatura.
60
“Julio Cesar Viggiano Guerra”, et al/ Revista Geotermia Vol. 26, Num. 2 Julio-Diciembre de 2013
Si la anterior consideración es válida, una vez superado el pH=5, por la aplicación de controladores de pH, o incluso por flasheo durante la explotación, la incrustación de calcita o de otros minerales (por ejemplo: sílice, anhidrita, pirita, etc.) será inminente. Esto ocurrirá a menor profundidad en la tubería (alrededor de 1000m) de lo que ha sido en el yacimiento (entre 290 y 785m) porque la despresurización es ahora acelerada, y por ello ocurre a mayor profundidad tal como se sucedió en el pozo H-16. Presumiblemente, un zoneamiento del pH a lo largo de la tubería, con un método de especiación (SPCALC, por ejemplo) podría ser útil en la predicción espacial del depósito de calcita o de otras fases incrustantes.
Tomando en cuenta lo anterior, es necesario manejar los controladores de acidez con mucho cuidado procurando que no se supere el valor de 5, sin menoscabar el control de la apertura durante la producción a efecto de mitigar el flasheo en la tubería del pozo.
El hecho de que tanto los pH medidos en superficie como los obtenidos con software de especiación termodinámica sean muy cercanos al neutro puede deberse a que el fluido que se analiza, ya en superficie, no incluye (o los subestima) los cambios fisico-químicos, sobretodo de desgasificación y mezcla que se generan durante la apertura del pozo y que influyen fuertemente en la variación del pH. Esto es especialmente cierto en fluidos como el de Los Humeros, que están muy cercanos al parental y también al punto crítico, y que no han evolucionado (ebullición, depósito, enfriamiento) cuyo resultado sería el depósito de fases y la neutralización del mismo.
Sin embargo, es urgente calcular los índices de saturación de los minerales por métodos de especiación (usando el SPCALC) con objeto de afinar las predicciones de incrustación y de analizar el estado de equilibrio de los minerales en el yacimiento. Estos datos, por supuesto, deberán compararse con las observaciones mineralógicas del estudio petrográfico.
Referencias [1] Bird, D.K., and H.C. Helgeson, Chemical Interaction of Aqueous Solutions with Epidote- Feldspar Mineral Assemblages in Geological Systems. II. Equilibrium Constraints in Metamorphic/Geothermal Processes. American Journal of Science, 1981. Vol 231, pp. 576-614.
[2] Browne, P.R.L. Hydrothermal Alteration as an Aid in Investigating Geothermal Fields. U.N. Symposium on the Development and Utilization of Geothermal Resources, Pisa 1976. Vol. 2, Part 1.
[3] Flores Armenta, M.C., Comunicación Personal. 2008.
[4] McKibben, M.A., Hydrothermal Mineral Assemblages, Oxide and Sulfide Systems Workshop on the Petrology and Isotope Geochemistry of Geothermal Systems. 1981. Univ. of Cal., Riverside, Cal.
[5] Pérez, J.R. y E. González-Partida, Modelo Numérico Bidimensional del Equilibrio Termodinámico entre Fases Fluidas y Minerales Presentes en el Campo Geotérmico de Los Humeros Puebla, México: Estudios Físico-Químicos de Corrosión y Mecanismos de Mitigación. Informe Final, 2007 CFE-UNAM-Universidad de Calgary, Canadá. Inédito.
[6] Tello-Hinojosa, E., Estado de equilibrio soluto-mineral saturación de minerales de alteración en fluidos geotérmicos de alta temperatura de México. 2005. Tesis Doctoral, UNAM. Inédito.
[7] Viggiano-Guerra, J.C. y J. Robles-Camacho, Mineralogía Hidrotermal en el Campo Geotérmico de Los Humeros, Pue.: Sus Usos Como Indicadora de Temperatura y del Régimen Hidrológico. 1988. Geotermia, Vol.4, No. 1, pp.15-28.
[8] Viggiano-Guerra, J.C. y J.L. Quijano-León, Mineralogía Hidrotermal en el Campo Geotérmico de Los Humeros, Pue.: III. Interacción Agua-Roca. 1989. Geotermia, Vol. 5, pp. 411-432.
[9] Viggiano-Guerra, J.C., F. Sandoval-Medina, M. Flores-Armenta, J.R. Pérez, y E. González-Partida, Aplicación del SPCALC en la especiación química y termodinámica de fluidos: ejemplo del caso de los pozos LV-4A, LV-11 y LV-13D, de Las Tres Vírgenes, BCS. 2008. Geotermia, Vol. 22. No. 1, pp. 12-27.
61
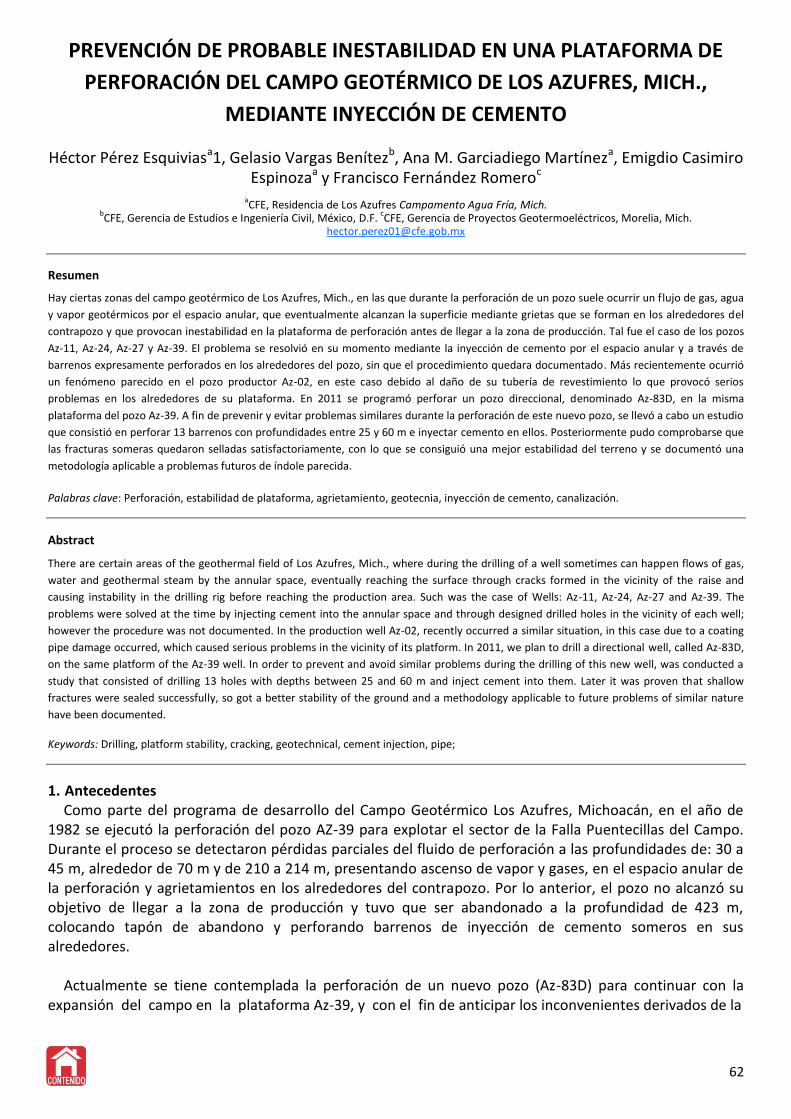
PREVENCIÓN DE PROBABLE INESTABILIDAD EN UNA PLATAFORMA DE
PERFORACIÓN DEL CAMPO GEOTÉRMICO DE LOS AZUFRES, MICH.,
MEDIANTE INYECCIÓN DE CEMENTO
Héctor Pérez Esquiviasa1, Gelasio Vargas Benítezb, Ana M. Garciadiego Martíneza, Emigdio Casimiro Espinozaa y Francisco Fernández Romeroc
aCFE, Residencia de Los Azufres Campamento Agua Fría, Mich.
bCFE, Gerencia de Estudios e Ingeniería Civil, México, D.F.
cCFE, Gerencia de Proyectos Geotermoeléctricos, Morelia, Mich.
Resumen
Hay ciertas zonas del campo geotérmico de Los Azufres, Mich., en las que durante la perforación de un pozo suele ocurrir un flujo de gas, agua
y vapor geotérmicos por el espacio anular, que eventualmente alcanzan la superficie mediante grietas que se forman en los alrededores del
contrapozo y que provocan inestabilidad en la plataforma de perforación antes de llegar a la zona de producción. Tal fue el caso de los pozos
Az-11, Az-24, Az-27 y Az-39. El problema se resolvió en su momento mediante la inyección de cemento por el espacio anular y a través de
barrenos expresamente perforados en los alrededores del pozo, sin que el procedimiento quedara documentado. Más recientemente ocurrió
un fenómeno parecido en el pozo productor Az-02, en este caso debido al daño de su tubería de revestimiento lo que provocó serios
problemas en los alrededores de su plataforma. En 2011 se programó perforar un pozo direccional, denominado Az-83D, en la misma
plataforma del pozo Az-39. A fin de prevenir y evitar problemas similares durante la perforación de este nuevo pozo, se llevó a cabo un estudio
que consistió en perforar 13 barrenos con profundidades entre 25 y 60 m e inyectar cemento en ellos. Posteriormente pudo comprobarse que
las fracturas someras quedaron selladas satisfactoriamente, con lo que se consiguió una mejor estabilidad del terreno y se documentó una
metodología aplicable a problemas futuros de índole parecida.
Palabras clave: Perforación, estabilidad de plataforma, agrietamiento, geotecnia, inyección de cemento, canalización.
Abstract
There are certain areas of the geothermal field of Los Azufres, Mich., where during the drilling of a well sometimes can happen flows of gas,
water and geothermal steam by the annular space, eventually reaching the surface through cracks formed in the vicinity of the raise and
causing instability in the drilling rig before reaching the production area. Such was the case of Wells: Az-11, Az-24, Az-27 and Az-39. The
problems were solved at the time by injecting cement into the annular space and through designed drilled holes in the vicinity of each well;
however the procedure was not documented. In the production well Az-02, recently occurred a similar situation, in this case due to a coating
pipe damage occurred, which caused serious problems in the vicinity of its platform. In 2011, we plan to drill a directional well, called Az-83D,
on the same platform of the Az-39 well. In order to prevent and avoid similar problems during the drilling of this new well, was conducted a
study that consisted of drilling 13 holes with depths between 25 and 60 m and inject cement into them. Later it was proven that shallow
fractures were sealed successfully, so got a better stability of the ground and a methodology applicable to future problems of similar nature
have been documented.
Keywords: Drilling, platform stability, cracking, geotechnical, cement injection, pipe;
1. Antecedentes Como parte del programa de desarrollo del Campo Geotérmico Los Azufres, Michoacán, en el año de
1982 se ejecutó la perforación del pozo AZ-39 para explotar el sector de la Falla Puentecillas del Campo. Durante el proceso se detectaron pérdidas parciales del fluido de perforación a las profundidades de: 30 a 45 m, alrededor de 70 m y de 210 a 214 m, presentando ascenso de vapor y gases, en el espacio anular de la perforación y agrietamientos en los alrededores del contrapozo. Por lo anterior, el pozo no alcanzó su objetivo de llegar a la zona de producción y tuvo que ser abandonado a la profundidad de 423 m, colocando tapón de abandono y perforando barrenos de inyección de cemento someros en sus alrededores.
Actualmente se tiene contemplada la perforación de un nuevo pozo (Az-83D) para continuar con la
expansión del campo en la plataforma Az-39, y con el fin de anticipar los inconvenientes derivados de la
62
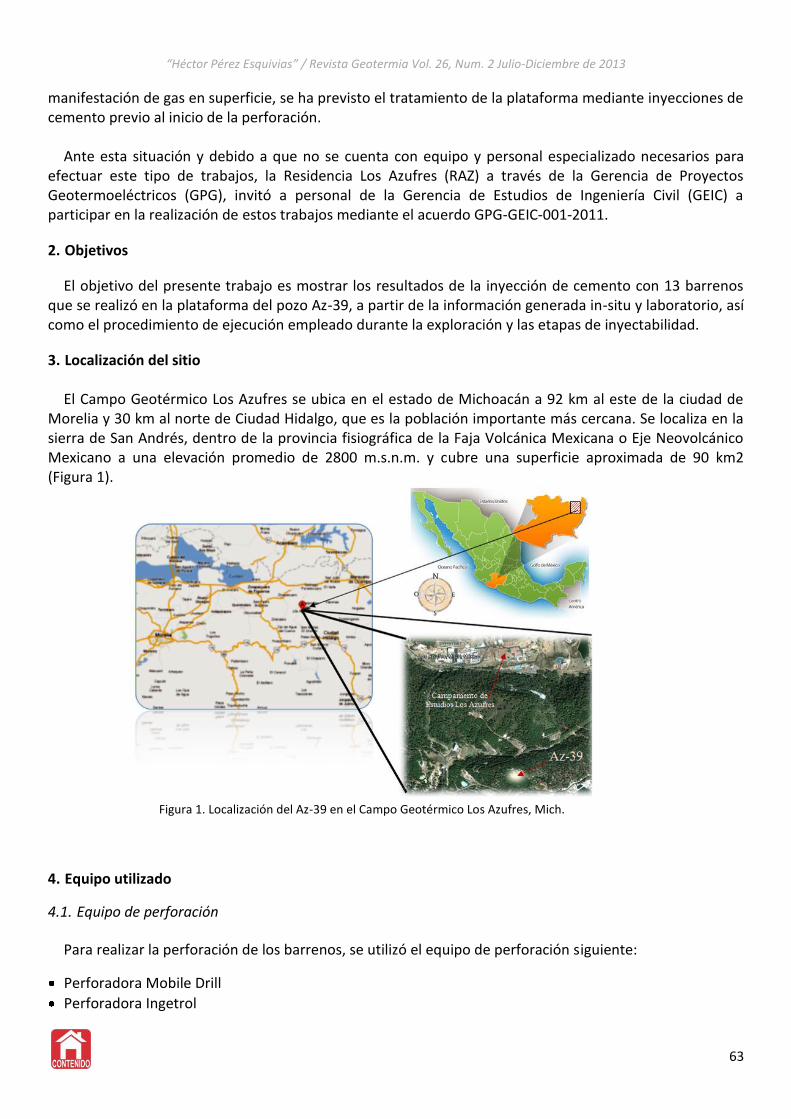
“Héctor Pérez Esquivias” / Revista Geotermia Vol. 26, Num. 2 Julio-Diciembre de 2013
manifestación de gas en superficie, se ha previsto el tratamiento de la plataforma mediante inyecciones de cemento previo al inicio de la perforación.
Ante esta situación y debido a que no se cuenta con equipo y personal especializado necesarios para
efectuar este tipo de trabajos, la Residencia Los Azufres (RAZ) a través de la Gerencia de Proyectos Geotermoeléctricos (GPG), invitó a personal de la Gerencia de Estudios de Ingeniería Civil (GEIC) a participar en la realización de estos trabajos mediante el acuerdo GPG-GEIC-001-2011.
2. Objetivos
El objetivo del presente trabajo es mostrar los resultados de la inyección de cemento con 13 barrenos que se realizó en la plataforma del pozo Az-39, a partir de la información generada in-situ y laboratorio, así como el procedimiento de ejecución empleado durante la exploración y las etapas de inyectabilidad.
3. Localización del sitio El Campo Geotérmico Los Azufres se ubica en el estado de Michoacán a 92 km al este de la ciudad de
Morelia y 30 km al norte de Ciudad Hidalgo, que es la población importante más cercana. Se localiza en la sierra de San Andrés, dentro de la provincia fisiográfica de la Faja Volcánica Mexicana o Eje Neovolcánico Mexicano a una elevación promedio de 2800 m.s.n.m. y cubre una superficie aproximada de 90 km2 (Figura 1).
Figura 1. Localización del Az-39 en el Campo Geotérmico Los Azufres, Mich.
4. Equipo utilizado
4.1. Equipo de perforación Para realizar la perforación de los barrenos, se utilizó el equipo de perforación siguiente:
Perforadora Mobile Drill
Perforadora Ingetrol
63
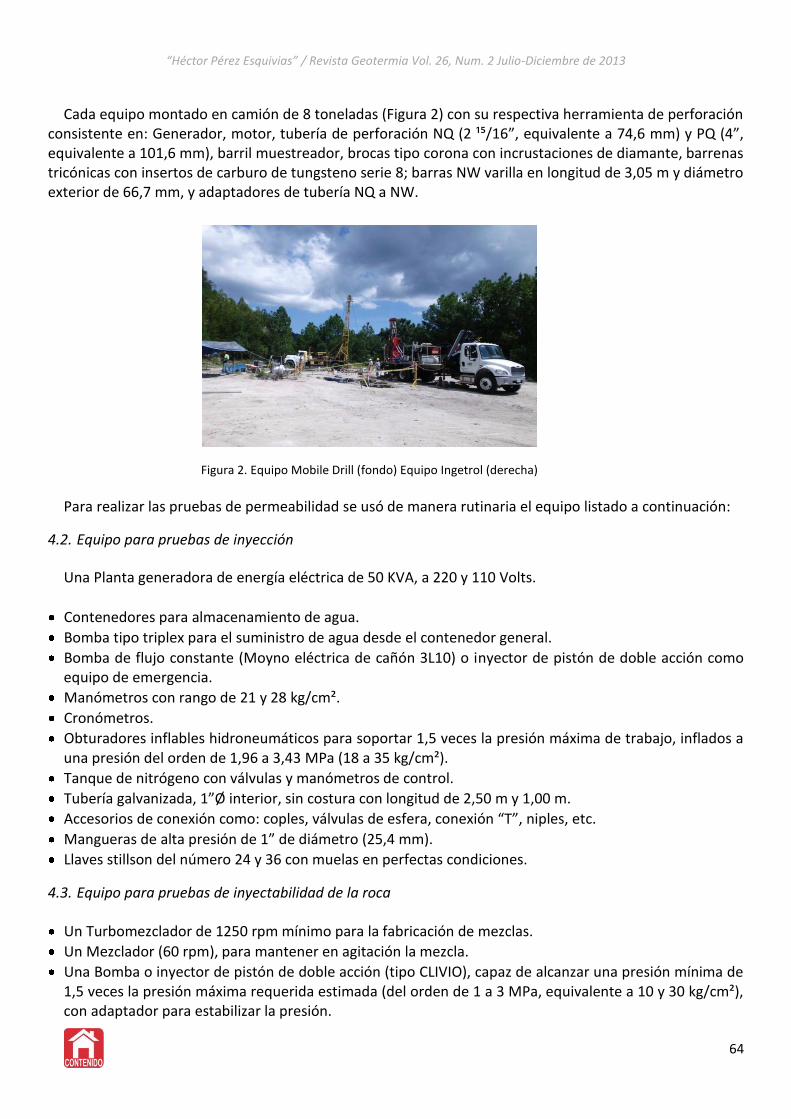
“Héctor Pérez Esquivias” / Revista Geotermia Vol. 26, Num. 2 Julio-Diciembre de 2013
Cada equipo montado en camión de 8 toneladas (Figura 2) con su respectiva herramienta de perforación
consistente en: Generador, motor, tubería de perforación NQ (2 ¹⁵/16”, equivalente a 74,6 mm) y PQ (4”, equivalente a 101,6 mm), barril muestreador, brocas tipo corona con incrustaciones de diamante, barrenas tricónicas con insertos de carburo de tungsteno serie 8; barras NW varilla en longitud de 3,05 m y diámetro exterior de 66,7 mm, y adaptadores de tubería NQ a NW.
Figura 2. Equipo Mobile Drill (fondo) Equipo Ingetrol (derecha)
Para realizar las pruebas de permeabilidad se usó de manera rutinaria el equipo listado a continuación:
4.2. Equipo para pruebas de inyección Una Planta generadora de energía eléctrica de 50 KVA, a 220 y 110 Volts.
Contenedores para almacenamiento de agua.
Bomba tipo triplex para el suministro de agua desde el contenedor general.
Bomba de flujo constante (Moyno eléctrica de cañón 3L10) o inyector de pistón de doble acción como equipo de emergencia.
Manómetros con rango de 21 y 28 kg/cm².
Cronómetros.
Obturadores inflables hidroneumáticos para soportar 1,5 veces la presión máxima de trabajo, inflados a una presión del orden de 1,96 a 3,43 MPa (18 a 35 kg/cm²).
Tanque de nitrógeno con válvulas y manómetros de control.
Tubería galvanizada, 1”Ø interior, sin costura con longitud de 2,50 m y 1,00 m.
Accesorios de conexión como: coples, válvulas de esfera, conexión “T”, niples, etc.
Mangueras de alta presión de 1” de diámetro (25,4 mm).
Llaves stillson del número 24 y 36 con muelas en perfectas condiciones.
4.3. Equipo para pruebas de inyectabilidad de la roca
Un Turbomezclador de 1250 rpm mínimo para la fabricación de mezclas.
Un Mezclador (60 rpm), para mantener en agitación la mezcla.
Una Bomba o inyector de pistón de doble acción (tipo CLIVIO), capaz de alcanzar una presión mínima de 1,5 veces la presión máxima requerida estimada (del orden de 1 a 3 MPa, equivalente a 10 y 30 kg/cm²), con adaptador para estabilizar la presión.
64
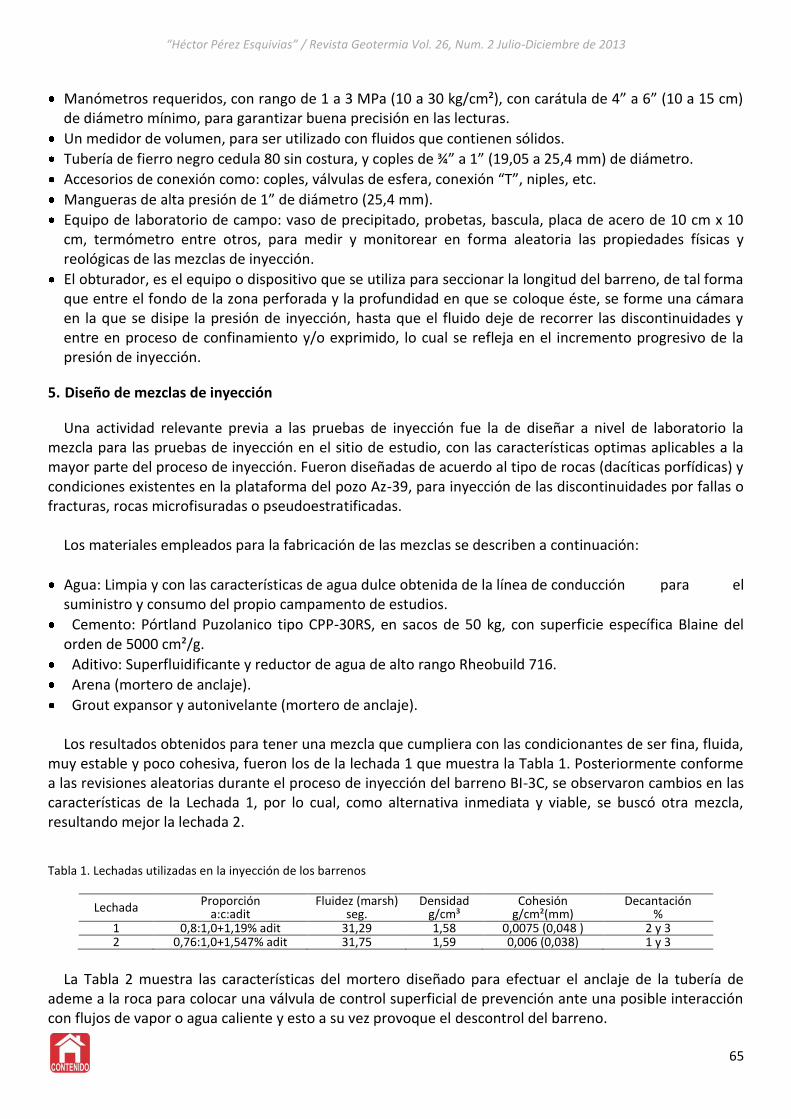
“Héctor Pérez Esquivias” / Revista Geotermia Vol. 26, Num. 2 Julio-Diciembre de 2013
Manómetros requeridos, con rango de 1 a 3 MPa (10 a 30 kg/cm²), con carátula de 4” a 6” (10 a 15 cm) de diámetro mínimo, para garantizar buena precisión en las lecturas.
Un medidor de volumen, para ser utilizado con fluidos que contienen sólidos.
Tubería de fierro negro cedula 80 sin costura, y coples de ¾” a 1” (19,05 a 25,4 mm) de diámetro.
Accesorios de conexión como: coples, válvulas de esfera, conexión “T”, niples, etc.
Mangueras de alta presión de 1” de diámetro (25,4 mm).
Equipo de laboratorio de campo: vaso de precipitado, probetas, bascula, placa de acero de 10 cm x 10 cm, termómetro entre otros, para medir y monitorear en forma aleatoria las propiedades físicas y reológicas de las mezclas de inyección.
El obturador, es el equipo o dispositivo que se utiliza para seccionar la longitud del barreno, de tal forma que entre el fondo de la zona perforada y la profundidad en que se coloque éste, se forme una cámara en la que se disipe la presión de inyección, hasta que el fluido deje de recorrer las discontinuidades y entre en proceso de confinamiento y/o exprimido, lo cual se refleja en el incremento progresivo de la presión de inyección.
5. Diseño de mezclas de inyección Una actividad relevante previa a las pruebas de inyección fue la de diseñar a nivel de laboratorio la
mezcla para las pruebas de inyección en el sitio de estudio, con las características optimas aplicables a la mayor parte del proceso de inyección. Fueron diseñadas de acuerdo al tipo de rocas (dacíticas porfídicas) y condiciones existentes en la plataforma del pozo Az-39, para inyección de las discontinuidades por fallas o fracturas, rocas microfisuradas o pseudoestratificadas.
Los materiales empleados para la fabricación de las mezclas se describen a continuación:
Agua: Limpia y con las características de agua dulce obtenida de la línea de conducción para el suministro y consumo del propio campamento de estudios.
Cemento: Pórtland Puzolanico tipo CPP-30RS, en sacos de 50 kg, con superficie específica Blaine del orden de 5000 cm²/g.
Aditivo: Superfluidificante y reductor de agua de alto rango Rheobuild 716.
Arena (mortero de anclaje).
Grout expansor y autonivelante (mortero de anclaje). Los resultados obtenidos para tener una mezcla que cumpliera con las condicionantes de ser fina, fluida,
muy estable y poco cohesiva, fueron los de la lechada 1 que muestra la Tabla 1. Posteriormente conforme a las revisiones aleatorias durante el proceso de inyección del barreno BI-3C, se observaron cambios en las características de la Lechada 1, por lo cual, como alternativa inmediata y viable, se buscó otra mezcla, resultando mejor la lechada 2.
Tabla 1. Lechadas utilizadas en la inyección de los barrenos
Lechada Proporción
a:c:adit Fluidez (marsh)
seg. Densidad
g/cm³ Cohesión
g/cm²(mm) Decantación
% 1 0,8:1,0+1,19% adit 31,29 1,58 0,0075 (0,048 ) 2 y 3 2 0,76:1,0+1,547% adit 31,75 1,59 0,006 (0,038) 1 y 3
La Tabla 2 muestra las características del mortero diseñado para efectuar el anclaje de la tubería de
ademe a la roca para colocar una válvula de control superficial de prevención ante una posible interacción con flujos de vapor o agua caliente y esto a su vez provoque el descontrol del barreno.
65
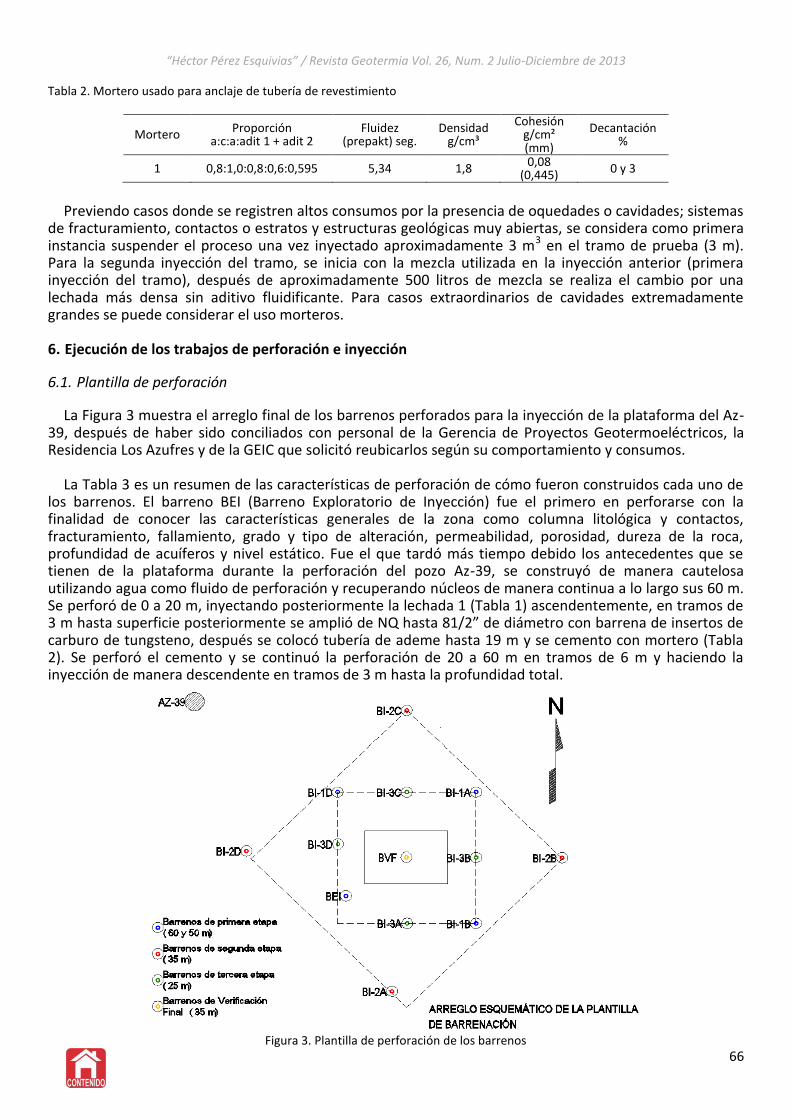
“Héctor Pérez Esquivias” / Revista Geotermia Vol. 26, Num. 2 Julio-Diciembre de 2013
Tabla 2. Mortero usado para anclaje de tubería de revestimiento
Mortero Proporción a:c:a:adit 1 + adit 2
Fluidez (prepakt) seg.
Densidad g/cm³
Cohesión g/cm² (mm)
Decantación %
1 0,8:1,0:0,8:0,6:0,595 5,34 1,8 0,08
(0,445) 0 y 3
Previendo casos donde se registren altos consumos por la presencia de oquedades o cavidades; sistemas
de fracturamiento, contactos o estratos y estructuras geológicas muy abiertas, se considera como primera instancia suspender el proceso una vez inyectado aproximadamente 3 m3 en el tramo de prueba (3 m). Para la segunda inyección del tramo, se inicia con la mezcla utilizada en la inyección anterior (primera inyección del tramo), después de aproximadamente 500 litros de mezcla se realiza el cambio por una lechada más densa sin aditivo fluidificante. Para casos extraordinarios de cavidades extremadamente grandes se puede considerar el uso morteros.
6. Ejecución de los trabajos de perforación e inyección
6.1. Plantilla de perforación La Figura 3 muestra el arreglo final de los barrenos perforados para la inyección de la plataforma del Az-
39, después de haber sido conciliados con personal de la Gerencia de Proyectos Geotermoeléctricos, la Residencia Los Azufres y de la GEIC que solicitó reubicarlos según su comportamiento y consumos.
La Tabla 3 es un resumen de las características de perforación de cómo fueron construidos cada uno de
los barrenos. El barreno BEI (Barreno Exploratorio de Inyección) fue el primero en perforarse con la finalidad de conocer las características generales de la zona como columna litológica y contactos, fracturamiento, fallamiento, grado y tipo de alteración, permeabilidad, porosidad, dureza de la roca, profundidad de acuíferos y nivel estático. Fue el que tardó más tiempo debido los antecedentes que se tienen de la plataforma durante la perforación del pozo Az-39, se construyó de manera cautelosa utilizando agua como fluido de perforación y recuperando núcleos de manera continua a lo largo sus 60 m. Se perforó de 0 a 20 m, inyectando posteriormente la lechada 1 (Tabla 1) ascendentemente, en tramos de 3 m hasta superficie posteriormente se amplió de NQ hasta 81/2” de diámetro con barrena de insertos de carburo de tungsteno, después se colocó tubería de ademe hasta 19 m y se cemento con mortero (Tabla 2). Se perforó el cemento y se continuó la perforación de 20 a 60 m en tramos de 6 m y haciendo la inyección de manera descendente en tramos de 3 m hasta la profundidad total.
Figura 3. Plantilla de perforación de los barrenos
66
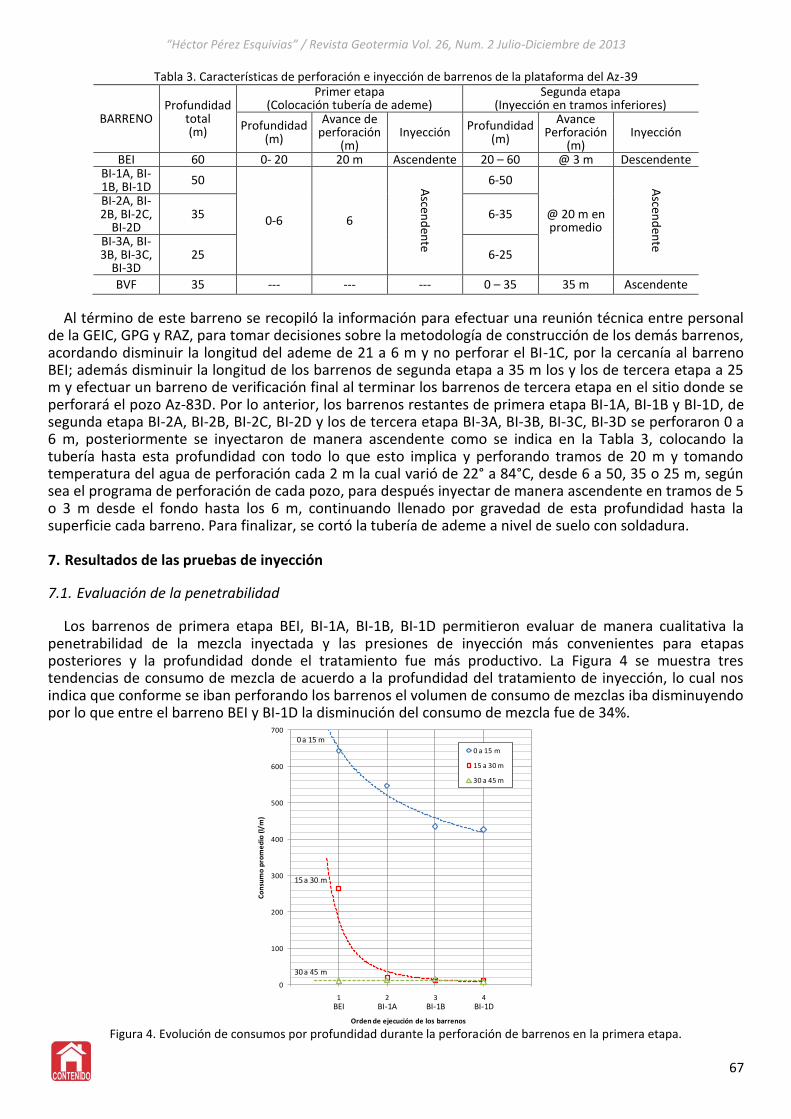
“Héctor Pérez Esquivias” / Revista Geotermia Vol. 26, Num. 2 Julio-Diciembre de 2013
Tabla 3. Características de perforación e inyección de barrenos de la plataforma del Az-39
BARRENO Profundidad
total (m)
Primer etapa (Colocación tubería de ademe)
Segunda etapa (Inyección en tramos inferiores)
Profundidad (m)
Avance de perforación
(m) Inyección
Profundidad (m)
Avance Perforación
(m) Inyección
BEI 60 0- 20 20 m Ascendente 20 – 60 @ 3 m Descendente BI-1A, BI-1B, BI-1D
50
0-6 6
Ascen
den
te
6-50
@ 20 m en promedio
Ascen
den
te
BI-2A, BI-2B, BI-2C,
BI-2D 35 6-35
BI-3A, BI-3B, BI-3C,
BI-3D 25 6-25
BVF 35 --- --- --- 0 – 35 35 m Ascendente
Al término de este barreno se recopiló la información para efectuar una reunión técnica entre personal de la GEIC, GPG y RAZ, para tomar decisiones sobre la metodología de construcción de los demás barrenos, acordando disminuir la longitud del ademe de 21 a 6 m y no perforar el BI-1C, por la cercanía al barreno BEI; además disminuir la longitud de los barrenos de segunda etapa a 35 m los y los de tercera etapa a 25 m y efectuar un barreno de verificación final al terminar los barrenos de tercera etapa en el sitio donde se perforará el pozo Az-83D. Por lo anterior, los barrenos restantes de primera etapa BI-1A, BI-1B y BI-1D, de segunda etapa BI-2A, BI-2B, BI-2C, BI-2D y los de tercera etapa BI-3A, BI-3B, BI-3C, BI-3D se perforaron 0 a 6 m, posteriormente se inyectaron de manera ascendente como se indica en la Tabla 3, colocando la tubería hasta esta profundidad con todo lo que esto implica y perforando tramos de 20 m y tomando temperatura del agua de perforación cada 2 m la cual varió de 22° a 84°C, desde 6 a 50, 35 o 25 m, según sea el programa de perforación de cada pozo, para después inyectar de manera ascendente en tramos de 5 o 3 m desde el fondo hasta los 6 m, continuando llenado por gravedad de esta profundidad hasta la superficie cada barreno. Para finalizar, se cortó la tubería de ademe a nivel de suelo con soldadura.
7. Resultados de las pruebas de inyección
7.1. Evaluación de la penetrabilidad
Los barrenos de primera etapa BEI, BI-1A, BI-1B, BI-1D permitieron evaluar de manera cualitativa la penetrabilidad de la mezcla inyectada y las presiones de inyección más convenientes para etapas posteriores y la profundidad donde el tratamiento fue más productivo. La Figura 4 se muestra tres tendencias de consumo de mezcla de acuerdo a la profundidad del tratamiento de inyección, lo cual nos indica que conforme se iban perforando los barrenos el volumen de consumo de mezclas iba disminuyendo por lo que entre el barreno BEI y BI-1D la disminución del consumo de mezcla fue de 34%.
0
100
200
300
400
500
600
700
0 1 2 3 4 5
Co
nsu
mo
pro
me
dio
(l/
m)
Orden de ejecución de los barrenos
0 a 15 m
15 a 30 m
30 a 45 m
0 a 15 m
30 a 45 m
15 a 30 m
BEI BI-1A BI-1B BI-1D
Figura 4. Evolución de consumos por profundidad durante la perforación de barrenos en la primera etapa.
67
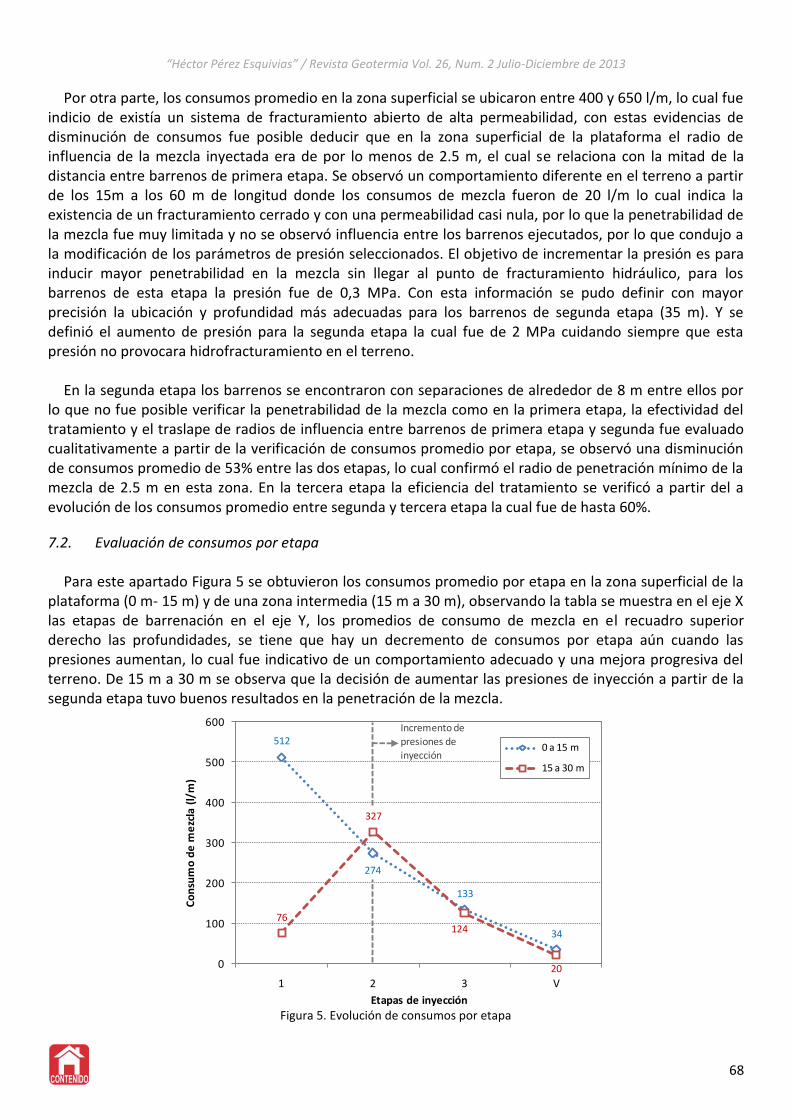
“Héctor Pérez Esquivias” / Revista Geotermia Vol. 26, Num. 2 Julio-Diciembre de 2013
Por otra parte, los consumos promedio en la zona superficial se ubicaron entre 400 y 650 l/m, lo cual fue indicio de existía un sistema de fracturamiento abierto de alta permeabilidad, con estas evidencias de disminución de consumos fue posible deducir que en la zona superficial de la plataforma el radio de influencia de la mezcla inyectada era de por lo menos de 2.5 m, el cual se relaciona con la mitad de la distancia entre barrenos de primera etapa. Se observó un comportamiento diferente en el terreno a partir de los 15m a los 60 m de longitud donde los consumos de mezcla fueron de 20 l/m lo cual indica la existencia de un fracturamiento cerrado y con una permeabilidad casi nula, por lo que la penetrabilidad de la mezcla fue muy limitada y no se observó influencia entre los barrenos ejecutados, por lo que condujo a la modificación de los parámetros de presión seleccionados. El objetivo de incrementar la presión es para inducir mayor penetrabilidad en la mezcla sin llegar al punto de fracturamiento hidráulico, para los barrenos de esta etapa la presión fue de 0,3 MPa. Con esta información se pudo definir con mayor precisión la ubicación y profundidad más adecuadas para los barrenos de segunda etapa (35 m). Y se definió el aumento de presión para la segunda etapa la cual fue de 2 MPa cuidando siempre que esta presión no provocara hidrofracturamiento en el terreno.
En la segunda etapa los barrenos se encontraron con separaciones de alrededor de 8 m entre ellos por
lo que no fue posible verificar la penetrabilidad de la mezcla como en la primera etapa, la efectividad del tratamiento y el traslape de radios de influencia entre barrenos de primera etapa y segunda fue evaluado cualitativamente a partir de la verificación de consumos promedio por etapa, se observó una disminución de consumos promedio de 53% entre las dos etapas, lo cual confirmó el radio de penetración mínimo de la mezcla de 2.5 m en esta zona. En la tercera etapa la eficiencia del tratamiento se verificó a partir del a evolución de los consumos promedio entre segunda y tercera etapa la cual fue de hasta 60%.
7.2. Evaluación de consumos por etapa Para este apartado Figura 5 se obtuvieron los consumos promedio por etapa en la zona superficial de la
plataforma (0 m- 15 m) y de una zona intermedia (15 m a 30 m), observando la tabla se muestra en el eje X las etapas de barrenación en el eje Y, los promedios de consumo de mezcla en el recuadro superior derecho las profundidades, se tiene que hay un decremento de consumos por etapa aún cuando las presiones aumentan, lo cual fue indicativo de un comportamiento adecuado y una mejora progresiva del terreno. De 15 m a 30 m se observa que la decisión de aumentar las presiones de inyección a partir de la segunda etapa tuvo buenos resultados en la penetración de la mezcla.
512
274
133
34
76
327
124
200
100
200
300
400
500
600
1 2 3 V
Co
nsu
mo
de
me
zcla
(l/
m)
Etapas de inyección
0 a 15 m
15 a 30 m
Incremento de
presiones de inyección
Figura 5. Evolución de consumos por etapa
68
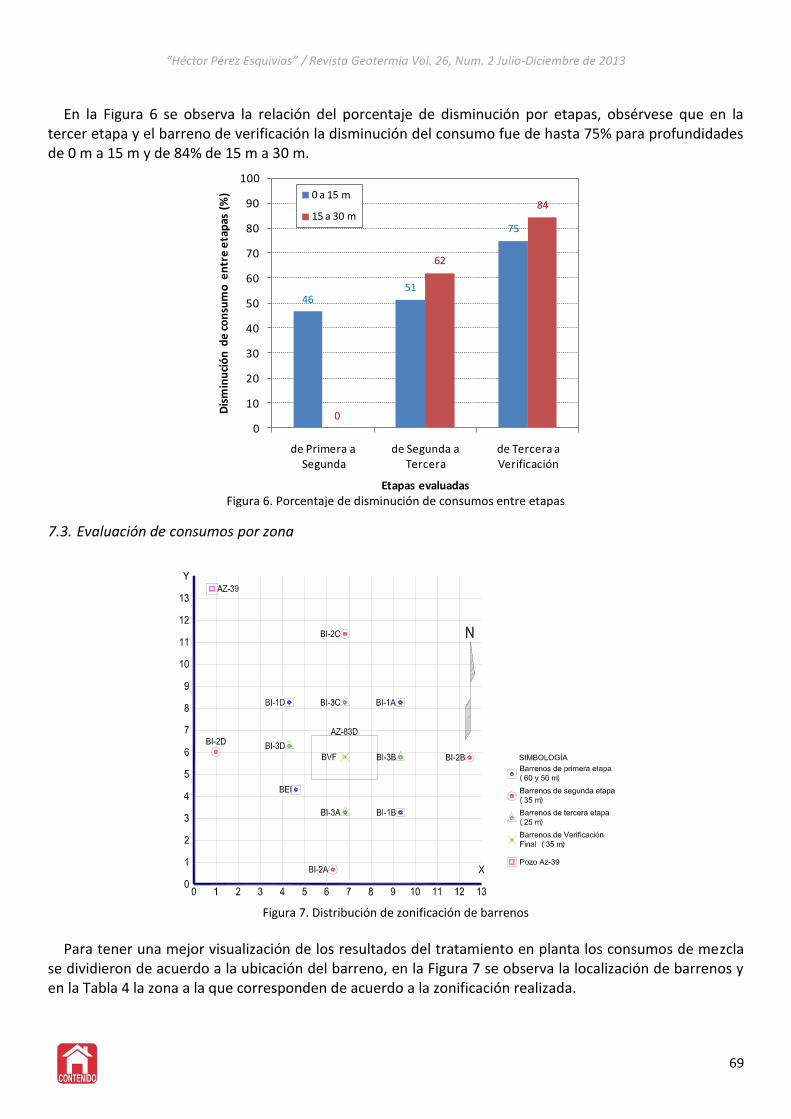
“Héctor Pérez Esquivias” / Revista Geotermia Vol. 26, Num. 2 Julio-Diciembre de 2013
En la Figura 6 se observa la relación del porcentaje de disminución por etapas, obsérvese que en la
tercer etapa y el barreno de verificación la disminución del consumo fue de hasta 75% para profundidades de 0 m a 15 m y de 84% de 15 m a 30 m.
4651
75
0
62
84
0
10
20
30
40
50
60
70
80
90
100
de Primera aSegunda
de Segunda a Tercera
de Tercera a Verificación
Dis
min
uci
ón
de
co
nsu
mo
en
tre
eta
pas
(%
)
Etapas evaluadas
0 a 15 m
15 a 30 m
Figura 6. Porcentaje de disminución de consumos entre etapas
7.3. Evaluación de consumos por zona
Figura 7. Distribución de zonificación de barrenos
Para tener una mejor visualización de los resultados del tratamiento en planta los consumos de mezcla
se dividieron de acuerdo a la ubicación del barreno, en la Figura 7 se observa la localización de barrenos y en la Tabla 4 la zona a la que corresponden de acuerdo a la zonificación realizada.
69
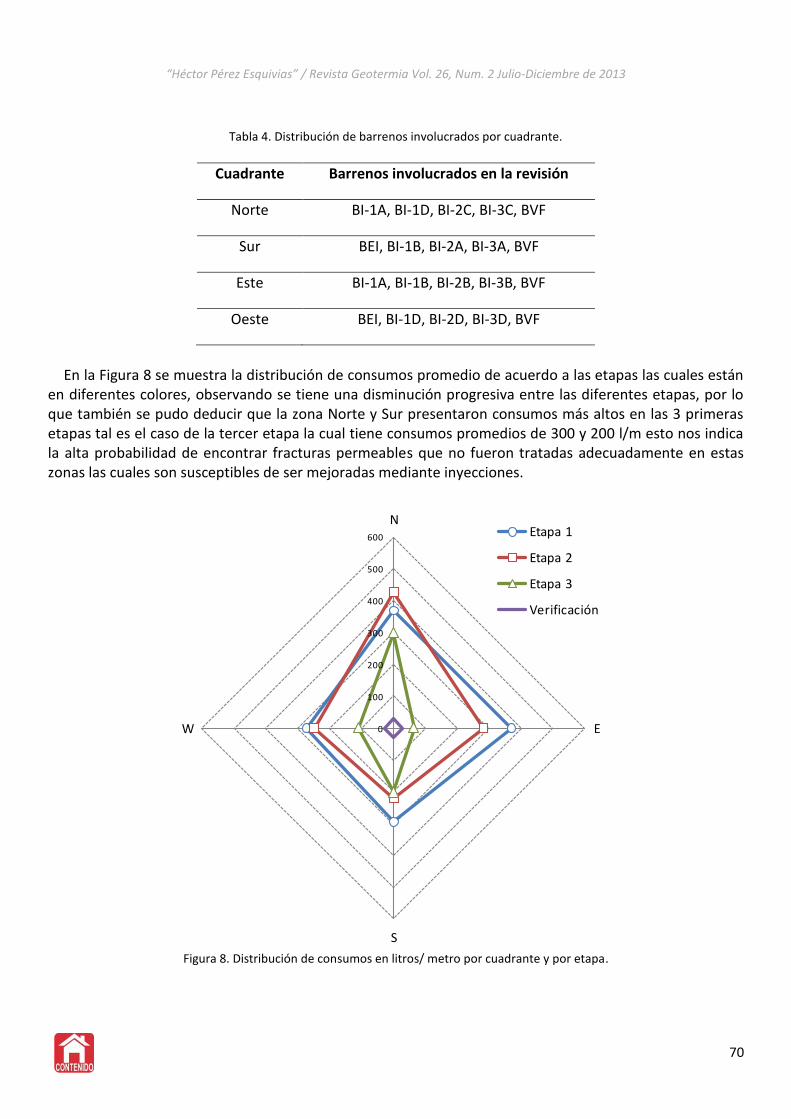
“Héctor Pérez Esquivias” / Revista Geotermia Vol. 26, Num. 2 Julio-Diciembre de 2013
Tabla 4. Distribución de barrenos involucrados por cuadrante.
Cuadrante Barrenos involucrados en la revisión
Norte BI-1A, BI-1D, BI-2C, BI-3C, BVF
Sur BEI, BI-1B, BI-2A, BI-3A, BVF
Este BI-1A, BI-1B, BI-2B, BI-3B, BVF
Oeste BEI, BI-1D, BI-2D, BI-3D, BVF
En la Figura 8 se muestra la distribución de consumos promedio de acuerdo a las etapas las cuales están
en diferentes colores, observando se tiene una disminución progresiva entre las diferentes etapas, por lo que también se pudo deducir que la zona Norte y Sur presentaron consumos más altos en las 3 primeras etapas tal es el caso de la tercer etapa la cual tiene consumos promedios de 300 y 200 l/m esto nos indica la alta probabilidad de encontrar fracturas permeables que no fueron tratadas adecuadamente en estas zonas las cuales son susceptibles de ser mejoradas mediante inyecciones.
0
100
200
300
400
500
600
N
E
S
W
Etapa 1
Etapa 2
Etapa 3
Verificación
Figura 8. Distribución de consumos en litros/ metro por cuadrante y por etapa.
70
“Héctor Pérez Esquivias” / Revista Geotermia Vol. 26, Num. 2 Julio-Diciembre de 2013
8. Conclusiones
A. Bajo un criterio de revisión basado en la disminución del consumo de mezcla por etapas y el aumento en las presiones de inyección aplicadas, se confirmó la eficiencia del tratamiento mediante inyecciones.
B. Cualitativamente se corroboró un aumento en las propiedades mecánicas del macizo rocoso tratado y una disminución de la permeabilidad del sistema de fracturamiento, especialmente en las zonas superficiales de la plataforma.
C. Las condiciones descritas en los dos puntos anteriores pudieron ser verificadas durante el periodo de ejecución de los trabajos en campo (alrededor de 6 meses), sin embargo, su comportamiento a largo plazo solo podrá ser confirmado a través de un monitoreo de las condiciones de la zona tratada e inspecciones durante la etapa de perforación del pozo de producción.
D. De a cuerdo con la revisión de los resultados por zonas, las secciones noroeste de 0 a 15 m y la zona sur de 15 a 30 m, aún pueden ser mejoradas mediante inyecciones.
E. Mediante inspección óptica de los núcleos recuperados y a partir de la evolución de las inyecciones, se puede deducir que las fracturas de apertura mayor, y por lo tanto más conductivas, fueron tratadas de forma eficiente, sin embargo, los sistemas de fracturamiento más cerrados, que también pueden ser permeables, aún son susceptibles de mejoramiento mediante inyecciones.
9. Recomendaciones
A. Revisar el comportamiento de una mezcla a base de cemento con otros aditivos y rellenos inertes que mejoren sus propiedades relacionadas con:
a. Fraguado ante altas temperaturas b. Comportamiento a largo plazo bajo condiciones agresivas
B. Para otros mejoramientos de terreno con características similares es recomendable emplear una metodología observacional de inyección basada en la evaluación de diferentes controles de calidad
C. Elaborar un procedimiento escrito para el tratamiento de este tipo de inconvenientes en los pozos geotérmicos conjuntamente entre la GEIC y RAZ.
Referencias [1] Comisión Federal De Electricidad. Residencia de Estudios Los Azufres, Gerencia de Proyectos Geotermoeléctricos.
(1982). “Informe Geológico del Pozo Az-39”. CFE.
*2+ González De Vallejo Luís, Ferrer M, Ortuño L, Oteo. (2002). “Ingeniería Geológica”. Ed. Pearson Prentice Hall. Pearson Educación. Madrid, España.
[3] RANAL V. GILES, JACK B. EVETT, CHENG LIU. (1994) “Mecánica de los Fluidos e Hidráulica” Ed. Mc. Graw Hill. Edigrafos, España.
*4+ Juárez Badillo Eulalio y Rico Rodriguez Alonso., “Mecánica De Suelos Tomo III, Flujo De Agua En Suelos” Ed. Limusa, México, 1980
*5+ Rico Rodriguez Alfonzo y Del Castillo Hermilo., “La Ingeniería De Suelos, En Las Vías Terrestres” Ed. Limusa, México, 1980
*6+ Marsal R J y Resendiz D., “Presas de tierra y enrocamiento”, Ed. Limusa, 1983.
[7] Fernández Loaiza, Carlos. “Mejoramiento y Estabilización de Suelos”, Ed. Limusa
71
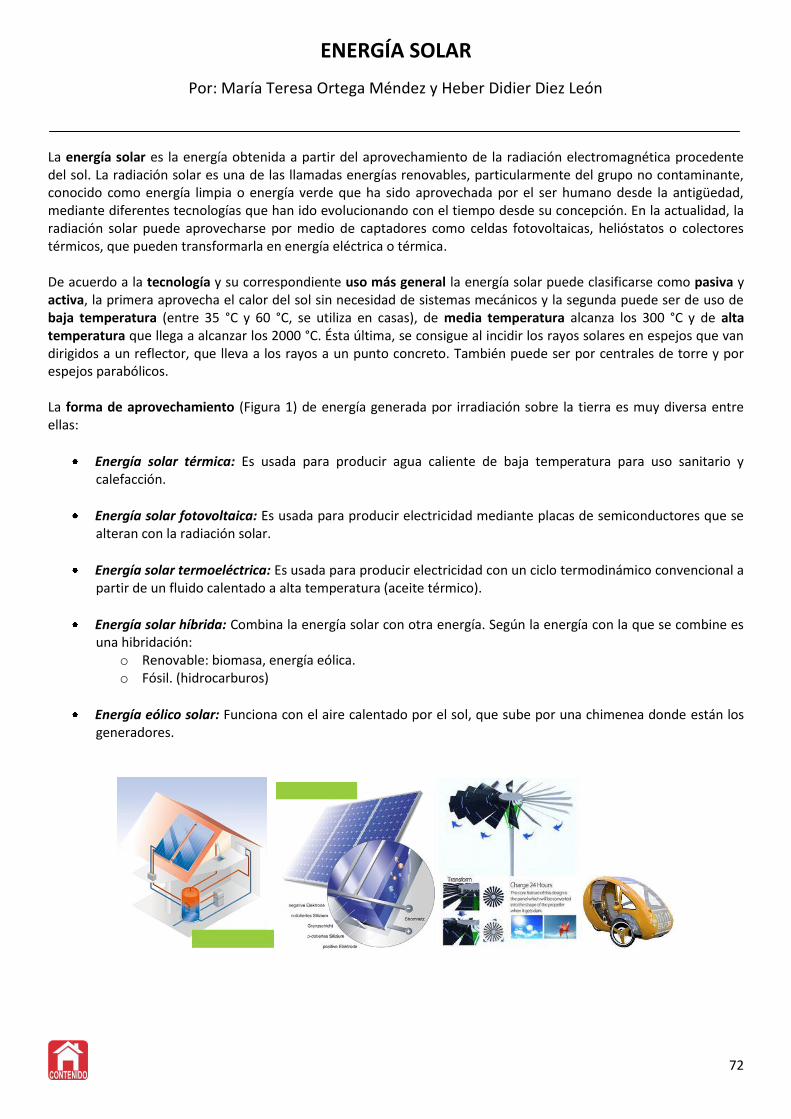
ENERGÍA SOLAR
Por: María Teresa Ortega Méndez y Heber Didier Diez León
La energía solar es la energía obtenida a partir del aprovechamiento de la radiación electromagnética procedente del sol. La radiación solar es una de las llamadas energías renovables, particularmente del grupo no contaminante, conocido como energía limpia o energía verde que ha sido aprovechada por el ser humano desde la antigüedad, mediante diferentes tecnologías que han ido evolucionando con el tiempo desde su concepción. En la actualidad, la radiación solar puede aprovecharse por medio de captadores como celdas fotovoltaicas, helióstatos o colectores térmicos, que pueden transformarla en energía eléctrica o térmica. De acuerdo a la tecnología y su correspondiente uso más general la energía solar puede clasificarse como pasiva y activa, la primera aprovecha el calor del sol sin necesidad de sistemas mecánicos y la segunda puede ser de uso de baja temperatura (entre 35 °C y 60 °C, se utiliza en casas), de media temperatura alcanza los 300 °C y de alta temperatura que llega a alcanzar los 2000 °C. Ésta última, se consigue al incidir los rayos solares en espejos que van dirigidos a un reflector, que lleva a los rayos a un punto concreto. También puede ser por centrales de torre y por espejos parabólicos. La forma de aprovechamiento (Figura 1) de energía generada por irradiación sobre la tierra es muy diversa entre ellas:
Energía solar térmica: Es usada para producir agua caliente de baja temperatura para uso sanitario y calefacción.
Energía solar fotovoltaica: Es usada para producir electricidad mediante placas de semiconductores que se alteran con la radiación solar.
Energía solar termoeléctrica: Es usada para producir electricidad con un ciclo termodinámico convencional a partir de un fluido calentado a alta temperatura (aceite térmico).
Energía solar híbrida: Combina la energía solar con otra energía. Según la energía con la que se combine es una hibridación:
o Renovable: biomasa, energía eólica. o Fósil. (hidrocarburos)
Energía eólico solar: Funciona con el aire calentado por el sol, que sube por una chimenea donde están los generadores.
72
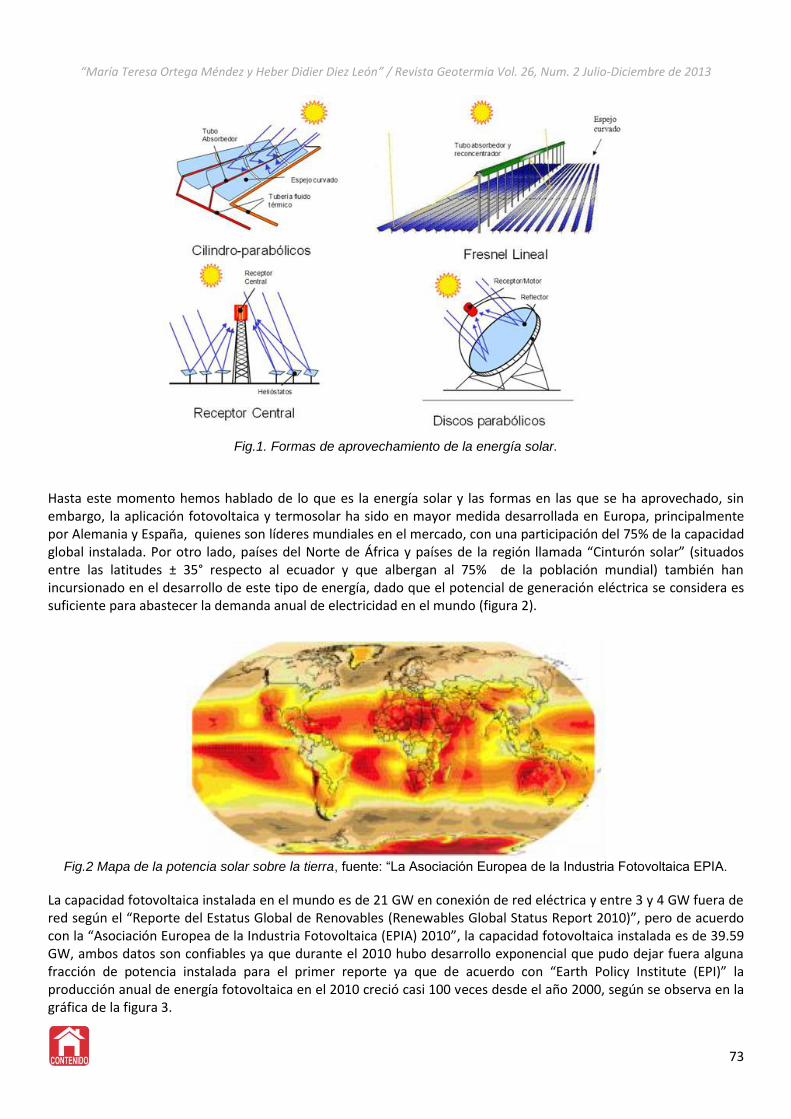
“María Teresa Ortega Méndez y Heber Didier Diez León” / Revista Geotermia Vol. 26, Num. 2 Julio-Diciembre de 2013
Fig.1. Formas de aprovechamiento de la energía solar.
Hasta este momento hemos hablado de lo que es la energía solar y las formas en las que se ha aprovechado, sin embargo, la aplicación fotovoltaica y termosolar ha sido en mayor medida desarrollada en Europa, principalmente por Alemania y España, quienes son líderes mundiales en el mercado, con una participación del 75% de la capacidad global instalada. Por otro lado, países del Norte de África y países de la región llamada “Cinturón solar” (situados entre las latitudes ± 35° respecto al ecuador y que albergan al 75% de la población mundial) también han incursionado en el desarrollo de este tipo de energía, dado que el potencial de generación eléctrica se considera es suficiente para abastecer la demanda anual de electricidad en el mundo (figura 2).
Fig.2 Mapa de la potencia solar sobre la tierra, fuente: “La Asociación Europea de la Industria Fotovoltaica EPIA.
La capacidad fotovoltaica instalada en el mundo es de 21 GW en conexión de red eléctrica y entre 3 y 4 GW fuera de red según el “Reporte del Estatus Global de Renovables (Renewables Global Status Report 2010)”, pero de acuerdo con la “Asociación Europea de la Industria Fotovoltaica (EPIA) 2010”, la capacidad fotovoltaica instalada es de 39.59 GW, ambos datos son confiables ya que durante el 2010 hubo desarrollo exponencial que pudo dejar fuera alguna fracción de potencia instalada para el primer reporte ya que de acuerdo con “Earth Policy Institute (EPI)” la producción anual de energía fotovoltaica en el 2010 creció casi 100 veces desde el año 2000, según se observa en la gráfica de la figura 3.
73
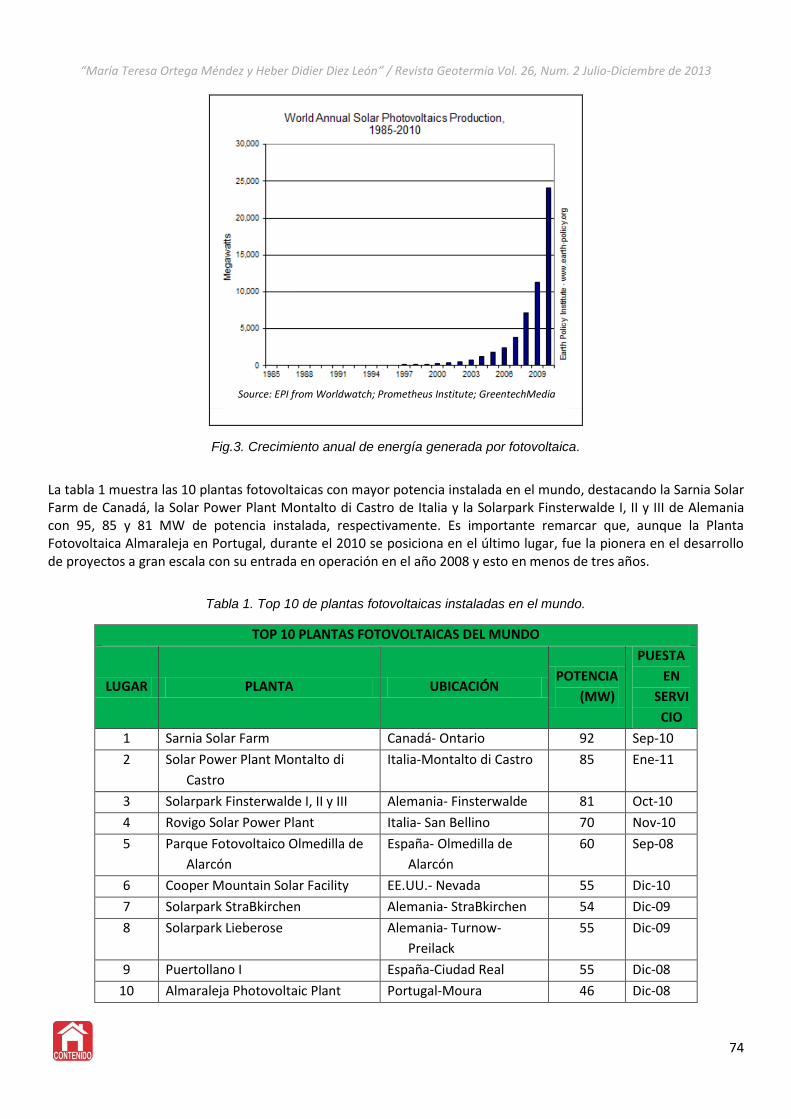
“María Teresa Ortega Méndez y Heber Didier Diez León” / Revista Geotermia Vol. 26, Num. 2 Julio-Diciembre de 2013
Fig.3. Crecimiento anual de energía generada por fotovoltaica.
La tabla 1 muestra las 10 plantas fotovoltaicas con mayor potencia instalada en el mundo, destacando la Sarnia Solar Farm de Canadá, la Solar Power Plant Montalto di Castro de Italia y la Solarpark Finsterwalde I, II y III de Alemania con 95, 85 y 81 MW de potencia instalada, respectivamente. Es importante remarcar que, aunque la Planta Fotovoltaica Almaraleja en Portugal, durante el 2010 se posiciona en el último lugar, fue la pionera en el desarrollo de proyectos a gran escala con su entrada en operación en el año 2008 y esto en menos de tres años.
Tabla 1. Top 10 de plantas fotovoltaicas instaladas en el mundo.
TOP 10 PLANTAS FOTOVOLTAICAS DEL MUNDO
LUGAR PLANTA UBICACIÓN POTENCIA
(MW)
PUESTA
EN
SERVI
CIO
1 Sarnia Solar Farm Canadá- Ontario 92 Sep-10
2 Solar Power Plant Montalto di
Castro
Italia-Montalto di Castro 85 Ene-11
3 Solarpark Finsterwalde I, II y III Alemania- Finsterwalde 81 Oct-10
4 Rovigo Solar Power Plant Italia- San Bellino 70 Nov-10
5 Parque Fotovoltaico Olmedilla de
Alarcón
España- Olmedilla de
Alarcón
60 Sep-08
6 Cooper Mountain Solar Facility EE.UU.- Nevada 55 Dic-10
7 Solarpark StraBkirchen Alemania- StraBkirchen 54 Dic-09
8 Solarpark Lieberose Alemania- Turnow-
Preilack
55 Dic-09
9 Puertollano I España-Ciudad Real 55 Dic-08
10 Almaraleja Photovoltaic Plant Portugal-Moura 46 Dic-08
74
Source: EPI from Worldwatch; Prometheus Institute; GreentechMedia
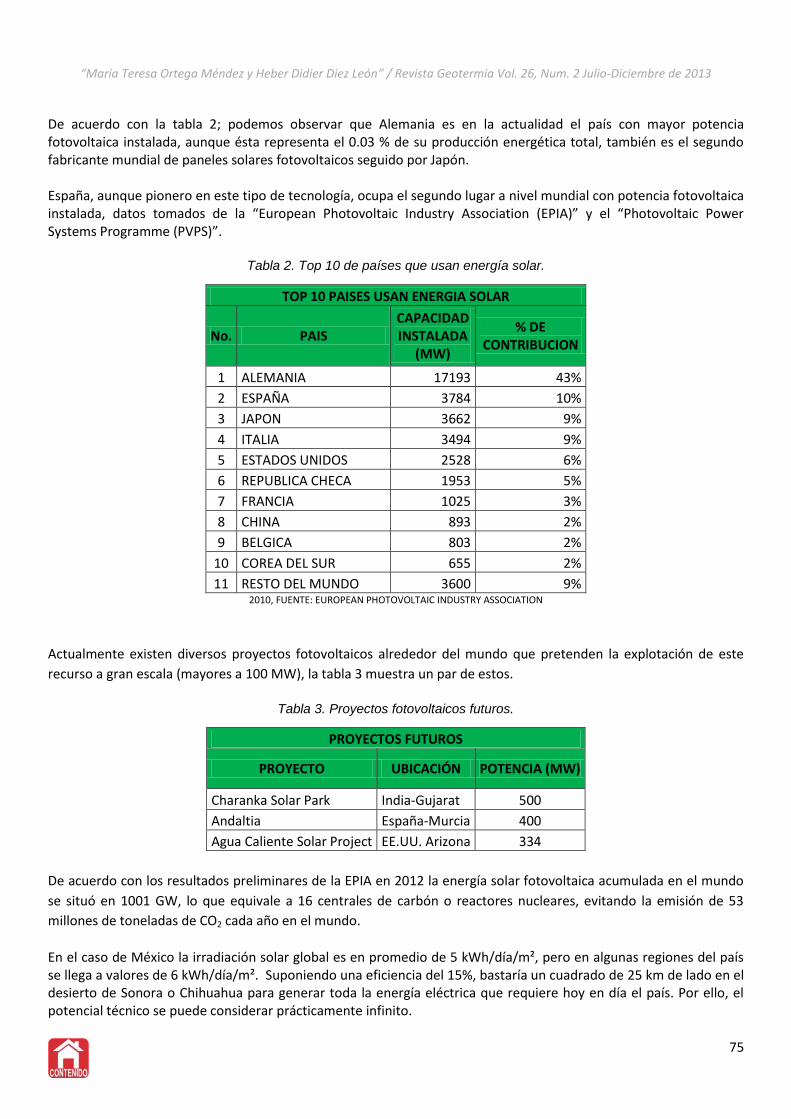
“María Teresa Ortega Méndez y Heber Didier Diez León” / Revista Geotermia Vol. 26, Num. 2 Julio-Diciembre de 2013
De acuerdo con la tabla 2; podemos observar que Alemania es en la actualidad el país con mayor potencia fotovoltaica instalada, aunque ésta representa el 0.03 % de su producción energética total, también es el segundo fabricante mundial de paneles solares fotovoltaicos seguido por Japón. España, aunque pionero en este tipo de tecnología, ocupa el segundo lugar a nivel mundial con potencia fotovoltaica instalada, datos tomados de la “European Photovoltaic Industry Association (EPIA)” y el “Photovoltaic Power Systems Programme (PVPS)”.
Tabla 2. Top 10 de países que usan energía solar.
TOP 10 PAISES USAN ENERGIA SOLAR
No. PAIS CAPACIDAD INSTALADA
(MW)
% DE CONTRIBUCION
1 ALEMANIA 17193 43%
2 ESPAÑA 3784 10%
3 JAPON 3662 9%
4 ITALIA 3494 9%
5 ESTADOS UNIDOS 2528 6%
6 REPUBLICA CHECA 1953 5%
7 FRANCIA 1025 3%
8 CHINA 893 2%
9 BELGICA 803 2%
10 COREA DEL SUR 655 2%
11 RESTO DEL MUNDO 3600 9% 2010, FUENTE: EUROPEAN PHOTOVOLTAIC INDUSTRY ASSOCIATION
Actualmente existen diversos proyectos fotovoltaicos alrededor del mundo que pretenden la explotación de este
recurso a gran escala (mayores a 100 MW), la tabla 3 muestra un par de estos.
Tabla 3. Proyectos fotovoltaicos futuros.
PROYECTOS FUTUROS
PROYECTO UBICACIÓN POTENCIA (MW)
Charanka Solar Park India-Gujarat 500
Andaltia España-Murcia 400
Agua Caliente Solar Project EE.UU. Arizona 334
De acuerdo con los resultados preliminares de la EPIA en 2012 la energía solar fotovoltaica acumulada en el mundo
se situó en 1001 GW, lo que equivale a 16 centrales de carbón o reactores nucleares, evitando la emisión de 53
millones de toneladas de CO2 cada año en el mundo.
En el caso de México la irradiación solar global es en promedio de 5 kWh/día/m², pero en algunas regiones del país se llega a valores de 6 kWh/día/m². Suponiendo una eficiencia del 15%, bastaría un cuadrado de 25 km de lado en el desierto de Sonora o Chihuahua para generar toda la energía eléctrica que requiere hoy en día el país. Por ello, el potencial técnico se puede considerar prácticamente infinito.
75
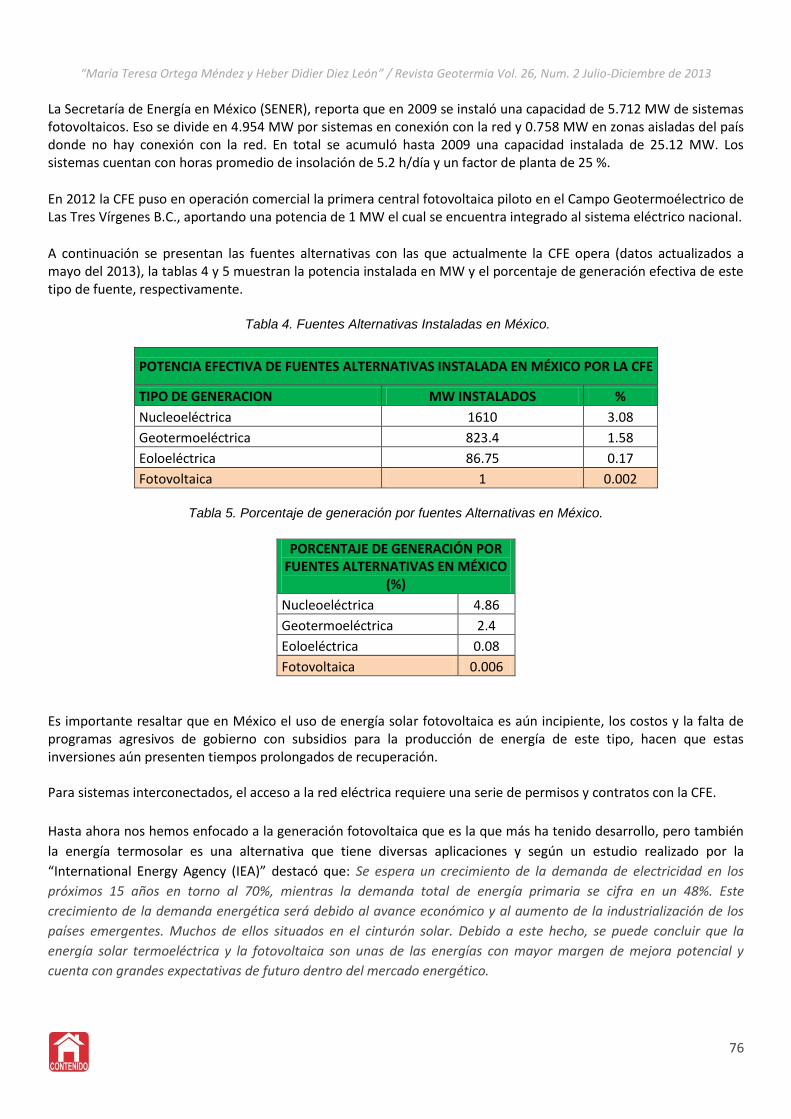
“María Teresa Ortega Méndez y Heber Didier Diez León” / Revista Geotermia Vol. 26, Num. 2 Julio-Diciembre de 2013
La Secretaría de Energía en México (SENER), reporta que en 2009 se instaló una capacidad de 5.712 MW de sistemas fotovoltaicos. Eso se divide en 4.954 MW por sistemas en conexión con la red y 0.758 MW en zonas aisladas del país donde no hay conexión con la red. En total se acumuló hasta 2009 una capacidad instalada de 25.12 MW. Los sistemas cuentan con horas promedio de insolación de 5.2 h/día y un factor de planta de 25 %.
En 2012 la CFE puso en operación comercial la primera central fotovoltaica piloto en el Campo Geotermoélectrico de Las Tres Vírgenes B.C., aportando una potencia de 1 MW el cual se encuentra integrado al sistema eléctrico nacional.
A continuación se presentan las fuentes alternativas con las que actualmente la CFE opera (datos actualizados a mayo del 2013), la tablas 4 y 5 muestran la potencia instalada en MW y el porcentaje de generación efectiva de este tipo de fuente, respectivamente.
Tabla 4. Fuentes Alternativas Instaladas en México.
POTENCIA EFECTIVA DE FUENTES ALTERNATIVAS INSTALADA EN MÉXICO POR LA CFE
TIPO DE GENERACION MW INSTALADOS %
Nucleoeléctrica 1610 3.08
Geotermoeléctrica 823.4 1.58
Eoloeléctrica 86.75 0.17
Fotovoltaica 1 0.002
Tabla 5. Porcentaje de generación por fuentes Alternativas en México.
PORCENTAJE DE GENERACIÓN POR
FUENTES ALTERNATIVAS EN MÉXICO (%)
Nucleoeléctrica 4.86
Geotermoeléctrica 2.4
Eoloeléctrica 0.08
Fotovoltaica 0.006
Es importante resaltar que en México el uso de energía solar fotovoltaica es aún incipiente, los costos y la falta de programas agresivos de gobierno con subsidios para la producción de energía de este tipo, hacen que estas inversiones aún presenten tiempos prolongados de recuperación. Para sistemas interconectados, el acceso a la red eléctrica requiere una serie de permisos y contratos con la CFE.
Hasta ahora nos hemos enfocado a la generación fotovoltaica que es la que más ha tenido desarrollo, pero también
la energía termosolar es una alternativa que tiene diversas aplicaciones y según un estudio realizado por la
“International Energy Agency (IEA)” destacó que: Se espera un crecimiento de la demanda de electricidad en los
próximos 15 años en torno al 70%, mientras la demanda total de energía primaria se cifra en un 48%. Este
crecimiento de la demanda energética será debido al avance económico y al aumento de la industrialización de los
países emergentes. Muchos de ellos situados en el cinturón solar. Debido a este hecho, se puede concluir que la
energía solar termoeléctrica y la fotovoltaica son unas de las energías con mayor margen de mejora potencial y
cuenta con grandes expectativas de futuro dentro del mercado energético.
76
“María Teresa Ortega Méndez y Heber Didier Diez León” / Revista Geotermia Vol. 26, Num. 2 Julio-Diciembre de 2013
A continuación mostramos sólo algunas aplicaciones de la Energía Solar:
Granjas solares
Central térmica solar, como: Potabilización de agua, Cocina solar, destilación, evaporación, fotosíntesis, secado.
Arquitectura sustentable
Acondicionamiento y ahorro de energía en edificaciones.
Calentamiento de agua.
Calefacción doméstica.
Energía para pequeños electrodomésticos.
Telecomunicaciones.
Supervisión Remota.
Abastecimiento de electricidad para comunidades rurales.
Calculadoras, relojes.
Satélites Espaciales. Ventajas
La radiación solar es prácticamente infinita. La tecnología fotovoltaica permite soluciones a la medida y autónomas. La operación de los sistemas fotovoltaicos es “generalmente amigable” con el medio ambiente. Los sistemas tienen una vida útil de más de 20 años. El mantenimiento de los sistemas fotovoltaicos es sencillo y tiene costos muy bajos. La tecnología de equipos y sistemas fotovoltaicos es madura. La instalación de los sistemas fotovoltaicos individuales es simple, rápida y sólo requiere de herramientas y
equipos de medición básicos. No consume combustible No genera residuos No produce ruidos o produce ruido moderado. Resiste condiciones climáticas extremas: granizo, viento, temperatura, humedad
Desventajas:
Aunque los sistemas fotovoltaicos han experimentado una reducción de precios, la inversión inicial es alta. Cuando la aplicación no es a gran escala, la cantidad de energía producida es limitada y alcanza solamente
para las necesidades básicas de electricidad. La disponibilidad de energía es variable y depende de las condiciones atmosféricas. Se requieren áreas considerables y existe contaminación visual. Incremento en emisiones y alto consumo de electricidad para fabricar silicio. Rango de inversión de 3000 a 4000 USD por KW (COPAR 2011). Uso de fuentes de energía no renovable para la fabricación de paneles solares en cadena. La utilización de silicio en la fabricación de celdas fotovoltaicas afecta la industria microelectrónica.
En las ventajas decimos que la energía solar es “generalmente amigable” con el medio ambiente, pero siendo estrictos, este tipo de energía, entre otros impactos ambientales directos o indirectos, también genera emisiones de CO2, que según el documento de Costos y Parámetros de Referencia para la Formulación de Proyectos de Inversión en el Sector Eléctrico (COPAR) oscilan con las siguientes proporciones:
Emisiones por fotovoltaica: 100-170 g CO2/Kwh
Térmica solar: 30-40 g CO2/Kwh
77
“María Teresa Ortega Méndez y Heber Didier Diez León” / Revista Geotermia Vol. 26, Num. 2 Julio-Diciembre de 2013
Como parámetro de referencia en cuanto a la magnitud de dichos valores se tiene que la generación con gas y carbón emiten 430 y 960 gCO2/Kwh, respectivamente. Con lo anterior, claramente puede deducirse que si bien el aprovechamiento de la energía solar no es del todo libre de emisiones ayuda a reducir las mismas a la atmósfera. Hasta este punto hemos hablado de los tipos de energía solar, su aplicación y desarrollo, así como sus ventajas y desventajas, resaltando que, aunque el potencial solar es prácticamente infinito, también tiene sus limitantes tecnológicas, ambientales y económicas, mismas que ponen a prueba el ingenio humano en la búsqueda de su aprovechamiento, por medio de la mejora de técnicas, nuevas aplicaciones e incluso materiales alternativos que permitan hacer eficiente y sostenible el uso de esta noble y natural energía. Con esto último, estimado lector, dejamos como punto de reflexión y a su apreciable consideración el balance que debe existir en la explotación de las fuentes alternativas y convencionales de energía con la finalidad de preservar nuestro planeta procurando la mejor calidad de vida para todos los seres vivos que lo habitamos.
Referencias
http://www.eoi.es/blogs/alfonsomedal/2012/06/22/potencial-de-desarrollo-de-la-tecnologia-solar-fotovoltaica-y-termosolar-y-zonas-de-implantacion-a-nivel-mundial/
http://www.acciona-energia.es/areas_actividad/solar_fotovoltaica/instalaciones/plantaamaraleja/planta-amaraleja.aspx
http://es.wikipedia.org/wiki/Energ%C3%ADa_solar_fotovoltaica
http://www.mexicosolar.com/efotovoltaica.html
http://www.anes.org/anes/index.php?option=com_wrapper&Itemid=75
http://www.conermex.com.mx/informacion-de-interes/los-sistemas-fotovoltaicos.html
http://eleconomista.com.mx/industrias/2013/01/08/mexico-duplica-generacion-fotovoltaica
http://www.energiasrenovableshoy.net/2011/10/ventajas-y-desventajas-del-uso-de-la.html
http://www.abcpedia.com/cienciaytecnologia/energia/fotovoltaica.html
http://www.miliarium.com/Bibliografia/Monografias/Energia/EnergiasRenovables/EnergiaSolarFotovoltaica.asp
http://www.renovables.gob.mx/portal/Default.aspx?id=1651
http://www.terra.org/categorias/articulos/la-energia-solar-fotovoltaica-bate-records-en-2010
78
Instrucciones de Publicación en la REVISTA GEOTERMIA
Geotermia está abierta a la participación de investigadores de instituciones tanto nacionales como del extranjero quienes deben dirigir sus contribuciones a:
GEOTERMIA, REVISTA MEXICANA DE GEOENERGÍA Alejandro Volta 655, Col. Electricistas.
Morelia, Mich., C.P. 58290, México Atención: Magaly Flores Armenta
[email protected] [email protected]
Los trabajos deberán cumplir con las siguientes instrucciones de publicación.
1. El artículo debe ser inédito y relacionado con la geotermia, las fuentes alternas no convencionales de energía o con ramas afines.
2. Enviar un correo electrónico con el artículo en formato de Microsoft Office Word a doble espacio y en un CD a las direcciones arriba citadas. Se aceptan trabajos en español con resumen en inglés, o en inglés con resumen en español.
3. Las tablas, cuadros y figuras deberán incluirse al final del texto. Las figuras y gráficas pueden ser en color o en blanco y negro, tener buena calidad y no rebasar el tamaño carta. Su cantidad deberá ser la suficiente para la comprensión o ilustración del trabajo expuesto. Deberán incluirse en CD en forma de archivos independientes en formato de imagen (*.gif, *tif, *.jpg) que puedan importarse como tales desde Microsoft Office Word.
4. Geotermia es una revista virtual que se publica en formato*.pdf en el portal interno de la Gerencia de Proyectos Geotermoeléctricos y en otros portales públicos. Por lo tanto, es importante que todas las figuras y gráficas tengan la resolución suficiente para poder apreciarse al convertirse a archivos de imagen.
5. Todo artículo será sometido a revisión y arbitraje de un mínimo de dos especialistas en la materia. Para facilitar la imparcialidad de la revisión se mantendrá el anonimato entre autores y árbitros. Se enviarán reconocimientos escritos a quienes colaboraron como árbitros.
6. Se ofrecerá apoyo especial a los autores sin hábitos de publicar resultados por no constituir la publicación una parte rutinaria de su trabajo, y que, en consecuencia, requieran de indicaciones adicionales. El Consejo Editorial se encargará de hacer las modificaciones o correcciones pequeñas que no justifiquen la aplicación de un nuevo arbitraje.
7. El contenido de los trabajos deberá abordar los temas que se indican a continuación. Se subrayan las partes consideradas como indispensables, aunque su contenido pueda aparecer bajo otra sección o con otro título. Las otras secciones son opcionales, aunque pudiera haber otras a juicio del autor: Título, Autor, Adscripción laboral, Dirección de correo electrónico, Resumen en español, Palabras Clave en español, Título en inglés, Resumen (Abstract) en inglés, Palabras Clave (Keywords) en inglés, Antecedentes o Introducción, Objetivo, Metodología, Datos, Procesamiento, Interpretación, Interpretaciones alternativas, Conclusiones, Verificación, Agradecimientos, Referencias, Apéndices.
8. Todas las referencias deberán estar citadas en el texto y todas las citas deberán estar incluidas en las referencias. En el texto se
empleará el sistema Harvard (apellido y año): "Algunos autores (González, 1995)...", o bien "González (1995) reporta que...". En caso de dos autores la cita deberá incluirlos a ambos (González y Rodríguez, 1995) y en caso de más autores deberá utilizarse la convención et al. (González et al., 1995). La lista de referencias irá en orden alfabético y deberá incluir a todos los autores con todos los detalles de la publicación; si se emplean abreviaturas de publicaciones científicas, deberán estar de acuerdo con el World List of Scientific Periodicals. Solamente las iniciales del primer autor irán después del apellido. El título de la revista o libro referenciado deberá escribirse en cursivas. Ejemplos:
Cedillo-Rodríguez, F., 1999. Modelo hidrogeológico de los yacimientos geotérmicos de Los Humeros. Geotermia, Vol. 15, No. 3, 159-170.
Gutiérrez-Negrín, L., A. López-Martínez and M. Balcázar-García, 1984. Application of dating for searching geothermic sources. Nuclear Tracks and Radiation Measurements, Vol. 8, Nos. 1-4, 385-389.
Allen, J.R.L., 1970. Physical Processes of Sedimentation. London, Allen and Unwin, 248 pp.
9. Si lo desea, puede solicitar una copia de los formatos de arbitraje y utilizar como guía para el contenido de su contribución los artículos ya publicados en esta revista.
10. Eventualmente aparecerá como parte de la revista una sección intitulada FORO, la cual dará cabida a artículos y colaboraciones tipo ensayo que pueden no cumplir con alguno o algunos de los requisitos precedentes, pero que a juicio del Consejo Editorial pueden resultar de interés para los lectores de la misma. Estas colaboraciones no serán sometidas a arbitraje técnico. Si desea que su colaboración sea considerada para publicarse en FORO, por favor indíquelo así al remitirla.
79

DIRECTIONS FOR CONTRIBUTORS
Geotermia is open to Mexican and foreign contributors, who should send all contributions to:
GEOTERMIA, REVISTA MEXICANA DE GEOENERGÍA Alejandro Volta 655, Col. Electricistas.
Morelia, Mich., C.P. 58290, México Atención: Magaly Flores Armenta
[email protected] [email protected]
Contributions must follow these guidelines: 1. A submitted paper must be unpublished and related to geothermics, nonconventional energy sources or similar subjects. 2. Submit an e-mail with the article in Microsoft Office Word format, double spaced, and a CD to an e-address indicated above.
Contributions in Spanish with abstracts in English, or in English with abstracts in Spanish, are acceptable. 3. Tables, figures and graphs must be placed at the end of the text. They must be of good quality, either in color or black and
white, and not larger than letter-sized paper. Include all tables, figures and graphs needed by a reader to understand the paper. Place them on the CD as independent files in image-format (*.gif, *.tif, *.jpg), which can be imported from Microsoft Office Word.
4. Geotermia is a digital magazine published in a *.pdf format at the internal website of the Gerencia de Proyectos
Geotermoeléctricos and at other public websites. Therefore, all figures and graphs must have enough resolution to be clear when they are converted to image-files.
5. All contributions will undergo review and arbitration by at least two specialists in the field. To encourage fair evaluations, the
authors will receive anonymous reviews. The reviewers will receive an acknowledgement letter from the editorial board. 6. Geotermia offers special support to first-time authors for whom publishing papers is not part of their jobs. The editorial board can
make small modifications or corrections to such papers without a new peer-review process. 7. All papers must include the following sections. Those considered as indispensable are underlined, yet they can be included under
other chapters or subtitles. The other parts are optional, plus authors can include additional sections: Title, Author(s), Company or institution, Address, Abstract in background, Objective, Methodology, Data, Processing, Interpretation, Alternative interpretations, Conclusions, Verification, Acknowledgement, References, Appendix.
8. All references must be cited in the text, and all citations must be included in the References. In the text, the Harvard citation
system (last name and year) must be used: “Some authors (González, 1995)...”, or: “González (1995) indicates that...” In the case of two authors, the citation must include both (González and Rodríguez, 1995), and in the case of more than two authors the convention et al. (González et al., 1995) must be used. The list of references must be arranged alphabetically and include all the authors and details of the cited publication. All abbreviations must be from the World List of Scientific Periodicals. Initials of the first author must follow the last name. The title of a magazine or book must be written in italics. Examples:
Cedillo-Rodríguez, F., 1999. Modelo hidrogeológico de los yacimientos geotérmicos de Los Humeros. Geotermia, Vol. 15, No. 3, 159-170.
Gutiérrez-Negrín, L., A. López-Martínez and M. Balcázar-García, 1984. Application of dating for searching geothermic sources. Nuclear Tracks and Radiation Measurements, Vol. 8, Nos. 1-4, 385-389.
Allen, J.R.L., 1970. Physical Processes of Sedimentation. London, Allen and Unwin, 248 pp. 9. You may ask for a copy of the review of any paper published in Geotermia and use it as a guide for your contribution. 10. Eventually, a section named FORO will constitute the last part of the magazine. The section will include contributions, notes and
essays that may or may not meet any or all of the stipulations for papers, but that the editorial board considers of interest to the readers. Contributions included in FORO will not undergo peer review. If you want a contribution be placed in FORO, please indicate this upon submission.
80