presentation to investors - aurobindo pharma · presentation to investors ... api 7548 6668 7445...
TRANSCRIPT
Aurobindo Pharma Limited
Presentation to InvestorsPresentation to Investors
July 2014
Forward looking statement
This presentation contains statements that constitute “forward looking statements” including and
without limitation, statements relating to the implementation of strategic initiatives, and other
statements relating to our future business developments and economic performance.
While these forward looking statements represent our judgment and future expectations
concerning the development of our business, a number of risks, uncertainties and other important
factors could cause actual developments and results to differ materially from our expectations.
These factors include, but are not limited to, general market, macro-economic, governmental and
regulatory trends, movements in currency exchange and interest rates, competitive pressures,regulatory trends, movements in currency exchange and interest rates, competitive pressures,
technological developments, changes in the financial conditions of third parties dealing with us,
legislative developments, and other key factors that we have indicated could adversely affect our
business and financial performance.
Aurobindo Pharma undertakes no obligation to publicly revise any forward looking statements to
reflect future events or circumstances.
For updates and specific queries, please visit our website www. aurobindo.com
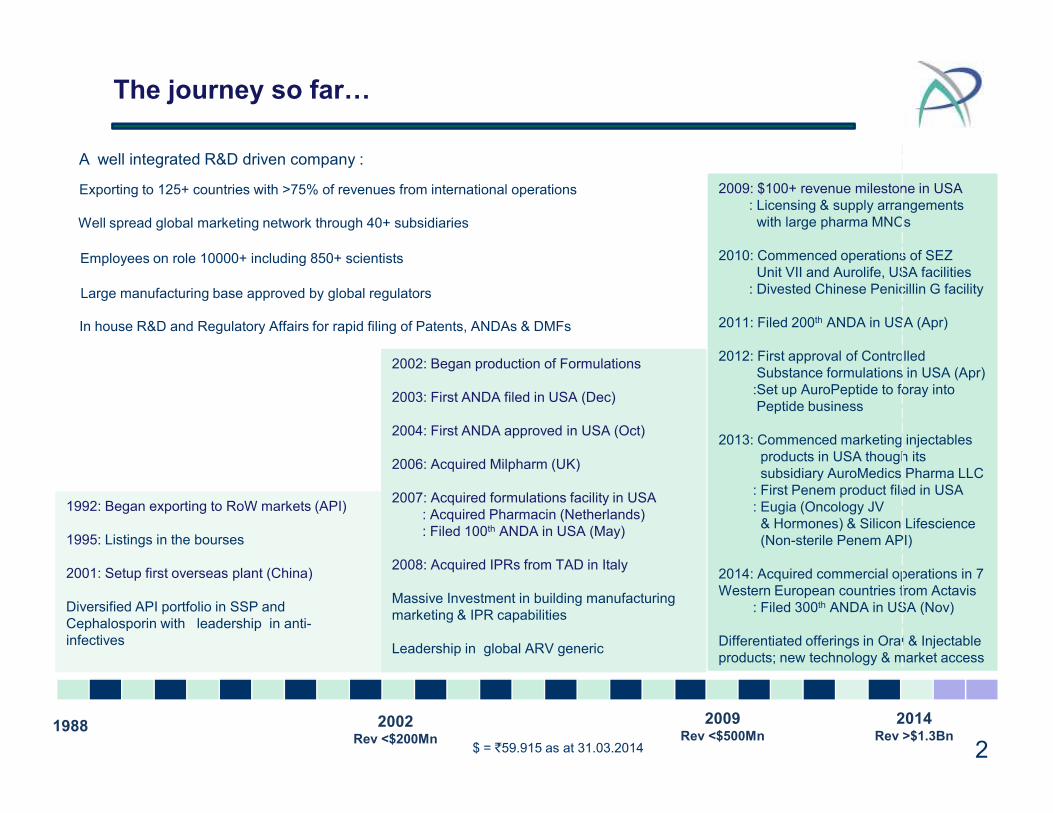
The journey so far…
2002: Began production of Formulations
2003: First ANDA filed in USA (Dec)
2009: $100+ revenue milestone in USA: Licensing & supply arrangements with large pharma MNCs
2010: Commenced operations of SEZ Unit VII and Aurolife, USA facilities: Divested Chinese Penicillin G facility
2011: Filed 200th ANDA in USA (Apr)
2012: First approval of Controlled Substance formulations in USA (Apr):Set up AuroPeptide to foray intoPeptide business
Exporting to 125+ countries with >75% of revenues from international operations
Well spread global marketing network through 40+ subsidiaries
Employees on role 10000+ including 850+ scientists
In house R&D and Regulatory Affairs for rapid filing of Patents, ANDAs & DMFs
Large manufacturing base approved by global regulators
A well integrated R&D driven company :
2002Rev <$200Mn
1988
1992: Began exporting to RoW markets (API)
1995: Listings in the bourses
2001: Setup first overseas plant (China)
Diversified API portfolio in SSP and Cephalosporin with leadership in anti-infectives
2004: First ANDA approved in USA (Oct)
2006: Acquired Milpharm (UK)
2007: Acquired formulations facility in USA: Acquired Pharmacin (Netherlands): Filed 100th ANDA in USA (May)
2008: Acquired IPRs from TAD in Italy
Massive Investment in building manufacturingmarketing & IPR capabilities
Leadership in global ARV generic
Peptide business
2013: Commenced marketing injectablesproducts in USA though its subsidiary AuroMedics Pharma LLC: First Penem product filed in USA: Eugia (Oncology JV& Hormones) & Silicon Lifescience(Non-sterile Penem API)
2014: Acquired commercial operations in 7 Western European countries from Actavis
: Filed 300th ANDA in USA (Nov)
Differentiated offerings in Oral & Injectableproducts; new technology & market access
$ = `59.915 as at 31.03.2014
2009Rev <$500Mn
2014Rev >$1.3Bn
2
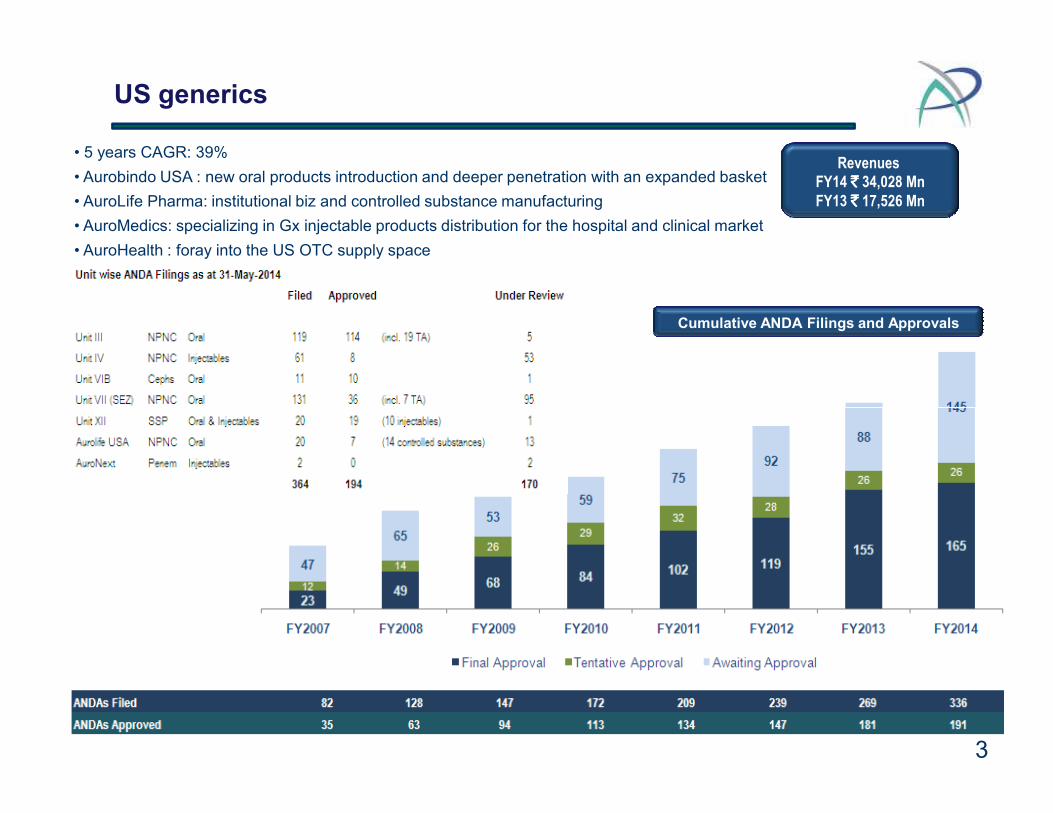
US generics
Cumulative ANDA Filings and Approvals
• 5 years CAGR: 39%
• Aurobindo USA : new oral products introduction and deeper penetration with an expanded basket
• AuroLife Pharma: institutional biz and controlled substance manufacturing
• AuroMedics: specializing in Gx injectable products distribution for the hospital and clinical market
• AuroHealth : foray into the US OTC supply space
Revenues FY14 `̀̀̀ 34,028 MnFY13 `̀̀̀ 17,526 Mn
3

EU generics
2014: Acquired €320Mn+ commercial infrastructure from Actavis in France, Italy, Spain, Portugal,
Germany, Netherlands and Belgium
2011 onwards: Focus markets through own subsidiaries in UK, Netherlands, Spain, Portugal, Germany,
Romania and Malta
Supply arrangements and New Business Opportunities with large pharma MNCs
Revenues FY14 `̀̀̀ 6,721 MnFY13 `̀̀̀ 4,679 Mn
Supply arrangements and New Business Opportunities with large pharma MNCs
2006/07: Acquisition of and integrating commercial operations of Milpharm in UK and Pharmacin inNetherlands
Aims to become one top 10 Gx companies in Europe by FY16
Strong foothold in France through Arrow Génériques brands
Vertically integrated platform provides operating synergy and supply chain focus
Compliment acquired hospital sales infrastructure with injectable and specialty portfolio across Western Europe
4
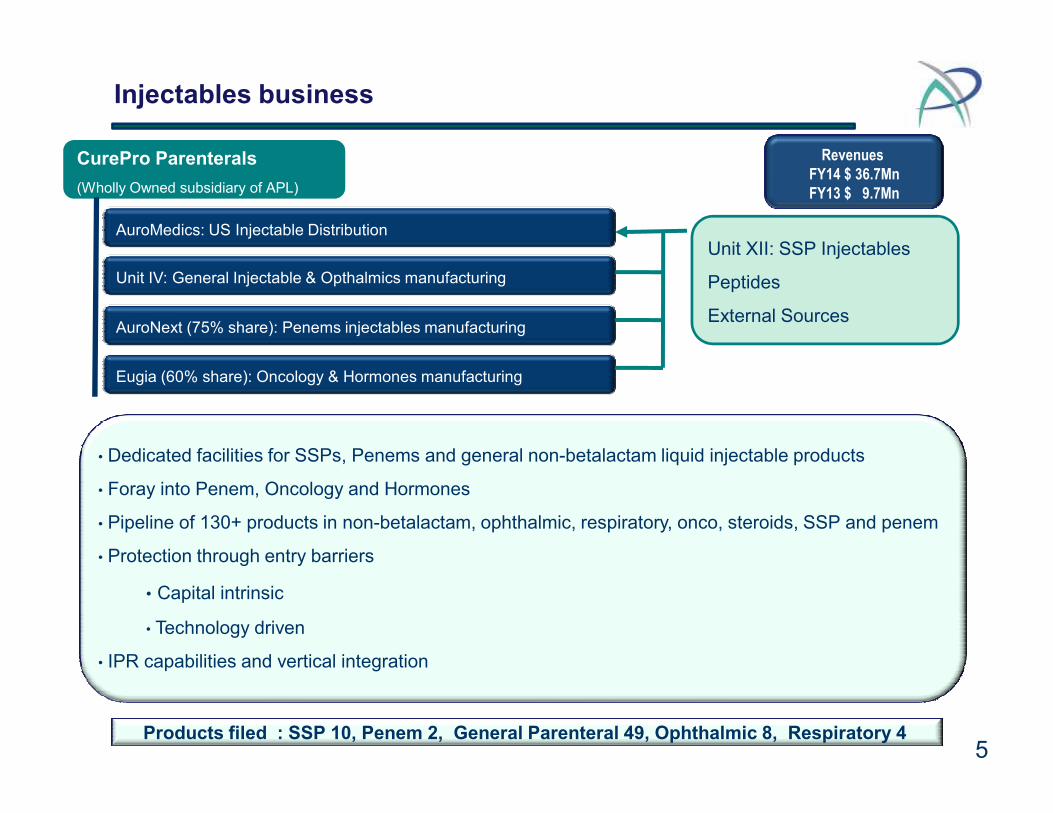
Injectables business
CurePro Parenterals
(Wholly Owned subsidiary of APL)
AuroMedics: US Injectable Distribution
Unit IV: General Injectable & Opthalmics manufacturing
AuroNext (75% share): Penems injectables manufacturing
Eugia (60% share): Oncology & Hormones manufacturing
Unit XII: SSP Injectables
Peptides
External Sources
Revenues FY14 $ 36.7MnFY13 $ 9.7Mn
• Dedicated facilities for SSPs, Penems and general non-betalactam liquid injectable products
• Foray into Penem, Oncology and Hormones
• Pipeline of 130+ products in non-betalactam, ophthalmic, respiratory, onco, steroids, SSP and penem
• Protection through entry barriers
• Capital intrinsic
• Technology driven
• IPR capabilities and vertical integration
Products filed : SSP 10, Penem 2, General Parenteral 49, Ophthalmic 8, Respiratory 4 5
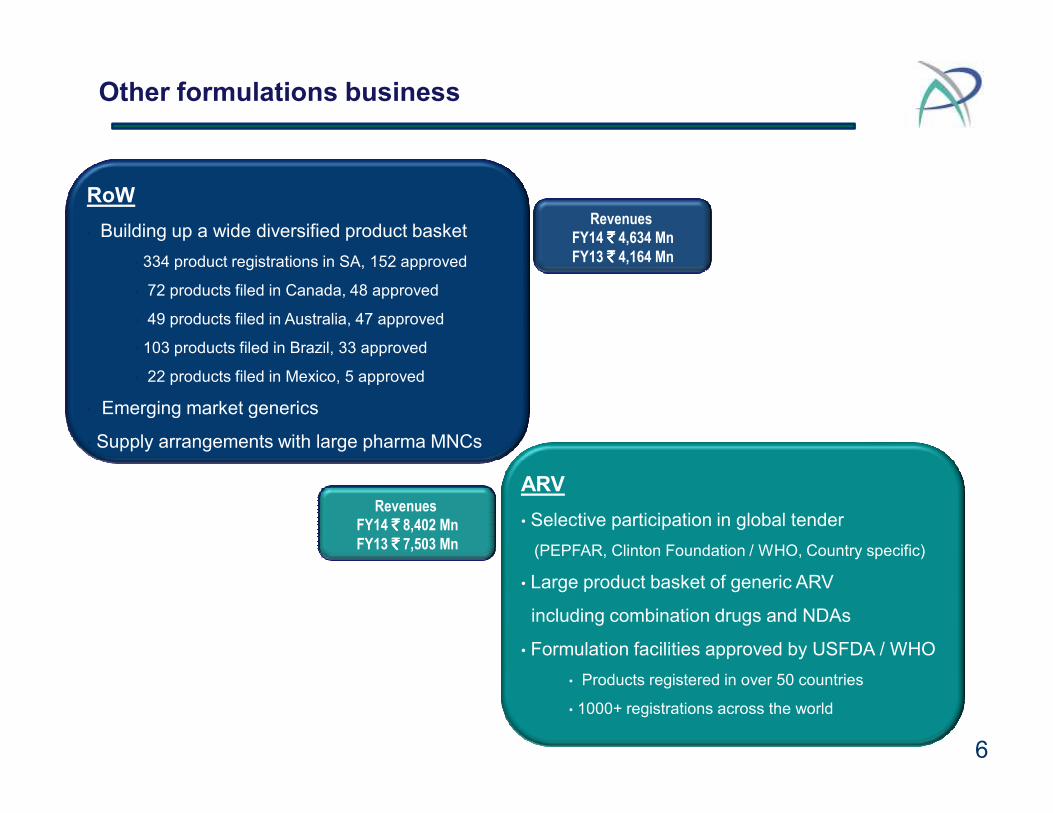
Other formulations business
RoW
• Building up a wide diversified product basket
• 334 product registrations in SA, 152 approved
• 72 products filed in Canada, 48 approved
• 49 products filed in Australia, 47 approved
• 103 products filed in Brazil, 33 approved
• 22 products filed in Mexico, 5 approved
• Emerging market generics
Revenues FY14 `̀̀̀ 4,634 MnFY13 `̀̀̀ 4,164 Mn
6
ARV
• Selective participation in global tender
(PEPFAR, Clinton Foundation / WHO, Country specific)
• Large product basket of generic ARV
including combination drugs and NDAs
• Formulation facilities approved by USFDA / WHO
• Products registered in over 50 countries
• 1000+ registrations across the world
• Emerging market generics
• Supply arrangements with large pharma MNCs
Revenues FY14 `̀̀̀ 8,402 MnFY13 `̀̀̀ 7,503 Mn
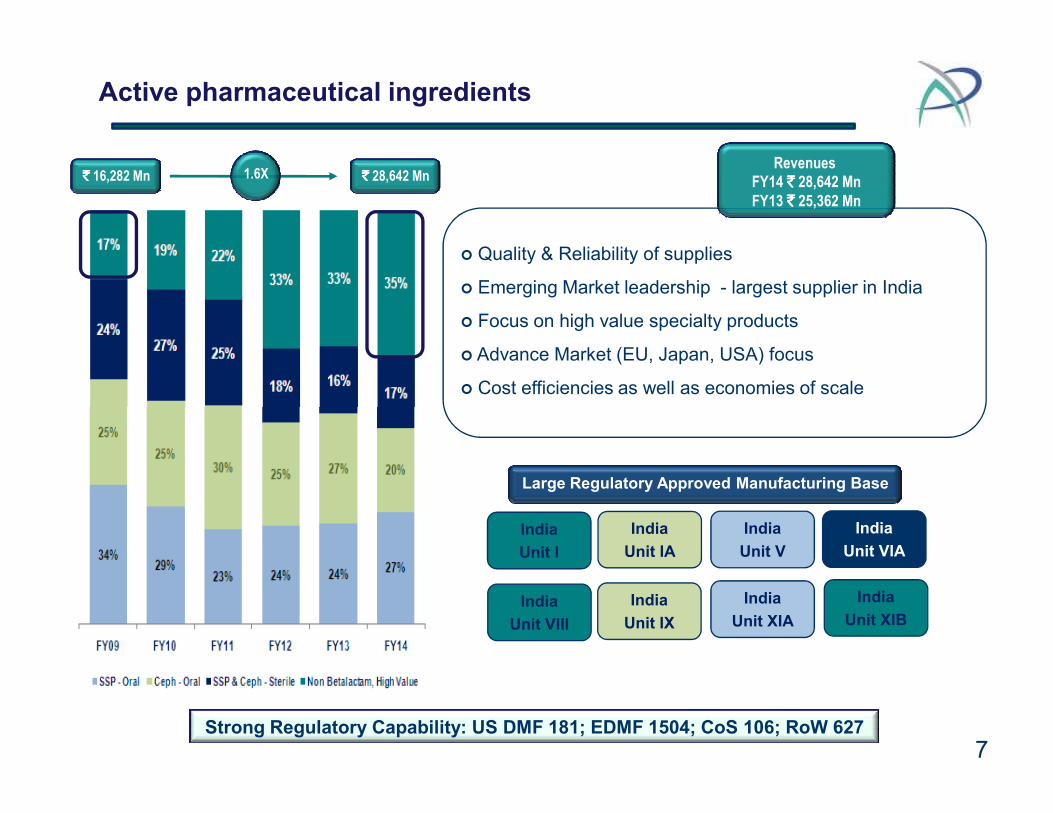
Active pharmaceutical ingredients
� Quality & Reliability of supplies
� Emerging Market leadership - largest supplier in India
� Focus on high value specialty products
� Advance Market (EU, Japan, USA) focus
� Cost efficiencies as well as economies of scale
Revenues FY14 `̀̀̀ 28,642 MnFY13 `̀̀̀ 25,362 Mn
`̀̀̀ 16,282 Mn `̀̀̀ 28,642 Mn1.6X
7Strong Regulatory Capability: US DMF 181; EDMF 1504; CoS 106; RoW 627
India
Unit V
India
Unit IA
India
Unit VIA
India
Unit I
India
Unit VIII
India
Unit XIB
Large Regulatory Approved Manufacturing Base
India
Unit IX
India
Unit XIA
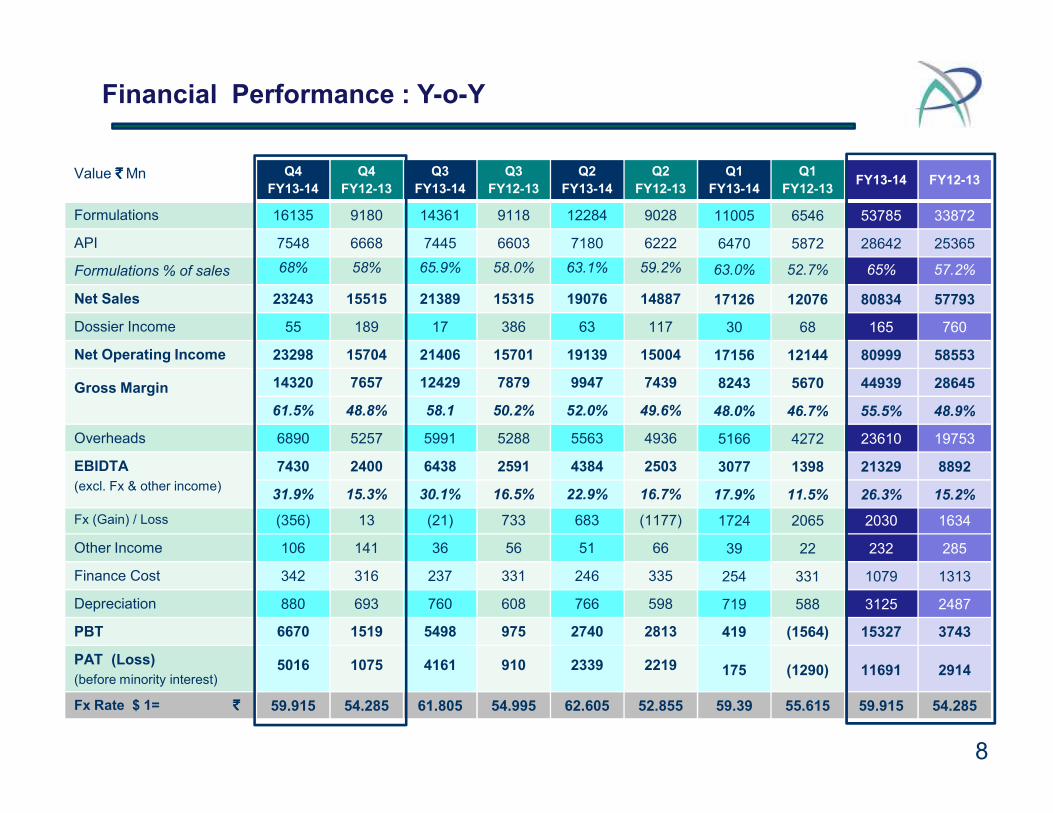
Value `̀̀̀Mn Q4
FY13-14
Q4
FY12-13
Q3
FY13-14
Q3
FY12-13
Q2
FY13-14
Q2
FY12-13
Q1
FY13-14
Q1
FY12-13FY13-14 FY12-13
Formulations 16135 9180 14361 9118 12284 9028 11005 6546 53785 33872
API 7548 6668 7445 6603 7180 6222 6470 5872 28642 25365
Formulations % of sales 68% 58% 65.9% 58.0% 63.1% 59.2% 63.0% 52.7% 65% 57.2%
Net Sales 23243 15515 21389 15315 19076 14887 17126 12076 80834 57793
Dossier Income 55 189 17 386 63 117 30 68 165 760
Net Operating Income 23298 15704 21406 15701 19139 15004 17156 12144 80999 58553
Gross Margin 14320 7657 12429 7879 9947 7439 8243 5670 44939 28645
61.5% 48.8% 58.1 50.2% 52.0% 49.6% 48.0% 46.7% 55.5% 48.9%
Financial Performance : Y-o-Y
8
61.5% 48.8% 58.1 50.2% 52.0% 49.6% 48.0% 46.7% 55.5% 48.9%
Overheads 6890 5257 5991 5288 5563 4936 5166 4272 23610 19753
EBIDTA
(excl. Fx & other income)
7430 2400 6438 2591 4384 2503 3077 1398 21329 8892
31.9% 15.3% 30.1% 16.5% 22.9% 16.7% 17.9% 11.5% 26.3% 15.2%
Fx (Gain) / Loss (356) 13 (21) 733 683 (1177) 1724 2065 2030 1634
Other Income 106 141 36 56 51 66 39 22 232 285
Finance Cost 342 316 237 331 246 335 254 331 1079 1313
Depreciation 880 693 760 608 766 598 719 588 3125 2487
PBT 6670 1519 5498 975 2740 2813 419 (1564) 15327 3743
PAT (Loss)
(before minority interest)5016 1075 4161 910 2339 2219 175 (1290) 11691 2914
Fx Rate $ 1= `̀̀̀ 59.915 54.285 61.805 54.995 62.605 52.855 59.39 55.615 59.915 54.285
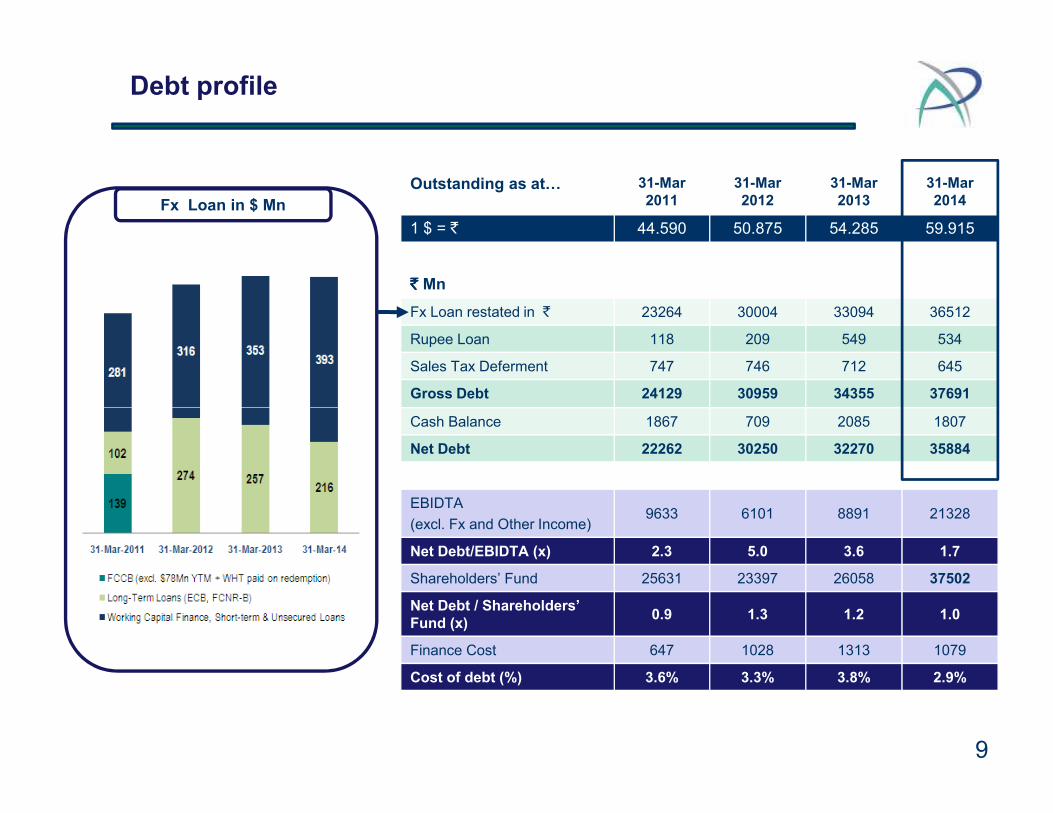
Outstanding as at… 31-Mar 2011
31-Mar 2012
31-Mar 2013
31-Mar 2014
1 $ = ` 44.590 50.875 54.285 59.915
` ` ` ` Mn
Fx Loan restated in ` 23264 30004 33094 36512
Rupee Loan 118 209 549 534
Sales Tax Deferment 747 746 712 645
Gross Debt 24129 30959 34355 37691
Debt profile
Fx Loan in $ Mn
9
Cash Balance 1867 709 2085 1807
Net Debt 22262 30250 32270 35884
EBIDTA
(excl. Fx and Other Income)9633 6101 8891 21328
Net Debt/EBIDTA (x) 2.3 5.0 3.6 1.7
Shareholders’ Fund 25631 23397 26058 37502
Net Debt / Shareholders’ Fund (x)
0.9 1.3 1.2 1.0
Finance Cost 647 1028 1313 1079
Cost of debt (%) 3.6% 3.3% 3.8% 2.9%
Thank You
For updates and specific queries, please visit our website www. aurobindo.com
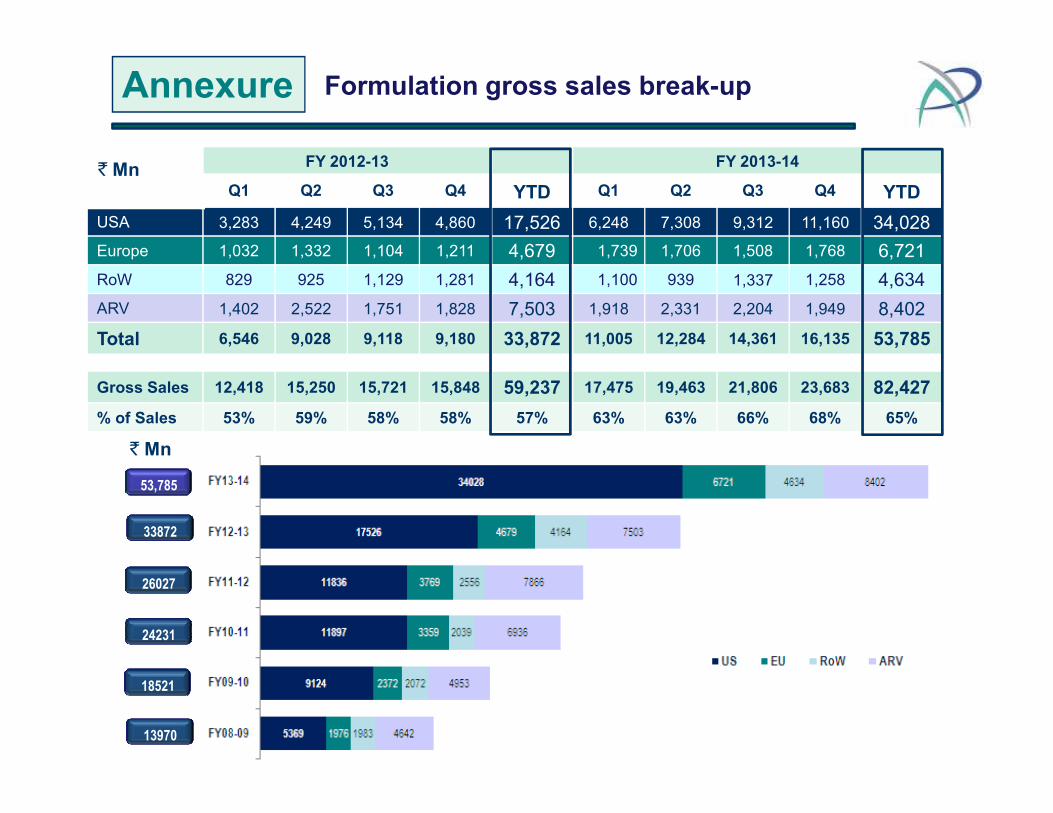
FY 2012-13 FY 2013-14
Q1 Q2 Q3 Q4 YTD Q1 Q2 Q3 Q4 YTD
USA 3,283 4,249 5,134 4,860 17,526 6,248 7,308 9,312 11,160 34,028
Europe 1,032 1,332 1,104 1,211 4,679 1,739 1,706 1,508 1,768 6,721
RoW 829 925 1,129 1,281 4,164 1,100 939 1,337 1,258 4,634
ARV 1,402 2,522 1,751 1,828 7,503 1,918 2,331 2,204 1,949 8,402
Total 6,546 9,028 9,118 9,180 33,872 11,005 12,284 14,361 16,135 53,785
Gross Sales 12,418 15,250 15,721 15,848 59,237 17,475 19,463 21,806 23,683 82,427
Formulation gross sales break-upAnnexure
` Mn
` Mn
11
% of Sales 53% 59% 58% 58% 57% 63% 63% 66% 68% 65%
13970
18521
24231
26027
53,785
33872
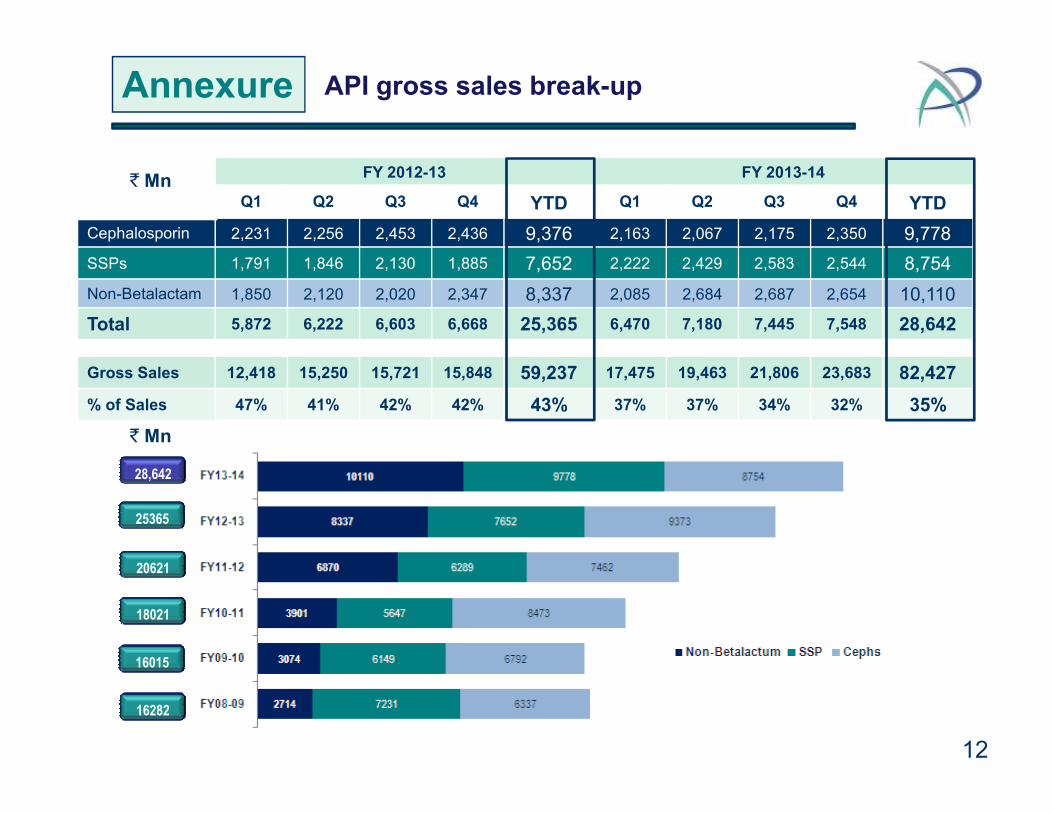
FY 2012-13 FY 2013-14
Q1 Q2 Q3 Q4 YTD Q1 Q2 Q3 Q4 YTD
Cephalosporin 2,231 2,256 2,453 2,436 9,376 2,163 2,067 2,175 2,350 9,778
SSPs 1,791 1,846 2,130 1,885 7,652 2,222 2,429 2,583 2,544 8,754
Non-Betalactam 1,850 2,120 2,020 2,347 8,337 2,085 2,684 2,687 2,654 10,110
Total 5,872 6,222 6,603 6,668 25,365 6,470 7,180 7,445 7,548 28,642
Gross Sales 12,418 15,250 15,721 15,848 59,237 17,475 19,463 21,806 23,683 82,427
% of Sales 47% 41% 42% 42% 43% 37% 37% 34% 32% 35%
API gross sales break-upAnnexure
` Mn
12
% of Sales 47% 41% 42% 42% 43% 37% 37% 34% 32% 35%
16282
16015
18021
20621
28,642
` Mn
25365
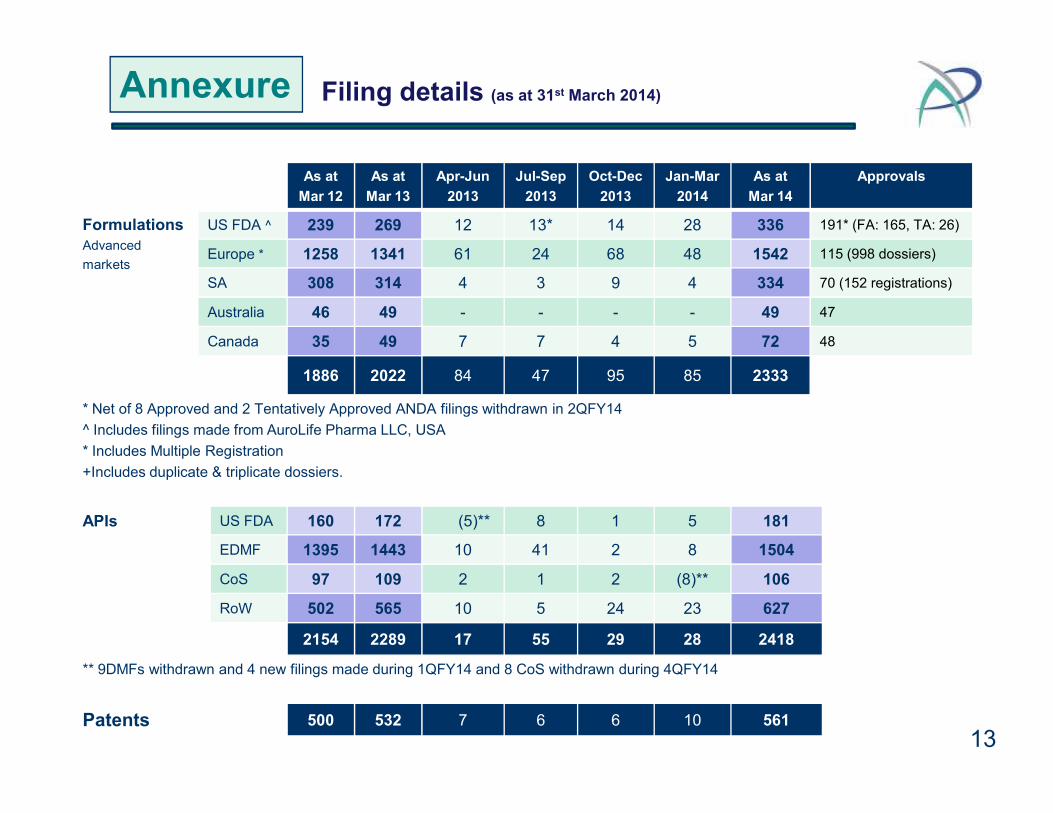
As at
Mar 12
As at
Mar 13
Apr-Jun
2013
Jul-Sep
2013
Oct-Dec
2013
Jan-Mar
2014
As at
Mar 14
Approvals
Formulations
Advanced
markets
US FDA ^ 239 269 12 13* 14 28 336 191* (FA: 165, TA: 26)
Europe * 1258 1341 61 24 68 48 1542 115 (998 dossiers)
SA 308 314 4 3 9 4 334 70 (152 registrations)
Australia 46 49 - - - - 49 47
Canada 35 49 7 7 4 5 72 48
1886 2022 84 47 95 85 2333
* Net of 8 Approved and 2 Tentatively Approved ANDA filings withdrawn in 2QFY14
Filing details (as at 31st March 2014)Annexure
* Net of 8 Approved and 2 Tentatively Approved ANDA filings withdrawn in 2QFY14
^ Includes filings made from AuroLife Pharma LLC, USA
* Includes Multiple Registration
+Includes duplicate & triplicate dossiers.
APIs US FDA 160 172 (5)** 8 1 5 181
EDMF 1395 1443 10 41 2 8 1504
CoS 97 109 2 1 2 (8)** 106
RoW 502 565 10 5 24 23 627
2154 2289 17 55 29 28 2418
** 9DMFs withdrawn and 4 new filings made during 1QFY14 and 8 CoS withdrawn during 4QFY14
Patents 500 532 7 6 6 10 561
13
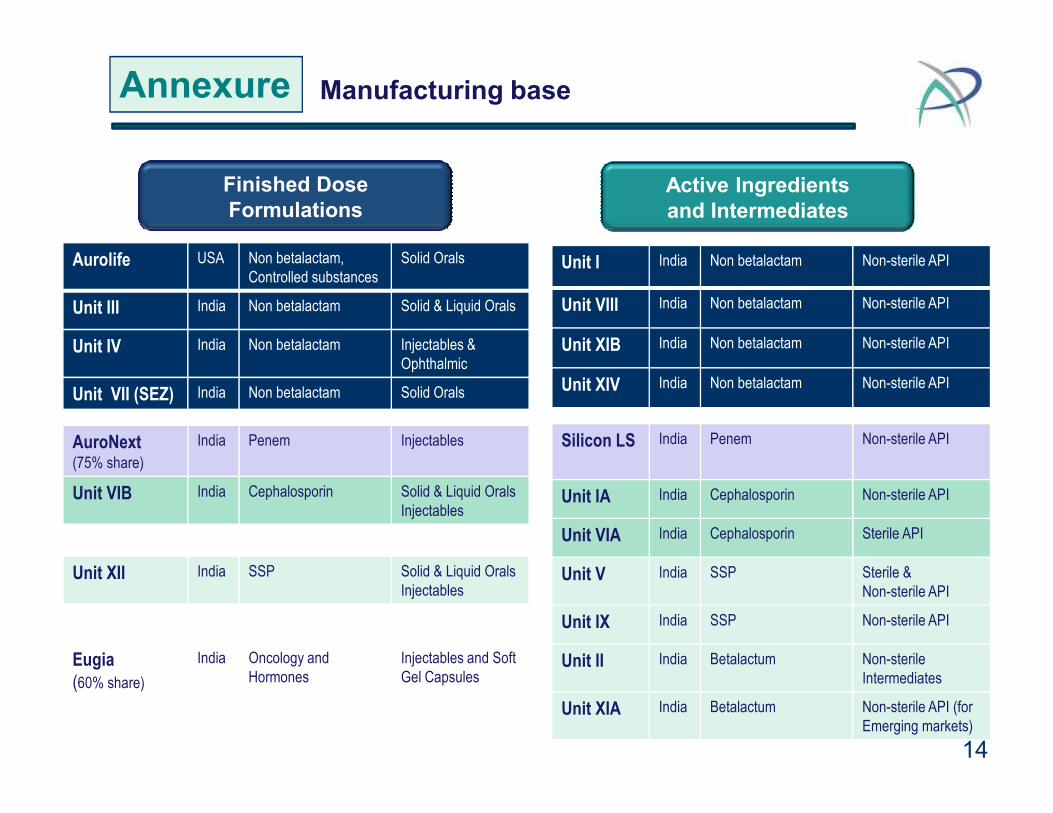
Annexure Manufacturing base
Finished DoseFormulations
Active Ingredientsand Intermediates
Aurolife USA Non betalactam,
Controlled substances
Solid Orals
Unit III India Non betalactam Solid & Liquid Orals
Unit IV India Non betalactam Injectables &
Ophthalmic
Unit VII (SEZ) India Non betalactam Solid Orals
Unit I India Non betalactam Non-sterile API
Unit VIII India Non betalactam Non-sterile API
Unit XIB India Non betalactam Non-sterile API
Unit XIV India Non betalactam Non-sterile API
14
AuroNext(75% share)
India Penem Injectables
Unit VIB India Cephalosporin Solid & Liquid Orals
Injectables
Unit XII India SSP Solid & Liquid Orals
Injectables
Eugia(60% share)
India Oncology and
Hormones
Injectables and Soft
Gel Capsules
Silicon LS India Penem Non-sterile API
Unit IA India Cephalosporin Non-sterile API
Unit VIA India Cephalosporin Sterile API
Unit V India SSP Sterile &
Non-sterile API
Unit IX India SSP Non-sterile API
Unit II India Betalactum Non-sterile
Intermediates
Unit XIA India Betalactum Non-sterile API (for
Emerging markets)
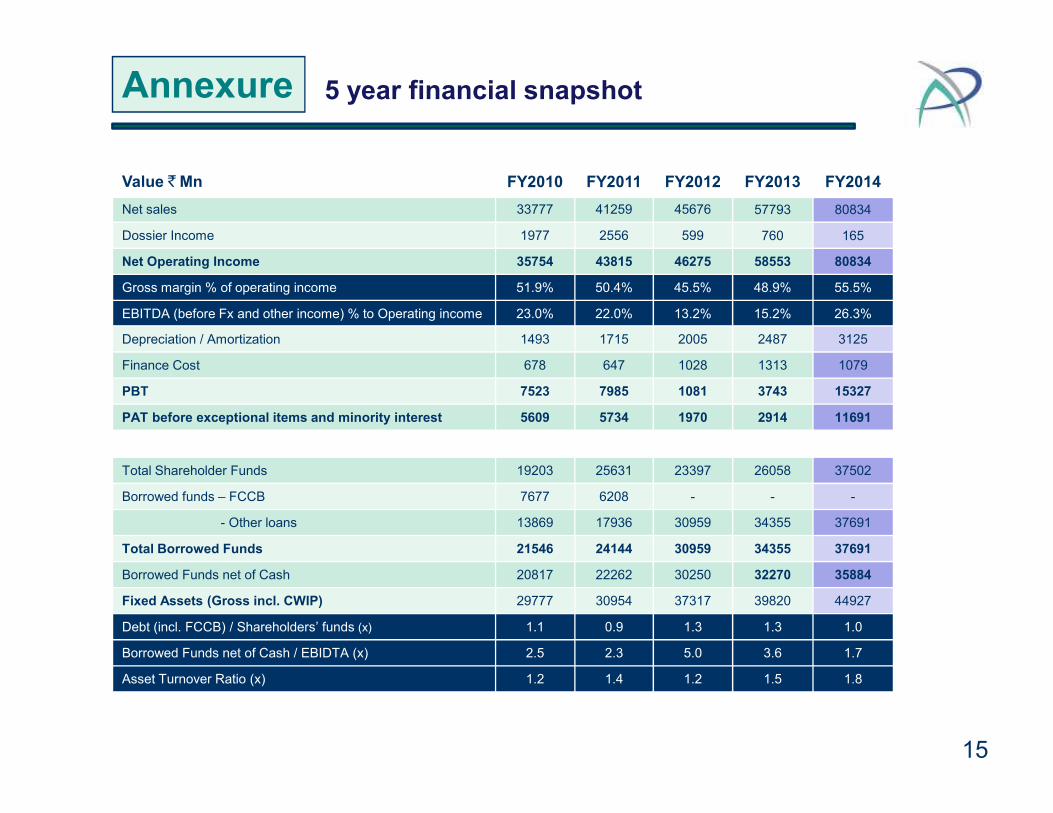
Value `Mn FY2010 FY2011 FY2012 FY2013 FY2014
Net sales 33777 41259 45676 57793 80834
Dossier Income 1977 2556 599 760 165
Net Operating Income 35754 43815 46275 58553 80834
Gross margin % of operating income 51.9% 50.4% 45.5% 48.9% 55.5%
EBITDA (before Fx and other income) % to Operating income 23.0% 22.0% 13.2% 15.2% 26.3%
Depreciation / Amortization 1493 1715 2005 2487 3125
Finance Cost 678 647 1028 1313 1079
PBT 7523 7985 1081 3743 15327
Annexure 5 year financial snapshot
15
PAT before exceptional items and minority interest 5609 5734 1970 2914 11691
Total Shareholder Funds 19203 25631 23397 26058 37502
Borrowed funds – FCCB 7677 6208 - - -
- Other loans 13869 17936 30959 34355 37691
Total Borrowed Funds 21546 24144 30959 34355 37691
Borrowed Funds net of Cash 20817 22262 30250 32270 35884
Fixed Assets (Gross incl. CWIP) 29777 30954 37317 39820 44927
Debt (incl. FCCB) / Shareholders’ funds (x) 1.1 0.9 1.3 1.3 1.0
Borrowed Funds net of Cash / EBIDTA (x) 2.5 2.3 5.0 3.6 1.7
Asset Turnover Ratio (x) 1.2 1.4 1.2 1.5 1.8
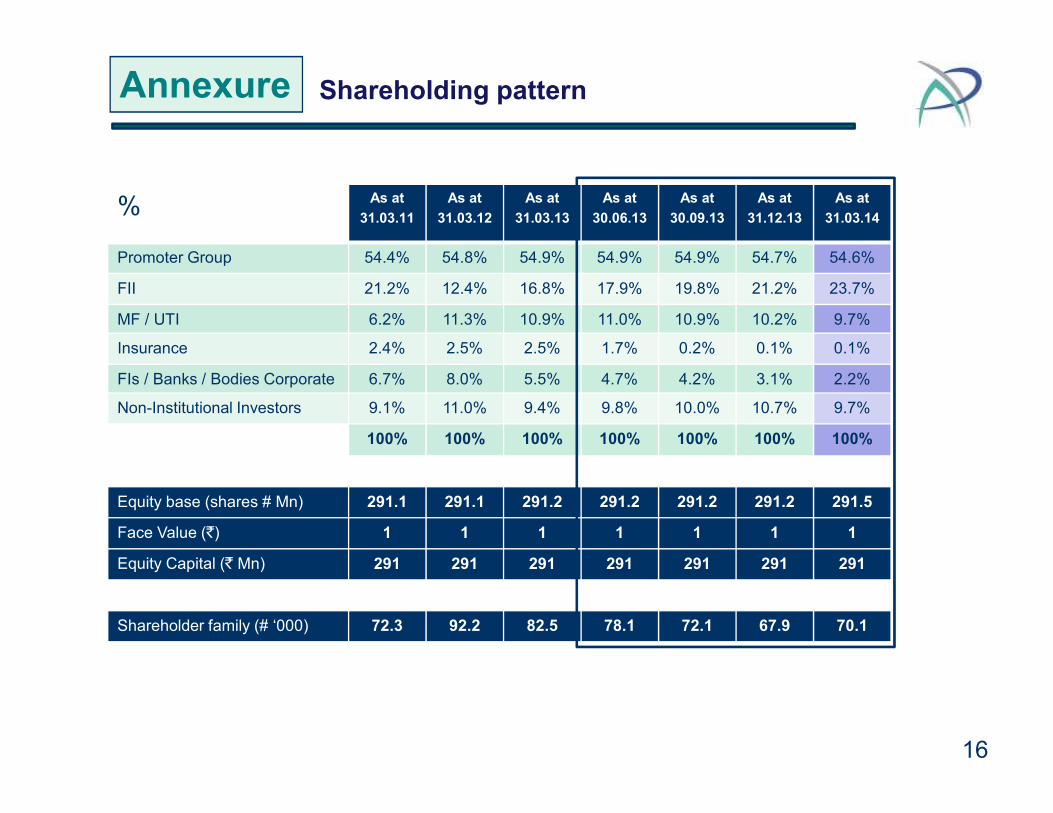
% As at
31.03.11
As at
31.03.12
As at
31.03.13
As at
30.06.13
As at
30.09.13
As at
31.12.13
As at
31.03.14
Promoter Group 54.4% 54.8% 54.9% 54.9% 54.9% 54.7% 54.6%
FII 21.2% 12.4% 16.8% 17.9% 19.8% 21.2% 23.7%
MF / UTI 6.2% 11.3% 10.9% 11.0% 10.9% 10.2% 9.7%
Insurance 2.4% 2.5% 2.5% 1.7% 0.2% 0.1% 0.1%
FIs / Banks / Bodies Corporate 6.7% 8.0% 5.5% 4.7% 4.2% 3.1% 2.2%
Non-Institutional Investors 9.1% 11.0% 9.4% 9.8% 10.0% 10.7% 9.7%
Annexure Shareholding pattern
16
Non-Institutional Investors 9.1% 11.0% 9.4% 9.8% 10.0% 10.7% 9.7%
100% 100% 100% 100% 100% 100% 100%
Equity base (shares # Mn) 291.1 291.1 291.2 291.2 291.2 291.2 291.5
Face Value (`) 1 1 1 1 1 1 1
Equity Capital (` Mn) 291 291 291 291 291 291 291
Shareholder family (# ‘000) 72.3 92.2 82.5 78.1 72.1 67.9 70.1