presentación de powerpoint - solarpack · hecho relevante 1. solarpack corporaciÓn tecnolÓgica,...
TRANSCRIPT

HECHO RELEVANTE
1.
SOLARPACK CORPORACIÓN TECNOLÓGICA, S.A.
COMUNICACIÓN DE HECHO RELEVANTE
SOLARPACK CORPORACIÓN TECNOLÓGICA, S.A." ("Solarpack"), de conformidad con lo
establecido en el artículo 17 del Reglamento (UE) nº 596/2014 sobre Abuso de Mercado, el artículo
228 del Real Decreto Legislativo 4/2015, de 23 de octubre, por el que se aprueba el texto refundido
de la Ley del Mercado de Valores, y demás normativa aplicable, comunica el siguiente:
HECHO RELEVANTE
Solarpack celebrará un Conference Call con analistas e inversores institucionales, hoy, lunes 25 de
febrero de 2019, a las 11 horas CET, que podrá seguirse en tiempo real, vía audio-conferencia,
registrándose previamente a través del siguiente link:
http://emea.directeventreg.com/registration/1992976
Adjunto se remite nota de prensa y la documentación de soporte a la presentación, que está
igualmente disponible a través de la web corporativa de Solarpack.
Getxo, a 25 de febrero de 2019.

NOTA DE PRENSA
INVESTOR RELATIONS MEDIA ENQUIRIES SOLARPACK COMCO Javier Arellano Susana Ruiz - [email protected] I Juan Carlos Bolland – [email protected] [email protected] | +34944309204 Carlota Vicén – [email protected] | +34 91 436 18 00
1
Getxo, 25 de febrero de 2019
Solarpack presenta resultados por primera vez tras su salida a bolsa
• Alcanza en el ejercicio 2018 unos ingresos de explotación de 30,1 MM € (-7% vs. 2017) y un beneficio neto de 5,6 MM € (+4% vs. 2017) a nivel consolidado - IFRS
• Sus resultados atribuibles por segmentos totalizan unos ingresos de explotación de 38,9 MM € y un EBITDA de 18,7 MM €
• La reciente ampliación de capital por 110 MM € comienza a desplegarse tras la compra de los c. 13 MW en activos operativos en España
• Pone en operación 10,5 MW en Colombia (totalizando 19,9 los MW construidos para terceros por la compañía en 2018) y comienza la construcción de 144 MW en Chile que pasan de Backlog a Under Construction
• Firma la financiación del proyecto Granja (Chile) con KfW y se cierran términos y condiciones, sujetos a due diligence, para la financiación de los proyectos en España, sumando todo ello hasta 131 MM € aproximadamente
La multinacional vizcaína especializada en energía solar fotovoltaica (FV) completa su primer ejercicio como compañía cotizada con unos sólidos resultados y una intensa actividad operativa para encarar un ejercicio 2019 de gran crecimiento.
En el segmento de Desarrollo y Construcción (DEVCON), los equipos de construcción de Solarpack han puesto en operación 19,9 MW en nuevas plantas solares FV durante el ejercicio 2018. Estas plantas se localizan en Chile y Colombia. Por otro lado, el ambicioso crecimiento del ejercicio 2019 comienza a hacerse realidad con el inicio de las obras en un total de 144 MW de nueva capacidad instalada, todos ellos localizados en Chile. Estos 144 MW, junto con los 362 MW en Backlog con que cuenta la compañía, se pondrán mayoritariamente en operación durante el ejercicio 2019.
Además de iniciar la construcción de nuevas plantas solares, Solarpack ha tenido avances significativos en la financiación bancaria de su plan de negocio. En concreto, ha firmado el contrato de financiación de su proyecto Granja (Chile), por un monto de hasta 91 MM US$ en deuda a largo plazo. Igualmente, la compañía ha acordado términos y condiciones, sujetos a Due Diligence, para la financiación de c 53 MM € en deuda a largo plazo para los proyectos que la compañía incorporará a su cartera de activos operativos en España.
Solarpack cuenta hoy además con 1.112 MW de proyectos en categoría Pipeline y 1.826 MW en categoría Identified Opportunities, que suponen una sólida base desde la que alimentar el crecimiento futuro de la compañía.
Su segmento de Generación de Energía (POWGEN) crece en el ejercicio 2018, sumando unos ingresos de explotación de 20,8 MM € y un EBITDA de 18,8 MM €. La compañía ha cerrado en diciembre de 2018 la adquisición de c. 13 MW en activos solares FV operativos en España. Los ingresos de explotación pro-forma con el impacto de esta adquisición desde enero de 2018, totalizan 28,4 MM €, con un EBITDA de 25,2 MM. El segmento POWGEN cuenta a 31 de diciembre de 2018 con 141 MW atribuibles en 11 proyectos (que totalizan 252 MW de potencia instalada) ubicados en Chile, España, India y Perú.
NOTA DE PRENSA
INVESTOR RELATIONS MEDIA ENQUIRIES SOLARPACK COMCO Javier Arellano Susana Ruiz - [email protected] I Juan Carlos Bolland – [email protected] [email protected] | +34944309204 Carlota Vicén – [email protected] | +34 91 436 18 00
2
El segmento de Servicios (SVCS) ha operado y mantenido 160 MW propios y de terceros durante 2018, con una disponibilidad media de 99,4%. Además, prestaba, a 31 de diciembre de 2018, servicios de gestión de activos a 330 MW propios y de terceros. A medida que los proyectos destinados a la unidad POWGEN vayan entrando en operación, la unidad SVCS continuará creciendo aportando un ingreso recurrente y visible a largo plazo para la compañía.
Sobre Solarpack
Solarpack es una multinacional especializada en el desarrollo, construcción y operación de proyectos
solares fotovoltaicos a gran escala con presencia en mercados de rápido crecimiento en Europa,
América del Norte, América Latina, Asia y África. Desde su fundación en 2005, la Compañía ha
desarrollado plantas de energía solar fotovoltaica que representan una capacidad total de 529 MW, de
los cuales Solarpack además ha construido 200 MW en modalidad “llave en mano” o “EPC”
("Ingeniería, Compras y Construcción"). La Compañía actualmente genera energía a través de 11
proyectos que suman 252 MW en España, Chile, Perú e India. Además, Solarpack opera y mantiene
13 plantas, con un total de 160 MW, y proporciona servicios de gestión de activos para un total de 330
MW de proyectos propios y de terceros. Con sede central en Getxo, España, Solarpack tiene una
presencia geográfica diversificada y emplea a 132 personas en 10 países.

Full Year 2018 Results
Full Year 2018 Results
February 25, 2019

Full Year 2018 Results
Disclaimer
This presentation has been prepared by Solarpack Corporación Tecnológica, S.A. (the Company) for informational use only.
The information contained in this presentation does not purport to be comprehensive or to contain all the information that a prospective purchaser of securities of the Company may desire or require in deciding whether or not to purchase such securities, and has not been verified by the Company or any other person. The information contained in this document is subject to change without notice. Neither the Company nor any of affiliates, advisors or agents makes any representation or warranty, express or implied, as to the accuracy or completeness of any information contained or referred to in this document. Each of the Company and its employees, officers, directors, advisors, agents or affiliates expressly disclaims any and all liabilities whatsoever (in negligence or otherwise, whether direct or indirect, in contract, tort or otherwise) for any loss howsoever arising from any use of this presentation, the information contained or referred to therein, any errors therein or omissions therefrom or otherwise arising in connection with this presentation. Neither the Company, nor any of its affiliates, advisors or agents undertakes any obligation to provide the recipients with access to additional information or to update this document or to correct any inaccuracies in the information contained or referred to therein.
Certain statements in this document regarding the market and competitive position data may be based on the internal analyses of the Company, which involve certain assumptions and estimates. These internal analyses may have not been verified by any independent sources and there can be no assurance that the assumptions or estimates are accurate. Additionally, certain information in this presentation may be based on management accounts and estimates of the Company and may have not been audited or reviewed by the Company’s auditors. Accordingly, recipients should not place undue reliance on this information. This information is provided to the recipients for informational purposes only and recipients must undertake their own investigation of the Company.
The information providing herein is not to be relied upon in substitution for the recipient’s own exercise of independent judgment with regard to the operations, financial condition and prospects of the Company.
Neither this presentation nor any copy of it shall be taken, transmitted into, disclosed, diffused, send, published or distributed in the United States, Canada, Australia or Japan. The distribution of this presentation in other jurisdictions may also be restricted by law and persons into whose possession this presentation comes should inform themselves about and observe any such restrictions. In particular, any offer that might result from the transaction herein escribed will not be made, directly or indirectly, in the United States of America, or by use of mails, or by any means or instrumentality (including, without limitation, facsimile transmission, telephone and internet) of interstate or foreign commerce of, or any facilities of any national securities exchange of, the United States, Canada, Australia or Japan. The securities of the Company have not been and, should there be an offering, Will not be registered under the U.S. Securities Act of 1933, as amended (the Securities Act) and, subject to certain exceptions, may not be offered or sold in the United States. The securities of the Company have not been and, should there be an offering, will not be registered under the applicable securities laws of any state or jurisdiction of Canada or Japan and, subject to certain exceptions, may not be offered or sold within Canada or Japan or to or for the benefit of any national, resident or citizen of Canada or Japan.
THIS PRESENTATION DOES NOT CONSTITUTE OR FORM PART OF ANY OFFER FOR SALE OR SOLICITATION OF ANY OFFER TO BUY ANY SECURITIES IN THE UNITED STATES OR IN ANY OTHER JURISDICTION, NOR SHALL IT OR ANY PART OF IT FORM THE BASIS OF OR BE RELIED ON IN CONNECTION WITH ANY CONTRACT OR COMMITMENT TO SELL OR PURCHASE SHARES. ANY DECISION TO SELL OR PURCHASE SHARES IN ANY OFFERING SHOULD BE MADE SOLELY ON THE BASIS OF PUBLICLY AVAILABLE INFORMATION.
This presentation may include forward-looking statements. These forward-looking statements involve known and unknown risks, uncertainties and other factors, which may cause such actual results, performance or achievements, or industry results, to be materially different from those expressed or implied by these forward-looking statements. These forward-looking statements are based on numerous assumptions regarding the present and future business strategies of the Company and the environment in which they expect to operate in the future. Forward-looking statements speak only as of the date of this presentation and the Company expressly disclaim any obligation or undertaking to release any update of, or revisions to, any forward-looking statements in this presentation, any change in their expectations or any change in events, conditions or circumstances on which these forward-looking statements are based.
In reviewing this presentation, the recipient is agreeing to, and accepting, the foregoing restrictions and limitations.
2

Full Year 2018 Results
AGENDA
1. Key Milestones of the Period
2. Operations Update
3. Financial Review
4. Outlook
5. Q&A
Appendix
3

Full Year 2018 Results
Key Milestones of the Period
4
1
2
3
4
5
Solarpack finally raised € 110m (including Greenshoe) in its fully primary IPO on December 5th, 2018▪ Funds available for growth strategy▪ Market cap as of today €394m(1)
The planned acquisition of c. 13MW of Spanish assets has been closed in December, 2018▪ Initial payment of €21.4m already disbursed▪ Additional €4.4m maximum earnout due end of 2019 based on “reasonable rate of return” to be set by Government▪ SPK’s attributable capacity2 reaches 141 MW
Movements in Pipeline and Identified Opportunities▪ 2 x 50 MW Third party EPC signed with aventron AG in Spain. Construction to start after financial close obtained by
client▪ 1,112 MW of Pipeline and 1,826 MW of Identified Opportunities as of this report’s date
Key figures yearly as of December 31, 2018▪ Development & Construction (DEVCON) Operating Revenues of €13.5m, EBITDA of €(0.0)m▪ Power Generation (POWGEN) Operating Revenues of €20.8m (PF-FY183 €28.4m), EBITDA of €18.8m (PF-FY183 €25.2m)▪ Services (SVCS) Operating Revenues of €4.6m, EBITDA of €1.3m
10,5 MW put in operation in Colombia and construction start of 144 MW in Chile▪ Financial close of Granja project signed with KfW▪ Construction start of Granja, Bellavista and Tricahue, and Backlog amounts to 362 MW▪ 10.5 MW (“Third party EPC” project type) moved from Under Construction to Operating
1. As of February 22, 2019 close2. Refers to DC capacity3. Pro-forma figures for FY2018 as if the acquisition of the c. 13 MW in Spain (the Spanish Assets) had been consolidated for the full year 2018
Full Year 2018 Results
AGENDA
5
1. Key Milestones of the Period
2. Operations Update
3. Financial Review
4. Outlook
5. Q&A
Appendix

Full Year 2018 Results6
Operations UpdateOperating portfolio - POWGEN
Attributable Gross Capacity reaches 141 MW of solid and diversified asset base after Spanish Assets acquisition
Spain
Chile
Peru
India
527
MW17
MW
# of Projects Capacity Attr. Capacity
58 MW
30 MW
68 MW
8 MW
2(1)
3
104 MW
86 MW
1(1)
1. 6 project sites in Chile, 6 project sites in India2. Pro-forma figures for FY2018 as if the acquisition of the
c. 13 MW in Spain (the Spanish Assets) had been consolidated for the full year 2018
€8.3m
PF EBITDA2 FY18
€4.3m
€2.4m
€10.2m
Currency
EUR
USD
USD
INR
252 MW
141 MW
11 €25.2m

Full Year 2018 Results 7
Operations UpdateProjects under Construction - DEVCON
144 MW have moved from Backlog to Under Construction in Chile
▪ Senior debt contract signed with KfW
▪ Modules, trackers and inverters orders placed
▪ High voltage transformer acquired
▪ Interconnection position at substation busbar acquired
▪ Fencing under execution
▪ No land preparation required
▪ Selection of interconnection subcontractor
▪ Tricahue:
▪ Modules, trackers and inverters orders placed
▪ Fencing completed
▪ Land site preparation completed
▪ Excavations and concrete fillings in progress
▪ Structure erection in progress
▪ Bellavista:
▪ Fencing completed
▪ Land site preparation
▪ Modules, trackers and inverter orders placed
Granja (Chile) PMGDs (Chile)

Full Year 2018 Results 8
Operations UpdateSummary of Project Portfolio - DEVCON
With 144 MW Under Construction, 362 MW of Backlog and 1,112 MW of Pipeline, Solarpack is ready to deliver profitable growth in an expanding sector
1. MW not weighted by probability of completion2. Attributable Capacity
Project Portfolio by Country (As of February 21, 2019)(1)
▪ 145 MW (adjusted to 144 MW) have transitioned from Backlog to Under Construction status in Chile
▪ One 118 MW Pipeline project dropped to Identified Opportunity in Colombia
▪ 131 MW of net additions to Identified Opportunities
MW Operating2 Under
ConstructionBacklog Pipeline Identified Opp.
Probability of Completion n.a. 100% >90% >50% 10%-30%
Spain 17.1 - 210.9 108.8 158.9
Peru 7.8 - - - 180.0
Chile 30.3 144.3 23.4 247.5 257.1
India 86.0 - 127.8 - -
South Africa - - - 517.5 258.7
Colombia - - - 238.0 170.4
USA - - - - 547.0
RoW - - - - 253.8
Total 141.2 144.3 362.1 1,111.8 1,825.9
Number of Projects 11 3 6 18 36
Full Year 2018 Results
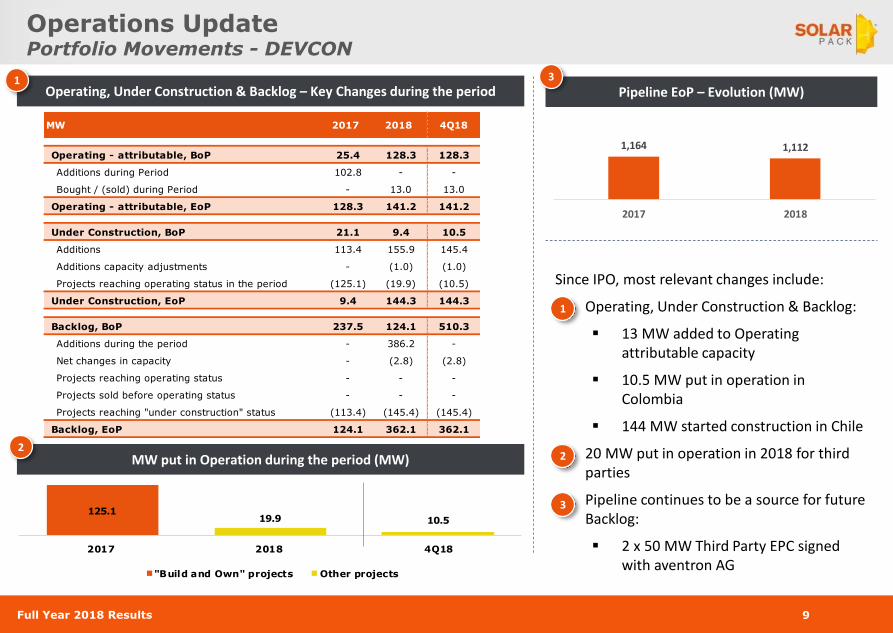
125.119.9 10.5
2017 2018 4Q18
"Build and Own" projects Other projects
9
Operations UpdatePortfolio Movements - DEVCON
Operating, Under Construction & Backlog – Key Changes during the period
Since IPO, most relevant changes include:
▪ Operating, Under Construction & Backlog:
▪ 13 MW added to Operating attributable capacity
▪ 10.5 MW put in operation in Colombia
▪ 144 MW started construction in Chile
▪ 20 MW put in operation in 2018 for third parties
▪ Pipeline continues to be a source for future Backlog:
▪ 2 x 50 MW Third Party EPC signed with aventron AG
MW put in Operation during the period (MW)
Pipeline EoP – Evolution (MW)1
2
3
1
2
3
MW 2017 2018 4Q18
Operating - attributable, BoP 25.4 128.3 128.3
Additions during Period 102.8 - -
Bought / (sold) during Period - 13.0 13.0
Operating - attributable, EoP 128.3 141.2 141.2
Under Construction, BoP 21.1 9.4 10.5
Additions 113.4 155.9 145.4
Additions capacity adjustments - (1.0) (1.0)
Projects reaching operating status in the period (125.1) (19.9) (10.5)
Under Construction, EoP 9.4 144.3 144.3
Backlog, BoP 237.5 124.1 510.3
Additions during the period - 386.2 -
Net changes in capacity - (2.8) (2.8)
Projects reaching operating status - - -
Projects sold before operating status - - -
Projects reaching "under construction" status (113.4) (145.4) (145.4)
Backlog, EoP 124.1 362.1 362.1
1,164 1,112
2017 2018

Full Year 2018 Results 10
Operations UpdateBacklog & Under Construction Status - DEVCON
Under Construction Status as of February 21, 2019
▪ Granja has signed senior debt contract with KfW (up to US$91m; >18yrs) and has obtained site control. The project is under construction
▪ *Senior loan term-sheet secured for Monclova and Grullas for up to €53m, DD in progress. Monclova has obtained environmental approvals
▪ KA2 has obtained interconnection rights
✔ Changes of the Period
Backlog Status as of February 21, 2019
**
Country Project Name Capacity (MW) Site Control Interconnec.
Rights
Environmental
Approvals
Build &
OwnFinancing
Off-take arrangement
status
Share Purchase
Agreememt
EPC for 3rd
Party
Chile Granja 123.0 ✔ Obtained Secured Obtained Yes ✔ Obtained Obtained n.a. n.a.
Chile Bellavista - PMGD 10.6 ✔ Secured Secured Obtained No n.a. n.a. Obtained Obtained
Chile Tricahue - PMGD 10.6 ✔ Obtained Obtained Obtained No n.a. n.a. Obtained Obtained
Total 3 144.3
Country Project Name Capacity (MW) Site Control Interconnec.
Rights
Environmental
Approvals
Build &
OwnFinancing
Off-take arrangement
status
Share Purchase
Agreememt
EPC for 3rd
Party
Spain Monclova 49.4 Obtained Secured ✔ Obtained Yes In progress Obtained n.a. n.a.
Spain Grullas 61.6 Obtained Secured Submitted Yes In progress Obtained n.a. n.a.
India KA2 127.8 In progress ✔ Obtained n.a. Yes In progress Obtained n.a. n.a.
Chile Panimávida - PMGD 11.7 Obtained Secured ✔ Obtained No n.a. n.a. Obtained Obtained
Spain Alvarado 100.0 Obtained Obtained In progress No n.a. n.a. Obtained Obtained
Chile Quinantu PMGD 11.6 Obtained Submitted Submitted No n.a. n.a. Obtained Obtained
Total 6 362.1

Full Year 2018 Results 11
Operations UpdateAcquisition of Spanish Assets - POWGEN
In December 2018, Solarpack acquired c. 13 MW(1) of attributable capacity in Spain. Opportunistic approach but under review if new opportunities could enhance profitable growth
Acquisition of Spanish Assets – attributable capacity
1. Acquisition of 100% equity interests in the share capital of several entities holding 88 solar plants of 100kW, whose added capacities represent the percentages shown in the table above over the total capacities of four solar plants located in Spain, and 46.74% of the share capital (up to 96.50% of the share capital) of the SPV holding Guijo de Coria project with a 6.13MW capacity
2. Guijo de Coria was not consolidated prior to the Spanish Operating Assets Acquisition. Fully consolidated after such transaction
▪ The transaction has added c. 13MW(1) of attributable capacity to the Spanish operating portfolio
▪ Total amount paid of €21.4m adjusted as per contracts to reflect difference between value as of January 1st 2018 and payment date
▪ Earnout to be paid in Q4 2019 subject to Rate of Return set for next regulatory period
▪ Spanish Government has proposed keeping the 7.4% Rate of Return for the next two regulatory periods. If enacted, earn out would
amount to €4.4m
▪ Yearly Pro-forma EBITDA contribution of €6.4m in 2018
▪ Value creation upside from (i) refinancing potential and (ii) SVCS margin protection and long term visibility
(2)
Owned before acq. Acquired Owned after acq.
Project MW MW MWPayment as of
Dec 30Max Earnout Total
Isla Mayor 0.4 2.5 2.9 4.8 0.9 5.7
Lebrija 0.2 1.4 1.7 2.3 0.5 2.8
Llerena 1 0.2 3.6 3.8 4.8 1.2 6.0
Llerena 2 0.3 2.5 2.8 6.1 1.2 7.3
Guijo Coria 3.1 2.9 5.9 3.4 0.7 4.1
4.2 12.9 17.1 21.4 4.4 25.8
Acquisition Investment (€mm)

Full Year 2018 Results
AGENDA
12
1. Key Milestones of the Period
2. Operations Update
3. Financial Review
4. Outlook
5. Q&A
Appendix

Full Year 2018 Results
2018 PF 2018 2017 Q4 2018 Q4 2017
Operating Revenues 46,497 38,864 54,497 14,673 9,791
Gross Profit 29,537 24,112 28,121 8,339 6,604
Gross Profit Margin % 63.5% 62.0% 51.6% 56.8% 67.4%
EBITDA 25,084 18,695 22,198 6,997 4,078
DEVCON (50) (50) 9,513 2,264 (2,767)
POWGEN 25,217 18,828 11,339 4,931 6,386
SVCS 1,328 1,328 1,569 266 513
Corporate (1,411) (1,411) (223) (465) (54)
EBITDA margin % 53.9% 48.1% 40.7% 47.7% 41.7%
EBIT 15,010 12,304 18,132 5,312 2,645
EBIT margin % 32.3% 31.7% 33.3% 36.2% 27.0%
13
Financial HighlightsSegment Financials – (DEVCON + POWGEN + SVCS + CORPORATE)1
2018 shows lower DEVCON activity due to focus on preparation of Backlog. However, POWGEN increases EBITDA contribution significantly due to “Build and Own” strategy and total revenues and EBITDA quarterly trend is positive
1. Segmented financials information, non-gaap. Helps to better understand the performance of the different businesses and cash generation. Under IFRS, certain eliminations/adjustments must bee applied2. Pro-forma figures for FY2018 for the acquisition of the c. 13 MW in Spain (the Spanish Assets)
0
5000
10000
15000
Q4 2017 Q1 2018 Q2 2018 Q3 2018 Q4 2018
Segment Quarterly Financials ('000 EUR)
Operating Revenues EBITDA
2

Full Year 2018 Results
Op
era
tin
g R
eve
nu
es
(€m
m)
Gro
ss M
argi
n (
€m
m, %
)EB
ITD
A a
nd
EB
ITD
A
Mar
gin
(€
mm
, %)
FINANCIAL PERFORMANCE
14
Financial HighlightsDevelopment & Construction (DEVCON) – Segment information
DEVCON activity started to pick-up again in 4Q 2018 due to Chilean Backlog construction start
DEVCON HIGHLIGHTS
▪ Backlog starts transition into Under Construction (144 MW) 4Q 2018
▪ Projects expected to enter operation during 2019 and early 2020
▪ Term-sheet secured for Monclova/Grullas and senior debt contract signed for Granja. Equivalent to €131.3m1 maximum senior debt
▪ 50% of Alvarado changed target completion date to Q12020 due to special environmental requirements
▪ 2 out of 5 KA2 sites are facing challenges on site acquisition which may lead to delays
Expected Calendar for Projects in Backlog and Under Construction (MW)
Under Construction
D&C
Operation
Country MW 4Q18 1Q19 2Q19 3Q19 4Q19 1Q20 2Q20
Monclova B&O Spain 49.4
Grullas B&O Spain 61.6
Alvarado B&S Spain 100
Granja B&O Chile 124.1
Bellavista B&S Chile 10.6
Tricahue B&S Chile 10.6
Panimavida B&S Chile 11.7
Quinantu B&S Chile 11.7
KA2 B&O India 130.6
Plant
1. EUR_USD=1.16 considered for Granja loan conversion in to €
36.8
13.5
1.6
8.1
2017 2018 4Q17 4Q18
14.7
3.5 3.0
40%26%
-28%
37%
2017 2018 4Q17 4Q18
9.5
(0.0)
(2.8)
2.3
26% 0% 28%
2017 2018 4Q17 4Q18

Full Year 2018 Results
11.3
18.8
6.4 4.9
6.4
87%
91% 94%92%
2017 2018 4Q17 4Q18
15
Financial HighlightsPower Generation (POWGEN) – Segment Information
Pro-Forma POWGEN figures shows strong, stable and recurrent EBITDA base in the range of €25.2m per year
FINANCIAL PERFORMANCEPOWGEN HIGHLIGHTS
▪ 59% YoY growth in Operating Revenue and 66% YoY growth in EBITDA
▪ Q417 includes c. €2.2m penalties in favour of Indian projects as compared to Q418
▪ Receivables in POWGEN have increased due to higher weight of TS1 (higher volume and receivables period)
▪ “Contracted” revenue at 94% and hard currency EBITDA at 58%
MW
in O
pe
rati
on
, Eo
PTo
tal P
rod
uct
ion
(G
Wh
)
Co
ntr
acte
d &
cu
rre
ncy
b
reak
do
wn
EBIT
DA
an
d E
BIT
DA
M
argi
n (
€m
m, %
)O
pe
rati
ng
Re
ven
ue
s (€
mm
)
PF POWGEN FY18 Revenues Split
PF POWGEN +SVCS FY18 Revenue currency split
PF Adjustment (1)
1. Pro-forma figures for FY2018 as if the acquisition of the c. 13 MW in Spain (the Spanish Assets) had been consolidated for the full year 2018
PF Adjustment (1)
252 252
128 141
2017 2018
Gross Attributable
358
510
114
240
2017 2018
Total Proportional
13.1
20.8
6.8 5.4
7.6
2017 2018 4Q17 4Q18
Contracted/
Regulated
94%
Merchant
6%
37%
31%
32%
EUR
USD
INR

Full Year 2018 Results 16
Financial HighlightsServices (SVCS) – Segment information
Op
era
tin
g R
eve
nu
es
(€m
m)
Gro
ss M
argi
n (
€m
m, %
)EB
ITD
A a
nd
EB
ITD
A
Mar
gin
(€
mm
, %)
FINANCIAL PERFORMANCE
SVCS remains as a recurrent EBITDA generator. Build and Own strategy will contribute to long term visibility
SVCS HIGHLIGHTS
O&
M a
nd
AM
S –
MW
Se
rvic
ed
Eo
PA
vera
ge P
lan
t A
vaila
bil
ity
(%
)
▪ 100% revenues in EUR and USD
▪ Higher margin in 4Q17 due to one-off repowering activity in Peru
▪ SVCS will continue to grow as projects Under Construction and in Backlog enter in operation
153.8 160.2 219.4
330.3
2017 2018
O&M AMS
99.2%98.5%
99.9% 99.9%
99.7% 99.4%
2017 2018
Max Min Average
4.7 4.6
1.4 1.2
2017 2018 4Q17 4Q18
2.1 1.8
0.7 0.5
45%39%
49%
37%
2017 2018 4Q17 4Q18
1.6 1.3
0.5 0.3
34% 29%38%
21%
2017 2018 4Q17 4Q18

Full Year 2018 Results 17
Financial HighlightsNet Financial Debt Profile
Net Debt over POWGEN + SVCS EBITDA remains at healthy levels and non-recourse project debt is largely predominant
PROPORTIONATE NET FINANCIAL DEBT BREAKDOWN(1)
1. NFD calculated as loans + other financial liabilities – Cash. Cash calculated as cash & cash equivalents + other financial assets + short-term credits2. Pro-forma for Spanish Assets acquisition
4.77x6.28xNet Debt/ EBITDA
€ 20.2m € 26.5mFY2018 EBITDA (POWGEN + SVCS)
Non Pro-forma Pro-forma2
2.07x2.73x
€ 20.2m € 26.5m
Non Pro-forma Pro-forma2
3.49x
€ 14.6m
IFRS non PF
IFRS NET FINANICAL DEBT
144.7
54.9 51.0
(18.0)
126.6
5.29.7
(86.6)
(3.9)
POWGEN
non-recourse
debt
POWGEN
Cash
Non-recourse
NFD
Int. bearing
debt
Non int.
bearing debt
Corporate
Cash
Total Prop.
NFD
Cons. Adj IFRS NFD

Full Year 2018 Results
5.7 14.6
5.0 3.9
7.4 18%
48%
67%
43%
2017 2018 4Q17 4Q18
32.3 30.1
7.4 9.3
8.2
2017 2018 4Q17 4Q18
18
Financial HighlightsConsolidated Financials IFRS
IFRS financials show increasing POGWEN EBITDA contribution, consistently positive bottom line incomes, and healthy NFD/EBITDA ratios
Operating Revenues(1) (€mm) FY18 Sales Breakdown by Country (%)
Net Financial Debt(3) & ND/EBITDA (€mm, x)Net Profit & Mg. (€mm, %)
EBITDA & EBITDA Mg. (€mm, %)
1. Operating Revenues consist of net business turnover, other operating revenues and variation of finished and work-in-progress stock2. PF figures to reflect the signed acquisition of assets in Spain (Isla Mayor, Lebrija, Llerena 1 & 2, Guijo de Coria solar PV plants) in 2H18 adding c. 13MW of attributable capacity3. ND calculated as loans + other financial liabilities – cash & cash equivalents – other financial assets – short-term credits
▪ Higher and more stable EBITDA due to increased POWGEN activity
▪ Accumulated €11.0m Net Profit in the last 2 years sustains profitable growth
▪ Leverage indicators remain healthy contributing to balanced risks strategy
Pro-forma Adjustment (2)
Pro-forma Adjustment (2)
Pro-forma Adjustment (2)
Spain
(EUR);
11.3%
Chile
(USD);
24.1%
India
(INR);
41.9%
Colombia
(COL);
18.8%
Other
(USD);
3.9%
5.4 5.6 1.0 2.7
2.7
17%18%
13%
30%
2017 2018 4Q17 4Q18
73.2
51.0
12.9x
3.5x
2017 2018
Full Year 2018 Results
AGENDA
19
1. Key Milestones of the Period
2. Operations Update
3. Financial Review
4. Outlook
5. Q&A
Appendix

Full Year 2018 Results
OutlookShort Term & Long Term
Solarpack is keeping the same short-term and long term targets set out prior to the IPO
▪ POWGEN (Build & Own):
▪ DEVCON:
9-10%
Equity IRR2 – Hard Currencies
10-15%
DEVCON Gross Margin
SHORT TERM (Backlog & Under Construction) OUTLOOK
12-15%
Equity IRR2 – Soft Currencies
150-300
New MW/yrrun-rate
70%
POWGEN contracted Rev.
66%
POWGEN + SVCS Rev. in Hard Curr.
Equity needs (€ millions)
60-65
Proj. Fin. Debt needs (€ millions)
160-170
DEVCON Gross Margin1
14.5%-17.5%
1. Weighted average DEVCON Gross Margin for projects Under Construction and Backlog2. Levered equity IRR
20
Full Year 2018 Results
AGENDA
21
1. Key Milestones of the Period
2. Operations Update
3. Financial Review
4. Outlook
5. Q&A
Appendix

Full Year 2018 Results
Appendix
22

Full Year 2018 Results
FY2018 ELIMINATIONS
In € thousands
Intragroup
Transactions
Interests in
Associates
Minority
Interests
Accounting
Reclass
Elimination
s Total
Operating Revenues (5.2) (5.7) 3.1 (0.9) (8.8)
External clients (0.1) (5.9) 3.1 (1.3) (4.2)
Related party clients (5.1) 0.2 - 0.4 (4.6)
Operating expenses 4.4 3.2 (0.9) 0.8 7.5
Direct costs 2.5 1.3 (0.0) 0.9 4.7
SG&A - - - - -
EBITDA (2.7) (4.4) 2.3 (0.1) (4.1)
D&A 1.9 1.9 (0.1) (0.1) 2.8
EBIT (0.8) (2.5) 2.2 (0.2) (1.3)
13.5
38.9
30.1 4.6
20.8
-
(8.8)
D&C Services Power
Gen.
Corp. Total Elimin. Consol.
IFRS
(0.0)
18.7
14.6
1.3
18.8
(1.4)
(4.1)
D&C Services Power
Gen.
Corp. Total Elimin. Consol.
IFRS
▪ Intra-Group transactions are eliminated under IFRS: The majority of the eliminations come from DEVCON margin for Build & Own Projects. To a lesser extent, revenues coming from SVCS provided to consolidated operating plants also result in eliminations
▪ In order to reflect the equity interests in the different projects, (i) transactions of non-controlled companies that are accounted for in the business divisions, but which are not included in the consolidated results of the Group under IFRS; and (ii) for those companies fully consolidated under IFRS, transactions attributable to non-controlling interests are eliminated to reflect proportional interest in the companies’ results
▪ Reclassification of operating revenues that are considered as financial income under IFRS
2018 Revenues (€mm) 2018 EBITDA (€mm)
Eliminations
23
Appendix IISegments Information - Non-GAAP to IFRS

Full Year 2018 Results
Appendix IIIOperating Portfolio
24
Solarpack owns stakes in 252MW distributed internationally, with attributable capacity amounting to 141MW
OPERATING PORFOLIO as of YE2018
1. Stakes post 2H2018 acquisition. In the case of Isla Mayor, Lebrija, Llerena 1 and Llerena 2, Solarpack owns 100% of SPVs which own stated percentages of total capacity for each PV plant2. Comprises the solar PV plants of CS3, PAS2 and PAS33. Outstanding debt at SPV level proportional to Stake Owned
Project Country CurrencyStake Owned
(%)(1)
Gross
Capacity
(MW)
Revenues
(€mm, PF)
EBITDA
(€mm, PF)
Outstanding debt as
period end (Currency
millions)
Isla Mayor Spain EUR 34% 8.4 1.8 1.5 7.0
Lebrija Spain EUR 44% 3.8 1.0 0.9 4.5
Llerena 1 Spain EUR 80% 4.8 2.3 2.0 13.0
Llerena 2 Spain EUR 70% 4.1 2.3 2.0 9.6
Guijo de Coria Spain EUR 97% 6.1 2.6 2.0 14.8
Tacna Peru USD 10% 22.2 0.9 0.8 6.4
Panamericana Peru USD 10% 20.7 0.9 0.9 6.4
Moquegua Peru USD 19% 19.4 0.9 0.7 6.9
Ataca (2) Chile USD 19% 26.5 1.3 1.1 10.2
PMGD PAS1-CAS1-
PSSChile USD 80% 31.6 3.8 3.3 24.6
TS1 India INR 83% 104.0 10.5 10.2 3,746.9
Total 252 28.4 25.2
(3)

Full Year 2018 Results 25
Appendix IVBalance Sheet
CONSOLIDATED BALANCE SHEET (IFRS)
Balance Sheet (€k)
Assets
Tangible fixed assets 5,196 175,136
Tangible fixed assets- PV plants 4,767 170,049
Tangible fixed assets under construction - PV plants - 4,551
Tangible fixed assets-other 429 536
Goodwill and Intangible assets 86 24,436
Non-current investments in group companies and associates 4,971 4,233
Non-current investments 2,083 5,477
Deferred tax assets 4,143 10,459
Total non-current assets 16,479 219,741
Inventories 117,958 3,680
Inventories-photovoltaic solar plants 117,958 3,542
Inventories-other - 138
Trade and other receivables 8,292 13,753
Current Investments in group companies and associates 978 544
Current Investments 4,046 9,532
Prepayments for current assets 248 381
Cash and cash equivalents 19,529 94,280
Total current assets 151,051 122,170
Total assets 167,531 341,911
2017A 2018ABalance Sheet
Net equity and Liabilities
Capital stock 427 13,301
Share premium 5,213 109,586
Reserves 46,596 32,993
Interim dividend (263) -
Translation differences (3,033) (4,034)
Valuation adjustments - 2,806
Non-controlling interests 4,020 4,855
Total net equity 52,960 159,507
Non-current provisions 325 1,682
Non-current payables 3,352 143,621
Long-term loan funds-photovoltaic solar plants 3,352 121,745
Subordinated debts with non-controlling partners related to solar plants - 2,985
Derivatives - 4,353
Other non-current financial liabilities - 14,539
Group companies and associates, non-current 0 1
Deferred tax liabilities 1,133 5,800
Total Non-current liabilities 4,810 151,105
Current provisions 332 181
Current payables 94,895 16,080
Short-term loan funds-photovoltaic solar plants 85,098 11,370
Short-term loan funds-other 28 4
Subordinated debts with non-controlling partners related to stock 3,717 1,161
Derivative financial instruments 780 -
Other current financial liabilities 5,272 3,545
Group companies and associates, current 0 0
Trade and other payables 14,332 14,834
Current accruals 202 205
Total current liabilities 109,761 31,300
Total liabilities 114,571 182,405
Total Equity + Liabilities 167,531 341,911
2017A 2018A

Full Year 2018 Results 26
Appendix IVIncome Statement
CONSOLIDATED INCOME STATEMENT (IFRS)
Consolidated Income Statement (€k) 2017A 2018A
Net business turnover 13,160 26,907
Other operating revenues 1,959 109
Changes in inventories of finished goods and work in progress & In-house
work on non-current assets17,167 3,084
Operating revenues 32,286 30,101
Raw and indirect material consumption (14,158) (4,222)
Cost of personnel (7,622) (6,674)
Amortizations and impairments (416) (3,569)
Other operating expenses (4,813) (4,607)
Operating expenses (27,008) (19,071)
Operating profit (EBIT) 5,279 11,030
Financial income 539 4,672
Financial expenses (2,371) (9,175)
Change in fair value of financial instruments 7,326 (1,877)
Net differences in exchange rates (3,576) 843
Net Financial Income/(Expense) 1,919 (5,537)
Interests in profits and loss of associates (1,215) 361
Earnings before corporate income tax (EBT) 5,983 5,854
Tax on profits (623) (295)
Profits from the year 5,360 5,559
Profits attributable to non-controlling interests 635 544
Profits attributable to shareholders of the Company 4,726 5,015

Full Year 2018 Results
Avenida de Algorta 16, 3º
48992 Getxo - Vizcaya - Spain
Phone: +34 944 309 204
Fax: +34 944 309 209
www.solarpack.es
27