pla-ommt nanocomposites manufactured by reactive...
TRANSCRIPT
Chapter
11
PLA-OMMT NANOCOMPOSITES MANUFACTURED BY REACTIVE EXTRUSION
Félix Carrasco,1* Orlando Onofre Santana,2 Jonathan Cailloux,2 and Maria Lluïsa Maspoch2
1 Department of Chemical Engineering, Universitat de Girona, C/Maria Aurèlia Capmany, 61, 17003 Girona, Spain 2 Centre Català del Plàstic (CCP), Universitat Politѐcnica de Catalunya, C/Colom, 114, 08222 Terrassa, Spain
*Corresponding author: [email protected]
Chapter 11
358
Contents
11.1. INTRODUCTION ..................................................................................................................................... 359
11.2. REACTIVE EXTRUSION PROCESSING AT LABORATORY SCALE ...................................... 364
11.2.1. Reaction monitoring .............................................................................................................. 364
11.2.2. Characterization of reactivity between clay and chain extender ....................... 368
11.3. REACTIVE EXTRUSION PROCESSING AT PILOT PLANT SCALE ....................................... 371
11.3.1. Molecular characterization ................................................................................................. 371
11.3.2. Effect of clay and/or chain extender addition on the rheological behavior ........................................................................................................................................ 373
11.3.3. Effect of chain extender incorporation on clay dispersion in the PLA matrix ............................................................................................................................................. 377
11.3.4. Mechanical characterization .............................................................................................. 378
11.3.5. Thermal stability ..................................................................................................................... 381
11.3.6. Kinetics of the thermal decomposition: elucidation of reaction mechanism .................................................................................................................................. 383
11.4. CONCLUSIONS ......................................................................................................................................... 392
ACKNOWLEDGEMENTS ................................................................................................................................. 392
REFERENCES ...................................................................................................................................................... 393

359
11.1. INTRODUCTION
The market of biopolymers is growing every year and important new demands can be expected from applications which offer clear benefits for customers and environment. A 2014 report published by BCC Research has estimated the global bioplastic demand in 2014 at more than 1400 kt, whereas it is predicted to be increasing to about 6000 kt in 2019 [1]. Furthermore, in correlation with the important demand of bioplastics, it is expected that the global production capacities will increase to more than 7.8 million tons in 2019. Unfortunately, for certain requests such as packaging or engineering sectors, the biopolymers cannot be fully competitive with polymers from the category of commodity or engineering thermoplastics (i.e., polystyrene (PS), polyethylene (PE), polypropylene (PP), and polyethylene terephthalate (PET)). However, the rapid emergence of bioplastics is one of the major stories of the last decade.
In comparison with other biopolymers, the production of poly(lactic acid) (PLA) has numerous advantages [2], such as: (a) biodegradability, recyclability, and compostability [3-4], (b) biocompatibility, which is a very attractive aspect of PLA, especially with respect to biomedical applications, (c) processability (PLA has better thermal processability compared to other biopolymers. It can be processed by injection molding, film extrusion, blow molding, thermoforming, fiber spinning, and film forming in order to yield molded parts, films, or fibers [5-6]), and (d) energy savings (PLA requires 25−55 % less energy to produce than petroleum-based polymers [7]). Despite the above positive features, PLA has also drawbacks, which limit its use, such as: (a) poor toughness (PLA is a very brittle material with less than 10 % elongation at break [8]. Although its tensile strength and elastic modulus are comparable to PET, the poor toughness limits its use in the applications that need plastic deformation at higher stress levels), (b) slow degradation rate (PLA degrades through the hydrolysis of backbone ester groups and the degradation rate depends on the PLA crystallinity, molecular weight, morphology, water diffusion rate into the polymer, and the stereoisomeric content [9]. The degradation rate is often considered to be an important selection criterion for biomedical applications [10]. The slow degradation rate leads to long in vivo lifetime (mostly 3−5 years), which is a serious problem with respect to disposal of consumer commodities), (c) hydrophobicity, (d) lack of reactive side-chain groups, (e) long injection molding cycle time due to a small rate of crystallization, and (f) high sensitivity to moisture and low resistance to hydrolysis. However, PLA-based products with specific end-use properties (high speed of crystallization, toughness and impact resistance, flame retardancy, antistatic to electrical conductive properties, and anti-UV and antimicrobial characteristics) have been recently produced for novel applications as new PLA bionanocomposites [11].
Chapter 11
360
The ever increasing commercial importance of polymers has entailed a continuous interest in their thermal stability. The kinetic modelling of the decomposition process plays a central role in many of those studies, being crucial for an accurate prediction of the materials behavior under different working conditions [12-25]. A precise prediction requires knowledge of the so-called kinetic triplet, namely, the activation energy, the frequency factor, and the kinetic model, through the conversion function, f(α). This latter parameter is an algebraic expression that is associated with the model that describes the kinetics of a solid-state reaction. Therefore, the kinetic analysis also provides some understanding of the mechanism of the reaction. Knowledge of the kinetic model of thermal degradation is very helpful in the field of the thermal stability of polymers [26-31].
It is generally agreed that the choice of the PLA matrix (isomer purity, molecular, rheological, and thermal properties, and method of processing) is of key importance for the production of composites/nanocomposites. However, among the other different factors, it is also essential to take into consideration the requirements of application. It is important also to point out that PLA is usually delivered as granules previously crystallized during the final steps of fabrication process, to obtain a certain degree of crystallinity. However, because the engineering applications are demanding a high thermal stability and/or utilization at high temperature, the general tendency is to use a PLA matrix with extremely low D-isomer content, which can exhibit higher melting temperature and degree of crystallinity [11]. PLA with low D-isomer content is mostly indicated in applications requiring semicrystalline polymers, while those with higher percentage of D-isomer are generally used where amorphous polymers are necessary, such as heat seal layers needing low activation temperature.
PLA is industrially obtained through the polymerization of lactic acid or by the ring-opening polymerization of lactide (the cyclic dimer of lactic acid, as an intermediate) [32-33]. Presently, the main way to obtain high molecular weight PLA is through ring-opening polymerization of lactide, carried out commonly by using a stannous octoate-based catalyst. Additionally, the biosynthesis of PLA using enzymes is a new challenge, in terms of both research and industrial implementation [34]. It has to be noted that lactic acid can be made by fermentation of sugars obtained from renewable resources, such as corn, potato, cane molasses, and sugar beet. PLA is the first commodity polymer produced from annually renewable resources [35].
Currently, the applications of PLA cover medical, packaging, and technical/engineering fields. PLA is used in a wide range of biomedical applications such as stents, surgical sutures, plates, and screws for craniomaxillofacial bone fixation, interference screws in ankle, knee, and hand, spinal cages, soft-tissue implants, tissue engineering scaffolds, tissue cultures, drug delivery devices, and craniofacial augmentation in plastic surgery [36]. In many cases PLA can be blended or copolymerized with other polymeric or
PLA-OMMT nanocomposites manufactured by reactive extrusion
361
non-polymeric components to achieve the desired behavior [37,38]. The general criterion for selecting a polymer for use as a biomaterial is to match the mechanical properties and the time of degradation to the needs of the application. PLA is ideally suited for many applications in the environment, where recovery of the product is not practical, such as agricultural mulch films and bags. Composting of post-consumer PLA items is also a viable solution for many PLA products. Biodegradable plastics, packaging and paper coatings, sustained release systems for pesticides and fertilizers, and compost bags are also examples of PLA usage in non-medical application. Fiber manufacturing is one of the largest potential application areas for PLA. PLA is readily melt spinnable and stress crystallizes upon drawing, and can be designed for many fiber applications. Some of the current fiber uses include hollow fiberfill for pillows and comforters, bulk continuous filament for carpet, filament yarns, and spun yarns for apparel, spun bond, and other nonwovens and bicomponent fibers for binders and self-crimping fibers. PLA excels at resistance to stain in standard tests with coffee, cola, tea, catsup, lipstick, and mustard. PLA also burns with low smoke generation, has good ultraviolet resistance, is easily dyeable, and brings good wickability of moisture to applications [35]. Films are the second largest application area for PLA. For example, PLA in food packaging applications is ideal for fresh products and those whose quality is not damaged by PLA oxygen permeability [2]. PLA is a growing alternative as a green/ecofriendly food packaging polymer. New applications have been claimed in the field of fresh products, where thermoformed PLA containers are used in retail markets for fruits, vegetables, and salads. That field of application of biodegradable polymer in food-contact articles includes also disposable cutlery, drinking cups, salad cups, plates, overwrap and lamination film, straws, stirrers, lids and cups, plates and containers for food dispensed at delicatessen, and fast-food establishments. For today, the major PLA application is in packaging (nearly 70 %) [2]. In this field, as a native form or in a blend, PLA contributes tremendously to packaging material stiffness, clarity, deadfold and twist retention, low-temperature heat sealability, and special barrier characteristics (i.e., aroma and flavor).
Because of its versatility, it is generally agreed that the production and processing of PLA (by injection molding, compression molding, extrusion, and spinning) and its nanocomposites can be realized with similar equipment [32,39,40], such as in the case of traditional polymers. With few modifications and adaptations, the production of PLA composites/nanocomposites is realized using the following techniques:
(a) there is melt-compounding using typical procedures, for example, dry- -mixing all or some of the components with high speed mixers, followed by compounding in a wide range of melt-blending equipment such as internal mixers, single- or twin-screw extruders, or Buss kneaders. The processing conditions (shear, temperatures, and mixing
Chapter 11
362
time) are determined by the type of equipment, nature of dispersed phase(s), blend composition, and desired end-use product properties. It is worth recalling that the polyester-based matrix (i.e., PLA) is very sensitive to temperature, shearing, and hydrolysis, so that all precautions should be applied to avoid its degradation [32]. It is absolutely necessary to limit the content of water in PLA for all compositions at 50−250 ppm whatever the processing conditions, and this can be problematic in the case of some natural fibers used as reinforcements or of fillers containing crystallization water. Clearly, the melt-compounding method is highly preferred in the context of sustainable development since it avoids the use of organic solvents, which are not ecofriendly and can alter the life cycle analysis of PLA. Moreover, this approach is easier upscaled to larger scale and to industry, whereas the twin-screw extrusion is the preferred method for PLA modification by reactive extrusion processing (REX) or for the addition of masterbatches, impact modifiers, fibers, fillers, additives, or selected polymers, which can increase the performances of PLA [41],
(b) solvent-based methods (i.e., solvent-casting) are chosen especially in the incipient phase of the research, mostly at small laboratory scale. Besides, due to low quantities of active pharmaceutical ingredients, this technique remains of interest for the biomedical sector, and
(c) there are other methods. The production of composites/ nanocomposites based on PLA can imply the polymerization of lactide on the surface of dispersed phases for better compatibility/higher performances [42], the physical blending of PLA (as fibers) with natural or synthetic fibers [43], utilization of pultrusion as technique [44] to produce PLA reinforced with long fibers [45], coextrusion (fibers, films, and sheets), and hot pressing using the film stacking method [46].
PLA can be compounded with fibers (flax, kenaf, glass fibers, carbon fibers, and cellulose), fillers (talc, carbonaceous fillers, hydroxyapatite, inorganic carbonates and sulfates, mica, and kaolin), and nanofillers (organomodified layered silicates, graphite derivatives, carbon nanotubes, sepiolite, halloysite, polyhedral oligomeric silsesquioxanes, silica, and ZnO). Generally speaking, fillers/nanofillers are combined with polymers to either reduce the cost or to modify the physical, rheological, optical, or other properties of the polymeric composites/nanocomposites. If the fillers/nanofillers do not decrease the molecular, thermal, and mechanical characteristics of PLA, their utilization can be an effective route to cost reduction and also the source of improved mechanical parameters, such as the increase of modulus/stiffness at room temperature or high temperature, especially in those PLA grades which allow a high degree of crystallinity. It is worth mentioning that a great number of adequately modified fillers can lead to PLA nanocomposites, which show remarkable improvements of properties evidenced even at very low nanofiller
PLA-OMMT nanocomposites manufactured by reactive extrusion
363
loading (usually 3−5 %). Micro- and nanofillers containing layered silicates or nanoclays have been reported in the literature [47-49].
Several works reported the melt blending of an organically modified montmorillonite type, named Cloisite® 30B (referred to as organically modified montomorillonite (OMMT)) with PLA [50-58]. This is due to the favorable enthalpy interactions between the clay organic modifier and the polymer, which is supposed to improve clay exfoliation [59]. According to the literature, 2−2.5 % of OMMT seems to induce a good balance between low clay loading and the notable enhancement of the rheological, mechanical, fracture, thermal, and gas barrier properties. Nevertheless, the thermomechanical properties of these biobased clay polymers above the glass transition cannot compete with reinforced commodity thermoplastics. The clay organic modifier is also known to catalyze the degradation of the PLA matrix during processing. Besides the risk of clay aggregation, processing difficulties are likely to occur during large scale productions where the melt strength is the dominant factor (i.e., film blowing and foaming). Reactive extrusion with a chain extender is widely used to counteract melt degradation and to increase molecular weight, melt strength, and hydrolytic stability of polyesters. Najafi et al. [54,60] showed that the melt degradation of PLA blended with 2 % of OMMT can be minimized by adding 1 % of a styrene-acrylic multifunctional epoxy random oligomer (referred to as SAmfE). Later, different studies showed that 0.5 % of SAmfE chain extender is sufficient to both counteract degradation reactions and significantly enhance PLA melt properties [61-63].
In this area the fundamental challenge is to enhance the interaction between the clay and the matrix in order to enhance clay dispersion. Tethering reactive species onto the surface of the OMMT platelets seems to be a valuable methodology, as already reported by several authors [64-66]. Taking into account that the resultant performance of PLA-based nanocomposite products is strongly affected by clay dispersion and the processing technique, lab-scale equipment is unable to induce a similar thermomechanical history as large scale processing systems. Most studies on PLA-OMMT nanocomposites melt blended with SAmfE chain extender were limited to the effects of the nanofiller content and both blending ratio and conditions [54,58,60,61]. Then, the processed materials were ground into pellets and compression molded to obtain test samples. Since this manufacturing process is both time and cost intensive, it is not able to easily penetrate the market of nanocomposite materials.
The present work aims at the manufacturing of PLA sheets reinforced with commercial OMMT through reactive extrusion in a pilot plant. PLA was first compounded separately with OMMT and chain extender on common preindustrial extruders and PLA-OMMT sheets were subsequently calendered in line using a masterbatch approach. Moreover, the reactivity exhibited by the OMMT towards the multifunctional reactive agent was investigated. Then, based on the clay dispersion, the rheological, mechanical, and thermal
Chapter 11
364
behaviors of the nanocomposites were analyzed. Finally, a new index was proposed in order to elucidate the correct mechanism responsible for the thermal degradation of the polymer and its nanocomposite obtained by reactive extrusion.
11.2. REACTIVE EXTRUSION PROCESSING AT LABORATORY SCALE
11.2.1. Reaction monitoring
The PLA extrusion grade used in this work has a D-lactide content of about 2 % and a melt flow index (210 °C/2.16 kg) of 6.4 0.3 g/10 min. The chain extender agent, namely, Joncryl-ADR-4300F®, has functionality, fn
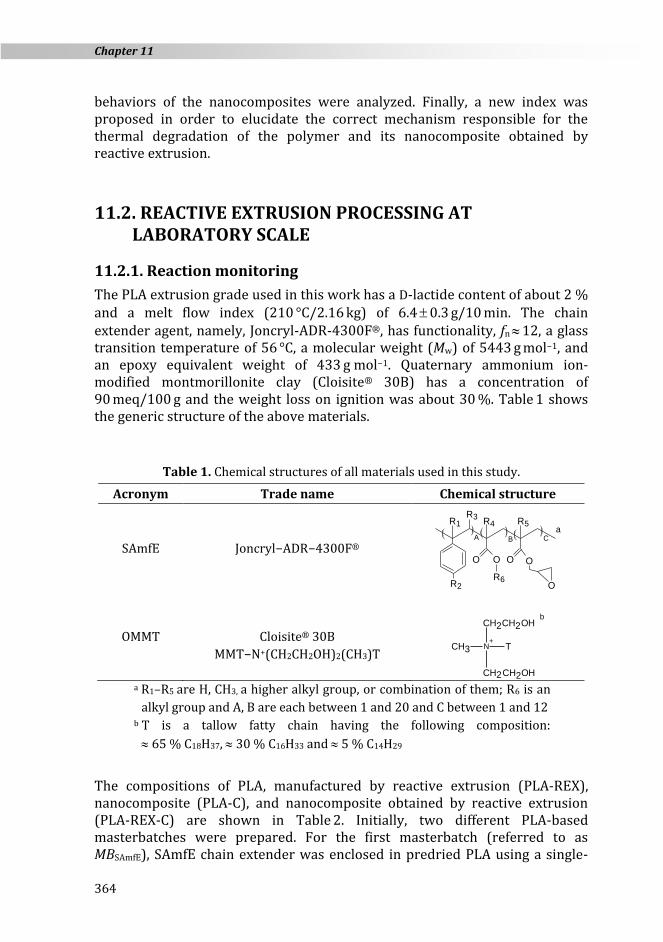
12, a glass transition temperature of 56 °C, a molecular weight (Mw) of 5443 g mol−1, and an epoxy equivalent weight of 433 g mol−1. Quaternary ammonium ion-modified montmorillonite clay (Cloisite® 30B) has a concentration of 90 meq/100 g and the weight loss on ignition was about 30 %. Table 1 shows the generic structure of the above materials.
Table 1. Chemical structures of all materials used in this study.
Acronym Trade name Chemical structure
SAmfE Joncryl−ADR−4300F®
OMMT
Cloisite® 30B
MMT−N+(CH2CH2OH)2(CH3)T
a R1–R5 are H, CH3, a higher alkyl group, or combination of them; R6 is an
alkyl group and A, B are each between 1 and 20 and C between 1 and 12 b T is a tallow fatty chain having the following composition:
65 % C18H37, 30 % C16H33 and 5 % C14H29
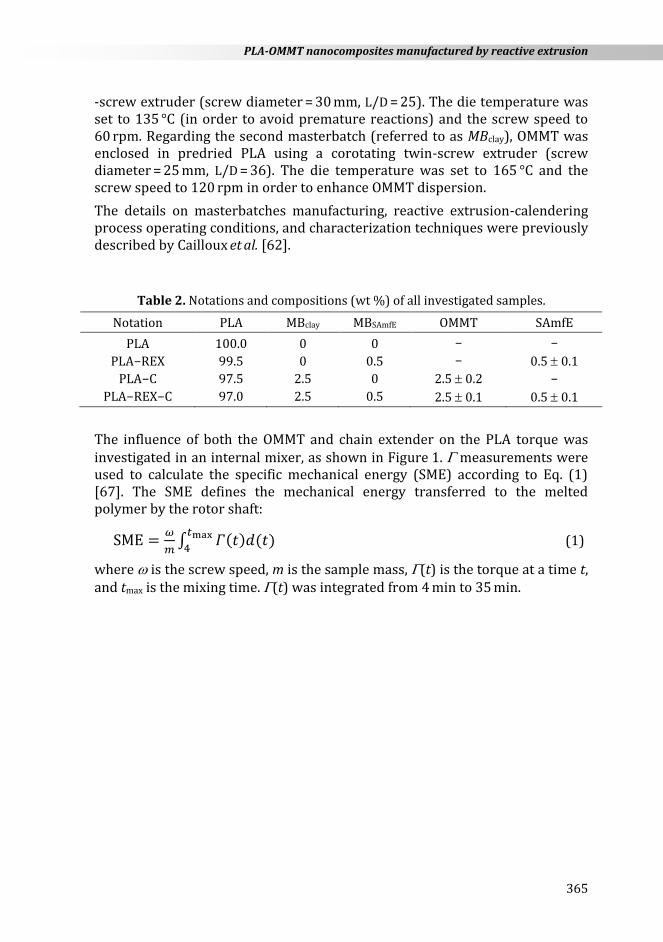
The compositions of PLA, manufactured by reactive extrusion (PLA-REX), nanocomposite (PLA-C), and nanocomposite obtained by reactive extrusion (PLA-REX-C) are shown in Table 2. Initially, two different PLA-based masterbatches were prepared. For the first masterbatch (referred to as MBSAmfE), SAmfE chain extender was enclosed in predried PLA using a single-
CBA
R1R3
R4 R5
OO O O
OR6
R2
a
CH3 N+
CH2CH2OH
CH2CH2OH
T
b
PLA-OMMT nanocomposites manufactured by reactive extrusion
365
-screw extruder (screw diameter = 30 mm, L/D = 25). The die temperature was set to 135 °C (in order to avoid premature reactions) and the screw speed to 60 rpm. Regarding the second masterbatch (referred to as MBclay), OMMT was enclosed in predried PLA using a corotating twin-screw extruder (screw diameter = 25 mm, L/D = 36). The die temperature was set to 165 °C and the screw speed to 120 rpm in order to enhance OMMT dispersion.
The details on masterbatches manufacturing, reactive extrusion-calendering process operating conditions, and characterization techniques were previously described by Cailloux et al. [62].
Table 2. Notations and compositions (wt %) of all investigated samples.
Notation PLA MBclay MBSAmfE OMMT SAmfE
PLA
PLA−REX
PLA−C
PLA−REX−C
100.0
99.5
97.5
97.0
0
0
2.5
2.5
0
0.5
0
0.5
−
−
2.5 0.2
2.5 0.1
−
0.5 0.1
−
0.5 0.1
The influence of both the OMMT and chain extender on the PLA torque was investigated in an internal mixer, as shown in Figure 1. measurements were used to calculate the specific mechanical energy (SME) according to Eq. (1) [67]. The SME defines the mechanical energy transferred to the melted polymer by the rotor shaft:
SME =𝜔
𝑚∫ 𝛤(𝑡)𝑑(𝑡)
𝑡max
4 (1)
where is the screw speed, m is the sample mass, (t) is the torque at a time t, and tmax is the mixing time. (t) was integrated from 4 min to 35 min.
Chapter 11
366
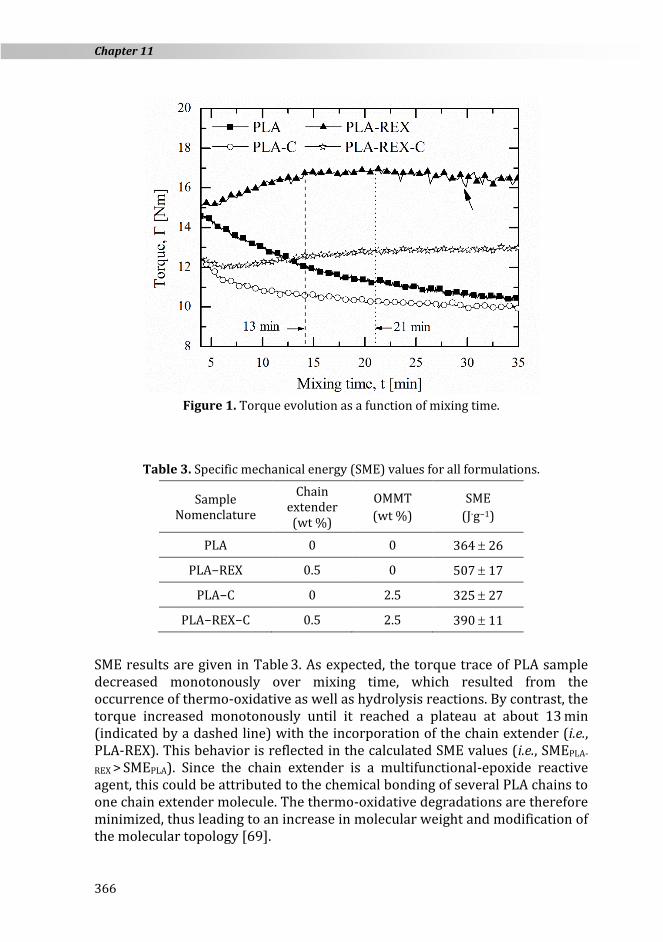
Figure 1. Torque evolution as a function of mixing time.
Table 3. Specific mechanical energy (SME) values for all formulations.
Sample Nomenclature
Chain extender (wt %)
OMMT
(wt %)
SME
(J·g−1)
PLA 0 0 364 26
PLA−REX 0.5 0 507 17
PLA−C 0 2.5 325 27
PLA−REX−C 0.5 2.5 390 11
SME results are given in Table 3. As expected, the torque trace of PLA sample decreased monotonously over mixing time, which resulted from the occurrence of thermo-oxidative as well as hydrolysis reactions. By contrast, the torque increased monotonously until it reached a plateau at about 13 min (indicated by a dashed line) with the incorporation of the chain extender (i.e., PLA-REX). This behavior is reflected in the calculated SME values (i.e., SMEPLA-
REX > SMEPLA). Since the chain extender is a multifunctional-epoxide reactive
agent, this could be attributed to the chemical bonding of several PLA chains to one chain extender molecule. The thermo-oxidative degradations are therefore minimized, thus leading to an increase in molecular weight and modification of the molecular topology [69].

PLA-OMMT nanocomposites manufactured by reactive extrusion
367
Regarding OMMT-based samples, a significant torque decrease of approximately 20 % was measured at 4 min. In fact, the clay acts as an internal lubricant, decreasing the viscosity of the molten blend, as already reported elsewhere [58]. The torque trace of PLA-C decreased monotonously over mixing time until it reached a plateau at approximately 21 min (indicated by a dotted line), which was below the PLA torque trace. This behavior agrees well with both the calculated SME values. Results suggest that the addition of OMMT further decreased the thermal stability of PLA during mixing. The thermal decomposition products of the surfactant in organomodified clay act as catalyst, which significantly decreases the thermal stability of polyesters at high temperatures [60,70].
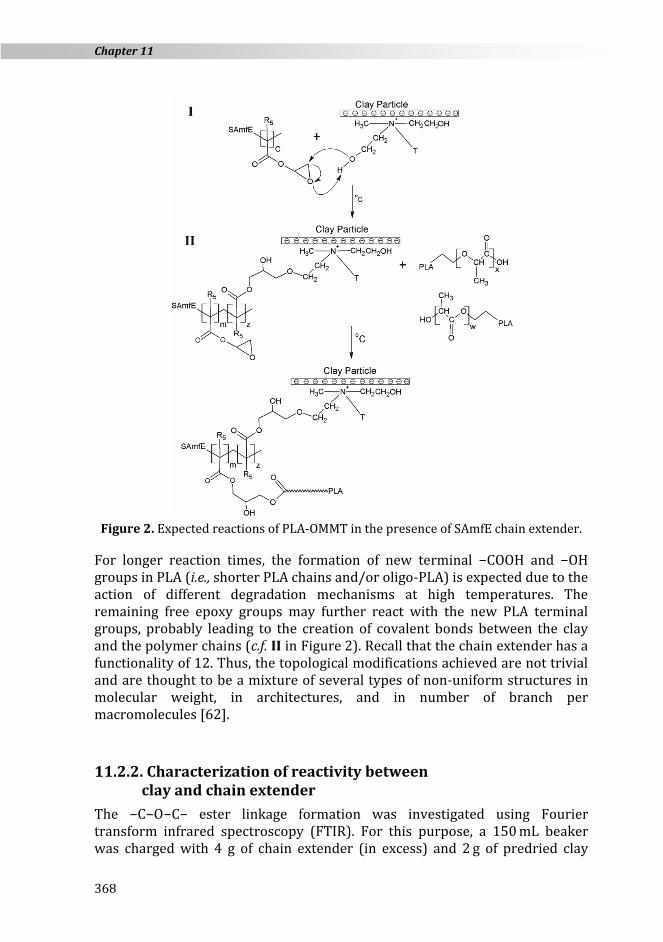
In contrast, the addition of 0.5 % of chain extender increased the melt stability of PLA-REX-C sample. As shown in Figure 1, the torque curve increased over mixing time until it reached a plateau around 21 min. However, a slower and less pronounced torque increase was observed as compared to PLA-REX samples. It is well known that both PLA functional end groups (i.e., −COOH and −OH groups) can react with the epoxy groups of the chain extender, creating covalent bonds. However, little reactivity of PLA terminal end groups towards the chain extender is initially expected, as most PLA functional end groups might be end-capped [71]. On the other hand, the organic treatment of the OMMT results in a high concentration of −CH2CH2OH groups (c.f. section 11.2.1.). The low molecular weight of the quaternary ammonium ion may enhance the diffusivity of the −OH functional end groups towards the epoxy groups in the melted bulk. Accordingly, the chain extender initially may be grafted onto the clay surface through the −C−O−C− ester linkage formation (c.f. I in Figure 2), mitigating further possible reaction between PLA and the chain extender. The enhancement of the PLA melt properties is likely to be reduced, thus leading to lower torque values.
Chapter 11
368
Figure 2. Expected reactions of PLA-OMMT in the presence of SAmfE chain extender.
For longer reaction times, the formation of new terminal −COOH and −OH groups in PLA (i.e., shorter PLA chains and/or oligo-PLA) is expected due to the action of different degradation mechanisms at high temperatures. The remaining free epoxy groups may further react with the new PLA terminal groups, probably leading to the creation of covalent bonds between the clay and the polymer chains (c.f. II in Figure 2). Recall that the chain extender has a functionality of 12. Thus, the topological modifications achieved are not trivial and are thought to be a mixture of several types of non-uniform structures in molecular weight, in architectures, and in number of branch per macromolecules [62].
11.2.2. Characterization of reactivity between clay and chain extender
The −C−O−C− ester linkage formation was investigated using Fourier transform infrared spectroscopy (FTIR). For this purpose, a 150 mL beaker was charged with 4 g of chain extender (in excess) and 2 g of predried clay
PLA-OMMT nanocomposites manufactured by reactive extrusion
369
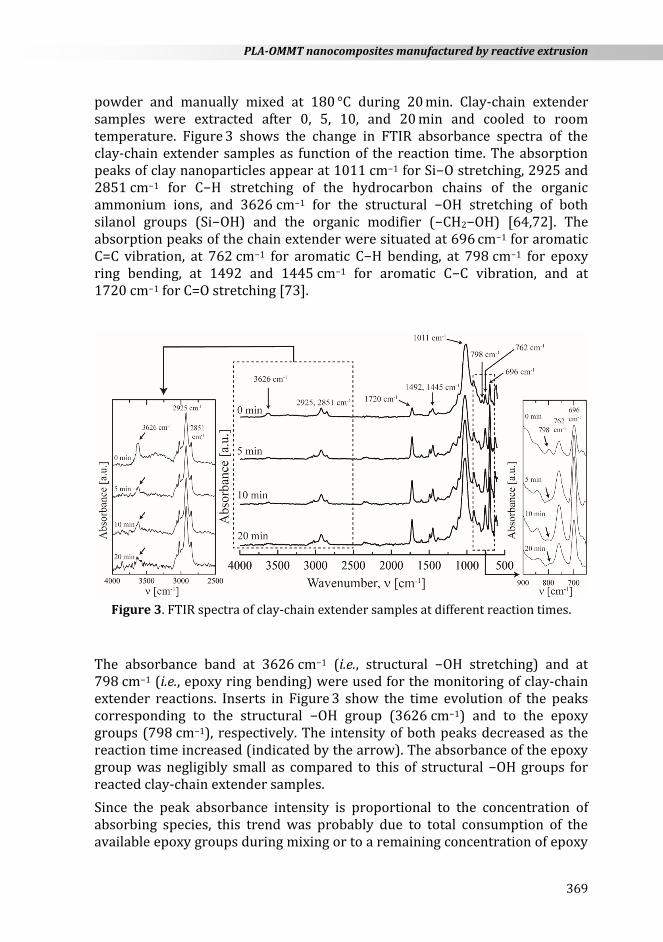
powder and manually mixed at 180 °C during 20 min. Clay-chain extender samples were extracted after 0, 5, 10, and 20 min and cooled to room temperature. Figure 3 shows the change in FTIR absorbance spectra of the clay-chain extender samples as function of the reaction time. The absorption peaks of clay nanoparticles appear at 1011 cm−1 for Si−O stretching, 2925 and 2851 cm−1 for C−H stretching of the hydrocarbon chains of the organic ammonium ions, and 3626 cm−1 for the structural −OH stretching of both silanol groups (Si−OH) and the organic modifier (−CH2−OH) [64,72]. The absorption peaks of the chain extender were situated at 696 cm−1 for aromatic C=C vibration, at 762 cm−1 for aromatic C−H bending, at 798 cm−1 for epoxy ring bending, at 1492 and 1445 cm−1 for aromatic C−C vibration, and at 1720 cm−1 for C=O stretching [73].
Figure 3. FTIR spectra of clay-chain extender samples at different reaction times.
The absorbance band at 3626 cm−1 (i.e., structural −OH stretching) and at 798 cm−1 (i.e., epoxy ring bending) were used for the monitoring of clay-chain extender reactions. Inserts in Figure 3 show the time evolution of the peaks corresponding to the structural −OH group (3626 cm−1) and to the epoxy groups (798 cm−1), respectively. The intensity of both peaks decreased as the reaction time increased (indicated by the arrow). The absorbance of the epoxy group was negligibly small as compared to this of structural −OH groups for reacted clay-chain extender samples.
Since the peak absorbance intensity is proportional to the concentration of absorbing species, this trend was probably due to total consumption of the available epoxy groups during mixing or to a remaining concentration of epoxy

Chapter 11
370
groups below the detection limit of the FTIR analysis. A relative decrease in the amount of structural −OH groups (referred to as α) was determined from the ratio of absorbance area of structural −OH group at 3626 cm−1 against internal standard, as given by Eq. (2). The characteristic band associated with stretching of −CH2 groups at 2925 and 2851 cm−1 was used as the internal standard:
𝛼 = 100 [1 − (𝐴−𝑂𝐻
𝐴−𝐶𝐻2
)𝑡 = 0
(𝐴−𝐶𝐻2
𝐴−𝑂𝐻)
𝑡] (2)
where A−OH and A−CH2 are the area under the peak corresponding to the
structural −OH stretching (at 3626 cm−1) and to the −CH stretching (at 2925 and 2851 cm−1), respectively, and t is the reaction time.
The relative amount of structural −OH groups decreased rapidly when the reaction time increased to 5 min (−73 %). The value of α tended to reach a plateau as the reaction time increased further. Thus, relatively fast chemical grafting between SAmfE and the clays is believed to proceed via the reaction between the epoxy groups and the −OH functionalities, which are on the surface of the platelets (Si−OH) and the organic modifying agent (−CH2−OH).
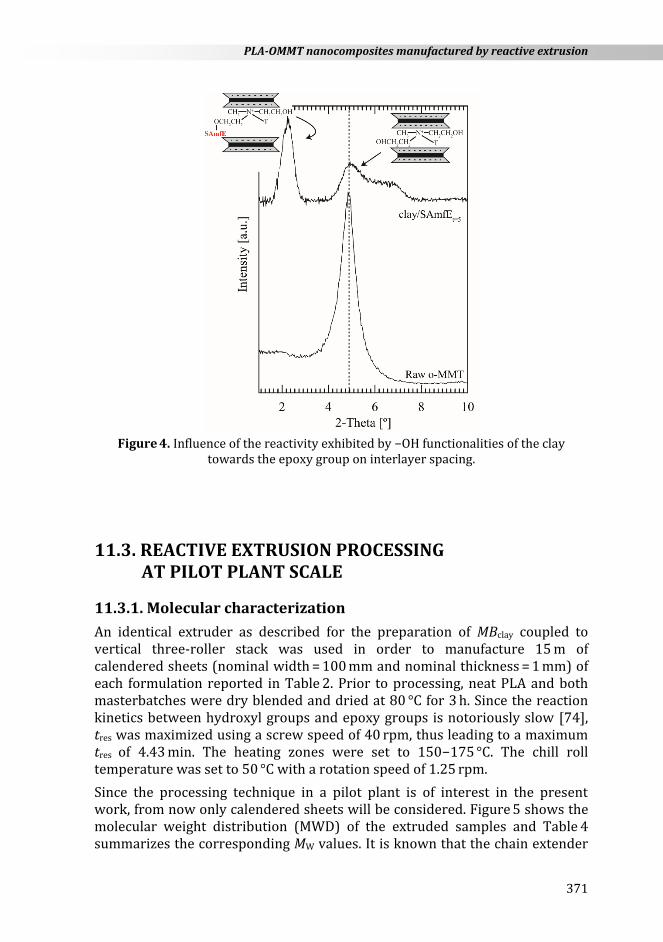
In order to evidence the intercalation of chain extender molecules into the clay galleries, the basal reflection of raw OMMT powder and clay-chain extender samples extracted after 5 min (referred to as clay-chain extender t=5) were studied using wide-angle X-ray diffraction (WAXD) analysis. As shown in Figure 4, raw OMMT exhibited a unique sharp peak at 2 = 4.8°, corresponding to the basal spacing of the raw OMMT. By contrast, OMMT-chain extender t=5 featured an additional peak at 2 = 2.3° which implies that the basal d-spacing between clay platelets increased from 1.86 to 3.84 nm. This increased interlayer spacing was attributed to intercalation of SAmfE. On the other hand, some degradation of the organic modifier should be considered due to the apparition of a shoulder in the high 2 tail.
PLA-OMMT nanocomposites manufactured by reactive extrusion
371
Figure 4. Influence of the reactivity exhibited by −OH functionalities of the clay
towards the epoxy group on interlayer spacing.
11.3. REACTIVE EXTRUSION PROCESSING AT PILOT PLANT SCALE
11.3.1. Molecular characterization
An identical extruder as described for the preparation of MBclay coupled to vertical three-roller stack was used in order to manufacture 15 m of calendered sheets (nominal width = 100 mm and nominal thickness = 1 mm) of each formulation reported in Table 2. Prior to processing, neat PLA and both masterbatches were dry blended and dried at 80 °C for 3 h. Since the reaction kinetics between hydroxyl groups and epoxy groups is notoriously slow [74], tres was maximized using a screw speed of 40 rpm, thus leading to a maximum tres of 4.43 min. The heating zones were set to 150−175 °C. The chill roll temperature was set to 50 °C with a rotation speed of 1.25 rpm.
Since the processing technique in a pilot plant is of interest in the present work, from now only calendered sheets will be considered. Figure 5 shows the molecular weight distribution (MWD) of the extruded samples and Table 4 summarizes the corresponding MW values. It is known that the chain extender

Chapter 11
372
can yield the formation of long chain branching (LCB) and/or non-uniform complex topological structures, which can flaw size-exclusion chromatography – differential refractometer (SEC-DRI) data due to co-elution issues. However, these experimental limitations can be assumed as negligible for low levels of structural modifications [62,75].
Figure 5. Effect of the clay and/or chain extender addition on the shape of the MWD.
While a slight decrease in molecular weights was observed for both PLA and PLA-C samples as compared to raw PLA pellets, molecular weight averages agreed within 9 %. This suggests that the effects of the different thermo-oxidative-hydrolysis degradations were minimized due to a satisfying optimization of the processing conditions (i.e., nitrogen blanket, relatively low profile temperature, and vacuum). While both PLA and PLA-C samples displayed a narrow monomodal MWD, the PLA-REX spectrum was slightly broadened, the molecular weight increased, and a shoulder appeared in the high molecular weight tail. These changes were expected and are consistent with various published works [68,69]. Since the chain extender is a multifunctional-epoxide agent, these differences were attributed to an increase in the population of high molecular weight linear chains and/or the presence of a mixture of non-uniform branched structures.

PLA-OMMT nanocomposites manufactured by reactive extrusion
373
Table 4. Average molecular weights of the samples under study.
Sample Nomenclature
Mn
(kg·mol−1)
Mw
(kg·mol−1)
Mz
(kg·mol−1) PDI
PLA pellets 77 1 165 4 298 34 2.1 0.1
PLA 74 4 158 1 277 21 2.1 0.1
PLA−REX 96 3 241 11 427 42 2.5 0.2
PLA−C 73 2 152 2 271 3 2.1 0.1
PLA−REX−C 73 2 160 3 293 7 2.0 0.1
Raw PLA pellets, PLA, PLA-C, and PLA-REX-C molecular weight averages ranged within 10 %. Although the molecular weight of PLA-REX-C was not enhanced, this does not necessarily exclude the occurrence of topological changes during compounding. Recall that possible premature reactions might have occurred between epoxy rings and −OH functionalities of the clay, possibly minimizing chain extension-branching reactions. Additionally, PLA-REX-C samples were previously filtered before SEC analyses. Thus, PLA macromolecules, which were grafted to both chain extender molecules and clay nanoparticles, might have been removed during filtration, eliminating the higher molecular weight fractions.
11.3.2. Effect of clay and/or chain extender addition on the rheological behavior
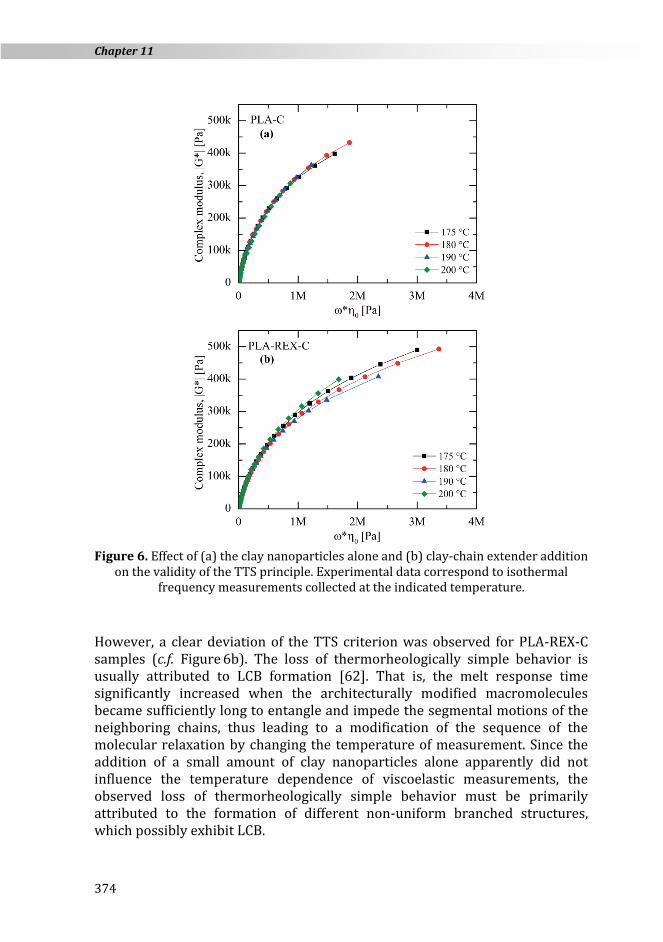
Within the linear viscoelastic regime, insight into molecular structures can be obtained by examining the temperature dependence of dynamic experiments collected at different temperatures. Typically, the success or failure of the application of the time-temperature superposition (TTS) principle is used in this area. Based on the Cole-Cole plot, the validity of the TTS principle can be verified by plotting the magnitude of the complex modulus, |G*|, against the product of the zero-shear rate viscosity and frequency, 0 · , as shown in Figure 6. Since such plots are temperature-independent, all data should merge into the same curve if the TTS holds.
PLA and PLA-REX samples exhibited a similar temperature dependence of |G*| versus 0 · as compared to PLA-C and PLA-REX-C, respectively. Consequently, only PLA-C and PLA-REX-C datasets are shown in Figure 6 for the sake of clarity. According to the above TTS statement, results suggest that PLA-C (c.f. Figure 6a) samples exhibit a thermorheologically simple behavior. At first glance, low clay loading did not seem to change both the rate of relaxation times and molecular motions at different testing temperatures.
Chapter 11
374
Figure 6. Effect of (a) the clay nanoparticles alone and (b) clay-chain extender addition
on the validity of the TTS principle. Experimental data correspond to isothermal frequency measurements collected at the indicated temperature.
However, a clear deviation of the TTS criterion was observed for PLA-REX-C samples (c.f. Figure 6b). The loss of thermorheologically simple behavior is usually attributed to LCB formation [62]. That is, the melt response time significantly increased when the architecturally modified macromolecules became sufficiently long to entangle and impede the segmental motions of the neighboring chains, thus leading to a modification of the sequence of the molecular relaxation by changing the temperature of measurement. Since the addition of a small amount of clay nanoparticles alone apparently did not influence the temperature dependence of viscoelastic measurements, the observed loss of thermorheologically simple behavior must be primarily attributed to the formation of different non-uniform branched structures, which possibly exhibit LCB.
PLA-OMMT nanocomposites manufactured by reactive extrusion
375
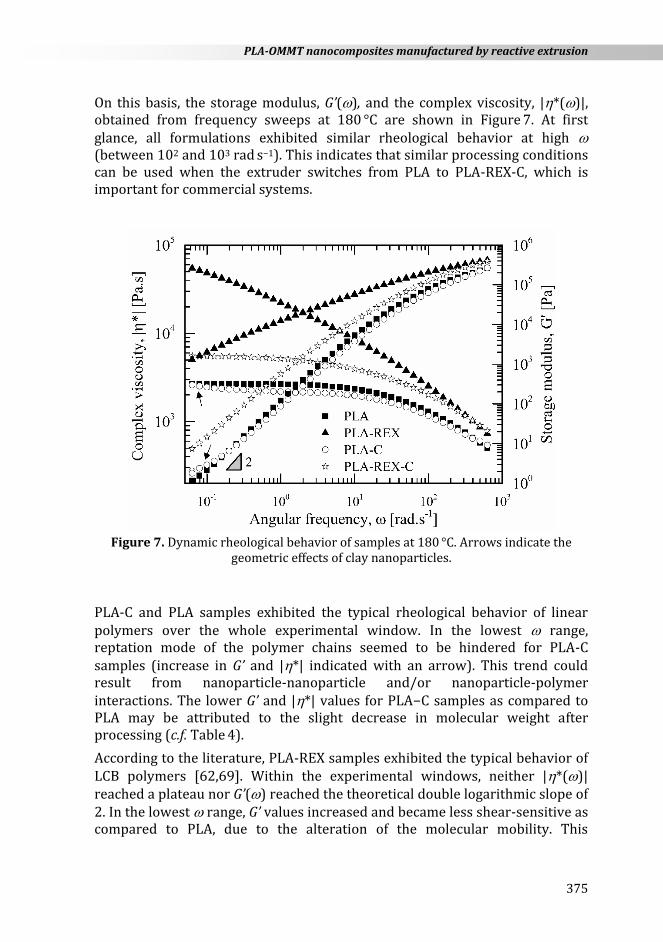
On this basis, the storage modulus, G’(), and the complex viscosity, |*()|, obtained from frequency sweeps at 180 °C are shown in Figure 7. At first glance, all formulations exhibited similar rheological behavior at high (between 102 and 103 rad s−1). This indicates that similar processing conditions can be used when the extruder switches from PLA to PLA-REX-C, which is important for commercial systems.
Figure 7. Dynamic rheological behavior of samples at 180 °C. Arrows indicate the
geometric effects of clay nanoparticles.
PLA-C and PLA samples exhibited the typical rheological behavior of linear polymers over the whole experimental window. In the lowest range, reptation mode of the polymer chains seemed to be hindered for PLA-C samples (increase in G’ and |*| indicated with an arrow). This trend could result from nanoparticle-nanoparticle and/or nanoparticle-polymer interactions. The lower G’ and |*| values for PLA−C samples as compared to PLA may be attributed to the slight decrease in molecular weight after processing (c.f. Table 4).
According to the literature, PLA-REX samples exhibited the typical behavior of LCB polymers [62,69]. Within the experimental windows, neither |*()| reached a plateau nor G’() reached the theoretical double logarithmic slope of 2. In the lowest range, G’ values increased and became less shear-sensitive as compared to PLA, due to the alteration of the molecular mobility. This

Chapter 11
376
indicates an increase in the melt elasticity (and thus in the melt strength) which is beneficial for processing stability.
However, changes in the rheological behavior with the addition of 0.5 wt.% of chain extender were not as pronounced as in the presence of OMMT. Within the experimental windows, the geometrical constraints induced by the clay in the lowest range were not seen for PLA-REX-C. Since the corresponding onset frequency is related to the size, the size distribution, and the interfacial tension between clay and polymeric matrix, this transition might have been shifted to lower in the present case. During mixing, the higher local shear field coupled with the possible clay polymer tethering might have induced better clay dispersion.
Accordingly, the out-of-phase of |*|, , was considered in order to determine
if PLA-C and PLA-REX-C showed modifications in the frequency onset. This is because provides additional information about the elastic compound of the
complex viscosity of the material. The double logarithmic derivative of
versus log, d2(log( ))/d(log())2 for PLA-C and PLA-REX-C was also plotted
in Figure 8.
Figure 8. Effect of the chain extender addition on the frequency onset of the transition
induced by clay nanoparticles on at 180 °C.
The maximum peak of the second derivative (indicated by an arrow) is slightly shifted towards lower for PLA-REX-C samples ( 0.1 rad s−1) as compared to PLA-C samples ( 0.3 rad s−1). Accordingly, the results agreed with the aforementioned hypothesis; that is, the frequency onset of the transition was
PLA-OMMT nanocomposites manufactured by reactive extrusion
377
shifted to lower when the chain extender was added. This could suggest better clay dispersion in the polymeric matrix, probably with an increased interfacial tension.
11.3.3. Effect of chain extender incorporation on clay dispersion in the PLA matrix
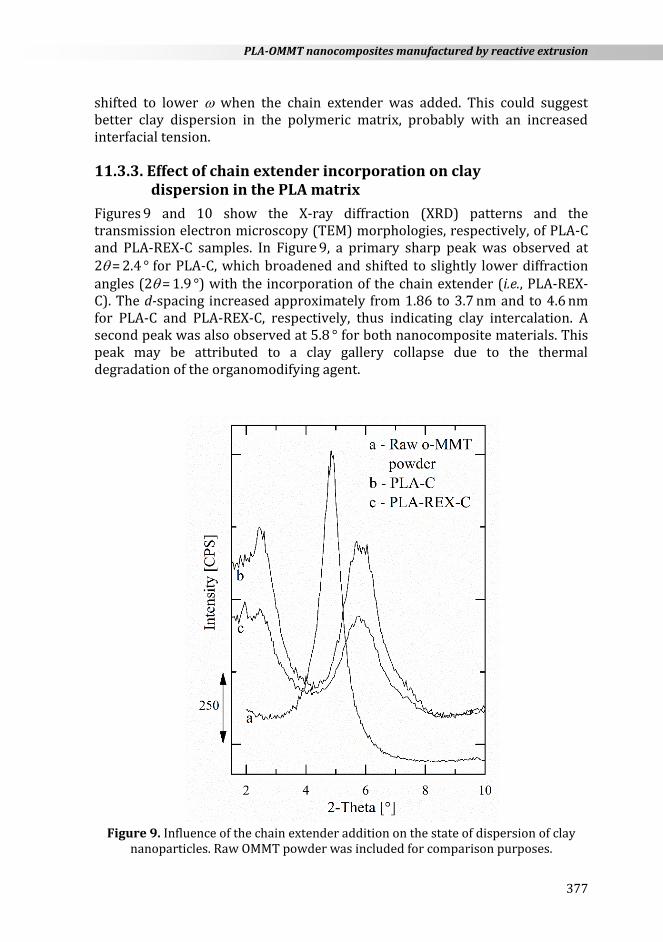
Figures 9 and 10 show the X-ray diffraction (XRD) patterns and the transmission electron microscopy (TEM) morphologies, respectively, of PLA-C and PLA-REX-C samples. In Figure 9, a primary sharp peak was observed at 2 = 2.4 ° for PLA-C, which broadened and shifted to slightly lower diffraction angles (2 = 1.9 °) with the incorporation of the chain extender (i.e., PLA-REX-C). The d-spacing increased approximately from 1.86 to 3.7 nm and to 4.6 nm for PLA-C and PLA-REX-C, respectively, thus indicating clay intercalation. A second peak was also observed at 5.8 ° for both nanocomposite materials. This peak may be attributed to a clay gallery collapse due to the thermal degradation of the organomodifying agent.
Figure 9. Influence of the chain extender addition on the state of dispersion of clay
nanoparticles. Raw OMMT powder was included for comparison purposes.
Chapter 11
378
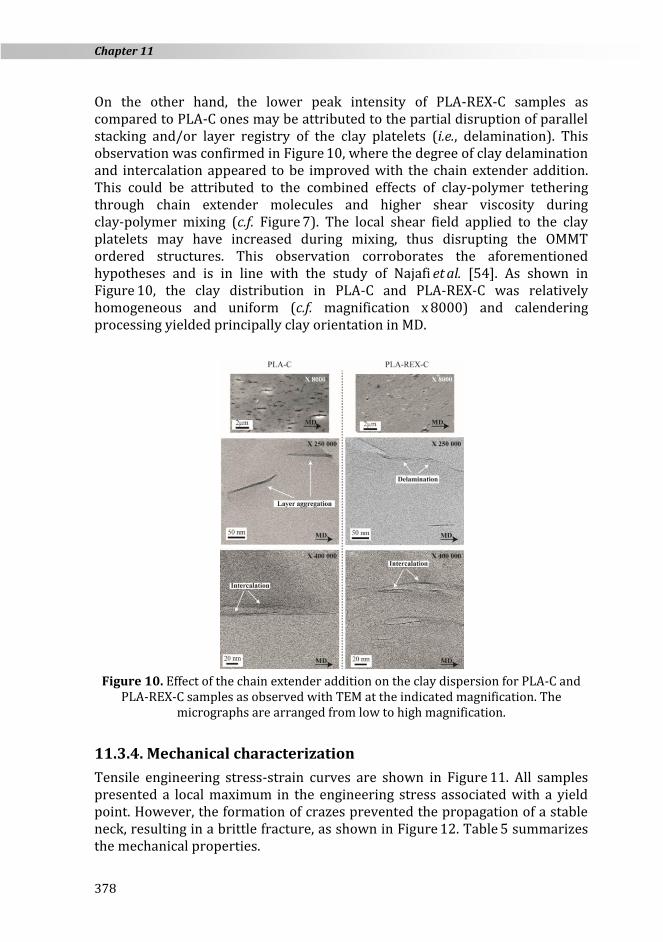
On the other hand, the lower peak intensity of PLA-REX-C samples as compared to PLA-C ones may be attributed to the partial disruption of parallel stacking and/or layer registry of the clay platelets (i.e., delamination). This observation was confirmed in Figure 10, where the degree of clay delamination and intercalation appeared to be improved with the chain extender addition. This could be attributed to the combined effects of clay-polymer tethering through chain extender molecules and higher shear viscosity during clay-polymer mixing (c.f. Figure 7). The local shear field applied to the clay platelets may have increased during mixing, thus disrupting the OMMT ordered structures. This observation corroborates the aforementioned hypotheses and is in line with the study of Najafi et al. [54]. As shown in Figure 10, the clay distribution in PLA-C and PLA-REX-C was relatively homogeneous and uniform (c.f. magnification x 8000) and calendering processing yielded principally clay orientation in MD.
Figure 10. Effect of the chain extender addition on the clay dispersion for PLA-C and
PLA-REX-C samples as observed with TEM at the indicated magnification. The micrographs are arranged from low to high magnification.
11.3.4. Mechanical characterization
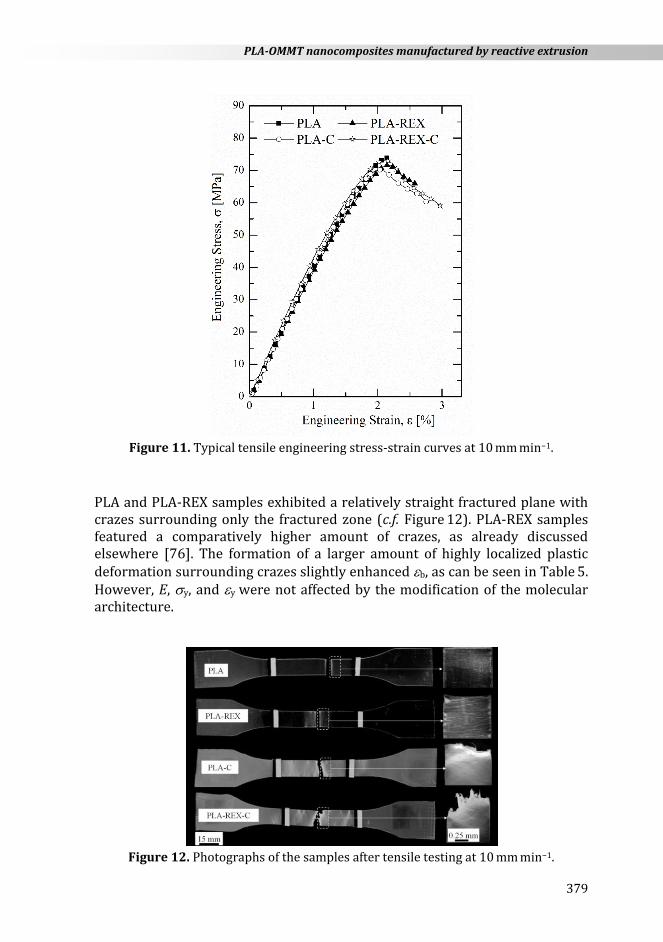
Tensile engineering stress-strain curves are shown in Figure 11. All samples presented a local maximum in the engineering stress associated with a yield point. However, the formation of crazes prevented the propagation of a stable neck, resulting in a brittle fracture, as shown in Figure 12. Table 5 summarizes the mechanical properties.
PLA-OMMT nanocomposites manufactured by reactive extrusion
379
Figure 11. Typical tensile engineering stress-strain curves at 10 mm min−1.
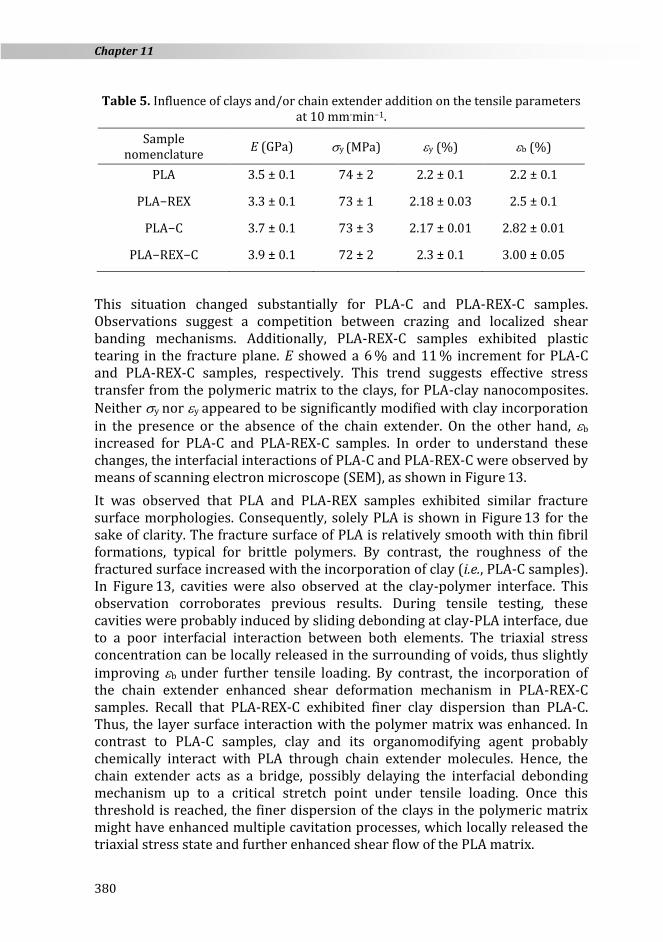
PLA and PLA-REX samples exhibited a relatively straight fractured plane with crazes surrounding only the fractured zone (c.f. Figure 12). PLA-REX samples featured a comparatively higher amount of crazes, as already discussed elsewhere [76]. The formation of a larger amount of highly localized plastic deformation surrounding crazes slightly enhanced b, as can be seen in Table 5. However, E, y, and y were not affected by the modification of the molecular architecture.
Figure 12. Photographs of the samples after tensile testing at 10 mm min−1.
Chapter 11
380
Table 5. Influence of clays and/or chain extender addition on the tensile parameters at 10 mm·min−1.
Sample nomenclature
E (GPa) y (MPa) y (%) b (%)
PLA 3.5 ± 0.1 74 ± 2 2.2 ± 0.1 2.2 ± 0.1
PLA−REX 3.3 ± 0.1 73 ± 1 2.18 ± 0.03 2.5 ± 0.1
PLA−C 3.7 ± 0.1 73 ± 3 2.17 ± 0.01 2.82 ± 0.01
PLA−REX−C 3.9 ± 0.1 72 ± 2 2.3 ± 0.1 3.00 ± 0.05
This situation changed substantially for PLA-C and PLA-REX-C samples. Observations suggest a competition between crazing and localized shear banding mechanisms. Additionally, PLA-REX-C samples exhibited plastic tearing in the fracture plane. E showed a 6 % and 11 % increment for PLA-C and PLA-REX-C samples, respectively. This trend suggests effective stress transfer from the polymeric matrix to the clays, for PLA-clay nanocomposites. Neither y nor y appeared to be significantly modified with clay incorporation in the presence or the absence of the chain extender. On the other hand, b
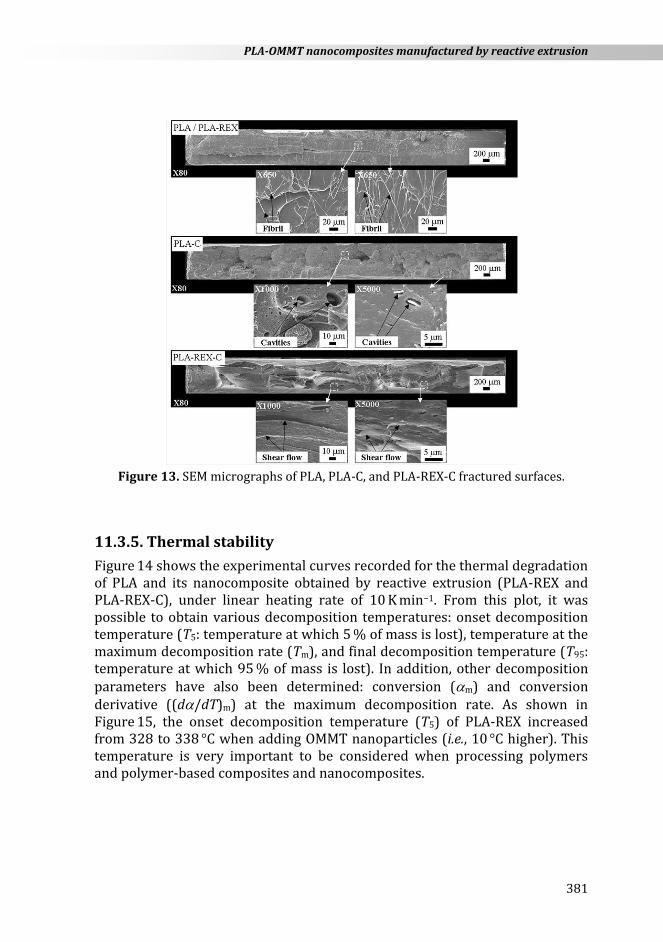
increased for PLA-C and PLA-REX-C samples. In order to understand these changes, the interfacial interactions of PLA-C and PLA-REX-C were observed by means of scanning electron microscope (SEM), as shown in Figure 13.
It was observed that PLA and PLA-REX samples exhibited similar fracture surface morphologies. Consequently, solely PLA is shown in Figure 13 for the sake of clarity. The fracture surface of PLA is relatively smooth with thin fibril formations, typical for brittle polymers. By contrast, the roughness of the fractured surface increased with the incorporation of clay (i.e., PLA-C samples). In Figure 13, cavities were also observed at the clay-polymer interface. This observation corroborates previous results. During tensile testing, these cavities were probably induced by sliding debonding at clay-PLA interface, due to a poor interfacial interaction between both elements. The triaxial stress concentration can be locally released in the surrounding of voids, thus slightly improving b under further tensile loading. By contrast, the incorporation of the chain extender enhanced shear deformation mechanism in PLA-REX-C samples. Recall that PLA-REX-C exhibited finer clay dispersion than PLA-C. Thus, the layer surface interaction with the polymer matrix was enhanced. In contrast to PLA-C samples, clay and its organomodifying agent probably chemically interact with PLA through chain extender molecules. Hence, the chain extender acts as a bridge, possibly delaying the interfacial debonding mechanism up to a critical stretch point under tensile loading. Once this threshold is reached, the finer dispersion of the clays in the polymeric matrix might have enhanced multiple cavitation processes, which locally released the triaxial stress state and further enhanced shear flow of the PLA matrix.
PLA-OMMT nanocomposites manufactured by reactive extrusion
381
Figure 13. SEM micrographs of PLA, PLA-C, and PLA-REX-C fractured surfaces.
11.3.5. Thermal stability
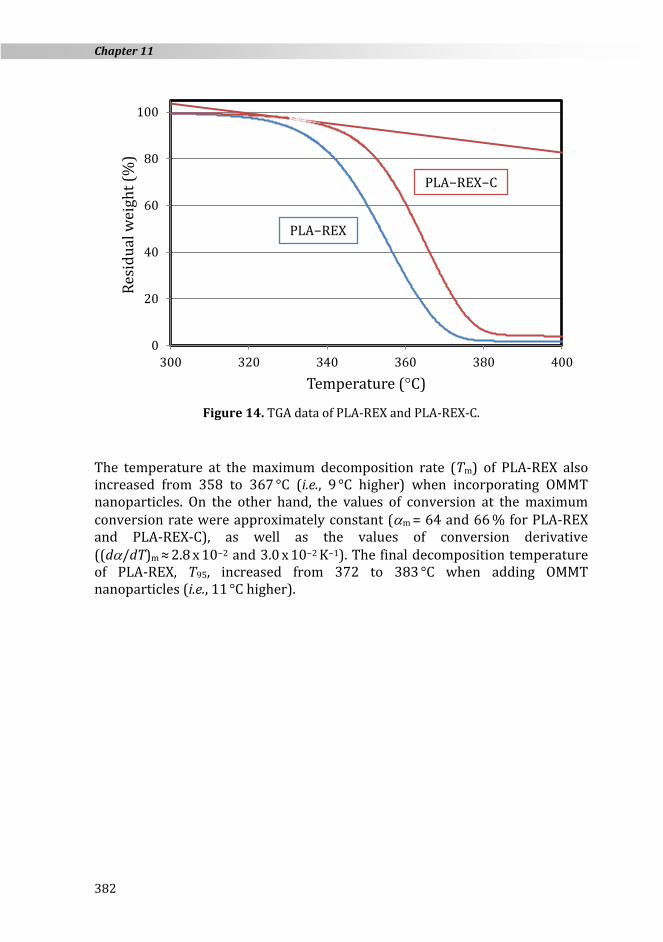
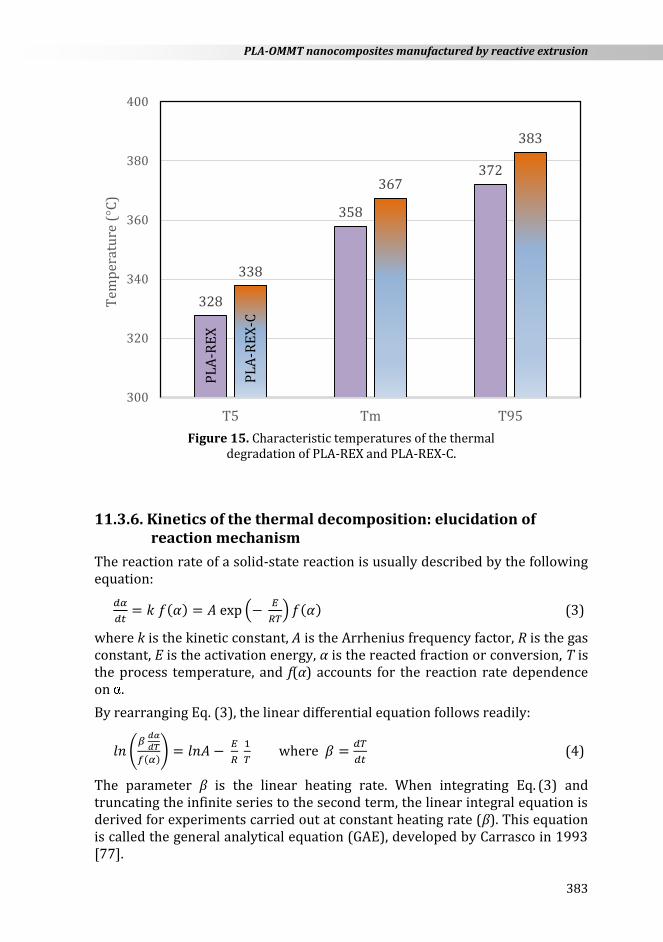
Figure 14 shows the experimental curves recorded for the thermal degradation of PLA and its nanocomposite obtained by reactive extrusion (PLA-REX and PLA-REX-C), under linear heating rate of 10 K min−1. From this plot, it was possible to obtain various decomposition temperatures: onset decomposition temperature (T5: temperature at which 5 % of mass is lost), temperature at the maximum decomposition rate (Tm), and final decomposition temperature (T95: temperature at which 95 % of mass is lost). In addition, other decomposition parameters have also been determined: conversion (m) and conversion derivative ((d/dT)m) at the maximum decomposition rate. As shown in Figure 15, the onset decomposition temperature (T5) of PLA-REX increased from 328 to 338 °C when adding OMMT nanoparticles (i.e., 10 °C higher). This temperature is very important to be considered when processing polymers and polymer-based composites and nanocomposites.
Chapter 11
382
Figure 14. TGA data of PLA-REX and PLA-REX-C.
The temperature at the maximum decomposition rate (Tm) of PLA-REX also increased from 358 to 367 °C (i.e., 9 °C higher) when incorporating OMMT nanoparticles. On the other hand, the values of conversion at the maximum conversion rate were approximately constant (m
= 64 and 66 % for PLA-REX and PLA-REX-C), as well as the values of conversion derivative ((d/dT)m
≈ 2.8 x 10⁻² and 3.0 x 10⁻² K−1). The final decomposition temperature of PLA-REX, T95, increased from 372 to 383 °C when adding OMMT nanoparticles (i.e., 11 °C higher).
0
20
40
60
80
100
300 320 340 360 380 400
Res
idu
al w
eigh
t (%
)
Temperature (°C)
PLA−REX
PLA−REX−C
PLA-OMMT nanocomposites manufactured by reactive extrusion
383
Figure 15. Characteristic temperatures of the thermal
degradation of PLA-REX and PLA-REX-C.
11.3.6. Kinetics of the thermal decomposition: elucidation of reaction mechanism
The reaction rate of a solid-state reaction is usually described by the following equation:
𝑑𝛼
𝑑𝑡= 𝑘 𝑓(𝛼) = 𝐴 exp (−
𝐸
𝑅𝑇) 𝑓(𝛼) (3)
where k is the kinetic constant, A is the Arrhenius frequency factor, R is the gas constant, E is the activation energy, α is the reacted fraction or conversion, T is the process temperature, and f(α) accounts for the reaction rate dependence on .
By rearranging Eq. (3), the linear differential equation follows readily:
𝑙𝑛 (𝛽
𝑑𝛼
𝑑𝑇
𝑓(𝛼)) = 𝑙𝑛𝐴 −
𝐸
𝑅
1
𝑇 where 𝛽 =
𝑑𝑇
𝑑𝑡 (4)
The parameter β is the linear heating rate. When integrating Eq. (3) and truncating the infinite series to the second term, the linear integral equation is derived for experiments carried out at constant heating rate (β). This equation is called the general analytical equation (GAE), developed by Carrasco in 1993 [77].
328
358
372
338
367
383
300
320
340
360
380
400
T5 Tm T95
Tem
per
atu
re (°C
)
PL
A-R
EX
PL
A-R
EX
-C
Chapter 11
384
𝑙𝑛 [𝛽 𝑔(𝛼)
𝑇2(1− 2𝑅𝑇
𝐸)] = 𝑙𝑛
𝐴𝑅
𝐸−
𝐸
𝑅
1
𝑇 where 𝑔(𝛼) = ∫
𝑑𝛼
𝑓(𝛼)
𝛼
0 (5)
The mathematical expressions for f() and g() are known for all the empirical and theoretical mechanisms studied in this work [78].
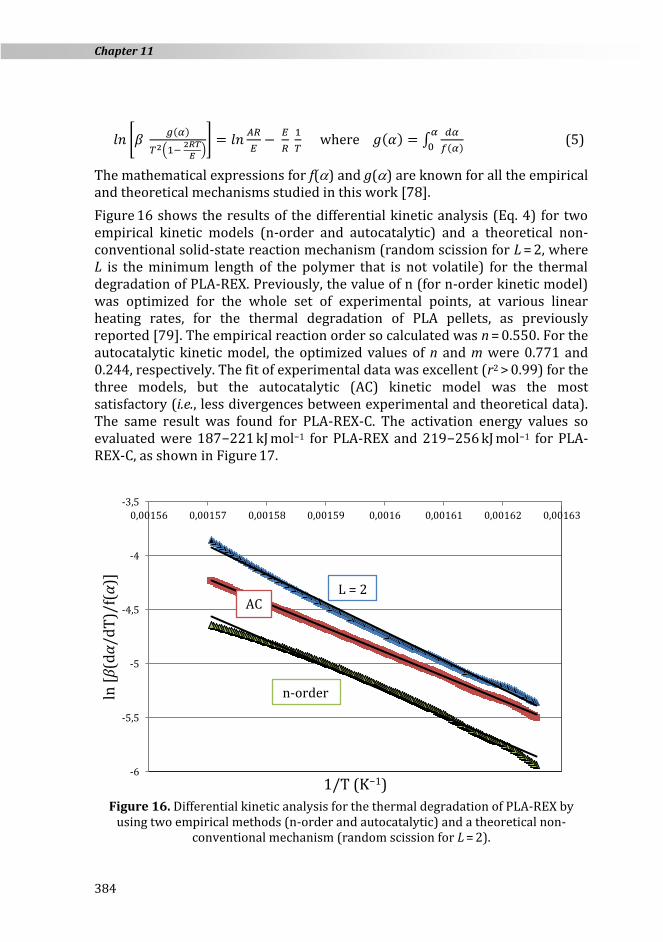
Figure 16 shows the results of the differential kinetic analysis (Eq. 4) for two empirical kinetic models (n-order and autocatalytic) and a theoretical non-conventional solid-state reaction mechanism (random scission for L = 2, where L is the minimum length of the polymer that is not volatile) for the thermal degradation of PLA-REX. Previously, the value of n (for n-order kinetic model) was optimized for the whole set of experimental points, at various linear heating rates, for the thermal degradation of PLA pellets, as previously reported [79]. The empirical reaction order so calculated was n = 0.550. For the autocatalytic kinetic model, the optimized values of n and m were 0.771 and 0.244, respectively. The fit of experimental data was excellent (r2 > 0.99) for the three models, but the autocatalytic (AC) kinetic model was the most satisfactory (i.e., less divergences between experimental and theoretical data). The same result was found for PLA-REX-C. The activation energy values so evaluated were 187−221 kJ mol−1 for PLA-REX and 219−256 kJ mol−1 for PLA-REX-C, as shown in Figure 17.
Figure 16. Differential kinetic analysis for the thermal degradation of PLA-REX by
using two empirical methods (n-order and autocatalytic) and a theoretical non-conventional mechanism (random scission for L = 2).
-6
-5,5
-5
-4,5
-4
-3,5
0,00156 0,00157 0,00158 0,00159 0,0016 0,00161 0,00162 0,00163
ln [
β(d
α/d
T)/
f(α
)]
1/T (K−1)
AC
n-order
L = 2
PLA-OMMT nanocomposites manufactured by reactive extrusion
385
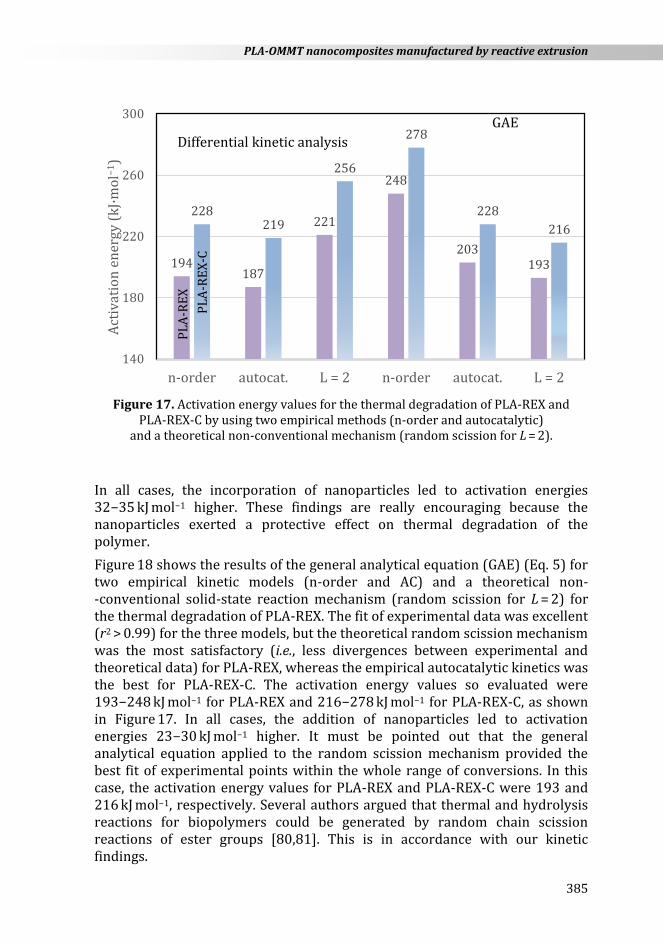
Figure 17. Activation energy values for the thermal degradation of PLA-REX and
PLA-REX-C by using two empirical methods (n-order and autocatalytic) and a theoretical non-conventional mechanism (random scission for L = 2).
In all cases, the incorporation of nanoparticles led to activation energies 32−35 kJ mol−1 higher. These findings are really encouraging because the nanoparticles exerted a protective effect on thermal degradation of the polymer.
Figure 18 shows the results of the general analytical equation (GAE) (Eq. 5) for two empirical kinetic models (n-order and AC) and a theoretical non- -conventional solid-state reaction mechanism (random scission for L = 2) for the thermal degradation of PLA-REX. The fit of experimental data was excellent (r2 > 0.99) for the three models, but the theoretical random scission mechanism was the most satisfactory (i.e., less divergences between experimental and theoretical data) for PLA-REX, whereas the empirical autocatalytic kinetics was the best for PLA-REX-C. The activation energy values so evaluated were 193−248 kJ mol−1 for PLA-REX and 216−278 kJ mol−1 for PLA-REX-C, as shown in Figure 17. In all cases, the addition of nanoparticles led to activation energies 23−30 kJ mol−1 higher. It must be pointed out that the general analytical equation applied to the random scission mechanism provided the best fit of experimental points within the whole range of conversions. In this case, the activation energy values for PLA-REX and PLA-REX-C were 193 and 216 kJ mol−1, respectively. Several authors argued that thermal and hydrolysis reactions for biopolymers could be generated by random chain scission reactions of ester groups [80,81]. This is in accordance with our kinetic findings.
194187
221
248
203193
228219
256
278
228
216
140
180
220
260
300
n-order autocat. L = 2 n-order autocat. L = 2
Act
ivat
ion
en
ergy
(k
J·m
ol−
1)
Differential kinetic analysis
GAE
PL
A-R
EX
PL
A-R
EX
-C

Chapter 11
386
Figure 18. General analytical equation applied to the thermal degradation of PLA-REX
by using two empirical methods (n-order and autocatalytic) and a theoretical non-conventional mechanism (random scission for L = 2).
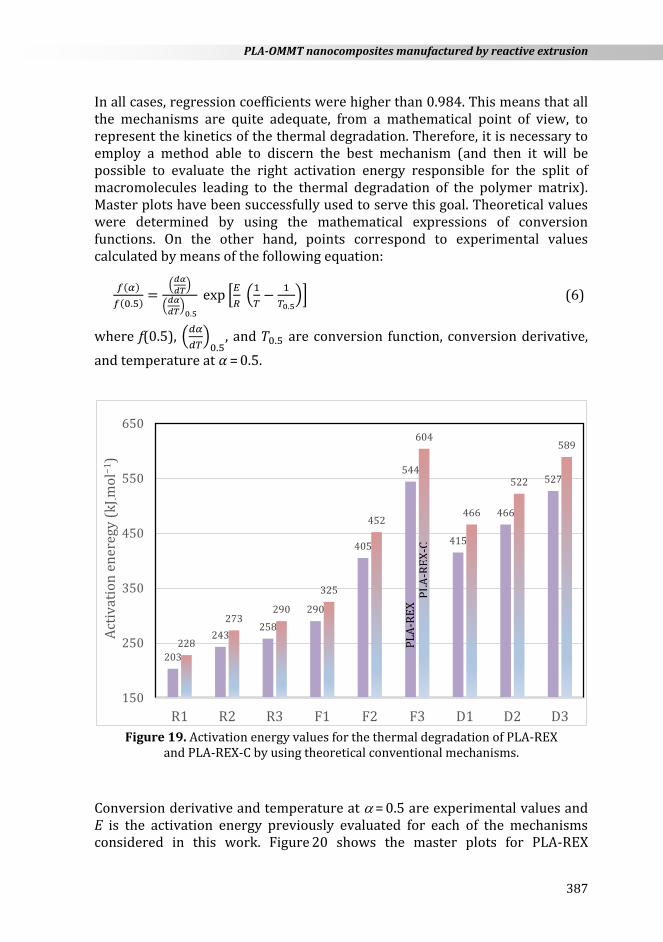
In addition to these empirical and theoretical non-conventional kinetic models, it is interesting to ascertain the validity of conventional solid-state mechanisms. The mechanisms considered in this work are diffusion mechanisms, D1 (one-dimensional), D2 (two-dimensional), and D3 (three- -dimensional); random nucleation with nucleus on the individual particle, F1 (one nucleus), F2 (two nuclei), and F3 (three nuclei); phase-boundary-controlled reaction, R1 (motion in one dimension), R2 (contracting area), and R3 (contracting volume). When applying the general analytical equation to the theoretical conventional mechanisms R1, F1, and D1, the fit of experimental points was only excellent (r2 > 0.99) for mechanism F1. When applying the general analytical equation to the theoretical conventional mechanisms R2, F2, and D2, the fit of experimental points was excellent (r2 > 0.99) for these three mechanisms. When applying the general analytical equation to the theoretical conventional mechanisms R3, F3, and D3, the fit of experimental points was only excellent (r2 > 0.99) for mechanisms R3 and D3. The values of activation energy for all the conventional solid-state mechanisms considered in this work for the thermal degradation of the polymer and its nanocomposite are shown in Figure 19.
The activation energy values so evaluated were 203−544 kJ mol−1 for PLA-REX and 228−604 kJ mol−1 for PLA-REX-C. Therefore, the addition of nanoparticles led to activation energies 25−62 kJ mol−1 higher.
-16,5
-15,5
-14,5
-13,5
0,00156 0,00157 0,00158 0,00159 0,0016 0,00161 0,00162 0,00163
ln [
βg(
α)/
(T2
(1 −
2R
T/E
))]
1/T (K−1)
AC
n-order L = 2
PLA-OMMT nanocomposites manufactured by reactive extrusion
387
In all cases, regression coefficients were higher than 0.984. This means that all the mechanisms are quite adequate, from a mathematical point of view, to represent the kinetics of the thermal degradation. Therefore, it is necessary to employ a method able to discern the best mechanism (and then it will be possible to evaluate the right activation energy responsible for the split of macromolecules leading to the thermal degradation of the polymer matrix). Master plots have been successfully used to serve this goal. Theoretical values were determined by using the mathematical expressions of conversion functions. On the other hand, points correspond to experimental values calculated by means of the following equation:
𝑓(𝛼)
𝑓(0.5)=
(𝑑𝛼
𝑑𝑇)
(𝑑𝛼
𝑑𝑇)
0.5
exp [𝐸
𝑅 (
1
𝑇−
1
𝑇0.5)] (6)
where f(0.5), (𝑑𝛼
𝑑𝑇)
0.5, and 𝑇0.5 are conversion function, conversion derivative,
and temperature at 𝛼 = 0.5.
Figure 19. Activation energy values for the thermal degradation of PLA-REX
and PLA-REX-C by using theoretical conventional mechanisms.
Conversion derivative and temperature at = 0.5 are experimental values and E is the activation energy previously evaluated for each of the mechanisms considered in this work. Figure 20 shows the master plots for PLA-REX
203
243258
290
405
544
415
466
527
228
273290
325
452
604
466
522
589
150
250
350
450
550
650
R1 R2 R3 F1 F2 F3 D1 D2 D3
Act
ivat
ion
en
ereg
y (k
J ·mo
l−1)
PL
A-R
EX
PL
A-R
EX
-C
Chapter 11
388
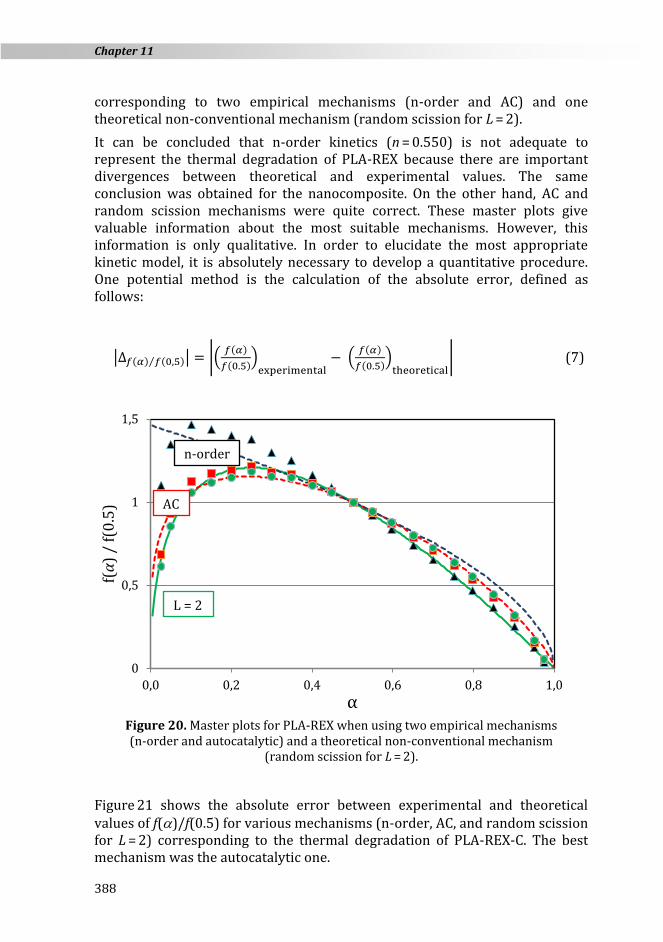
corresponding to two empirical mechanisms (n-order and AC) and one theoretical non-conventional mechanism (random scission for L = 2).
It can be concluded that n-order kinetics (n = 0.550) is not adequate to represent the thermal degradation of PLA-REX because there are important divergences between theoretical and experimental values. The same conclusion was obtained for the nanocomposite. On the other hand, AC and random scission mechanisms were quite correct. These master plots give valuable information about the most suitable mechanisms. However, this information is only qualitative. In order to elucidate the most appropriate kinetic model, it is absolutely necessary to develop a quantitative procedure. One potential method is the calculation of the absolute error, defined as follows:
|∆𝑓(𝛼) 𝑓⁄ (0,5)| = |(𝑓(𝛼)
𝑓(0.5))
experimental− (
𝑓(𝛼)
𝑓(0.5))
theoretical| (7)
Figure 20. Master plots for PLA-REX when using two empirical mechanisms (n-order and autocatalytic) and a theoretical non-conventional mechanism
(random scission for L = 2).
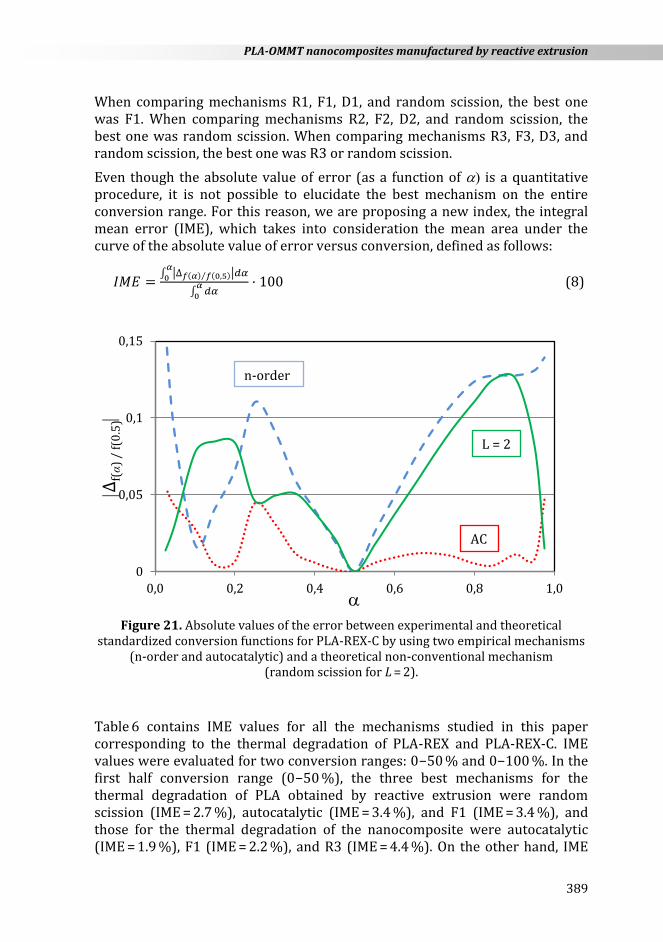
Figure 21 shows the absolute error between experimental and theoretical values of f()/f(0.5) for various mechanisms (n-order, AC, and random scission for L = 2) corresponding to the thermal degradation of PLA-REX-C. The best mechanism was the autocatalytic one.
0
0,5
1
1,5
0,0 0,2 0,4 0,6 0,8 1,0
f(α
) /
f(0
.5)
α
L = 2
AC
n-order
PLA-OMMT nanocomposites manufactured by reactive extrusion
389
When comparing mechanisms R1, F1, D1, and random scission, the best one was F1. When comparing mechanisms R2, F2, D2, and random scission, the best one was random scission. When comparing mechanisms R3, F3, D3, and random scission, the best one was R3 or random scission.
Even though the absolute value of error (as a function of is a quantitative procedure, it is not possible to elucidate the best mechanism on the entire conversion range. For this reason, we are proposing a new index, the integral mean error (IME), which takes into consideration the mean area under the curve of the absolute value of error versus conversion, defined as follows:
𝐼𝑀𝐸 =∫ |∆𝑓(𝛼) 𝑓⁄ (0,5)|𝑑𝛼
𝛼
0
∫ 𝑑𝛼𝛼
0
· 100 (8)
Figure 21. Absolute values of the error between experimental and theoretical
standardized conversion functions for PLA-REX-C by using two empirical mechanisms (n-order and autocatalytic) and a theoretical non-conventional mechanism
(random scission for L = 2).
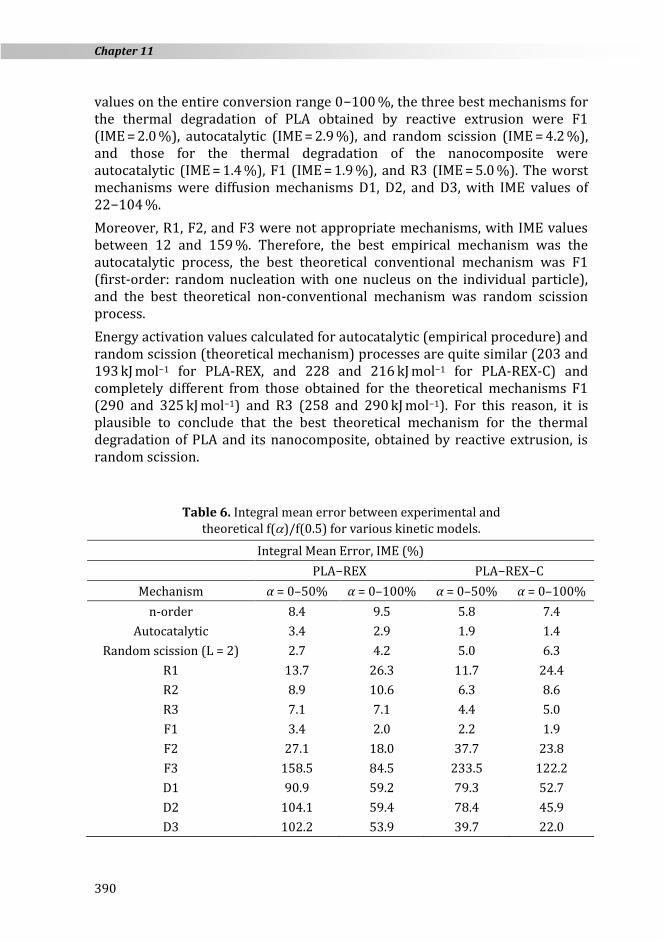
Table 6 contains IME values for all the mechanisms studied in this paper corresponding to the thermal degradation of PLA-REX and PLA-REX-C. IME values were evaluated for two conversion ranges: 0−50 % and 0−100 %. In the first half conversion range (0−50 %), the three best mechanisms for the thermal degradation of PLA obtained by reactive extrusion were random scission (IME = 2.7 %), autocatalytic (IME = 3.4 %), and F1 (IME = 3.4 %), and those for the thermal degradation of the nanocomposite were autocatalytic (IME = 1.9 %), F1 (IME = 2.2 %), and R3 (IME = 4.4 %). On the other hand, IME
0
0,05
0,1
0,15
0,0 0,2 0,4 0,6 0,8 1,0
Δf(α
) /
f(0
.5)
L = 2
n-order
AC
Chapter 11
390
values on the entire conversion range 0−100 %, the three best mechanisms for the thermal degradation of PLA obtained by reactive extrusion were F1 (IME = 2.0 %), autocatalytic (IME = 2.9 %), and random scission (IME = 4.2 %), and those for the thermal degradation of the nanocomposite were autocatalytic (IME = 1.4 %), F1 (IME = 1.9 %), and R3 (IME = 5.0 %). The worst mechanisms were diffusion mechanisms D1, D2, and D3, with IME values of 22−104 %.
Moreover, R1, F2, and F3 were not appropriate mechanisms, with IME values between 12 and 159 %. Therefore, the best empirical mechanism was the autocatalytic process, the best theoretical conventional mechanism was F1 (first-order: random nucleation with one nucleus on the individual particle), and the best theoretical non-conventional mechanism was random scission process.
Energy activation values calculated for autocatalytic (empirical procedure) and random scission (theoretical mechanism) processes are quite similar (203 and 193 kJ mol−1 for PLA-REX, and 228 and 216 kJ mol−1 for PLA-REX-C) and completely different from those obtained for the theoretical mechanisms F1 (290 and 325 kJ mol−1) and R3 (258 and 290 kJ mol−1). For this reason, it is plausible to conclude that the best theoretical mechanism for the thermal degradation of PLA and its nanocomposite, obtained by reactive extrusion, is random scission.
Table 6. Integral mean error between experimental and theoretical f()/f(0.5) for various kinetic models.
Integral Mean Error, IME (%)
PLA−REX PLA−REX−C
Mechanism α = 0–50% α = 0–100% α = 0–50% α = 0–100%
n-order 8.4 9.5 5.8 7.4
Autocatalytic 3.4 2.9 1.9 1.4
Random scission (L = 2) 2.7 4.2 5.0 6.3
R1 13.7 26.3 11.7 24.4
R2 8.9 10.6 6.3 8.6
R3 7.1 7.1 4.4 5.0
F1 3.4 2.0 2.2 1.9
F2 27.1 18.0 37.7 23.8
F3 158.5 84.5 233.5 122.2
D1 90.9 59.2 79.3 52.7
D2 104.1 59.4 78.4 45.9
D3 102.2 53.9 39.7 22.0
PLA-OMMT nanocomposites manufactured by reactive extrusion
391
In order to check the validity of the activation energy values obtained for the thermal degradation of PLA-REX and PLA-REX-C by using the random scission kinetic model, the following equation must be used:
𝛼 = [1 − exp [− 𝐴 𝑅 𝑇2
𝛽 𝐸 (1 −
2𝑅𝑇
𝐸) exp (−
𝐸
𝑅𝑇)]]
2
(9)
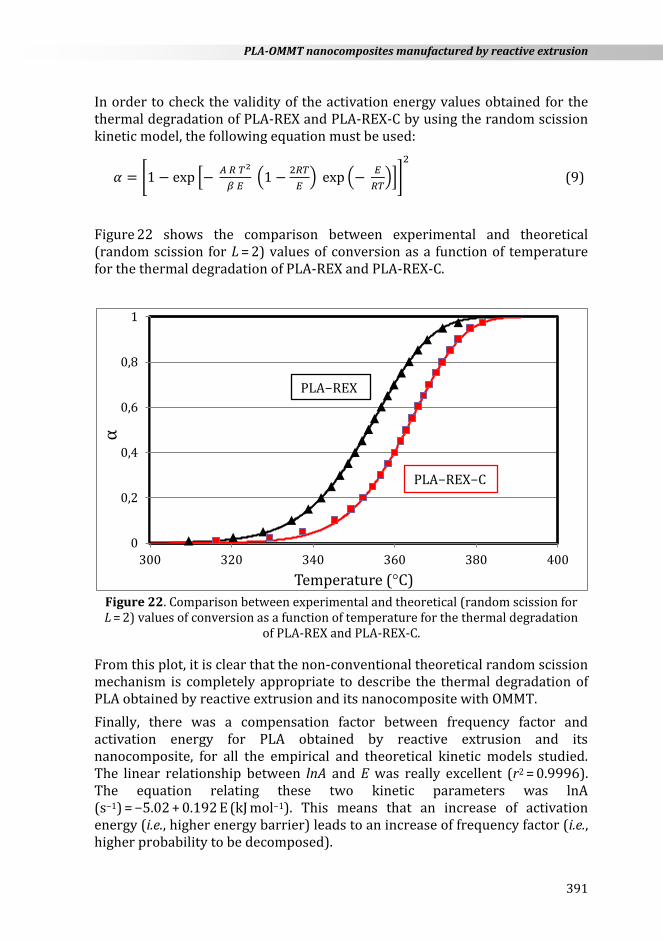
Figure 22 shows the comparison between experimental and theoretical (random scission for L = 2) values of conversion as a function of temperature for the thermal degradation of PLA-REX and PLA-REX-C.
Figure 22. Comparison between experimental and theoretical (random scission for L = 2) values of conversion as a function of temperature for the thermal degradation
of PLA-REX and PLA-REX-C.
From this plot, it is clear that the non-conventional theoretical random scission mechanism is completely appropriate to describe the thermal degradation of PLA obtained by reactive extrusion and its nanocomposite with OMMT.
Finally, there was a compensation factor between frequency factor and activation energy for PLA obtained by reactive extrusion and its nanocomposite, for all the empirical and theoretical kinetic models studied. The linear relationship between lnA and E was really excellent (r2 = 0.9996). The equation relating these two kinetic parameters was lnA (s−1) = −5.02 + 0.192 E (kJ mol−1). This means that an increase of activation energy (i.e., higher energy barrier) leads to an increase of frequency factor (i.e., higher probability to be decomposed).
0
0,2
0,4
0,6
0,8
1
300 320 340 360 380 400
α
Temperature (°C)
PLA−REX
PLA−REX−C
Chapter 11
392
11.4. CONCLUSIONS
In this work, PLA sheets reinforced with commercial OMMT were manufactured in line through reactive extrusion in a pilot plant. Initial reaction monitoring analyses suggested that premature chain extender-clay tethering occurs relatively quickly, thus minimizing further architectural modifications of PLA. A relatively homogeneous distribution of clay nanoparticles, principally oriented in the direction of production (machine direction), was successfully achieved through REX-calendering process. The coexistence of dispersed structures involving tactoids of various sizes and intercalated organoclay layers was confirmed. However, the degree of both clay delamination and intercalation was improved through clay-polymer tethering via chain extender molecules. The mechanical properties of these bionanocomposites changed notably. After tensile testing, the nanocomposite exhibited the presence of several cavities at the clay-PLA interface, resulting from a poor interfacial interaction between clays and the polymer. By contrast, nanocomposite samples exhibited multiple cavitation processes which slightly enhanced shear flow of the polymeric matrix. The onset decomposition temperature of the PLA increased from 328 to 338 °C when adding OMMT nanoparticles (i.e., 10 °C higher). Therefore, the addition of nanoparticles clearly enhanced the thermal stability of the polymer matrix. The general analytical equation was applied to various kinetic models: empirical (n-order and AC), theoretical conventional (R1, F1, D1, R2, F2, D2, R3, F3, and D3), and theoretical non-conventional (random scission). By means of master plots, it was possible to qualitatively determine the best mechanism. Moreover, a new index, based on the integral mean error between experimental and theoretical values of f()/f(0.5), was developed. This index constitutes a quantitative criterion to discern the best mechanism. Random scission kinetic model was found to be the best mechanism explaining the chemical reactions involved in the thermal degradation of PLA obtained by reactive extrusion and its nanocomposite. The activation energies so calculated were 193 and 216 kJ mol−1 for PLA and its nanocomposite, respectively. Therefore, the presence of nanoparticles within the polymer matrix exerted a protective effect on the thermal degradation.
ACKNOWLEDGEMENTS
The authors would like to acknowledge the financial support from the Spanish Ministry of Economy and Competitiveness through the Projects MAT2013- -40730-P and MAT2016-80045-R (AEI/FEDER, UE).
PLA-OMMT nanocomposites manufactured by reactive extrusion
393
REFERENCES
1. J. Chen, Global Markets and Technologies for Bioplastics (BCC Research report PLS050C), 2014.
2. M. Jamshidian, E. Arab-Tehrany, M. Imran, M. Jacquot, S. Desobry. Compr. Rev. Food Sci. Food Saf. 9 (2010) 552−571.
3. R.E. Drumright, P.R. Gruber, D.E. Henton. Adv. Mater. 12 (2000) 1841−1846. 4. D.J. Sawyer. Macromol. Symp. 201 (2003) 271−281. 5. D. Garlotta. J. Polym. Environ. 9 (2001) 63−84. 6. R. Auras, B. Harte, S. Selke. Macromol. Biosci. 4 (2004) 835−864. 7. R.M. Rasal, A.V. Janorkar, D.E. Hirta. Prog. Polym. Sci. 35 (2010) 338−356. 8. R.M. Rasal, D.E. Hirt. J. Biomed. Mater. Res. Part A 88(A) (2009) 1079−1086. 9. A.V. Janorkar, A.T. Metters, D.E. Hirt. Macromolecules 37 (2004) 9151−9159.
10. Y. Tokiwa, B.P. Calabia. Appl. Microbiol. Biotechnol. 72 (2006) 244−251. 11. M. Murariu, P. Dubois. Adv. Drug Deliv. Rev. 107 (2016) 17−46. 12. M.C. Bruns, J.H. Koo, O.A. Ezekoye. Polym. Degrad. Stab. 94 (2009) 1013−1022. 13. G. Madras, B.J. McCoy. Ind. Eng. Chem. Res. 38 (1999) 352−357. 14. V. Mamleev, S. Bourbigot, J. Yvon. J. Anal. Appl. Pyrol. 80 (2007) 151−165. 15. O. Bianchi, J.D. Martins, R. Florio, R.V.B. Oliveira. Polym. Test. 30 (2011)
616−624. 16. J.E.J. Staggs. Polymer 48 (2007) 3868−3876. 17. S. Vyazovkin. J. Therm. Anal. Calorim. 83 (2006) 45−51. 18. P. Paik, K.K. Kar, Mater. Chem. Phys. 113 (2009) 953−961. 19. F. Carrasco, P. Pagès. Polym. Degrad. Stab. 93 (2008) 1000−1007. 20. C. Reverte, J.L. Dirion, M. Cabassud. J. Anal. Appl. Pyrol. 79 (2007) 297−305. 21. F. Carrasco, P. Pagès, J. Gámez-Pérez, O.O. Santana, M.L. Maspoch. Polym.
Degrad. Stab. 95 (2010) 116−125. 22. P. Budrugeac, E. Segal. Polym. Degrad. Stab. 93 (2008) 1073−1080. 23. P. Budrugeac. Polym. Degrad. Stab. 89 (2005) 265−273. 24. O. Bianchi, R.V.B. Oliveira, R. Florio, J.D.N. Martins, A.J. Zattera, L.B. Canto.
Polym. Test. 27 (2008) 722−729. 25. S. Vyazovkin, N. Sbirrazzuoli. Macromol. Rapid Comm. 27 (2006) 1515−1532. 26. D.E. García, J.C. Carrasco, J.P. Salazar, M.A. Pérez, R.A. Cancino, S. Riquelme.
Express Polym. Lett. 10 (2016) 835−848. 27. P.E. Sánchez-Jiménez, L.A. Pérez-Maqueda, A. Perejón, J.M. Criado.
Polym. Degrad. Stab. 94 (2009) 2079−2085. 28. Y. Xu, Y. Wang, T. Xu, J. Zhang, C. Liu, C. Shen. Polym. Test. 37 (2015) 179−185 29. L.A. Pérez-Maqueda, J.M. Criado, F.J. Gotor, J. Malek. J. Phys. Chem A 106 (2002)
2862−2868 30. S.W. Bigger, M.J. Cran, M.A. Bohn. Polym. Test. 44 (2015) 1−7. 31. L.A. Pérez-Maqueda, P.E. Sánchez-Jiménez, A. Perejón, C. García-Garrido,
J.M. Criado, M. Benítez-Guerrero. Polym. Test. 37 (2015) 1−5. 32. L.T. Lim, R. Auras, M. Rubino. Prog. Polym. Sci. 33 (2008) 820−852. 33. R. Auras, B. Harte, S. Selke. Macromol. Biosci. 4 (2004) 835−864. 34. S. Taguchi. Polym. Degrad. Stab. 95 (2010) 1421−1428. 35. D.E. Henton, P. Gruber, J. Lunt, J. Randall, in: A.K. Mohanty, M. Misra, L.T. Drzal
(Eds.), Natural Fibers, Biopolymers, and Biocomposites, Taylor & Francis, F.L. Boca Raton 2005, pp. 527−577.
36. S. Farah, D.G. Anderson, R. Langer. Adv. Drug Deliv. Rev. 107 (2016) 367−392.
Chapter 11
394
37. B. Gupta, N. Revagade, J. Hilborn. Prog. Polym. Sci. 32 (2007) 455−482. 38. Y. Cheng, S. Deng, P. Chen, R. Ruan. Front. Chem. Chin. 4 (2009) 259−264. 39. K.E. Perepelkin. Fibre Chem. 34 (2002) 85−100. 40. A.M. Harris, E.C. Lee. J. Appl. Polym. Sci. 107 (2008) 2246−2255. 41. C. Martin, Features-compounding PLA on twin-screws: what testing reveals,
http://www.ptonline.com/articles/compounding-pla-on-twin-screws-what-test-ing-reveals (accessed 10 Dec 2015, Plastics Technology Magazine) 2014.
42. J. Li, X.L. Lu, Y.F. Zheng. Appl. Surf. Sci. 255 (2008) 494−497. 43. B.H. Lee, H.S. Kim, S. Lee, H.J. Kim, J.R. Dorgan. Compos. Sci. Technol. 69 (2009)
2573−2579. 44. J. Ganster, J. Erdmann, H.P. Fink. Kunstst. Int. 101 (2011) 46−49. 45. T. Fujiura, T. Okamoto, T. Tanaka, Y. Imaida. WIT Trans. Ecol. Environ. 138
(2010) 181−188. 46. L. Yu, K. Dean, L. Li. Prog. Polym. Sci. 31 (2006) 576−602. 47. J.M. Raquez, Y. Habibi, M. Murariu, P. Dubois. Prog. Polym. Sci. 38 (2013)
1504−1542. 48. P. Bordes, E. Pollet, L. Avérous. Prog. Polym. Sci. 34 (2009) 125−155. 49. S. Sinha Ray, K. Yamada, M. Okamoto, K. Ueda. Nano Lett. 2 (2002) 1093−1096. 50. J.M. Raquez, Y. Habibi, M. Murariu, P. Dubois. Prog. Polym. Sci. 38 (2013)
1504−1542. 51. M.A. Paul, M. Alexandre, P. Degee, C. Henrist, A. Rulmont, P. Dubois. Polymer 44
(2003) 443−450. 52. J. Gámez-Perez, L. Nascimento, J.J. Bou, E. Franco-Urquiza, O.O. Santana,
F. Carrasco, M.L. Maspoch. J. Appl. Polym. Sci. 120 (2011) 896−905. 53. E.A. Franco-Urquiza, J.C. Velázquez-Infante, J. Cailloux, O.O. Santana,
M.L. Maspoch. Adv. Polym. Tech. 34(1) (2015) 21470. 54. N. Najafi, M.C. Heuzey, P.J. Carreau. Compos. Sci. Technol. 72 (2012) 608−615. 55. F. Carrasco, J. Gámez-Pérez, O.O. Santana, M.L. Maspoch. Chem. Eng. J. 178
(2011) 451−460. 56. F. Carrasco, L.A. Pérez-Maqueda, O.O. Santana, M.L. Maspoch. Polym. Degrad.
Stab. 101 (2014) 52−59. 57. S. Castiello, M.B. Coltelli, L. Conzatti, S. Bronco. J. Appl. Polym. Sci. 125 (2012)
E413−E428. 58. M. Pluta. J. Polym. Sci. Pol. Phys. 44 (2006) 3392−3405. 59. E. Acik, N. Orbey, U. Yilmazer. J. Appl. Polym. Sci. 133(4) (2016) 42915. 60. N. Najafi, M.C. Heuzey, P.J. Carreau, P.M. Wood-Adams. Polym.Degrad. Stab. 97
(2012) 554−565. 61. Q.K. Meng, M.C. Heuzey, P.J. Carreau. Polym. Degrad. Stab. 97 (2012) 1−11. 62. J. Cailloux, O.O. Santana, J.J. Bou, F. Carrasco, M.L. Maspoch. J. Rheol. 59 (2015)
1191−1227. 63. R. Al-Itry, K. Lamnawar, A. Maazouz. Eur. Polym. J. 58 (2014) 90−102. 64. A.P. Korobko, S.V. Krasheninnikov, I.V. Levakova, S.N. Drozd, S.N. Chvalun,
V.V. Nikolaev, M.A. Shcherbina, S.V. Cherdyntseva. Polym. Sci. Ser A 53 (2011) 75−84.
65. T. Abt, J.J. Bou, M. Sánchez-Soto. Express Polym. Lett. 8 (2014) 953−966. 66. G.X. Chen, H.S. Kim, J.H. Shim, J.S. Yoon. Macromolecules 38 (2005) 3738−3744. 67. A. Redl, M.H. Morel, J. Bonicel, S. Guilbert, B. Vergnes. Rheol. Acta. 38 (1999)
311−320.
PLA-OMMT nanocomposites manufactured by reactive extrusion
395
68. J. Cailloux, O.O. Santana, E. Franco-Urquiza, J.J. Bou, F. Carrasco, J. Gámez-Pérez, M.L. Maspoch. Express Polym. Lett. 7 (2013) 304−318.
69. Y.M. Corre, J. Duchet, J. Reignier, A. Maazouz. Rheol Acta. 50 (2011) 613−629. 70. P. Bordes, E. Hablot, E. Pollet, L. Avérous. Polym. Degrad. Stab. 94 (2009)
789−796. 71. D.M. Bigg. Adv. Polym. Tech. 24 (2005) 69−82. 72. A. Pattanayak, S.C. Jana. Polymer 46 (2005) 3275−3288. 73. E. Pretsch, P. Bühlmann, C. Affolter, A. Herrera, R. Martínez, Determinación
estructural de compuestos orgánicos, Barcelona: Springer-Verlag Ibérica, 2001.
74. D.N. Bikiaris, G.P. Karayannidis. J Polym Sci, Part A: Polym. Chem. 34 (1996) 1337−1342.
75. E. van Ruymbeke, V. Stephenne, D. Daoust, R. Godard, R. Keunings, C. Bailly. J. Rheol. 49 (2005) 1503−1520.
76. J. Cailloux , O.O. Santana, E. Franco-Urquiza, J.J. Bou, F. Carrasco, M.L. Maspoch. J. Mater. Sci. 49 (2014) 4093−4107.
77. F. Carrasco. Thermochim. Acta 213 (1993) 115−134. 78. F. Carrasco, O.O. Santana, J. Cailloux, M.L. Maspoch. Polym. Test. 48 (2015)
69−81. 79. F. Carrasco, L.A. Pérez-Maqueda, P.E. Sánchez-Jiménez, A. Perejón, O.O.
Santana, M.L. Maspoch. Polym. Test. 32 (2013) 937−945. 80. Y. Doi, Y. Kanesawa, M. Kunioka, T. Saito. Macromolecules 1 (1990) 26−31. 81. H. Yu, N. Huang, C. Wang, Z. Tang. J. Appl. Polym. Sci. 11 (2003) 2557−2562.

Chapter 11
396