lake okeechobee tributaries tmdl | us epa archive …...bod biochemical oxygen demand cafo confined...
TRANSCRIPT


FINAL
TTOOTTAALL MMAAXXIIMMUUMM DDAAIILLYY LLOOAADD ((TTMMDDLL))
FFoorr
BBiioocchheemmiiccaall OOxxyyggeenn DDeemmaanndd,, DDiissssoollvveedd OOxxyyggeenn,, aanndd NNuuttrriieennttss
IInn tthhee
LLaakkee OOkkeeeecchhoobbeeee TTrriibbuuttaarriieess
OOsscceeoollaa,, PPoollkk,, OOkkeeeecchhoobbeeee,, HHiigghhllaannddss,, GGllaaddee,, aanndd MMaarrttiinn,, FFlloorriiddaa
PPrreeppaarreedd bbyy::
UUSS EEPPAA RReeggiioonn 44
6611 FFoorrssyytthh SSttrreeeett SSWW
AAttllaannttaa,, GGeeoorrggiiaa 3300330033
JJuunnee 22000088

ii
In compliance with the provisions of the Federal Clean Water Act, 33 U.S.C §1251 et. seq., as amended by the Water Quality Act of 1987, P.L. 400-4, the U.S. Environmental Protection Agency is hereby establishing Total Maximum Daily Loads (TMDLs) for biochemical oxygen demand, dissolved oxygen, and nutrients in the Lake Okeechobee tributaries. Subsequent actions must be consistent with these TMDLs.
_____________ _______________________
_
James D. Giattina Date Director Water Management Division

Lake Okeechobee Tributaries –Total Maximum Daily Loads June 2008
iii
TABLE OF CONTENTS
1 INTRODUCTION ................................................................................................................ 1
1.1 Purpose of Report ............................................................................................................. 6
1.2 Previous Studies in the Lake Okeechobee Watershed ..................................................... 6
1.3 Identification of Impaired Waterbodies ............................................................................ 9
1.3.1 Lake Okeechobee Basin ................................................................................................ 9
1.3.2 Kissimmee River Basin ............................................................................................... 17
1.3.3 Fisheating Creek Basin .............................................................................................. 19
1.3.4 Everglades Agricultural Area (EAA) .......................................................................... 20
2 STATEMENT OF WATER QUALITY PROBLEM ........................................................ 24
3 WATER QUALITY STANDARDS .................................................................................. 25
3.1 Nutrient Criterion ........................................................................................................... 25
3.2 Dissolved Oxygen Criterion ........................................................................................... 25
3.3 Biochemical Oxygen Demand Criterion ........................................................................ 26
4 TARGET IDENTIFICATION ........................................................................................... 27
4.1 Basis and Rationale For Nutrient Targets ...................................................................... 27
4.2 Nutrient Target Development ......................................................................................... 32
4.3 Nutrient Target Application ........................................................................................... 33
4.4 DO and BOD Target ....................................................................................................... 34
5 WATER QUALITY RESULTS ........................................................................................ 36
6 SOURCE ASSESSMENT ................................................................................................. 40
6.1 Background Loads .......................................................................................................... 40
6.2 Permitted Point Sources ................................................................................................. 40
6.2.1 Municipal Separate Storm Sewer System Permittees ................................................. 41
6.3 Nonpoint Sources ........................................................................................................... 42
6.3.1 Agriculture .................................................................................................................. 43

Lake Okeechobee Tributaries –Total Maximum Daily Loads June 2008
iv
6.3.2 Sediment ...................................................................................................................... 44
6.3.3 Septic Systems ............................................................................................................. 44
6.3.4 Stormwater Runoff ...................................................................................................... 44
7 TMDL DEVELOPMENT .................................................................................................. 46
7.1 Nutrient TMDL .............................................................................................................. 46
7.2 BOD TMDL ................................................................................................................... 50
8 TMDL ALLOCATION ...................................................................................................... 51
8.1 Allocation ....................................................................................................................... 51
8.2 Load Allocation .............................................................................................................. 55
8.3 Wasteload Allocations .................................................................................................... 56
8.4 Margin of Safety ............................................................................................................. 56
8.5 Seasonal Variability ....................................................................................................... 56
9 TMDL IMPLEMENTATION ............................................................................................ 57
REFERENCES ............................................................................................................................. 58
Appendix A: Calculation of Limiting Nutrient ........................................................................... 60
Appendix B: Derivation of TN Target ......................................................................................... 62
Appendix C: Rationale for Controlling Nitrogen in Impaired WBIDs ........................................ 63
Appendix D: Calculation of BOD TMDL .................................................................................. 68
APPENDIX E: Water Quality Plots ............................................................................................. 69

Lake Okeechobee Tributaries –Total Maximum Daily Loads June 2008
v
LIST OF TABLES
Table 1. Planning Unit and Basin Group of Impaired WBIDs ...................................................... 2
Table 2. Comparison of LOPP Basins and Impaired WBIDs ........................................................ 7
Table 3. Summary of TP Loads Discharging into Lake Okeechobee (SFWMD, 2004) .............. 11
Table 4. Comparison of LOPP and WBID Loads ........................................................................ 13
Table 5. Summary of Land Cover in Impaired WBIDs ............................................................... 21
Table 6. Existing Limiting Condition in Impaired WBIDs (based on TP and TN data) ............. 31
Table 7. Summary of Nutrient Data for WBIDs Impaired by both Nutrients and DO ................ 37
Table 8. Summary of DO and BOD Data in WBIDs Impaired For DO ...................................... 39
Table 9. Area and Inflows for Impaired WBIDs and LOPP Basins (Baseline Conditions) ......... 47
Table 10. Summary of Existing Conditions for Total Nitrogen .................................................. 49
Table 11. TMDL Components for Total Phosphorus .................................................................. 52
Table 12. TMDL Components for Total Nitrogen ....................................................................... 54
Table 13. TMDL Components for BOD ...................................................................................... 55
Table 14. TP Allocations for LOPP Basins Expressed as Daily Loads ....................................... 55
LIST OF FIGURES
Figure 1. Location of Horseshoe Creek (WBID 1436) in the Upper Kissimmee River Basin ...... 4
Figure 2. Location of Impaired WBIDs below Lake Kissimmee ................................................... 5
Figure 3. Control Structures and Sampling Stations in Lake Okeechobee .................................. 14
Figure 4. Taylor Creek and Nubbin Slough Basins ..................................................................... 17

Lake Okeechobee Tributaries –Total Maximum Daily Loads June 2008
vi
LIST OF ABBREVIATIONS
AFO Animal Feeding Operation AgNMP Agricultural Nutrient Management Plan BAT Best Available Technology BMP Best Management Practices BOD Biochemical Oxygen Demand CAFO Confined Animal Feeding Operation CFS Cubic Feet per Second DMR Discharge Monitoring Report DO Dissolved Oxygen EAA Everglades Agricultural Area EOF Edge-of-Field/Farm F.A.C. Florida Administrative Code FDACS Florida Department of Agriculture and Consumer Services FDEP Florida Department of Environmental Protection GIS Geographic Information System HAB Harmful Algae Bloom HUC Hydrologic Unit Code IWR Impaired Waters Rule LA Load Allocation LOPP Lake Okeechobee Protection Plan LOWP Lake Okeechobee Watershed Project MOS Margin of Safety
MS4 Municipal Separate Storm Sewer Systems Mton Metric Ton NPDES National Pollutant Discharge Elimination System PLRG Pollutant Load Reduction Goal PPB Parts Per Billion (equivalent to 1 ug/L) PPM Parts Per Million (equivalent to 1 mg/L) RASTA Reservoir Assisted Stormwater Treatment Area SFWMD South Florida Water Management District SOD Sediment Oxygen Demand SSAC Site Specific Alternative Criteria STA Stormwater Treatment Area TCNS Taylor Creek Nubbin Slough TN Total Nitrogen TP Total Phosphorus WBID Water Body Identification WLA Waste Load Allocation

Lake Okeechobee Tributaries –Total Maximum Daily Loads June 2008
vii
SUMMARY SHEET
1. Florida 1998 303(d) Listed Waterbody Information
WBID Segment Name Classification Constituent County HUC
3186B Kissimmee River 3F DO, BOD Osceola 03090101
3186C Blanket Bay Slough 3F Nutrients, DO Osceola 03090101
3186D Eight Mile Slough 3F DO Polk 03090101
3188 Farm Area 3F Nutrients, DO Okeechobee 03090101
3188A Chandler Slough 3F Nutrients, DO Okeechobee 03090101
3192C Oak Creek 3F Nutrients, DO Okeechobee 03090101
3199B Chandler Hammock Slough
3F Nutrients, DO Okeechobee 03090102
3203A Nubbin Slough 3F Nutrients, DO Okeechobee 03090102
3203B Mosquito Creek 3F Nutrients, DO Okeechobee 03090102
3204 Harney Pond Canal 3F Nutrients, DO Highlands/Glade 03090103
3205 Taylor Creek 3F Nutrients, DO Okeechobee 03090101
3205D Otter Creek 3F Nutrients, DO Okeechobee 03090101
3206 Indian Prairie Canal 3F Nutrients, DO Highlands/Glade 03090103
3209 Kissimmee River 3F Nutrients, DO Glades 03090101
3213A Lettuce Creek 3F Nutrients, DO Okeechobee/Martin 03090102
3213B Henry Creek 3F Nutrients, DO Okeechobee 03090102
3213C S-135 3F Nutrients, DO Martin 03090102
3213D Myrtle Slough 3F Nutrients, DO Martin 03090102
1436 Horseshoe Creek 3F Nutrients, DO Polk 03090101
3248 N. New River Canal (S-2 Basin) 3F Nutrients, DO Palm Beach 03090202
3251 S-3 Basin 3F Nutrients, DO Palm Beach 03090202

Lake Okeechobee Tributaries –Total Maximum Daily Loads June 2008
viii
3246 East Caloosahatchee (S-4 Basin) 3F Nutrients, DO Hendry 03090202
2. Water Quality Standards:
BOD (62-302.530(12)F.A.C.): Levels shall not be increased to exceed values which would cause dissolved oxygen to be depressed below the limit established for each class and, in no case shall it be great enough to produce nuisance conditions.
DO (62-302.530(31) F.A.C.): Dissolved oxygen shall not be less than 5.0 mg/l. Normal daily and seasonal fluctuations above these levels shall be maintained. The water quality standard for DO also considers the definition of natural background and the directive not to abate natural conditions (62-302.200(15) F.A.C. and 62-302.300(15) F.A.C.).
Nutrients (62-302.530(48)(a) F.A.C.): The discharge of nutrients shall continue to be limited as needed to prevent violations of other standards contained in this chapter. Man induced nutrient enrichment (total nitrogen and total phosphorus) shall be considered degradation in relation to the provisions of Section 62-302.300, 62-302.700, and 62-4.242, F.A.C.
62-302.530(48)(b) In no case shall nutrient concentrations of a body of water be altered so as to cause an imbalance in natural populations of aquatic flora or fauna.
It should be noted that FDEP has efforts ongoing to develop numeric criteria for nutrients applicable to inland waters which are expected to be adopted into state water quality standards at a future date according to a schedule described in the State of Florida’s Numeric Nutrient Criteria Development Plan (FDEP, 2007a).
3. TMDL Approach
Nutrients: The TMDLs target both Total Phosphorus (TP) and Total Nitrogen (TN) based on considerations described in Section 4 of this report. An instream TP target of 113 ug/L was selected to provide protection of aquatic life within the tributary, and a TP load consistent with the loads prescribed in the Lake Okeechobee Protection Plan (LOPP), was assigned at the pore point of the WBIDs comprising a LOPP basin. An instream target of 1.2 mg/L TN was selected to provide protection of aquatic life within the tributary and meet downstream uses. The TMDL targets were developed to support the State of Florida’s narrative water quality standard for nutrients by not causing an imbalance in natural populations of aquatic flora or fauna and also to not produce or contribute to conditions that violate the State’s standard for dissolved oxygen. Control of both nutrients, N and P, in upstream waters provides additional assurance that excess productivity will remain in control, and avoids pollutant-caused depressions of DO. The TMDL will ensure protection for aquatic life both in the tributary WBIDs, as well as not contribute to water quality impairments in the downstream waters of Lake Okeechobee and its subsequent drainage to the coastal estuaries of St. Lucie and Caloosahatchee.
Dissolved Oxygen. In WBIDs impaired for both DO and nutrients, it is assumed the TMDLs for TP and TN will address the DO impairment. When BOD data are available and a correlation can be determined between DO and BOD (e.g., WBID 3186B), a TMDL for BOD is provided. Many of the impaired waterbodies have been channelized or are canals and it may be difficult to consistently meet the statewide DO standard even

Lake Okeechobee Tributaries –Total Maximum Daily Loads June 2008
ix
after controlling pollutant concentrations. In such circumstances, allocations for contributing pollutants (e.g., TP and TN) would be targeted to achieve the natural background loading and natural instream pollutant concentrations in the waterbody. Any allowance of increased loadings beyond natural background could potentially cause a lowering of DO. Because the standard prevents abatement of natural conditions, the TMDL report provides an allocation, where necessary, that results in natural conditions. A site specific criterion for DO needs to be established for any condition that will not attain natural DO concentrations.
BOD: A regression analysis correlating BOD to DO was developed to determine the BOD concentration necessary to maintain DO levels that attain the water quality standard.
4. TMDL Allocation for Total Phosphorus in WBIDs Impaired by Nutrients and DO:
LOPP Basin/WBIDs
WLA LA (ppb)
MOS TMDL % Reduction
Lake Load (Mton/yr)
WBID Conc. (ppb)
Lake WBID
S-65A ,B, C, D, E 19.25 76%
3188 0 113 Implicit 113 76%
3188A 0 113 Implicit 113 41%
3186C 0 113 Implicit 113 0%
3186D 0 113 Implicit 113 58%
3192C 0 113 Implicit 113 76%
Taylor Creek / Nubbin Slough (S-191) 19.01 76%
3205 0 113 Implicit 113 76%
3205D 0 113 Implicit 113 82%
3203A 0 113 Implicit 113 77%
3203B 0 113 Implicit 113 88%
3213A 0 113 Implicit 113 75%
3213B 0 113 Implicit 113 74%
3213D 0 113 Implicit 113 90%
C-40 Basin (S-72) 2.32 76%
3206 0 113 Implicit 113 39%

Lake Okeechobee Tributaries –Total Maximum Daily Loads June 2008
x
LOPP Basin/WBIDs
WLA LA (ppb)
MOS TMDL % Reduction
Lake Load (Mton/yr)
WBID Conc. (ppb)
Lake WBID
C-41 Basin (S-71) 6.17 76%
3204 0 113 Implicit 113 25%
L59-E 0.36 76%
3209 0 113 Implicit 113 0%
S-135 Basin 0.82 76%
3213C 0 113 Implicit 113 0%
S-154 Basin 5.72 76%
3199B 0 113 Implicit 113 93%
S-65 (Lake Kissimmee) 16.96 76%
1436 0 113 Implicit 113 0%
S-2 Basin (includes WBID 3248) 1.98 76%
S-3 Basin (includes WBID 3251) 0.56 76%
S-4 Basin (includes WBID 3246) 1.67 76%
Notes: 1) A daily TP concentration of 113 ug/L is based on an annual average of the measured days taking into account natural variability; 2) WBIDs requiring a higher percent reduction than in the LOPP basins are highlighted in bold font. Additional Best management practices beyond those proposed in the Lake Okeechobee Protection Plan should be implemented in these WBIDs; and 3) the loads allocated to the S-2, S-3 and S-4 LOPP basins, which have the potential to back pump flood waters into Lake Okeechobee, are consistent with the loads assigned to the LOPP. EPA is not establishing instream targets for the WBIDs containing these structures, as work is ongoing to quantify nutrient concentrations that are protective of the EAA canals. Once this work is complete, the TMDLs for these WBIDs may be revised to reflect the numeric nutrient criteria.
5. TP Allocations for Lake Okeechobee Protection Plan Basins Expressed as Daily Loads:
LOPP Basin WLA (lb/day)
LA (lb/day)
TMDL (lb/day)
S-65A, B, C, D, E 0 116.19 116.19
Taylor Creek / Nubbin Slough (S-191) 0 114.74 114.74

Lake Okeechobee Tributaries –Total Maximum Daily Loads June 2008
xi
LOPP Basin WLA (lb/day)
LA (lb/day)
TMDL (lb/day)
C-40 Basin (S-72) 0 14 14
C-41 Basin (S-71) 0 37.24 37.24
L59-E 0 2.17 2.17
S-135 Basin 0 4.95 4.95
S-154 Basin 0 34.50 34.50
S-65 0 102.37 102.37
lb/day = Mton/yr * yr/365.25 day * 2204.623 lb/Mton.
Note: Achievement of the annual load would imply achievement of the daily load averaged through the year; therefore, implementation should target the annual load.
6. TMDL Allocation for Total Nitrogen for WBIDs Impaired by Nutrients and DO:
WBID WLA (lb/day)
LA (lb/day)
MOS TMDL (lb/day)
% Reduction
3188 0 600.09 Implicit 600.09 32%
3188A 0 65.08 Implicit 65.08 15%
3186C 0 98.73 Implicit 98.73 35%
3186D 0 149.39 Implicit 149.39 0%
3192C 0 62.98 Implicit 62.98 39%
3205 0 400.12 Implicit 400.12 34%
3205D 0 74.48 Implicit 74.48 43%
3203A 0 115.64 Implicit 115.64 25%
3203B 0 50.72 Implicit 50.72 54%
3213A 0 23.65 Implicit 23.65 35%
3213B 0 120.90 Implicit 120.90 42%
3213D 0 123.41 Implicit 123.41 54%
3206 0 145.32 Implicit 145.32 31%

Lake Okeechobee Tributaries –Total Maximum Daily Loads June 2008
xii
WBID WLA (lb/day)
LA (lb/day)
MOS TMDL (lb/day)
% Reduction
3204 0 444.90 Implicit 444.90 39%
3209 0 57.13 Implicit 57.13 27%
3213C 0 170.44 Implicit 170.44 29%
3199B 0 115.19 Implicit 115.19 60%
1436 0 240.37 Implicit 240.37 30%
Note: The expressed daily TN load is based on an annual average of the measured days taking into account natural variability.
7. TMDL Allocation for BOD:
WBID TMDL
(lb/day) WLA
(lb/day) LA
(lb/day) Percent
Reduction
3186B 811.13 0 811.13 38%
8. Endangered Species (yes or blank): Yes
9. EPA Lead on TMDL (EPA or blank): EPA
10. TMDL Considers Point Source, Nonpoint Source, or both: Both
11. Major NPDES Discharges to surface waters: None
12. MS4 Allocations:
Note: The MS4 is responsible for controlling pollutant loads from the urban areas within its jurisdiction. WBID 1436, Horseshoe Creek, is located in Polk County, but this area is not covered by the Polk County MS4 permit due to low population density. All future areas with population densities meeting the MS4 requirements will be required to achieve the percent reductions assigned in the above table.
MS4
NPDES ID
% Reduction in Nutrient
Load City of Davenport/Polk County FLS000015 TP: 0%
TN: 30%

Lake Okeechobee Tributaries – Total Maximum Daily Load June 2008
1
1 INTRODUCTION
Section 303(d) of the Clean Water Act requires states to list waters within its boundaries for which technology based effluent limitations are not stringent enough to protect water quality standards. Listed waters are prioritized with respect to designated use classifications and the severity of pollution. In accordance with this prioritization, states are required to develop Total Maximum Daily Loads (TMDLs) for those water bodies that are not meeting water quality standards. The TMDL process establishes allowable loadings of pollutants or other quantifiable parameters for a waterbody based on the relationship between pollution sources and in-stream water quality conditions. States establish water quality based controls to reduce pollution from both point and nonpoint sources to restore and maintain the quality of their water resources (USEPA, 1991). TMDLs are being finalized pursuant to EPA commitments in the 1998 Consent Decree in the Florida TMDL lawsuit (Florida Wildlife Federation, et al. v. Carol Browner, et al., Civil Action No. 4: 98CV356-WS, 1998).
Florida Department of Environmental Protection (FDEP) developed a statewide, watershed-based approach to water resource management. Under this approach, water resources are managed on the basis of natural boundaries, such as river basins, rather than political boundaries. The state’s 52 basins are divided into 5 groups with water quality assessed in each group on a rotating five-year cycle. The Lake Okeechobee Watershed includes the Lake Okeechobee Basin located in group 1, the Caloosahatchee and Lake Worth Lagoon-West Palm Beach Coast Basins located in group 3, the Fisheating Creek Basin and the Kissimmee Basin located in group 4 and the Everglades Basin located in group 5. The Florida Legislature established five water management districts (WMDs) responsible for managing ground and surface water supplies in the counties encompassing the districts. The Lake Okeechobee tributaries are managed through the South Florida Water Management District (SFWMD).
For the purpose of planning and management, the WMDs divide the district into planning units defined as either an individual primary tributary basin or a group of adjacent primary tributary basins with similar characteristics. These planning units contain smaller, hydrological based units called drainage basins, which are further divided into “water segments” with each assigned a unique Waterbody IDentification (WBID) number. A water segment usually contains only one unique waterbody type (stream, lake, cannel, etc.). In September 2006, EPA proposed TMDLs for impaired WBIDs located both north and south of Lake Okeechobee. In response to public comments, EPA is finalizing TMDLs for those WBIDs located north of the lake, as well as those WBIDs south of the lake that have the potential to back pump flood waters into Lake Okeechobee (i.e., S-2, S-3, and S-4 basins). The loads allocated to these pump structures are consistent with the loads assigned in the Lake Okeechobee Protection Plan (LOPP). EPA is not establishing instream targets for the WBIDs containing these structures, as work is ongoing to quantify nutrient loads that are protective of the EAA Class III canals. Once this work is complete, the TMDLs for these WBIDs may be revised to reflect the numeric nutrient criteria.

Lake Okeechobee Tributaries – Total Maximum Daily Load June 2008
2
EPA concurred with the public comment that waters south of the Lake in the Everglades Agricultural Area (EAA) are different than waters north of the Lake and, therefore, different TMDL targets are appropriate for the EAA TMDLs. EPA intends to finalize the EAA TMDLs in the Everglades TMDL report that was proposed in September 2007. EPA is finalizing TMDLs for several of the impaired WBIDs (i.e., WBID 3205, 3205A, 3204, 3186C, and 3186D) in advance of the Consent Decree schedule to encourage implementation of the TMDLs through a watershed approach. The planning unit and basin group of each impaired WBID are identified in Table 1. All segments are classified as freshwater streams. The locations of impaired WBIDs in the Upper Kissimmee River basin are shown in Figure 1. The location of impaired WBIDs below Lake Kissimmee are shown in Figure 2. The Lake Okeechobee Watershed Project (LOWP) boundaries are overlain with WBID boundaries in Figure 2, and for purposes of this report, the LOWP boundaries are the same as the LOPP basins.
Table 1. Planning Unit and Basin Group of Impaired WBIDs
WBID Segment Name Planning Unit Basin Group
3186B Kissimmee River Lower Kissimmee 4
3186C Blanket Bay Slough Lower Kissimmee 4
3186D Eight Mile Slough Lower Kissimmee 4
3188 Farm Area Lower Kissimmee 4
3188A Chandler Slough Lower Kissimmee 4
3192C Oak Creek Lower Kissimmee 4
3199B Chandler Hammock Slough
CTP Complex 1
3203A Nubbin Slough NHLMS Complex 1
3203B Mosquito Creek NHLMS Complex 1
3204 Harney Pond Canal Northwest Lake Okeechobee
4
3205 Taylor Creek TOL63 Complex 1

Lake Okeechobee Tributaries – Total Maximum Daily Load June 2008
3
WBID Segment Name Planning Unit Basin Group
3205D Otter Creek TOL63 Complex 1
3206 Indian Prairie Canal Northwest Lake Okeechobee
4
3209 Kissimmee River Lower Kissimmee 4
3213A Lettuce Creek NHLMS Complex 1
3213B Henry Creek NHLMS Complex 1
3213C S-135 NHLMS Complex 1
3213D Myrtle Slough NHLMS Complex 1
1436 Horseshoe Creek Upper Kissimmee 4
3248 N. New River Canal (located in S-2 basin)
Everglades Agricultural Area
5
3251 S-3 Everglades Agricultural Area
5
3246 East Caloosahatchee (located in S-4 basin)
East Caloosahatchee
3

Lake Okeechobee Tributaries – Total Maximum Daily Load June 2008
4
#
###
#
##
#
##
#
#
#
#
Lake Kissimmee
Davenport
Citrus Ridge
Reedy Creek
Lake Cypress
WBID 1436
Lake Hatchineha
Polk County
Lake Russell
Osceola County
5 0 5 10 15 20 Miles
Upper Kissimmee BasinCities and Towns (near WBID 1436)County Boundary
Rivers and LakesLAKE/PONDRESERVOIRSEA/OCEANSTREAM/RIVERCANAL/DITCHSWAMP/MARSH
WBID 1436# Monitoring Stations
Horseshoe Creek
N
EW
S
Figure 1. Location of Horseshoe Creek (WBID 1436) in the Upper Kissimmee River Basin

Lake Okeechobee Tributaries – Total Maximum Daily Load June 2008
5
3186B
3186C
3186D
31883192C
3505
3505
D
3199B3188A
3209
32063204
32463250
3251 3248
3248A
3253
3247
3244
3238 3238E
3233
3252A
3213C
3213D
3213A
3213B3203
A
3203B
S-191
S-65D
S-65BC
S-65A
C-40C-41
L-59E S-135
S-133
S-154
L-8
S-5A
S-2S-3
S-4
W
ater Conservation Areas Water Conservat i
on A
reas
10 0 10 20 30 40 50 60 70 80 Miles
WaterbodyLAKE/PONDRESERVOIRSEA/OCEANSTREAM/RIVERCANAL/DITCHSWAMP/MARSH
WBIDs (IWR Run 22)TMDL WBIDsLOWP Basin
N
EW
S
Figure 2. Location of Impaired WBIDs below Lake Kissimmee

Lake Okeechobee Tributaries – Total Maximum Daily Load June 2008
6
1.1 Purpose of Report
This document presents TMDLs for pollutants contributing to the 1998 listed impairments (i.e., nutrients, DO, and BOD) in the tributaries to Lake Okeechobee. The tributaries were identified as impaired by nutrients, BOD, and/or DO. Load reductions of Total Phosphorus (TP) and Total Nitrogen (TN) should result in the attainment of the designated use of the streams and not contribute to impairments in downstream waters (i.e., Lake Okeechobee and St. Lucie and Caloosahatchee Estuaries).. A TMDL is also established for BOD in WBID 3186B to meet the applicable water quality criteria.
1.2 Previous Studies in the Lake Okeechobee Watershed
The total phosphorus TMDL for Lake Okeechobee was adopted by FDEP in May 2001 and was approved by EPA in October 2001 (FDEP, 2001a). The TMDL establishes an annual load of 140 Mtons of phosphorus to Lake Okeechobee to achieve an in-lake target phosphorus concentration of 40 ppb in the pelagic zone of the Lake. The target was developed using chlorophyll a as an indicator of algal biomass, which in turn acts as a surrogate for indicating excessive nutrient concentrations. The TMDL is allocated to atmospheric deposition (35 Mtons) and to the sum of all nonpoint surface water inputs to the Lake (105 Mtons). No portion of the TMDL was allocated to point sources. Several point sources exist in the Lake Okeechobee watershed; however, none of these sources discharge directly to Lake Okeechobee. The TMDL report states that attainment of the TMDL will be calculated using a 5-year rolling average of monthly loads calculated from measured flow and concentration values. The 40 ppb goal for the entire pelagic zone is considered a conservative goal that introduces an implicit margin of safety into the TMDL. This reflects the fact that under high lake conditions, total phosphorus concentrations are relatively homogeneous across the open water region, but when lake stages are low, the near shore area displays considerably lower total phosphorus than the open water zone. Hence if 40 ppb is met at the pelagic stations (which represent mid-lake), the total phosphorus concentrations should be below 40 ppb in the near shore area during certain years.
Lake Okeechobee TMDL:
The Lake Okeechobee Protection Act (LOPA, Chapter 00-103, Laws of Florida) was passed by the 2000 Legislature to establish a restoration and protection program of Lake Okeechobee. This is to be accomplished by achieving and maintaining compliance with State water quality standards in Lake Okeechobee and its tributary waters through a watershed-based, phased, comprehensive and innovative protection program designed to reduce phosphorus loads and implement long-term solutions, based upon the Lake’s phosphorus TMDL and considering the establishment of TMDLs for the tributaries of Lake Okeechobee. This program set forth a series of activities and deliverables for the following coordinating agencies: the South Florida Water Management District, the Florida Department of Environmental Protection and the Florida Department of Agriculture and Consumer Services. Elements specifically required by the legislation include a formal Lake Okeechobee
Lake Okeechobee Protection Program: Lake Okeechobee Protection Plan:

Lake Okeechobee Tributaries – Total Maximum Daily Load June 2008
7
Protection Plan (LOPP). The LOPP identifies alternative plans, schedules and costs to meet the established TP TMDL for Lake Okeechobee (LOPP, 2004). The TMDLs contained in this report are considered to be consistent with the LOPP and, therefore, the established Lake Okeechobee TP TMDL.
The original LOPP Project Area was composed of thirty-four basins that define the Lake Okeechobee watershed. The basins are essentially the same as the basins used in the Surface Water Improvement and Management Plan (SWIM). In 2005, the project boundaries were extended to the north to include the Upper Kissimmee River basin. The approximate project boundaries are shown in Figure 1. Often more than one WBID will be contained within an LOPP basin. The location of the original basins relative to the impaired WBIDs is shown in Figure 2. A listing of impaired WBIDs within each LOPP basin and the percent of area these WBIDs encompass is provided in Table 2.
TP loads allocated in the LOPP to the basins are summarized in Table 3. The column, “Target Based on Load,” depicts the loads necessary to achieve the Lake Okeechobee TMDL. The column, “Target Concentration Based on Load,” represents the annual average TP concentration corresponding to the load required at the pore point of each basin to comply with the LOPP.
A comparison of LOPP loads and WBID loads is provided in Table 4. WBID loads are based on a TP concentration of 113 ug/L. This table also identifies some of the control strategies planned for the various LOPP basins (FDEP et. al., 2008). A complete listing of the control strategies planned for the various basins can be found in FDEP’s Lake Okeechobee Watershed Construction Plan (FDEP et. al., 2008). In cases where the loads required by the TMDL for the WBIDs are less than the LOPP load, additional BMPs should be implemented. WBID loads in Table 4 are based on estimated flows as derived in Section 7 of this report. This table indicates that to achieve the LOPP loads, flows may need to be reduced below existing conditions or TP concentrations may need to be reduced below the target, or a combination of both.
Table 2. Comparison of LOPP Basins and Impaired WBIDs
LOPP Basin LOPP Basin Area (acres)
Impaired WBIDs Impaired WBID Area (percentage)
C-40 Basin 43,964 3206 100%
C-41 Basin 94,928 3204 100%
L-59E 14,409 3209 100%
Taylor Creek/Nubbin Slough 120,754 3205, 3205D, 3203A, 3203B, 3213A, 3213B, 3213D
99%

Lake Okeechobee Tributaries – Total Maximum Daily Load June 2008
8
LOPP Basin LOPP Basin Area (acres)
Impaired WBIDs Impaired WBID Area (percentage)
S-135 Basin 25,408 3213C 75%
S-154 Basin 24,630 3199B 38%
S-65 A, B, C, D, E 427,913 3188, 3188A, 3186B, 3186C, 3186D, 3192C
53%
S-65 1,021,674 1436 0.3%
S-2 31,399 3248, 3248A 100%
S-3 9794 3251 100%
S-4 29,164 3246 100%
Note: Impaired WBIDs listed for S-65 basin are Group 4 WBIDs in the Consent Decree schedule.
The Comprehensive Everglades Restoration Plan (CERP) provides a framework and guide to restore the south Florida ecosystem including the Everglades. The conceptual plan for the Lake Okeechobee watershed consists of construction of stormwater treatment areas (STAs) and reservoirs; restoration of wetlands; and removal of phosphorus-laden sediment from tributaries. The Taylor Creek/Nubbin Slough (WBIDs 3505 and 3203A) Reservoir-assisted Stormwater Treatment Area (RASTA) is one of ten initially authorized projects. The SFWMD purchased pastureland located adjacent to Taylor Creek and converted the land to a reservoir suitable for storage and water quality treatment. The Taylor Creek RASTA is estimated to remove about 3 to 5 Mtons of phosphorus each year. The Nubbin Slough STA is constructed wetlands for treating stormwater runoff before it enters Lake Okeechobee. The STA is estimated to remove about 22 to 24 Mtons of phosphorus per year. Other phosphorus reduction projects are planned for the watershed and should result in improved water quality in both the impaired waterbodies and Lake Okeechobee. Details on CERP projects can be found on the CERP webpage (
Comprehensive Everglades Restoration Plan (CERP):
www.evergladesplan.org).
Howard T. Odum investigated phosphorus levels in Florida streams in the 1950’s as part of a Florida Geological Survey study (Odum, 1953). This was one of the first studies in Florida on the behavior of phosphorus in water and the impact it has on aquatic growth. Water samples were collected throughout the state from streams, lakes and springs for the purpose of correlating TP levels in water
Florida Geological Study:

Lake Okeechobee Tributaries – Total Maximum Daily Load June 2008
9
to geological conditions and levels of pollution. A limited number of samples were collected in Lake Okeechobee and Kissimmee River watershed as part of the canals and rivers of south Florida region. In June 1952, TP concentrations based on a limited number of samples in the tributaries ranged from 0.031 ppm in Fisheating Creek; 0.057 ppm in Taylor Creek; 0.060 ppm in the Kissimmee River below Lake Kissimmee; and 0.097 in St. Lucie Canal. While these values are informative, they are too limited (spatially and temporally) to represent historic water quality conditions of the waterbodies.
1.3 Identification of Impaired Waterbodies
The Lake Okeechobee watershed consists of the entire area that contributes surface water flow and total phosphorus (TP) and total nitrogen (TN) loads to Lake Okeechobee. TMDLs for the impaired WBIDs included in this report are located north of Lake Okeechobee, and represent the largest contribution of flow and nutrients to the lake. The following watershed descriptions are taken from the Basin Status Reports developed by FDEP.
Land cover distribution cited in the planning unit descriptions is from 1999 color infrared imagery downloaded from the SFWMD web page. The LOPA requires that “Prior to authorizing a discharge into works of the District, the District shall require responsible parties to demonstrate that proposed changes in land use will not result in increased phosphorus loading over that of existing land uses.” Table 5 is a summary of land cover in the impaired WBIDs.
1.3.1 Lake Okeechobee Basin
Lake Okeechobee is a large, shallow eutrophic lake located in south central Florida that is designated a Class I water (potable water supply). The lake is the largest body of freshwater in the southeastern United States and covers a surface area of 730 mi2
The surface hydrology in the Lake Okeechobee watershed is largely governed by man-made systems. A system of encircling levees impounds the Lake’s waters, creating a reservoir used for navigation, water supply, flood control, and recreation. Pumping stations and control structures in the levees along Lake Okeechobee are designed to move water either into or out of the Lake as needed,
with an average depth of 8.6 ft. The Lake is a major feature of the Kissimmee-Okeechobee-Everglades system, which is a continuous hydrologic system extending from Central Florida south to Florida bay. The watershed of the Lake stretches from just south of Orlando to areas that border the Lake on the south, east and west and covers 3.5 million acres. The Lake provides a number of values to society and nature including water supply for agriculture, urban areas, and the environment; flood protection; a multi-million dollar sport fishery; and habitat for wading birds, migratory waterfowl, and the federally endangered Everglades Snail Kite. These values of the lake have been threatened in recent decades by excessive phosphorus (P) loading, harmful high water levels, and rapid expansion of exotic plants (FDEP, 2001b). Two hundred years ago, a large percentage of the lake bottom may have been covered with sand. Today organic mud overlies much of the bottom. The upper 10 centimeters of that mud are estimated to contain more than 30,000 Mtons of phosphorus. The rate of mud sediment accumulation and phosphorus deposition has increased significantly over the past 50 years.

Lake Okeechobee Tributaries – Total Maximum Daily Load June 2008
10
permitting water levels to fluctuate greatly with flood and drought conditions and the demand for water (see Figure 3). The major inflows into the Lake include rainfall (39 percent), the Kissimmee River (31 percent), and numerous smaller inflows (all 5 percent or less) from Fisheating Creek, and Taylor Creek/Nubbin Slough (TCNS), and numerous smaller inflows, such as discharges from the Everglades Agricultural Area. Major outflows include evapotranspiration (66 percent), the Caloosahatchee River to the west (12 percent), the St. Lucie Canal (C-44) to the east (4 percent), and four major agricultural canals (the Miami, New River, Hillsboro, and West Beach Canals) that drain south and southeast (18 percent).
The Lake Okeechobee Tributaries that directly affect the Lake are included in the Lake Okeechobee Basin, St. Lucie-Loxahatchee Basin, Upper Kissimmee and Fisheating Creek Basin, Caloosahatchee River Basin and the Everglades Basin. The Lake Okeechobee Basin is divided into three planning units: the CTP Complex, the TOL63 Complex and the NHLMS Complex. The following description of the planning units is from the SFWMD Lake Okeechobee Basin Status Report (FDEP, 2001b).

Lake Okeechobee Tributaries – Total Maximum Daily Load June 2008
11
Table 3. Summary of TP Loads Discharging into Lake Okeechobee (SFWMD, 2004) LOWP Design Loads
(Mtons/yr) Basin LOPP
Implementation AREA (acres)
Average Annual Discharge (1991-2000) (Acre-ft)
Average Annual P Load (1991-2000) (Mtons)
Target Load Based on Flow (Mtons)
Target Based on Load (Mton)
Target conc. based on flow (ug/L)
Target conc. based on load (ug/L)
Alt 1 through 6 (Higher of Remain. Load, Adjusted Remain. Load, and targets)
Alt 1 through 7 (Higher of Remain. Load, Adjusted Remain. Load, and targets)
715 Farms (Culv 12A) 3,295 12,045 1.67 0.56 0.41 37.91 27.32 0.59 0.59 C-40 Basin (S-72) 43,964 16,266 9.58 0.76 2.32 37.91 115.81 6.98 6.02 C-41 Basin (S-71) 94,928 49,799 25.45 2.33 6.17 37.91 100.49 17.14 13.82 S-84 Basin (C41A) 58,488 51,791 9.06 2.42 2.20 37.91 34.40 6.47 5.31 S-308C (St. Lucie-C-44) 129,428 55,880 11.23 2.61 2.72 37.91 39.53 9.86 8.09 East Beach DD (Culv 10) 5,275 11,815 8.73 0.55 2.12 37.91 145.35 2.12 2.12 East Shore DD (Culv 12) 8,416 14,432 3.10 0.67 0.75 37.91 42.24 0.89 0.89 Fisheating Creek 289,366 200,766 40.97 9.38 9.93 37.91 40.13 32.99 31.81 Industrial Canal 8,232 23,337 2.99 1.09 0.73 37.91 25.23 2.24 2.24 L-48 Basin (S-127) 20,774 23,040 6.58 1.08 1.59 37.91 56.14 5.03 4.97 L-49 Basin (S-129) 12,093 13,189 1.69 0.62 0.41 37.91 25.18 1.31 1.29 L-59E 14,409 6,395 1.48 0.30 0.36 37.91 45.55 1.20 1.20 L-59W 6,440 8,319 1.93 0.39 0.47 37.91 45.74 1.55 1.55 L-60E 5,038 1,236 0.25 0.06 0.06 37.91 39.20 0.21 0.21 L-60W 3,271 419 0.07 0.02 0.02 37.91 31.67 0.05 0.05 L-61E 14,286 6,997 1.13 0.33 0.27 37.91 31.80 0.93 0.93 L-61W 13,567 10,646 1.27 0.50 0.31 37.91 23.39 1.08 0.90 Taylor Creek/Nubbin Slough (S-191)
120,754 101,946 78.40 4.77 19.01 37.91 151.22 24.03 19.01
S-131 Basin 7,164 9,490 1.28 0.44 0.31 37.91 26.58 0.89 0.83 S-133 Basin 25,660 26,478 6.99 - 1.69 0.00 51.92 5.13 4.62 S-135 Basin 18,089 25,408 3.39 1.19 0.82 37.91 26.25 2.62 2.29 S-154 Basin 33,798 24,630 23.59 1.15 5.72 37.91 188.33 8.36 5.72 S-2 106,044 31,399 8.16 1.47 1.98 37.91 51.12 1.98 1.98

Lake Okeechobee Tributaries – Total Maximum Daily Load June 2008
12
LOWP Design Loads (Mtons/yr)
Basin LOPP Implementation AREA (acres)
Average Annual Discharge (1991-2000) (Acre-ft)
Average Annual P Load (1991-2000) (Mtons)
Target Load Based on Flow (Mtons)
Target Based on Load (Mton)
Target conc. based on flow (ug/L)
Target conc. based on load (ug/L)
Alt 1 through 6 (Higher of Remain. Load, Adjusted Remain. Load, and targets)
Alt 1 through 7 (Higher of Remain. Load, Adjusted Remain. Load, and targets)
S-3 64,630 9,794 2.33 0.46 0.56 37.91 46.73 0.56 0.56 S-4 39,673 29,164 6.87 1.36 1.67 37.91 46.35 1.67 1.67 S-65A,B,C,D,E 427,913 291,845 79.41 13.64 19.25 37.91 53.50 25.02 19.25 South FL Conservancy DD (S-236)
2,364 10,345 1.42 0.48 0.34 37.91 26.92 0.57 0.57
South Shore/So. Bay DD (Culv 4A)
2,947 8,151 1.07 0.38 0.26 37.91 25.87 0.40 0.40
Nicodemus Slough (Culv 5)
25,641 3,371 0.25 0.16 0.06 37.91 14.54 0.20 0.20
S65 (Lake Kissimmee) ** 1,021,674 856,146 69.95 40.02 16.96 37.91 16.07 52.46 52.46 Lake Istokpoga (S-68)** 393,276 247,718 14.95 11.58 3.62 37.91 11.87 14.95 14.95 S5A Basin (S-352-WPB Canal)
120,798 11 0.00 0.00 0.00 37.91 59.91 0.00 0.00
East Caloosahatchee (S-77) ***
200,993 205 0.01 0.01 0.00 37.91 12.13 0.01 0.01
L-8 Basin (Culv 10A) 108,402 63,865 7.81 2.99 1.89 37.91 24.06 6.98 6.53 Total 3,451,087 2,246,336 433.09 103.76 105.00 37.46 37.91 236.49 213.03

Lake Okeechobee Tributaries – Total Maximum Daily Load June 2008
13
Table 4. Comparison of LOPP and WBID Loads
LOPP Basin LOPP Load1 (Mtons/yr)
WBID(s) Load2 (Mtons/yr)
Basin Implementation Strategies to Reduce TP Loads3
S-65A, B, C, D, E 19.25 40.65 Kissimmee River Restoration Project; Kissimmee Reservoir; Istokpoga Canal RASTA; Kissimmee East Storage; and alternative water storage facilities (Kissimmee Prairie State Park)
Taylor Creek Nubbin Slough (S-191 Basin)
19.01 14.20 Impaired WBIDs discharge to TCNS Critical Project STA; and Brady Ranch STA (located in TCNS basin) receive discharge; Taylor Creek STA (planned to receive flows from Taylor Creek and Kissimmee East Reservoir); TCNS Reservoir; and other nutrient control technologies
C-40 Basin 2.32 2.27 Discharge from basin to be routed to Istokpoga Reservoir and STA before entering the lake
C-41 Basin 6.17 6.94 Discharge from basin to be routed to Istokpoga Reservoir and STA before entering the lake; Seminole Brighton aquifer storage and recovery (ASR) wells planned
L-59E Basin 0.36 0.89 Discharge from basin to be routed to Istokpoga Reservoir and STA before entering the lake; Paradise Run 10 ASR Well System
S-135 Basin 0.82 2.66 Discharge from the basin will be routed to Lakeside Ranch STA (located in TCNS basin)
S-154 Basin 5.72 1.31 Priority basin for TP reductions through BMPs; deep well injection
S-65 Basin 16.96 3.75 Discharge from basin flows into Lake Kissimmee and then through downstream restoration areas before flowing into the lake.

Lake Okeechobee Tributaries – Total Maximum Daily Load June 2008
14
Notes: 1) LOPP loads are the sum of all allowable loads discharging from the WBID(s) comprising an LOPP basin as described in the LOPP report. 2) WBID loads calculated by EPA and provided in this TMDL report are based on estimated annual average discharge from the WBID(s) comprising an LOPP basin and a TP target concentration of 113 ug/L. The WBID loads assume the peak flow is not reduced; however, this and/or a reduction in TP concentration may be necessary in order to achieve the LOPP load. 3) The BMPs and the source control regulatory programs identified in the LOPP will be implemented throughout the entire watershed.
Figure 3. Control Structures and Sampling Stations in Lake Okeechobee
The NHLMS Complex includes Nubbin Slough (WBID 3203A), Henry Creek (WBID 3213B), Lettuce Creek (WBID 3213A), Mosquito Creek (WBID 3203B), Myrtle Slough (WBID 3213D), and waters within the drainages leading to the South Florida Water Management District’s structures S-135 (WBID 3213C) and S-153 (WBID 3219). These structures do not have NPDES permits and are not assigned WLAs in this TMDL. The NHLMS Complex covers about 131 square miles and contains about 29 miles of streams. It consists of a collection of small tributary streams along the
NHLMS Complex:

Lake Okeechobee Tributaries – Total Maximum Daily Load June 2008
15
northeast shore of Lake Okeechobee that once flowed directly into the lake but the tributaries are now intercepted by canals prior to reaching the Hoover Dike/Levee. Land uses in all WBIDs include dairies, pasture, and low-density residential housing.
Flows in Mosquito Creek, Nubbin Slough, Henry Creek, Lettuce Creek and Myrtle Slough are intercepted by the L-63 Canal, which transports water to the rim canal and the S-191 structure, which ultimately discharge into the lake (see Figure 4). Mosquito Creek is four miles long and flows from northeast to southwest. Nubbin Slough is about 7 miles long and flows to the southwest. Henry Creek is four miles long and flows from northeast to southwest. Lettuce Creek is located on the northeast side of Lake Okeechobee and near the small community of Upthegrove Beach. The surface of the shallow, turbid, eutrophic creek is covered with dense mats of aquatic plants. Myrtle Slough is about 4 miles long and flows to the southwest. The slough is part of a network of interconnecting small canals constructed to drain a low-lying area so that it may be used for agricultural purposes, mostly pastures. High levels of inorganic nitrogen have been measured in the slough indicative of runoff containing animal waste.
To achieve the load at the pore point of the LOPP basin, water discharging from the impaired WBIDs will be routed through Stormwater Treatment Areas (STAs) in the TCNS basin prior to discharging into Lake Okeechobee. Additional BMPs such as edge-of-field/farm (EOF) treatment technologies have been implemented in the basin to control high nutrient concentrations discharging from agricultural practices in the WBIDs. Innovative nutrient control technologies such as construction of an algal turf scrubber nutrient recovery facility is planned to reduce nutrient loadings from the basin.
The CTP Complex includes the S-154 basin and part of the S-133 basin. It covers about 86 square miles and contains about 11 miles of streams. Chandler Hammock Slough (WBID 3199B), located in the S-154 basin, is the only impaired WBID on the 1998 303(d) list within the CTP Complex. Chandler Hammock Slough flows southward into Turkey Slough (WBID 3199A), which flows into Popash Slough (WBID 3205C). The rim canal around Lake Okeechobee collects the flow from these connected sloughs (see
CTP Complex:
Figure 3). Depending on lake stage, water can flow from the rim canal into the lake through hurricane gate structure 6. Water can also be pumped through S-133 into the lake. Land cover in Chandler Hammock Slough is predominately agriculture, accounting for approximately 83% (or 10,645 acres) of land, followed by wetlands (1584 acres or 12.3%) and pasture (491 acres or 3.8%).
The LOPP identifies the S-154 Basin as a priority basin for TP reductions through BMPs. FDEP is considering deep well injection as an option for achieving additional TP reductions in the basin; however, at this time this option is conceptual.

Lake Okeechobee Tributaries – Total Maximum Daily Load June 2008
16
The TOL63 Complex covers 108 square miles and contains 45 miles of streams and canals, and includes part of the S-191 basin and the eastern portion of the S-133 basin. Taylor Creek (WBID 3205) and Otter Creek (WBID 3205D), located in the S-191 basin are the two impaired WBIDs within the complex. Otter Creek flows about 3.5 miles southwesterly before joining Taylor Creek. Taylor Creek is 29 miles long. Flows from Taylor Creek are diverted into the L-63 North Canal (WBID 3203C) at structure S-192 north of the town of Okeechobee. The Taylor Creek channel below the S-192 diversion carries flow in a southeast direction until it reaches the rim canal (C-59) and discharges by gravity into Lake Okeechobee at structure S-191 (see
TOL63 Complex:
Figure 4). Land cover in Taylor and Otter creeks is predominately agriculture, followed by wetlands and pastures.
The primary strategy in the LOPP for controlling phosphorus from Taylor Creek (WBID 3505) and Otter Creek (WBID 3505D) has been the implementation of basin-wide BMPs. According to the LOPP, Level I BMPs have resulted in about a 30 percent reduction basin-wide in phosphorus concentration and loads. All dairies within the impaired watersheds are required to comply with the DER Dairy Rule. FDEP anticipates further phosphorus reductions will be achieved through the routing of stormwater through the Taylor Creek STA. A 30,000 acre-feet (ac-ft) reservoir is planned to intercept flow from the Taylor Creek watershed, resulting in additional phosphorus reductions.

Lake Okeechobee Tributaries – Total Maximum Daily Load June 2008
17
Figure 4. Taylor Creek and Nubbin Slough Basins
1.3.2 Kissimmee River Basin
The Kissimmee River Basin flows into Lake Okeechobee and is part of the Everglades ecosystem. The Kissimmee River Basin is 2,940 square-miles and extends from Orlando southward to Lake Okeechobee. The Kissimmee River is the largest source of surface water to Lake Okeechobee, is about 105 miles long and has a maximum width of 35 miles. The Kissimmee River Basin contains four planning units: Upper Kissimmee, Lower Kissimmee, Lake Istokpoga, and Lake Placid. None of the impaired WBIDs discussed in this report are within either the Lake Istokpoga or Lake Placid basins. A discussion of water quality in these basins can be found in the Kissimmee River and Fisheating Creek Basin Status Report (FDEP, 2004).
Lake Kissimmee is the geographic divide between the Upper and Lower Kissimmee planning units. Lake Kissimmee outflow is regulated through structure S-65. Based on flow data from 1972 through April 30, 2005, the annual average outflow from the lake was 719,120 acre-ft (FDEP, 2006). During the 2004 hurricane season the flow volume from the lake was over 1.9 times the historical average flow.

Lake Okeechobee Tributaries – Total Maximum Daily Load June 2008
18
The Upper Kissimmee Planning Unit includes portions of Orange, Osceola, and Polk Counties from Orlando southward to the southern tip of Lake Kissimmee. Hundreds of lakes, ranging in size from small sinkholes to large lakes dot the planning unit. The many lakes and swampy areas in the planning unit provide a relatively large storage capacity which retards drainage and results in relatively slow runoff rates. Water in the planning unit generally flows southward to Lake Kissimmee, then onward to Lake Okeechobee via the Kissimmee River (a.k.a. C-38 Canal). Horseshoe Creek (WBID 1436) is the only WBID in the Upper Kissimmee Planning Unit addressed in this report and represents less than 1% of the drainage area in the planning unit.
Upper Kissimmee Planning Unit:
Horseshoe Creek is located west of Reedy Creek in the northeastern part of Polk County. The upstream half of the creek is channelized, fed by a number of small canals dug to drain wetlands. The lower half of the creek is unmodified. Discharge from the creek flows to a portion of the Reedy Creek swamp known as the Huckleberry Islands, an extensive wetland area in Osceola County connecting Reedy and Snell Creeks. The city of Davenport is located south of Horseshoe Creek. The creek drains a predominantly agricultural area; however, urbanized areas, especially some medium density residential areas, are primarily located in the southern part of the drainage basin.
The Lower Kissimmee Planning Unit is 722 square miles and encompasses portions of Polk, Osceola, Highlands, and Okeechobee Counties. There are no significant urban areas in the planning unit as the area is entirely rural in nature; however, portions of an active military bombing test range (Avon Park Air Force Range) is located in the northern portion of the planning unit near the Polk-Highland County line. Impaired WBIDs in the planning unit include: Kissimmee River (WBIDs 3209 and 3186B), Blanket Bay Slough (WBID 3186C), and Eight Mile Slough (WBID 3186D), Oak Creek (WBID 3192C), Farm Area (WBID 3188), and Chandler Slough (WBID 3188A). Land cover in these WBIDs is predominately agriculture followed by wetlands.
Lower Kissimmee Planning Unit:
Historically, the Kissimmee River meandered approximately 103 miles with a 1- to 2-mile-wide floodplain. During the historic period of hydrologic record (1934-1960) the river moved very slowly, with normal river velocities averaging less than 2 feet per second. A severe hurricane occurred within the basin in 1947 resulting in extensive property damage from flooding. The State responded with a request to the federal government to design a flood control plan for central and southern portion of the state. Between 1962 and 1971, the Kissimmee River was channelized and transformed into a series of impounded reservoirs. Inflow from the basin was regulated by six water control structures (S-65 and S-65 A, B, C, D, and E). The Upper Kissimmee Basin (S-65) and Kissimmee River (S-65A, B, C, D, E Basin) contribute about 51 percent of the total surface water inflow to Lake Okeechobee, over 1.1 million acre-feet per year. These basins also contribute 34 percent of the phosphorus load to the lake.
The Kissimmee River Restoration and the Kissimmee River Headwater Revitalization projects were jointly authorized in the 1992 Water Resources Development Act (FDEP, 2006). The primary goal

Lake Okeechobee Tributaries – Total Maximum Daily Load June 2008
19
of the Kissimmee River Restoration project is to reestablish the ecological integrity of the river-floodplain system. Restoration efforts require reconstruction of the physical form of the river and reestablishment of pre-channelization hydrologic conditions. Once the project is complete, water quality improvements should be achieved in the WBIDs in the S-65 A, B, C, D, and E basins.
The primary purpose of the Kissimmee River Headwater Revitalization Project is to provide the water storage and regulation schedule modifications needed to approximate the historical flow characteristics of the Kissimmee River system. Structures and canals in the upper basin will be modified to accommodate the increased capacity associated with the increased lake storage volumes needed to fully meet the requirements of the restoration.
The primary strategy identified in the LOPP for controlling phosphorus from the impaired WBIDs has been the implementation of basin-wide BMPs targeted at agricultural activities. The Kissimmee River Restoration project should improve the assimilation capacity of the Kissimmee River resulting in reduced nutrient loads discharging into Lake Okeechobee. One management alternative being considered by FDEP is a Kissimmee Reservoir project for the Lower Kissimmee Basin designed to receive flows from and discharge back to the Kissimmee River. This reservoir will result in some phosphorus reductions. Stored water can potentially be diverted to STAs in the TCNS basin for treatment resulting in additional phosphorus reductions.
1.3.3 Fisheating Creek Basin
The Fisheating Creek Basin is located to the west of Lake Okeechobee, adjacent to the Kissimmee River Basin and is part of the Everglades ecosystem. The basin is about 849 square miles and extends from west central Highlands County southward into northern portion of Glades County, and then eastward towards Lake Okeechobee. The basin includes two planning units: Fisheating Creek and Northwest Lake Okeechobee. Of the five major basins draining into Lake Okeechobee, Fisheating Creek is the least impacted by humans in terms of hydrology and land uses, and still contains many areas suited for preservation (SFWMD, 2004).
There are two stream segments listed as impaired in the Fisheating Creek Basin. Both the Harney Pond Canal (WBID 3204) and Indian Prairie Canal (WBID 3206) are tributaries to Fisheating Creek and are located in the Northwest Lake Okeechobee Planning Unit. Harney Pond Canal and Indian Prairie Canal corresponds to LOPP SWMM basin C-40 and C-41, respectively. Fisheating Creek drains via gravity flow into Lake Okeechobee on the west shore, near Moore Haven. Land cover in the impaired WBIDs is predominately agriculture followed by wetlands.
FDEP is considering a RASTA (Reservoir-Assisted Stormwater Treatment Area) for the Fisheating Creek watershed for the purpose of maximizing TP load reductions and water storage in the LOPP. This RASTA will receive flows from the impaired WBIDs as well as other tributaries draining to Fisheating Creek. This reservoir could potentially store lake waters, if necessary. BMPs targeted at agricultural activities continue to be the primary strategy for reducing phosphorus loadings from the basin.

Lake Okeechobee Tributaries – Total Maximum Daily Load June 2008
20
1.3.4 Everglades Agricultural Area (EAA)
The EAA is comprised of highly productive agricultural land located directly south of Lake Okeechobee within eastern Hendry and western Palm Beach counties. The drainage system of the EAA is a complicated network of canals, levees, control structures and pumps. The low topographic relief and the wide seasonal variation in rainfall within the EAA necessitate extensive drainage during the wet season and irrigation during the dry season. TMDLs are finalized for EAA WBIDs 3248, 3251, and 3246. Three major pump stations (i.e., S-2, S-3 and S-4) are located in these WBIDs. The TMDLs allocate the allowable load for pumping stormwater into Lake Okeechobee and do not allocate loads for water flowing south into the Everglades for WBIDs 3248 and 3251or into the Caloosahatchee River for WBID 3246. The pump stations are not required to obtain National Pollutant Discharge Elimination System (NPDES) permits and are, therefore, not assigned WLAs in these TMDLs.

Lake Okeechobee Tributaries – Total Maximum Daily Load June 2008
21
Table 5. Summary of Land Cover in Impaired WBIDs
WBID
Res
iden
tial
Com
mer
cial
, In
dust
rial
, Pu
blic
Agr
icul
ture
Ran
gela
nd
Fore
st
Wat
er
Wet
land
s
Bar
ren
&
Ext
ract
ive
Tra
nspo
rtat
ion
& U
tiliti
es
Total (acres)
Acres % Acres % Acres % Acres % Acres % Acres % Acres % Acres % Acres %
Lake Okeechobee Basin
3199B 106 0.8 0 0.0 10645 82.6 491 3.8 19 0.2 26 0.2 1584 12.3 0 0.0 21 0.2 12893
3203B 353 5.2 37 0.6 5352 79.6 136 2.0 55 0.8 15 0.2 644 9.6 3 0.0 128 1.9 6724
3213A 49 1.6 26 0.8 2618 83.5 77 2.4 71 2.3 73 2.3 109 3.5 70 2.2 42 1.3 3135
3213B 400 2.5 25 0.2 11410 71.2 151 0.9 832 5.2 246 1.5 2703 16.9 134 0.8 129 0.8 16030
3213C 109 0.8 0 0.0 10746 79.1 393 2.9 260 1.9 510 3.8 1056 7.8 508 3.7 0 0.0 13582
3213D 13 0.1 0 0.0 11945 73.0 856 5.2 1583 9.7 30 0.2 1767 10.8 20 0.1 146 0.9 16361
3203A 551 3.6 33 0.2 12676 82.7 510 3.3 44 0.3 121 0.8 1203 7.8 121 0.8 74 0.5 15332
3205 2003 3.8 792 1.5 41876 78.9 1958 3.7 1252 2.4 594 1.1 4402 8.3 96 0.2 76 0.1 53049
3205D 34 0.3 42 0.4 8499 86.1 263 2.7 97 1.0 48 0.5 405 4.1 87 0.9 400 4.0 9875
Kissimmee River Basin
3209 14 0.1 65 0.4 9723 67.5 88 0.6 51 0.4 805 5.6 2699 18.7 970 6.7 0 0.0 14414

Lake Okeechobee Tributaries – Total Maximum Daily Load June 2008
22
WBID
Res
iden
tial
Com
mer
cial
, In
dust
rial
, Pu
blic
Agr
icul
ture
Ran
gela
nd
Fore
st
Wat
er
Wet
land
s
Bar
ren
&
Ext
ract
ive
Tra
nspo
rtat
ion
& U
tiliti
es
Total (acres)
Acres % Acres % Acres % Acres % Acres % Acres % Acres % Acres % Acres %
3186B 1590 2.3 106 0.2 31778 46.9 10356 15.3 8165 12.1 521 0.8 14539 21.5 591 0.9 43 0.1 67689
3186C 6 0 0 0.0 12389 76.5 127 0.8 30 0.2 30 0.2 3622 22.4 0 0.0 0 0.0 16203
3186D 0 0 0 0.0 3059 12.5 8863 36.1 8385 34.2 4 0.0 4194 17.1 13 0.1 0 0.0 24518
3192C 0 0 0 0.0 8784 85.0 0 0.0 0 0.0 0 0.0 1551 15.0 0 0.0 0 0.0 10335
3188 297 0.3 2 0.0 57417 58.3 15793 16.0 1217 1.2 1216 1.2 21937 22.3 516 0.5 91 0.1 98485
3188A 29 0.3 6 0.1 7383 69.1 6 0.1 130 1.2 58 0.5 3005 28.1 52 0.5 12 0.1 10680
1436 255 8.5 6 0.2 1305 43.4 729 24.3 42 1.4 113 3.7 348 11.6 50 1.7 158 5.2 3004
Fisheating Creek Basin
3204 898 0.9 42 0.0 70990 73.9 4845 5.0 3177 3.3 783 0.8 13994 14.6 1258 1.3 126 0.1 96114
3206 36 0.1 8 0.0 37629 84.7 19 0.0 442 1.0 472 1.1 5406 12.2 388 0.9 6 0.0 44406
Everglades Agricultural Area
3248 444 0.7 451 0.7 62306 95.4 168 0.3 4 0.0 476 0.7 454 0.7 439 0.7 593 0.9 65336
3251 65 0.1 43 0.1 63148 97.7 39 0.1 43 0.1 397 0.6 335 0.5 513 0.8 56 0.1 64638

Lake Okeechobee Tributaries – Total Maximum Daily Load June 2008
23
WBID
Res
iden
tial
Com
mer
cial
, In
dust
rial
, Pu
blic
Agr
icul
ture
Ran
gela
nd
Fore
st
Wat
er
Wet
land
s
Bar
ren
&
Ext
ract
ive
Tra
nspo
rtat
ion
& U
tiliti
es
Total (acres)
Acres % Acres % Acres % Acres % Acres % Acres % Acres % Acres % Acres %
3246 1815 4.3 1134 2.7 35397 82.9 679 1.6 437 1.0 673 1.6 1163 2.7 408 1.0 1000 2.3 42706

Lake Okeechobee Tributaries – Total Maximum Daily Load June 2008
24
2 STATEMENT OF WATER QUALITY PROBLEM
Section 303(d) of the Clean Water Act requires states to submit to the Environmental Protection Agency (EPA) lists of waters that are not fully meeting their applicable water quality standards. FDEP has developed such lists, commonly referred to as § 303(d) lists, since 1992. As part of that process, tributaries in the Lake Okeechobee watershed were included on Florida’s 1998 § 303(d) list as impaired by excess nutrients, depressed dissolved oxygen (DO), and BOD.
The most common water quality problems in the Lake Okeechobee Basin are elevated levels of nutrients and low DO. TP and TN levels are higher than statewide medians, and most of the DO observations fall below the 5.0 mg/l water quality criterion. Many of the impaired waterbodies have been channelized or are canals. In constructed waterbodies it is difficult to consistently meet DO standards developed for natural water systems. In addition, there is an ongoing aquatic weed control program in the basin, which is necessary to allow the waterbodies to efficiently transport water; however, this exacerbates DO problems due to the decaying plant material.
In addition to nutrients and BOD, water temperature, flow velocity, and sediment oxygen demand (SOD), can influence the DO concentration in a creek. Temperature can influence DO concentration by influencing the solubility of DO in the water, the metabolic activities of organisms (for example, respiration rate), and to a lesser extent, the rates at which oxygen consumption chemical reactions are taking place (organic materials oxidization). Theoretically, the difference in water temperature at different stations can be caused by differences in canopy coverage. SOD data were not available in the impaired WBIDs. Flow velocities can influence the accumulation of organic sediments, the DO reaeration, and water residence time in a given creek. Many of the impaired WBIDs are characterized as wide swampy areas, which diminish the momentum of the stream flow and cause the flow velocity to decrease resulting in depressed DO concentrations.

Lake Okeechobee Tributaries – Total Maximum Daily Load June 2008
25
3 WATER QUALITY STANDARDS
Water quality criteria established by the State of Florida are described in the Florida Administrative Code (F.A.C.), Section 62-302.530. The individual criteria should be considered in conjunction with other provisions in water quality standards, including Section 62-302.500 F.A.C. [Surface Waters: Minimum Criteria, General Criteria] that apply to all waters unless alternative or more stringent criteria are specified in F.A.C. Section 62-302.530.
Lake Okeechobee tributaries are Class III water bodies, with a designated use of recreation and propagation and maintenance of a healthy, well-balanced population of fish and wildlife. The Class III water quality criteria applicable to the impairment addressed by this TMDL are the DO criterion, BOD criterion and the narrative nutrient criterion.
3.1 Nutrient Criterion
Florida’s existing nutrient criterion is narrative, as follows:
(62-302.530(48)(a) F.A.C.): The discharge of nutrients shall continue to be limited as needed to prevent violations of other standards contained in this chapter. Man induced nutrient enrichment (total nitrogen and total phosphorus) shall be considered degradation in relation to the provisions of Section 62-302.300, 62-302.700, and 62-4.242, F.A.C.
(62-302.530(48)(b) F.A.C.): In no case shall nutrient concentrations of a body of water be altered so as to cause an imbalance in natural populations of aquatic flora or fauna.
It should be noted that FDEP has efforts ongoing to develop numeric criteria for nutrients applicable to inland waters which are expected to be adopted into state water quality standards at a future date according to a schedule described in the State of Florida’s Numeric Nutrient Criteria Development Plan (FDEP, 2007a).
Accordingly, in the interim, before numeric nutrient criteria are developed and adopted, nutrient TMDL targets are developed as translations or quantifications of the narrative criterion. Nutrient targets represent the levels below which an imbalance in flora or fauna would be expected to occur.
3.2 Dissolved Oxygen Criterion
The statewide Class III DO criterion for predominantly fresh waters is a minimum DO of 5 mg/l. The narrative nutrient criterion is also applicable as it related to dissolved oxygen via 62-302.530(48)(a) F.A.C., which state that “the discharge of nutrients shall continue to be limited as needed to prevent violations of other standards contained in this chapter.”
The water quality standard for DO also considers the definition of natural background and the directive not to abate natural conditions. Florida standards (62-302.200(15) F.A.C.) state that,

Lake Okeechobee Tributaries – Total Maximum Daily Load June 2008
26
“’Natural Background’ shall mean the condition of waters in the absence of man-induced alterations based on the best scientific information available to the Department. The establishment of natural background for an altered waterbody may be based upon a similar unaltered waterbody or on historical pre-alteration data.” Florida standards also state at 62-302.300(15) F.A.C., “Pollution which causes or contributes to new violations of water quality standards or to continuation of existing violations is harmful to the waters of this State and shall not be allowed. Waters having water quality below the criteria established for them shall be protected and enhanced. However, the Department shall not strive to abate natural conditions.”
Where DO levels are not attaining the statewide water quality criterion of 5 mg/L and a site-specific alternative criterion has not been established, the TMDL targets are required to achieve the loadings and instream concentrations in the waterbody that are considered protective of native aquatic flora and fauna. The TMDL report assumes that any pollutant loadings exceeding natural background could potentially cause a lowering of DO below natural conditions. Because the standard prevents abatement of natural conditions, the TMDL can provide an allocation, where necessary, that results in natural conditions. Therefore, the allocations are being established so that all loading results in natural condition concentrations in the waterbody.
3.3 Biochemical Oxygen Demand Criterion
Florida’s BOD criterion is a narrative standard that “BOD values shall not be increased to exceed values which would cause DO to be depressed below the limit established for each class or a natural condition concentration and, in no case shall it be great enough to produce nuisance conditions” [62-302.530(12)].

Lake Okeechobee Tributaries – Total Maximum Daily Load June 2008
27
4 TARGET IDENTIFICATION
A TMDL is the maximum loading of a pollutant that will attain the applicable water quality standard. Additionally, TMDL allocations must not result in, or contribute to, any violation of other water quality standards for the waterbody or downstream waterbodies.
Nutrients, such as phosphorus and nitrogen, present a special challenge in TMDL development. Nutrients drive a process known as primary productivity that occurs throughout an entire network of interconnected waterbodies. Therefore, TMDLs for nutrients should consider the near-field, intermediate and far-field impacts of excess nutrients and the associated excess biomass. In order to develop nutrient TMDLs for the Lake Okeechobee tributaries that will result in the attainment of applicable water quality standards including protection of downstream uses, these TMDLs address both phosphorus and nitrogen.
4.1 Basis and Rationale For Nutrient Targets
Numeric nutrient targets for this TMDL are developed to be protective of aquatic life in the tributary WBIDs, and the downstream waters of Lake Okeechobee and its subsequent drainage through the St. Lucie Canal and the Caloosahatchee River to their downstream coastal estuaries. The targets of this TMDL will meet the State of Florida’s narrative water quality standard for nutrients which requires levels of nutrients that do not cause an imbalance in natural populations of aquatic flora or fauna and do not produce or contribute to conditions that violate the DO standard, including exceeding natural conditions.
Aquatic life becomes impaired by nutrients when excess amounts of nutrients are expressed in excess primary productivity. Primary productivity refers to the collective actions of plants (autotrophs) to utilize the energy of sunlight through the process of photosynthesis to fix carbon and available nutrients into biomass of living organisms. This is, of course, an essential process on which all plants and animals depend, and it serves as an intersection of the global cycles of critical elements carbon, hydrogen, oxygen, nitrogen, and phosphorus (C, H, O, N, & P).
In aquatic systems, the normal cycles of C, H, O, N, and P can be distorted by anthropogenic activities in the watershed which generate extra N and P that can enter adjacent waterbodies by surface runoff and/or ground water inflow. These excess nutrients will then drive excess primary productivity. This extra accumulated biomass is seen as an over-abundance of aquatic plants, i.e., algal blooms and/or increased macrophyte vegetation. This can produce nuisance conditions which affect aesthetic values and recreation. When certain algal species are involved which are able to produce toxins, as in Harmful Algal Blooms (HABs), human health can be affected by exposure through drinking water, direct contact, or inhalation.
Aquatic life use can be impacted directly by excess algal blooms and/or macrophyte abundance through loss of habitat or other competitive disadvantages. But even more widespread impact occurs indirectly through depression or depletion of dissolved oxygen that occurs when excess primary

Lake Okeechobee Tributaries – Total Maximum Daily Load June 2008
28
production eventually decomposes and creates a demand for dissolved oxygen. This lowers the available oxygen for other aquatic life. Most aquatic life becomes stressed by chronic low oxygen conditions and is virtually eliminated when oxygen depletion persists for a significant period of time. Impairment of aquatic life use is the common result of excess eutrophication of a waterbody.
Primary production in excess results directly from excess available nutrients. As such, protection of aquatic life requires control of available nutrients in order to restrict primary productivity. Productivity may lag introduction of nutrients in time and space, and that fact must be considered when correlating nutrient levels and response. Proximal production may be temporarily suppressed by limitation of light, the amount of one or both nutrients, high velocity/turbulence, or the lack of suitable substrate, but transported bio-available nutrients will be utilized at some point. Whenever excess nutrients are expressed, excess productivity will result adversely affecting aquatic life in that location. The frequency and extent of low oxygen events affects organisms differently; non-motile and long-lived organisms are among the most sensitive.
Primary productivity as a process is driven by a number of factors, and moderated by others. The major nutrients, nitrogen and phosphorus (N and P), along with certain minor nutrients, are required as inputs for intermediary metabolic steps associated with photosynthesis. Since these steps are a series of chemical reactions, their net stoichiometry ultimately determines the utilization of the inputs to the process. These stoichiometric relationships provide some explanation for the ratios originally reported by Redfield, and widely used today to interpret aquatic nutrient dynamics and manage water quality.
The Redfield ratio for nitrogen and phosphorus is given as a molar ratio of N : P = 16 : 1 (or alternately, a weight ratio of N : P = 7.2 : 1). In general practice, a functional range is used with a ratio greater than 30 considered P limited, between 30 and 10 considered co-limited, and less than 10 considered nitrogen limited. This practice allows for a wide mid-range of co-limitation where neither nutrient conclusively controls primary production, and the process can proceed until limited by something else. Limiting nutrient analysis by Redfield ratio comparison can be a useful tool for insight into nutrient limitation, but it should be applied with understanding of its limitations. Appendix A contains calculations of the limiting nutrient in each WBID for existing as well as TMDL conditions.
Limiting nutrient analysis is fundamentally based on “Liebig’s Law of the Minimum,” which is strictly applicable only under steady-state conditions, that is, when inflows balance outflows of energy and materials. The practice of identifying only a single nutrient target to address a problem of excess cultural eutrophication presumes that the system is, and will remain, in steady state equilibrium, an oversimplification whose weakness has been noted before. In 1971, Dr. Eugene P. Odum in Fundamentals of Ecology, stated “Since cultural eutrophication usually produces a highly “unsteady” state, involving severe oscillations (i.e., heavy blooms of algae followed by die-offs, which in turn trigger another bloom on release of nutrients), then the “either/or” argument may be highly irrelevant because phosphorus, nitrogen, carbon dioxide and many other constituents may rapidly replace one another as limiting factors during the course of transitory oscillations. Accordingly, there is no theoretical basis for any “one factor” hypothesis under such transient-state

Lake Okeechobee Tributaries – Total Maximum Daily Load June 2008
29
conditions.”
Further, it is important to realize that the Redfield ratio is a generalization that is thought to capture stoichiometry of reactions that occur inside of cells, and that the actual uptake of nutrients by cells (or organisms), may be moderated by adaptation for things like storage capability/capacity or alternative biochemistry, which, it should be noted, often operate counter to water column Redfield ratios. These adaptations can be particularly effective in highly enriched situations. In addition, aquatic macrophytes can respond differently than algae to nutrient limitation ratios in the water column, and often exactly opposite. This could be important in cases where impairment can involve either algae, macrophytes, or both; and the overall effect on nutrient dynamics should not be underestimated.
Calculation of Redfield ratios from an existing data set of ambient grab samples by averaging over time and space tends to over-simplify the system. While this will effectively characterize a prevailing pattern of nutrient limitation, it may not reflect periods or events of shorter duration when very different nutrient conditions exist. Nutrient dynamics in aquatic systems are complex, with often considerable fluctuation in the water column concentrations of nutrients, and therefore, the ratio of nutrient concentrations varies. As previously noted, over-enriched aquatic systems are not steady state systems; they are dynamic systems, and a very complex dynamic at that.
Traditionally, many nutrient TMDLs have relied on comparing calculated nutrient ratios in available water column data to the Redfield ratio in order to identify the limiting nutrient as a target and then to manage that nutrient over an averaging period to control productivity. Doing so, mistakenly assumes a steady state for the diagnosis, and then again for the application of the remedy. This increases the risk that excess productivity will not always be controlled, and during shifts in limitation, short term events would be allowed within the averaging period that would not sufficiently protect aquatic life use. To illustrate this point, a daily Redfield ratio was calculated for each WBID where both TP and TN measurements were taken. The percent of time the ratio was P-limited, co-limited, and N-limited was calculated by dividing the number of times the WBID was limited by the total number of sampling events. Results of this analysis for existing conditions for those WBIDs impaired for both nutrients and DO are shown in Table 6.
When one nutrient is identified as limiting, by default the other nutrient is identified as the excess nutrient. Transport of un-reacted nutrients, as well as products of excess production, must be considered when determining appropriate protection of downstream waterbody conditions, both immediate downstream and distant downstream. As described above, the expression of bio-available nutrients in primary productivity may be delayed, conditions commonly change over space and time, and nutrient limitation can easily shift. Even short duration events of excess production can very significantly affect forms of aquatic life that cannot be sustained over long term averaging periods.
While aggressive control of one nutrient can restrict productivity, control of both nutrients, N and P, in upstream waters can also provide additional assurance that excess productivity will remain under control. In a highly enriched system, it is important to avoid even brief episodes that can escape the prevailing control during periods of weakened limitation of one nutrient. The resulting additional

Lake Okeechobee Tributaries – Total Maximum Daily Load June 2008
30
biomass is the product of excess productivity initially driven by excess nutrients and should not be ignored. Even if less significant locally, it will be transported downstream, and because it represents additional biomass for instream processing, it may continue to burden the normal dynamics as it cycles, and recycles downstream. This spiraling effect can be underestimated in its effect on aquatic life in the intermediate and far-field.
Under conditions of phosphorus limitation, the excess nutrient, nitrogen, is exported in unreacted state, because there would not have been the opportunity for its uptake in biomass. In such a situation, a strategy where phosphorus reduction alone is relied upon to control the majority of local excess primary productivity, there will be a consequent increase in the export of the excess nutrient, nitrogen. The larger the excess of nitrogen, the greater the contribution to nitrogen sensitive downstream systems; therefore, concurrent reduction of nitrogen in the basin is often warranted in order to protect downstream use. Also, in these situations, there may be additional near-field justification for nitrogen control, arising from the fact that at those times when local primary productivity is being effectively suppressed by applied phosphorous limitation, additional biological uptake of N is restricted, which may leave the chemically reduced constituents of the nitrogen series, i.e., ammonia and organic N, to directly exert their oxygen demand in a setting that is already under oxygen stress.
In a situation where a phosphorus only control strategy has previously been established to limit excess algae and macrophyte growth in a downstream lake, the success of that strategy might be jeopardized by not controlling both nutrients upstream of the lake. If nitrogen inputs to the lake are left uncontrolled, there can remain a risk of excess primary production when residual phosphorus in the lake sediments becomes available, or in localized areas where nitrogen limitation occurs. And in such a situation, if phosphorus levels are expected to remain high for some time, it can be prudent to lower prevailing nitrogen levels. Any uncertainty in the estimation of prevalence of phosphorus limiting conditions would pose greater risk to control if nitrogen is allowed in abundance. It has been observed that primary production in lakes often responds more significantly to phosphorus reduction when nitrogen is also reduced.

Lake Okeechobee Tributaries – Total Maximum Daily Load June 2008
31
Table 6. Existing Limiting Condition in Impaired WBIDs (based on TP and TN data)
WBID Average Condition
Limiting Condition (% of time)
Phosphorus Nitrogen Co-Limited
3186C Co-Limited 4% 50% 46%
3186D P-Limited 73% 8% 19%
3188 N-Limited 19% 40% 42%
3188A Co-Limited 25% 9% 66%
3192C Co-Limited 28% 11% 61%
3199B N-Limited 2% 86% 12%
3203A N-Limited 6% 67% 27%
3203B N-Limited 1% 82% 18%
3205 N-Limited 2% 62% 36%
3205D N-Limited 8% 58% 34%
3213A N-Limited 0.5% 40.3% 59.2%
3213B Co-Limited 15% 37% 48%
3213D N-Limited 2% 83% 16%
3204 Co-Limited 61% 0% 39%
3213C P-Limited 67% 1% 32%
3206 Co-Limited 34% 4% 62%
3209 P-Limited 70% 2% 27%
1436 P-Limited 98% 0% 2%

Lake Okeechobee Tributaries – Total Maximum Daily Load June 2008
32
4.2 Nutrient Target Development
The Lake Okeechobee drainage basin is a highly enriched system with elevated levels of both TP and TN throughout, and conditions of low DO are common in the impaired WBIDs. This is evident from ambient monitoring data and general observations, as well as both quantitative and qualitative evidence in downstream waters. In this situation, control of both TP and TN as nutrient inputs is necessary to prevent adverse impacts of nutrient over-enrichment in both near-field and far-field waters.
A TMDL must have a quantified target for the subject parameter which represents a level that fully supports the designated use of the waterbody in question and does not result in any violation of water quality standards downstream of that waterbody. Florida currently has only narrative water quality standards for nutrients; therefore, determination of appropriate targets for nutrient TMDLs requires a numerical translation of the State’s narrative criteria.
FDEP has invested considerable time and resources in an ongoing effort to develop numeric criteria for nutrients applicable to all inland waters which the State expects to adopt into state water quality standards at some future date. At that time, those criteria will require full EPA review and must be approved by EPA before they are effective for Clean Water Act purposes. Until EPA receives a formal water quality standards submittal of those criteria with sufficient supporting documentation they cannot be determined to be sufficiently protective of the use and otherwise consistent with the CWA.
While FDEP’s criteria development process is ongoing and incomplete, the State offered EPA certain preliminary information for consideration as targets for this TMDL. FDEP adapted the EPA Ecoregion Reference Condition approach, applied it to the Central Peninsula Bioregion, and projected a range of values for TN and TP that the State considers protective of aquatic life in streams of that bioregion (FDEP, 2007b). EPA considers the State’s approach to have considerable technical merit, and while EPA encourages the State to continue refinement of the approach, EPA views the preliminary values projected from the process to represent the best information currently available on a level of nutrients protective of aquatic life in streams of the Central Peninsula Bioregion of Florida. EPA is using these values in conjunction with other factors to assure downstream use protection in choosing appropriate targets for this TMDL.
The reference approach described in the FDEP Technical Support Document (FDEP, 2007b) results in a proposed range of values for TP of 84 ug/L to 128 ug/L; and a range of values for TN of 1.3 mg/L to 2.0 mg/L. In this document, FDEP states that it is very confident the native flora or fauna are fully protected within these ranges of concentrations.
A TP target of 113 ug/L as an annual average concentration within the WBIDs was selected from a range of TP values provided by FDEP to protect aquatic life in the tributaries. To ensure protection of downstream uses, TP loads consistent with those prescribed in the LOPP are assigned at the pore point of the WBIDs comprising an LOPP basin.

Lake Okeechobee Tributaries – Total Maximum Daily Load June 2008
33
A TN target of 1.2 mg/L as an annual average concentration within the WBIDs was selected to protect aquatic life in the tributaries and to protect the downstream uses. This value is slightly below the lower value in the range of TN values provided by FDEP to protect of aquatic life in the tributaries. The lower value of 1.2 mg/L was selected based on an interim TN target for the St. Lucie Estuary of 0.74 mg/L at the Roosevelt Bridge provided by FDEP in a recent (June 3, 2008) memorandum. EPA reviewed TN data from Lake Okeechobee, the C-44 canal and the St. Lucie Estuary to determine a TN target for the tributaries that would achieve the interim TN target proposed by FDEP for the St. Lucie estuary. This target determination takes into account assimilation of TN in the surface water system between Lake Okeechobee and the St. Lucie Estuary and dilution of TN with the tidal system. Based on the best currently available information, a value of 1.2 mg/L annual average TN protects aquatic life in the tributary WBIDs provides protection of downstream uses. Additional information on the derivation of the TN target analysis is provided in Appendix B.
The TMDL report allocates loads to TP and TN. The dissolved inorganic fraction of total nitrogen (i.e., ammonia (NH3) and nitrite-nitrate (NO2-NO3
Use of these values as targets for this TMDL does not, nor should it in any way, be interpreted to constitute an approval, or conditional approval of these values as Florida water quality standards. At this time, EPA’s satisfaction with the use of these values as interim TMDL targets is based on limited information and does not reflect an in-depth review or a judgment of the values as numeric criteria that will, or will not be protective, or otherwise consistent with the CWA.
)) is more immediately bioavailable than organic nitrogen, and therefore, more directly enhances the growth of primary producers such as algae and other plants. Inorganic nitrogen is found in animal wastes, artificial fertilizers, and other anthropogenic sources. Specific controls of dissolved inorganic nitrogen in implementation of this TMDL could be most effective for reducing massive algae blooms that cause severe drops in DO levels.
4.3 Nutrient Target Application
The averages of existing nutrient values for each WBID were used to calculate a Redfield ratio to determine the prevailing nutrient limitation condition of that WBID. There were four P-limited WBIDs, six co-limited WBIDs, and eight N limited WBIDs in the existing conditions scenario. After the P target was applied, all but two WBIDs were P limited with existing levels of N (see Appendix A). However, it is understood that with variation in nutrient concentration the ratio will change and limitation will shift accordingly. Targeting only the limiting nutrient, without addressing the other can be expected to restrain primary production only as long as that nutrient is clearly limiting.
If P is targeted in all WBIDs at a level that will maintain or establish P limitation in each, then excess primary production should be controlled over the averaging period, as long as clear P limitation is maintained throughout the WBID. Under those circumstances, the WBID should be protected in the near-field and P transport reduced downstream to Lake Okeechobee (where primary productivity is to be controlled by a TMDL for P). However, this approach would be incomplete without an

Lake Okeechobee Tributaries – Total Maximum Daily Load June 2008
34
assessment of N for several reasons. Forms of N available for primary productivity can remain in excess and directly exert a negative influence on DO.
High levels of excess N can have a direct effect on DO. During the majority of the time under P limitation, when local primary productivity is being effectively suppressed by control of P, biological uptake of N is restricted. This may leave the chemically reduced constituents of the nitrogen series, i.e., ammonia and organic N, to more directly exert their oxygen demand in WBIDs that are already under oxygen stress.
In many of these WBIDs with high ambient N concentrations there is significant animal agriculture in the watershed, which could be expected to increase the organic N and ammonia fractions of total N delivered to the waterbody. News reports of oxygen depletion fish kills associated with agricultural runoff are easy to find. This potential for increased nitrogenous oxygen demand and allochthonous carbonaceous oxygen demand under P limitation provides justification for concurrent reduction of N. Additional rationale for controlling nitrogen can be found in Appendix C.
In the near field, with P only control, there may also be high levels of N present. Many WBIDs have such significant P limitation precisely because of existing high levels of N. Allowing these high ambient levels of N increases the risk of failure of the control scheme. The strength of P limitation can be expected to vary during the averaging period, and shifts to co-limiting conditions with high N present may result in loss of control of primary production. During these times, events of short duration could significantly affect aquatic life. In order to minimize the risk of water quality standards violation, concurrent control of N may be warranted in these WBIDs.
Additionally, N can, or will be, the excess nutrient in all P limited WBIDs, and as such remains in the watershed for transportation downstream while productivity is restrained by P control. The far-field effects of exported N from WBIDs under P only control must be considered if downstream uses are to be adequately protected. Under conditions of P limitation, with local excess primary production controlled to a large extent by P reductions alone, there will be consequent export of the excess nutrient, N, which will impact nitrogen sensitive downstream systems. Without concurrent control, the larger the excess of N, the greater will be the impact.
There are documented nutrient impairments in the downstream estuaries of the St. Lucie (USEPA, 2006) and the Caloosahatchee River (SFWMD, 2005) with excess nitrogen loading attributed to discharge from Lake Okeechobee. To avoid contributing to violations of water quality standards in these downstream waters, concurrent control of N is warranted. With control targets for tributaries based upon estimations of least impacted conditions, levels may approach a natural background condition which would be acceptable for transport to Lake Okeechobee.
4.4 DO and BOD Target
In waterbodies listed for both nutrients and DO, controlling nutrients should result in improved DO conditions. In most of the WBIDs, insufficient data are available to correlate elevated BOD concentrations with depressed DO levels, with the exception of WBID 3186B which is listed for DO

Lake Okeechobee Tributaries – Total Maximum Daily Load June 2008
35
and BOD and not nutrients. In that case, a regression analysis between DO and BOD was performed using the limited data available in the WBID. The analysis was conducted at both a single station and using all data collected in the WBID. The correlation is stronger at a single station rather than the results obtained when all data are used in the analysis. Although DO and BOD measurements are collected at several stations within the WBID, only data collected at Station 21FLSFWMKRFNC38 include times when DO criteria are achieved in the stream. This station is located upstream of Kissimmee River Restoration project and was the only station where a range of BOD and DO measurements were collected. The data were filtered to remove non-detect samples. Using the trend line equation shown on this plot, the BOD concentration corresponding to the DO criterion of 5 mg/l is about 2.36 mg/l and is used as the target in this WBID. Details of the BOD target calculation are provided in Appendix D.
Elevated chlorophyll levels are an indication of nutrient productivity; however, insufficient data are available in most WBIDs to indicate a correlation between these parameters. An assumption in these TMDLs is DO conditions should improve when management strategies are implemented to return nutrients loadings to natural background levels.

Lake Okeechobee Tributaries – Total Maximum Daily Load June 2008
36
5 WATER QUALITY RESULTS
Data collected during the Group 4 listing cycle were used to assess water quality in the impaired waterbodies to determine if the waterbody is impaired and if a TMDL is needed. EPA confirmed the impairment status using FDEP’s current assessment methodology contained in the Impaired Waters Rule (IWR) and determined that TMDLs are needed in the impaired WBIDs. Data compiled in IWR Run 24 were used in the data analysis and are summarized in Table 7 and Table 8. This covers water quality data collected between 1993 and 2004. For WBIDs listed for nutrients, TN, TP, chlorophyll-a and unionized ammonia data are reported. A summary of BOD and DO data for WBIDs listed for DO is shown in Table 8.
WBIDs 3186B and 3186D are listed for DO and/or BOD. Samples collected at the same station and on the same day and analyzed for DO, BOD, Chl-a, TP, TN, and temperature are plotted to determine a correlation, if any, between these parameters. Select correlation plots for WBID 3186B and 3186D are provided in Appendix E. As expected, DO has a negative correlation with temperature, most likely a benefit of tree canopy. In these WBIDs, DO does not have a strong correlation with Chl-a or any of the nutrient parameters.
WBID 3186D does not have sufficient data collected at any station to correlate depressed DO concentrations with either BOD or chlorophyll-a. Chlorophyll concentrations measured in the WBID are low (maximum value is 6 µg/l) and would not be indicative of nutrient rich waters. WBID 3186D is predominately forest and rangeland. The correlation between DO and TN for WBID 3186D is shown in Appendix E. The correlation is weak, but in general, as TN concentrations decrease, DO concentrations increase.

Lake Okeechobee Tributaries – Total Maximum Daily Load June 2008
37
Table 7. Summary of Nutrient Data for WBIDs Impaired by both Nutrients and DO
WBID TP (mg/l) TN (mg/l) Chlorophyll -a(µg/l) Unionized Ammonia (mg/l)
Obs Mean Min Max Obs Mean Min Max Obs Mean Min Max Obs Mean Min Max
3186C 46 0.39 0.01 1.49 45 1.86 0.84 9.51 20 29.17 1.4 365.07 1 0 0 0
3186D 45 0.07 0.01 1.08 43 1.08 0.33 3.8 17 2.4 1 6.3 - - - -
3188 711 0.47 0 3.92 258 1.77 0.5 8.4 23 7.24 1 74 13 0 0 0
3188A 152 0.19 0.03 1.19 108 1.42 0.52 4.64 6 83.02 1 480 - - - -
3192C 18 0.27 0.04 1.3 18 1.98 1.11 4.71 12 30.03 1 150 - - - -
3199B 104 1.587 0.05 5.78 92 2.99 0.92 11.00 14 157.77 6.00 979.36 - - - -
3203A 2,869 0.484 0.01 15 557 1.6 0.78 11.36 3 13.78 3.89 26.67 191 0 0 0.02
3203B 591 0.943 0.19 3.72 203 2.6 1.04 9.68 3 5.28 4.41 6.17 2 0 0 0
3204 988 0.15 0 0.73 987 1.96 0.07 6.41 21 51.55 1 440 399 0 0 0.01
3205 567 0.48 0.02 1.47 405 1.83 0.51 7.91 23 50.32 1 370 1 0.01 0.01 0.01
3205D 500 0.63 0.02 5.83 369 2.1 0.57 27.85 21 12.52 1 210 2 0.02 0.01 0.03
3206 444 0.185 0.04 1.93 444 1.73 0.062 5.07 23 24.72 1 62 199 0 0 0.07
3209 3,453 0.107 0 2.59 1588 1.64 0.035 13.62 233 10.28 1 69.3 552 0 0 0.01
3213A 203 0.455 0.07 1.76 200 1.86 0.48 3.87 8 19.83 1 67 2 0.01 0.01 0.01
3213B 272 0.438 0 2.11 245 2.07 0.134 23.38 65 38.65 3.8 144.8 34 0 0 0
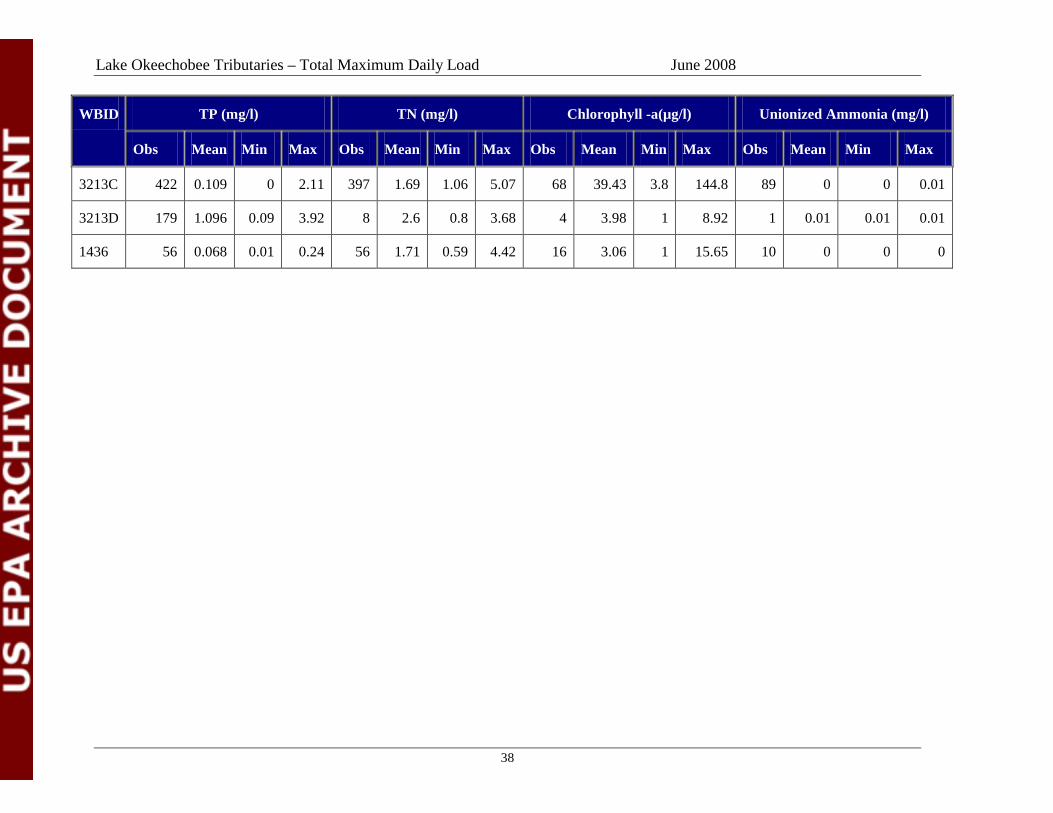
Lake Okeechobee Tributaries – Total Maximum Daily Load June 2008
38
WBID TP (mg/l) TN (mg/l) Chlorophyll -a(µg/l) Unionized Ammonia (mg/l)
Obs Mean Min Max Obs Mean Min Max Obs Mean Min Max Obs Mean Min Max
3213C 422 0.109 0 2.11 397 1.69 1.06 5.07 68 39.43 3.8 144.8 89 0 0 0.01
3213D 179 1.096 0.09 3.92 8 2.6 0.8 3.68 4 3.98 1 8.92 1 0.01 0.01 0.01
1436 56 0.068 0.01 0.24 56 1.71 0.59 4.42 16 3.06 1 15.65 10 0 0 0

Lake Okeechobee Tributaries – Total Maximum Daily Load June 2008
39
Table 8. Summary of DO and BOD Data in WBIDs Impaired For DO
WBID DO (mg/l) BOD (mg/l)
Obs Mean Min Max Obs Mean Min Max
3186B 616 4.42 0.01 12.81 60 3.81 2 14.6
3186C 46 4.11 0.61 7.6 16 2.91 0.7 7.4
3186D 43 4.49 0.13 9.16 15 2.05 2 2.2
3188 608 3.53 0.11 14.02 23 2.23 0 8.5
3188A 137 3.18 0.42 8.43 6 2.43 0 8.3
3192C 19 2.46 0.17 7.6 12 5.72 1 20.1
3199B 92 2.57 0.18 8.61 - - - -
3203A 1050 3.38 0 15.43 - - - -
3203B 519 3.76 0.44 9.41 - - - -
3204 949 4.31 0.2 11.63 19 3.55 0 19.2
3205 413 4.24 0.33 11.3 - - - -
3205D 1079 3.76 0.1 12.6 13 1.31 0.41 3.8
3206 435 4.19 0.13 10.69 29 2.21 0 6.1
3209 1379 5.34 0 13.42 8 2.49 2 3.4
3213A 197 4 0.69 10.5 - - - -
3213B 240 3.98 0.09 10.8 - - - -
3213C 400 4.67 0.09 13.93 - - - -
3213D 168 2.57 0.3 9.16 - - - -
1436 68 3.75 0.14 8.9 25 2.01 1.1 3.6

Lake Okeechobee Tributaries – Total Maximum Daily Load June 2008
40
6 SOURCE ASSESSMENT
An important part of the TMDL analysis is the identification of source categories and the amount of pollutant loading contributed by these sources. Sources are broadly classified as either point or nonpoint sources. Phosphorus originating from atmospheric deposition is allocated to background loads. Several of the WBIDs are also impaired for dissolved oxygen and one is listed for DO and BOD only. The sources contributing to nutrient impairment also contribute to the low DO and elevated unionized ammonia levels. Low DO concentrations can also be attributed to hydromodification associated with channelization.
6.1 Background Loads
Dry and wet atmospheric deposition of phosphorus is considered background. Phosphorus loading in South Florida is monitored through the Florida Atmospheric Mercury Study (FAMS). Wet deposition phosphorus loading rates average about 10 mgP/m2-yr, while dry deposition phosphorus loading rates range from 10 mgP/m2-yr to 20 mgP/m2-yr (FDEP, 2001b). The Lake Okeechobee Technical Advisory Committee recommended that 18 mgP/m2
6.2 Permitted Point Sources
-yr is an appropriate atmospheric loading of phosphorus over the open lake. This rate is used to estimate background loads of phosphorus in the impaired tributaries in the Lake Okeechobee watershed. The LOPP allocates 35 Mtons to atmospheric deposition.
A point source is defined as a discernable, confined, and discrete conveyance from which pollutants are or may be discharged to surface waters. Point source discharges of industrial wastewater and treated sanitary wastewater must be authorized by National Pollutant Discharge Elimination System (NPDES) permits. NPDES permitted facilities discharging treated sanitary wastewater or stormwater are typically considered primary sources of nutrients. Waste Load Allocations (WLAs) are assigned to all NPDES permits discharging to surface waters.
Several domestic and industrial wastewater point sources exist in the watershed; however, most of them do not discharge to surface waters. Animal Feeding Operations (AFOs) are located in WBIDs 3505 and 3505D, but they land apply the wastewater and are not expected to discharge to surface waters. H.W. Rucks Dairy Barn #1(FLA139173) and #2 (FLA139165) are located in WBIDs 3505 and 3505D, respectively, and rely on BMPs to control phosphorus at the source.
FDEP regulates dairy farms and other confined animal operations located in the Lake Okeechobee watershed under State Law, Chapter 62-670.500, F.A.C. (Dairy Rule). The purpose of the rule is to control pollution of waters of the state due to the discharge of wastewater and runoff from dairies and other confined animal operations. Additionally, EPA reinterpreted its Federal rules regarding NPDES permitting of Concentrated Animal Feeding Operations (CAFOs). The state was required to implement these Federal rules by December 2004. Based on EPA’s CAFO rule, all dairies and some of the CAFOs located within the Lake Okeechobee watershed must obtain NPDES permits. The
Lake Okeechobee Tributaries – Total Maximum Daily Load June 2008
41
permit for the dairy farms does not allow discharge to surface waters except under extreme rainfall events. For purposes of the TMDL, the WLA for these facilities is 0 lb/day. The permitting requirements include the development and implementation of a nutrient management plan, record keeping, transfer of waste to third parties, and annual reporting (FDEP, 2006).
Stormwater Treatment Areas (STAs) are large parcels of wetlands planted with specific species that act as filters to remove nutrients. Within the life cycle of these plants, plant litter will accumulate and become peat through a natural anaerobic process. The peat will trap pollutants introduced by agricultural stormwater runoff, facilitating restoration of downstream waterbodies.
The Taylor Creek STA is located in WBID 3505 and treats stormwater from the Taylor Creek watershed (including WBID 3505D) before discharging into Lake Okeechobee. The Nubbin Slough STA is located in WBID 3203A and receives flow from and discharges to Nubbin Slough. Expansion of these STAs is planned for the future to receive flow from all WBIDs in the S-191 basin. The STAs are currently not permitted through the NPDES program.
6.2.1 Municipal Separate Storm Sewer System Permittees
Like other nonpoint sources of pollution, urban stormwater discharges are associated with land use and human activities, and are driven by rainfall and runoff processes leading to the intermittent discharge of pollutants in response to storms. The 1987 amendments to the Clean Water Act designated certain stormwater discharges from urbanized areas as point sources requiring NPDES stormwater permits. The three major components of the NPDES stormwater regulations are:
• Municipal Separate Storm Sewer Systems (or MS4) permits that are issued to entities that own and operate master stormwater systems, primarily local governments. Permittees are required to implement comprehensive stormwater management programs designed to reduce the discharge of pollutants from the MS4 to the maximum extent practicable.
• Stormwater Associated with Industrial Activities, which is regulated primarily by a multi-sector general permit that covers various types of industrial manufacturing facilities and requires the implementation of stormwater pollution prevention plans.
• Construction activity generic permits for projects that disturb one or more acres of land and which require the implementation of stormwater pollution prevention plans to provide for erosion and sediment control during construction and the treatment and management of stormwater to minimize pollution and flooding.
In October 2000, USEPA authorized FDEP to implement the NPDES stormwater program in all areas of Florida except Indian Tribal lands. FDEP’s authority to administer the NPDES program is set forth in Section 403.0885, Florida Statutes. The Stormwater Rule was established as a technology-based program that relies on the implementation of BMPs that are designed to achieve a specific level of treatment (i.e., performance standards) as set forth in Chapter 62-40, F.A.C.

Lake Okeechobee Tributaries – Total Maximum Daily Load June 2008
42
The Stormwater Rule requires the state’s water management districts (WMDs) to establish stormwater pollutant load reduction goals (PLRGs) and adopt them as part of a SWIM plan, other watershed plan, or rule. Stormwater PLRGs are a major component of the load allocation part of a TMDL. To date, stormwater PLRGs have been established for Tampa Bay, Lake Thonotosassa, the Winter Haven Chain of Lakes, the Everglades, Lake Okeechobee, and Lake Apopka. The NPDES stormwater program was implemented in phases, with Phase I MS4 areas including municipalities having a population above 100,000. Because the master drainage systems of most local governments in Florida are interconnected, FDEP implemented Phase 1 of the MS4 permitting program on a countywide basis, which brings in all cities, Chapter 298 urban water control districts, and the Florida DOT throughout the fifteen counties meeting the population criteria. Phase II of the NPDES Program was expanded in 2003 and requires stormwater permits to construction sites between one and five acres, and to local governments with as few as 10,000 people.
An important difference between federal and state stormwater permitting programs is the federal program covers both new and existing discharges, while the state program focuses on new discharges. Although MS4 discharges are technically referred to as “point sources” for the purpose of regulation, they are still diffuse sources of pollution that cannot be easily collected and treated by a central treatment facility. Most MS4 permits issued in Florida include a re-opener clause allowing permit revisions for implementing TMDLs once they are formally adopted by rule.
Polk County and the City of Davenport in the Horseshoe Creek basin (WBID 1436) are covered by a Phase I MS4 permit (FLS000015). Polk County is the “unofficial” lead permittee. The Department of Transportation is a co-permittee to this permit. Osceola County (FLR04E063) and Martin County (FLR04E013) are of sufficient population density to require a Phase II MS4 permit. There are no urban areas in the impaired WBIDs of sufficient populations in Polk, Osceola, or Martin counties covered by an MS4 permit; therefore, a WLA of 0 lb/day is assigned to WBIDs located in these counties.
MS4 permittees will only be responsible for reducing the anthropogenic loads associated with stormwater outfalls that it owns or otherwise has responsible control over, and it is not responsible for reducing other nonpoint source loads in its jurisdiction. All future areas with populations meeting the MS4 requirements will be required to achieve the percent reductions assigned to the WBIDs in the TMDL.
6.3 Nonpoint Sources
Unlike traditional point source effluent loads, nonpoint source loads are diffuse sources that cannot be identified as entering a waterbody through a discrete conveyance at a single location. These sources generally, but not always, involve accumulation of nutrients on land surfaces and wash off as a result of storm events. Nonpoint sources of phosphorus and nitrogen loadings in the Lake Okeechobee watershed include: agriculture (cattle and truck crops), wildlife, residential and urban development (septic systems), and stormwater runoff. Nutrients associated with residential and urban development is from landscape fertilization, accumulation of nutrients in drain fields and

Lake Okeechobee Tributaries – Total Maximum Daily Load June 2008
43
septic tanks, municipal sludge from wastewater treatment plants and landfills. The single greatest contributor to increased N in most ecosystems is fertilizer use, with other factors including deforestation, fossil fuel burning, increased planting of nitrogen fixing crops, and oxidation of organic soils (SFWMD, 2003).
Major outflows from Lake Okeechobee include evapotranspiration (66 percent), the Caloosahatchee River to the west (12 percent), St. Lucie Canal to the east (4 percent) and the four major agricultural canals (the Miami, New River, Hillsboro, and West Palm Beach Canals) that drain south and southeast (18 percent). The lake contributes poor water quality to these waterbodies. Implementation of control strategies outlined in the LOPP should result in improved water quality discharging from the lake.
Depressed DO concentrations in many of the canals are a result of transporting nutrient-rich waters. Despite reductions in the organic load carried in the canals, the physical nature of the canals may not result in DO concentrations above Class III water quality criteria. Site specific alternative DO criteria may be necessary for many of the canals in the watershed.
A summary of anthropogenic nonpoint sources found in the Lake Okeechobee watershed is presented below. A detail discussion of these sources and remediation actions planned for the watershed can be found on FDEP’s webpage.
6.3.1 Agriculture
Agricultural activities are the principle land uses in the impaired WBIDs and are responsible for discharging large quantities of nutrients to the waterbodies through stormwater runoff. Cattle and dairy pasturelands are the primary agriculture activities north and northwest of Lake Okeechobee, while cropland (sugarcane and vegetables) dominates to the south and east of the lake. The most intensive land use in the watershed is dairy farming, which began in the 1950’s. The TCNS watershed contains almost half (11,085 acres) of the dairy land in the entire Lake Okeechobee watershed and contributes almost 24 percent of the TP load to the lake (FDEP et al, 2008).
In 1987, FDEP adopted Chapter 62-670 to establish treatment requirements to reduce total phosphorus concentrations in runoff originating from AFOs and dairy farms in the Lake Okeechobee watershed. Waste treatment systems were to be constructed to treat runoff and wastewater from barns and high-intensity milk herd holding areas. According to the Dairy Rule, all 49 dairies in the Lake Okeechobee drainage basin had to sell and remove their cattle or else comply with the rule by 1991. The Dairy Buy-Out-Program allowed owners of dairies to sell their dairy if they were unable or unwilling to comply with the rule. In 1997, 23 dairies were eliminated, while 26 came into compliance with the rule.
The importation of phosphorus as feed, fertilizer and detergents, to support agricultural activities is a major source of phosphorus, nitrate, nitrite, and ammonia to the watershed. Ninety-eight percent of the phosphorus imported to the watershed supports agricultural activities while the remaining two percent supports human activities. Land use activities that are responsible for the largest percentage

Lake Okeechobee Tributaries – Total Maximum Daily Load June 2008
44
of annual phosphorus imports to the watershed include: improved and unimproved pasture, dairies, agriculture (citrus and caladium farms), sugarcane, sod farms, and row crops.
6.3.2 Sediment
Another factor that controls phosphorus in the waterbodies involves the internal phosphorus loading from sediments that accumulates in the waterbodies. Phosphorus is typically bound to calcium, other organic matter, or iron at the surface of the sediments. The diffusive flux of phosphorus between the surface and water column is controlled by iron solubility. Under conditions of low dissolved oxygen (iron is in the form of Fe2+
Dairies and sludge applications are significant sources of nutrients (N and P) in the Okeechobee watershed. Most of the P control measures enacted in response to the Dairy Rule, especially holding more water and containing cattle waste, yield significant N control. An estimated 11,914 tons of sludge was applied in Okeechobee County in 1999, containing an estimated 275 tons of N and 133 tons of P. Large chicken farms near Indiantown transported nitrogen-rich chicken manure into Okeechobee’s watershed through 2001. A partial moratorium on sludge application was called in 2001 and BMPs for sludge application for agriculture were developed by the Florida Department of Agriculture and Consumer Services (Audobon of Florida, 2005).
), phosphorus is released at high rates from the sediment in the water column and could increase from 50 ug/L to over 1 mg/L. This condition could contribute to algal blooms that occur in the summer months.
Nutrient impairment in Lettuce Creek (WBID 3213A) is attributed to high dissolved phosphorus fraction attached to sediment particles. Baffle boxes were installed in the creek as part of the Tributary Sediment Removal Project to evaluate the phosphorus reduction benefits that could be achieved by removing sediment loads from a stream. This type of traditional sediment trap was ineffective at removing phosphorus due to the small diameter particles discharging into Lettuce Creek. The study concluded a simple settling pond with chemical coagulation would be more efficient and cost effective at removing particulate phosphorus than baffle boxes.
6.3.3 Septic Systems
Residential septic tank systems and small package plants deliver contaminants (bacteria and toxic household chemicals) and nutrients to the impaired waterbodies. While urban areas comprise about 10 percent of the land uses in the basin, they only contribute 3 percent of the total phosphorus load in the watershed (FDEP, 2001b). Wastewater master plans were completed in January 2004 to address the need for connecting septic system and package plants to a central sewer system.
6.3.4 Stormwater Runoff
Stormwater runoff from agricultural and urban land cover represents a significant portion of the nutrient loadings to the impaired streams. Numerous Best Available Technologies (BATs) projects have been initiated in the Lake Okeechobee watershed to reduce phosphorus loadings in stormwater runoff. In May 2004, the SFWMD completed construction of edge-of-farm stormwater treatment BATs on select dairy properties in the watershed, one of which was on property located in WBIDs

Lake Okeechobee Tributaries – Total Maximum Daily Load June 2008
45
3213A and 3203A. Dairy BATs projects consist of capturing stormwater runoff from high nutrient pasture areas; reusing the runoff onsite in current operations (if possible); and if offsite discharge is necessary, chemically treating the runoff prior to its release.
Reducing nutrients entering stormwater in urbanized areas is essential to achieving the goals of the LOPP. Public education through the Florida Yards and Neighborhood Program provides weekly newspaper articles addressing proper lawn maintenance practices. The program encourages the use of low- or no-phosphorus fertilizers for urban lawns and golf courses.

Lake Okeechobee Tributaries – Total Maximum Daily Load June 2008
46
7 TMDL DEVELOPMENT
The TMDLs are based on achieving nutrient concentrations that protect the tributaries and achieve the nutrient load to Lake Okeechobee consistent with the allocations outlined in the LOPP. The LOPP allocates an annual average load of 35 Mtons to background (i.e., atmospheric deposition) and 105 Mtons/yr between point and nonpoint sources. To achieve the TP load in the lake, the basins discharging into the lake are allocated a load such that the total load from all waterbodies (impaired and not impaired) does not exceed 105 Mtons. Details of the development of the target TP load for Lake Okeechobee can be found in the LOPP (SFWMD, 2004). The TMDLs also target TN as described in Section 4 of this report.
An assumption in these TMDLs is DO conditions should improve when management strategies are implemented to return nutrients loadings to natural background levels. In the TMDL scenario, DO concentrations meet the natural condition criterion. WBID 3186B is listed for DO and BOD, and the TMDL for this WBID allocates loading to BOD to achieve water quality standards.
7.1 Nutrient TMDL
Nutrient enrichment and the resulting problems related to eutrophication tend to be widespread and are frequently manifested some distance (in both time and space) from their source. Addressing eutrophication involves relating water quality and biological effects (photosynthesis, decomposition, nutrient recycling, etc.), as acted upon by hydrodynamic factors (flow, wind, tide, salinity, etc.) to the timing and magnitude of constituent loads supplied from various categories of pollution sources. Dynamic computer simulation models have become indispensable tools to describe these relationships. Calibrated models also provide opportunities to predict water quality conditions under alternative constituent loadings.
FDEP’s TMDL for Lake Okeechobee used the watershed model WAMVIEW to develop baseline discharge and TP loads into the lake. The model time period was 1991-2003 and included the worst drought in recent history (2000) and extremely wet years (1998 and 2003). The LOPP describes how model results were used to assign annual TP loads to each of the 34 basins in the Lake Okeechobee watershed. TP loads allocated to each basin were calculated by multiplying the annual discharge (acre-ft) at each basin outflow structure, the observed flow-weighted TP concentration (mg/l), and a conversion factor (1.233 x 10⁻³ m3 Mton acre-ft-1 mg-1
Table 9
).
is a summary of impaired WBIDs located within each LOPP basin, the drainage area, and the annual average discharge. These values represent baseline conditions (1991-2000) against which alternative TP reduction plans are compared. The annual average flow for WBID 1436 is based on WAMVIEW model output at the downstream end of the WBID. Flow from WBID 1436 drains to a swamp before entering Lake Kissimmee.
For all other WBIDs addressed in this report, the annual average discharge values assigned to each WBID are area-weighted based on the percentage of area the WBID covers in an LOPP basin. For

Lake Okeechobee Tributaries – Total Maximum Daily Load June 2008
47
example, the drainage area of WBID 3205 is about 44 percent of the total drainage area of the S-191 basin. This percentage is multiplied by the total flow from the S-191 basin to estimate flow in WBID 3205.
In most cases WBID boundaries align with LOPP basins, but in some instances the areas differ. An LOPP basin may include areas from WBIDs not on the 303(d) list. Impaired WBIDs in the S-65 A, B, C, D, E basin account for about 53 percent of the flow from the watershed. The TMDL allocates loads to the impaired WBIDs but not to the non-listed waterbodies in the watershed. The non-listed waterbodies are expected to meet the goals for TP reduction outlined in the LOPP.
The SFWMD developed a spreadsheet to evaluate the impact alternative BMPs would have on achieving the TP TMDL for Lake Okeechobee. Criteria used to evaluate the BMPs included protection of native flora or fauna in the lake and watershed, achievement of water quality standards, and cost impacts on land owners and the regional economy. A summary of estimated load reductions resulting from current BMP activities and future tools necessary to achieve the TMDL are shown in Table 3.
Table 9. Area and Inflows for Impaired WBIDs and LOPP Basins (Baseline Conditions)
LOPP Basin WBID Drainage Area Annual average Discharge (acre-ft/yr)
Acres % of WBID within Basin
S-65 A, B, C, D, E Basin 427,913 291,845
3188 98,485 23.0% 67,169
3188A 10,680 2.5% 7284
3186B 67,689 15.8% 46,165
3186C 16,203 3.8% 11,051
3186D 24,518 5.7% 16,722
3192C 10,335 2.4% 7049
Non-Listed Areas 200,003 46.7% 136,406
Taylor Creek/Nubbin Slough (S-191) 120,754 101,946
3205 53,049 43.9% 44,786

Lake Okeechobee Tributaries – Total Maximum Daily Load June 2008
48
LOPP Basin WBID Drainage Area Annual average Discharge (acre-ft/yr)
Acres % of WBID within Basin
3205D 9875 8.2% 8337
3203A 15,332 12.7% 12,944
3203B 6724 5.6% 5677
3213B 16,030 13.3% 13,533
3213A 3135 2.6% 2647
3213D 16,361 13.5% 13,813
Non-Listed Areas 248 0.2% 209
C-40 Basin (S-72) 43,964 16,266
3206 44,406 100% 16,266
C-41 Basin (S-71) 94,928 49,799
3204 96,114 100% 49,799
L-59E 14,409 6395
3209 14,414 100% 6395
S-135 Basin 18,089 25,408
3213C 13,582 75.1% 19,078
Non-Listed Areas 4,507 24.9% 6331
S-154 33,798 24,630
3199B 12,893 38.1% 9396
Non-Listed Areas 20,905 61.9% 15234

Lake Okeechobee Tributaries – Total Maximum Daily Load June 2008
49
LOPP Basin WBID Drainage Area Annual average Discharge (acre-ft/yr)
Acres % of WBID within Basin
S-65 1,021,674
1436 3004 0.3% 26,905
Other Areas (includes impaired WBIDs not in the Group 4 Basin)
862,069
Existing conditions for TP are expressed as concentrations and represent the mean value calculated from all stations in the WBID (see Table 7). The TP baseline load assigned to each LOPP basin represents existing conditions for all WBIDs discharging into that basin.
Existing conditions for TN are expressed as loads. TN loads are calculated using the mean concentration measured in the WBID and area-weighted flows estimated from the LOPP.
Load (Mton/yr) = Flow (acre-ft/yr) * Conc. (mg/l) * 1.2326E-03 (Equation 2)
In Equation 2, flow is the annual average flow estimated for the WBID and concentration is the mean value calculated using all observation data collected in the WBID. Existing conditions for total nitrogen are summarized in Table 10.
Table 10. Summary of Existing Conditions for Total Nitrogen
WBID Average TN Concentration (mg/l)
Flow (acre-ft/yr)
TN Load (lb/day)
3186C 1.86 11,051 153.03
3186D 1.08 16,722 134.45
3188 1.77 67,169 885.123
3188A 1.42 7284 77.01
3192C 1.98 7049 103.91
3199B 2.99 9396 287.01

Lake Okeechobee Tributaries – Total Maximum Daily Load June 2008
50
WBID Average TN Concentration (mg/l)
Flow (acre-ft/yr)
TN Load (lb/day)
3203A 1.60 12,944 154.19
3203B 2.60 5677 109.89
3205 1.83 44,786 610.18
3205D 2.10 8337 130.34
3213A 1.86 2647 36.65
3213B 2.07 13,533 208.56
3213D 2.60 13,813 267.38
3204 1.96 49,799 726.68
3213C 1.69 19,078 240.04
3206 1.73 16,266 209.50
3209 1.64 6395 78.08
1436 1.71 26,905 342.53
7.2 BOD TMDL
A regression analysis using DO and BOD data collected in the upper portion of the WBID is used to develop the DO TMDL for WBID 3186B. The data are graphed and a trend line is drawn through the data points. The trend line equation is then used to solve for the BOD concentration resulting in DO of 5 mg/l. The TMDL is calculated using this BOD concentration of 2.36 mg/l and an estimate of annual average flow in the WBID. Existing BOD load assigned to WBID 3186B is calculated using the average BOD measurement collected from all stations in the WBID. Existing and TMDL loads are 1309 and 811.13 lb/day, respectively. BOD load calculations are provided in Appendix D.

Lake Okeechobee Tributaries – Total Maximum Daily Load June 2008
51
8 TMDL ALLOCATION
The TMDL process quantifies the amount of a pollutant that can be assimilated in a waterbody, identifies the sources of the pollutant, and recommends regulatory or other actions to be taken to achieve compliance with applicable water quality standards based on the relationship between pollution sources and in-stream water quality conditions. The objective of a TMDL is to allocate loads among all of the known pollutant sources throughout a watershed so that appropriate control measures can be implemented and water quality standards achieved.
8.1 Allocation
A TMDL can be expressed as the sum of all point source loads (Waste Load Allocations or WLA), nonpoint source loads (Load Allocations or LA), and an appropriate margin of safety (MOS), which accounts for uncertainty concerning the relationship between effluent limitations and water quality:
TMDL = Σ WLAs + Σ LAs + MOS
Federal regulations provide that TMDLs can be expressed in terms of mass per time (e.g. pounds per day), toxicity, or other appropriate measure (40 C.F.R.§ 130.2(i)). Allocations are to both TP and TN to ensure complete protection of aquatic use support in the tributaries and downstream waters. TMDLs for TP are expressed as annual average loads consistent with the loads prescribed in the LOPP. Strategies implemented in the watershed to achieve the nutrient TMDLs should result in attainment of DO and BOD water quality standards.
The TMDL components for TP are expressed as concentration at the WBID scale and as loads at the LOPP basin scale expressed in units of Mtons/year and pounds/day. Annual average LOPP basin loads are divided by 365 days/yr to obtain daily loads. The TMDL components for TN and BOD are expressed in terms of daily loads in units of lb/day based on average annual flows calculated for each WBID. The target TP and TN concentrations represent annual average values. TMDLs should be implemented to achieve the annual average concentrations and LOPP loads. TMDL components for TP, TN, and BOD are provided in Table 11, Table 12, and Table 13, respectively. LOPP basin loads converted to daily loads are provided in Table 14. An implicit Margin of Safety (MOS) is assumed in all TMDLs as described in Section 8.4. The percent reduction required to achieve water quality standards is calculated using the following equation:
% Reduction = (existing load – TMDL) / (existing load) * 100 (Equation 3)
In several of the WBIDs a greater reduction is needed to meet the LOPP basin loads than what is required to achieve the TP target protective of the individual tributaries. EPA is relying on the best management practices (BMPs) and control strategies FDEP is designing for these LOPP basins to achieve the loads protective of Lake Okeechobee. In other WBIDs a greater reduction is needed to achieve the instream TP target for the tributaries than what is required to achieve the load at the pore point of the LOPP basins. Additional BMPs for these WBIDs, beyond those planned for the LOPP,

Lake Okeechobee Tributaries – Total Maximum Daily Load June 2008
52
will be needed to control nonpoint source runoff to achieve the load allocation described in this TMDL report. The WBIDs where instream TP targets require greater reductions than provided for in the LOPP are located in the TCNS and S-135 basins and are highlighted in bold font in Table 11.
Table 11. TMDL Components for Total Phosphorus
LOPP Basin/WBIDs
WLA LA (ppb)
MOS TMDL % Reduction
Lake Load (Mton/yr)
WBID Conc. (ppb)
Lake WBID
S-65A ,B, C, D, E 19.25 76%
3188 0 113 Implicit 113 76%
3188A 0 113 Implicit 113 41%
3186C 0 113 Implicit 113 0%
3186D 0 113 Implicit 113 58%
3192C 0 113 Implicit 113 76%
Taylor Creek / Nubbin Slough (S-191) 19.01 76%
3205 0 113 Implicit 113 76%
3205D 0 113 Implicit 113 82%
3203A 0 113 Implicit 113 77%
3203B 0 113 Implicit 113 88%
3213A 0 113 Implicit 113 75%
3213B 0 113 Implicit 113 74%
3213D 0 113 Implicit 113 90%
C-40 Basin (S-72) 2.32 76%
3206 0 113 Implicit 113 39%
C-41 Basin (S-71) 6.17 76%

Lake Okeechobee Tributaries – Total Maximum Daily Load June 2008
53
LOPP Basin/WBIDs
WLA LA (ppb)
MOS TMDL % Reduction
Lake Load (Mton/yr)
WBID Conc. (ppb)
Lake WBID
3204 0 113 Implicit 113 25%
L59-E 0.36 76%
3209 0 113 Implicit 113 0%
S-135 Basin 0.82 76%
3213C 0 113 Implicit 113 0%
S-154 Basin 5.72 76%
3199B 0 113 Implicit 113 93%
S-65 (Lake Kissimmee) 16.96 76%
1436 0 113 Implicit 113 0%
1. Reductions proposed are based on achieving 113 ug/L as an annual average of measured days. Lake reduction based on achieving the load allocated in LOPP.
2. WBIDs requiring a higher percent reduction than the LOPP are highlighted in bold font.
3. Implicit MOS based on conservative assumptions including using all data collected in the WBID to determine existing conditions rather than considering one time period (season or year). Data represents all flow conditions including drought (1999-2002) and hurricane years (2004).

Lake Okeechobee Tributaries – Total Maximum Daily Load June 2008
54
Table 12. TMDL Components for Total Nitrogen
WBID WLA (lb/day)
LA (lb/day)
MOS TMDL (lb/day)
% Reduction
3188 0 600.09 Implicit 600.09 32%
3188A 0 65.08 Implicit 65.08 15%
3186C* 0 98.73 Implicit 98.73 35%
3186D 0 149.39 Implicit 149.39 0%
3192C* 0 62.98 Implicit 62.98 39%
3205 0 400.12 Implicit 400.12 34%
3205D 0 74.48 Implicit 74.48 43%
3203A* 0 115.64 Implicit 115.64 25%
3203B* 0 50.72 Implicit 50.72 54%
3213A 0 23.65 Implicit 23.65 35%
3213B 0 120.90 Implicit 120.90 42%
3213D* 0 123.41 Implicit 123.41 54%
3206* 0 145.32 Implicit 145.32 31%
3204* 0 444.90 Implicit 444.90 39%
3209 0 57.13 Implicit 57.13 27%
3213C 0 170.44 Implicit 170.44 29%
3199B* 0 115.19 Implicit 115.19 60%
1436 0 240.37 Implicit 240.37 30%
Note: The daily TN load should be achieved based on an annual average of the measured days recognizing natural variability.

Lake Okeechobee Tributaries – Total Maximum Daily Load June 2008
55
Allocations for WBIDs marked with an asterisk in Table 12 are provided primarily for the purpose of protecting downstream waterbodies. EPA recognizes that projects can legitimately be designed, located, and implemented downstream in the future for treatment of nitrogen to address estuary impairments in lieu of implementing reductions in the waterbodies. At such time, the allocations in this TMDL report can be revised to account for those projects. Implementation of this TMDL, or the St. Lucie estuary TMDL, can include such treatment projects. Practices for reduction of nitrogen in agricultural lands are identified in Section 9 TMDL Implementation.
Table 13. TMDL Components for BOD
WBID TMDL
(lb/day) WLA
(lb/day) LA
(lb/day) Percent
Reduction
3186B 811.13 0 811.13 38%
Table 14. TP Allocations for LOPP Basins Expressed as Daily Loads
Basin WLA (lb/day)
LA (lb/day)
TMDL (lb/day)
S-65A, B, C, D, E 0 116.19 116.19
Taylor Creek / Nubbin Slough (S-191) 0 114.74 114.74
C-40 Basin (S-72) 0 14 14
C-41 Basin (S-71) 0 37.24 37.24
L59-E 0 2.17 2.17
S-135 Basin 0 4.95 4.95
S-154 Basin 0 34.50 34.50
S-65 0 102.37 102.37
8.2 Load Allocation
The LA includes nonpoint source loads from air deposition and unimpaired tributaries. The LA assigns necessary reductions expected in the upstream load from areas above Lake Kissimmee. However, the LA does not take into account changes in nonpoint source loads due to projected changes in land use. The LOPP states changes in land use cannot result in increased phosphorus loading over existing conditions.

Lake Okeechobee Tributaries – Total Maximum Daily Load June 2008
56
8.3 Wasteload Allocations
The WLA is a combination of the WLAs for all of the NPDES wastewater facilities and the stormwater discharge from MS4 entities. There are no NPDES facilities discharging to surface waters or MS4 jurisdictions within the boundaries of the impaired WBIDs. Urban stormwater from smaller municipalities not yet covered under Phase II of the NPDES stormwater program are included in the LA component. All future point sources discharging to surface waters impacting the impaired WBIDs will be required to meet the loads established in these TMDLs.
8.4 Margin of Safety
An implicit MOS was provided in the TMDL analysis through the selection of nutrient target concentrations that incorporate natural background conditions. It is assumed that each waterbody contains a certain amount of assimilative capacity above natural background before the standards are exceeded. Including natural background as part of the averaging in developing a target provides an implicit margin of safety.
8.5 Seasonal Variability
Seasonal variability was addressed in the selection of the nutrient target concentrations by considering data collected during all seasons. The data used in the TMDL analysis were collected during both drought (2000-2001) and wet conditions (1998). South Florida experienced an extremely rare occurrence of a series of hurricanes during August and September 2004. High rainfall, high surface water flows, and rises in water levels in lakes were experienced during the events and following months. Water quality data collected in the fall of 2004 reflects the devastation caused by these events.

Lake Okeechobee Tributaries – Total Maximum Daily Load June 2008
57
9 TMDL IMPLEMENTATION
The Clean Water Act [Section 303(d)(2)] directs TMDLs established by EPA be implemented by a State pursuant to subsection 303(e). A State can establish its own procedures for implementation. Federal regulations provide direction on implementation of TMDLs in the permitting process. At a minimum, NPDES permits must include a permit limit consistent with the assumptions of an approved wasteload allocation. However, the State may also establish a compliance schedule to provide time for implementation of effluent limits more stringent than currently permitted.
Control of nonpoint sources is much more dependant on local efforts to reduce pollution. There are many methods for controlling nonpoint sources. The predominant land uses in the areas covered by this TMDL is agriculture. For guidance on controlling nonpoint loading into waterbodies from agricultural sources, please refer to EPA's guidance, National Management Measures to Control Nonpoint Source Pollution from Agriculture, http://www.epa.gov/owow/nps/agmm/index.html. EPA also recently published a report, "Riparian Buffer Width, Vegetative Cover, and Nitrogen Removal Effectiveness: A Review of Current Science and Regulations", which provides a synthesis of existing scientific literature on the effectiveness of riparian buffers to improve water quality through their inherent ability to process and remove excess anthropogenic nitrogen from surface and ground waters (USEPA, 2005).
FDEP and the SFWMD have conducted numerous studies to evaluate implementation levels and costs to achieve TMDL targets for phosphorus (SWET, 2008). Some of these are described in this paragraph. Implementation of a modest “typical” BMP program was found to be the most cost effective initial phosphorus control practice for the watershed. Edge-of-field/farm (EOF) systems for high phosphorus source areas are the most cost effective control practices that can implemented. Control of nutrients from residential landuses includes site and EOF systems. Site level practices are typically landscape management BMPs, such as fertilization and water management practices. EOF systems for urban areas include standard stormwater retention/detention practices and possible chemical treatment for pass-thru waters. In-field soil amendments (e.g., lime, iron salts, gypsum, etc.) are effective at raising the pH of the soil to enhance phosphorus binding or to directly bind phosphorus with the applied compound. Soil amendments can significantly reduce phosphorus but they have disadvantages that greatly limit their effectiveness for controlling phosphorus. Disadvantages of the using soil amendments include the costs, difficulty in getting the amendments mixed into the soil adequately to maximum their effectiveness and some amendments (e.g., lime and iron salts) being vulnerable to remobilization.
Agricultural nutrient management plans (AgNMPs) have been developed by the FDACS to assist dairies with designing BMPs for their farms. The AgNMPs are designed to bring the dairies into a closer balance in terms of phosphorus import and export. The plans prescribe reduced phosphorus content of imported materials, recycling of phosphorus through spray fields, stormwater retention, and EOF treatment including chemical coagulants. Retained or chemically treated phosphorus will need to be periodically removed from settling basins and properly disposed of (SWET, 2008).

Lake Okeechobee Tributaries – Total Maximum Daily Load June 2008
58
REFERENCES
Audubon of Florida, 2005. Lake Okeechobee: A synthesis of information and recommendations
for its restoration. P.N. Gray, C.J. Farrell, M.L. Krauss, and A.H. Gromnicki, Eds., Audubon of Florida, Miami. 106 pp. + appendices.
Florida Administrative Code (F.A.C.) 62-302.530. Criteria for Surface Water Quality Classifications.
FDEP, SFWMD, and FDACS, 2008. Lake Okeechobee Watershed Construction Project Phase II Technical Plan, prepared by South Florida Water Management District, Florida Department of Environmental Protection, and Florida Department of Agriculture and Consumer Services, February 2008.
FDEP, 2008. Nutrient Targets for the St. Lucie Estuary, Florida Department of Environmental Protection Memorandum to Drew Bartlett from Kristina Laskis, Rob McTear, and Keith Parmer, June 3, 2008.
FDEP, 2007a. State of Florida - Numeric Nutrient Criteria Development Plan, Tallahassee, FL, September 2007.
FDEP, 2007b. Technical Support Document: Derivation of the Numeric Nutrient Thresholds for Total Nitrogen and Total Phosphorus in the Lake Okeechobee Tributaries, May 2007.
FDEP, 2006. Water Quality Assessment Report, Kissimmee River and Fisheating Creek. Division of Water Resources Bureau of Watershed Management. March 2006.
FDEP, 2005. 2005 South Florida Environmental Report, Chapter 3: Lake Okeechobee Annual Report.
FDEP, 2004. Water Quality Status Report Kissimmee River and Fisheating Creek. Division of Water Resource Management, South and Central Districts, Group 4 Basin, 2004.
FDEP, 2001a. Total Maximum Daily Load for Total Phosphorus – Lake Okeechobee, Florida. Submitted to the USEPA Region 4. Tallahassee, FL.
FDEP, 2001b. Basin Status Report, Lake Okeechobee. Division of Water Resource Management, Southeast District, Group 1 Basin, 2001.
Harper, H. H. and D.M. Baker. 2003. Evaluation of Alternative Stormwater Regulations for Southwest Florida. Environmental Research & Design, Inc.
Odum, Eugene P., 1971. Fundamentals of Ecology, Third Edition. WB. Saunders Company, Philadelphia, PA.

Lake Okeechobee Tributaries – Total Maximum Daily Load June 2008
59
Odum, Howard T., Dissolved Phosphorus in Florida Waters. Department of Biology, College of Arts and Sciences, University of Florida, Report to Florida Geological Survey, January 9, 1953.
SFWMD, 2004. Lake Okeechobee Protection Plan (LOPP), South Florida Water Management District, Florida Department of Environmental Protection, and Florida Department of Agriculture and Consumer Affairs. January 1, 2004.
SFWMD, 2003. Lake Okeechobee Surface Water Improvement and Management Plan (SWIM), Division of Water Resources Management, Southeast District, 2003.
SWET, 2008. Task 3 Legacy P Abatement Plan for Project Entitled Technical Assistance in Review and Analysis of Existing Data for Evaluation of Legacy Phosphorus in the Lake Okeechobee Watershed, draft report prepared for South Florida Water Management District by Soil and Water Engineering Technology, Inc (SWET) in association with JGH Engineering, April 14, 2008.
University of Florida, 2001. Florida Water Resources. University of Florida Extension Institute of Food and Agricultural Sciences WQ101. Gainesville, FL April 2001.
USEPA, 2006. Proposed Total Maximum Daily Load (TMDL) for Dissolved Oxygen and Nutrients in North St. Lucie River (WBID 3194), St. Lucie Estuary (WBID 3194B), and C-24 Canal Watershed (WBID 3197), USEPA Region 4, Atlanta, GA. September 2006.
USEPA, 2005. Riparian Buffer Width, Vegetative Cover, and Nitrogen Removal Effectiveness: A Review of Current Science and Regulations. USEPA, National Risk Management Research Laboratory, Office of Research and Development, Cincinnati, OH EPA/600/R-05/118, October 2005.
USEPA, 2000. Nutrient Criteria Technical Guidance Manual, Rivers and Streams. USEPA, Office of Water, Washington, DC EPA-822-B-00-002.
USEPA, 1991. Guidance for Water-Quality Based Decisions: the TMDL Process. USEPA, Office of Water, Washington, DC EPA-440/4-91-001. April 1991.

Lake Okeechobee Tributaries – Total Maximum Daily Load June 2008
60
Appendix A: Calculation of Limiting Nutrient
Table B- 1. Limiting Nutrient Conditions for Existing and Single Nutrient Control (P only)
WBID Existing Conditions (ave. values) Single Nutrient Control (P=113 ug/L)
TN TP Limiting Nutrient/value
TN TP Limiting Nutrient/value
3186C 1.86 0.39 Co-Limiting / 10.56 1.86 0.113 Phosphorus /36.45
3186D 1.08 0.07 Phosphorus / 33.85 1.08 0.113 Co-Limiting /21.16
3188 1.77 0.47 Nitrogen / 7.02 1.77 0.113 Phosphorus /34.68
3188A 1.42 0.19 Co-Limiting / 16.55 1.42 0.113 Co-Limiting /27.83
3192C 1.98 0.27 Co-Limiting / 17.47 1.98 0.113 Phosphorus /38.80
3199B 2.99 1.59 Nitrogen / 4.14 2.99 0.113 Phosphorus /58.59
3203A 1.6 0.5 Nitrogen / 8.86 1.6 0.113 Phosphorus /31.35
3203B 2.6 0.94 Nitrogen / 5.14 2.6 0.113 Phosphorus /50.95
3204 1.96 0.15 Co-Limiting / 28.64 1.96 0.113 Phosphorus /38.41
3205 1.83 0.48 Nitrogen / 8.63 1.83 0.113 Phosphorus /35.86
3205D 2.1 0.63 Nitrogen / 7.80 2.1 0.113 Phosphorus /41.15
3206 1.73 0.19 Co-Limiting / 19.93 1.73 0.113 Phosphorus /33.90
3209 1.64 0.11 Phosphorus / 33.82 1.64 0.113 Phosphorus /32.14
3213A 1.86 0.45 Nitrogen / 9.15 1.86 0.113 Phosphorus /36.45
3213B 2.07 0.39 Co-Limiting / 11.47 2.07 0.113 Phosphorus /40.56
3213C 1.69 0.109 Phosphorus/ 34.33 1.69 0.113 Phosphorus /33.12
3213D 2.6 1.1 Nitrogen / 3.86 2.6 0.113 Phosphorus /50.95
1436 1.71 0.07 Phosphorus / 53.46 1.71 0.113 Phosphorus /33.51

Lake Okeechobee Tributaries – Total Maximum Daily Load June 2008
61
Limiting nutrient calculations are based on molar ratio of average TN to TP concentrations measured at all stations in the WBID. Concentrations are converted to molar values by dividing TN and TP concentrations by their molecular weight, or 14 for Nitrogen and 31 for Phosphorus. An example calculation is as follows:
WBID 3186C: TN/TP = (1.86/14) / (0.39/31) = 0.1328/0.0126 = 10.56 Co-limited
For TMDL conditions (control both N & P): TN/TP = (1.2/14) / (0.113/31) = 23.5 Co-limited
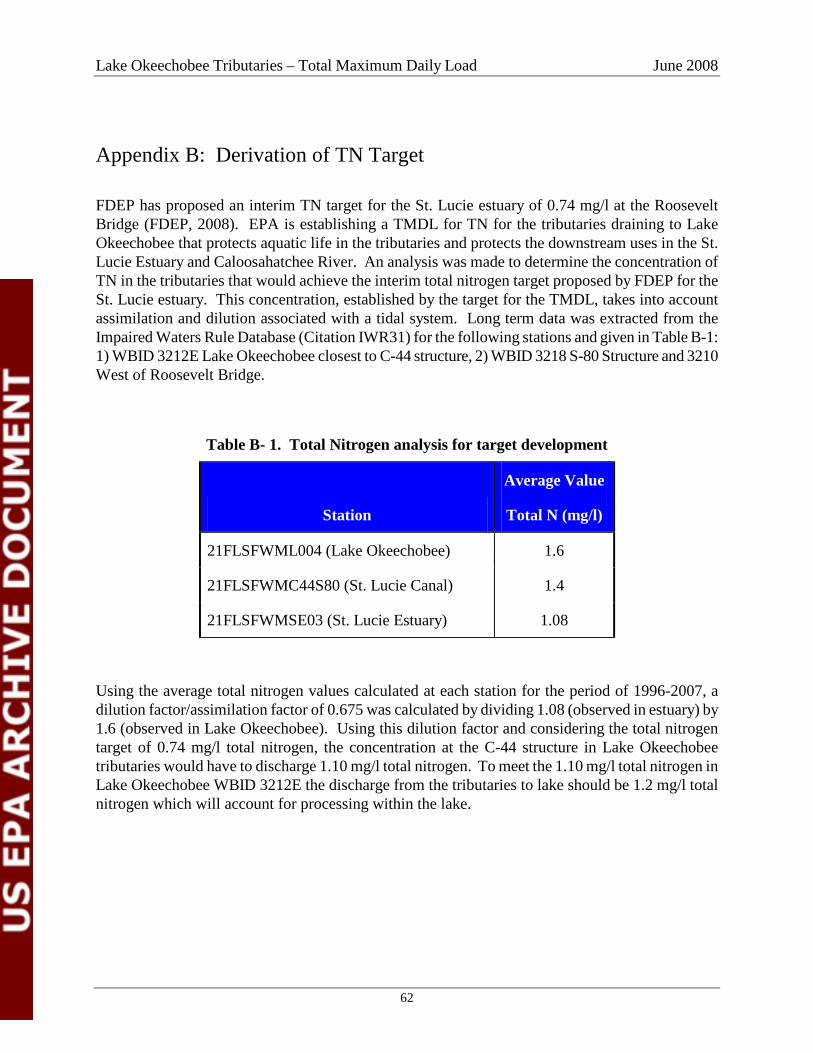
Lake Okeechobee Tributaries – Total Maximum Daily Load June 2008
62
Appendix B: Derivation of TN Target
FDEP has proposed an interim TN target for the St. Lucie estuary of 0.74 mg/l at the Roosevelt Bridge (FDEP, 2008). EPA is establishing a TMDL for TN for the tributaries draining to Lake Okeechobee that protects aquatic life in the tributaries and protects the downstream uses in the St. Lucie Estuary and Caloosahatchee River. An analysis was made to determine the concentration of TN in the tributaries that would achieve the interim total nitrogen target proposed by FDEP for the St. Lucie estuary. This concentration, established by the target for the TMDL, takes into account assimilation and dilution associated with a tidal system. Long term data was extracted from the Impaired Waters Rule Database (Citation IWR31) for the following stations and given in Table B-1: 1) WBID 3212E Lake Okeechobee closest to C-44 structure, 2) WBID 3218 S-80 Structure and 3210 West of Roosevelt Bridge.
Table B- 1. Total Nitrogen analysis for target development
Station
Average Value
Total N (mg/l)
21FLSFWML004 (Lake Okeechobee) 1.6
21FLSFWMC44S80 (St. Lucie Canal) 1.4
21FLSFWMSE03 (St. Lucie Estuary) 1.08
Using the average total nitrogen values calculated at each station for the period of 1996-2007, a dilution factor/assimilation factor of 0.675 was calculated by dividing 1.08 (observed in estuary) by 1.6 (observed in Lake Okeechobee). Using this dilution factor and considering the total nitrogen target of 0.74 mg/l total nitrogen, the concentration at the C-44 structure in Lake Okeechobee tributaries would have to discharge 1.10 mg/l total nitrogen. To meet the 1.10 mg/l total nitrogen in Lake Okeechobee WBID 3212E the discharge from the tributaries to lake should be 1.2 mg/l total nitrogen which will account for processing within the lake.

Lake Okeechobee Tributaries – Total Maximum Daily Load June 2008
63
Appendix C: Rationale for Controlling Nitrogen in Impaired WBIDs
The rationale for controlling nitrogen in the impaired WBIDs involved the following three steps.
Step one: If the DO is not meeting the water quality standard for the WBID based on the verified list binomial test or, if the data set is too small, greater than 10% of the samples violate, then a regression analysis is run to determine if nitrogen has an effect on DO. If so, nitrogen will be controlled. If not, step two is applied (which would also apply if the DO were meeting the water quality standard because it targets control of primary productivity throughout the year).
Step two: If a phosphorus only TMDL results in phosphorus limitation for less than 90% of the time using the TMDL target concentration as the phosphorus condition, nitrogen will be controlled. This avoids the risk associated with dependence on a single nutrient control approach where that condition would be expected for less than 90% of the time. Inherent fluctuation in phosphorus levels will still be observed post TMDL implementation.
Step three
Results of this analysis are provided in
: A third check will be made to ensure that excess nitrogen, post TMDL implementation, is not delivered downstream recognizing that there are documented nitrogen caused impairments in the St. Lucie and Caloosahatchee Bay. If the target condition in Lake Okeechobee expressed as a median is less than the median of existing TN concentrations in the WBID, nitrogen will be controlled. As expected, the concentrations of nitrogen in Lake Okeechobee inflows are not significantly different, after mixing, than those in Lake Okeechobee outflows.
Table C- 1. If any one of the three conditions presented in this table were true, controlling total nitrogen was considered essential to meeting the designated use in the WBID.
Table C- 1. Decision Rationale for Controlling Nitrogen in Lake Okeechobee Tributaries
WBID Does DO Correlate with Nitrogen (see note 1)
Is TP Limiting Condition LESS than 90% time (see note 2)
Is TNWBID > TNTARGET
(see note 3)
3186B No Yes – control N (TP limited 71% of time)
No
3186C No No Yes – control N (TN: 1.61 > 1.2)
3186D No Yes – control N (TP limited 49% of time)
No
3188 No Yes – control N (TP limited 84% of time)
Yes – control N (TN: 1.55 > 1.2)

Lake Okeechobee Tributaries – Total Maximum Daily Load June 2008
64
WBID Does DO Correlate with Nitrogen (see note 1)
Is TP Limiting Condition LESS than 90% time (see note 2)
Is TNWBID > TNTARGET
(see note 3)
3188A No Yes – control N (TP limited 83% of time)
Yes – control N (TN: 1.37 > 1.2)
3192C No No Yes – control N (TN: 1.81 > 1.2)
3199B No No Yes – control N (TN: 2.66 > 1.2)
3203A No No Yes – control N (TN: 1.54 > 1.2)
3203B No No Yes – control N (TN: 2.37 > 1.2)
3204 No No Yes – control N (TN: 1.76 > 1.2)
3205 No Yes – control N (TP limited 85% of time)
Yes – control N (TN: 1.73 > 1.2)
3205D No Yes – control N (TP limited 89% of time)
Yes – control N (TN: 1.73 > 1.2)
3206 No No Yes – control N (TN: 1.60 > 1.2)
3209 No Yes – control N (TP limited 78% of time)
Yes – control N (TN: 1.36 > 1.2)
3213A Yes (control N) No Yes – control N (TN: 1.79 > 1.2)
3213B Yes (control N) No Yes – control N (TN: 1.75 > 1.2)
3213C Yes (control N) No Yes – control N (TN: 1.58 > 1.2)
3213D No No Yes – control N (TN: 2.14 > 1.2)
1436 Yes (control N) Yes – control N (TP limited 88% of time)
Yes – control N (TN: 1.63 > 1.2)
1. Data indicates correlation with ammonia, nitrate-nitrite, and/or total nitrogen
2. TP limiting condition reflects Post TMDL condition for implementing TP controls only
WBIDs showing a correlation between DO and Nitrogen are illustrated below.

Lake Okeechobee Tributaries – Total Maximum Daily Load June 2008
65
WBID 3213A
y = -0.1416x + 2.2542R2 = 0.2153
00.5
11.5
22.5
33.5
4
0 2 4 6 8 10 12
DO
TKN
Figure C- 1. Correlation between DO and TKN in WBID 3213A
WBID 3213A
y = -0.1131x + 2.2973R2 = 0.1374
00.5
11.5
22.5
33.5
44.5
0 2 4 6 8 10 12
DO
TN
Figure C- 2. Correlation between DO and TN in WBID 3213A

Lake Okeechobee Tributaries – Total Maximum Daily Load June 2008
66
3213B
y = -0.1345x + 2.227R2 = 0.1887
0
0.5
1
1.5
2
2.5
3
3.5
4
0 2 4 6 8 10 12
DO
TKN
Figure C- 3. Correlation between DO and TKN in WBID 3213B
3213B
y = -0.1064x + 2.2722R2 = 0.1184
0
0.5
1
1.5
2
2.5
3
3.5
4
4.5
0 2 4 6 8 10 12
DO
TN
Figure C- 4. Correlation between DO and TN in WBID 3213B

Lake Okeechobee Tributaries – Total Maximum Daily Load June 2008
67
3213C
y = -0.0099x + 0.104R2 = 0.2062
-0.05
0
0.05
0.1
0.15
0.2
0.25
0.3
0 2 4 6 8 10 12 14 16
DO
Amm
onia
Figure C- 5. Correlation between DO and Ammonia in WBID 3213C
1436
y = -0.1453x + 2.2419R2 = 0.1591
0
0.5
1
1.5
2
2.5
3
3.5
4
4.5
5
0 1 2 3 4 5 6 7 8 9 10
DO
TN
Figure C- 6. Correlation between DO and TN in WBID 1436

Lake Okeechobee Tributaries – Total Maximum Daily Load June 2008
68
Appendix D: Calculation of BOD TMDL
The trendline equation shown in the above plot is used to determine the BOD target.To maintain DO levels above 5 mg/l, BOD would need to be equal to or less than:
BOD = -1.6495x + 10.595BOD = -1.6495 (5) + 10.595BOD = 2.3655 mg/l
Average Annual Flow estimated for WBID 3186B is: 46165 acre-ft/yr [LOPP, 2003]Average Annual BOD load is: 134.291 Mton/yrDaily BOD load is: 811.1263 lb/day
Conversion Factors: 2204.623 lb/Mton
DO and BOD Correlation at Sta 21FLSFWMKRFNC38 in WBID 3186B
y = -1.6495x + 10.595R2 = 0.3735
02468
10121416
0 1 2 3 4 5 6 7DO (mg/l)
BOD
(mg/
l)
Existing BOD loads are calculated using the average concentration measured at all stations in the WBID between 1998 and 2001. This concentration is multiplied by the annual average flow and converted to load as follows:
Existing Conditions:
Mean BOD concentration = 3.81 mg/l
Existing Load = 3.81 mg/l * 46165 acre-ft/yr * 0.0012326 = 216.8 Mton/yr
Existing Load (lb/day) = 216.8 Mton/yr * yr/365.25 day * 2204.623 lb/Mton = 1309 lb/day
Conversion Factor: mg/L*acre-ft/yr * 43560 ft2/acre*28.317 L/cf * Mton/109mg = 0.0012326
% Reduction = (Existing Load – TMDL Load) / Existing Load * 100
Percent Reduction:
% Reduction = (216.8 – 134.291) / 216.8 = 38%

Lake Okeechobee Tributaries – Total Maximum Daily Load June 2008
69
APPENDIX E: Water Quality Plots
Sta 21FLSFWMKRFNC38
y = -1.6707x + 10.618R2 = 0.401
02468
10121416
0 1 2 3 4 5 6 7
DO (mg/l)
BOD
(mg/
l)
Figure E-1. Correlation between DO and BOD in WBID 3186B
Correlation between DO and Chla(corrected) at Sta 21FLSFWMKREA97
y = -1.1795x + 28.138R2 = 0.017
020406080
100120140
0 2 4 6 8 10 12 14
DO (mg/l)
Chla
(ug/
l)
Figure E-2. Correlation between DO and Chlorophyll-a in WBID 3186B

Lake Okeechobee Tributaries – Total Maximum Daily Load June 2008
70
Sta 21SFWMS65A
y = -1.1392x + 29.92R2 = 0.2989
05
101520
25303540
0 2 4 6 8 10 12 14
DO (mg/l)
Tem
pera
ture
(C)
Figure E- 3. Correlation between DO and Temperature in WBID 3186B
Sta 21FLSFWMKREA97 in WBID 3186B
y = -0.003x + 0.0783R2 = 0.0772
0
0.05
0.1
0.15
0.2
0 2 4 6 8 10 12 14
DO (mg/l)
TP (m
g/l)
Figure E- 4. Correlation between DO and TP in WBID 3186B

Lake Okeechobee Tributaries – Total Maximum Daily Load June 2008
71
Figure E- 5. Correlation between DO and TN in WBID 3186D
Station 21FLSFWMKREA78 in WBID 3186D
y = -3.3585x + 42.694R2 = 0.6885
0
5
10
15
20
25
30
35
0 1 2 3 4 5 6 7 8
DO (mg/l)
Tem
pera
ture
(C)
Figure E- 6. Correlation between Temperature and DO in WBID 3186D
DO and TN Correlation Plot at Sta 21FLSFWMKREA 78
y = -0.0698x + 1.0378R2 = 0.0244
00.20.40.60.8
11.21.41.6
0 1 2 3 4 5 6 7 8
DO (mg/l)
TN (m
g/l)