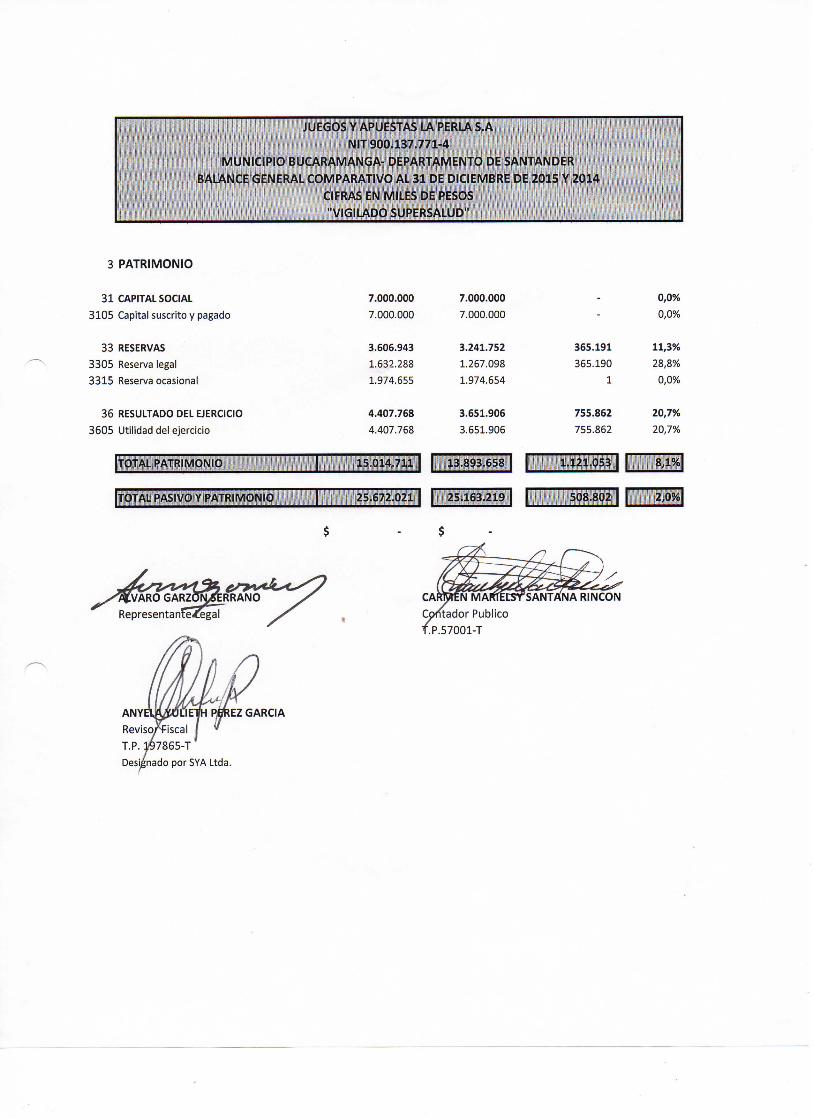
juegos y apuestas la perla sjuegos y apuestas la perla s.a nit 900.137.771-4 municipio bucaramanga-...
TRANSCRIPT

JUEGOS Y APUESTAS LA PERLA S.A NIT 9 0 0 . 1 3 7 . 7 7 1 - 4
MUNICIPIO BUCARAMANGA- DEPARTAMENTO DE SANTANDER BALANCE GENERAL COMPARATIVO AL 3 1 DE DICIEMBRE DE 2 0 1 5 Y 2 0 1 4
CIFRAS EN MILES DE PESOS "VIGILADO SUPERSALUD"
1 2 0 1 5 I 1 2 0 1 4 1 1 VAR. ABS « I 1 ACTIVO
1 AaiVO CORRIENTE 1 1 DISPONIBLE 8 . 0 2 4 . 5 0 6 8 . 0 6 6 . 4 2 3 ( 4 1 . 9 1 7 ) - 0 , 5 %
1 1 0 5 Caja 4 . 6 7 2 . 0 7 0 1 .273 .093 3 . 3 9 8 . 9 7 7 2 6 7 , 0 %
1 1 1 0 Bancos 1 .699.029 3 . 9 0 6 . 7 6 9 ( 2 . 2 0 7 . 7 4 0 ) - 5 6 , 5 %
1 1 2 0 Cuentas de A h o r r o 1 .653.407 2 . 8 8 6 . 5 6 1 ( 1 . 2 3 3 . 1 5 4 ) - 4 2 , 7 %
1 2 INVERSIONES 9 . 6 1 0 . 7 9 0 9 . 5 6 3 . 9 2 3 4 6 . 8 6 7 0 , 5 %
1 2 2 5 Cert i f icados 2 . 5 1 9 . 4 2 4 2 . 4 7 0 . 0 0 0 4 9 . 4 2 4 2 , 0 %
1 2 4 5 Derechos F iduciar ios 2 6 4 . 8 4 9 2 6 7 . 4 0 6 ( 2 . 5 5 7 ) - 1 , 0 %
1 2 5 0 O t r a s Invers iones 6 . 8 2 6 . 5 1 7 6 . 8 2 6 . 5 1 7 - 0 , 0 %
1 3 DEUDORES 3 . 9 7 7 . 8 3 1 4 . 2 4 3 . 1 3 4 ( 2 6 5 . 3 0 3 ) - 6 , 3 %
1 3 0 5 C l ientes 2 0 8 . 1 8 1 3 6 5 . 9 4 6 ( 1 5 7 . 7 6 5 ) - 4 3 , 1 %
1 3 3 0 Ant ic ipos y avances 8 9 2 . 0 5 7 8 8 9 . 3 9 6 2 . 6 6 1 0 , 3 %
1 3 3 5 Depósitos 9 4 4 . 8 3 0 1 . 0 1 2 . 5 8 1 ( 6 7 . 7 5 1 ) - 6 , 7 %
1 3 5 5 A n t i c i p o de i m p u e s t o s 1 .768.442 1 . 6 1 3 . 1 5 1 1 5 5 . 2 9 1 9 , 6 %
1 3 6 5 Cuentas por cobrar a t r a b a j a d o r e s 2 7 . 3 8 1 2 1 . 2 0 2 6 . 1 7 9 2 9 , 1 %
1 3 8 0 D e u d o r e s v a r i o s 1 3 6 . 9 4 0 3 4 0 . 8 5 8 ( 2 0 3 . 9 1 8 ) - 5 9 , 8 %
ITOTAL ACTIVO CORRIENTE | 2 1 . 6 1 3 . 1 2 7 1 1 2 1 . 8 7 3 . 4 8 0 1 1 ( 2 6 0 . 3 5 3 ) 1 1 - 1 . 2 % |
1 2 ACTIVO NO CORRIENTE
t
1 2 0 5 INVERSIONES 3 . 5 6 0 . 8 4 0 3 . 0 5 3 . 9 1 4 5 0 6 . 9 2 6 1 6 , 6 %
1 2 0 5 Acciones 3 . 5 6 0 . 8 4 0 3 . 0 5 3 . 9 1 4 5 0 6 . 9 2 6 1 5 , 6 %
1 5 PROPIEDADES PLANTA Y EQUIPO 4 9 8 . 0 5 4 6 5 . 3 6 6 4 3 2 . 6 8 8 6 6 1 , 9 %
1 5 1 6 Construcc iones y edi f i cac iones 4 1 4 . 4 7 6 4 1 4 . 4 7 6 - 0 , 0 % 1 5 2 4 Equipos de of i c ina 1 . 3 2 6 . 7 0 1 1 . 3 1 2 . 9 4 4 1 3 . 7 5 7 1 ,0% 1 5 2 8 Equipos de computación y comunicación 4 . 9 4 2 . 4 2 8 4 . 3 1 5 . 8 7 6 6 2 5 . 5 5 2 1 4 , 5 % 1 5 4 0 F lota y equ ip de t r a n s p o r t e 1 4 4 . 7 9 5 1 4 4 . 7 9 5 - 0 , 0 % 1 5 9 2 Depreciación a c u m u l a d a ( 6 . 3 3 0 . 3 4 6 ) ( 6 . 1 2 3 . 7 2 5 ) ( 2 0 6 . 6 2 1 ) 3 , 4 %
1 7 DIFERIDOS - 1 7 0 . 4 5 9 ( 1 7 0 . 4 5 9 ) - 1 0 0 , 0 %
1 7 0 5 Gastos pagados por a n t i c i p a d o - 1 9 . 4 3 9 ( 1 9 . 4 3 9 ) - 1 0 0 , 0 % 1 7 1 0 Cargos d i f e r i d o s - 1 5 1 . 0 2 0 ( 1 5 1 . 0 2 0 ) - 1 0 0 , 0 %
[ T O T A L AalvO NO CORRIENTE 1 4 . 0 5 8 . 8 9 4 ] 1 3 . 2 8 9 . 7 3 9 J 1 7 6 9 . 1 5 5 1 1 2 3 , 4 % |
ITOTAL ACTIVO 1 2 5 . 6 7 2 . 0 2 1 1 1 2 5 . 1 6 3 . 2 1 9 1 1 5 0 8 . 8 0 2 1 1 2 , 0 % |

MUNICIPIO BALANCE GENEkAL.
J\DO SUPERSALUD"
2 PASIVO
2 1 PASIVO CORRIENTE
21 OBLIGACIONES FINANCIERAS 500.000 583.334 (1.164.873) -199,7%
2 1 0 5 Bancos Nac ionales 5 0 0 . 0 0 0 5 8 3 . 3 3 4 (83.334) 1 0 0 , 0 %
2 3 CUENTAS POR PAGAR 4.672.516 5.683.904 (1.011.388) -17,8%
2 3 3 5 Costos y gastos por pagar 8 8 2 . 9 1 3 9 5 3 . 0 6 4 (70.151) - 7 , 4 % 2 3 6 0 Div idendos Por Pagar 2 . 2 5 1 . 4 0 0 2 . 4 6 2 . 9 4 2 (211.542) 1 0 0 , 0 % 2 3 6 5 Retención e n la f u e n t e 3 5 7 . 3 0 8 3 6 6 . 4 3 3 (9.125) - 2 , 5 % 2 3 6 8 I m p u e s t o s de i n d u s t r i a y c o m e r c i o 1.359 9 2 4 435 4 7 , 1 % 2 3 7 0 Retención y a p o r t e s de n o m i n a 1 8 . 2 8 4 2 1 . 1 8 2 (2.898) - 1 3 , 7 % 2 3 8 0 Acreedores v a r i o s 1 .161.252 1 .879 .359 (718.107) - 3 8 , 2 %
2 4 IMPUESTOS GRAVAMENES Y TASAS 4.679.214 4.210.026 469.188 11,1%
2 4 0 4 De r e n t a y c o m p l e m e n t a r i o s 1 .800.000 1 .434 .449 3 6 5 . 5 5 1 2 5 , 5 % 2 4 0 8 I m p u e s t o s o b r e las v e n t a s p o r pagar 1 .963.345 1 .879 .053 8 4 . 2 9 2 4 , 5 % 2 4 7 2 A l azar y juegos 9 1 5 . 8 6 9 8 9 6 . 5 2 4 1 9 . 3 4 5 2 , 2 %
2 5 OBLIGACIONES LABORALES 297.498 227.285 70.213 30,9%
2 5 0 5 Salarios por pagar 1 5 . 7 0 0 2 1 . 6 6 0 ( 5 . 9 6 0 ) - 2 7 , 5 % 2 5 1 0 Cesantías consol idadas 1 5 0 . 1 7 1 1 5 4 . 0 4 2 ( 3 . 8 7 1 ) - 2 , 5 % 2 5 1 5 Intereses s o b r e las cesantías 1 7 . 3 7 0 1 7 . 3 9 1 (21) - 0 , 1 % 2 5 2 0 P r i m a de servic ios t - 1 0 0 , 0 % 2 5 2 5 Vacaciones consol idadas 1 1 4 . 2 5 7 3 4 . 1 9 2 8 0 . 0 6 5 2 3 4 , 2 %
2 8 OTROS PASIVOS 508.082 565.012 (56.930) -10,1%
2 8 1 5 Ingresos recibidos para t e r c e r o s 5 0 8 . 0 8 2 5 6 5 . 0 1 2 ( 5 6 . 9 3 0 ) - 1 0 , 1 %
JTOTAL PASIVO CORRIENTE | 10.657.310 1 1 11.269.561 1 1 1612.251)1 1 -5,4%|
JTOTAL PASIVO | 10.657.310 1 1 11.269.561 1 1 (612.251)1 1 -5,4%|
JUEGOS Y APUESTAS LA PERLA S.A NIT 900.137.771-4
MUNICIPIO BUCARAMANGA- DEPARTAMENTO DE SANTANDER BALANCE GENERAL COMPARATIVO AL 31 DE DICIEMBRE DE 2015 Y 2014
CIFRAS EN MILES DE PESOS "VIGILADO SUPERSALUD"
3 PATRIMONIO
3 1 CAPITAL SOCIAL 7.000.000 7.000.000 0,0%
3105 Capital suscr i to y pagado 7 . 0 0 0 . 0 0 0 7 . 0 0 0 . 0 0 0 • 0 , 0 %
3 3 RESERVAS 3.606.943 3.241.752 365.191 11,3%
3 3 0 5 Reserva legal 1 .632.288 1 . 2 6 7 . 0 9 8 3 6 5 . 1 9 0 2 8 , 8 % 3 3 1 5 Reserva ocas iona l 1 .974.655 1 . 9 7 4 . 6 5 4 1 0 , 0 %
3 6 RESULTADO DEL EJERCICIO 4.407.768 3.651.906 755.862 20,7%
3 6 0 5 Ut i l idad del e jerc ic io 4 . 4 0 7 . 7 6 8 3 . 6 5 1 . 9 0 6 7 5 5 . 8 6 2 2 0 , 7 %
ITOTAL PATRIMONIO 1 1 5 . 0 1 4 . 7 1 1 1 1 1 3 . 8 9 3 . 6 5 8 1 j 1 . 1 2 1 . 0 5 3 1 1 8 , 1 % |
[ T O T A L P A S I V O Y P A T R I M O N I O 1 2 5 . 6 7 2 . 0 2 1 1 1 2 5 . 1 6 3 . 2 1 9 1 I 5 0 8 . 8 0 2 1 1 2 , 0 % |
^ . ^ V A R O G A R Z C ^ E R R A N O X
RepresentanTe<fegal
ANYI R e v i s o j T . P . Designado por SYA Ltda.
EZ GARCIA

JUEGOS Y APUESTAS LA PERLA S.A
NIT 900.137.771-4
MUNICIPIO BUCARAMANGA- DEPARTAMENTO DE SANTANDER
ESTADO DE RESULTADOS COMPARATIVO AL 3 1 DE DICIEMBRE DE 2 0 1 5 Y 2 0 1 4
CIFRA: c PESOS
"VIGILADO SUPERSALUD"
1 2015 1 1 2 0 1 4 1 VAR. ABS
4 INGRESOS
4l|lNGRES0S OPERACIONALES 1 75.129.528 | | 64.687.102 1 10.442.426 1 1 16,1%| 4 1 3 5 C o m e r c i o al p o r m a y o r y al p o r m e n o r 4 1 3 5 V e n t a de l o t e r i a s , r i f a s , c h a n c e , a p u e s t a s y s i m i l a r e s
COLOCACION DE APUESTAS PERMANENTE 68.895.535 60.142.655 8.752.880 14,6% 4 1 3 5 Chance 68.895.535 60.142.655 8.752.880 1 4 , 6 %
COLABORACION EMPRESARIAL 6.233.993 4.544.447 1.689.546 37,2% 4 1 3 5 Corredor empresarial 1.937.208 1.164.970 772.238 6 6 , 3 % 4 1 3 5 Matr i z S.A. 2.583.807 1.943.067 640.740 3 3 , 0 % 4135 Conexred 1.712.978 1.436.410 276.568 19,3%
6|C0ST0 DE VENTAS Y DE PRESTACION DE SERVICIOS 1 44.972.933 | | 40.852.227 | 4.120.706 1 1 io,i%| 6 1 C o m e r c i o al p o r m a y o r y al por menor
6 1 3 5 V e n t a d e l o t e r i a s , r i f a s , c h a n c e , a p u e s t a s y s i m i l a r e s COLOCACION DE APUESTAS PERMANENTE 44.972.933 40.852.227 4.120.706 10,1%
6 1 3 5 Premios 35.669.310 34.145.757 1.523.553 4 ,5% 6 1 3 5 Formularios 541.924 408.577 1 3 3 . 3 4 7 3 2 , 6 % 6 1 3 5 Derechos de explotación 8.761.699 6.297.893 2 . 4 6 3 . 8 0 6 3 9 , 1 %
1 UTILIDAD BRUTA 1 30.156.595 1 1 23.834.875 | 6.321.720 1 1 26,5%|
5 GASTOS
51|GAST0S OPERACIONALES 23.592.192 | | 20.131.615 1 3.460.577 1 1 17,2%|
5 1 De administración 8.207.775 8.387.531 (179.756) -2,1% 5 1 0 5 Gastos de personal 2.161.016 1.948.617 212.399 10,9% 5 1 1 0 Honorarios 1.204.750 853.449 3 5 1 . 3 0 1 4 1 , 2 % 5 1 1 5 Impuestos 104.459 120.623 (16.164) - 1 3 , 4 % 5 1 2 0 Arrendamientos 1.882.668 1.423.045 459.623 3 2 , 3 % 5 1 2 5 Contribuciones y afiliaciones 40.838 63.448 (22.610) - 3 5 , 6 % 5 1 3 0 Seguros 105.609 5.557 100.052 1800,5%
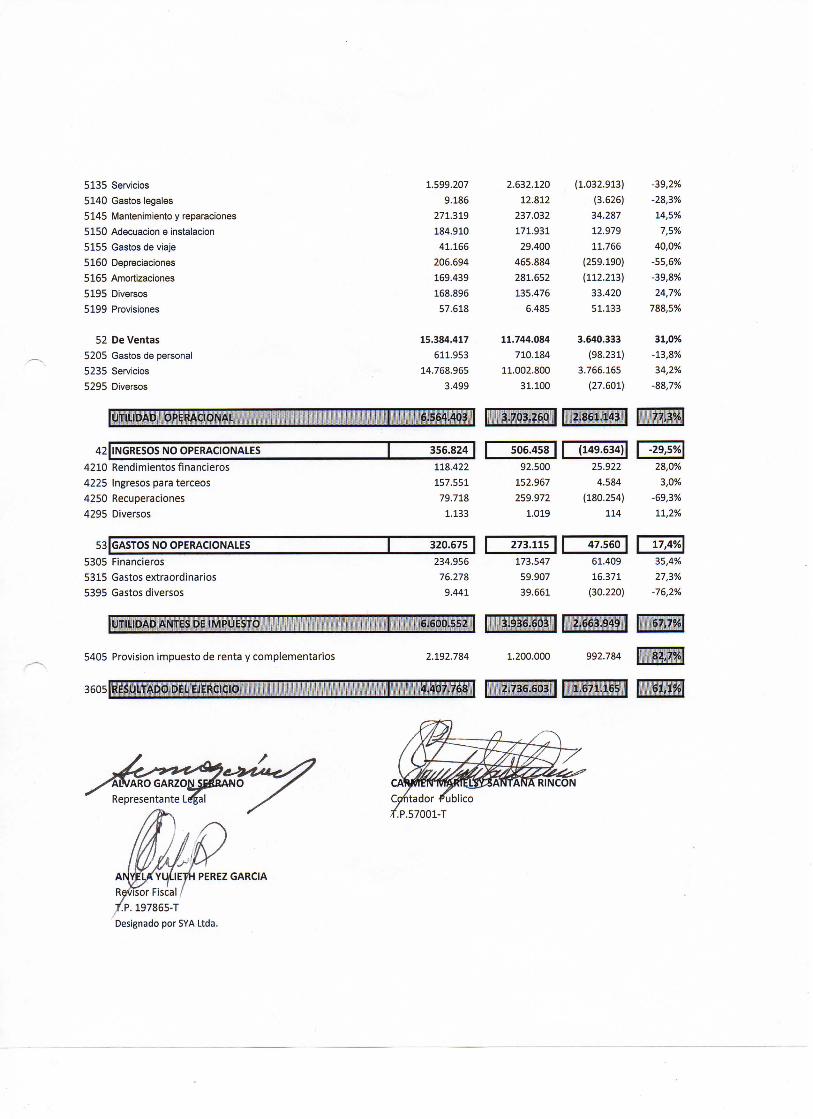
5 1 3 5 Servicios 1.599.207 2.532.120 (1.032.913) - 3 9 , 2 % 5 1 4 0 Gastos legales 9.186 12.812 (3.525) - 2 8 , 3 % 5 1 4 5 Mantenimiento y reparaciones 271.319 237.032 34.287 1 4 , 5 % 5 1 5 0 Adecuación e instalación 184.910 1 7 1 . 9 3 1 12.979 7,5% 5 1 5 5 Gastos de viaje 41.166 29.400 11.765 4 0 , 0 % 5 1 6 0 Depreciaciones 206.694 4 5 5 . 8 8 4 (259.190) - 5 5 , 5 % 5 1 6 5 Amortizaciones 169.439 281.652 (112.213) - 3 9 , 8 % 5 1 9 5 Diversos 168.895 135.475 33.420 2 4 , 7 % 5 1 9 9 Provisiones 57.518 5.485 51.133 7 8 8 , 5 %
5 2 De Ventas 15.384.417 11.744.084 3.640.333 31,0% 5 2 0 5 Gastos de personal 611.953 710.184 (98.231) - 1 3 , 8 % 5 2 3 5 Servicios 14.758.955 11.002.800 3.756.165 3 4 , 2 % 5 2 9 5 Diversos 3.499 31.100 (27.501) - 8 8 , 7 %
•UTILIDAD OPERACIONAL 1 6.564.403 1 3.703.260 1 1 2.861.143 1 77,3%!
42|lNGRESOS NO OPERACIONALES 1 356.824 1 506.458 1 1 (149.634)1 -29,5%| 4 2 1 0 R e n d i m i e n t o s f i n a n c i e r o s 118.422 92.500 25.922 2 8 , 0 % 4 2 2 5 Ingresos para t e r c e o s 1 5 7 . 5 5 1 152.967 4.584 3 ,0% 4 2 5 0 R e c u p e r a c i o n e s 79.718 259.972 (180.254) - 5 9 , 3 % 4 2 9 5 Diversos 1.133 1.019 114 1 1 , 2 %
53 [GASTOS NO OPERACIONALES 1 320.675 1 273.115 1 1 47.560 [ 17,4%| 5 3 0 5 F i n a n c i e r o s 234.955 173.547 61.409 3 5 , 4 % 5 3 1 5 Gastos e x t r a o r d i n a r i o s 75.278 59.907 1 5 . 3 7 1 2 7 , 3 % 5 3 9 5 Gastos d i v e r s o s 9 . 4 4 1 3 9 . 5 5 1 (30.220) - 7 5 , 2 %
[UTILIDAD ANTES DE IMPUESTO ' I 6.600.552 1 3.936.603 1 1 2.663.949 j 67,7%|
5 4 0 5 Provisión i m p u e s t o d e r e n t a y c o m p l e m e n t a r i o s 2.192.784 1.200.000 992.784 82,7%|
3605[RESULTADO DEL EJERCICIO 1 4.407.768 1 2.736.603 1 1 1.671.165 1 61,1%!
Cpfítador -fojblico rP.57001-T
Aiyjm<YLj(.IETH PEREZ GARCIA Revisor Fiscal /
, / p . 1 9 7 8 6 5 - T Designado por SYA Ltda.