f.heitmeir, j.woisetschläger, w.sanz, h.jericha (2003...
TRANSCRIPT

F.Heitmeir, J.Woisetschläger, W.Sanz, H.Jericha (2003) Transonic turbine testing, Proceedings 5 th European Conference on Turbomachinery, Praque, 2003, pp 837-848
TRANSONIC TURBINE TESTING
Franz Heitmeir, Jakob Woisetschläger, Wolfgang Sanz and Herbert Jericha
Institute for Thermal Turbomachinery and Machine Dynamics Graz University of Technology
Graz, Austria [email protected]
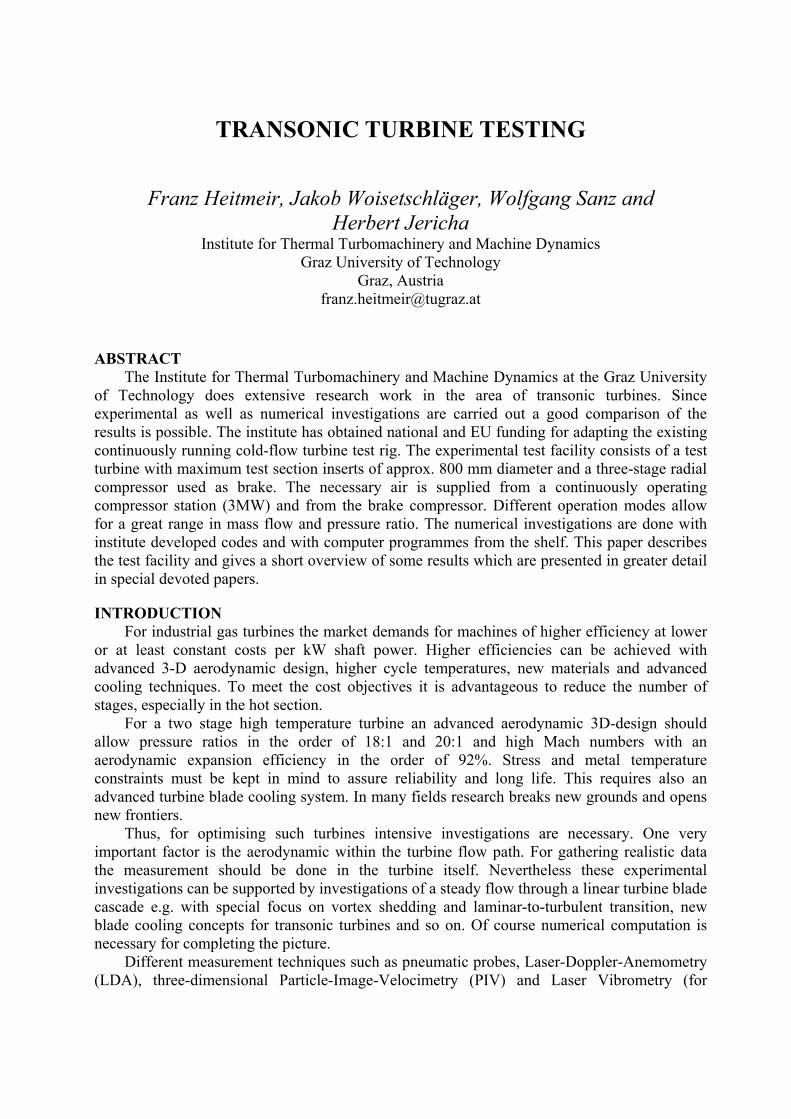
ABSTRACT The Institute for Thermal Turbomachinery and Machine Dynamics at the Graz University
of Technology does extensive research work in the area of transonic turbines. Since experimental as well as numerical investigations are carried out a good comparison of the results is possible. The institute has obtained national and EU funding for adapting the existing continuously running cold-flow turbine test rig. The experimental test facility consists of a test turbine with maximum test section inserts of approx. 800 mm diameter and a three-stage radial compressor used as brake. The necessary air is supplied from a continuously operating compressor station (3MW) and from the brake compressor. Different operation modes allow for a great range in mass flow and pressure ratio. The numerical investigations are done with institute developed codes and with computer programmes from the shelf. This paper describes the test facility and gives a short overview of some results which are presented in greater detail in special devoted papers.
INTRODUCTION For industrial gas turbines the market demands for machines of higher efficiency at lower
or at least constant costs per kW shaft power. Higher efficiencies can be achieved with advanced 3-D aerodynamic design, higher cycle temperatures, new materials and advanced cooling techniques. To meet the cost objectives it is advantageous to reduce the number of stages, especially in the hot section.
For a two stage high temperature turbine an advanced aerodynamic 3D-design should allow pressure ratios in the order of 18:1 and 20:1 and high Mach numbers with an aerodynamic expansion efficiency in the order of 92%. Stress and metal temperature constraints must be kept in mind to assure reliability and long life. This requires also an advanced turbine blade cooling system. In many fields research breaks new grounds and opens new frontiers.
Thus, for optimising such turbines intensive investigations are necessary. One very important factor is the aerodynamic within the turbine flow path. For gathering realistic data the measurement should be done in the turbine itself. Nevertheless these experimental investigations can be supported by investigations of a steady flow through a linear turbine blade cascade e.g. with special focus on vortex shedding and laminar-to-turbulent transition, new blade cooling concepts for transonic turbines and so on. Of course numerical computation is necessary for completing the picture.
Different measurement techniques such as pneumatic probes, Laser-Doppler-Anemometry (LDA), three-dimensional Particle-Image-Velocimetry (PIV) and Laser Vibrometry (for

frequency analysis of density fluctuations in the flow) give an insight into the three-dimensional unsteady flow field between and after the blades. These unsteady data can be completed by time-averaged probe measurements to provide a full data-set of the 3-D vector fields in planes between the stator and rotor, in the rotor and behind the rotor. The results from investigations into the above mentioned high-pressure high temperature turbine with an advanced aerodynamic design show interesting features which could influence new turbine designs e.g. rotor-stator flow interaction and phase-locking of vortex shedding frequency to the rotor passing frequency.
Even with high sophisticated experimental equipment some flow phenomena could not be accessed sufficiently or need more detailed investigation. Therefore the experimental investigations should be supported with numerical computations to get a more detailed insight into the steady and unsteady flow phenomena. In the following the results from a modern self-developed CFD code are presented. It was used to simulate the Reynolds-averaged Navier-Stokes flow. Tip leakage flow was considered by meshing the leakage between rotor blades and casing. Phase-lagged boundary conditions allow the time-accurate calculation of the rotor-stator interaction by considering only one stator and rotor blade passage.
DESCRIPTION OF TEST TURBINE FACILITY Fig. 1 shows a schematic diagram of the turbine test rig. A 3 MW compressor station
delivers the pressurised air to the turbine stage. The produced shaft power of test turbine is counteracted by a 3 stage radial compressor and not as usual by a water brake. The solution with the brake compressor is a very efficient alternative to a water brake because most of the braking power can be recovered. The pressurised air from the brake compressor can be added to the air from the compressor station in a mixing chamber and thus increase the overall mass flow. The air from the compressor station can be cooled down to about 40 °C, whereas the air of the brake compressor is not cooled. The mixing chamber is therefore equipped with inserts in order to homogenise the air temperature profile at the turbine inlet. The exhaust air from the turbine normally flows through an exhaust line directly to the silencers in the exhaust tower. For further increasing the pressure ratio over the test turbine a suction blower in the exhaust duct is available. It reduces the turbine back pressure and is driven by a 750 kW helicopter engine.
Figure 1: Schematic diagram of the turbine test rig
The operation of the facility and the interaction of the different components of this complex configuration are described by Neumayer et al. [1]. Special effort was put into securing a safe operation of the whole system. A detailed discussion of this topic with a special emphasis on the emergency shutdown and on load changes of the facility can be found in [2].
Depending on the flow similarity requirements (corrected speed and pressure ratio) of the turbine stage to be tested it can occur that the brake compressor does not achieve the prescribed pressure ratio for the given speed. In this case the compressed air from the brake compressor is fed directly to the exhaust line, the bypass valve remains partly open to maintain the braking effect.
For the test set up discussed in the following the maximum mass flow from the air supply compressors was about 9.5 kg/s without and about 22 kg/s with the air from the brake compressor. If necessary the turbine stage to be tested must be scaled in such a way that the turbine mass flow does not exceed the maximum air supply.
The concept of this test facility allows a continuous operation of the test turbine within a widely adjustable speed range between 7000 and 11550 rpm, limited by the brake compressor disks. The maximum turbine inlet pressure is 4.7 bar limited by the strength of the mixing chamber, the range of turbine inlet temperatures is from 40 to 185 °C. The operation conditions result in a maximum shaft power of about 2.8 MW depending on the characteristic of the turbine stage mounted. The modular design of the test turbine allows quick modifications. The flow path, the stages as well as the diffuser can be adapted in a wide range [3]. The maximum diameter of inserts into the test section is limited to 800 mm.
The stator of the test turbine is mounted on a rotatable ring allowing a circumferential traversing of the flow path with an optical system which is fixed to one point.
A very unique and important feature of the test set up is the optical access to the flow path through large windows. This feature is described in the following chapter.
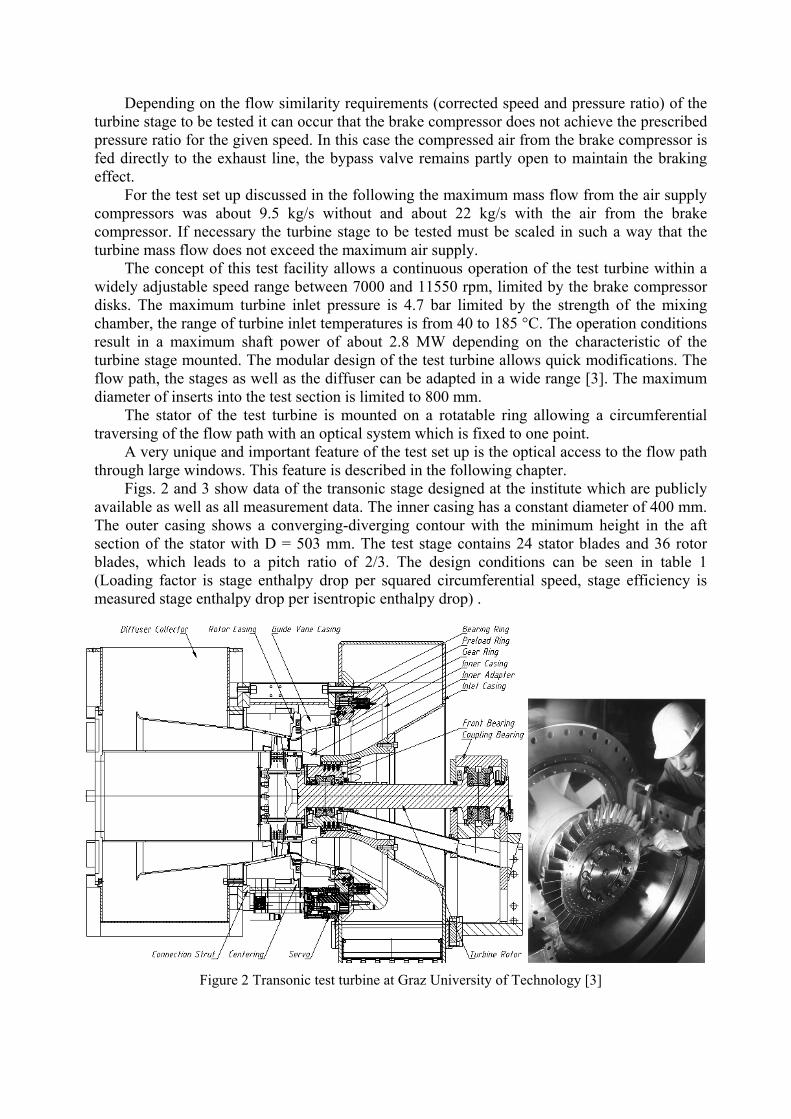
Figs. 2 and 3 show data of the transonic stage designed at the institute which are publicly available as well as all measurement data. The inner casing has a constant diameter of 400 mm. The outer casing shows a converging-diverging contour with the minimum height in the aft section of the stator with D = 503 mm. The test stage contains 24 stator blades and 36 rotor blades, which leads to a pitch ratio of 2/3. The design conditions can be seen in table 1 (Loading factor is stage enthalpy drop per squared circumferential speed, stage efficiency is measured stage enthalpy drop per isentropic enthalpy drop) .
Figure 2 Transonic test turbine at Graz University of Technology [3]
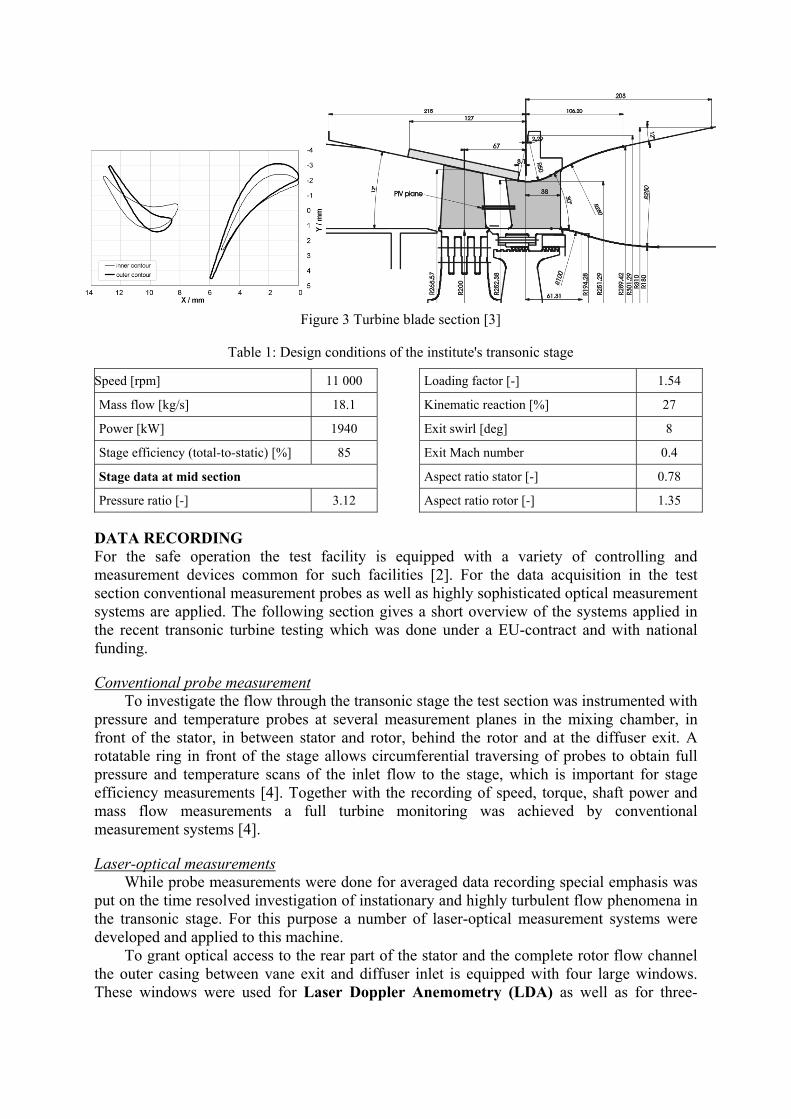
Figure 3 Turbine blade section [3]
Table 1: Design conditions of the institute's transonic stage
Speed [rpm] 11 000
Mass flow [kg/s] 18.1
Power [kW] 1940
Stage efficiency (total-to-static) [%] 85
Stage data at mid section
Pressure ratio [-] 3.12
Loading factor [-] 1.54
Kinematic reaction [%] 27
Exit swirl [deg] 8
Exit Mach number 0.4
Aspect ratio stator [-] 0.78
Aspect ratio rotor [-] 1.35
DATA RECORDING For the safe operation the test facility is equipped with a variety of controlling and measurement devices common for such facilities [2]. For the data acquisition in the test section conventional measurement probes as well as highly sophisticated optical measurement systems are applied. The following section gives a short overview of the systems applied in the recent transonic turbine testing which was done under a EU-contract and with national funding.
Conventional probe measurement To investigate the flow through the transonic stage the test section was instrumented with
pressure and temperature probes at several measurement planes in the mixing chamber, in front of the stator, in between stator and rotor, behind the rotor and at the diffuser exit. A rotatable ring in front of the stage allows circumferential traversing of probes to obtain full pressure and temperature scans of the inlet flow to the stage, which is important for stage efficiency measurements [4]. Together with the recording of speed, torque, shaft power and mass flow measurements a full turbine monitoring was achieved by conventional measurement systems [4].
Laser-optical measurements While probe measurements were done for averaged data recording special emphasis was
put on the time resolved investigation of instationary and highly turbulent flow phenomena in the transonic stage. For this purpose a number of laser-optical measurement systems were developed and applied to this machine.
To grant optical access to the rear part of the stator and the complete rotor flow channel the outer casing between vane exit and diffuser inlet is equipped with four large windows. These windows were used for Laser Doppler Anemometry (LDA) as well as for three-
dimensional Particle Image Velocimetry (PIV) and Laser Vibrometer (LV) investigations of the flow between stator and rotor as well as in and behind the rotor. Instead of traversing the laser probes circumferentially the stator blades were mounted on the rotatable ring and are rotated to obtain a scan of the complete stator spacing. The rotation of the stator was also applied to obtain flow data behind the rotor for different stator positions.
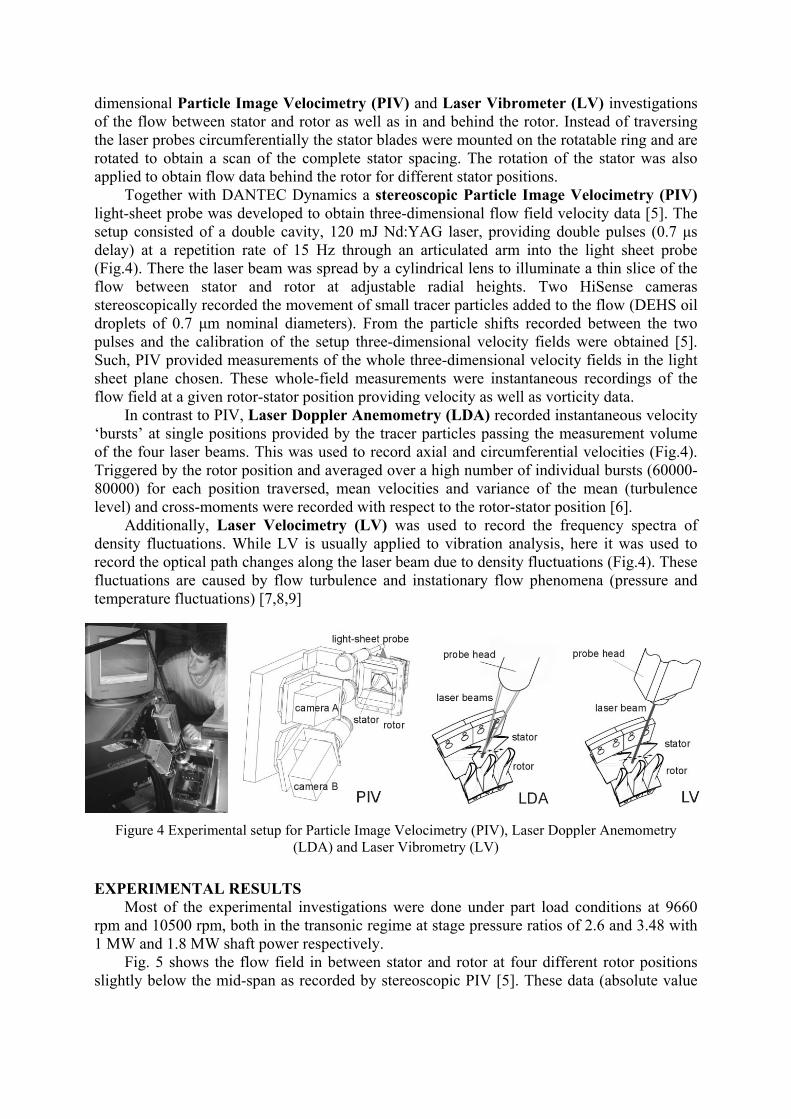
Together with DANTEC Dynamics a stereoscopic Particle Image Velocimetry (PIV) light-sheet probe was developed to obtain three-dimensional flow field velocity data [5]. The setup consisted of a double cavity, 120 mJ Nd:YAG laser, providing double pulses (0.7 µs delay) at a repetition rate of 15 Hz through an articulated arm into the light sheet probe (Fig.4). There the laser beam was spread by a cylindrical lens to illuminate a thin slice of the flow between stator and rotor at adjustable radial heights. Two HiSense cameras stereoscopically recorded the movement of small tracer particles added to the flow (DEHS oil droplets of 0.7 µm nominal diameters). From the particle shifts recorded between the two pulses and the calibration of the setup three-dimensional velocity fields were obtained [5]. Such, PIV provided measurements of the whole three-dimensional velocity fields in the light sheet plane chosen. These whole-field measurements were instantaneous recordings of the flow field at a given rotor-stator position providing velocity as well as vorticity data.
In contrast to PIV, Laser Doppler Anemometry (LDA) recorded instantaneous velocity ‘bursts’ at single positions provided by the tracer particles passing the measurement volume of the four laser beams. This was used to record axial and circumferential velocities (Fig.4). Triggered by the rotor position and averaged over a high number of individual bursts (60000-80000) for each position traversed, mean velocities and variance of the mean (turbulence level) and cross-moments were recorded with respect to the rotor-stator position [6].
Additionally, Laser Velocimetry (LV) was used to record the frequency spectra of density fluctuations. While LV is usually applied to vibration analysis, here it was used to record the optical path changes along the laser beam due to density fluctuations (Fig.4). These fluctuations are caused by flow turbulence and instationary flow phenomena (pressure and temperature fluctuations) [7,8,9]
Figure 4 Experimental setup for Particle Image Velocimetry (PIV), Laser Doppler Anemometry
(LDA) and Laser Vibrometry (LV)
EXPERIMENTAL RESULTS Most of the experimental investigations were done under part load conditions at 9660
rpm and 10500 rpm, both in the transonic regime at stage pressure ratios of 2.6 and 3.48 with 1 MW and 1.8 MW shaft power respectively.
Fig. 5 shows the flow field in between stator and rotor at four different rotor positions slightly below the mid-span as recorded by stereoscopic PIV [5]. These data (absolute value
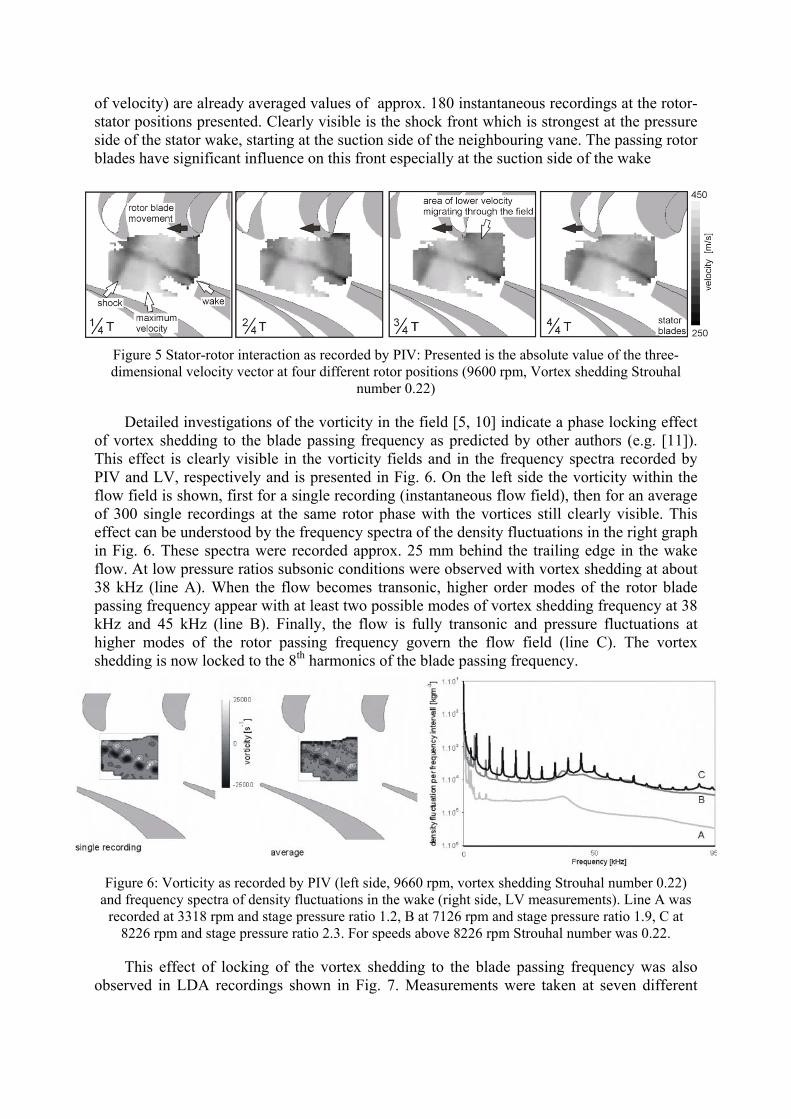
of velocity) are already averaged values of approx. 180 instantaneous recordings at the rotor-stator positions presented. Clearly visible is the shock front which is strongest at the pressure side of the stator wake, starting at the suction side of the neighbouring vane. The passing rotor blades have significant influence on this front especially at the suction side of the wake
Figure 5 Stator-rotor interaction as recorded by PIV: Presented is the absolute value of the three-dimensional velocity vector at four different rotor positions (9600 rpm, Vortex shedding Strouhal
number 0.22)
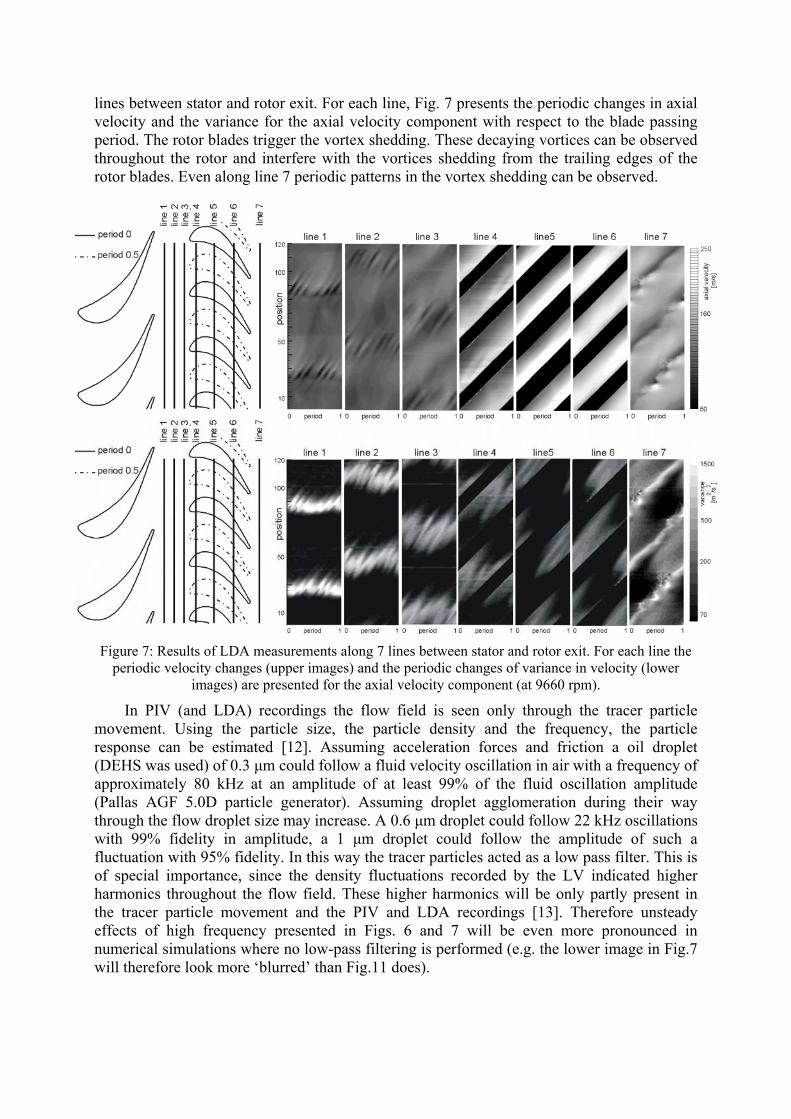
Detailed investigations of the vorticity in the field [5, 10] indicate a phase locking effect of vortex shedding to the blade passing frequency as predicted by other authors (e.g. [11]). This effect is clearly visible in the vorticity fields and in the frequency spectra recorded by PIV and LV, respectively and is presented in Fig. 6. On the left side the vorticity within the flow field is shown, first for a single recording (instantaneous flow field), then for an average of 300 single recordings at the same rotor phase with the vortices still clearly visible. This effect can be understood by the frequency spectra of the density fluctuations in the right graph in Fig. 6. These spectra were recorded approx. 25 mm behind the trailing edge in the wake flow. At low pressure ratios subsonic conditions were observed with vortex shedding at about 38 kHz (line A). When the flow becomes transonic, higher order modes of the rotor blade passing frequency appear with at least two possible modes of vortex shedding frequency at 38 kHz and 45 kHz (line B). Finally, the flow is fully transonic and pressure fluctuations at higher modes of the rotor passing frequency govern the flow field (line C). The vortex shedding is now locked to the 8th harmonics of the blade passing frequency.
Figure 6: Vorticity as recorded by PIV (left side, 9660 rpm, vortex shedding Strouhal number 0.22)
and frequency spectra of density fluctuations in the wake (right side, LV measurements). Line A was recorded at 3318 rpm and stage pressure ratio 1.2, B at 7126 rpm and stage pressure ratio 1.9, C at
8226 rpm and stage pressure ratio 2.3. For speeds above 8226 rpm Strouhal number was 0.22.
This effect of locking of the vortex shedding to the blade passing frequency was also observed in LDA recordings shown in Fig. 7. Measurements were taken at seven different
lines between stator and rotor exit. For each line, Fig. 7 presents the periodic changes in axial velocity and the variance for the axial velocity component with respect to the blade passing period. The rotor blades trigger the vortex shedding. These decaying vortices can be observed throughout the rotor and interfere with the vortices shedding from the trailing edges of the rotor blades. Even along line 7 periodic patterns in the vortex shedding can be observed.
Figure 7: Results of LDA measurements along 7 lines between stator and rotor exit. For each line the
periodic velocity changes (upper images) and the periodic changes of variance in velocity (lower images) are presented for the axial velocity component (at 9660 rpm).
In PIV (and LDA) recordings the flow field is seen only through the tracer particle movement. Using the particle size, the particle density and the frequency, the particle response can be estimated [12]. Assuming acceleration forces and friction a oil droplet (DEHS was used) of 0.3 µm could follow a fluid velocity oscillation in air with a frequency of approximately 80 kHz at an amplitude of at least 99% of the fluid oscillation amplitude (Pallas AGF 5.0D particle generator). Assuming droplet agglomeration during their way through the flow droplet size may increase. A 0.6 µm droplet could follow 22 kHz oscillations with 99% fidelity in amplitude, a 1 µm droplet could follow the amplitude of such a fluctuation with 95% fidelity. In this way the tracer particles acted as a low pass filter. This is of special importance, since the density fluctuations recorded by the LV indicated higher harmonics throughout the flow field. These higher harmonics will be only partly present in the tracer particle movement and the PIV and LDA recordings [13]. Therefore unsteady effects of high frequency presented in Figs. 6 and 7 will be even more pronounced in numerical simulations where no low-pass filtering is performed (e.g. the lower image in Fig.7 will therefore look more ‘blurred’ than Fig.11 does).
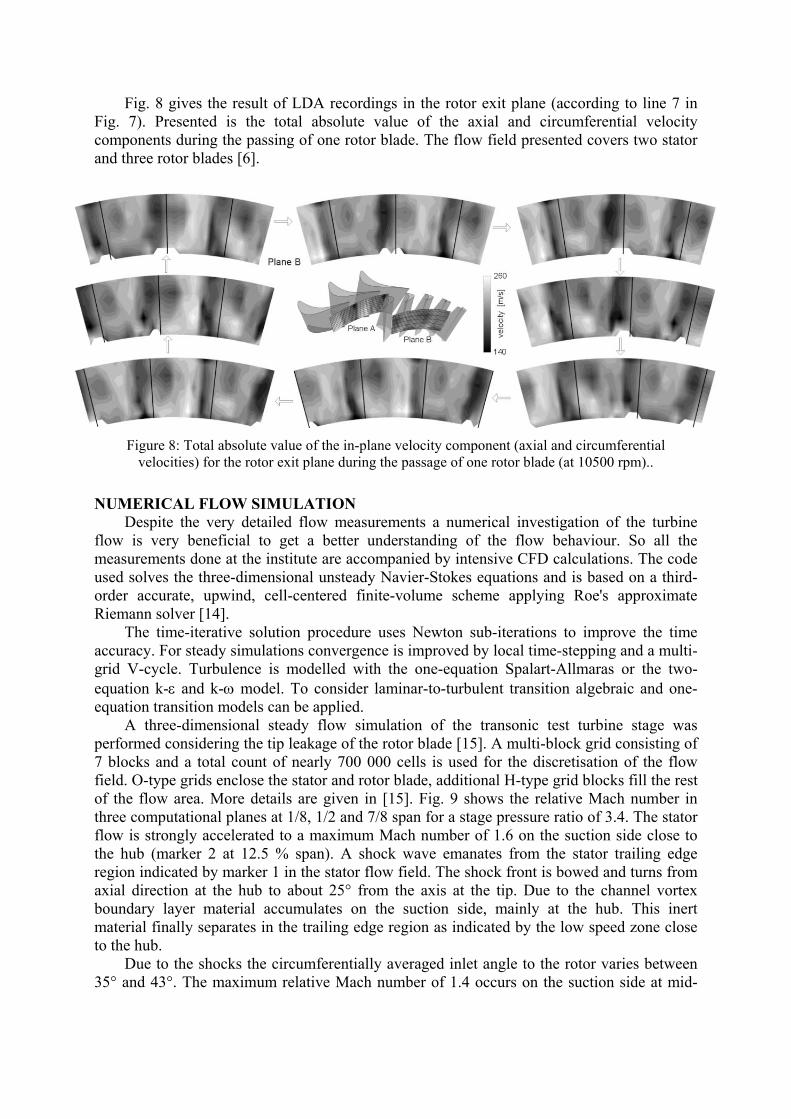
Fig. 8 gives the result of LDA recordings in the rotor exit plane (according to line 7 in Fig. 7). Presented is the total absolute value of the axial and circumferential velocity components during the passing of one rotor blade. The flow field presented covers two stator and three rotor blades [6].
Figure 8: Total absolute value of the in-plane velocity component (axial and circumferential
velocities) for the rotor exit plane during the passage of one rotor blade (at 10500 rpm)..
NUMERICAL FLOW SIMULATION Despite the very detailed flow measurements a numerical investigation of the turbine
flow is very beneficial to get a better understanding of the flow behaviour. So all the measurements done at the institute are accompanied by intensive CFD calculations. The code used solves the three-dimensional unsteady Navier-Stokes equations and is based on a third-order accurate, upwind, cell-centered finite-volume scheme applying Roe's approximate Riemann solver [14].
The time-iterative solution procedure uses Newton sub-iterations to improve the time accuracy. For steady simulations convergence is improved by local time-stepping and a multi-grid V-cycle. Turbulence is modelled with the one-equation Spalart-Allmaras or the two-equation k-ε and k-ω model. To consider laminar-to-turbulent transition algebraic and one-equation transition models can be applied.
A three-dimensional steady flow simulation of the transonic test turbine stage was performed considering the tip leakage of the rotor blade [15]. A multi-block grid consisting of 7 blocks and a total count of nearly 700 000 cells is used for the discretisation of the flow field. O-type grids enclose the stator and rotor blade, additional H-type grid blocks fill the rest of the flow area. More details are given in [15]. Fig. 9 shows the relative Mach number in three computational planes at 1/8, 1/2 and 7/8 span for a stage pressure ratio of 3.4. The stator flow is strongly accelerated to a maximum Mach number of 1.6 on the suction side close to the hub (marker 2 at 12.5 % span). A shock wave emanates from the stator trailing edge region indicated by marker 1 in the stator flow field. The shock front is bowed and turns from axial direction at the hub to about 25° from the axis at the tip. Due to the channel vortex boundary layer material accumulates on the suction side, mainly at the hub. This inert material finally separates in the trailing edge region as indicated by the low speed zone close to the hub.
Due to the shocks the circumferentially averaged inlet angle to the rotor varies between 35° and 43°. The maximum relative Mach number of 1.4 occurs on the suction side at mid-
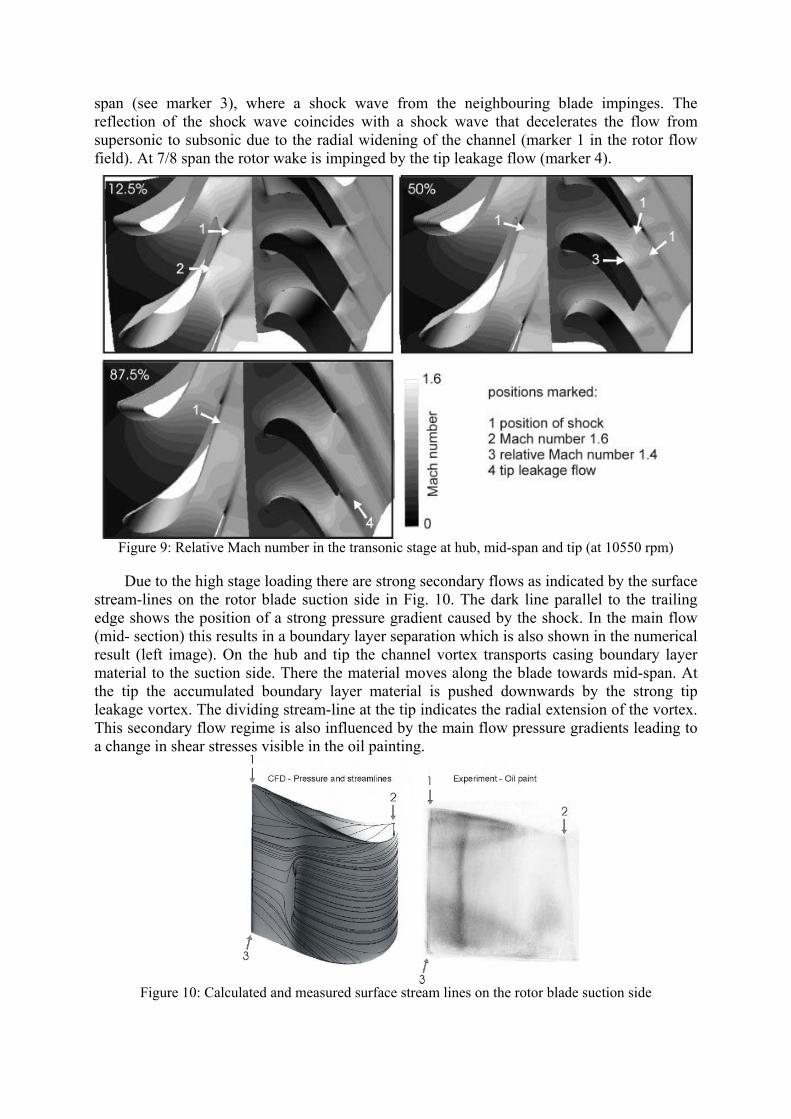
span (see marker 3), where a shock wave from the neighbouring blade impinges. The reflection of the shock wave coincides with a shock wave that decelerates the flow from supersonic to subsonic due to the radial widening of the channel (marker 1 in the rotor flow field). At 7/8 span the rotor wake is impinged by the tip leakage flow (marker 4).
Figure 9: Relative Mach number in the transonic stage at hub, mid-span and tip (at 10550 rpm)
Due to the high stage loading there are strong secondary flows as indicated by the surface stream-lines on the rotor blade suction side in Fig. 10. The dark line parallel to the trailing edge shows the position of a strong pressure gradient caused by the shock. In the main flow (mid- section) this results in a boundary layer separation which is also shown in the numerical result (left image). On the hub and tip the channel vortex transports casing boundary layer material to the suction side. There the material moves along the blade towards mid-span. At the tip the accumulated boundary layer material is pushed downwards by the strong tip leakage vortex. The dividing stream-line at the tip indicates the radial extension of the vortex. This secondary flow regime is also influenced by the main flow pressure gradients leading to a change in shear stresses visible in the oil painting.
Figure 10: Calculated and measured surface stream lines on the rotor blade suction side
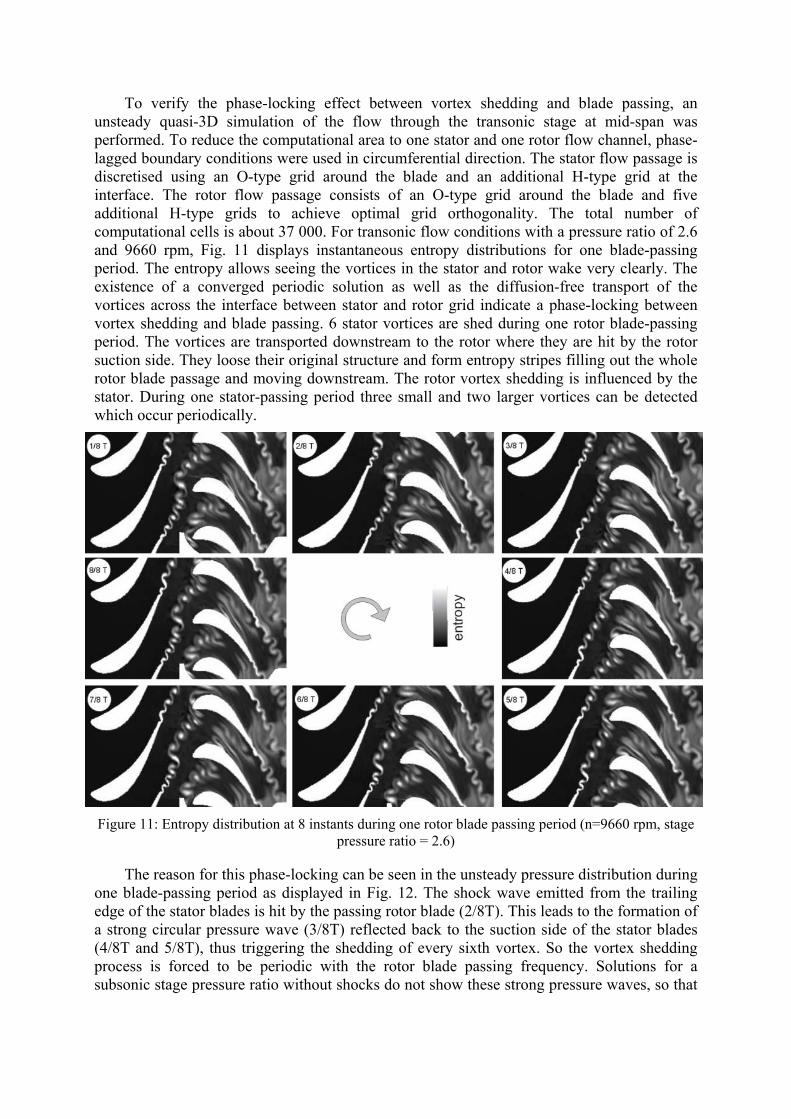
To verify the phase-locking effect between vortex shedding and blade passing, an unsteady quasi-3D simulation of the flow through the transonic stage at mid-span was performed. To reduce the computational area to one stator and one rotor flow channel, phase-lagged boundary conditions were used in circumferential direction. The stator flow passage is discretised using an O-type grid around the blade and an additional H-type grid at the interface. The rotor flow passage consists of an O-type grid around the blade and five additional H-type grids to achieve optimal grid orthogonality. The total number of computational cells is about 37 000. For transonic flow conditions with a pressure ratio of 2.6 and 9660 rpm, Fig. 11 displays instantaneous entropy distributions for one blade-passing period. The entropy allows seeing the vortices in the stator and rotor wake very clearly. The existence of a converged periodic solution as well as the diffusion-free transport of the vortices across the interface between stator and rotor grid indicate a phase-locking between vortex shedding and blade passing. 6 stator vortices are shed during one rotor blade-passing period. The vortices are transported downstream to the rotor where they are hit by the rotor suction side. They loose their original structure and form entropy stripes filling out the whole rotor blade passage and moving downstream. The rotor vortex shedding is influenced by the stator. During one stator-passing period three small and two larger vortices can be detected which occur periodically.
Figure 11: Entropy distribution at 8 instants during one rotor blade passing period (n=9660 rpm, stage
pressure ratio = 2.6)
The reason for this phase-locking can be seen in the unsteady pressure distribution during one blade-passing period as displayed in Fig. 12. The shock wave emitted from the trailing edge of the stator blades is hit by the passing rotor blade (2/8T). This leads to the formation of a strong circular pressure wave (3/8T) reflected back to the suction side of the stator blades (4/8T and 5/8T), thus triggering the shedding of every sixth vortex. So the vortex shedding process is forced to be periodic with the rotor blade passing frequency. Solutions for a subsonic stage pressure ratio without shocks do not show these strong pressure waves, so that
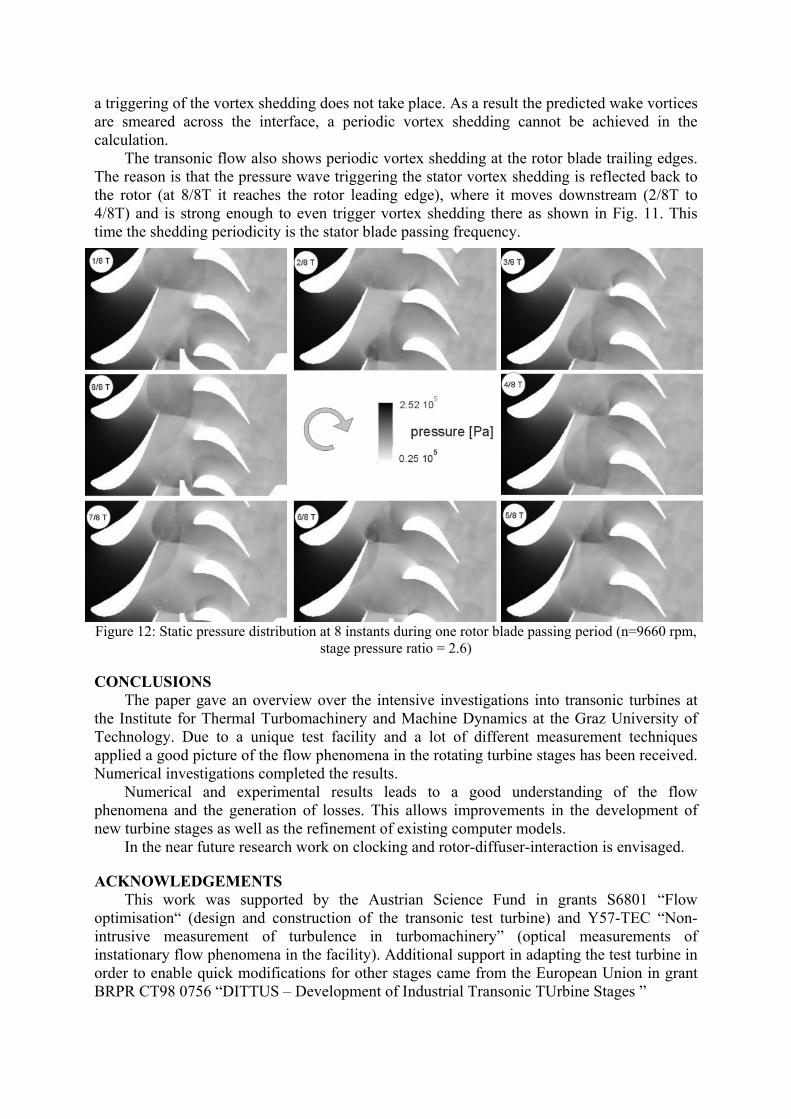
a triggering of the vortex shedding does not take place. As a result the predicted wake vortices are smeared across the interface, a periodic vortex shedding cannot be achieved in the calculation.
The transonic flow also shows periodic vortex shedding at the rotor blade trailing edges. The reason is that the pressure wave triggering the stator vortex shedding is reflected back to the rotor (at 8/8T it reaches the rotor leading edge), where it moves downstream (2/8T to 4/8T) and is strong enough to even trigger vortex shedding there as shown in Fig. 11. This time the shedding periodicity is the stator blade passing frequency.
Figure 12: Static pressure distribution at 8 instants during one rotor blade passing period (n=9660 rpm,
stage pressure ratio = 2.6)
CONCLUSIONS The paper gave an overview over the intensive investigations into transonic turbines at
the Institute for Thermal Turbomachinery and Machine Dynamics at the Graz University of Technology. Due to a unique test facility and a lot of different measurement techniques applied a good picture of the flow phenomena in the rotating turbine stages has been received. Numerical investigations completed the results.
Numerical and experimental results leads to a good understanding of the flow phenomena and the generation of losses. This allows improvements in the development of new turbine stages as well as the refinement of existing computer models.
In the near future research work on clocking and rotor-diffuser-interaction is envisaged.
ACKNOWLEDGEMENTS This work was supported by the Austrian Science Fund in grants S6801 “Flow
optimisation“ (design and construction of the transonic test turbine) and Y57-TEC “Non-intrusive measurement of turbulence in turbomachinery” (optical measurements of instationary flow phenomena in the facility). Additional support in adapting the test turbine in order to enable quick modifications for other stages came from the European Union in grant BRPR CT98 0756 “DITTUS – Development of Industrial Transonic TUrbine Stages ”
REFERENCES [1] Neumayer, F., Kulhanek, G., Pirker, H.-P., Jericha, H., Seyr, A., Sanz, W. (2001), Operational behaviour of a transonic test turbine facility, Proceedings ASME, TURBO EXPO 2001, ASME Paper No- 2001-GT-489 [2] Neumayer, F. (2001) Time-Resolved Simulation of the Operational Behaviour of a Test Turbine Facility, Proc. of the 4th European Conference on Turbomachinery, Firenze, Italy, Paper-No. ATI-CST-044/01 [3] Erhard, J. (2000), Design, construction and Commissioning of a transonic test-turbine facility, Doctoral Thesis, Graz University of Technology [4] Seyr A., Kulhanek G., Neumayer F., Rossi E., Sanz W. (2001) Performance Measurement of the Second Stage of a Transonic Turbine, Proceedings ASME, TURBO EXPO 2001, ASME Paper 2001-GT-0490 [5] Lang, H., Mørck, T., Woisetschläger, J. (2002) Stereoscopic particle image velocimetry in a transonic turbine stage, Exp. Fluids 32, 700-709, Springer-Verlag [6] Neumayer, F., Göttlich, E., Heitmeir, F., submitted to the 5 th European Conference on Turbomachinery, Prague, 2003 [7] Mayrhofer, N., Woisetschläger, J. (2001) Frequency analysis of turbulent compressible flows by laser vibrometry, Exp. Fluids 31, 153-161, Springer-Verlag [8] Woisetschläger, J. , Mayrhofer, N., Lang, H., Hampel, B. (2002) Experimental investigation of turbine wake flow by interferometrically triggered PIV and LDV measurements, Proceedings ASME, TURBO EXPO 2002, ASME Paper 2002-GT-30347 [9] Woisetschläger, J. , Mayrhofer, N., Hampel, B., Lang, H. Laser-optical investigation of turbine wake flow, submitted to Measurement Science and Technology, IOP-Publishing [10] Lang, H., Hampel, B., Göttlich, E., Woisetschläger, J., Heitmeir, F. (2003) Influence of the blade passing on the stator wake in a transonic turbine stage investigated by particle image velocimetry, , submitted to the 5 th European Conference on Turbomachinery, Prague, 2003 [11] Sondak, D.L., Dorney, D.J. (1999) Simulation of vortex shedding in a turbine stage, J.Turbomach., 121, 428-435 [12] Mei R (1996) Velocity fidelity of flow tracer particles, Experiments in Fluids, 22:1-13 [13] Woisetschläger, j., Mayrhofer, N., Hampel, B., Lang, H., Sanz, W. (2003), Laser-optical investigation of turbine wake flow, Experiments in Fluids, in print [14] Gehrer A. (1999) Entwicklung eines 3D-Navier-Stokes Codes zur numerischen Berechnung der Turbomaschinenströmung, Doctoral Thesis, Graz University of Technology [15] Pieringer, P., Sanz, W., Neumayer, F., Gehrer, A., Heitmeir, F. (2003) Numerical Investigation of the Three-Dimensional Flow Through a Transonic Turbine Stage, 5 th European Conference on Turbomachinery, Prague, 2003