evaluación de riesgos naturales consultores en … · mabel cristina marulanda f. specialist...
TRANSCRIPT
Evaluación de Riesgos Naturales
- América Latina -
Consultores en Riesgos y Desastres EERRNN
CAPRA CENTRAL AMERICA PROBABILISTIC RISK ASSESSMENT
EVALUACIÓN PROBABILISTA DE RIESGOS EN CENTRO AMÉRICA
BELIZE
TASK I
HAZARD IDENTIFICATION, HISTORICAL REVIEW AND PROBABILISTIC ANALYSIS
TECHNICAL REPORT TASK 1.1 B
REVIEW: EXISTING STUDIES
Evaluación de Riesgos Naturales
- América Latina - Consultores en Riesgos y Desastres
Consortium formed by: Colombia
Carrera 19A # 84-14 Of 504 Edificio Torrenova Tel. 57-1-691-6113 Fax 57-1-691-6102 Bogotá, D.C.
INGENIAR
España
Centro Internacional de Métodos Numéricos en Ingeniería - CIMNE Campus Nord UPC Tel. 34-93-401-64-96 Fax 34-93-401-10-48 Barcelona
C I M N E
México
Vito Alessio Robles No. 179 Col. Hacienda de Guadalupe Chimalistac C.P.01050 Delegación Álvaro Obregón Tel. 55-5-616-8161 Fax 55-5-616-8162 México, D.F.
ERN Ingenieros Consultores, S. C. ERNERNERNERN Evaluación de Riesgos Naturales – América Latina www.ern-la.com
ERN ERN
Evaluación de Riesgos Naturales
- América Latina -
Consultores en Riesgos y Desastres ERN
Direction and Coordination of Technical Working Groups – Consortium ERN America Latina
Omar Darío Cardona A. Project General Direction
Luis Eduardo Yamín L. Technical Direction ERN (COL)
Mario Gustavo Ordaz S. Technical Direction ERN (MEX)
Alex Horia Barbat B. Technical Direction CIMNE (ESP)
Gabriel Andrés Bernal G. General Coordination ERN (COL)
Eduardo Reinoso A. General Coordination ERN (MEX)
Martha Liliana Carreño T. General Coordination l CIMNE (ESP)
Specialists and Advisors – Working Groups
Julián Tristancho Specialist ERN (COL)
Carlos Eduardo Avelar F. Specialist ERN (MEX)
Mabel Cristina Marulanda F. Specialist CIMNE(SPN)
Miguel Genaro Mora C. Specialist ERN (COL)
Benjamín Huerta G. Specialist ERN (MEX)
Jairo Andrés Valcárcel T. Specialist CIMNE(SPN)
César Augusto Velásquez V. Specialist ERN (COL)
Mauro Pompeyo Niño L. Specialist ERN (MEX)
Juan Pablo Londoño L. Specialist CIMNE(SPN)
Karina Santamaría D. Specialist ERN (COL)
Isaías Martínez A. Technical Assistant ERN (MEX)
René Salgueiro Specialist CIMNE(SPN)
Mauricio Cardona O. Specialist ERN (COL)
Edgar Osuna H. Technical Assistant ERN (MEX)
Nieves Lantada Specialist CIMNE(SPN)
Sergio Enrique Forero A. Specialist ERN (COL)
José Juan Hernández G. Technical Assistant ERN (MEX)
Álvaro Martín Moreno R. Associated Advisor (COL)
Mario Andrés Salgado G. Technical Assistant ERN (COL)
Marco Torres Associated Advisor (MEX)
Mario Díaz-Granados O. Associated Advisor (COL)
Juan Pablo Forero A. Technical Assistant ERN (COL)
Johoner Venicio Correa C. Technical Assistant ERN (COL)
Liliana Narvaez M. Associated Advisor (COL)
Andrés Mauricio Torres C. Technical Assistant ERN (COL)
Juan Miguel Galindo P. Technical Assistant ERN (COL)
Juan Camilo Olaya Technical Assistant ERN (COL)
Diana Marcela González C. Technical Assistant ERN (COL)
Yinsury Sodel Peña V. Technical Assistant ERN (COL)
Steven White Technical Assistant ERN (COL)
Local Advisors
SNET Francisco Ernesto Durán & Giovanni Molina El Salvador
Osmar E. Velasco Guatemala
Oscar Elvir Honduras Romaldo Isaac Lewis Belize
Interamerican Development Bank
Flavio Bazán Sectorial Specialist
Cassandra T. Rogers Sectorial Specialist
Sergio Lacambra Sectorial Specialist
Tsuneki Hori Internal Consultant
Oscar Anil Ishizawa Internal Consultant
World Bank
Francis Ghesquiere Regional Coordinator
Joaquín Toro Specialist
Fernando Ramírez C. Specialist
Edward C. Anderson Specialist
Stuart Gill Specialist
i
ERN América Latina
Contents
1 General ...................................................................................................................... 1-1
2 General statistics for the country ......................................................................... 2-1
3 Specific statistics by event .................................................................................... 3-1
3.1 Earthquake ...................................................................................................................................... 3-1
3.1.1 Statistical curves .................................................................................................................... 3-5
3.1.2 Important historical events .................................................................................................. 3-9
3.2 Tsunami ......................................................................................................................................... 3-10
3.3 Huracanes ...................................................................................................................................... 3-10
3.3.1 Statistical curves .................................................................................................................. 3-15
3.3.2 Important historical events ................................................................................................ 3-20
3.4 Intense rainfall ............................................................................................................................. 3-24
3.4.1 Statistical curves .................................................................................................................. 3-25
3.4.2 Important historical events ................................................................................................ 3-26
3.5 Flood .............................................................................................................................................. 3-27
3.5.1 Statistical curves .................................................................................................................. 3-29
3.5.2 Important historical events ................................................................................................ 3-31
3.6 Landslide ....................................................................................................................................... 3-32
3.7 Volcanic eruption ........................................................................................................................ 3-32
i
ERN América Latina
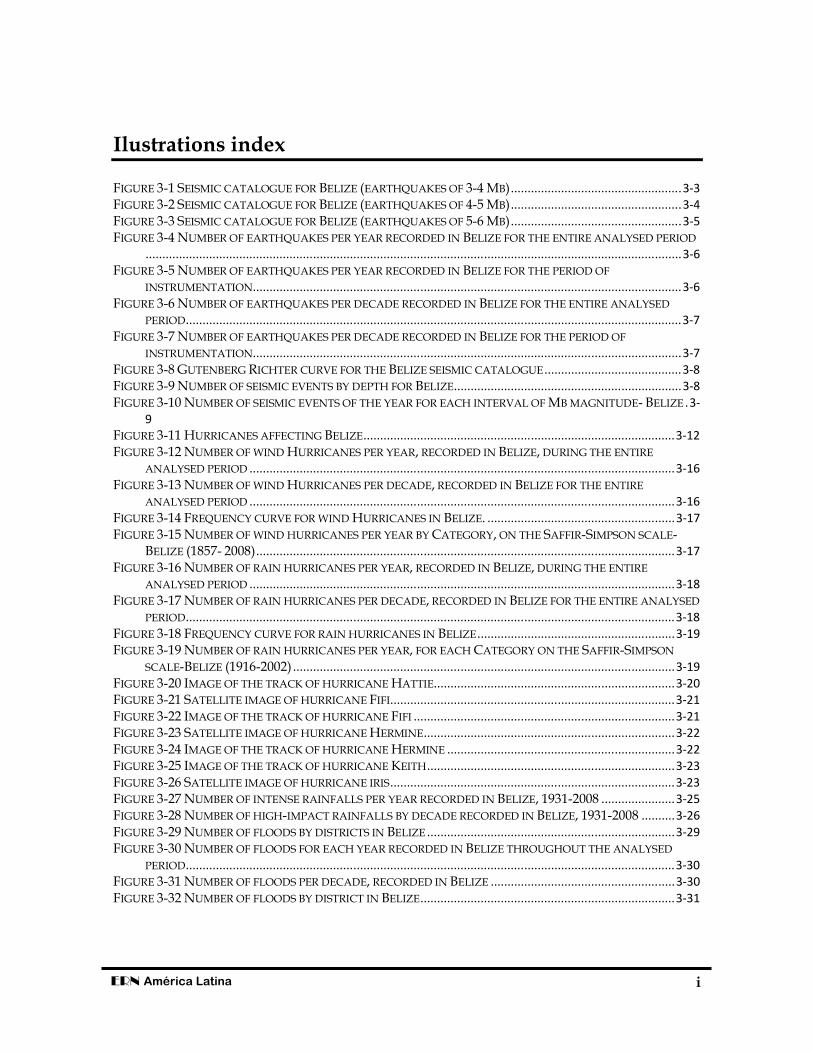
Ilustrations index FIGURE 3-1 SEISMIC CATALOGUE FOR BELIZE (EARTHQUAKES OF 3-4 MB) ................................................... 3-3
FIGURE 3-2 SEISMIC CATALOGUE FOR BELIZE (EARTHQUAKES OF 4-5 MB) ................................................... 3-4
FIGURE 3-3 SEISMIC CATALOGUE FOR BELIZE (EARTHQUAKES OF 5-6 MB) ................................................... 3-5
FIGURE 3-4 NUMBER OF EARTHQUAKES PER YEAR RECORDED IN BELIZE FOR THE ENTIRE ANALYSED PERIOD
................................................................................................................................................................ 3-6
FIGURE 3-5 NUMBER OF EARTHQUAKES PER YEAR RECORDED IN BELIZE FOR THE PERIOD OF
INSTRUMENTATION ................................................................................................................................ 3-6
FIGURE 3-6 NUMBER OF EARTHQUAKES PER DECADE RECORDED IN BELIZE FOR THE ENTIRE ANALYSED
PERIOD .................................................................................................................................................... 3-7
FIGURE 3-7 NUMBER OF EARTHQUAKES PER DECADE RECORDED IN BELIZE FOR THE PERIOD OF
INSTRUMENTATION ................................................................................................................................ 3-7
FIGURE 3-8 GUTENBERG RICHTER CURVE FOR THE BELIZE SEISMIC CATALOGUE ......................................... 3-8
FIGURE 3-9 NUMBER OF SEISMIC EVENTS BY DEPTH FOR BELIZE .................................................................... 3-8
FIGURE 3-10 NUMBER OF SEISMIC EVENTS OF THE YEAR FOR EACH INTERVAL OF MB MAGNITUDE- BELIZE . 3-
9
FIGURE 3-11 HURRICANES AFFECTING BELIZE ............................................................................................. 3-12
FIGURE 3-12 NUMBER OF WIND HURRICANES PER YEAR, RECORDED IN BELIZE, DURING THE ENTIRE
ANALYSED PERIOD ............................................................................................................................... 3-16
FIGURE 3-13 NUMBER OF WIND HURRICANES PER DECADE, RECORDED IN BELIZE FOR THE ENTIRE
ANALYSED PERIOD ............................................................................................................................... 3-16
FIGURE 3-14 FREQUENCY CURVE FOR WIND HURRICANES IN BELIZE. ........................................................ 3-17
FIGURE 3-15 NUMBER OF WIND HURRICANES PER YEAR BY CATEGORY, ON THE SAFFIR-SIMPSON SCALE-BELIZE (1857- 2008) ............................................................................................................................. 3-17
FIGURE 3-16 NUMBER OF RAIN HURRICANES PER YEAR, RECORDED IN BELIZE, DURING THE ENTIRE
ANALYSED PERIOD ............................................................................................................................... 3-18
FIGURE 3-17 NUMBER OF RAIN HURRICANES PER DECADE, RECORDED IN BELIZE FOR THE ENTIRE ANALYSED
PERIOD .................................................................................................................................................. 3-18
FIGURE 3-18 FREQUENCY CURVE FOR RAIN HURRICANES IN BELIZE ........................................................... 3-19
FIGURE 3-19 NUMBER OF RAIN HURRICANES PER YEAR, FOR EACH CATEGORY ON THE SAFFIR-SIMPSON
SCALE-BELIZE (1916-2002) .................................................................................................................. 3-19
FIGURE 3-20 IMAGE OF THE TRACK OF HURRICANE HATTIE ........................................................................ 3-20
FIGURE 3-21 SATELLITE IMAGE OF HURRICANE FIFI ..................................................................................... 3-21
FIGURE 3-22 IMAGE OF THE TRACK OF HURRICANE FIFI .............................................................................. 3-21
FIGURE 3-23 SATELLITE IMAGE OF HURRICANE HERMINE ........................................................................... 3-22
FIGURE 3-24 IMAGE OF THE TRACK OF HURRICANE HERMINE .................................................................... 3-22
FIGURE 3-25 IMAGE OF THE TRACK OF HURRICANE KEITH .......................................................................... 3-23
FIGURE 3-26 SATELLITE IMAGE OF HURRICANE IRIS ..................................................................................... 3-23
FIGURE 3-27 NUMBER OF INTENSE RAINFALLS PER YEAR RECORDED IN BELIZE, 1931-2008 ...................... 3-25
FIGURE 3-28 NUMBER OF HIGH-IMPACT RAINFALLS BY DECADE RECORDED IN BELIZE, 1931-2008 .......... 3-26
FIGURE 3-29 NUMBER OF FLOODS BY DISTRICTS IN BELIZE .......................................................................... 3-29
FIGURE 3-30 NUMBER OF FLOODS FOR EACH YEAR RECORDED IN BELIZE THROUGHOUT THE ANALYSED
PERIOD .................................................................................................................................................. 3-30
FIGURE 3-31 NUMBER OF FLOODS PER DECADE, RECORDED IN BELIZE ....................................................... 3-30
FIGURE 3-32 NUMBER OF FLOODS BY DISTRICT IN BELIZE ............................................................................ 3-31
i
ERN América Latina
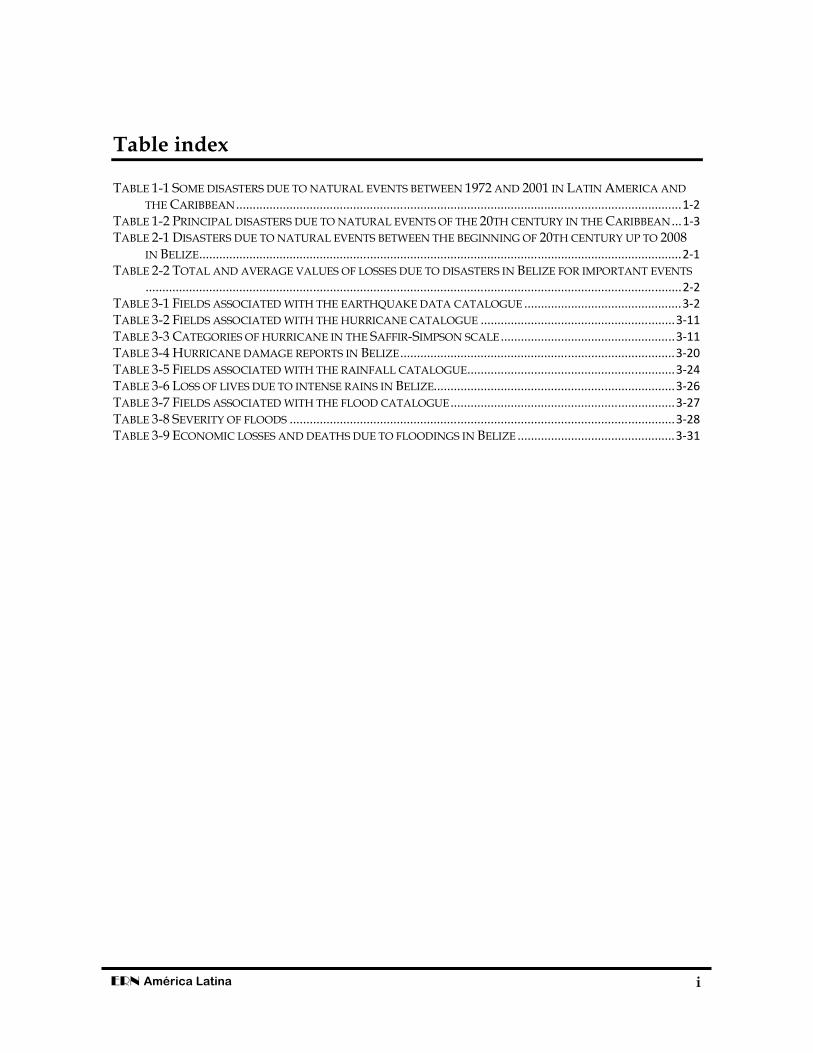
Table index TABLE 1-1 SOME DISASTERS DUE TO NATURAL EVENTS BETWEEN 1972 AND 2001 IN LATIN AMERICA AND
THE CARIBBEAN ..................................................................................................................................... 1-2
TABLE 1-2 PRINCIPAL DISASTERS DUE TO NATURAL EVENTS OF THE 20TH CENTURY IN THE CARIBBEAN ... 1-3
TABLE 2-1 DISASTERS DUE TO NATURAL EVENTS BETWEEN THE BEGINNING OF 20TH CENTURY UP TO 2008 IN BELIZE ................................................................................................................................................ 2-1
TABLE 2-2 TOTAL AND AVERAGE VALUES OF LOSSES DUE TO DISASTERS IN BELIZE FOR IMPORTANT EVENTS
................................................................................................................................................................ 2-2
TABLE 3-1 FIELDS ASSOCIATED WITH THE EARTHQUAKE DATA CATALOGUE ............................................... 3-2
TABLE 3-2 FIELDS ASSOCIATED WITH THE HURRICANE CATALOGUE .......................................................... 3-11
TABLE 3-3 CATEGORIES OF HURRICANE IN THE SAFFIR-SIMPSON SCALE .................................................... 3-11
TABLE 3-4 HURRICANE DAMAGE REPORTS IN BELIZE .................................................................................. 3-20
TABLE 3-5 FIELDS ASSOCIATED WITH THE RAINFALL CATALOGUE .............................................................. 3-24
TABLE 3-6 LOSS OF LIVES DUE TO INTENSE RAINS IN BELIZE........................................................................ 3-26
TABLE 3-7 FIELDS ASSOCIATED WITH THE FLOOD CATALOGUE ................................................................... 3-27
TABLE 3-8 SEVERITY OF FLOODS ................................................................................................................... 3-28
TABLE 3-9 ECONOMIC LOSSES AND DEATHS DUE TO FLOODINGS IN BELIZE ............................................... 3-31
1-1
ERN América Latina
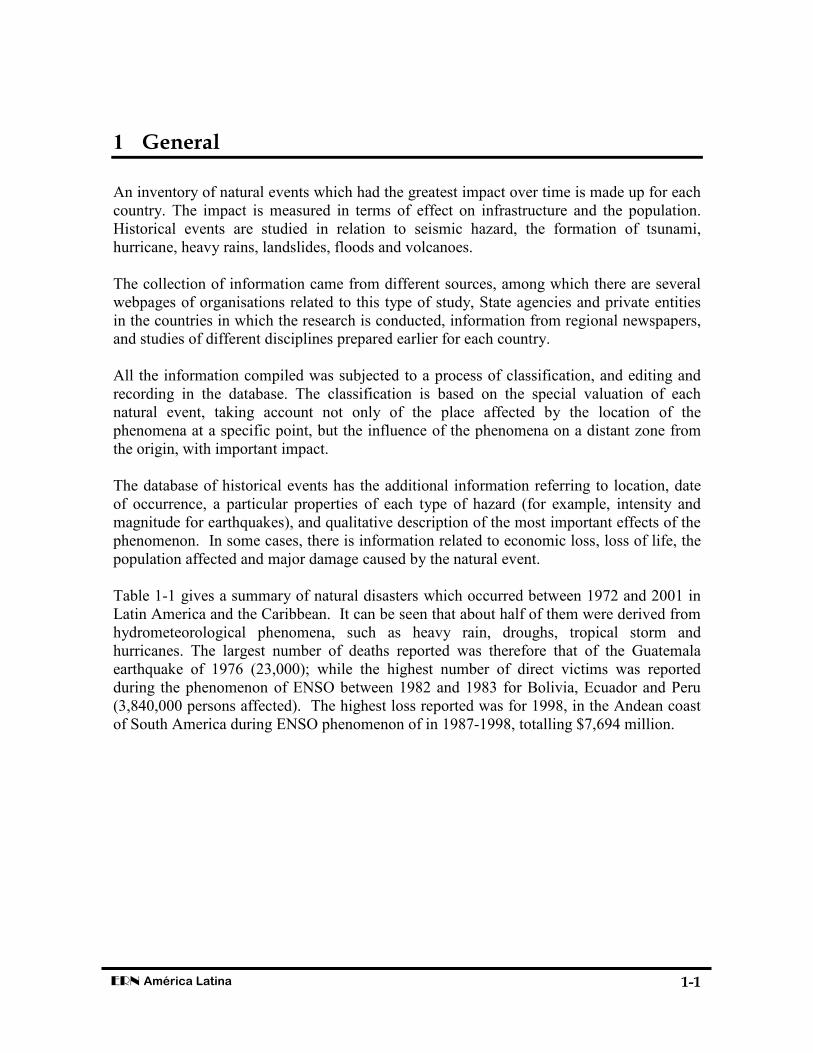
1 General
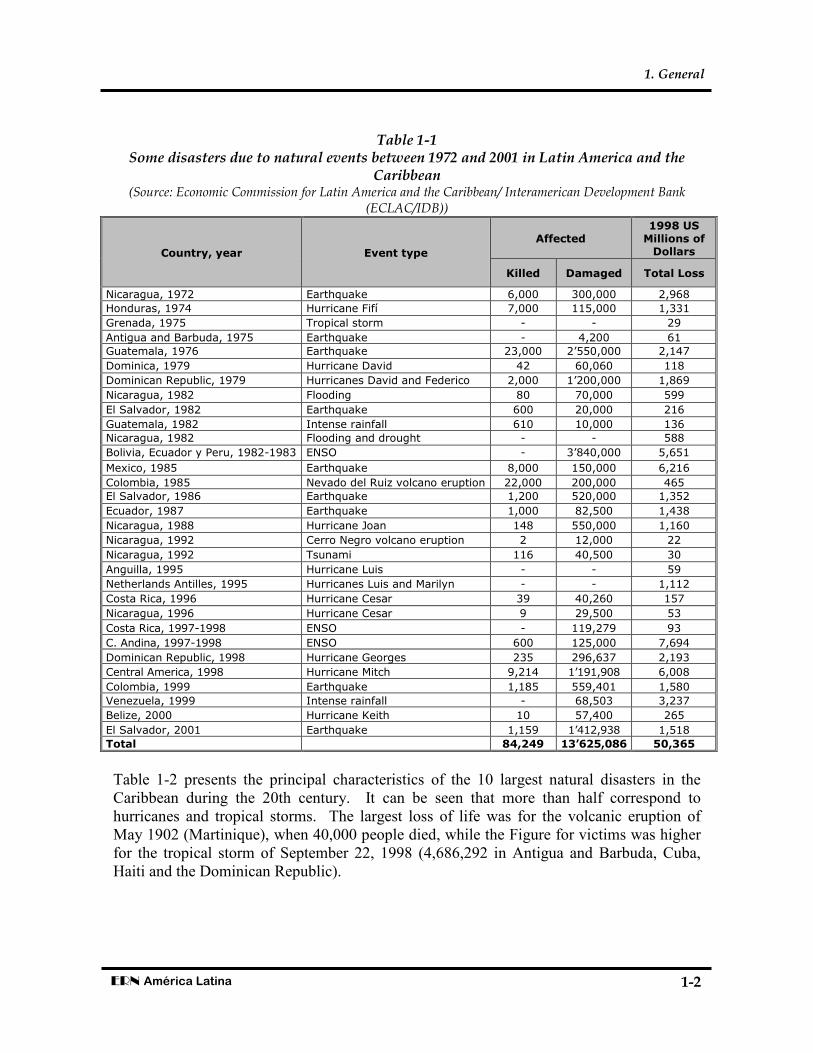
An inventory of natural events which had the greatest impact over time is made up for each country. The impact is measured in terms of effect on infrastructure and the population. Historical events are studied in relation to seismic hazard, the formation of tsunami, hurricane, heavy rains, landslides, floods and volcanoes. The collection of information came from different sources, among which there are several webpages of organisations related to this type of study, State agencies and private entities in the countries in which the research is conducted, information from regional newspapers, and studies of different disciplines prepared earlier for each country. All the information compiled was subjected to a process of classification, and editing and recording in the database. The classification is based on the special valuation of each natural event, taking account not only of the place affected by the location of the phenomena at a specific point, but the influence of the phenomena on a distant zone from the origin, with important impact. The database of historical events has the additional information referring to location, date of occurrence, a particular properties of each type of hazard (for example, intensity and magnitude for earthquakes), and qualitative description of the most important effects of the phenomenon. In some cases, there is information related to economic loss, loss of life, the population affected and major damage caused by the natural event. Table 1-1 gives a summary of natural disasters which occurred between 1972 and 2001 in Latin America and the Caribbean. It can be seen that about half of them were derived from hydrometeorological phenomena, such as heavy rain, droughs, tropical storm and hurricanes. The largest number of deaths reported was therefore that of the Guatemala earthquake of 1976 (23,000); while the highest number of direct victims was reported during the phenomenon of ENSO between 1982 and 1983 for Bolivia, Ecuador and Peru (3,840,000 persons affected). The highest loss reported was for 1998, in the Andean coast of South America during ENSO phenomenon of in 1987-1998, totalling $7,694 million.
1. General
1-2
ERN América Latina
Table 1-1
Some disasters due to natural events between 1972 and 2001 in Latin America and the Caribbean
(Source: Economic Commission for Latin America and the Caribbean/ Interamerican Development Bank (ECLAC/IDB))
Country, year Event type
Affected 1998 US Millions of Dollars
Killed Damaged Total Loss
Nicaragua, 1972 Earthquake 6,000 300,000 2,968
Honduras, 1974 Hurricane Fifí 7,000 115,000 1,331
Grenada, 1975 Tropical storm - - 29
Antigua and Barbuda, 1975 Earthquake - 4,200 61 Guatemala, 1976 Earthquake 23,000 2’550,000 2,147
Dominica, 1979 Hurricane David 42 60,060 118
Dominican Republic, 1979 Hurricanes David and Federico 2,000 1’200,000 1,869
Nicaragua, 1982 Flooding 80 70,000 599
El Salvador, 1982 Earthquake 600 20,000 216
Guatemala, 1982 Intense rainfall 610 10,000 136
Nicaragua, 1982 Flooding and drought - - 588
Bolivia, Ecuador y Peru, 1982-1983 ENSO - 3’840,000 5,651
Mexico, 1985 Earthquake 8,000 150,000 6,216
Colombia, 1985 Nevado del Ruiz volcano eruption 22,000 200,000 465 El Salvador, 1986 Earthquake 1,200 520,000 1,352
Ecuador, 1987 Earthquake 1,000 82,500 1,438
Nicaragua, 1988 Hurricane Joan 148 550,000 1,160
Nicaragua, 1992 Cerro Negro volcano eruption 2 12,000 22
Nicaragua, 1992 Tsunami 116 40,500 30
Anguilla, 1995 Hurricane Luis - - 59
Netherlands Antilles, 1995 Hurricanes Luis and Marilyn - - 1,112
Costa Rica, 1996 Hurricane Cesar 39 40,260 157
Nicaragua, 1996 Hurricane Cesar 9 29,500 53
Costa Rica, 1997-1998 ENSO - 119,279 93
C. Andina, 1997-1998 ENSO 600 125,000 7,694
Dominican Republic, 1998 Hurricane Georges 235 296,637 2,193
Central America, 1998 Hurricane Mitch 9,214 1’191,908 6,008
Colombia, 1999 Earthquake 1,185 559,401 1,580
Venezuela, 1999 Intense rainfall - 68,503 3,237
Belize, 2000 Hurricane Keith 10 57,400 265
El Salvador, 2001 Earthquake 1,159 1’412,938 1,518
Total 84,249 13’625,086 50,365
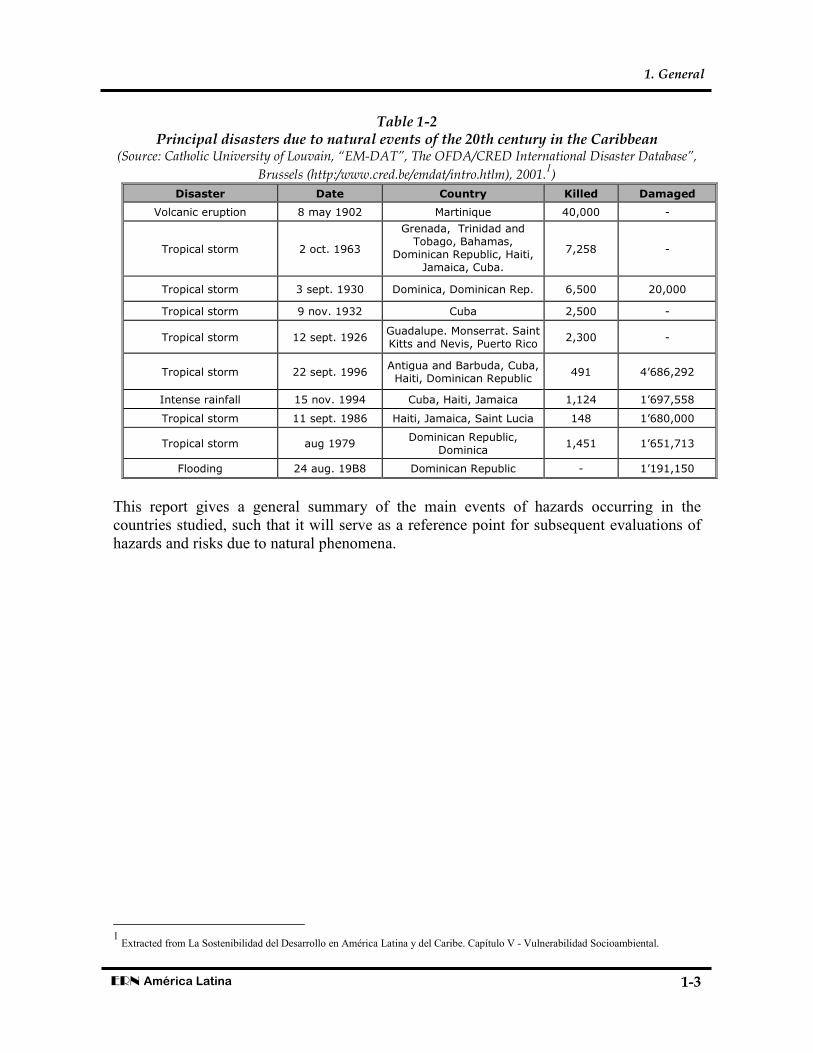
Table 1-2 presents the principal characteristics of the 10 largest natural disasters in the Caribbean during the 20th century. It can be seen that more than half correspond to hurricanes and tropical storms. The largest loss of life was for the volcanic eruption of May 1902 (Martinique), when 40,000 people died, while the Figure for victims was higher for the tropical storm of September 22, 1998 (4,686,292 in Antigua and Barbuda, Cuba, Haiti and the Dominican Republic).
1. General
1-3
ERN América Latina
Table 1-2 Principal disasters due to natural events of the 20th century in the Caribbean
(Source: Catholic University of Louvain, “EM-DAT”, The OFDA/CRED International Disaster Database”,
Brussels (http:/www.cred.be/emdat/intro.htlm), 2001.1)
Disaster Date Country Killed Damaged
Volcanic eruption 8 may 1902 Martinique 40,000 -
Tropical storm 2 oct. 1963
Grenada, Trinidad and Tobago, Bahamas,
Dominican Republic, Haiti, Jamaica, Cuba.
7,258 -
Tropical storm 3 sept. 1930 Dominica, Dominican Rep. 6,500 20,000
Tropical storm 9 nov. 1932 Cuba 2,500 -
Tropical storm 12 sept. 1926 Guadalupe. Monserrat. Saint Kitts and Nevis, Puerto Rico
2,300 -
Tropical storm 22 sept. 1996 Antigua and Barbuda, Cuba, Haiti, Dominican Republic
491 4’686,292
Intense rainfall 15 nov. 1994 Cuba, Haiti, Jamaica 1,124 1’697,558
Tropical storm 11 sept. 1986 Haiti, Jamaica, Saint Lucia 148 1’680,000
Tropical storm aug 1979 Dominican Republic,
Dominica 1,451 1’651,713
Flooding 24 aug. 19B8 Dominican Republic - 1’191,150
This report gives a general summary of the main events of hazards occurring in the countries studied, such that it will serve as a reference point for subsequent evaluations of hazards and risks due to natural phenomena.
1 Extracted from La Sostenibilidad del Desarrollo en América Latina y del Caribe. Capítulo V - Vulnerabilidad Socioambiental.

2-1
ERN América Latina
2 General statistics for the country
Among the phenomena which have affected that he during the 20th century, and the early 21st century, the most important have been storms followed by floods. Table 2-1 summarises the most important disasters which have struck Belize during this period, and the information related to loss of lifes, material losses and total number of people affected.
Table 2-1
Disasters due to natural events between the beginning of 20th century up to 2008 in Belize (Source: Catholic University of Louvain, “EM-DAT”, The OFDA/CRED International Disaster Database”,
Brussels (http://www.emdat.be/Database/CountryProfile/countryprofile.php#top10lists), 2009.)
Disaster Date Killed Damaged Total Loss
(US$ Millions)
Storm 30/09/2000 14 62,570 277,460
Storm 08/10/2001 30 20,000 250,000
Storm 30/10/1961 275 - 60,000
Storm 21/08/2007 - 20,000 14,847
Storm 14/11/2005 3 - -
Storm 10/09/1931 1,500 - 7,500
Storm 18/09/1978 5 6,000 6,000
Storm 28/09/1955 16 - 5,000
Storm 02/09/1974 - 70,000 4,000
Storm 25/10/1998 9 60,000 -
Storm 31/05/2008 7 10,000 -
Flooding 19/10/2008 1 38,000 9,697
Flooding 10/1995 - 2,600 -
Flooding 12/1979 - 17,000 -
Extreme temperature 1990 - - 2,250
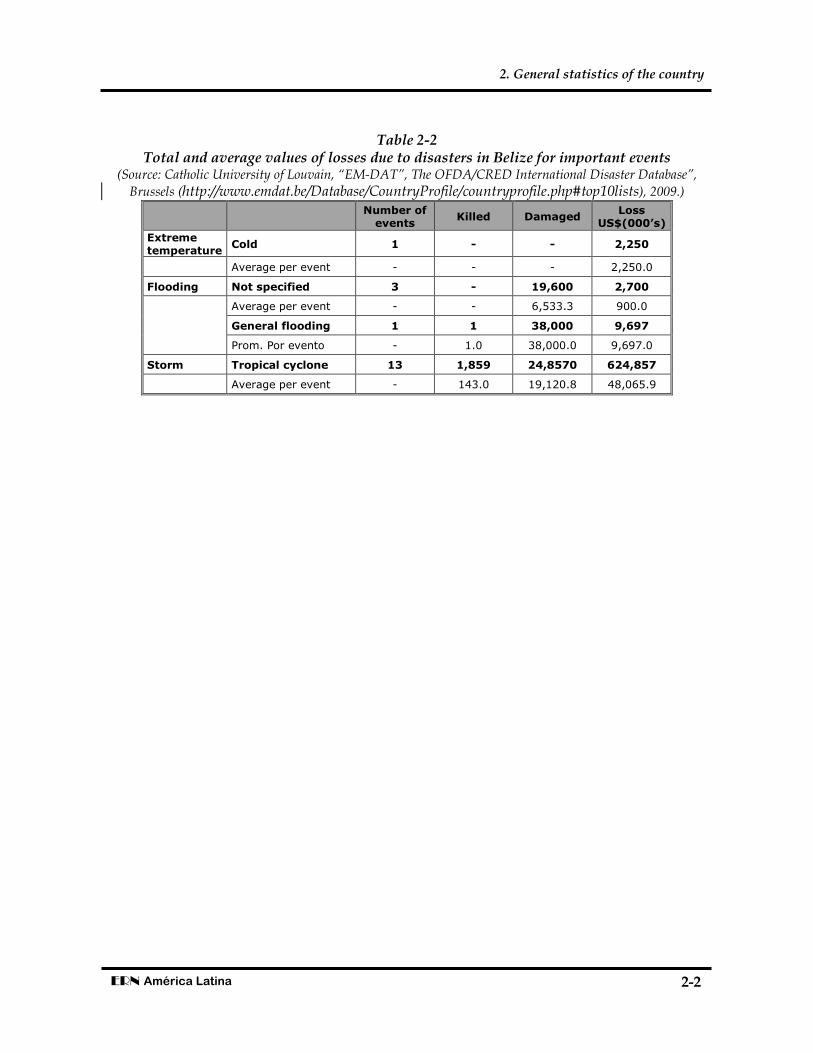
Further, Table 2-2 provides a compendium of information regarding total and average values of losses caused by some significant events, classified by type of disaster.
2. General statistics of the country
2-2
ERN América Latina
Table 2-2
Total and average values of losses due to disasters in Belize for important events (Source: Catholic University of Louvain, “EM-DAT”, The OFDA/CRED International Disaster Database”,
Brussels (http://www.emdat.be/Database/CountryProfile/countryprofile.php#top10lists), 2009.)
Number of events
Killed Damaged Loss
US$(000’s)
Extreme temperature
Cold 1 - - 2,250
Average per event - - - 2,250.0
Flooding Not specified 3 - 19,600 2,700
Average per event - - 6,533.3 900.0
General flooding 1 1 38,000 9,697
Prom. Por evento - 1.0 38,000.0 9,697.0
Storm Tropical cyclone 13 1,859 24,8570 624,857
Average per event - 143.0 19,120.8 48,065.9
3-1
ERN América Latina
3 Specific statistics by event
3.1 Earthquake
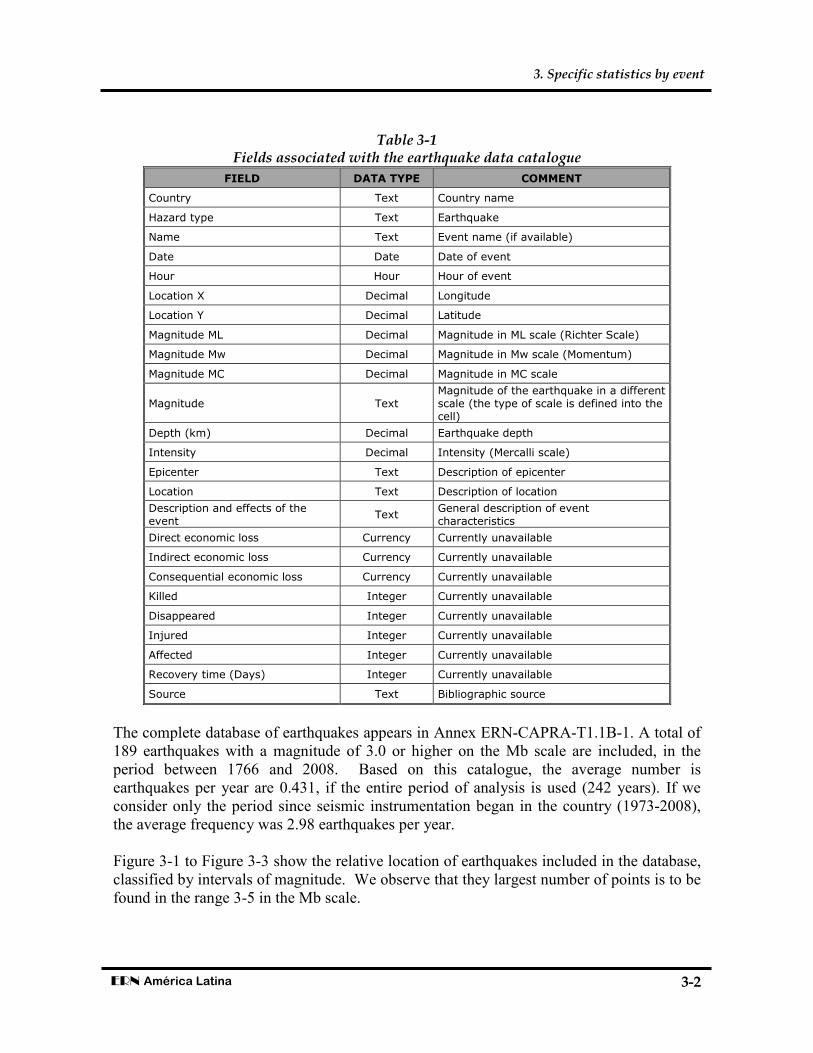
A database of important seismic events has been created, which also serves as a basis for statistical analysis of events. Based on this inventory, the recurrence curve of earthquakes by year and decade is generated, with the distribution of earthquakes as a function of magnitude, amongst other things. The database includes both macro-events identified, and the more moderate events taken from recent historical records. The information related to historical events includes, in most cases, information regarding parameters of location, magnitude and intensity force, and to a lesser extent, records related to the effects and losses produced by each event. These latter data will serve to calibrate and validate the analysis models This database does not claim to replace the official catalogue of seismicity for the country. The intention, on the contrary, is to verify that no important events are missing from the official catalogue (of which we do not have a copy). The database includes a field for location, date, and comments, and the source from which information was obtained (date, time, location, comment and source). In addition, there are data for magnitude of the earthquake on different scales, depth, intensity and information of the epicentre. For some earthquakes, though is information on losses, deaths, disappearances, injuries, persons affected, etc. The sources of this database are principally matched in a geoeferenced format, documents and studies of individual events, or descriptions of groups of events, information available on the Internet, and catalogue of events generated by the Belize entities. Table 3-1 describes the fields associated with the earthquake database.
3. Specific statistics by event
3-2
ERN América Latina
Table 3-1
Fields associated with the earthquake data catalogue
FIELD DATA TYPE COMMENT
Country Text Country name
Hazard type Text Earthquake
Name Text Event name (if available)
Date Date Date of event
Hour Hour Hour of event
Location X Decimal Longitude
Location Y Decimal Latitude
Magnitude ML Decimal Magnitude in ML scale (Richter Scale)
Magnitude Mw Decimal Magnitude in Mw scale (Momentum)
Magnitude MC Decimal Magnitude in MC scale
Magnitude Text Magnitude of the earthquake in a different scale (the type of scale is defined into the cell)
Depth (km) Decimal Earthquake depth
Intensity Decimal Intensity (Mercalli scale)
Epicenter Text Description of epicenter
Location Text Description of location
Description and effects of the event
Text General description of event characteristics
Direct economic loss Currency Currently unavailable
Indirect economic loss Currency Currently unavailable
Consequential economic loss Currency Currently unavailable
Killed Integer Currently unavailable
Disappeared Integer Currently unavailable
Injured Integer Currently unavailable
Affected Integer Currently unavailable
Recovery time (Days) Integer Currently unavailable
Source Text Bibliographic source
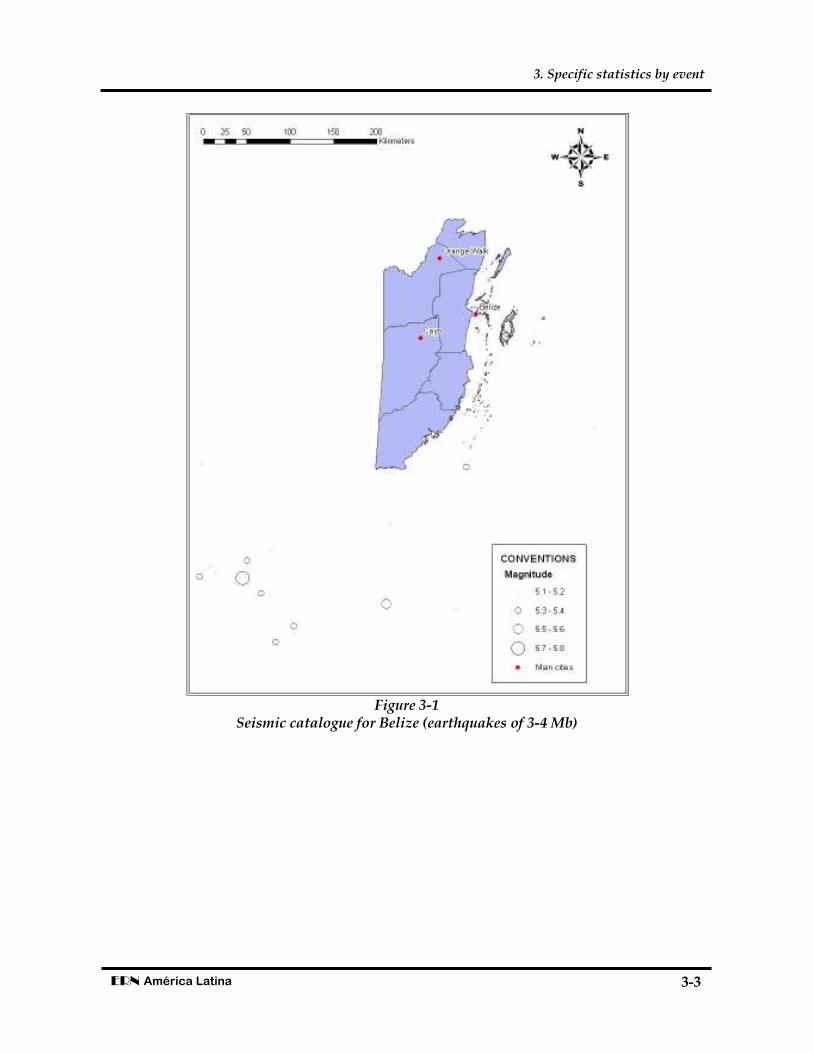
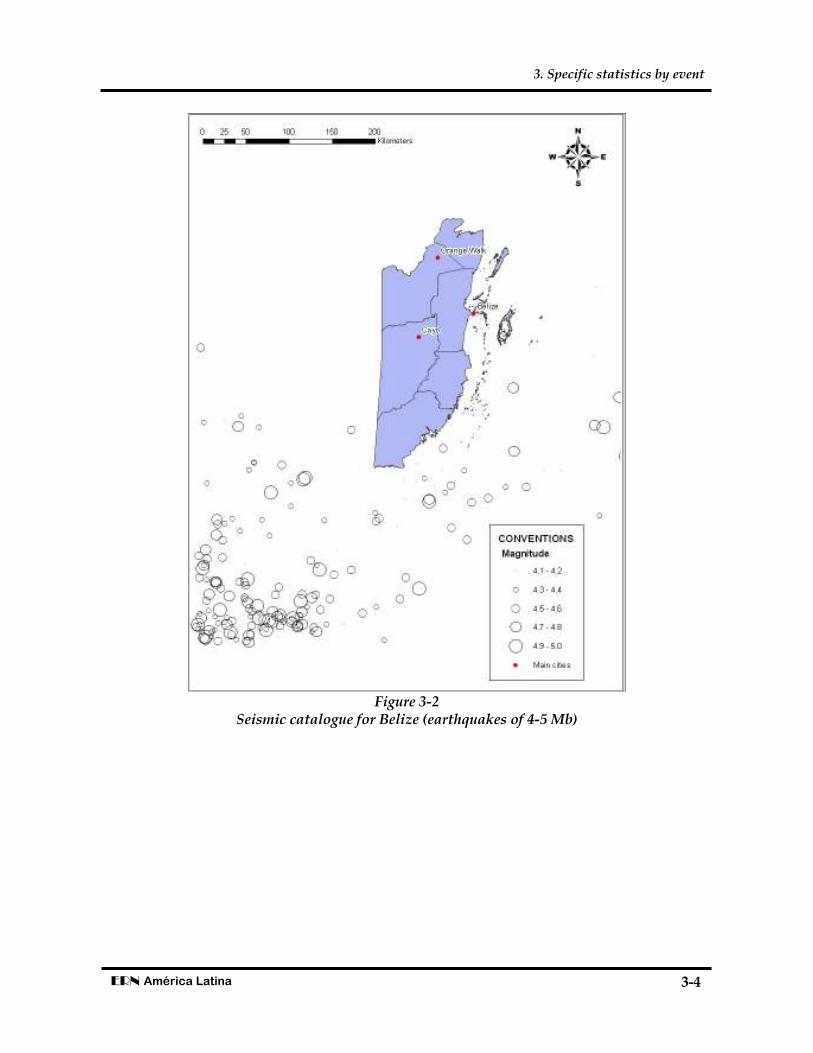
The complete database of earthquakes appears in Annex ERN-CAPRA-T1.1B-1. A total of 189 earthquakes with a magnitude of 3.0 or higher on the Mb scale are included, in the period between 1766 and 2008. Based on this catalogue, the average number is earthquakes per year are 0.431, if the entire period of analysis is used (242 years). If we consider only the period since seismic instrumentation began in the country (1973-2008), the average frequency was 2.98 earthquakes per year. Figure 3-1 to Figure 3-3 show the relative location of earthquakes included in the database, classified by intervals of magnitude. We observe that they largest number of points is to be found in the range 3-5 in the Mb scale.
3. Specific statistics by event
3-3
ERN América Latina
Figure 3-1
Seismic catalogue for Belize (earthquakes of 3-4 Mb)
3. Specific statistics by event
3-4
ERN América Latina
Figure 3-2
Seismic catalogue for Belize (earthquakes of 4-5 Mb)
3. Specific statistics by event
3-5
ERN América Latina
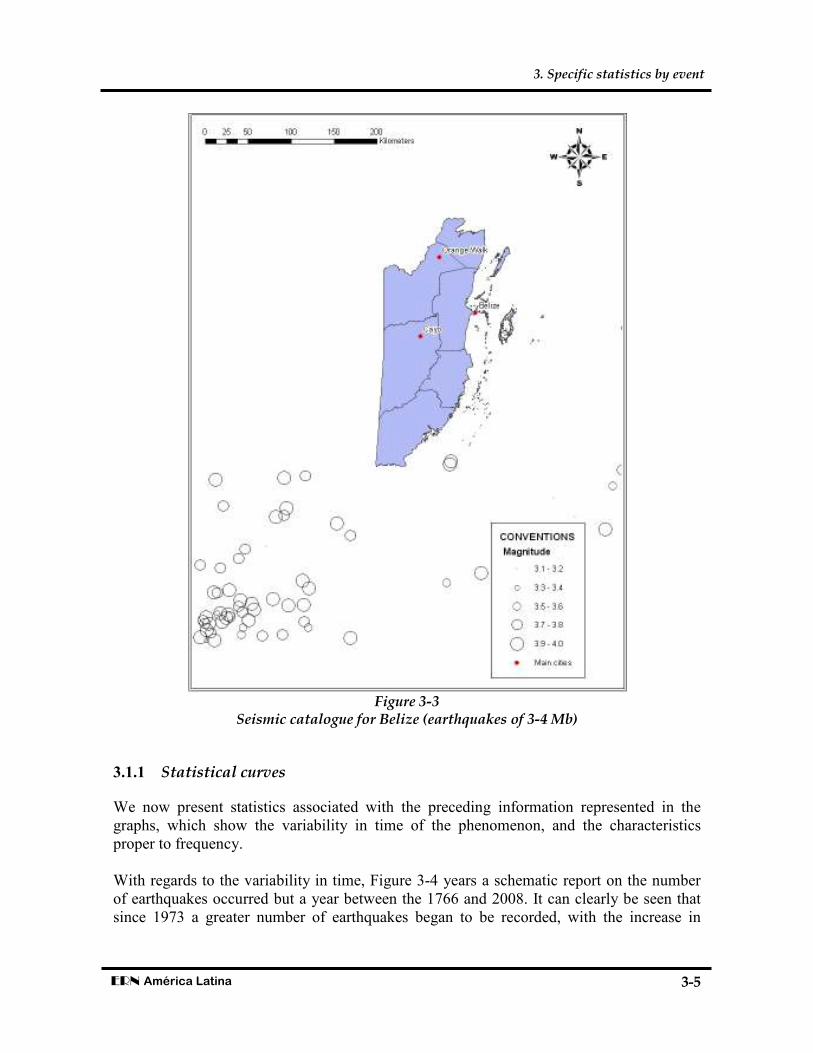
Figure 3-3
Seismic catalogue for Belize (earthquakes of 3-4 Mb)
3.1.1 Statistical curves
We now present statistics associated with the preceding information represented in the graphs, which show the variability in time of the phenomenon, and the characteristics proper to frequency. With regards to the variability in time, Figure 3-4 years a schematic report on the number of earthquakes occurred but a year between the 1766 and 2008. It can clearly be seen that since 1973 a greater number of earthquakes began to be recorded, with the increase in

3. Specific statistics by event
3-6
ERN América Latina
seismic instrumentation. Figure 3-5 indicates details of the number of earthquakes per year for the range 1973-2008.
0
10
20
30
40
50
60
70
80
1760
1770
1780
1790
1800
1810
1820
1830
1840
1850
1860
1870
1880
1890
1900
1910
1920
1930
1940
1950
1960
1970
1980
1990
2000
2010
Numebr of events
Year Figure 3-4
Number of earthquakes per year recorded in Belize for the entire analysed period
0
10
20
30
40
50
60
70
80
1973
1974
1975
1976
1977
1978
1979
1980
1981
1982
1983
1984
1985
1986
1987
1988
1989
1990
1991
1992
1993
1994
1995
1996
1997
1998
1999
2000
2001
2002
2003
2004
2005
2006
2007
2008
2009
Number of events
Year
Figure 3-5 Number of earthquakes per year recorded in Belize for the period of instrumentation
For its part, Figure 3-6 indicates the frequency of earthquakes with a magnitude of 2.0 or more, by decades. Figure 3-7 shows details of the period by decades with the largest number of records.

3. Specific statistics by event
3-7
ERN América Latina
0
20
40
60
80
100
120
140
160
180
1766 -
1776
1776 -
1786
1786 -
1796
1796 -
1806
1806 -
1816
1816 -
1826
1826 -
1836
1836 -
1846
1846 -
1856
1856 -
1866
1866 -
1876
1876 -
1886
1886 -
1896
1896 -
1906
1906 -
1916
1916 -
1926
1926 -
1936
1936 -
1946
1946 -
1956
1956 -
1966
1966 -
1976
1976 -
1986
1986 -
1996
1996 -
2006
2006 -
2009
Number of events
Decade
Figure 3-6 Number of earthquakes per decade recorded in Belize for the entire analysed period
0
20
40
60
80
100
120
140
160
180
1966 -
1976
1976 -
1986
1986 -
1996
1996 -
2006
2006 -
2009
Number of events
Decade
Figure 3-7 Number of earthquakes per decade recorded in Belize for the period of instrumentation
Figure 3-8 is the Gutenberg Richter recurrence curve for seismic events from the catalogue, classified by magnitude in Mb. Like the plans shown in the catalogue, the curve indicates that the greater number of records had magnitude of 4-5Mb, and there are no records of magnitudes higher than 6 or lower than 3.

3. Specific statistics by event
3-8
ERN América Latina
1
10
100
1000
Number of earthquakes w
ith upper or
equal magnitude to the provided
Mb Magnitude
Figure 3-8 Gutenberg Richter curve for the Belize seismic catalogue
Figure 3-9 classifies the number of earthquakes as a function of depth, which indicates that the largest number of records lie between 30 and 40 km, a few between zero and 10 and between 80 and 110 km, and very small values of data for greater depths.
0
20
40
60
80
100
120
140
160
0-1
0
10-2
0
20-3
0
30-4
0
40-5
0
50-6
0
60-7
0
70-8
0
80-9
0
90-1
00
100-1
10
110-1
20
120-1
30
130-1
40
140-1
50
150-1
60
160-1
70
170-1
80
180-1
90
190-2
00
200-2
10
210-2
20
220-2
30
230-2
40
240-2
50
250-2
60
260-2
70
270-2
80
280-2
90
Number of earthquakes
Interval of Depth (km)
Figure 3-9
Number of seismic events by depth for Belize The diagram which represents the number of earthquakes per year was made for the earthquakes classified on the Mb. scale of magnitude. The distribution of earthquakes over time in the data catalogue was used to obtain curvesfor the period of greatest instrumentation that is the last 35 years (1973-2008). Figure 3-10 shows the results. It may be observed that there is much variability in results with the change of the time-range selected.

3. Specific statistics by event
3-9
ERN América Latina
[4 - 5) [5 - 6) [6 - 7) [7 - 8)
Return Period 0.145 1.250
Earthquake/Year 6.914 0.800 0.000 0.000
0.00
1.00
2.00
3.00
4.00
5.00
6.00
7.00
8.00
Average number of earthquakes
by year
Interval of Magnitude Mb
Analyzed Period : 35 years (1973 - 2008)
Figure 3-10
Number of seismic events of the year for each interval of Mb magnitude- Belize (Period 1973 to 2008)
Currently, Belize does not have data for economic loss, loss of life, number of injured or otherwise affected, and it is therefore not possible to show a summary table of information on economic and human loss.
3.1.2 Important historical events
The following are some of the principal seismic events which have affected Belize. In Annex ERN-CAPRA-T1.1B-1 there is a list of all the events which form the seismic catalogue for Belize collected to date. The information was obtained mainly from the US Geological Survey, and from seismic records from other countries, recording events also felt in Belize. All the earthquakes presented below events which mostly affected the territory of other countries, but due to their magnitude and intensity, were feltd and recorded in Belize. Febrary 4
th, 1976
The epicentre was at coordinates 15.32° north and 89.1° west, at a depth of 5 km and a magnitude of 7.5 mb Gs.
August 20th, 1977
The epicentre was at 16.7° north and 86.61° west, at a depth of 36 km and a magnitude of 6.1 UKPAS.
August 9th, 1980
The epicentre was 15.9% North and 88.52° West, at a depth of 22 km, and a magnitude of 6.7 UKBRK.

3. Specific statistics by event
3-10
ERN América Latina
September 18th, 1991
The epicentre was at 14.65° north and 90.99° west, depth of 5 km and a magnitude of 6.2 MwHRV
July de 1997
The epicentre was at 16.16° north and 87.92° west, depth of 33 km, magnitude of 6.1MwGS
May 28th, 2009
310 km north-west of Tegucigalpa, Honduras, at a depth of 10 km and a magnitude of 7.3 Mw. Belize suffered power cuts and severe damage to housing
3.2 Tsunami
There are no records of tsunami phenomena for Belize, as having affected the country. Several databases were consulted, and no information was found on any of them.
3.3 Hurricanes
The database for Hurricanes is used to make a statistical analysis of events, and to obtain curves of a number of events per year, decade, and frequency of occurrence as a function of the Category of the phenomenon, on the Saffir-Simpson scale. The hurricane catalogue includes both identified macro events, and more moderate events taken from recent historical records. The database contains a broad range of information in general, regarding the name, type of event, location, date of occurrence, and particular properties of the phenomenon. There is some information available referring to the effects of the phenomenon, and to data of economic and human loss reported. Most of the data had been taken from recent historical records published by a range of entities, such as the National Oceanic and Atmospheric Administration (in particular, HUR-DAT), the Unisys Weather, and the Organisation of American States (OAS). The database has fields for identification and location (event type, name, date) and detail prices on the event (windspeed, pressure, Category, place affected, description and source). There are also fields for information on the main effects of the event (economic loss, deaths, disappeared, injured, affected, and recovery time). Table 3-2 indicates all the fields associated with the complete catalogue, which appears in Annex ERN-CAPRA-T1.1B-3. As a guide, Table 3-3 shows the main characteristics of the Saffir-Simpson scale.

3. Specific statistics by event
3-11
ERN América Latina
Table 3-2 Fields associated with the hurricane catalogue
FIELD DATA TYPE COMMENT
Event type Text Wind hurricane or Rain hurricane
Name Text Hurricane name
Date Date Date of event
Wind speed Decimal Wind speed in Knots
Pressure Decimal Pressure in mb
Category Text Saffir-Simpson Category
Affected area Text Affected places by the event
Description and effects Text General description of event characteristics
Direct economic loss Currency Currently available for some cases
Indirect economic loss Currency Currently unavailable
Consequential economic loss Currency Currently unavailable
Killed Integer Currently available for some cases
Disappeared Integer Currently available for some cases
Injured Integer Currently unavailable
Affected Integer Currently available for some cases
Recovery time (Days) Integer Currently unavailable
Source Text Bibliographic source
Table 3-3
Categories of hurricane in the Saffir-Simpson scale (Source: http://weather.unisys.com/Huracán/index.html)
Type Category Pressure (mb)
Wind Speed
Wind Speed
(knots) (mph)
Tropical Depression TD ----- < 34 < 39 Tropical Storm TS ----- 34-63 39-73 Hurricane 1 > 980 64-82 74-95 Hurricane 2 965-980 83-95 96-110 Hurricane 3 945-965 96-112 111-130
Hurricane 4 920-945 113-135 131-155 Hurricane 5 < 920 >135 >155
The selection of hurricanes which have affected Belize on the basis of the hurricane catalogue for all Central America was made taking account of information found in articles, studies, reports and records, in which there were direct effects on that territory, in addition to events whose trajectories are included in an area of 200 km around Belize territory. The Belize database has 95 events in total, of which 90 refer to Hurricanes classified as wind Hurricanes, and 5 classified as rain Hurricanes. Wind Hurricanes occurred between 1864 and 2007, and rain Hurricanes between 1931 and 2001. The specifications were established depending on the type of impact of the phenomena in the region. The events analysed range from tropical storms to Force 5 Hurricanes, on the Saffir-Simpson scale. Figure 3-11 shows the relative location of hurricanes included in the database.

3. Specific statistics by event
3-12
ERN América Latina
Figure 3-11
Hurricanes affecting Belize

3. Specific statistics by event
3-13
ERN América Latina
Figure 3-11
Hurricanes affecting Belize (Continued)

3. Specific statistics by event
3-14
ERN América Latina
Figure 3-11(Continued)

3. Specific statistics by event
3-15
ERN América Latina
Figure 3-11(Continued)
3.3.1 Statistical curves
The graphs below show that distribution in time of hurricane events, and the frequency of occurrence of events contained in the catalogue. La Figure 3-12 illustrates the number of wind Hurricanes per year 1850 and 2008.

3. Specific statistics by event
3-16
ERN América Latina
0
1
2
3
4
51850
1860
1870
1880
1890
1900
1910
1920
1930
1940
1950
1960
1970
1980
1990
2000
Number of events
Year
Figure 3-12 Number of wind Hurricanes per year, recorded in Belize, during the entire analysed period
Figure 3-13 shows the distribution of events by decade. The most frequent occurrence of events took place between 1930 and 1940, according to available catalogues.
0
2
4
6
8
10
12
14
16
18
20
1850-1
860
1860-1
870
1870-1
880
1880-1
890
1890-1
900
1900-1
910
1910-1
920
1920-1
930
1930-1
940
1940-1
950
1950-1
960
1960-1
970
1970-1
980
1980-1
990
1990-2
000
2000-2
008
Number of events
Decade
Figure 3-13 Number of wind Hurricanes per decade, recorded in Belize for the entire analysed period
Figure 3-14 shows the number of wind hurricane events which equals or exceeds each Category in the Saffir-Simpson scale. Most of these events are in Categories 1 and 2.

3. Specific statistics by event
3-17
ERN América Latina
1
10
100
0 1 2 3 4 5 6
Number of hurricanes w
ith upper or
equal category to the provided
Saffir-Simpson Scale Category
Figure 3-14
Frequency curve for wind Hurricanes in Belize.
The frequency of occurrence of a hurricane as a function of its Category is shown in Figure 3-15. Since there is continuity of events throughout the time covered by records, the period taken into account to obtain frequency values (hurricanes per year), covers 1857 to 2008. According to statistics from the catalogue of events, the average value of wind Hurricanes per year is 0.15, which means that on average, there is a wind Hurricane every 9.29 years which directly affects that country.
Storm 1 2 3 4 5
Hurricane/Year 0.265 0.185 0.199 0.132 0.053 0.066
Return Period 3.775 5.393 5.033 7.550 18.875 15.100
0.000
0.050
0.100
0.150
0.200
0.250
0.300
Average number of Hurricanes
by year
Saffir-Simpson Scale Category
Figure 3-15 Number of wind hurricanes per year by Category, on the Saffir-Simpson scale-Belize
(1857- 2008)

3. Specific statistics by event
3-18
ERN América Latina
The graphs presented below show the distribution over time of events of rain hurricanes, and the frequency of occurrence of events contained in the catalogue Figure 3-16 illustrates the number of rain hurricanes per year for the period 1915 - 2002.
0
1
21915
1925
1935
1945
1955
1965
1975
1985
1995
Number of events
Year
Figure 3-16 Number of rain hurricanes per year, recorded in Belize, during the entire analysed period
Figure 3-17 shows the distribution of events by decade. The largest number of events occurred between 2000 and 2002.
0
1
2
3
4
1910-1
920
1920-1
930
1930-1
940
1940-1
950
1950-1
960
1960-1
970
1970-1
980
1980-1
990
1990-2
000
2000-2
002
Number of events
Decade
Figure 3-17 Number of rain hurricanes per decade, recorded in Belize for the entire analysed period
Figure 3-18 indicates the frequency of rain hurricane events as a function of Category on the Saffir-Simpson scale.

3. Specific statistics by event
3-19
ERN América Latina
1
10
Number of hurricanes w
ith upper or
equal category to the provided
Saffir-Simpson Scale Category
Figure 3-18 Frequency curve for rain hurricanes in Belize
Further, the number of rain hurricanes per year as a function of their Category is shown in Figure 3-19. As with wind hurricanes, these records have certain continuity, and the period taken into account to obtain frequency values (hurricanes per year), is the entire period 1916-2002. From this, it can be seen that the largest number of events is in Category 4. Finally, according to rain hurricane data per year, it is possible to establish that the average value for events three year is 0.012, that is, that a rain hurricane directly affecting Belize occurs every 66.9 years, and causes major impact.
Storm 1 2 3 4
Hurricane/Year 0.000 0.012 0.000 0.035 0.012
Return Period 86.000 28.667 86.000
0.000
0.010
0.020
0.030
0.040
Average number of Hurricanes
by year
Saffir-Simpson Scale Category Figure 3-19
Number of rain hurricanes per year, for each Category on the Saffir-Simpson scale-Belize (1916-2002)

3. Specific statistics by event
3-20
ERN América Latina
Table 3-4 shows Category 4 and 5 Hurricanes which have affected Belize. In the next section, there is a general summary of some of the most important events which have affected Belize.
Table 3-4 Hurricane damage reports in Belize
Name Year Direct
loss(millions of dolars)
Killed Affected
Hurricane Not Name 1970 - - -
Hurricane Not Name 1996 - - - Hurricane JANET 1994 - - - Hurricane HERMINE 1980 - 30 175,000 Hurricane HATTIE 1961 440 319 - Hurricane FIFI 1974 900 8000-10,000
Hurricane EDITH 1988 380 35 2,800 Hurricane CARMEN 1996 152 4 - Hurricane GRETA 1996 - - - Hurricane OPAL 1969 3.9 35 150,000 Hurricane MITCH 1998 6,500 11,000-18,000 -
Hurricane KEITH 1995 225 18 - Hurricane IRIS 1993 66.2 23 100,000 Hurricane DEAN 1958 - 39 - Hurricane FELIX 1966 50.4 133 - Hurricane KEITH 2000 225 18 - Hurricane IRIS 2001 66.2 23 100,000
3.3.2 Important historical events
Belize’s Caribbean coast is a temp is a territory which has been much affected by hurricane. In 1961 a hurricane completely destroyed the then-capital, Belize City, obliging survivors to move to the centre of the country, to what is now the capital of Belize, Belmopan. Below we present the information on hurricanes which have had the most impact on Belize territory since 1960, in the Atlantic hurricane seasons. Hurricane Hattie (1961)
Figure 3-20
Image of the track of hurricane Hattie (Source: http://es.wikipedia.org/wiki/Archivo:Hattie_1961_track.png)

3. Specific statistics by event
3-21
ERN América Latina
Hurricane Hattie-Simone forms part of the hurricane season in the Atlantic from 1961. It was a Category 5 hurricane on the Saffir-Simpson scale, and it affected Belize, Honduras and Guatemala. The hurricane developed, and affected Central America between October 27 and November 1, 1961. Winds of up to 300 km an hour and pressures of 92kPa were recorded. In its track across Central America, it is estimated that it caused 319 deaths, and damage of US$440,000,000, at present value2. Its passage over Belize City caused the destruction of 75% of its houses and shops. Hurricane Fifi (1974)
Figure 3-21
Satellite image of hurricane Fifi (Source: http://es.wikipedia.org/wiki/Archivo:Fifi_1974_track.png)
Figure 3-22
Image of the track of hurricane Fifi (Source: http://es.wikipedia.org/wiki/Archivo:Fifi_1974_track.png)
Hurricane Fifi belongs to the 1974 Atlantic Ocean hurricane season. It crossed the Atlantic as hurricane Fifi, and reached the Pacific, where it was renamed hurricane Orlene. Hurricane Fifi-Orlene developed between September 14 and 22, 1974, from a tropical wave in the Caribbean. It struck Belize territory on September 19 as a Category 2 hurricane, on the Saffir-Simpson scale, with sustained winds of 175 kph, and pressures of 970 mb.
2 Gordon E Dunn and Staff /March 1961) “The Hurricane Season of 19612”, Monthly Weather Reviiew

3. Specific statistics by event
3-22
ERN América Latina
Hurricane Fifi cause damage totalling US$900,000,000 (USD-1974), in Central America, that is, US$4,000 million in present value. The event was catalogued as the 4th most deadly in history, with 8,000-10,000 fatalities.
Hurricane Hermine (1980)
Figure 3-23
Satellite image of hurricane Hermine (Source: http://es.wikipedia.org/wiki/Archivo:Tropical_Storm_Hermine_(1980).JPG)
Figure 3-24
Image of the track of hurricane Hermine (Source: http://es.wikipedia.org/wiki/Archivo:Hermine_1980_track.png)
Hermine belongs to the 1980 Atlantic Ocean hurricane season, and it developed on September 20-25, 1980, from a tropical wave coming from Africa. On September 22, it touched the mainland in Belize with sustained winds of 110 kph and a minimum pressure of 990 mb. It is estimated that there were major floods in Honduras and Belize, but there are no records of damage estimates.

3. Specific statistics by event
3-23
ERN América Latina
Hurricane Keith (2000)
Figure 3-25
Image of the track of hurricane Keith (Source: http://es.wikipedia.org/wiki/Archivo:Keith_2000_track.png)
Hurricane Keith belongs to the 2000 Atlantic Ocean hurricane season. It developed between September 28 and October 6, 2000, with maximum sustained winds of 193 kph (Category 4 on the Saffiir-Simpson scale) and minimum pressures of 941 mb. Hurricane Keith touched land in Belize on October 1, where it weakened down to Category 1. It is estimated that the total damage caused by hurricane Keith in Belize was US$225,000,000 (US$-2000)
Hurricane Iris (2001)
Figure 3-26
Satellite image of hurricane iris (Source: http://geografica.cenapred.unam.mx/SIAT/2001/Oct/08/IRIS11_image011.jpg)
Hurricane Iris belongs to the 2001 Atlantic Ocean hurricane season. It developed between October 4-9, 2001, with Category 4 on the Saffir-Simpson scale and sustained winds

3. Specific statistics by event
3-24
ERN América Latina
stronger than 230 kph. In Belize, it arrived at Monkey River Town on October 9. 23 people reportedly died, 20 of them on the coast. The damage caused by hurricane Iris in Belize totalled an estimated US$66.2 million (US$-2001)
3.4 Intense rainfall
A database has been formed with events of intense rainfall, are based on which statistical analysis was made of them. Based also on this inventory, the rainfall curves were generated for each year and events by decade. The databases base includes mainly the events for which information is available on the Internet, since in most cases, due to the level of impact caused by these rains, they have the attention of the media. Although quantitative information is quite limited - in a few cases only, there are data of millilitres of water, records obtained described the zones involved and the infrastructure affected. Most of the phenomena with considerable impact in the zone are related to Hurricanes which have passed through Central America, cold fronts (polar thrust), tropical waterway waves, convective and orographic processes, the synoptic position of the inter-tropical convergence zone, and episodes of El Nkiño/La Niña/ENOS. The sources of information were the International Disaster Database-EM-BAT, and Red Desastres-Belize. The rainfall catalogue has general fields. Location in space and time (hazard type, date, time, location), data for specific properties of the rainfall for a few cases (mm of water), and a record of the effects generated (economic loss, deaths, persons affected). Table 3-5 describes all fields of the associated database, which is presented in the Annex ERN-CAPRA-T1.1B-4.
Table 3-5 Fields associated with the rainfall catalogue
FIELD DATA TYPE COMMENT
Event type Text Intense Rainfall
Date Date Date of event
Hour Hour Hour of event
Place Text Location of event
Level of water Integer Maximum water depth in mm
Description and effects Text General description of event characteristics
Direct economic loss Currency Currently available
Indirect economic loss Currency Currently unavailable
Consequential economic loss Currency Currently unavailable
Killed Integer Currently available for some cases
Disappeared Integer Currently unavailable
Injured Integer Currently unavailable

3. Specific statistics by event
3-25
ERN América Latina
FIELD DATA TYPE COMMENT
Affected Integer Currently available for some cases
Recovery time (Days) Integer Currently unavailable
Source Text Bibliographic source
The rainfall database has six different events, between 1931 and 2008. Due to the lack of available information, there are no measurements of intensity for most of the events in the catalogue, and this greatly limits the statistical analysis which may be done. A rainfall map associated with each district cannot be produced, since there is no information available for it.
3.4.1 Statistical curves
The graphs below were obtained from the catalogue made up of important rainfall events. Figure 3-27 illustrates the number of events for each year in the period of analysis (1931-2008).
0
1
2
1931
1941
1951
1961
1971
1981
1991
2001
Number of Events
Year Figure 3-27
Number of intense rainfalls per year recorded in Belize, 1931-2008 Figure 3-28 shows the number of events per decade. Most of the events were reported for the period 2000-2008.

3. Specific statistics by event
3-26
ERN América Latina
0
1
2
3
4
1930-1940
1940-1950
1950-1960
1960-1970
1970-1980
1980-1990
1990-2000
2000-2008
Number of Events
Decade Figure 3-28
Number of high-impact rainfalls by decade recorded in Belize, 1931-2008
Finally, Table 3-6 shows some data of human and material damage in the events contained in the catalogue.
Table 3-6 Loss of lives due to intense rains in Belize
Date Direct loss Killed Affected
10/09/1931 7.5 1,500 -
30/10/1961 60.0 275 -
02/09/1974 4.0 - 70,000
30/09/2000 277.5 14 62,570
08/10/2001 250.0 30 20,000
31/05/2008 26.0 - -
3.4.2 Important historical events
There follows information on some of the most important storms which have affected Belize between 1900 and 2009. The information was taken from the emergency events database (EM-DAT) website3. 1931
The storm occurred on September 10, leaving estimated damage of US$7.5 million, and an estimated 1,500 fatalities
3 http://www.emdat.be/Database/CountryProfile/countryprofile.php

3. Specific statistics by event
3-27
ERN América Latina
1961
The storm occurred on October 30, leaving damage estimated at US$60,000,000, with an estimated 275 fatalities. 1974
The storm occurred on September 2, leaving damage of US$4,000,000, and an estimated 70,000 persons affected. 2000
The storm occurred on September 30, leaving material damage of US$277.5 million, with 14 fatalities, and 62,570 persons directly affected. 2001
The storm occurred on October 8, leaving material damage of US$250 million. There were 30 fatalities, and 20,000 people were affected.
3.5 Flood
A flood database can also be used for statistical analysis of events. Based on this catalogue, graphs and events were generated by year, decade, and district. The data had been taken from documents statistics of the International Disaster Database-DN-EM-DAT, and UNDP, amongst others. The database has fields for identification and location (type of hazard, date, location) and details parameters of the event (river, region affected, duration, severity, principal cause, description, effects, source). Table 3-7 indicates all fields associated with the complete catalogue, to be seen in Annex ERN-CAPRA-T1.1B-5.
Table 3-7 Fields associated with the flood catalogue
FIELD DATA TYPE COMMENT
Event type Text Flood
Date Date Date of event
Location Text Location of the event
Rivers Text Involved rivers
Affected Region Integer Affected area in km². Currently unavailable
Time of the event Integer Time in days (Currently available for some cases)
Severity class Integer
Level of severity given by the Regional Natural Hazard Atlas of Central America. The clasification goes from 1 to 3 (see Table 3-8). Currently available for some cases
Main cause Text Main cause
Description and effects of the event
Text General description of event characteristics

3. Specific statistics by event
3-28
ERN América Latina
FIELD DATA TYPE COMMENT
Direct economic loss Currency Currently available for some cases
Indirect economic loss Currency Currently unavailable
Consequential economic loss Currency Currently unavailable
Killed Integer Currently available for some cases
Disappeared Integer Currently unavailable
Injured Integer Currently unavailable
Affected Integer Currently available for some cases
Recovery time (Days) Integer Currently unavailable
Source Text Bibliographic source
Table 3-8 shows classification by severity of flood, given in the regional absence of natural hazards in Central America, which is about included in the database formed by the this type of event.
Table 3-8 Severity of floods
(Source: http://atlas.snet.gob.sv/atlas/files/Inundaciones/HistoriaInundacionesCA.html) SEVERITY CLASS
IMPACT LEVEL FREQUENCY
1 Events of big floodings. Significative damage in structures or fields. Fatalities.
1-2 decades
2 Big events. Damage with collective impact. Recurrence interval (between 20 and 100 years).
3 Extreme events. Massive damage of infrastructure. High
level of fatalities. Recurrence interval upper than 100 years
The catalogue of floods for Belize has six events in total reported between 1979 and 2008. As there are few records of flooding, an average value of events per year as a functional duration could not be obtained. Figure 3-29 shows the number of floods recorded by district.

3. Specific statistics by event
3-29
ERN América Latina
Figure 3-29
Number of floods by districts in Belize
3.5.1 Statistical curves
The following curves present the analysis made using available data for floods. Figure Figure 3-30 shows the number of flood events per year in the analysis period 1970-2008.

3. Specific statistics by event
3-30
ERN América Latina
0
1
2
3
1970
1980
1990
2000
Number of events
Year Figure 3-30
Number of floods for each year recorded in Belize throughout the analysed period
Figure 3-31 shows events by decade. The largest number of records appears for the period 2000-2008.
0
1
2
3
4
1970-1980
1980-1990
1990-2000
2000-2008
Number of events
Decade Figure 3-31
Number of floods per decade, recorded in Belize Figure 3-32 the number of events classified by district.

3. Specific statistics by event
3-31
ERN América Latina
0
1
2
Belize
Cayo
Corozal
Orange Walk
Stann Creek
Toledo
Number of events
District Figure 3-32
Number of floods by district in Belize
Table 3-9 which shows the records of highest economic losses (US$9.7 million) and largest number of persons affected (38,000) by flooding, from 2008 (October 19, 2008). The next section summarises the most important flood events.
Table 3-9 Economic losses and deaths due to floodings in Belize
Date Direct loss (millions of dolars)
Killed Affected
12/1979 - - 17,000
10/1995 0.5 - 2,600
20/05/1990 2.2 - -
01/10/2000 - 1 3,296
31/05/2008 - 5 8,000
19/10/2008 9.7 1 38,000
3.5.2 Important historical events
The following is information about the most important floods which have occurred in Belize between 1900 and 2009. The information was taken from the emergency events database (EM DAT)4. 1979
December, with approximately 17,000 affected
4 http://www.emdat.be/Database/CountryProfile/countryprofile.php.

3. Specific statistics by event
3-32
ERN América Latina
1995
October, with 2,600 directly affected direct economic loss over 0.5 millon dolars. 2008
October 19, 2008, with 1 death, 38,000 affected, and US$9.7 million in material losses
3.6 Landslide
There are no records of landslides affecting Belize.
3.7 Volcanic eruption
Belize has no volcanoes in its territory, and therefore this type of evaluation does not apply.

ERN América Latina
ANNEX LIST
- Annex ERN-CAPRA-T1.1B-1 Earthquakes Belize.xls – Digital Annex - Annex ERN-CAPRA-T1.1B-3 Hurricanes Belize.xls – Digital Annex - Annex ERN-CAPRA-T1.1B-4 Intense rainfall Belize.xls – Digital Annex - Annex ERN-CAPRA-T1.1B-5 Floods Belize.xls - Digital Annex