estudios de sismicidad en la region del … de sismicidad en la region del campo geotermico de cerro...
TRANSCRIPT
ESTUDIOS DE SISMICIDAD EN LA REGION DEL CAMPO GEOTERMICO DE CERRO PRIETO
A Albores L1 C A Reyes 21 J N Brune2 J Gonza1ez Gl L Garcilazo Ml y F Suarez VI
1Centro de Investigacion Cientlfica y Educaci6n Superior de Ensenada Ensenada Baja California Mexico
2Institute of Geophysics and Planetary Physics Scripps Institution of Oceanography
University of California La Jolla California USA
I RESUMEN
Reportamos resultados de los estudios de la sismici dad de la region del Campo Geotermico de Cerro Prie to Estos estudios se llevaron a cabo con estacio~ nes permanentes de periodo corto durante 1974-1975 y 1977-78 Durante el ultimo periodo se utilizaron sismometros horizontales para el mejor control del arribo de tiempo de las ondas S Las localizaciones fueron obtenidas para aproximadamente 200 eventos y las soluciones compuestas del plano de falla fueron obtenidas para un grupo de eventos seleccionados La actividad sismica esta caracterizada principalshymente por enjambres de eventos relativamente pequeshynos Sin embargo un enjambre tuvo eventos con mapound nitudes mayores de 50
Los epicentros indican una distribucion amplia que une las fallas de Cerro Prieto e Imperial Dentro de esta distribucion hay indicaciones de orientacion paralela y oblicua al sistema de fallas transformashydas Cerro Prieto-Imperial Las soluciones compuesshytas del plano de falla indican movimiento lateral derecho a 10 largo de fallas con tendencia noroesteshysureste y movimiento en la direccion del echado en algunas de las fallas oblicuas Los resultados son consistentes con el modele propuesto por Hill (1977) y sugieren que los enjambres ocurren como resultado de la inyeccion de fluidos magmaticos a 10 largo de las zonas de falla En consecuencia el entendimien to de la naturaleza del fallamiento y de los proce~ sos tectonicos es muy importante en la evaluacion del potencial para energia geotermica en una region
II INTRODUCCION
Las areas geotermicas estan usualmente localizadas en regiones de tectonismo activo y en consecuencia no es sorprendente que en la mayoria de elIas la ac tividad sismica es alta En particular el estudioshyde la actividad sismica del Valle de Mexicali es de gran importancia para nuestro entendimiento del tecshytonismo de la region y debido al potencial economi co que representa la explotacion de sus recursos shygeotermicos es importante caracterizar el campo geo termico de Cerro Prieto dentro del Patron TectonicoshyRegional del Valle de Mexicali Como consecuencia
seremos capaces de refinar nuestros conceptos para identificar areas similares con recursos geotermicos potenciales
En el presente trabajo reportamos los resultados de estudios de sismicidad iniciados en el Valle de Mexicali utilizando estaciones portatiles y a parshytir de julio de 1977 estaciones permanentes locali zadas en la region del Campo Geotermico de Cerro Prieto Este es el primer estudio que se realiza en la region utilizando sismometros verticales y horizontales para mejorar la confianza en las deter minaciones de profundidades focales
El estudio fue propuesto a la CFE-Coordinadora Ejeshycutiva de Cerro Prieto a traves del Instituto de vestigaciones Electricas (lIE) y financiado conjunshytamente por CFE y CICESE Los resultados obtenidos hasta la fecha nos han aportado la infraestructura basica de datos para la futura elaboracion del mode 10 tectonico-estructural de las partes activas delshysistema de Fallas Imperial-Cerro Prieto Esta base de datos no existia debido principalmente a la cashyrencia de estaciones sismologicas en el valle
Estudios sobre la ocurrencia y localizacion de mishycrotemblores han sido propuestos por diferentes aushytores (Combs y Rothstein 1976 Hamilton y Muffler 1972 Hill et al 1975 Lange and Westphal 1969 Majer y McEvilly 1979) como una herramienta exshyploratoria de Recursos Geotermicos El argumento principal es el siguiente La actividad sismica ocurre a 10 largo de fallas y estas son zonas de alto fracturamiento que provee la permeabilidad su ficiente para la extraccion de calor En este mo~ delo el transporte de calor se lleva a cabo por el mecanismo convectivo de fluidos (salmuera caliente)
Otros metodos sismico-pasivos han sido propuestos como herramientas de exploracion analisis de ate nuacion de ondas de cuerpo Variaciones regionales en la razon VpVs analisis de ruido sismico Los dos primeros han sido evaluados por Majer y McEvelly (1979) como promisorios puesto que existen result a dos en campos tipicos en los cuales valores an5malos en Q y VpVs se observan en las zonas de produccion
227
228
(con referencia al area circunvecina) Los resulta dos sobre analisis de rU1do s1smico aun no han sido 10 suficientemente convincentes
De las tendencias existentes para el estudio de los recursos geotermicos en el Valle de Mexicali (utishylizando metodos s1smicos-pasivos) nos hemos decidi do por el enfasis tectonico en lugar de la observa cion con optica muy fina de la sismicidad en el cam po Nuestros conocimientos del tectonismo de cen-shytros de dipersion en la corteza oceanica del Golfo de California estan relativamente bien desarrollados y nos permiten hacer comparaciones directas con el Valle de Mexicali el cual es parte de la misma pr~ vincia fisiografica del Golfo de California
El Valle de Mexicali como parte de la provincia fi siografica del Golfo de California esta caracteri~ zado por un sistema de grabens resultante de la exshytension cortical asociada al movimiento de rumbo de las Fallas Imperial-Cerro Prieto Como consecuencia esta es una region de corteza del gada y alto flujo termico causado por la iustrusion de material 19neo del manto Si suponemos que la cubierta sedimentaria (5000 a 6000 mts) inhibe la ci rculacion hidrotermal (D L tVilliams et al 1974 C Lister 1976) y que la circulacion en esta reshygion ocurre lateralmente a traves del sistema de f~ lIas transformadas (Imperial-Cerro Prieto) entonshyces esas zonas de falla son las mas probables de transporte vertical por conveccion hidrotermal de salmueras calientes En consecuencia las zonas de fallas son los lugares mas probables para encontrar reservorios geotermicos de gran importancia econoshymica
III INVESTIGACIONES PREVIAS
Tres estaciones permanentes fueron instaladas en 1969 por la UNAM y CALTECH (Lomnitz et al 1970) alrededor de la region norte del Golfo de Califorshynia para estudiar la sismicidad del Valle de Mexica Ii y la region Norte del Golfo de California -Lomnitz et al (1970) reportaron que la actividad s1smica estuvo concentrada en las Fallas Imperial Cerro Prieto (San Jacinto) Sierra Juarez y San Mi
(figura 1) El modelo tectonico de la provi~ cia fisiografica alrededor de la parte Norte del Golfo de California propuesto por dichos autores consiste de una serie de seis fallas transformadas conectadas con cinco centros de dispersion de corshyteza oceanica Los centr~s de estan ca racterizados por zonas geotermicas volcanes recian tes enjambres de temblores y depresiones topografI cas submarinas
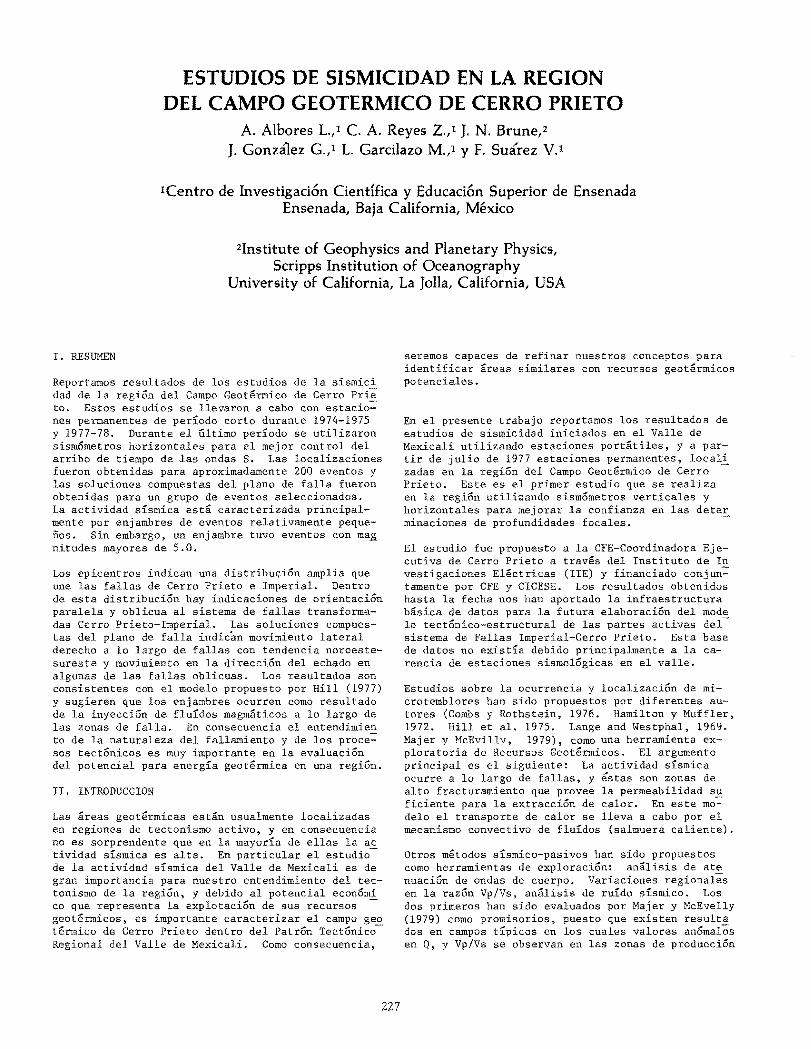
Los resultados obtenidos en un estudio mas reciente de los datos de las estaciones RHM EGM SFP la red de CALTECH del Sur de California y de una red temporal instalada durante el per10do 1974-1975 se muestran en la figura 2 Estas determinaciones de epicentros se llevaron a cabo con un promedio de aproximadamente 5 estaciones con arribos identifica bles de ondas S en 2-3 de elIas
Los epicentros en la region sureste de Cerro Prieto muestran claramente una tendencia paralela a la Fashylla Cerro Prieto e indican que dicha tendencia de epicentros esta asociada con la falla En la region comprendida entre las dos fallas los epicentros se dispersan y no sugieren un patron simple Pocos
Palamar
lt~ 0o~
Glamis
PLT
XSL 794~9404
Figura 1 Mapa regional del area de Cerro Prieto Los puntos solidos representan la Red Sismologica de estaciones permanentes de Cerro Prieto (RESCEP) Los crculos abiertos representan estaciones temporales que operaron para los eventos de Enero 1977 y para el enjambre Victoria de Marzo 1978 Los triangulos solidos representan algunas de las estaciones permanentes de la region
eventos ocurren fuera de la region entre las dos lIas Aun cuando durante el per10do de tiempo reshypresentado por la figura 2 no existe una tendencia de epicentros a 10 largo de la Falla Imperial ~n
el per10do de tiempo estudiado por Lomnitz et al (1970) existio dicha tendenda (existio aClemas una concentracion a 10 largo de la Falla Cerro Prieto) Los datos del Bolet1n Sismologico de CALTECH previos a 1971 no muestran concentraciones obvias de dad a 10 largo de la Falla Imperial en Mexico 0 de la Falla Cerro Prieto Esto podrfa deberse a la po bre cobertura y pobre precision de localizacion du~ rante este per10do de tiempo
IV RESULTADOS RECIENTES
Instrumentacion- Estaciones portatiles de alta gashynancia con en papel ahumado (Sprengnether ModMEQ-800) con 60 db de atenuacion (incrementos de -6 dbpasos) fueron utilizadas en conjunto con sismometros RANGER-SS1 (frecuencia natural de 1 Hz y constante de motor G~93 voltsmtseg) La cacion sin atenugcion tiene su maximo alrededor de los 25Hz (4 x 10 ) La respuesta a frecuencias del sistema inclu1dos el amplificador y filtros se mues tra en la figura 3 El suministro de energfa elec~ trica del sistema se provee con dos baterias de 12 volts (75 amps) El consumo de corriente es de 15 mamp 10 cual permite operar en modo continuo por cinco semanas El sistema de control de tiempo (WWVB) se provee con radios Modelo 60-TL de True Time Instruments El codigo de tiempo se alimenta manualmente al sistema al iniciar y finalizar el re
0
w w U1
~CCP0 rg
00 ~
0 ~ 0 0 ~ (]
08J 0
VOLCAN bull C PRIETO PRIANOOO
()l eCPR
(J1_ ~
0 0
0 0
00 1( (I
0 ~1l 0
10 000 GUA Oamp
0 0 ()l 0
0~ 00(J1_
0
[NORTE
115deg25 115deg 15
XBL 794-9400
Figura 2 Sismicidad de la region de Cerro Prieto de 1971-1975 Los triangulos solidos representan estaciones locales operadas en 1974 - 1975
gistro La estabi~dad del control interne de pos es + 432 x 10 segdia La velocidad de reshygistro del tambor es 2 mmseg 10 cual permite leer los tiempos de arribo de senales impulsivas con un error de aproximadamente plusmn 005 segs
Operacion de Campo- Las estaciones fueron opera-middot das en diferentes lugares por periodos cortos de tiempo con el objeto de determinar el nivel de acti vidad local de microtemblores y niveles de ruido shysrsmico En junio 2077 se instalo la red permanen te (RESCEP) en el area de Cerro Prieto que consta de tres estaciones con sismometros verticales (QKP SON TAM) y dos estaciones con sismometros verticashyles y horizontales (CPR TLX) La localizacion de las estaciones se muestra en la Figura 1
Las coordenadas geograficas se listan en la Tabla l en la cual tambien se incluye el nivel de ganancia al que ha operado cada estacion desde junio 2077 El nivel de rurdo sismico en el valle es considerashyblemente alto durante el dia decreciendo signifishycantemente durante la noche por 10 cual todas excepto QKP han operado al minimo nivel de ganancia
3de 39 x 10 (-60 db) dando un nivel de ruido en la traza del sismograma de 05 mm pico a pico Los sismometros se encuentran instalados en bases de concreto a 2 mts de profundidad observandose
229
106
105 Z 0 I shylaquo U IJ
Z lt)
4~ 10
103
01 10 FREQUENCY
XBL 794-9401
Figura 3 Curva de amplificacion para los sismografos utilizados en este estudio
TABLA 1 Coordenadas geograficas y nivel de ganancia (ganancia~axima igual a 4 x 10⁶) de las estaciones
ESTACION lATITUD lONGITUD GANANCIA
EPUmiddot 32middot 14 60 115deg 04 80 60 db
EIRmiddot 32deg 3655 II 5middot 0775 60 db
RSOmiddot 32deg 3190 115 0 0095 60 db
CPRmiddot+ 32deg 2520 115deg 18 10 60 db
QKPt 32deg 1830 115middot 1992 90 db
TlX + 32middot 1832 115middot 0871 60 db
NVl + 32deg 2391 115deg 1266 60 db
TOM + 320 3462 1150 1433 60 db
SON + 32deg 1750 115deg 0983 60 db
ClS bullbull 32deg 1946 1150 0675
OlA bullbull i 32middot 2003 115deg 0957
VIC bullbull 32deg 1856 1150 0604
i VEN bullbull 32deg 1465 115 0 0750
CVC bullbull 32middot 1216 115deg 0873
ESTACIONES UTILIZADAS DURANTE ENERO 1977 ESTACIONES UTlLlZADAS DURANTE MARZO 1918 ( dlgltale) REO DE ESTACIONES PERMANENTES+ XBL 794-9409
100
230
un amortiguamiento de al menos un factor de dos en el nivel de rUido con respecto a las observaciones en la superficie La frecuencia caracteristica del rUldo sismico esta principalmente relacionado a la intensa actividad agricola del valle (y posiblemenshyte a la actividad geotermal en la vecindad de la e~ tacion Nuevo Leon) La diferencia en rUldo slsmico observado en las estaciones localizadas en el valle con respecto a la estacion QKP es muy probablemente originada por efectos de amplificacion en los sedishymentos de baja del valle
V ANALISIS DE DATOS
Los resultados de este estudio estan basados en 10shycalizaciones relativas precisas y mecanismos focashyles compuestos del primer movimiento Los mejores datos (eventos grandes) provinieron de enjambres de eventos Los enjambres ocurrieron en las siguientes localidades Vecindad del Campo Geotermico de Cerro Prieto (Septiembre 28 77) en la vecindad del pozo exploratorio PRIAN (Octubre 15 77) sur de la Falla Imperial cerca del Ejido Tlaxcala (Enero 17 77) Y en la vecindad del Ejido Victoria (Marzo 10 78) La base de datos para el estudio de la sismishycidad durante este perlodo fueron tiempos de arribos de fases P y S Y polaridades de las ondas P regisshytradas por las estaciones de la red sismografica de Cerro Prieto RESCEP 1977-197R En las determinaciones de epicentros y profundidades focales se selecciQnaron eventos registrados por RESCEP que estan caracterizadQs por arribos vos permit iendo lecturas confiables de los arribos P y S
En promedio el espaciamiento de las estaciones de RESCEP (figura 1) es aproximadamente 20 KID esto provee buen control en las determinaciones epicenshytrales y profundidades focales para eventos zados en el interior de la red Los datos de los enjambres de Septiembre 28 77 Octubre 15 77 Enero 2078 y Marzo 1078 fueron particularmente importa~ tes como eventos maestros para las determinacioshynes relativas de epicentros que se discuten posteshyriormente La localizacion de esos eventos se mues tran en la Figura 1 La Tabla 2 da sus coordena-shydas hipocentrales y magnitud coda
Para alcanzar el maximo nivel de precision en las determinaciones hipocentrales los tiempos del prishymer arribo de las fases P y S fueron leldos por va rios lectores utilizando lentes con una magnifica-shycion de 6X Las lecturas aSl obtenidas fueron comshyparadas para determinar los errores estandar en la precision de tiempos de arribos (plusmn 005 seg)
El metodo de localizacion relativa utilizada en es te estudio es simple y efectiva El metodo ha sido descrito por Johnson y Hadley (1976) y se describe brevemente a continuacion El metodo consiste de dos partes Primeramente uno 0 varios eventos por zonas son seleccionados y designados eventos maesshytros El criterio de seleccion es principalmente la disponibilidad de arribos impulsivos py S en to das las estaciones En seguida se supone que los shyresiduales tiempo-distancia en la localizacion son ocasionados completamente pbr retrasos de estacion esto es por anomallas en la estructura de velocida des en la vecindad de la estacion Los eventos res tantes son localizados utilizando esos retardos deshytiempo como correcciones de estacion De esta for-
TABLA 2 Fechas coordenadas hipocentrales y magnishytudes coda de los eventos maestros para la detershyminacion relativa de epicentros
FE CH A LATITUD LONGI TUD DE P T H MAG
770928 32middot 2372 115deg 1315 935 17
770928 32middot 2417 115deg 1366 II A6 23
770928 32deg 2437 115deg 12A3 608 28
770928 32middot 2379 115deg 1333 905 28
771015 32deg 2401 115deg 1171 933 7710 15 32deg 2380 115deg II 37 7 12 771015 32middot 2402 115deg 1123 10 04 7712 20 32deg 3790 115deg 1956 6 64 19
7712 II 32deg 3692 115deg 2448 603 18
771211 32 3652 115deg 2378 667 20
7801 20 32deg 2710 115middot I L 18 1498 10
7801110 32deg 2692 115deg 1073 1486 I I
780318 32deg 1624 115 0 0561 1081 49
780318 32deg 1516 115 0 0614 I 189 23
780319 32deg 1611 115middot 0780 974 25
bull
OltMlt10 XBL 794-9408
rea se logra un alto nivel de precision en las locashylizaciones relativas (equivalente a fijar un vector de localizacion relativa a los tiempos relativos en tre un evento y el evento maestro) El mayor logr de este metodo de localizaciones relativas es el de proveer una imagen mas clara de la distribucion de la sismicidad Con la eventual adquisicion de cono cimiento sobre la estructura de velocidades sera sible obtener un mayor refinamiento en las naciones Pero creemos que las conclusiones basi- cas no se cambiaran criticamente
Para fijar la velocidad de la onda S a partir de la velocidad de la onda P la razon VpVs fue determishynada del diagrama de Wadati que se muestra en la gura 4 Aproximadamente 80 datos de primeros bos de las fases P y S leldos en los registros vershyticales y horizontales fueron utilizados Los tiem pos de las fases P y S se determinaron con referenshycia a la estacion con arribo P mas temprano La co rrelacion lineal entre S y P dan un valor para VpVs de 167 menor que el valor esperado de 173 (para una razon de Poisson de 025) y significanteshymente diferente del valor de 25 reportado por Majer y McEvilly (1979 este volumen) en un estushydio realizado en la vecindad inmediata de los pozos de Cerro Prieto utilizando sismornetros verticales y horizontales
Las determinaciones hipocentrales se obtuvieron uti lizando el programa de localizacion HYPO-75 (Lee y Lahr 1975) El modele de velocidades utilizado pa ra la localizacion se tomo de estudios similares en en el Valle Imperial El modele se muestra en la figura 5 Las discontinuidades abruptas en este mo dele fueron alisadas por la introduccion de capas delgadas con cambios graduales en velocidad para disminuir los efectos desestabilizadores de capas abruptas sobre las determinaciones de mecanismos fo cales
231
bull bullbullbull bull bull
bull
(f)
ltJ lIE (fIT5 DE REO
fERI1FINENTE
o ~ EVENJDS DE SEPTIEtmtE 19n
o ENJAl18RE OE MMZO OE HI7S
eCIACIlII RECTR RJUSTF(JRl I 16726--013597
~~~~----~-----------------~--------~
D P ( SEC)
XBL 794-9403
Figura 4 Diagrama Wadati para los tiempos de arribo de las ondas P y S en la region de Cerro Prieto
VI DISCUSION DE LOS RESULTADOS
Localizaciones- La Figura 6 muestra la distribushycion de epicentros localizables de la actividad ss mica en el Valle de Mexicali durante el perodo deshyobservacion Enero 1977 - Mayo 1978 La distribushycion general de epicentros determinados durante esshyte perodo de observacion no es muy diferente del perodo mostrado en la figura 2 sugiriendo que ambas determinaciones son relativamente confiables Eventos tan pequenos como M (magnitud) aproximadashymente 05 fueron localizados pero debido al alto nivel de rufdo sfsmico observado en el valle y a problemas intermitentes en la operacion de la red la cobertura de la actividad sfsmica no es completa
Como se puede observar en la figura 6 el patron sfsmico muestra una tendencia N-S conectando el ex tremo noroeste de la Falla Cerro Prieto con el ex~ tremo sureste de la Falla Imperial La sismicidad muestra escasa actividad sfsmica a 10 largo del tra zo superficial de la Falla Imperial comprendido en~ tre la estacion TAM y la frontera Internacional (en contraste durante 1969 Lomnitz et al 1970
VELOCITY (Km I sec) a
a
4
6
7
e
E 9
_ 10 x ~
Cl
UJ
Cl
15
VELOCITY (Kmec)
170 196 27376 469 6AO 7 10
20 600
XBL 794-9402
Figura 5 Modelo de velocidad utilizado en este estudio
encontraron actividad significante en esta seccion de la Falla Imperial) La concentracien de eventos en la vecindad del Ejido Victoria (cercana a la esshytacion SON) corresponde en su mayor parte al Enjam bre Victoria de Marzo 10-2378 el cual consistio en aproximadamente 500 eventos Las magnit~des de los eventos mas grandes fueron 47 y 50 La distribushycion de epicentros sugiere que la actividad del enshyjambre involucre predominantemente la tendencia noroeste de la Falla Cerro Prieto y una falla para lela en-echelon y fallas conectantes NS Esta in terpretacion tambien la sugiere el mecanismo focal compuesto de esos eventos
Un patron difuso de actividad ssmica se observa al oeste de la Falla Cerro Prieto Cerca de la estashyci6n QKP ocurri6 una serie de replicas de un temshyblor del 5 de Mayo de 1978 con aproximadamente 1500 eventos de magnitud menor a 1 Existe tambien actividad sismica difusa al noroeste de Cerro Prieto probablemente asociada a la zona de fal1a San Jacinto (aun cuando estos eventos ocurren en el exterior de RESCEP y su loca1izaci6n esta pobreshymente constrenida)
232
w w U1
0 0
0 0 0 0 8
VOLCAN C PRIETOOJ
ltl R 0
0 0
0
0 OKP~
03 OJ
ltl ji shy
0
0
115 0 15
XBL 794-9399
Figura 6 Sismicidad de la region de Cerro Prieto 1977-1978 Los triangulos solidos representan estaciones permanentes de la Red Sismologica de Cerro Prieto (RESCEP)
Un estudio especial se realizo de las replicas de un evento de magnitud 42 (CALTECH) que se locali shyzo en el extremo sur de la Falla Imperial (Punto A) el 17 de Enero de 1977 burante un periodo de observacion de 48 horas iniciadas 36 horas despues del evento principal se registraron 40 eventos de los cuales fue posible localizar 10 Las profundi dades focales estimadas varian de 6 a 13 Km -
Soluciones Compuestas del Plano de Falla- La esshyfera focal de las proyecciones de la polaridad del primer arribo para un determinado grupo de eventos rotulados A B C y D en la figura 6 fueron cados en una proyeccion de igual area (hemisferio superior) Si todos los eventos del mismo grupo tienen la misma orientaci6n de falla esta proyecshycion compuesta indicara dicha orientacion aun cuan do pocas estaciones hayan sido utilizadas
La solucion compuesta del plano de falla para los eventos del grupo A (Enero 17 1977) se muestra en la figura 7 Este indica ya sea movimiento lateshyral derecho a 10 largo de una falla con una tendenshycia noroeste 0 un movimiento lateral izquierdo con una tendencia noreste a 10 largo de una falla conju gada Si la interpretacion del movimiento lateralshyderecho es seleccionado entonces la localizacion de los epicentros sugiere al menos tres fallas enshyechelon paralelas a la Falla de Cerro Prieto De otra forma si la interpretacion del movimiento la-
o
o o 0
00 8 ~ 0
o
XBL 794-9410
Figura 7 Grafica del mecanismo focal compuesto para los eventos del temblor de Enero 17 1977 Smbolos 0 dilatacion compresion
teral izquierdo es seleccionada los epicentros tam bien podrian representar fallamiento lateral izshyquierdo conjugado
Para los eventos localizados en la vecindad del poshyzo exploratorio PRIAN (Grupo B figura 6) el mecanis mo focal esta pobremente constrenido pero sugiere shymovimiento sobre una falla vertical En comparashycion el mecanismo focal compuesto de eventos en la vecindad de los pozos de produccion de la planta geotermica de Cerro Prieto (Grupo C figura 8) can que la actividad sismica involucra predominante mente fallamiento normal con un echado de 30 grados hacia el sureste 0 60 grados al noroeste la primeshyra es consistente con los resultados de estudios geologicos esctructurales realizados en el area de la zona de producci6n por Puente y de la Pena (1979 este volumen) Los datos de 1a polaridad del plano de falla compuesto del Grupo D figura 9 tambien sugiere un fallamiento normal sin embargo los datos no son suficientes para precisar la soluci6n La lInea punteada indica el mismo plano de falla como en la figura 8 y es consisshytente con los datos con 1a excepcion de un punto
La solucion compuesta del plano de fa1la para el Grupo E figura 10 (enjambre de Marzo 10-23 1978) esta bien constrenida e indica un rumbo lateral derecho con una tendencia de falla noroeste (azimut 330 grados) o movimiento lateral izquierdo con una tendencia de falla noreste La solucion anterior es la mas proshybable porque es consistente con 1a orientacion de 1a falla de Cerro Prieto y 1a tendencia indicada
233
bullbull bull
XBl 794-9407
Figura 8 Grafica del mecanismo focal compuesto para los eventos del Enjambre de Septiembre 29 y Octubre 15 1977 Sfmbolos 0 dilatacion _ = compresion
bullbull
I
I I I
I I
I
bull
I
1
I I
I
~ 2=40middot bull
600
Y
I I
bull I I
I
I 1300
o 00 1-
XBl 794-9406
Figura 9 Grafica del mecanisme focal compuesto para los eventos del Grupo D (ver figura 6) Spoundmbolos 0 = dilatacion _ = compresion
bullshy) o
XBL 794- 9405
Figura 10 Grafica del mecanisme focal compuesto para los eventos del Enjambre 10-21 1978 Sfmbolos 0 dilatacion _ = compresion
por las localizaciones epicentrales figura 6 Alg nos de los eventos de este enjambre no estan represhysentados en la solucion compuesta porque sus polashyridadps fueron claramente inconsistentes con la ROshy
lucion Estas podrlan representar fallamiento om deslizamiento de echado simultaneanlente con fallashymiento con deslizamiento de rumbo
Interpretacion- El patron de sismicidad y el meca nismo focal compuesto del plano de falla descrito shyanteriormente que la distribucion de la deshyformacion (deslizamiento slsmico) en el Valle de Mexicali ocurre principalmente a Jo largo de dos tendencias tectoricas i) Fallas paralelas incluyendo el sistema de fallas transformadas Impeshyrial-Cerro Prieto ii) Un sistema de fallas obli shycuas a la tendencia Imperial-Cerro Prieto involucran do al menos fallamiento normal
Los resultados de estudios previos en la provincia del Salton Sea y en el Golfo de California (Hill et al 1975 Lomnitz et al 1970 Reichle 1976 Thatcher y Brune 1971) nos indican que las fuerzas tectonicas regionales inducidas por el movimiento relativo de la placa del Paclfico (Nor-Oeste) con respecto a la placa Americana produce fuerzas tecshytonicas tensionales en el graben de Cerro Prieto ocasionando cortical con el consecuente adelgazamiento de la corteza Dispersion local de la corteza es requerido por la geometrla de la esshytribacion local (off-set) del sistema de fallas Imshyperial-Cerro Prieto Nuestros datos en conjunto con estudios geo16gicos (Puente y de la Pena 1979 este volumen) indican que en el interior del graben de Cerro Prieto la corteza se rompe en una serie de blocks delimitados por pIanos orientados paralelashymente al sistema Imperial-Cerro Prieto (como se
234
observa en los puntos AyE de la figura 6) y por un conjunto oblicuo de fracturas con una componenshyte de fallamiento normal indicando tensi6n en una direcci6n noroeste-sureste como 10 indica 1a disshytribuci6n de 1a sismicidad en el graben y los meshycanismos focales compuestos (Puntos B y C) Cuando este sistema de fracturamiento se observa en la 1uz del mode10 de Hill (1977) se sugiere que los enjamshybres ocurren como resu1tado de la inyecciJu de fluidos magmaticos La existencia de estas zonas de fracturamiento complejo en la corteza podrian tambien explicar e1 alto flujo termico observado en en el Valle de Mexicali puesto que las fracturas producen zonas de alta permeabilidad a traves de los cuales 1a salmuera caliente puede fluir
Los resultados de este estudio han sido muy estimushylantes y nos indican que con una mayor cobertura y precision aspectos importantes del tectonismo del campo geotermico de Cerro Prieto seran reve1ashydos Un arreglo de seis estaciones con te1emetria digital disenada para este proposito ha sido lada por CICESE con fondos de la CFE y CICESE 1a red se encuentra en operacion actualmente
VII AGRADECIMIENTOS
~ste estudio fue financiado en conjunto por la COO dinadora Ejecutiva de Ceero Prieto (CFE) y e1 Censhytro de Investigacion Cientifica y de Educacion Sushyperior de Ensenada (CICESE) a traves del Instituto de Investigaciones Electricas (lIE) La informacion del primer periodo fue obtenida con fondos de la NSF y NASA Durante este periodo los trabajos de campo fueron realizados por Alejandro Nava y Steve Day
Queremos agradecer especia1mente al Ing Hector Alonso (CFE) Ing Guillermo de 1a Garza (lIE) y a1 Dr Pablo Mu1as (lIE) por e1 apoyo y estimu10 brindado para este estudio
Nos hemos beneficiado con las discusiones sobre la geologia y geofisica de Cerro Prieto del Ing Hector Alonso Ing Antonio Razo y el Ing Puente
Estamos especialmente agradecidos con Jouracy Soarez Alejandro Hinojosa L Inzunza y Javier Martinez por su asistencia en la lectura de sismoshygramas y a F Jaime por su participacion en 1a coshyleccion diaria de sismogramas Ademas apreciamos e1 esfuerzo de N Rohner y Rosi Martinez por mecashynografiar y traducir la version Espanol-Ingles de este articulo
VIII BIBLIOGRAFIA
Combs J Y Rothstein Y 1976 Microearthquake studies at the Coso geothermal area China
Lake California in Proc Second UN Symp on Development and Use of Geothermal Reshysources May 1975 San Francisco Washington DC US Government Printing Office v 2 p 909
Hamilton RI Y Muffler LJP 1972 Microshyearthquakes at The Geysers geothermal area California J Geophys Res v 77 p 2081
Hill DP 1977 A model for earthquake swarms J Geophys Res v 82 p 1347
Hill DP Mowincke1 P y Peake LG 1975 Earthquakes active faults and geothermal areas in the Imperial Valley California Science v 188 p 1306
Johnson CE y Hadley DM 1976 Tectonic implications of the Brawley earthquake swarm Imperial Valley California Bull Seism Soc Am v 66 pp 1133-1144
Lange AL y Westphal WH 1969 Microearthshyquakes near The Geysers Sonoma County Cali shyfornia J Geophys Res v 74 p 4377
Lee WHK y Lahr JC 1975 HYPO-7l (Reshyvised) A computer program for determining hypocenter magnitude and first motion patshytern of local earthquakes US Geological Survey Open-File Report p 113
Lister CRB 1976 Qualitative theory on the deep end of geothermal systems in Froc Second UN Symp on Development and Use of Geothermal Resources May 1975 San Francisshyco Washington DC US Government Printshying Office v 2 p 459
Lomnitz C Mooser F Allen CR Brune JN y Thatcher W 1970 Sismicidad y tectonica del Golfo de California resultados prelimishynares Geoflsica Internacional v 10 no 2 p 37 48
Majer EL Y UcEvilly TV 1979 Seismologshyical investigations at The Geysers geothermal field Geophysics v 44 no 2 p 246
Reichle MS Sharman G y Brune JN 1976 Sonobuoy and teleseismic study of Gulf of California transform fault earthquake seshyquences Bull Seism Soc Amer v 66 p 1623
Thatcher W y Brune JN 1971 Seismic study on an oceanic ridge earthquake swarm in the Gulf of California Geophys JR astr Soc v 22 p 1446
Weaver CS y Hill DP 1978 Earthquake swarms and local spreading along major strike-slip faults in California Basel Birkhauser Verlag p 117
Williams DL Von Hersen RP Sclater JG Y Anderson RN 1974 The Galapagos spreading center lithospheric cooling and hydrothermal circulation Geophys JR ast Soc v 38 p 587
235
SEISMICITY STUDIES IN THE REGION OF THE CERRO PRIETO GEOTHERMAL FIELD
ABSTRACT We report results from seismicity studies
in the region of the Cerro Prieto Geothermal Field These studies were conducted with local short period seismic arrays during 1974-75 and 1977-78 During the latter period horizontal seismometers were used for better control on the S-wave arrival times Locations were obtained for about 200 events and composite fault plane solutions were obtained for five groups of events The seismic activity is characterized primarily by swarms of relatively small events although one swarm had events with magnitudes as high as 50
The epicenters indicate a broad distribushytion connecting the Cerro Prieto and Imperial faults Within this distribution there are indications of trends both parallel to and oblique to the Cerro Prieto-Imperial transform fault system The composite fault plane solutions indicate right lateral strike-slip faulting along NW-SE trending faults and dip-slip faulting along at least some of the oblique faults
The results are consistent with the model proposed by Hill (1977) and suggest that swarms occur as a result of injection of magmatic fluids along fault zones Thus understanding the nature of faulting and tectonic processes is very important in evaluating the potential for geothermal energy in a region
INTRODUCTION Geothermal areas are usually located in
regions of active tectonism and as a consequence it is not surprising that in the majority of them the seismic activity is high In particular the study of seismic activity of the Mexicali Valley is very important for our understanding of the tectonism of the region and due to the economic potential represented by the valleys geothermal resources it is important to charactshyerize the Cerro Prieto geothermal field within the regional tectonic pattern of the Valley of Mexicali Consequently we will be able to refine our concepts for identifying similar areas with potential geothermal resources
In the present study we report the results of seismic studies initiated in the Valley of Mexicali using portable stations and beginning m July 1977 permanent stations located in the region of the Cerro Prieto geothermal field This is the first study carried out in this region using both horizontal and vertical seismographs to improve the determination of focal depth
The study was proposed to the CFE Execshyutive Coordinator of Cerro Prieto through the Institute of Electrical Research and financed jointly by CFE and CICESE The results obtained to date have provided us with the basic data for future elaboration of the tectonic structural model of the active parts of the Imperial-Cerro Prieto fault system This data base has not been available earlier due principally to the lack of seismological stations in the valley
Study of the occurrence and locations of microearthquakes has been proposed by different authors (Combs and Rothstein 1976 Hamilton and Muffler 1972 Hill et al 1975 Lange and Westpahl 1969 Majer and McEvilly 1979) as an exploratory tool for geothermal resources The principal concept is the following The seismic activity occurs along faults and these are highly fractured zones that provide permeability sufficient for the extraction of heat In this model the transport of heat is brought about by the convection of fluids (hot brines)
Other seismic passive methods have been proposed as tools for exploration analysis of the attenuation of body waves regional variation in the ratio VpVs and analysis of seismic noise The first two have been evaluated by Majer and 1cEvilly (1979) as promising because results now exist for typical fields in which anomalous values of Q and VpVs are observed in the zones of proshyduction (relative to the surrounding areas) Results concerning the analysis of seismic noise still have not been sufficiently convincing
From among the range of emphases available for the study of the geothermal resources in the Valley of Mexicali (using passive seismic methods) we have decided on the tectonic emphasis rather than a very fine scale focus on the seismicity in the geothermal field Our knowledge of the tecshytonism of spreading centers in the oceanic crust of the Gulf of California is relatively well developed and permits us to make direct Comparshyisons with the Hexicali Valley which is part of the same physiographic province
The Mexicali Valley as part of the physiographic province of the Gulf of California is characterized by a system of grabens resulting from crustal extension associated with strike-slip motion along the Cerro Prieto and Imperial faults As a consequence it is a region of crustal thinning and high heat flow caused by the intrusshyion of ignious material from the mantle If we assume that the sedimentary cover (5000 to 6000 meters) inhibits vertical hydrothermal circulation (Williams et al 1974 Lister 1976) and that the circulation in this region occurs laterally across the system of transform faults (ImperialshyCerro Prieto) then these faults are likely zones of vertical transport for hydrothermal convection of hot solutions Hence the fault zones are probable places for geothermal reservoirs of major economic importance
PREVIOUS INVESTIGATIONS Three permanent stations were installed by
UNAH and CALTECH in 1969 (Lomnitz et al1970) around the northern part of the Gulf of California to study the seismicity of the Mexicali Valley and the northern part of the Gulf of California Lomnitz et al (1970) reported that the seismic activity was concentrated in the Imperial Cerro Prieto (San Jacinto) Sierra Juarez and San Miguel faults (Figure 1) The tectonic model of the
236
physiographic province around the northern part of the Gulf proposed by these authors consists of a series of six transform faults connected with five spreading centers The spreading centers are characterized by geothermal zones recent volcanshyoes swarms of earthquakes and topographic depressions
The results obtained in a more recent study of data from stations Rio Hardy RHM EGMSFP the CALTECH Southern California array and a temporary array installed during the period 1974 to 1975 are shown in Figure 2 These determinshyations of epicenters were obtained with an average of 5 stations with S arrivals from 2-3 stations
The epicenters in the region southeast of Cerro Prieto clearly show a trend paralleling the Cerro Prieto fault and indicate that this trend of epicenters is associated with the fault The epicenters scatter in the region between the two faults and do not indicate any simple pattern A few events occur outside the region between the two faults Although during the period of time represented by Figure 2 there is no obvious trend of epicenters along the Imperial fault in the time period studied by Lomnitz et al (1970)there was such a trend (there was also a concentration along the Cerro Prieto fault) The data from the CALTECH Bulletin for Periods before 1971 does not show obvious concentrations of activity along either the Imperial fault in Mexico or the Cerro Prieto fault This could be partly due to poor coverage and poor location accuracy during this time period
RECENT RESULTS
Instrumentation High-gain portable stations recording on
smoked paper (Sprengnether Model MEQ 800) with 60 dB of attenuation (with increments of -6 dB per step) were used in conjunction with Ranger SSI seismometers (natural frequency 1 Hz generator constant 93 voltsmetersecond) The unattenuated magnification peaks at about 25 Hz (4 x 10⁶) The frequency response of this system including the amplifier and filters is shown in Figure 3 The power supply for the system is provided with two 12 volt batteries (75 amps) The current drain is about 15 milliamps which permits operation in a continuous mode for five weeks Time control for this system is provided with 60-TL True Time Instruments radios (WWVB) The time code is manually fed into the system at the beginning and end of each record Stability of the internal time control is plusmn 432 x 10-4 secsday The drum recording velocity is 2 millimeterssecond which permits reading of arrival times of impulsive signals with an error of about plusmn 05 seconds
Field Operation The stations were operated in different
places for short periods of time in order to determine a local level of microearthquake activity and the levels of seismic noise On June 20 1977 the permanent array (RESCEP) was install shyed in the area of Cerro Prieto and consisted of three stations with vertical seismometers (QKP SONTAM) and two stations with vertical and horizontal seismometers (CPRTLX) The location of the stations is shown in Figure 1
Geographic coordinates for the stations are listed in Table 1 which also shows the gain
level at which each station has operated since June 20 1977 The level of seismic noise in the valley is quite high during the day decreasing significantly during the night and thus all the stations except ~KP were operated at the minimum gain of 39 x 10 (- 60 dB) giving a noise level on the trace of the seismogram of 5 millimeters peak-to-peak Seismometers were located in conshycrete bases 2 meters deep resulting in a deshycreased noise level of about a factor of 2 with respect to observations on the surface The characteristic frequency of the micro-seismic noise is about 2 Hz This high level of seismic noise is primarily related to the intense agricultural activity in the valley (and possibly to geothermal activity in the case of the Nuevo Leon station) The difference in noise level observed on the valley stations with respect to the station QKP is probably a result of effects of amplification in the low rigidity sediments of the valley
DATA ANALYSIS
The results of this study are based on precise relative locations and composite focal mechanism solutions Most of the better data (larger events) was from swarms of events Swarms occurred in the following localities the region around the Cerro Prieto geothermal camp (September 28 1977) near the exploration well PRIAN (October 15 1977) near the southern extreme of the Imperial fault near Ejido Tlaxcala (January 17 1977) and in the vicinity of Ejido Victoria (March 10 1978) The data base for the study during this period was arrival times of P and S phases and polarities of P waves registered on the stations of the Cerro Prieto seismic array RESCEP (1977-1978) For determination of epishycenters and focal depths events characterized by impulsive arrivals allowing confident readings of the P and S wave arrivals were selected from RESCEP recordings
The average spacing of the stations of RESCEP (Figure 1) is about 20 km This provides good control for the epicentral determinations and focal depths of events located in the interior of the array Data from the swarms of September 28 1977 October 15 1977 January 10 1978 and March 10 1978 were particularly important as data for master events for the relative determinashytions of epicenters to be discussed later The locations of these events are shown in Figure 1 Table 2 gives their hypocentral coordinates and coda magnitudes
In order to achieve the maximum level of precision in the hypocentral determinations the arrival times for the P and S phases were careshyfully read by several different persons using magnifying glasses with the magnification of 6X Data thus obtained were compared to determine the standard errors in the accuracy of the arrival times (plusmn 05 seconds)
The method of relative location used in this study is simple and effective The method has been described by Johnson and Hadley (1976) and is described briefly here The method conshysists of two parts First one or more events (by zone) are selected and designated master events Criteria for selection is primarily the existence of impulsive P and S wave arrival times on all the stations Then it is assumed that the
237
distance residuals in the location are brought about completely by station delays ie by anomshyalies in the velocity structure in the vicinity of the station The remaining events are located using these time delays as station corrections In this way a high level of precision is obtained in the relative locations (equivalent to fixing the relative location vector from the relative times between the event and the master event) The major advantage of this method for relative locations is that it provides a clearer picture of the distribution of seismicity If eventually better knowledge of velocity structure is obtained it will be possible to refine the locations However we believe that the basic conclusions obtained here will not be changed critically
In order to determine the velocity of the S wave from the velocity of the P wave the ratio VpVs was determined using a Wadati diagram as shown in Figure 4 Approximately 80 data points from arrival times of the P and S phases read on the vertical and horizontal components were used Times of the P and S phases are determined relat shyive to earliest P wave arrival times A linear correlation between Sand P times gives a value of VpVs of 167 which is less than the expected value of 173 (for a Poissons ratio of 14th) and is significantly different from the value of 25 reported by Majer and McEvilly (this volume) in a study carried out in the immediate vicinity of the Cerro Prieto geothermal wells using vertical and horizontal seismometers
Hypocentral determinations were obtained utilizing the location program HYPO 1975 (Lee and Lahr 1975) The model of velocities used for the locations has been taken from similar studies in the Imperial Valley The model is shown in Figure 5 The abrupt continuities in this model were smoothed by introducing thin layers with gradual changes in velocity to diminish the destabilizing effects of abrupt layers on the determination of focal mechanisms
DISCUSSION OF RESULTS
Locations Figure 6 shows the distribution of
locateable epicenters for the seismic activity in the Mexicali Valley during the period of obsershyvation January 1977 - May 1978 The general distribution of epicenters during this period of observation is not greatly different from the period shown in Figure 2 suggesting that both sets of determinations are relatively reliable Events as small as M approximately 05 were located but due to the high noise level of the valley and to intermittent problems in the operation of the array the coverage of the seismic activity is not complete
As can be observed in Figure 6 the seismic pattern shows a N-S trend connecting the northwest end of the Cerro Prieto fault with the southeast end of the Imperial fault The seisshymicity shows little activity along the surface traces of the Imperial fault between the station TAM and the International Border (In contrast during 1969 Lomnitz et aZ 1970 found significant activity along this section of the Imperial fault) The concentration of events in the vicinity of Ejido Victoria (close to the station SON) corresshyponds mostly to the Victoria Swarm of March 10-23
1978 which consisted of approximately 500 events The magnitudes of the two largest events were 47 and 50 The distribution of epicenters suggests that the activity of the swarm involved preshydominantly the NW trending Cerro Prieto fault a parallel en-echelon fault and NS connecting faults This interpretation is also suggested by the composite focal mechanisms for these events
A diffuse pattetn of seismic activity is observed east of the Cerro Prieto fault Near the station QKP an aftershock sequence of a May 5 1978 earthquake occurred consisting of about 1500 events of magnitude less than 1 There is also diffuse seismic activity northwest of Cerro Prieto probably associated with the San Jacinto fault zone (although these events occurred outside of the array and their locations are poorly conshy
middotstrained) A special study was made of the aftershy
shocks of the January 17 1977 event of magnitude 42 (CALTECH) at the extreme southeast end of the Imperial fault (near point A in Figure 6) During a period of observation of 48 hours beginning 36 hours after the main event 40 aftershocks were recorded of which it was possible to locate 10 The estimated focal depths varied from 6 to 13 km
Composite Fault Plane Solutions The focal sphere projections of the
polarity of first arrivals for certain groups of events labelled A B C and D in Figure 6 were plotted on equal area projections (upper hemisshyphere) If all the events in the group have the same fault orientation this composite projection will indicate this orientation even though only a few stations are used
The composite fault plane solution for the events in group A (January 17 1977) is shown in Figure 7 It indicates either right lateral motion along a NW trending fault or left lateral motion along a conjugate NE trending fault If the right lateral interpretation is taken then the epicenter locations suggest at least 3 enshyechelon faults parallel to the Cerro Prieto fault On the other hand if the left lateral intershypretation is taken the epicenters could also represent some left lateral conjugate faulting
The composite fault plane solution for the events located in the neighborhood of the explorashytion well PRIAN (group B Figure 6) is poorly constrained but suggests dip-slip motion on a nearly vertical fault The composite fault plane solution for the events in the vicinity of the Cerro Prieto geothermal steam wells (group C Figure 6) indicates that the activity involves predominantly normal faulting with a dip of 600
to the southeast or 30deg to the northwest~ (Figure 8) The former is consistent with the results of structural geology studies carrfed out in the area of production by Puente and de la Pefia (this volume) The composite fault plane polarity data for group D (Figure 9) also suggests normal fault shying although the data are not sufficient to accushyrately constrain the solution The dashed lines indicate the same fault planes as in Figure 8 and is consistent with the data with the exception of one point
The composite fault plane solution for group E (Figure 10 swarm of March 10-231978) is well constrained and indicates right lateral strike-slip along a NW trending fault (azimuth
238
330deg) or a left lateral motion along a NE trending fault The former solution is most likely because it is consistent with the orientation of the Cerro Prieto fault and the trends indicated in the epicentral locations (Figure 6) Some events in this swarm are not represented in the composite solution because their polarities were clearly inconsistent with the soluti~n They may represent dip-slip faulting occurring long with the strikeshyslip faulting
Interpretation The pattern of seismicity and the composite
fault plane solutions described above suggest that the distribution of tectonic deformation (seismic slip) in the Mexicali Valley occurs principally along two tectonic trends 1 faults parallel to and including the Imperial-Cerro Prieto transform fault system 2 a system faults oblique to the Imperial-Cerro Prieto trend with at least some normal faulting
The results of previous studies in the Salton Province and in the Gulf of California (Hill et aZ 1975 Lomnitz et al 1970 Thatcher and Brune 1971 Reichle et al 1976 Weaver and Hill 1978) indicates that the regional tectonic forces induced by the relative motion of the Pacific plate (northwest) with respect to the American plate produces tensional tectonic forces in the Cerro Prieto graben and causes crustal spreading and thinning Local spreading of the crust is required by the geometry of the local offset of the Imperial-Cerro Prieto fault system Our data along with the geological studies (Puente and de la Pena this volume) indishycates that in the interior of the Cerro Prieto grashyben the crust is broken into a series of blocks bounded by planes oriented parallel to the Imperishyal-Cerro Prieto system (as observed at points A and E in Figure 6) and by an oblique set of fractures with some normal faulting indicating tension in a NW-SE direction indicated by the distribution of seismicity in the graben and by the composite focal plane solutions at points B C and D When this system of fracturing is viewed in the light of the model of Hill (1977) it suggests that swarms occur as a result of injection of magmatic fluids Existence of these complex fracture zones in the crust also may explain the high heat flow observed in the Mexicali Valley since the fractures would produce zones of high permeability through which the hot brines could flow
The results of this study have been very encouraging and indicate that with improved coverage and accuracy important aspects of tectonics of the Cerro Prieto steam field will be revealed A six station telemetered digital seismic array designed for this purpose has been installed by CICESE with funding from CFE and CICESE and is now in operation
ACKNOWLEDGEMENTS This work was financed jointly by the
Executive Coordinator of Cerro Prieto (CF~) and CICESE through the Institute of Electrical Research (IIE)
We would like to specially acknowledge the encouragement and support for this study by Eng Hector Alonso (CFE) Eng Guillermo de la Garza (lIE) and Dr Pablo Mulas (lIE)
We have also benefited from discussions about the geology and geophysics of Cerro Prieto with Eng Hector Alonso Eng Antonio Razo and Eng I Puente We are especially thankful to L Garcilazo J Soarez J Hinojoza and JMartfnez for assistance in reading records and field work
The data from the earlier 1971-1975 period was obtained with funds from the National Science Foundation Grant DES74-03l88 and National Aeronautics and Space Administration Grant NASA NGR-05-009-246 Alejandro Nava and Steve Day carried out the field operations during this period and Steve Day assisted in some of the data analysis
We also appreciate the efforts of Neenah Rohner and Rosi Martinez who typed the English and Spanish versions of this paper
TABLE AND FIGURE CAPTIONS
Table 1 Geographic coordinates and gain settings (maximum magnification of 4 x 10⁶) for the stations
Table 2 Dates hypocentra1 coordinates and coda magnitudes of the master events for relative determination of epicenters
Figure 1 Regional map of the Cerro Prieto area The solid dots represent the permanent stations of the Cerro Prieto Seismic Array (RESCEP) The open circles represent temporary stations operated for the January 1977 events and for the March 1978 Victoria swarm The solid triangles represent some of the permanent regional stations
Figure 2 Seismicity of the Cerro Prieto region from 1971-1975 Solid triangles represent local stations operated in 1974-1975
Figure 3 Magnification curve for the seismographs used in this study
Figure 4 Wadati diagram for P and S wave arrival times in the Cerro Prieto region
Figure 5 Velocity model used in this study
Figure 6 Seismicity of the Cerro Prieto region 1977-78 The solid triangles represent permanent stations of the Cerro Prieto Seismic Array (RESCEP)
Figure 7 Composite focal mechanism plot for the aftershocks of the January 17 1977 earthquake Symbols 0 = dilation _ = compression
Figure 8 Composite focal mechanism plot for earthshyquake swarms of September 29 and October 15 1977 Symbols 0 = dilation _ = compression
Figure 9 Composite focal mechanism plot for the events of Group D (see Figure 6) Symbols o = dilation _ = compression
Figure 10 Composite focal mechanism plot for the earthquake swarm of March 10-21 1978 Symbols o = dilation _ = compression

228
(con referencia al area circunvecina) Los resulta dos sobre analisis de rU1do s1smico aun no han sido 10 suficientemente convincentes
De las tendencias existentes para el estudio de los recursos geotermicos en el Valle de Mexicali (utishylizando metodos s1smicos-pasivos) nos hemos decidi do por el enfasis tectonico en lugar de la observa cion con optica muy fina de la sismicidad en el cam po Nuestros conocimientos del tectonismo de cen-shytros de dipersion en la corteza oceanica del Golfo de California estan relativamente bien desarrollados y nos permiten hacer comparaciones directas con el Valle de Mexicali el cual es parte de la misma pr~ vincia fisiografica del Golfo de California
El Valle de Mexicali como parte de la provincia fi siografica del Golfo de California esta caracteri~ zado por un sistema de grabens resultante de la exshytension cortical asociada al movimiento de rumbo de las Fallas Imperial-Cerro Prieto Como consecuencia esta es una region de corteza del gada y alto flujo termico causado por la iustrusion de material 19neo del manto Si suponemos que la cubierta sedimentaria (5000 a 6000 mts) inhibe la ci rculacion hidrotermal (D L tVilliams et al 1974 C Lister 1976) y que la circulacion en esta reshygion ocurre lateralmente a traves del sistema de f~ lIas transformadas (Imperial-Cerro Prieto) entonshyces esas zonas de falla son las mas probables de transporte vertical por conveccion hidrotermal de salmueras calientes En consecuencia las zonas de fallas son los lugares mas probables para encontrar reservorios geotermicos de gran importancia econoshymica
III INVESTIGACIONES PREVIAS
Tres estaciones permanentes fueron instaladas en 1969 por la UNAM y CALTECH (Lomnitz et al 1970) alrededor de la region norte del Golfo de Califorshynia para estudiar la sismicidad del Valle de Mexica Ii y la region Norte del Golfo de California -Lomnitz et al (1970) reportaron que la actividad s1smica estuvo concentrada en las Fallas Imperial Cerro Prieto (San Jacinto) Sierra Juarez y San Mi
(figura 1) El modelo tectonico de la provi~ cia fisiografica alrededor de la parte Norte del Golfo de California propuesto por dichos autores consiste de una serie de seis fallas transformadas conectadas con cinco centros de dispersion de corshyteza oceanica Los centr~s de estan ca racterizados por zonas geotermicas volcanes recian tes enjambres de temblores y depresiones topografI cas submarinas
Los resultados obtenidos en un estudio mas reciente de los datos de las estaciones RHM EGM SFP la red de CALTECH del Sur de California y de una red temporal instalada durante el per10do 1974-1975 se muestran en la figura 2 Estas determinaciones de epicentros se llevaron a cabo con un promedio de aproximadamente 5 estaciones con arribos identifica bles de ondas S en 2-3 de elIas
Los epicentros en la region sureste de Cerro Prieto muestran claramente una tendencia paralela a la Fashylla Cerro Prieto e indican que dicha tendencia de epicentros esta asociada con la falla En la region comprendida entre las dos fallas los epicentros se dispersan y no sugieren un patron simple Pocos
Palamar
lt~ 0o~
Glamis
PLT
XSL 794~9404
Figura 1 Mapa regional del area de Cerro Prieto Los puntos solidos representan la Red Sismologica de estaciones permanentes de Cerro Prieto (RESCEP) Los crculos abiertos representan estaciones temporales que operaron para los eventos de Enero 1977 y para el enjambre Victoria de Marzo 1978 Los triangulos solidos representan algunas de las estaciones permanentes de la region
eventos ocurren fuera de la region entre las dos lIas Aun cuando durante el per10do de tiempo reshypresentado por la figura 2 no existe una tendencia de epicentros a 10 largo de la Falla Imperial ~n
el per10do de tiempo estudiado por Lomnitz et al (1970) existio dicha tendenda (existio aClemas una concentracion a 10 largo de la Falla Cerro Prieto) Los datos del Bolet1n Sismologico de CALTECH previos a 1971 no muestran concentraciones obvias de dad a 10 largo de la Falla Imperial en Mexico 0 de la Falla Cerro Prieto Esto podrfa deberse a la po bre cobertura y pobre precision de localizacion du~ rante este per10do de tiempo
IV RESULTADOS RECIENTES
Instrumentacion- Estaciones portatiles de alta gashynancia con en papel ahumado (Sprengnether ModMEQ-800) con 60 db de atenuacion (incrementos de -6 dbpasos) fueron utilizadas en conjunto con sismometros RANGER-SS1 (frecuencia natural de 1 Hz y constante de motor G~93 voltsmtseg) La cacion sin atenugcion tiene su maximo alrededor de los 25Hz (4 x 10 ) La respuesta a frecuencias del sistema inclu1dos el amplificador y filtros se mues tra en la figura 3 El suministro de energfa elec~ trica del sistema se provee con dos baterias de 12 volts (75 amps) El consumo de corriente es de 15 mamp 10 cual permite operar en modo continuo por cinco semanas El sistema de control de tiempo (WWVB) se provee con radios Modelo 60-TL de True Time Instruments El codigo de tiempo se alimenta manualmente al sistema al iniciar y finalizar el re
0
w w U1
~CCP0 rg
00 ~
0 ~ 0 0 ~ (]
08J 0
VOLCAN bull C PRIETO PRIANOOO
()l eCPR
(J1_ ~
0 0
0 0
00 1( (I
0 ~1l 0
10 000 GUA Oamp
0 0 ()l 0
0~ 00(J1_
0
[NORTE
115deg25 115deg 15
XBL 794-9400
Figura 2 Sismicidad de la region de Cerro Prieto de 1971-1975 Los triangulos solidos representan estaciones locales operadas en 1974 - 1975
gistro La estabi~dad del control interne de pos es + 432 x 10 segdia La velocidad de reshygistro del tambor es 2 mmseg 10 cual permite leer los tiempos de arribo de senales impulsivas con un error de aproximadamente plusmn 005 segs
Operacion de Campo- Las estaciones fueron opera-middot das en diferentes lugares por periodos cortos de tiempo con el objeto de determinar el nivel de acti vidad local de microtemblores y niveles de ruido shysrsmico En junio 2077 se instalo la red permanen te (RESCEP) en el area de Cerro Prieto que consta de tres estaciones con sismometros verticales (QKP SON TAM) y dos estaciones con sismometros verticashyles y horizontales (CPR TLX) La localizacion de las estaciones se muestra en la Figura 1
Las coordenadas geograficas se listan en la Tabla l en la cual tambien se incluye el nivel de ganancia al que ha operado cada estacion desde junio 2077 El nivel de rurdo sismico en el valle es considerashyblemente alto durante el dia decreciendo signifishycantemente durante la noche por 10 cual todas excepto QKP han operado al minimo nivel de ganancia
3de 39 x 10 (-60 db) dando un nivel de ruido en la traza del sismograma de 05 mm pico a pico Los sismometros se encuentran instalados en bases de concreto a 2 mts de profundidad observandose
229
106
105 Z 0 I shylaquo U IJ
Z lt)
4~ 10
103
01 10 FREQUENCY
XBL 794-9401
Figura 3 Curva de amplificacion para los sismografos utilizados en este estudio
TABLA 1 Coordenadas geograficas y nivel de ganancia (ganancia~axima igual a 4 x 10⁶) de las estaciones
ESTACION lATITUD lONGITUD GANANCIA
EPUmiddot 32middot 14 60 115deg 04 80 60 db
EIRmiddot 32deg 3655 II 5middot 0775 60 db
RSOmiddot 32deg 3190 115 0 0095 60 db
CPRmiddot+ 32deg 2520 115deg 18 10 60 db
QKPt 32deg 1830 115middot 1992 90 db
TlX + 32middot 1832 115middot 0871 60 db
NVl + 32deg 2391 115deg 1266 60 db
TOM + 320 3462 1150 1433 60 db
SON + 32deg 1750 115deg 0983 60 db
ClS bullbull 32deg 1946 1150 0675
OlA bullbull i 32middot 2003 115deg 0957
VIC bullbull 32deg 1856 1150 0604
i VEN bullbull 32deg 1465 115 0 0750
CVC bullbull 32middot 1216 115deg 0873
ESTACIONES UTILIZADAS DURANTE ENERO 1977 ESTACIONES UTlLlZADAS DURANTE MARZO 1918 ( dlgltale) REO DE ESTACIONES PERMANENTES+ XBL 794-9409
100
230
un amortiguamiento de al menos un factor de dos en el nivel de rUido con respecto a las observaciones en la superficie La frecuencia caracteristica del rUldo sismico esta principalmente relacionado a la intensa actividad agricola del valle (y posiblemenshyte a la actividad geotermal en la vecindad de la e~ tacion Nuevo Leon) La diferencia en rUldo slsmico observado en las estaciones localizadas en el valle con respecto a la estacion QKP es muy probablemente originada por efectos de amplificacion en los sedishymentos de baja del valle
V ANALISIS DE DATOS
Los resultados de este estudio estan basados en 10shycalizaciones relativas precisas y mecanismos focashyles compuestos del primer movimiento Los mejores datos (eventos grandes) provinieron de enjambres de eventos Los enjambres ocurrieron en las siguientes localidades Vecindad del Campo Geotermico de Cerro Prieto (Septiembre 28 77) en la vecindad del pozo exploratorio PRIAN (Octubre 15 77) sur de la Falla Imperial cerca del Ejido Tlaxcala (Enero 17 77) Y en la vecindad del Ejido Victoria (Marzo 10 78) La base de datos para el estudio de la sismishycidad durante este perlodo fueron tiempos de arribos de fases P y S Y polaridades de las ondas P regisshytradas por las estaciones de la red sismografica de Cerro Prieto RESCEP 1977-197R En las determinaciones de epicentros y profundidades focales se selecciQnaron eventos registrados por RESCEP que estan caracterizadQs por arribos vos permit iendo lecturas confiables de los arribos P y S
En promedio el espaciamiento de las estaciones de RESCEP (figura 1) es aproximadamente 20 KID esto provee buen control en las determinaciones epicenshytrales y profundidades focales para eventos zados en el interior de la red Los datos de los enjambres de Septiembre 28 77 Octubre 15 77 Enero 2078 y Marzo 1078 fueron particularmente importa~ tes como eventos maestros para las determinacioshynes relativas de epicentros que se discuten posteshyriormente La localizacion de esos eventos se mues tran en la Figura 1 La Tabla 2 da sus coordena-shydas hipocentrales y magnitud coda
Para alcanzar el maximo nivel de precision en las determinaciones hipocentrales los tiempos del prishymer arribo de las fases P y S fueron leldos por va rios lectores utilizando lentes con una magnifica-shycion de 6X Las lecturas aSl obtenidas fueron comshyparadas para determinar los errores estandar en la precision de tiempos de arribos (plusmn 005 seg)
El metodo de localizacion relativa utilizada en es te estudio es simple y efectiva El metodo ha sido descrito por Johnson y Hadley (1976) y se describe brevemente a continuacion El metodo consiste de dos partes Primeramente uno 0 varios eventos por zonas son seleccionados y designados eventos maesshytros El criterio de seleccion es principalmente la disponibilidad de arribos impulsivos py S en to das las estaciones En seguida se supone que los shyresiduales tiempo-distancia en la localizacion son ocasionados completamente pbr retrasos de estacion esto es por anomallas en la estructura de velocida des en la vecindad de la estacion Los eventos res tantes son localizados utilizando esos retardos deshytiempo como correcciones de estacion De esta for-
TABLA 2 Fechas coordenadas hipocentrales y magnishytudes coda de los eventos maestros para la detershyminacion relativa de epicentros
FE CH A LATITUD LONGI TUD DE P T H MAG
770928 32middot 2372 115deg 1315 935 17
770928 32middot 2417 115deg 1366 II A6 23
770928 32deg 2437 115deg 12A3 608 28
770928 32middot 2379 115deg 1333 905 28
771015 32deg 2401 115deg 1171 933 7710 15 32deg 2380 115deg II 37 7 12 771015 32middot 2402 115deg 1123 10 04 7712 20 32deg 3790 115deg 1956 6 64 19
7712 II 32deg 3692 115deg 2448 603 18
771211 32 3652 115deg 2378 667 20
7801 20 32deg 2710 115middot I L 18 1498 10
7801110 32deg 2692 115deg 1073 1486 I I
780318 32deg 1624 115 0 0561 1081 49
780318 32deg 1516 115 0 0614 I 189 23
780319 32deg 1611 115middot 0780 974 25
bull
OltMlt10 XBL 794-9408
rea se logra un alto nivel de precision en las locashylizaciones relativas (equivalente a fijar un vector de localizacion relativa a los tiempos relativos en tre un evento y el evento maestro) El mayor logr de este metodo de localizaciones relativas es el de proveer una imagen mas clara de la distribucion de la sismicidad Con la eventual adquisicion de cono cimiento sobre la estructura de velocidades sera sible obtener un mayor refinamiento en las naciones Pero creemos que las conclusiones basi- cas no se cambiaran criticamente
Para fijar la velocidad de la onda S a partir de la velocidad de la onda P la razon VpVs fue determishynada del diagrama de Wadati que se muestra en la gura 4 Aproximadamente 80 datos de primeros bos de las fases P y S leldos en los registros vershyticales y horizontales fueron utilizados Los tiem pos de las fases P y S se determinaron con referenshycia a la estacion con arribo P mas temprano La co rrelacion lineal entre S y P dan un valor para VpVs de 167 menor que el valor esperado de 173 (para una razon de Poisson de 025) y significanteshymente diferente del valor de 25 reportado por Majer y McEvilly (1979 este volumen) en un estushydio realizado en la vecindad inmediata de los pozos de Cerro Prieto utilizando sismornetros verticales y horizontales
Las determinaciones hipocentrales se obtuvieron uti lizando el programa de localizacion HYPO-75 (Lee y Lahr 1975) El modele de velocidades utilizado pa ra la localizacion se tomo de estudios similares en en el Valle Imperial El modele se muestra en la figura 5 Las discontinuidades abruptas en este mo dele fueron alisadas por la introduccion de capas delgadas con cambios graduales en velocidad para disminuir los efectos desestabilizadores de capas abruptas sobre las determinaciones de mecanismos fo cales
231
bull bullbullbull bull bull
bull
(f)
ltJ lIE (fIT5 DE REO
fERI1FINENTE
o ~ EVENJDS DE SEPTIEtmtE 19n
o ENJAl18RE OE MMZO OE HI7S
eCIACIlII RECTR RJUSTF(JRl I 16726--013597
~~~~----~-----------------~--------~
D P ( SEC)
XBL 794-9403
Figura 4 Diagrama Wadati para los tiempos de arribo de las ondas P y S en la region de Cerro Prieto
VI DISCUSION DE LOS RESULTADOS
Localizaciones- La Figura 6 muestra la distribushycion de epicentros localizables de la actividad ss mica en el Valle de Mexicali durante el perodo deshyobservacion Enero 1977 - Mayo 1978 La distribushycion general de epicentros determinados durante esshyte perodo de observacion no es muy diferente del perodo mostrado en la figura 2 sugiriendo que ambas determinaciones son relativamente confiables Eventos tan pequenos como M (magnitud) aproximadashymente 05 fueron localizados pero debido al alto nivel de rufdo sfsmico observado en el valle y a problemas intermitentes en la operacion de la red la cobertura de la actividad sfsmica no es completa
Como se puede observar en la figura 6 el patron sfsmico muestra una tendencia N-S conectando el ex tremo noroeste de la Falla Cerro Prieto con el ex~ tremo sureste de la Falla Imperial La sismicidad muestra escasa actividad sfsmica a 10 largo del tra zo superficial de la Falla Imperial comprendido en~ tre la estacion TAM y la frontera Internacional (en contraste durante 1969 Lomnitz et al 1970
VELOCITY (Km I sec) a
a
4
6
7
e
E 9
_ 10 x ~
Cl
UJ
Cl
15
VELOCITY (Kmec)
170 196 27376 469 6AO 7 10
20 600
XBL 794-9402
Figura 5 Modelo de velocidad utilizado en este estudio
encontraron actividad significante en esta seccion de la Falla Imperial) La concentracien de eventos en la vecindad del Ejido Victoria (cercana a la esshytacion SON) corresponde en su mayor parte al Enjam bre Victoria de Marzo 10-2378 el cual consistio en aproximadamente 500 eventos Las magnit~des de los eventos mas grandes fueron 47 y 50 La distribushycion de epicentros sugiere que la actividad del enshyjambre involucre predominantemente la tendencia noroeste de la Falla Cerro Prieto y una falla para lela en-echelon y fallas conectantes NS Esta in terpretacion tambien la sugiere el mecanismo focal compuesto de esos eventos
Un patron difuso de actividad ssmica se observa al oeste de la Falla Cerro Prieto Cerca de la estashyci6n QKP ocurri6 una serie de replicas de un temshyblor del 5 de Mayo de 1978 con aproximadamente 1500 eventos de magnitud menor a 1 Existe tambien actividad sismica difusa al noroeste de Cerro Prieto probablemente asociada a la zona de fal1a San Jacinto (aun cuando estos eventos ocurren en el exterior de RESCEP y su loca1izaci6n esta pobreshymente constrenida)
232
w w U1
0 0
0 0 0 0 8
VOLCAN C PRIETOOJ
ltl R 0
0 0
0
0 OKP~
03 OJ
ltl ji shy
0
0
115 0 15
XBL 794-9399
Figura 6 Sismicidad de la region de Cerro Prieto 1977-1978 Los triangulos solidos representan estaciones permanentes de la Red Sismologica de Cerro Prieto (RESCEP)
Un estudio especial se realizo de las replicas de un evento de magnitud 42 (CALTECH) que se locali shyzo en el extremo sur de la Falla Imperial (Punto A) el 17 de Enero de 1977 burante un periodo de observacion de 48 horas iniciadas 36 horas despues del evento principal se registraron 40 eventos de los cuales fue posible localizar 10 Las profundi dades focales estimadas varian de 6 a 13 Km -
Soluciones Compuestas del Plano de Falla- La esshyfera focal de las proyecciones de la polaridad del primer arribo para un determinado grupo de eventos rotulados A B C y D en la figura 6 fueron cados en una proyeccion de igual area (hemisferio superior) Si todos los eventos del mismo grupo tienen la misma orientaci6n de falla esta proyecshycion compuesta indicara dicha orientacion aun cuan do pocas estaciones hayan sido utilizadas
La solucion compuesta del plano de falla para los eventos del grupo A (Enero 17 1977) se muestra en la figura 7 Este indica ya sea movimiento lateshyral derecho a 10 largo de una falla con una tendenshycia noroeste 0 un movimiento lateral izquierdo con una tendencia noreste a 10 largo de una falla conju gada Si la interpretacion del movimiento lateralshyderecho es seleccionado entonces la localizacion de los epicentros sugiere al menos tres fallas enshyechelon paralelas a la Falla de Cerro Prieto De otra forma si la interpretacion del movimiento la-
o
o o 0
00 8 ~ 0
o
XBL 794-9410
Figura 7 Grafica del mecanismo focal compuesto para los eventos del temblor de Enero 17 1977 Smbolos 0 dilatacion compresion
teral izquierdo es seleccionada los epicentros tam bien podrian representar fallamiento lateral izshyquierdo conjugado
Para los eventos localizados en la vecindad del poshyzo exploratorio PRIAN (Grupo B figura 6) el mecanis mo focal esta pobremente constrenido pero sugiere shymovimiento sobre una falla vertical En comparashycion el mecanismo focal compuesto de eventos en la vecindad de los pozos de produccion de la planta geotermica de Cerro Prieto (Grupo C figura 8) can que la actividad sismica involucra predominante mente fallamiento normal con un echado de 30 grados hacia el sureste 0 60 grados al noroeste la primeshyra es consistente con los resultados de estudios geologicos esctructurales realizados en el area de la zona de producci6n por Puente y de la Pena (1979 este volumen) Los datos de 1a polaridad del plano de falla compuesto del Grupo D figura 9 tambien sugiere un fallamiento normal sin embargo los datos no son suficientes para precisar la soluci6n La lInea punteada indica el mismo plano de falla como en la figura 8 y es consisshytente con los datos con 1a excepcion de un punto
La solucion compuesta del plano de fa1la para el Grupo E figura 10 (enjambre de Marzo 10-23 1978) esta bien constrenida e indica un rumbo lateral derecho con una tendencia de falla noroeste (azimut 330 grados) o movimiento lateral izquierdo con una tendencia de falla noreste La solucion anterior es la mas proshybable porque es consistente con 1a orientacion de 1a falla de Cerro Prieto y 1a tendencia indicada
233
bullbull bull
XBl 794-9407
Figura 8 Grafica del mecanismo focal compuesto para los eventos del Enjambre de Septiembre 29 y Octubre 15 1977 Sfmbolos 0 dilatacion _ = compresion
bullbull
I
I I I
I I
I
bull
I
1
I I
I
~ 2=40middot bull
600
Y
I I
bull I I
I
I 1300
o 00 1-
XBl 794-9406
Figura 9 Grafica del mecanisme focal compuesto para los eventos del Grupo D (ver figura 6) Spoundmbolos 0 = dilatacion _ = compresion
bullshy) o
XBL 794- 9405
Figura 10 Grafica del mecanisme focal compuesto para los eventos del Enjambre 10-21 1978 Sfmbolos 0 dilatacion _ = compresion
por las localizaciones epicentrales figura 6 Alg nos de los eventos de este enjambre no estan represhysentados en la solucion compuesta porque sus polashyridadps fueron claramente inconsistentes con la ROshy
lucion Estas podrlan representar fallamiento om deslizamiento de echado simultaneanlente con fallashymiento con deslizamiento de rumbo
Interpretacion- El patron de sismicidad y el meca nismo focal compuesto del plano de falla descrito shyanteriormente que la distribucion de la deshyformacion (deslizamiento slsmico) en el Valle de Mexicali ocurre principalmente a Jo largo de dos tendencias tectoricas i) Fallas paralelas incluyendo el sistema de fallas transformadas Impeshyrial-Cerro Prieto ii) Un sistema de fallas obli shycuas a la tendencia Imperial-Cerro Prieto involucran do al menos fallamiento normal
Los resultados de estudios previos en la provincia del Salton Sea y en el Golfo de California (Hill et al 1975 Lomnitz et al 1970 Reichle 1976 Thatcher y Brune 1971) nos indican que las fuerzas tectonicas regionales inducidas por el movimiento relativo de la placa del Paclfico (Nor-Oeste) con respecto a la placa Americana produce fuerzas tecshytonicas tensionales en el graben de Cerro Prieto ocasionando cortical con el consecuente adelgazamiento de la corteza Dispersion local de la corteza es requerido por la geometrla de la esshytribacion local (off-set) del sistema de fallas Imshyperial-Cerro Prieto Nuestros datos en conjunto con estudios geo16gicos (Puente y de la Pena 1979 este volumen) indican que en el interior del graben de Cerro Prieto la corteza se rompe en una serie de blocks delimitados por pIanos orientados paralelashymente al sistema Imperial-Cerro Prieto (como se
234
observa en los puntos AyE de la figura 6) y por un conjunto oblicuo de fracturas con una componenshyte de fallamiento normal indicando tensi6n en una direcci6n noroeste-sureste como 10 indica 1a disshytribuci6n de 1a sismicidad en el graben y los meshycanismos focales compuestos (Puntos B y C) Cuando este sistema de fracturamiento se observa en la 1uz del mode10 de Hill (1977) se sugiere que los enjamshybres ocurren como resu1tado de la inyecciJu de fluidos magmaticos La existencia de estas zonas de fracturamiento complejo en la corteza podrian tambien explicar e1 alto flujo termico observado en en el Valle de Mexicali puesto que las fracturas producen zonas de alta permeabilidad a traves de los cuales 1a salmuera caliente puede fluir
Los resultados de este estudio han sido muy estimushylantes y nos indican que con una mayor cobertura y precision aspectos importantes del tectonismo del campo geotermico de Cerro Prieto seran reve1ashydos Un arreglo de seis estaciones con te1emetria digital disenada para este proposito ha sido lada por CICESE con fondos de la CFE y CICESE 1a red se encuentra en operacion actualmente
VII AGRADECIMIENTOS
~ste estudio fue financiado en conjunto por la COO dinadora Ejecutiva de Ceero Prieto (CFE) y e1 Censhytro de Investigacion Cientifica y de Educacion Sushyperior de Ensenada (CICESE) a traves del Instituto de Investigaciones Electricas (lIE) La informacion del primer periodo fue obtenida con fondos de la NSF y NASA Durante este periodo los trabajos de campo fueron realizados por Alejandro Nava y Steve Day
Queremos agradecer especia1mente al Ing Hector Alonso (CFE) Ing Guillermo de 1a Garza (lIE) y a1 Dr Pablo Mu1as (lIE) por e1 apoyo y estimu10 brindado para este estudio
Nos hemos beneficiado con las discusiones sobre la geologia y geofisica de Cerro Prieto del Ing Hector Alonso Ing Antonio Razo y el Ing Puente
Estamos especialmente agradecidos con Jouracy Soarez Alejandro Hinojosa L Inzunza y Javier Martinez por su asistencia en la lectura de sismoshygramas y a F Jaime por su participacion en 1a coshyleccion diaria de sismogramas Ademas apreciamos e1 esfuerzo de N Rohner y Rosi Martinez por mecashynografiar y traducir la version Espanol-Ingles de este articulo
VIII BIBLIOGRAFIA
Combs J Y Rothstein Y 1976 Microearthquake studies at the Coso geothermal area China
Lake California in Proc Second UN Symp on Development and Use of Geothermal Reshysources May 1975 San Francisco Washington DC US Government Printing Office v 2 p 909
Hamilton RI Y Muffler LJP 1972 Microshyearthquakes at The Geysers geothermal area California J Geophys Res v 77 p 2081
Hill DP 1977 A model for earthquake swarms J Geophys Res v 82 p 1347
Hill DP Mowincke1 P y Peake LG 1975 Earthquakes active faults and geothermal areas in the Imperial Valley California Science v 188 p 1306
Johnson CE y Hadley DM 1976 Tectonic implications of the Brawley earthquake swarm Imperial Valley California Bull Seism Soc Am v 66 pp 1133-1144
Lange AL y Westphal WH 1969 Microearthshyquakes near The Geysers Sonoma County Cali shyfornia J Geophys Res v 74 p 4377
Lee WHK y Lahr JC 1975 HYPO-7l (Reshyvised) A computer program for determining hypocenter magnitude and first motion patshytern of local earthquakes US Geological Survey Open-File Report p 113
Lister CRB 1976 Qualitative theory on the deep end of geothermal systems in Froc Second UN Symp on Development and Use of Geothermal Resources May 1975 San Francisshyco Washington DC US Government Printshying Office v 2 p 459
Lomnitz C Mooser F Allen CR Brune JN y Thatcher W 1970 Sismicidad y tectonica del Golfo de California resultados prelimishynares Geoflsica Internacional v 10 no 2 p 37 48
Majer EL Y UcEvilly TV 1979 Seismologshyical investigations at The Geysers geothermal field Geophysics v 44 no 2 p 246
Reichle MS Sharman G y Brune JN 1976 Sonobuoy and teleseismic study of Gulf of California transform fault earthquake seshyquences Bull Seism Soc Amer v 66 p 1623
Thatcher W y Brune JN 1971 Seismic study on an oceanic ridge earthquake swarm in the Gulf of California Geophys JR astr Soc v 22 p 1446
Weaver CS y Hill DP 1978 Earthquake swarms and local spreading along major strike-slip faults in California Basel Birkhauser Verlag p 117
Williams DL Von Hersen RP Sclater JG Y Anderson RN 1974 The Galapagos spreading center lithospheric cooling and hydrothermal circulation Geophys JR ast Soc v 38 p 587
235
SEISMICITY STUDIES IN THE REGION OF THE CERRO PRIETO GEOTHERMAL FIELD
ABSTRACT We report results from seismicity studies
in the region of the Cerro Prieto Geothermal Field These studies were conducted with local short period seismic arrays during 1974-75 and 1977-78 During the latter period horizontal seismometers were used for better control on the S-wave arrival times Locations were obtained for about 200 events and composite fault plane solutions were obtained for five groups of events The seismic activity is characterized primarily by swarms of relatively small events although one swarm had events with magnitudes as high as 50
The epicenters indicate a broad distribushytion connecting the Cerro Prieto and Imperial faults Within this distribution there are indications of trends both parallel to and oblique to the Cerro Prieto-Imperial transform fault system The composite fault plane solutions indicate right lateral strike-slip faulting along NW-SE trending faults and dip-slip faulting along at least some of the oblique faults
The results are consistent with the model proposed by Hill (1977) and suggest that swarms occur as a result of injection of magmatic fluids along fault zones Thus understanding the nature of faulting and tectonic processes is very important in evaluating the potential for geothermal energy in a region
INTRODUCTION Geothermal areas are usually located in
regions of active tectonism and as a consequence it is not surprising that in the majority of them the seismic activity is high In particular the study of seismic activity of the Mexicali Valley is very important for our understanding of the tectonism of the region and due to the economic potential represented by the valleys geothermal resources it is important to charactshyerize the Cerro Prieto geothermal field within the regional tectonic pattern of the Valley of Mexicali Consequently we will be able to refine our concepts for identifying similar areas with potential geothermal resources
In the present study we report the results of seismic studies initiated in the Valley of Mexicali using portable stations and beginning m July 1977 permanent stations located in the region of the Cerro Prieto geothermal field This is the first study carried out in this region using both horizontal and vertical seismographs to improve the determination of focal depth
The study was proposed to the CFE Execshyutive Coordinator of Cerro Prieto through the Institute of Electrical Research and financed jointly by CFE and CICESE The results obtained to date have provided us with the basic data for future elaboration of the tectonic structural model of the active parts of the Imperial-Cerro Prieto fault system This data base has not been available earlier due principally to the lack of seismological stations in the valley
Study of the occurrence and locations of microearthquakes has been proposed by different authors (Combs and Rothstein 1976 Hamilton and Muffler 1972 Hill et al 1975 Lange and Westpahl 1969 Majer and McEvilly 1979) as an exploratory tool for geothermal resources The principal concept is the following The seismic activity occurs along faults and these are highly fractured zones that provide permeability sufficient for the extraction of heat In this model the transport of heat is brought about by the convection of fluids (hot brines)
Other seismic passive methods have been proposed as tools for exploration analysis of the attenuation of body waves regional variation in the ratio VpVs and analysis of seismic noise The first two have been evaluated by Majer and 1cEvilly (1979) as promising because results now exist for typical fields in which anomalous values of Q and VpVs are observed in the zones of proshyduction (relative to the surrounding areas) Results concerning the analysis of seismic noise still have not been sufficiently convincing
From among the range of emphases available for the study of the geothermal resources in the Valley of Mexicali (using passive seismic methods) we have decided on the tectonic emphasis rather than a very fine scale focus on the seismicity in the geothermal field Our knowledge of the tecshytonism of spreading centers in the oceanic crust of the Gulf of California is relatively well developed and permits us to make direct Comparshyisons with the Hexicali Valley which is part of the same physiographic province
The Mexicali Valley as part of the physiographic province of the Gulf of California is characterized by a system of grabens resulting from crustal extension associated with strike-slip motion along the Cerro Prieto and Imperial faults As a consequence it is a region of crustal thinning and high heat flow caused by the intrusshyion of ignious material from the mantle If we assume that the sedimentary cover (5000 to 6000 meters) inhibits vertical hydrothermal circulation (Williams et al 1974 Lister 1976) and that the circulation in this region occurs laterally across the system of transform faults (ImperialshyCerro Prieto) then these faults are likely zones of vertical transport for hydrothermal convection of hot solutions Hence the fault zones are probable places for geothermal reservoirs of major economic importance
PREVIOUS INVESTIGATIONS Three permanent stations were installed by
UNAH and CALTECH in 1969 (Lomnitz et al1970) around the northern part of the Gulf of California to study the seismicity of the Mexicali Valley and the northern part of the Gulf of California Lomnitz et al (1970) reported that the seismic activity was concentrated in the Imperial Cerro Prieto (San Jacinto) Sierra Juarez and San Miguel faults (Figure 1) The tectonic model of the
236
physiographic province around the northern part of the Gulf proposed by these authors consists of a series of six transform faults connected with five spreading centers The spreading centers are characterized by geothermal zones recent volcanshyoes swarms of earthquakes and topographic depressions
The results obtained in a more recent study of data from stations Rio Hardy RHM EGMSFP the CALTECH Southern California array and a temporary array installed during the period 1974 to 1975 are shown in Figure 2 These determinshyations of epicenters were obtained with an average of 5 stations with S arrivals from 2-3 stations
The epicenters in the region southeast of Cerro Prieto clearly show a trend paralleling the Cerro Prieto fault and indicate that this trend of epicenters is associated with the fault The epicenters scatter in the region between the two faults and do not indicate any simple pattern A few events occur outside the region between the two faults Although during the period of time represented by Figure 2 there is no obvious trend of epicenters along the Imperial fault in the time period studied by Lomnitz et al (1970)there was such a trend (there was also a concentration along the Cerro Prieto fault) The data from the CALTECH Bulletin for Periods before 1971 does not show obvious concentrations of activity along either the Imperial fault in Mexico or the Cerro Prieto fault This could be partly due to poor coverage and poor location accuracy during this time period
RECENT RESULTS
Instrumentation High-gain portable stations recording on
smoked paper (Sprengnether Model MEQ 800) with 60 dB of attenuation (with increments of -6 dB per step) were used in conjunction with Ranger SSI seismometers (natural frequency 1 Hz generator constant 93 voltsmetersecond) The unattenuated magnification peaks at about 25 Hz (4 x 10⁶) The frequency response of this system including the amplifier and filters is shown in Figure 3 The power supply for the system is provided with two 12 volt batteries (75 amps) The current drain is about 15 milliamps which permits operation in a continuous mode for five weeks Time control for this system is provided with 60-TL True Time Instruments radios (WWVB) The time code is manually fed into the system at the beginning and end of each record Stability of the internal time control is plusmn 432 x 10-4 secsday The drum recording velocity is 2 millimeterssecond which permits reading of arrival times of impulsive signals with an error of about plusmn 05 seconds
Field Operation The stations were operated in different
places for short periods of time in order to determine a local level of microearthquake activity and the levels of seismic noise On June 20 1977 the permanent array (RESCEP) was install shyed in the area of Cerro Prieto and consisted of three stations with vertical seismometers (QKP SONTAM) and two stations with vertical and horizontal seismometers (CPRTLX) The location of the stations is shown in Figure 1
Geographic coordinates for the stations are listed in Table 1 which also shows the gain
level at which each station has operated since June 20 1977 The level of seismic noise in the valley is quite high during the day decreasing significantly during the night and thus all the stations except ~KP were operated at the minimum gain of 39 x 10 (- 60 dB) giving a noise level on the trace of the seismogram of 5 millimeters peak-to-peak Seismometers were located in conshycrete bases 2 meters deep resulting in a deshycreased noise level of about a factor of 2 with respect to observations on the surface The characteristic frequency of the micro-seismic noise is about 2 Hz This high level of seismic noise is primarily related to the intense agricultural activity in the valley (and possibly to geothermal activity in the case of the Nuevo Leon station) The difference in noise level observed on the valley stations with respect to the station QKP is probably a result of effects of amplification in the low rigidity sediments of the valley
DATA ANALYSIS
The results of this study are based on precise relative locations and composite focal mechanism solutions Most of the better data (larger events) was from swarms of events Swarms occurred in the following localities the region around the Cerro Prieto geothermal camp (September 28 1977) near the exploration well PRIAN (October 15 1977) near the southern extreme of the Imperial fault near Ejido Tlaxcala (January 17 1977) and in the vicinity of Ejido Victoria (March 10 1978) The data base for the study during this period was arrival times of P and S phases and polarities of P waves registered on the stations of the Cerro Prieto seismic array RESCEP (1977-1978) For determination of epishycenters and focal depths events characterized by impulsive arrivals allowing confident readings of the P and S wave arrivals were selected from RESCEP recordings
The average spacing of the stations of RESCEP (Figure 1) is about 20 km This provides good control for the epicentral determinations and focal depths of events located in the interior of the array Data from the swarms of September 28 1977 October 15 1977 January 10 1978 and March 10 1978 were particularly important as data for master events for the relative determinashytions of epicenters to be discussed later The locations of these events are shown in Figure 1 Table 2 gives their hypocentral coordinates and coda magnitudes
In order to achieve the maximum level of precision in the hypocentral determinations the arrival times for the P and S phases were careshyfully read by several different persons using magnifying glasses with the magnification of 6X Data thus obtained were compared to determine the standard errors in the accuracy of the arrival times (plusmn 05 seconds)
The method of relative location used in this study is simple and effective The method has been described by Johnson and Hadley (1976) and is described briefly here The method conshysists of two parts First one or more events (by zone) are selected and designated master events Criteria for selection is primarily the existence of impulsive P and S wave arrival times on all the stations Then it is assumed that the
237
distance residuals in the location are brought about completely by station delays ie by anomshyalies in the velocity structure in the vicinity of the station The remaining events are located using these time delays as station corrections In this way a high level of precision is obtained in the relative locations (equivalent to fixing the relative location vector from the relative times between the event and the master event) The major advantage of this method for relative locations is that it provides a clearer picture of the distribution of seismicity If eventually better knowledge of velocity structure is obtained it will be possible to refine the locations However we believe that the basic conclusions obtained here will not be changed critically
In order to determine the velocity of the S wave from the velocity of the P wave the ratio VpVs was determined using a Wadati diagram as shown in Figure 4 Approximately 80 data points from arrival times of the P and S phases read on the vertical and horizontal components were used Times of the P and S phases are determined relat shyive to earliest P wave arrival times A linear correlation between Sand P times gives a value of VpVs of 167 which is less than the expected value of 173 (for a Poissons ratio of 14th) and is significantly different from the value of 25 reported by Majer and McEvilly (this volume) in a study carried out in the immediate vicinity of the Cerro Prieto geothermal wells using vertical and horizontal seismometers
Hypocentral determinations were obtained utilizing the location program HYPO 1975 (Lee and Lahr 1975) The model of velocities used for the locations has been taken from similar studies in the Imperial Valley The model is shown in Figure 5 The abrupt continuities in this model were smoothed by introducing thin layers with gradual changes in velocity to diminish the destabilizing effects of abrupt layers on the determination of focal mechanisms
DISCUSSION OF RESULTS
Locations Figure 6 shows the distribution of
locateable epicenters for the seismic activity in the Mexicali Valley during the period of obsershyvation January 1977 - May 1978 The general distribution of epicenters during this period of observation is not greatly different from the period shown in Figure 2 suggesting that both sets of determinations are relatively reliable Events as small as M approximately 05 were located but due to the high noise level of the valley and to intermittent problems in the operation of the array the coverage of the seismic activity is not complete
As can be observed in Figure 6 the seismic pattern shows a N-S trend connecting the northwest end of the Cerro Prieto fault with the southeast end of the Imperial fault The seisshymicity shows little activity along the surface traces of the Imperial fault between the station TAM and the International Border (In contrast during 1969 Lomnitz et aZ 1970 found significant activity along this section of the Imperial fault) The concentration of events in the vicinity of Ejido Victoria (close to the station SON) corresshyponds mostly to the Victoria Swarm of March 10-23
1978 which consisted of approximately 500 events The magnitudes of the two largest events were 47 and 50 The distribution of epicenters suggests that the activity of the swarm involved preshydominantly the NW trending Cerro Prieto fault a parallel en-echelon fault and NS connecting faults This interpretation is also suggested by the composite focal mechanisms for these events
A diffuse pattetn of seismic activity is observed east of the Cerro Prieto fault Near the station QKP an aftershock sequence of a May 5 1978 earthquake occurred consisting of about 1500 events of magnitude less than 1 There is also diffuse seismic activity northwest of Cerro Prieto probably associated with the San Jacinto fault zone (although these events occurred outside of the array and their locations are poorly conshy
middotstrained) A special study was made of the aftershy
shocks of the January 17 1977 event of magnitude 42 (CALTECH) at the extreme southeast end of the Imperial fault (near point A in Figure 6) During a period of observation of 48 hours beginning 36 hours after the main event 40 aftershocks were recorded of which it was possible to locate 10 The estimated focal depths varied from 6 to 13 km
Composite Fault Plane Solutions The focal sphere projections of the
polarity of first arrivals for certain groups of events labelled A B C and D in Figure 6 were plotted on equal area projections (upper hemisshyphere) If all the events in the group have the same fault orientation this composite projection will indicate this orientation even though only a few stations are used
The composite fault plane solution for the events in group A (January 17 1977) is shown in Figure 7 It indicates either right lateral motion along a NW trending fault or left lateral motion along a conjugate NE trending fault If the right lateral interpretation is taken then the epicenter locations suggest at least 3 enshyechelon faults parallel to the Cerro Prieto fault On the other hand if the left lateral intershypretation is taken the epicenters could also represent some left lateral conjugate faulting
The composite fault plane solution for the events located in the neighborhood of the explorashytion well PRIAN (group B Figure 6) is poorly constrained but suggests dip-slip motion on a nearly vertical fault The composite fault plane solution for the events in the vicinity of the Cerro Prieto geothermal steam wells (group C Figure 6) indicates that the activity involves predominantly normal faulting with a dip of 600
to the southeast or 30deg to the northwest~ (Figure 8) The former is consistent with the results of structural geology studies carrfed out in the area of production by Puente and de la Pefia (this volume) The composite fault plane polarity data for group D (Figure 9) also suggests normal fault shying although the data are not sufficient to accushyrately constrain the solution The dashed lines indicate the same fault planes as in Figure 8 and is consistent with the data with the exception of one point
The composite fault plane solution for group E (Figure 10 swarm of March 10-231978) is well constrained and indicates right lateral strike-slip along a NW trending fault (azimuth
238
330deg) or a left lateral motion along a NE trending fault The former solution is most likely because it is consistent with the orientation of the Cerro Prieto fault and the trends indicated in the epicentral locations (Figure 6) Some events in this swarm are not represented in the composite solution because their polarities were clearly inconsistent with the soluti~n They may represent dip-slip faulting occurring long with the strikeshyslip faulting
Interpretation The pattern of seismicity and the composite
fault plane solutions described above suggest that the distribution of tectonic deformation (seismic slip) in the Mexicali Valley occurs principally along two tectonic trends 1 faults parallel to and including the Imperial-Cerro Prieto transform fault system 2 a system faults oblique to the Imperial-Cerro Prieto trend with at least some normal faulting
The results of previous studies in the Salton Province and in the Gulf of California (Hill et aZ 1975 Lomnitz et al 1970 Thatcher and Brune 1971 Reichle et al 1976 Weaver and Hill 1978) indicates that the regional tectonic forces induced by the relative motion of the Pacific plate (northwest) with respect to the American plate produces tensional tectonic forces in the Cerro Prieto graben and causes crustal spreading and thinning Local spreading of the crust is required by the geometry of the local offset of the Imperial-Cerro Prieto fault system Our data along with the geological studies (Puente and de la Pena this volume) indishycates that in the interior of the Cerro Prieto grashyben the crust is broken into a series of blocks bounded by planes oriented parallel to the Imperishyal-Cerro Prieto system (as observed at points A and E in Figure 6) and by an oblique set of fractures with some normal faulting indicating tension in a NW-SE direction indicated by the distribution of seismicity in the graben and by the composite focal plane solutions at points B C and D When this system of fracturing is viewed in the light of the model of Hill (1977) it suggests that swarms occur as a result of injection of magmatic fluids Existence of these complex fracture zones in the crust also may explain the high heat flow observed in the Mexicali Valley since the fractures would produce zones of high permeability through which the hot brines could flow
The results of this study have been very encouraging and indicate that with improved coverage and accuracy important aspects of tectonics of the Cerro Prieto steam field will be revealed A six station telemetered digital seismic array designed for this purpose has been installed by CICESE with funding from CFE and CICESE and is now in operation
ACKNOWLEDGEMENTS This work was financed jointly by the
Executive Coordinator of Cerro Prieto (CF~) and CICESE through the Institute of Electrical Research (IIE)
We would like to specially acknowledge the encouragement and support for this study by Eng Hector Alonso (CFE) Eng Guillermo de la Garza (lIE) and Dr Pablo Mulas (lIE)
We have also benefited from discussions about the geology and geophysics of Cerro Prieto with Eng Hector Alonso Eng Antonio Razo and Eng I Puente We are especially thankful to L Garcilazo J Soarez J Hinojoza and JMartfnez for assistance in reading records and field work
The data from the earlier 1971-1975 period was obtained with funds from the National Science Foundation Grant DES74-03l88 and National Aeronautics and Space Administration Grant NASA NGR-05-009-246 Alejandro Nava and Steve Day carried out the field operations during this period and Steve Day assisted in some of the data analysis
We also appreciate the efforts of Neenah Rohner and Rosi Martinez who typed the English and Spanish versions of this paper
TABLE AND FIGURE CAPTIONS
Table 1 Geographic coordinates and gain settings (maximum magnification of 4 x 10⁶) for the stations
Table 2 Dates hypocentra1 coordinates and coda magnitudes of the master events for relative determination of epicenters
Figure 1 Regional map of the Cerro Prieto area The solid dots represent the permanent stations of the Cerro Prieto Seismic Array (RESCEP) The open circles represent temporary stations operated for the January 1977 events and for the March 1978 Victoria swarm The solid triangles represent some of the permanent regional stations
Figure 2 Seismicity of the Cerro Prieto region from 1971-1975 Solid triangles represent local stations operated in 1974-1975
Figure 3 Magnification curve for the seismographs used in this study
Figure 4 Wadati diagram for P and S wave arrival times in the Cerro Prieto region
Figure 5 Velocity model used in this study
Figure 6 Seismicity of the Cerro Prieto region 1977-78 The solid triangles represent permanent stations of the Cerro Prieto Seismic Array (RESCEP)
Figure 7 Composite focal mechanism plot for the aftershocks of the January 17 1977 earthquake Symbols 0 = dilation _ = compression
Figure 8 Composite focal mechanism plot for earthshyquake swarms of September 29 and October 15 1977 Symbols 0 = dilation _ = compression
Figure 9 Composite focal mechanism plot for the events of Group D (see Figure 6) Symbols o = dilation _ = compression
Figure 10 Composite focal mechanism plot for the earthquake swarm of March 10-21 1978 Symbols o = dilation _ = compression
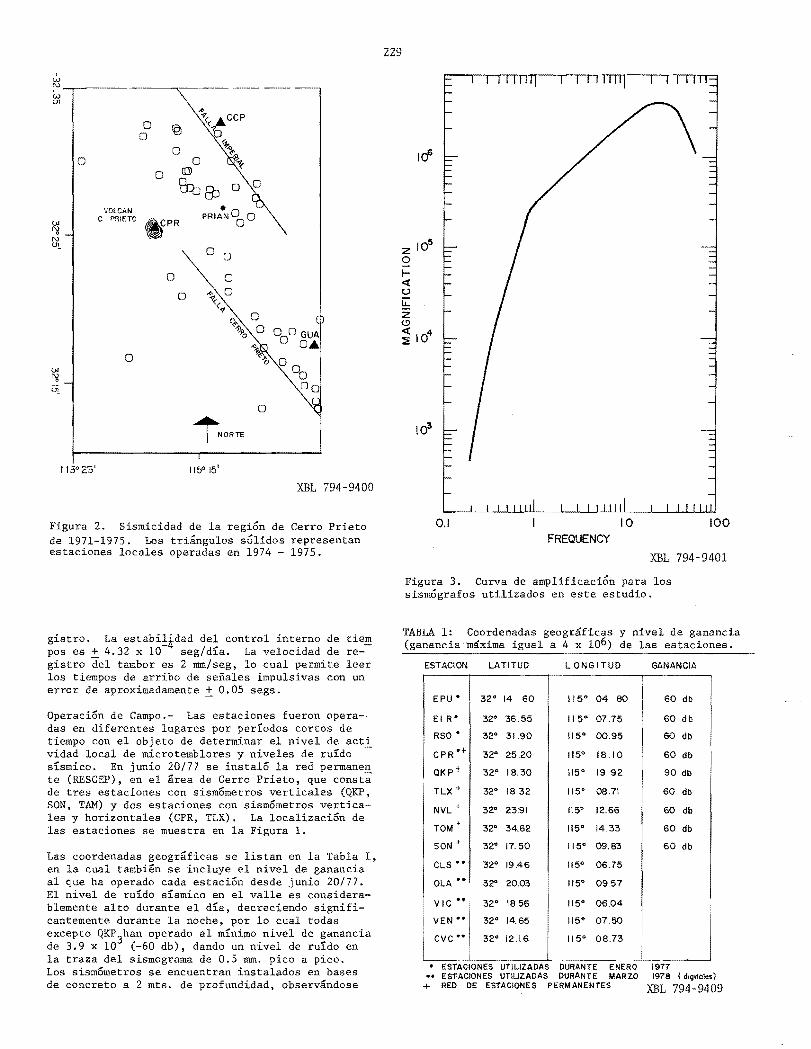
0
w w U1
~CCP0 rg
00 ~
0 ~ 0 0 ~ (]
08J 0
VOLCAN bull C PRIETO PRIANOOO
()l eCPR
(J1_ ~
0 0
0 0
00 1( (I
0 ~1l 0
10 000 GUA Oamp
0 0 ()l 0
0~ 00(J1_
0
[NORTE
115deg25 115deg 15
XBL 794-9400
Figura 2 Sismicidad de la region de Cerro Prieto de 1971-1975 Los triangulos solidos representan estaciones locales operadas en 1974 - 1975
gistro La estabi~dad del control interne de pos es + 432 x 10 segdia La velocidad de reshygistro del tambor es 2 mmseg 10 cual permite leer los tiempos de arribo de senales impulsivas con un error de aproximadamente plusmn 005 segs
Operacion de Campo- Las estaciones fueron opera-middot das en diferentes lugares por periodos cortos de tiempo con el objeto de determinar el nivel de acti vidad local de microtemblores y niveles de ruido shysrsmico En junio 2077 se instalo la red permanen te (RESCEP) en el area de Cerro Prieto que consta de tres estaciones con sismometros verticales (QKP SON TAM) y dos estaciones con sismometros verticashyles y horizontales (CPR TLX) La localizacion de las estaciones se muestra en la Figura 1
Las coordenadas geograficas se listan en la Tabla l en la cual tambien se incluye el nivel de ganancia al que ha operado cada estacion desde junio 2077 El nivel de rurdo sismico en el valle es considerashyblemente alto durante el dia decreciendo signifishycantemente durante la noche por 10 cual todas excepto QKP han operado al minimo nivel de ganancia
3de 39 x 10 (-60 db) dando un nivel de ruido en la traza del sismograma de 05 mm pico a pico Los sismometros se encuentran instalados en bases de concreto a 2 mts de profundidad observandose
229
106
105 Z 0 I shylaquo U IJ
Z lt)
4~ 10
103
01 10 FREQUENCY
XBL 794-9401
Figura 3 Curva de amplificacion para los sismografos utilizados en este estudio
TABLA 1 Coordenadas geograficas y nivel de ganancia (ganancia~axima igual a 4 x 10⁶) de las estaciones
ESTACION lATITUD lONGITUD GANANCIA
EPUmiddot 32middot 14 60 115deg 04 80 60 db
EIRmiddot 32deg 3655 II 5middot 0775 60 db
RSOmiddot 32deg 3190 115 0 0095 60 db
CPRmiddot+ 32deg 2520 115deg 18 10 60 db
QKPt 32deg 1830 115middot 1992 90 db
TlX + 32middot 1832 115middot 0871 60 db
NVl + 32deg 2391 115deg 1266 60 db
TOM + 320 3462 1150 1433 60 db
SON + 32deg 1750 115deg 0983 60 db
ClS bullbull 32deg 1946 1150 0675
OlA bullbull i 32middot 2003 115deg 0957
VIC bullbull 32deg 1856 1150 0604
i VEN bullbull 32deg 1465 115 0 0750
CVC bullbull 32middot 1216 115deg 0873
ESTACIONES UTILIZADAS DURANTE ENERO 1977 ESTACIONES UTlLlZADAS DURANTE MARZO 1918 ( dlgltale) REO DE ESTACIONES PERMANENTES+ XBL 794-9409
100
230
un amortiguamiento de al menos un factor de dos en el nivel de rUido con respecto a las observaciones en la superficie La frecuencia caracteristica del rUldo sismico esta principalmente relacionado a la intensa actividad agricola del valle (y posiblemenshyte a la actividad geotermal en la vecindad de la e~ tacion Nuevo Leon) La diferencia en rUldo slsmico observado en las estaciones localizadas en el valle con respecto a la estacion QKP es muy probablemente originada por efectos de amplificacion en los sedishymentos de baja del valle
V ANALISIS DE DATOS
Los resultados de este estudio estan basados en 10shycalizaciones relativas precisas y mecanismos focashyles compuestos del primer movimiento Los mejores datos (eventos grandes) provinieron de enjambres de eventos Los enjambres ocurrieron en las siguientes localidades Vecindad del Campo Geotermico de Cerro Prieto (Septiembre 28 77) en la vecindad del pozo exploratorio PRIAN (Octubre 15 77) sur de la Falla Imperial cerca del Ejido Tlaxcala (Enero 17 77) Y en la vecindad del Ejido Victoria (Marzo 10 78) La base de datos para el estudio de la sismishycidad durante este perlodo fueron tiempos de arribos de fases P y S Y polaridades de las ondas P regisshytradas por las estaciones de la red sismografica de Cerro Prieto RESCEP 1977-197R En las determinaciones de epicentros y profundidades focales se selecciQnaron eventos registrados por RESCEP que estan caracterizadQs por arribos vos permit iendo lecturas confiables de los arribos P y S
En promedio el espaciamiento de las estaciones de RESCEP (figura 1) es aproximadamente 20 KID esto provee buen control en las determinaciones epicenshytrales y profundidades focales para eventos zados en el interior de la red Los datos de los enjambres de Septiembre 28 77 Octubre 15 77 Enero 2078 y Marzo 1078 fueron particularmente importa~ tes como eventos maestros para las determinacioshynes relativas de epicentros que se discuten posteshyriormente La localizacion de esos eventos se mues tran en la Figura 1 La Tabla 2 da sus coordena-shydas hipocentrales y magnitud coda
Para alcanzar el maximo nivel de precision en las determinaciones hipocentrales los tiempos del prishymer arribo de las fases P y S fueron leldos por va rios lectores utilizando lentes con una magnifica-shycion de 6X Las lecturas aSl obtenidas fueron comshyparadas para determinar los errores estandar en la precision de tiempos de arribos (plusmn 005 seg)
El metodo de localizacion relativa utilizada en es te estudio es simple y efectiva El metodo ha sido descrito por Johnson y Hadley (1976) y se describe brevemente a continuacion El metodo consiste de dos partes Primeramente uno 0 varios eventos por zonas son seleccionados y designados eventos maesshytros El criterio de seleccion es principalmente la disponibilidad de arribos impulsivos py S en to das las estaciones En seguida se supone que los shyresiduales tiempo-distancia en la localizacion son ocasionados completamente pbr retrasos de estacion esto es por anomallas en la estructura de velocida des en la vecindad de la estacion Los eventos res tantes son localizados utilizando esos retardos deshytiempo como correcciones de estacion De esta for-
TABLA 2 Fechas coordenadas hipocentrales y magnishytudes coda de los eventos maestros para la detershyminacion relativa de epicentros
FE CH A LATITUD LONGI TUD DE P T H MAG
770928 32middot 2372 115deg 1315 935 17
770928 32middot 2417 115deg 1366 II A6 23
770928 32deg 2437 115deg 12A3 608 28
770928 32middot 2379 115deg 1333 905 28
771015 32deg 2401 115deg 1171 933 7710 15 32deg 2380 115deg II 37 7 12 771015 32middot 2402 115deg 1123 10 04 7712 20 32deg 3790 115deg 1956 6 64 19
7712 II 32deg 3692 115deg 2448 603 18
771211 32 3652 115deg 2378 667 20
7801 20 32deg 2710 115middot I L 18 1498 10
7801110 32deg 2692 115deg 1073 1486 I I
780318 32deg 1624 115 0 0561 1081 49
780318 32deg 1516 115 0 0614 I 189 23
780319 32deg 1611 115middot 0780 974 25
bull
OltMlt10 XBL 794-9408
rea se logra un alto nivel de precision en las locashylizaciones relativas (equivalente a fijar un vector de localizacion relativa a los tiempos relativos en tre un evento y el evento maestro) El mayor logr de este metodo de localizaciones relativas es el de proveer una imagen mas clara de la distribucion de la sismicidad Con la eventual adquisicion de cono cimiento sobre la estructura de velocidades sera sible obtener un mayor refinamiento en las naciones Pero creemos que las conclusiones basi- cas no se cambiaran criticamente
Para fijar la velocidad de la onda S a partir de la velocidad de la onda P la razon VpVs fue determishynada del diagrama de Wadati que se muestra en la gura 4 Aproximadamente 80 datos de primeros bos de las fases P y S leldos en los registros vershyticales y horizontales fueron utilizados Los tiem pos de las fases P y S se determinaron con referenshycia a la estacion con arribo P mas temprano La co rrelacion lineal entre S y P dan un valor para VpVs de 167 menor que el valor esperado de 173 (para una razon de Poisson de 025) y significanteshymente diferente del valor de 25 reportado por Majer y McEvilly (1979 este volumen) en un estushydio realizado en la vecindad inmediata de los pozos de Cerro Prieto utilizando sismornetros verticales y horizontales
Las determinaciones hipocentrales se obtuvieron uti lizando el programa de localizacion HYPO-75 (Lee y Lahr 1975) El modele de velocidades utilizado pa ra la localizacion se tomo de estudios similares en en el Valle Imperial El modele se muestra en la figura 5 Las discontinuidades abruptas en este mo dele fueron alisadas por la introduccion de capas delgadas con cambios graduales en velocidad para disminuir los efectos desestabilizadores de capas abruptas sobre las determinaciones de mecanismos fo cales
231
bull bullbullbull bull bull
bull
(f)
ltJ lIE (fIT5 DE REO
fERI1FINENTE
o ~ EVENJDS DE SEPTIEtmtE 19n
o ENJAl18RE OE MMZO OE HI7S
eCIACIlII RECTR RJUSTF(JRl I 16726--013597
~~~~----~-----------------~--------~
D P ( SEC)
XBL 794-9403
Figura 4 Diagrama Wadati para los tiempos de arribo de las ondas P y S en la region de Cerro Prieto
VI DISCUSION DE LOS RESULTADOS
Localizaciones- La Figura 6 muestra la distribushycion de epicentros localizables de la actividad ss mica en el Valle de Mexicali durante el perodo deshyobservacion Enero 1977 - Mayo 1978 La distribushycion general de epicentros determinados durante esshyte perodo de observacion no es muy diferente del perodo mostrado en la figura 2 sugiriendo que ambas determinaciones son relativamente confiables Eventos tan pequenos como M (magnitud) aproximadashymente 05 fueron localizados pero debido al alto nivel de rufdo sfsmico observado en el valle y a problemas intermitentes en la operacion de la red la cobertura de la actividad sfsmica no es completa
Como se puede observar en la figura 6 el patron sfsmico muestra una tendencia N-S conectando el ex tremo noroeste de la Falla Cerro Prieto con el ex~ tremo sureste de la Falla Imperial La sismicidad muestra escasa actividad sfsmica a 10 largo del tra zo superficial de la Falla Imperial comprendido en~ tre la estacion TAM y la frontera Internacional (en contraste durante 1969 Lomnitz et al 1970
VELOCITY (Km I sec) a
a
4
6
7
e
E 9
_ 10 x ~
Cl
UJ
Cl
15
VELOCITY (Kmec)
170 196 27376 469 6AO 7 10
20 600
XBL 794-9402
Figura 5 Modelo de velocidad utilizado en este estudio
encontraron actividad significante en esta seccion de la Falla Imperial) La concentracien de eventos en la vecindad del Ejido Victoria (cercana a la esshytacion SON) corresponde en su mayor parte al Enjam bre Victoria de Marzo 10-2378 el cual consistio en aproximadamente 500 eventos Las magnit~des de los eventos mas grandes fueron 47 y 50 La distribushycion de epicentros sugiere que la actividad del enshyjambre involucre predominantemente la tendencia noroeste de la Falla Cerro Prieto y una falla para lela en-echelon y fallas conectantes NS Esta in terpretacion tambien la sugiere el mecanismo focal compuesto de esos eventos
Un patron difuso de actividad ssmica se observa al oeste de la Falla Cerro Prieto Cerca de la estashyci6n QKP ocurri6 una serie de replicas de un temshyblor del 5 de Mayo de 1978 con aproximadamente 1500 eventos de magnitud menor a 1 Existe tambien actividad sismica difusa al noroeste de Cerro Prieto probablemente asociada a la zona de fal1a San Jacinto (aun cuando estos eventos ocurren en el exterior de RESCEP y su loca1izaci6n esta pobreshymente constrenida)
232
w w U1
0 0
0 0 0 0 8
VOLCAN C PRIETOOJ
ltl R 0
0 0
0
0 OKP~
03 OJ
ltl ji shy
0
0
115 0 15
XBL 794-9399
Figura 6 Sismicidad de la region de Cerro Prieto 1977-1978 Los triangulos solidos representan estaciones permanentes de la Red Sismologica de Cerro Prieto (RESCEP)
Un estudio especial se realizo de las replicas de un evento de magnitud 42 (CALTECH) que se locali shyzo en el extremo sur de la Falla Imperial (Punto A) el 17 de Enero de 1977 burante un periodo de observacion de 48 horas iniciadas 36 horas despues del evento principal se registraron 40 eventos de los cuales fue posible localizar 10 Las profundi dades focales estimadas varian de 6 a 13 Km -
Soluciones Compuestas del Plano de Falla- La esshyfera focal de las proyecciones de la polaridad del primer arribo para un determinado grupo de eventos rotulados A B C y D en la figura 6 fueron cados en una proyeccion de igual area (hemisferio superior) Si todos los eventos del mismo grupo tienen la misma orientaci6n de falla esta proyecshycion compuesta indicara dicha orientacion aun cuan do pocas estaciones hayan sido utilizadas
La solucion compuesta del plano de falla para los eventos del grupo A (Enero 17 1977) se muestra en la figura 7 Este indica ya sea movimiento lateshyral derecho a 10 largo de una falla con una tendenshycia noroeste 0 un movimiento lateral izquierdo con una tendencia noreste a 10 largo de una falla conju gada Si la interpretacion del movimiento lateralshyderecho es seleccionado entonces la localizacion de los epicentros sugiere al menos tres fallas enshyechelon paralelas a la Falla de Cerro Prieto De otra forma si la interpretacion del movimiento la-
o
o o 0
00 8 ~ 0
o
XBL 794-9410
Figura 7 Grafica del mecanismo focal compuesto para los eventos del temblor de Enero 17 1977 Smbolos 0 dilatacion compresion
teral izquierdo es seleccionada los epicentros tam bien podrian representar fallamiento lateral izshyquierdo conjugado
Para los eventos localizados en la vecindad del poshyzo exploratorio PRIAN (Grupo B figura 6) el mecanis mo focal esta pobremente constrenido pero sugiere shymovimiento sobre una falla vertical En comparashycion el mecanismo focal compuesto de eventos en la vecindad de los pozos de produccion de la planta geotermica de Cerro Prieto (Grupo C figura 8) can que la actividad sismica involucra predominante mente fallamiento normal con un echado de 30 grados hacia el sureste 0 60 grados al noroeste la primeshyra es consistente con los resultados de estudios geologicos esctructurales realizados en el area de la zona de producci6n por Puente y de la Pena (1979 este volumen) Los datos de 1a polaridad del plano de falla compuesto del Grupo D figura 9 tambien sugiere un fallamiento normal sin embargo los datos no son suficientes para precisar la soluci6n La lInea punteada indica el mismo plano de falla como en la figura 8 y es consisshytente con los datos con 1a excepcion de un punto
La solucion compuesta del plano de fa1la para el Grupo E figura 10 (enjambre de Marzo 10-23 1978) esta bien constrenida e indica un rumbo lateral derecho con una tendencia de falla noroeste (azimut 330 grados) o movimiento lateral izquierdo con una tendencia de falla noreste La solucion anterior es la mas proshybable porque es consistente con 1a orientacion de 1a falla de Cerro Prieto y 1a tendencia indicada
233
bullbull bull
XBl 794-9407
Figura 8 Grafica del mecanismo focal compuesto para los eventos del Enjambre de Septiembre 29 y Octubre 15 1977 Sfmbolos 0 dilatacion _ = compresion
bullbull
I
I I I
I I
I
bull
I
1
I I
I
~ 2=40middot bull
600
Y
I I
bull I I
I
I 1300
o 00 1-
XBl 794-9406
Figura 9 Grafica del mecanisme focal compuesto para los eventos del Grupo D (ver figura 6) Spoundmbolos 0 = dilatacion _ = compresion
bullshy) o
XBL 794- 9405
Figura 10 Grafica del mecanisme focal compuesto para los eventos del Enjambre 10-21 1978 Sfmbolos 0 dilatacion _ = compresion
por las localizaciones epicentrales figura 6 Alg nos de los eventos de este enjambre no estan represhysentados en la solucion compuesta porque sus polashyridadps fueron claramente inconsistentes con la ROshy
lucion Estas podrlan representar fallamiento om deslizamiento de echado simultaneanlente con fallashymiento con deslizamiento de rumbo
Interpretacion- El patron de sismicidad y el meca nismo focal compuesto del plano de falla descrito shyanteriormente que la distribucion de la deshyformacion (deslizamiento slsmico) en el Valle de Mexicali ocurre principalmente a Jo largo de dos tendencias tectoricas i) Fallas paralelas incluyendo el sistema de fallas transformadas Impeshyrial-Cerro Prieto ii) Un sistema de fallas obli shycuas a la tendencia Imperial-Cerro Prieto involucran do al menos fallamiento normal
Los resultados de estudios previos en la provincia del Salton Sea y en el Golfo de California (Hill et al 1975 Lomnitz et al 1970 Reichle 1976 Thatcher y Brune 1971) nos indican que las fuerzas tectonicas regionales inducidas por el movimiento relativo de la placa del Paclfico (Nor-Oeste) con respecto a la placa Americana produce fuerzas tecshytonicas tensionales en el graben de Cerro Prieto ocasionando cortical con el consecuente adelgazamiento de la corteza Dispersion local de la corteza es requerido por la geometrla de la esshytribacion local (off-set) del sistema de fallas Imshyperial-Cerro Prieto Nuestros datos en conjunto con estudios geo16gicos (Puente y de la Pena 1979 este volumen) indican que en el interior del graben de Cerro Prieto la corteza se rompe en una serie de blocks delimitados por pIanos orientados paralelashymente al sistema Imperial-Cerro Prieto (como se
234
observa en los puntos AyE de la figura 6) y por un conjunto oblicuo de fracturas con una componenshyte de fallamiento normal indicando tensi6n en una direcci6n noroeste-sureste como 10 indica 1a disshytribuci6n de 1a sismicidad en el graben y los meshycanismos focales compuestos (Puntos B y C) Cuando este sistema de fracturamiento se observa en la 1uz del mode10 de Hill (1977) se sugiere que los enjamshybres ocurren como resu1tado de la inyecciJu de fluidos magmaticos La existencia de estas zonas de fracturamiento complejo en la corteza podrian tambien explicar e1 alto flujo termico observado en en el Valle de Mexicali puesto que las fracturas producen zonas de alta permeabilidad a traves de los cuales 1a salmuera caliente puede fluir
Los resultados de este estudio han sido muy estimushylantes y nos indican que con una mayor cobertura y precision aspectos importantes del tectonismo del campo geotermico de Cerro Prieto seran reve1ashydos Un arreglo de seis estaciones con te1emetria digital disenada para este proposito ha sido lada por CICESE con fondos de la CFE y CICESE 1a red se encuentra en operacion actualmente
VII AGRADECIMIENTOS
~ste estudio fue financiado en conjunto por la COO dinadora Ejecutiva de Ceero Prieto (CFE) y e1 Censhytro de Investigacion Cientifica y de Educacion Sushyperior de Ensenada (CICESE) a traves del Instituto de Investigaciones Electricas (lIE) La informacion del primer periodo fue obtenida con fondos de la NSF y NASA Durante este periodo los trabajos de campo fueron realizados por Alejandro Nava y Steve Day
Queremos agradecer especia1mente al Ing Hector Alonso (CFE) Ing Guillermo de 1a Garza (lIE) y a1 Dr Pablo Mu1as (lIE) por e1 apoyo y estimu10 brindado para este estudio
Nos hemos beneficiado con las discusiones sobre la geologia y geofisica de Cerro Prieto del Ing Hector Alonso Ing Antonio Razo y el Ing Puente
Estamos especialmente agradecidos con Jouracy Soarez Alejandro Hinojosa L Inzunza y Javier Martinez por su asistencia en la lectura de sismoshygramas y a F Jaime por su participacion en 1a coshyleccion diaria de sismogramas Ademas apreciamos e1 esfuerzo de N Rohner y Rosi Martinez por mecashynografiar y traducir la version Espanol-Ingles de este articulo
VIII BIBLIOGRAFIA
Combs J Y Rothstein Y 1976 Microearthquake studies at the Coso geothermal area China
Lake California in Proc Second UN Symp on Development and Use of Geothermal Reshysources May 1975 San Francisco Washington DC US Government Printing Office v 2 p 909
Hamilton RI Y Muffler LJP 1972 Microshyearthquakes at The Geysers geothermal area California J Geophys Res v 77 p 2081
Hill DP 1977 A model for earthquake swarms J Geophys Res v 82 p 1347
Hill DP Mowincke1 P y Peake LG 1975 Earthquakes active faults and geothermal areas in the Imperial Valley California Science v 188 p 1306
Johnson CE y Hadley DM 1976 Tectonic implications of the Brawley earthquake swarm Imperial Valley California Bull Seism Soc Am v 66 pp 1133-1144
Lange AL y Westphal WH 1969 Microearthshyquakes near The Geysers Sonoma County Cali shyfornia J Geophys Res v 74 p 4377
Lee WHK y Lahr JC 1975 HYPO-7l (Reshyvised) A computer program for determining hypocenter magnitude and first motion patshytern of local earthquakes US Geological Survey Open-File Report p 113
Lister CRB 1976 Qualitative theory on the deep end of geothermal systems in Froc Second UN Symp on Development and Use of Geothermal Resources May 1975 San Francisshyco Washington DC US Government Printshying Office v 2 p 459
Lomnitz C Mooser F Allen CR Brune JN y Thatcher W 1970 Sismicidad y tectonica del Golfo de California resultados prelimishynares Geoflsica Internacional v 10 no 2 p 37 48
Majer EL Y UcEvilly TV 1979 Seismologshyical investigations at The Geysers geothermal field Geophysics v 44 no 2 p 246
Reichle MS Sharman G y Brune JN 1976 Sonobuoy and teleseismic study of Gulf of California transform fault earthquake seshyquences Bull Seism Soc Amer v 66 p 1623
Thatcher W y Brune JN 1971 Seismic study on an oceanic ridge earthquake swarm in the Gulf of California Geophys JR astr Soc v 22 p 1446
Weaver CS y Hill DP 1978 Earthquake swarms and local spreading along major strike-slip faults in California Basel Birkhauser Verlag p 117
Williams DL Von Hersen RP Sclater JG Y Anderson RN 1974 The Galapagos spreading center lithospheric cooling and hydrothermal circulation Geophys JR ast Soc v 38 p 587
235
SEISMICITY STUDIES IN THE REGION OF THE CERRO PRIETO GEOTHERMAL FIELD
ABSTRACT We report results from seismicity studies
in the region of the Cerro Prieto Geothermal Field These studies were conducted with local short period seismic arrays during 1974-75 and 1977-78 During the latter period horizontal seismometers were used for better control on the S-wave arrival times Locations were obtained for about 200 events and composite fault plane solutions were obtained for five groups of events The seismic activity is characterized primarily by swarms of relatively small events although one swarm had events with magnitudes as high as 50
The epicenters indicate a broad distribushytion connecting the Cerro Prieto and Imperial faults Within this distribution there are indications of trends both parallel to and oblique to the Cerro Prieto-Imperial transform fault system The composite fault plane solutions indicate right lateral strike-slip faulting along NW-SE trending faults and dip-slip faulting along at least some of the oblique faults
The results are consistent with the model proposed by Hill (1977) and suggest that swarms occur as a result of injection of magmatic fluids along fault zones Thus understanding the nature of faulting and tectonic processes is very important in evaluating the potential for geothermal energy in a region
INTRODUCTION Geothermal areas are usually located in
regions of active tectonism and as a consequence it is not surprising that in the majority of them the seismic activity is high In particular the study of seismic activity of the Mexicali Valley is very important for our understanding of the tectonism of the region and due to the economic potential represented by the valleys geothermal resources it is important to charactshyerize the Cerro Prieto geothermal field within the regional tectonic pattern of the Valley of Mexicali Consequently we will be able to refine our concepts for identifying similar areas with potential geothermal resources
In the present study we report the results of seismic studies initiated in the Valley of Mexicali using portable stations and beginning m July 1977 permanent stations located in the region of the Cerro Prieto geothermal field This is the first study carried out in this region using both horizontal and vertical seismographs to improve the determination of focal depth
The study was proposed to the CFE Execshyutive Coordinator of Cerro Prieto through the Institute of Electrical Research and financed jointly by CFE and CICESE The results obtained to date have provided us with the basic data for future elaboration of the tectonic structural model of the active parts of the Imperial-Cerro Prieto fault system This data base has not been available earlier due principally to the lack of seismological stations in the valley
Study of the occurrence and locations of microearthquakes has been proposed by different authors (Combs and Rothstein 1976 Hamilton and Muffler 1972 Hill et al 1975 Lange and Westpahl 1969 Majer and McEvilly 1979) as an exploratory tool for geothermal resources The principal concept is the following The seismic activity occurs along faults and these are highly fractured zones that provide permeability sufficient for the extraction of heat In this model the transport of heat is brought about by the convection of fluids (hot brines)
Other seismic passive methods have been proposed as tools for exploration analysis of the attenuation of body waves regional variation in the ratio VpVs and analysis of seismic noise The first two have been evaluated by Majer and 1cEvilly (1979) as promising because results now exist for typical fields in which anomalous values of Q and VpVs are observed in the zones of proshyduction (relative to the surrounding areas) Results concerning the analysis of seismic noise still have not been sufficiently convincing
From among the range of emphases available for the study of the geothermal resources in the Valley of Mexicali (using passive seismic methods) we have decided on the tectonic emphasis rather than a very fine scale focus on the seismicity in the geothermal field Our knowledge of the tecshytonism of spreading centers in the oceanic crust of the Gulf of California is relatively well developed and permits us to make direct Comparshyisons with the Hexicali Valley which is part of the same physiographic province
The Mexicali Valley as part of the physiographic province of the Gulf of California is characterized by a system of grabens resulting from crustal extension associated with strike-slip motion along the Cerro Prieto and Imperial faults As a consequence it is a region of crustal thinning and high heat flow caused by the intrusshyion of ignious material from the mantle If we assume that the sedimentary cover (5000 to 6000 meters) inhibits vertical hydrothermal circulation (Williams et al 1974 Lister 1976) and that the circulation in this region occurs laterally across the system of transform faults (ImperialshyCerro Prieto) then these faults are likely zones of vertical transport for hydrothermal convection of hot solutions Hence the fault zones are probable places for geothermal reservoirs of major economic importance
PREVIOUS INVESTIGATIONS Three permanent stations were installed by
UNAH and CALTECH in 1969 (Lomnitz et al1970) around the northern part of the Gulf of California to study the seismicity of the Mexicali Valley and the northern part of the Gulf of California Lomnitz et al (1970) reported that the seismic activity was concentrated in the Imperial Cerro Prieto (San Jacinto) Sierra Juarez and San Miguel faults (Figure 1) The tectonic model of the
236
physiographic province around the northern part of the Gulf proposed by these authors consists of a series of six transform faults connected with five spreading centers The spreading centers are characterized by geothermal zones recent volcanshyoes swarms of earthquakes and topographic depressions
The results obtained in a more recent study of data from stations Rio Hardy RHM EGMSFP the CALTECH Southern California array and a temporary array installed during the period 1974 to 1975 are shown in Figure 2 These determinshyations of epicenters were obtained with an average of 5 stations with S arrivals from 2-3 stations
The epicenters in the region southeast of Cerro Prieto clearly show a trend paralleling the Cerro Prieto fault and indicate that this trend of epicenters is associated with the fault The epicenters scatter in the region between the two faults and do not indicate any simple pattern A few events occur outside the region between the two faults Although during the period of time represented by Figure 2 there is no obvious trend of epicenters along the Imperial fault in the time period studied by Lomnitz et al (1970)there was such a trend (there was also a concentration along the Cerro Prieto fault) The data from the CALTECH Bulletin for Periods before 1971 does not show obvious concentrations of activity along either the Imperial fault in Mexico or the Cerro Prieto fault This could be partly due to poor coverage and poor location accuracy during this time period
RECENT RESULTS
Instrumentation High-gain portable stations recording on
smoked paper (Sprengnether Model MEQ 800) with 60 dB of attenuation (with increments of -6 dB per step) were used in conjunction with Ranger SSI seismometers (natural frequency 1 Hz generator constant 93 voltsmetersecond) The unattenuated magnification peaks at about 25 Hz (4 x 10⁶) The frequency response of this system including the amplifier and filters is shown in Figure 3 The power supply for the system is provided with two 12 volt batteries (75 amps) The current drain is about 15 milliamps which permits operation in a continuous mode for five weeks Time control for this system is provided with 60-TL True Time Instruments radios (WWVB) The time code is manually fed into the system at the beginning and end of each record Stability of the internal time control is plusmn 432 x 10-4 secsday The drum recording velocity is 2 millimeterssecond which permits reading of arrival times of impulsive signals with an error of about plusmn 05 seconds
Field Operation The stations were operated in different
places for short periods of time in order to determine a local level of microearthquake activity and the levels of seismic noise On June 20 1977 the permanent array (RESCEP) was install shyed in the area of Cerro Prieto and consisted of three stations with vertical seismometers (QKP SONTAM) and two stations with vertical and horizontal seismometers (CPRTLX) The location of the stations is shown in Figure 1
Geographic coordinates for the stations are listed in Table 1 which also shows the gain
level at which each station has operated since June 20 1977 The level of seismic noise in the valley is quite high during the day decreasing significantly during the night and thus all the stations except ~KP were operated at the minimum gain of 39 x 10 (- 60 dB) giving a noise level on the trace of the seismogram of 5 millimeters peak-to-peak Seismometers were located in conshycrete bases 2 meters deep resulting in a deshycreased noise level of about a factor of 2 with respect to observations on the surface The characteristic frequency of the micro-seismic noise is about 2 Hz This high level of seismic noise is primarily related to the intense agricultural activity in the valley (and possibly to geothermal activity in the case of the Nuevo Leon station) The difference in noise level observed on the valley stations with respect to the station QKP is probably a result of effects of amplification in the low rigidity sediments of the valley
DATA ANALYSIS
The results of this study are based on precise relative locations and composite focal mechanism solutions Most of the better data (larger events) was from swarms of events Swarms occurred in the following localities the region around the Cerro Prieto geothermal camp (September 28 1977) near the exploration well PRIAN (October 15 1977) near the southern extreme of the Imperial fault near Ejido Tlaxcala (January 17 1977) and in the vicinity of Ejido Victoria (March 10 1978) The data base for the study during this period was arrival times of P and S phases and polarities of P waves registered on the stations of the Cerro Prieto seismic array RESCEP (1977-1978) For determination of epishycenters and focal depths events characterized by impulsive arrivals allowing confident readings of the P and S wave arrivals were selected from RESCEP recordings
The average spacing of the stations of RESCEP (Figure 1) is about 20 km This provides good control for the epicentral determinations and focal depths of events located in the interior of the array Data from the swarms of September 28 1977 October 15 1977 January 10 1978 and March 10 1978 were particularly important as data for master events for the relative determinashytions of epicenters to be discussed later The locations of these events are shown in Figure 1 Table 2 gives their hypocentral coordinates and coda magnitudes
In order to achieve the maximum level of precision in the hypocentral determinations the arrival times for the P and S phases were careshyfully read by several different persons using magnifying glasses with the magnification of 6X Data thus obtained were compared to determine the standard errors in the accuracy of the arrival times (plusmn 05 seconds)
The method of relative location used in this study is simple and effective The method has been described by Johnson and Hadley (1976) and is described briefly here The method conshysists of two parts First one or more events (by zone) are selected and designated master events Criteria for selection is primarily the existence of impulsive P and S wave arrival times on all the stations Then it is assumed that the
237
distance residuals in the location are brought about completely by station delays ie by anomshyalies in the velocity structure in the vicinity of the station The remaining events are located using these time delays as station corrections In this way a high level of precision is obtained in the relative locations (equivalent to fixing the relative location vector from the relative times between the event and the master event) The major advantage of this method for relative locations is that it provides a clearer picture of the distribution of seismicity If eventually better knowledge of velocity structure is obtained it will be possible to refine the locations However we believe that the basic conclusions obtained here will not be changed critically
In order to determine the velocity of the S wave from the velocity of the P wave the ratio VpVs was determined using a Wadati diagram as shown in Figure 4 Approximately 80 data points from arrival times of the P and S phases read on the vertical and horizontal components were used Times of the P and S phases are determined relat shyive to earliest P wave arrival times A linear correlation between Sand P times gives a value of VpVs of 167 which is less than the expected value of 173 (for a Poissons ratio of 14th) and is significantly different from the value of 25 reported by Majer and McEvilly (this volume) in a study carried out in the immediate vicinity of the Cerro Prieto geothermal wells using vertical and horizontal seismometers
Hypocentral determinations were obtained utilizing the location program HYPO 1975 (Lee and Lahr 1975) The model of velocities used for the locations has been taken from similar studies in the Imperial Valley The model is shown in Figure 5 The abrupt continuities in this model were smoothed by introducing thin layers with gradual changes in velocity to diminish the destabilizing effects of abrupt layers on the determination of focal mechanisms
DISCUSSION OF RESULTS
Locations Figure 6 shows the distribution of
locateable epicenters for the seismic activity in the Mexicali Valley during the period of obsershyvation January 1977 - May 1978 The general distribution of epicenters during this period of observation is not greatly different from the period shown in Figure 2 suggesting that both sets of determinations are relatively reliable Events as small as M approximately 05 were located but due to the high noise level of the valley and to intermittent problems in the operation of the array the coverage of the seismic activity is not complete
As can be observed in Figure 6 the seismic pattern shows a N-S trend connecting the northwest end of the Cerro Prieto fault with the southeast end of the Imperial fault The seisshymicity shows little activity along the surface traces of the Imperial fault between the station TAM and the International Border (In contrast during 1969 Lomnitz et aZ 1970 found significant activity along this section of the Imperial fault) The concentration of events in the vicinity of Ejido Victoria (close to the station SON) corresshyponds mostly to the Victoria Swarm of March 10-23
1978 which consisted of approximately 500 events The magnitudes of the two largest events were 47 and 50 The distribution of epicenters suggests that the activity of the swarm involved preshydominantly the NW trending Cerro Prieto fault a parallel en-echelon fault and NS connecting faults This interpretation is also suggested by the composite focal mechanisms for these events
A diffuse pattetn of seismic activity is observed east of the Cerro Prieto fault Near the station QKP an aftershock sequence of a May 5 1978 earthquake occurred consisting of about 1500 events of magnitude less than 1 There is also diffuse seismic activity northwest of Cerro Prieto probably associated with the San Jacinto fault zone (although these events occurred outside of the array and their locations are poorly conshy
middotstrained) A special study was made of the aftershy
shocks of the January 17 1977 event of magnitude 42 (CALTECH) at the extreme southeast end of the Imperial fault (near point A in Figure 6) During a period of observation of 48 hours beginning 36 hours after the main event 40 aftershocks were recorded of which it was possible to locate 10 The estimated focal depths varied from 6 to 13 km
Composite Fault Plane Solutions The focal sphere projections of the
polarity of first arrivals for certain groups of events labelled A B C and D in Figure 6 were plotted on equal area projections (upper hemisshyphere) If all the events in the group have the same fault orientation this composite projection will indicate this orientation even though only a few stations are used
The composite fault plane solution for the events in group A (January 17 1977) is shown in Figure 7 It indicates either right lateral motion along a NW trending fault or left lateral motion along a conjugate NE trending fault If the right lateral interpretation is taken then the epicenter locations suggest at least 3 enshyechelon faults parallel to the Cerro Prieto fault On the other hand if the left lateral intershypretation is taken the epicenters could also represent some left lateral conjugate faulting
The composite fault plane solution for the events located in the neighborhood of the explorashytion well PRIAN (group B Figure 6) is poorly constrained but suggests dip-slip motion on a nearly vertical fault The composite fault plane solution for the events in the vicinity of the Cerro Prieto geothermal steam wells (group C Figure 6) indicates that the activity involves predominantly normal faulting with a dip of 600
to the southeast or 30deg to the northwest~ (Figure 8) The former is consistent with the results of structural geology studies carrfed out in the area of production by Puente and de la Pefia (this volume) The composite fault plane polarity data for group D (Figure 9) also suggests normal fault shying although the data are not sufficient to accushyrately constrain the solution The dashed lines indicate the same fault planes as in Figure 8 and is consistent with the data with the exception of one point
The composite fault plane solution for group E (Figure 10 swarm of March 10-231978) is well constrained and indicates right lateral strike-slip along a NW trending fault (azimuth
238
330deg) or a left lateral motion along a NE trending fault The former solution is most likely because it is consistent with the orientation of the Cerro Prieto fault and the trends indicated in the epicentral locations (Figure 6) Some events in this swarm are not represented in the composite solution because their polarities were clearly inconsistent with the soluti~n They may represent dip-slip faulting occurring long with the strikeshyslip faulting
Interpretation The pattern of seismicity and the composite
fault plane solutions described above suggest that the distribution of tectonic deformation (seismic slip) in the Mexicali Valley occurs principally along two tectonic trends 1 faults parallel to and including the Imperial-Cerro Prieto transform fault system 2 a system faults oblique to the Imperial-Cerro Prieto trend with at least some normal faulting
The results of previous studies in the Salton Province and in the Gulf of California (Hill et aZ 1975 Lomnitz et al 1970 Thatcher and Brune 1971 Reichle et al 1976 Weaver and Hill 1978) indicates that the regional tectonic forces induced by the relative motion of the Pacific plate (northwest) with respect to the American plate produces tensional tectonic forces in the Cerro Prieto graben and causes crustal spreading and thinning Local spreading of the crust is required by the geometry of the local offset of the Imperial-Cerro Prieto fault system Our data along with the geological studies (Puente and de la Pena this volume) indishycates that in the interior of the Cerro Prieto grashyben the crust is broken into a series of blocks bounded by planes oriented parallel to the Imperishyal-Cerro Prieto system (as observed at points A and E in Figure 6) and by an oblique set of fractures with some normal faulting indicating tension in a NW-SE direction indicated by the distribution of seismicity in the graben and by the composite focal plane solutions at points B C and D When this system of fracturing is viewed in the light of the model of Hill (1977) it suggests that swarms occur as a result of injection of magmatic fluids Existence of these complex fracture zones in the crust also may explain the high heat flow observed in the Mexicali Valley since the fractures would produce zones of high permeability through which the hot brines could flow
The results of this study have been very encouraging and indicate that with improved coverage and accuracy important aspects of tectonics of the Cerro Prieto steam field will be revealed A six station telemetered digital seismic array designed for this purpose has been installed by CICESE with funding from CFE and CICESE and is now in operation
ACKNOWLEDGEMENTS This work was financed jointly by the
Executive Coordinator of Cerro Prieto (CF~) and CICESE through the Institute of Electrical Research (IIE)
We would like to specially acknowledge the encouragement and support for this study by Eng Hector Alonso (CFE) Eng Guillermo de la Garza (lIE) and Dr Pablo Mulas (lIE)
We have also benefited from discussions about the geology and geophysics of Cerro Prieto with Eng Hector Alonso Eng Antonio Razo and Eng I Puente We are especially thankful to L Garcilazo J Soarez J Hinojoza and JMartfnez for assistance in reading records and field work
The data from the earlier 1971-1975 period was obtained with funds from the National Science Foundation Grant DES74-03l88 and National Aeronautics and Space Administration Grant NASA NGR-05-009-246 Alejandro Nava and Steve Day carried out the field operations during this period and Steve Day assisted in some of the data analysis
We also appreciate the efforts of Neenah Rohner and Rosi Martinez who typed the English and Spanish versions of this paper
TABLE AND FIGURE CAPTIONS
Table 1 Geographic coordinates and gain settings (maximum magnification of 4 x 10⁶) for the stations
Table 2 Dates hypocentra1 coordinates and coda magnitudes of the master events for relative determination of epicenters
Figure 1 Regional map of the Cerro Prieto area The solid dots represent the permanent stations of the Cerro Prieto Seismic Array (RESCEP) The open circles represent temporary stations operated for the January 1977 events and for the March 1978 Victoria swarm The solid triangles represent some of the permanent regional stations
Figure 2 Seismicity of the Cerro Prieto region from 1971-1975 Solid triangles represent local stations operated in 1974-1975
Figure 3 Magnification curve for the seismographs used in this study
Figure 4 Wadati diagram for P and S wave arrival times in the Cerro Prieto region
Figure 5 Velocity model used in this study
Figure 6 Seismicity of the Cerro Prieto region 1977-78 The solid triangles represent permanent stations of the Cerro Prieto Seismic Array (RESCEP)
Figure 7 Composite focal mechanism plot for the aftershocks of the January 17 1977 earthquake Symbols 0 = dilation _ = compression
Figure 8 Composite focal mechanism plot for earthshyquake swarms of September 29 and October 15 1977 Symbols 0 = dilation _ = compression
Figure 9 Composite focal mechanism plot for the events of Group D (see Figure 6) Symbols o = dilation _ = compression
Figure 10 Composite focal mechanism plot for the earthquake swarm of March 10-21 1978 Symbols o = dilation _ = compression
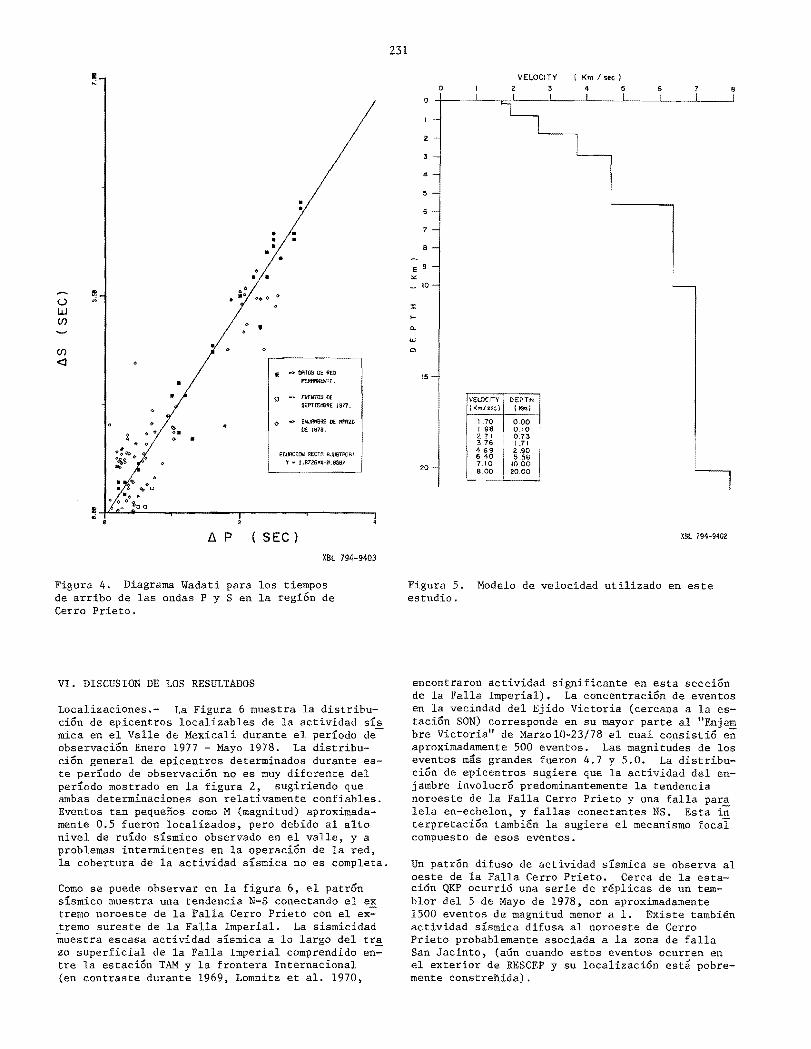
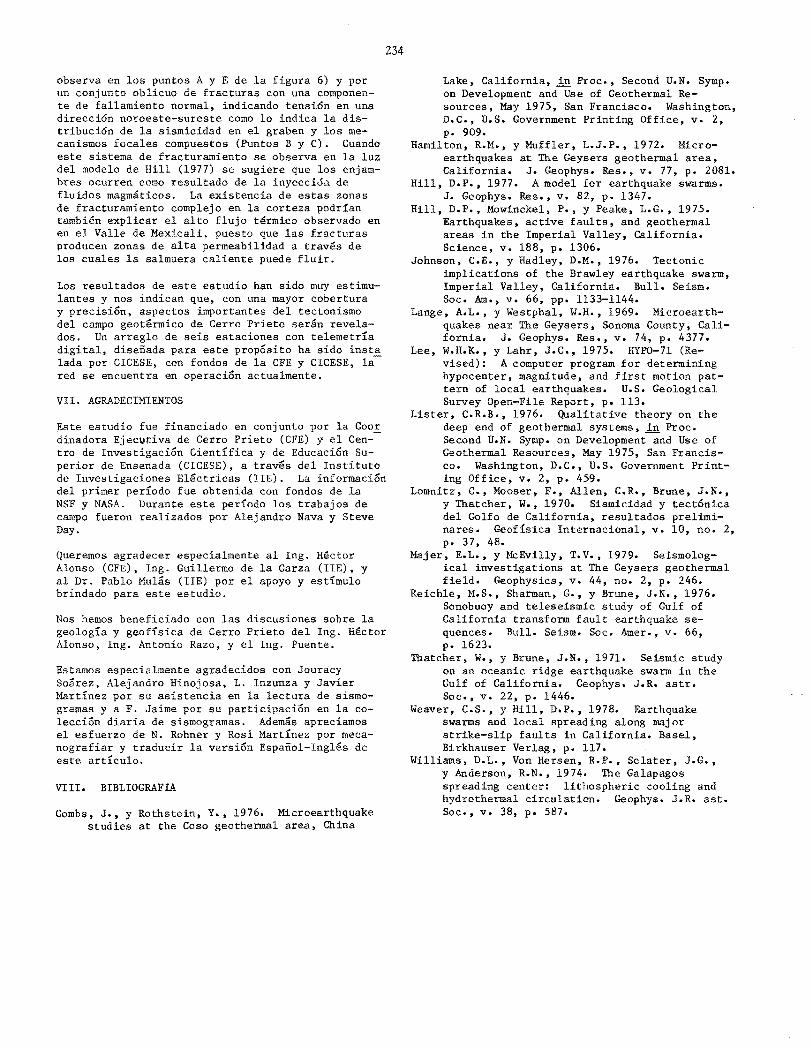
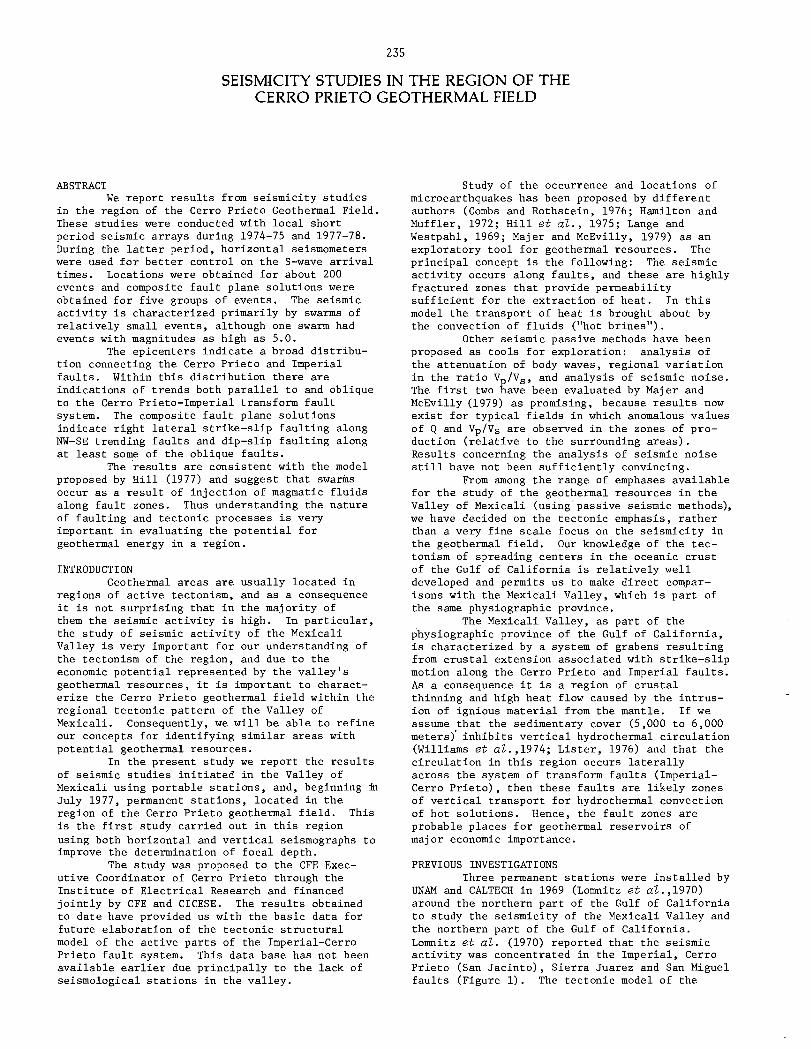
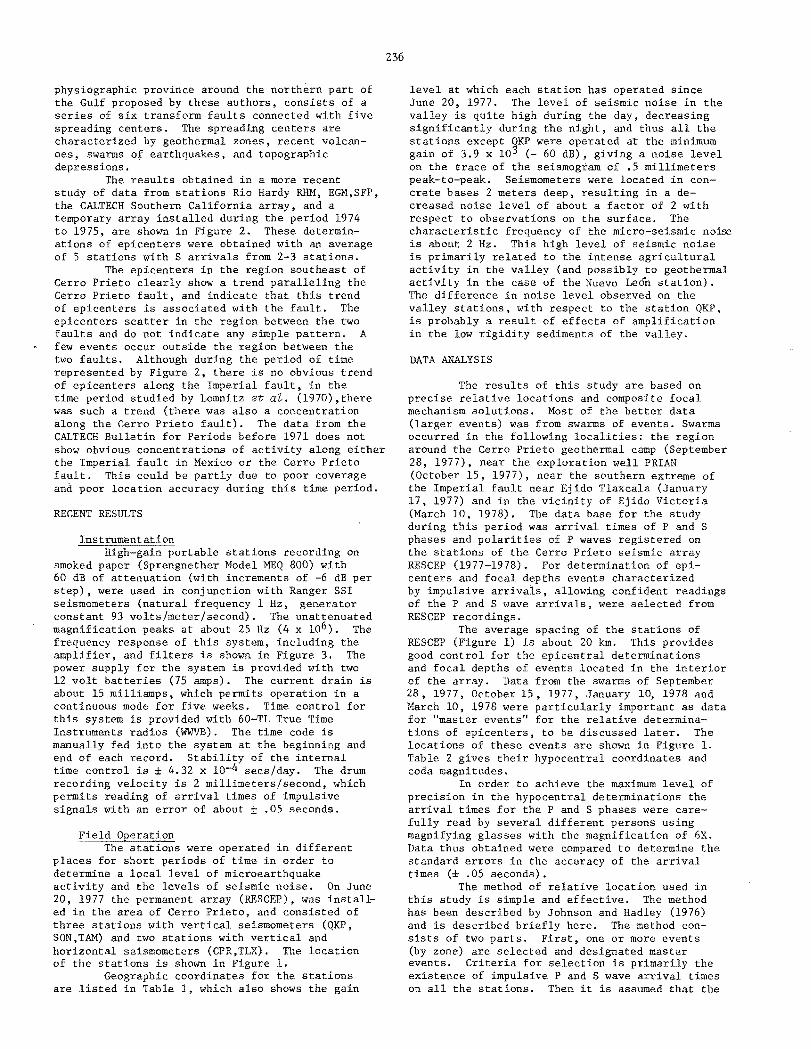
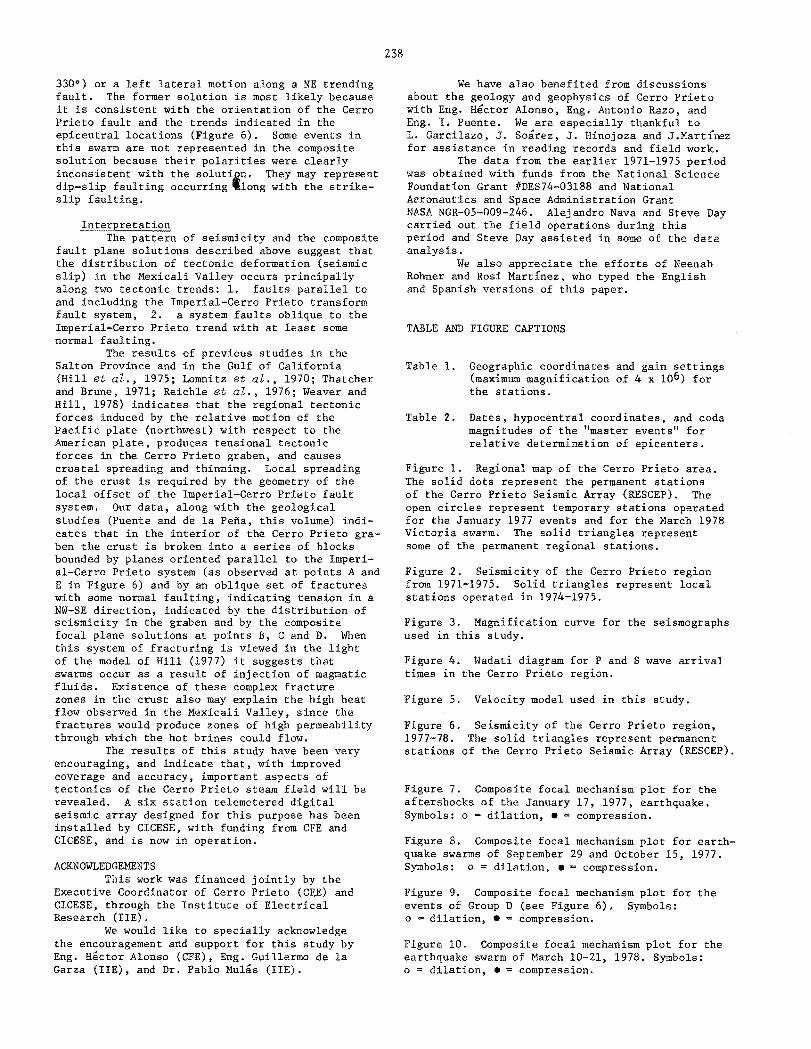