Download - FY2015 results presentation
Conference call
3 March 2016
H. 6.00 pm CET
Results presentation as at 31/12/2015
DIS
CL
AIM
ER
This presentation does not constitute an offer or an invitation to subscribe for or purchase any securities.
The securities referred to herein have not been registered and will not be registered in the United States under the U.S. Securities Act of 1933, as
amended (the “Securities Act”), or in Australia, Canada or Japan or any other jurisdiction where such an offer or solicitation would require the approval
of local authorities or otherwise be unlawful. The securities may not be offered or sold in the United States or to U.S. persons unless such securities
are registered under the Securities Act, or an exemption from the registration requirements of the Securities Act is available. Copies of this
presentation are not being made and may not be distributed or sent into the United States, Canada, Australia or Japan.
This presentation contains forwards-looking information and statements about IGD SIIQ SPA and its Group.
Forward-looking statements are statements that are not historical facts.
These statements include financial projections and estimates and their underlying assumptions, statements regarding plans, objectives and
expectations with respect to future operations, products and services, and statements regarding plans, performance.
Although the management of IGD SIIQ SPA believes that the expectations reflected in such forward-looking statements are reasonable,
investors and holders of IGD SIIQ are cautioned that forward-looking information and statements are subject to various risk and uncertainties,
many of which are difficult to predict and generally beyond the control of IGD SIIQ; that could cause actual results and developments to differ
materially from those expressed in, or implied or projected by, the forward-looking statements.
These risks and uncertainties include, but are not limited to, those contained in this presentation.
Except as required by applicable law, IGD SIIQ does not undertake any obligation to update any forward-looking information or statements
3
03 March 2016 FY2015 Results Presentation
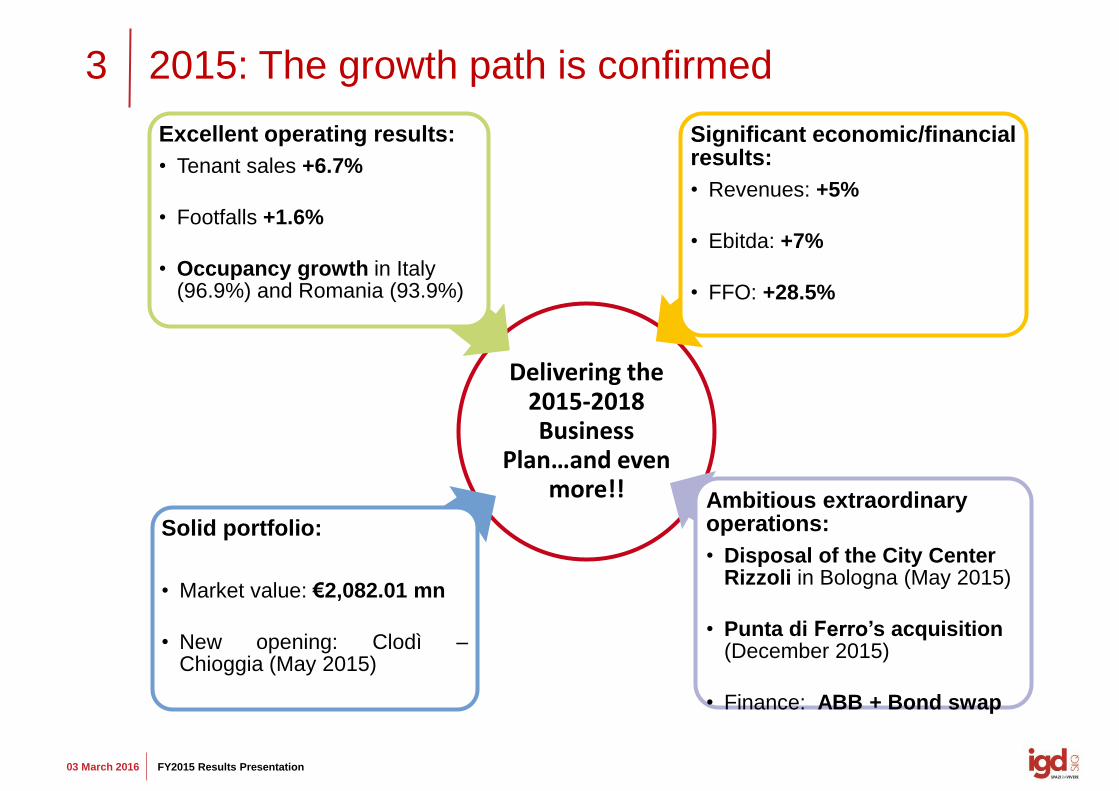
2015: The growth path is confirmed
Delivering the 2015-2018 Business
Plan…and even more!!
Excellent operating results:
• Tenant sales +6.7%
• Footfalls +1.6%
• Occupancy growth in Italy (96.9%) and Romania (93.9%)
Solid portfolio:
• Market value: €2,082.01 mn
• New opening: Clodì – Chioggia (May 2015)
Significant economic/financial results:
• Revenues: +5%
• Ebitda: +7%
• FFO: +28.5%
Ambitious extraordinary operations:
• Disposal of the City Center Rizzoli in Bologna (May 2015)
• Punta di Ferro’s acquisition (December 2015)
• Finance: ABB + Bond swap
4
03 March 2016 FY2015 Results Presentation
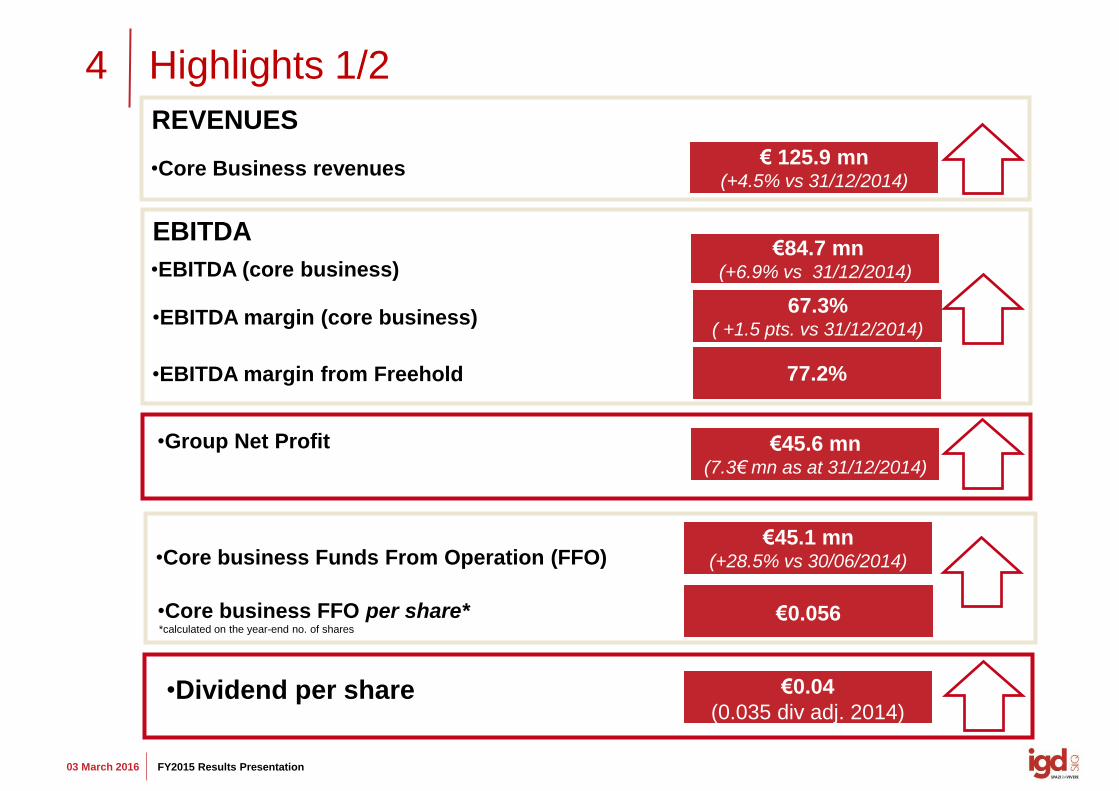
Highlights 1/2
•Core business Funds From Operation (FFO) €45.1 mn
(+28.5% vs 30/06/2014)
•EBITDA (core business) €84.7 mn
(+6.9% vs 31/12/2014)
EBITDA
REVENUES
•EBITDA margin from Freehold 77.2%
•Group Net Profit
€45.6 mn
(7.3€ mn as at 31/12/2014)
•Core Business revenues € 125.9 mn
(+4.5% vs 31/12/2014)
•Core business FFO per share*
€0.056
•EBITDA margin (core business) 67.3%
( +1.5 pts. vs 31/12/2014)
•Dividend per share
€0.04
(0.035 div adj. 2014)
*calculated on the year-end no. of shares
5
03 March 2016 FY2015 Results Presentation
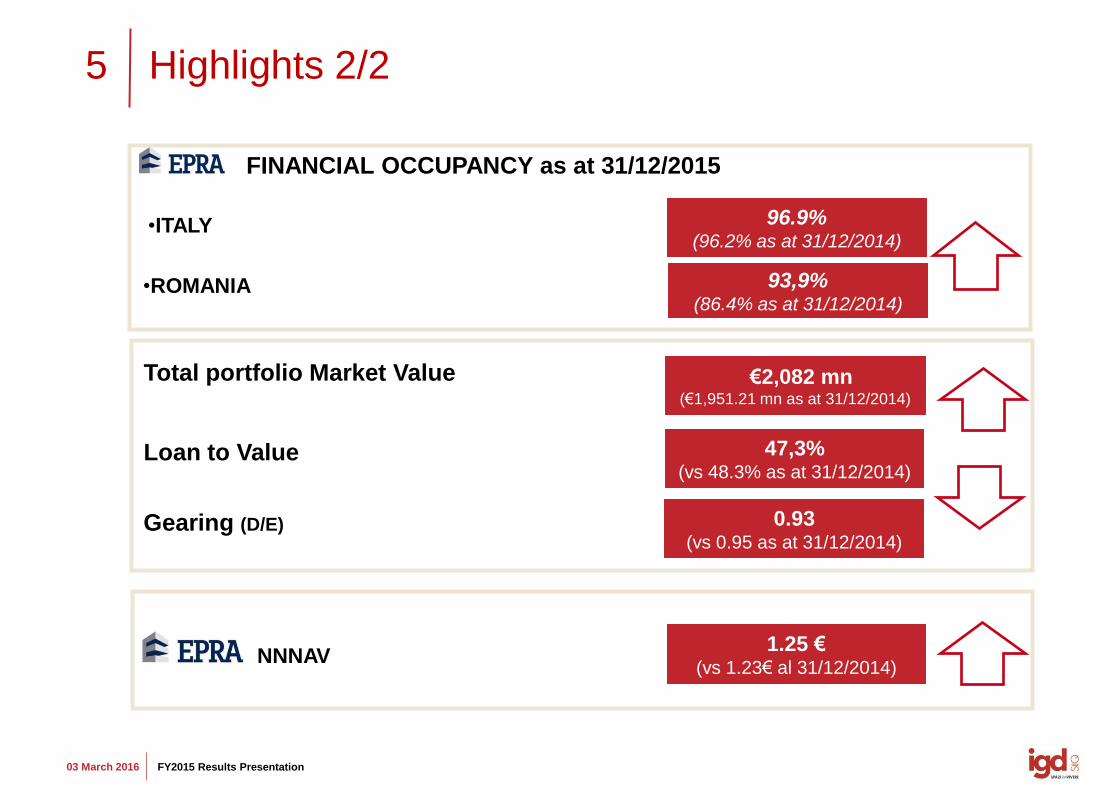
FINANCIAL OCCUPANCY as at 31/12/2015
Highlights 2/2
€2,082 mn (€1,951.21 mn as at 31/12/2014)
•ITALY
•ROMANIA
96.9% (96.2% as at 31/12/2014)
93,9% (86.4% as at 31/12/2014)
Total portfolio Market Value
47,3% (vs 48.3% as at 31/12/2014)
Loan to Value
0.93 (vs 0.95 as at 31/12/2014)
Gearing (D/E)
NNNAV 1.25 €
(vs 1.23€ al 31/12/2014)
ECONOMIC CONTEXT
7
03 March 2016 FY2015 Results Presentation
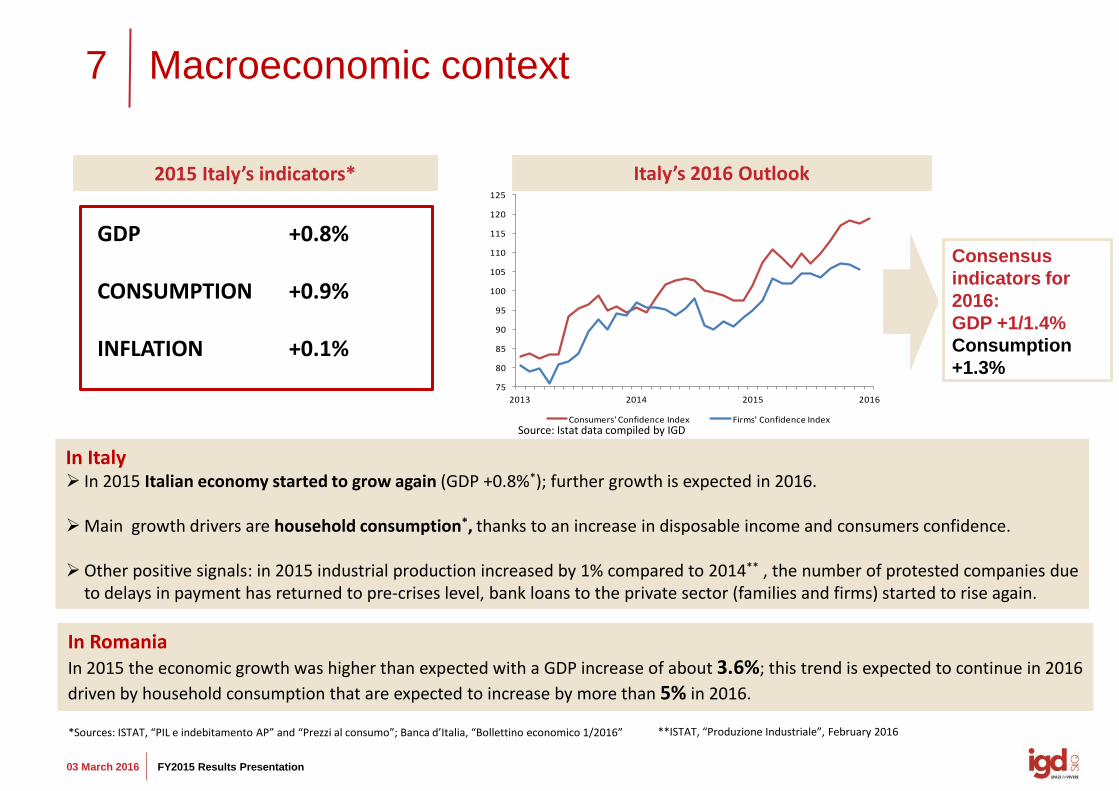
In Romania In 2015 the economic growth was higher than expected with a GDP increase of about 3.6%; this trend is expected to continue in 2016
driven by household consumption that are expected to increase by more than 5% in 2016.
75
80
85
90
95
100
105
110
115
120
125
2013 2014 2015 2016
Consumers' Confidence Index Firms' Confidence Index
Consensus
indicators for
2016:
GDP +1/1.4%
Consumption
+1.3%
Macroeconomic context
2015 Italy’s indicators*
In Italy In 2015 Italian economy started to grow again (GDP +0.8%*); further growth is expected in 2016. Main growth drivers are household consumption*, thanks to an increase in disposable income and consumers confidence.
Other positive signals: in 2015 industrial production increased by 1% compared to 2014** , the number of protested companies due
to delays in payment has returned to pre-crises level, bank loans to the private sector (families and firms) started to rise again.
Italy’s 2016 Outlook
GDP +0.8% CONSUMPTION +0.9%
INFLATION +0.1%
**ISTAT, “Produzione Industriale”, February 2016
Source: Istat data compiled by IGD
*Sources: ISTAT, “PIL e indebitamento AP” and “Prezzi al consumo”; Banca d’Italia, “Bollettino economico 1/2016”
8
03 March 2016 FY2015 Results Presentation
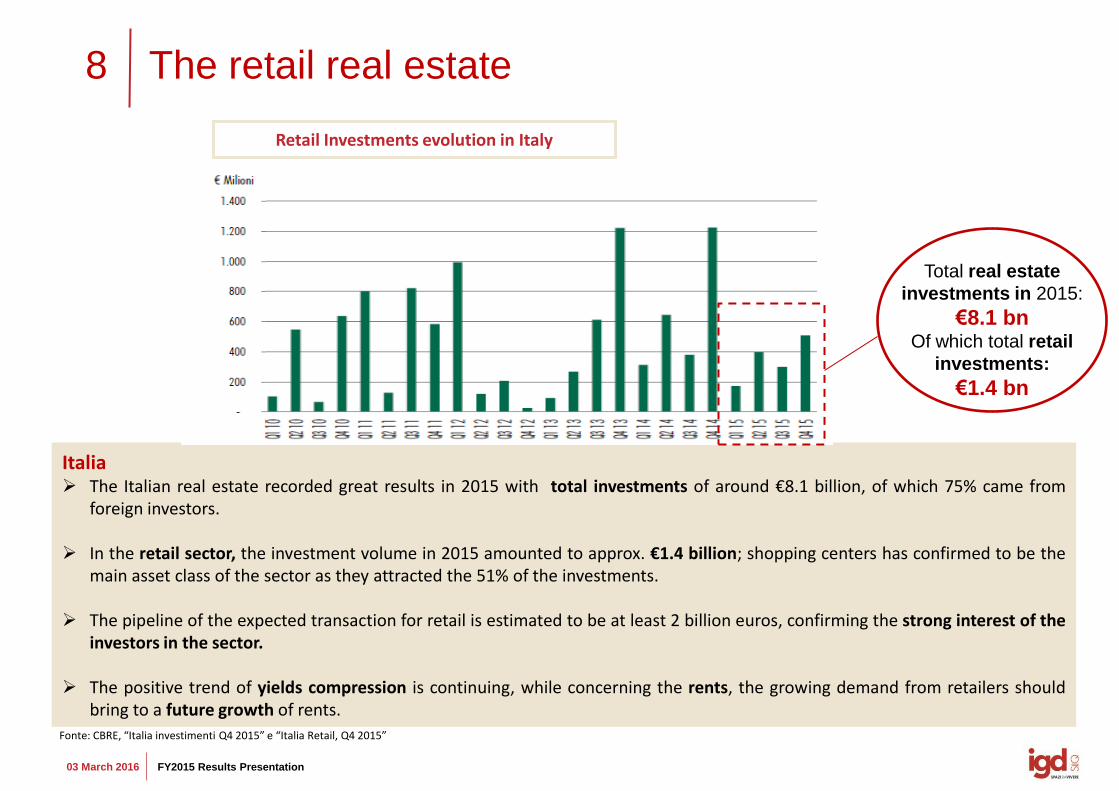
Italia The Italian real estate recorded great results in 2015 with total investments of around €8.1 billion, of which 75% came from
foreign investors.
In the retail sector, the investment volume in 2015 amounted to approx. €1.4 billion; shopping centers has confirmed to be the main asset class of the sector as they attracted the 51% of the investments.
The pipeline of the expected transaction for retail is estimated to be at least 2 billion euros, confirming the strong interest of the
investors in the sector. The positive trend of yields compression is continuing, while concerning the rents, the growing demand from retailers should
bring to a future growth of rents.
The retail real estate
Retail Investments evolution in Italy
Total real estate
investments in 2015:
€8.1 bn Of which total retail
investments:
€1.4 bn
Fonte: CBRE, “Italia investimenti Q4 2015” e “Italia Retail, Q4 2015”

ECONOMIC AND
FINANCIAL RESULTS
10
03 March 2016 FY2015 Results Presentation
115,346120,789
5,1415,0851,6452,289274
353
CONS 2014 CONS 2015
Core business revenues from rental act.
Revenues from services
Revenues from trading
Non-core business revenues from rental act.
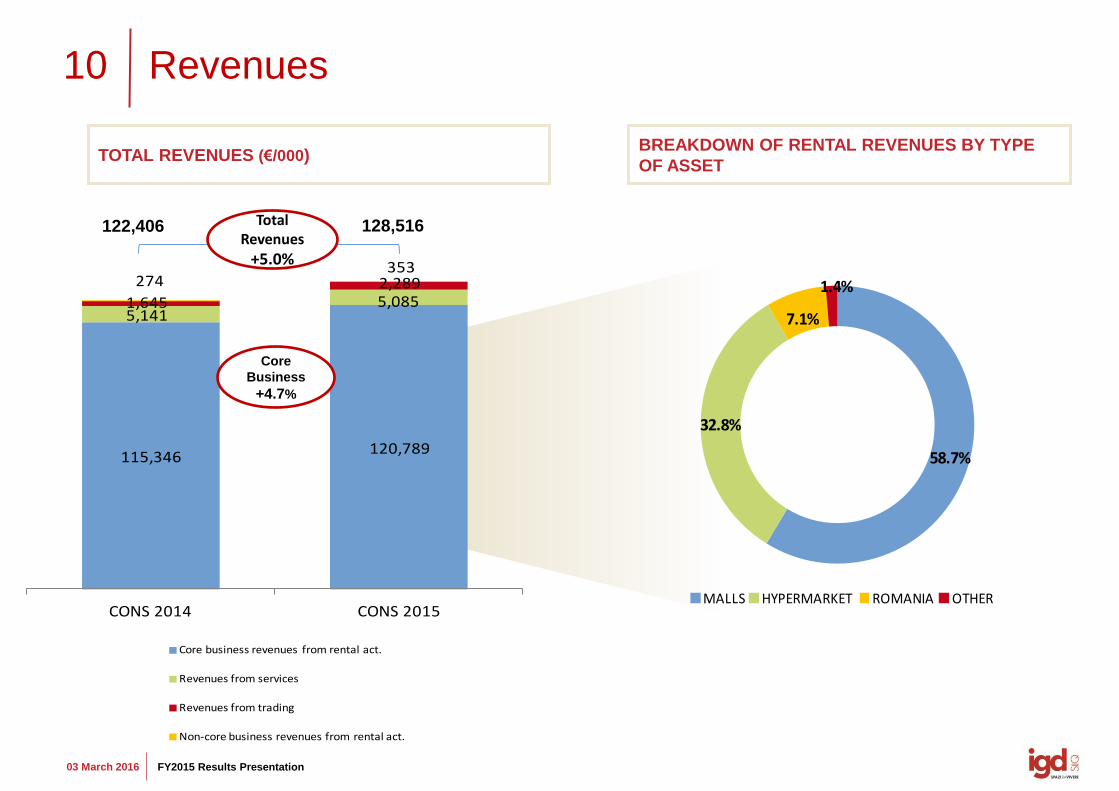
Revenues
TOTAL REVENUES (€/000)
Total Revenues
+5.0%
122,406 128,516
BREAKDOWN OF RENTAL REVENUES BY TYPE
OF ASSET
Core
Business
+4.7%
58.7%
32.8%
7.1%
1.4%
MALLS HYPERMARKET ROMANIA OTHER
11
03 March 2016 FY2015 Results Presentation
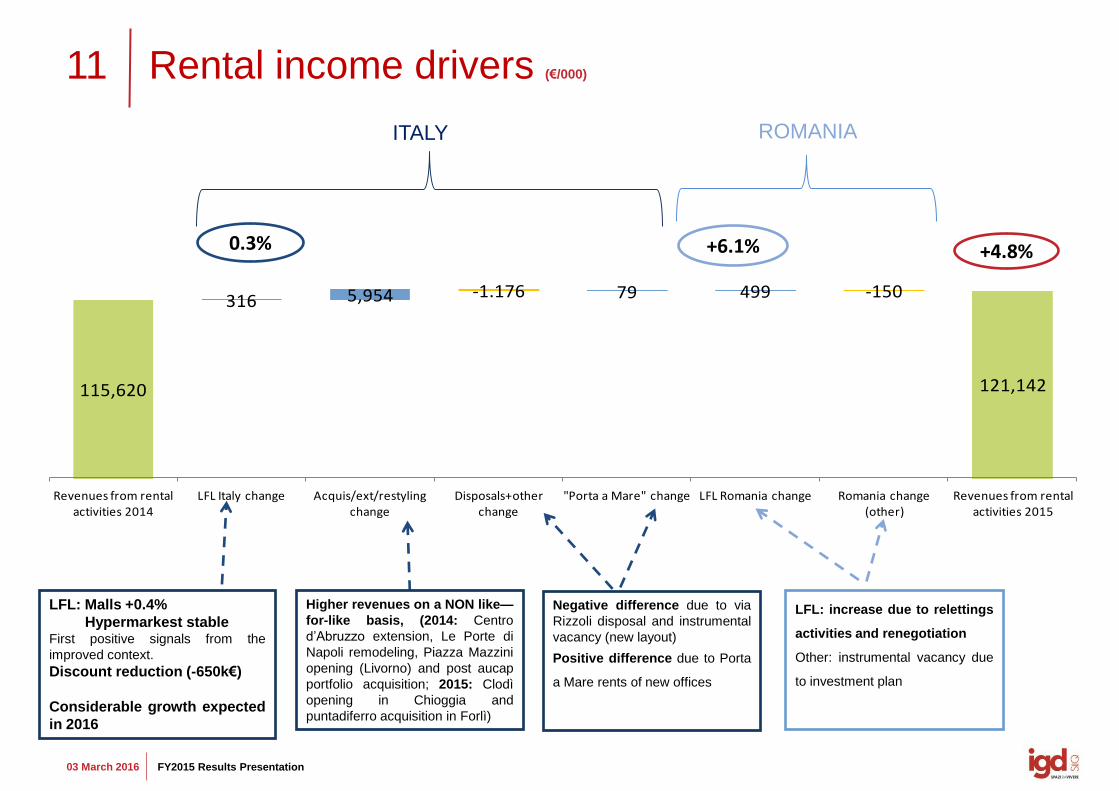
Rental income drivers (€/000)
+6.1% 0.3% +4.8%
LFL: increase due to relettings
activities and renegotiation
Other: instrumental vacancy due
to investment plan
LFL: Malls +0.4%
Hypermarkest stable First positive signals from the
improved context.
Discount reduction (-650k€)
Considerable growth expected
in 2016
ITALY ROMANIA
Negative difference due to via
Rizzoli disposal and instrumental
vacancy (new layout)
Positive difference due to Porta
a Mare rents of new offices
Higher revenues on a NON like—
for-like basis, (2014: Centro
d’Abruzzo extension, Le Porte di
Napoli remodeling, Piazza Mazzini
opening (Livorno) and post aucap
portfolio acquisition; 2015: Clodì
opening in Chioggia and
puntadiferro acquisition in Forlì)
115,620
316 5,954 -1.176 79 499 -150
121,142
Revenues from rental activities 2014
LFL Italy change Acquis/ext/restyling change
Disposals+other change
"Porta a Mare" change LFL Romania change Romania change (other)
Revenues from rental activities 2015
12
03 March 2016 FY2015 Results Presentation
44,792
39,392
CONS. 14 CONS. 15
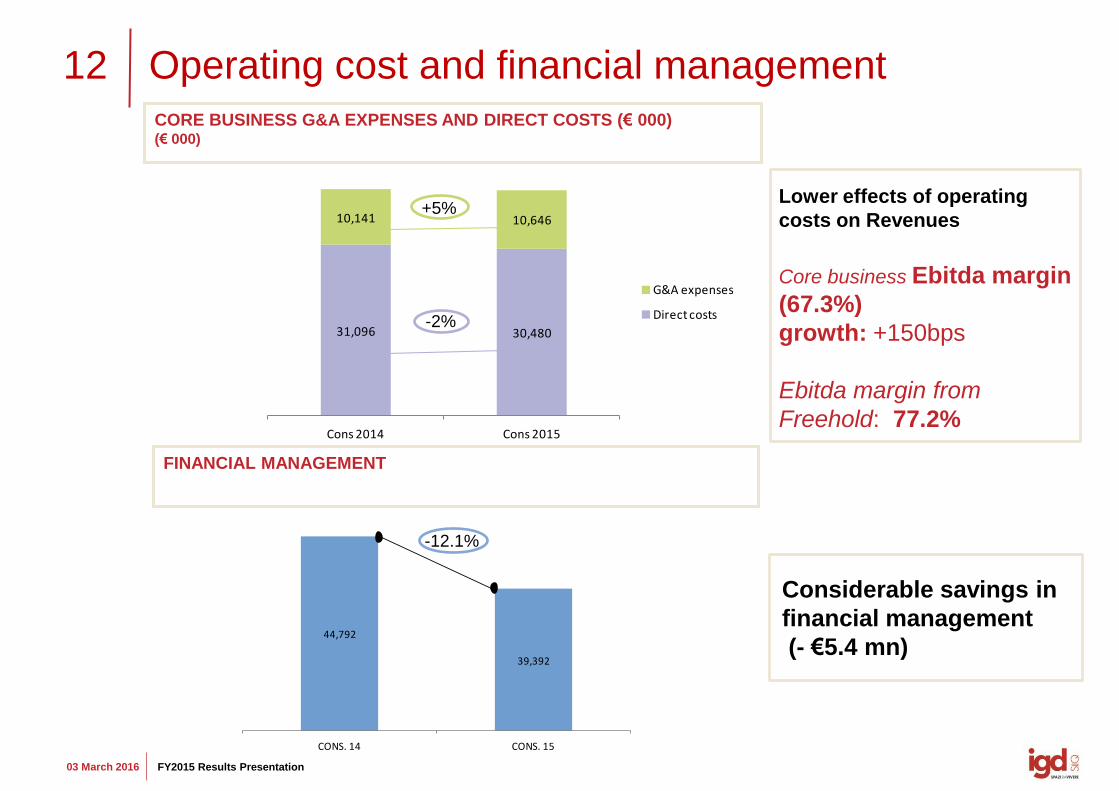
Operating cost and financial management
CORE BUSINESS G&A EXPENSES AND DIRECT COSTS (€ 000) (€ 000)
FINANCIAL MANAGEMENT
31,096 30,480
10,141 10,646
Cons 2014 Cons 2015
G&A expenses
Direct costs-2%
-12.1%
+5% Lower effects of operating
costs on Revenues
Core business Ebitda margin
(67.3%)
growth: +150bps
Ebitda margin from
Freehold: 77.2%
Considerable savings in
financial management
(- €5.4 mn)
13
03 March 2016 FY2015 Results Presentation
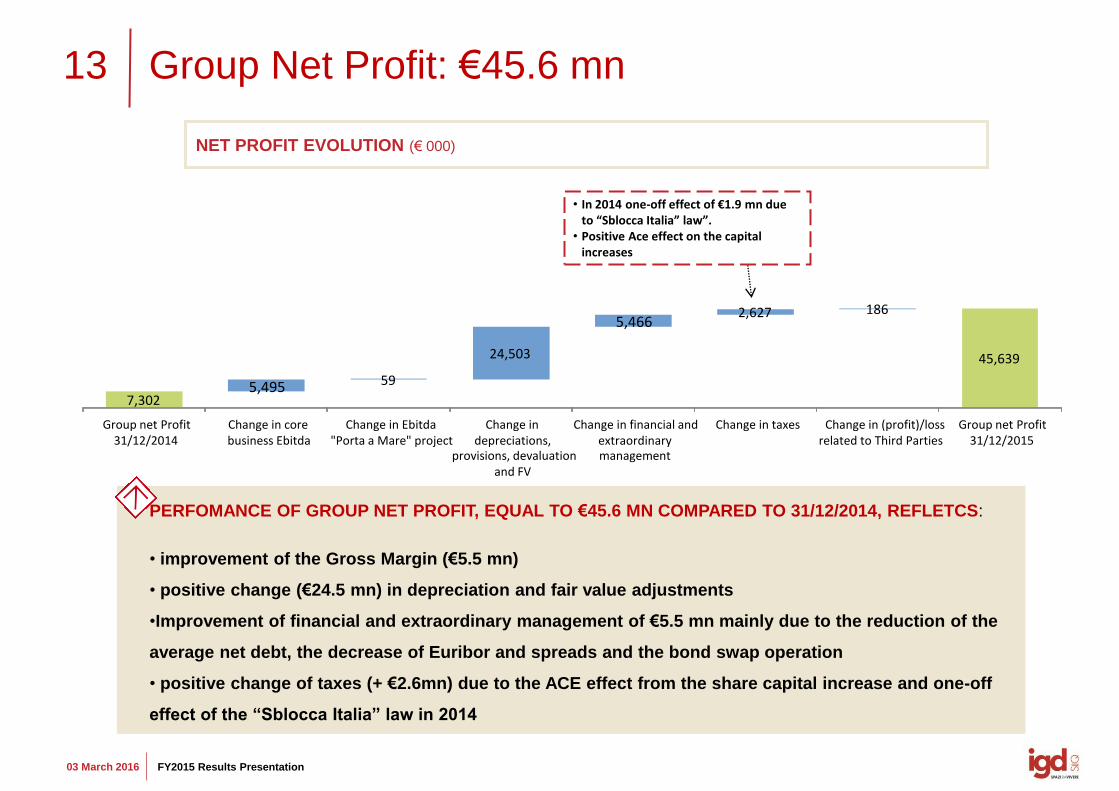
Group Net Profit: €45.6 mn
NET PROFIT EVOLUTION (€ 000)
• In 2014 one-off effect of €1.9 mn due to “Sblocca Italia” law”.
• Positive Ace effect on the capital increases
PERFOMANCE OF GROUP NET PROFIT, EQUAL TO €45.6 MN COMPARED TO 31/12/2014, REFLETCS:
• improvement of the Gross Margin (€5.5 mn)
• positive change (€24.5 mn) in depreciation and fair value adjustments
•Improvement of financial and extraordinary management of €5.5 mn mainly due to the reduction of the
average net debt, the decrease of Euribor and spreads and the bond swap operation
• positive change of taxes (+ €2.6mn) due to the ACE effect from the share capital increase and one-off
effect of the “Sblocca Italia” law in 2014
7,302 5,495 59
24,503
5,466 2,627 186
45,639
Group net Profit 31/12/2014
Change in core business Ebitda
Change in Ebitda "Porta a Mare" project
Change in depreciations,
provisions, devaluation and FV
Change in financial and extraordinary management
Change in taxes Change in (profit)/loss related to Third Parties
Group net Profit 31/12/2015
14
03 March 2016 FY2015 Results Presentation
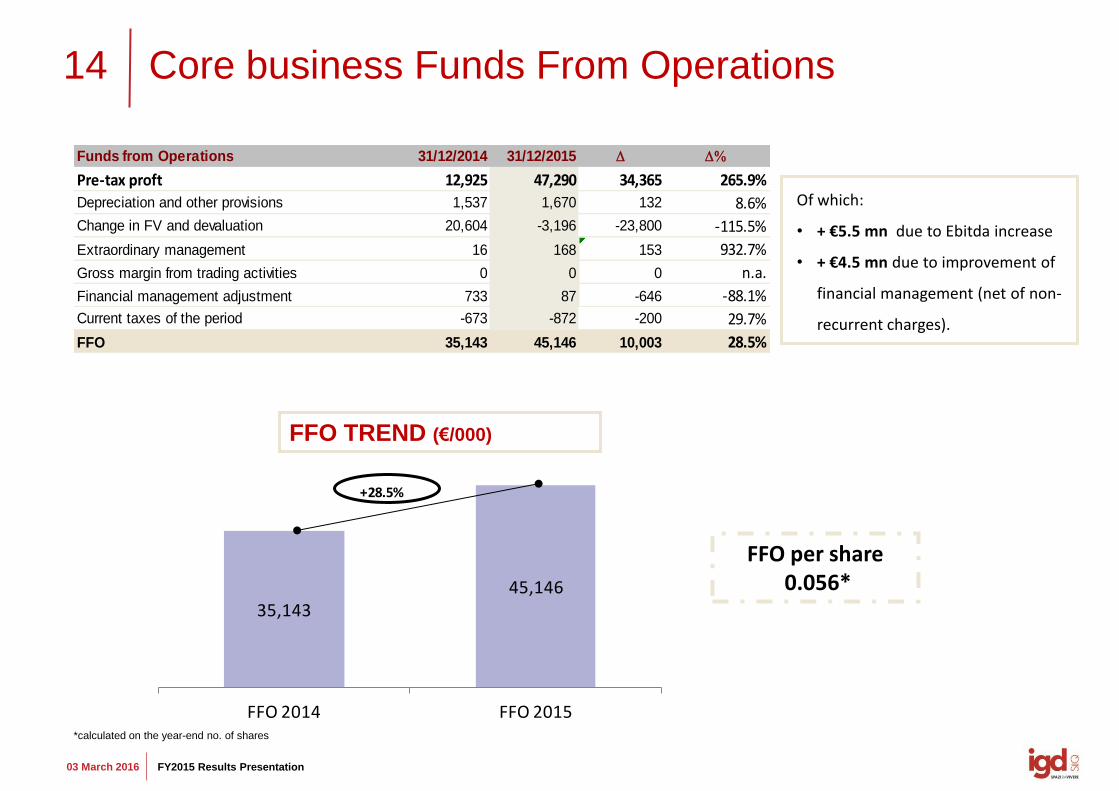
Core business Funds From Operations
Of which:
• + €5.5 mn due to Ebitda increase
• + €4.5 mn due to improvement of
financial management (net of non-
recurrent charges).
FFO per share 0.056*
Funds from Operations 31/12/2014 31/12/2015 D D%
Pre-tax proft 12,925 47,290 34,365 265.9%
Depreciation and other provisions 1,537 1,670 132 8.6%
Change in FV and devaluation 20,604 -3,196 -23,800 -115.5%
Extraordinary management 16 168 153 932.7%
Gross margin from trading activities 0 0 0 n.a.
Financial management adjustment 733 87 -646 -88.1%
Current taxes of the period -673 -872 -200 29.7%
FFO 35,143 45,146 10,003 28.5%
35,14345,146
FFO 2014 FFO 2015
+28.5%
FFO TREND (€/000)
*calculated on the year-end no. of shares
OPERATING
PERFORMANCE
16
03 March 2016 FY2015 Results Presentation
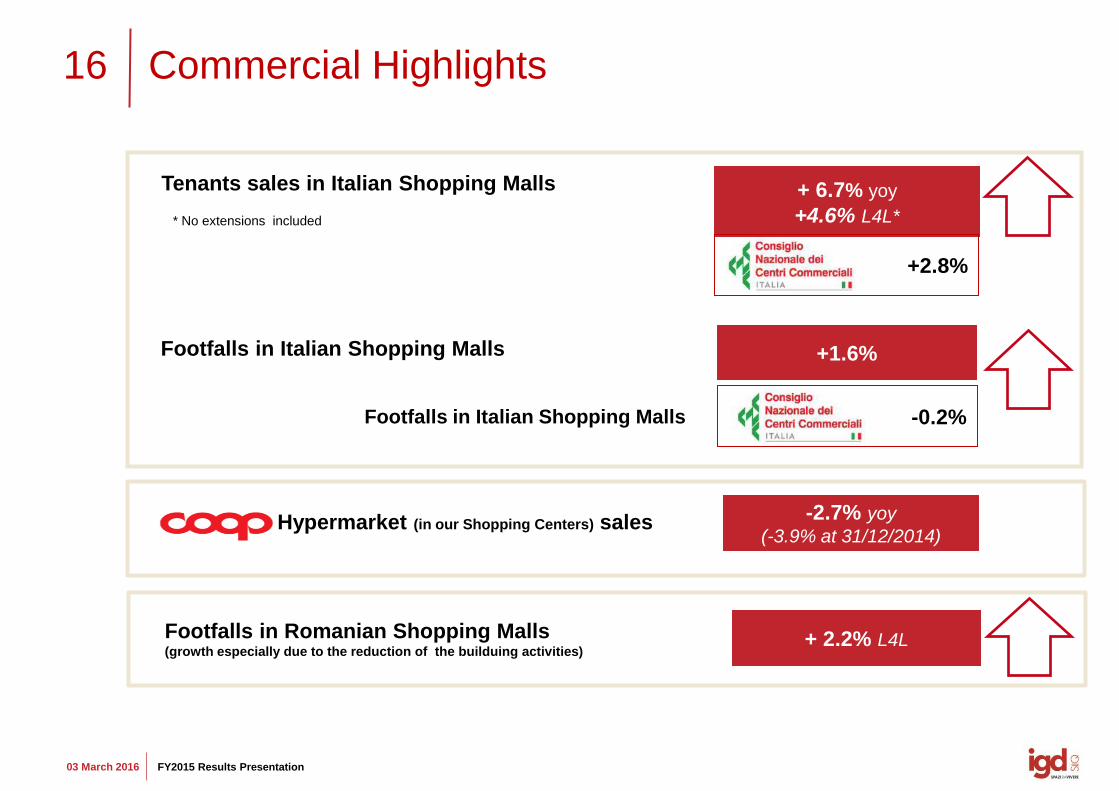
Commercial Highlights
+ 6.7% yoy
+4.6% L4L*
Tenants sales in Italian Shopping Malls
Footfalls in Romanian Shopping Malls (growth especially due to the reduction of the builduing activities)
+ 2.2% L4L
* No extensions included
+1.6% Footfalls in Italian Shopping Malls
Footfalls in Italian Shopping Malls -0.2%
-2.7% yoy
(-3.9% at 31/12/2014) Hypermarket (in our Shopping Centers) sales
+2.8%
17
03 March 2016 FY2015 Results Presentation
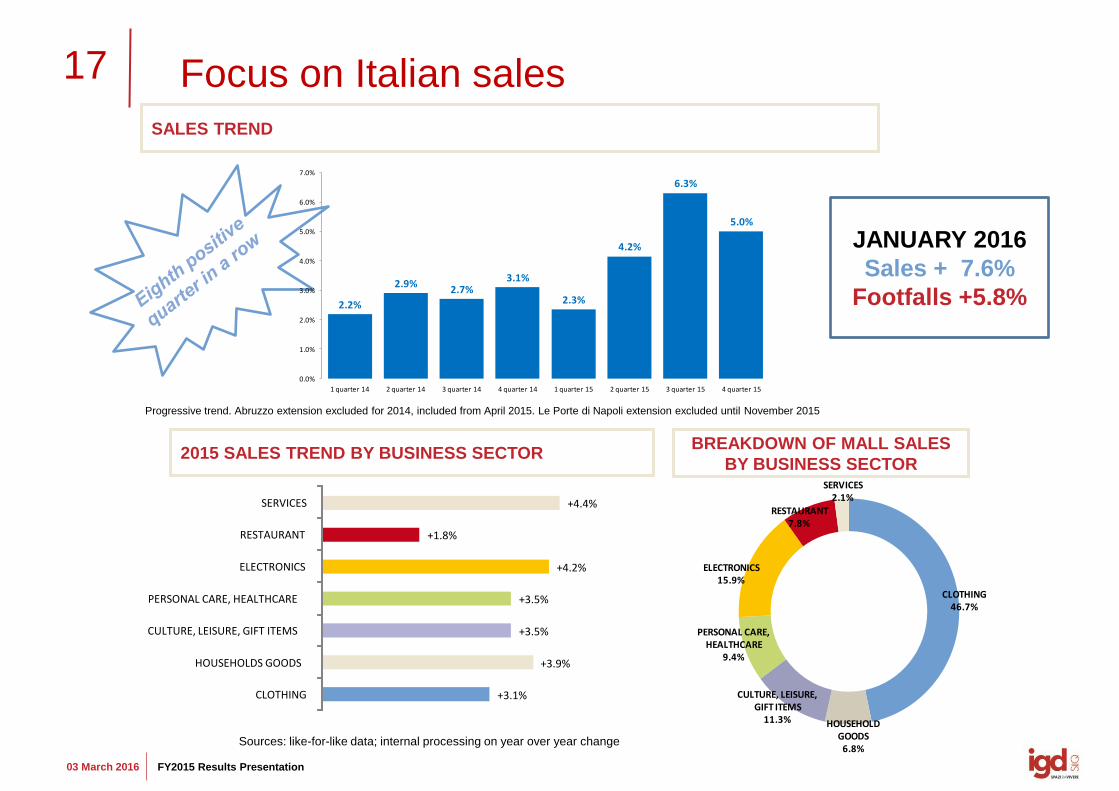
Focus on Italian sales
2015 SALES TREND BY BUSINESS SECTOR BREAKDOWN OF MALL SALES
BY BUSINESS SECTOR
Sources: like-for-like data; internal processing on year over year change
SALES TREND
Progressive trend. Abruzzo extension excluded for 2014, included from April 2015. Le Porte di Napoli extension excluded until November 2015
CLOTHING 46.7%
HOUSEHOLD GOODS
6.8%
CULTURE, LEISURE, GIFT ITEMS
11.3%
PERSONAL CARE, HEALTHCARE
9.4%
ELECTRONICS15.9%
RESTAURANT7.8%
SERVICES2.1%
2.2%
2.9%2.7%
3.1%
2.3%
4.2%
6.3%
5.0%
0.0%
1.0%
2.0%
3.0%
4.0%
5.0%
6.0%
7.0%
1 quarter 14 2 quarter 14 3 quarter 14 4 quarter 14 1 quarter 15 2 quarter 15 3 quarter 15 4 quarter 15
JANUARY 2016
Sales + 7.6%
Footfalls +5.8%
+3.1%
+3.9%
+3.5%
+3.5%
+4.2%
+1.8%
+4.4%
CLOTHING
HOUSEHOLDS GOODS
CULTURE, LEISURE, GIFT ITEMS
PERSONAL CARE, HEALTHCARE
ELECTRONICS
RESTAURANT
SERVICES
18
03 March 2016 FY2015 Results Presentation
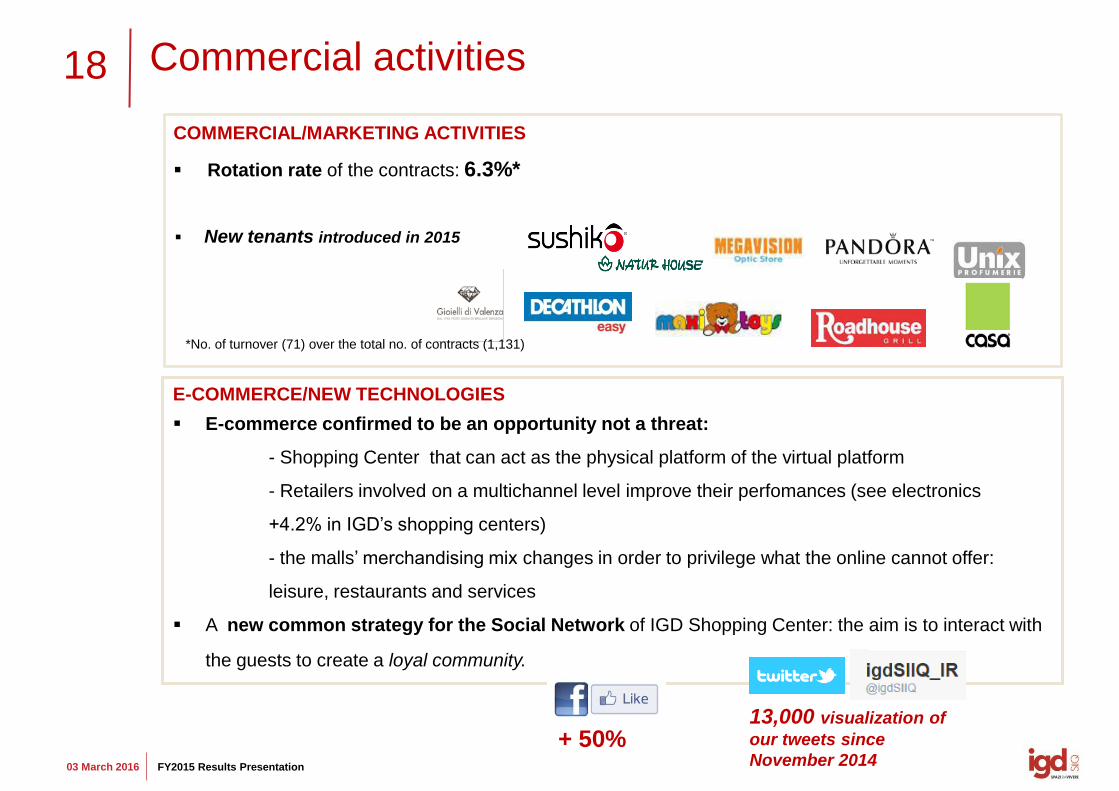
COMMERCIAL/MARKETING ACTIVITIES
Rotation rate of the contracts: 6.3%*
Commercial activities
E-COMMERCE/NEW TECHNOLOGIES
E-commerce confirmed to be an opportunity not a threat:
- Shopping Center that can act as the physical platform of the virtual platform
- Retailers involved on a multichannel level improve their perfomances (see electronics
+4.2% in IGD’s shopping centers)
- the malls’ merchandising mix changes in order to privilege what the online cannot offer:
leisure, restaurants and services
A new common strategy for the Social Network of IGD Shopping Center: the aim is to interact with
the guests to create a loyal community.
New tenants introduced in 2015
+ 50% 13,000 visualization of
our tweets since
November 2014
*No. of turnover (71) over the total no. of contracts (1,131)
19
03 March 2016 FY2015 Results Presentation
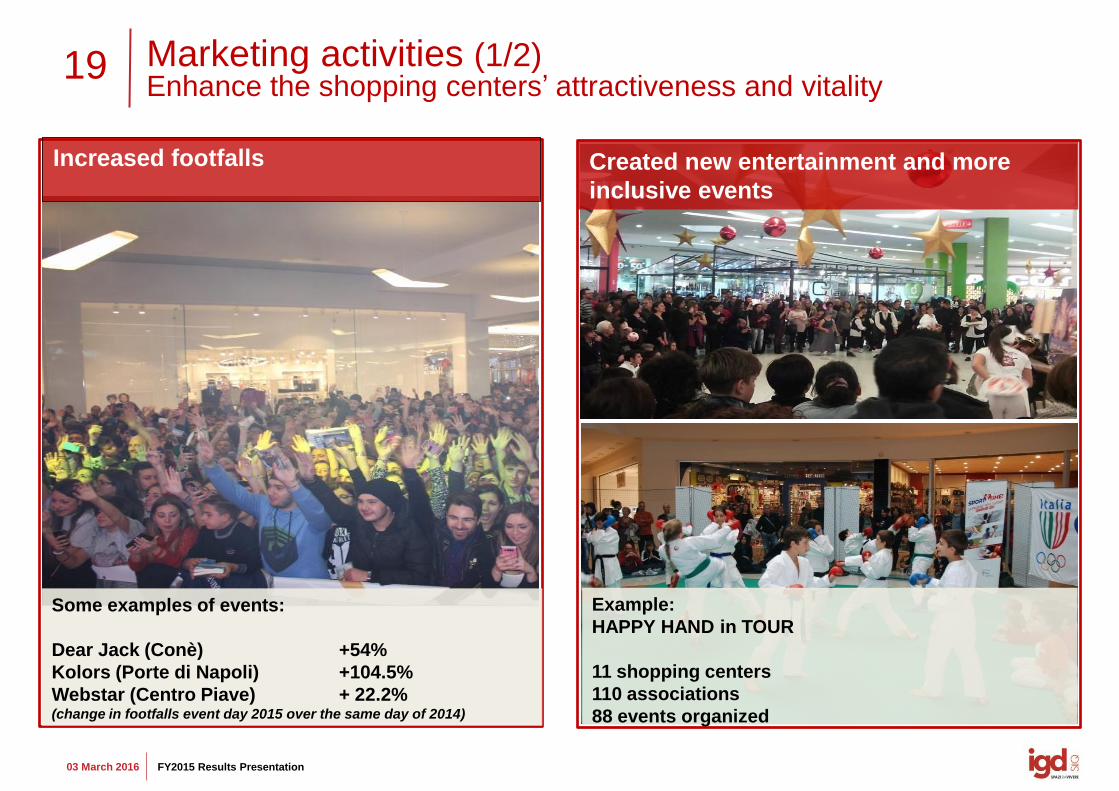
Some examples of events:
Dear Jack (Conè) +54%
Kolors (Porte di Napoli) +104.5%
Webstar (Centro Piave) + 22.2% (change in footfalls event day 2015 over the same day of 2014)
Increased footfalls Created new entertainment and more
inclusive events
Example:
HAPPY HAND in TOUR
11 shopping centers
110 associations
88 events organized
Marketing activities (1/2) Enhance the shopping centers’ attractiveness and vitality
20
03 March 2016 FY2015 Results Presentation
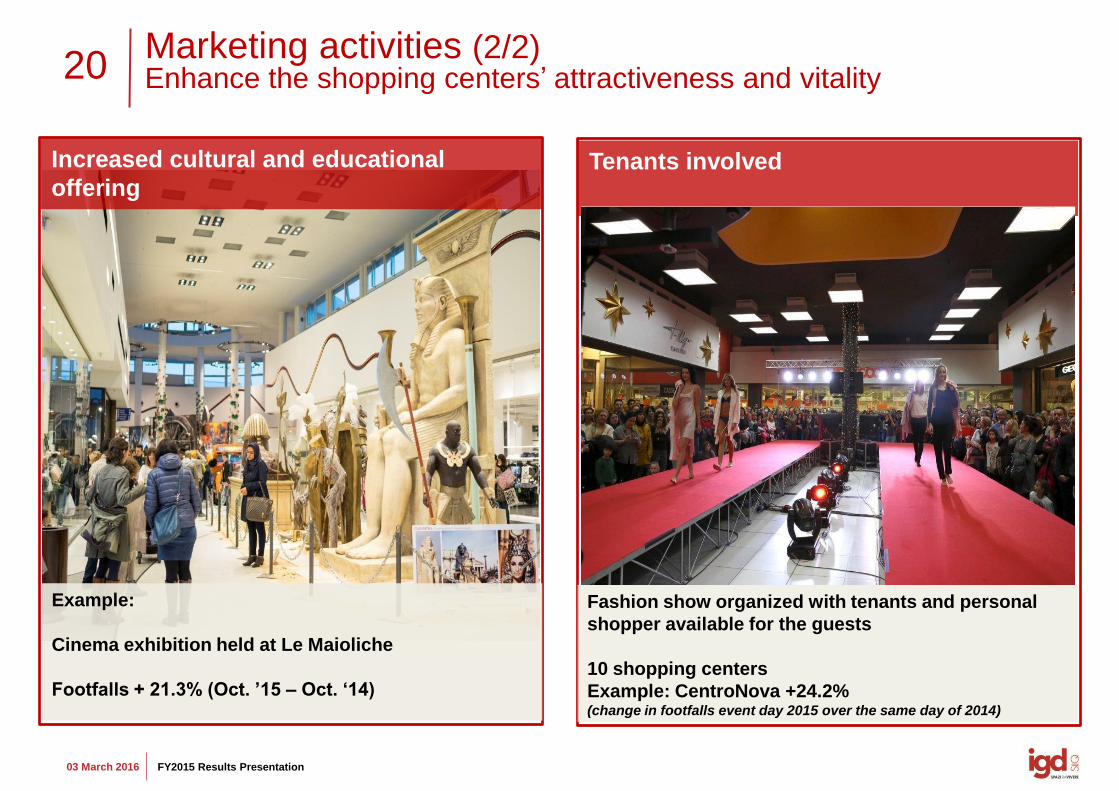
Example:
Cinema exhibition held at Le Maioliche
Footfalls + 21.3% (Oct. ’15 – Oct. ‘14)
Increased cultural and educational
offering Tenants involved
Fashion show organized with tenants and personal
shopper available for the guests
10 shopping centers
Example: CentroNova +24.2% (change in footfalls event day 2015 over the same day of 2014)
Marketing activities (2/2) Enhance the shopping centers’ attractiveness and vitality
21
03 March 2016 FY2015 Results Presentation
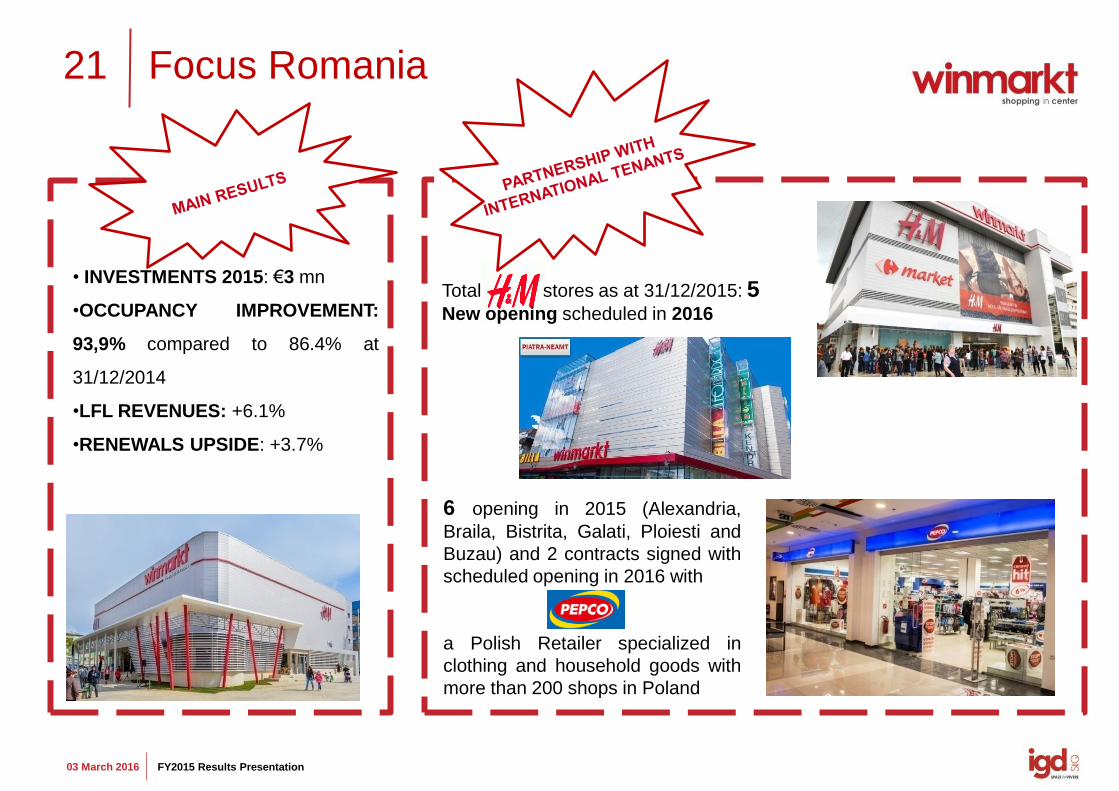
Focus Romania
• INVESTMENTS 2015: €3 mn
•OCCUPANCY IMPROVEMENT:
93,9% compared to 86.4% at
31/12/2014
•LFL REVENUES: +6.1%
•RENEWALS UPSIDE: +3.7%
Total stores as at 31/12/2015: 5 New opening scheduled in 2016
6 opening in 2015 (Alexandria,
Braila, Bistrita, Galati, Ploiesti and
Buzau) and 2 contracts signed with
scheduled opening in 2016 with
a Polish Retailer specialized in
clothing and household goods with
more than 200 shops in Poland
22
03 March 2016 FY2015 Results Presentation
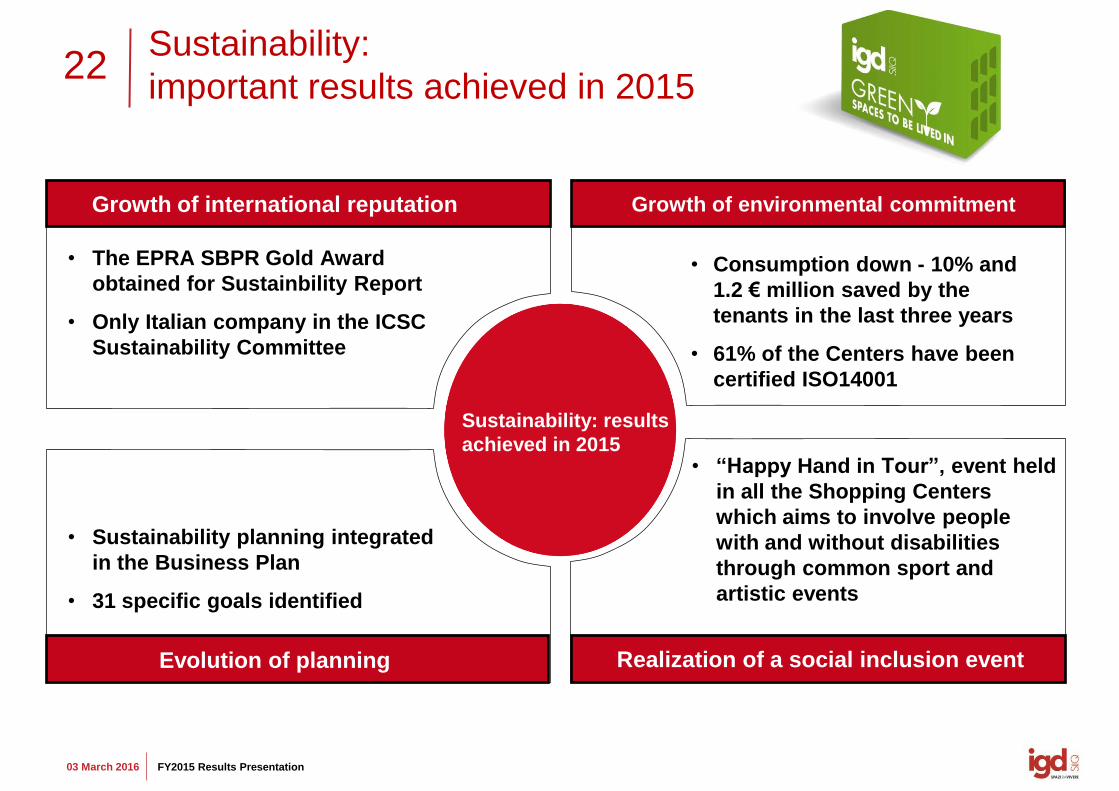
Sustainability:
important results achieved in 2015
Sustainability: results
achieved in 2015
• The EPRA SBPR Gold Award
obtained for Sustainbility Report
• Only Italian company in the ICSC
Sustainability Committee
• Sustainability planning integrated
in the Business Plan
• 31 specific goals identified
• Consumption down - 10% and
1.2 € million saved by the
tenants in the last three years
• 61% of the Centers have been
certified ISO14001
• “Happy Hand in Tour”, event held
in all the Shopping Centers
which aims to involve people
with and without disabilities
through common sport and
artistic events
Growth of international reputation
Evolution of planning
Growth of environmental commitment
Realization of a social inclusion event
PORTFOLIO
24
03 March 2016 FY2015 Results Presentation
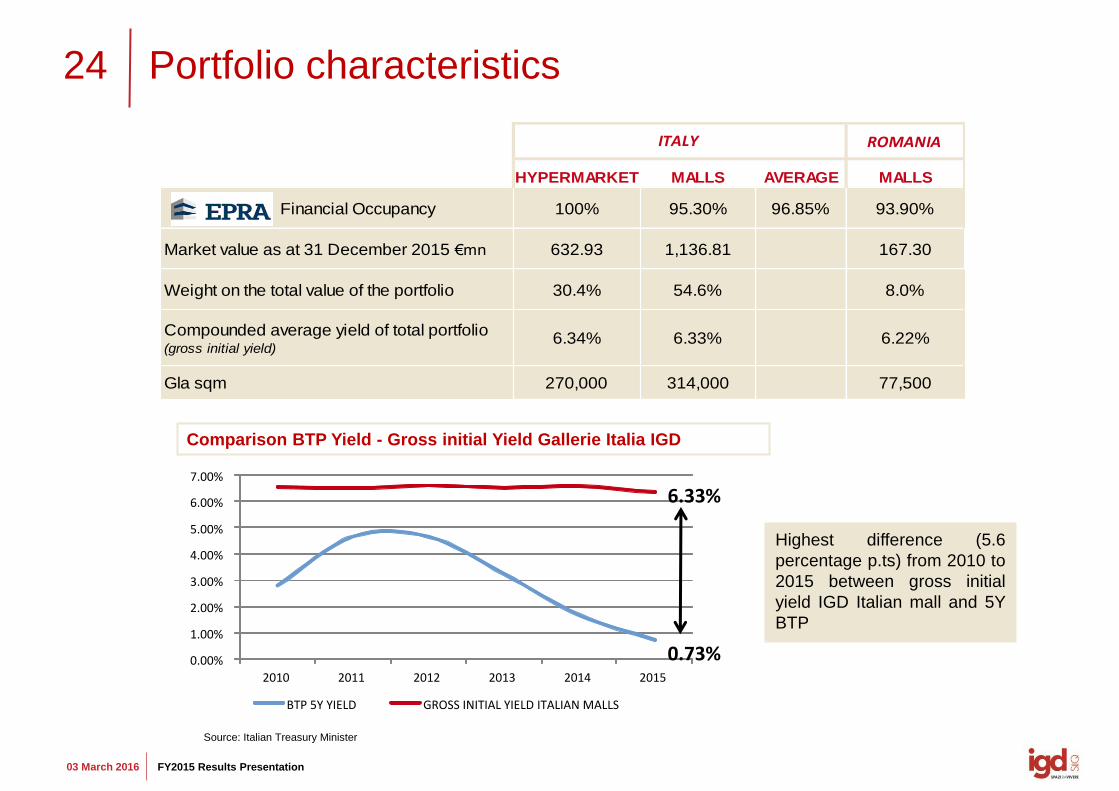
0.73%
6.33%
0.00%
1.00%
2.00%
3.00%
4.00%
5.00%
6.00%
7.00%
2010 2011 2012 2013 2014 2015
BTP 5Y YIELD GROSS INITIAL YIELD ITALIAN MALLS
Portfolio characteristics
Comparison BTP Yield - Gross initial Yield Gallerie Italia IGD
Highest difference (5.6
percentage p.ts) from 2010 to
2015 between gross initial
yield IGD Italian mall and 5Y
BTP
Source: Italian Treasury Minister
ROMANIA
HYPERMARKET MALLS AVERAGE MALLS
Financial Occupancy 100% 95.30% 96.85% 93.90%
Market value as at 31 December 2015 €mn 632.93 1,136.81 167.30
Weight on the total value of the portfolio 30.4% 54.6% 8.0%
Compounded average yield of total portfolio (gross initial yield)
6.34% 6.33% 6.22%
Gla sqm 270,000 314,000 77,500
ITALY
25
03 March 2016 FY2015 Results Presentation
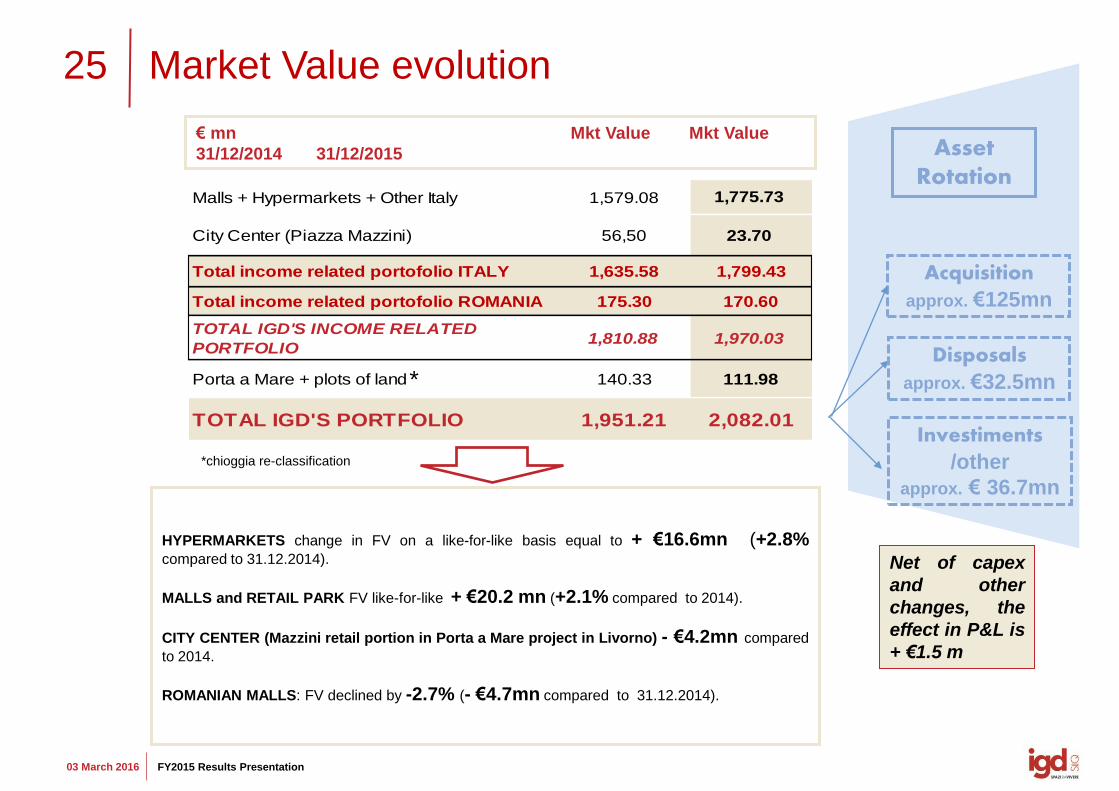
€ mn Mkt Value Mkt Value
31/12/2014 31/12/2015
Market Value evolution
HYPERMARKETS change in FV on a like-for-like basis equal to + €16.6mn (+2.8% compared to 31.12.2014).
MALLS and RETAIL PARK FV like-for-like + €20.2 mn (+2.1% compared to 2014).
CITY CENTER (Mazzini retail portion in Porta a Mare project in Livorno) - €4.2mn compared
to 2014.
ROMANIAN MALLS: FV declined by -2.7% (- €4.7mn compared to 31.12.2014).
Asset Rotation
Disposals
approx. €32.5mn
Investiments
/other
approx. € 36.7mn
Net of capex
and other
changes, the
effect in P&L is
+ €1.5 m
Acquisition
approx. €125mn
Malls + Hypermarkets + Other Italy 1,579.08 1,775.73
City Center (Piazza Mazzini) 56,50 23.70
Total income related portofolio ITALY 1,635.58 1,799.43
Total income related portofolio ROMANIA 175.30 170.60
TOTAL IGD'S INCOME RELATED
PORTFOLIO1,810.88 1,970.03
Porta a Mare + plots of land 140.33 111.98
TOTAL IGD'S PORTFOLIO 1,951.21 2,082.01
*
*chioggia re-classification
26
03 March 2016 FY2015 Results Presentation
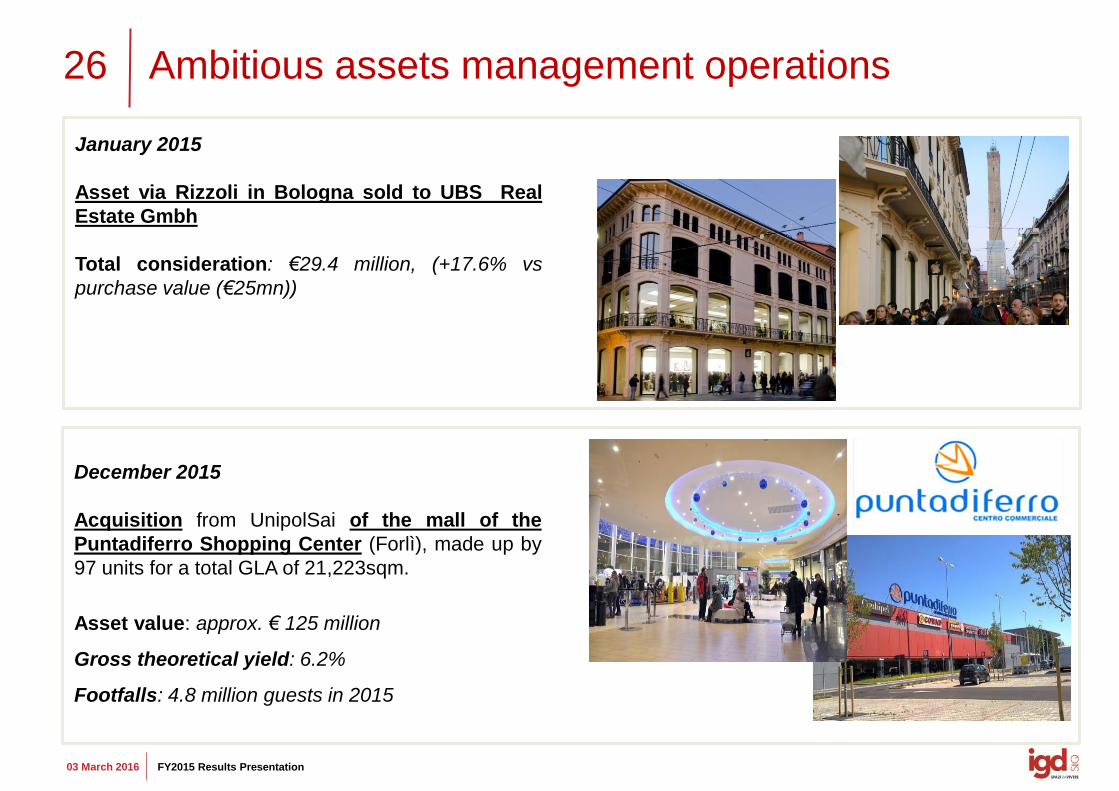
Ambitious assets management operations
January 2015
Asset via Rizzoli in Bologna sold to UBS Real
Estate Gmbh
Total consideration: €29.4 million, (+17.6% vs
purchase value (€25mn))
December 2015
Acquisition from UnipolSai of the mall of the
Puntadiferro Shopping Center (Forlì), made up by
97 units for a total GLA of 21,223sqm.
Asset value: approx. € 125 million
Gross theoretical yield: 6.2%
Footfalls: 4.8 million guests in 2015
27
03 March 2016 FY2015 Results Presentation
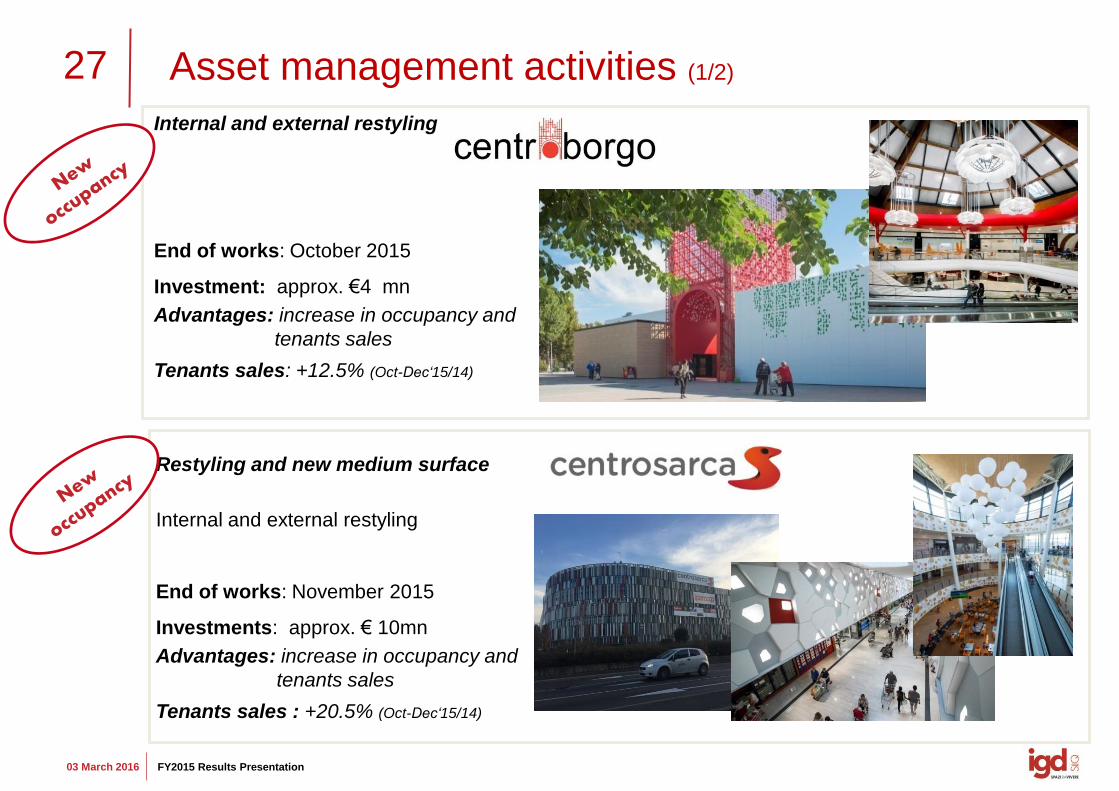
Asset management activities (1/2)
Internal and external restyling
End of works: October 2015
Investment: approx. €4 mn
Advantages: increase in occupancy and
tenants sales
Tenants sales: +12.5% (Oct-Dec‘15/14)
Restyling and new medium surface
Internal and external restyling
End of works: November 2015
Investments: approx. € 10mn
Advantages: increase in occupancy and
tenants sales
Tenants sales : +20.5% (Oct-Dec‘15/14)
28
03 March 2016 FY2015 Results Presentation
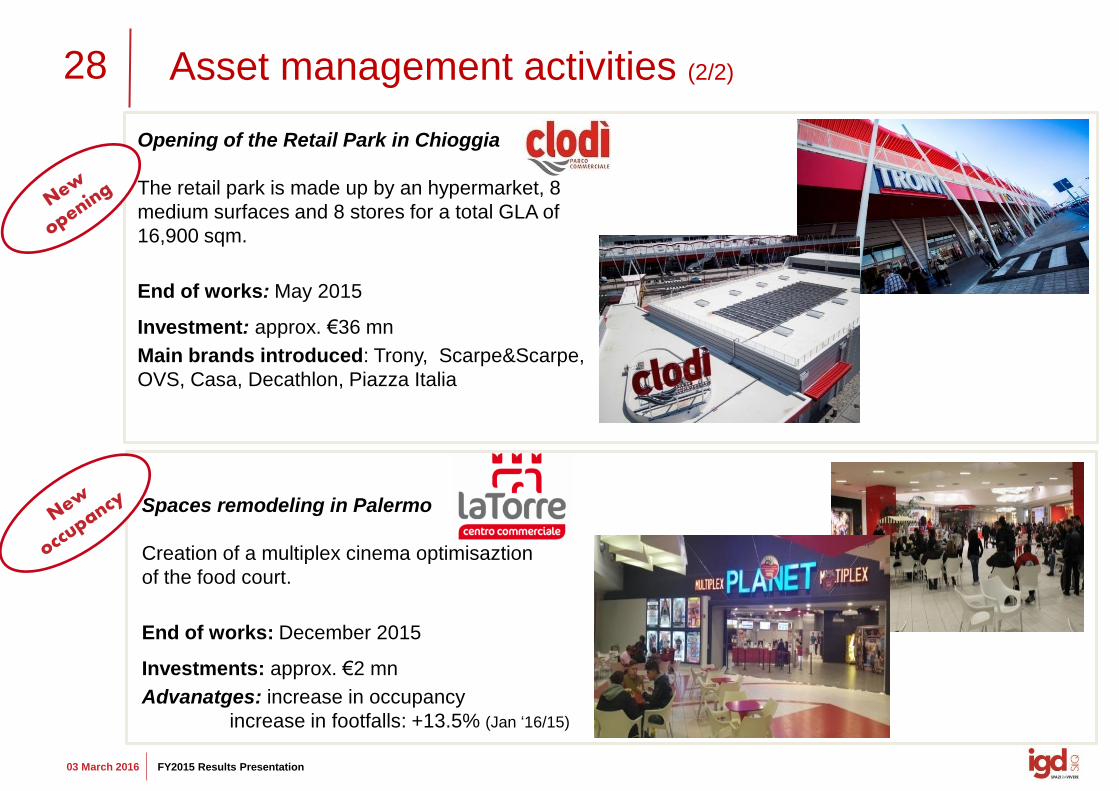
Asset management activities (2/2)
Opening of the Retail Park in Chioggia
The retail park is made up by an hypermarket, 8
medium surfaces and 8 stores for a total GLA of
16,900 sqm.
End of works: May 2015
Investment: approx. €36 mn
Main brands introduced: Trony, Scarpe&Scarpe,
OVS, Casa, Decathlon, Piazza Italia
Spaces remodeling in Palermo
Creation of a multiplex cinema optimisaztion
of the food court.
End of works: December 2015
Investments: approx. €2 mn
Advanatges: increase in occupancy
increase in footfalls: +13.5% (Jan ‘16/15)
29
03 March 2016 FY2015 Results Presentation
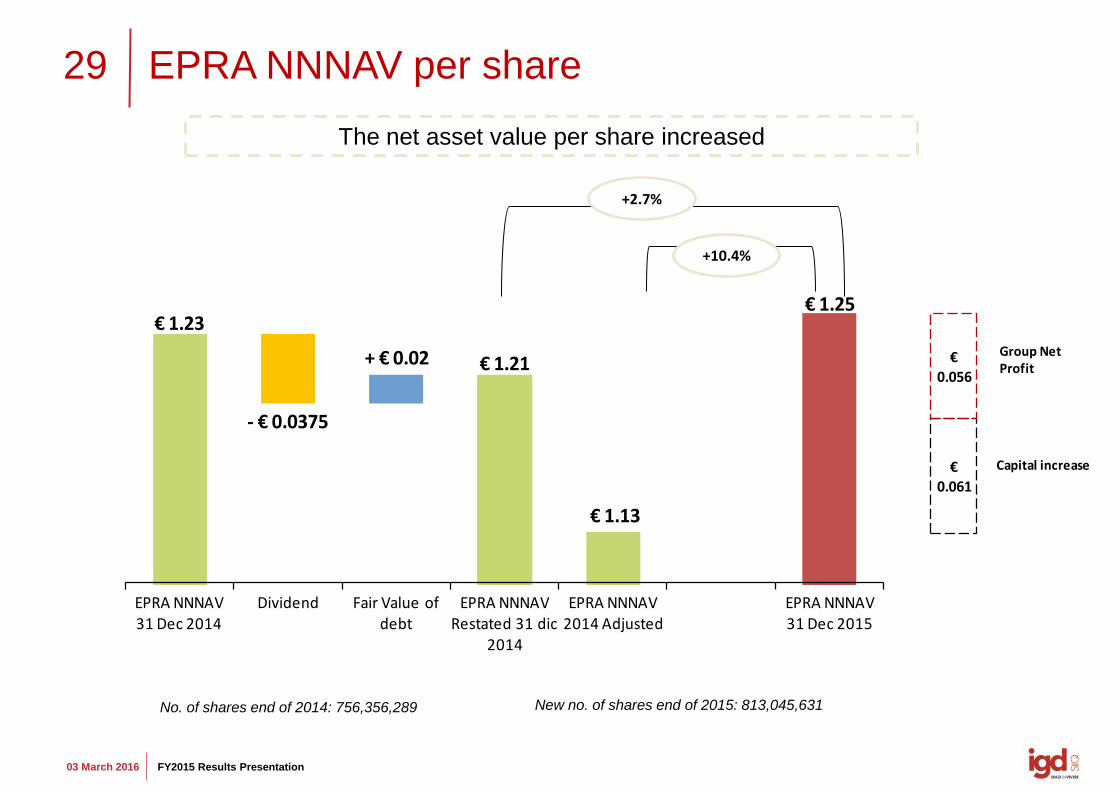
€ 1.23
- € 0.0375
+ € 0.02 € 1.21
€ 1.13
€ 1.25
EPRA NNNAV 31 Dec 2014
Dividend Fair Value of debt
EPRA NNNAV Restated 31 dic
2014
EPRA NNNAV 2014 Adjusted
EPRA NNNAV 31 Dec 2015
€0.061
€0.056
Group Net Profit
Capital increase
EPRA NNNAV per share
+10.4%
+2.7%
The net asset value per share increased
No. of shares end of 2014: 756,356,289 New no. of shares end of 2015: 813,045,631
FINANCIAL STRUCTURE
31
03 March 2016 FY2015 Results Presentation
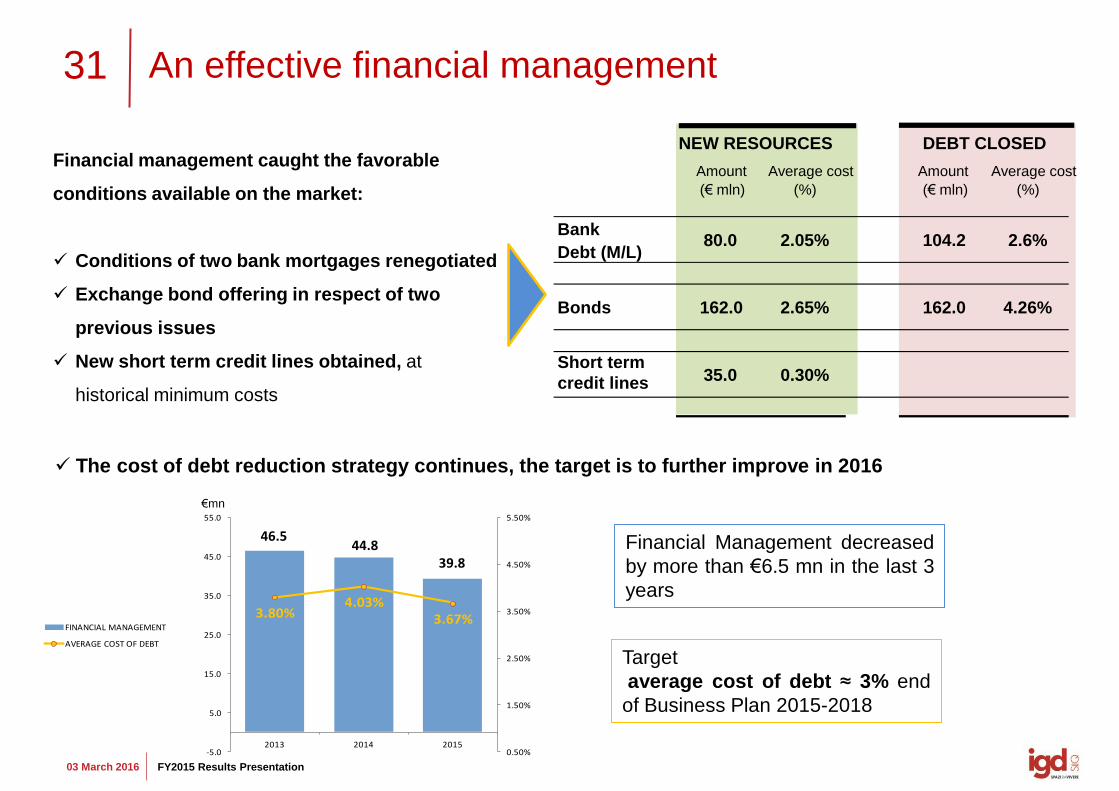
An effective financial management
Financial management caught the favorable
conditions available on the market:
Conditions of two bank mortgages renegotiated
Exchange bond offering in respect of two
previous issues
New short term credit lines obtained, at
historical minimum costs
The cost of debt reduction strategy continues, the target is to further improve in 2016
Target
average cost of debt ≈ 3% end
of Business Plan 2015-2018
€mn
3.80%4.03%
3.67%
0.50%
1.50%
2.50%
3.50%
4.50%
5.50%
-5.0
5.0
15.0
25.0
35.0
45.0
55.0
2013 2014 2015
FINANCIAL MANAGEMENT
AVERAGE COST OF DEBT
46.5 44.8
39.8
Financial Management decreased
by more than €6.5 mn in the last 3
years
Amount
(€ mln)
Average cost
(%)
Amount
(€ mln)
Average cost
(%)
Bank
Debt (M/L) 80.0 2.05% 104.2 2.6%
Bonds 162.0 2.65% 162.0 4.26%
Short term
credit lines 35.0 0.30%
NEW RESOURCES DEBT CLOSED
32
03 March 2016 FY2015 Results Presentation
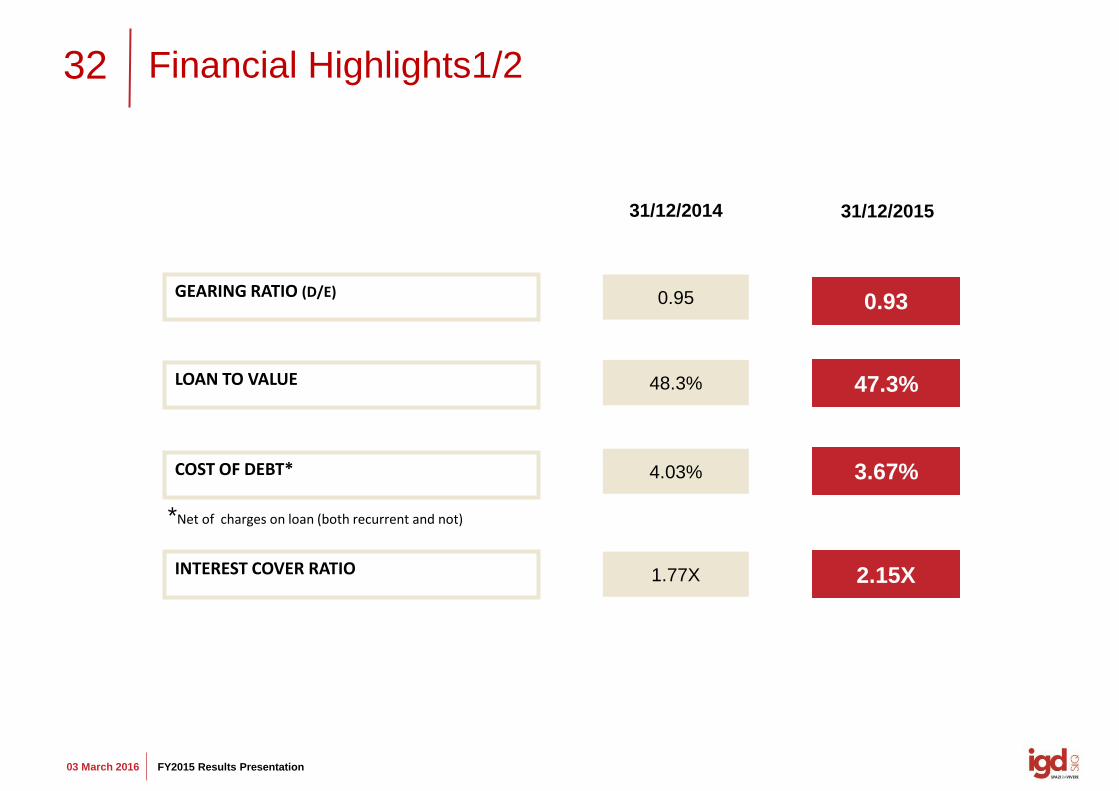
31/12/2014
Financial Highlights1/2
LOAN TO VALUE
31/12/2015
GEARING RATIO (D/E)
48.3%
0.95
47.3%
0.93
4.03% 3.67% COST OF DEBT*
1.77X 2.15X INTEREST COVER RATIO
*Net of charges on loan (both recurrent and not)
33
03 March 2016 FY2015 Results Presentation
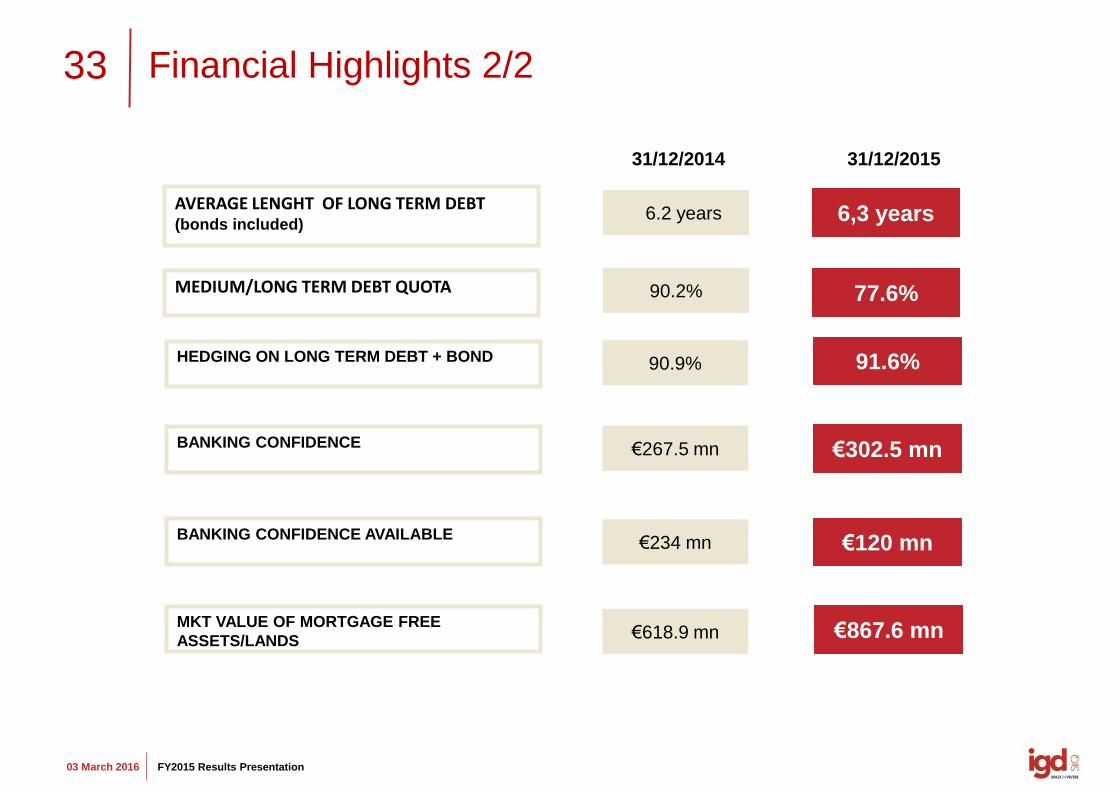
31/12/2014
Financial Highlights 2/2
31/12/2015
HEDGING ON LONG TERM DEBT + BOND 91.6%
€267.5 mn €302.5 mn BANKING CONFIDENCE
€234 mn €120 mn BANKING CONFIDENCE AVAILABLE
€618.9 mn €867.6 mn MKT VALUE OF MORTGAGE FREE
ASSETS/LANDS
90.9%
MEDIUM/LONG TERM DEBT QUOTA 90.2% 77.6%
AVERAGE LENGHT OF LONG TERM DEBT (bonds included)
6.2 years 6,3 years
34
03 March 2016 FY2015 Results Presentation
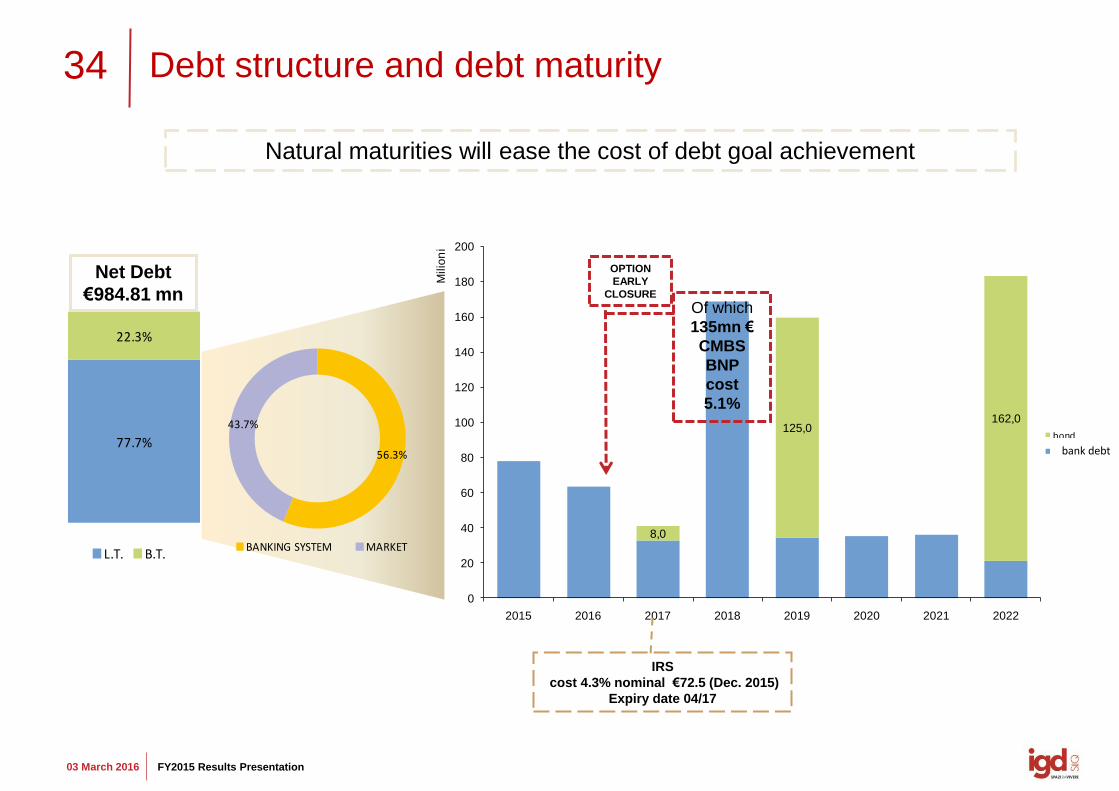
77.7%
22.3%
L.T. B.T.
Debt structure and debt maturity
Net Debt
€984.81 mn
56.3%
43.7%
BANKING SYSTEM MARKET8,0
125,0162,0
0
20
40
60
80
100
120
140
160
180
200
2015 2016 2017 2018 2019 2020 2021 2022
Milio
ni
bond
debito bancario
Of which
135mn €
CMBS
BNP
cost
5.1%
OPTION
EARLY
CLOSURE
bank debt
IRS
cost 4.3% nominal €72.5 (Dec. 2015)
Expiry date 04/17
Natural maturities will ease the cost of debt goal achievement
35
03 March 2016 FY2015 Results Presentation
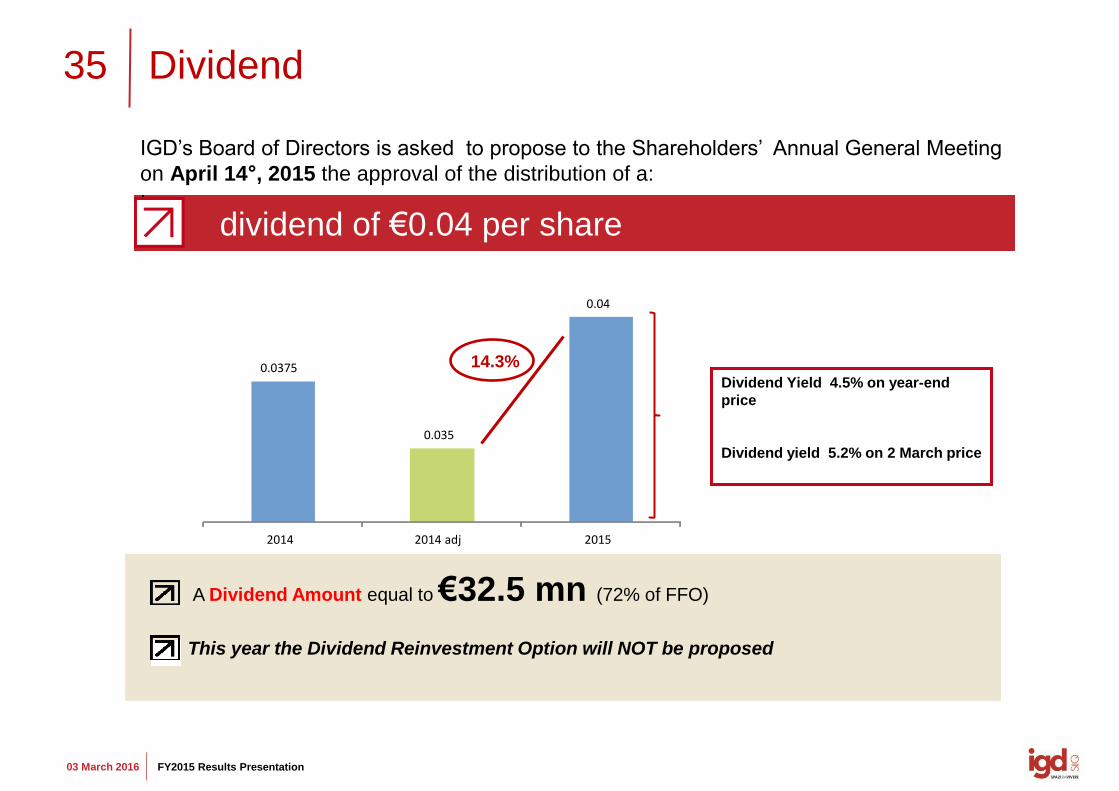
Dividend
dividend of €0.04 per share
IGD’s Board of Directors is asked to propose to the Shareholders’ Annual General Meeting
on April 14°, 2015 the approval of the distribution of a:
:
This year the Dividend Reinvestment Option will NOT be proposed
+14.3%
Dividend Yield 4.5% on year-end
price
Dividend yield 5.2% on 2 March price
A Dividend Amount equal to €32.5 mn (72% of FFO)
0.0375
0.035
0.04
2014 2014 adj 2015
14.3%
OUTLOOK
37
03 March 2016 FY2015 Results Presentation
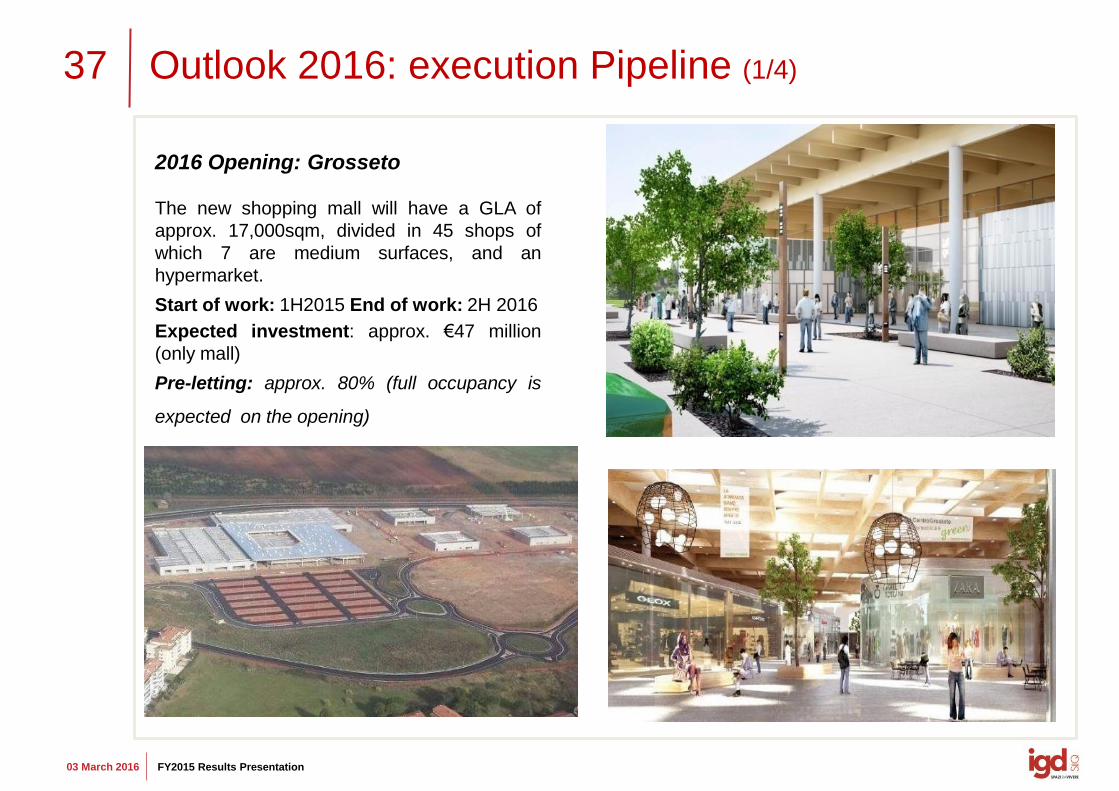
Outlook 2016: execution Pipeline (1/4)
2016 Opening: Grosseto
The new shopping mall will have a GLA of
approx. 17,000sqm, divided in 45 shops of
which 7 are medium surfaces, and an
hypermarket.
Start of work: 1H2015 End of work: 2H 2016
Expected investment: approx. €47 million
(only mall)
Pre-letting: approx. 80% (full occupancy is
expected on the opening)
38
03 March 2016 FY2015 Results Presentation
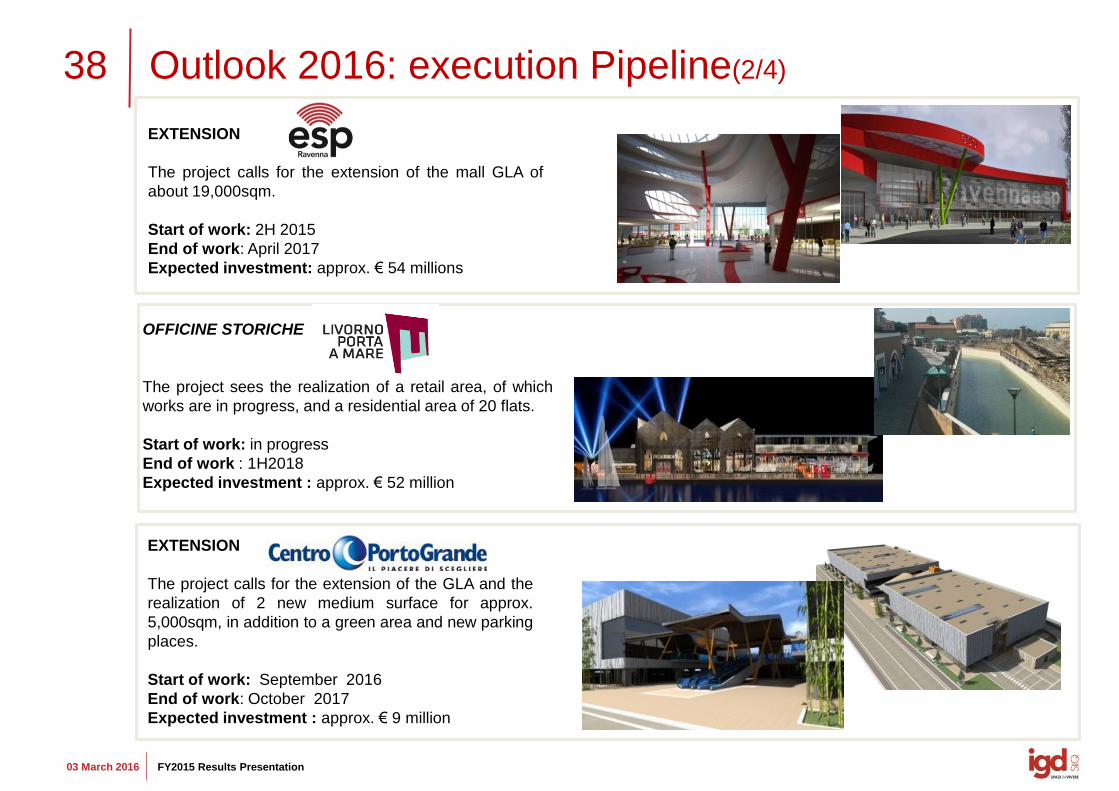
Outlook 2016: execution Pipeline(2/4)
EXTENSION
The project calls for the extension of the GLA and the
realization of 2 new medium surface for approx.
5,000sqm, in addition to a green area and new parking
places.
Start of work: September 2016
End of work: October 2017
Expected investment : approx. € 9 million
OFFICINE STORICHE
The project sees the realization of a retail area, of which
works are in progress, and a residential area of 20 flats.
Start of work: in progress
End of work : 1H2018
Expected investment : approx. € 52 million
EXTENSION
The project calls for the extension of the mall GLA of
about 19,000sqm.
Start of work: 2H 2015
End of work: April 2017
Expected investment: approx. € 54 millions
39
03 March 2016 FY2015 Results Presentation
Outlook 2016 (3/4)
on REVENUES:
• on a like-for-like basis
• thanks to the contribution of the Grosseto Shopping Mall from the
second half of 2016, and the full year contribution of the 2015 new
entry: Clodì Retail Park (Chioggia) and puntadiferro Shopping Mall
in Forlì
Considerable improvements expected:
on the AVERAGE COST OF DEBT
Further reduction of the average cost of debt thanks to the
favorable market conditions.
40
03 March 2016 FY2015 Results Presentation
Outlook 2016 (4/4)
Commited in maintaing an attractive dividend policy
linked to the FFO trend
( 2/3 of the gross FFO)
Expected FFO for 2016
≈ + 13/15 %
ATTACHMENTS
42
03 March 2016 FY2015 Results Presentation
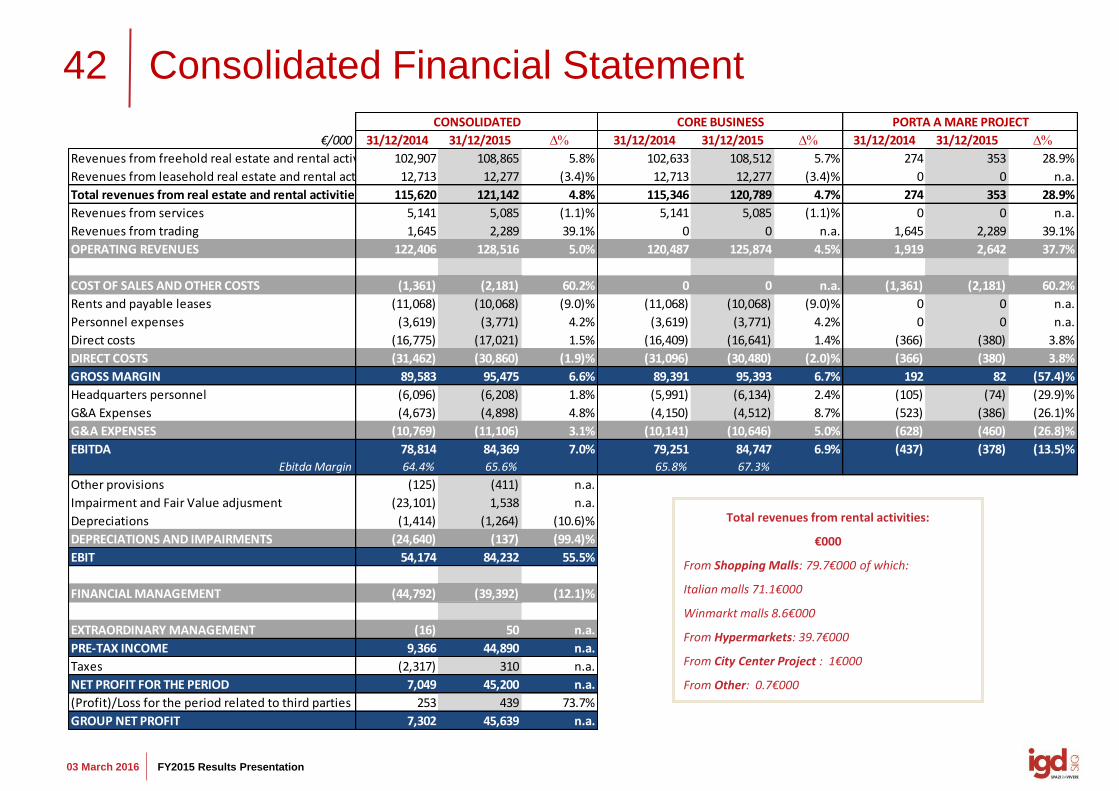
€/000 31/12/2014 31/12/2015 D% 31/12/2014 31/12/2015 D% 31/12/2014 31/12/2015 D%
Revenues from freehold real estate and rental activities 102,907 108,865 5.8% 102,633 108,512 5.7% 274 353 28.9%
Revenues from leasehold real estate and rental activities 12,713 12,277 (3.4)% 12,713 12,277 (3.4)% 0 0 n.a.
Total revenues from real estate and rental activities 115,620 121,142 4.8% 115,346 120,789 4.7% 274 353 28.9%
Revenues from services 5,141 5,085 (1.1)% 5,141 5,085 (1.1)% 0 0 n.a.
Revenues from trading 1,645 2,289 39.1% 0 0 n.a. 1,645 2,289 39.1%
OPERATING REVENUES 122,406 128,516 5.0% 120,487 125,874 4.5% 1,919 2,642 37.7%
COST OF SALES AND OTHER COSTS (1,361) (2,181) 60.2% 0 0 n.a. (1,361) (2,181) 60.2%
Rents and payable leases (11,068) (10,068) (9.0)% (11,068) (10,068) (9.0)% 0 0 n.a.
Personnel expenses (3,619) (3,771) 4.2% (3,619) (3,771) 4.2% 0 0 n.a.
Direct costs (16,775) (17,021) 1.5% (16,409) (16,641) 1.4% (366) (380) 3.8%
DIRECT COSTS (31,462) (30,860) (1.9)% (31,096) (30,480) (2.0)% (366) (380) 3.8%
GROSS MARGIN 89,583 95,475 6.6% 89,391 95,393 6.7% 192 82 (57.4)%
Headquarters personnel (6,096) (6,208) 1.8% (5,991) (6,134) 2.4% (105) (74) (29.9)%
G&A Expenses (4,673) (4,898) 4.8% (4,150) (4,512) 8.7% (523) (386) (26.1)%
G&A EXPENSES (10,769) (11,106) 3.1% (10,141) (10,646) 5.0% (628) (460) (26.8)%
EBITDA 78,814 84,369 7.0% 79,251 84,747 6.9% (437) (378) (13.5)%
Ebitda Margin 64.4% 65.6% 65.8% 67.3%
Other provisions (125) (411) n.a.
Impairment and Fair Value adjusment (23,101) 1,538 n.a.
Depreciations (1,414) (1,264) (10.6)%
DEPRECIATIONS AND IMPAIRMENTS (24,640) (137) (99.4)%
EBIT 54,174 84,232 55.5%
FINANCIAL MANAGEMENT (44,792) (39,392) (12.1)%
EXTRAORDINARY MANAGEMENT (16) 50 n.a.
PRE-TAX INCOME 9,366 44,890 n.a.
Taxes (2,317) 310 n.a.
NET PROFIT FOR THE PERIOD 7,049 45,200 n.a.
(Profit)/Loss for the period related to third parties 253 439 73.7%
GROUP NET PROFIT 7,302 45,639 n.a.
CORE BUSINESS PORTA A MARE PROJECTCONSOLIDATED
Consolidated Financial Statement
Total revenues from rental activities:
€000
From Shopping Malls: 79.7€000 of which:
Italian malls 71.1€000
Winmarkt malls 8.6€000
From Hypermarkets: 39.7€000
From City Center Project : 1€000
From Other: 0.7€000
43
03 March 2016 FY2015 Results Presentation
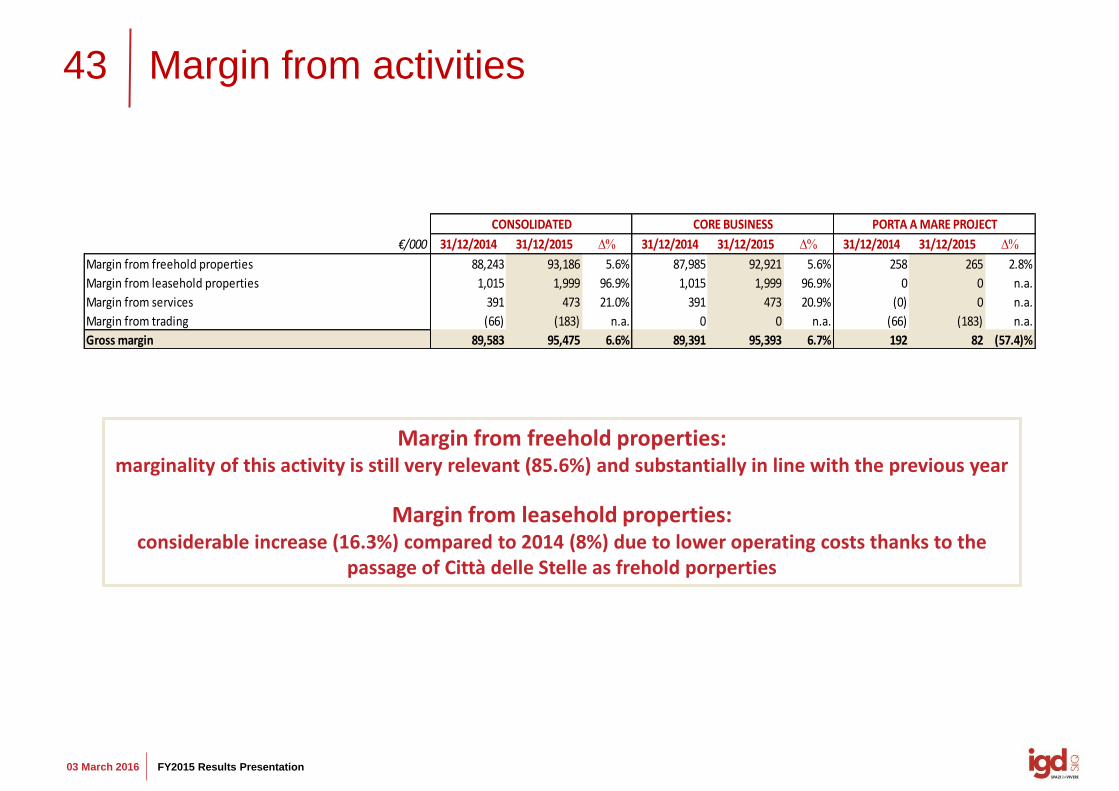
Margin from activities
Margin from freehold properties: marginality of this activity is still very relevant (85.6%) and substantially in line with the previous year
Margin from leasehold properties: considerable increase (16.3%) compared to 2014 (8%) due to lower operating costs thanks to the
passage of Città delle Stelle as frehold porperties
€/000 31/12/2014 31/12/2015 D% 31/12/2014 31/12/2015 D% 31/12/2014 31/12/2015 D%
Margin from freehold properties 88,243 93,186 5.6% 87,985 92,921 5.6% 258 265 2.8%
Margin from leasehold properties 1,015 1,999 96.9% 1,015 1,999 96.9% 0 0 n.a.
Margin from services 391 473 21.0% 391 473 20.9% (0) 0 n.a.
Margin from trading (66) (183) n.a. 0 0 n.a. (66) (183) n.a.
Gross margin 89,583 95,475 6.6% 89,391 95,393 6.7% 192 82 (57.4)%
CONSOLIDATED CORE BUSINESS PORTA A MARE PROJECT
44
03 March 2016 FY2015 Results Presentation
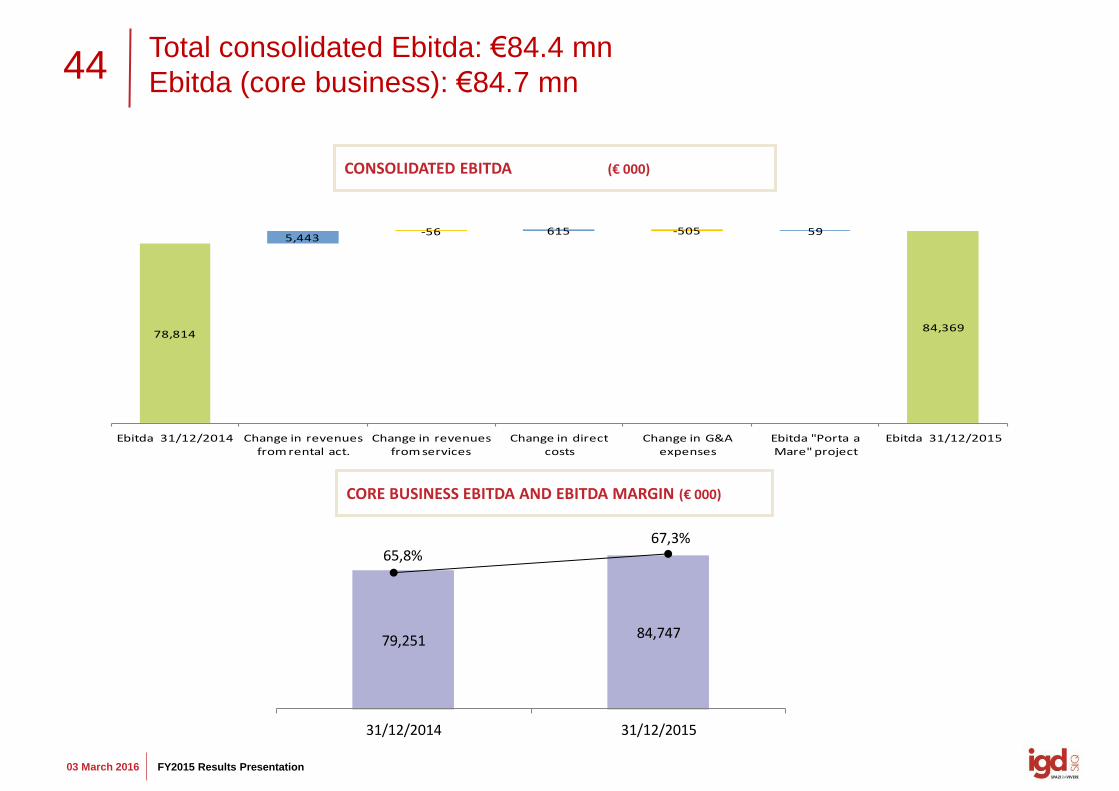
Total consolidated Ebitda: €84.4 mn
Ebitda (core business): €84.7 mn
CONSOLIDATED EBITDA (€ 000)
CORE BUSINESS EBITDA AND EBITDA MARGIN (€ 000)
79,251 84,747
31/12/2014 31/12/2015
65,8%67,3%
78,814
5,443-56 615 -505 59
84,369
Ebitda 31/12/2014 Change in revenues from rental act.
Change in revenues from services
Change in direct costs
Change in G&A expenses
Ebitda "Porta a Mare" project
Ebitda 31/12/2015
45
03 March 2016 FY2015 Results Presentation
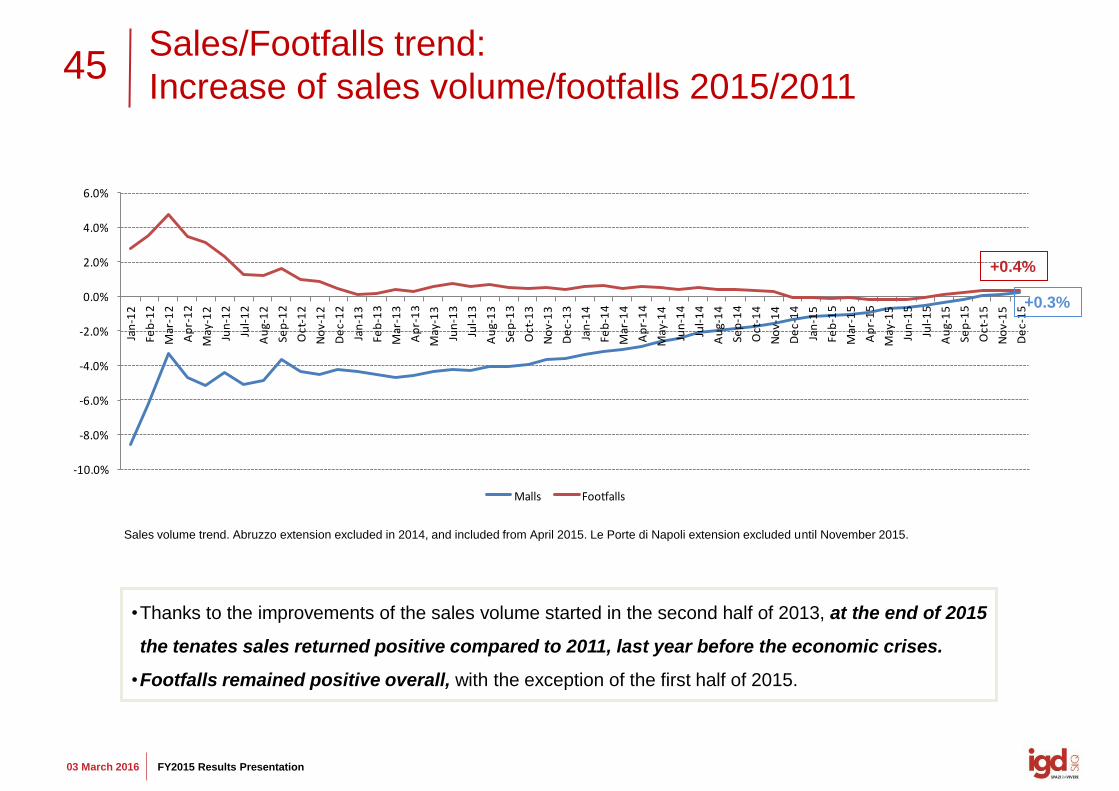
Sales/Footfalls trend:
Increase of sales volume/footfalls 2015/2011
•Thanks to the improvements of the sales volume started in the second half of 2013, at the end of 2015
the tenates sales returned positive compared to 2011, last year before the economic crises.
•Footfalls remained positive overall, with the exception of the first half of 2015.
Sales volume trend. Abruzzo extension excluded in 2014, and included from April 2015. Le Porte di Napoli extension excluded until November 2015.
-10.0%
-8.0%
-6.0%
-4.0%
-2.0%
0.0%
2.0%
4.0%
6.0%
Jan
-12
Feb
-12
Mar
-12
Ap
r-1
2
May
-12
Jun
-12
Jul-
12
Au
g-1
2
Sep
-12
Oct
-12
No
v-1
2
De
c-1
2
Jan
-13
Feb
-13
Mar
-13
Ap
r-1
3
May
-13
Jun
-13
Jul-
13
Au
g-1
3
Sep
-13
Oct
-13
No
v-1
3
De
c-1
3
Jan
-14
Feb
-14
Mar
-14
Ap
r-1
4
May
-14
Jun
-14
Jul-
14
Au
g-1
4
Sep
-14
Oct
-14
No
v-1
4
De
c-1
4
Jan
-15
Feb
-15
Mar
-15
Ap
r-1
5
May
-15
Jun
-15
Jul-
15
Au
g-1
5
Sep
-15
Oct
-15
No
v-1
5
De
c-1
5
Malls Footfalls
+0.4%
+0.3%
46
03 March 2016 FY2015 Results Presentation
42.5%
26.7%
16.7%14.2%23.0% 24.0%
19.0%
35.0%
0%
5%
10%
15%
20%
25%
30%
35%
40%
45%
2016 2017 2018 >2018
no of contracts rent value
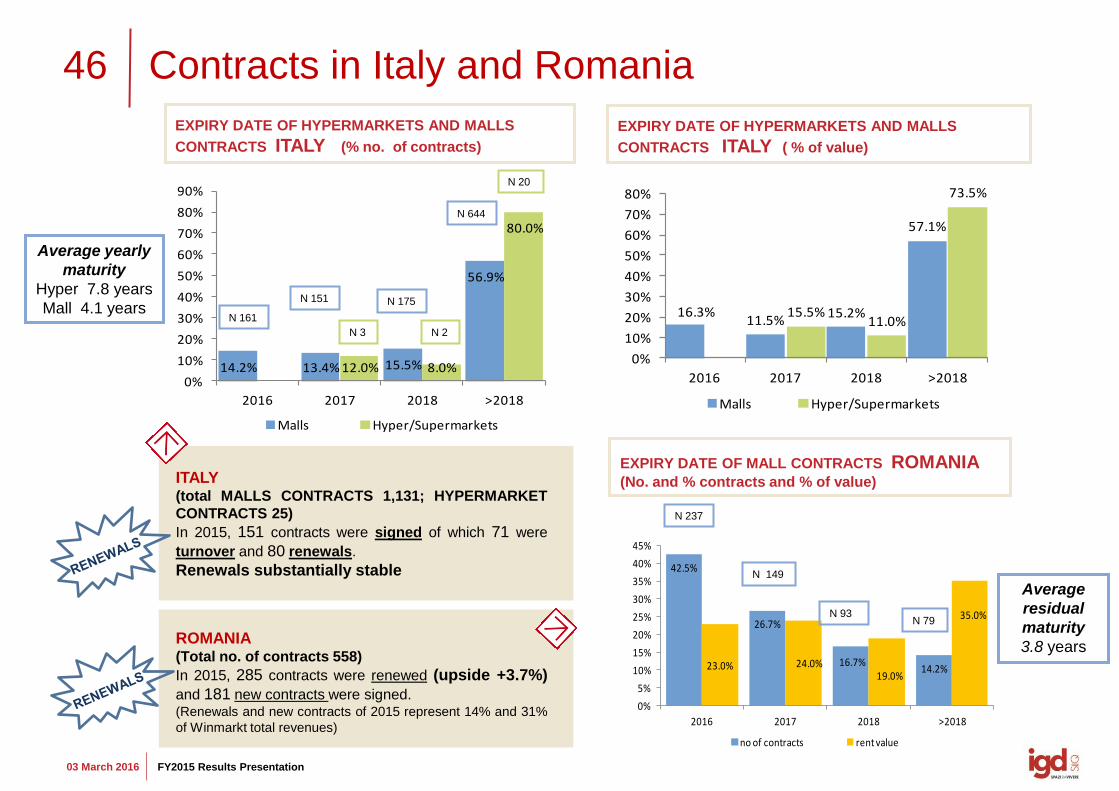
Contracts in Italy and Romania
EXPIRY DATE OF HYPERMARKETS AND MALLS
CONTRACTS ITALY (% no. of contracts)
ITALY (total MALLS CONTRACTS 1,131; HYPERMARKET
CONTRACTS 25)
In 2015, 151 contracts were signed of which 71 were
turnover and 80 renewals.
Renewals substantially stable
ROMANIA (Total no. of contracts 558)
In 2015, 285 contracts were renewed (upside +3.7%)
and 181 new contracts were signed. (Renewals and new contracts of 2015 represent 14% and 31%
of Winmarkt total revenues)
EXPIRY DATE OF HYPERMARKETS AND MALLS
CONTRACTS ITALY ( % of value)
N 161
N 151 N 175
N 20
N 93 N 79
N 149
N 237
EXPIRY DATE OF MALL CONTRACTS ROMANIA (No. and % contracts and % of value)
N 644
N 3
Average yearly
maturity
Hyper 7.8 years
Mall 4.1 years
Average
residual
maturity
3.8 years
N 2
14.2% 13.4% 15.5%
56.9%
12.0% 8.0%
80.0%
0%
10%
20%
30%
40%
50%
60%
70%
80%
90%
2016 2017 2018 >2018
Malls Hyper/Supermarkets
16.3%11.5%
15.2%
57.1%
15.5%11.0%
73.5%
0%
10%
20%
30%
40%
50%
60%
70%
80%
2016 2017 2018 >2018
Malls Hyper/Supermarkets
47
03 March 2016 FY2015 Results Presentation
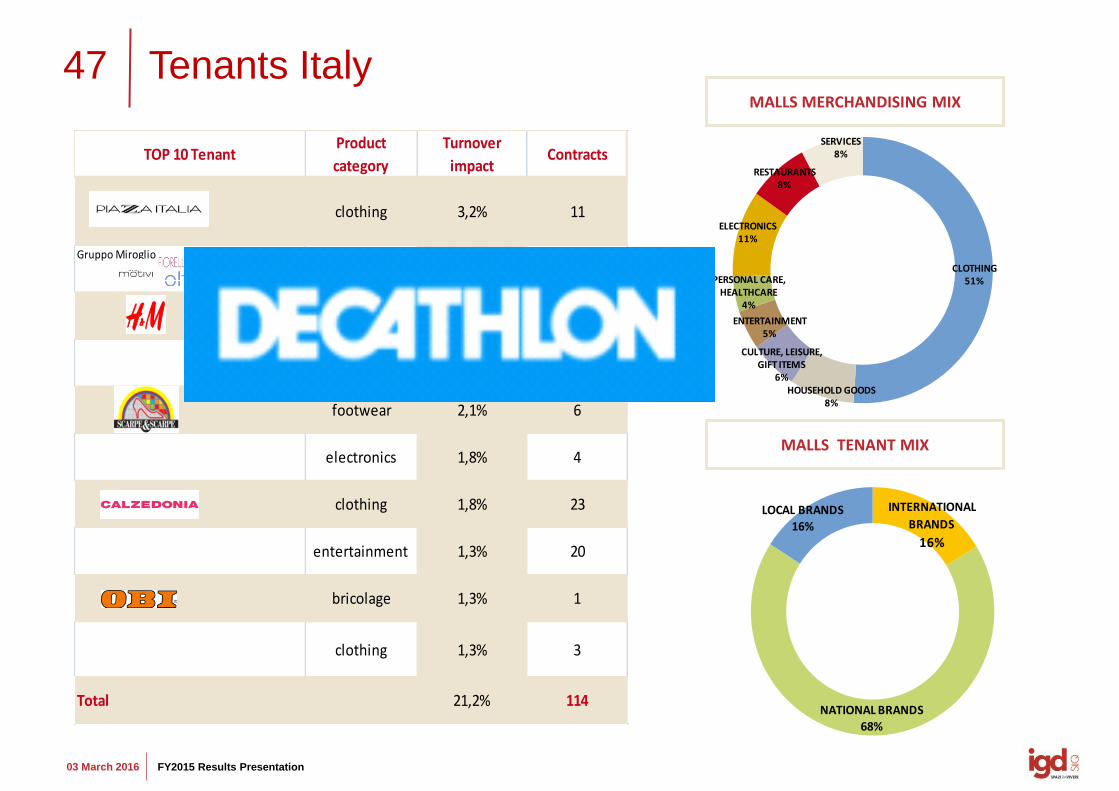
Tenants Italy
MALLS TENANT MIX
MALLS MERCHANDISING MIX
CLOTHING51%
HOUSEHOLD GOODS8%
CULTURE, LEISURE, GIFT ITEMS
6%
ENTERTAINMENT5%
PERSONAL CARE, HEALTHCARE
4%
ELECTRONICS11%
RESTAURANTS8%
SERVICES 8%
INTERNATIONAL
BRANDS
16%
NATIONAL BRANDS68%
LOCAL BRANDS
16%
TOP 10 TenantProduct
category
Turnover
impactContracts
clothing 3,2% 11
Gruppo Miroglio
clothing 3,1% 30
clothing 3,1% 9
clothing 2,3% 7
footwear 2,1% 6
electronics 1,8% 4
clothing 1,8% 23
entertainment 1,3% 20
bricolage 1,3% 1
clothing 1,3% 3
Total 21,2% 114
48
03 March 2016 FY2015 Results Presentation
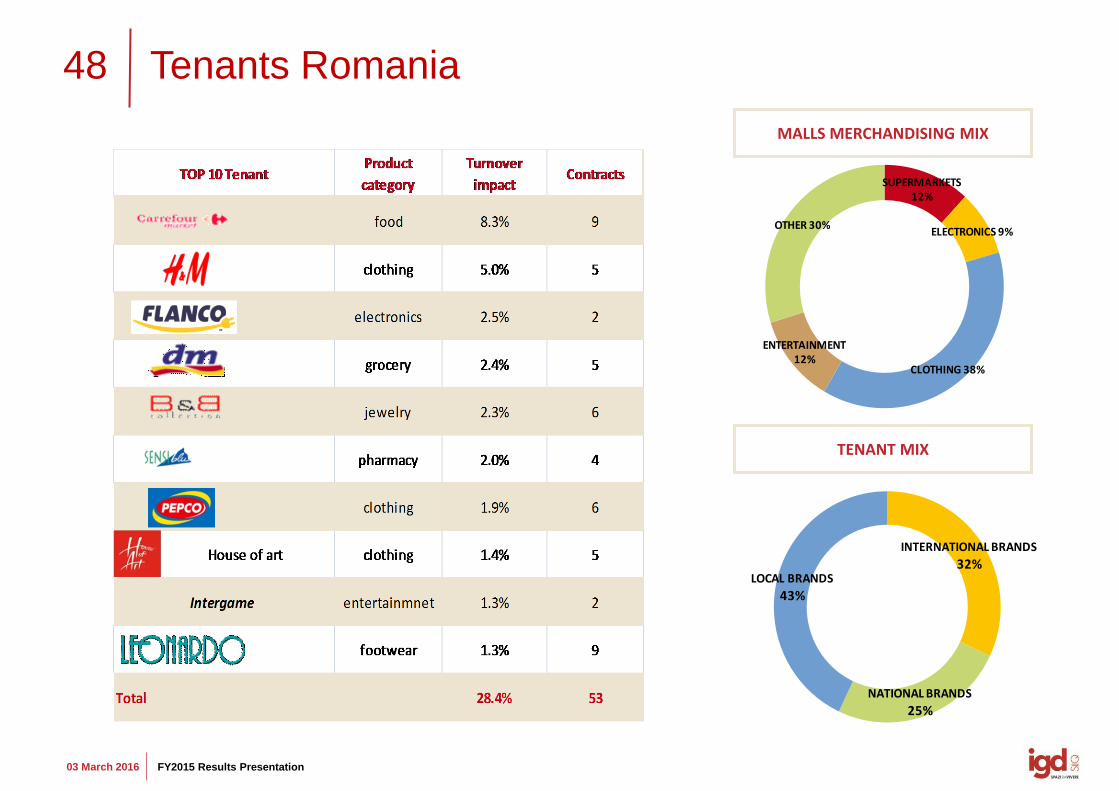
Tenants Romania
TENANT MIX
MALLS MERCHANDISING MIX
INTERNATIONAL BRANDS
32%
NATIONAL BRANDS
25%
LOCAL BRANDS
43%
SUPERMARKETS 12%
ELECTRONICS 9%
CLOTHING 38%
ENTERTAINMENT 12%
OTHER 30%
49
03 March 2016 FY2015 Results Presentation
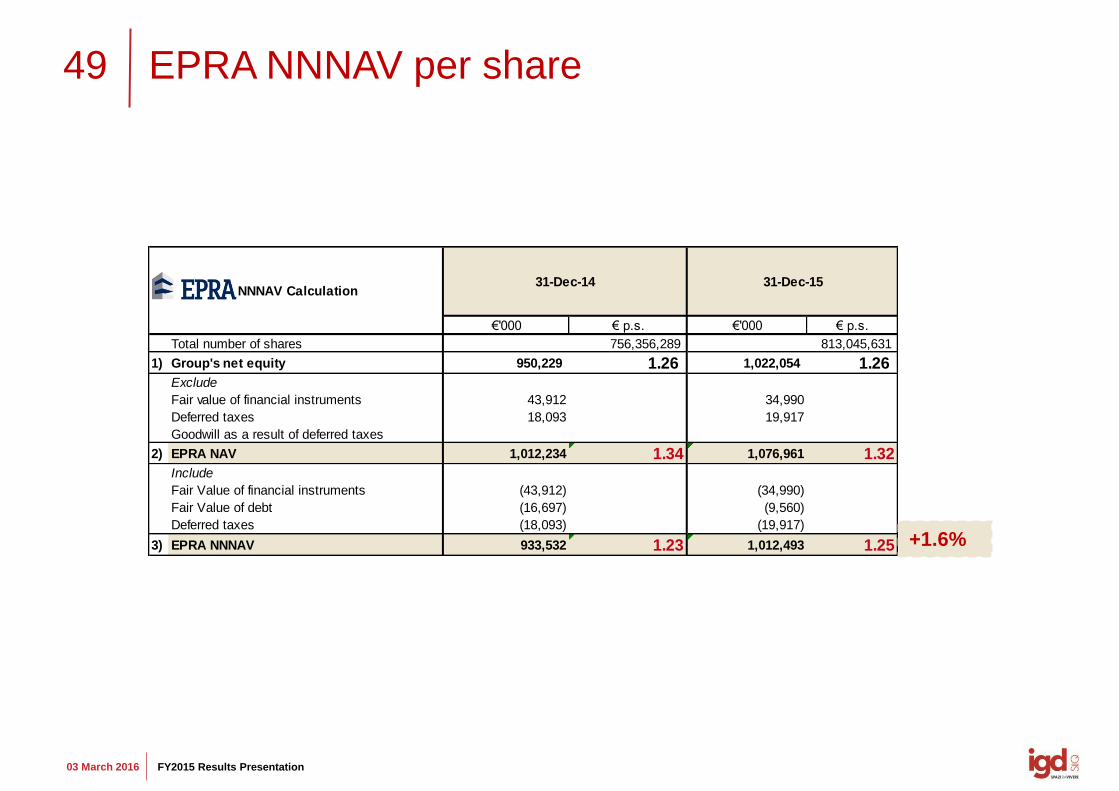
EPRA NNNAV per share
€'000 € p.s. €'000 € p.s.
Total number of shares 756,356,289 813,045,631
1) Group's net equity 950,229 1.26 1,022,054 1.26 Exclude
Fair value of financial instruments 43,912 34,990
Deferred taxes 18,093 19,917
Goodwill as a result of deferred taxes
2) EPRA NAV 1,012,234 1.34 1,076,961 1.32Include
Fair Value of financial instruments (43,912) (34,990)
Fair Value of debt (16,697) (9,560)
Deferred taxes (18,093) (19,917)
3) EPRA NNNAV 933,532 1.23 1,012,493 1.25
31-Dec-1531-Dec-14 NNNAV Calculation
+1.6%
50
03 March 2016 FY2015 Results Presentation
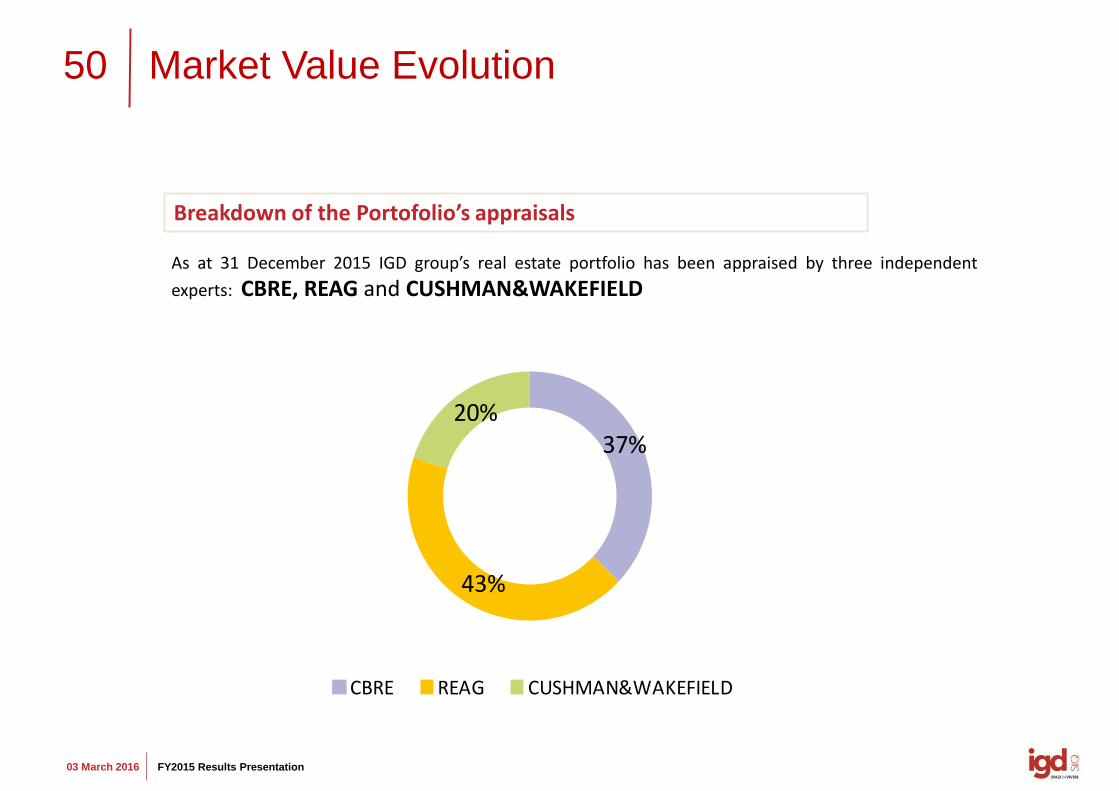
Market Value Evolution
As at 31 December 2015 IGD group’s real estate portfolio has been appraised by three independent
experts: CBRE, REAG and CUSHMAN&WAKEFIELD
Breakdown of the Portofolio’s appraisals
37%
43%
20%
CBRE REAG CUSHMAN&WAKEFIELD
51
03 March 2016 FY2015 Results Presentation
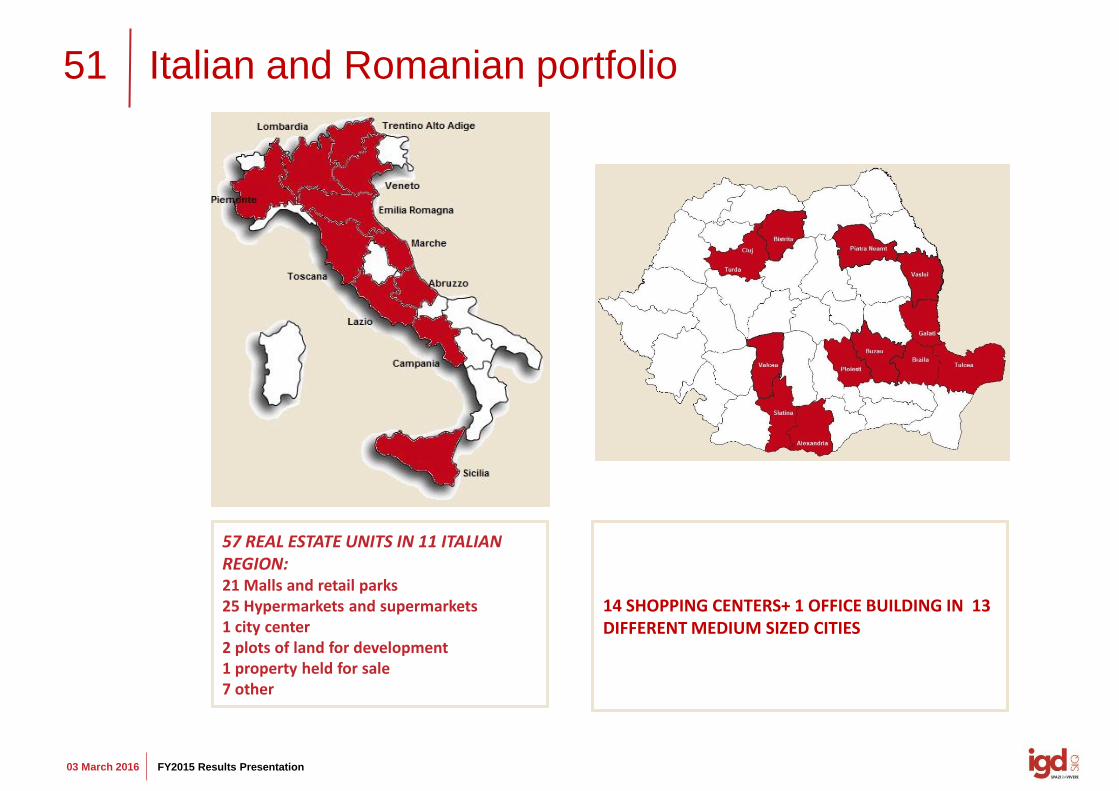
Italian and Romanian portfolio
57 REAL ESTATE UNITS IN 11 ITALIAN REGION: 21 Malls and retail parks 25 Hypermarkets and supermarkets 1 city center 2 plots of land for development 1 property held for sale 7 other
14 SHOPPING CENTERS+ 1 OFFICE BUILDING IN 13 DIFFERENT MEDIUM SIZED CITIES
52
03 March 2016 FY2015 Results Presentation
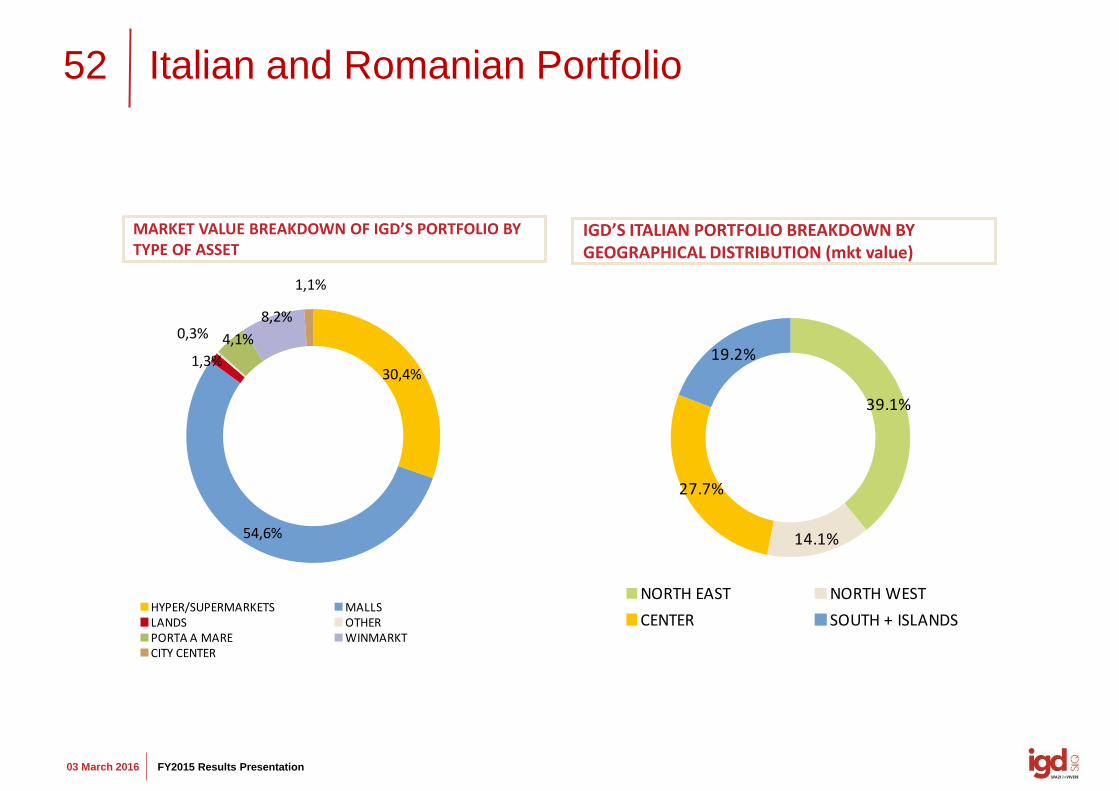
Italian and Romanian Portfolio
IGD’S ITALIAN PORTFOLIO BREAKDOWN BY GEOGRAPHICAL DISTRIBUTION (mkt value)
MARKET VALUE BREAKDOWN OF IGD’S PORTFOLIO BY TYPE OF ASSET
39.1%
14.1%
27.7%
19.2%
NORTH EAST NORTH WEST
CENTER SOUTH + ISLANDS
30,4%
54,6%
1,3%
0,3% 4,1%
8,2%
1,1%
HYPER/SUPERMARKETS MALLSLANDS OTHERPORTA A MARE WINMARKTCITY CENTER
53
03 March 2016 FY2015 Results Presentation
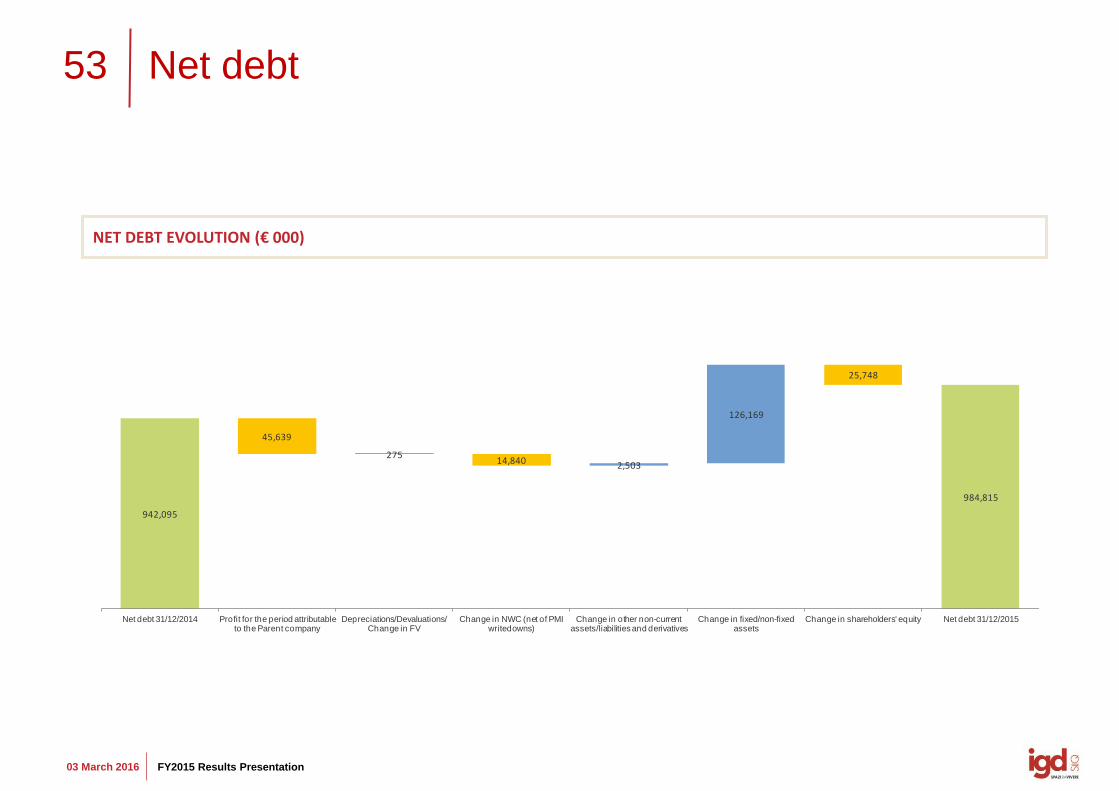
Net debt
NET DEBT EVOLUTION (€ 000)
942,095
45,639
27514,840 2,503
126,169
25,748
984,815
Net debt 31/12/2014 Profit for the period attributable to the Parent company
Depreciations/Devaluations/ Change in FV
Change in NWC (net of PMI writedowns)
Change in other non-current assets/liabilities and derivatives
Change in fixed/non-fixed assets
Change in shareholders' equity Net debt 31/12/2015

ww
w.g
rup
po
igd
.it
Claudia Contarini, IR T. +39. 051 509213 [email protected]
Federica Pivetti T. +39. 051 509260 [email protected]
to @igdSIIQ


