Download - Filtracion Ingles

8/8/2019 Filtracion Ingles
http://slidepdf.com/reader/full/filtracion-ingles 1/13
8/8/2019 Filtracion Ingles
http://slidepdf.com/reader/full/filtracion-ingles 2/13

8/8/2019 Filtracion Ingles
http://slidepdf.com/reader/full/filtracion-ingles 3/13
Fundamental characteristics of a FPD 275
Figure 1. Configuration of the FPD.
Figure 2. Experimental setup with the FPD.
to the cake from the heat jacket made of aluminum underneath the filter chamber.
A thin diaphragm is placed on the heater, and then covered with a mesh and a filtercloth, which is the same as the FPD. The FMD is connected to a vacuum pump
and a steam generator (see Fig. 4). In the FPD, the cake temperature was measured
only at the center and the water content was calculated as the average water content
from the removed water during the drying process. By employing the FMD, we can
measure the local temperatures by inserting thermocouples (as many as we want)
and open the FMD at any time to measure the local water content at any location in
the cake by sampling the cake.
8/8/2019 Filtracion Ingles
http://slidepdf.com/reader/full/filtracion-ingles 4/13
276 R. Chuvaree et al.
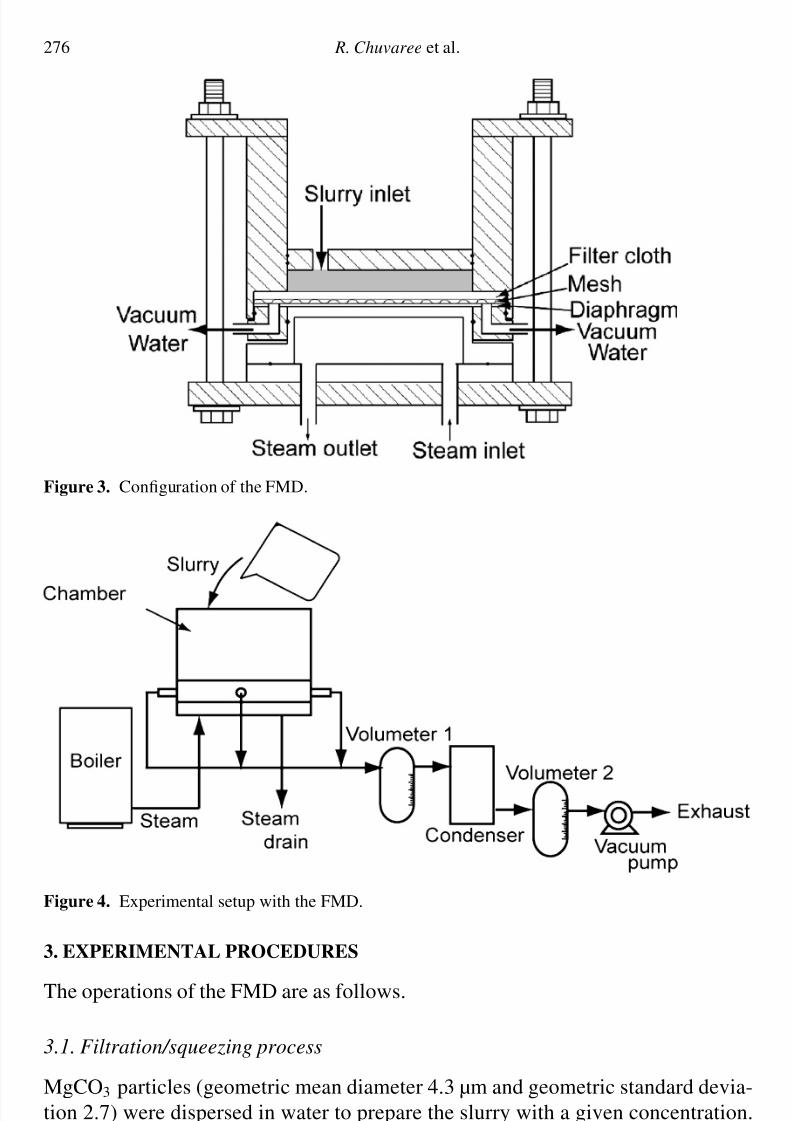
Figure 3. Configuration of the FMD.
Figure 4. Experimental setup with the FMD.
3. EXPERIMENTAL PROCEDURES
The operations of the FMD are as follows.
3.1. Filtration/squeezing process
MgCO3 particles (geometric mean diameter 4.3 μm and geometric standard devia-
tion 2.7) were dispersed in water to prepare the slurry with a given concentration.
The slurry was supplied to the filtration chamber through an inlet on the lid and the
inlet was closed. Then filtration was started by vacuuming the chamber at 6 kPa-

8/8/2019 Filtracion Ingles
http://slidepdf.com/reader/full/filtracion-ingles 5/13
Fundamental characteristics of a FPD 277
absolute with a pump connected to the drain outlet and the volume of filtrate was
measured continuously by a balance.
3.2. Drying process
Steam at a temperature of 120–122◦C was supplied to the heater underneath the
chamber (see Figs 3 and 4) while applying vacuum pressure. Heat from the steam
was transferred through the diaphragm, the mesh and the filter. The liquid water
removed from the cake and the evaporated vapor were collected in Volumeters 1
and 2, respectively. The levels of water in Volumeters 1 and 2 were detected by a
level sensor (model GYLS-192-AR-R1; Santest) to measure the amount of removed
water from which the drying rate of the cake was calculated. The temperatures
of steam and cake were also measured continuously using thermocouples (SCseries; Chino). Thermocouple signals were multiplexed to a data acquisition system
(Memory Hiloggers 8422-51; Hioki E.E.) which records all data measured as a
function of time, and enables the data to be displayed digitally and graphically in
real time on a computer display.
During the course of drying, the local temperature evolution was measured with
thermocouples and the local water content was measured by sampling the cake by
opening the lid of the FMD at given time intervals.
4. RESULTS AND DISCUSSIONS
4.1. Comparison of data obtained with the FPD and with the FMD
In order to check whether the FMD retains the essential features of the FPD,
comparisons of filtration and drying data obtained with these two devices are
performed. The effect of slurry concentration on the filtration curve at the constantfiltration pressure of 6 kPa-absolute is shown in Fig. 5. Figure 5 shows that, for both
dryers, the filtrate volume increases faster with decreasing slurry concentration. The
Ruth plots of data obtained with the FPD and FMD at slurry concentration of 5 wt%
are shown in Fig. 6. Figure 6 shows that the data for both dryers fall on straight
lines, indicating that the Ruth equation is applicable to the filtration of this slurry.
The specific cake resistance calculated from the Ruth plots is about 1.11×10¹² m/kg
for both dryers regardless of the slurry concentrations.
The evolution of temperatures at the mid-depth and at the center of cake during thedrying process for both dryers is compared in Fig 7. As seen from Fig. 7, for both
dryers, the drying process is divided into three regions: (i) the region where the cake
is heated from the initial temperature to the boiling point, (ii) the region in which
water in the cake evaporates at the boiling point and (iii) the region where the cake of
almost 100% solid is heated up to the final temperature. The second region is shorter
for the FMD because of the smaller amount of slurry in the chamber, but the third
region is longer due to the insufficient heat insulation of the FMD. Since similar

8/8/2019 Filtracion Ingles
http://slidepdf.com/reader/full/filtracion-ingles 6/13
278 R. Chuvaree et al.
Figure 5. Filtration curves of slurry at various concentrations.
Figure 6. Ruth plot of data of MgCO3 slurries obtained by the FPD and FMD.
drying curves are observed for the FMD and FPD at other steam temperatures and
diaphragm thicknesses, it can be said that the FMD may retain the essential features
of the FPD.
The radial temperature distributions in the cake measured at a depth of 4 mm
(the cake thickness is 8 mm) using the FMD are shown in Fig. 8. In region (i)

8/8/2019 Filtracion Ingles
http://slidepdf.com/reader/full/filtracion-ingles 7/13
Fundamental characteristics of a FPD 279
Figure 7. Comparison of cake temperature evolution during the drying process with the FPD and
FMD (pressure: 6 kPa-absolute, steam temperature: 120◦C).
Figure 8. Cake temperature evolution at various radial distances in the cake: FMD (pressure: 6 kPa-absolute, steam temperature: 120◦C).
where the cake is heated to the boiling point of water, there is no difference in
temperature due to the locations in the cake, suggesting that the heating of cake to
its boiling temperature is quite uniform in the radial direction of the cake. However,
after 50 min, the cake at the rim dries faster than the inside since the chamber is
vacuumed from the rim. At the rim of cake, water is sucked to the outlet by the

8/8/2019 Filtracion Ingles
http://slidepdf.com/reader/full/filtracion-ingles 8/13
280 R. Chuvaree et al.
vacuum pump so that the drying occurs faster and the temperature rises earlier than
that at the center. Therefore, the drying front moves from the rim to the center as the
drying proceeds. However, when no water remains in the cake, the cake is heated
and reaches the final temperature at the same time.
Figure 9 shows the temperature evolution along the cake thickness at the center of the cake. The results show that the cake at the bottom dries faster than that the top as
expected since the cake is heated from the bottom. The cake at the bottom is heated
and completely dried within only 20 min, whereas the cake at the center and the
top requires 70 and 75 min to finish the evaporating period. However, as shown in
Fig. 10 (where r is the radius of the cake and x is the cake depth), the relationship
between the local water content and the local temperature fall on a single curve,
regardless of the locations in the cake. Furthermore, it is found that the same curve
is also applicable to the FPD for the relationship between the temperature at thecenter of cake and the average water content measured from the removed water, as
shown in Fig. 11. Consequently, the relationship between the water content and the
temperature seems to be a unique property of a cake for given operating conditions.
Several empirical models to predict the water content of a cake for the drying
process have been proposed. For the FMD, the volume of the chamber is quite
small so that the cake is dried uniformly compared to the larger FPD. Therefore,
we may consider that the rate of water evaporation is proportional to the amount
of water remaining in the cake. Consequently, the water content in a cake may
decrease exponentially with time, i.e. the Lewis model [6], MR = exp(−kt ), where
Figure 9. Cake temperature evolution at various thicknesses in the cake: FMD (pressure: 6 kPa-
absolute, steam temperature: 120◦C).

8/8/2019 Filtracion Ingles
http://slidepdf.com/reader/full/filtracion-ingles 9/13
Fundamental characteristics of a FPD 281
Figure 10. Plot of water content as a function of local cake temperature: FMD (pressure: 6 kPa-
absolute, steam temperature: 120◦C).
Figure 11. Comparison of water content–temperature relationships between the FPD and FMD
(pressure: 6 kPa-absolute, steam temperature: 120◦C).
MR = (m − me)/(m0 − me) is the dimensionless water content, is applied to fit
the experimental data. In this equation, k is the drying rate constant, t is the drying
time, m is the water content in the cake, m0 is the initial water content and me is the
equilibrium water content. In the present vacuum dryer, the values of me can be set

8/8/2019 Filtracion Ingles
http://slidepdf.com/reader/full/filtracion-ingles 10/13
282 R. Chuvaree et al.
Figure 12. Effect of diaphragm thickness on the water content (pressure: 6 kPa-absolute, steam
temperature: 120◦C).
to be zero so that the Lewis model is reduced to:
m = m0 exp(−kt). (1)
Figure 12 shows the semi-logarithmic plot of average water content in cake against
the drying time at different diaphragm thicknesses for both the FMD and FPD. The
experimental data fall on a straight line for m/m0 > 0.05 for both dryers, indicating
that the exponential decay model is applicable to the average water content of cake
down to 5% of the initial water content. The exponential decay model breaks down
at a water content less than 5% of the initial one, probably because the mass transfer
resistance of evaporated vapor through the cake plays a significant role and there
exists bound water on the surface of particles.The drying rate constants obtained with the FMD are k = 7.62 × 10⁻⁴ and
6.28 × 10⁻⁴ s−1, respectively, for 0.1- and 0.4-mm thick diaphragms, while those
obtained with the FPD are k = 9.50 × 10⁻⁴ and 7.91 × 10⁻⁴ s−1. Since the heat
resistance increases with the diaphragm thickness, a thinner diaphragm is preferable
for enhancing the heat transfer rate and thus reducing the drying time. The drying
rate constants obtained with the FMD are smaller than those with the FPD by a
factor of 0.8, because of the insufficient heat insulation for the FMD.
4.2. Scaling effect
Since the FMD is found to have the essential characteristics of the FPD, the size
effect on the drying characteristics of the FPD is discussed by comparing the data
obtained with both dryers.
The effects of the diaphragm thickness on the evolution of temperatures at the
center of the cake in both dryers are compared in Fig. 13. With a thinner diaphragm,

8/8/2019 Filtracion Ingles
http://slidepdf.com/reader/full/filtracion-ingles 11/13
Fundamental characteristics of a FPD 283
Figure 13. Effect of diaphragm thickness on the evolution of cake temperature (pressure: 6 kPa-
absolute, steam temperature: 120◦C).
Figure 14. Effect of vacuum pressure on water content evolution (diaphragm thickness: 0.4 mm,
steam temperature: 120◦C).
the cakes reach higher boiling points in a shorter time. The cake temperature
decrease in the FMD is more significant in region (ii) compared to that in the
FPD because the evaporated water vapor is readily vacuumed out from the filtration
chamber of the FMD.
Figure 14 compares the effect of vacuum pressure on the drying rate constants
for both dryers. The drying rate constant (the slope of the line) decreases with
the absolute pressure (increases with the vacuum pressure) because evaporation
8/8/2019 Filtracion Ingles
http://slidepdf.com/reader/full/filtracion-ingles 12/13
284 R. Chuvaree et al.
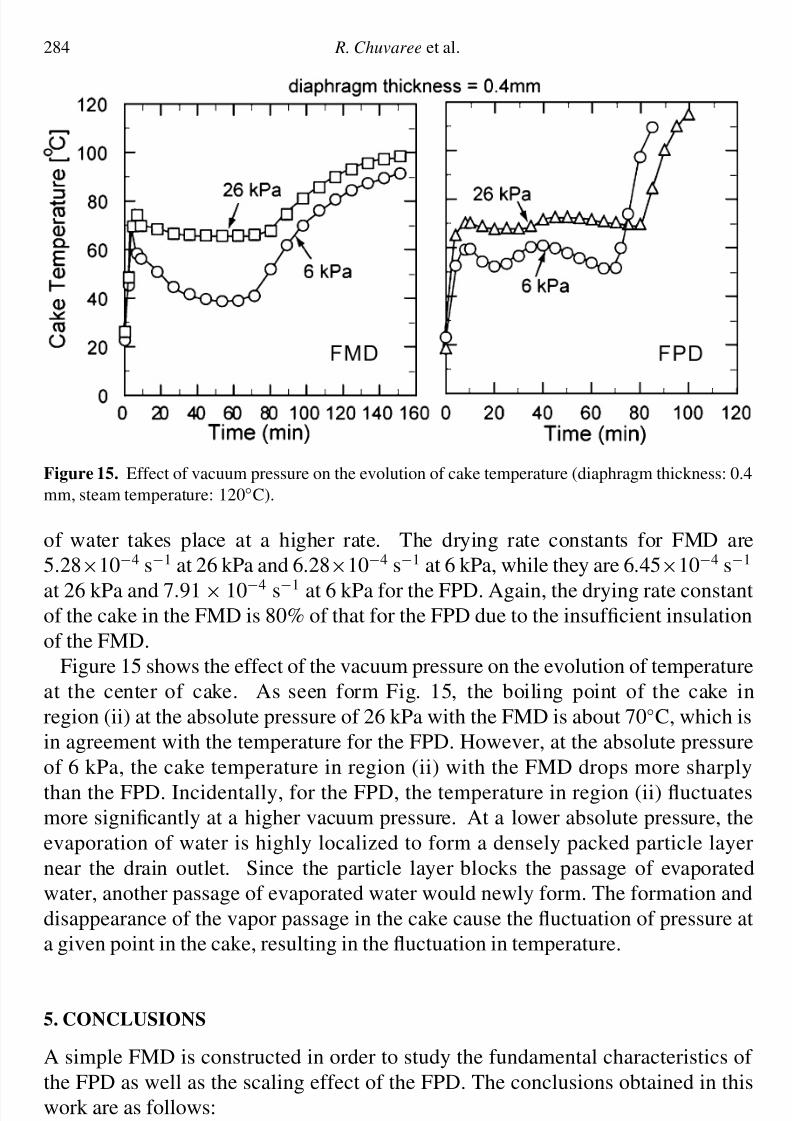
Figure 15. Effect of vacuum pressure on the evolution of cake temperature (diaphragm thickness: 0.4
mm, steam temperature: 120◦C).
of water takes place at a higher rate. The drying rate constants for FMD are
5.28×10⁻⁴ s−1 at 26 kPa and 6.28×10⁻⁴ s−1 at 6 kPa, while they are 6.45×10⁻⁴ s−1
at 26 kPa and 7.91× 10−
4 s−
1 at 6 kPa for the FPD. Again, the drying rate constantof the cake in the FMD is 80% of that for the FPD due to the insufficient insulation
of the FMD.
Figure 15 shows the effect of the vacuum pressure on the evolution of temperature
at the center of cake. As seen form Fig. 15, the boiling point of the cake in
region (ii) at the absolute pressure of 26 kPa with the FMD is about 70◦C, which is
in agreement with the temperature for the FPD. However, at the absolute pressure
of 6 kPa, the cake temperature in region (ii) with the FMD drops more sharply
than the FPD. Incidentally, for the FPD, the temperature in region (ii) fluctuatesmore significantly at a higher vacuum pressure. At a lower absolute pressure, the
evaporation of water is highly localized to form a densely packed particle layer
near the drain outlet. Since the particle layer blocks the passage of evaporated
water, another passage of evaporated water would newly form. The formation and
disappearance of the vapor passage in the cake cause the fluctuation of pressure at
a given point in the cake, resulting in the fluctuation in temperature.
5. CONCLUSIONS
A simple FMD is constructed in order to study the fundamental characteristics of
the FPD as well as the scaling effect of the FPD. The conclusions obtained in this
work are as follows:
(i) The local water content in the cake is only a function of temperature and
therefore the water content can be predicted from the local cake temperature.
8/8/2019 Filtracion Ingles
http://slidepdf.com/reader/full/filtracion-ingles 13/13
Fundamental characteristics of a FPD 285
(ii) The relationship between the local water content and the local temperature
obtained with the FMD is also applicable to the FPD for the relationship
between the temperature at the center of cake and the average water content
calculated from the water removed from the cake.
(iii) The exponential decay model is applicable to predict the average water contentin the cake when the water content is higher than 5% of the initial water
content.
(iv) The drying rate constant increases with decreasing the diaphragm thickness
and increasing the vacuum pressure.
(v) For the FPD with a large filtration area, nonuniformity in drying of the cake
causes fluctuations in the local cake temperature.
REFERENCES
1. R. Chuvaree, N. Nishida, Y. Otani and T. Tanaka, Filter press dryer for filtration/squeezing and
drying of slurries, J. Chem. Eng., Japan. 39, 298–304 (2006).
2. B. U. Kozanoglu, J. A. Vilchez, J. Casal and J. Arnaldos, Mass transfer coefficient in vacuum
fluidized bed drying, Chem. Eng. Sci. 56, 3899–3901 (2001).
3. S. Methakhup, N. Chiewchan and S. Devahastin, Effects of drying methods and conditions on
drying kinetics and quality of Indian gooseberry flake, Food Sci. Technol. 38, 579–587 (2005).4. Z. W. Cui, S. Y. Xu and D. W. Sun, Microwave-vacuum drying kinetics of carrot slices, J. Food
Eng. 65, 157–164 (2004).
5. C. Péré and E. Rodier, Microwave vacuum drying of porous media: experimental study and
qualitative considerations of internal transfers, Chem. Eng. Process. 41, 427–436 (2002).
6. D. M. Bruce, Exposed-layer barley drying: Three models fitted to new data up to 150◦C, J. Agric.
Eng. Res. 32, 337–348 (1985).


