
TESIS DOCTORAL
UNIVERSIDAD DE LAS PALMAS DE GRAN CANARIA FACULTAD DE EDUCACIÓN FÍSICA
DEPARTAMENTO DE EDUCACIÓN FÍSICA
“EJERCICIO FÍSICO Y RECEPTOR MUSCULAR DE LEPTINA EN HUMANOS SANOS Y OBESOS”
“EXERCISE AND MUSCLE LEPTIN RECEPTOR
IN HEALTH AND OBESE HUMANS"
Tesis doctoral presentada por: Teresa Fuentes Nieto
Tesis doctoral dirigida por: José Antonio López Calbet Carlos Borja Guerra Hernández Alfredo Santana Rodríguez
Los directores El doctorando
Las Palmas de Gran Canaria, 2010

Financiación
La realización de este trabajo de investigación ha sido posible gracias al
disfrute de una beca del “Programa Nacional de Formación de Profesorado
Universitario”, concedida por el Ministerio de Ciencia e Innovación de España.
El presente trabajo ha sido financiado por los siguientes proyectos de
investigación:
1. “Mecanismos genéticos y moleculares de la resistencia a la leptina en
músculo esquelético humano normal y de pacientes obesos con
intolerancia a la glucosa” (PI/10/07). Investigador principal: Alfredo
Santana Rodríguez. Entidad financiadora: FUNCIS (Fundación
Canaria de Investigación y Salud).
2. “Influencia del ejercicio físico regular en la expresión proteica y nivel
de fosforilación (activación) de la isoforma larga del receptor de
leptina (OB-Rb) en músculo esquelético humano”. Investigador
principal: Carlos Borja Guerra Hernández. Entidad financiadora:
Universidad de Las Palmas de Gran Canaria (Proyectos de
Investigación en el marco de Programa Propio para el año 2006).
3. “Influencia del ejercicio físico en los mecanismos de señalización de
leptina en el músculo esquelético humano” (BFU2006-13784).
Investigador principal: José Antonio López Calbet. Entidad
financiadora: Ministerio de Ciencia e Innovación.

5
Agradecimientos:
Son muchas las personas y muchos los agradecimientos.
Empezaré por mi familia. Mª del Carmen Nieto (mamá), Fº Javier Fuentes (papá) y mis
hermanos: Laura, Beatriz, Lucía y Jaime. Muchas gracias por educarme, confiar
siempre en mí, dejarme volar, seguir mis peripecias y amortiguar las caídas del camino.
Quisiera en segundo lugar expresar un especial agradecimiento a mis directores de tesis:
Sin duda, la “culpa” de esta tesis y del doctorado la tiene José Antonio López Calbet.
Gracias por abrirme las puertas de tu laboratorio, poniendo a mi disposición todos los
medios que estaban en tu mano.
Gracias de todo corazón a Borja Guerra, que ha sabido conjugar como nadie el papel
de jefe, tutor, maestro y amigo; sin perder nunca el buen humor. Ha sido un placer y un
orgullo trabajar contigo.
A Alfredo Santana por su generosidad a la hora de compartir sus infinitos
conocimientos, así como los medios a su disposición. Y sobre todo, gracias por estar ahí
siempre que te necesito.
Mil y una gracias a mis compañeros de laboratorio, por estos años compartiendo
pipetas, poyata, risas y cafés:
José y sus “postics”, sus “Inspecciones sorpresa” y sus “elige un número… te ha
tocado”. Gracias por preocuparte de nosotros como un padre.
Safira, fue un placer compartir los primeros años de esta andadura contigo, no sólo
como compañera de trabajo sino como amiga.
Hugo, gracias por resolver mis interminables dudas y mis constantes “problemillas
informáticos” con esa eterna disponibilidad.
Amelia, mi compi de congresos, muchas gracias por compartir trabajo, viajes, charlas y
hasta paellas familiares conmigo.

6
Jesús, mi andaluz preferido del laboratorio, ya sabes que aunque hubiera más lo
seguirías siendo. Muchas gracias por ese buen humor, esa sonrisa perenne, los cafés
terapéuticos, las bromas fáciles (ya sabes que seguiré cayendo en las mismas) y el buen
trabajo en equipo (nadie mejor con quien ordenar sueros).
José Guillén, gracias por ese buen ambiente que aportaste durante tu año en el
laboratorio.
David, gracias por tus “frikadas mañaneras” y tu “café al 10X” (siempre listo para
tomar).
Lorena, “piba!”, muchas gracias por estar siempre “de buen rollito” y transmitirlo.
Rafa, gracias por ofrecerme otro punto de vista de la vida y la ciencia, por regalarme
miles de conversaciones de todo tipo y por tu amistad incondicional.
Maca, gracias por aportar ese buen hacer diario.
Marta y Andrea, gracias por dar ese aire renovado y jovial al laboratorio durante
vuestros meses de estancia.
A Mila, Vicky, Isabel, Macu, “Julius”, Anselmo, Rosa Delia… y demás personal de la
universidad por sus sonrisas diarias a la entrada y salida de la facultad.
Muchas gracias a mis compañeros en mis estancias fuera de Las Palmas:
A todo el grupo del Dr. José Viña, en Valencia. Por esos tres meses de antioxidantes,
ratones, paellas y fallas. A Carmen Gómez, por su profesionalidad, calidez y amistad,
que hizo que me sintiera como en casa.
No me olvidaré tampoco de mi estancia en la preciosa Copenhague. De la sonrisa Jorn y
Jacqueline a la entrada del PANUM, las canciones en Español en el X-lab, las cenas en
casa de Rob, los ratos con Clara y Pau y los momentos con mi gente de la Guess House:
Alba, Daniela y Barbara. Thank you very much to Rob Boushel.
Gracias también a mis amigos ajenos al mundo de la investigación:
Muchas gracias a Cristina y a Mónica, mis segovianas, siempre dispuestas a platicar
durante horas y horas sobre todo lo que me preocupa, incluso desde la distancia.

7
A Jacqueline, a Esther (con coscó incluido), Cesitar, Jorge Running, Rafa Leo, Manolo,
Pablo, Victor (y sus victormeleridades) que han sido mi familia durante estos años en
Las Palmas.
Muchas gracias a mis voleyplayeros de Las Canteras con los que me desahogaba a base
de remates: Andrew, Sleeping, Pablo, Jorge, Manolo, Paola… Y a mis padeleros con los
que he mantenido la “vidilla” de la competición: Carmen Julia, Felipe, Iván, Marisol,
Rubén, María y Aurora…
Por último, y no por ello menos importante, querría agradecer a todas las personas que
se han prestado a participar en nuestros estudios, así como a La Universidad de Las
Palmas de Gran Canaria, en especial al equipo del Vicerrectorado de Investigación. Sin
ellos no podríamos investigar.

ÍNDICE
11
Pág.
RESUMEN 15
ABSTRACT 21 ABREVIATURAS 27
INTRODUCCIÓN 31
1. OBESIDAD 33
2. LEPTINA 34
3. RECEPTORES DE LEPTINA 37
4. PRINCIPALES VÍAS DE SEÑALIZACIÓN ACTIVADAS
POR LEPTINA 40
Cascada de señalización JAK/STAT 41
Cascada de señalización MAPK (Miogen-Activated Protein Kinase) 44
Vía de señalización de IRS (Insulin Receptor Sustrate) / PI3K
(Phospo-Inositide 3-Kinase) 46
AMPK (5’-AMP-Activated Protein Kinase) 49
5. RESISTENCIA A LA LEPTINA 54
6. PRESENTACIÓN DE LOS ARTÍCULOS QUE COMPONEN LA
TESIS 57
6.1. Artículo 1 (Guerra et al. 2007) 58
6.2 . Artículo 2 (Guerra et al. 2008) 58
6.3. Artículo 3 (Fuentes et al. 2010) 59
6.4. Artículo 4 (Fuentes et al. 2010b) 59

12
OBJETIVOS 61
RESUMEN DE LA METODOLOGÍA APLICADA 65
1. SUJETOS 67
2. COMPOSICIÓN CORPORAL 67
3. PROCESAMIENTO DE MUESTRAS DE SANGRE 69
4. BIOPSIAS MUSCULARES 69
5. OBTENCIÓN DE EXTRACTOS PROTEICOS A PARTIR DE
BIOPSIAS MUSCULARES 70
6. OBTENCIÓN DE EXTRACTOS PROTEICOS DE
HIPOTÁLAMO HUMANO 70
7. ELECTROFORESIS DE PROTEINAS Y TINCIÓN DE GELES 70
8. ANÁLISIS DE PROTEÍNAS POR WESTERN BLOT 71
9. ENSAYOS DE COMPETICIÓN PARA OB-R 73
10. ANÁLISIS ESTADÍSTICO 74
RESUMEN DE LOS RESULTADOS 75
1. RESUMEN DE RESULTADOS DEL ARTÍCULO 1
(Guerra et al. 2007) 77
2. RESUMEN DE RESULTADOS DEL ARTÍCULO 2
(Guerra et al. 2008) 78
3. RESUMEN DE RESULTADOS DEL ARTÍCULO 3
(Fuentes et al. 2010) 79
4. RESUMEN DE RESULTADOS DEL ARTÍCULO 4
(Fuentes et al. 2010b) 81
13
DISCUSIÓN 85
ESTUDIO 1: Receptores de leptina en músculo
esquelético humano. 87
ESTUDIO 2: Dimorfismo sexual en los receptores musculares
de leptina en humanos, leptina circulante y sensivilidad a la
insulina. 89
ESTUDIO 3: Reducción de la expresión de la expresión
proteica del receptor muscular de leptina de 170 KDa en sujetos
obesos: un potencial mecanismo de resistencia a la leptina. 94
ESTUDIO 4: Señalización muscular en respuesta al ejercicio
de esprint en hombres y mujeres. 99
CONCLUSIONES 105
CONCLUSIONS 109
BIBLIOGRAFÍA 113
ANEXO: ARTÍCULOS QUE COMPONEN LA TESIS 135

RESUMEN

Resumen
17
La leptina es una adipocitoquina sintetizada y secretada por el tejido
adiposo en proporción directa a la cantidad de masa grasa. La leptina ejerce
acciones tanto a nivel del sistema nervioso central (hipotálamo), donde suprime
el apetito y aumenta el gasto energético, como a nivel periférico (músculo
esquelético), donde estimula la oxidación de grasas. Esta hormona ejerce sus
acciones normales tras la interacción con su receptor (OB-R), el cual se
encuentra presente en numerosos tejidos, incluido el músculo esquelético. La
obesidad humana generalmente, se encuentra asociada a una concentración
sérica permanentemente elevada de leptina, lo que conduce a la aparición de
resistencia a la leptina.
En esta tesis doctoral, se ha investigado la expresión de las diferentes
isoformas del receptor de leptina en músculo esquelético humano, el potencial
dimorfismo sexual en la expresión del mismo, los mecanismos moleculares
mediadores de la resistencia muscular a la leptina asociada a la obesidad y la
influencia del ejercicio físico en las vías de señalización activados por la
hormona en hombres y mujeres sanos.
En el primer estudio de la tesis participaron 14 hombres sanos. La
expresión proteica de los receptores de leptina fue determinada en músculo
esquelético, tejido adiposo subcutáneo e hipotálamo, utilizando un anticuerpo
contra el receptor de leptina humano. Tres bandas con un peso molecular
aproximado de 170, 128 y 98 KDa fueron identificadas por Western blot con el
anticuerpo dirigido contra OB-R. Las tres bandas fueron identificadas en
músculo esquelético, las bandas de 98 y 170 KDa fueron detectadas en
hipotálamo y las bandas de 98 y 128 KDa fueron detectadas en el tejido
adiposo subcutáneo del muslo. La banda de 128 KDa no fue detectada en
cuatro de los sujetos, mientras que en el resto de sujetos su aparición se
explica por la presencia de tejido adiposo intermuscular, como demostró el uso
de un anticuerpo dirigido contra la perilipina A. No se encontró correlación entre
la concentración basal de leptina en sangre y la densidad de la banda de 170
KDa. Concluimos que una isoforma larga del receptor de leptina con un peso
molecular cercano a 170 KDa se expresa a nivel proteico en músculo
Resumen
18
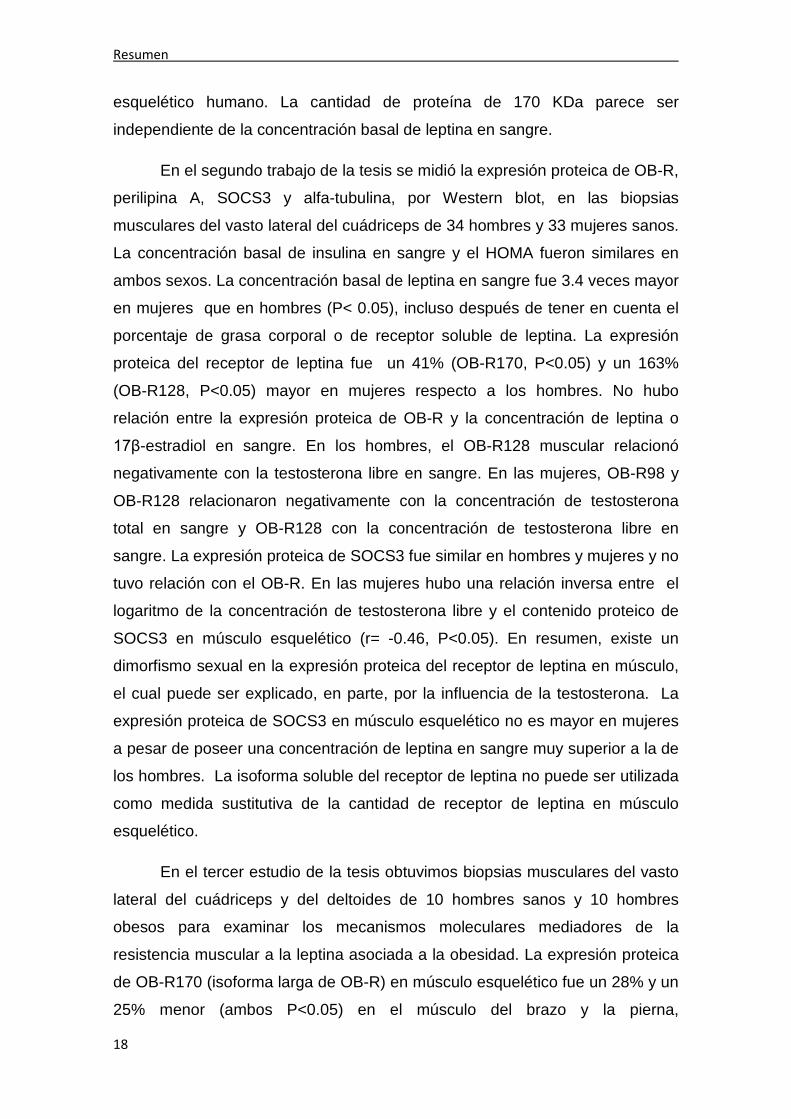
esquelético humano. La cantidad de proteína de 170 KDa parece ser
independiente de la concentración basal de leptina en sangre.
En el segundo trabajo de la tesis se midió la expresión proteica de OB-R,
perilipina A, SOCS3 y alfa-tubulina, por Western blot, en las biopsias
musculares del vasto lateral del cuádriceps de 34 hombres y 33 mujeres sanos.
La concentración basal de insulina en sangre y el HOMA fueron similares en
ambos sexos. La concentración basal de leptina en sangre fue 3.4 veces mayor
en mujeres que en hombres (P< 0.05), incluso después de tener en cuenta el
porcentaje de grasa corporal o de receptor soluble de leptina. La expresión
proteica del receptor de leptina fue un 41% (OB-R170, P<0.05) y un 163%
(OB-R128, P<0.05) mayor en mujeres respecto a los hombres. No hubo
relación entre la expresión proteica de OB-R y la concentración de leptina o
17β-estradiol en sangre. En los hombres, el OB-R128 muscular relacionó
negativamente con la testosterona libre en sangre. En las mujeres, OB-R98 y
OB-R128 relacionaron negativamente con la concentración de testosterona
total en sangre y OB-R128 con la concentración de testosterona libre en
sangre. La expresión proteica de SOCS3 fue similar en hombres y mujeres y no
tuvo relación con el OB-R. En las mujeres hubo una relación inversa entre el
logaritmo de la concentración de testosterona libre y el contenido proteico de
SOCS3 en músculo esquelético (r= -0.46, P<0.05). En resumen, existe un
dimorfismo sexual en la expresión proteica del receptor de leptina en músculo,
el cual puede ser explicado, en parte, por la influencia de la testosterona. La
expresión proteica de SOCS3 en músculo esquelético no es mayor en mujeres
a pesar de poseer una concentración de leptina en sangre muy superior a la de
los hombres. La isoforma soluble del receptor de leptina no puede ser utilizada
como medida sustitutiva de la cantidad de receptor de leptina en músculo
esquelético.
En el tercer estudio de la tesis obtuvimos biopsias musculares del vasto
lateral del cuádriceps y del deltoides de 10 hombres sanos y 10 hombres
obesos para examinar los mecanismos moleculares mediadores de la
resistencia muscular a la leptina asociada a la obesidad. La expresión proteica
de OB-R170 (isoforma larga de OB-R) en músculo esquelético fue un 28% y un
25% menor (ambos P<0.05) en el músculo del brazo y la pierna,

Resumen
19
respectivamente, de los sujetos obesos frente a los sujetos control. En los
sujetos control, la expresión proteica de SOCS3 y la fosforilación de STAT3,
AMPKα y ACCβ fue similar en el deltoides y en el vasto lateral del cuádriceps.
En los sujetos obesos, la expresión proteica del receptor de leptina fue mayor
en el deltoides que en el vasto lateral, mientras que la expresión proteica de
SOCS3 fue mayor y los niveles de fosforilación de STAT3, AMPKα y ACCβ
fueron menores en el vasto lateral comparado con el deltoides (todos P<0.05).
En resumen, la expresión proteica de los receptores de leptina y la señalización
por leptina en músculo esquelético se ven reducidas en obesidad,
particularmente en los músculos de la pierna.
En el cuarto y último trabajo de esta tesis doctoral se investigó el posible
dimorfismo sexual en la señalización muscular en respuesta a un ejercicio de
esprint de 30s (Wingate). Para ello fueron obtenidas biopsias musculares
antes, inmediatamente después del ejercicio de esprint y a los 30 y 120
minutos del periodo de recuperación en el vasto lateral del cuádriceps de 17
hombres y 10 mujeres sanos. La fosforilación de Thr172-AMPKα, ACCβ Ser221,
Thy705-STAT3, Thy202/Thy204-ERK1/2 y Thy180/Thy182-p38MAPK en respuesta al
ejercicio de esprint fue similar en hombres y mujeres. La fosforilación de Thr172-
AMPKα aumentó 4 veces a los 30 minutos del periodo de recuperación en
hombres y mujeres (P<0.01). La fosforilación de ACCβ Ser221 aumentó 3 veces
justo después del ejercicio de esprint y a los 30 minutos del periodo de
recuperación en hombres y mujeres (p<0.01). La fosforilación de Thy705-STAT3
aumentó 2 horas después del test de Wingate respecto a los valores
observados justo después del ejercicio (P<0.05) y 30 minutos después del test
de Wingate la fosforilación de Thy202/Thy204-ERK1/2 aumentó 2.5 veces
respecto a los valores encontrados antes del ejercicio y justo después del
ejercicio (ambos P<0.05). Concluimos que la señalización muscular en
respuesta a un ejercicio de esprint mediada por AMPK, ACC, STAT3, ERK y
p38MAPK es esencialmente similar en hombres y mujeres. La fosfosrilación de
AMPK, ACC, STAT3 y ERK aumenta de manera notable después de un
ejercicio de esprint de 30 segundos (Wingate test) en el músculo vasto lateral.

ABSTRACT

Abstract
23
Leptin is an adipocytokine synthesized and secreted by adipose tissue in
direct proportion to the amount of fat mass. Leptin acts on both the central
nervous system (hypothalamus), where inhibits appetite and increases energy
expenditure, and the peripheral tissues (such as skeletal muscle), where
stimulates fat oxidation. This hormone exerts its normal actions through the
interaction with its receptor (OB-R), which is present in many tissues, including
skeletal muscle. Human obesity is generally associated with a sustained high
leptin serum concentration and leptin resistance.
In this doctoral thesis, we have studied the protein expression of different
leptin receptor isoforms (OB-Rs) in human skeletal muscle, the potential sexual
dimorphism in muscle OB-R protein expression, potential molecular mediators
of muscle leptin resistance associated with obesity and, finally, the influence of
acute bicycling exercise on skeletal muscle signaling pathways known to be
activated in rodent skeletal muscle by leptin.
In the first study of the thesis participated 14 healthy men. The
expression of OB-R protein was determined in skeletal muscle, subcutaneous
adipose tissue, and hypothalamus using a polyclonal rabbit antihuman leptin
receptor. Three bands with a molecular mass close to 170, 128, and 98 KDa
were identified by Western blot with the anti-OB-R antibody. All three bands
were identified in skeletal muscle: the 98 KDa and 170 KDa bands were
detected in hypothalamus, and the 98 KDa and 128 KDa bands were detected
in thigh subcutaneous adipose tissue. The 128-KDa isoform was not detected in
four subjects, whereas in the rest its occurrence was fully explained by the
presence of intermuscular adipose tissue, as demonstrated using an anti-
perilipin A antibody. No relationship was observed between the basal
concentration of leptin in serum and the 170 KDa band density. In conclusion, a
long isoform of the leptin receptor with a molecular mass close to 170 KDa is
expressed at the protein level in human skeletal muscle. The amount of 170
KDa protein appears to be independent of the basal concentration of leptin in
serum.
In the second study of the thesis the protein expression of OB-R, perilipin
A, SOCS3 and alpha-tubulin was assessed by Western blot in muscle biopsies

Abstract
24
obtained from the m. vastus lateralis in thirty-four men and thirty-three women.
Basal serum insulin concentration and HOMA were similar in both genders.
Serum leptin concentration was 3.4 times higher in women compared to men
(P<0.05) and this difference remained significant after accounting for the
differences in percentage of body fat or soluble leptin receptor. OB-R protein
was 41% (OB-R170, P<0.05) and 163% (OB-R128, P<0.05) greater in women
than men. There was no relationship between OB-R expression and the serum
concentrations of leptin or 17β-estradiol. In men, muscle OB-R128 protein was
inversely related to serum free testosterone. In women, OB-R98 and OB-R128
were inversely related to total serum testosterone concentration, and OB-R128
to serum free testosterone concentration. SOCS3 protein expression was
similar in men and women and was not related to OB-R. In women, there was
an inverse relationship between the logarithm of free testosterone and SCOS3
protein content in skeletal muscle (r = -0.46, P<0.05). From this study it was
concluded that there is a gender dimorphism in skeletal muscle leptin receptors
expression, which can be partly explained by the influence of testosterone.
SOCS3 expression in skeletal muscle is not up-regulated in women, despite
very high serum leptin concentrations compared to men. The circulating form of
the leptin receptor can not be used as a surrogate measure of the amount of
leptin receptors expressed in skeletal muscles.
In the third study of the thesis we obtained muscle biopsies from the
vastus lateralis of the quadriceps and deltoid muscles of 10 healthy men and 10
obese men to examine the molecular mediators of muscle to leptin resistance
associated with obesity. Skeletal muscle OB-R170 (OB-R long isoform) protein
expression was 28 and 25% lower (both P<0.05) in arm and leg muscles,
respectively, of obese men compared with control subjects. In normal-weight
subjects, SOCS3 protein expression, and STAT3, AMPKα and ACCβ
phosphorylation, were similar in the deltoid and vastus lateralis muscles. In
obese subjects, the deltoid muscle had a greater amount of leptin receptors
than the vastus lateralis, whilst SOCS3 protein expression was increased and
basal STAT3, AMPKα and ACCβ phosphorylation levels were reduced in the
vastus lateralis compared with the deltoid muscle (all P<0.05). From this study it
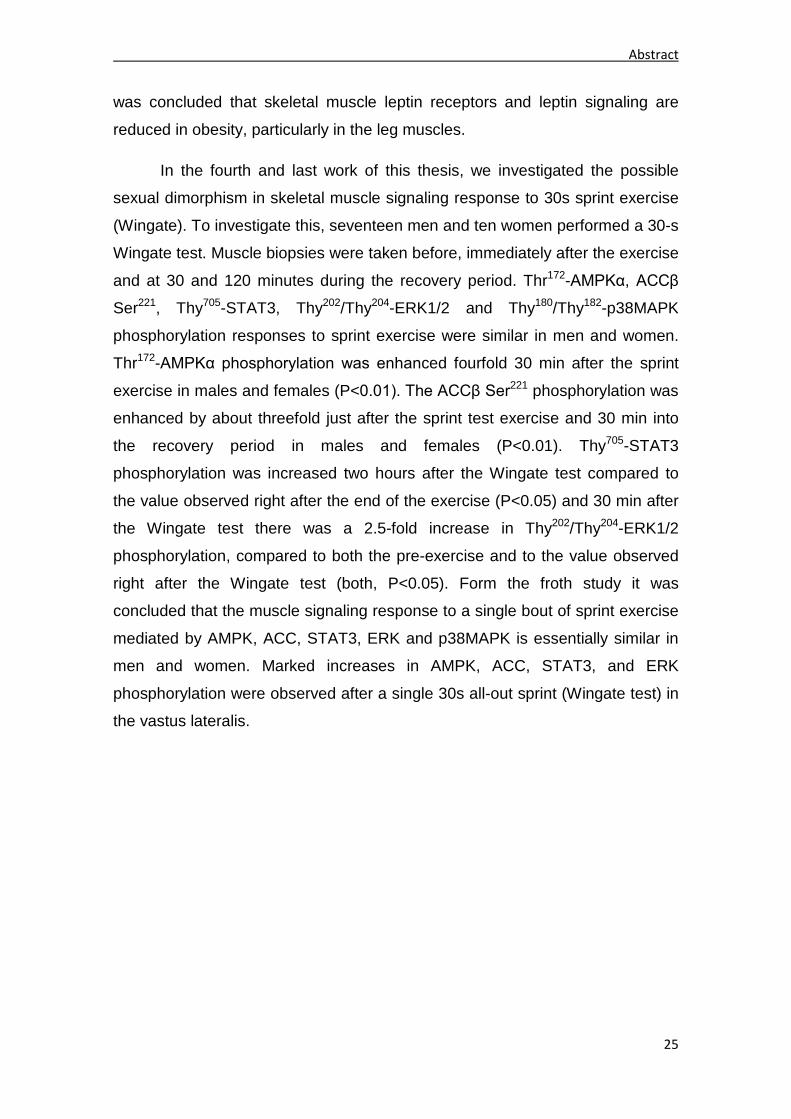
Abstract
25
was concluded that skeletal muscle leptin receptors and leptin signaling are
reduced in obesity, particularly in the leg muscles.
In the fourth and last work of this thesis, we investigated the possible
sexual dimorphism in skeletal muscle signaling response to 30s sprint exercise
(Wingate). To investigate this, seventeen men and ten women performed a 30-s
Wingate test. Muscle biopsies were taken before, immediately after the exercise
and at 30 and 120 minutes during the recovery period. Thr172-AMPKα, ACCβ
Ser221, Thy705-STAT3, Thy202/Thy204-ERK1/2 and Thy180/Thy182-p38MAPK
phosphorylation responses to sprint exercise were similar in men and women.
Thr172-AMPKα phosphorylation was enhanced fourfold 30 min after the sprint
exercise in males and females (P<0.01). The ACCβ Ser221 phosphorylation was
enhanced by about threefold just after the sprint test exercise and 30 min into
the recovery period in males and females (P<0.01). Thy705-STAT3
phosphorylation was increased two hours after the Wingate test compared to
the value observed right after the end of the exercise (P<0.05) and 30 min after
the Wingate test there was a 2.5-fold increase in Thy202/Thy204-ERK1/2
phosphorylation, compared to both the pre-exercise and to the value observed
right after the Wingate test (both, P<0.05). Form the froth study it was
concluded that the muscle signaling response to a single bout of sprint exercise
mediated by AMPK, ACC, STAT3, ERK and p38MAPK is essentially similar in
men and women. Marked increases in AMPK, ACC, STAT3, and ERK
phosphorylation were observed after a single 30s all-out sprint (Wingate test) in
the vastus lateralis.

ABREVIATURAS

Abreviaturas
29
• ACC, Acetil Coenzima-A Carboxilasa.
• ADN, Ácido Desoxirribonucleico.
• AGRP (Agouti Related Peptide).
• AKT (Protein Kinase B), proteína kinasa B.
• AMP, Adenosin Monofosfato.
• AMPK (5’-AMP-Activated Protein Kinase), proteína quinasa activada por AMP.
• ARNm, Ácido Ribonucleico Mensajero.
• AS160 (AKT Substrate 160 KDa), sustrato de AKT de 160 KDa.
• ATP, Adenosín Trifosfato.
• CART (Cocaine and Amphetamine Regulated Transcrip), peptido anorexigénico regulado por cocaína y anfetamina.
• C-FOS, gen diana de la leptina.
• CNTF (Ciliary Neurotrophic Factor), factor neorutrófico ciliar.
• CPTI (Carnitine Palmitoyltransferase I), carnitina palmitoil transferasa I.
• CT-1 (Cardiotrophin-1), cardiotrofina 1.
• EGR-1 (Early Growth Response Protein 1), gen diana de la leptina.
• ERK (Extracellular Regulated Kinases), proteína quinasa regulada por señales extracelulares.
• FSH (Follicle-stimulating Hormone), hormona folículo estimulante.
• GLUT4 (Glucose Transporter Type 4), transportador de glucosa tipo 4.
• GRB-2 (Growth Factor Receptor Binding-2), factor de crecimiento de unión al receptor de tipo 2.
• IL-6, IL-11 y IL-12, interleuquinas 6, 11 y 12.
• IMC, Índice de Masa Corporal.
• IR (Insulin Receptor), receptor de insulina.
• IRS (Insulin Receptor Sustrate), sustrato del receptor de insulina.
• JAK (Janus Kinase).
• KDa, Kilodalton.
• LIF (Leukaemia Inhibitory Factor), factor inhibidor de leucemia.

Abreviaturas
30
• LKB1, proteína quinasa de AMPK.
• MAPK (Mitogen-Activated Protein Kinase), proteína quinasa activada por mitógenos.
• NPY (Neuropeptide Y), neuropéptido Y.
• OB-R, receptor de leptina.
• OSM (Oncostatin-M), oncostatina M.
• PI3K (Phospo-Inositide 3-Kinase), proteína quinasa activada por 3-fosfatidil inositol.
• PKC (Protein Kinase C), proteína quinasa C.
• POMC (Proopiomelanocortin), proopiomelanocortina.
• PP2A, proteína fosfatasa 2A.
• PP2C, proteína fosfatasa 2C.
• PTP1B (Protein Tyrosine Phosphatase 1B), proteína fosfatasa de tirosina 1B.
• RabGAP, sustrato de AKT de 160 KDa.
• SHP-2, fosfatasa de tirosina.
• RM, Repetición Máxima.
• SNC, Sistema Nervioso Central.
• SOCS (Suppresor of Cytokine Signalling), proteína supresora de la señalización por citoquinas.
• STAT (Signal Transducers and Activator of Transcription), proteína transductora de la señalización y activadora de la transcripción.
• VO2MAX, consumo de oxígeno máximo.
• Y1138, tirosina 1138.
• Y985, tirosina 985.

INTRODUCCIÓN

Introducción
33
1. OBESIDAD
Los cambios en el estilo de vida y alimentación han conducido en las
últimas décadas a un progresivo aumento de la incidencia de la obesidad,
siendo una de las alteraciones metabólicas más frecuentes (Gomez-Ambrosi et
al., 2006). La obesidad constituye el principal problema de salud comunitaria al
que deberá enfrentarse la sociedad occidental y especialmente la sociedad
española en los próximos años (Rodriguez Artalejo et al., 2002; Aranceta et al.,
2003; Gutierrez-Fisac et al., 2005). De hecho, nuestro país presenta índices de
los más elevados de Europa: en España, el 17,1% de las personas de más de
18 años presentan obesidad y el 36,7% sobrepeso. Esta situación es más
frecuente en el caso de los hombres (18,6% con obesidad y 44,2% con
sobrepeso) que en el de las mujeres (15,6% y 29,2%), y aumenta con la edad
para ambos sexos (Encuesta europea de salud en España, INE, 2009). En la
mayoría de los casos la obesidad se asocia a una falta de actividad física y a
un desequilibrio entre la energía consumida y energía gastada, afectando a
todos los segmentos de la población, desde niños a adultos y ancianos
(Aranceta et al., 2001; Aranceta et al., 2003; Serra Majem et al., 2003;
Gutierrez-Fisac et al., 2004; Gutierrez-Fisac et al., 2005). Para lograr una
disminución de la masa grasa corporal es necesario instaurar un balance
energético negativo, es decir que el gasto energético diario sea superior a la
ingestión diaria de calorías. Para ello es importante aumentar la actividad física
diaria (Bar-Or et al., 1998; Villeneuve et al., 1998; Ara et al., 2004; Blair &
Church, 2004; Lobstein et al., 2004; Borodulin et al., 2005). Además, la práctica
habitual de actividad física se asocia, independientemente del grado de
adiposidad, a una menor mortalidad en la población general (Hu et al., 2004) y
a un menor riesgo cardiovascular (Blair & Jackson, 2001; Borodulin et al.,
2005).
La obesidad ocasiona un desequilibrio metabólico que afecta a múltiples
órganos, pero en especial al tejido adiposo, el hígado, el páncreas y el músculo
esquelético. Buena parte de las alteraciones metabólicas asociadas a la
Introducción
34
obesidad están relacionadas con la resistencia a la insulina y a la leptina (Tilg &
Moschen, 2008).
2. LEPTINA
El descubrimiento de la leptina a finales del año 1994 (Zhang et al.,
1994) supuso un paso muy importante en el conocimiento de los mecanismos
moleculares mediados por los diferentes factores producidos por el tejido
adiposo sobre la homeostasis energética. El gen ob, el cual codifica la leptina,
está estructurado en tres exones separados por dos intrones (He et al., 1995) y
mapea en 7q31.3 en humanos (Isse et al., 1995). La leptina es una hormona de
16 KDa producida por los adipocitos en proporción directa a la masa grasa y
actúa disminuyendo el apetito y aumentando el metabolismo basal a nivel del
sistema nervioso central (SNC) (Friedman & Halaas, 1998; Muoio et al., 1999;
Dulloo et al., 2002; Wauters et al., 2002). Se ha observado cómo una mutación
en el gen ob produce obesidad en ratones (Zhang et al., 1994; Campfield et al.,
1995; Halaas et al., 1995; Pelleymounter et al., 1995). Esta mutación, muy poco
frecuente en humanos, produce hiperplasia del tejido adiposo, obesidad
mórbida e hipogonadismo hipotalámico (Montague et al., 1997; Strobel et al.,
1998; Rau et al., 1999). La leptina posee una estructura similar a la que poseen
los miembros de la familia de citoquinas de cadena larga, incluyendo al LIF
(LeukaemiaIinhibitory Factor), CNTF (Ciliary Neurotrophic Factor), OSM
(Oncostatin-M) y CT-1 (Cardiotrophin-1), así como a IL-6 (Interleukin-6), IL-11
(Interleukin-11) e IL-12 (Interleukin-12) (Madej et al., 1995; Kline et al., 1997;
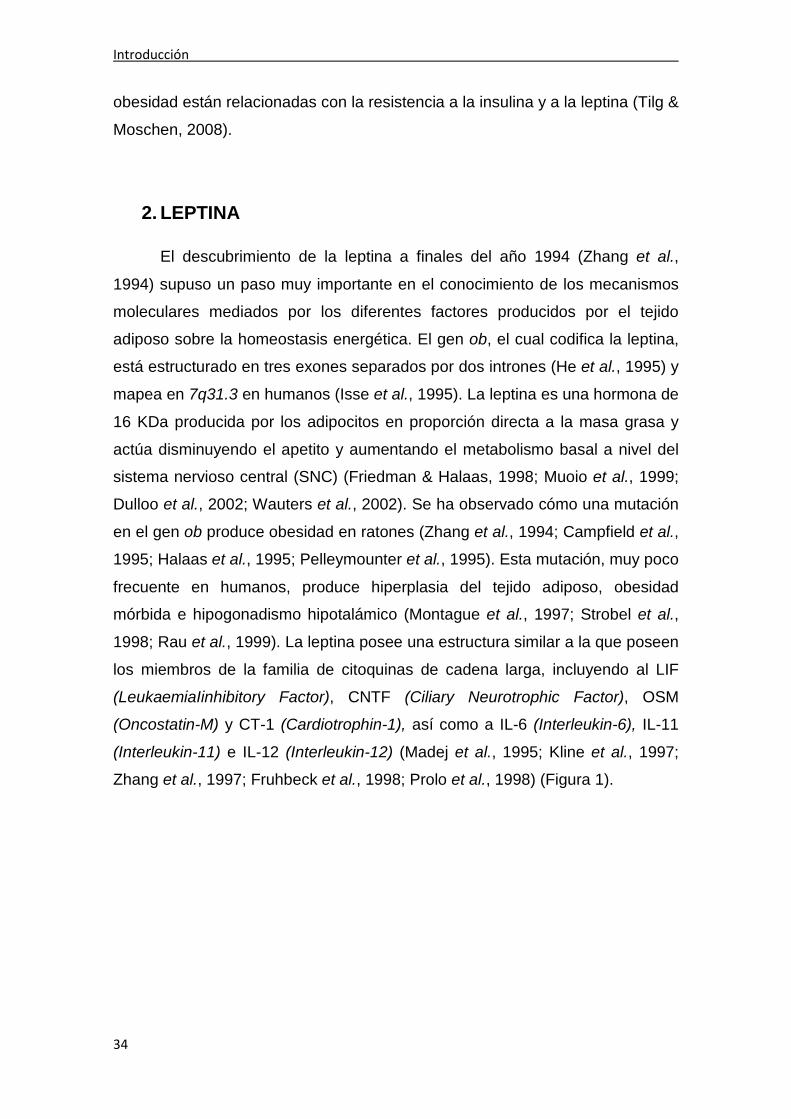
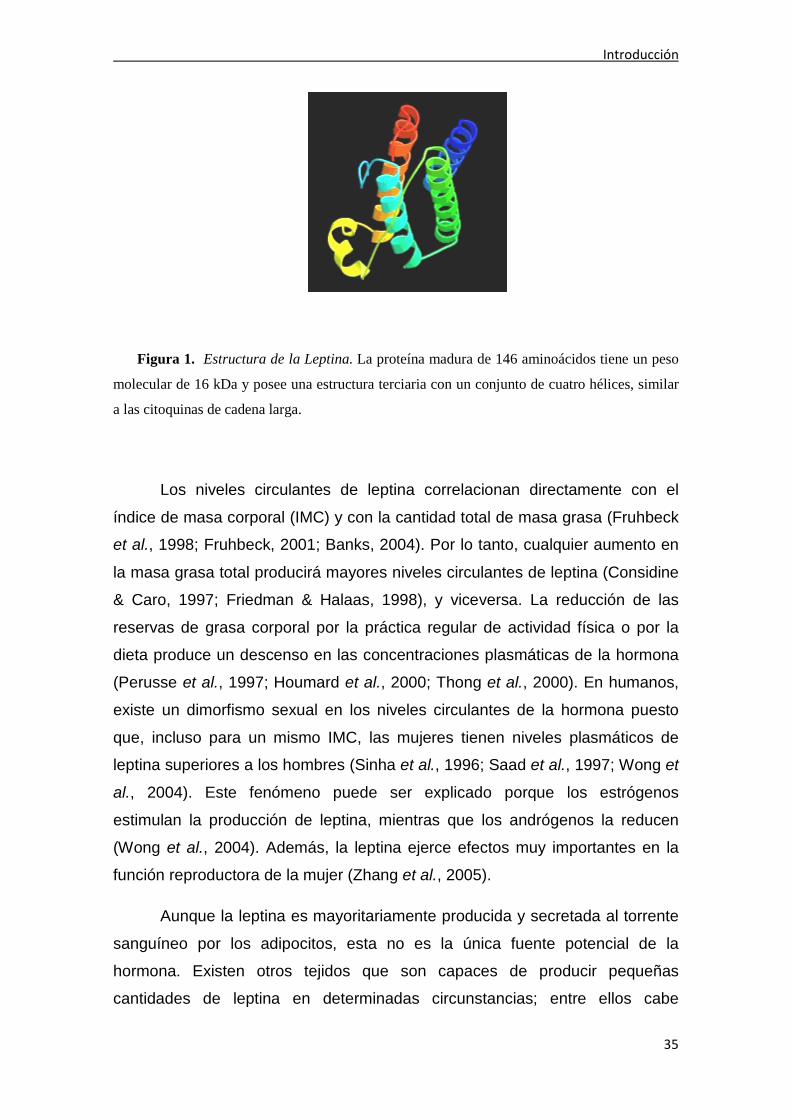
Zhang et al., 1997; Fruhbeck et al., 1998; Prolo et al., 1998) (Figura 1).
Introducción
35
Figura 1. Estructura de la Leptina. La proteína madura de 146 aminoácidos tiene un peso
molecular de 16 kDa y posee una estructura terciaria con un conjunto de cuatro hélices, similar
a las citoquinas de cadena larga.
Los niveles circulantes de leptina correlacionan directamente con el
índice de masa corporal (IMC) y con la cantidad total de masa grasa (Fruhbeck
et al., 1998; Fruhbeck, 2001; Banks, 2004). Por lo tanto, cualquier aumento en
la masa grasa total producirá mayores niveles circulantes de leptina (Considine
& Caro, 1997; Friedman & Halaas, 1998), y viceversa. La reducción de las
reservas de grasa corporal por la práctica regular de actividad física o por la
dieta produce un descenso en las concentraciones plasmáticas de la hormona
(Perusse et al., 1997; Houmard et al., 2000; Thong et al., 2000). En humanos,
existe un dimorfismo sexual en los niveles circulantes de la hormona puesto
que, incluso para un mismo IMC, las mujeres tienen niveles plasmáticos de
leptina superiores a los hombres (Sinha et al., 1996; Saad et al., 1997; Wong et
al., 2004). Este fenómeno puede ser explicado porque los estrógenos
estimulan la producción de leptina, mientras que los andrógenos la reducen
(Wong et al., 2004). Además, la leptina ejerce efectos muy importantes en la
función reproductora de la mujer (Zhang et al., 2005).
Aunque la leptina es mayoritariamente producida y secretada al torrente
sanguíneo por los adipocitos, esta no es la única fuente potencial de la
hormona. Existen otros tejidos que son capaces de producir pequeñas
cantidades de leptina en determinadas circunstancias; entre ellos cabe
Introducción
36
destacar la placenta, la mucosa gástrica, la médula ósea, el epitelio de la
glándula mamaria, el músculo esquelético, la pituitaria, el hipotálamo y el hueso
(Masuzaki et al., 1997; Bado et al., 1998; Morash et al., 1999; Ahima & Flier,
2000). Inicialmente se pensó que los efectos de la leptina se producían
únicamente a nivel central, sin embargo, actualmente se sabe que la leptina es
una hormona pleiotrópica que ejerce funciones fisiológicas tanto en el SNC
como en múltiples tejidos periféricos (Fruhbeck, 2001; Akerman et al., 2002;
Baratta, 2002; Fruhbeck, 2002; Muoio & Lynis Dohm, 2002; Harvey & Ashford,
2003; Bjorbaek & Kahn, 2004). La leptina controla el apetito a nivel
hipotalámico a través de la estimulación de la expresión de péptidos
anorexigénicos como POMC (Proopiomelanocortin) y CART (Cocaine and
Amphetamine Regulated Transcrip) y la inhibición de la expresión de péptidos
orexigénicos como NPY (Neuropeptide Y) y AGRP (Agouti Related Peptide)
(Flier & Maratos-Flier, 1998; Sawchenko, 1998; Elmquist et al., 1999). Entre los
diferentes tejidos periféricos diana de la acción de la leptina se encuentra el
músculo esquelético, principal tejido regulador del metabolismo basal y uno de
los principales moduladores del metabolismo de los ácidos grasos y de la
glucosa (Steinberg & Dyck, 2000). En este tejido, la hormona actúa
incrementando la oxidación de ácidos grasos, reduciendo la acumulación de
grasa intramuscular y aumentando la captación de glucosa y el gasto
energético (Berti & Gammeltoft, 1999; Ceddia et al., 2001; Yaspelkis et al.,
2001; Muoio & Lynis Dohm, 2002; Steinberg et al., 2002b; Argiles et al., 2005)
(Figura 2). El descubrimiento de esta hormona ha permitido en los últimos años
un gran avance en el conocimiento de la regulación de la ingesta de alimentos
(apetito) y del control del peso corporal, de la diabetes, el metabolismo, la
reproducción, la respuesta immune, la fisiopatología cardiovascular, la función
respiratoria y el crecimiento y desarrollo (Ahima & Flier, 2000; Fruhbeck, 2006).
El hecho de que esta hormona ejerza acciones sobre múltiples tejidos ha
supuesto que en los últimos años se haya realizado un gran esfuerzo
investigador con el objeto de profundizar en el conocimiento de las diferentes
vías bioquímicas y moleculares activadas por la leptina y que gobiernan los
diferentes efectos de la hormona, lo cual podría tener importantes
implicaciones en el tratamiento de algunas patologías, como la obesidad.

Introducción
37
Figura 2. Pleiotropismo de las acciones de la leptina en el Sistema Nervioso Central (SNC)
y en tejidos periféricos. La leptina regula determinadas variables que controlan el peso corporal
y la homeostasis energética tanto a nivel central como periférico, destacando especialmente las
acciones ejercidas por la hormona a nivel de uno de los principales tejidos moduladores del
metabolismo basal, como es el músculo esquelético.
3. RECEPTORES DE LEPTINA
La naturaleza pleiotrópica de las acciones de la leptina se debe a la
distribución universal de su receptor. La hormona ejerce sus acciones, tanto a
nivel central como a nivel periférico (Considine & Caro, 1997; Friedman &
Halaas, 1998; Gallagher et al., 2005; Guerra et al., 2007), interaccionando con
receptores transmembrana (OB-Rs) que poseen una estructura muy similar a
los pertenecientes a la familia de receptores de citokinas de la clase I (White &
Tartaglia, 1996; Tartaglia, 1997). Existen al menos seis isoformas de OB-Rs,
designadas como: OB-Ra, OB-Rb, OB-Rc, OB-Rd, OB-Re y Ob-Rf; generadas
por procesamiento alternativo de un único ARNm y/o por procesamiento
proteolítico de los productos proteicos subsecuentes (Lee et al., 1996; Chua et
al., 1997; Tartaglia, 1997). Todas estas isoformas poseen en común un dominio
extracelular de unos 800 aminoácidos y un dominio transmembrana de 34
aminoácidos; y difieren en el dominio intracelular que es característico de cada

Introducción
38
isoforma (Lee et al., 1996; Chua et al., 1997; Tartaglia, 1997). En función de
estos dominios, las isoformas puede clasificarse en: corta, secretada o soluble
y larga (Figura 3).
Figura 3. Representación de los diferentes dominios de las isoformas larga (OB-Rb), corta
(OB-Ra) y secretada (OB-Re) del receptor de leptina. Únicamente OB-Rb posee una cola
citoplasmática, altamente conservada en múltiples especies, que contiene los motivos Box 1
(B1) y Box 2 (B2), necesarios para la interacción y máxima activación de determinadas
quinasas intracelulares.
A pesar de que las isoformas cortas del receptor (OB-Ra, OB-Rc, OB-
Rd y Ob-Rf) poseen una pequeña cola citoplasmática de 30-40 aminoácidos,
sólo la isoforma larga (OB-Rb) fue inicialmente considerada como la isoforma
funcional del receptor, porque es la única que posee una cola citoplasmática de
300 aminoácidos, altamente conservada en numerosas especies, que contiene
una serie de motivos imprescindibles para la interacción de otras proteínas y
para la posterior activación de determinadas vías de señalización (Tartaglia et
al., 1995; Chua et al., 1997; Tartaglia, 1997).

Introducción
39
Se ha observado que la ausencia de OB-Rb es la responsable del
fenotipo obeso del ratón db/db y de la rata fa/fa (Chua et al., 1996). Otros
estudios han demostrado que la eliminación selectiva de todas las isoformas de
OB-R en neuronas produce obesidad en ratones, lo que evidencia la
importancia de la acción neuronal de la leptina en lo que se refiere a la
modulación del peso corporal (Cohen et al., 2001). La isoforma larga del
receptor (OB-Rb) se expresa mayoritariamente en el hipotálamo (Burguera et
al., 2000). Las isoformas cortas también se expresan en determinadas regiones
del SNC como son los plexos coroideos, aunque su expresión es mayoritaria
en tejidos periféricos como el adiposo (Bjorbaek & Kahn, 2004). Estudios
previos han revelado la presencia del ARN mensajero (ARNm) de OB-R en
numerosos tejidos periféricos como el hueso, corazón, hígado, pulmón,
glándula adrenal, testículos, placenta, tejido adiposo (Ahima & Flier, 2000;
Cornish et al., 2002; Margetic et al., 2002; Muoio & Lynis Dohm, 2002; Bjorbaek
& Kahn, 2004) y músculo esquelético humano (Ceddia et al., 2001; Ramsay &
Richards, 2005). Las funciones de las isoformas cortas no están
completamente aclaradas, si bien podrían ser la re-captación de la leptina
desde el fluido cerebroespinal, así como el transporte mediado por el receptor
de la hormona a través de la barrera hematoencefálica (Hileman et al., 2002;
Bjorbaek & Kahn, 2004). Por otro lado, se ha demostrado que la isoforma
secretada o soluble (OB-Re), la cual carece del dominio intracelular, es la
principal proteína unida a la leptina (Leptin Binding Protein) en la sangre
humana (Lammert et al., 2001), y que sus niveles circulantes dependen del
sexo, del grado de adiposidad y de la administración de su hormona (Chan et
al., 2002). Inicialmente, la investigación de las diferentes acciones de la leptina
sobre la homeostasis energética y el control del peso corporal, se centró
únicamente en el SNC. Sin embargo en la actualidad, y debido
fundamentalmente a la amplia distribución de las isoformas cortas y largas de
OB-R en numerosos tejidos extra-neurales, se está prestando un interés cada
vez mayor a los efectos de esta hormona en la periferia como prueba del
pleiotropismo funcional de la misma.
El ejercicio regular en ratas llevado a cabo durante doce semanas redujo
la cantidad de ARNm de OB-Rb en el nucleo arcuato del hipotálamo (Kimura et
Introducción
40
al., 2004). En cuanto a la influencia del entrenamiento crónico sobre los
receptores de leptina en músculo esquelético humano, en nuestro grupo de
investigación hemos demostrado que la expresión proteica de OB-Rb en el
tríceps braquial del brazo dominante de tenistas profesionales es mayor que en
brazo no dominante (Olmedillas et al., 2009), lo que sugiere que la hipertrofia
muscular producida por el entrenamiento podría modular positivamente la
expresión del receptor.
4. PRINCIPALES VÍAS DE SEÑALIZACIÓN ACTIVADAS POR LEPTINA
En los últimos años la investigación sobre los múltiples efectos de la
leptina se ha centrado en el estudio de las diferentes vías de señalización
activadas tras su unión al receptor; esto ha permitido profundizar en el
conocimiento de los mecanismos bioquímicos y moleculares que gobiernan las
diferentes acciones de la hormona. Inicialmente, la aceptación de la similitud
estructural del OB-R con determinados miembros de la superfamilia de
receptores de citoquinas resultó en la pronta identificación de la vía de
señalización de JAK/STAT (Janus Kinase / Signal Transducer an Activator of
Transcription) como una de las principales cascadas de señalización activadas
por la leptina (Sweeney, 2002; Sahu, 2003; Ahima & Osei, 2004; Hegyi et al.,
2004). Estudios posteriores han mostrado que sólo OB-Rb contiene una serie
de motivos en su cola citoplasmática que son necesarios para la correcta
activación de la vía de JAK/STAT (Figura 4).
Introducción
41
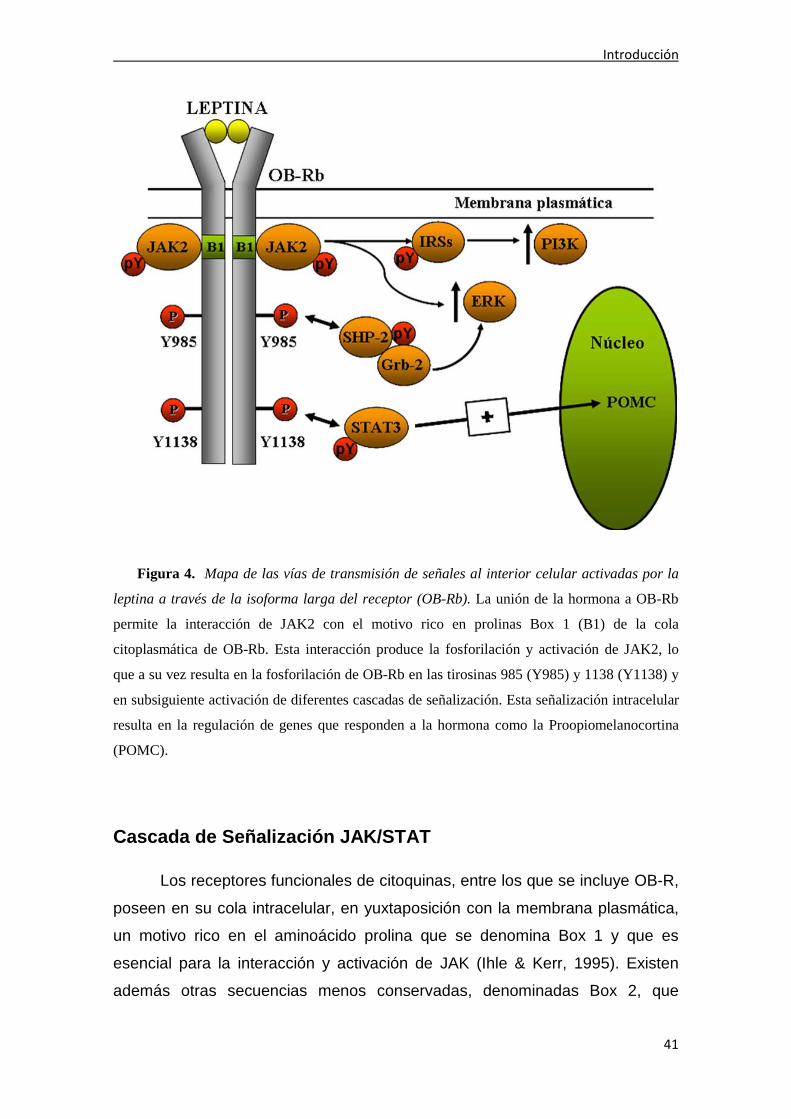
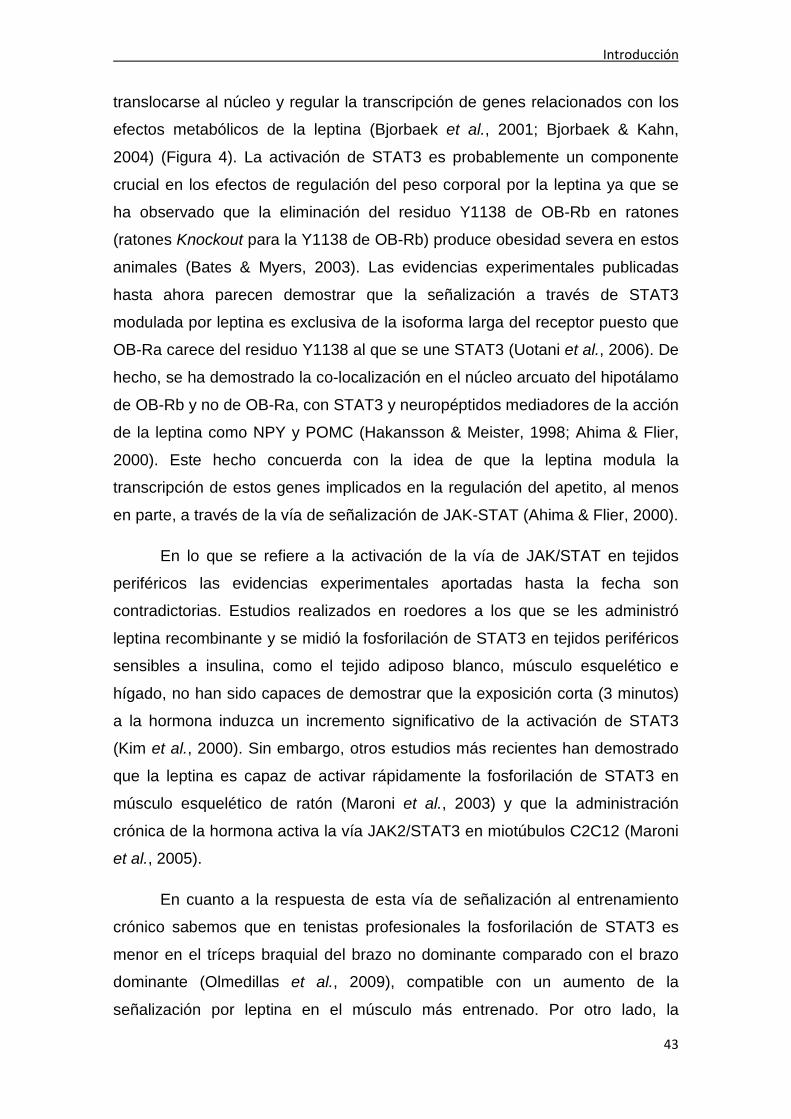
Figura 4. Mapa de las vías de transmisión de señales al interior celular activadas por la
leptina a través de la isoforma larga del receptor (OB-Rb). La unión de la hormona a OB-Rb
permite la interacción de JAK2 con el motivo rico en prolinas Box 1 (B1) de la cola
citoplasmática de OB-Rb. Esta interacción produce la fosforilación y activación de JAK2, lo
que a su vez resulta en la fosforilación de OB-Rb en las tirosinas 985 (Y985) y 1138 (Y1138) y
en subsiguiente activación de diferentes cascadas de señalización. Esta señalización intracelular
resulta en la regulación de genes que responden a la hormona como la Proopiomelanocortina
(POMC).
Cascada de Señalización JAK/STAT
Los receptores funcionales de citoquinas, entre los que se incluye OB-R,
poseen en su cola intracelular, en yuxtaposición con la membrana plasmática,
un motivo rico en el aminoácido prolina que se denomina Box 1 y que es
esencial para la interacción y activación de JAK (Ihle & Kerr, 1995). Existen
además otras secuencias menos conservadas, denominadas Box 2, que

Introducción
42
también juegan un importante papel en la interacción con JAK y en la
discriminación de las diferentes isoformas de OB-R. El receptor de leptina
carece de dominio tirosina quinasa por lo que interacciona con quinasas
citoplasmáticas, principalmente con Janus Kinase 2 (JAK2) (Ghilardi & Skoda,
1997; Tartaglia, 1997; White et al., 1997). En lo que se refiere a la señalización
activada por la leptina, se ha demostrado que sólo Box 1 y los aminoácidos que
están inmediatamente próximos, son esenciales para la activación de JAK2
(Bahrenberg et al., 2002; Kloek et al., 2002). El dominio citoplasmático de todas
las isoformas de OB-R posee el motivo Box 1 para la interacción con JAK2 en
la proximidad de la cara intracelular de la membrana, sin embargo sólo OB-Rb
presenta además el motivo Box 2 y sitios para la interacción con STAT (Kellerer
et al., 1997). Aunque inicialmente se pensó que sólo la isoforma larga era
capaz de señalizar, hoy sabemos que en algunas condiciones, la isoforma
corta del receptor de leptina (OB-Ra) posee capacidad de activar determinadas
vías de señalización mediadas a través de JAK2, sin necesidad de la presencia
de estos motivos en su cola citoplasmática intracelular (Bjorbaek et al., 1997;
Uotani et al., 2006).
Puesto que OB-Rb carece de actividad enzimática intrínseca, la
señalización a partir del mismo se produce, tras la unión a la hormona, por su
interacción no covalente con JAK2, la cual se activa como consecuencia de
esta interacción y fosforila a numerosos residuos de tirosina en otras proteínas,
al mismo tiempo que fosforila también determinados residuos de tirosina (985 y
1138) existentes en la cola intracelular del OB-Rb funcional (Bjorbaek et al.,
1997; Li & Friedman, 1999; Banks et al., 2000). Las regiones intracelulares
fosforiladas de OB-Rb, fundamentalmente la tirosina 1138 (Y1138),
proporcionan sitios de unión para las proteínas STAT. Diversos estudios
realizados “in vitro” han demostrado que la leptina es capaz de activar diversas
isoformas de STAT, como son, STAT1, 3 y 5, sin embargo otros trabajos
realizados “in vivo” han demostrado que la administración intravenosa de la
hormona sólo es capaz de activar a STAT3 en hipotálamo de ratón (Ghilardi et
al., 1996; Vaisse et al., 1996). La interacción de STAT3 con la Y1138 de OB-Rb
produce su activación, lo que a su vez provoca la disociación del receptor y la
posterior formación de dímeros de STAT3 en el citoplasma para finalmente
Introducción
43
translocarse al núcleo y regular la transcripción de genes relacionados con los
efectos metabólicos de la leptina (Bjorbaek et al., 2001; Bjorbaek & Kahn,
2004) (Figura 4). La activación de STAT3 es probablemente un componente
crucial en los efectos de regulación del peso corporal por la leptina ya que se
ha observado que la eliminación del residuo Y1138 de OB-Rb en ratones
(ratones Knockout para la Y1138 de OB-Rb) produce obesidad severa en estos
animales (Bates & Myers, 2003). Las evidencias experimentales publicadas
hasta ahora parecen demostrar que la señalización a través de STAT3
modulada por leptina es exclusiva de la isoforma larga del receptor puesto que
OB-Ra carece del residuo Y1138 al que se une STAT3 (Uotani et al., 2006). De
hecho, se ha demostrado la co-localización en el núcleo arcuato del hipotálamo
de OB-Rb y no de OB-Ra, con STAT3 y neuropéptidos mediadores de la acción
de la leptina como NPY y POMC (Hakansson & Meister, 1998; Ahima & Flier,
2000). Este hecho concuerda con la idea de que la leptina modula la
transcripción de estos genes implicados en la regulación del apetito, al menos
en parte, a través de la vía de señalización de JAK-STAT (Ahima & Flier, 2000).
En lo que se refiere a la activación de la vía de JAK/STAT en tejidos
periféricos las evidencias experimentales aportadas hasta la fecha son
contradictorias. Estudios realizados en roedores a los que se les administró
leptina recombinante y se midió la fosforilación de STAT3 en tejidos periféricos
sensibles a insulina, como el tejido adiposo blanco, músculo esquelético e
hígado, no han sido capaces de demostrar que la exposición corta (3 minutos)
a la hormona induzca un incremento significativo de la activación de STAT3
(Kim et al., 2000). Sin embargo, otros estudios más recientes han demostrado
que la leptina es capaz de activar rápidamente la fosforilación de STAT3 en
músculo esquelético de ratón (Maroni et al., 2003) y que la administración
crónica de la hormona activa la vía JAK2/STAT3 en miotúbulos C2C12 (Maroni
et al., 2005).
En cuanto a la respuesta de esta vía de señalización al entrenamiento
crónico sabemos que en tenistas profesionales la fosforilación de STAT3 es
menor en el tríceps braquial del brazo no dominante comparado con el brazo
dominante (Olmedillas et al., 2009), compatible con un aumento de la
señalización por leptina en el músculo más entrenado. Por otro lado, la

Introducción
44
fosforilación de STAT3 aumenta en músculo esquelético humano 2 horas
después de un ejercicio de agudo de fuerza (extensión de pierna) (Trenerry et
al., 2007). Sin embargo, no se encontraron cambios en la fosforilación de
STAT3 después de un ejercicio de extensión de pierna al 60% del VO2max
durante 90 minutos (Boonsong et al., 2007). También se ha observado un
aumento de la fosforilación de JAK2 en músculo esquelético humano
inmediatamente después de un ejercicio de intensidad moderada (30 minutos
de biciceta al 70% del VO2max) (Consitt et al., 2008).
Cascada de Señalización de MAPK (Mitogen-Activated Protein
Kinase)
Las proteínas ERK (Extracellular Regulated Kinases) son componentes
de la cascada de señalización Ras/Raf/MAPK y son activadas por numerosos
estímulos, incluyendo la leptina. La vía de MAPK puede ser activada tanto por
OB-Ra como OB-Rb, aunque en menor medida por la primera (Bjorbaek et al.,
1997; Banks et al., 2000). A pesar de que la parte más distal de OB-R no es
necesaria para la señalización por MAPK, se ha demostrado que se requiere la
porción intracelular intacta de la isoforma larga para obtener la máxima
activación de la vía. Este fenómeno, se debe a que la leptina es capaz de
inducir la activación de ERK a través de dos vías diferentes. Una vía modulada
indirectamente por OB-R en la cual JAK2 una vez activa fosforila a ERK y otra
mediada directamente por el receptor en la cual se produce la interacción de la
fosfatasa de tirosina SHP-2 con la Y985 (previamente fosforilada por JAK2) del
OB-Rb, produciéndose en última instancia la activación de ERK a través de
Grb-2 (Growth Factor Receptor Binding-2) (Bjorbaek et al., 1997; Ahima & Osei,
2004) (Figura 4). ERK, una vez activada por cualquiera de las dos vías, es
capaz de translocarse al núcleo desde el citoplasma para modular
positivamente la expresión de determinados genes diana de la acción de la
leptina, como son c-fos y egr-1, los cuales participan en proliferación celular y
diferenciación (Fruhbeck, 2006). En cualquier caso, ambas vías requieren un
dominio catalítico intacto de SHP-2, puesto que se ha demostrado que la

Introducción
45
pérdida de la actividad de esta fosfatasa bloquea la fosforilación de ERK
inducida por la leptina (Bjorbaek et al., 2001).
Existen numerosos estudios que han demostrado que la leptina es capaz
de activar la cascada de MAPK “in vivo” e “in vitro”, tanto en el SNC como en
tejidos periféricos implicados en la regulación de la homeostasis energética y
del metabolismo basal, como son el tejido adiposo y el músculo esquelético. Un
estudio reciente muestra que la leptina estimula la actividad de la sintasa de
óxido nítrico (NOS) en tejido adiposo blanco a través de un complejo
mecanismo que implica a PKA (Protein Kinase A) y a ERK1/2 (Mehebik et al.,
2005). Otro estudio particularmente interesante, demuestra que cuando los
mioblastos murinos C2C12 son tratados con leptina se produce un rápido
incremento de la fosforilación tanto de ERK como de p38 MAPK (Maroni et al.,
2003).
La práctica de actividad física también es capaz de producir cambios en
el nivel de activación de esta importante vía de señalización. Investigaciones
recientes han demostrado que el ejercicio produce un incremento de la
fosforilación de ERK en músculo esquelético humano. Varios estudios han
encontrado un aumento de la señalización de la fosforilación de ERK tras un
ejercicio agudo de fuerza (extensión de pierna) al 70% y al 80% de su
intensidad máxima (Creer et al., 2005; Deldicque et al., 2008a). Por otro lado,
un ejercicio de resistencia agudo aumentó la fosforilación de ERK en músculo
esquelético de ratas (Goodyear et al., 1996). Se ha comprobado que un
ejercicio de 60 minutos al 70% del VO2max en cicloergómetro aumenta la
fosforilación de MAPK en músculo esquelético humano (Aronson et al., 1997).
Y la fosforilación de ERK y p38 MAPK aumenta tras una maratón (Yu et al.,
2001). Widegren y col. midieron la fosforilación de ERK durante y después (60
minutos de recuperación) de un ejercicio de resistencia (extensión de pierna)
de una hora de duración al 70% VO2max y observaron que la fosforilación de
ERK aumentó en respuesta al ejercicio, alcanzando el pico máximo a los 30
minutos y volvió a los niveles iniciales tras una hora de recuperación (Widegren
et al., 1998). Además, observaron que la fosforilación de ERK aumentaba tras
un ejercicio de resistencia (30 minutos) de baja intensidad (40% del VO2max)
aunque en menor medida que en respuesta al mismo tipo de ejercicio realizado

Introducción
46
a alta intensidad (75% del VO2max) (Widegren et al., 2000). Tras un sólo
ejercicio de esprint de 30 segundos (Wingate) no se encontró aumento en la
fosforilación de p38 MAPK (Gibala et al., 2009). Sin embargo, Gibala y col. sí
que encontraron un aumento de la fosforilación de p38 MAPK inmediatamente
después de 4 ejercicios de esprint separados por periodos de descanso de 4
minutos (Gibala et al., 2009). En cuanto a la influencia del entrenamiento en
esta vía de señalización, Beziane y col. (Benziane et al., 2008) comprobaron
cómo el aumento de la fosforilación de ERK tras un ejercicio agudo de
resistencia resultaba atenuado tras 10 días de entrenamiento de resistencia
intenso. Sin embargo el entrenamiento no afectó al aumento de la fosforilación
de p38 MAPK detectado tras el ejercicio agudo de resistencia (Benziane et al.,
2008).
Vía de señalización de IRS (Insulin Receptor Sustrate) / PI3K
(Phospo-Inositide 3-Kinase)
PI3K representa una diana clave en las acciones de un amplio espectro
de ligandos, siendo la insulina uno de los principales. De hecho, gran parte de
los efectos dependientes de insulina llevan consigo la activación de PI3K. Una
vez activa, PI3K es capaz de estimular la actividad de Akt (Protein Kinase B) y
de varias isoformas de PKC (Protein Kinase C) (Sweeney, 2002). La unión de
la insulina a su receptor (IR) produce el reclutamiento de varios IRSs (Insulin
Receptor Substrates) que posteriormente son fosforilados en residuos de
tirosina por la actividad quinasa intrínseca del receptor. Como consecuencia de
su fosforilación, los IRSs incrementan su afinidad de unión a otras moléculas
de señalización, disparando la subsiguiente activación de PI3K y de Akt
(Fruhbeck, 2006). En lo que se refiere a la leptina, actualmente sabemos que la
hormona es capaz de actuar sobre algunos componentes de la cascada de
señalización activada por insulina, como por ejemplo IRS y PI3K, a través de
OB-R. El mecanismo por medio del cual la leptina activa a PI3K ocurre a través
de JAK2, la cual una vez activa es capaz de fosforilar a IRS, permitiendo en
última instancia la activación de PI3K (Kellerer et al., 1997) (Figura 4).

Introducción
47
La interacción de las vías de señalización activadas por IR y OB-Rb se
investigó inicialmente en tejidos no neuronales. En este sentido, Kellerer y col.
(Kellerer et al., 1997) demostraron cómo la leptina imita los efectos de la
insulina en el transporte de glucosa y en la síntesis de glucógeno a través de la
vía de señalización de PI3K en los miotúbulos C2C12 (Kellerer et al., 1997).
Los autores de este estudio comprobaron que la activación de PI3K por la
leptina se produce a través del sustrato IRS-2, mientras que la activación de
PI3K por parte de la insulina se produce a través de ambos sustratos, IRS-1 e
IRS-2 (Kellerer et al., 1997). Estudios posteriores examinaron la posible
regulación de PI3K por leptina en el hipotálamo, observando que se producía
una rápida activación de la enzima, alcanzando los niveles máximos de
activación dentro de los primeros 30 minutos (Bjorbaek & Kahn, 2004). Otro
estudio ha demostrado que OB-R e IR se expresan en células neuronales y
responden a leptina e insulina con la estimulación de la actividad de PI3K
aunque a través de diferentes mecanismos (Benomar et al., 2005). Los datos
aportados por Benomar y col. (Benomar et al., 2005) indican que la leptina
activa PI3K a través de IRS-2 y la insulina a través de IRS-1. En cuanto a la
potencial función de la activación de la fosforilación de PI3K inducida por
leptina, parece que podría ser muy importante para la regulación del apetito
modulado por la hormona, puesto que existen estudios realizados en roedores
que han demostrado que la administración intracerebroventricular de
inhibidores de PI3K bloquea los efectos moduladores del apetito ejercidos por
la leptina (Niswender et al., 2001; Rahmouni et al., 2003). Por otro lado, se cree
además que esta activación de PI3K puede jugar un papel clave en la
modulación inducida por la hormona de la expresión de determinados
neuropéptidos implicados en la regulación de la ingesta de alimentos (Bjorbaek
& Kahn, 2004).
En cuanto a la influencia del ejercicio físico sobre esta vía de
señalización, la mayoría de los estudios que analizan la respuesta de IRS/PI3K
y ejercicio en humanos hacen referencia a la activación inducida por la insulina
y no a la señalización debida a la leptina (Kirwan et al., 2000; Frosig et al.,
2007a; Frosig et al., 2007b). Por ejemplo, Kirman y col. (Kirwan et al., 2000)
investigaron los efectos del ejercicio regular sobre la activación de PI3K. Para

Introducción
48
ello realizaron un estudio en el que llevaron a cabo un clampaje
hiperinsulinémico (40 mU•m- ²•min- ¹) y euglucémico (5.0 mM) durante dos
horas a ocho sujetos sanos entrenados y a ocho hombres y mujeres sanos
sedentarios. Posteriormente, los autores analizaron la activación de PI3K
mediada por IRS-1 antes y después del clampaje en biopsias tomadas del
vasto lateral del cuádricep. Los resultados aportados por este estudio
demostraron que la activación de PI3K fue mayor en los sujetos entrenados
que en los sedentarios. El consumo máximo de oxígeno (VO2max), indicador de
la capacidad aeróbica, correlacionó positivamente con la activación de PI3K.
Además, el incremento de actividad de PI3K también correlacionó
positivamente con la tasa de eliminación de glucosa vía insulina. Las
evidencias experimentales aportadas por esta investigación sugieren que la
práctica regular de actividad física incrementa la activación de PI3K inducida
por insulina y mediada por IRS-1 (Kirwan et al., 2000), lo cual es un indicativo,
al menos indirecto, de un aumento de la sensibilidad muscular a la hormona.
Sin embargo, cabe destacar que recientemente se han publicado dos estudios
que también han investigado los efectos del ejercicio físico sobre la activación
mediada por insulina de PI3K y que han arrojado resultados contradictorios.
Frosig y col. (Frosig et al., 2007a) estudiaron este fenómeno en músculo
esquelético humano estimulado con insulina y sometido a entrenamiento de
resistencia. Los autores observaron que el ejercicio reducía la respuesta de
activación de PI3K mediada por IRS-1 en condiciones basales tras la
administración de insulina, a pesar de aumentar la sensibilidad a la insulina.
Estos experimentos sugieren que, contrariamente a lo que se pensaba hasta el
momento, este tipo de entrenamiento es incapaz de aumentar la respuesta de
señalización por insulina, pero sí aumenta la sensibilidad a la insulina
probablemente al aumentar la cantidad de proteínas implicadas en la cascada
de señalización por insulina (Akt1/2: 55±17%; AS160: 25±8%; GLUT4:
52±19%; Hexoquinasa 2: 297±40%; IRAP: 65±15%) en músculo esquelético
entrenado (Frosig et al., 2007a). Sin embargo, otro estudio realizado por el
mismo grupo de investigación sí que ha demostrado que el ejercicio agudo
interacciona con la señalización activada por insulina a través de IRS-2 y PI3K
para incrementar la capacidad de síntesis proteica en músculo esquelético
humano, lo que sí se puede entender como un aumento de la sensibilidad a la
Introducción
49
hormona (Frosig et al., 2007b). Los resultados aportados por este último
estudio son muy relevantes puesto que existen otras investigaciones que
demuestran que la leptina es capaz de inducir la activación de PI3K a través de
IRS-2 (Kellerer et al., 1997; Benomar et al., 2005).
AMPK (5’-AMP-Activated Protein Kinase)
El nombre de AMPK fue adoptado en 1987 (Carling et al., 1987), no
obstante la enzima fue descubierta en 1973 (Carlson & Kim, 1973). La AMPK
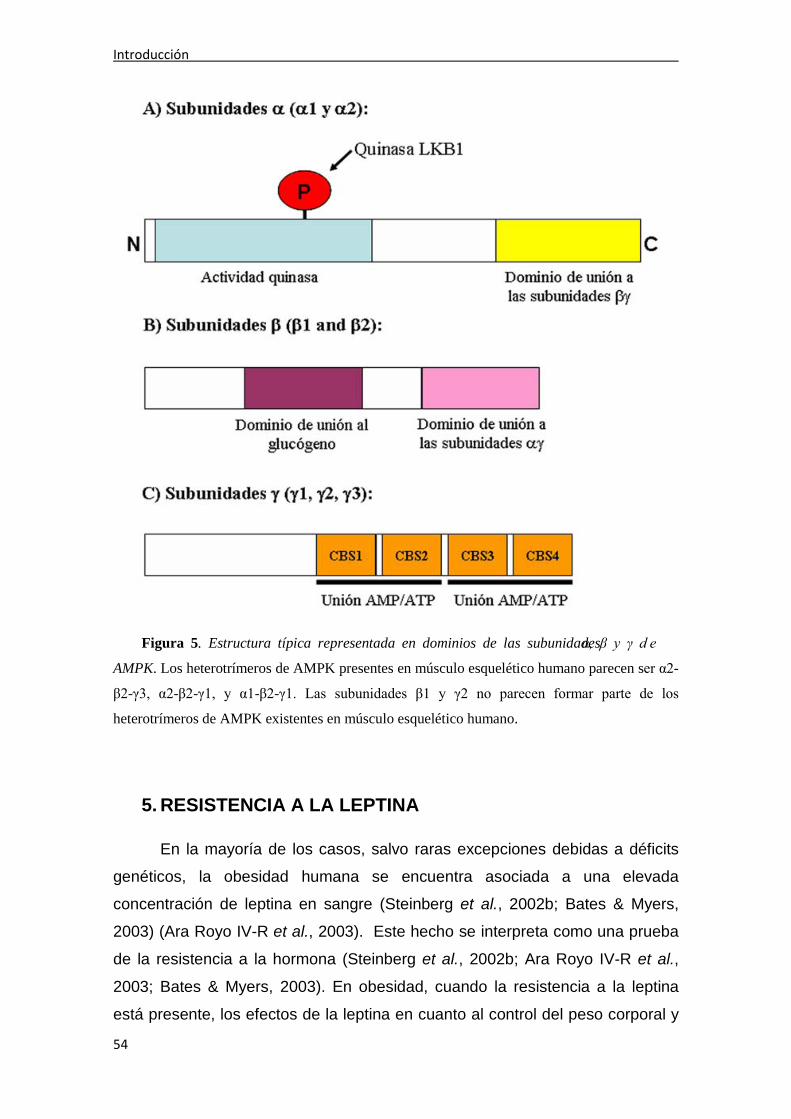
es una enzima heterotrimérica compuesta por una subunidad catalítica (α) y
dos subunidades reguladoras (β y γ ) (Kahn et al., 2005; Uotani et al., 2006)
(Figura 5), cuya expresión está regulada por múltiples genes que codifican
cada una de las subunidades (α1, α2, β1, β2, γ1, γ2, γ3) (Mahlapuu et al.,
2004). En total se pueden formar 12 heterotrímeros diferentes de AMPK, cuyo
patrón de expresión muestra gran pleiotropismo (Barnes et al., 2004; Steinberg
& Jorgensen, 2007). La función específica de cada uno de los heterotrímeros
aún no ha sido aclarada, pero se ha demostrado que los ratones knockout para
AMPKα2 desarrollan obesidad y diabetes tipo 2 (Viollet et al., 2003).
En el músculo esquelético la mayoría de los complejos contienen α2 y
β2 (Steinberg & Jorgensen, 2007). Un 20% de estos complejos α2/β2 están
asociados a γ3, mientras que el resto se encuentran mayoritariamente
asociados a γ1 (Wojtaszewski et al., 2005). Aunque la isoforma α1 se ha
encontrado en extractos musculares, existe evidencia experimental para sugerir
que procede de otras células diferentes a las fibras musculares (Fujii et al.,
2000). En este tejido, la actividad de la AMPK depende principalmente de la
fosforilación de la treonina 172 en el asa de activación de la subunidad α por la
quinasa LKB1 (Hong et al., 1998; Hawley et al., 2003), antes llamada quinasa
de AMPK (AMPKK). La LKB1 también se activa por AMP (Ponticos et al.,
1998). Los ratones transgénicos que carecen de LKB1 tienen una muy escasa
actividad AMPKα2 (Sakamoto et al., 2005), lo que confirma la importancia de
esta quinasa para la activación de AMPK. Además, la AMPK puede ser
activada alostéricamente, a través de la subunidad γ, que contiene dos
módulos de Bateman que pueden unirse con gran afinidad a AMP y con mucha
Introducción
50
menos afinidad a ATP (Figura 5) (Adams et al., 2004; Scott et al., 2004). La
unión de AMP a la subunidad γ facilita la fo sforilación de la treonina 172 por la
LKB1 (Ponticos et al., 1998; Hawley et al., 2003; Sakamoto et al., 2005).
Además, también se ha demostrado que el AMP es incapaz de activar a la
AMPK en ausencia de LKB1 (Sakamoto et al., 2005). Al mismo tiempo, la unión
de AMP inhibe la de-fosforilación de AMPK por las proteínas fosfatasas PP2A y
PP2C (Davies et al., 1995). La sensibilidad a la activación por AMP de la AMPK
varía en función del tipo de isoforma γ presente. De esta forma, la isoforma
más sensible a la activación por AMP es la γ2, la menos sensible la γ3,
mientras que la γ1 presenta una sensibilidad intermedia (Cheung et al., 2000).
No obstante, la isoforma predominante en las fibras musculares glucolíticas (FT
o tipo II) es la γ3, mientras que esta isoforma se expresa escasamente en las
fibras musculares lentas u oxidativas (ST o tipo I) (Mahlapuu et al., 2004). La
AMPK es activada por tanto, ante cualquier estrés celular que produzca un
incremento del ratio AMP/ATP, como por ejemplo el ejercicio de esprint en
músculo esquelético humano (Guerra et al., 2010).
La principal función de la AMPK en el músculo esquelético es la de
estimular la oxidación de ácidos grasos al fosforilar a la ACC (Acetil Coenzima-
A Carboxilasa), actuando como un “sensor de combustible” que controla el
estatus energético de las células (Minokoshi et al., 2002; Tanaka et al., 2005).
La ACC fosforilada queda inactivada y deja de producir malonil-CoA. El malonil-
CoA es un inhibidor alostérico de la actividad CPTI (Carnitina
Palmitoiltransferasa I), responsable del transporte de ácidos grasos de cadena
larga al interior de las mitocondrias (Ruderman et al., 1999). En el músculo
esquelético predomina la isoforma β (ACC -β) (Minokoshi et al., 2002). Se ha
demostrado que ratones Knockout para ACC-β muestran un incremento en la
oxidación de ácidos grasos en el músculo y un nivel de adiposidad reducido
(Minokoshi et al., 2002). Sin embargo, evidencias experimentales recientes
indican que podría existir una disociación entre la fosforilación de la AMPK y de
la ACC en respuesta al ejercicio de esprint en músculo esquelético humano
(Guerra et al., 2010).
Además, también se ha demostrado que un incremento de la actividad
de la AMPK muscular produce un aumento del transporte de glucosa al interior
Introducción
51
de la fibra (Steinberg & Jorgensen, 2007). Esta estimulación de la captación
muscular de glucosa se asocia a la fosforilación de la proteína AS160
(substrato de AKT de 160 KDa, también conocida como RabGAP (Rab
GTPase-activating protein)) (Treebak et al., 2007). La AS160 también se
fosforila en respuesta a la estimulación por insulina (Larance et al., 2005) y
ejercicio (Guerra et al., 2010). Esta última evidencia experimental vuelve a
poner de manifiesto la interacción en la señalización activada por insulina y
leptina.
En los últimos años se han aportado numerosas evidencias
experimentales que documentan ampliamente los efectos de la leptina sobre
esta importante vía de señalización. Un estudio particularmente interesante ha
demostrado que la inyección intravenosa de leptina incrementa la fosforilación
de la AMPKα2 en músculo esquelético, efecto que es más acusado en las
fibras de contracción lenta (Minokoshi et al., 2002) y que depende de la unión
de la leptina al receptor OB-Rb (Minokoshi et al., 2002). No obstante la
activación de AMPK por leptina también podría depender de la isoforma corta
del receptor, OB-Ra (Uotani et al., 2006). Además, la leptina induce un
aumento del tono simpático de tal manera que la liberación de noradrenalina
por las terminaciones nerviosas de la pared vascular de las arteriolas
musculares determina, a través de receptores alfa-adrenérgicos de las fibras
musculares, un aumento tardío de la actividad AMPK en ratas (Minokoshi et al.,
2002). La activación alfa-adrenérgica de la AMPK está mediada por receptores
acoplados a proteínas G (Gq) (Kishi et al., 2000). Además, existen estudios
realizados en ratones transgénicos que sobre-expresan leptina que han
demostrado que los niveles permanentemente elevados de la hormona
producen activación crónica de la AMPK en las fibras musculares lentas
(Tanaka et al., 2005). Estos ratones son delgados y adelgazan más
rápidamente que los ratones normales cuando son sometidos a una dieta
hipercalórica. Sin embargo, es especialmente importante destacar que a pesar
de presentar unos niveles crónicamente elevados de leptina, no muestran
signos de resistencia a la acción de la hormona, contrariamente a lo observado
en seres humanos obesos que presentan hiperleptinemia y resistencia a la
acción de la leptina. En contraste con lo observado en los ratones transgénicos,

Introducción
52
la actividad basal de la AMPK parece no estar modificada en obesos (Steinberg
et al., 2004a) o ligeramente disminuida (Bandyopadhyay et al., 2006), tal vez
debido a la resistencia a la acción de la leptina. En cualquier caso es necesario
realizar estudios con una muestra amplia de sujetos con diversos niveles de
obesidad para poder establecer si existe alguna relación entre composición
corporal, leptina y actividad AMPK en músculo esquelético en seres humanos.
En lo que se refiere a los efectos del ejercicio físico sobre esta vía de
señalización, hasta el momento se sabe que la actividad AMPK aumenta en
respuesta al ejercicio moderado (por encima del 50% del VO2max) (Fujii et al.,
2000; Wojtaszewski et al., 2000; Chen et al., 2003; Roepstorff et al., 2006), así
como en respuesta al ejercicio de alta intensidad (Chen et al., 2000; Birk &
Wojtaszewski, 2006; Gibala et al., 2009; Guerra et al., 2010). Si la intensidad
del ejercicio es inferior, la actividad AMPK sólo aumenta si el esfuerzo se
desarrolla hasta la extenuación (Wojtaszewski et al., 2002). La estimulación de
AMPK por el ejercicio de resistencia (30 minutos al 63 % del VO2max) es rápida
puesto que este incremento se comienza a detectar ya a los cinco minutos
después del inicio del mismo, manteniéndose elevada durante el resto del
ejercicio (Stephens et al., 2002). Estudios más recientes han demostrado que
ejercicios de alta intensidad, que producen el agotamiento en dos minutos y en
treinta segundos respectivamente, también inducen un incremento de la
activación de AMPK (α2/β2/γ3) justo después del ejercicio (Birk &
Wojtaszewski, 2006; Guerra et al., 2010). Gibala y col. encontraron un
aumento de la fosforilación de AMPK inmediatamente después de 4 ejercicios
de 30 segundos a máxima intensidad (test de Wingate de 30 segundos) (Gibala
et al., 2009). Por otro lado, se ha observado un aumento de la fosforilación de
AMPKα 30 minutos después de un sólo Wingate de 30 segundos en ayunas,
sin embargo 120 minutos después de la finalización del test los niveles de
fosforilación de AMPKα fueron similares a los valores basales (Guerra et al.,
2010). Así mismo, a los 20 minutos y justo después de una hora ejercicio al
70% del VO2max se produjo un aumento de la fosforilación AMPKα2, pero no se
encontró un aumento significativo 30 minutos después del mismo (Fujii et al.,
2000). Sin embargo, se ha demostrado recientemente que la fosforilación de
AMPK se mantiene elevada 150 minutos sobre los niveles basales después de
Introducción
53
un ejercicio de 40 minutos al 70% del VO2max (Sriwijitkamol et al., 2007).
Ejercicios realizados al 70% del VO2max también se han asociado, en seres
humanos, a un aumento de la fracción fosforilada de AS160 en ciclistas, tras
una hora de esfuerzo (Stephens et al., 2002; Treebak et al., 2007) y en sujetos
sanos no deportistas tras 40 minutos al 70% del VO2max, manteniéndose el
aumento 150 minutos después del esfuerzo (Sriwijitkamol et al., 2007). En
cambio, inmediatamente después de esprints de dos minutos y sesenta
segundos de duración no se han observado cambios en el grado de
fosforilación de la AS160 (Treebak et al., 2007), pero sí inmediatamente y 30
minutos después de un Wingate de 30 segundos (Guerra et al., 2010).
Recientemente se ha comunicado que la fosforilación de AS160 durante el
ejercicio está, al menos en parte, mediada por la activación del heterotrímero
de AMPK α2/β2/γ1 (Treebak et al., 2007). Otro estudio particularmente
interesante ha demostrado que en las mujeres el grado de activación AMPK es
inferior que en los hombres cuando realizan ejercicio durante noventa minutos
al 60% del VO2max (Roepstorff et al., 2006). Los efectos de la práctica regular
de actividad física (entrenamiento deportivo) sobre la actividad de AMPK y su
cascada de señalización intracelular han sido mucho menos estudiados.
Introducción
54
Figura 5. Estructura típica representada en dominios de las subunidades α, β y γ d e
AMPK. Los heterotrímeros de AMPK presentes en músculo esquelético humano parecen ser α2-
β2-γ3, α2-β2-γ1, y α1-β2-γ1. Las subunidades β1 y γ2 no parecen formar parte de los
heterotrímeros de AMPK existentes en músculo esquelético humano.
5. RESISTENCIA A LA LEPTINA
En la mayoría de los casos, salvo raras excepciones debidas a déficits
genéticos, la obesidad humana se encuentra asociada a una elevada
concentración de leptina en sangre (Steinberg et al., 2002b; Bates & Myers,
2003) (Ara Royo IV-R et al., 2003). Este hecho se interpreta como una prueba
de la resistencia a la hormona (Steinberg et al., 2002b; Ara Royo IV-R et al.,
2003; Bates & Myers, 2003). En obesidad, cuando la resistencia a la leptina
está presente, los efectos de la leptina en cuanto al control del peso corporal y
Introducción
55
al incremento del metabolismo basal se ven alterados. La resistencia a la
hormona se puede producir tanto a nivel hipotalámico (resistencia central)
(Houmard et al., 2000) como en tejidos extraneurales (resistencia periférica)
(Ara Royo IV-R et al., 2003). En ambos casos, la resistencia a la hormona
puede deberse a una regulación negativa (down regulation) y/o a una
desensibilización de OB-R, además de a otros mecanismos (Zhang et al.,
1997).
Numerosos estudios demuestran que la señalización mediada por OB-
Rb y activada por leptina está sometida a un sistema de control de
retroalimentación negativa regulado por las proteínas SOCS (Suppresor of
Cytokine Signalling) (Sahu, 2003). En concreto, actualmente se sabe que
cuando los niveles de leptina están permanentemente elevados en sangre, la
hormona induce la expresión génica de SOCS3 a través de STAT3. El producto
proteico de SOCS3 es capaz de interaccionar entonces con el residuo
fosforilado Y985 de OB-Rb y con JAK2 bloqueando la señalización activada por
leptina (Bjorbaek et al., 1999; Eyckerman et al., 2000; Sahu, 2003; Bjorbaek &
Kahn, 2004). Puesto que el incremento de la expresión de SOCS3 inducido por
niveles permanentemente elevados de leptina es capaz de inhibir la
fosforilación en residuos de tirosina de OB-R, uno de los mecanismos
propuestos para explicar el fenómeno de la resistencia a la leptina es
precisamente un cambio en la expresión endógena de SOCS3 (Bjorbak et al.,
2000; Munzberg & Myers, 2005). Así, se ha observado que ratones knockout
para SOCS3 (SOCS3 -/+) tienen incrementada la sensibilidad a la leptina con
respecto a los ratones salvajes, puesto que la inyección de esta hormona en
los primeros es mucho más efectiva reduciendo el peso corporal y activando la
señalización a partir del OB-Rb (Myers, 2004; Munzberg & Myers, 2005). Otra
evidencia en este sentido ha sido aportada por un estudio en el que se
demuestra que la inhibición de la expresión de SOCS3 por medio de técnicas
de ARN de interferencia, incrementa la fosforilación de JAK2 y de STAT3
(Dunn et al., 2005). Además, los autores de este estudio demostraron que el
bloqueo de la expresión de SOCS3 no sólo incrementaba en gran medida la
fosforilación de ERK, sino que además bloqueaba el descenso de esta señal
tras una estimulación prolongada del receptor. De esta forma parece plausible

Introducción
56
un potencial mecanismo de inhibición de la señalización mediada por ERK, y
probablemente por JAK2, independiente de Y985 y dependiente de Y1138, y
producido por un incremento de la expresión de SOCS3 debida a una
estimulación prolongada de la cola intracelular de OB-Rb (Dunn et al., 2005;
Munzberg & Myers, 2005).
El sistema de retroalimentación negativa mediado por SOCS3 explica
porque en una condición patológica como es la obesidad donde los niveles
circulantes de leptina están permanentemente elevados, la hormona es incapaz
de inducir un descenso del peso corporal, lo cual a su vez indica que en la
mayoría de los casos la obesidad en humanos representa una forma de
resistencia a la leptina (Banks et al., 2000). De hecho, aunque se ha observado
que la administración exógena de leptina es capaz de producir un descenso del
peso corporal en obesos, esta reducción ha sido cuando menos modesta a las
dosis de hormona testadas(Bates & Myers, 2003; Myers, 2004).
Otro regulador negativo de la señalización por leptina es la proteína
PTP1B (Protein Tyrosine Phosphatase 1B), la cual es capaz de regularla a
través de la de-fosforilación de JAK2 (Cook & Unger, 2002; Zabolotny et al.,
2002). La implicación de PTP1B en la regulación de las vías de señalización
dependientes de leptina ha sido demostrada en estudios en los que se
administró leptina a ratones knockout para PTP1B, observándose una
hipersensibilidad a los efectos fisiológicos de la hormona en lo que se refiere al
control del peso corporal (Zabolotny et al., 2002; Bjorbaek & Kahn, 2004).
Además, diversos estudios han demostrado que PTP1B es un importante
regulador fisiológico negativo de la señalización mediada por insulina (Elchebly
et al., 1999; Klaman et al., 2000; Bjorbaek & Kahn, 2004). Más recientemente
se ha demostrado la implicación de la proteína C reactiva en la modulación de
la sensibilidad a la leptina, observándose la interacción de esta proteína con la
leptina en sangre lo que impediría la unión a su receptor, bloqueando por tanto
las acciones fisiológicas de la hormona (Chen et al., 2006).
El desarrollo de la resistencia a la leptina en músculo esquelético
conduce a una disminución de la sensibilidad a la insulina por la acumulación
Introducción
57
de lípidos intramusculares, siendo éste un fenómeno típicamente observado en
la obesidad (Fruhbeck et al., 1998). Se ha demostrado que dietas ricas en
grasas producen resistencia a la leptina en el músculo esquelético de ratas, lo
que incrementa la acumulación intramuscular de triacilglicerol (TG) y conduce
en última instancia al desarrollo de la resistencia a la insulina observada en
obesidad (Steinberg & Dyck, 2000). Poco después se publicó la primera
evidencia experimental de la existencia de resistencia a la leptina en músculo
esquelético humano (Steinberg et al., 2002b). En este estudio se demuestra
que la leptina es incapaz de reducir la acumulación de TG en músculo
esquelético de individuos obesos pero si lo hace en tejido muscular de sujetos
delgados (Steinberg et al., 2002b).
En lo que se refiere a moduladores positivos de la sensibilidad a la
leptina, recientemente se ha demostrado la existencia, al menos a nivel
hipotalámico, de una proteína denominada SH2-B que actúa como un
modulador positivo de la señalización activada por leptina ya que amplifica la
activación de JAK2, incrementando la sensibilidad a la hormona (Ren et al.,
2005). Por otro lado, en cuanto a la influencia del ejercicio físico en la
sensibilidad de la leptina en músculo esquelético, Steinberg y col. comprobaron
que el entrenamiento de resistencia en roedores revierte, al menos
parcialmente, la resistencia a la leptina provocada por dietas elevadas en grasa
en roedores, sin disminuir el incremento del ARNm de SOCS3 inducido por
este tipo de dietas (Steinberg et al., 2004a).
6. PRESENTACIÓN DE LOS ARTÍCULOS QUE COMPONEN LA TESIS
Los artículos que componen esta tesis siguen una línea temática común
que se inicia con el estudio de los receptores de leptina en músculo esquelético
humano, continúa con el estudio del dimorfismo sexual de los mismos en
humanos, se extiende hasta la investigación de los receptores leptina y sus
vías de señalización en el músculo esquelético de sujetos sanos y obesos con
el objetivo de desentrañar los mecanismos moleculares que son responsables

Introducción
58
de la resistencia a la hormona observada en obesidad y finaliza con el estudio
del dimorfismo sexual de las vías de señalización de la leptina en respuesta al
ejercicio de esprint, pudiendo constituir este modelo de ejercicio una posible vía
terapéutica para el tratamiento de la resistencia muscular a la leptina.
6.1 Artículo 1 (Guerra et al. 2007)
Borja Guerra, Alfredo Santana, Teresa Fuentes, Safira Delgado-Guerra,
Alfredo Cabrera-Socorro, Cecilia Dorado, and José A, L. Calbet. (2007). Leptin
receptors in human skeletal muscle. J Appl Physiol. 102, 1786-1792.
En este primer estudio demostramos por primera vez la expresión
proteica de todas las isoformas del receptor de leptina en músculo esquelético
humano, no existiendo relación entre los niveles circulantes de leptina y la
expresión proteica muscular de su receptor. Además, presentamos un método
basado en la técnica del Western blot para determinar la contaminación de
grasa intramuscular en las biopsias de músculo esquelético humano. Este
método nos permitió demostrar que el músculo esquelético, y no el tejido
adiposo, expresa una isoforma de 170 KDa del receptor de leptina (OB-R170),
la cual podría corresponder a una isoforma larga.
6.2 Artículo 2 (Guerra et al. 2008)
Borja Guerra, Teresa Fuentes, Safira Delgado-Guerra, Amelia Guadalupe-
Grau, Hugo Olmedillas, Alfredo Santana, Jesús Gustavo Ponce-González,
Cecilia Dorado, and José A. L. Calbet. (2008). Gender Dimorphism in skeletal
muscle leptin receptors, serum leptin and insulin sensitivity. Plos one. 3, e3466.
En este segundo estudio demostramos que en humanos existe un
dimorfismo sexual en lo que se refiere a la expresión proteica muscular de OB-
R, el cual puede ser explicado al menos en parte por los niveles circulantes de
testosterona. Este dimorfismo sexual en la expresión muscular de OB-R en
humanos podría explicar el hecho de que las mujeres oxiden más grasas
durante el ejercicio que los hombres.

Introducción
59
6.3 Artículo 3 (Fuentes et al. 2010)
T. Fuentes, I. Ara, A. Guadalupe-Grau, S. Larsen, B. Stallknecht, H.
Olmedillas, A.Santana, J.W. Helge, J.A.L. Calbet, and B.Guerra. (2010). Leptin
receptor 170KDa (OB-R170) protein expression is reduced in obese human
skeletal muscle: a potential mechanism of leptin resistance. Exp Physiol, 95,
160-171.
En este estudio encontramos una reducción de la expresión proteica
muscular de la isoforma larga de OB-R en sujetos obesos con respecto a
sujetos sanos controles. Este hallazgo podría explicar, al menos en parte, la
resistencia muscular a la leptina observada en obesidad. Además, en este
trabajo se demuestra que la señalización activada por la hormona se encuentra
reducida en el músculo de los obesos con respecto a los controles,
especialmente en los músculos de las piernas. Este fenómeno se podría
explicar por un aumento de la expresión proteica del modulador negativo de la
sensibilidad a la leptina, SOCS3, en las piernas de los sujetos obesos.
6.4 Artículo 4 (Fuentes et al. 2010b)
Teresa Fuentes, Borja Guerra, Jesús G. Ponce-González, David Morales-
Alamo, Amelia Guadalupe-Grau, Hugo Olmedillas, Leandro Fernández-Pérez,
Alfredo Santana, Lorena Rodríguez-García, José A.L. Calbet. (2010). Skeletal
muscle signalling in response to sprint exercise: sex differences? (En revisión)
En este último estudio encontramos una respuesta similar en la
señalización activada por el ejercicio de esprint mediada por AMPK, ACC,
STAT3, ERK y p38MAPK entre hombres y mujeres. Lo cual indica que las
diferencias sexuales en la concentración de leptina en respuesta al ejercicio de
esprint, no parecen influir en la señalización activada en el vasto lateral en
respuesta al ejercicio de esprint. Además, encontramos un aumento de la
fosforilación de AMPK, ACC, STAT3 y ERK después de un esprint de 30s (test

Introducción
60
de Wingate), que parece estar relacionado, en el caso de STAT3 y ERK, con la
intensidad del ejercicio.

OBJETIVOS

Objetivos
63
La hipótesis general sobre la que se plantea este estudio está basada en
que la resistencia muscular a la leptina observada en obesos podría ser
explicada por una regulación negativa de la expresión proteica muscular de los
receptores de leptina y/o por una reducción de la señalización muscular
activada por la hormona en humanos obesos. Las elevadas concentraciones
plasmáticas de leptina observadas en sujetos obesos podrían producir una
reducción de la expresión proteica muscular de OB-R y/o una reducción de la
señalización activada por la hormona debida al aumento de la expresión
proteica muscular de SOCS3. La regulación negativa de la expresión proteica
muscular de OB-R por los niveles circulantes de la hormona también podría
observarse en el músculo esquelético de mujeres con respecto a hombres,
sobre todo teniendo en cuenta que incluso para un mismo índice de masa
corporal la concentración plasmática de leptina es mayor en mujeres que en
hombres. Del mismo modo, puede que las mujeres presenten diferentes grados
de activación de las vías de señalización de la leptina en respuesta a un
ejercicio de esprint. Es muy posible también que existan diferencias regionales
en la sensibilidad muscular a la leptina en sujetos obesos, del mismo modo que
existen diferencias regionales en la sensibilidad muscular a la insulina en
sujetos diabéticos.
Para abordar experimentalmente esta hipótesis de partida, hemos
utilizado biopsias musculares y muestras de sangre de sujetos sanos (hombres
y mujeres) y de obesos (hombres), y más concretamente, nos hemos
propuesto los siguientes objetivos:
1. Determinar y cuantificar la expresión proteica del receptor de leptina
(OB-R) en músculo esquelético humano.
2. Investigar si la expresión proteica de OB-R en músculo esquelético
humano se relaciona con los niveles basales circulantes de leptina.
3. Determinar si existe un dimorfismo sexual en la expresión proteica
muscular de OB-R en humanos y su potencial relación con los
niveles plasmáticos circulantes de leptina, estradiol y testosterona,
así como estudiar si existen diferencias en la sensibilidad muscular a
leptina entre hombres y mujeres.

Objetivos
64
4. Determinar si existe una regulación negativa de la expresión proteica
de OB-R en músculo esquelético humano de sujetos obesos e
investigar si está relacionada con la concentración plasmática de
leptina.
5. Estudiar si la señalización muscular activada por leptina está
reducida en sujetos obesos y determinar si existen diferencias
regionales en la sensibilidad muscular a la hormona en humanos.
6. Determinar si existe un dimorfismo sexual en la señalización
muscular inducida por el ejericio de esprint en seres humanos,
espcialmente en las señales intracelulares que también son activadas
por leptina.

RESUMEN DE LA
METODOLOGÍA APLICADA

Resumen de la metodología aplicada
67
En el siguiente apartado se expone brevemente la metodología utilizada
para abordar los objetivos del estudio. La descripción detallada de los
procedimientos experimentales se encuentra en cada uno de los artículos
incluidos en la memoria.
1. SUJETOS
Estudio 1: 14 hombres sanos.
Estudio 2: 34 hombres y 33 mujeres sanos.
Estudio 3: 10 hombres sanos y 10 hombres obesos.
Estudio 4: 17 hombres y 10 mujeres sanos.
La edad, talla, peso y porcentaje de grasa corporal de los sujetos de
cada grupo se detallan en la tabla 1.
Todos los sujetos participaron en nuestros estudios previa firma del
correspondiente consentimiento informado. Los estudios fueron aprobados por
el Comité de Ética de la Universidad de Las Palmas de Gran Canaria.
2. COMPOSICIÓN CORPORAL
La composición corporal de los sujetos se llevó a cabo a través de
absorciometría fotónica de rayos X (DXA) (Hologic QDR-1500, Hologic, sofward
versión 7.10, Waltham, MA) tal como se describe en numerosos trabajos
publicados por nuestro grupo de investigación (Ara et al., 2004; Ara et al.,
2006).

Resumen de la metodología aplicada
68
Tabla1: Características de los sujetos.
Estu
dio
1
Hom
bres
Estu
dio
2 Es
tudi
o 3
Estu
dio
4
Hom
bres
M
ujer
es
Cont
rol
Obe
sos
Hom
bres
M
ujer
es
N
=14
N=3
4 N
=33
N=1
0 N
=10
N=1
7 N
=10
M
EDIA
±
DE
MED
IA
± D
E M
EDIA
±
DE
MED
IA
± D
E M
EDIA
±
DE
MED
IA
± D
E M
EDIA
±
DE
Edad
(año
s)
33.1
±
2.0
27.1
±
6.8
26.7
±
6.7
31.2
±
4.8
30.4
±
7.4
24.4
±
4.0
25.2
±
4.0
Talla
(cm
) 17
5.9
± 1.
7 17
6.5
± 5.
8 16
5.3
± 6.
3 18
4.3
± 9.
4 18
3.9
± 8.
2 17
6.5
± 7.
1 16
0.7
± 5.
5
Peso
(Kg)
81
.2
± 3.
8 76
.2
± 11
.5
60.2
±
8.4
90.9
±
13.2
11
4.9
± 8.
2 79
.5
± 10
.1
57.0
±
6.7
Gra
sa c
orpo
ral (
%)
22.5
±
1.9
18.4
±
7.4
28.1
±
7.1
24.8
±
5.8
34.9
±
5.1
18.0
±
6.2
26.3
±
3.5

Resumen de la metodología aplicada
69
3. PROCESAMIENTO DE MUESTRAS DE SANGRE
Todos los sujetos fueron sometidos a una extracción de sangre periférica
anticoagulada en EDTA en ayunas. Las muestras de sangre fueron
centrifugadas y el plasma fue separado y almacenado en un congelador de -80
ºC hasta su posterior análisis. En el plasma se determinó la concentración de
las diferentes hormonas que son objeto de este estudio por medio de la técnica
de ELISA:
- leptina,
- testosterona total,
- testosterona libre,
- 17β- Estradiol.
Además, los sujetos fueron sometidos a una extracción de sangre
periférica en ayunas que se dejó coagular en hielo durante 20 minutos. Las
muestras fueron centrifugadas y el suero separado y almacenado en un
congelador de -80ºC hasta su posterior análisis. En el suero de determinó: la
glucosa a través del método hexoquinasa (Neeley, 1972) y la insulina por
medio de la técnica ECLIA (Matthews et al., 1985)
4. BIOPSIAS MUSCULARES
Las biopsias musculares de obtuvieron por punción bajo anestesia local
del vasto lateral externo del cuádriceps (estudios 1, 2, 3 y 4) y del deltoides
(estudio 3), como se ha realizado en el laboratorio de Rendimiento Humano de
la ULPGC en numerosas ocasiones usando la técnica de Bergstrom, tras una
noche de ayuno. Con esta técnica se pueden obtener 40-60 mg de músculo
(200mg con aspiración) (Lundby et al., 2006).
Resumen de la metodología aplicada
70
5. OBTENCIÓN DE EXTRACTOS PROTEICOS A PARTIR DE BIOPSIAS MUSCULARES
Para la obtención de los extractos proteicos de músculo esquelético
humano y grasa subcutánea, una pieza del tejido congelado fue
homogeneizada en Buffer de Lisis de Urea (UREA 6 M- SDS 1% e Inhibidor de
proteasas Complete 1X). Después de ser centrifugados durante 15 minutos a
20,000g, los extractos proteicos totales se transfirieron a tubos limpios y una
alícuota de cada extracto fue separada para la cuantificación de proteínas por
el método del ácido bicinconínico (Smith et al., 1985).
6. OBTENCIÓN DE EXTRACTOS PROTEICOS DE HIPOTÁLAMO HUMANO
Los extractos proteicos totales de hipotálamo se prepararon a partir de
tejido hipotalámico obtenido de necropsias de sujetos normales (edad 26-76
años), cuyo cerebro fue extraído poco después de su muerte (menos de 10
horas post-mortem) y congelado a -80 ºC hasta su análisis.
Para la extracción proteica a partir de hipotálamo humano, se
homogenizó un fragmento del tejido congelado en Buffer de Lisis Tween® 20
(0.0625M Tris-HCL, pH 7.4, 1% [w/v] Tween®20 e Inhibidor de proteasas
Complete 1X). Después se procedió a la centrifugación de los mismos a
20.000g para eliminar los restos celulares. Posteriormente los extractos
proteicos totales fueron transferidos a tubos limpios y una alícuota de cada uno
fue separada para la cuantificación de proteínas por el método del ácido
bicinconínico (Smith et al., 1985).
7. ELECTROFORESIS DE PROTEINAS Y TINCIÓN DE GELES
Los extractos proteicos fueron diluidos en tampón de carga de
electroforesis (Tris-HCl pH 6.8, 62.50 mM, SDS 2.3%, glicerol 10%, β-
mercaptoetanol 5%, azul de bromofenol). A continuación se procedió a la
separación electroforética de las proteínas en geles de arcrilamida-

Resumen de la metodología aplicada
71
bisacrilamida (7.5% - 10%) usando el sistema de Laemmli (Laemmli, 1970), con
las modificaciones convenientes (Marin et al., 2001). Estos geles permiten
separar las proteínas por sus diferentes pesos moleculares. Tras la
electroforesis la visualización de las proteínas se efectuó tiñendo los geles con
azul de Coomassie, que reacciona con ciertos aminoácidos polares (Meyer &
Lamberts, 1965). Esta tinción permite comprobar la eficacia de extracción
proteica y de resolución electroforética.
8. ANÁLISIS DE PROTEÍNAS POR WESTERN BLOT
Se trata de una técnica que permite la detección del grado de presencia
de una proteína en estudio, mediante la separación diferencial según el peso
molecular de esta proteína desnaturalizada, y la posterior exposición a
anticuerpos específicos. Después de la separación electroforética de extractos
totales de proteínas, se procedió a la transferencia de las proteínas a
membranas de polivinilo (Hybond-P, Amersham Biosciences), la cual se realizó
a 400 mA durante 90 minutos a 4ºC.
Para evitar la unión no específica de los anticuerpos, las membranas
fueron incubadas con un tampón de bloqueo al menos durante 1 hora a
temperatura ambiente:
-Blotto blocking buffer (leche desnatada al 5% disuelta en tampón TBS
con 0,1% del detergente Tween-20 (TBS-T)) para anticuerpos usados para la
inmunodetección de proteína total.
-BSA blocking buffer (Bovine Serum Albumin (BSA) al 4% disuelta en
TBS-T) para anticuerpos fosfo-específicos.
La inmunodetección comenzó con la incubación de la membrana con el
anticuerpo primario correspondiente (ver tabla 2). Las condiciones exactas de
incubación para cada anticuerpo pueden ser consultadas en los artículos que
componen esta tesis doctoral. Posteriormente a la incubación con los
anticuerpos primarios y al lavado de las membranas en tampón TBS-T, se
procedió a la incubación con los anticuerpos secundarios correspondientes
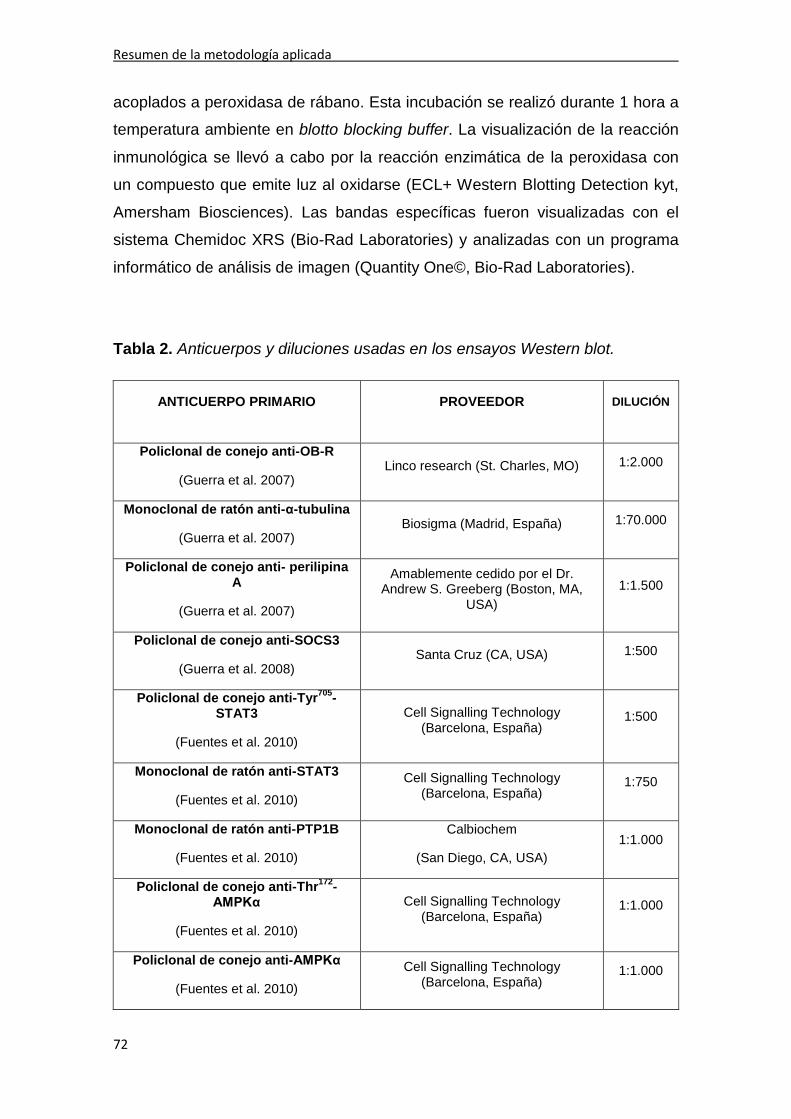
Resumen de la metodología aplicada
72
acoplados a peroxidasa de rábano. Esta incubación se realizó durante 1 hora a
temperatura ambiente en blotto blocking buffer. La visualización de la reacción
inmunológica se llevó a cabo por la reacción enzimática de la peroxidasa con
un compuesto que emite luz al oxidarse (ECL+ Western Blotting Detection kyt,
Amersham Biosciences). Las bandas específicas fueron visualizadas con el
sistema Chemidoc XRS (Bio-Rad Laboratories) y analizadas con un programa
informático de análisis de imagen (Quantity One©, Bio-Rad Laboratories).
Tabla 2. Anticuerpos y diluciones usadas en los ensayos Western blot.
ANTICUERPO PRIMARIO PROVEEDOR DILUCIÓN
Policlonal de conejo anti-OB-R
(Guerra et al. 2007) Linco research (St. Charles, MO) 1:2.000
Monoclonal de ratón anti-α-tubulina
(Guerra et al. 2007) Biosigma (Madrid, España) 1:70.000
Policlonal de conejo anti- perilipina A
(Guerra et al. 2007)
Amablemente cedido por el Dr. Andrew S. Greeberg (Boston, MA,
USA) 1:1.500
Policlonal de conejo anti-SOCS3
(Guerra et al. 2008) Santa Cruz (CA, USA) 1:500
Policlonal de conejo anti-Tyr705-STAT3
(Fuentes et al. 2010)
Cell Signalling Technology (Barcelona, España)
1:500
Monoclonal de ratón anti-STAT3
(Fuentes et al. 2010) Cell Signalling Technology
(Barcelona, España) 1:750
Monoclonal de ratón anti-PTP1B
(Fuentes et al. 2010)
Calbiochem
(San Diego, CA, USA) 1:1.000
Policlonal de conejo anti-Thr172-AMPKα
(Fuentes et al. 2010)
Cell Signalling Technology (Barcelona, España)
1:1.000
Policlonal de conejo anti-AMPKα
(Fuentes et al. 2010) Cell Signalling Technology
(Barcelona, España) 1:1.000

Resumen de la metodología aplicada
73
Policlonal de conejo anti-ACC
(Fuentes et al. 2010) Cell Signalling Technology
(Barcelona, España) 1:400
Policlonal de conejo anti-fosfoACC (Ser79)
(Fuentes et al. 2010)
Upstate Biotechnology
(Lake Placid, NY, USA) 1:400
Policlonal de conejo anti-p44/42 MAPK
(Fuentes et el. 2010b)
Cell Signalling Technology (Barcelona, España)
1:500
Monoclonal de ratón anti-fosfop44/42 MAPK (Thr202/Tyr204)
(Fuentes et al. 2010b)
Cell Signalling Technology (Barcelona, España)
1:5.000
Policlonal de conejo anti- p38 MAPK
(Fuentes et al. 2010b) Cell Signalling Technology
(Barcelona, España) 1:1.000
Monoclonal de ratón anti-fosfo-p38 MAPK (Thr180/Tyr182)
(Fuentes et al. 2010b)
Cell Signalling Technology (Barcelona, España)
1:1.000
9. ENSAYOS DE COMPETICIÓN PARA OB-R
Para evaluar la especificidad del anticuerpo empleado en nuestros
estudios para detectar las diferentes isoformas de OB-R en músculo
esquelético humano se realizaron ensayos de competición utilizando para ello
un péptido recombinante que posee el dominio extracelular de OB-R en su
secuencia (Recombinant Human Leptin R/Fc Cimera, RD Systems). Para
realizar estos ensayos se preincubó el anticuerpo anti-OBR (diluido a 1:2,000
en blotto blocking buffer) con cantidades crecientes del péptido recombinante
(0, 10, 100, 500ng) durante toda la noche a 4ºC. A la mañana siguiente, la
expresión proteica de OB-R en músculo esquelético fue analizada por medio de
la técnica del Western blot incubando la membrana con esta solución de
prehibridación.

Resumen de la metodología aplicada
74
10. ANÁLISIS ESTADÍSTICO
El análisis estadístico se llevó a cabo a través de la versión 8.0 del
programa SPSS (SPSS, Chicago, IL). Los datos cuantitativos está expresados
como media ± error estándar (S.E.M). Se comprobó la normalidad de las
variables con el test Kolmogorov-Smirnov corregido por Lilliefors. Cuando fue
necesario, el análisis fue realizado con los datos transformados a logaritmos.
Las diferencias entre grupos fueron determinadas con ANOVA, y con
ANCOVA, usando como covariable la perilipina A (estudio 2) y el porcentaje de
grasa corporal (estudio 3). La relación entre variables fue determinada usando
análisis de regresión lineal y análisis de correlación Pearson. La significación
estadística se indica para valores de P < 0.05 o inferiores.

RESUMEN DE LOS
RESULTADOS
Resumen de los resultados
77
En el siguiente apartado se resumen los resultados más relevantes de
cada uno de los artículos. La descripción detallada de los resultados se
encuentra en los artículos anexos.
1. RESUMEN DE RESULTADOS DEL ARTÍCULO 1 (Guerra et al. 2007)
Borja Guerra, Alfredo Santana, Teresa Fuentes, Safira Delgado-Guerra,
Alfredo Cabrera-Socorro, Cecilia Dorado, and José A, L. Calbet. (2007). Leptin
receptors in human skeletal muscle. J Appl Physiol. 102, 1786-1792.
a) Identificación del receptor de leptina en músculo esquelético humano.
El anticuerpo contra el dominio extracelular de OB-R reconoció tres
bandas con un peso molecular de 170 KDa, 128 KDa y 98 KDa (ver
figura 2 del estudio 1). La banda de 170 KDa fue detectada en los
extractos de músculo esquelético e hipotálamo. La banda de 128
KDa fue detectada en los extractos de músculo esquelético y tejido
adiposo, si bien en algunos sujetos la expresión de esta banda no fue
detectada. La banda de 98 KDa fue detectada en los extractos de
hipotálamo, tejido adiposo y músculo esquelético. Por otro lado,
observamos una correlación positiva entre las bandas de 98 y 128
KDa (r=0.76, p<0.01) y las bandas de 170 y 98KDa (r=0.74, p<0.01).
b) Especificidad del Anticuerpo.
Mediante los ensayos de especificidad demostramos que el
anticuerpo utilizado contra el dominio extracelular del OB-R reconoció
específicamente a las 3 bandas detectadas (ver figura 3 del estudio
1).
c) Contribución de tejido adiposo en la densidad de las bandas de OB-R
en músculo esquelético.
Mediante el uso de un anticuerpo dirigido contra la Perilipina A, una
proteína expresada en los adipocitos pero no en la fibra muscular,
pudimos comprobar que nuestros extractos musculares tenían 1.18 ±

Resumen de los resultados
78
0.13 µg de proteínas de tejido adiposo por cada 50 µg de proteínas
de músculo esquelético, es decir, un 2.4 ± 0.2% del extracto proteico
muscular estaba contaminado con proteínas procedentes del tejido
adiposo. Nuestros experimentos demostraron que esta
contaminación de grasa fue responsable del 89% de la densidad de
la banda de 98KDa y del 100% de la densidad de la banda de 128
KDa detectada en los extractos de músculo esquelético. La
contaminación de grasa no afectó a la banda de 170KDa, siendo ésta
específica de músculo esquelético humano (ver figuras 1 y 4 del
estudio 1).
d) Relación entre la leptina circulante y el OB-R muscular.
No hubo relación entre la concentración plasmática basal de leptina y
la expresión proteica muscular de OB-R.
2. RESUMEN DE RESULTADOS DEL ARTÍCULO 2 (Guerra et al. 2008)
Borja Guerra, Teresa Fuentes, Safira Delgado-Guerra, Amelia Guadalupe-
Grau, Hugo Olmedillas, Alfredo Santana, Jesús Gustavo Ponce-González,
Cecilia Dorado, and José A. L. Calbet. (2008). Gender Dimorphism in skeletal
muscle leptin receptors, serum leptin and insulin sensitivity. Plos one. 3, e3466.
a) Concentración de leptina plasmática, HOMA y hormonas sexuales.
La concentración basal de insulina y el índice HOMA, calculado a
partir de las concentraciones séricas de glucosa e insulina, fueron
similares en ambos sexos. La concentración de leptina circulante fue
3.4 veces mayor en mujeres que en hombres (P<0.05),
independientemente de la mayor cantidad de grasa presente en las
mujeres. En ambos sexos la concentración de leptina circulante
correlacionó con el porcentaje de grasa corporal (r=0.85, p<0.001).
En hombres la concentración de leptina correlacionó negativamente
con la testosterona total (r=-0.38, p<0.05) y la testosterona total así
como la testosterona libre correlacionaron negativamente con el

Resumen de los resultados
79
porcentaje de grasa corporal (r=-0.51 y r=-0.41, respectivamente,
p<0.01) (ver tabla 1 del estudio 2).
b) Dimorfismo sexual en la expresión de OB-R en músculo esquelético
humano y sensibilidad muscular a la hormona.
La expresión proteica de OB-R en músculo esquelético fue un 41%
(OB-R170, P<0.05) y un 163% (OB-R128, P<0.05) mayor en mujeres
que en hombres, independientemente de las diferencias en el
contenido de Perilipina A (ver figura 2 del estudio 2). No se encontró
relación entre OB-R muscular y la concentración de leptina circulante
en ninguno de los dos sexos.
En hombres encontramos una correlación negativa entre OB-R128 y
la concentración de testosterona libre (r=-0.34, p=0.05). En mujeres
OB-R128 y OB-R98 correlacionaron negativamente con la
concentración de testosterona total (r=-0.39 y r=-0.36,
respectivamente, ambos p<0.05) y OB-R128 con la concentración de
testosterona libre (r=-0.36, p<0.05).
La expresión proteica de SOCS-3 en músculo esquelético humano
fue similar en hombres y mujeres sanos y no correlacionó con la
concentración de leptina plasmática (ver figuras 3 y 4 del estudio 2).
3. RESUMEN DE RESULTADOS DEL ARTÍCULO 3 (Fuentes et al. 2010)
T. Fuentes, I. Ara, A. Guadalupe-Grau, S. Larsen, B. Stallknecht, H.
Olmedillas, A.Santana, J.W. Helge, J.A.L. Calbet, and B.Guerra. (2010). Leptin
receptor 170KDa (OB-R170) protein expression is reduced in obese human
skeletal muscle: a potential mechanism of leptin resistance. Exp Physiol, 95,
160-171.

Resumen de los resultados
80
a) Concentración de leptina circulante, HOMA y consumo máximo de
oxígeno (VO2max).
La concentración de leptina en sangre fue 3.5 veces mayor en los
sujetos obesos que en los controles (P<0.05), independientemente
de las diferencias en el porcentaje de grasa corporal. Los valores de
HOMA, insulina y glucosa fueron respectivamente 2.4, 2.2 y 1.1
veces mayores en el grupo de sujetos obesos comparado con el
grupo control (P<0.05). El VO2max fue un 25% menor en los sujetos
obesos (P<0.05) que en los controles (ver tabla 1 del estudio 3).
b) Expresión proteica de OB-R en deltoides y vasto lateral de sujetos
obesos y controles.
La expresión proteica del OB-R170 fue un 28% y un 25% menor en el
deltoides y en el vasto lateral, respectivamente, de los sujetos obesos
comparado con los sujetos control (P<0.05) (ver figura 1A y 1B del
estudio 3).
c) Expresión proteica muscular de moduladores negativos de la
sensibilidad muscular a la leptina.
La expresión proteica en músculo esquelético de SOCS-3 y PTP1B
fue similar en los sujetos sanos y obesos (ver figura 2 del estudio 3).
d) Señalización muscular activada por leptina.
El nivel de fosforilación de la Tyr705- STAT3 del deltoides, pero no del
vasto lateral, fue mayor en los sujetos obesos comparados con los
sujetos control (ver figura 3 del estudio 3).
Los niveles de fosforilación de la Thr172-AMPK fueron comparables
en sujetos obesos y controles (ver figura 4A del estudio 3). Sin
embargo, los niveles de fosforilación de la Ser221-ACCβ fueron un
67% mayores en el deltoides y un 36% menores en el vasto lateral de
los sujetos obesos (p<0.05) en comparación con los sujetos controles
(ver figura 4B del estudio 3).

Resumen de los resultados
81
e) Grupo de sujetos controles.
La expresión proteica de OB-R, en sus tres isoformas (OB-R170, OB-
R128 y OB-R98) (ver figura 1 del estudio 3), así como la expresión
proteica de SOCS-3 y PTP1B fueron similares en deltoides y vasto
lateral (ver figura 2 del estudio 3). Los niveles de fosforilación de la
Tyr705- STAT3 (ver figura 3 del estudio 3) así como la fosforilación
basal de la Thr172-AMPK y la Ser221-ACCβ (ver figura 4 del estudio 3)
fueron también similares en brazo y pierna dentro de este grupo de
sujetos.
f) Grupo de sujetos obesos.
La expresión proteica de las tres isoformas de OB-R (ver figura 1A
del estudio 3) fue un 15, un 70 y 22% (Ob-R170, OB-R128 y OB-R98,
respectivamente) menor en pierna que en el brazo (P<0.05) (ver
figuras 1B, 1C y 1D, respectivamente). Además, la expresión proteica
de SOCS3 fue un 59% mayor en el vasto lateral que en el deltoides
(P<0.05) (ver figura 2A del estudio 3). El contenido de PTP1B fue
similar en brazos y piernas (ver figura 2B del estudio 3). Los niveles
de fosforilación de la Tyr705- STAT3 fueron un 62% menores en el
vasto lateral comparado con el deltoides (P<0.05) (ver figura 3 del
estudio 3). Además, los niveles basales de fosforilación de la Thr172-
AMPK y la Ser221-ACCβ fueron un 53 y un 65% menores en el vasto
lateral que en el deltoides, respectivamente (P<0.001) (ver figura 4
del estudio 3).
4. RESUMEN DE LOS RESULTADOS DEL ARTÍCULO 4 (Fuentes et al.
2010b)
Teresa Fuentes, Borja Guerra, Jesús G. Ponce-González, David Morales-
Alamo, Amelia Guadalupe-Grau, Hugo Olmedillas, Leandro Fernández-Pérez,
Alfredo Santana, Lorena Rodríguez-García, José A.L. Calbet. (2010b). Skeletal
muscle signalling in response to sprint exercise: sex differences? (En revisión).
Resumen de los resultados
82
a) Composición Corporal, potencia máxima y potencia media en el test
de Wingate (ver tabla 1 del estudio 4).
Ambos grupos fueron comparables en edad, pero las mujeres
tuvieron menor talla y peso corporal, así como mayor porcentaje de
grasa corporal comparado con los hombres (P<0.01). Los hombres
tuvieron un mayor rendimiento en el test de Wingate, no obstante,
cuando la potencia máxima fue normalizada por la masa libre de
grasa de las piernas no se observaron diferencias significativas entre
sexos. Las concentraciones de lactato en sangre en respuesta al
ejercicio fueron similares en ambos grupos (ver tabla 2 del estudio 4).
b) Concentración de leptina en sangre (ver tabla 3 del estudio 4).
La concentración de leptina en sangre fue mayor en las mujeres que
en los hombres durante toda la secuencia temporal analizada. La
concentración de leptina en sangre, 2 horas después del ejercicio, se
redujo un 27% en hombres y un 13% en mujeres (interacción tiempo-
sexo, P<0.01), respecto a los valores previos al ejercicio. No hubo
relación entre el área bajo la curva de los valores de lactato y leptina.
Sin embargo, el área bajo la curva de la leptina presentó una
tendencia a relaccionarse negativamente con la potencia media por
Kg de peso libre de grasa de las piernas (r=-0.35, P=0.07) (ver tabla
4 del estudio 4).
c) Señalización muscular en respuesta al ejercicio de esprint.
La fosforilación de Thr172-AMPKα, ACCβ Ser221, Thy705-STAT3,
Thy202/Thy204-ERK1/2 y Thy180/Thy182-p38MAPK en respuesta al
ejercicio de esprint fue similar en hombres y mujeres (interacción
tiempo-sexo, en todos los casos P>0.05). La fosforilación de Thr172-
AMPKα aumentó 4 veces 30 minutos después del ejercicio de esprint
respecto a los valores previos al ejercicio en hombres y mujeres
(P<0.01) (ver figura 1 del estudio 4). La fosforilación de ACCβ Ser 221
aumentó 3 veces justo después y a los 30 minutos de la finalización
del ejercicio de esprint respecto a los valores previos al ejercicio en

Resumen de los resultados
83
hombres y mujeres (P<0.01) (ver figura 2 del estudio 4). La
fosforilación de Thy705-STAT3 aumentó significativamente 2 horas
después del test de Wingate respecto a los valores obtenidos justo
después del mismo (P<0.05) (ver figura 3 del estudio 4). Del mismo
modo, 30 minutos después del test de Wingate la fosforilación de
Thy202/Thy204-ERK1/2 fue 2.5 veces mayor respecto a la fosforilación
previa e inmediatamente posterior al test (ambas, P<0.05) (ver figura
4 del estudio 4). No se observaron cambios en la fosforilación de
Thy180/Thy182-p38MAPK en ninguno de los grupos (ver figura 5 del
estudio 4).
La potencia media por Kg de peso libre de grasa de las piernas
correlacionó positivamente con la fosforilación de Thy705-STAT3
(r=0.58, P<0.01). Una tendencia similar fue observada para la
fosforilación de Thy202/Thy204-ERK1/2 (r= 0.31, P=0.11) (tabla 4 del
estudio 4).

DISCUSIÓN

Discusión
87
ESTUDIO 1: RECEPTORES DE LEPTINA EN MÚSCULO ESQUELÉTICO HUMANO.
Estudios previos ya habían demostrado la presencia del ARNm del
receptor de leptina (OB-R) en músculo esquelético humano (Ceddia et al.,
2001) y en cultivos primarios de células de músculo esquelético (Solberg et al.,
2005). Además, diversas investigaciones habían puesto de manifiesto que
cultivos primarios musculares responden a la estimulación con leptina con un
incremento de la actividad de ERK (Solberg et al., 2005) y/o AMPK y con
aumento en la oxidación de ácidos grasos (Minokoshi et al., 2002; Steinberg et
al., 2006b). Estas evidencias experimentales previas nos permitieron
plantearnos la siguiente hipótesis de partida: el músculo esquelético humano
expresa receptor de leptina a nivel proteico. Los resultados obtenidos mediante
el uso de la técnica del Western blot en este primer estudio nos permitieron
confirmar esta hipótesis de partida.
A lo largo de este estudio empleamos un anticuerpo específico dirigido
contra el dominio extracelular de OB-R que nos permitió detectar, en ensayos
de Western blot, tres bandas con unos pesos moleculares aproximados de 98,
128 y 170 KDa. Las bandas de 128 y 98 KDa coinciden con la masa molecular
de la isoforma larga y corta de OB-R (OB-Rb y OB-Ra, respectivamente),
detectadas en otros tejidos humanos, incluyendo cerebro, hígado, tracto
intestinal, cordón umbilical y membranas fetales (Couce et al., 1997; Briscoe et
al., 2001; Akerman et al., 2002; Aparicio et al., 2005; Merino et al., 2006).
Además, el peso molecular de la banda de 170 KDa es compatible con el peso
molecular de la isoforma larga de OB-R (OB-Rb) detectada en células del
endotelio venoso umbilical humano (Bouloumie et al., 1998).
Los resultados de los ensayos de competición realizados con un péptido
de bloqueo que posee el dominio extracelular, presente en todas las isoformas
del OB-R humano (Recombinant Human Leptin R/Fc chimera), demostraron
que el anticuerpo dirigido contra OB-R empleado en este estudio reconoce
específicamente las tres bandas detectadas en músculo mediante los ensayos
de Western blot realizados. Estas evidencias experimentales sugieren que el
Discusión
88
músculo esquelético humano expresa a nivel proteico tanto la isoforma larga
como corta del receptor de leptina.
El músculo esquelético es un tejido complejo y puede contener grasa
intramuscular (Kim et al., 2004; Gallagher et al., 2005). Esto significa que las
biopsias musculares pueden presentar siempre una potencial contaminación de
grasa intramuscular, lo cual resultaba crucial en nuestro estudio puesto que el
tejido adiposo expresa en gran medida OB-R. Estudios previos ya habían
descrito valores de grasa intramuscular de 1.7, 2.2 y 2.5 % en sujetos con un
porcentaje de grasa corporal de 10.8, 25.3 y 20,2 % respectivamente (Kim et
al., 2004; Gallagher et al., 2005). En lo que se refiere a nuestro estudio, los
resultados demuestran que los extractos proteicos musculares se encuentran
contaminados con aproximadamente un 2.4 % de tejido adiposo intramuscular.
Por lo tanto, resulta muy importante tener en cuenta que una biopsia muscular
siempre posee cierta cantidad de tejido adiposo, lo cual ha sido obviado en
otros estudios que examinan la expresión génica de OB-R (Liu et al., 1997;
Ceddia et al., 2001; Ramsay & Richards, 2005).
Las evidencias experimentales aportadas por este primer estudio
demuestran claramente la presencia exclusiva de una banda de 170 KDa en
músculo esquelético, la cual no se expresa en tejido adiposo. Sin embargo, las
bandas de 98 y 128 KDa parecen proceder de la grasa intramuscular. La
procedencia de estas bandas fue comprobada experimentalmente añadiendo
cantidades crecientes de un extracto proteico obtenido de tejido adiposo
subcutáneo a los extractos musculares procedentes de las biopsias y
realizando con éstos ensayos de Western blot con el anticuerpo diseñado
contra el dominio extracelular de OB-R. Estos experimentos nos permitieron
observar como la intensidad de las bandas de 98 y 128 KDa aumentaba,
mientras que la densidad de la banda de 170 KDa no variaba al añadir extracto
proteico de grasa a los extractos musculares. Conociendo la cantidad de tejido
adiposo de cada biopsia muscular y la densidad de las bandas de 98 y 128
KDa del tejido adiposo subcutáneo comprobamos que la totalidad de la
densidad de la banda de 128 KDa y un 89% de la densidad de la banda de 98
KDa es debida a la contaminación con tejido graso. La falta de anticuerpos
específicos para cada isoforma de OB-R hizo imposible que pudiéramos

Discusión
89
comprobar a través de técnicas de inmunohistoquímica si la banda de 98 KDa
estaba presente en músculo esquelético humano.
La isoforma soluble del receptor de leptina (OB-Re) carece de los
dominios intracelular y transmembrana de OB-R y es la principal proteína unida
a la leptina en sangre (Friedman & Halaas, 1998). Teniendo en cuenta lo
comentado anteriormente, esta isoforma soluble de OB-R podría afectar a
nuestras determinaciones de OB-R en músculo humano debido a la presencia
de sangre en las biopsias musculares en el momento de la preparación de los
extractos. Para abordar experimentalmente esta cuestión, preparamos
extractos proteicos a partir de muestras de sangre humana para posteriormente
realizar ensayos de Western blot con el anticuerpo anti-OB-R usado a lo largo
de este primer estudio. Estos experimentos demostraron que OB-Re no es
reconocido por el anticuerpo diseñado contra el dominio extracelular de OB-R
en extractos proteicos preparados a partir de sangre humana, lo que sugiere
que las bandas de OB-R observadas en los extractos proteicos musculares no
proceden de la sangre presente en la biopsia muscular.
La presencia de una isoforma larga del receptor de leptina en músculo
esquelético humano puede ayudar a comprender la regulación del metabolismo
energético humano, así como a desentrañar la fisiopatología del síndrome
metabólico y la resistencia a la leptina e insulina (Steinberg & Dyck, 2000;
Steinberg et al., 2006b). De hecho, la isoforma de 170 KDa de OB-R detectada
podría constituir el principal ligando de la leptina en el músculo esquelético
humano (Baumann et al., 1996; Bjorbaek et al., 1997; Tartaglia, 1997; Bjorbak
et al., 2000).
Discusión
90
ESTUDIO 2: DIMORFISMO SEXUAL EN LOS RECEPTORES MUSCULARES DE LEPTINA EN HUMANOS, LEPTINA CIRCULANTE Y SENSIVILIDAD A LA INSULINA.
En el segundo estudio de este trabajo de tesis doctoral presentamos
evidencias que corroboraron la presencia de las isoformas corta y larga del
receptor de leptina en músculo esquelético humano, determinada previamente
en el estudio 1 (Guerra et al., 2007).
La hipótesis de partida que nos planteamos en este estudio es que las
mujeres tienen una expresión proteica reducida de OB-R muscular con
respecto a los hombres. Esta hipótesis de partida se basó en las siguientes
evidencias experimentales previas:
1. El aumento crónico de leptina en sangre, como ocurre en obesidad o
durante el embarazo, se ha relacionado con un descenso en la
expresión de OB-Rb en el hipotálamo y en tejidos periféricos como el
hígado (Hikita et al., 2000).
2. La administración aguda de leptina produce un descenso agudo de la
expresión de OB-R en líneas celulares (Hikita et al., 2000).
3. El ayuno prolongado en humanos incrementa la expresión del ARNm
de OB-R en células mononucleares periféricas (Chan et al., 2002).
4. La administración de leptina recombinante a humanos en ayunas
bloquea el aumento de OB-R en células mononucleares (Chan et al.,
2002).
En contraste con nuestra hipótesis, las evidencias experimentales
aportadas por este segundo estudio mostraron una mayor expresión proteica
de las isoformas de OB-R de 170 y 128 KDa de peso molecular en el músculo
esquelético de mujeres que en el de hombres. Además, comprobamos que las
biopsias musculares de las mujeres poseían más cantidad de grasa
intermuscular que las de los hombres, ya que éstas poseían mayor contenido
de Perilipina A (Gallagher et al., 2005).
Discusión
91
La expresión proteica de OB-R128 fue 2.3 veces mayor en mujeres que
en hombres, independientemente del mayor contenido de perilipina presente en
mujeres. La mayor expresión proteica de OB-R170 detectada en mujeres no
puede ser explicada por la mayor cantidad de grasa en mujeres, dado que esta
isoforma no se expresa en tejido adiposo (Guerra et al., 2007).
El dimorfismo sexual en la concentración plasmática de leptina ha sido
relacionado con una posible reducción de la sensibilidad a la leptina en mujeres
(Schwartz et al., 1996), sin embargo nuestros resultados apuntan a un aumento
de la sensibilidad a la leptina en mujeres.
Regulación de las concentraciones circulantes de leptina y de la
expresión muscular del receptor de leptina.
En concordancia con estudios anteriores, encontramos una relación
negativa entre la concentración de leptina y la testosterona sanguínea en
hombres (Isidori et al., 1999), probablemente debida al efecto inhibidor de la
leptina en la génesis de esteroides (Tena-Sempere et al., 2001) y en la
biosíntesis de testosterona (Caprio et al., 1999). A su vez, se ha observado que
los andrógenos reducen la trascripción génica de leptina en adipocitos de ratas
(Machinal et al., 1999) y que la administración de testosterona en hombres
jóvenes reduce la concentración plasmática de leptina (Luukkaa et al., 1998).
Este efecto es probablemente debido a la inhibición directa de la producción de
leptina en los adipocitos (Wabitsch et al., 1997), unido al aumento de la tasa
aclaramiento de la hormona y a la reducción de la vida media de la leptina en
sangre (Castrogiovanni et al., 2003).
La inhibición en la génesis de esteroides en células granulosas de ovario
causada por la leptina (Zachow et al., 1999) puede explicar la relación negativa
encontrada entre el 17β-estradiol y la leptina en mujeres. Por otro lado, la
estimulación ovárica con FSH induce un aumento concomitante del contenido
plasmático de leptina y de 17β-estradiol (Mannucci et al., 1998). Sin embargo,
se ha demostrado que las mujeres postmenopáusicas tienen mayores niveles
de leptina plasmática que sus homólogos hombres (Shimizu et al., 1997) y los
Discusión
92
mismos niveles que mujeres pre-menopáusicas, tras ajustar los datos a la
cantidad de grasa (Saad et al., 1997). Teniendo en cuenta estos datos, el 17β-
estradiol y los andrógenos podrían explicar sólo una pequeña parte del
dimorfismo sexual en la concentración plasmática de leptina.
La falta de relación entre el 17β - estradiol y los receptores musculares
de leptina observada en este segundo estudio puede deberse a que el estradiol
fue medido en una única y puntual extracción, la cual no refleja fielmente la
acción de los estrógenos en el músculo a medio y largo plazo, sobre todo en
mujeres fértiles (Shimizu et al., 1997; Mannucci et al., 1998). De hecho, un
estudio reciente ha mostrado que en ratas ovariectomizadas el 17β- estradiol
aumenta la expresión proteica de OB-R en músculo esquelético (Alonso et al.,
2007). No obstante, nuestros resultados indican que pequeñas diferencias en la
concentración de 17β- estradiol no permiten explicar las diferencias individuales
en la expresión de OB-R en hombres o mujeres.
Expresión aumentada de los receptores musculares de leptina en
mujeres.
Este segundo estudio de la presente tesis doctoral sugiere que el
músculo esquelético de las mujeres posee la capacidad potencial de responder
más efectivamente a la estimulación inducida por leptina debido al mayor
contenido proteico de OB-R (OB-Ra y OB-Rb) detectado en este músculo con
respecto al de los hombres. Este hecho podría explicar el porqué las mujeres
son capaces de oxidar más grasa durante un ejercicio prolongado que los
hombres (Tarnopolsky et al., 1990; Henderson et al., 2007).
Actualmente se desconoce el mecanismo responsable del dimorfismo
sexual en la expresión del receptor muscular de leptina en humanos. Los
resultados aportados por este segundo estudio del presente trabajo de tesis
doctoral indican que este dimorfismo sexual no puede ser explicado por los
niveles circulantes de leptina, puesto que a pesar de que ambos géneros tienen
concentraciones séricas de leptina muy diferentes, éstas no correlacionaron
con la expresión proteica muscular de OB-Ra u OB-Rb, ni con los niveles

Discusión
93
circulantes de OB-Re. Sin embargo, este estudio sí que aporta evidencias
indirectas acerca del potencial efecto de la concentración de testosterona libre
sobre la expresión muscular de OB-R, la cual podría explicar entre un 12% y un
13% de la variabilidad del contenido de OB-R128 en el músculo esquelético en
ambos sexos. A pesar de que leptina e insulina comparten determinadas vías
de señalización, nuestro estudio demuestra que los niveles basales circulantes
de insulina no regulan la expresión proteica muscular de OB-R. En este
sentido, un estudio previo ya había demostrado que no existe relación entre las
concentraciones séricas de insulina y la expresión génica de OB-Ra y OB-Rb
en hipotálamo e hígado de ratas obesas (Liu et al., 2007).
Expresión proteica muscular de SOCS3.
Se han observado mayores niveles de ARNm de SOCS3 en el músculo
esquelético de sujetos diabéticos tipo 2 comparado con sujetos sanos
(Rieusset et al., 2004), así como en músculo esquelético de ratones obesos
(Emanuelli et al., 2001). Sin embargo, en los últimos años se han publicado
diversos estudios que han aportado evidencias experimentales contradictorias
al respecto. Por ejemplo, recientemente se ha demostrado que el ARNm de
SOCS3 se encuentra aumentado en tejido graso subcutáneo en una muestra
de 9 hombres y 7 mujeres (Rieusset et al., 2004), sin embargo, también se ha
demostrado una reducción significativa de este ARNm en mujeres (Seron et al.,
2006). El presente estudio muestra por primera vez la expresión proteica de
SOCS3 en músculo esquelético humano de ambos sexos. En este sentido,
nuestro estudio demuestra que la expresión proteica de SOCS3 no se
encuentra incrementada en el músculo esquelético de las mujeres con respecto
al de los hombres, lo cual implica que si la sensibilidad muscular a la leptina
estuviera reducida en las mujeres, este fenómeno no podría ser explicado por
una expresión aumentada de SOCS3.
Discusión
94
ESTUDIO 3: REDUCCIÓN DE LA EXPRESIÓN PROTEICA DEL RECEPTOR MUSCULAR DE LEPTINA DE 170 KDA EN SUJETOS OBESOS: UN POTENCIAL MECANISMO DE RESISTENCIA A LA LEPTINA.
De acuerdo con la hipótesis de partida planteada, los resultados
aportados por este tercer estudio demuestran que la expresión proteica
muscular del receptor de leptina se encuentra reducida en humanos obesos en
comparación con sujetos controles sanos. Este efecto fue únicamente
observado en la isoforma larga del OB-R de 170 KDa, principal isoforma
implicada en la señalización intracelular (Kamikubo et al., 2008). Por otro lado,
este estudio también muestra un aumento de la expresión proteica de SOSC3 y
una reducción de la fosforilación de STAT3, AMPKα y ACCβ en el vasto lateral
del cuádriceps comparado con el deltoides, en sujetos obesos. Además,
únicamente el grupo control presentó una relación entre la cantidad de OB-R
170 y la fosforilación de STAT3. Estos efectos confirmaron nuestra hipótesis: la
resistencia a la leptina en músculo esquelético humano asociada a la obesidad
está relacionada con una reducción en la disponibilidad de receptores de
leptina combinada con una reducción de la señalización activada por la
hormona. Además, nuestro estudio aportó evidencias sobre el mayor grado de
resistencia a la leptina presente en los músculos de las extremidades inferiores
con respecto a los de las extremidades superiores en sujetos obesos.
Nuestros resultados coinciden con estudios previos que muestran una
regulación negativa de la expresión génica de OB-Rb y OB-Ra en hipotálamo
e hígado en obesidad (Hikita et al., 2000; Liu et al., 2007). La reducción de la
expresión proteica de OB-R170 en obesidad podría deberse a la
hiperleptinemia observada en este grupo experimental. Sin embargo, en
nuestro estudio no observamos relación entre la concentración sérica basal de
leptina, crónicamente elevada en obesidad, y la expresión proteica de los
receptores de leptina, excepto para la expresión proteica de OB-R128 en el
deltoides que correlacionó negativamente con la concentración basal de
leptina. La falta de relación entre la concentración plasmática de leptina y la

Discusión
95
expresión proteica de OB-Rs fue observada también en nuestros estudios
anteriores (Guerra et al., 2007; Guerra et al., 2008). Por lo tanto, nuestros
trabajos indican que la cantidad muscular de OB-R170 debe estar regulada por
otros mecanismos, además de por los niveles circulantes de leptina.
Expresión proteica de OB-R y resistencia muscular a la leptina.
En teoría, la menor cantidad de OB-R170 podría estar relacionada con
la acumulación de triglicéridos, la lipotoxicidad y las alteraciones en la
señalización muscular activada por la insulina, típicas en obesidad.
La resistencia central a la leptina ha sido relacionada con una
disminución en la expresión génica (Mannucci et al., 1998) y proteica del
receptor de leptina en hipotálamo (Martin et al., 2000). La resistencia periférica
a la leptina podría deberse también a una reducción del ARNm de los
receptores de leptina (Liu et al., 2007). Por lo tanto, la reducción de la
expresión proteica de OB-R170 en el músculo esquelético de sujetos obesos
observada en nuestro estudio podría representar un mecanismo de resistencia
muscular a la leptina. Estudios anteriores han demostrado que la sensibilidad
muscular a la leptina está disminuida en obesidad, ya que la hormona es
incapaz de aumentar la oxidación de ácidos grasos en músculo esquelético de
humanos obesos in vitro (Steinberg et al., 2002b) y la administración crónica de
leptina disminuye la captación de ácidos grasos y el transporte de los mismos
en músculo esquelético de ratas (Steinberg et al., 2002a).
Expresión proteica de SOCS3 y PTP1B en músculo esquelético
humano.
La resistencia muscular a la leptina podría deberse también a una
disminución en la señalización activada por la hormona a través de OB-Rb
(Munzberg & Myers, 2005). Varios estudios han aportado evidencias que
relacionan la resistencia a la leptina con una sobreexpresión de SOCS3
(Bjorbaek et al., 1999). En músculo esquelético de roedores con resistencia a la

Discusión
96
leptina (Eguchi et al., 2007), así como en miotúbulos de músculo esquelético de
obesos (Steinberg et al., 2006a) se ha observado una mayor expresión de
SOCS3. En nuestro estudio medimos por primera vez los niveles proteicos de
SOCS3 en músculo esquelético de humanos obesos y sanos. En contraste
con los estudios citados, nuestros resultados mostraron un contenido similar de
SOCS3 en músculo esquelético en ambos grupos. Además, no encontramos
relación entre la concentración de leptina plasmática y la expresión proteica de
SOCS3 en músculo.
Nuestros resultados indican que las diferencias en la sensibilidad a la
leptina entre ambos grupos experimentales no pueden explicarse únicamente
por las diferencias en el contenido proteico muscular de SOCS3. En este
sentido, Steinberg y col. observaron como el entrenamiento de resistencia
restablece la capacidad de la leptina para activar la oxidación de ácidos grasos
en ratas obesas con una elevada expresión génica muscular de SOCS3
(Steinberg et al., 2004b). Sin embargo, este efecto del ejercicio físico no se vió
acompañado de una disminución de la expresión del ARNm de SOCS3. A
pesar de no encontrar diferencias entre el contenido muscular de SOCS3 entre
el grupo de sujetos obesos y en grupo control, pudimos observar diferencias
regionales en el grupo de sujetos obesos, detectándose una expresión proteica
aumentada en los músculos de las piernas en comparación con los de los
brazos. Estas diferencias regionales en el contenido de SOCS3 en el músculo
de sujetos obesos, podrían explicar, al menos en parte, la mayor sensibilidad a
la insulina encontrada en los músculos de las extremidades superiores frente a
los de extremidades inferiores en humanos con diabetes tipo 2 (Olsen et al.,
2005).
PTP1B es un regulador negativo de la señalización de leptina e insulina
(Dube & Tremblay, 2005) y se encuentra sobreexpresado en múltiples tejidos
de ratones obesos, incluido el músculo esquelético (Zabolotny et al., 2002;
Dube & Tremblay, 2005; Zabolotny et al., 2008). Los estudios que han
investigado la expresión de PTP1B en músculo esquelético humano han
aportado evidencias experimentales contradictorias: varios estudios muestran
un aumento de la expresión de PTP1B en tejido adiposo y músculo esquelético
de humanos obesos (Ahmad et al., 1997a; Ahmad et al., 1997b; Cheung et al.,
Discusión
97
1999; Arora, 2008); mientras que otros estudios no muestran diferencias en la
expresión de PTP1B entre sujetos obesos y/o diabéticos comparado con
sujetos sanos (Kusari et al., 1994; Ahmad et al., 1997a; Ahmad et al., 1997b;
Worm et al., 1999). Al respecto, nuestros resultados mostraron un contenido
similar de PTP1B en el músculo esquelético de sujetos obesos y controles
sanos en pierna y brazo. Además, no encontramos relación entre la expresión
proteica de PTP1B en músculo y la concentración plasmática de leptina, lo cual
indica que las diferencias en la sensibilidad a la leptina en humanos no pueden
ser explicadas por las diferencias en el contenido muscular de PTP1B.
Fosforilación de STAT3 en músculo esquelético
La vía de señalización de STAT3 es activada en músculo esquelético
humano por numerosos estímulos además de por leptina (Stepkowski et al.,
2008) y está involucrada en la regulación de la proliferación celular,
diferenciación, muerte celular programada, inflamación, hipertrofia muscular y
en la respuesta inmunitaria, entre otros fenómenos (Akira, 2000; Judd et al.,
2006). Por lo tanto, la falta de relación encontrada entre los niveles de
fosforilación de STAT3 y la concentración de leptina y el contenido de OB-R170
en el deltoides de los sujetos obesos, puede reflejar simplemente la influencia
de otras señales sobre los efectos de la leptina en el deltoides. Por otro lado, el
descenso de la fosforilación de STAT3 en el vasto lateral de los sujetos obesos,
puede ser explicado por la sobreexpresión de SOCS3 encontrada en el vasto
lateral de los mismos, lo que bloquearía la fosforilación de STAT3 (Murray,
2007), con el consiguiente descenso en la oxidación de grasas y el
consiguiente aumento de la acumulación de triglicéridos intramusculares
(Akasaka et al., 2009).
Fosforilación de AMPKα y ACCβ en músculo esquelético
De acuerdo con estudios previos (Bandyopadhyay et al., 2006), hemos
observado que la fosforilación de ACCβ, pero no de AMPKα, se encuentra

Discusión
98
reducida en el vasto lateral de los sujetos obesos en comparación con los
sujetos control. La reducción en la fosforilación de ACCβ probablemente
produce una disminución de la oxidación de ácidos grasos, a través del
incremento de los niveles musculares de malonil coenzima A (Bandyopadhyay
et al., 2006; Steinberg & Jorgensen, 2007). En contra de nuestra hipótesis,
observamos una mayor fosforilación de ACCβ en el deltoides de obesos
comparado con el grupo control. Estos resultados podrían ser una
consecuencia de la hiperleptinemia propia de la obesidad, la cual sería
compatible con menores niveles de resistencia a la leptina en los brazos que en
las piernas. Diferencias regionales de este tipo han sido observadas en sujetos
con diabetes tipo 2, en lo cuales se ha demostrado una mayor sensibilidad a la
insulina en los músculos de los brazos que en los de las piernas (Olsen et al.,
2005). Por otro lado, los menores niveles de fosforilación de AMPKα y ACCβ
en el vasto lateral frente al deltoides de los sujetos obesos, podrían explicarse
por la mayor expresión proteica de SOCS3 encontrada en este mismo músculo
en el grupo de sujetos obesos.
Diferencias regionales en la expresión proteica de OB-R en el
músculo de obesos
Las evidencias experimentales aportadas por este tercer estudio
demuestran que existen diferencias regionales en la expresión proteica de OB-
R entre los músculos deltoides y vasto lateral del cuádriceps en sujetos obesos.
Puesto que los músculos de las piernas se usan continuamente en la
deambulación, mientras que los de los brazos se usan más intermitentemente,
las diferencias regionales en la expresión muscular de OB-R sugieren que la
actividad muscular podría jugar un papel clave en la regulación de la expresión
de este receptor. Por lo tanto, es muy posible que los músculos más activos
necesiten menos OB-R ya que el ejercicio mejora la sensibilidad muscular a la
leptina. En este sentido, se ha demostrado recientemente que la inmovilización
con yeso (4-11 días) o el reposo en cama en humanos estimula la expresión de
OB-R en el gastrocnemio medio (Chen et al., 2007). La mayor expresión
proteica de OB-R detectada en el deltoides frente al vasto lateral de los sujetos

Discusión
99
obesos podría facilitar la señalización activada por la hormona y permitir, en
presencia de hiperleptinemia, una mayor señalización activada por AMPK y
STAT3, en comparación con el vasto lateral del cuádriceps. Las diferencias
regionales en la expresión proteica de OB-R en el músculo de los sujetos
obesos podrían estar relacionadas con diferencias en la distribución de tipos de
fibras entre el vasto lateral y el deltoides. Sin embargo nuestros sujetos obesos
y control tienen una distribución de tipos de fibras similar en ambos músculos
(Ara et al.).
ESTUDIO 4: SEÑALIZACIÓN MUSCULAR EN RESPUESTA AL EJERCICIO DE ESPRINT EN HOMBRES Y MUJERES.
En este último estudio analizamos las vías de señalización muscular de
AMPK, MAPK (ERK/p38MAPK) y STAT en respuesta a un ejercicio de esprint
de 30s (test de Wingate) en hombres y mujeres. La respuesta encontrada fue
similar en ambos grupos. Además, mostramos que el ejercicio de esprint
aumenta la fosforilación de AMPK 30 minutos después del test de Wingate y la
fosforilación de ACC inmediatamente después y 30 minutos después del
esprint, sin diferencias significativas entre hombres y mujeres. Nuestros
resultados coinciden con el estudio de Guerra y col. realizado en hombres
(Guerra et al., 2010) y sostienen la idea de que la fosforilación de ACC en
respuesta al ejercicio de esprint es, al menos en parte, independiente de la
fosforilación de AMPK (Jorgensen et al., 2004; Dzamko et al., 2008; Guerra et
al., 2010). De acuerdo con el estudio de Gibala y col. (Gibala et al., 2009) y
Guerra y col. (Guerra et al., 2010), no encontramos un aumento en la
fosforilación de AMPK inmediatamente después del esprint de 30s. Dos horas
después del ejercicio de esprint la fosforilación de AMPK fue similar a la
fosforilación previa al ejercicio.
Al contrario que en nuestro modelo de ejercicio (altamente glucolítico),
se ha observado una respuesta rápida (en los 5 primeros minutos) de la
fosforilación de AMPKα en hombres durante un ejercicio de resistencia

Discusión
100
(Stephens et al., 2002). De este modo, es posible que ejercicios que requieran
oxidación de grasas conlleven una rápida fosforilación de AMPKα. Las
diferencias entre sexos en la fosforilación de AMPKα en respuesta al ejercicio
han sido estudiadas solamente en respuesta a un ejercicio de resistencia.
Roepstorff y col. observaron una menor fosforilación de AMPKα en mujeres
comparado con hombres después de 90 minutos de ejercicio en bicicleta al
60% del VO2max (Roepstorff et al., 2006). Las diferencias sexuales en la
activación de AMPK inducida por el ejercicio fueron explicadas por un aumento
muscular del AMP, del ratio AMP/ATP y de la creatina en hombres pero no en
mujeres. A pesar de que los nucleótidos no fueron medidos en nuestro estudio,
trabajos previos no han demostrado diferencias significativas en el uso del ATP
entre sexos durante un sólo ejercicio de esprint. Esto concuerda con los valores
similares en la potencia máxima por Kg de peso libre de grasa de las piernas
entre hombres y mujeres encontrados en nuestro estudio. Sin embargo,
Esbjornsson-Liljedahl y col. mostraron que las mujeres poseen una
recuperación más rápida del ATP mediada por IMP (Esbjornsson-Liljedahl et
al., 2002). A pesar de esto, no encontramos diferencias entre sexos en la
fosforilación de AMPKα y ACC 30 minutos y 2 horas después del test de
Wingate.
No se han encontrado cambios significativos en la fosforilación de
STAT3 después de 90 minutos de ejercicio en bicicleta en hombres (Boonsong
et al., 2007), pero el estudio publicado por Trenerry y col. mostró un aumento
en la fosforilación de STAT3 2 horas después de un ejercicio de fuerza en
hombres (3 x 12 RM de un ejercicio de extensión de pierna) (Trenerry et al.,
2007). En nuestro estudio encontramos una fuerte relación entre la potencia
media desarrollada por Kg de peso libre de grasa de las piernas y la
fosforilación de STAT3 30 minutos después del test de Wingate, pero no 2
horas después. Combinando nuestros resultados con los aportados por el
trabajo de Trenerry y col. (Trenerry et al., 2007) podemos sugerir que la
intensidad del ejercicio es uno de los factores determinantes de la fosforilación
de STAT3 en respuesta al ejercicio. La fosforilación de STAT3 después del
ejercicio intenso produce su translocación al núcleo (Trenerry et al., 2007) y el
aumento de la expresión de genes regulados por STAT3 (interleucina-6 (IL-6),

Discusión
101
JunB, c-MYC, c-fos y supresor de la señalización de citoquinas (SOCS) 3), que
probablemente tienen un papel importante en la adaptación al ejercicio de alta
intensidad (Trenerry et al., 2007; Trenerry et al., 2008).
De acuerdo con nuestra hipótesis, la fosforilación de ERK1/2 aumenta
30 minutos después de la finalización del esprint, sin diferencias significativas
entre hombres y mujeres. Del mismo modo, se han encontrado incrementos
similares en la fosforilación de ERK1/2 después de ejercicio de resistencia en
hombres (Goodyear et al., 1996; Widegren et al., 1998; Widegren et al., 2000;
Yu et al., 2001; Creer et al., 2005; Deldicque et al., 2008b) y después de
ejercicio de fuerza en hombres (Deldicque et al., ; Williamson et al., 2003) y
mujeres con sobrepeso (Harber et al., 2008). Por otro lado, Richter y col.
encontraron que la fosforilación de ERK1/2 aumenta en relación al incremento
de la intensidad del ejercicio (Richter et al., 2004). Este hecho concuerda con la
tendencia a la correlación encontrada en nuestro estudio, entre la potencia
media desarrollada por kg de masa libre de grasa de las extremidades
inferiores y la respuesta en la fosforilación de Thy202/Thy204-ERK1/2 30 minutos
después del test de Wingate.
La fosforilación de p38MAPK aumenta después de un ejercicio de
resistencia en hombres (Aronson et al., 1997; Yu et al., 2001) y después de un
ejercicio de fuerza en hombres (Deldicque et al., 2008b) y mujeres con
sobrepeso (Harber et al., 2008), así como durante un ejercicio interválico de
alta intensidad en hombres (Cochran et al.). Gibala y col. no observaron
cambios en la fosforilación p38MAPK inmediatamente después de un test de
Wingate (Gibala et al., 2009). Nuestro estudio confirma estos datos mostrando
que el nivel de fosforilación p38MAPK se mantiene sin cambios durante las dos
horas posteriores a un solo test de Wingate. Sin embargo, después de cuatro
test de Wingate intercalados con períodos de 4 min de descanso Gibala y col..
encontraron un aumento de un 30% en la fosforilación p38MAPK (Gibala et al.,
2009).
En este último estudio de este trabajo de tesis doctoral, se ha medido
por primera vez la respuesta de las concentraciones séricas de leptina a un
ejercicio de esprint (Wingate test) en hombres y mujeres. Nuestra investigación

Discusión
102
revela que la concentración de leptina en sangre no se modifica
inmediatamente después de un esprint de 30 segundos, pero desciende
durante el periodo de recuperación, siendo esta reducción significativamente
más acentuada en hombres que en mujeres. Aunque las mujeres tuvieron
mayores concentraciones de leptina que los hombres durante el periodo de
repuperación y a pesar de que las mujeres presentar una mayor expresión de
receptor muscular de leptina (Guerra et al., 2008), no encontramos diferencias
en la fosforilación de STAT3 en respuesta al ejercicio de esprint entre hombres
y mujeres. Además, la reducción de leptina dos horas después del test de
Wingate, no fue acompañada por cambios en la fosforilación de STAT3,
indicando que debe haber otros mecanismos implicados en el mantenimiento
de la fosforilación de STAT3 cuando las concentraciones de leptina en sangre
se ven reducidas. La reducción de la concentración de leptina en sangre 2
horas después del ejercicio de esprint podría ser explicada por los efectos del
ejercicio (Kraemer et al., 2002), mediados por la estimulación del sistema β -
adrenérgico (Couillard et al., 2002), a través de mecanismos
posttranscripcionales (Ricci et al., 2005). Sin embargo, no podemos obviar la
influencia del ayuno (Boden et al., 1996; Zhang et al., 2002).
Los hombres desarrollaron un mayor rendimiento en el test de Wingate.
Sin embargo, la potencia máxima relativa a la masa libre de grasa de las
extremidades fue similar en ambos sexos (Perez-Gomez et al., 2008b). No
obstante, tras ser normalizada por la masa libre de grasa de las piernas, la
potencia media fue un 6% mayor en los hombres respecto a las mujeres. Esta
diferencia podría ser debida en parte a la mayor capacidad anaeróbica de los
hombres, especialmente debido a su mayor capacidad glucolítica (Jaworowski
et al., 2002). Como era de esperar, el test the Wingate fue acompañado de un
aumento en la concentración de lactato en sangre (Calbet et al., 2003). Sin
embargo, con estas pequeñas diferencias en la potencia media normalizada,
las respuestas en el lactato fueron similares en hombres y mujeres. Estudios
con cultivos celulares de adipocitos indican que la inhibición de la glucólisis
reduce la expresión génica y la liberación de leptina (Mueller et al., 1998). El
lactato suprime la lipólisis (Liu et al. 2009) y los ácidos grasos libres reducen
los niveles circulantes de leptina, de este modo, los incrementos en la

Discusión
103
concentración de lactato en sangre deberían influir positivamente en la
liberación de leptina (Vestergaard et al., 2005). Sin embargo, en nuestro
estudio, la respuesta del lactato al ejercicio no correlaciona con los niveles
séricos de leptina.

CONCLUSIONES

Conclusiones
107
1. El músculo esquelético humano expresa a nivel proteico una isoforma
larga del receptor de leptina de 170 KDa de peso molecular.
2. En humanos, existe un dimorfismo sexual en la expresión proteica
muscular de OB-R que puede ser explicada, al menos en parte, por la
influencia de los niveles circulantes de testosterona.
3. A pesar del hecho de que el músculo esquelético de las mujeres está
expuesto a elevadas concentraciones de leptina, la expresión proteica
de SOCS3 es similar en hombres y mujeres, indicando que si existe
algún grado de resistencia muscular a la leptina en mujeres el
mecanismo no está mediado por un aumento de SOCS3.
4. La expresión proteica muscular de la isoforma larga del receptor de
leptina se encuentra reducida en seres humanos obesos. Esta
regulación negativa de la expresión de OB-R no puede ser explicada
por los niveles crónicamente aumentados de leptina e insulina
observados en estos sujetos.
5. En humanos obesos se observan diferencias regionales en la expresión
de la isoforma larga del receptor de leptina, de forma que la expresión
esta aumentada en los músculos de los brazos con respecto a los de
las piernas.
6. En humanos obesos la expresión proteica de SOCS3 esta aumentada y
la fosforilación de STAT3, AMPKα y ACCβ reducida en los músculos de
las piernas con respecto a los de los brazos, pudiendo reflejar este
hecho diferencias regionales en la sensibilidad a la leptina al igual que
existen diferencias regionales en la sensibilidad a la insulina en sujetos
diabéticos de tipo 2.
7. La fosforilación de AMPK, ACC, STAT3 y ERK se ve incrementada
después de un ejercicio de sprint de 30s (test de Wingate) en el vasto
lateral de hombres y mujeres. En el caso de las quinasas de proteína
STAT3 y ERK, este incremento de la fosforilación parece estar
relacionado con la intensidad del ejercicio.

Conclusiones
108
8. La respuesta de la señalización muscular mediada por AMPK, ACC,
STAT3, ERK y p38MAPK a un ejercicio de esprint es similar en
hombres y mujeres, a pesar de las diferencias observadas entre sexos
en las concentraciones séricas de leptina.

CONCLUSIONS
Conclusions
111
1. A long isoform of the leptin receptor with a molecular mass close to
170KDa is expressed at the protein level in human skeletal muscle.
2. In humans, there is a sexual dimorphism in muscle protein expression of
OB-R which can be explained, at least in part, by the influence of
circulating testosterone levels.
3. Despite the fact that female skeletal muscle is exposed to very high leptin
concentrations, SOCS3 expression is similar in men and women,
indicating that if women have some degree of leptin resistance in their
skeletal muscle the mechanism should be other than SOCS3 up-
regulation.
4. Muscle protein expression of the long isoform of the leptin receptor is
reduced in obese humans. This negative regulation of OB-R expression
cannot be explained by chronically increased levels of leptin and insulin
observed in these subjects.
5. Obese humans shown regional differences in the protein expression of
the long isoform of the leptin receptor, so that the expression is
increased in the muscles of the arms with respect to the legs.
6. In obese humans SOCS3 protein expression is increased, and basal
STAT3, AMPKα and ACCβ phosphorylation levels are reduced in the
vastus lateralis compared with the deltoid muscle. This may reflect
regional differences in leptin sensitivity.
7. AMPK, ACC, STAT3 and ERK phosphorylation is increased in the vastus
lateralis of men and women in response to a 30s sprint exercise. The
rise in ERK and STAT3 phosphorylation seems to be related to the
intensity of exercise.
8. The muscle AMPK, ACC, STAT3, ERK and p38MAPK mediated
signaling response to a single bout of sprint exercise is similar in men
and women, despite of the sexual differences in leptin response to
exercise.

BIBLIOGRAFÍA
Bibliografía
115
Bibliografía
Adams J, Chen ZP, Van Denderen BJ, Morton CJ, Parker MW, Witters LA, Stapleton D & Kemp BE (2004). Intrasteric control of AMPK via the gamma1 subunit AMP allosteric regulatory site. Protein Sci 13, 155-165.
Ahima RS & Flier JS (2000). Leptin. Annu Rev Physiol 62, 413-437. Ahima RS & Osei SY (2004). Leptin signaling. Physiol Behav 81, 223-241. Ahmad F, Azevedo JL, Cortright R, Dohm GL & Goldstein BJ (1997a). Alterations in skeletal
muscle protein-tyrosine phosphatase activity and expression in insulin-resistant human obesity and diabetes. J Clin Invest 100, 449-458.
Ahmad F, Considine RV, Bauer TL, Ohannesian JP, Marco CC & Goldstein BJ (1997b). Improved
sensitivity to insulin in obese subjects following weight loss is accompanied by reduced protein-tyrosine phosphatases in adipose tissue. Metabolism 46, 1140-1145.
Akasaka Y, Tsunoda M, Ide T & Murakami K (2009). Chronic leptin treatment stimulates lipid
oxidation in immortalized and primary mouse skeletal muscle cells. Biochim Biophys Acta 1791, 103-109.
Akerman F, Lei ZM & Rao CV (2002). Human umbilical cord and fetal membranes co-express
leptin and its receptor genes. Gynecol Endocrinol 16, 299-306. Akira S (2000). Roles of STAT3 defined by tissue-specific gene targeting. Oncogene 19, 2607-
2611. Alonso A, Fernandez R, Moreno M, Ordonez P, Diaz F & Gonzalez C (2007). Leptin and its
receptor are controlled by 17beta-estradiol in peripheral tissues of ovariectomized rats. Exp Biol Med (Maywood) 232, 542-549.
Aparicio T, Kermorgant S, Darmoul D, Guilmeau S, Hormi K, Mahieu-Caputo D & Lehy T (2005).
Leptin and Ob-Rb receptor isoform in the human digestive tract during fetal development. J Clin Endocrinol Metab 90, 6177-6184.
Ara I, Larsen S, Stallknecht B, Guerra B, Morales-Alamo D, Andersen JL, Ponce-Gonzalez JG,
Guadalupe-Grau A, Galbo H, Calbet JA & Helge JW Normal mitochondrial function and increased fat oxidation capacity in leg and arm muscles in obese humans. Int J Obes (Lond).
Ara I, Perez-Gomez J, Vicente-Rodriguez G, Chavarren J, Dorado C & Calbet JA (2006). Serum
free testosterone, leptin and soluble leptin receptor changes in a 6-week strength-training programme. Br J Nutr 96, 1053-1059.
Ara I, Vicente-Rodriguez G, Jimenez-Ramirez J, Dorado C, Serrano-Sanchez JA & Calbet JA
(2004). Regular participation in sports is associated with enhanced physical fitness and lower fat mass in prepubertal boys. Int J Obes Relat Metab Disord 28, 1585-1593.
Ara Royo IV-R, Pérez Gómez G, Dorado García J & JAL. CC (2003). Leptina y Ejercicio Físico.
Archivos de Medicina del Deporte XX(94), 135-142.

Bibliografía
116
Aranceta J, Perez-Rodrigo C, Serra-Majem L, Ribas L, Quiles-Izquierdo J, Vioque J & Foz M
(2001). Influence of sociodemographic factors in the prevalence of obesity in Spain. The SEEDO'97 Study. Eur J Clin Nutr 55, 430-435.
Aranceta J, Perez Rodrigo C, Serra Majem L, Ribas Barba L, Quiles Izquierdo J, Vioque J, Tur
Mari J, Mataix Verdu J, Llopis Gonzalez J, Tojo R & Foz Sala M (2003). [Prevalence of obesity in Spain: results of the SEEDO 2000 study]. Med Clin (Barc) 120, 608-612.
Argiles JM, Lopez-Soriano J, Almendro V, Busquets S & Lopez-Soriano FJ (2005). Cross-talk
between skeletal muscle and adipose tissue: a link with obesity? Med Res Rev 25, 49-65.
Aronson D, Violan MA, Dufresne SD, Zangen D, Fielding RA & Goodyear LJ (1997). Exercise
stimulates the mitogen-activated protein kinase pathway in human skeletal muscle. J Clin Invest 99, 1251-1257.
Arora S (2008). Leptin and its metabolic interactions - an update. Diabetes Obes Metab. Bado A, Levasseur S, Attoub S, Kermorgant S, Laigneau JP, Bortoluzzi MN, Moizo L, Lehy T,
Guerre-Millo M, Le Marchand-Brustel Y & Lewin MJ (1998). The stomach is a source of leptin. Nature 394, 790-793.
Bahrenberg G, Behrmann I, Barthel A, Hekerman P, Heinrich PC, Joost HG & Becker W (2002).
Identification of the critical sequence elements in the cytoplasmic domain of leptin receptor isoforms required for Janus kinase/signal transducer and activator of transcription activation by receptor heterodimers. Mol Endocrinol 16, 859-872.
Bandyopadhyay GK, Yu JG, Ofrecio J & Olefsky JM (2006). Increased malonyl-CoA levels in
muscle from obese and type 2 diabetic subjects lead to decreased fatty acid oxidation and increased lipogenesis; thiazolidinedione treatment reverses these defects. Diabetes 55, 2277-2285.
Banks AS, Davis SM, Bates SH & Myers MG, Jr. (2000). Activation of downstream signals by the
long form of the leptin receptor. J Biol Chem 275, 14563-14572. Banks WA (2004). The many lives of leptin. Peptides 25, 331-338. Bar-Or O, Foreyt J, Bouchard C, Brownell KD, Dietz WH, Ravussin E, Salbe AD, Schwenger S, St
Jeor S & Torun B (1998). Physical activity, genetic, and nutritional considerations in childhood weight management. Med Sci Sports Exerc 30, 2-10.
Baratta M (2002). Leptin--from a signal of adiposity to a hormonal mediator in peripheral
tissues. Med Sci Monit 8, RA282-292. Barnes BR, Marklund S, Steiler TL, Walter M, Hjalm G, Amarger V, Mahlapuu M, Leng Y,
Johansson C, Galuska D, Lindgren K, Abrink M, Stapleton D, Zierath JR & Andersson L (2004). The 5'-AMP-activated protein kinase gamma3 isoform has a key role in carbohydrate and lipid metabolism in glycolytic skeletal muscle. J Biol Chem 279, 38441-38447.

Bibliografía
117
Bates SH & Myers MG, Jr. (2003). The role of leptin receptor signaling in feeding and neuroendocrine function. Trends Endocrinol Metab 14, 447-452.
Baumann H, Morella KK, White DW, Dembski M, Bailon PS, Kim H, Lai CF & Tartaglia LA (1996).
The full-length leptin receptor has signaling capabilities of interleukin 6-type cytokine receptors. Proc Natl Acad Sci U S A 93, 8374-8378.
Benomar Y, Roy AF, Aubourg A, Djiane J & Taouis M (2005). Cross down-regulation of leptin
and insulin receptor expression and signalling in a human neuronal cell line. Biochem J 388, 929-939.
Benziane B, Burton TJ, Scanlan B, Galuska D, Canny BJ, Chibalin AV, Zierath JR & Stepto NK
(2008). Divergent cell signaling after short-term intensified endurance training in human skeletal muscle. Am J Physiol Endocrinol Metab 295, E1427-1438.
Berti L & Gammeltoft S (1999). Leptin stimulates glucose uptake in C2C12 muscle cells by
activation of ERK2. Mol Cell Endocrinol 157, 121-130. Birk JB & Wojtaszewski JF (2006). Predominant alpha2/beta2/gamma3 AMPK activation during
exercise in human skeletal muscle. J Physiol 577, 1021-1032. Bjorbaek C, Buchholz RM, Davis SM, Bates SH, Pierroz DD, Gu H, Neel BG, Myers MG, Jr. & Flier
JS (2001). Divergent roles of SHP-2 in ERK activation by leptin receptors. J Biol Chem 276, 4747-4755.
Bjorbaek C, El-Haschimi K, Frantz JD & Flier JS (1999). The role of SOCS-3 in leptin signaling and
leptin resistance. J Biol Chem 274, 30059-30065. Bjorbaek C & Kahn BB (2004). Leptin signaling in the central nervous system and the periphery.
Recent Prog Horm Res 59, 305-331. Bjorbaek C, Uotani S, da Silva B & Flier JS (1997). Divergent signaling capacities of the long and
short isoforms of the leptin receptor. J Biol Chem 272, 32686-32695. Bjorbak C, Lavery HJ, Bates SH, Olson RK, Davis SM, Flier JS & Myers MG, Jr. (2000). SOCS3
mediates feedback inhibition of the leptin receptor via Tyr985. J Biol Chem 275, 40649-40657.
Blair SN & Church TS (2004). The fitness, obesity, and health equation: is physical activity the
common denominator? Jama 292, 1232-1234. Blair SN & Jackson AS (2001). Physical fitness and activity as separate heart disease risk factors:
a meta-analysis. Med Sci Sports Exerc 33, 762-764. Boden G, Chen X, Mozzoli M & Ryan I (1996). Effect of fasting on serum leptin in normal human
subjects. J Clin Endocrinol Metab 81, 3419-3423. Boonsong T, Norton L, Chokkalingam K, Jewell K, Macdonald I, Bennett A & Tsintzas K (2007).
Effect of exercise and insulin on SREBP-1c expression in human skeletal muscle: potential roles for the ERK1/2 and Akt signalling pathways. Biochem Soc Trans 35, 1310-1311.

Bibliografía
118
Borodulin K, Laatikainen T, Lahti-Koski M, Lakka TA, Laukkanen R, Sarna S & Jousilahti P (2005). Associations between estimated aerobic fitness and cardiovascular risk factors in adults with different levels of abdominal obesity. Eur J Cardiovasc Prev Rehabil 12, 126-131.
Bouloumie A, Drexler HC, Lafontan M & Busse R (1998). Leptin, the product of Ob gene,
promotes angiogenesis. Circ Res 83, 1059-1066. Briscoe CP, Hanif S, Arch JR & Tadayyon M (2001). Leptin receptor long-form signalling in a
human liver cell line. Cytokine 14, 225-229. Burguera B, Couce ME, Long J, Lamsam J, Laakso K, Jensen MD, Parisi JE & Lloyd RV (2000). The
long form of the leptin receptor (OB-Rb) is widely expressed in the human brain. Neuroendocrinology 71, 187-195.
Calbet JA, De Paz JA, Garatachea N, Cabeza de Vaca S & Chavarren J (2003). Anaerobic energy
provision does not limit Wingate exercise performance in endurance-trained cyclists. J Appl Physiol 94, 668-676.
Campfield LA, Smith FJ, Guisez Y, Devos R & Burn P (1995). Recombinant mouse OB protein:
evidence for a peripheral signal linking adiposity and central neural networks. Science 269, 546-549.
Caprio M, Isidori AM, Carta AR, Moretti C, Dufau ML & Fabbri A (1999). Expression of
functional leptin receptors in rodent Leydig cells. Endocrinology 140, 4939-4947. Carling D, Zammit VA & Hardie DG (1987). A common bicyclic protein kinase cascade
inactivates the regulatory enzymes of fatty acid and cholesterol biosynthesis. FEBS Lett 223, 217-222.
Carlson CA & Kim KH (1973). Regulation of hepatic acetyl coenzyme A carboxylase by
phosphorylation and dephosphorylation. J Biol Chem 248, 378-380. Castrogiovanni D, Perello M, Gaillard RC & Spinedi E (2003). Modulatory role of testosterone in
plasma leptin turnover in rats. Endocrine 22, 203-210. Ceddia RB, William WN, Jr. & Curi R (2001). The response of skeletal muscle to leptin. Front
Biosci 6, D90-97. Cochran AJ, Little JP, Tarnopolsky MA & Gibala MJ Carbohydrate feeding during recovery alters
the skeletal muscle metabolic response to repeated sessions of high-intensity interval exercise in humans. J Appl Physiol 108, 628-636.
Cohen P, Zhao C, Cai X, Montez JM, Rohani SC, Feinstein P, Mombaerts P & Friedman JM
(2001). Selective deletion of leptin receptor in neurons leads to obesity. J Clin Invest 108, 1113-1121.
Considine RV & Caro JF (1997). Leptin and the regulation of body weight. Int J Biochem Cell Biol
29, 1255-1272. Consitt LA, Wideman L, Hickey MS & Morrison RF (2008). Phosphorylation of the JAK2-STAT5
pathway in response to acute aerobic exercise. Med Sci Sports Exerc 40, 1031-1038.

Bibliografía
119
Cook WS & Unger RH (2002). Protein tyrosine phosphatase 1B: a potential leptin resistance
factor of obesity. Dev Cell 2, 385-387. Cornish J, Callon KE, Bava U, Lin C, Naot D, Hill BL, Grey AB, Broom N, Myers DE, Nicholson GC
& Reid IR (2002). Leptin directly regulates bone cell function in vitro and reduces bone fragility in vivo. J Endocrinol 175, 405-415.
Couce ME, Burguera B, Parisi JE, Jensen MD & Lloyd RV (1997). Localization of leptin receptor
in the human brain. Neuroendocrinology 66, 145-150. Couillard C, Mauriege P, Prud'homme D, Nadeau A, Tremblay A, Bouchard C & Despres JP
(2002). Plasma leptin response to an epinephrine infusion in lean and obese women. Obes Res 10, 6-13.
Creer A, Gallagher P, Slivka D, Jemiolo B, Fink W & Trappe S (2005). Influence of muscle
glycogen availability on ERK1/2 and Akt signaling after resistance exercise in human skeletal muscle. J Appl Physiol 99, 950-956.
Chan JL, Bluher S, Yiannakouris N, Suchard MA, Kratzsch J & Mantzoros CS (2002). Regulation
of circulating soluble leptin receptor levels by gender, adiposity, sex steroids, and leptin: observational and interventional studies in humans. Diabetes 51, 2105-2112.
Chen K, Li F, Li J, Cai H, Strom S, Bisello A, Kelley DE, Friedman-Einat M, Skibinski GA, McCrory
MA, Szalai AJ & Zhao AZ (2006). Induction of leptin resistance through direct interaction of C-reactive protein with leptin. Nat Med 12, 425-432.
Chen YW, Gregory CM, Scarborough MT, Shi R, Walter GA & Vandenborne K (2007).
Transcriptional pathways associated with skeletal muscle disuse atrophy in humans. Physiol Genomics 31, 510-520.
Chen ZP, McConell GK, Michell BJ, Snow RJ, Canny BJ & Kemp BE (2000). AMPK signaling in
contracting human skeletal muscle: acetyl-CoA carboxylase and NO synthase phosphorylation. Am J Physiol Endocrinol Metab 279, E1202-1206.
Chen ZP, Stephens TJ, Murthy S, Canny BJ, Hargreaves M, Witters LA, Kemp BE & McConell GK
(2003). Effect of exercise intensity on skeletal muscle AMPK signaling in humans. Diabetes 52, 2205-2212.
Cheung A, Kusari J, Jansen D, Bandyopadhyay D, Kusari A & Bryer-Ash M (1999). Marked
impairment of protein tyrosine phosphatase 1B activity in adipose tissue of obese subjects with and without type 2 diabetes mellitus. J Lab Clin Med 134, 115-123.
Cheung PC, Salt IP, Davies SP, Hardie DG & Carling D (2000). Characterization of AMP-activated
protein kinase gamma-subunit isoforms and their role in AMP binding. Biochem J 346 Pt 3, 659-669.
Chua SC, Jr., Chung WK, Wu-Peng XS, Zhang Y, Liu SM, Tartaglia L & Leibel RL (1996).
Phenotypes of mouse diabetes and rat fatty due to mutations in the OB (leptin) receptor. Science 271, 994-996.

Bibliografía
120
Chua SC, Jr., Koutras IK, Han L, Liu SM, Kay J, Young SJ, Chung WK & Leibel RL (1997). Fine structure of the murine leptin receptor gene: splice site suppression is required to form two alternatively spliced transcripts. Genomics 45, 264-270.
Davies SP, Helps NR, Cohen PT & Hardie DG (1995). 5'-AMP inhibits dephosphorylation, as well
as promoting phosphorylation, of the AMP-activated protein kinase. Studies using bacterially expressed human protein phosphatase-2C alpha and native bovine protein phosphatase-2AC. FEBS Lett 377, 421-425.
Deldicque L, Atherton P, Patel R, Theisen D, Nielens H, Rennie MJ & Francaux M (2008a).
Decrease in Akt/PKB signalling in human skeletal muscle by resistance exercise. Eur J Appl Physiol 104, 57-65.
Deldicque L, Atherton P, Patel R, Theisen D, Nielens H, Rennie MJ & Francaux M (2008b).
Effects of resistance exercise with and without creatine supplementation on gene expression and cell signaling in human skeletal muscle. J Appl Physiol 104, 371-378.
Deldicque L, De Bock K, Maris M, Ramaekers M, Nielens H, Francaux M & Hespel P Increased
p70s6k phosphorylation during intake of a protein-carbohydrate drink following resistance exercise in the fasted state. Eur J Appl Physiol 108, 791-800.
Dube N & Tremblay ML (2005). Involvement of the small protein tyrosine phosphatases TC-PTP
and PTP1B in signal transduction and diseases: from diabetes, obesity to cell cycle, and cancer. Biochim Biophys Acta 1754, 108-117.
Dulloo AG, Stock MJ, Solinas G, Boss O, Montani JP & Seydoux J (2002). Leptin directly
stimulates thermogenesis in skeletal muscle. FEBS Lett 515, 109-113. Dunn SL, Bjornholm M, Bates SH, Chen Z, Seifert M & Myers MG, Jr. (2005). Feedback
inhibition of leptin receptor/Jak2 signaling via Tyr1138 of the leptin receptor and suppressor of cytokine signaling 3. Mol Endocrinol 19, 925-938.
Dzamko N, Schertzer JD, Ryall JG, Steel R, Macaulay SL, Wee S, Chen ZP, Michell BJ, Oakhill JS,
Watt MJ, Jorgensen SB, Lynch GS, Kemp BE & Steinberg GR (2008). AMPK-independent pathways regulate skeletal muscle fatty acid oxidation. J Physiol 586, 5819-5831.
Eguchi M, Gillis LC, Liu Y, Lyakhovsky N, Du M, McDermott JC & Sweeney G (2007). Regulation
of SOCS-3 expression by leptin and its co-localization with insulin receptor in rat skeletal muscle cells. Mol Cell Endocrinol 267, 38-45.
Elchebly M, Payette P, Michaliszyn E, Cromlish W, Collins S, Loy AL, Normandin D, Cheng A,
Himms-Hagen J, Chan CC, Ramachandran C, Gresser MJ, Tremblay ML & Kennedy BP (1999). Increased insulin sensitivity and obesity resistance in mice lacking the protein tyrosine phosphatase-1B gene. Science 283, 1544-1548.
Elmquist JK, Elias CF & Saper CB (1999). From lesions to leptin: hypothalamic control of food
intake and body weight. Neuron 22, 221-232. Emanuelli B, Peraldi P, Filloux C, Chavey C, Freidinger K, Hilton DJ, Hotamisligil GS & Van
Obberghen E (2001). SOCS-3 inhibits insulin signaling and is up-regulated in response to tumor necrosis factor-alpha in the adipose tissue of obese mice. J Biol Chem 276, 47944-47949.

Bibliografía
121
Esbjornsson-Liljedahl M, Bodin K & Jansson E (2002). Smaller muscle ATP reduction in women
than in men by repeated bouts of sprint exercise. J Appl Physiol 93, 1075-1083. Eyckerman S, Broekaert D, Verhee A, Vandekerckhove J & Tavernier J (2000). Identification of
the Y985 and Y1077 motifs as SOCS3 recruitment sites in the murine leptin receptor. FEBS Lett 486, 33-37.
Flier JS & Maratos-Flier E (1998). Obesity and the hypothalamus: novel peptides for new
pathways. Cell 92, 437-440. Friedman JM & Halaas JL (1998). Leptin and the regulation of body weight in mammals. Nature
395, 763-770. Frosig C, Rose AJ, Treebak JT, Kiens B, Richter EA & Wojtaszewski JF (2007a). Effects of
endurance exercise training on insulin signalling in human skeletal muscle - Interactions at the level of PI3-K, Akt and AS160. Diabetes.
Frosig C, Sajan MP, Maarbjerg SJ, Brandt N, Roepstorff C, Wojtaszewski JF, Kiens B, Farese RV &
Richter EA (2007b). Acute Exercise improves PIP3 Responsiveness of aPKC and interacts with Insulin Signalling to Peptide Elongation in Human Skeletal Muscle. J Physiol.
Fruhbeck G (2001). A heliocentric view of leptin. Proc Nutr Soc 60, 301-318. Fruhbeck G (2002). Peripheral actions of leptin and its involvement in disease. Nutr Rev 60,
S47-55; discussion S68-84, 85-47. Fruhbeck G (2006). Intracellular signalling pathways activated by leptin. Biochem J 393, 7-20. Fruhbeck G, Jebb SA & Prentice AM (1998). Leptin: physiology and pathophysiology. Clin
Physiol 18, 399-419. Fujii N, Hayashi T, Hirshman MF, Smith JT, Habinowski SA, Kaijser L, Mu J, Ljungqvist O,
Birnbaum MJ, Witters LA, Thorell A & Goodyear LJ (2000). Exercise induces isoform-specific increase in 5'AMP-activated protein kinase activity in human skeletal muscle. Biochem Biophys Res Commun 273, 1150-1155.
Gallagher D, Kuznia P, Heshka S, Albu J, Heymsfield SB, Goodpaster B, Visser M & Harris TB
(2005). Adipose tissue in muscle: a novel depot similar in size to visceral adipose tissue. Am J Clin Nutr 81, 903-910.
Ghilardi N & Skoda RC (1997). The leptin receptor activates janus kinase 2 and signals for
proliferation in a factor-dependent cell line. Mol Endocrinol 11, 393-399. Ghilardi N, Ziegler S, Wiestner A, Stoffel R, Heim MH & Skoda RC (1996). Defective STAT
signaling by the leptin receptor in diabetic mice. Proc Natl Acad Sci U S A 93, 6231-6235.
Gibala MJ, McGee SL, Garnham AP, Howlett KF, Snow RJ & Hargreaves M (2009). Brief intense
interval exercise activates AMPK and p38 MAPK signaling and increases the expression of PGC-1alpha in human skeletal muscle. J Appl Physiol 106, 929-934.
Bibliografía
122
Gomez-Ambrosi J, Salvador J, Silva C, Pastor C, Rotellar F, Gil MJ, Cienfuegos JA & Fruhbeck G
(2006). Increased cardiovascular risk markers in obesity are associated with body adiposity: role of leptin. Thromb Haemost 95, 991-996.
Goodyear LJ, Chang PY, Sherwood DJ, Dufresne SD & Moller DE (1996). Effects of exercise and
insulin on mitogen-activated protein kinase signaling pathways in rat skeletal muscle. Am J Physiol 271, E403-408.
Guerra B, Fuentes T, Delgado-Guerra S, Guadalupe-Grau A, Olmedillas H, Santana A, Ponce-
Gonzalez JG, Dorado C & Calbet JA (2008). Gender dimorphism in skeletal muscle leptin receptors, serum leptin and insulin sensitivity. PLoS One 3, e3466.
Guerra B, Guadalupe-Grau A, Fuentes T, Ponce-Gonzalez JG, Morales-Alamo D, Olmedillas H,
Guillen-Salgado J, Santana A & Calbet JA (2010). SIRT1, AMP-activated protein kinase phosphorylation and downstream kinases in response to a single bout of sprint exercise: influence of glucose ingestion. Eur J Appl Physiol.
Guerra B, Santana A, Fuentes T, Delgado-Guerra S, Cabrera-Socorro A, Dorado C & Lopez
Calbet JA (2007). Leptin receptors in human skeletal muscle. J Appl Physiol. Gutierrez-Fisac JL, Lopez E, Banegas JR, Graciani A & Rodriguez-Artalejo F (2004). Prevalence of
overweight and obesity in elderly people in Spain. Obes Res 12, 710-715. Gutierrez-Fisac JL, Regidor E, Banegas JR & Rodriguez Artalejo F (2005). [Prevalence of obesity
in the Spanish adult population: 14 years of continuous increase]. Med Clin (Barc) 124, 196-197.
Hakansson ML & Meister B (1998). Transcription factor STAT3 in leptin target neurons of the
rat hypothalamus. Neuroendocrinology 68, 420-427. Halaas JL, Gajiwala KS, Maffei M, Cohen SL, Chait BT, Rabinowitz D, Lallone RL, Burley SK &
Friedman JM (1995). Weight-reducing effects of the plasma protein encoded by the obese gene. Science 269, 543-546.
Harber MP, Crane JD, Douglass MD, Weindel KD, Trappe TA, Trappe SW & Fink WF (2008).
Resistance exercise reduces muscular substrates in women. Int J Sports Med 29, 719-725.
Harvey J & Ashford ML (2003). Leptin in the CNS: much more than a satiety signal.
Neuropharmacology 44, 845-854. Hawley SA, Boudeau J, Reid JL, Mustard KJ, Udd L, Makela TP, Alessi DR & Hardie DG (2003).
Complexes between the LKB1 tumor suppressor, STRAD alpha/beta and MO25 alpha/beta are upstream kinases in the AMP-activated protein kinase cascade. J Biol 2, 28.
He Y, Chen H, Quon MJ & Reitman M (1995). The mouse obese gene. Genomic organization,
promoter activity, and activation by CCAAT/enhancer-binding protein alpha. J Biol Chem 270, 28887-28891.

Bibliografía
123
Hegyi K, Fulop K, Kovacs K, Toth S & Falus A (2004). Leptin-induced signal transduction pathways. Cell Biol Int 28, 159-169.
Henderson GC, Fattor JA, Horning MA, Faghihnia N, Johnson ML, Mau TL, Luke-Zeitoun M &
Brooks GA (2007). Lipolysis and fatty acid metabolism in men and women during the postexercise recovery period. J Physiol 584, 963-981.
Hikita M, Bujo H, Hirayama S, Takahashi K, Morisaki N & Saito Y (2000). Differential regulation
of leptin receptor expression by insulin and leptin in neuroblastoma cells. Biochem Biophys Res Commun 271, 703-709.
Hileman SM, Pierroz DD, Masuzaki H, Bjorbaek C, El-Haschimi K, Banks WA & Flier JS (2002).
Characterizaton of short isoforms of the leptin receptor in rat cerebral microvessels and of brain uptake of leptin in mouse models of obesity. Endocrinology 143, 775-783.
Hong JL, Ho CY, Kwong K & Lee LY (1998). Activation of pulmonary C fibres by adenosine in
anaesthetized rats: role of adenosine A1 receptors. J Physiol 508 ( Pt 1), 109-118. Houmard JA, Cox JH, MacLean PS & Barakat HA (2000). Effect of short-term exercise training
on leptin and insulin action. Metabolism 49, 858-861. Hu FB, Willett WC, Li T, Stampfer MJ, Colditz GA & Manson JE (2004). Adiposity as compared
with physical activity in predicting mortality among women. N Engl J Med 351, 2694-2703.
Ihle JN & Kerr IM (1995). Jaks and Stats in signaling by the cytokine receptor superfamily.
Trends Genet 11, 69-74. Isidori AM, Caprio M, Strollo F, Moretti C, Frajese G, Isidori A & Fabbri A (1999). Leptin and
androgens in male obesity: evidence for leptin contribution to reduced androgen levels. J Clin Endocrinol Metab 84, 3673-3680.
Isse N, Ogawa Y, Tamura N, Masuzaki H, Mori K, Okazaki T, Satoh N, Shigemoto M, Yoshimasa
Y, Nishi S & et al. (1995). Structural organization and chromosomal assignment of the human obese gene. J Biol Chem 270, 27728-27733.
Jaworowski A, Porter MM, Holmback AM, Downham D & Lexell J (2002). Enzyme activities in
the tibialis anterior muscle of young moderately active men and women: relationship with body composition, muscle cross-sectional area and fibre type composition. Acta Physiol Scand 176, 215-225.
Jorgensen SB, Viollet B, Andreelli F, Frosig C, Birk JB, Schjerling P, Vaulont S, Richter EA &
Wojtaszewski JF (2004). Knockout of the alpha2 but not alpha1 5'-AMP-activated protein kinase isoform abolishes 5-aminoimidazole-4-carboxamide-1-beta-4-ribofuranosidebut not contraction-induced glucose uptake in skeletal muscle. J Biol Chem 279, 1070-1079.
Judd LM, Bredin K, Kalantzis A, Jenkins BJ, Ernst M & Giraud AS (2006). STAT3 activation
regulates growth, inflammation, and vascularization in a mouse model of gastric tumorigenesis. Gastroenterology 131, 1073-1085.
Bibliografía
124
Kahn BB, Alquier T, Carling D & Hardie DG (2005). AMP-activated protein kinase: ancient energy gauge provides clues to modern understanding of metabolism. Cell Metab 1, 15-25.
Kamikubo Y, Dellas C, Loskutoff DJ, Quigley JP & Ruggeri ZM (2008). Contribution of leptin
receptor N-linked glycans to leptin binding. Biochem J 410, 595-604. Kellerer M, Koch M, Metzinger E, Mushack J, Capp E & Haring HU (1997). Leptin activates PI-3
kinase in C2C12 myotubes via janus kinase-2 (JAK-2) and insulin receptor substrate-2 (IRS-2) dependent pathways. Diabetologia 40, 1358-1362.
Kim J, Heshka S, Gallagher D, Kotler DP, Mayer L, Albu J, Shen W, Freda PU & Heymsfield SB
(2004). Intermuscular adipose tissue-free skeletal muscle mass: estimation by dual-energy X-ray absorptiometry in adults. J Appl Physiol 97, 655-660.
Kim YB, Uotani S, Pierroz DD, Flier JS & Kahn BB (2000). In vivo administration of leptin
activates signal transduction directly in insulin-sensitive tissues: overlapping but distinct pathways from insulin. Endocrinology 141, 2328-2339.
Kimura M, Tateishi N, Shiota T, Yoshie F, Yamauchi H, Suzuki M & Shibasaki T (2004). Long-
term exercise down-regulates leptin receptor mRNA in the arcuate nucleus. Neuroreport 15, 713-716.
Kirwan JP, del Aguila LF, Hernandez JM, Williamson DL, O'Gorman DJ, Lewis R & Krishnan RK
(2000). Regular exercise enhances insulin activation of IRS-1-associated PI3-kinase in human skeletal muscle. J Appl Physiol 88, 797-803.
Kishi K, Yuasa T, Minami A, Yamada M, Hagi A, Hayashi H, Kemp BE, Witters LA & Ebina Y
(2000). AMP-Activated protein kinase is activated by the stimulations of G(q)-coupled receptors. Biochem Biophys Res Commun 276, 16-22.
Klaman LD, Boss O, Peroni OD, Kim JK, Martino JL, Zabolotny JM, Moghal N, Lubkin M, Kim YB,
Sharpe AH, Stricker-Krongrad A, Shulman GI, Neel BG & Kahn BB (2000). Increased energy expenditure, decreased adiposity, and tissue-specific insulin sensitivity in protein-tyrosine phosphatase 1B-deficient mice. Mol Cell Biol 20, 5479-5489.
Kline AD, Becker GW, Churgay LM, Landen BE, Martin DK, Muth WL, Rathnachalam R,
Richardson JM, Schoner B, Ulmer M & Hale JE (1997). Leptin is a four-helix bundle: secondary structure by NMR. FEBS Lett 407, 239-242.
Kloek C, Haq AK, Dunn SL, Lavery HJ, Banks AS & Myers MG, Jr. (2002). Regulation of Jak
kinases by intracellular leptin receptor sequences. J Biol Chem 277, 41547-41555. Kraemer RR, Chu H & Castracane VD (2002). Leptin and exercise. Exp Biol Med (Maywood) 227,
701-708. Kusari J, Kenner KA, Suh KI, Hill DE & Henry RR (1994). Skeletal muscle protein tyrosine
phosphatase activity and tyrosine phosphatase 1B protein content are associated with insulin action and resistance. J Clin Invest 93, 1156-1162.
Laemmli UK (1970). Cleavage of structural proteins during the assembly of the head of
bacteriophage T4. Nature 227, 680-685.
Bibliografía
125
Lammert A, Kiess W, Bottner A, Glasow A & Kratzsch J (2001). Soluble leptin receptor
represents the main leptin binding activity in human blood. Biochem Biophys Res Commun 283, 982-988.
Larance M, Ramm G, Stockli J, van Dam EM, Winata S, Wasinger V, Simpson F, Graham M,
Junutula JR, Guilhaus M & James DE (2005). Characterization of the role of the Rab GTPase-activating protein AS160 in insulin-regulated GLUT4 trafficking. J Biol Chem 280, 37803-37813.
Lee GH, Proenca R, Montez JM, Carroll KM, Darvishzadeh JG, Lee JI & Friedman JM (1996).
Abnormal splicing of the leptin receptor in diabetic mice. Nature 379, 632-635. Li C & Friedman JM (1999). Leptin receptor activation of SH2 domain containing protein
tyrosine phosphatase 2 modulates Ob receptor signal transduction. Proc Natl Acad Sci U S A 96, 9677-9682.
Liu YL, Emilsson V & Cawthorne MA (1997). Leptin inhibits glycogen synthesis in the isolated
soleus muscle of obese (ob/ob) mice. FEBS Lett 411, 351-355. Liu ZJ, Bian J, Liu J & Endoh A (2007). Obesity reduced the gene expressions of leptin receptors
in hypothalamus and liver. Horm Metab Res 39, 489-494. Lobstein T, Baur L & Uauy R (2004). Obesity in children and young people: a crisis in public
health. Obes Rev 5 Suppl 1, 4-104. Lundby C, Sander M, van Hall G, Saltin B & Calbet JA (2006). Maximal exercise and muscle
oxygen extraction in acclimatizing lowlanders and high altitude natives. J Physiol 573, 535-547.
Luukkaa V, Pesonen U, Huhtaniemi I, Lehtonen A, Tilvis R, Tuomilehto J, Koulu M & Huupponen
R (1998). Inverse correlation between serum testosterone and leptin in men. J Clin Endocrinol Metab 83, 3243-3246.
Machinal F, Dieudonne MN, Leneveu MC, Pecquery R & Giudicelli Y (1999). In vivo and in vitro
ob gene expression and leptin secretion in rat adipocytes: evidence for a regional specific regulation by sex steroid hormones. Endocrinology 140, 1567-1574.
Madej T, Boguski MS & Bryant SH (1995). Threading analysis suggests that the obese gene
product may be a helical cytokine. FEBS Lett 373, 13-18. Mahlapuu M, Johansson C, Lindgren K, Hjalm G, Barnes BR, Krook A, Zierath JR, Andersson L &
Marklund S (2004). Expression profiling of the gamma-subunit isoforms of AMP-activated protein kinase suggests a major role for gamma3 in white skeletal muscle. Am J Physiol Endocrinol Metab 286, E194-200.
Mannucci E, Ognibene A, Becorpi A, Cremasco F, Pellegrini S, Ottanelli S, Rizzello SM, Massi G,
Messeri G & Rotella CM (1998). Relationship between leptin and oestrogens in healthy women. Eur J Endocrinol 139, 198-201.
Margetic S, Gazzola C, Pegg GG & Hill RA (2002). Leptin: a review of its peripheral actions and
interactions. Int J Obes Relat Metab Disord 26, 1407-1433.

Bibliografía
126
Marin R, Guerra B & Alonso R (2001). The amount of estrogen receptor alpha increases after
heat shock in a cholinergic cell line from the basal forebrain. Neuroscience 107, 447-454.
Maroni P, Bendinelli P & Piccoletti R (2003). Early intracellular events induced by in vivo leptin
treatment in mouse skeletal muscle. Mol Cell Endocrinol 201, 109-121. Maroni P, Bendinelli P & Piccoletti R (2005). Intracellular signal transduction pathways induced
by leptin in C2C12 cells. Cell Biol Int 29, 542-550. Martin RL, Perez E, He YJ, Dawson R, Jr. & Millard WJ (2000). Leptin resistance is associated
with hypothalamic leptin receptor mRNA and protein downregulation. Metabolism 49, 1479-1484.
Masuzaki H, Ogawa Y, Sagawa N, Hosoda K, Matsumoto T, Mise H, Nishimura H, Yoshimasa Y,
Tanaka I, Mori T & Nakao K (1997). Nonadipose tissue production of leptin: leptin as a novel placenta-derived hormone in humans. Nat Med 3, 1029-1033.
Matthews DR, Hosker JP, Rudenski AS, Naylor BA, Treacher DF & Turner RC (1985).
Homeostasis model assessment: insulin resistance and beta-cell function from fasting plasma glucose and insulin concentrations in man. Diabetologia 28, 412-419.
Mehebik N, Jaubert AM, Sabourault D, Giudicelli Y & Ribiere C (2005). Leptin-induced nitric
oxide production in white adipocytes is mediated through PKA and MAP kinase activation. Am J Physiol Cell Physiol 289, C379-387.
Merino B, Diez-Fernandez C, Ruiz-Gayo M & Somoza B (2006). Choroid plexus epithelial cells
co-express the long and short form of the leptin receptor. Neurosci Lett 393, 269-272. Meyer TS & Lamberts BL (1965). Use of coomassie brilliant blue R250 for the electrophoresis of
microgram quantities of parotid saliva proteins on acrylamide-gel strips. Biochim Biophys Acta 107, 144-145.
Minokoshi Y, Kim YB, Peroni OD, Fryer LG, Muller C, Carling D & Kahn BB (2002). Leptin
stimulates fatty-acid oxidation by activating AMP-activated protein kinase. Nature 415, 339-343.
Montague CT, Farooqi IS, Whitehead JP, Soos MA, Rau H, Wareham NJ, Sewter CP, Digby JE,
Mohammed SN, Hurst JA, Cheetham CH, Earley AR, Barnett AH, Prins JB & O'Rahilly S (1997). Congenital leptin deficiency is associated with severe early-onset obesity in humans. Nature 387, 903-908.
Morash B, Li A, Murphy PR, Wilkinson M & Ur E (1999). Leptin gene expression in the brain and
pituitary gland. Endocrinology 140, 5995-5998. Mueller WM, Gregoire FM, Stanhope KL, Mobbs CV, Mizuno TM, Warden CH, Stern JS & Havel
PJ (1998). Evidence that glucose metabolism regulates leptin secretion from cultured rat adipocytes. Endocrinology 139, 551-558.
Munzberg H & Myers MG, Jr. (2005). Molecular and anatomical determinants of central leptin
resistance. Nat Neurosci 8, 566-570.
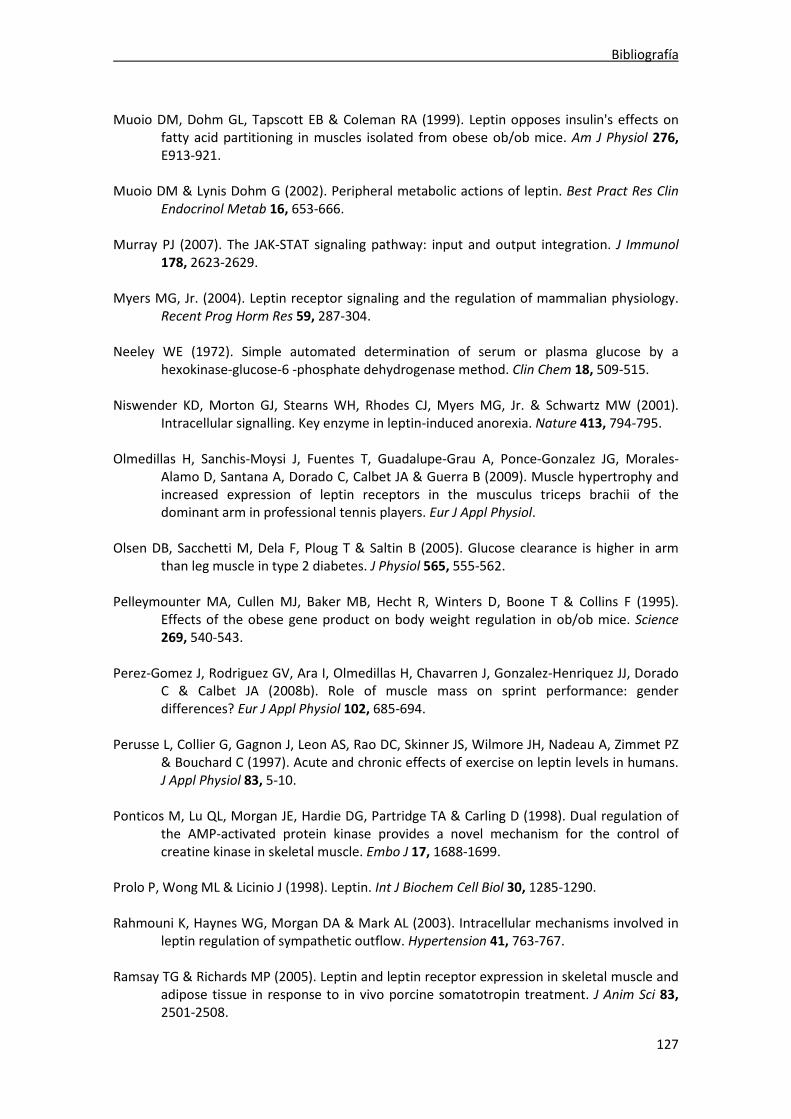
Bibliografía
127
Muoio DM, Dohm GL, Tapscott EB & Coleman RA (1999). Leptin opposes insulin's effects on
fatty acid partitioning in muscles isolated from obese ob/ob mice. Am J Physiol 276, E913-921.
Muoio DM & Lynis Dohm G (2002). Peripheral metabolic actions of leptin. Best Pract Res Clin
Endocrinol Metab 16, 653-666. Murray PJ (2007). The JAK-STAT signaling pathway: input and output integration. J Immunol
178, 2623-2629. Myers MG, Jr. (2004). Leptin receptor signaling and the regulation of mammalian physiology.
Recent Prog Horm Res 59, 287-304. Neeley WE (1972). Simple automated determination of serum or plasma glucose by a
hexokinase-glucose-6 -phosphate dehydrogenase method. Clin Chem 18, 509-515. Niswender KD, Morton GJ, Stearns WH, Rhodes CJ, Myers MG, Jr. & Schwartz MW (2001).
Intracellular signalling. Key enzyme in leptin-induced anorexia. Nature 413, 794-795. Olmedillas H, Sanchis-Moysi J, Fuentes T, Guadalupe-Grau A, Ponce-Gonzalez JG, Morales-
Alamo D, Santana A, Dorado C, Calbet JA & Guerra B (2009). Muscle hypertrophy and increased expression of leptin receptors in the musculus triceps brachii of the dominant arm in professional tennis players. Eur J Appl Physiol.
Olsen DB, Sacchetti M, Dela F, Ploug T & Saltin B (2005). Glucose clearance is higher in arm
than leg muscle in type 2 diabetes. J Physiol 565, 555-562. Pelleymounter MA, Cullen MJ, Baker MB, Hecht R, Winters D, Boone T & Collins F (1995).
Effects of the obese gene product on body weight regulation in ob/ob mice. Science 269, 540-543.
Perez-Gomez J, Rodriguez GV, Ara I, Olmedillas H, Chavarren J, Gonzalez-Henriquez JJ, Dorado
C & Calbet JA (2008b). Role of muscle mass on sprint performance: gender differences? Eur J Appl Physiol 102, 685-694.
Perusse L, Collier G, Gagnon J, Leon AS, Rao DC, Skinner JS, Wilmore JH, Nadeau A, Zimmet PZ
& Bouchard C (1997). Acute and chronic effects of exercise on leptin levels in humans. J Appl Physiol 83, 5-10.
Ponticos M, Lu QL, Morgan JE, Hardie DG, Partridge TA & Carling D (1998). Dual regulation of
the AMP-activated protein kinase provides a novel mechanism for the control of creatine kinase in skeletal muscle. Embo J 17, 1688-1699.
Prolo P, Wong ML & Licinio J (1998). Leptin. Int J Biochem Cell Biol 30, 1285-1290. Rahmouni K, Haynes WG, Morgan DA & Mark AL (2003). Intracellular mechanisms involved in
leptin regulation of sympathetic outflow. Hypertension 41, 763-767. Ramsay TG & Richards MP (2005). Leptin and leptin receptor expression in skeletal muscle and
adipose tissue in response to in vivo porcine somatotropin treatment. J Anim Sci 83, 2501-2508.
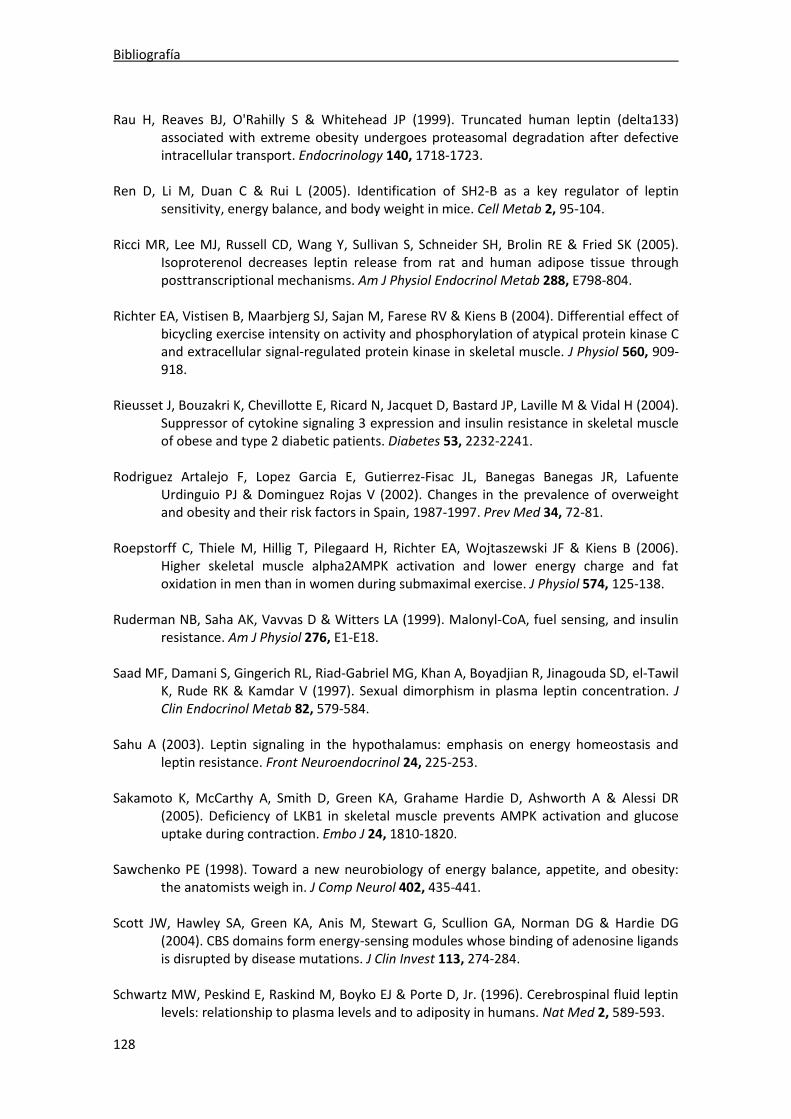
Bibliografía
128
Rau H, Reaves BJ, O'Rahilly S & Whitehead JP (1999). Truncated human leptin (delta133)
associated with extreme obesity undergoes proteasomal degradation after defective intracellular transport. Endocrinology 140, 1718-1723.
Ren D, Li M, Duan C & Rui L (2005). Identification of SH2-B as a key regulator of leptin
sensitivity, energy balance, and body weight in mice. Cell Metab 2, 95-104. Ricci MR, Lee MJ, Russell CD, Wang Y, Sullivan S, Schneider SH, Brolin RE & Fried SK (2005).
Isoproterenol decreases leptin release from rat and human adipose tissue through posttranscriptional mechanisms. Am J Physiol Endocrinol Metab 288, E798-804.
Richter EA, Vistisen B, Maarbjerg SJ, Sajan M, Farese RV & Kiens B (2004). Differential effect of
bicycling exercise intensity on activity and phosphorylation of atypical protein kinase C and extracellular signal-regulated protein kinase in skeletal muscle. J Physiol 560, 909-918.
Rieusset J, Bouzakri K, Chevillotte E, Ricard N, Jacquet D, Bastard JP, Laville M & Vidal H (2004).
Suppressor of cytokine signaling 3 expression and insulin resistance in skeletal muscle of obese and type 2 diabetic patients. Diabetes 53, 2232-2241.
Rodriguez Artalejo F, Lopez Garcia E, Gutierrez-Fisac JL, Banegas Banegas JR, Lafuente
Urdinguio PJ & Dominguez Rojas V (2002). Changes in the prevalence of overweight and obesity and their risk factors in Spain, 1987-1997. Prev Med 34, 72-81.
Roepstorff C, Thiele M, Hillig T, Pilegaard H, Richter EA, Wojtaszewski JF & Kiens B (2006).
Higher skeletal muscle alpha2AMPK activation and lower energy charge and fat oxidation in men than in women during submaximal exercise. J Physiol 574, 125-138.
Ruderman NB, Saha AK, Vavvas D & Witters LA (1999). Malonyl-CoA, fuel sensing, and insulin
resistance. Am J Physiol 276, E1-E18. Saad MF, Damani S, Gingerich RL, Riad-Gabriel MG, Khan A, Boyadjian R, Jinagouda SD, el-Tawil
K, Rude RK & Kamdar V (1997). Sexual dimorphism in plasma leptin concentration. J Clin Endocrinol Metab 82, 579-584.
Sahu A (2003). Leptin signaling in the hypothalamus: emphasis on energy homeostasis and
leptin resistance. Front Neuroendocrinol 24, 225-253. Sakamoto K, McCarthy A, Smith D, Green KA, Grahame Hardie D, Ashworth A & Alessi DR
(2005). Deficiency of LKB1 in skeletal muscle prevents AMPK activation and glucose uptake during contraction. Embo J 24, 1810-1820.
Sawchenko PE (1998). Toward a new neurobiology of energy balance, appetite, and obesity:
the anatomists weigh in. J Comp Neurol 402, 435-441. Scott JW, Hawley SA, Green KA, Anis M, Stewart G, Scullion GA, Norman DG & Hardie DG
(2004). CBS domains form energy-sensing modules whose binding of adenosine ligands is disrupted by disease mutations. J Clin Invest 113, 274-284.
Schwartz MW, Peskind E, Raskind M, Boyko EJ & Porte D, Jr. (1996). Cerebrospinal fluid leptin
levels: relationship to plasma levels and to adiposity in humans. Nat Med 2, 589-593.

Bibliografía
129
Seron K, Corset L, Vasseur F, Boutin P, Gomez-Ambrosi J, Salvador J, Fruhbeck G & Froguel P
(2006). Distinct impaired regulation of SOCS3 and long and short isoforms of the leptin receptor in visceral and subcutaneous fat of lean and obese women. Biochem Biophys Res Commun 348, 1232-1238.
Serra Majem L, Ribas Barba L, Aranceta Bartrina J, Perez Rodrigo C, Saavedra Santana P & Pena
Quintana L (2003). [Childhood and adolescent obesity in Spain. Results of the enKid study (1998-2000)]. Med Clin (Barc) 121, 725-732.
Shimizu H, Shimomura Y, Nakanishi Y, Futawatari T, Ohtani K, Sato N & Mori M (1997).
Estrogen increases in vivo leptin production in rats and human subjects. J Endocrinol 154, 285-292.
Sinha MK, Ohannesian JP, Heiman ML, Kriauciunas A, Stephens TW, Magosin S, Marco C & Caro
JF (1996). Nocturnal rise of leptin in lean, obese, and non-insulin-dependent diabetes mellitus subjects. J Clin Invest 97, 1344-1347.
Smith PK, Krohn RI, Hermanson GT, Mallia AK, Gartner FH, Provenzano MD, Fujimoto EK,
Goeke NM, Olson BJ & Klenk DC (1985). Measurement of protein using bicinchoninic acid. Anal Biochem 150, 76-85.
Solberg R, Aas V, Thoresen GH, Kase ET, Drevon CA, Rustan AC & Reseland JE (2005). Leptin
expression in human primary skeletal muscle cells is reduced during differentiation. J Cell Biochem 96, 89-96.
Sriwijitkamol A, Coletta DK, Wajcberg E, Balbontin GB, Reyna SM, Barrientes J, Eagan PA,
Jenkinson CP, Cersosimo E, DeFronzo RA, Sakamoto K & Musi N (2007). Effect of acute exercise on AMPK signaling in skeletal muscle of subjects with type 2 diabetes: a time-course and dose-response study. Diabetes 56, 836-848.
Stein K, Vasquez-Garibay E, Kratzsch J, Romero-Velarde E & Jahreis G (2006). Influence of
nutritional recovery on the leptin axis in severely malnourished children. J Clin Endocrinol Metab 91, 1021-1026.
Steinberg GR & Dyck DJ (2000). Development of leptin resistance in rat soleus muscle in
response to high-fat diets. Am J Physiol Endocrinol Metab 279, E1374-1382. Steinberg GR, Dyck DJ, Calles-Escandon J, Tandon NN, Luiken JJ, Glatz JF & Bonen A (2002a).
Chronic leptin administration decreases fatty acid uptake and fatty acid transporters in rat skeletal muscle. J Biol Chem 277, 8854-8860.
Steinberg GR & Jorgensen SB (2007). The AMP-Activated Protein Kinase: Role in Regulation of
Skeletal Muscle Metabolism and Insulin Sensitivity. Mini Rev Med Chem 7, 519-526. Steinberg GR, Macaulay SL, Febbraio MA & Kemp BE (2006a). AMP-activated protein kinase--
the fat controller of the energy railroad. Can J Physiol Pharmacol 84, 655-665. Steinberg GR, McAinch AJ, Chen MB, O'Brien PE, Dixon JB, Cameron-Smith D & Kemp BE
(2006b). The suppressor of cytokine signaling 3 inhibits leptin activation of AMP-kinase in cultured skeletal muscle of obese humans. J Clin Endocrinol Metab 91, 3592-3597.

Bibliografía
130
Steinberg GR, Parolin ML, Heigenhauser GJ & Dyck DJ (2002b). Leptin increases FA oxidation in lean but not obese human skeletal muscle: evidence of peripheral leptin resistance. Am J Physiol Endocrinol Metab 283, E187-192.
Steinberg GR, Smith AC, Van Denderen BJ, Chen Z, Murthy S, Campbell DJ, Heigenhauser GJ,
Dyck DJ & Kemp BE (2004a). AMP-activated protein kinase is not down-regulated in human skeletal muscle of obese females. J Clin Endocrinol Metab 89, 4575-4580.
Steinberg GR, Smith AC, Wormald S, Malenfant P, Collier C & Dyck DJ (2004b). Endurance
training partially reverses dietary-induced leptin resistance in rodent skeletal muscle. Am J Physiol Endocrinol Metab 286, E57-63.
Stephens TJ, Chen ZP, Canny BJ, Michell BJ, Kemp BE & McConell GK (2002). Progressive
increase in human skeletal muscle AMPKalpha2 activity and ACC phosphorylation during exercise. Am J Physiol Endocrinol Metab 282, E688-694.
Stepkowski SM, Chen W, Ross JA, Nagy ZS & Kirken RA (2008). STAT3: an important regulator
of multiple cytokine functions. Transplantation 85, 1372-1377. Strobel A, Issad T, Camoin L, Ozata M & Strosberg AD (1998). A leptin missense mutation
associated with hypogonadism and morbid obesity. Nat Genet 18, 213-215. Sweeney G (2002). Leptin signalling. Cell Signal 14, 655-663. Tanaka T, Hidaka S, Masuzaki H, Yasue S, Minokoshi Y, Ebihara K, Chusho H, Ogawa Y, Toyoda
T, Sato K, Miyanaga F, Fujimoto M, Tomita T, Kusakabe T, Kobayashi N, Tanioka H, Hayashi T, Hosoda K, Yoshimatsu H, Sakata T & Nakao K (2005). Skeletal muscle AMP-activated protein kinase phosphorylation parallels metabolic phenotype in leptin transgenic mice under dietary modification. Diabetes 54, 2365-2374.
Tarnopolsky LJ, MacDougall JD, Atkinson SA, Tarnopolsky MA & Sutton JR (1990). Gender
differences in substrate for endurance exercise. J Appl Physiol 68, 302-308. Tartaglia LA (1997). The leptin receptor. J Biol Chem 272, 6093-6096. Tartaglia LA, Dembski M, Weng X, Deng N, Culpepper J, Devos R, Richards GJ, Campfield LA,
Clark FT, Deeds J, Muir C, Sanker S, Moriarty A, Moore KJ, Smutko JS, Mays GG, Wool EA, Monroe CA & Tepper RI (1995). Identification and expression cloning of a leptin receptor, OB-R. Cell 83, 1263-1271.
Tena-Sempere M, Manna PR, Zhang FP, Pinilla L, Gonzalez LC, Dieguez C, Huhtaniemi I &
Aguilar E (2001). Molecular mechanisms of leptin action in adult rat testis: potential targets for leptin-induced inhibition of steroidogenesis and pattern of leptin receptor messenger ribonucleic acid expression. J Endocrinol 170, 413-423.
Thong FS, Hudson R, Ross R, Janssen I & Graham TE (2000). Plasma leptin in moderately obese
men: independent effects of weight loss and aerobic exercise. Am J Physiol Endocrinol Metab 279, E307-313.
Tilg H & Moschen AR (2008). Inflammatory mechanisms in the regulation of insulin resistance.
Mol Med 14, 222-231.
Bibliografía
131
Treebak JT, Birk JB, Rose AJ, Kiens B, Richter EA & Wojtaszewski JF (2007). AS160 phosphorylation is associated with activation of alpha2beta2gamma1- but not alpha2beta2gamma3-AMPK trimeric complex in skeletal muscle during exercise in humans. Am J Physiol Endocrinol Metab 292, E715-722.
Trenerry MK, Carey KA, Ward AC & Cameron-Smith D (2007). STAT3 signaling is activated in
human skeletal muscle following acute resistance exercise. J Appl Physiol 102, 1483-1489.
Trenerry MK, Carey KA, Ward AC, Farnfield MM & Cameron-Smith D (2008). Exercise-induced
activation of STAT3 signaling is increased with age. Rejuvenation Res 11, 717-724. Uotani S, Abe T & Yamaguchi Y (2006). Leptin activates AMP-activated protein kinase in
hepatic cells via a JAK2-dependent pathway. Biochem Biophys Res Commun 351, 171-175.
Vaisse C, Halaas JL, Horvath CM, Darnell JE, Jr., Stoffel M & Friedman JM (1996). Leptin
activation of Stat3 in the hypothalamus of wild-type and ob/ob mice but not db/db mice. Nat Genet 14, 95-97.
Vestergaard ET, Hansen TK, Nielsen S, Moller N, Christiansen JS & Jorgensen JO (2005). Effects
of GH replacement therapy in adults on serum levels of leptin and ghrelin: the role of lipolysis. Eur J Endocrinol 153, 545-549.
Villeneuve PJ, Morrison HI, Craig CL & Schaubel DE (1998). Physical activity, physical fitness,
and risk of dying. Epidemiology 9, 626-631. Viollet B, Andreelli F, Jorgensen SB, Perrin C, Geloen A, Flamez D, Mu J, Lenzner C, Baud O,
Bennoun M, Gomas E, Nicolas G, Wojtaszewski JF, Kahn A, Carling D, Schuit FC, Birnbaum MJ, Richter EA, Burcelin R & Vaulont S (2003). The AMP-activated protein kinase alpha2 catalytic subunit controls whole-body insulin sensitivity. J Clin Invest 111, 91-98.
Wabitsch M, Blum WF, Muche R, Braun M, Hube F, Rascher W, Heinze E, Teller W & Hauner H
(1997). Contribution of androgens to the gender difference in leptin production in obese children and adolescents. J Clin Invest 100, 808-813.
Wauters M, Considine RV, Chagnon M, Mertens I, Rankinen T, Bouchard C & Van Gaal LF
(2002). Leptin levels, leptin receptor gene polymorphisms, and energy metabolism in women. Obes Res 10, 394-400.
White DW, Kuropatwinski KK, Devos R, Baumann H & Tartaglia LA (1997). Leptin receptor (OB-
R) signaling. Cytoplasmic domain mutational analysis and evidence for receptor homo-oligomerization. J Biol Chem 272, 4065-4071.
White DW & Tartaglia LA (1996). Leptin and OB-R: body weight regulation by a cytokine
receptor. Cytokine Growth Factor Rev 7, 303-309. Widegren U, Jiang XJ, Krook A, Chibalin AV, Bjornholm M, Tally M, Roth RA, Henriksson J,
Wallberg-henriksson H & Zierath JR (1998). Divergent effects of exercise on metabolic and mitogenic signaling pathways in human skeletal muscle. Faseb J 12, 1379-1389.

Bibliografía
132
Widegren U, Wretman C, Lionikas A, Hedin G & Henriksson J (2000). Influence of exercise intensity on ERK/MAP kinase signalling in human skeletal muscle. Pflugers Arch 441, 317-322.
Williamson D, Gallagher P, Harber M, Hollon C & Trappe S (2003). Mitogen-activated protein
kinase (MAPK) pathway activation: effects of age and acute exercise on human skeletal muscle. J Physiol 547, 977-987.
Wojtaszewski JF, Birk JB, Frosig C, Holten M, Pilegaard H & Dela F (2005). 5'AMP activated
protein kinase expression in human skeletal muscle: effects of strength training and type 2 diabetes. J Physiol 564, 563-573.
Wojtaszewski JF, Mourtzakis M, Hillig T, Saltin B & Pilegaard H (2002). Dissociation of AMPK
activity and ACCbeta phosphorylation in human muscle during prolonged exercise. Biochem Biophys Res Commun 298, 309-316.
Wojtaszewski JF, Nielsen P, Hansen BF, Richter EA & Kiens B (2000). Isoform-specific and
exercise intensity-dependent activation of 5'-AMP-activated protein kinase in human skeletal muscle. J Physiol 528 Pt 1, 221-226.
Wong SL, DePaoli AM, Lee JH & Mantzoros CS (2004). Leptin hormonal kinetics in the fed state:
effects of adiposity, age, and gender on endogenous leptin production and clearance rates. J Clin Endocrinol Metab 89, 2672-2677.
Worm D, Vinten J & Beck-Nielsen H (1999). The significance of phosphotyrosine phosphatase
(PTPase) 1B in insulin signalling. Diabetologia 42, 1146-1149. Yaspelkis BB, 3rd, Davis JR, Saberi M, Smith TL, Jazayeri R, Singh M, Fernandez V, Trevino B,
Chinookoswong N, Wang J, Shi ZQ & Levin N (2001). Leptin administration improves skeletal muscle insulin responsiveness in diet-induced insulin-resistant rats. Am J Physiol Endocrinol Metab 280, E130-142.
Yu M, Blomstrand E, Chibalin AV, Krook A & Zierath JR (2001). Marathon running increases
ERK1/2 and p38 MAP kinase signalling to downstream targets in human skeletal muscle. J Physiol 536, 273-282.
Zabolotny JM, Bence-Hanulec KK, Stricker-Krongrad A, Haj F, Wang Y, Minokoshi Y, Kim YB,
Elmquist JK, Tartaglia LA, Kahn BB & Neel BG (2002). PTP1B regulates leptin signal transduction in vivo. Dev Cell 2, 489-495.
Zabolotny JM, Kim YB, Welsh LA, Kershaw EE, Neel BG & Kahn BB (2008). Protein-tyrosine
phosphatase 1B expression is induced by inflammation in vivo. J Biol Chem 283, 14230-14241.
Zachow RJ, Weitsman SR & Magoffin DA (1999). Leptin impairs the synergistic stimulation by
transforming growth factor-beta of follicle-stimulating hormone-dependent aromatase activity and messenger ribonucleic acid expression in rat ovarian granulosa cells. Biol Reprod 61, 1104-1109.
Zhang F, Basinski MB, Beals JM, Briggs SL, Churgay LM, Clawson DK, DiMarchi RD, Furman TC,
Hale JE, Hsiung HM, Schoner BE, Smith DP, Zhang XY, Wery JP & Schevitz RW (1997). Crystal structure of the obese protein leptin-E100. Nature 387, 206-209.

Bibliografía
133
Zhang F, Chen Y, Heiman M & Dimarchi R (2005). Leptin: structure, function and biology. Vitam
Horm 71, 345-372. Zhang Y, Matheny M, Zolotukhin S, Tumer N & Scarpace PJ (2002). Regulation of adiponectin
and leptin gene expression in white and brown adipose tissues: influence of beta3-adrenergic agonists, retinoic acid, leptin and fasting. Biochim Biophys Acta 1584, 115-122.
Zhang Y, Proenca R, Maffei M, Barone M, Leopold L & Friedman JM (1994). Positional cloning
of the mouse obese gene and its human homologue. Nature 372, 425-432.

ANEXOS

Leptin receptors in human skeletal muscle
Borja Guerra,1 Alfredo Santana,2 Teresa Fuentes,1 Safira Delgado-Guerra,1
Alfredo Cabrera-Socorro,3 Cecilia Dorado,1 and Jose A. L. Calbet1
1Department of Physical Education, University of Las Palmas de Gran Canaria, Las Palmas de Gran Canaria,2Genetic Unit, Childhood Hospital Materno Infantil de Las Palmas, Las Palmas de Gran Canaria, and3Department of Anatomy, Faculty of Medicine, University of La Laguna, La Laguna, Canary Island, Spain
Submitted 20 November 2006; accepted in final form 10 January 2007
Guerra B, Santana A, Fuentes T, Delgado-Guerra S, Cabrera-Socorro A, Dorado C, Calbet JA. Leptin receptors in human skeletalmuscle. J Appl Physiol 102: 1786–1792, 2007. First published Janu-ary 18, 2007; doi:10.1152/japplphysiol.01313.2006.—Human skeletalmuscle expresses leptin receptor mRNA; however, it remains un-known whether leptin receptors (OB-R) are also expressed at theprotein level. Fourteen healthy men (age � 33.1 � 2.0 yr, height �175.9 � 1.7 cm, body mass � 81.2 � 3.8 kg, body fat � 22.5 �1.9%; means � SE) participated in this investigation. The expressionof OB-R protein was determined in skeletal muscle, subcutaneousadipose tissue, and hypothalamus using a polyclonal rabbit anti-human leptin receptor. Three bands with a molecular mass close to170, 128, and 98 kDa were identified by Western blot with theanti-OB-R antibody. All three bands were identified in skeletal muscle:the 98-kDa and 170-kDa bands were detected in hypothalamus, and the98-kDa and 128-kDa bands were detected in thigh subcutaneous adiposetissue. The 128-kDa isoform was not detected in four subjects,whereas in the rest its occurrence was fully explained by the presenceof intermuscular adipose tissue, as demonstrated using an anti-perili-pin A antibody. No relationship was observed between the basalconcentration of leptin in serum and the 170-kDa band density. Inconclusion, a long isoform of the leptin receptor with a molecularmass close to 170 kDa is expressed at the protein level in humanskeletal muscle. The amount of 170-kDa protein appears to beindependent of the basal concentration of leptin in serum.
obesity; adipose tissue; hypothalamus; perilipin
LEPTIN IS A 16-KDA HORMONE structurally related to cytokines (66)that plays a crucial role in the regulation of appetite and fatdeposition (20, 38). This hormone is primarily released bywhite adipose tissue and acts on brain and peripheral receptors(19, 24, 45) that belong to the class I type cytokine receptorfamily (61, 65). There are at least six isoforms of leptinreceptors (OB-Rs) generated by mRNA alternative splicingand/or proteolytic processing of the subsequent protein prod-ucts (18, 33, 61). All of these receptors contain identicalextracellular and transmembrane domains and differ in thelength of the intracellular amino acid sequence (18, 33, 61).The long form of the leptin receptor (OB-Rb) has an intracel-lular domain, highly conserved in several species, that iscritical for the effects of this hormone (18, 61, 65). Upon leptinbinding, the OB-Rb is activated, leading to stimulation of thejanus kinase/signal transducer and activator of transcriptionsignaling pathway, like the other class I cytokine receptors (9,12, 61). In the central nervous system, leptin/OB-Rb inter-action leads to the activation of janus kinase-2 by transphos-phorylation and subsequent phosphorylation of tyrosine res-
idues (Tyr985 and Tyr1138) in the cytoplasmic part ofOB-Rb (11, 27).
Expression of OB-R mRNA has also been found in nonneu-ronal tissues (32), such as bone, heart, liver, lung, adrenalglands, testes, spleen, small intestine, pancreatic islets, theplacenta, adipose tissue, and skeletal muscle (1, 10, 21, 36, 43,48). However, the presence of OB-R protein has not beenshown in some human tissues in which mRNA for OB-R hasbeen detected, such as skeletal muscle (17), cultures of primaryskeletal muscle cells (55), subcutaneous adipose tissue (51),and hypothalamus (15).
In addition to its locomotive function, skeletal muscle ac-counts for the majority of the basal metabolic rate and is alsothe primary tissue responsible for whole body glucose and fattyacid metabolism (57). Animal experiments have shown thatleptin has physiological effects in skeletal muscle (17, 23, 37);however, it remains unknown if human skeletal muscle isactually able to respond to circulating leptin (7). Plasma leptinconcentration is directly proportional to adipose tissue mass.Increasing fat mass results in higher levels of circulating leptin(19, 24), while reducing the body fat stores through regularexercise and/or dieting results in lower plasma leptin concen-trations (28, 46, 62). Human obesity is characterized by a highconcentration of leptin in plasma associated with leptin resis-tance (8, 60). Obesity also causes insulin resistance in humans(30, 44), which has been associated with raised plasma leptinconcentrations, independent of body fat mass (50, 56). Leptinresistance could be caused by a downregulation and/or desen-sitization of OB-Rs, among other mechanisms.
In this study, we planned to test two hypotheses: first, thatleptin receptors are expressed at the protein level in humanskeletal muscle; and second, that the amount of OB-R proteinexpression in skeletal muscles depends on the basal concen-tration of leptin. To test these hypotheses, we carried outWestern blot analysis in protein extracts obtained from humanmuscle biopsies and from a human hypothalamus. The hypo-thalamus protein extract was used as a control to verify that anyband identified as a potential OB-R in muscle is also present inthe hypothalamic protein extract, since the hypothalamus isrich in OB-R protein content (53). To test the second hypoth-esis, we determined whether plasma leptin concentration cor-relates with the protein expression of OB-R in skeletal muscle.
MATERIALS AND METHODS
Materials. The Complete protease inhibitor cocktail was obtainedfrom Roche Diagnostics (Mannheim, Germany). The polyclonal rab-
Address for reprint requests and other correspondence: B. Guerra, Departa-mento de Educacion Fısica, Campus Universitario de Tafira, 35017 Las Palmas deGran Canaria, Canary Island, Spain (e-mail: [email protected]).
The costs of publication of this article were defrayed in part by the paymentof page charges. The article must therefore be hereby marked “advertisement”in accordance with 18 U.S.C. Section 1734 solely to indicate this fact.
J Appl Physiol 102: 1786–1792, 2007.First published January 18, 2007; doi:10.1152/japplphysiol.01313.2006.
8750-7587/07 $8.00 Copyright © 2007 the American Physiological Society http://www. jap.org1786
on October 4, 2010
jap.physiology.orgD
ownloaded from

bit anti-human leptin receptor that recognizes the extracellular domainof human leptin receptor was obtained from Linco Research (St.Charles, MO). The recombinant human (RH) leptin R/Fc chimera,generated from DNA containing the extracellular domain of OB-R(amino acid residues 1-839) fused to the Fc region of human IgG1,was obtained from R&D Systems (McKinley Place). The monoclonalmouse anti-�-tubulin antibody was obtained from Biosigma (Madrid,Spain). The secondary horseradish peroxidase (HRP)-conjugated goatanti-rabbit and donkey anti-mouse antibodies were from JacksonImmunoReseach (West Grove, PA). The Hybond-P transfer mem-branes, Hyperfilm enhanced chemiluminescence (ECL), and the ECLplus Western Blotting Detection System were from Amersham Bio-sciences (Little Chalfont, Buckinghamshire, UK). The GS-800 Cali-brated Densitometer and the image analysis software Quantity Onewere obtained from Bio-Rad Laboratories (Hemel Hempstead, Hert-fordshire, UK).
Subjects. Fourteen healthy men (age � 33.1 � 2.0 yr, height �175.9 � 1.7 cm, body mass � 81.2 � 3.8 kg, body fat � 22.5 �1.9%) participated in this investigation. Written, informed consentwas obtained from each subject after they received a full explanationabout the study procedures. The study was performed in accordancewith the Helsinki Declaration of 1975 and approved by the EthicalCommittee of the University of Las Palmas de Gran Canaria.
General procedures. The body composition of each subject wasdetermined by dual-energy X-ray absorptiometry (Hologic QDR-1500, Hologic, software version 7.10, Waltham, MA), as describedelsewhere (5, 6, 52). On a different day, following an overnight fast,a muscle biopsy was obtained from the middle portion of the vastuslateralis muscle using Bergstrom’s technique without suction, asdescribed elsewhere (35). The muscle specimen was cleaned toremove any visible blood, fat, or connective tissue. Then the muscletissue was immediately frozen in liquid nitrogen and stored at �80°Cfor later analysis. In some subjects, a small piece of subcutaneousadipose tissue was also sampled (2–3 cm) apart from the incision,using the same kind of needle without suction to minimize the risk ofcontamination of the subcutaneous biopsy with blood.
Human brain material. The OB-R expression was determined in aprotein extract from adult human hypothalamus by Western blotanalysis. The rationale for targeting this tissue is the high content ofOB-R protein found in rodents (49), and expression of OB-R mRNA(both short and long isoforms) has been reported in human hypothal-amus (15). The hypothalamic extracts were prepared using unfixedbrain obtained from necropsies of three cognitively normal subjects(aged 26–75 yr), whose brains were extracted shortly after death (�10h postmortem) and frozen at �80°C. The donors had no neurodegen-erative disease. These procedures conformed with the rules of theEthical Committee of the University of La Laguna in accordance withthe declaration of Helsinki. Material from these brains has also beenused in other studies (16).
Protein preparation for Western blotting. For total protein extrac-tion from human skeletal muscle and subcutaneous adipose tissue, apiece of frozen tissue was homogenized in urea lysis buffer [6 M urea,1% (wt/vol) SDS, and 1� of Complete protease inhibitor]. For proteinextraction from human hypothalamus, a piece of frozen tissue washomogenized in Tween 20 lysis buffer [0.0625 M Tris �HCl, pH 7.4,1% (wt/vol) Tween 20, and 1� of Complete protease inhibitor]. Aftercentrifugation at 20,000 g to remove tissue debris, total protein extractswere transferred to clean tubes, and an aliquot of each extract waspreserved for protein quantification by bicinchoninic acid assay (54).
A whole blood protein extract was obtained from 10 ml of EDTAanticoagulated blood that was drawn from an antecubital vein. Theblood was mixed with a hypotonic solution, and, after erythrocytelysis, the pellet, containing the leukocytes, was extracted using theurea lysis buffer and procedures described above.
Electrophoresis and Western blot analysis. Proteins were solubi-lized in sample buffer containing 0.0625 M Tris �HCl, pH 6.8, 2.3%(wt/vol) SDS, 10% (vol/vol) glycerol, 5% (vol/vol) �-mercaptoetha-
nol, and 0.001% (wt/vol) bromophenol blue. Equal amounts (50 �g)of each sample were electrophoresed on 7.5–10% SDS-PAGE usingthe system of Laemmli (31) and transferred to Hybond-P membranes,according to the method of Towbin et al. (63). For immunoblotting,membranes were preincubated with 5% blotting grade blocker nonfatdry milk (Bio-Rad Laboratories, Hercules, CA) in Tris-buffered salinewith 0.1% Tween 20 (blotto blocking buffer) for 1 h at room temperature(20–22°C). To detect the leptin receptor isoforms (OB-Rs), membraneswere incubated with a rabbit polyclonal-specific anti-human OB-Rantibody. To control for differences in loading and transfer efficiencyacross membranes, an antibody directed against �-tubulin was used tohybridate on the same samples. Membrane incubations with poly-clonal rabbit anti-OB-R (diluted 1:2,000 in blotto blocking buffer)were performed overnight at 4°C. Membrane incubations with mono-clonal mouse anti-�-tubulin (diluted 1:70,000 in blotto blockingbuffer) were performed for 1 h at room temperature. As control foradipose tissue protein presence in muscular tissue, a polyclonal rabbitanti-perilipin A antibody was used (64). To explore the expression ofthis protein in human skeletal muscle and subcutaneous adiposetissue, membranes were blocked with 4% BSA (Sigma, Madrid,Spain) in Tris-buffered saline with 0.1% Tween 20 (BSA blockingbuffer) for 1 h at room temperature. Membrane incubations withpolyclonal rabbit anti-perilipin A antibody (diluted 1:1,500 in BSAblocking buffer) were performed for 1 h at room temperature. Anti-body-specific labeling was revealed by incubation with a HRP-conjugated goat anti-rabbit antibody (1:20,000) or a HRP-conjugateddonkey anti-mouse (1:10,000) antibody, both diluted in blotto block-ing buffer and visualized with the ECL kit (Amersham Biosciences).Specific bands were scanned with the GS-800 Calibrated Densitom-eter and analyzed with the image analysis program Quantity One(Bio-Rad Laboratories, Hercules, CA). Data are reported as bandintensity of immunostaining values (arbitrary units) obtained forOB-R relative to those obtained for �-tubulin. �-Tubulin content inthe muscle biopsies was similar in all of the subjects analyzed (3.54 �0.22 arbitrary units of band density of immunostaining).
Competitive assays for OB-R. To evaluate the specificity of theanti-OB-R antibody used in this investigation, competitive assayswere performed with increasing amounts of RH leptin R/Fc (RHOB-R) chimera (0, 10, 100, 500 ng) preincubated with anti-OB-Rantibody (diluted 1:2,000 in blotto blocking buffer) overnight at 4°C.OB-R protein expression from muscular extracts was analyzed byWestern blot with the preincubation solution. Data are reported asa percentage of OB-R immunostaining values (band quenching) inthe presence of increasing amounts of RH leptin R/Fc chimerarelative to those observed for a control that was not preincubatedwith RH leptin R/Fc.
Potential contamination by whole blood or subcutaneous adiposetissue. To assess if a small contamination by blood could influence theOB-R immunostainings, whole human blood protein extracts wereobtained from two healthy subjects and processed for Western blotanalysis as described above. Skeletal muscle biopsies may be con-taminated by a small amount of adipose tissue, which may come fromthe adipose tissue accumulated between the muscle bundles and/or bysubcutaneous fat tissue. Although the latter possibility was minimizedby avoiding the use of suction, the amount of protein material comingfrom adipose tissue was also assessed in all muscle samples. For thispurpose, a protein extract from subcutaneous adipose tissue was firstobtained, as reported above. Then, in the same gel, skeletal muscleprotein extracts (50 �g) were run together with subcutaneous adiposetissue protein extract samples containing 1, 2, 3, 4, or 5 �g of protein(Fig. 1A). Then Western blots were performed using a polyclonalrabbit anti-perilipin A antibody as described above. From the banddensities obtained for perilipin, a standard curve was calculated bylinear regression (all curves had a r2 value �0.98) (Fig. 1B). Thecorresponding equation was used to calculate the maximal amount offat that could be present in each muscle biopsy, assuming that skeletalmuscle fibers have undetectable amounts of perilipin A (26, 47). To
1787OB-R ISOFORMS IN HUMAN SKELETAL MUSCLE
J Appl Physiol • VOL 102 • MAY 2007 • www.jap.org
on October 4, 2010
jap.physiology.orgD
ownloaded from
calculate the potential contribution of some adipose tissue (or adipo-cytes) present in the muscle samples on the OB-R protein expression,we carried out two additional experiments. First, we added increasingamounts of protein extracts from adipose tissue (1, 2, and 4 �g) to 50�g of muscle protein extract. In the second experiment, increasingamounts of muscle protein extracts were added to 10 �g of proteinextract from adipose tissue. In both experiments, the expression ofOB-R was determined by Western blot analysis.
Leptin assays. Serum leptin was determined by ELISA (ELx800Universal Microplate Reader, Bioteck Instruments), using reagent kitsfrom Diagnostic Systems Laboratories (Webster, TX) and followingthe manufacturer’s instructions. The sensitivity of the total leptinassays was 0.05 ng/ml (4). The intra-assay coefficient of variation was3.8%, and the interassay coefficient of variation was 4.4%.
Statistical analyses. The statistical analyses was performed usingthe SPSS software package (SPSS, Chicago, IL), version 8.0. All dataare reported as means � SE. The relationships between leptin andband densities were tested with linear regression analysis. Calibrationcurves for the relationship between perilipin A band density andprotein content from subcutaneous adipose tissue fat were obtained bylinear regression analysis. Pearson’s correlation coefficients were usedto assess associations between leptin and OB-R protein expression.The sample population was ordered according to the basal leptinconcentration values and then split into two groups, each composed ofseven subjects. One group consisted of the subjects with the sevenlowest values of plasma leptin, whereas the other group contained thesubjects with the seven highest leptin concentrations. The banddensities of the 170-kDa isoform were compared between these twogroups using Student’s t-test. A statistical test was considered signif-icant at P � 0.05 level (two-tailed).
RESULTS
Identification of OB-R in human skeletal muscle. The proteinexpression of the OB-R in human skeletal muscle was deter-mined by Western blot analysis using an antibody raised
against its extracellular domain. This antibody revealed thepresence of three bands in which molecular mass was 170,128, and 98 kDa (Fig. 2, A and D). The 170-kDa band wasdetected in skeletal muscle and hypothalamus protein extracts(Fig. 2A). The other two bands migrating at 128 and 98 kDawere identified in skeletal muscle and thigh subcutaneousadipose tissue protein extracts (Fig. 2A). The 98-kDa band wasalso found in hypothalamus protein extracts (Fig. 2A). Noimmunosignal was observed in the absence of primary anti-body (data not shown). The 128-kDa isoform was not detectedin four subjects, implying that the level of expression wasundetectable or that the 128-kDa isoform was not expressed atall in the skeletal muscle (Fig. 2A). In the latter case, the128-kDa observed in some subjects indicated contamination bysurrounding adipose tissue or adipocytes located in betweenthe muscle fibers. In contrast, the 170- and the 98-kDa isoformswere detected in all 14 subjects (Fig. 2A).
The densities of the 98-kDa and the 128-kDa OB-R bands(r � 0.76, P � 0.01) and the 170-kDa and the 98-kDa OB-Rbands (r � 0.74, P � 0.01) were correlated. No relationship
Fig. 2. Determination of the expression of human leptin receptor (OB-R) inhuman skeletal muscle. Protein extracts were prepared from muscle, SAT, andhypothalamus (HIP), and OB-R, perilipin A, and �-tubulin protein expressionwas analyzed by Western blot. A: representative immunoblot assay afterincubation with a polyclonal rabbit anti-OB-R antibody specifically raisedagainst the long isoform. B: representative Western blot after incubation witha polyclonal rabbit anti-perilipin A antibody in the same samples used in A. C:representative immunoblot analysis after incubation with the monoclonalmouse anti-�-tubulin antibody in the same samples used in A. D: densitometricimmunosignal values (arbitrary units of band densities) of OB-R bands relativeto those obtained for �-tubulin.
Fig. 1. Determination of perilipin A content to assess the degree of adiposetissue infiltration in human skeletal muscle biopsies. Protein extracts wereobtained from muscle and subcutaneous adipose tissue (SAT), and perilipin Aprotein expression was determined by Western blot. A: representative immu-noblotting performed in SAT protein extracts containing 1, 2, 3, 4, and 5 �gof protein and in muscle protein extracts (50 �g). B: representative standardcurve calculated by linear regression (r2 � 0.99) from the band densitiesobtained for perilipin A (arbitrary units).
1788 OB-R ISOFORMS IN HUMAN SKELETAL MUSCLE
J Appl Physiol • VOL 102 • MAY 2007 • www.jap.org
on October 4, 2010
jap.physiology.orgD
ownloaded from
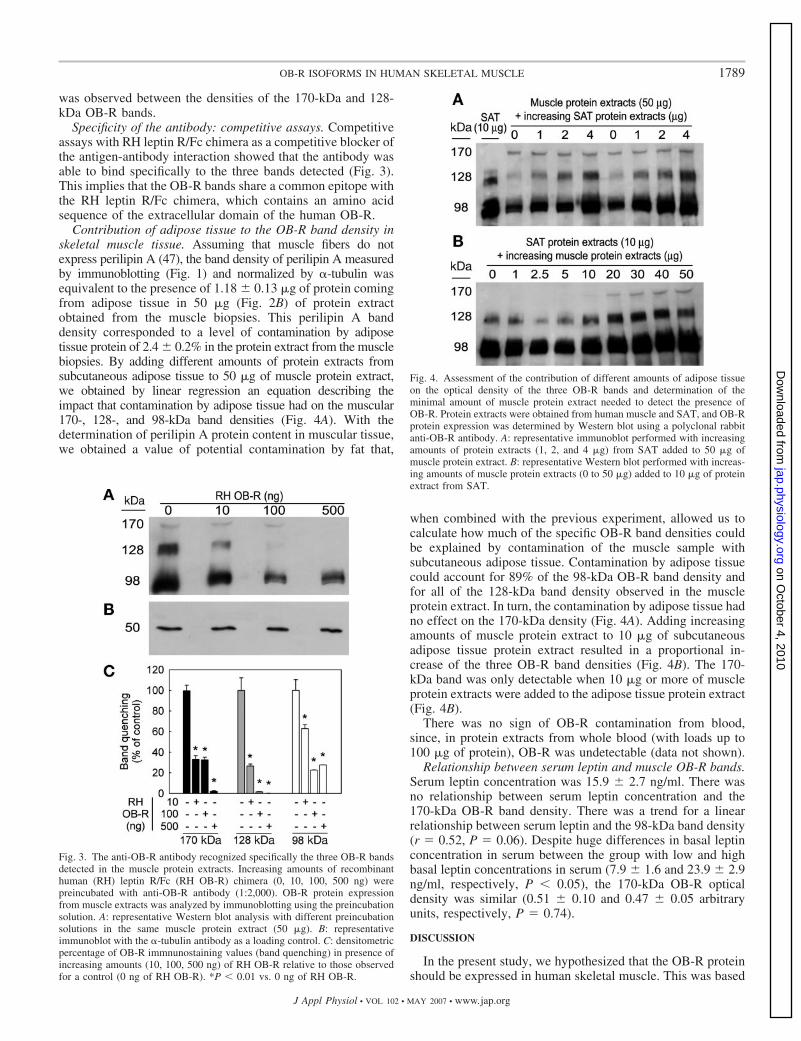
was observed between the densities of the 170-kDa and 128-kDa OB-R bands.
Specificity of the antibody: competitive assays. Competitiveassays with RH leptin R/Fc chimera as a competitive blocker ofthe antigen-antibody interaction showed that the antibody wasable to bind specifically to the three bands detected (Fig. 3).This implies that the OB-R bands share a common epitope withthe RH leptin R/Fc chimera, which contains an amino acidsequence of the extracellular domain of the human OB-R.
Contribution of adipose tissue to the OB-R band density inskeletal muscle tissue. Assuming that muscle fibers do notexpress perilipin A (47), the band density of perilipin A measuredby immunoblotting (Fig. 1) and normalized by �-tubulin wasequivalent to the presence of 1.18 � 0.13 �g of protein comingfrom adipose tissue in 50 �g (Fig. 2B) of protein extractobtained from the muscle biopsies. This perilipin A banddensity corresponded to a level of contamination by adiposetissue protein of 2.4 � 0.2% in the protein extract from the musclebiopsies. By adding different amounts of protein extracts fromsubcutaneous adipose tissue to 50 �g of muscle protein extract,we obtained by linear regression an equation describing theimpact that contamination by adipose tissue had on the muscular170-, 128-, and 98-kDa band densities (Fig. 4A). With thedetermination of perilipin A protein content in muscular tissue,we obtained a value of potential contamination by fat that,
when combined with the previous experiment, allowed us tocalculate how much of the specific OB-R band densities couldbe explained by contamination of the muscle sample withsubcutaneous adipose tissue. Contamination by adipose tissuecould account for 89% of the 98-kDa OB-R band density andfor all of the 128-kDa band density observed in the muscleprotein extract. In turn, the contamination by adipose tissue hadno effect on the 170-kDa density (Fig. 4A). Adding increasingamounts of muscle protein extract to 10 �g of subcutaneousadipose tissue protein extract resulted in a proportional in-crease of the three OB-R band densities (Fig. 4B). The 170-kDa band was only detectable when 10 �g or more of muscleprotein extracts were added to the adipose tissue protein extract(Fig. 4B).
There was no sign of OB-R contamination from blood,since, in protein extracts from whole blood (with loads up to100 �g of protein), OB-R was undetectable (data not shown).
Relationship between serum leptin and muscle OB-R bands.Serum leptin concentration was 15.9 � 2.7 ng/ml. There wasno relationship between serum leptin concentration and the170-kDa OB-R band density. There was a trend for a linearrelationship between serum leptin and the 98-kDa band density(r � 0.52, P � 0.06). Despite huge differences in basal leptinconcentration in serum between the group with low and highbasal leptin concentrations in serum (7.9 � 1.6 and 23.9 � 2.9ng/ml, respectively, P � 0.05), the 170-kDa OB-R opticaldensity was similar (0.51 � 0.10 and 0.47 � 0.05 arbitraryunits, respectively, P � 0.74).
DISCUSSION
In the present study, we hypothesized that the OB-R proteinshould be expressed in human skeletal muscle. This was based
Fig. 3. The anti-OB-R antibody recognized specifically the three OB-R bandsdetected in the muscle protein extracts. Increasing amounts of recombinanthuman (RH) leptin R/Fc (RH OB-R) chimera (0, 10, 100, 500 ng) werepreincubated with anti-OB-R antibody (1:2,000). OB-R protein expressionfrom muscle extracts was analyzed by immunoblotting using the preincubationsolution. A: representative Western blot analysis with different preincubationsolutions in the same muscle protein extract (50 �g). B: representativeimmunoblot with the �-tubulin antibody as a loading control. C: densitometricpercentage of OB-R immnunostaining values (band quenching) in presence ofincreasing amounts (10, 100, 500 ng) of RH OB-R relative to those observedfor a control (0 ng of RH OB-R). *P � 0.01 vs. 0 ng of RH OB-R.
Fig. 4. Assessment of the contribution of different amounts of adipose tissueon the optical density of the three OB-R bands and determination of theminimal amount of muscle protein extract needed to detect the presence ofOB-R. Protein extracts were obtained from human muscle and SAT, and OB-Rprotein expression was determined by Western blot using a polyclonal rabbitanti-OB-R antibody. A: representative immunoblot performed with increasingamounts of protein extracts (1, 2, and 4 �g) from SAT added to 50 �g ofmuscle protein extract. B: representative Western blot performed with increas-ing amounts of muscle protein extracts (0 to 50 �g) added to 10 �g of proteinextract from SAT.
1789OB-R ISOFORMS IN HUMAN SKELETAL MUSCLE
J Appl Physiol • VOL 102 • MAY 2007 • www.jap.org
on October 4, 2010
jap.physiology.orgD
ownloaded from
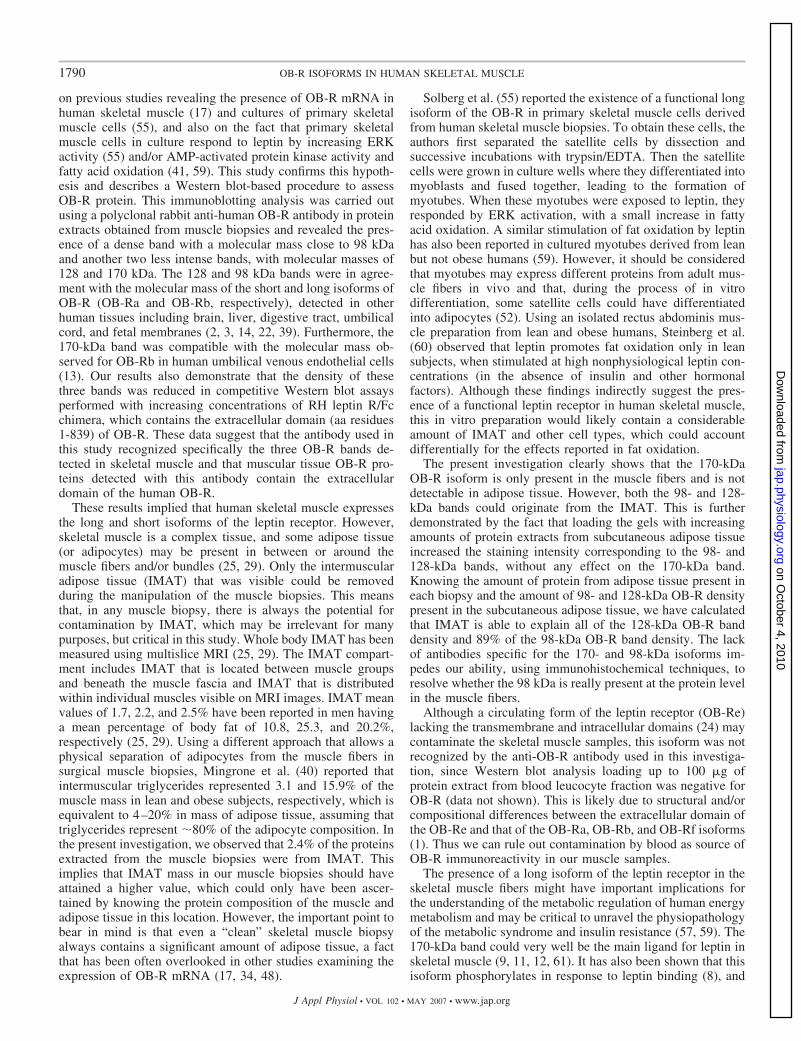
on previous studies revealing the presence of OB-R mRNA inhuman skeletal muscle (17) and cultures of primary skeletalmuscle cells (55), and also on the fact that primary skeletalmuscle cells in culture respond to leptin by increasing ERKactivity (55) and/or AMP-activated protein kinase activity andfatty acid oxidation (41, 59). This study confirms this hypoth-esis and describes a Western blot-based procedure to assessOB-R protein. This immunoblotting analysis was carried outusing a polyclonal rabbit anti-human OB-R antibody in proteinextracts obtained from muscle biopsies and revealed the pres-ence of a dense band with a molecular mass close to 98 kDaand another two less intense bands, with molecular masses of128 and 170 kDa. The 128 and 98 kDa bands were in agree-ment with the molecular mass of the short and long isoforms ofOB-R (OB-Ra and OB-Rb, respectively), detected in otherhuman tissues including brain, liver, digestive tract, umbilicalcord, and fetal membranes (2, 3, 14, 22, 39). Furthermore, the170-kDa band was compatible with the molecular mass ob-served for OB-Rb in human umbilical venous endothelial cells(13). Our results also demonstrate that the density of thesethree bands was reduced in competitive Western blot assaysperformed with increasing concentrations of RH leptin R/Fcchimera, which contains the extracellular domain (aa residues1-839) of OB-R. These data suggest that the antibody used inthis study recognized specifically the three OB-R bands de-tected in skeletal muscle and that muscular tissue OB-R pro-teins detected with this antibody contain the extracellulardomain of the human OB-R.
These results implied that human skeletal muscle expressesthe long and short isoforms of the leptin receptor. However,skeletal muscle is a complex tissue, and some adipose tissue(or adipocytes) may be present in between or around themuscle fibers and/or bundles (25, 29). Only the intermuscularadipose tissue (IMAT) that was visible could be removedduring the manipulation of the muscle biopsies. This meansthat, in any muscle biopsy, there is always the potential forcontamination by IMAT, which may be irrelevant for manypurposes, but critical in this study. Whole body IMAT has beenmeasured using multislice MRI (25, 29). The IMAT compart-ment includes IMAT that is located between muscle groupsand beneath the muscle fascia and IMAT that is distributedwithin individual muscles visible on MRI images. IMAT meanvalues of 1.7, 2.2, and 2.5% have been reported in men havinga mean percentage of body fat of 10.8, 25.3, and 20.2%,respectively (25, 29). Using a different approach that allows aphysical separation of adipocytes from the muscle fibers insurgical muscle biopsies, Mingrone et al. (40) reported thatintermuscular triglycerides represented 3.1 and 15.9% of themuscle mass in lean and obese subjects, respectively, which isequivalent to 4–20% in mass of adipose tissue, assuming thattriglycerides represent 80% of the adipocyte composition. Inthe present investigation, we observed that 2.4% of the proteinsextracted from the muscle biopsies were from IMAT. Thisimplies that IMAT mass in our muscle biopsies should haveattained a higher value, which could only have been ascer-tained by knowing the protein composition of the muscle andadipose tissue in this location. However, the important point tobear in mind is that even a “clean” skeletal muscle biopsyalways contains a significant amount of adipose tissue, a factthat has been often overlooked in other studies examining theexpression of OB-R mRNA (17, 34, 48).
Solberg et al. (55) reported the existence of a functional longisoform of the OB-R in primary skeletal muscle cells derivedfrom human skeletal muscle biopsies. To obtain these cells, theauthors first separated the satellite cells by dissection andsuccessive incubations with trypsin/EDTA. Then the satellitecells were grown in culture wells where they differentiated intomyoblasts and fused together, leading to the formation ofmyotubes. When these myotubes were exposed to leptin, theyresponded by ERK activation, with a small increase in fattyacid oxidation. A similar stimulation of fat oxidation by leptinhas also been reported in cultured myotubes derived from leanbut not obese humans (59). However, it should be consideredthat myotubes may express different proteins from adult mus-cle fibers in vivo and that, during the process of in vitrodifferentiation, some satellite cells could have differentiatedinto adipocytes (52). Using an isolated rectus abdominis mus-cle preparation from lean and obese humans, Steinberg et al.(60) observed that leptin promotes fat oxidation only in leansubjects, when stimulated at high nonphysiological leptin con-centrations (in the absence of insulin and other hormonalfactors). Although these findings indirectly suggest the pres-ence of a functional leptin receptor in human skeletal muscle,this in vitro preparation would likely contain a considerableamount of IMAT and other cell types, which could accountdifferentially for the effects reported in fat oxidation.
The present investigation clearly shows that the 170-kDaOB-R isoform is only present in the muscle fibers and is notdetectable in adipose tissue. However, both the 98- and 128-kDa bands could originate from the IMAT. This is furtherdemonstrated by the fact that loading the gels with increasingamounts of protein extracts from subcutaneous adipose tissueincreased the staining intensity corresponding to the 98- and128-kDa bands, without any effect on the 170-kDa band.Knowing the amount of protein from adipose tissue present ineach biopsy and the amount of 98- and 128-kDa OB-R densitypresent in the subcutaneous adipose tissue, we have calculatedthat IMAT is able to explain all of the 128-kDa OB-R banddensity and 89% of the 98-kDa OB-R band density. The lackof antibodies specific for the 170- and 98-kDa isoforms im-pedes our ability, using immunohistochemical techniques, toresolve whether the 98 kDa is really present at the protein levelin the muscle fibers.
Although a circulating form of the leptin receptor (OB-Re)lacking the transmembrane and intracellular domains (24) maycontaminate the skeletal muscle samples, this isoform was notrecognized by the anti-OB-R antibody used in this investiga-tion, since Western blot analysis loading up to 100 �g ofprotein extract from blood leucocyte fraction was negative forOB-R (data not shown). This is likely due to structural and/orcompositional differences between the extracellular domain ofthe OB-Re and that of the OB-Ra, OB-Rb, and OB-Rf isoforms(1). Thus we can rule out contamination by blood as source ofOB-R immunoreactivity in our muscle samples.
The presence of a long isoform of the leptin receptor in theskeletal muscle fibers might have important implications forthe understanding of the metabolic regulation of human energymetabolism and may be critical to unravel the physiopathologyof the metabolic syndrome and insulin resistance (57, 59). The170-kDa band could very well be the main ligand for leptin inskeletal muscle (9, 11, 12, 61). It has also been shown that thisisoform phosphorylates in response to leptin binding (8), and
1790 OB-R ISOFORMS IN HUMAN SKELETAL MUSCLE
J Appl Physiol • VOL 102 • MAY 2007 • www.jap.org
on October 4, 2010
jap.physiology.orgD
ownloaded from

this phosphorylation has been linked to the activation ofintracellular cascades with subsequent effects on fatty acidtransport and metabolism (41, 42, 58).
In summary, this study shows that a long isoform of theleptin receptor with a molecular mass close to 170 kDa isexpressed at the protein level in human skeletal muscle. Theamount of 170-kDa protein appears to be independent of thebasal concentration of leptin in serum. In addition, we describea procedure based on the determination of perilipin A content,a protein exclusive of adipocytes, to determine the degree ofadipose tissue infiltration in human muscle biopsies. The latterprocedure was critical for the interpretation of our results.Adipose tissue contamination must be assessed when usingrough protein extracts from skeletal muscle, if the aim is tostudy molecules that may also be present in IMAT. Futureexperiments with human and animal models of hypo- andhyperleptinemia, and longitudinal studies in dieting and/orexercising humans, should be carried out to establish the roleof this isoform of the leptin receptor in the regulation ofskeletal muscle metabolism.
ACKNOWLEDGMENTS
The authors thank Dr. Andrew S. Greenberg for kindly providing theanti-perilipin A antibody. Special thanks are given to Jose Navarro de Tuerofor excellent technical assistance and to Ana Navarro y Guerra del Rıo forattendance in the elaboration of immunoblotting figures. The specializedadvice from Tony Webster in editing the English version of the manuscript isalso acknowledged. Special thanks are given to all subjects who volunteeredfor these experiments. We express our gratitude to Gundela Meyer for helpwith the human hypothalamus.
GRANTS
This study was supported by grants from the Ministerio de Educacion yCiencia (BFI2003-09638, BFU2006-13784, and FEDER) and the Gobierno deCanarias (PI2005/177). We are grateful for all the support provided by theAcademia Canaria de Seguridad and particularly to Juan Manuel CastanedaContreras. B. Guerra is a fellow of the “Recursos Humanos y Difusion de laInvestigacion” Programe (Instituto de Salud Carlos III, Ministerio de Sanidady Consumo, Spain).
REFERENCES
1. Ahima RS, Flier JS. Leptin. Annu Rev Physiol 62: 413–437, 2000.2. Akerman F, Lei ZM, Rao CV. Human umbilical cord and fetal mem-
branes co-express leptin and its receptor genes. Gynecol Endocrinol 16:299–306, 2002.
3. Aparicio T, Kermorgant S, Darmoul D, Guilmeau S, Hormi K,Mahieu-Caputo D, Lehy T. Leptin and Ob-Rb receptor isoform in thehuman digestive tract during fetal development. J Clin Endocrinol Metab90: 6177–6184, 2005.
4. Ara I, Perez Gomez J, Vicente-Rodriguez G, Chavarren J, Dorado C,Calbet JA. Serum free testosterone, leptin and soluble leptin receptorchanges in a 6-week strength-training programme. Br J Nutr 96: 1053–1059, 2006.
5. Ara I, Vicente-Rodriguez G, Jimenez-Ramirez J, Dorado C, Serrano-Sanchez JA, Calbet JA. Regular participation in sports is associated withenhanced physical fitness and lower fat mass in prepubertal boys. Int JObes Relat Metab Disord 28: 1585–1593, 2004.
6. Ara I, Vicente-Rodriguez G, Perez-Gomez J, Jimenez-Ramirez J,Serrano-Sanchez JA, Dorado C, Calbet JA. Influence of extracurricularsport activities on body composition and physical fitness in boys: a 3-yearlongitudinal study. Int J Obes 30: 1062–1071, 2006.
7. Argiles JM, Lopez-Soriano J, Almendro V, Busquets S, Lopez-Soriano FJ. Cross-talk between skeletal muscle and adipose tissue: alink with obesity? Med Res Rev 25: 49 – 65, 2005.
8. Bates SH, Myers MG Jr. The role of leptin receptor signaling in feedingand neuroendocrine function. Trends Endocrinol Metab 14: 447–452,2003.
9. Baumann H, Morella KK, White DW, Dembski M, Bailon PS, Kim H,Lai CF, Tartaglia LA. The full-length leptin receptor has signalingcapabilities of interleukin 6-type cytokine receptors. Proc Natl Acad SciUSA 93: 8374–8378, 1996.
10. Bjorbaek C, Kahn BB. Leptin signaling in the central nervous system andthe periphery. Recent Prog Horm Res 59: 305–331, 2004.
11. Bjorbaek C, Lavery HJ, Bates SH, Olson RK, Davis SM, Flier JS,Myers MG Jr. SOCS3 mediates feedback inhibition of the leptin receptorvia Tyr985. J Biol Chem 275: 40649–40657, 2000.
12. Bjorbaek C, Uotani S, da Silva B, Flier JS. Divergent signalingcapacities of the long and short isoforms of the leptin receptor. J BiolChem 272: 32686–32695, 1997.
13. Bouloumie A, Drexler HC, Lafontan M, Busse R. Leptin, the product ofOb gene, promotes angiogenesis. Circ Res 83: 1059–1066, 1998.
14. Briscoe CP, Hanif S, Arch JR, Tadayyon M. Leptin receptor long-formsignalling in a human liver cell line. Cytokine 14: 225–229, 2001.
15. Burguera B, Couce ME, Long J, Lamsam J, Laakso K, Jensen MD,Parisi JE, Lloyd RV. The long form of the leptin receptor (OB-Rb) iswidely expressed in the human brain. Neuroendocrinology 71: 187–195,2000.
16. Cabrera-Socorro A, Pueyo Morlans M, Suarez Sola ML, GonzalezDelgado FJ, Castaneyra-Perdomo A, Marin MC, Meyer G. Multipleisoforms of the tumor protein p73 are expressed in the adult humantelencephalon and choroid plexus and present in the cerebrospinal fluid.Eur J Neurosci 23: 2109–2118, 2006.
17. Ceddia RB, William WN Jr, Curi R. The response of skeletal muscle toleptin. Front Biosci 6: D90–D97, 2001.
18. Chua SC Jr, Koutras IK, Han L, Liu SM, Kay J, Young SJ, ChungWK, Leibel RL. Fine structure of the murine leptin receptor gene: splicesite suppression is required to form two alternatively spliced transcripts.Genomics 45: 264–270, 1997.
19. Considine RV, Caro JF. Leptin and the regulation of body weight. IntJ Biochem Cell Biol 29: 1255–1272, 1997.
20. Considine RV, Sinha MK, Heiman ML, Kriauciunas A, Stephens TW,Nyce MR, Ohannesian JP, Marco CC, McKee LJ, Bauer TL, Caro JF.Serum immunoreactive-leptin concentrations in normal-weight and obesehumans. N Engl J Med 334: 292–295, 1996.
21. Cornish J, Callon KE, Bava U, Lin C, Naot D, Hill BL, Grey AB,Broom N, Myers DE, Nicholson GC, Reid IR. Leptin directly regulatesbone cell function in vitro and reduces bone fragility in vivo. J Endocrinol175: 405–415, 2002.
22. Couce ME, Burguera B, Parisi JE, Jensen MD, Lloyd RV. Localizationof leptin receptor in the human brain. Neuroendocrinology 66: 145–150,1997.
23. Dulloo AG, Stock MJ, Solinas G, Boss O, Montani JP, Seydoux J.Leptin directly stimulates thermogenesis in skeletal muscle. FEBS Lett515: 109–113, 2002.
24. Friedman JM, Halaas JL. Leptin and the regulation of body weight inmammals. Nature 395: 763–770, 1998.
25. Gallagher D, Kuznia P, Heshka S, Albu J, Heymsfield SB, GoodpasterB, Visser M, Harris TB. Adipose tissue in muscle: a novel depot similarin size to visceral adipose tissue. Am J Clin Nutr 81: 903–910, 2005.
26. Greenberg AS, Egan JJ, Wek SA, Garty NB, Blanchette-Mackie EJ,Londos C. Perilipin, a major hormonally regulated adipocyte-specificphosphoprotein associated with the periphery of lipid storage droplets.J Biol Chem 266: 11341–11346, 1991.
27. Hekerman P, Zeidler J, Bamberg-Lemper S, Knobelspies H, LavensD, Tavernier J, Joost HG, Becker W. Pleiotropy of leptin receptorsignalling is defined by distinct roles of the intracellular tyrosines. FEBSJ 272: 109–119, 2005.
28. Houmard JA, Cox JH, MacLean PS, Barakat HA. Effect of short-termexercise training on leptin and insulin action. Metabolism 49: 858–861,2000.
29. Kim J, Heshka S, Gallagher D, Kotler DP, Mayer L, Albu J, Shen W,Freda PU, Heymsfield SB. Intermuscular adipose tissue-free skeletalmuscle mass: estimation by dual-energy X-ray absorptiometry in adults.J Appl Physiol 97: 655–660, 2004.
30. Krentz AJ. Insulin resistance. BMJ 313: 1385–1389, 1996.31. Laemmli UK. Cleavage of structural proteins during the assembly of the
head of bacteriophage T4. Nature 227: 680–685, 1970.32. Lee DW, Leinung MC, Rozhavskaya-Arena M, Grasso P. Leptin and
the treatment of obesity: its current status. Eur J Pharmacol 440: 129–139, 2002.
1791OB-R ISOFORMS IN HUMAN SKELETAL MUSCLE
J Appl Physiol • VOL 102 • MAY 2007 • www.jap.org
on October 4, 2010
jap.physiology.orgD
ownloaded from

33. Lee GH, Proenca R, Montez JM, Carroll KM, Darvishzadeh JG, LeeJI, Friedman JM. Abnormal splicing of the leptin receptor in diabeticmice. Nature 379: 632–635, 1996.
34. Liu YL, Emilsson V, Cawthorne MA. Leptin inhibits glycogen synthesisin the isolated soleus muscle of obese (ob/ob) mice. FEBS Lett 411:351–355, 1997.
35. Lundby C, Sander M, van Hall G, Saltin B, Calbet JA. Maximalexercise and muscle oxygen extraction in acclimatizing lowlanders andhigh altitude natives. J Physiol 573: 535–547, 2006.
36. Margetic S, Gazzola C, Pegg GG, Hill RA. Leptin: a review of itsperipheral actions and interactions. Int J Obes Relat Metab Disord 26:1407–1433, 2002.
37. Maroni P, Bendinelli P, Piccoletti R. Early intracellular events inducedby in vivo leptin treatment in mouse skeletal muscle. Mol Cell Endocrinol201: 109–121, 2003.
38. Mars M, de Graaf C, de Groot CP, van Rossum CT, Kok FJ. Fastingleptin and appetite responses induced by a 4-day 65%-energy-restricteddiet. Int J Obes 30: 122–128, 2006.
39. Merino B, Diez-Fernandez C, Ruiz-Gayo M, Somoza B. Choroid plexusepithelial cells co-express the long and short form of the leptin receptor.Neurosci Lett 393: 269–272, 2006.
40. Mingrone G, Bertuzzi A, Capristo E, Greco AV, Manco M, PietrobelliA, Salinari S, Heymsfield SB. Unreliable use of standard muscle hydra-tion value in obesity. Am J Physiol Endocrinol Metab 280: E365–E371,2001.
41. Minokoshi Y, Kim YB, Peroni OD, Fryer LG, Muller C, Carling D,Kahn BB. Leptin stimulates fatty-acid oxidation by activating AMP-activated protein kinase. Nature 415: 339–343, 2002.
42. Muoio DM, Dohm GL, Fiedorek FT Jr, Tapscott EB, Coleman RA.Leptin directly alters lipid partitioning in skeletal muscle. Diabetes 46:1360–1363, 1997.
43. Muoio DM, Lynis Dohm G. Peripheral metabolic actions of leptin. BestPract Res Clin Endocrinol Metab 16: 653–666, 2002.
44. Olefsky JM, Kolterman OG, Scarlett JA. Insulin action and resistancein obesity and noninsulin-dependent type II diabetes mellitus. Am JPhysiol Endocrinol Metab 243: E15–E30, 1982.
45. Pelleymounter MA, Cullen MJ, Baker MB, Hecht R, Winters D,Boone T, Collins F. Effects of the obese gene product on body weightregulation in ob/ob mice. Science 269: 540–543, 1995.
46. Perusse L, Collier G, Gagnon J, Leon AS, Rao DC, Skinner JS,Wilmore JH, Nadeau A, Zimmet PZ, Bouchard C. Acute and chroniceffects of exercise on leptin levels in humans. J Appl Physiol 83: 5–10,1997.
47. Phillips SA, Choe CC, Ciaraldi TP, Greenberg AS, Kong AP, Baxi SC,Christiansen L, Mudaliar SR, Henry RR. Adipocyte differentiation-related protein in human skeletal muscle: relationship to insulin sensitiv-ity. Obes Res 13: 1321–1329, 2005.
48. Ramsay TG, Richards MP. Leptin and leptin receptor expression inskeletal muscle and adipose tissue in response to in vivo porcine soma-totropin treatment. J Anim Sci 83: 2501–2508, 2005.
49. Sahu A. Leptin signaling in the hypothalamus: emphasis on energyhomeostasis and leptin resistance. Front Neuroendocrinol 24: 225–253,2003.
50. Segal KR, Landt M, Klein S. Relationship between insulin sensitivityand plasma leptin concentration in lean and obese men. Diabetes 45:988–991, 1996.
51. Seron K, Corset L, Vasseur F, Boutin P, Gomez-Ambrosi J, SalvadorJ, Fruhbeck G, Froguel P. Distinct impaired regulation of SOCS3 andlong and short isoforms of the leptin receptor in visceral and subcutaneousfat of lean and obese women. Biochem Biophys Res Commun 348:1232–1238, 2006.
52. Shefer G, Wleklinski-Lee M, Yablonka-Reuveni Z. Skeletal musclesatellite cells can spontaneously enter an alternative mesenchymal path-way. J Cell Sci 117: 5393–5404, 2004.
53. Shih CD, Au LC, Chan JY. Differential role of leptin receptors at thehypothalamic paraventricular nucleus in tonic regulation of food intakeand cardiovascular functions. J Biomed Sci 10: 367–378, 2003.
54. Smith PK, Krohn RI, Hermanson GT, Mallia AK, Gartner FH,Provenzano MD, Fujimoto EK, Goeke NM, Olson BJ, Klenk DC.Measurement of protein using bicinchoninic acid. Anal Biochem 150:76–85, 1985.
55. Solberg R, Aas V, Thoresen GH, Kase ET, Drevon CA, Rustan AC,Reseland JE. Leptin expression in human primary skeletal muscle cells isreduced during differentiation. J Cell Biochem 96: 89–96, 2005.
56. Sorensen TI, Echwald S, Holm JC. Leptin in obesity. BMJ 313:953–954, 1996.
57. Steinberg GR, Dyck DJ. Development of leptin resistance in rat soleusmuscle in response to high-fat diets. Am J Physiol Endocrinol Metab 279:E1374–E1382, 2000.
58. Steinberg GR, Dyck DJ, Calles-Escandon J, Tandon NN, Luiken JJ,Glatz JF, Bonen A. Chronic leptin administration decreases fatty aciduptake and fatty acid transporters in rat skeletal muscle. J Biol Chem 277:8854–8860, 2002.
59. Steinberg GR, McAinch AJ, Chen MB, O’Brien PE, Dixon JB,Cameron-Smith D, Kemp BE. The suppressor of cytokine signaling 3inhibits leptin activation of AMP-kinase in cultured skeletal muscle ofobese humans. J Clin Endocrinol Metab 91: 3592–3597, 2006.
60. Steinberg GR, Parolin ML, Heigenhauser GJ, Dyck DJ. Leptin in-creases FA oxidation in lean but not obese human skeletal muscle:evidence of peripheral leptin resistance. Am J Physiol Endocrinol Metab283: E187–E192, 2002.
61. Tartaglia LA. The leptin receptor. J Biol Chem 272: 6093–6096, 1997.62. Thong FS, Hudson R, Ross R, Janssen I, Graham TE. Plasma leptin in
moderately obese men: independent effects of weight loss and aerobicexercise. Am J Physiol Endocrinol Metab 279: E307–E313, 2000.
63. Towbin H, Staehelin T, Gordon J. Electrophoretic transfer of proteinsfrom polyacrylamide gels to nitrocellulose sheets: procedure and someapplications. Proc Natl Acad Sci USA 76: 4350–4354, 1979.
64. Wang Y, Sullivan S, Trujillo M, Lee MJ, Schneider SH, Brolin RE,Kang YH, Werber Y, Greenberg AS, Fried SK. Perilipin expression inhuman adipose tissues: effects of severe obesity, gender, and depot. ObesRes 11: 930–936, 2003.
65. White DW, Tartaglia LA. Leptin and OB-R: body weight regulation bya cytokine receptor. Cytokine Growth Factor Rev 7: 303–309, 1996.
66. Zhang F, Basinski MB, Beals JM, Briggs SL, Churgay LM, ClawsonDK, DiMarchi RD, Furman TC, Hale JE, Hsiung HM, Schoner BE,Smith DP, Zhang XY, Wery JP, Schevitz RW. Crystal structure of theobese protein leptin-E100. Nature 387: 206–209, 1997.
1792 OB-R ISOFORMS IN HUMAN SKELETAL MUSCLE
J Appl Physiol • VOL 102 • MAY 2007 • www.jap.org
on October 4, 2010
jap.physiology.orgD
ownloaded from

Gender Dimorphism in Skeletal Muscle Leptin Receptors,Serum Leptin and Insulin SensitivityBorja Guerra1, Teresa Fuentes1, Safira Delgado-Guerra1, Amelia Guadalupe-Grau1, Hugo Olmedillas1,
Alfredo Santana1,2,3, Jesus Gustavo Ponce-Gonzalez1, Cecilia Dorado1, Jose A. L. Calbet1*
1 Department of Physical Education, University of Las Palmas de Gran Canaria, Campus Universitario de Tafira s/n, Las Palmas de Gran Canaria, Spain, 2 Genetic Unit,
Chilhood Hospital-Materno Infantil de Las Palmas, del Sur s/n, Las Palmas de Gran Canaria, Spain, 3 Research Unit, Hospital de Gran Canaria Dr. Negrın, Bco Ballena s/n, Las
Palmas de Gran Canaria, Spain
Abstract
To determine if there is a gender dimorphism in the expression of leptin receptors (OB-R170, OB-R128 and OB-R98) and theprotein suppressor of cytokine signaling 3 (SOCS3) in human skeletal muscle, the protein expression of OB-R, perilipin A,SOCS3 and alpha-tubulin was assessed by Western blot in muscle biopsies obtained from the m. vastus lateralis in thirty-four men (age = 27.166.8 yr) and thirty-three women (age = 26.766.7 yr). Basal serum insulin concentration and HOMAwere similar in both genders. Serum leptin concentration was 3.4 times higher in women compared to men (P,0.05) andthis difference remained significant after accounting for the differences in percentage of body fat or soluble leptin receptor.OB-R protein was 41% (OB-R170, P,0.05) and 163% (OB-R128, P,0.05) greater in women than men. There was norelationship between OB-R expression and the serum concentrations of leptin or 17b-estradiol. In men, muscle OB-R128protein was inversely related to serum free testosterone. In women, OB-R98 and OB-R128 were inversely related to totalserum testosterone concentration, and OB-R128 to serum free testosterone concentration. SOCS3 protein expression wassimilar in men and women and was not related to OB-R. In women, there was an inverse relationship between the logarithmof free testosterone and SCOS3 protein content in skeletal muscle (r = 20.46, P,0.05). In summary, there is a genderdimorphism in skeletal muscle leptin receptors expression, which can be partly explained by the influence of testosterone.SOCS3 expression in skeletal muscle is not up-regulated in women, despite very high serum leptin concentrationscompared to men. The circulating form of the leptin receptor can not be used as a surrogate measure of the amount ofleptin receptors expressed in skeletal muscles.
Citation: Guerra B, Fuentes T, Delgado-Guerra S, Guadalupe-Grau A, Olmedillas H, et al. (2008) Gender Dimorphism in Skeletal Muscle Leptin Receptors, SerumLeptin and Insulin Sensitivity. PLoS ONE 3(10): e3466. doi:10.1371/journal.pone.0003466
Editor: Alejandro Lucia, Universidad Europea de Madrid, Spain
Received June 20, 2008; Accepted September 1, 2008; Published October 21, 2008
Copyright: � 2008 Guerra et al. This is an open-access article distributed under the terms of the Creative Commons Attribution License, which permitsunrestricted use, distribution, and reproduction in any medium, provided the original author and source are credited.
Funding: This study was supported by grants from the Ministerio de Educacion y Ciencia (BFI2003-09638, BFU2006-13784 and FEDER), Gobierno de Canarias(PI2005/177) and Universidad de Las Palmas de Gran Canaria, Spain (UNI2006/05). Borja Guerra is a fellow of the ‘‘Recursos Humanos y Difusion de laInvestigacion’’ Program (Instituto de Salud Carlos III, Ministerio de Sanidad y Consumo, Spain). The sponsors of this study had no role in the design and conduct ofthe study, in the collection, analysis, and interpretation of the data, and in the preparation, review, or approval of the manuscript.
Competing Interests: The authors have declared that no competing interests exist.
* E-mail: [email protected]
Introduction
Leptin is a hormone secreted primarily by adipocytes from the
white adipose tissue and by the stomach [1,2] with pleiotropic
effects on appetite, energy expenditure, fat deposition, hemato-
poiesis, angiogenesis, blood pressure, immune function, blood
clotting, bone mass, and reproduction [1]. In lean, but not in obese
human skeletal muscle, leptin is able to stimulate fatty acid
oxidation [3], suggesting that triglyceride accumulation and
lipotoxicity in obesity could be caused by changes in the leptin
signaling cascade.
There are at least six isoforms of leptin receptors (OB-Rs)
generated by mRNA alternative splicing and/or proteolytic
processing of the subsequent protein products [4]. These isoforms
are divisible into three classes: secreted, short and long. The
secreted isoform, also named soluble leptin receptor (sOB-R), is
mostly secreted into the bloodstream by the liver [5]. The sOB-R
binds circulating leptin and regulates the concentration of free
leptin [6]. The short and long isoforms contain identical
extracellular and transmembrane domains and differ in the length
of the intracellular amino acid sequence [1,7]. The long form of
the leptin receptor (OB-Rb) has a ,300 residues intracellular
domain, highly conserved in several species, and is critical for the
effects of this hormone [7]. In fact, the db/db mice lacking OB-Rb,
are phenotypically similar to the leptin-deficient ob/ob mice and to
the db3j/db3j mice (which are deficient in all leptin receptor
isoforms) [8].
Expression of OB-R mRNA have also been found in non-
neuronal tissues [9] such as bone, heart, liver, lung, adrenal glands,
testes, spleen, small intestine, pancreatic islets, placenta, adipose
tissue and skeletal muscle [10–15]. We have recently shown the
presence of OB-R protein in human skeletal muscle, adipose tissue
and hypothalamus [16].
The concentration of leptin in plasma is proportional to the size
of the fat mass but for a given amount of fat mass (and BMI),
women have a higher concentration of circulating free leptin
[17,18,19], i.e. women may be more resistant to the effects of
leptin. High leptin levels could down-regulate leptin receptors,
since expression (mRNA) of the long (OB-Rb) and short (OB-Ra)
isoforms of the leptin receptor are markedly reduced in the
PLoS ONE | www.plosone.org 1 October 2008 | Volume 3 | Issue 10 | e3466

hypothalamus and liver of obese rats, which have enhanced
plasma leptin concentration [20]. OB-R expression appears to be
reduced by testosterone in Leydig cells [21], while estradiol
administration to ovariectomized rats increases OB-R protein
expression in skeletal muscles [22]. Leptin may also down-regulate
leptin signaling in the target tissues by inducing the protein
suppressor of cytokine signaling 3 (SOCS3), which blunts JAK-2-
dependent leptin signaling [23] and causes leptin resistance in the
skeletal muscle [24].
We hypothesized that the high level of circulating leptin
observed in women may result in down-regulation of leptin
receptors in skeletal muscle or increased SOCS3 protein levels. In
addition, we also hypothesized that leptin receptors expression in
skeletal muscle will be inversely related to testosterone concentra-
tion and directly related to estradiol concentration in both genders.
Accordingly, our main purpose was to determine if there is a
gender dimorphism in leptin receptor expression in human skeletal
muscles. A second purpose was to assess if such dimorphism (if
present) is associated with some gender-related factors such as,
circulating levels of leptin, testosterone or estradiol concentrations.
A third purpose was to determine if the high leptin levels of
women are associated to increased SOCS3 protein levels in
skeletal muscles. Finally, we aimed at determining if soluble leptin
receptor may serve as a surrogate measure of the leptin receptor
protein expression in skeletal muscles.
Materials and Methods
MaterialsThe Complete protease inhibitor cocktail was obtained from
Roche Diagnostics (Mannheim, Germany). The polyclonal rabbit
anti-human leptin receptor antibody that recognizes the human
leptin receptor was obtained from Linco Research (St. Charles,
Missouri, USA). The polyclonal rabbit anti-human SOCS3
antibody was obtained from Santa Cruz Biotechnology (Santa
Cruz, CA, USA). The monoclonal mouse anti-alpha-tubulin
antibody was obtained from Biosigma (Madrid, Spain). The
secondary HRP-conjugated goat anti-rabbit and donkey anti-
mouse antibodies were from Jackson ImmunoReseach (West
Grove, PA, USA). The Hybond-P transfer membranes, Hyperfilm
ECL and the ECL plus Western Blotting Detection System were
from Amersham Biosciences (Little Chalfont, Buckinghamshire,
UK). The ChemiDoc XRS System and the image analysis
software Quantity One� were obtained from Bio-Rad Laborato-
ries (Hemel Hempstead Hertfordshire, UK).
ParticipantsThirty three healthy men and thirty three healthy women agree
to participate in this investigation. The study population was
composed by physical education students and police officers. Their
levels of physical activity span from an almost sedentary life style to
a high level of physical activity. All of them were non-smokers, had
normal basal blood glucose concentrations, and had no hyperten-
sion or any metabolic disease. The Body composition, basal serum
glucose and endocrine variables are shown in Table 1. Written
informed consent was obtained from each subject after they
received a full explanation about the study procedures. The study
was performed in accordance with the Helsinki Declaration of
1975, as revised in 2000, being approved by the Ethical
Committee of the University of Las Palmas de Gran Canaria.
General ProceduresThe body composition of each subject was determined by DXA
(Hologic QDR-1500, Hologic Corp., software version 7.10,
Waltham, MA) as described elsewhere [25,26]. On a different
day, subjects reported to the laboratory at 8.00 after an overnight
fast. After 10 min rest in the supine position a 20 ml blood sample
was withdrawn and used to measure serum glucose, insulin, leptin,
free and total testosterone, 17b-estradiol, and the soluble leptin
receptor. Then a muscle biopsy was obtained from the middle
portion of the vastus lateralis muscle using the Bergstrom’s
technique with suction, as described elsewhere [27]. The muscle
specimen was cleaned to remove any visible blood fat or
connective tissue. The muscle tissue was immediately frozen in
liquid nitrogen, and stored at 280uC for later analysis. In 5 men
and five women a small piece of subcutaneous adipose tissue was
also sampled 2–3 cm apart from the incision using the same kind
of needle.
Total protein extraction, electrophoresis and Westernblot Analysis
For total protein extraction from skeletal muscle and subcuta-
neous adipose tissue a piece of frozen tissue was homogenized as
described elsewhere [16]. Muscle and fat homogenates were
rotated end over end at 4uC for 60 min, after which they were
centrifuged for 15 min at 20,000 g to remove tissue debris. The
supernatants were harvested and transferred to clean tubes. An
aliquot of each extract was preserved for protein quantification by
bicinchoninic acid assay. Proteins were solubilized in sample buffer
containing 0.0625 mM Tris-HCl, pH 6.8, 2.3% [w/v] SDS, 10%
[v/v] glycerol, 5% [v/v] b-mercaptoethanol, 0.001% [w/v]
bromophenol blue. Equal amounts (50 mg) of each sample were
electrophoresed on 7.5–10% sodium dodecyl sulfate – polyacryl-
amide gel electrophoresis (SDS-PAGE) using the system of
Laemmli [28] and transferred to Hybond-P membranes according
to the method of Towbin et al. [29].
Table 1. Body composition, basal plasma glucose andendocrine variables.
Men (n = 34) Women (n = 33)
Mean SD Mean SD
Age (years) 27 6 7 27 6 7
Height (cm) 176.5 6 5.8 * 165.3 6 6.3
Body mass (kg) 76.2 6 11.5 * 60.2 6 8.4
BMI (kg.m22) 24.5 6 3.7 * 22.0 6 2.3
% body fat 18.4 6 7.4 * 28.1 6 7.1
Lean body mass (kg) 58.6 6 5.4 * 40.6 6 3.5
Fat mass (kg) 14.7 6 7.9 * 17.4 6 6.7
Trunk fat mass (kg) 6.9 6 4.8 * 7.0 6 4.5
% fat in trunk 42.8 6 9.4 * 37.6 6 9.0
Glucose (mmol.L21) 4.6 6 0.4 * 4.4 6 0.5
Insulin (pmol.L21) 59.3 6 58.3 53.4 6 24.9
HOMA 1.8 6 2.0 1.5 6 0.7
Leptin (ng.mL21) 4.5 6 4.0 * 15.3 6 8.2
Soluble leptin receptor (ng.mL21) 25.5 6 7.8 * 30.7 6 10.0
Total testosterone (ng.mL21) 7.5 6 3.8 * 1.0 6 0.4
Free testosterone (pg.mL21) 18.0 6 5.7 * 3.7 6 2.1
17b-estradiol 16.0 6 14.4 * 76.9 6 71.0 a
* P,0.05 compared to women. a (n = 28).doi:10.1371/journal.pone.0003466.t001
Gender and Leptin Receptors
PLoS ONE | www.plosone.org 2 October 2008 | Volume 3 | Issue 10 | e3466
For immunoblotting, membranes were pre-incubated with 5%
blotting grade blocker non-fat dry milk (Bio-Rad Laboratories,
Hercules, CA, USA) in Tris-buffered saline (TBS) with 0.1%
Tween 20 (blotto blocking buffer) for 1 h at room temperature
(20–22uC). To detect the leptin receptor isoforms (OB-Rs),
membranes were incubated with a rabbit polyclonal specific
anti-human OB-R (long form) antibody.
To detect SOCS3 protein expression membranes were
incubated with a rabbit polyclonal specific anti-human SOCS3
antibody. To control for differences in loading and transfer
efficiency across membranes, an antibody directed against alpha-
tubulin was used to hybridize on the same samples. Membrane
incubations with polyclonal rabbit anti-OB-R (diluted 1:2.000 in
blotto blocking buffer) and with polyclonal rabbit anti-SOCS3
(diluted 1:500 in blotto blocking buffer) were performed over night
at 4uC. Membrane incubations with monoclonal mouse anti-
alpha-tubulin (diluted 1:70,000 in blotto blocking buffer) were
performed for 1 h at room temperature.
As control for adipose tissue protein presence in muscular tissue,
a polyclonal rabbit anti-perilipin A antibody was used [30]. To
explore the expression of this protein in human skeletal muscle and
subcutaneous adipose tissue, membranes were blocked with 4%
Bovine Serum Albumin (Sigma, Madrid, Spain) in TBS with 0.1%
Tween 20 (BSA blocking buffer) for 1 h at room temperature.
Membrane incubations with polyclonal rabbit anti-perilipin A
antibody (diluted 1:1,500 in BSA blocking buffer) were performed
for 1 h at room temperature. Antibody-specific labeling was
revealed by incubation with a HRP-conjugated goat anti-rabbit
antibody (1:20,000) or a HRP-conjugated donkey anti-mouse
(1:10,000) antibody both diluted in blotto blocking buffer and
visualized with the ECL chemiluminescence kit (Amersham
Biosciences). Specific bands were visualized with the ECL
chemiluminiscence kit, visualized with the ChemiDoc XRS system
(Bio-Rad Laboratories) and analyzed with the image analysis
program Quantity one� (Bio-Rad laboratories). Data are reported
as band intensity of immunostaining values (arbitrary units)
obtained for OB-R, Perilipin or SOCS3 relative to those obtained
for alpha-tubulin. Alpha-tubulin content in the male and female
muscle biopsies was similar (6.5460.44 and 5.4460.42 arbitrary
units of immunostaining band density, respectively, P.0.05).
Glucose and insulin measurementsSerum glucose was measured by the hexokinase method using
Gluco-quant reagents (Roche/Hitachi, 11876899216, Indianapolis,
USA). Serum insulin was measured by an electrochemiluminiscence
immunoassay (ECLIA) intended for use on Modular Analytics
analyzer E170 using Insulin kit reagents (Roche/Hitachi, Indiana-
polis, USA). In a first incubation, insulin from 20 ml serum sample, a
biotinylated monoclonal insulin-specific antibody and a monoclonal
insulin-specific antibody labeled with a ruthenium complex form a
sandwich complex. After addition of streptavidin-coated micropar-
ticles, the complex becomes bound to the solid phase via interaction
of biotin and streptavidin. The reaction mixture is aspirated into the
measuring cell where the microparticles are magnetically captured
onto the surface of the electrode. Unbound substances are then
removed by washing. Application of a voltage to the electrode then
induces chemiluminescent emission which is measured by a
photomultiplier. Results are determined via a calibration curve.
Insulin sensitivity was 0.20 mU/ml.
Assessment of insulin resistanceIn each subject, the degree of insulin resistance was estimated at
the baseline by the Homeostasis model assessment (HOMA)
according to the method described by Matthews et al. [31].
Leptin AssaysSerum leptin were determined by Enzyme-Linked Immunosor-
bent Assay (ELISA) (ELx800 Universal Microplate Reader,
Bioteck Instruments Inc, Vermont, USA), using reagent kits from
Linco Research (#EZHL-80SK, Linco ResearchSt. Charles,
Missouri, USA) and following the manufacturer’s instructions.
The sensitivity of the total leptin assays was 0.05 ng/mL. The
intra-assay coefficient variation was 3.8% and the inter-assay
coefficient of variation was 4.4%.
Soluble leptin receptor (sOB-R) AssaysSerum OB-Rs were determined by Enzyme-Linked Immunosor-
bent Assay (ELISA) (ELx800 Universal Microplate Reader, Bioteck
Instruments Inc, Vermont, USA), using reagent kits from R&D
Systems (#DOBR00, R&D, Minneapolis, MN, USA) and following
the manufacturer’s instructions. The sensitivity of the sOB-R assays
was 0.057 ng/mL. The intra-assay coefficient variation was 4.4%
and the inter-assay coefficient of variation was 6.8%.
Total and Free Testosterone AssaysSerum free and total testosterone were determined by Enzyme-
Linked Immunosorbent Assay (ELISA) (ELx800 Universal Micro-
plate Reader, Bioteck Instruments Inc, Vermont, USA), using
reagent kits from IBL (#DB52181 for free testosterone and
#RE52151 for total testosterone, IBL, Hamburg, Germany) and
following the manufacturer’s instructions. The sensitivity of the
free testosterone and total testosterone assays was 0.17 pg/mL and
0.08 ng/mL, respectively. The intra-assay coefficient variation was
6.1% and 3.6%, for free and total testosterone respectively. The
inter-assay coefficient of variation for free and total testosterone
was 7.8% and 7.1%, respectively.
17b-Estradiol Assay17b-estradiol was measured by a competitive electrochemilu-
miniscence immunoassay (ECLIA) intended for use on Modular
Analytics analyzer E170 using E2 reagents (Roche/Hitachi,
03000079122, Indianapolis, USA). Briefly, by incubating 35 ml
of serum sample with an estradiol-specific biotinylated antibody,
an immunocomplex is formed, the amount of which is dependent
upon the analyte concentration in the sample. After addition of
streptavidin-coated microparticles and an estradiol derivative
labeled with a ruthenium complex, the final antibody-hapten
complex was bound to a solid phase via a biotin-streptavidin
interaction. After remove the unbound substances, application of a
voltage induces chemiluminiscent emission which is measured by a
photomultiplier. Results were determined via a calibration curve
being the analytical sensitivity 18.4 pmol/L.
Statistical analysisVariables were checked for normal distribution by using a
Kolmogorov-Smirnov test with the Lilliefors correction. When
necessary, the analysis was done on logarithmically transformed
data. Gender differences were determined with ANOVA. To
determine if there was a gender difference in 128 KDa OBR isoform
content in the muscle biopsies we used ANCOVA with perilipin A as
a covariate. The relationship between variables was determined using
linear regression analysis. Values are reported as the mean6standard
deviation. P#0.05 was considered significant. Statistical analysis was
performed using SPSS v.8.0 for Windows (SPSS Inc., Chicago, IL).
Results
Body composition, anthropometrics and hormonal data are
reported in Table 1. Both genders were comparable in age, but
Gender and Leptin Receptors
PLoS ONE | www.plosone.org 3 October 2008 | Volume 3 | Issue 10 | e3466
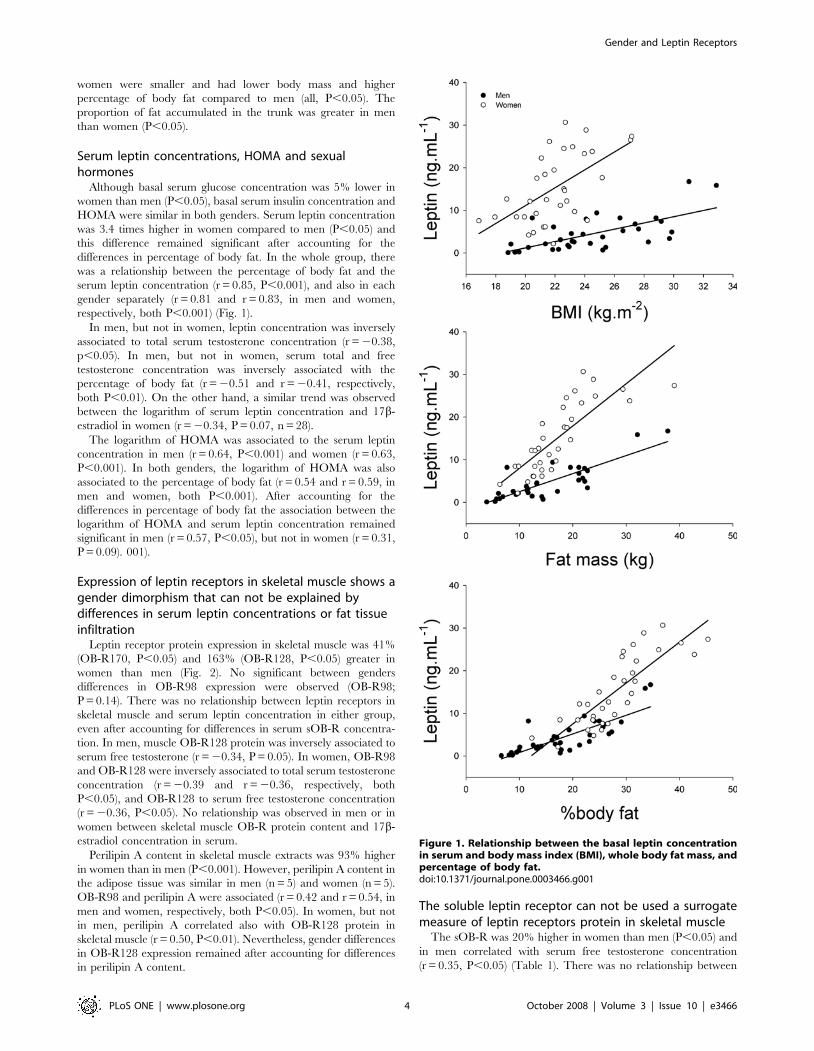
women were smaller and had lower body mass and higher
percentage of body fat compared to men (all, P,0.05). The
proportion of fat accumulated in the trunk was greater in men
than women (P,0.05).
Serum leptin concentrations, HOMA and sexualhormones
Although basal serum glucose concentration was 5% lower in
women than men (P,0.05), basal serum insulin concentration and
HOMA were similar in both genders. Serum leptin concentration
was 3.4 times higher in women compared to men (P,0.05) and
this difference remained significant after accounting for the
differences in percentage of body fat. In the whole group, there
was a relationship between the percentage of body fat and the
serum leptin concentration (r = 0.85, P,0.001), and also in each
gender separately (r = 0.81 and r = 0.83, in men and women,
respectively, both P,0.001) (Fig. 1).
In men, but not in women, leptin concentration was inversely
associated to total serum testosterone concentration (r = 20.38,
p,0.05). In men, but not in women, serum total and free
testosterone concentration was inversely associated with the
percentage of body fat (r = 20.51 and r = 20.41, respectively,
both P,0.01). On the other hand, a similar trend was observed
between the logarithm of serum leptin concentration and 17b-
estradiol in women (r = 20.34, P = 0.07, n = 28).
The logarithm of HOMA was associated to the serum leptin
concentration in men (r = 0.64, P,0.001) and women (r = 0.63,
P,0.001). In both genders, the logarithm of HOMA was also
associated to the percentage of body fat (r = 0.54 and r = 0.59, in
men and women, both P,0.001). After accounting for the
differences in percentage of body fat the association between the
logarithm of HOMA and serum leptin concentration remained
significant in men (r = 0.57, P,0.05), but not in women (r = 0.31,
P = 0.09). 001).
Expression of leptin receptors in skeletal muscle shows agender dimorphism that can not be explained bydifferences in serum leptin concentrations or fat tissueinfiltration
Leptin receptor protein expression in skeletal muscle was 41%
(OB-R170, P,0.05) and 163% (OB-R128, P,0.05) greater in
women than men (Fig. 2). No significant between genders
differences in OB-R98 expression were observed (OB-R98;
P = 0.14). There was no relationship between leptin receptors in
skeletal muscle and serum leptin concentration in either group,
even after accounting for differences in serum sOB-R concentra-
tion. In men, muscle OB-R128 protein was inversely associated to
serum free testosterone (r = 20.34, P = 0.05). In women, OB-R98
and OB-R128 were inversely associated to total serum testosterone
concentration (r = 20.39 and r = 20.36, respectively, both
P,0.05), and OB-R128 to serum free testosterone concentration
(r = 20.36, P,0.05). No relationship was observed in men or in
women between skeletal muscle OB-R protein content and 17b-
estradiol concentration in serum.
Perilipin A content in skeletal muscle extracts was 93% higher
in women than in men (P,0.001). However, perilipin A content in
the adipose tissue was similar in men (n = 5) and women (n = 5).
OB-R98 and perilipin A were associated (r = 0.42 and r = 0.54, in
men and women, respectively, both P,0.05). In women, but not
in men, perilipin A correlated also with OB-R128 protein in
skeletal muscle (r = 0.50, P,0.01). Nevertheless, gender differences
in OB-R128 expression remained after accounting for differences
in perilipin A content.
The soluble leptin receptor can not be used a surrogatemeasure of leptin receptors protein in skeletal muscle
The sOB-R was 20% higher in women than men (P,0.05) and
in men correlated with serum free testosterone concentration
(r = 0.35, P,0.05) (Table 1). There was no relationship between
Figure 1. Relationship between the basal leptin concentrationin serum and body mass index (BMI), whole body fat mass, andpercentage of body fat.doi:10.1371/journal.pone.0003466.g001
Gender and Leptin Receptors
PLoS ONE | www.plosone.org 4 October 2008 | Volume 3 | Issue 10 | e3466

sOB-R concentration in serum and OB-R isoforms in skeletal
muscle. There was no relationship between HOMA and muscle
leptin receptors or sOB-R.
SOCS3 protein content in skeletal muscle is similar inhealthy men and women and is not related to serumleptin concentration
SOCS3 protein expression was similar in men and women,
despite the fact that women had about 4-folds higher leptin
concentration than men (Fig. 3). Even when we took the seven
men with the lowest leptin concentration and compared them with
the seven women with the highest leptin concentration, SOCS3
expression was comparable in both groups, despite 40-folds higher
leptin concentration in women than men (Fig. 4). In women, there
was an inverse association between the logarithm of free
testosterone and SCOS3 protein content in skeletal muscle
(r = 20.46, P,0.05).
Discussion
In this study we provide further evidence for the presence of the
long (Ob-Rb) and short isoforms of leptin receptor protein in
human skeletal muscle [16]. Immunoblot analysis detected several
immunoreactive proteins with molecular weight of 98, 128 and
170 kDa. The most prominent 128 kDa band has a molecular
weight similar to OB-Rb, based on its amino acid composition
[32]. The smaller 98 kDa protein is likely to correspond to one of
the short leptin receptor isoforms [4]. The 170 kDa has a
molecular weight which corresponds well with the glycosylated
form of OB-Rb [33].
Based on the experimental evidences showing: 1) that in
conditions with chronically elevated leptin concentration, such as
obesity and pregnancy the expression of OB-Rb mRNA is reduced
in the hypothalamus [34], but also in peripheral tissues such as the
liver [34]; 2) that acute leptin administration causes an acute
reduction in the expression of leptin receptors in cell lines [34]; 3)
that prolonged fasting in humans increases OB-R mRNA in
peripheral mononuclear cell [35]; and 4) that administration of
human recombinant leptin in fasting humans blunts the increase in
OB-R in mononuclear cells [35], we hypothesized that women
compared to men will have reduced protein expression of OBR in
skeletal muscle. In contrast with our hypothesis, this study shows
that the 170 and 128 KDa leptin receptors isoforms are more
abundant in female than male skeletal muscle. We have also
observed that the muscle biopsies obtained from women had a
greater amount of perilipin A than those from men. Inasmuch as
Figure 2. Leptin receptor (OB-R) isoform protein expression inmale and female human skeletal muscle. Total Protein extractswere prepared from male and female muscle and OB-R, perilipin A andalpha-tubulin protein expression was analyzed by Western blot. A: arepresentative immunoblot assay after incubation with a polyclonalrabbit anti-OB-R antibody specifically raised against de long isoform ofthe leptin receptor. B: a representative western blot after incubationwith a polyclonal rabbit anti-perilipin A antibody in the same samplesused in A. C: a representative immunoblot analysis after incubation withthe monoclonal mouse anti-alpha-tubulin antibody in the samesamples used in A. D: densitometric immunosignal values (arbitraryunits of band densities) of OB-R bands relative to those obtained foralpha-tubulin.doi:10.1371/journal.pone.0003466.g002
Figure 3. Suppressor of cytokine signaling 3 (SOCS3) proteincontent in muscle biopsies obtained from the musculus vastuslateralis in men and women. A.U.: arbitrary units.doi:10.1371/journal.pone.0003466.g003
Gender and Leptin Receptors
PLoS ONE | www.plosone.org 5 October 2008 | Volume 3 | Issue 10 | e3466

perilipin A is a protein present in adipocytes and absent in skeletal
muscle fibers, greater perilipin A content in women’s skeletal
muscle biopsies strongly suggest that women have more intermus-
cular adipose tissue than men [36]. These findings only apply to
healthy young humans and different results may be possible in
patients with obesity or metabolic diseases.
Greater intermuscular adipose tissue could explain part of the
gender difference in OB-R128 protein content. Nevertheless, after
accounting for differences in perilipin content, OB-R128 protein
content was still 2.3 times higher in women than men. On the
other hand, adipose tissue contamination in the skeletal muscle
biopsies does not explain the gender differences in OB-R170, since
this isoform was not detected in subcutaneous adipose tissue.
It has been postulated that the sexual dimorphism in leptin
levels reflects reduced leptin sensitivity in women [37] however,
our findings are more compatible with increased leptin sensitivity
in the women’s skeletal muscle, unless the intracellular signaling
pathways are more inhibited in women than men.
Regulation of leptin receptor expressionIn agreement with previous studies an inverse association was
observed between leptin concentration and serum testosterone in
men [38], likely caused by an inhibitory effect of leptin on Leydig
cells steroidogenesis [39] and perhaps in testosterone biosynthesis
[40]. In turn, androgens reduce leptin gene transcription in rat
adipocytes [41] and testosterone administration to young men
reduces serum leptin [42]. This effect is likely due a direct
inhibition of leptin production in adipocytes [43], likely combined
an increased leptin clearance rate and shortened plasma leptin
half-life [44].
Although animal studies have shown that 17b-estradiol
administration to ovariectomized rats increases plasma leptin
levels [45] by stimulating leptin production in the adipocytes [41],
leptin also inhibits steroidogenesis in granulosa cells of the ovary
[46], what could explain our findings in regard with the negative
relationship between 17b-estradiol and leptin in women. In
humans, leptin changes in the same direction as 17b-estradiol
during the menstrual cycle [47,48]. Ovarian stimulation with
human FSH (225 IU daily) during an in vitro fertilization program
led to a concomitant rise of plasma leptin coupled to the elevation
of plasma 17b-estradiol [47]. However, postmenopausal women
have higher plasma leptin levels than weight-matched men [48]
and the same as premenopausal women after accounting for
differences in fat mass [17]. The latter implies that at the most
17b-estradiol and androgen could only explain a small part of the
sexual dimorphism in plasma leptin concentrations [17].
Although no relationship was observed in the present study
between 17b-estradiol concentration and skeletal muscles leptin
receptors we can not rule out estrogens as contributors to the
sexual dimorphism in skeletal muscle leptin receptors in humans,
mainly because a punctual isolated determination of basal plasma
concentration of 17b-estradiol give just a rough estimation of the
estrogenic action on the muscles at mid and long term, particularly
fertile women [47,48]. In fact, a recent study has shown that in
ovariectomized rats 17b-estradiol increases OB-Rb protein in
skeletal muscle [22]. Nevertheless our findings indicate that small
differences in 17b-estradiol concentration do not account for
individual differences in muscle leptin receptors in women or men.
Increased skeletal muscle leptin receptors in womenThe sOB-R, a circulating soluble form of the leptin receptor is
the main leptin binding protein in blood and determines the free
fraction of circulating leptin [35,49,50]. Administration of leptin to
humans has been reported to elicit small reciprocal changes in
sOB-R plasma concentration [35]. The latter agrees with our
observation of slightly lower serum soluble receptor leptin
concentration in women than men.
Our study indicates that female skeletal muscle has the potential
to respond more to leptin stimulation due to the remarkably
greater abundance of leptin receptors, particularly of the two main
isoforms involved in intracellular leptin signaling (OB-Rb and OB-
Ra) [51]. This could explain why women have an increased
capacity to oxidize fatty acids during prolonged exercise than men
[52,53].
It remains unknown which is the mechanism that determines
this sexual dimorphism in skeletal muscle leptin receptors. Our
study indicates that leptin itself does not explain the sexual
dimorphism in skeletal muscle OB-R expression, since despite a
broad spectrum of leptin concentration is both genders, there was
no correlation between serum leptin concentration and the
abundance of leptin receptors in skeletal muscle, even after
accounting for the differences in serum sOB-R concentration.
Nevertheless, our study provides indirect evidence supporting a
role of serum free testosterone concentration which could explain
12–13% of the variability in skeletal muscle content of the
128 KDa leptin receptor isoform in both genders.
Although leptin and insulin share some intracellular signaling
pathways, our study indicates that insulin (at basal concentration)
does not appear to play a role in the regulation of leptin receptor
expression in skeletal muscles. In agreement, Liu et al. 2007 [20]
reported no significant relationship between OB-Ra or OB-Rb
gene expression in the hypothalamus and liver and serum insulin
concentrations in obese rats.
Soluble leptin receptor does not reflect the amount ofleptin receptors in skeletal muscle
The sOB-R could originate from alternative splicing of the
leptin receptor or from full-length functional leptin receptors
released by enzymatic cleavage, most likely in the liver [5]. In the
latter case, it has been hypothesized that serum sOB-R
concentration could reflect the amount of leptin receptor
Figure 4. Suppressor of cytokine signaling 3 (SOCS3) proteincontent in muscle biopsies obtained from the musculus vastuslateralis in men the seven men with the lowest serum leptinconcentrations and the seven women with the highest serumleptin concentrations. A.U.: arbitrary units.doi:10.1371/journal.pone.0003466.g004
Gender and Leptin Receptors
PLoS ONE | www.plosone.org 6 October 2008 | Volume 3 | Issue 10 | e3466
expressed in tissues [54]. Our study, however, shows that sOB-R is
not related to the expression of OB-R isoforms in skeletal muscles.
SOCS3 protein content in skeletal musclesIt has been reported that SOCS-3 mRNA levels are increased in
the skeletal muscle of type 2 diabetic patients compared with
control subjects and correlates with reduced insulin-stimulated
glucose uptake [55]. Skeletal muscle SOCS-3 mRNA is also
increased in obese mice [56]. The study of SOCS3 mRNA levels
in subcutaneous adipose tissue of humans has yielded contradict-
ing results. It has been reported to be increased in a mixed sample
(9 men and 7 women) [55] and to be reduced in obese women
[57]. Thus, it has been suggested that this contradicting results
could have been cause by gender differences in the expression of
SOCS3 in the obese human [57]. Here we report for the first time
SOCS3 protein levels in human skeletal muscle in both genders. In
contrast with our hypothesis, SOCS3 protein is not up-regulated
in women compared to men, implying that if women have some
degree of leptin resistance in their skeletal muscles the mechanisms
is not related to SOCS3 up-regulation.
In summary, this study shows that in healthy young humans
there is a sexual dimorphism in the expression of leptin receptors
in human skeletal muscles, which can not be explained by
differences in circulating leptin or soluble leptin receptor, or
differences in intermuscular adipose tissue. A small part of the
sexual dimorphism could be explained by an inverse relationship
between serum free testosterone concentration and the 128 KDa
isoform of the leptin receptor. No relationship was observed
between estradiol concentration and leptin receptors in skeletal
muscle. The circulating form of the leptin receptor can not be used
as a surrogate measure of the amount of leptin receptors expressed
in skeletal muscles. Despite the fact that the female skeletal muscle
is exposed to very high leptin concentrations, SOCS3 protein
expression was not up-regulated, indicating that if women have
some degree of leptin resistance in their skeletal muscles the
mechanism should be other than SOCS3 up-regulation.
Acknowledgments
The authors wish to thank Dr. Andrew S. Greenberg for kindly providing
the anti-perilipin A antibody. Special thanks are given to Jose Navarro de
Tuero for his excellent technical assistance. The specialized advice from
Tony Webster in editing the English version of the manuscript is also
acknowledged.
Author Contributions
Conceived and designed the experiments: BG TF AS CD JALC.
Performed the experiments: BG TF SDG AGG HO AS JALC. Analyzed
the data: BG TF SDG AGG HO AS JALC. Contributed reagents/
materials/analysis tools: BG TF SDG AGG HO AS JPG CD JALC. Wrote
the paper: BG TF AS CD JALC.
References
1. Zhang F, Chen Y, Heiman M, Dimarchi R (2005) Leptin: structure, functionand biology. Vitam Horm 71: 345–372.
2. Zhang Y, Proenca R, Maffei M, Barone M, Leopold L, et al. (1994) Positional
cloning of the mouse obese gene and its human homologue. Nature 372:425–432.
3. Steinberg GR, Parolin ML, Heigenhauser GJ, Dyck DJ (2002) Leptin increases
FA oxidation in lean but not obese human skeletal muscle: evidence of
peripheral leptin resistance. Am J Physiol Endocrinol Metab 283: E187–192.
4. Tartaglia LA, Dembski M, Weng X, Deng N, Culpepper J, et al. (1995)Identification and expression cloning of a leptin receptor, OB-R. Cell 83:
1263–1271.
5. Cohen P, Yang G, Yu X, Soukas AA, Wolfish CS, et al. (2005) Induction ofleptin receptor expression in the liver by leptin and food deprivation. J Biol
Chem 280: 10034–10039.
6. Ge H, Huang L, Pourbahrami T, Li C (2002) Generation of soluble leptin
receptor by ectodomain shedding of membrane-spanning receptors in vitro andin vivo. J Biol Chem 277: 45898–45903.
7. Tartaglia LA (1997) The leptin receptor. J Biol Chem 272: 6093–6096.
8. Myers MG, Cowley MA, Munzberg H (2007) Mechanisms of Leptin Action and
Leptin Resistance. Annu Rev Physiol.
9. Lee GH, Proenca R, Montez JM, Carroll KM, Darvishzadeh JG, et al. (1996)
Abnormal splicing of the leptin receptor in diabetic mice. Nature 379: 632–635.
10. Ahima RS, Flier JS (2000) Leptin. Annu Rev Physiol 62: 413–437.
11. Ramsay TG, Richards MP (2005) Leptin and leptin receptor expression inskeletal muscle and adipose tissue in response to in vivo porcine somatotropin
treatment. J Anim Sci 83: 2501–2508.
12. Margetic S, Gazzola C, Pegg GG, Hill RA (2002) Leptin: a review of its
peripheral actions and interactions. Int J Obes Relat Metab Disord 26:1407–1433.
13. Cornish J, Callon KE, Bava U, Lin C, Naot D, et al. (2002) Leptin directly
regulates bone cell function in vitro and reduces bone fragility in vivo.J Endocrinol 175: 405–415.
14. Bjorbaek C, Kahn BB (2004) Leptin signaling in the central nervous system and
the periphery. Recent Prog Horm Res 59: 305–331.
15. Muoio DM, Lynis Dohm G (2002) Peripheral metabolic actions of leptin. Best
Pract Res Clin Endocrinol Metab 16: 653–666.
16. Guerra B, Santana A, Fuentes T, Delgado-Guerra S, Cabrera-Socorro A, et al.(2007) Leptin receptors in human skeletal muscle. J Appl Physiol 102:
1786–1792.
17. Saad MF, Damani S, Gingerich RL, Riad-Gabriel MG, Khan A, et al. (1997)Sexual dimorphism in plasma leptin concentration. J Clin Endocrinol Metab 82:
579–584.
18. Wong SL, DePaoli AM, Lee JH, Mantzoros CS (2004) Leptin hormonal kinetics
in the fed state: effects of adiposity, age, and gender on endogenous leptinproduction and clearance rates. J Clin Endocrinol Metab 89: 2672–2677.
19. Sinha MK, Opentanova I, Ohannesian JP, Kolaczynski JW, Heiman ML, et al.
(1996) Evidence of free and bound leptin in human circulation. Studies in lean
and obese subjects and during short-term fasting. J Clin Invest 98: 1277–1282.
20. Liu ZJ, Bian J, Liu J, Endoh A (2007) Obesity reduced the gene expressions ofleptin receptors in hypothalamus and liver. Horm Metab Res 39: 489–494.
21. Ishikawa T, Fujioka H, Ishimura T, Takenaka A, Fujisawa M (2007) Expression
of leptin and leptin receptor in the testis of fertile and infertile patients.Andrologia 39: 22–27.
22. Alonso A, Fernandez R, Moreno M, Ordonez P, Diaz F, et al. (2007) Leptin andits receptor are controlled by 17beta-estradiol in peripheral tissues of
ovariectomized rats. Exp Biol Med (Maywood) 232: 542–549.
23. Bjorbaek C, Lavery HJ, Bates SH, Olson RK, Davis SM, et al. (2000) SOCS3
mediates feedback inhibition of the leptin receptor via Tyr985. J Biol Chem 275:40649–40657.
24. Steinberg GR, McAinch AJ, Chen MB, O’Brien PE, Dixon JB, et al. (2006) The
suppressor of cytokine signaling 3 inhibits leptin activation of AMP-kinase incultured skeletal muscle of obese humans. J Clin Endocrinol Metab 91:
3592–3597.
25. Ara I, Perez-Gomez J, Vicente-Rodriguez G, Chavarren J, Dorado C, Calbet JA
(2006) Serum free testosterone, leptin and soluble leptin receptor changes in a 6-week strength-training programme. Br J Nutr 96: 1053–1059.
26. Perez-Gomez J, Rodriguez GV, Ara I, Olmedillas H, Chavarren J, et al. (2008)
Role of muscle mass on sprint performance: gender differences? Eur J Appl
Physiol 102: 685–694.
27. Lundby C, Sander M, van Hall G, Saltin B, Calbet JA (2006) Determinants ofmaximal exercise and muscle oxygen extraction in acclimatizing lowlanders and
in high altitude natives. J Physiol.
28. Laemmli UK (1970) Cleavage of structural proteins during the assembly of the
head of bacteriophage T4. Nature 227: 680–685.
29. Towbin H, Staehelin T, Gordon J (1979) Electrophoretic transfer of proteinsfrom polyacrylamide gels to nitrocellulose sheets: procedure and some
applications. Proc Natl Acad Sci U S A 76: 4350–4354.
30. Greenberg AS, Egan JJ, Wek SA, Garty NB, Blanchette-Mackie EJ, et al. (1991)
Perilipin, a major hormonally regulated adipocyte-specific phosphoproteinassociated with the periphery of lipid storage droplets. J Biol Chem 266:
11341–11346.
31. Matthews DR, Hosker JP, Rudenski AS, Naylor BA, Treacher DF, et al. (1985)
Homeostasis model assessment: insulin resistance and beta-cell function fromfasting plasma glucose and insulin concentrations in man. Diabetologia 28:
412–419.
32. Wang MY, Koyama K, Shimabukuro M, Newgard CB, Unger RH (1998) OB-
Rb gene transfer to leptin-resistant islets reverses diabetogenic phenotype. ProcNatl Acad Sci U S A 95: 714–718.
33. Kamikubo Y, Dellas C, Loskutoff DJ, Quigley JP, Ruggeri ZM (2008)
Contribution of leptin receptor N-linked glycans to leptin binding. Biochem J410: 595–604.
34. Hikita M, Bujo H, Hirayama S, Takahashi K, Morisaki N, et al. (2000)Differential regulation of leptin receptor expression by insulin and leptin in
neuroblastoma cells. Biochem Biophys Res Commun 271: 703–709.
35. Chan JL, Bluher S, Yiannakouris N, Suchard MA, Kratzsch J, et al. (2002)Regulation of circulating soluble leptin receptor levels by gender, adiposity, sex
Gender and Leptin Receptors
PLoS ONE | www.plosone.org 7 October 2008 | Volume 3 | Issue 10 | e3466

steroids, and leptin: observational and interventional studies in humans.
Diabetes 51: 2105–2112.
36. Gallagher D, Kuznia P, Heshka S, Albu J, Heymsfield SB, et al. (2005) Adipose
tissue in muscle: a novel depot similar in size to visceral adipose tissue. Am J Clin
Nutr 81: 903–910.
37. Schwartz MW, Peskind E, Raskind M, Boyko EJ, Porte D Jr (1996)
Cerebrospinal fluid leptin levels: relationship to plasma levels and to adiposity
in humans. Nat Med 2: 589–593.
38. Isidori AM, Caprio M, Strollo F, Moretti C, Frajese G, et al. (1999) Leptin and
androgens in male obesity: evidence for leptin contribution to reduced androgen
levels. J Clin Endocrinol Metab 84: 3673–3680.
39. Tena-Sempere M, Manna PR, Zhang FP, Pinilla L, Gonzalez LC, et al. (2001)
Molecular mechanisms of leptin action in adult rat testis: potential targets for
leptin-induced inhibition of steroidogenesis and pattern of leptin receptor
messenger ribonucleic acid expression. J Endocrinol 170: 413–423.
40. Caprio M, Isidori AM, Carta AR, Moretti C, Dufau ML, et al. (1999)
Expression of functional leptin receptors in rodent Leydig cells. Endocrinology
140: 4939–4947.
41. Machinal F, Dieudonne MN, Leneveu MC, Pecquery R, Giudicelli Y (1999) In
vivo and in vitro ob gene expression and leptin secretion in rat adipocytes:
evidence for a regional specific regulation by sex steroid hormones.
Endocrinology 140: 1567–1574.
42. Luukkaa V, Pesonen U, Huhtaniemi I, Lehtonen A, Tilvis R, et al. (1998)
Inverse correlation between serum testosterone and leptin in men. J Clin
Endocrinol Metab 83: 3243–3246.
43. Wabitsch M, Blum WF, Muche R, Braun M, Hube F, et al. (1997) Contribution
of androgens to the gender difference in leptin production in obese children and
adolescents. J Clin Invest 100: 808–813.
44. Castrogiovanni D, Perello M, Gaillard RC, Spinedi E (2003) Modulatory role of
testosterone in plasma leptin turnover in rats. Endocrine 22: 203–210.
45. Brann DW, De Sevilla L, Zamorano PL, Mahesh VB (1999) Regulation of leptin
gene expression and secretion by steroid hormones. Steroids 64: 659–663.
46. Zachow RJ, Weitsman SR, Magoffin DA (1999) Leptin impairs the synergistic
stimulation by transforming growth factor-beta of follicle-stimulating hormone-
dependent aromatase activity and messenger ribonucleic acid expression in rat
ovarian granulosa cells. Biol Reprod 61: 1104–1109.47. Mannucci E, Ognibene A, Becorpi A, Cremasco F, Pellegrini S, et al. (1998)
Relationship between leptin and oestrogens in healthy women. Eur J Endocrinol
139: 198–201.48. Shimizu H, Shimomura Y, Nakanishi Y, Futawatari T, Ohtani K, et al. (1997)
Estrogen increases in vivo leptin production in rats and human subjects.J Endocrinol 154: 285–292.
49. Stein K, Vasquez-Garibay E, Kratzsch J, Romero-Velarde E, Jahreis G (2006)
Influence of nutritional recovery on the leptin axis in severely malnourishedchildren. J Clin Endocrinol Metab 91: 1021–1026.
50. Lammert A, Kiess W, Bottner A, Glasow A, Kratzsch J (2001) Soluble leptinreceptor represents the main leptin binding activity in human blood. Biochem
Biophys Res Commun 283: 982–988.51. Fruhbeck G (2006) Intracellular signalling pathways activated by leptin.
Biochem J 393: 7–20.
52. Henderson GC, Fattor JA, Horning MA, Faghihnia N, Johnson ML, et al.(2007) Lipolysis and fatty acid metabolism in men and women during the
postexercise recovery period. J Physiol 584: 963–981.53. Tarnopolsky LJ, MacDougall JD, Atkinson SA, Tarnopolsky MA, Sutton JR
(1990) Gender differences in substrate for endurance exercise. J Appl Physiol 68:
302–308.54. van Dielen FM, van ’t Veer C, Buurman WA, Greve JW (2002) Leptin and
soluble leptin receptor levels in obese and weight-losing individuals. J ClinEndocrinol Metab 87: 1708–1716.
55. Rieusset J, Bouzakri K, Chevillotte E, Ricard N, Jacquet D, et al. (2004)Suppressor of cytokine signaling 3 expression and insulin resistance in skeletal
muscle of obese and type 2 diabetic patients. Diabetes 53: 2232–2241.
56. Emanuelli B, Peraldi P, Filloux C, Chavey C, Freidinger K, et al. (2001) SOCS-3inhibits insulin signaling and is up-regulated in response to tumor necrosis factor-
alpha in the adipose tissue of obese mice. J Biol Chem 276: 47944–47949.57. Seron K, Corset L, Vasseur F, Boutin P, Gomez-Ambrosi J, et al. (2006) Distinct
impaired regulation of SOCS3 and long and short isoforms of the leptin receptor
in visceral and subcutaneous fat of lean and obese women. Biochem Biophys ResCommun 348: 1232–1238.
Gender and Leptin Receptors
PLoS ONE | www.plosone.org 8 October 2008 | Volume 3 | Issue 10 | e3466
160 Exp Physiol 95.1 pp 160–171
Experimental Physiology – Research Paper
Leptin receptor 170kDa (OB-R170) protein expressionis reduced in obese human skeletal muscle: a potentialmechanism of leptin resistance
T. Fuentes1, I. Ara2,3, A. Guadalupe-Grau1, S. Larsen3, B. Stallknecht3, H. Olmedillas1, A. Santana1,4,5,J. W. Helge3, J. A. L. Calbet1 and B. Guerra1
1Department of Physical Education, University of Las Palmas de Gran Canaria, Campus Universitario de Tafira s/n,Las Palmas de Gran Canaria, 35017, Spain2Department of Physiatry and Nursing, University of Zaragoza, Spain3Center for Healthy Ageing, Department of Biomedical Sciences, Faculty of Health Sciences, University of Copenhagen, Copenhagen, Denmark4Genetic Unit, Childhood Hospital-Materno Infantil de Las Palmas, Avenida Marıtima, del Sur s/n, Las Palmas de Gran Canaria, 35016, Spain5Research Unit, Hospital de Gran Canaria Doctor Negrın, Bco Ballena s/n, Las Palmas de Gran Canaria, 35013, Spain
To examine whether obesity-associated leptin resistance could be due to down-regulation ofleptin receptors (OB-Rs) and/or up-regulation of suppressor of cytokine signalling 3 (SOCS3)and protein tyrosine phosphatase 1B (PTP1B) in skeletal muscle, which blunt janus kinase 2-dependent leptin signalling and signal transducer and activator of transcription 3 (STAT3)phosphorylation and reduce AMP-activated protein kinase (AMPK) and acetyl-coenzyme Acarboxylase (ACC) phosphorylation. Deltoid and vastus lateralis muscle biopsies were obtainedfrom 20 men: 10 non-obese control subjects (mean ± s.d. age, 31 ± 5 years; height, 184 ± 9 cm;weight, 91 ± 13 kg; and percentage body fat, 24.8 ± 5.8%) and 10 obese (age, 30 ± 7 years; height,184 ± 8 cm; weight, 115 ± 8 kg; and percentage body fat, 34.9 ± 5.1%). Skeletal muscle OB-R170(OB-R long isoform) protein expression was 28 and 25% lower (both P < 0.05) in arm and legmuscles, respectively, of obese men compared with control subjects. In normal-weight subjects,SOCS3 protein expression, and STAT3, AMPKα and ACCβ phosphorylation, were similar in thedeltoid and vastus lateralis muscles. In obese subjects, the deltoid muscle had a greater amountof leptin receptors than the vastus lateralis, whilst SOCS3 protein expression was increased andbasal STAT3, AMPKα and ACCβ phosphorylation levels were reduced in the vastus lateraliscompared with the deltoid muscle (all P < 0.05). In summary, skeletal muscle leptin receptorsand leptin signalling are reduced in obesity, particularly in the leg muscles.
(Received 12 June 2009; accepted after revision 24 August 2009; first published online 28 August 2009)Corresponding author J. A. L. Calbet: Departamento de Educacion Fısica, Campus Universitario de Tafira, 35017 LasPalmas de Gran Canaria, Canary Island, Spain. Email: [email protected]
Human obesity is characterized by increased leptinconcentration in plasma, as well as leptin (Steinberg et al.2002b; Bates & Myers, 2003; Anubhuti & Arora, 2008;Myers et al. 2008) and insulin resistance (Olefsky et al.1982). Insulin resistance has been associated with raisedplasma leptin concentrations independent of body fatmass (Sørensen et al. 1996). Leptin resistance in skeletalmuscles could be caused by a down-regulation and/ordesensitization of leptin receptors (OB−Rs), among othermechanisms.
Upon binding to the long form of its receptor (OB-Rb), leptin stimulates janus kinase 2 (JAK2), which
autophosphorylates, and phosphorylates several tyrosineresidues (Tyr) of OB-Rb (Bjørbæk & Kahn, 2004). Thesignal transducer and activator of transcription 3 (STAT3)binds to the phosphorylated Tyr1138 in OB-Rb, and thisinteraction is required for tyrosine phosphorylation andactivation of STAT3 by JAK2 (Banks et al. 2000; Bateset al. 2003). Phosphorylation of STAT3 on Tyr705, mediatedby Tyr1138, is required for leptin regulation of energybalance and body weight (Bates et al. 2003). Moreover,reduce Tyr705-STAT3 phosphorylation in the presenceof increased leptin concentrations is indicative of leptinresistance (Hosoi et al. 2008).
DOI: 10.1113/expphysiol.2009.049270 C© 2009 The Authors. Journal compilation C© 2010 The Physiological Society

Exp Physiol 95.1 pp 160–171 Leptin receptors in obese humans 161
Leptin promotes fatty acid (FA) oxidation in skeletalmuscle through activation of AMP-activated proteinkinase (AMPK) which, in turn, phosphorylates andinhibits acetyl-coenzyme A carboxylase (ACC), leadingto reduced malonyl-coenzyme A and increased FA fluxinto the mitochondria via carnitine palmitoyl transferase-1 (Ruderman et al. 1999). In men, skeletal muscle leptinresistance may be accompanied by decreased basal Thr172-AMPKα and Ser221-ACCβ phosphorylation (Steinberget al. 2002a; Bandyopadhyay et al. 2006). It remainsunknown whether the obesity-associated reduction inbasal Thr172-AMPKα and Ser221-ACCβ phosphorylationis general or is limited only to certain skeletal muscles.
The elevated leptin levels observed in obesity coulddown-regulate leptin receptors, since mRNA levels of thelong (OB-Rb) and short isoforms (OB-Ra) of the leptinreceptor are markedly reduced in the hypothalamus andliver of obese rats, which have enhanced plasma leptinconcentration (Liu et al. 2007). Leptin may also down-regulate leptin signalling in the target tissues by inducingthe protein suppressor of cytokine signalling 3 (SOCS3),which blunts JAK2/STAT3-dependent leptin signalling(Bjørbæk et al. 2000) and causes leptin resistance in theskeletal muscle (Steinberg et al. 2006c). Furthermore,overexpression of SOCS3 inhibits leptin activation ofAMPK and ACCβ phosphorylation in skeletal muscle cells(Steinberg et al. 2006a; Steinberg & Jorgensen, 2007).
Protein tyrosine phosphatase 1B (PTP1B) is alsoa negative regulator of leptin and insulin signalling(Dube & Tremblay, 2005) that may be increased inskeletal muscle by inflammation (Zabolotny et al. 2008).Protein tyrosine phosphatase 1B blunts leptin signallingby causing dephosphorylation of the leptin receptor-associated JAK2 (Dube & Tremblay, 2005).
We hypothesized that the high level of circulatingleptin observed in obese humans may lead to down-regulation of leptin receptor protein expression in skeletalmuscle, and increased SOCS3 and PTP1B protein levels,which may cause leptin resistance and reduced basallevels of Tyr705-STAT3 and Thr172-AMPKα/Ser221-ACCβ
phosphorylation.Therefore, the main aim of this study was to determine
whether there is a down-regulation of leptin receptorprotein expression in skeletal muscles of obese human andto investigate whether this down-regulation is related toserum leptin concentration. Another aim was to determinewhether the high circulating levels of leptin in obesesubjects are associated with increased SOCS3 and PTP1Bprotein expression and reduced Tyr705-STAT3, Thr172-AMPKα and Ser221-ACCβ basal phosphorylation levels inskeletal muscles of both the upper and lower extremities.The reason for studying arm and leg muscles is thatmetabolic differences between arm and leg muscles havebeen described in humans (Olsen et al. 2005). For example,Olsen et al. (2005) showed that glucose clearance during
an insulin clamp is higher in the arm than in the leg inhealthy control subjects and in type 2 diabetics.
Methods
Materials
The complete protease inhibitor cocktail was obtainedfrom Roche Diagnostics (Mannheim, Germany). Thepolyclonal rabbit anti-human leptin receptor antibodythat recognizes three isoforms of the human leptinreceptor present in skeletal muscle (Guerra et al. 2007)was obtained from Linco Research (St Charles, MO,USA). The polyclonal rabbit anti-perilipin A antibodywas kindly provided by Dr Andrew S. Greenberg (JeanMayer USDA Human Nutrition Research Center, Boston,MA, USA). The polyclonal rabbit anti-human SOCS3antibody was obtained from Santa Cruz Biotechnology(Santa Cruz, CA, USA). The monoclonal mouse anti-α-tubulin antibody was obtained from Biosigma (Madrid,Spain). The polyclonal rabbit anti-Tyr705-STAT3 and themonoclonal mouse anti-STAT3 antibodies were from CellSignaling Technology (Barcelona, Spain). The monoclonalmouse-anti-PTP1B was from Calbiochem (San Diego,CA, USA). The polyclonal rabbit anti-pThr172-AMPKα,anti-AMPKα and anti-acetyl-coenzyme A carboxylase(ACC) antibody were obtained from Cell SignalingTechnology (Barcelona, Spain). The polyclonal rabbit anti-phospho-acetyl-coenzyme A carboxylase (Ser79) antibodywas obtained from Upstate Biotechnology (Lake Placid,NY, USA). The secondary horseradish peroxidase (HRP)-conjugated goat anti-rabbit and donkey anti-mouseantibodies were from Jackson ImmunoReseach (WestGrove, PA, USA). The Hybond-P transfer membranes,Hyperfilm ECL and the ECL plus Western BlottingDetection System were from Amersham Biosciences (LittleChalfont, UK). The ChemiDoc XRS System and the imageanalysis software Quantity One C© were obtained from Bio-Rad Laboratories (Hemel Hempstead, UK).
Subjects
Twenty young male subjects participated in thisinvestigation. Body composition, basal serum glucoseand endocrine variables are shown in Table 1. Writteninformed consent was obtained from each subject afterthey received a full explanation about the nature and thepossible risks associated with the study procedures. Thestudy was approved by the Copenhagen Ethics Committee(KF 01 304792), and the experiments conformed to TheDeclaration of Helsinki of 1975.
General procedures
Subjects reported to the laboratory after an overnightfast on 3 days over a 3 week period, and the order
C© 2009 The Authors. Journal compilation C© 2010 The Physiological Society

162 T. Fuentes and others Exp Physiol 95.1 pp 160–171
of the experiments performed on the two last dayswas randomized. Before each of the experimental dayssubjects fasted overnight, and on the first experimentalday, after an initial 15 min rest, height and weight weremeasured, whereafter subjects underwent a standard120 min oral glucose tolerance test (OGTT), ingestinga solution of 75 g glucose dissolved in 300 ml of water.Blood samples were taken before and after 2 h formeasurement of plasma glucose concentrations (ABL,series 700; Radiometer, Copenhagen, Denmark). Bodycomposition was determined by dual-energy X-rayabsorptiometry scanning using a Lunar Prodigy Advancebone densitometer (Lunar Corporation, Madison, WI,USA). Finally, a graded incremental exercise protocolwas used to establish the maximal oxygen uptake(VO2max) on a normal bicycle ergometer (Ergometrics 800,Jaeger, Wurzburg, Germany). Before every test, a volumecalibration and a calibration of the gas analysers usinggases of known composition was performed.
On the second and the third day, a needle biopsy fromthe deltoid or the vastus lateralis muscle was obtainedusing Bergstrom’s technique with suction, as describedelsewhere (Lundby et al. 2006). The muscle specimen wascleaned to remove any visible blood, fat or connectivetissue. The muscle tissue was frozen within 15 s in liquidnitrogen, and stored at –80◦C for later analysis. On one ofthe days, venous blood was sampled from an antecubitalvein.
Analytical procedures (glucose, insulin and leptinmeasurements)
Blood was transferred into iced tubes containing 0.3 M
EDTA (10 μl ml−1 blood) and immediately centrifugedat 2480g at 4◦C for 10 min. A small fraction of theblood was transferred into tubes containing ethyleneglycol tetraacetic acid (15 μl (ml blood)−1), and thiswas later used to determine insulin concentrations. Theplasma was stored at −80◦C until analysis. Plasmaglucose was analysed using a conventional, commerciallyavailable assay on an automatic analyser (Hitachi, 612Automatic Analyzer, Roche, Switzerland). Plasma insulinwas determined using a radioimmunoassay kit (InsulinRIA100, Pharmacia, Uppsala, Sweden). Plasma leptin wasmeasured using a specific high-sensitive human ELISA kit(R&D Systems, MN, USA). The leptin assay had an intra-assay coefficient of variation of 3.2%.
Assessment of insulin resistance
In each subject, the degree of insulin resistance wasestimated by the homeostasis model assessment (HOMA).In brief, fasting plasma insulin and fasting plasmaglucose values were used to calculate an index of insulin
resistance. The HOMA index was calculated as fastinginsulin concentration (in μU ml−1) × fasting glucoseconcentration (in mmol l−1)/22.5, assuming that normalyoung subjects have an insulin resistance of 1.
Total protein extraction, electrophoresisand Western blot analysis
For total protein extraction from human skeletal muscle,a piece of frozen tissue was homogenized as describedelsewhere (Guerra et al. 2007). After centrifugation at20 000g at 16◦C for 15 min to remove tissue debris,total protein extracts were transferred to clean tubes,and an aliquot of each extract was preserved forprotein quantification by bicinchoninic acid assay (Smithet al. 1985). Proteins were solubilized in sample buffercontaining 0.0625 M Tris-HCl, pH 6.8, 2.3% (w/v) SDS,10% (v/v) glycerol, 5% (v/v) β-mercaptoethanol and0.001% (w/v) Bromophenol Blue. Equal protein amounts(50 μg) of each sample were electrophorezed on 7.5–10% SDS-PAGE using the system of Laemmli (1970) andtransferred to Hybond-P membranes according to themethod of Towbin et al. (1979). For immunoblotting,membranes were pre-incubated with 5% blotting gradeblocker non-fat dry milk (Bio-Rad Laboratories, Hercules,CA, USA) in Tris-buffered saline (TBS) with 0.1%Tween 20 (blotto blocking buffer) for 1 h at roomtemperature (20–22◦C). To detect the leptin receptorisoforms (OB-Rs), membranes were incubated witha rabbit polyclonal specific anti-human OB-R (longform) antibody. To detect SOCS3 protein expression,membranes were incubated with a rabbit polyclonalspecific anti-human SOCS3 antibody. To detect PTP1Bprotein expression, membranes were incubated with amouse monoclonal specific anti-human PTP1B antibody.To detect Tyr705-STAT3 phosphorylation, membraneswere incubated with a rabbit polyclonal antibody thatrecognizes this kinase only when the residue Tyr705
is phosphorylated. To detect total STAT3, membraneswere incubated with a mouse monoclonal antibodythat recognizes both forms (phosphorylated and non-phosphorylated) of this kinase. To detect Thr172-AMPKα
phosphorylation, membranes were incubated with arabbit polyclonal antibody that recognizes this kinaseonly when the residue Thr172 is phosphorylated. Todetect total AMPKα, membranes were incubated witha rabbit polyclonal antibody that recognizes the bothforms of AMPK, namely AMPKα1 and AMPKα2. Todetect ACC phosphorylation, membranes were incubatedwith a rabbit polyclonal antibody raised against a peptidecorresponding to the sequence in rat liver ACCα aroundthe Ser79 phosphorylation site, which recognizes theequivalent Ser221 in human ACCβ in the phosphorylatedstate. A single band was detected at ∼280 kDa in human
C© 2009 The Authors. Journal compilation C© 2010 The Physiological Society

Exp Physiol 95.1 pp 160–171 Leptin receptors in obese humans 163
skeletal muscle, which coincides with the molecular massreported for ACCβ (Thampy, 1989). We also verifiedthat this antibody recognizes the two phosphorylatedACC isoforms (ACCα at 265 kDa and ACCβ at 280 kDa)in protein extracts obtained from subcutaneous adiposetissue (data not shown). To assess total ACC proteincontent, membranes were incubated with a rabbitpolyclonal antibody that recognizes both forms of ACC.In additional experiments using human subcutaneousadipose tissue, we detected two bands with the ACCantibody corresponding to the α and β isoforms of theACC (data not shown). In human skeletal muscle extracts,however, only one band at 280 kDa was detected, whichcorresponded to the β isoform (data not shown). Tocontrol for differences in loading and transfer efficiencyacross membranes, an antibody directed against α-tubulinwas used to hybridize with the same samples. Membraneincubations with polyclonal rabbit anti-OB-R (diluted1:1500 in blotto blocking buffer), polyclonal rabbit anti-Tyr705-STAT3 (diluted 1:500 in 5% bovine serum albuminin TBS with 0.1% Tween 20; BSA blocking buffer),monoclonal mouse anti-STAT3 (diluted 1:750 in BSAblocking buffer), polyclonal rabbit-anti-Thr172-AMPKα
(diluted 1:1000 in BSA blocking buffer), polyclonal rabbit-anti-AMPKα (diluted 1:1000 in BSA blocking buffer),polyclonal rabbit-anti-Ser221-ACCβ (diluted 1:400 in BSAblocking buffer), polyclonal rabbit-anti-ACCβ (diluted1:400 in BSA blocking buffer) and the monoclonalmouse anti-PTP1B (diluted 1:1000 in blotto blockingbuffer) were performed overnight at 4◦C. Membraneincubations with polyclonal rabbit anti-SOCS3 (diluted1:500 in blotto blocking buffer) and with monoclonalmouse anti-α-tubulin (diluted 1:50 000 in blotto blockingbuffer) were performed for 1 h at room temperature. Asa control for the presence of adipose tissue protein inthe muscular tissue, a polyclonal rabbit anti-perilipin Aantibody was used (Guerra et al. 2007). To explore theexpression of this protein in human skeletal muscle,membranes were blocked with BSA blocking buffer for1 h at room temperature. Membrane incubations withpolyclonal rabbit anti-perilipin A antibody (diluted 1:1500in BSA blocking buffer) were performed for 1 h at roomtemperature. Antibody-specific labelling was revealedby incubation with a HRP-conjugated goat anti-rabbitantibody (1:20 000) or a HRP-conjugated donkey anti-mouse antibody (1:10 000), both diluted in blotto blockingbuffer and visualized with the ECL chemiluminiscence kit(Amersham Biosciences). Specific bands were visualizedwith the ECL chemiluminiscence kit, visualized withthe ChemiDoc XRS system (Bio-Rad Laboratories) andanalysed with the image analysis program Quantityone C© (Bio-Rad Laboratories). The densitometry analysiswas carried out immediately before saturation of theimmunosignal. Data are reported as band intensity ofimmunostaining values (arbitrary units) obtained for OB-
Table 1. Body composition, basal plasma glucose and endocrinevariables
Control group Obese group
Age (years) 31.2 ± 4.8 30.4 ± 7.4Height (cm) 184.3 ± 9.4 183.9 ± 8.2Weight (kg) 90.9 ± 13.2 114.9 ± 8.2∗Body mass index (kg m−2) 26.6 ± 3.7 33.8 ± 2.3∗Whole body fat (kg) 22.3 ± 7.8 37.4 ± 9.0∗Percentage body fat 24.8 ± 5.8 34.9 ± 5.1∗VO2max (ml min−1 (kg whole 39.7 ± 6.1 29.8 ± 3.8∗
body mass)−1)VO2max (ml min−1 (kg lean 54.5 ± 4.8 49.1 ± 8.7
mass)−1)Glucose (mmol l−1) 5.0 ± 0.2 5.5 ± 0.3∗Insulin (pmol l−1) 47.6 ± 24.7 102.7 ± 51.8∗Homeostasis model assessment 10.6 ± 5.2 25.1 ± 12.9∗Leptin (ng ml−1) 5.7 ± 5.2 20.1 ± 12.1∗
Values are means ± S.E.M. ∗P < 0.05 versus control group.
R, perilipin, PTP1B or SOCS3 relative to those obtained forα-tubulin, or as arbitrary units of band density obtainedfor the phosphorylated form of STAT3, AMPKα andACCβ relative to those obtained for the total STAT3,AMPKα and ACCβ form, respectively. α-Tubulin, totalSTAT3, total AMPKα and total ACCβ protein contentin the muscle biopsies of the two experimental groupswas similar (data not shown; all P > 0.05). Western blotanalysis of all proteins studied was performed in triplicatefor each muscle biopsy, with a variation coefficient lessthan 10%. Samples from each subject were running in thesame gel.
Statistical analysis
Variables were checked for normal distribution by using aKolmogorov–Smirnov test with the Lilliefors correction.Variables that deviated from the normal distributionwhere logarithmically transformed. Between groups, aswell as between extremities, differences were determinedwith ANOVA, and with ANCOVA, using the percentage ofbody fat as covariate. The relationship between variableswas determined using Pearson correlation analysis. Valuesare reported as the means ± S.E.M., and P ≤ 0.05 wasconsidered significant. Statistical analysis was performedusing SPSS v.14.0 for Windows (SPSS Inc., Chicago, IL,USA).
Results
Body composition and anthropometricsin both experimental groups
Body composition and anthropometrics are reported inTable 1. Both groups were comparable in age, height andlean mass, but the obese group had greater weight, bodymass index (BMI), whole body fat mass, percentage of
C© 2009 The Authors. Journal compilation C© 2010 The Physiological Society
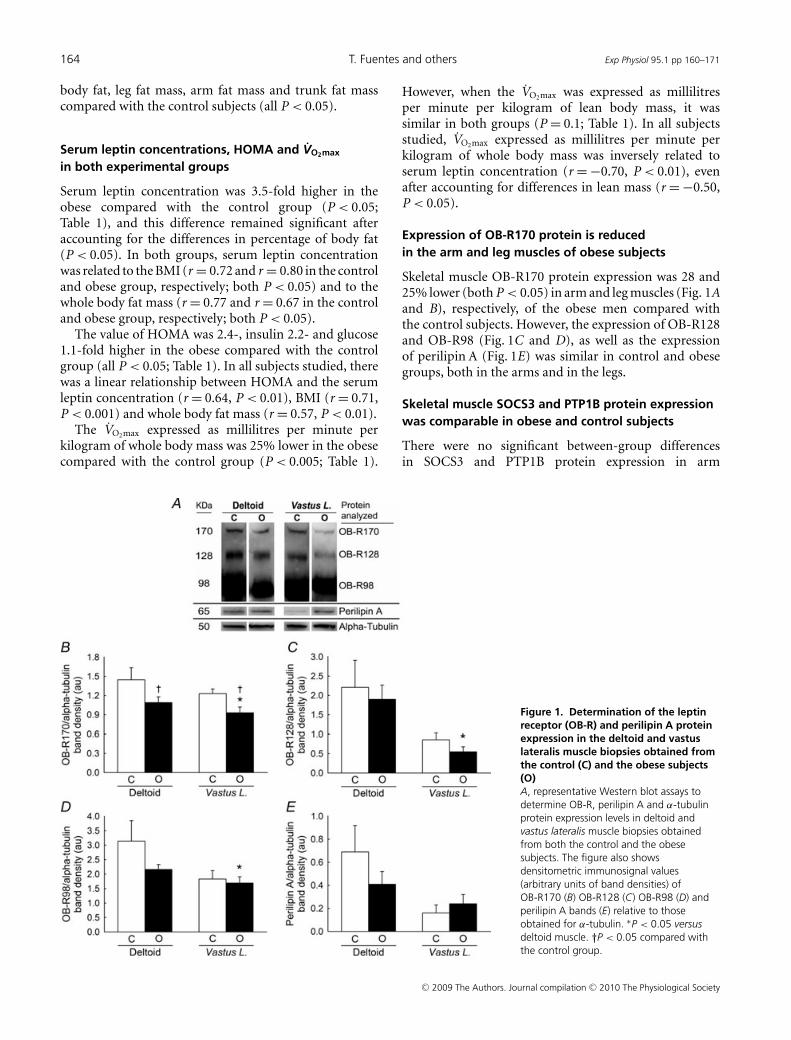
164 T. Fuentes and others Exp Physiol 95.1 pp 160–171
body fat, leg fat mass, arm fat mass and trunk fat masscompared with the control subjects (all P < 0.05).
Serum leptin concentrations, HOMA and VO2max
in both experimental groups
Serum leptin concentration was 3.5-fold higher in theobese compared with the control group (P < 0.05;Table 1), and this difference remained significant afteraccounting for the differences in percentage of body fat(P < 0.05). In both groups, serum leptin concentrationwas related to the BMI (r = 0.72 and r = 0.80 in the controland obese group, respectively; both P < 0.05) and to thewhole body fat mass (r = 0.77 and r = 0.67 in the controland obese group, respectively; both P < 0.05).
The value of HOMA was 2.4-, insulin 2.2- and glucose1.1-fold higher in the obese compared with the controlgroup (all P < 0.05; Table 1). In all subjects studied, therewas a linear relationship between HOMA and the serumleptin concentration (r = 0.64, P < 0.01), BMI (r = 0.71,P < 0.001) and whole body fat mass (r = 0.57, P < 0.01).
The VO2max expressed as millilitres per minute perkilogram of whole body mass was 25% lower in the obesecompared with the control group (P < 0.005; Table 1).
Figure 1. Determination of the leptinreceptor (OB-R) and perilipin A proteinexpression in the deltoid and vastuslateralis muscle biopsies obtained fromthe control (C) and the obese subjects(O)A, representative Western blot assays todetermine OB-R, perilipin A and α-tubulinprotein expression levels in deltoid andvastus lateralis muscle biopsies obtainedfrom both the control and the obesesubjects. The figure also showsdensitometric immunosignal values(arbitrary units of band densities) ofOB-R170 (B) OB-R128 (C) OB-R98 (D) andperilipin A bands (E) relative to thoseobtained for α-tubulin. ∗P < 0.05 versusdeltoid muscle. †P < 0.05 compared withthe control group.
However, when the VO2max was expressed as millilitresper minute per kilogram of lean body mass, it wassimilar in both groups (P = 0.1; Table 1). In all subjectsstudied, VO2max expressed as millilitres per minute perkilogram of whole body mass was inversely related toserum leptin concentration (r = −0.70, P < 0.01), evenafter accounting for differences in lean mass (r = −0.50,P < 0.05).
Expression of OB-R170 protein is reducedin the arm and leg muscles of obese subjects
Skeletal muscle OB-R170 protein expression was 28 and25% lower (both P < 0.05) in arm and leg muscles (Fig. 1Aand B), respectively, of the obese men compared withthe control subjects. However, the expression of OB-R128and OB-R98 (Fig. 1C and D), as well as the expressionof perilipin A (Fig. 1E) was similar in control and obesegroups, both in the arms and in the legs.
Skeletal muscle SOCS3 and PTP1B protein expressionwas comparable in obese and control subjects
There were no significant between-group differencesin SOCS3 and PTP1B protein expression in arm
C© 2009 The Authors. Journal compilation C© 2010 The Physiological Society

Exp Physiol 95.1 pp 160–171 Leptin receptors in obese humans 165
and leg muscles (P > 0.05; Fig. 2A and B). The ratioOB−R170/SOCS3 was 36% lower in the vastus lateralisof the obese subjects compared with the control subjects(P < 0.05). However, there were no significant between-group differences in the ratio of OBR-170/PTP1B in armand leg muscles.
Figure 2. Determination of SOCS3 and PTP1B proteinexpression in the deltoid and vastus lateralis muscle biopsiesobtained from the control (C) and the obese subjects (O)A, top panel, representative Western blot assay to determine SOCS3protein expression level in deltoid and vastus lateralis muscle biopsiesobtained from both the control and the obese subjects; bottom panel,densitometric immunosignal values (arbitrary units of band densities)of SOCS3 bands relative to those obtained for α-tubulin. B, top panel,representative Western blot assay to determine PTP1B proteinexpression level in deltoid and vastus lateralis muscle biopsies obtainedfrom both the control and the obese subjects; bottom panel,densitometric immunosignal values (arbitrary units of band densities)of PTP1B bands relative to those obtained for α-tubulin. ∗P < 0.05versus deltoid muscle.
Deltoid but not vastus lateralis Tyr705-STAT3phosphorylation level was increasedin the obese subjects
Deltoid muscle Tyr705-STAT3 phosphorylation level was373% higher in obese men than in control men(P < 0.01; Fig. 3). However, there were no significantbetween-group differences in vastus lateralis Tyr705-STAT3phosphorylation (Fig. 3).
Skeletal muscle Thr172-AMPKα phosphorylationbut not Ser221-ACCβ phosphorylation levelswere comparable in obese and control subjects
There were no significant between-group differencesin Thr172-AMPKα phosphorylation levels in arm andleg muscles (Fig. 4A). However, deltoid muscle Ser221-ACCβ phosphorylation level was 67% higher and vastuslateralis Ser221-ACCβ phosphorylation level was 36%lower in obese compared with control subjects (bothP < 0.05; Fig. 4B). The pThr172-AMPKα/SOCS3 andpSer221-ACCβ/SOCS3 ratios were 45 and 49% lower,respectively, in the vastus lateralis of the obese comparedwith the control subjects (both P < 0.05).
Figure 3. Determination of pTyr705-STAT3 phosphorylation levelin the deltoid and vastus lateralis muscle biopsies obtainedfrom the control (C) and obese subjects (O)Top panel, representative Western blot assay to determinepTyr705-STAT3 phosphorylation level in deltoid and vastus lateralismuscle biopsies obtained from both the control and the obesesubjects. Bottom panel, densitometric analysis of pTyr705-STAT3immunoblots (arbitrary units of band densities). Values are relative tototal STAT3. ∗P < 0.05 versus deltoid muscle. †P < 0.05 comparedwith the control group.
C© 2009 The Authors. Journal compilation C© 2010 The Physiological Society

166 T. Fuentes and others Exp Physiol 95.1 pp 160–171
Control group
Protein expression of the three leptin receptor isoforms(OB-R170, OB-R128 and OB-R98) (Fig. 1A) was similar
Figure 4. Determination of Thr172-AMPKα and Ser221-ACCβ
phosphorylation level in the deltoid and vastus lateralis musclebiopsies obtained from the control (C) and the obese subjects(O)A, top panel, representative Western blot assay to determinepThr172-AMPKα phosphorylation level in deltoid and vastus lateralismuscle biopsies obtained from both the control and the obesesubjects; bottom panel, densitometric analysis of pThr172-AMPKα
immunoblots (arbitrary units of band densities). Values are relative tototal AMPKα. B, top panel, representative Western blot assay todetermine pSer221-ACCβ phosphorylation level in deltoid and vastuslateralis muscle biopsies obtained from both the control and the obesesubjects; bottom panel, densitometric analysis of pSer221-ACCβ
immunoblots (arbitrary units of band densities). Values are relative tototal ACCβ. ∗P < 0.05 versus deltoid muscle. †P < 0.05 comparedwith the control group.
in leg and arm muscles (P = 0.27, P = 0.1 andP = 0.06, respectively; Fig. 1B, C and D, respectively).No relationship was observed between OB-Rs proteinexpression in arm or leg muscles and serum leptinconcentration or HOMA. Perilipin A protein expression(Fig. 1A) was similar in both muscles (P = 0.06; Fig. 1Aand E).
Protein expression levels of SOCS3 (P = 0.93; Fig. 2A)and PTP1B (P = 0.09; Fig. 2B) were similar in arm andleg muscles. In the deltoid, OB-R98 and SOCS3 proteinexpression were related (r = 0.76, P < 0.05).
The phosphorylation level of Tyr705-STAT3 was similarin arm and leg muscles (P = 0.30; Fig. 3). In the arms, butnot in the legs, STAT3 phosphorylation level was directlyrelated to the OB-R170 (r = 0.80, P < 0.05) and OB-R128 (r = 0.70, P < 0.05). The STAT3 phosphorylationlevel and SOCS3 protein content were related in theleg (r = 0.64, P < 0.05), but not in the arm (r = 0.36,P = 0.34). The mean of the STAT3 phosphorylation inboth limbs was related to OB-R170 (r = 0.91, P < 0.001),OB-R128 (r = 0.98, P < 0.001) and OB-R98 (r = 0.85,P < 0.01).
Basal phosphorylation levels of Thr172-AMPKα
(P = 0.34) and Ser221-ACCβ (P = 0.48) were similar inarm and leg muscle (Fig. 4A and B). There was nocorrelation between Thr172-AMPKα and Ser221-ACCβ
basal phosphorylation and plasma leptin concentration.
Obese group
The expression of the three isoforms of the leptin receptor(Fig. 1A) was reduced by 15, 70 and 22% in the legcompared with the arm muscles (OB-R170, OB-R128and OB-R98, respectively, all P < 0.05; Fig. 1B, C and E,respectively). Expression of OB-R170 did not correlatewith serum leptin concentration or HOMA in eithermuscle. The expression of perilipin A was similar in bothextremities (Fig. 1A and E; P = 0.34).
The protein expression of SOCS3 was 59% higher inleg than in arm muscles (P < 0.05; Fig. 2A). However,PTP1B protein content was similar in arm and leg muscles(P = 0.3; Fig. 2B). In the arm muscles, neither SOCS3nor PTP1B protein expression was significantly relatedto OB-Rs protein expression, serum leptin concentrationor HOMA. Neither SOCS3 nor PTP1B protein contentin leg muscles was significantly related to serum leptinconcentration.
The phosphorylation level of Tyr705-STAT3 was 62%lower in leg than in arm muscles (P < 0.05; Fig. 3). Thephosphorylation level of Tyr705-STAT3 in vastus lateralisand deltoid muscles was not related to serum leptinconcentration.
Basal phosphorylation levels of Thr172-AMPKα andSer221-ACCβ were 53 and 65% lower in leg than in armmuscles, respectively (both P < 0.001; Fig. 4).
C© 2009 The Authors. Journal compilation C© 2010 The Physiological Society
Exp Physiol 95.1 pp 160–171 Leptin receptors in obese humans 167
Discussion
In agreement with our hypothesis, we have shown thatleptin receptor content is reduced in the skeletal muscle ofobese subjects. This effect is exclusive to the long isoformof the leptin receptor (OB-R170), which is the main OB-R isoform involved in intracellular signalling (Kamikuboet al. 2008). In addition, we have shown that SOCS3, whichblunts JAK2-dependent leptin signalling, is increased,whereas pTyr705-STAT3 phosphorylation, which regulatesgene expression in response to leptin signalling, andThr172-AMPKα and Ser221-ACCβ phosphorylation levels,which regulate skeletal muscle fatty acid oxidation inresponse to leptin stimulation, are reduced in the vastuslateralis compared with the deltoid muscle in obesesubjects. Moreover, in non-obese subjects there is a tightcoupling between the amount of long isoform presentin the skeletal muscles of the extremities and STAT3phosphorylation, while this relationship is lost in obesity.Thus, these findings essentially confirm our hypothesis,i.e. obesity-induced leptin resistance in human skeletalmuscle is associated with reduced availability of leptinreceptors combined with reduced leptin signalling, asreflected by the lower levels of Tyr705-STAT3, Thr172-AMPKα and Ser221-ACCβ basal phosphorylation levels,probably caused by increased SOSC3 protein expression inthe leg muscles. However, our study also provides evidencefor higher leptin resistance in the leg than in the armmuscle of obese people.
Our findings concur with previous studies showinga down-regulation of gene expression of the short andlong isoforms of the leptin receptor (OB-Ra and OB-Rb, respectively) in the hypothalamus and liver in obesity(Hikita et al. 2000; Liu et al. 2007). Cell-culture studieshave shown that leptin receptor expression is controlledby leptin (Hikita et al. 2000; Liu et al. 2004). Acute leptinadministration causes an acute reduction in the expressionof leptin receptors in cell lines (Hikita et al. 2000; Liu et al.2004). Moreover, a reduction of circulating leptin levelsby prolonged fasting in humans increases OB-R mRNAin peripheral mononuclear cells (Chan et al. 2002), whileadministration of human recombinant leptin in fastinghumans blunts the increase in OB-R in mononuclearcells (Chan et al. 2002). The reduction of OB-R170protein content in obesity might have been caused by thehyperleptinaemia observed in this experimental group.However, no relationship was observed in the presentstudy between the basal levels of leptin, which werechronically elevated in obesity, and the expression of leptinreceptors in skeletal muscle, except for the expressionof OB-R128 in the arm muscles, which was inverselyrelated to serum leptin concentration. Similar to thefindings of the present investigation, no relationshipbetween skeletal muscle OB-R protein expression andserum leptin concentrations has been reported in normal-
weight subjects, including women (Guerra et al. 2007;Guerra et al. 2008). In contrast, a negative relationshipbetween plasma leptin concentration and both OB-Ra andOB-Rb gene expression (mRNA) in hypothalamus andliver has been reported in rats (Liu et al. 2007). However,in that study the effect hyperleptinaemia on the amountof leptin receptor protein was not reported. Thus, ourfindings indicate that the amount of muscle OB-R170, inaddition to circulating leptin levels, must be regulated byother mechanisms (Guerra et al. 2007, 2008).
Expression of OB-R and muscle leptin resistance
The OB-R170 has a molecular weight which correspondswell to the glycosylated form of the OB-R long isoform(OB-Rb) and is expressed in human skeletal muscle andhypothalamus (Guerra et al. 2007). The OB-R128 couldcorrespond to the non-glycosylated form of the longisoform of the leptin receptor (Aparicio et al. 2005). TheOB-R170 isoform could very well be the main ligandfor leptin in skeletal muscle (Bjørbæk et al. 2000). Ithas also been shown that this isoform phosphorylates inresponse to leptin binding (Bates & Myers, 2003), andthis phosphorylation has been linked to the activationof intracellular cascades with subsequent effects on fattyacid transport and metabolism (Steinberg et al. 2002b).In theory, down-regulation of the OB-R170 receptornumber could account for some of the accumulationof triglycerides, lipotoxicity and altered insulin signallingtypical of obesity.
Central leptin resistance has been associated withhypothalamic OB-R mRNA and protein down-regulation(Martin et al. 2000). Peripheral leptin resistance couldalso be caused by a reduction of the OB-Rs mRNA (Liuet al. 2007). Therefore, the reduced amount of OB-R170protein in the human obese skeletal muscle observed inour study might be a potential mechanism of muscularleptin resistance. Previous data have shown that muscleleptin sensitivity is reduced in obesity, since the hormoneis unable to increase the fatty acid oxidation in humanobese skeletal muscle in vitro (Steinberg et al. 2002b), andchronic leptin administration decreases fatty acid uptakeand fatty acid transporters in rat skeletal muscle (Steinberget al. 2002a).
Protein expression of SOCS3 and PTP1B in humanskeletal muscle
Cellular leptin resistance also could be caused by anattenuation of the OB-Rb signalling (Munzberg et al.2005). Induction of SOCS3 expression has been implicatedas a potential mechanism of leptin resistance and ofleptin-induced insulin resistance (Bjørbæk et al. 1999).Expression of SOCS3 is increased in hypothalamus, white
C© 2009 The Authors. Journal compilation C© 2010 The Physiological Society
168 T. Fuentes and others Exp Physiol 95.1 pp 160–171
adipocytes and skeletal muscle of leptin-resistant rodents(Wang et al. 2000, 2001; Steinberg et al. 2004b; Eguchiet al. 2007). Additionally, in mice, decreasing SOCS3expression in the whole body or deleting SOCS3 inneurons increases the amplitude of OB-Rb signalling,resulting in animals that are leaner than wild-types atbaseline, and that are resistant to diet-induced obesity(Myers et al. 2008). Furthermore, Steinberg et al. (2006b)reported that SOCS3 mRNA is up-regulated in humanmyotubes cultured from skeletal muscle of obese humans,which inhibits the leptin-induced AMPK activation inthese obese myotubes. Moreover, Steinberg et al. (2006b)showed that overexpression of SOCS3 via adenovirus-mediated infection in lean myotubes to a similar degree asobserved in obese myotubes prevented leptin activation ofAMPK. In the present investigation, we have measured, forthe first time, the SOCS3 protein levels in human skeletalmuscle of obese and control subjects. Our data indicatesimilar skeletal muscle SOCS3 protein content in obeseand control subjects. Moreover, muscle SOCS3 proteinexpression was not related to leptin serum concentrations.
Our results also imply that differences in leptinsensitivity could hardly be explained uniquely bydifferences in SOCS3 protein content. In contrast withour results, Eguchi et al. (2007) reported that SOCS3mRNA and protein expression are up-regulated by leptinin rat skeletal muscle in a time-dependent manner.Moreover, endurance training restored the ability of leptinto increase the muscular fatty acid oxidation in obeserats with high muscular SOCS3 mRNA expression, butthis effect of exercise was not mediated by a decreaseof the muscular SOCS3 mRNA expression (Steinberget al. 2004b). Therefore, while in certain circumstancesincreased SOCS3 expression may be an importantregulator of leptin and insulin sensitivity, our data showthat SOCS3 protein expression is not increased in humanobese skeletal muscle, but it is differentially distributed,with increased SOCS3 levels in leg compared with armmuscles. These regional differences in SOCS3 proteinexpression between arm and leg muscle of obese subjectsmay, at least partly, explain why there is better-preservedinsulin sensitivity in arm than leg muscle in humans withtype 2 diabetes (Olsen et al. 2005).
Protein tyrosine phosphatase 1B (PTP1B) is a negativeregulator of leptin and insulin signalling (Dube &Tremblay, 2005) and is overexpressed in multiple insulin-and leptin-responsive tissues in mice with diet-inducedobesity, including the arcuate nucleus and medialhypothalamus, important sites of PTP1B action onbody weight regulation, and in peripheral tissues, suchas skeletal muscle, adipose tissue and liver (Zabolotnyet al. 2002; Dube & Tremblay, 2005). Moreover, PTP1Boverexpression in muscle of transgenic mice causesimpaired insulin signalling in muscle and whole bodyinsulin resistance (Zabolotny et al. 2004). Protein tyrosine
phosphatase 1B is overexpressed in obese rodent skeletalmuscle, and this PTP1B overexpression is promoted byinflammation (Zabolotny et al. 2008). Reports of PTP1Bexpression in tissues of insulin-resistant, obese and/ordiabetic humans are inconsistent. Several studies havereported that PTP1B levels are increased in skeletalmuscle and adipose tissue of obese humans (Ahmad et al.1997a,b; Cheung et al. 1999). However, other studieshave shown that PTP1B expression is unchanged ordecreased in obese and/or diabetic humans comparedwith control subjects (Kusari et al. 1994; Ahmad et al.1997a; Worm et al. 1999). In the present investigation,we have measured PTP1B protein levels in human skeletalmuscle of obese and control subjects. Our data indicatesimilar skeletal muscle PTP1B protein content in obeseand control subjects in arm and leg muscles. Moreover,muscle PTP1B protein expression was not related to leptinserum concentrations, implying that differences in humanmuscle leptin sensitivity could hardly be explained bydifferences in PTP1B protein content.
Phosphorylation of STAT3 in skeletal muscle
The STAT3 signalling pathway in human skeletal muscle isthe signal transducer of numerous stimuli in addition toleptin signalling (Stepkowski et al. 2008) and is involvedin the regulation, among other processes, of cellularproliferation, differentiation, programmed cell death,inflammation, muscle hypertrophy and the immuneresponse (Akira, 2000; Judd et al. 2006). Thus, the lackof correlation between leptin concentrations and Tyr705-STAT3 phosphorylation levels, and the fact that Tyr705-STAT3 phosphorylation is not related to the amount OB-R170 in the arm muscles of obese subjects, could simplyreflect the influence of other signals overruling the effectsof leptin in the deltoid muscle. In contrast, since SOCS3 iselevated in the vastus lateralis of obese subjects, severalsignals eliciting Tyr705-STAT3 phosphorylation may beblunted (Murray, 2007), explaining the lower basal STAT3phosphorylation in the leg muscles of obese subjects.Reduced basal levels of Tyr705-STAT3 phosphorylation, inturn, may attenuate lipid oxidation, leading to triglycerideintramyocellular accumulation. In agreement, it has beenshown that leptin administration increases lipid oxidationin the mouse, which was blocked by a JAK2 inhibitor andSTAT3 small interfering RNA (Akasaka et al. 2009).
Phosphorylation of AMPKα and ACCβ
in skeletal muscle
Basal Ser221-ACCβ phosphorylation level and AMPKactivity (but not Thr172-AMPKα phosporylation level)are significantly reduced in obese compared with controlmuscle biopsies obtained from the vastus lateralismuscle (Bandyopadhyay et al. 2006). In agreement,
C© 2009 The Authors. Journal compilation C© 2010 The Physiological Society

Exp Physiol 95.1 pp 160–171 Leptin receptors in obese humans 169
we have shown that Ser221-ACCβ but not Thr172-AMPKα phosphorylation levels were reduced in thevastus lateralis muscle of obese compared with controlsubjects. The reduced Ser221-ACCβ phosphorylationobserved in obese leg muscle probably increases musclemalonyl-coenzyme A levels and reduces FA oxidation(Bandyopadhyay et al. 2006; Steinberg & Jorgensen,2007). Another study found no differences betweenobese and control women in AMPK activity and Ser221-ACCβ phosphorylation in the rectus abdominis muscle(Steinberg et al. 2004a). In contrast to our hypothesis, wefound greater Ser221-ACCβ phosporylation in the deltoidmuscle of obese compared to control subjects. This findingmay be a consequence of hyperleptinaemia in obesity, assupported by our results, which are compatible with lowerleptin resistance in the arm compared with the leg musclesin obesity. Similarly, regional differences with greaterinsulin sensitivity in arm than in leg muscles have beenreported in type 2 diabetes (Olsen et al. 2005). Anothernovelty from this study is that we have observed lowerThr172-AMPKα and Ser221-ACCβ phosphorylation levelsin the vastus lateralis compared with the deltoid muscleof the obese subjects, which could be explained by thegreater SOCS3 protein content found in the obese vastuslateralis.
Regional differences in the OB-R proteinexpression in obese muscle
Another interesting finding from our study is that there areregional differences in OB-R protein expression betweenthe deltoid muscle and the vastus lateralis in obese humans.Since leg muscles are used frequently in ambulation, whilearm muscles are used with a more intermittent pattern,this finding could indicate that muscle activity plays a rolein the regulation of leptin receptors. More active muscles,such as vastus lateralis, could need less leptin receptorsbecause exercise improves leptin sensitivity. Interestingly,the leptin receptors are up-regulated in the medialgastrocnemius after 4–11 days of cast immobilization orbed rest in humans (Chen et al. 2007). The greater OB-R protein expression detected in the deltoid muscles ofobese subjects could facilitate leptin signalling and, in thepresence of hyperleptinaemia, lead to increased STAT3and AMPK signalling compared with the vastus lateralis.However, it remains to be determined whether regularexercise modifies the expression of skeletal muscle leptinreceptors in humans.
Regional differences in the OB-R protein expression inobese muscle could relate to differences in muscle fibretype composition between deltoid and vastus lateralis.However, our obese and control subjects had a similarfibre type composition in their deltoid and vastus lateralis(I. Ara, S. Larsen, B. Stallknecht, B. Guerra, D. Morales-Alamo, J.L. Andersen, J.G. Ponce-Gonzalez, A. Guadalupe-
Grau, H. Galbo, J.A.L. Calbet & J.W. Helge, unpublishedobservations), ruling out this possible explanation.
Conclusion
In summary, this study shows that in obese humansthere is a down-regulation of the OB-R170 proteinexpression in skeletal muscle, which cannot be explainedby differences in circulating leptin or insulin betweenobese and control subjects. Moreover, we found thatin obese humans the deltoid muscle, which has a fibretype composition similar to that of the vastus lateralis(Calbet et al. 2005; I. Ara, S. Larsen, B. Stallknecht, B.Guerra, D. Morales-Alamo, J.L. Andersen, J.G. Ponce-Gonzalez, A. Guadalupe-Grau, H. Galbo, J.A.L. Calbet &J.W. Helge, unpublished observations), has more leptinreceptors than the vastus lateralis. In normal-weightsubjects, SOCS3 protein expression, and STAT3, AMPKα
and ACCβ phosphorylation, are similar in the deltoidand vastus lateralis muscles. However, in obesity, SOCS3protein expression is increased, and basal STAT3, AMPKα
and ACCβ phosphorylation levels are reduced in thevastus lateralis compared with the deltoid muscle. Incombination, these findings are compatible with markedregional differences in skeletal leptin resistance in obesehumans.
References
Ahmad F, Azevedo JL, Cortright R, Dohm GL & Goldstein BJ(1997a). Alterations in skeletal muscle protein-tyrosinephosphatase activity and expression in insulin-resistanthuman obesity and diabetes. J Clin Invest 100, 449–458.
Ahmad F, Considine RV, Bauer TL, Ohannesian JP, Marco CC& Goldstein BJ (1997b). Improved sensitivity to insulin inobese subjects following weight loss is accompanied byreduced protein-tyrosine phosphatases in adipose tissue.Metabolism 46, 1140–1145.
Akasaka Y, Tsunoda M, Ide T & Murakami K (2009). Chronicleptin treatment stimulates lipid oxidation in immortalizedand primary mouse skeletal muscle cells. Biochim BiophysActa 1791, 103–109.
Akira S (2000). Roles of STAT3 defined by tissue-specific genetargeting. Oncogene 19, 2607–2611.
Anubhuti & Arora S (2008). Leptin and its metabolicinteractions: an update. Diabetes Obes Metab 10, 973–993.
Aparicio T, Kermorgant S, Darmoul D, Guilmeau S, Hormi K,Mahieu-Caputo D & Lehy T (2005). Leptin and Ob-Rbreceptor isoform in the human digestive tract during fetaldevelopment. J Clin Endocrinol Metab 90, 6177–6184.
Bandyopadhyay GK, Yu JG, Ofrecio J & Olefsky JM (2006).Increased malonyl-CoA levels in muscle from obese andtype 2 diabetic subjects lead to decreased fatty acid oxidationand increased lipogenesis; thiazolidinedione treatmentreverses these defects. Diabetes 55, 2277–2285.
Banks AS, Davis SM, Bates SH & Myers MG Jr (2000).Activation of downstream signals by the long form of theleptin receptor. J Biol Chem 275, 14563–14572.
C© 2009 The Authors. Journal compilation C© 2010 The Physiological Society

170 T. Fuentes and others Exp Physiol 95.1 pp 160–171
Bates SH & Myers MG Jr (2003). The role of leptin receptorsignaling in feeding and neuroendocrine function. TrendsEndocrinol Metab 14, 447–452.
Bates SH, Stearns WH, Dundon TA, Schubert M, Tso AW,Wang Y, Banks AS, Lavery HJ, Haq AK, Maratos-Flier E,Neel BG, Schwartz MW & Myers MG Jr (2003). STAT3signalling is required for leptin regulation of energy balancebut not reproduction. Nature 421, 856–859.
Bjørbæk C, El-Haschimi K, Frantz JD & Flier JS (1999). Therole of SOCS-3 in leptin signaling and leptin resistance. J BiolChem 274, 30059–30065.
Bjørbæk C & Kahn BB (2004). Leptin signaling in the centralnervous system and the periphery. Recent Prog Horm Res 59,305–331.
Bjørbæk C, Lavery HJ, Bates SH, Olson RK, Davis SM, Flier JS& Myers MG Jr (2000). SOCS3 mediates feedback inhibitionof the leptin receptor via Tyr985. J Biol Chem 275,40649–40657.
Calbet JA, Holmberg HC, Rosdahl H, van Hall G,Jensen-Urstad M & Saltin B (2005). Why do arms extract lessoxygen than legs during exercise? Am J Physiol Regul IntegrComp Physiol 289, R1448–R1458.
Chan JL, Bluher S, Yiannakouris N, Suchard MA, Kratzsch J &Mantzoros CS (2002). Regulation of circulating solubleleptin receptor levels by gender, adiposity, sex steroids, andleptin: observational and interventional studies in humans.Diabetes 51, 2105–2112.
Chen YW, Gregory CM, Scarborough MT, Shi R, Walter GA &Vandenborne K (2007). Transcriptional pathways associatedwith skeletal muscle disuse atrophy in humans. PhysiolGenomics 31, 510–520.
Cheung A, Kusari J, Jansen D, Bandyopadhyay D, Kusari A &Bryer-Ash M (1999). Marked impairment of protein tyrosinephosphatase 1B activity in adipose tissue of obese subjectswith and without type 2 diabetes mellitus. J Lab Clin Med134, 115–123.
Dube N & Tremblay ML (2005). Involvement of the smallprotein tyrosine phosphatases TC-PTP and PTP1B in signaltransduction and diseases: from diabetes, obesity to cellcycle, and cancer. Biochim Biophys Acta 1754, 108–117.
Eguchi M, Gillis LC, Liu Y, Lyakhovsky N, Du M, McDermottJC & Sweeney G (2007). Regulation of SOCS-3 expression byleptin and its co-localization with insulin receptor in ratskeletal muscle cells. Mol Cell Endocrinol 267, 38–45.
Guerra B, Fuentes T, Delgado-Guerra S, Guadalupe-Grau A,Olmedillas H, Santana A, Ponce-Gonzalez JG, Dorado C &Calbet JA (2008). Gender dimorphism in skeletal muscleleptin receptors, serum leptin and insulin sensitivity. PLoSOne 3, e3466.
Guerra B, Santana A, Fuentes T, Delgado-Guerra S,Cabrera-Socorro A, Dorado C & Calbet JA (2007). Leptinreceptors in human skeletal muscle. J Appl Physiol 102,1786–1792.
Hikita M, Bujo H, Hirayama S, Takahashi K, Morisaki N &Saito Y (2000). Differential regulation of leptin receptorexpression by insulin and leptin in neuroblastoma cells.Biochem Biophys Res Commun 271, 703–709.
Hosoi T, Sasaki M, Miyahara T, Hashimoto C, Matsuo S, YoshiiM & Ozawa K (2008). Endoplasmic reticulum stress inducesleptin resistance. Mol Pharmacol 74, 1610–1619.
Judd LM, Bredin K, Kalantzis A, Jenkins BJ, Ernst M & GiraudAS (2006). STAT3 activation regulates growth,inflammation, and vascularization in a mouse model ofgastric tumorigenesis. Gastroenterology 131, 1073–1085.
Kamikubo Y, Dellas C, Loskutoff DJ, Quigley JP & Ruggeri ZM(2008). Contribution of leptin receptor N-linked glycans toleptin binding. Biochem J 410, 595–604.
Kusari J, Kenner KA, Suh KI, Hill DE & Henry RR (1994).Skeletal muscle protein tyrosine phosphatase activity andtyrosine phosphatase 1B protein content are associated withinsulin action and resistance. J Clin Invest 93, 1156–1162.
Laemmli UK (1970). Cleavage of structural proteins during theassembly of the head of bacteriophage T4. Nature 227,680–685.
Liu ZJ, Bian J, Liu J & Endoh A (2007). Obesity reduced thegene expressions of leptin receptors in hypothalamus andliver. Horm Metab Res 39, 489–494.
Liu ZJ, Endoh A, Li R & Ohzeki T (2004). Effects of leptin anddexamethasone on long and short leptin receptor mRNA.Pediatr Int 46, 561–564.
Lundby C, Sander M, van Hall G, Saltin B & Calbet JA (2006).Determinants of maximal exercise and muscle oxygenextraction in acclimatizing lowlanders and in high altitudenatives. J Physiol 573, 535–547.
Martin RL, Perez E, He YJ, Dawson R Jr & Millard WJ (2000).Leptin resistance is associated with hypothalamic leptinreceptor mRNA and protein downregulation. Metabolism 49,1479–1484.
Munzberg H, Bjornholm M, Bates SH & Myers MG Jr (2005).Leptin receptor action and mechanisms of leptin resistance.Cell Mol Life Sci 62, 642–652.
Murray PJ (2007). The JAK-STAT signaling pathway: input andoutput integration. J Immunol 178, 2623–2629.
Myers MG, Cowley MA & Munzberg H (2008). Mechanisms ofleptin action and leptin resistance. Annu Rev Physiol 70,537–556.
Olefsky JM, Kolterman OG & Scarlett JA (1982). Insulin actionand resistance in obesity and noninsulin-dependent type IIdiabetes mellitus. Am J Physiol Endocrinol Metab 243,E15–E30.
Olsen DB, Sacchetti M, Dela F, Ploug T & Saltin B (2005).Glucose clearance is higher in arm than leg muscle in type 2diabetes. J Physiol 565, 555–562.
Ruderman NB, Saha AK, Vavvas D & Witters LA (1999).Malonyl-CoA, fuel sensing, and insulin resistance. Am JPhysiol Endocrinol Metab 276, E1–E18.
Smith PK, Krohn RI, Hermanson GT, Mallia AK, Gartner FH,Provenzano MD, Fujimoto EK, Goeke NM, Olson BJ &Klenk DC (1985). Measurement of protein usingbicinchoninic acid. Anal Biochem 150, 76–85.
Sørensen TI, Echwald S & Holm JC (1996). Leptin in obesity.BMJ 313, 953–954.
Steinberg GR, Dyck DJ, Calles-Escandon J, Tandon NN, LuikenJJ, Glatz JF & Bonen A (2002a). Chronic leptin administra-tion decreases fatty acid uptake and fatty acid transporters inrat skeletal muscle. J Biol Chem 277, 8854–8860.
Steinberg GR & Jorgensen SB (2007). The AMP-activatedprotein kinase: role in regulation of skeletal musclemetabolism and insulin sensitivity. Mini Rev Med Chem 7,519–526.
C© 2009 The Authors. Journal compilation C© 2010 The Physiological Society

Exp Physiol 95.1 pp 160–171 Leptin receptors in obese humans 171
Steinberg GR, McAinch AJ, Chen MB, O’Brien PE, Dixon JB,Cameron-Smith D & Kemp BE (2006a). The suppressor ofcytokine signaling 3 inhibits leptin activation of AMP-kinasein cultured skeletal muscle of obese humans. J ClinEndocrinol Metab 91, 3592–3597.
Steinberg GR, Macaulay SL, Febbraio MA & Kemp BE (2006b).AMP-activated protein kinase – the fat controller of theenergy railroad. Can J Physiol Pharmacol 84, 655–665.
Steinberg GR, Michell BJ, van Denderen BJ, Watt MJ, CareyAL, Fam BC, Andrikopoulos S, Proietto J, Gorgun CZ,Carling D, Hotamisligil GS, Febbraio MA, Kay TW & KempBE (2006c). Tumor necrosis factor α-induced skeletal muscleinsulin resistance involves suppression of AMP-kinasesignaling. Cell Metab 4, 465–474.
Steinberg GR, Parolin ML, Heigenhauser GJ & Dyck DJ(2002b). Leptin increases FA oxidation in lean but not obesehuman skeletal muscle: evidence of peripheral leptinresistance. Am J Physiol Endocrinol Metab 283, E187–E192.
Steinberg GR, Smith AC, Van Denderen BJ, Chen Z, Murthy S,Campbell DJ, Heigenhauser GJ, Dyck DJ & Kemp BE(2004a). AMP-activated protein kinase is notdown-regulated in human skeletal muscle of obese females.J Clin Endocrinol Metab 89, 4575–4580.
Steinberg GR, Smith AC, Wormald S, Malenfant P, Collier C &Dyck DJ (2004b). Endurance training partially reversesdietary-induced leptin resistance in rodent skeletal muscle.Am J Physiol Endocrinol Metab 286, E57–E63.
Stepkowski SM, Chen W, Ross JA, Nagy ZS & Kirken RA(2008). STAT3: an important regulator of multiple cytokinefunctions. Transplantation 85, 1372–1377.
Thampy KG (1989). Formation of malonyl coenzyme A in ratheart. Identification and purification of an isozyme of acarboxylase from rat heart. J Biol Chem 264, 17631–17634.
Towbin H, Staehelin T & Gordon J (1979). Electrophoretictransfer of proteins from polyacrylamide gels tonitrocellulose sheets: procedure and some applications. ProcNatl Acad Sci USA 76, 4350–4354.
Wang Z, Zhou YT, Kakuma T, Lee Y, Kalra SP, Kalra PS, Pan W& Unger RH (2000). Leptin resistance of adipocytes inobesity: role of suppressors of cytokine signaling. BiochemBiophys Res Commun 277, 20–26.
Wang ZW, Pan WT, Lee Y, Kakuma T, Zhou YT & Unger RH(2001). The role of leptin resistance in the lipidabnormalities of aging. FASEB J 15, 108–114.
Worm D, Vinten J & Beck-Nielsen H (1999). The significanceof phosphotyrosine phosphatase (PTPase) 1B in insulinsignalling. Diabetologia 42, 1146–1149.
Zabolotny JM, Bence-Hanulec KK, Stricker-Krongrad A, Haj F,Wang Y, Minokoshi Y, Kim YB, Elmquist JK, Tartaglia LA,Kahn BB & Neel BG (2002). PTP1B regulates leptin signaltransduction in vivo. Dev Cell 2, 489–495.
Zabolotny JM, Haj FG, Kim YB, Kim HJ, Shulman GI, Kim JK,Neel BG & Kahn BB (2004). Transgenic overexpression ofprotein-tyrosine phosphatase 1B in muscle causes insulinresistance, but overexpression with leukocyte antigen-relatedphosphatase does not additively impair insulin action. J BiolChem 279, 24844–24851.
Zabolotny JM, Kim YB, Welsh LA, Kershaw EE, Neel BG &Kahn BB (2008). Protein-tyrosine phosphatase 1Bexpression is induced by inflammation in vivo. J Biol Chem283, 14230–14241.
Acknowledgements
The authors wish to thank Dr Andrew S. Greenberg for kindlyproviding the anti-perilipin A antibody. Special thanks are givento Jose Navarro de Tuero for his excellent technical assistance andto Ana Navarro y Guerra del Rıo for her help in the elaborationof the immunoblotting figures. This study was supported bygrants from the Ministerio de Educacion y Ciencia (BFI2003-09638, BFU2006-13784 and FEDER), Gobierno de Canarias(PI2005/177), Universidad de Las Palmas de Gran Canaria, Spain(UNI2006/05) and the Novo Nordisk Foundation. Special thanksare given to all subjects who volunteered for these experiments.Borja Guerra is a fellow of the Recursos Humanos y Difusion de laInvestigacion Program (Instituto de Salud Carlos III, Ministeriode Sanidad y Consumo, Spain).
C© 2009 The Authors. Journal compilation C© 2010 The Physiological Society

1
Skeletal muscle signalling in response to sprint exercise: sex
differences?
Teresa Fuentes1, Borja Guerra1, Jesús G. Ponce-González1, David Morales-Alamo1,
Amelia Guadalupe-Grau1, Hugo Olmedillas1, Leandro Fernández-Pérez2, Alfredo
Santana1,4,5, Lorena Rodríguez-García, José A.L. Calbet1.
1 Department of Physical Education, University of Las Palmas de Gran Canaria, Campus Universitario de
Tafira s/n, Las Palmas de Gran Canaria, 35017, Spain.
2 Department of Clinical Sciences, Molecular and Translational Endocrinology Group, University of Las
Palmas de Gran Canaria, Dr. Pasteur s/n, Canary Islands, Spain.
3 Endocrinology Service, Hospital de Gran Canaria Dr. Negrín, Bco Ballena s/n, Las Palmas de Gran
Canaria, 35013, Spain
4 Genetic Unit, Chilhood Hospital-Materno Infantil de Las Palmas, Avenida Marítima, del Sur s/n, Las
Palmas de Gran Canaria, 35016, Spain.
5 Research Unit, Hospital de Gran Canaria Dr. Negrín, Bco Ballena s/n, Las Palmas de Gran Canaria,
35013, Spain
Running title: Muscle signalling to sprint exercise in men and women
Correspondence to:
Jose A L Calbet
Departamento de Educación Física, Campus Universitario de Tafira,
35017 Las Palmas de Gran Canaria, Canary Island, Spain.
Tel: 0034 928 458 896
Fax: 0034 928 458 867
email:[email protected]
2
Abstract
Sprint exercise leads to the activation of several signaling cascades, particularly those
involved in the regulation of metabolism and the response to cellular stress in the
skeletal muscle. Despite differences between men and women in both the metabolic
response to endurance and sprint exercise no single study has determined whether a sex
dimorphism in skeletal muscle signaling response to sprint exercise exists in humans.
To investigate this, seventeen men and ten women performed a 30-s Wingate test.
Muscle biopsies were taken before, immediately after the exercise and at 30 and 120
minutes during the recovery period. Thr172-AMPKα, ACCβ Ser221, Thy705-STAT3,
Thy202/Thy204-ERK1/2 and Thy180/Thy182-p38MAPK phosphorylation responses to
sprint exercise were similar in men and women. Thr172-AMPKα phosphorylation was
enhanced fourfold 30 min after the sprint exercise in males and females (P< 0.01). The
ACCβ Ser221 phosphorylation was enhanced by about threefold just after the sprint test
exercise and 30 min into the recovery period in males and females (P< 0.01). Thy705-
STAT3 phosphorylation was increased two hours after the Wingate test compared to the
value observed right after the end of the exercise (P<0.05) and 30 min after the Wingate
test there was a 2.5-fold increase in Thy202/Thy204-ERK1/2 phosphorylation, compared
to both the pre-exercise and to the value observed right after the Wingate test (both,
P<0.05). In conclusion, the muscle signaling response to a single bout of sprint exercise
mediated by AMPK, ACC, STAT3, ERK and p38MAPK is essentially similar in men
and women. Marked increases in AMPK, ACC, STAT3, and ERK phosphorylation
were observed after a single 30s all-out sprint (Wingate test) in the vastus lateralis.
3
Introduction
Sprint exercise alters the energy charge of cell (Chen et al., 2000), modifies the redox
state (Cuevas et al., 2005; Kang et al., 2009), and elicits marked changes in
intracellular concentrations of Ca++ (Ortenblad et al., 2000), metabolites (Cheetham et
al., 1986; Gaitanos et al., 1993; McKenna et al., 1993; Greenhaff et al., 1994) and
electrolytes (Harmer et al., 2000). This leads to the activation of several signalling
cascades, particularly those involved in the regulation of metabolism and the response
to cellular stress in the skeletal muscle (Chen et al., 2000; Treebak et al., 2007; Gibala
et al., 2009; Guerra et al., 2010). Despite differences between men and women in both
the metabolic response to endurance (Tarnopolsky et al., 1990; Lamont et al., 2003;
Zehnder et al., 2005) and sprint exercise (Esbjornsson et al., 2009), and that a
significant sexual dimorphism exists in neuroendocrine, metabolic, and cardiovascular
counterregulatory responses to exercise in man (Esbjornsson-Liljedahl et al., 1999;
Davis et al., 2000; Esbjornsson-Liljedahl et al., 2002; Esbjornsson et al., 2009), no
single study has determined whether a sex dimorphism in skeletal muscle signalling
response to sprint exercise exists in humans.
One of the main signalling systems activated by sprint exercise in human
skeletal muscle is AMP-activated protein kinase (AMPK). We have recently shown that
a single 30s sprint elicits a 4-fold increase in AMPK phosporylation 30 min after the
end of the sprint (Guerra et al., 2010). The level of AMPK phosphorylation does not
seem to be greater with repeated 30s sprints (Gibala et al., 2009; Guerra et al., 2010).
Phosphorylation and activation of AMPK is mainly regulated by the AMP/ATP ratio
(Hardie, 2003). Since women experience a smaller ATP reduction with repeated sprint
exercise than men (Esbjornsson-Liljedahl et al., 2002), we hypothesized that AMPK
phosphorylation in response to a single sprint exercise could be also attenuated in

4
women compared to men, as previously reported during submaximal prolonged exercise
(Roepstorff et al., 2006).
A single 30s sprint also increases acetyl-coenzyme A carboxilase (ACC)
phosphorylation (a downstream target for AMPK) leading the reduced malonyl-
coenzyme A and increased FA flux into the mitochondria (Ruderman et al., 1999). In
men, ACC phosphorylation have been reported immediately after a 30s sprint (Birk &
Wojtaszewski, 2006; Gibala et al., 2009; Guerra et al., 2010) and ACC remains
phosphorylated during the following 30min of recovery (Guerra et al., 2010). ACC
phosphorylation during sprint exercise may be caused by AMPK dependent and
independent mechanisms (Jorgensen et al., 2004; Sakamoto et al., 2005; Guerra et al.,
2010). It remains unknown if sex differences exist in the sprint exercise-induced ACC
phosphorylation.
Extracellular signal-regulated kinase (ERK1/2) and p38-mitogen activated
protein kinase (MAPK) signalling pathways are also activated during submaximal
exercise in men depending on exercise intensity (Widegren et al., 2000; Richter et al.,
2004; Egan et al., 2010; Little et al., 2010). However, little is known about the
responses of these two kinases to sprint exercise (Gibala et al., 2009).
Compared to men, women have higher serum leptin concentrations and
increased leptin receptors in their skeletal muscles (Guerra et al., 2008). Leptin
promotes fat oxidation (Galgani et al., 2010). Thus women may respond more easily to
exercise-induced changes in circulating leptin concentrations. The leptin response to
sprint exercise has not been studied. We decided to determine if sex differences in the
leptin response could explain differences in skeletal muscle signalling to sprint exercise
through the janus kinase 2 (JAK2)/signal transducer and activator of transcription 3

5
(STAT3) cascade, which is activated by the binding of leptin to the leptin receptor in
skeletal muscle (Bjorbaek & Kahn, 2004).
Therefore, the main aim of this study was to determine if there is a sex
difference in muscle signalling in response to a single sprint exercise and to determine
whether this difference can be explained by sex-specific changes in circulating leptin
concentrations. Another aim was to determine whether a potential sex-difference in the
sprint-induced signalling in skeletal muscle could be explained by the higher mean
power output developed during prolonged sprint by men compared to women.
Material and Methods
Materials
The complete protease inhibitor cocktail was obtained from Roche Diagnostics
(Mannheim, Germany). All the primary antibodies used were from Cell Signaling
Technology (Danvers, MA, USA) except for the polyclonal rabbit antiphospho-acetyl
CoA carboxylase (Ser79) antibody that was obtained from Upstate Biotechnology (Lake
Placid, NY, USA). The secondary HRP-conjugated goat anti-rabbit antibody was from
Jackson Immuno Research (West Grove, PA, USA). The Hybond-P transfer membranes
and the ECL plus Western Blotting Detection System were from Amersham
Biosciences (Little Chalfont, Buckinghamshire, UK). The ChemiDoc XRS System and
the image analysis software Quantity One© were obtained from Bio-Rad Laboratories
(Hemel Hempstead, Hertfordshire, UK).
Subjects
Seventeen healthy male physical education students (age 24.4 ± 4 years, height 176.5 ±
7.1 cm, body mass 79.5 ± 10.1 Kg, body fat 18.0 ± 6.2%) and ten healthy females
physical education students (age 25.2 ± 4 years, height 160.7 ± 5.5 cm, body mass 57.0
6
± 6.7 Kg, body fat 26.3 ± 3.5%) agreed to participate in this investigation (Table 1).
Before volunteering, subjects were given full oral and written information about the
course of the study and possible risks associated with participation. Written consent was
obtained from each subject. The study was performed in accordance with the Helsinki
Declaration and approved by the Ethical Committee of the University of Las Palmas de
Gran Canaria.
General procedures
The body composition of each subject was determined by DXA (Hologic QDR-1500,
Hologic Corp., software version 7.10, Waltham, MA) as described elsewhere (Ara et
al., 2004; Perez-Gomez et al., 2008b). On a different day, subjects reported to the
laboratory at 8.00 after an overnight fast and an antecubital vein was catheterized. After
10 min rest in the supine position a 20 ml blood sample was withdrawn and used to
measure serum leptin. Then a muscle biopsy was obtained from the middle portion of
the vastus lateralis muscle using the Bergstrom’s technique with suction, as described
elsewhere (Guerra et al., 2007; Perez-Gomez et al., 2008b). Three minutes after the
resting muscle biopsy and blood sample, the subject performed a 30 seconds Wingate
test with a braking force equivalent to 8 and 10% of their body mass (women and men,
respectively) as described elsewhere (Calbet et al., 1997; Calbet et al., 2003). No warm
up was allowed prior to the start of the Wingate test. Right after the Wingate test
another muscle biopsy and a blood sample were obtained. The time needed to obtain
and freeze the muscle biopsies immediately after the Wingate test was always below 30
s in all cases. To avoid injury-triggered activation of p38 MAPK or ERK1/2 the muscle
biopsies were obtained at least 3 cm apart, following the same procedures as those
described by Drummond et al.(2009) and by Guerra et al. (2010). During the following

7
2 hours the subjects were fasting and sat quietly in laboratory or in the library of our
Faculty. During the recovery period additional muscle biopsies and blood samples were
obtained at 30 and 120 minutes. The last two muscle biopsies were obtained from the
contra lateral leg. Only one incision was practiced in each thigh. The muscle specimens
were cleaned to remove any visible blood, fat, or connective tissue. Then the muscle
tissue was immediately frozen in liquid nitrogen and stored at -80°C for later analysis.
Since sprinting performance is not affected the phase of the menstrual cycle
(Tsampoukos et al., 2010) this variable was not controlled in these experiments.
Western blot analysis
Muscle protein extracts were prepared as described previously (Guerra et al., 2007) and
total protein content was quantified using the bicinchoninic acid assay (Smith et al.,
1985). Equal amounts (50 μg) of each sample were subjected to immunobloting
protocol as described previously (Guerra et al., 2007). To determine Thr172-AMPKα,
Ser221-ACCβ, Tyr705-STAT3, Thr202/Tyr204-ERK1/2 and Thr180/Tyr182-p38 MAPK
phosphorylation levels antibodies directed against the phosphorylated and total form of
these kinases were used all diluted in 5% bovine serum albumin in Tris-buffered saline
with 0.1% Tween 20 (TBS-T) (BSA-blocking buffer). Antibody-specific labeling was
revealed by incubation with a HRP-conjugated goat anti-rabbit antibody (1:20,000) or a
HRP-conjugated donkey anti-mouse (1:10,000) antibody both diluted in blotto blocking
buffer and visualized with the ECL chemiluminiscence kit (Amersham Bisociences).
Specific bands were visualized with the ECL chemiluminescence kit, using the
ChemiDoc XRS system (Bio-Rad Laboratories, Hercules, CA, USA) and analyzed with
the image analysis program Quantity one© (Bio-Rad laboratories, Hercules, CA, USA).
The densitometry analysis was carried out immediately before saturation of the
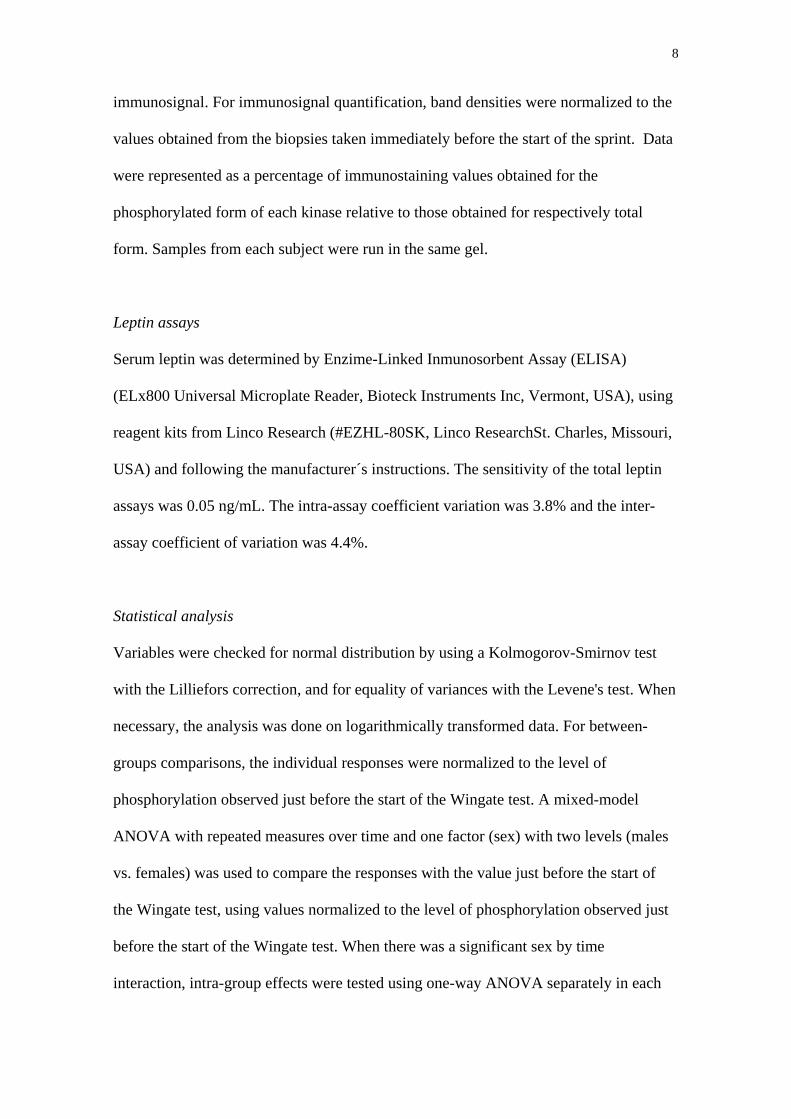
8
immunosignal. For immunosignal quantification, band densities were normalized to the
values obtained from the biopsies taken immediately before the start of the sprint. Data
were represented as a percentage of immunostaining values obtained for the
phosphorylated form of each kinase relative to those obtained for respectively total
form. Samples from each subject were run in the same gel.
Leptin assays
Serum leptin was determined by Enzime-Linked Inmunosorbent Assay (ELISA)
(ELx800 Universal Microplate Reader, Bioteck Instruments Inc, Vermont, USA), using
reagent kits from Linco Research (#EZHL-80SK, Linco ResearchSt. Charles, Missouri,
USA) and following the manufacturer´s instructions. The sensitivity of the total leptin
assays was 0.05 ng/mL. The intra-assay coefficient variation was 3.8% and the inter-
assay coefficient of variation was 4.4%.
Statistical analysis
Variables were checked for normal distribution by using a Kolmogorov-Smirnov test
with the Lilliefors correction, and for equality of variances with the Levene's test. When
necessary, the analysis was done on logarithmically transformed data. For between-
groups comparisons, the individual responses were normalized to the level of
phosphorylation observed just before the start of the Wingate test. A mixed-model
ANOVA with repeated measures over time and one factor (sex) with two levels (males
vs. females) was used to compare the responses with the value just before the start of
the Wingate test, using values normalized to the level of phosphorylation observed just
before the start of the Wingate test. When there was a significant sex by time
interaction, intra-group effects were tested using one-way ANOVA separately in each

9
group, and pairwise comparisons were carried out using the Holm–Bonferroni method.
Unpaired t-tests were used for planned comparisons to test between-group differences at
specific time points, the corresponding P values were adjusted for multiple comparisons
with the Holm–Bonferroni method. The relationship between variables was determined
using linear regression analysis. Values are reported as the mean ± standard error of the
mean (unless otherwise stated). P < 0.05 was considered significant. Statistical analysis
was performed using SPSS v.15.0 for Windows (SPSS Inc., Chicago, IL).
Results
Body composition, Pmax and Pmean in the Wingate test are reported in the Table 1.
Both genders were comparable in age, but women were smaller and had lower body
mass and higher percentage of body fat compared to men (all, P< 0.01). Men had higher
performance in the Wingate test. However, when Pmax was expressed relative to the
lean mass of the lower extremities not significant between-sex differences were
observed (Table 1.). The blood lactate responses to the Wingate test were similar in
males and females (time x sex interaction P=0.74) (Table 2) and the area under the
curve as well (110±14 and 103±8 mM.min, in men and women, respectively, P=0.22).
Serum leptin concentrations
Serum leptin concentration was higher in women compared to men at all time points.
Compared to pre-exercise values, 2 hours after exercise, leptin concentration was
decreased in men by 27% (P<0.01) and women by 13% (P<0.01). (Time x sex
interaction P<0.01) (Table 3). There was no relationship between the lactate area under
the curve and the leptin area under the curve (r=-0.19, P=0.33, n=27). However, the
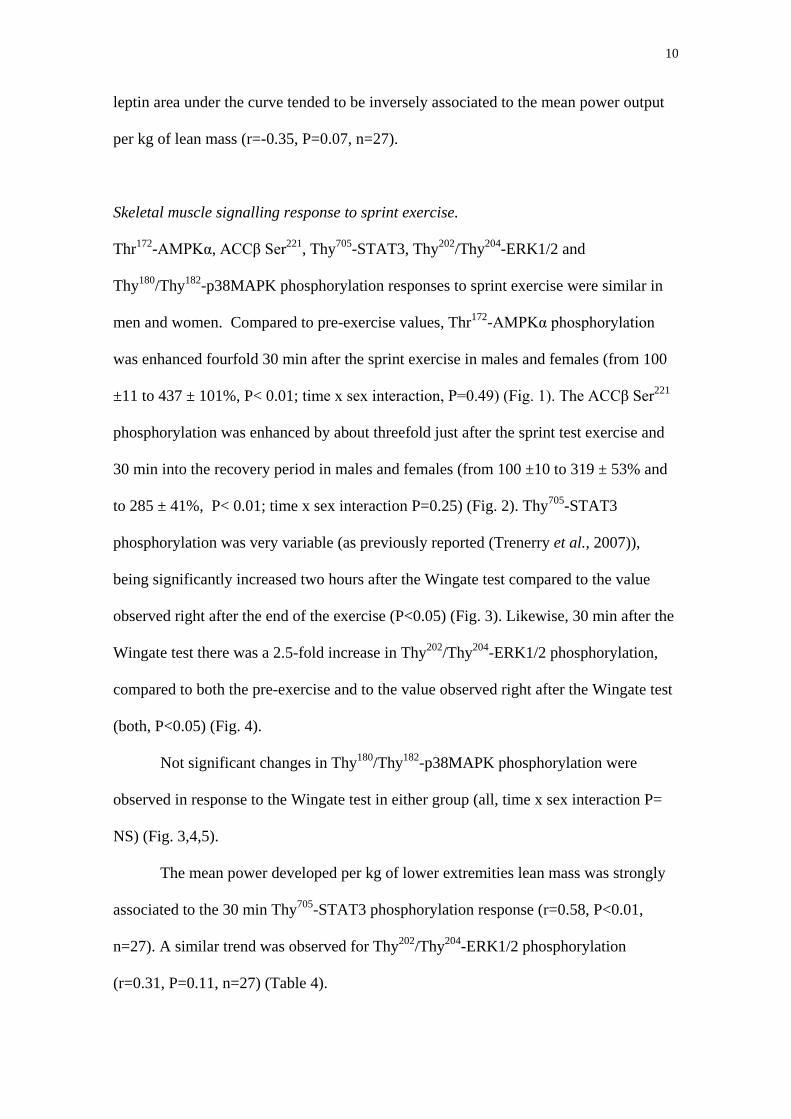
10
leptin area under the curve tended to be inversely associated to the mean power output
per kg of lean mass (r=-0.35, P=0.07, n=27).
Skeletal muscle signalling response to sprint exercise.
Thr172-AMPKα, ACCβ Ser221, Thy705-STAT3, Thy202/Thy204-ERK1/2 and
Thy180/Thy182-p38MAPK phosphorylation responses to sprint exercise were similar in
men and women. Compared to pre-exercise values, Thr172-AMPKα phosphorylation
was enhanced fourfold 30 min after the sprint exercise in males and females (from 100
±11 to 437 ± 101%, P< 0.01; time x sex interaction, P=0.49) (Fig. 1). The ACCβ Ser221
phosphorylation was enhanced by about threefold just after the sprint test exercise and
30 min into the recovery period in males and females (from 100 ±10 to 319 ± 53% and
to 285 ± 41%, P< 0.01; time x sex interaction P=0.25) (Fig. 2). Thy705-STAT3
phosphorylation was very variable (as previously reported (Trenerry et al., 2007)),
being significantly increased two hours after the Wingate test compared to the value
observed right after the end of the exercise (P<0.05) (Fig. 3). Likewise, 30 min after the
Wingate test there was a 2.5-fold increase in Thy202/Thy204-ERK1/2 phosphorylation,
compared to both the pre-exercise and to the value observed right after the Wingate test
(both, P<0.05) (Fig. 4).
Not significant changes in Thy180/Thy182-p38MAPK phosphorylation were
observed in response to the Wingate test in either group (all, time x sex interaction P=
NS) (Fig. 3,4,5).
The mean power developed per kg of lower extremities lean mass was strongly
associated to the 30 min Thy705-STAT3 phosphorylation response (r=0.58, P<0.01,
n=27). A similar trend was observed for Thy202/Thy204-ERK1/2 phosphorylation
(r=0.31, P=0.11, n=27) (Table 4).

11
Discussion
In this investigation, we examined AMPK, MAPK/ERK and STAT3 muscle signaling
pathways in response to a 30s all-out sprint test (Wingate test) in men and women.
Essentially, the response was similar in both groups. We have shown that sprint exercise
increases AMPK phosphorylation at 30 min after the Wingate test and increases ACC
phosphorylation immediately after and also 30 min later, without significant differences
between men and women. These results are in agreement with the study in men of
Guerra et al. (2010) and support the idea of that ACC phoshorylation in response to
exercise is, at less in part, independent of AMPK activation (Jorgensen et al., 2004;
Dzamko et al., 2008). In agreement with the studies performed in men by Gibala
(Gibala et al., 2009) and Guerra (2010), we did not observe AMPKα phosphorylation
immediately after 30-s sprint. We have also shown that two hours after a single sprint
exercise AMPKα phosphorylation has returned to pre-exercise values.
The influence of gender on AMPKα phosphorylation in response to exercise has
been only studied during endurance exercise. Roepstorff et al reported lower AMPKα
phosphorylation in women compared to men after 90 minutes of bicycle exercise at
60% of VO2max (Roepstorff et al., 2006). The sex difference in muscle AMPK activation
with exercise was explained by an increase in muscle free AMP, free AMP/ATP ratio,
and creatine in men but not in women. Although nucleotides were not measured in the
present investigation, previous studies have failed to show between-sex significant
differences in ATP use during a single sprint. The latter agrees with the similar peak
power output developed during the Wingate test by men and women when normalized
for the lean mass of the lower extremities (Perez-Gomez et al., 2008b). However,
Esbjornsson-Liljedahl et al. showed that women possess a faster recovery of ATP via
reamination of IMP (inosine monophosphate) (Esbjornsson-Liljedahl et al., 2002).

12
Despite the latter, no between-sex differences in AMPKα phosphorylation or its
downstream kinase ACC where observed 30 and 120 min after the Wingate test.
The STAT3 phosphorylation response to exercise has been studied only in men
(Boonsong et al., 2007; Trenerry et al., 2007). No significant changes in STAT3
phosphorylation were found after 90 minutes of leg cycling exercise (Boonsong et al.,
2007). However, Trenerry et al. reported increased STAT3 phosphorylation 2 hours
after resistance exercise (leg extension: 3 x 12RM) (Trenerry et al., 2007). The latter,
agrees with the results obtained in the present investigation, where STAT3
phosphorylation occurred 2 hours after the sprint. In our study, there was an association
between the mean power developed per kg of lower extremities lean mass and STAT3
phosphorylation 30 min after the Wingate test, but not latter. Combining our results
with those reported by Trenerry et al. (2007) it may be suggested that exercise intensity
is an important factor determining the STAT3 phosphorylation response to exercise.
STAT3 phosphorylation after intense exercise is accompanied by translocation to the
nucleus (Trenerry et al., 2007) and increased expression of the STAT3-regulated genes
(interleukin-6 (IL-6), JUNB, c-MYC, c-FOS, and suppressor of cytokine signaling
(SOCS) 3), which likely have an important role in the adaptation to high intensity
exercise (Trenerry et al., 2007; Trenerry et al., 2008).
In agreement with our hypothesis ERK1/2 phosphorylation was increased 30
minutes after the sprint without significant differences between men and women.
Similar increases in ERK1/2 phosphorylation have been reported by other in men after
endurance exercise (Goodyear et al., 1996; Widegren et al., 1998; Widegren et al.,
2000; Yu et al., 2001; Creer et al., 2005; Deldicque et al., 2008a), and after resistance
exercise in men (Williamson et al., 2003; Richter et al., 2004; Deldicque et al., 2008a)
and overweight women (Harber et al., 2008). On the other hand, Richter et al. found

13
that ERK1/ 2 phosphorylation was more marked as exercise intensity increased (Richter
et al, 2004). This fact agree with the trend to correlation found in our study between
mean power developed per kg of lower extremities lean mass and the 30 min
Thy202/Thy204-ERK1/2 phosphorylation response. Nevertheless, increased ERK1/2
phosphorylation does imply necessarily more enzymatic activity (Richter et al., 2004).
p38MAPK phosphorylation is increased after endurance exercise in men (Aronson et
al., 1997; Yu et al., 2001) and after resistance exercise in men (Deldicque et al., 2008b)
and overweight women (Harber et al., 2008) and during an high-intensity intermittent
exercise in men (Cochran et al., 2010).
Gibala et al. did not observe changes in p38MAPK phosphorylation immediately
after a single Wingate test (Gibala et al., 2009).The present investigation, confirms
these findings and also shows that the level of p38MAPK phosphorylation remains
unchanged during the next 2 hours after a single sprint. However, after four repeated
Wingate tests interspaced with 4 min rest periods a 30% increase in p38MAPK
phosphorylation was reported by Gibala et al. (Gibala et al., 2009). p38MAPK
phosphorylation in response to high intensity exercise may be modulated by energy
availability (Cochran et al., 2010) and greater perturbation of the cellular energy status
than that elicited by a single sprint may be necessary to elicit p38MAPK
phosphorylation.
This study presents the first measurements of the serum leptin concentration
changes in response to a single 30s all-test (Wingate test) in men and women. Our
investigation reveals that serum leptin concentration is not altered immediately after a
30s sprint exercise, but it decreases during the recovery period, being this effect
significantly more accentuated in men than women. Although our women had higher
leptin concentrations than our men during the recovery period and despite the fact that
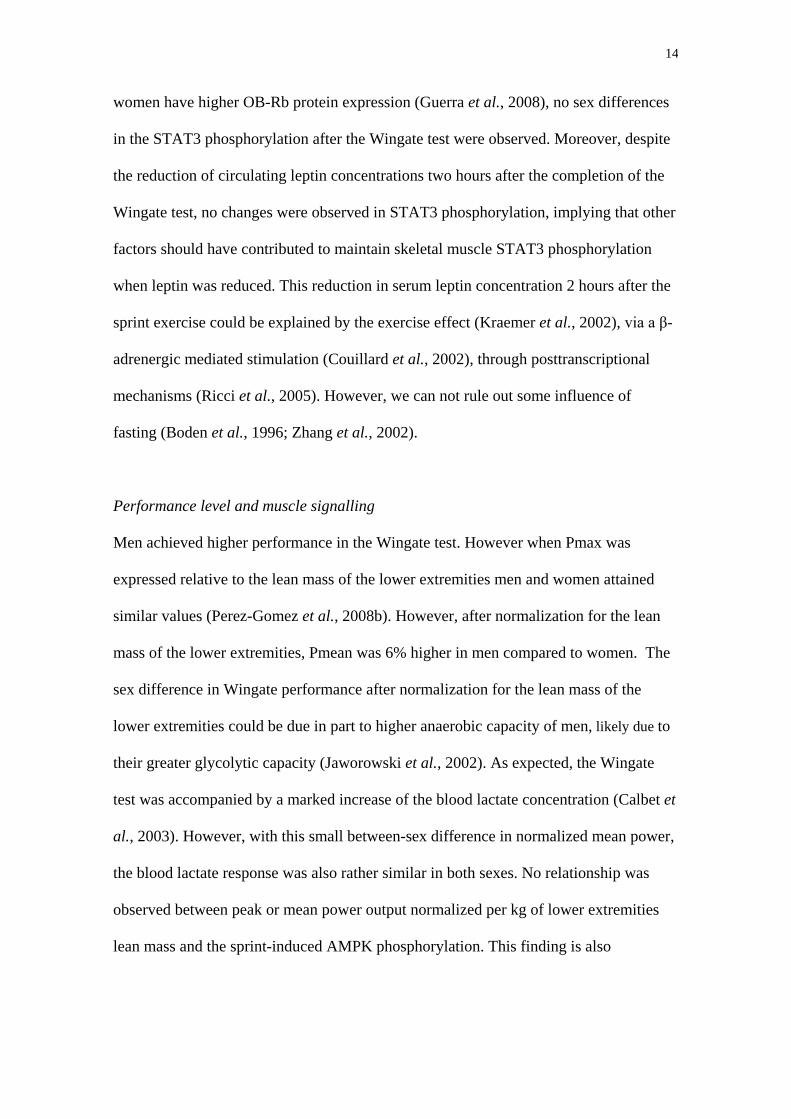
14
women have higher OB-Rb protein expression (Guerra et al., 2008), no sex differences
in the STAT3 phosphorylation after the Wingate test were observed. Moreover, despite
the reduction of circulating leptin concentrations two hours after the completion of the
Wingate test, no changes were observed in STAT3 phosphorylation, implying that other
factors should have contributed to maintain skeletal muscle STAT3 phosphorylation
when leptin was reduced. This reduction in serum leptin concentration 2 hours after the
sprint exercise could be explained by the exercise effect (Kraemer et al., 2002), via a β-
adrenergic mediated stimulation (Couillard et al., 2002), through posttranscriptional
mechanisms (Ricci et al., 2005). However, we can not rule out some influence of
fasting (Boden et al., 1996; Zhang et al., 2002).
Performance level and muscle signalling
Men achieved higher performance in the Wingate test. However when Pmax was
expressed relative to the lean mass of the lower extremities men and women attained
similar values (Perez-Gomez et al., 2008b). However, after normalization for the lean
mass of the lower extremities, Pmean was 6% higher in men compared to women. The
sex difference in Wingate performance after normalization for the lean mass of the
lower extremities could be due in part to higher anaerobic capacity of men, likely due to
their greater glycolytic capacity (Jaworowski et al., 2002). As expected, the Wingate
test was accompanied by a marked increase of the blood lactate concentration (Calbet et
al., 2003). However, with this small between-sex difference in normalized mean power,
the blood lactate response was also rather similar in both sexes. No relationship was
observed between peak or mean power output normalized per kg of lower extremities
lean mass and the sprint-induced AMPK phosphorylation. This finding is also
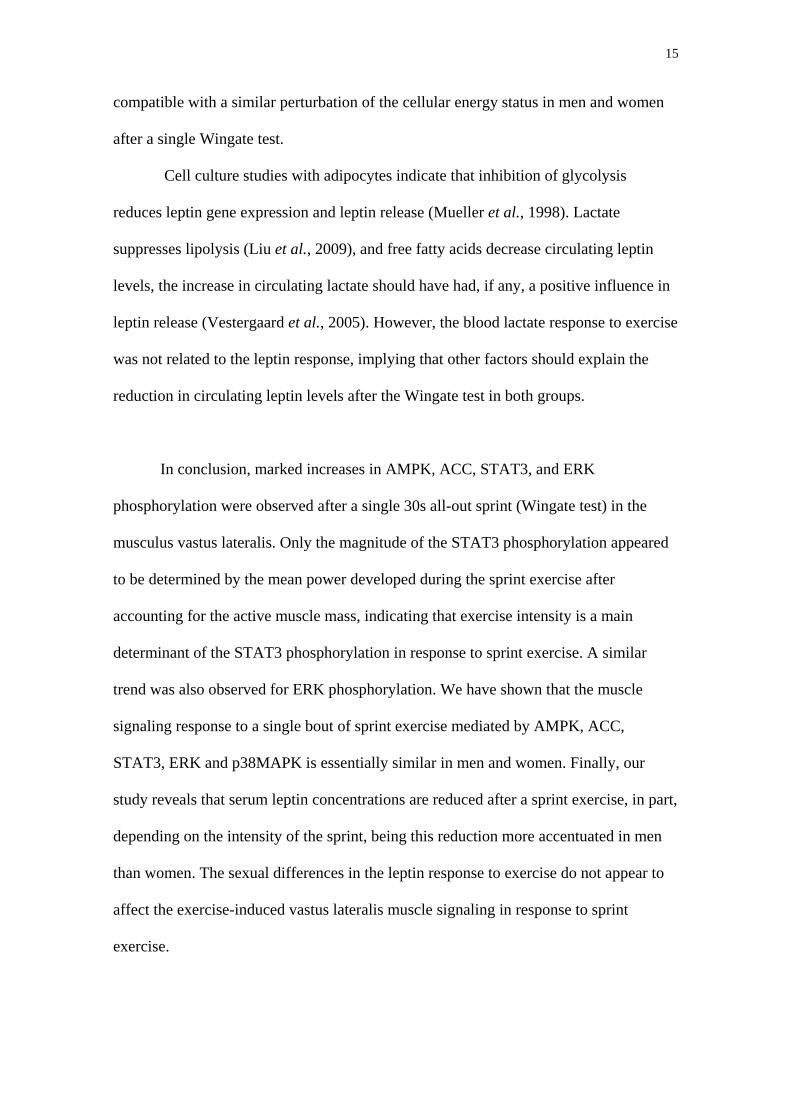
15
compatible with a similar perturbation of the cellular energy status in men and women
after a single Wingate test.
Cell culture studies with adipocytes indicate that inhibition of glycolysis
reduces leptin gene expression and leptin release (Mueller et al., 1998). Lactate
suppresses lipolysis (Liu et al., 2009), and free fatty acids decrease circulating leptin
levels, the increase in circulating lactate should have had, if any, a positive influence in
leptin release (Vestergaard et al., 2005). However, the blood lactate response to exercise
was not related to the leptin response, implying that other factors should explain the
reduction in circulating leptin levels after the Wingate test in both groups.
In conclusion, marked increases in AMPK, ACC, STAT3, and ERK
phosphorylation were observed after a single 30s all-out sprint (Wingate test) in the
musculus vastus lateralis. Only the magnitude of the STAT3 phosphorylation appeared
to be determined by the mean power developed during the sprint exercise after
accounting for the active muscle mass, indicating that exercise intensity is a main
determinant of the STAT3 phosphorylation in response to sprint exercise. A similar
trend was also observed for ERK phosphorylation. We have shown that the muscle
signaling response to a single bout of sprint exercise mediated by AMPK, ACC,
STAT3, ERK and p38MAPK is essentially similar in men and women. Finally, our
study reveals that serum leptin concentrations are reduced after a sprint exercise, in part,
depending on the intensity of the sprint, being this reduction more accentuated in men
than women. The sexual differences in the leptin response to exercise do not appear to
affect the exercise-induced vastus lateralis muscle signaling in response to sprint
exercise.

16
Acknowledgements
This study was supported by grants from the Ministerio de Educación y Ciencia
(BFU2006-13784 and FEDER), FUNCIS (PI/10/07), Proyecto Estructurante de la
ULPGC (ULPAPD-08/01-4), Proyecto de Programa Propio de la ULPGC (ULPGC
2009-07) and Ministerio de Ciencia e Innovación (DEP2010-21866). Special thanks are
given to José Navarro de Tuero and María del Carmen García Chicano for their
excellent technical assistance.
17
References Ara I, Vicente-Rodriguez G, Jimenez-Ramirez J, Dorado C, Serrano-Sanchez JA & Calbet JA
(2004). Regular participation in sports is associated with enhanced physical fitness and lower fat mass in prepubertal boys. Int J Obes Relat Metab Disord 28, 1585-1593.
Aronson D, Violan MA, Dufresne SD, Zangen D, Fielding RA & Goodyear LJ (1997). Exercise
stimulates the mitogen-activated protein kinase pathway in human skeletal muscle. J Clin Invest 99, 1251-1257.
Birk JB & Wojtaszewski JF (2006). Predominant alpha2/beta2/gamma3 AMPK activation
during exercise in human skeletal muscle. J Physiol 577, 1021-1032. Bjorbaek C & Kahn BB (2004). Leptin signaling in the central nervous system and the
periphery. Recent Prog Horm Res 59, 305-331. Boden G, Chen X, Mozzoli M & Ryan I (1996). Effect of fasting on serum leptin in normal
human subjects. J Clin Endocrinol Metab 81, 3419-3423. Boonsong T, Norton L, Chokkalingam K, Jewell K, Macdonald I, Bennett A & Tsintzas K
(2007). Effect of exercise and insulin on SREBP-1c expression in human skeletal muscle: potential roles for the ERK1/2 and Akt signalling pathways. Biochem Soc Trans 35, 1310-1311.
Calbet JA, Chavarren J & Dorado C (1997). Fractional use of anaerobic capacity during a 30-
and a 45-s Wingate test. Eur J Appl Physiol Occup Physiol 76, 308-313. Calbet JA, De Paz JA, Garatachea N, Cabeza de Vaca S & Chavarren J (2003). Anaerobic
energy provision does not limit Wingate exercise performance in endurance-trained cyclists. J Appl Physiol 94, 668-676.
Cochran AJ, Little JP, Tarnopolsky MA & Gibala MJ (2010). Carbohydrate feeding during
recovery alters the skeletal muscle metabolic response to repeated sessions of high-intensity interval exercise in humans. J Appl Physiol 108, 628-636.
Couillard C, Mauriege P, Prud'homme D, Nadeau A, Tremblay A, Bouchard C & Despres JP
(2002). Plasma leptin response to an epinephrine infusion in lean and obese women. Obes Res 10, 6-13.
Creer A, Gallagher P, Slivka D, Jemiolo B, Fink W & Trappe S (2005). Influence of muscle
glycogen availability on ERK1/2 and Akt signaling after resistance exercise in human skeletal muscle. J Appl Physiol 99, 950-956.
Cuevas MJ, Almar M, Garcia-Glez JC, Garcia-Lopez D, De Paz JA, Alvear-Ordenes I &
Gonzalez-Gallego J (2005). Changes in oxidative stress markers and NF-kappaB activation induced by sprint exercise. Free Radic Res 39, 431-439.
Cheetham ME, Boobis LH, Brooks S & Williams C (1986). Human muscle metabolism during
sprint running. J Appl Physiol 61, 54-60. Chen ZP, McConell GK, Michell BJ, Snow RJ, Canny BJ & Kemp BE (2000). AMPK signaling
in contracting human skeletal muscle: acetyl-CoA carboxylase and NO synthase phosphorylation. Am J Physiol Endocrinol Metab 279, E1202-1206.

18
Davis SN, Galassetti P, Wasserman DH & Tate D (2000). Effects of gender on neuroendocrine and metabolic counterregulatory responses to exercise in normal man. J Clin Endocrinol Metab 85, 224-230.
Deldicque L, Atherton P, Patel R, Theisen D, Nielens H, Rennie MJ & Francaux M (2008a).
Decrease in Akt/PKB signalling in human skeletal muscle by resistance exercise. Eur J Appl Physiol 104, 57-65.
Deldicque L, Atherton P, Patel R, Theisen D, Nielens H, Rennie MJ & Francaux M (2008b).
Effects of resistance exercise with and without creatine supplementation on gene expression and cell signaling in human skeletal muscle. J Appl Physiol 104, 371-378.
Drummond MJ, Fry CS, Glynn EL, Dreyer HC, Dhanani S, Timmerman KL, Volpi E &
Rasmussen BB (2009). Rapamycin administration in humans blocks the contraction-induced increase in skeletal muscle protein synthesis. J Physiol 587, 1535-1546.
Dzamko N, Schertzer JD, Ryall JG, Steel R, Macaulay SL, Wee S, Chen ZP, Michell BJ,
Oakhill JS, Watt MJ, Jorgensen SB, Lynch GS, Kemp BE & Steinberg GR (2008). AMPK-independent pathways regulate skeletal muscle fatty acid oxidation. J Physiol 586, 5819-5831.
Egan B, Carson BP, Garcia-Roves PM, Chibalin AV, Sarsfield FM, Barron N, McCaffrey N,
Moyna NM, Zierath JR & O'Gorman DJ (2010). Exercise intensity-dependent regulation of peroxisome proliferator-activated receptor coactivator-1 mRNA abundance is associated with differential activation of upstream signalling kinases in human skeletal muscle. J Physiol 588, 1779-1790.
Esbjornsson-Liljedahl M, Bodin K & Jansson E (2002). Smaller muscle ATP reduction in
women than in men by repeated bouts of sprint exercise. J Appl Physiol 93, 1075-1083. Esbjornsson-Liljedahl M, Sundberg CJ, Norman B & Jansson E (1999). Metabolic response in
type I and type II muscle fibers during a 30-s cycle sprint in men and women. J Appl Physiol 87, 1326-1332.
Esbjornsson M, Norman B, Suchdev S, Viru M, Lindhgren A & Jansson E (2009). Greater
growth hormone and insulin response in women than in men during repeated bouts of sprint exercise. Acta Physiol (Oxf) 197, 107-115.
Gaitanos GC, Williams C, Boobis LH & Brooks S (1993). Human muscle metabolism during
intermittent maximal exercise. J Appl Physiol 75, 712-719. Galgani JE, Greenway FL, Caglayan S, Wong ML, Licinio J & Ravussin E (2010). Leptin
replacement prevents weight loss-induced metabolic adaptation in congenital leptin-deficient patients. J Clin Endocrinol Metab 95, 851-855.
Gibala MJ, McGee SL, Garnham AP, Howlett KF, Snow RJ & Hargreaves M (2009). Brief
intense interval exercise activates AMPK and p38 MAPK signaling and increases the expression of PGC-1alpha in human skeletal muscle. J Appl Physiol 106, 929-934.
Goodyear LJ, Chang PY, Sherwood DJ, Dufresne SD & Moller DE (1996). Effects of exercise
and insulin on mitogen-activated protein kinase signaling pathways in rat skeletal muscle. Am J Physiol 271, E403-408.
19
Greenhaff PL, Nevill ME, Soderlund K, Bodin K, Boobis LH, Williams C & Hultman E (1994). The metabolic responses of human type I and II muscle fibres during maximal treadmill sprinting. J Physiol 478, 149-155.
Guerra B, Fuentes T, Delgado-Guerra S, Guadalupe-Grau A, Olmedillas H, Santana A, Ponce-
Gonzalez JG, Dorado C & Calbet JA (2008). Gender dimorphism in skeletal muscle leptin receptors, serum leptin and insulin sensitivity. PLoS One 3, e3466.
Guerra B, Guadalupe-Grau A, Fuentes T, Ponce-Gonzalez JG, Morales-Alamo D, Olmedillas H,
Guillen-Salgado J, Santana A & Calbet JA (2010). SIRT1, AMP-activated protein kinase phosphorylation and downstream kinases in response to a single bout of sprint exercise: influence of glucose ingestion. Eur J Appl Physiol 109, 731-743.
Guerra B, Santana A, Fuentes T, Delgado-Guerra S, Cabrera-Socorro A, Dorado C & Lopez
Calbet JA (2007). Leptin receptors in human skeletal muscle. J Appl Physiol. Harber MP, Crane JD, Douglass MD, Weindel KD, Trappe TA, Trappe SW & Fink WF (2008).
Resistance exercise reduces muscular substrates in women. Int J Sports Med 29, 719-725. Hardie DG (2003). Minireview: the AMP-activated protein kinase cascade: the key sensor of
cellular energy status. Endocrinology 144, 5179-5183. Harmer AR, McKenna MJ, Sutton JR, Snow RJ, Ruell PA, Booth J, Thompson MW, Mackay
NA, Stathis CG, Crameri RM, Carey MF & Eager DM (2000). Skeletal muscle metabolic and ionic adaptations during intense exercise following sprint training in humans. J Appl Physiol 89, 1793-1803.
Jaworowski A, Porter MM, Holmback AM, Downham D & Lexell J (2002). Enzyme activities
in the tibialis anterior muscle of young moderately active men and women: relationship with body composition, muscle cross-sectional area and fibre type composition. Acta Physiol Scand 176, 215-225.
Jorgensen SB, Viollet B, Andreelli F, Frosig C, Birk JB, Schjerling P, Vaulont S, Richter EA &
Wojtaszewski JF (2004). Knockout of the alpha2 but not alpha1 5'-AMP-activated protein kinase isoform abolishes 5-aminoimidazole-4-carboxamide-1-beta-4-ribofuranosidebut not contraction-induced glucose uptake in skeletal muscle. J Biol Chem 279, 1070-1079.
Kang C, O'Moore KM, Dickman JR & Ji LL (2009). Exercise activation of muscle peroxisome
proliferator-activated receptor-gamma coactivator-1alpha signaling is redox sensitive. Free Radic Biol Med 47, 1394-1400.
Kraemer RR, Chu H & Castracane VD (2002). Leptin and exercise. Exp Biol Med (Maywood)
227, 701-708. Lamont LS, McCullough AJ & Kalhan SC (2003). Gender differences in the regulation of
amino acid metabolism. J Appl Physiol 95, 1259-1265. Little JP, Safdar A, Cermak N, Tarnopolsky MA & Gibala MJ (2010). Acute endurance
exercise increases the nuclear abundance of PGC-1alpha in trained human skeletal muscle. Am J Physiol Regul Integr Comp Physiol 298, R912-917.
Liu C, Wu J, Zhu J, Kuei C, Yu J, Shelton J, Sutton SW, Li X, Yun SJ, Mirzadegan T, Mazur C,
Kamme F & Lovenberg TW (2009). Lactate inhibits lipolysis in fat cells through activation of an orphan G-protein-coupled receptor, GPR81. J Biol Chem 284, 2811-2822.

20
McKenna MJ, Schmidt TA, Hargreaves M, Cameron L, Skinner SL & Kjeldsen K (1993). Sprint training increases human skeletal muscle Na(+)-K(+)-ATPase concentration and improves K+ regulation. J Appl Physiol 75, 173-180.
Mueller WM, Gregoire FM, Stanhope KL, Mobbs CV, Mizuno TM, Warden CH, Stern JS &
Havel PJ (1998). Evidence that glucose metabolism regulates leptin secretion from cultured rat adipocytes. Endocrinology 139, 551-558.
Ortenblad N, Lunde PK, Levin K, Andersen JL & Pedersen PK (2000). Enhanced sarcoplasmic
reticulum Ca(2+) release following intermittent sprint training. Am J Physiol Regul Integr Comp Physiol 279, R152-160.
Perez-Gomez J, Rodriguez GV, Ara I, Olmedillas H, Chavarren J, Gonzalez-Henriquez JJ,
Dorado C & Calbet JA (2008b). Role of muscle mass on sprint performance: gender differences? Eur J Appl Physiol 102, 685-694.
Ricci MR, Lee MJ, Russell CD, Wang Y, Sullivan S, Schneider SH, Brolin RE & Fried SK
(2005). Isoproterenol decreases leptin release from rat and human adipose tissue through posttranscriptional mechanisms. Am J Physiol Endocrinol Metab 288, E798-804.
Richter EA, Vistisen B, Maarbjerg SJ, Sajan M, Farese RV & Kiens B (2004). Differential
effect of bicycling exercise intensity on activity and phosphorylation of atypical protein kinase C and extracellular signal-regulated protein kinase in skeletal muscle. J Physiol 560, 909-918.
Roepstorff C, Thiele M, Hillig T, Pilegaard H, Richter EA, Wojtaszewski JF & Kiens B (2006).
Higher skeletal muscle alpha2AMPK activation and lower energy charge and fat oxidation in men than in women during submaximal exercise. J Physiol 574, 125-138.
Ruderman NB, Saha AK, Vavvas D & Witters LA (1999). Malonyl-CoA, fuel sensing, and
insulin resistance. Am J Physiol 276, E1-E18. Sakamoto K, McCarthy A, Smith D, Green KA, Grahame Hardie D, Ashworth A & Alessi DR
(2005). Deficiency of LKB1 in skeletal muscle prevents AMPK activation and glucose uptake during contraction. Embo J 24, 1810-1820.
Smith PK, Krohn RI, Hermanson GT, Mallia AK, Gartner FH, Provenzano MD, Fujimoto EK,
Goeke NM, Olson BJ & Klenk DC (1985). Measurement of protein using bicinchoninic acid. Anal Biochem 150, 76-85.
Tarnopolsky LJ, MacDougall JD, Atkinson SA, Tarnopolsky MA & Sutton JR (1990). Gender
differences in substrate for endurance exercise. J Appl Physiol 68, 302-308. Treebak JT, Birk JB, Rose AJ, Kiens B, Richter EA & Wojtaszewski JF (2007). AS160
phosphorylation is associated with activation of alpha2beta2gamma1- but not alpha2beta2gamma3-AMPK trimeric complex in skeletal muscle during exercise in humans. Am J Physiol Endocrinol Metab 292, E715-722.
Trenerry MK, Carey KA, Ward AC & Cameron-Smith D (2007). STAT3 signaling is activated
in human skeletal muscle following acute resistance exercise. J Appl Physiol 102, 1483-1489.
Trenerry MK, Carey KA, Ward AC, Farnfield MM & Cameron-Smith D (2008). Exercise-
induced activation of STAT3 signaling is increased with age. Rejuvenation Res 11, 717-724.
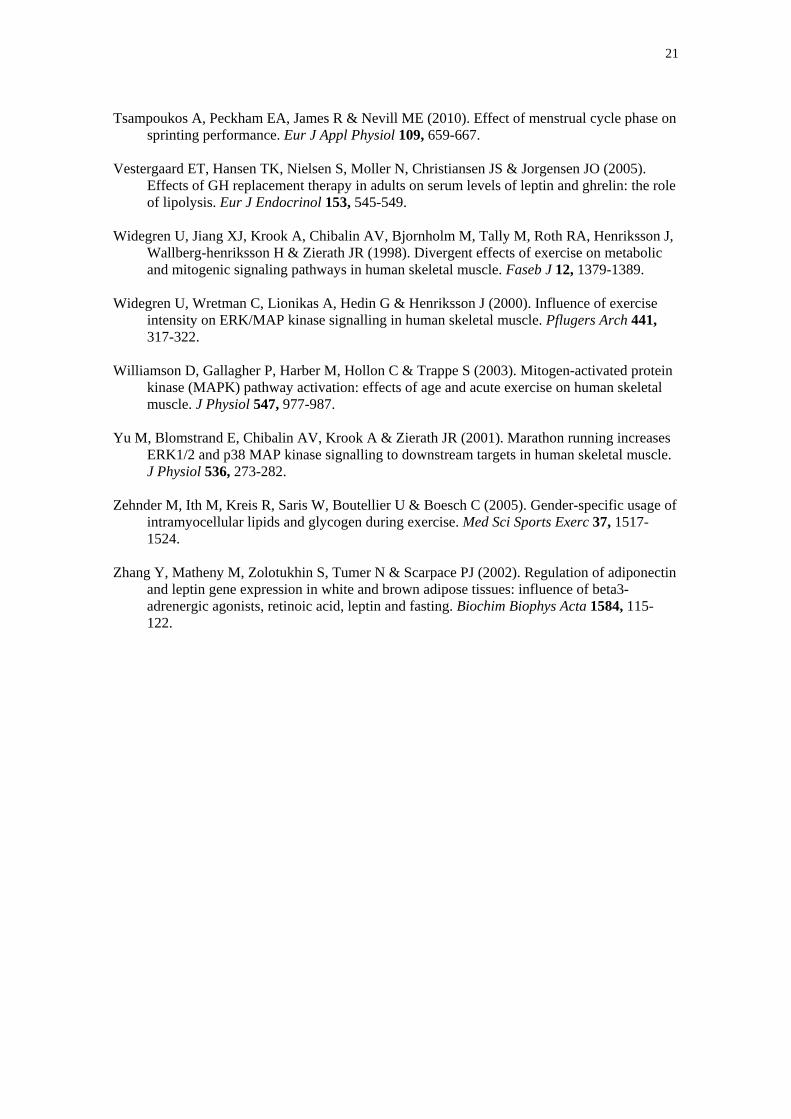
21
Tsampoukos A, Peckham EA, James R & Nevill ME (2010). Effect of menstrual cycle phase on
sprinting performance. Eur J Appl Physiol 109, 659-667. Vestergaard ET, Hansen TK, Nielsen S, Moller N, Christiansen JS & Jorgensen JO (2005).
Effects of GH replacement therapy in adults on serum levels of leptin and ghrelin: the role of lipolysis. Eur J Endocrinol 153, 545-549.
Widegren U, Jiang XJ, Krook A, Chibalin AV, Bjornholm M, Tally M, Roth RA, Henriksson J,
Wallberg-henriksson H & Zierath JR (1998). Divergent effects of exercise on metabolic and mitogenic signaling pathways in human skeletal muscle. Faseb J 12, 1379-1389.
Widegren U, Wretman C, Lionikas A, Hedin G & Henriksson J (2000). Influence of exercise
intensity on ERK/MAP kinase signalling in human skeletal muscle. Pflugers Arch 441, 317-322.
Williamson D, Gallagher P, Harber M, Hollon C & Trappe S (2003). Mitogen-activated protein
kinase (MAPK) pathway activation: effects of age and acute exercise on human skeletal muscle. J Physiol 547, 977-987.
Yu M, Blomstrand E, Chibalin AV, Krook A & Zierath JR (2001). Marathon running increases
ERK1/2 and p38 MAP kinase signalling to downstream targets in human skeletal muscle. J Physiol 536, 273-282.
Zehnder M, Ith M, Kreis R, Saris W, Boutellier U & Boesch C (2005). Gender-specific usage of
intramyocellular lipids and glycogen during exercise. Med Sci Sports Exerc 37, 1517-1524.
Zhang Y, Matheny M, Zolotukhin S, Tumer N & Scarpace PJ (2002). Regulation of adiponectin
and leptin gene expression in white and brown adipose tissues: influence of beta3-adrenergic agonists, retinoic acid, leptin and fasting. Biochim Biophys Acta 1584, 115-122.

22
Legends to figures. Fig. 1. Levels of Thr172-AMPKα phosphorylation, before and after a Wingate test in
males group (black bars) and female group (grey bars). Values were normalized to the
average obtained immediately before the sprint exercise (R), which were assigned a
value of 100%. * P< 0.05 versus rest (R). P= 0.49, time x sex interaction. (n= 17 for the
male group and n= 10 for the female group).
Fig. 2. Levels of ACCβ Ser221 phosphorylation, before and after a Wingate test in males
group (black bars) and female group (grey bars). Values were normalized to the average
obtained immediately before the sprint exercise (R), which were assigned a value of
100%. * P< 0.05 versus rest (R). P= 0.14, time x sex interaction. (n= 17 for the male
group and n= 10 for the female group).
Fig. 3. Levels of Thy705-STAT3 phosphorylation, before and after a Wingate test in
males group (black bars) and female group (grey bars). Values were normalized to the
average obtained immediately before the sprint exercise (R), which were assigned a
value of 100%. $ P< 0.05 versus post (0). P= 0.32, time x sex interaction. (n= 17 for the
male group and n= 10 for the female group). Statistical analysis performed with
logarithmically transformed data.
Fig. 4. Levels of Thy202/Thy204-ERK1/2 phosphorylation, before and after a Wingate
test in males group (black bars) and female group (grey bars). Values were normalized
to the average obtained immediately before the sprint exercise (R), which were assigned
a value of 100%.* P< 0.05 versus rest (R). $ P< 0.05 versus immediately after exercise
(0). P= 0.12, time x sex interaction. (n= 17 for the male group and n= 10 for the female
group).
Fig. 5. Levels of Thy180/Thy182-p38MAPK phosphorylation, before and after a Wingate
test in males group (black bars) and female group (grey bars). Values were normalized
to the average obtained immediately before the sprint exercise (R), which were assigned
a value of 100%. P= 0.42, time x sex interaction. (n= 17 for the male group and n= 10
for the female group).

23
Table 1. Physical characteristics and performance (mean ± SD).
Men (n=17) Women (n=10)
Age (years) 24.4 ± 4 25.2 ± 4
Height (cm) 176.5 ± 7.1 160.7 ± 5.5*
Body mass (Kg) 79.5 ± 10.1 57.0 ± 6.7*
% Body Fat 18.0 ± 6.2 26.3 ± 3.5*
Pmax (W) 1,010.0 ± 128.2 586.4 ± 55.6*
Pmax (W/Kg body mass) 12.8 ± 01.8 10.4 ± 1.2*
Pmax (W/Kg lean leg mass) 52.0 ± 5.8 50.5 ± 3.9
Pmean (W) 618.1 ± 86.9 348.8 ± 82.4*
Pmean (W/Kg body mass) 26.1 ± 5.1 14.3 ± 4.5*
Pmean (W/Kg lean leg mass) 32.0 ± 4.2 29.7 ± 5.0*
Pmax, Pmean peak and mean power output in the Wingate test. * P< 0.05

24
Table 2. Lactate concentration (mmol.L-1) prior to and during the recovery period after the
sprint exercise in men and women (mean ± SD).
Lactate (mmol.L-1) R 3 min 5 min 7 min 10 min
Group by time
interaction
Men (n=17) 0.9 ± 0.0 12.2 ± 0.4& 12.9 ± 0.4*&
13.1 ± 0.5*& 12.7 ± 0.5&
P= 0.74 Women (n=10) 1.3 ± 0.3 11.6 ± 0.3& 12.3 ±
0.3*& 12.1 ± 0.3
*& 11.8 ± 0.4&
* P< 0.05 versus 3 min. after exercise; & P< 0.05 versus rest (R).
Table 3. Leptin concentration (ng.mL-1) prior to and during the recovery period after the sprint
exercise in men and women (mean ± SD).
Leptin (ng.mL-1) R 0 30 min 120 min
Mean ± SD Mean ± SD Mean ± SD Mean ± SD Group by time interaction
Men (n=17) 5.1 ± 0.9 5.1 ± 0.9 4.5 ± 0.9 3.6 ± 0.7* P<0.01
Women (n=10) 13.5 ± 1.9& 14.3 ± 1.9& 13.3 ± 1.9& 11.8 ± 1.9&* P<0.01
* P< 0.05 versus rest (R); & P< 0.05 compared to men.

25
Table 4. Correlation matrix between ergometric variables and signalling at the 30 min time point after a single Wingate test (n=27 in all cases).
AUC Leptin
AUC Lactate
Pmax/kg Lean
Pmean/Kg Lean
pACCβ 30 min
pAMPKα 30 min
pERK1/2 30 min
Log pSTAT3 30 min
AUC Leptin (ng-mL-1.min) r P AUC Lactate (nM.min) r -0.19 P 0.34 Pmax (W/Kg lean leg mass) r -0.06 0.39 P 0.76 0.04 Pmean (W/Kg lean leg mass) r -0.35 0.40 0.45 P 0.07 0.04 0.02 pACCβ 30 min r -0.27 0.31 0.19 -0.07 P 0.18 0.11 0.35 0.74 pAMPKα 30 min r 0.02 0.06 -0.07 0.16 -0.26 P 0.92 0.76 0.71 0.42 0.20 pERK1/2 30 min r -0.02 0.22 -0.17 0.31 -0.32 0.29 P 0.91 0.27 0.39 0.11 0.10 0.15 Log pSTAT3 30 min r 0.05 0.05 -0.11 0.58 -0.39 0.52 0.52
P 0.79 0.80 0.60 0.002 0.04 0.01 0.01
AUC: area under the curve; pACCβ 30 min: ACCβ Ser221 phosphorylation 30 min after the Wingate test; pAMPKα 30 min: Thr172-AMPKα phosphorylation 30 min after the Wingate test; pERK1/2 30 min : Thy202/Thy204-ERK1/2 30 min after the Wingate test; Log pSTAT3 30 min; Logarithm of Thy705-STAT3 phosphorylation 30 min after the Wingate test.

26
Figure 1.
Figure 2.
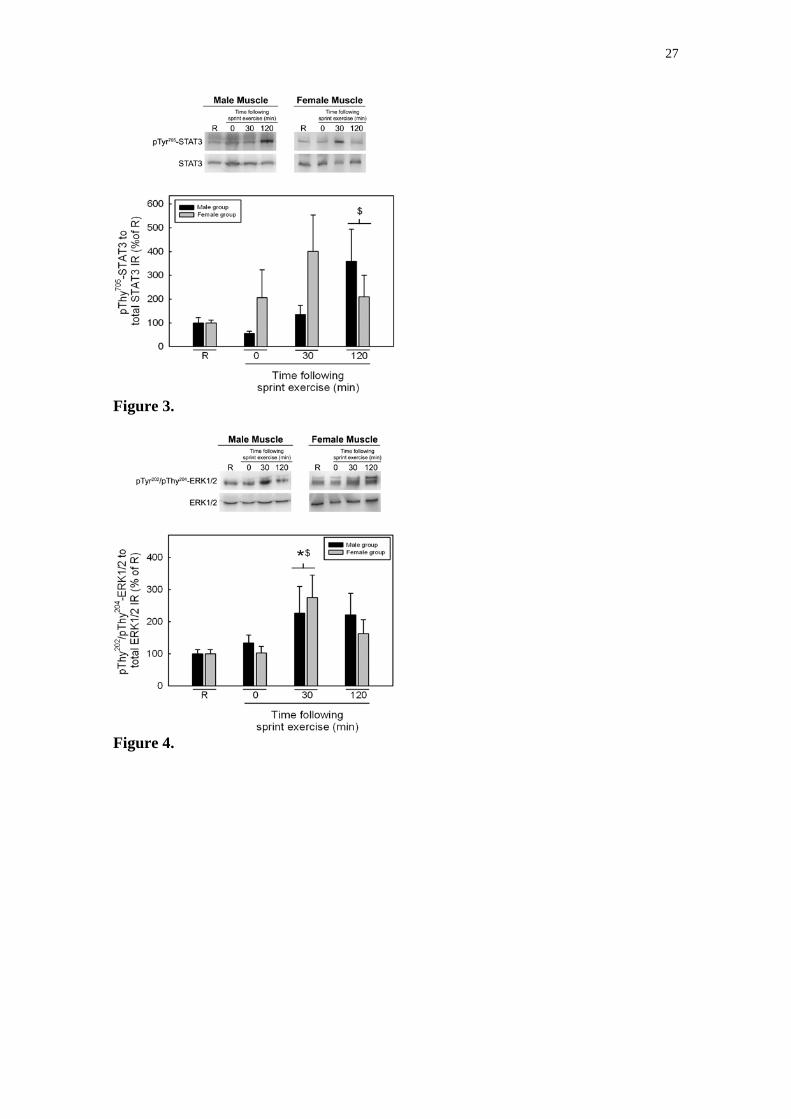
27
Figure 3.
Figure 4.

28
Figure 5.
![Hosp. Doce de octubre.ppt [Sólo lectura] · ?- drepanocitosis?- Hb inestables?Membrana del hematíe: ?esferocitosis hereditaria (esferocitos)?Eliptocitosis?Defecto leptina (lipds)](https://cdn.vdocumento.com/doc/165x107/5bb4c41709d3f2c0138da6ff/hosp-doce-de-solo-lectura-drepanocitosis-hb-inestablesmembrana-del.jpg)


