Renewable Energy Asia 2015
3rd June 2015BITEC
The Future of Renewable Energy
in Thailand
Opportunities and Challenges
Dr. Praipol Koomsup
1
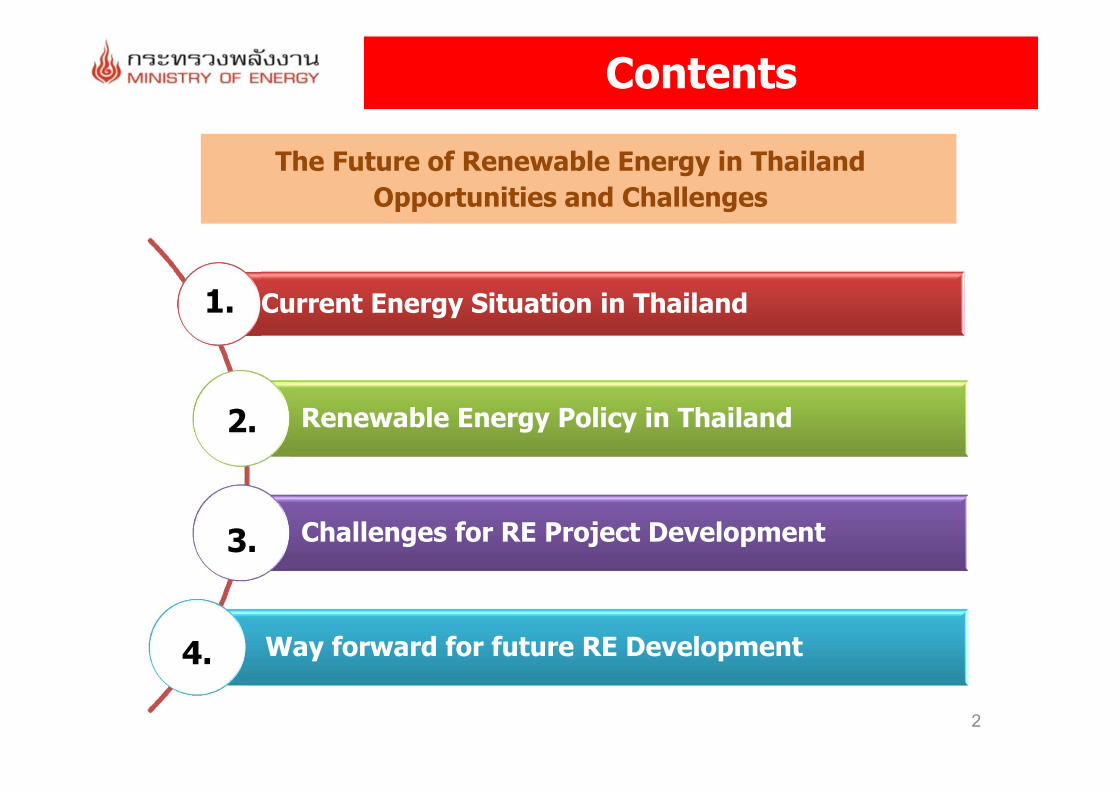
Contents
Current Energy Situation in Thailand
Renewable Energy Policy in Thailand
Challenges for RE Project Development
Way forward for future RE Development
1.
2.
3.
4.
The Future of Renewable Energy in ThailandOpportunities and Challenges
2
1. Current Energy Situation in Thailand
3
2
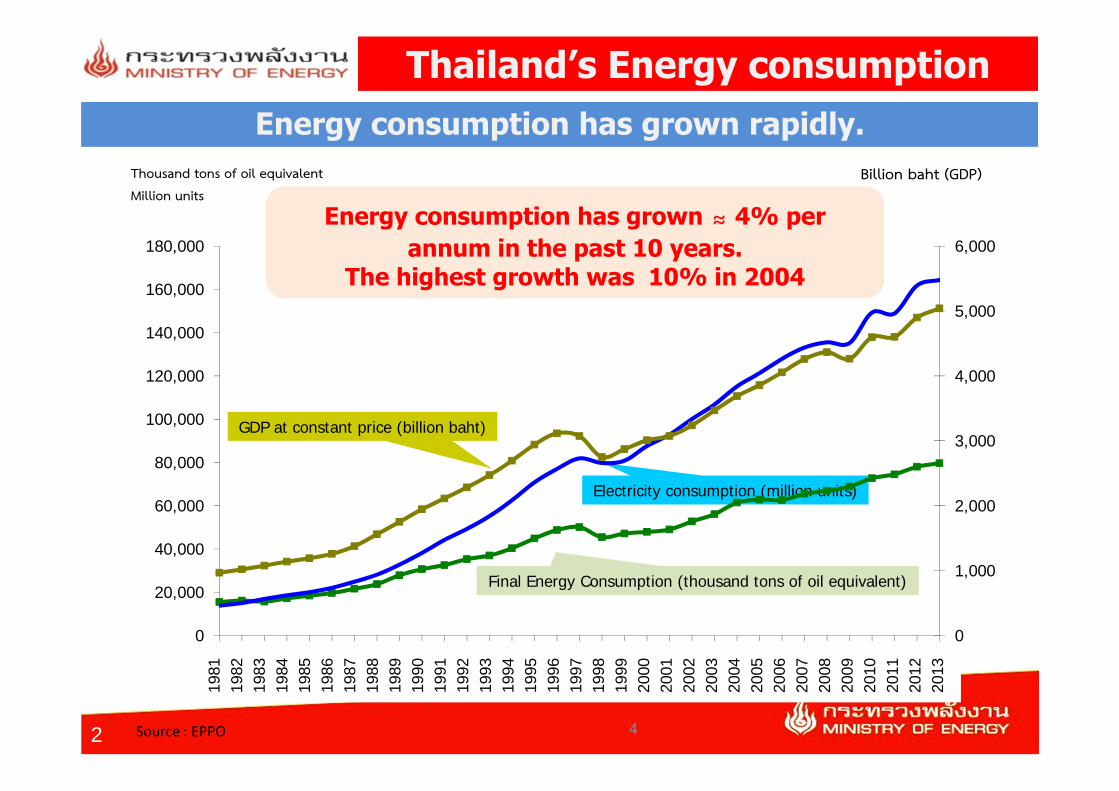
Thailand’s Energy consumptionEnergy consumption has grown rapidly.
Final Energy Consumption (thousand tons of oil equivalent)
Thousand tons of oil equivalent
Million unitsBillion baht (GDP)
GDP at constant price (billion baht)
Electricity consumption (million units)
Source : EPPO
Energy consumption has grown ≈ 4% per annum in the past 10 years.
The highest growth was 10% in 2004
0
1,000
2,000
3,000
4,000
5,000
6,000
0
20,000
40,000
60,000
80,000
100,000
120,000
140,000
160,000
180,00025
2425
2525
2625
2725
2825
2925
3025
3125
3225
3325
3425
3525
3625
3725
3825
3925
4025
4125
4225
4325
4425
4525
4625
4725
4825
4925
5025
5125
5225
5325
5425
5525
56
1981
1982
1983
1984
1985
1986
1987
1988
1989
1990
1991
1992
1993
1994
1995
1996
1997
1998
1999
2000
2001
2002
2003
2004
2005
2006
2007
2008
2009
2010
2011
2012
2013
4
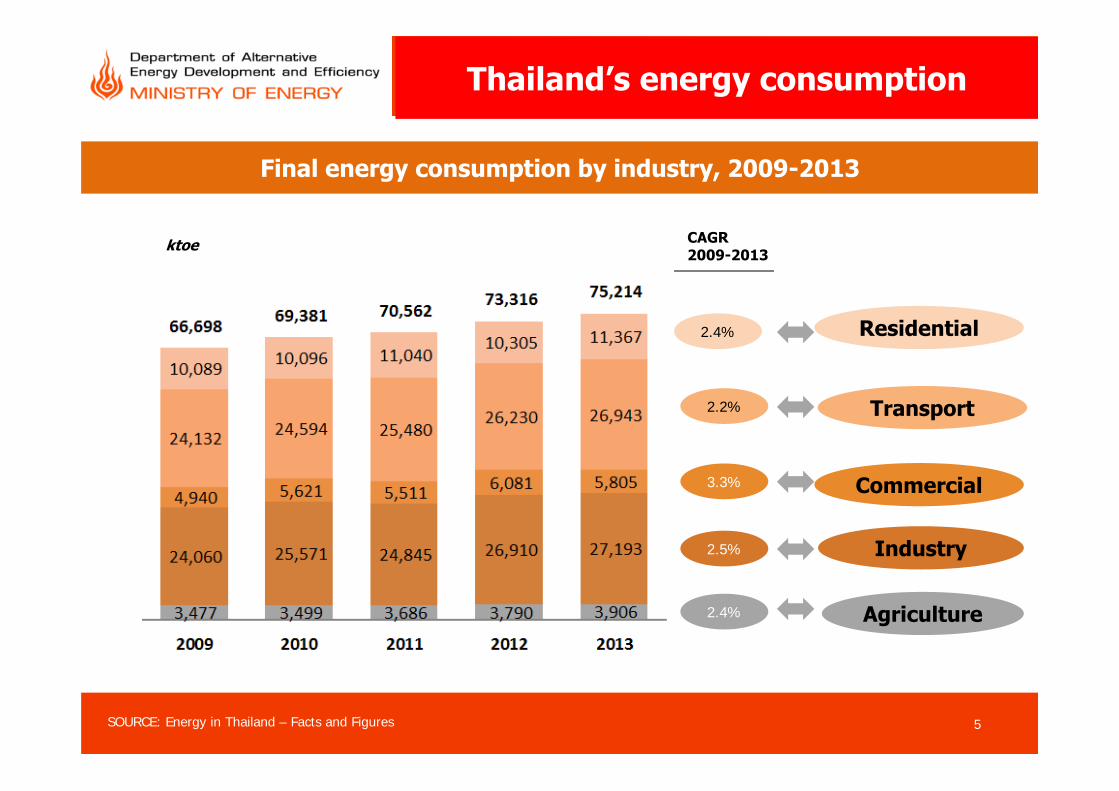
5SOURCE: Energy in Thailand – Facts and Figures
Final energy consumption by industry, 2009-2013
CAGR 2009-2013
2.4%
2.2%
3.3%
2.5%
2.4% Agriculture
Industry
Commercial
Transport
Residential
ktoe
Thailand’s energy consumption
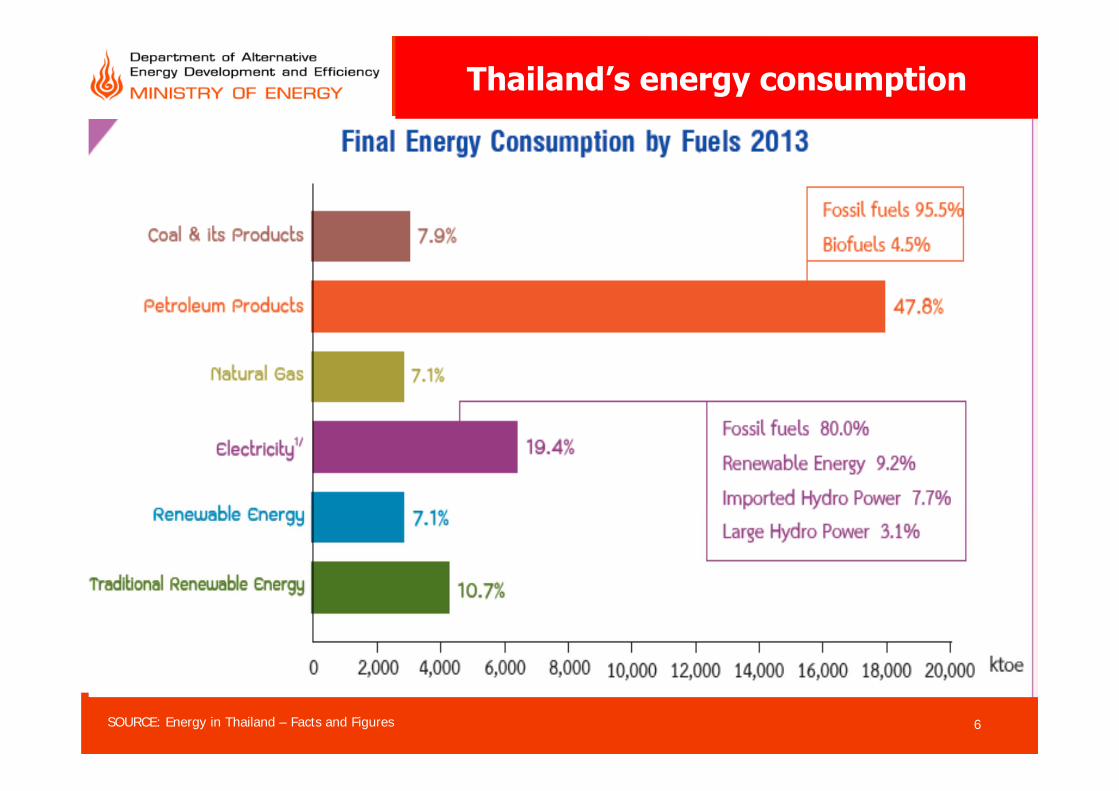
6SOURCE: Energy in Thailand – Facts and Figures
Thailand’s energy consumption

7SOURCE: Energy in Thailand – Facts and Figures
Thailand’s energy supply
• Thailand relies heavily on imported energy
–Import over 90% of crude oil, 80% from the
middle east
–Import 30% of natural gas
–2/3 of commercial energy is imported

2
Electricity Generation
Year GWhChange
GWh (%)
2009 148,358 137 0.1
2010 163,668 15,310 10.3
2011 162,343 -1,325 -0.8
2012 176,973 14,630 9.0
2013 177,398 425 0.2
2014p 180,919 3,520 2.0
p: Preliminary
67%19%
0.1%3% 11%
Natural gasCoal/Lignite
Import and other
HydroOil
Electricity Generation Fuel Mix*
8
2
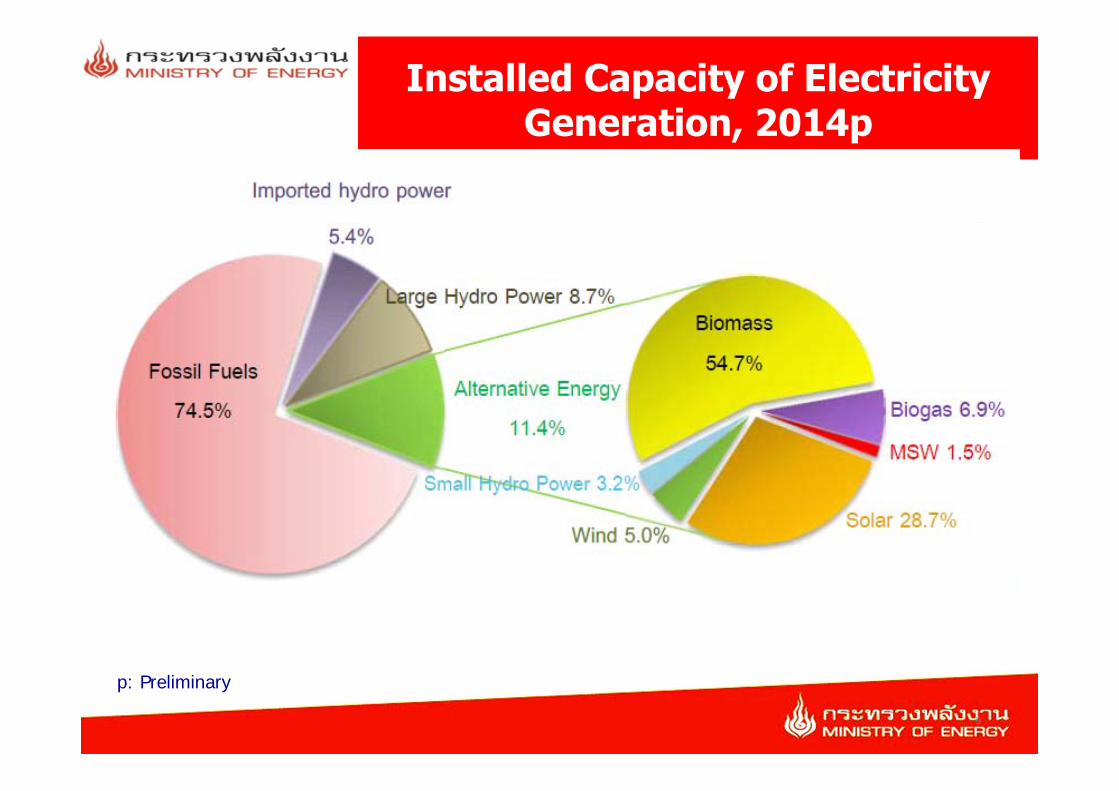
Installed Capacity of Electricity Generation, 2014p
p: Preliminary
9
2
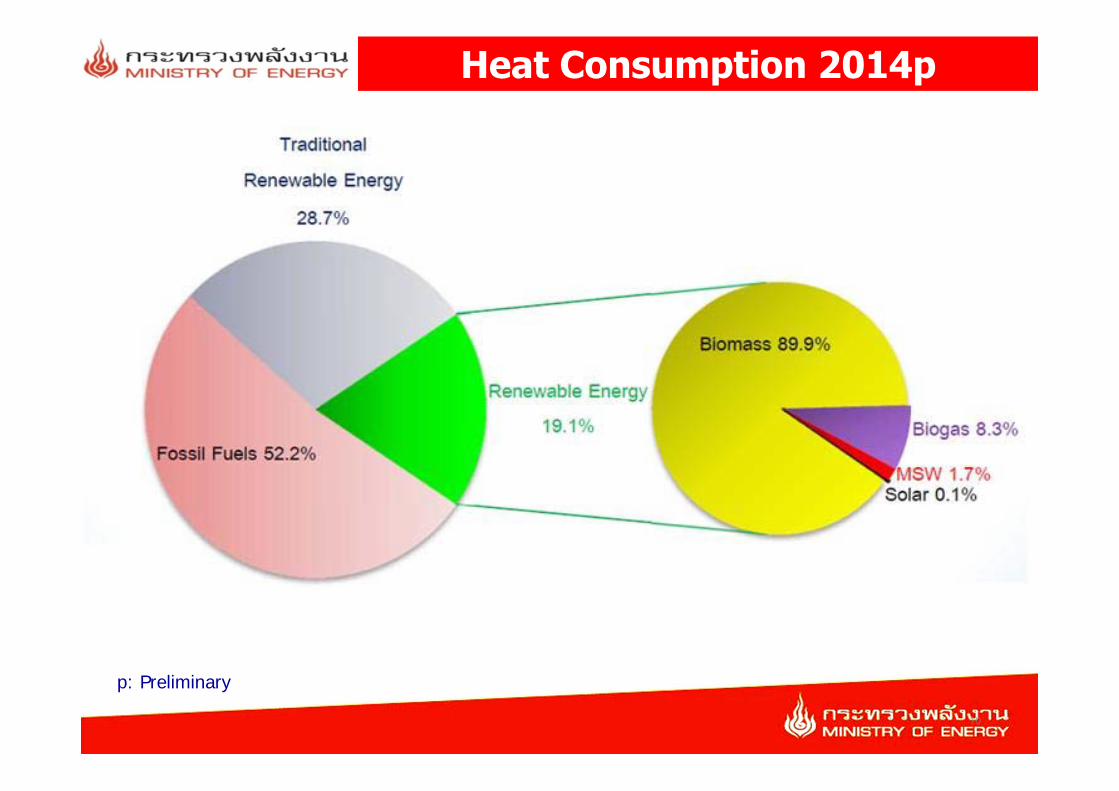
Heat Consumption 2014p
p: Preliminary
10
2. Energy and Renewable Energy Policy in Thailand
11
2
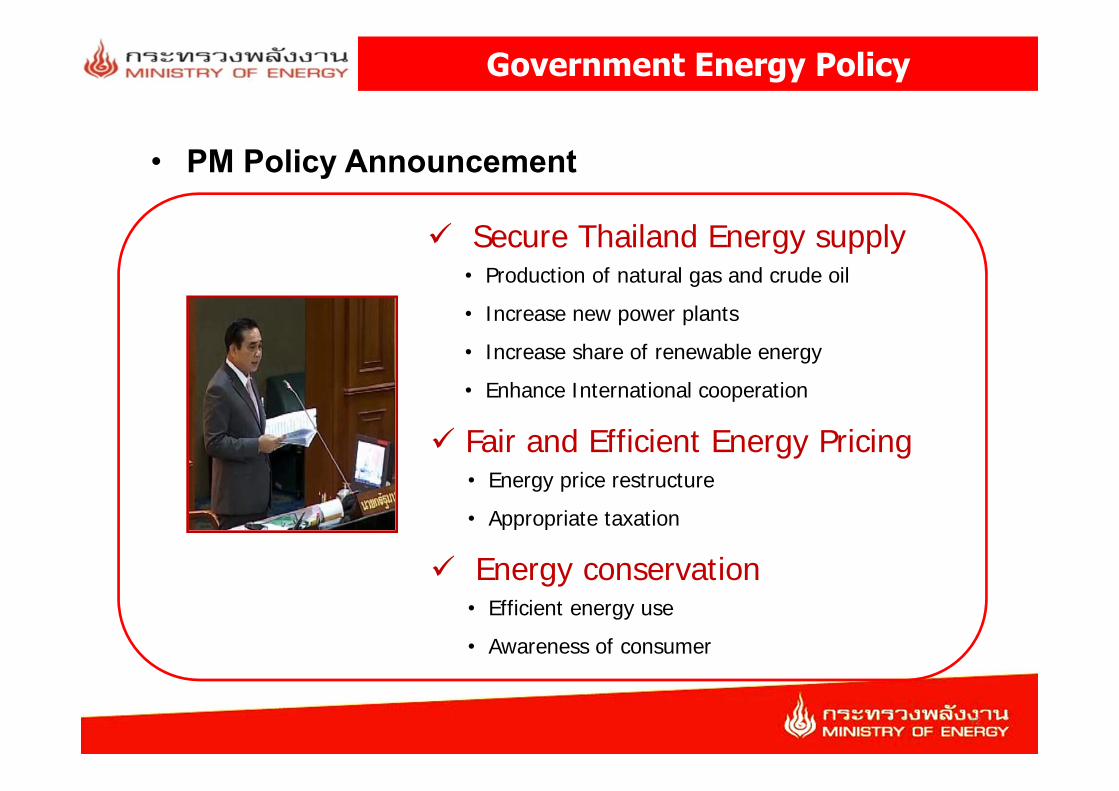
Government Energy Policy
• PM Policy Announcement
Secure Thailand Energy supply• Production of natural gas and crude oil• Increase new power plants• Increase share of renewable energy • Enhance International cooperation
Fair and Efficient Energy Pricing• Energy price restructure• Appropriate taxation
Energy conservation• Efficient energy use• Awareness of consumer
12

Ministry of Energy Strategy for RE
Goal : Security, Affordability, and Sustainability Goal : Security, Affordability, and Sustainability in Energy
• Efficient energy consumption• Increase use of renewable energy
• Energy efficiency development• Education and participation campaign/network• Research and Development of RE technologies• Promote people awareness at community level
13
2
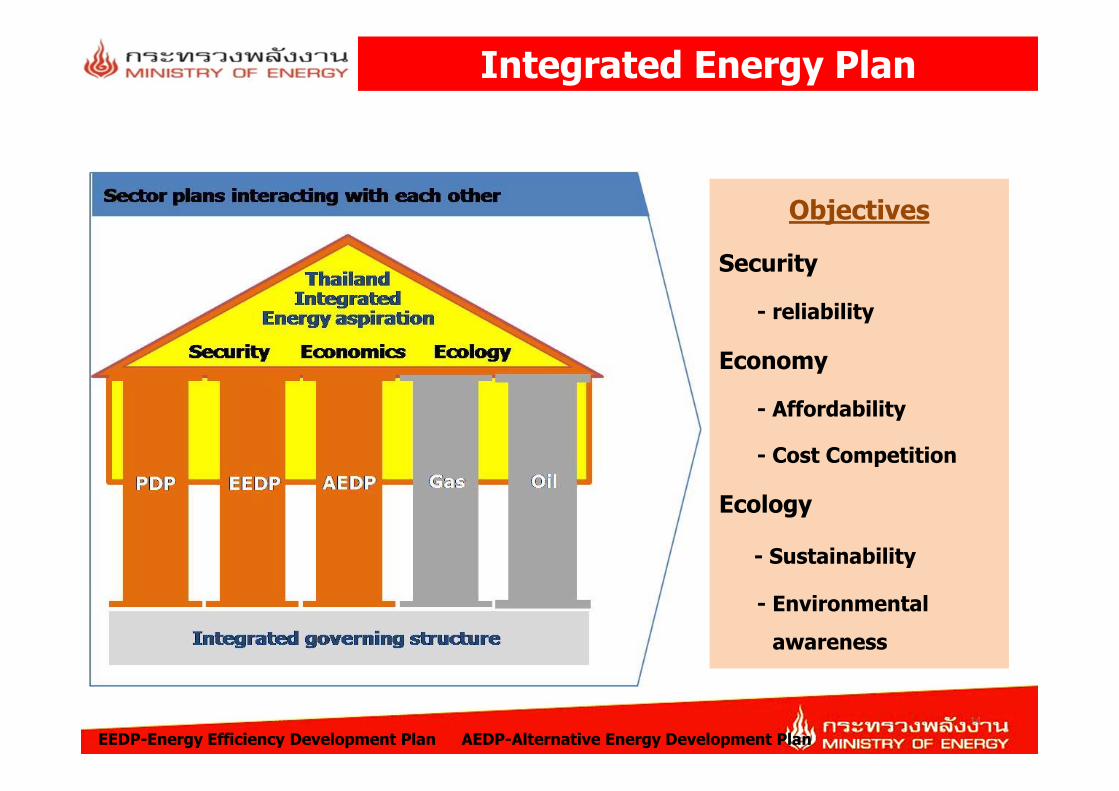
Integrated Energy Plan
Objectives
Security
- reliability
Economy
- Affordability
- Cost Competition
Ecology
- Sustainability
- Environmental awareness
EEDP-Energy Efficiency Development Plan AEDP-Alternative Energy Development Plan 14

Power Development Plan (PDP) 2015
2
GWh
Renewable Energy
Power Generation, classified by fuel type
18 %
2 %
15 %
37 %
17 %
6 %5 %
2015
2016
2017
2018
2019
2020
2021
2022
2023
2024
2025
2026
2027
2028
2029
2030
2031
2032
2033
2034
2035
2036
Domestic Hydropower
Imported Hydropower
Natural Gas
Imported CoalLignite
15
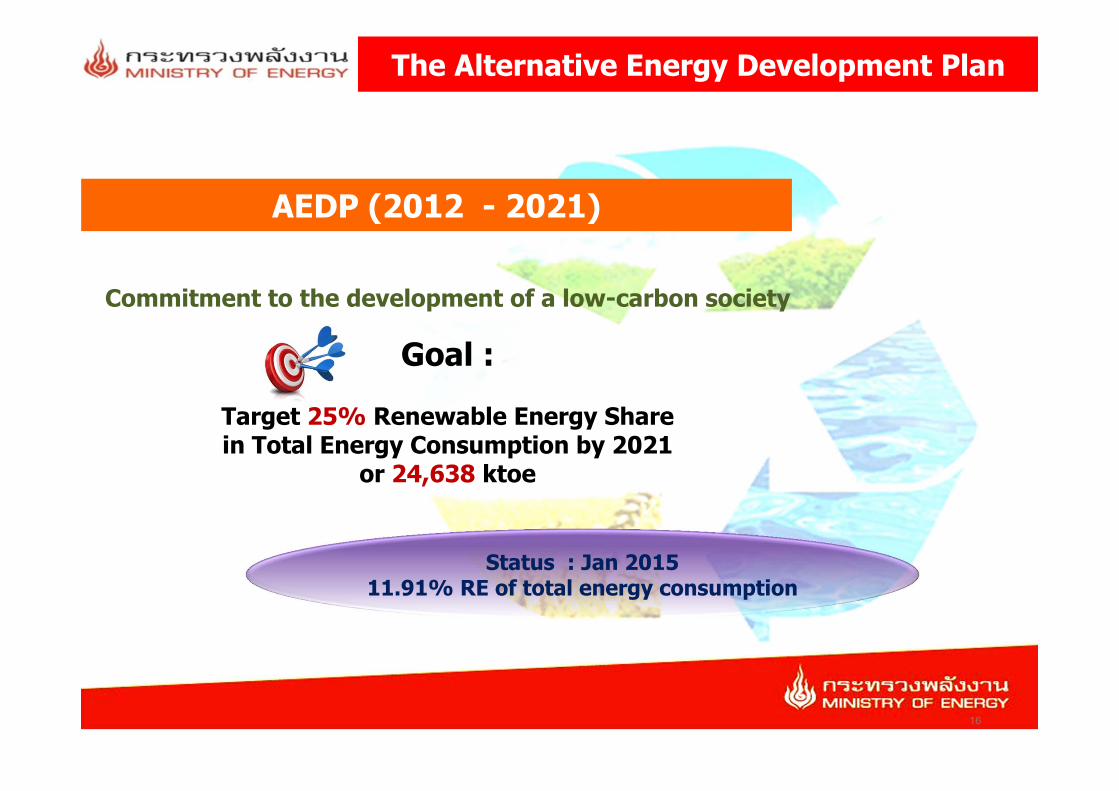
The Alternative Energy Development Plan
Commitment to the development of a low-carbon society
Goal :
Target 25% Renewable Energy Share in Total Energy Consumption by 2021
or 24,638 ktoe
AEDP (2012 - 2021)
Status : Jan 201511.91% RE of total energy consumption
16
2
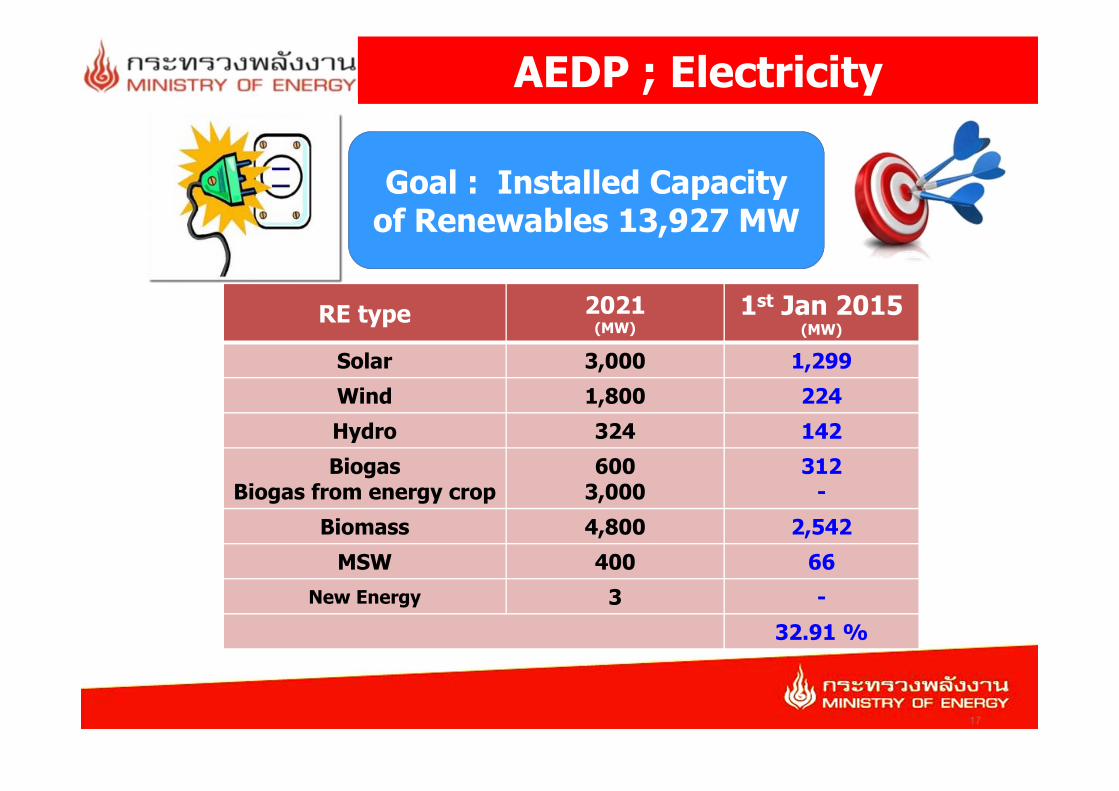
AEDP ; Electricity
Goal : Installed Capacity of Renewables 13,927 MW
RE type 2021 (MW)
1st Jan 2015(MW)
Solar 3,000 1,299Wind 1,800 224Hydro 324 142Biogas
Biogas from energy crop600
3,000312
-Biomass 4,800 2,542
MSW 400 66New Energy 3 -
32.91 %
17
2
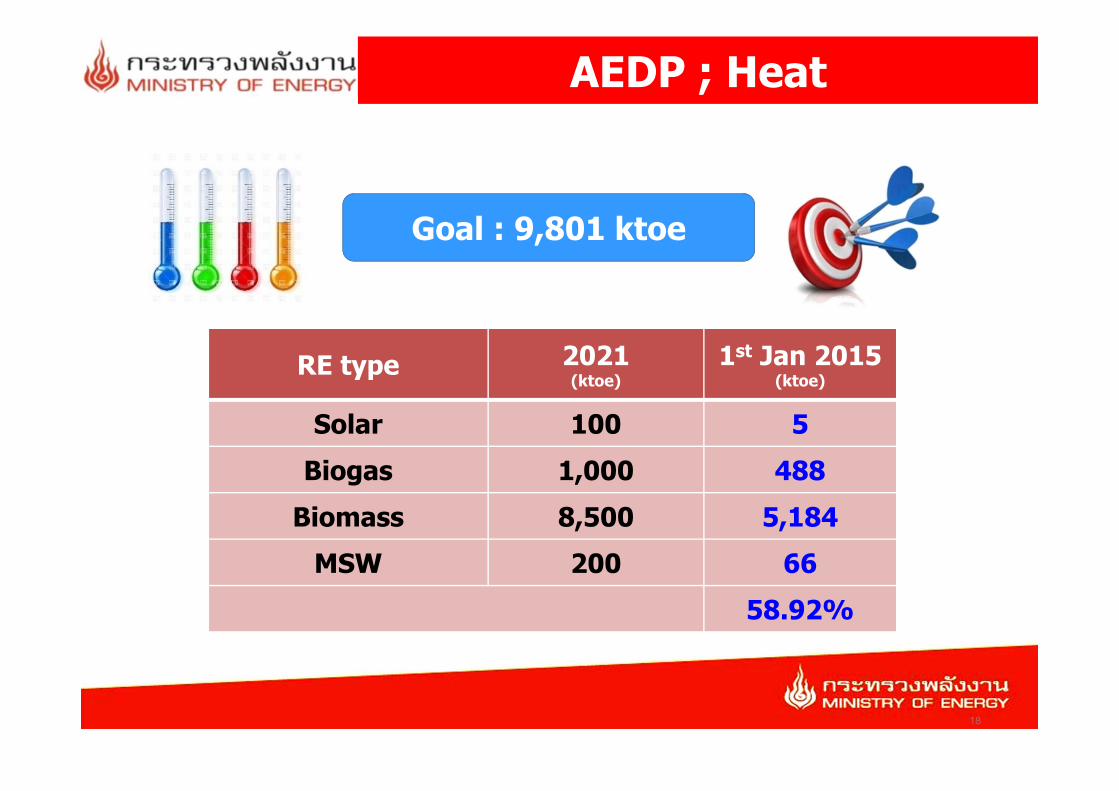
AEDP ; Heat
Goal : 9,801 ktoe
RE type 2021 (ktoe)
1st Jan 2015(ktoe)
Solar 100 5Biogas 1,000 488
Biomass 8,500 5,184MSW 200 66
58.92%
18
2
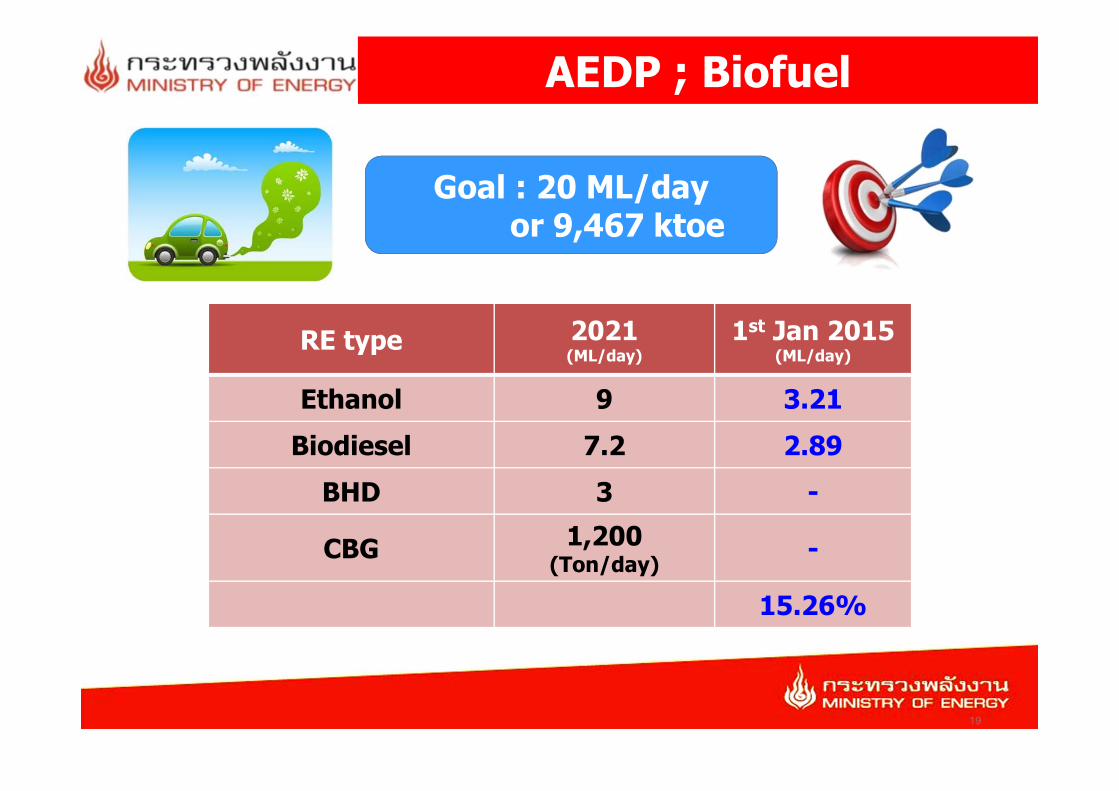
AEDP ; Biofuel
Goal : 20 ML/dayor 9,467 ktoe
RE type 2021 (ML/day)
1st Jan 2015(ML/day)
Ethanol 9 3.21Biodiesel 7.2 2.89
BHD 3 -
CBG 1,200(Ton/day) -
15.26%
19
2
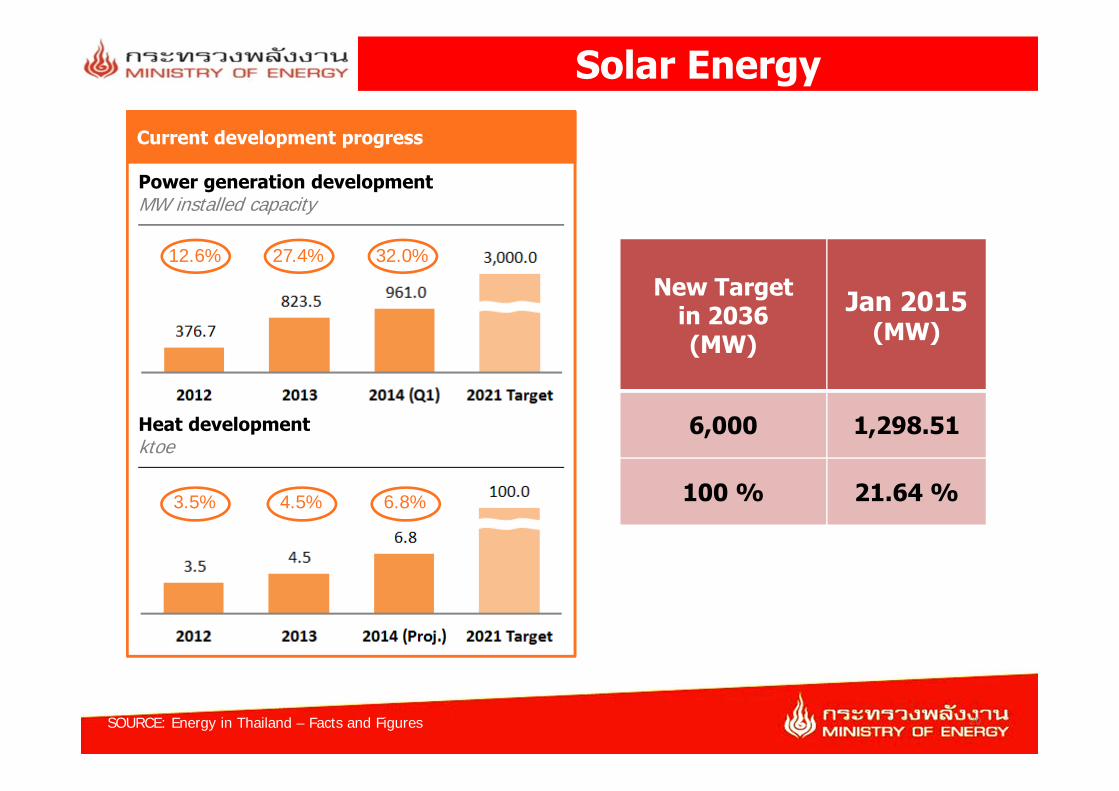
Solar EnergyCurrent development progress
SOURCE: Energy in Thailand – Facts and Figures
Power generation developmentMW installed capacity
Heat developmentktoe
27.4% 32.0%
3.5% 4.5% 6.8%
12.6%New Target
in 2036(MW)
Jan 2015(MW)
6,000 1,298.51
100 % 21.64 %
20
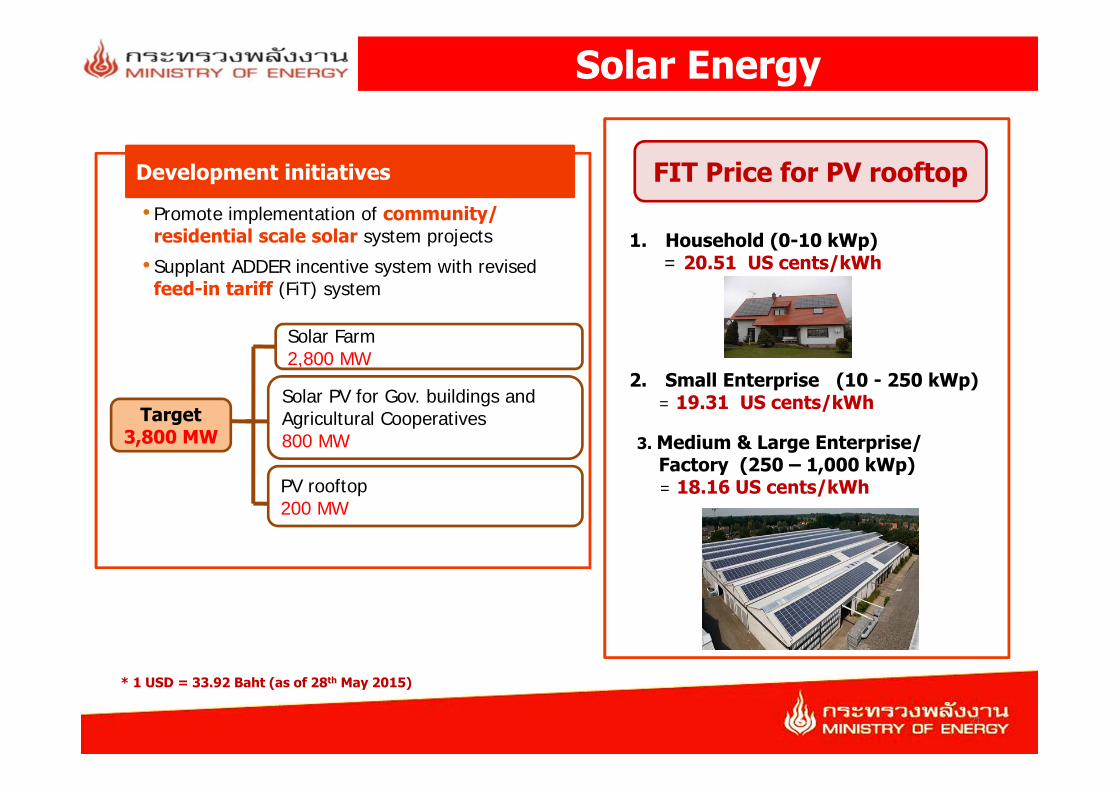
Solar Energy
Development initiatives
• Promote implementation of community/ residential scale solar system projects• Supplant ADDER incentive system with revised
feed-in tariff (FiT) system
Solar Farm2,800 MW
Solar PV for Gov. buildings and Agricultural Cooperatives800 MW
Target3,800 MW
PV rooftop200 MW
FIT Price for PV rooftop
1. Household (0-10 kWp)= 20.51 US cents/kWh
2. Small Enterprise (10 - 250 kWp)= 19.31 US cents/kWh
3. Medium & Large Enterprise/Factory (250 – 1,000 kWp)= 18.16 US cents/kWh
* 1 USD = 33.92 Baht (as of 28th May 2015)
21
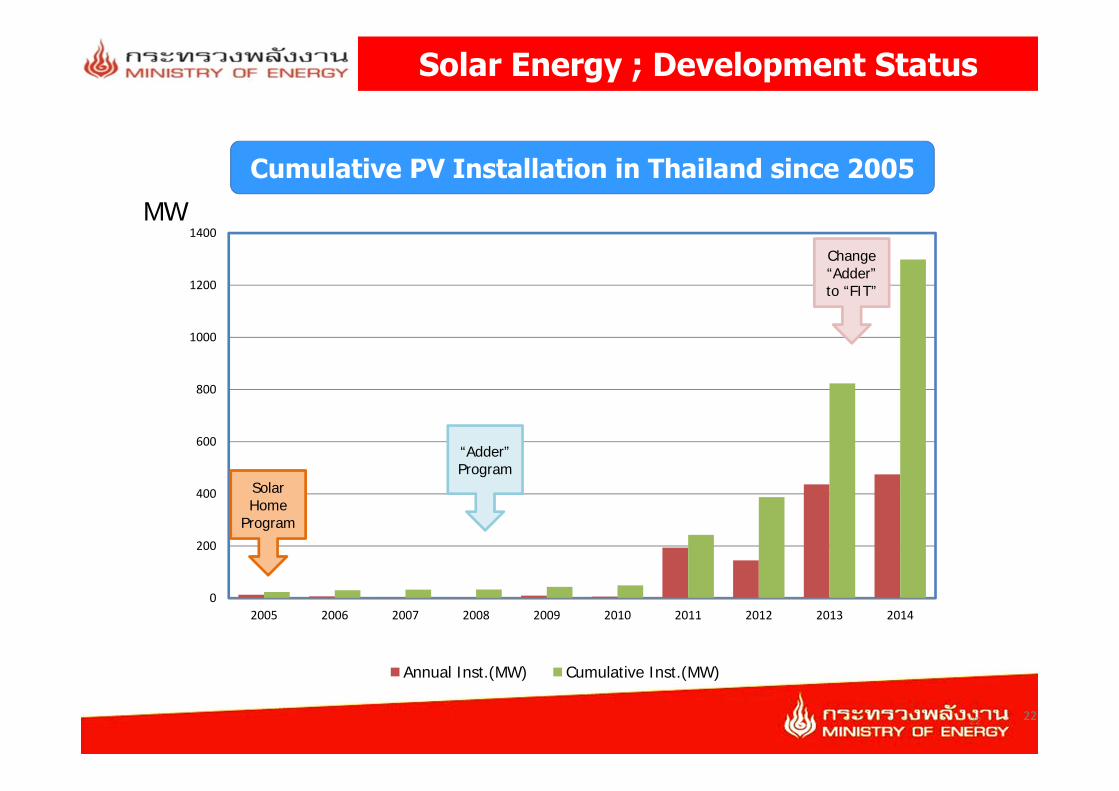
2
Solar Energy ; Development Status
22
0
200
400
600
800
1000
1200
1400
2005 2006 2007 2008 2009 2010 2011 2012 2013 2014
Annual Inst.(MW) Cumulative Inst.(MW)
Cumulative PV Installation in Thailand since 2005MW
Solar Home
Program
“Adder”Program
Change “Adder”to “FIT”
22
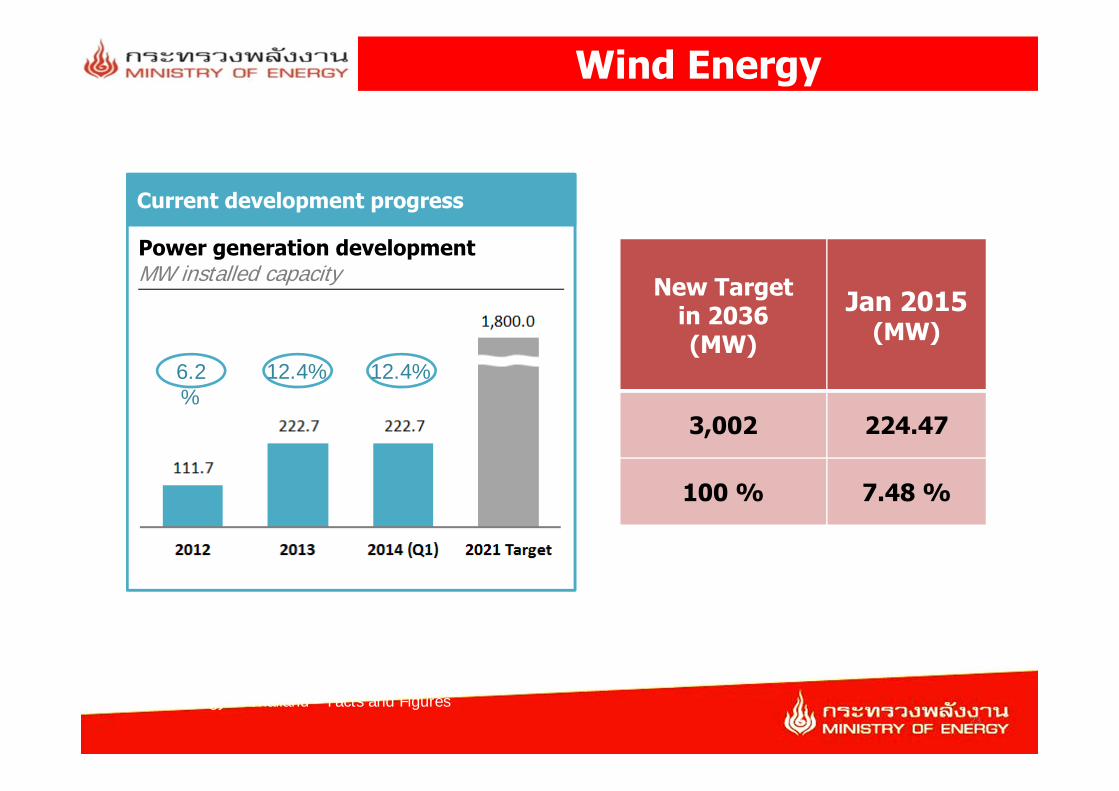
2
Wind Energy
Current development progress
Power generation developmentMW installed capacity
SOURCE: Energy in Thailand – Facts and Figures
6.2%
12.4% 12.4%
New Target in 2036(MW)
Jan 2015(MW)
3,002 224.47
100 % 7.48 %
23
2
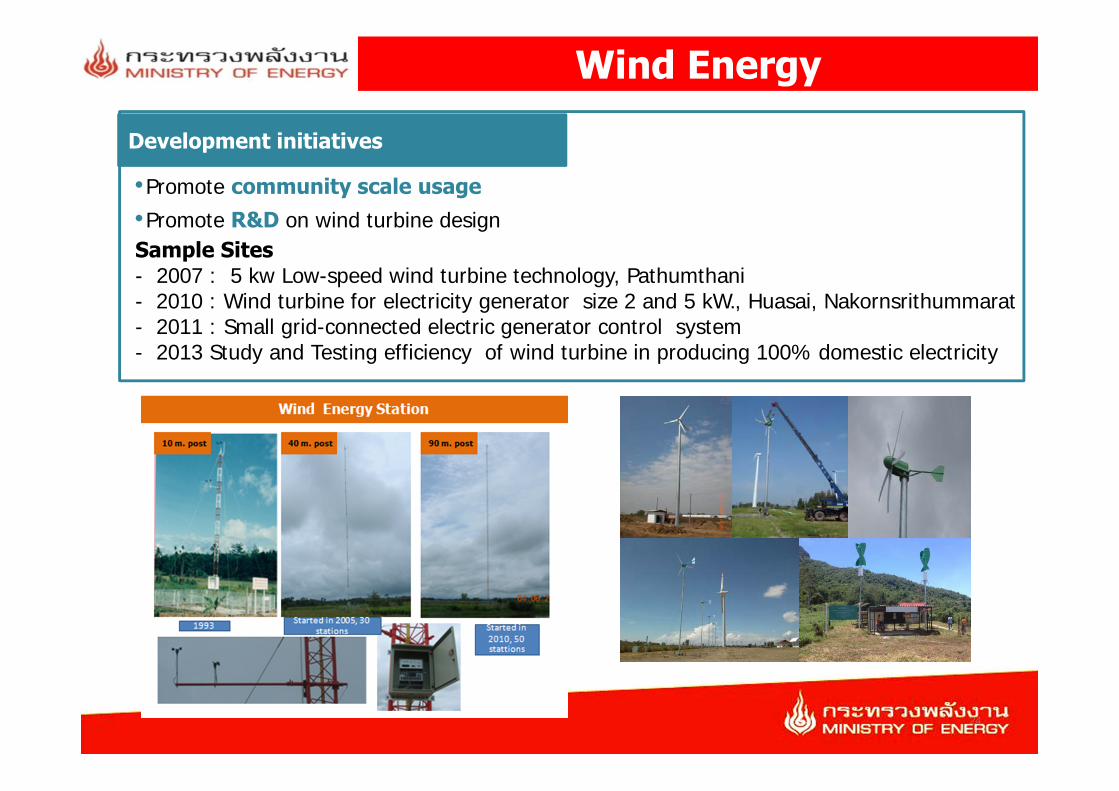
Wind Energy
•Promote community scale usage•Promote R&D on wind turbine design
Development initiatives
Sample Sites- 2007 : 5 kw Low-speed wind turbine technology, Pathumthani- 2010 : Wind turbine for electricity generator size 2 and 5 kW., Huasai, Nakornsrithummarat- 2011 : Small grid-connected electric generator control system- 2013 Study and Testing efficiency of wind turbine in producing 100% domestic electricity
24

2
Wind Energy
Wind Farm in Korat
25
2
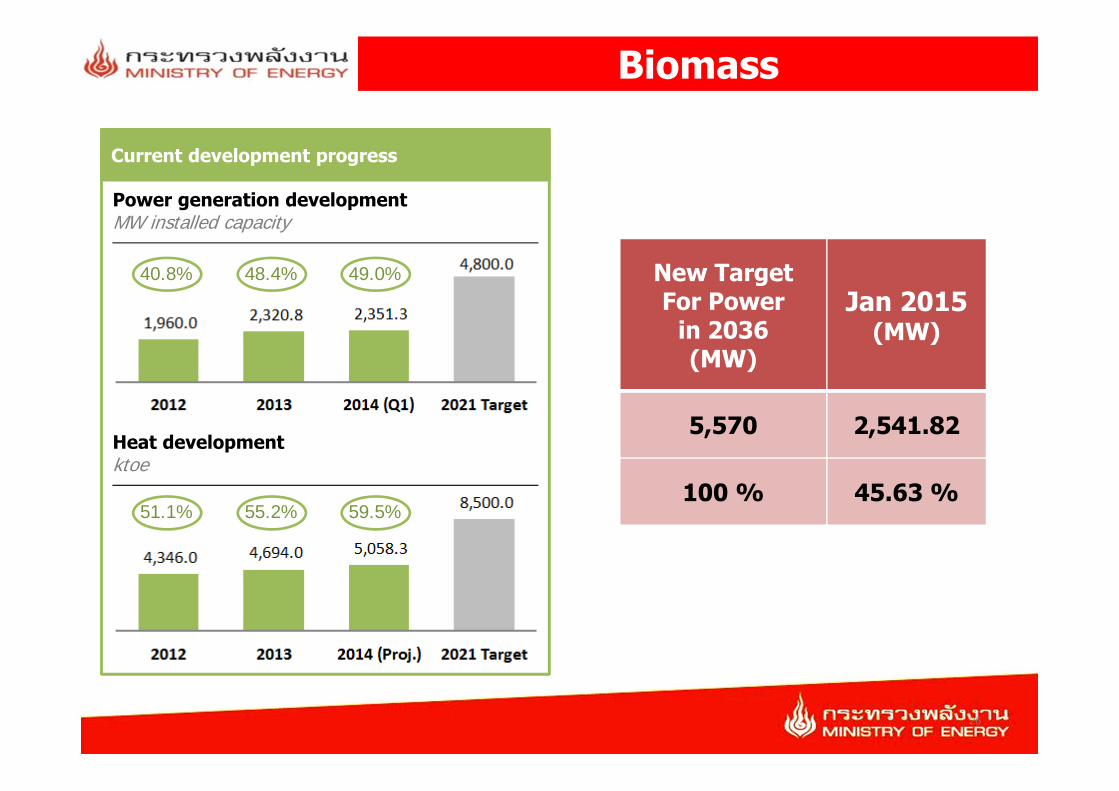
Biomass
Current development progress
Power generation developmentMW installed capacity
Heat developmentktoe
48.4% 49.0%40.8%
55.2% 59.5%51.1%
New Target For Power
in 2036(MW)
Jan 2015(MW)
5,570 2,541.82
100 % 45.63 %
26

2
Biomass
Development initiatives
• Promote fast growing trees
• Develop biomass pellets
• Develop advanced gasifierand gas engine technology
• Promote high pressure boilers
• Promote Distributed Green Generation (DGG) –
• Develop transmission and distribution infrastructure
27

2
BiogasCurrent development progress
Power generation developmentMW installed capacity
Heat developmentktoe
7.4% 7.6%5.4%
49.5% 52.8%45.8%
New Target in 2036(MW)
Jan 2015(MW)
1,280 311.50
100 % 24.33 %
28
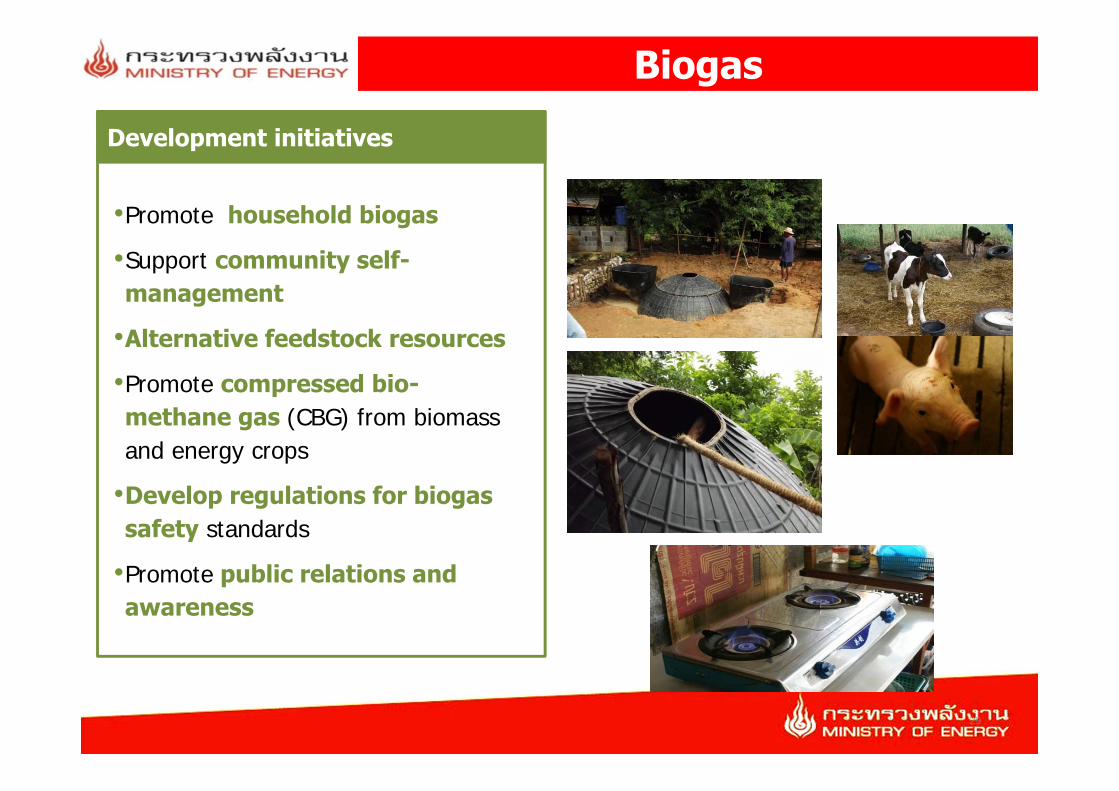
BiogasDevelopment initiatives
•Promote household biogas
•Support community self-management
•Alternative feedstock resources
•Promote compressed bio-methane gas (CBG) from biomass and energy crops
•Develop regulations for biogas safety standards
•Promote public relations and awareness
29
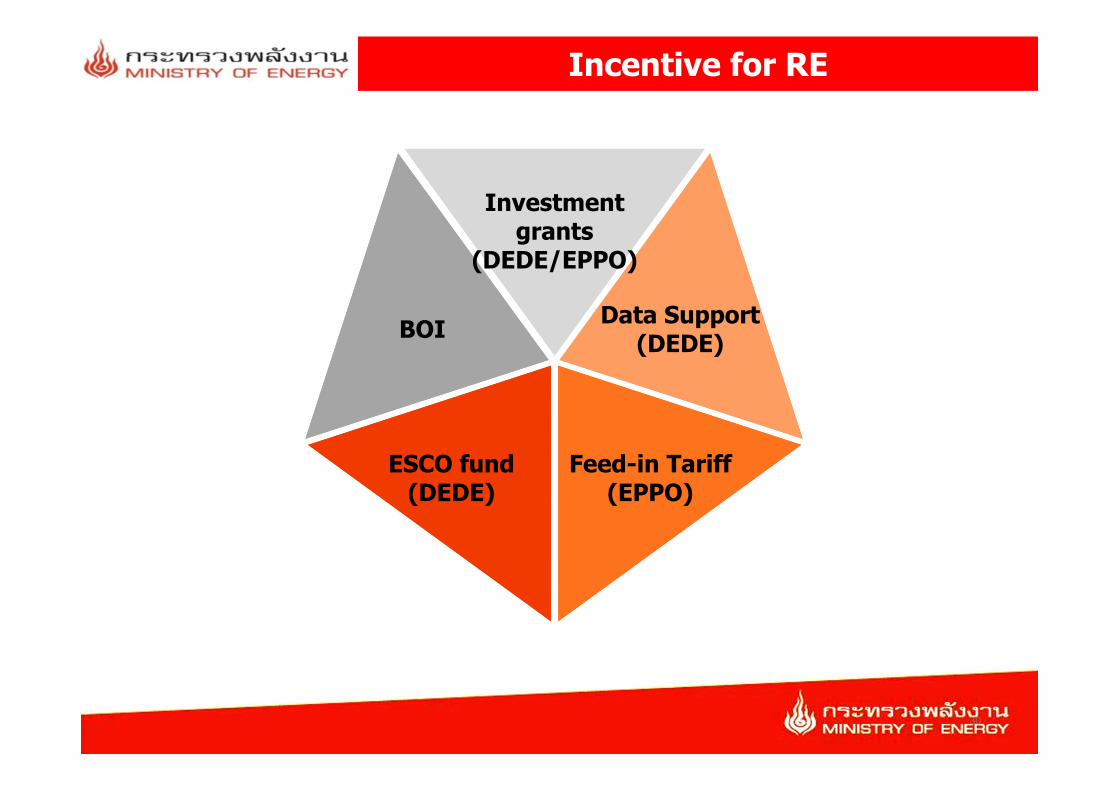
Incentive for RE
Investment grants
(DEDE/EPPO)
BOI Data Support (DEDE)
Feed-in Tariff(EPPO)
ESCO fund(DEDE)
30
2
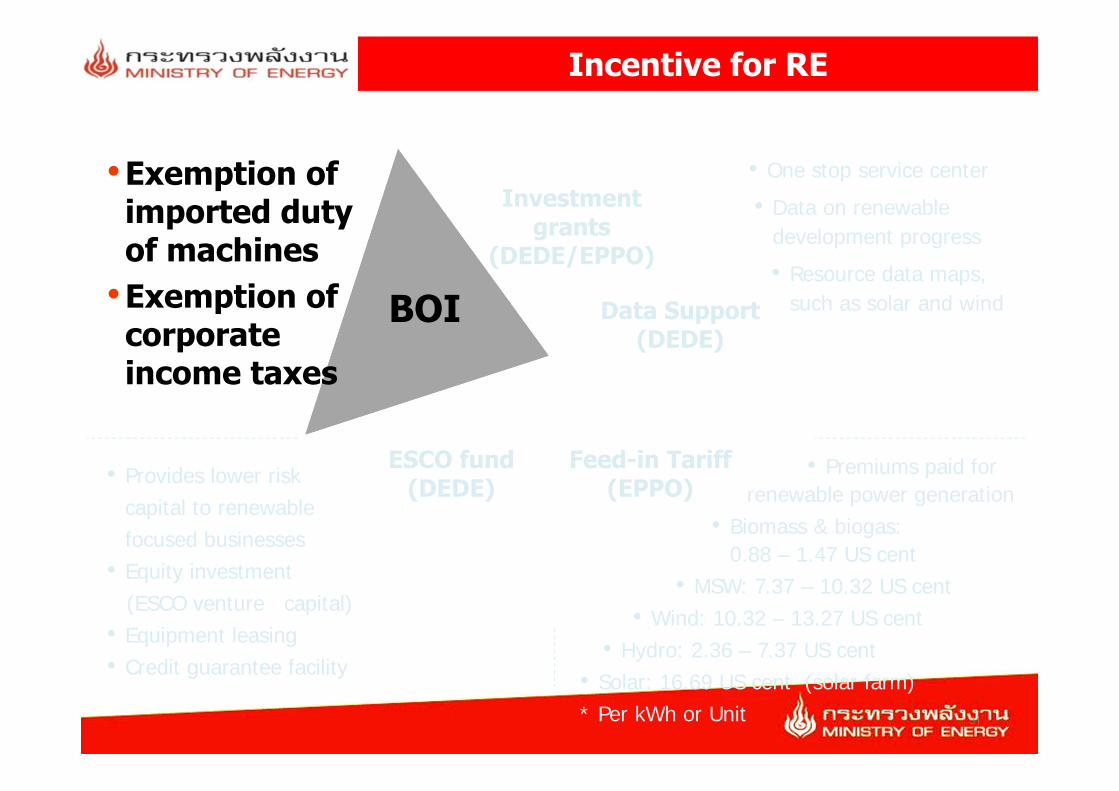
Incentive for RE
Investment grants
(DEDE/EPPO)
BOI Data Support (DEDE)
Feed-in Tariff(EPPO)
ESCO fund(DEDE)
•Exemption of imported duty of machines•Exemption of corporate income taxes
• One stop service center• Data on renewable
development progress• Resource data maps,
such as solar and wind
• Provides lower riskcapital to renewable focused businesses
• Equity investment (ESCO venture capital)
• Equipment leasing • Credit guarantee facility
• Premiums paid forrenewable power generation
• Biomass & biogas: 0.88 – 1.47 US cent
• MSW: 7.37 – 10.32 US cent• Wind: 10.32 – 13.27 US cent
• Hydro: 2.36 – 7.37 US cent• Solar: 16.69 US cent (solar farm)* Per kWh or Unit 31
2
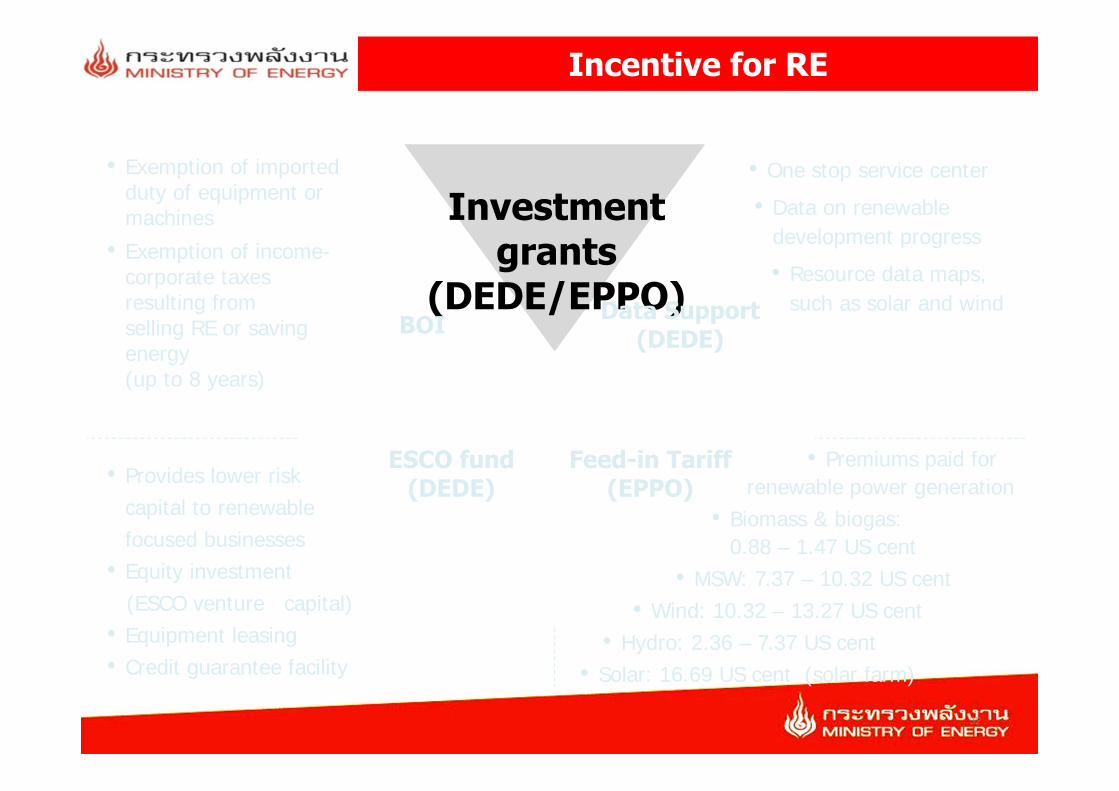
Incentive for RE
Investment grants
(DEDE/EPPO)BOI Data Support
(DEDE)
Feed-in Tariff(EPPO)
ESCO fund(DEDE)
• Exemption of imported duty of equipment or machines
• Exemption of income-corporate taxes resulting from selling RE or savingenergy (up to 8 years)
• One stop service center• Data on renewable
development progress• Resource data maps,
such as solar and wind
• Provides lower riskcapital to renewable focused businesses
• Equity investment (ESCO venture capital)
• Equipment leasing • Credit guarantee facility
• Premiums paid forrenewable power generation
• Biomass & biogas: 0.88 – 1.47 US cent
• MSW: 7.37 – 10.32 US cent• Wind: 10.32 – 13.27 US cent
• Hydro: 2.36 – 7.37 US cent• Solar: 16.69 US cent (solar farm)
32

2
Incentive for RE
Investment grants
(DEDE/EPPO)
BOI Data Support (DEDE)
Feed-in Tariff(EPPO)
ESCO fund(DEDE)
• Exemption of imported duty of equipment or machines
• Exemption of income-corporate taxes resulting from selling RE or savingenergy (up to 8 years)
•One stop service •Data on renewables
• Provides lower riskcapital to renewable focused businesses
• Equity investment (ESCO venture capital)
• Equipment leasing • Credit guarantee facility
• Premiums paid forrenewable power generation
• Biomass & biogas: 0.88 – 1.47 US cent
• MSW: 7.37 – 10.32 US cent• Wind: 10.32 – 13.27 US cent
• Hydro: 2.36 – 7.37 US cent• Solar: 16.69 US cent (solar farm)
33
2
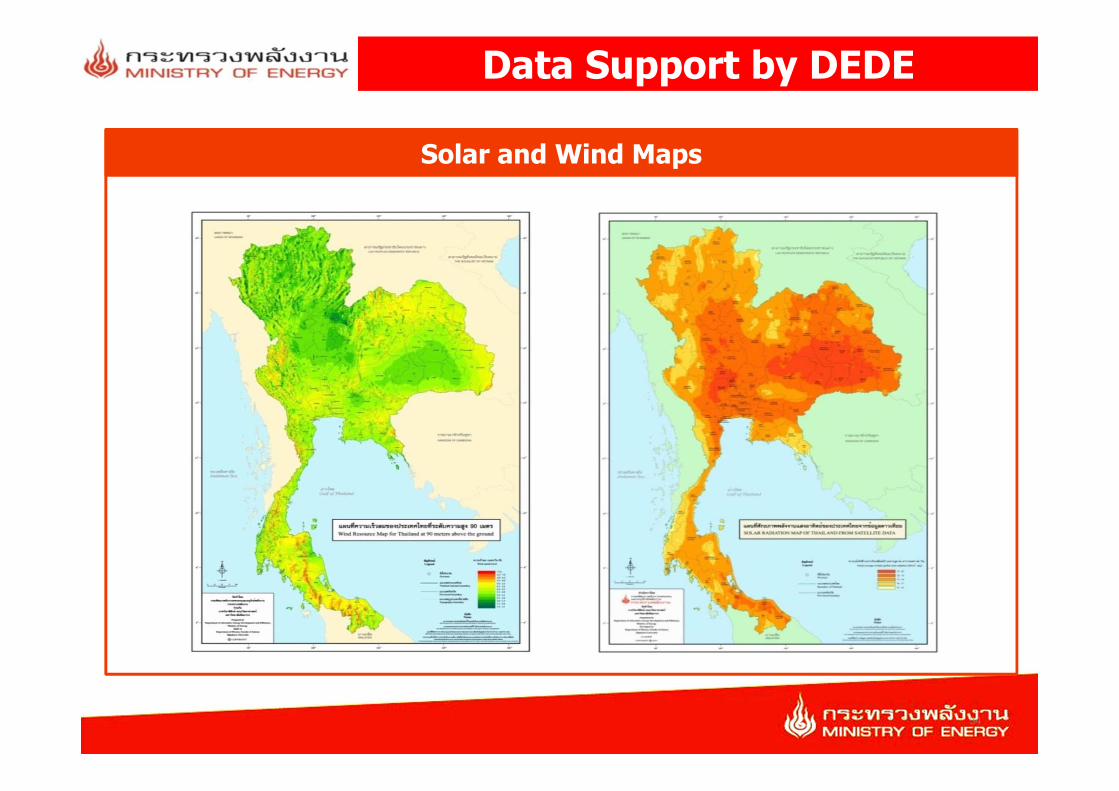
Data Support by DEDE
Solar and Wind Maps
34
2
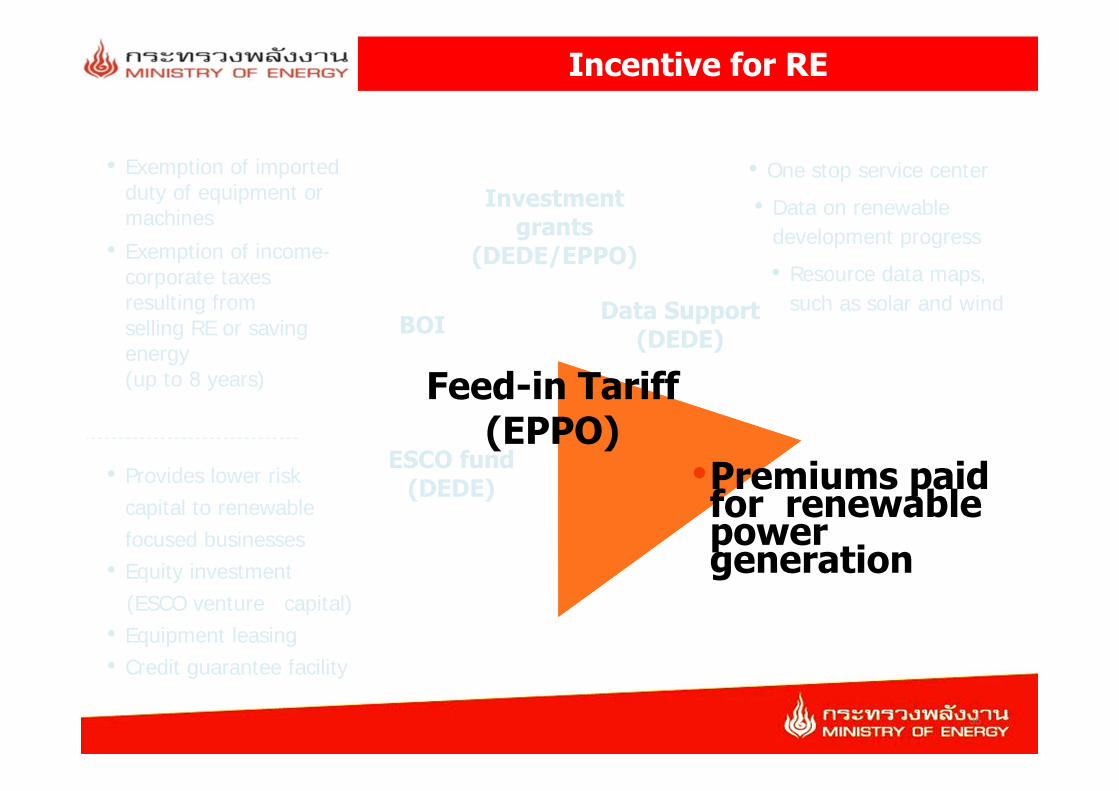
Incentive for RE
Investment grants
(DEDE/EPPO)
BOI Data Support (DEDE)
Feed-in Tariff(EPPO)
ESCO fund(DEDE)
• Exemption of imported duty of equipment or machines
• Exemption of income-corporate taxes resulting from selling RE or savingenergy (up to 8 years)
• One stop service center• Data on renewable
development progress• Resource data maps,
such as solar and wind
• Provides lower riskcapital to renewable focused businesses
• Equity investment (ESCO venture capital)
• Equipment leasing • Credit guarantee facility
•Premiums paid for renewable power generation
35
2
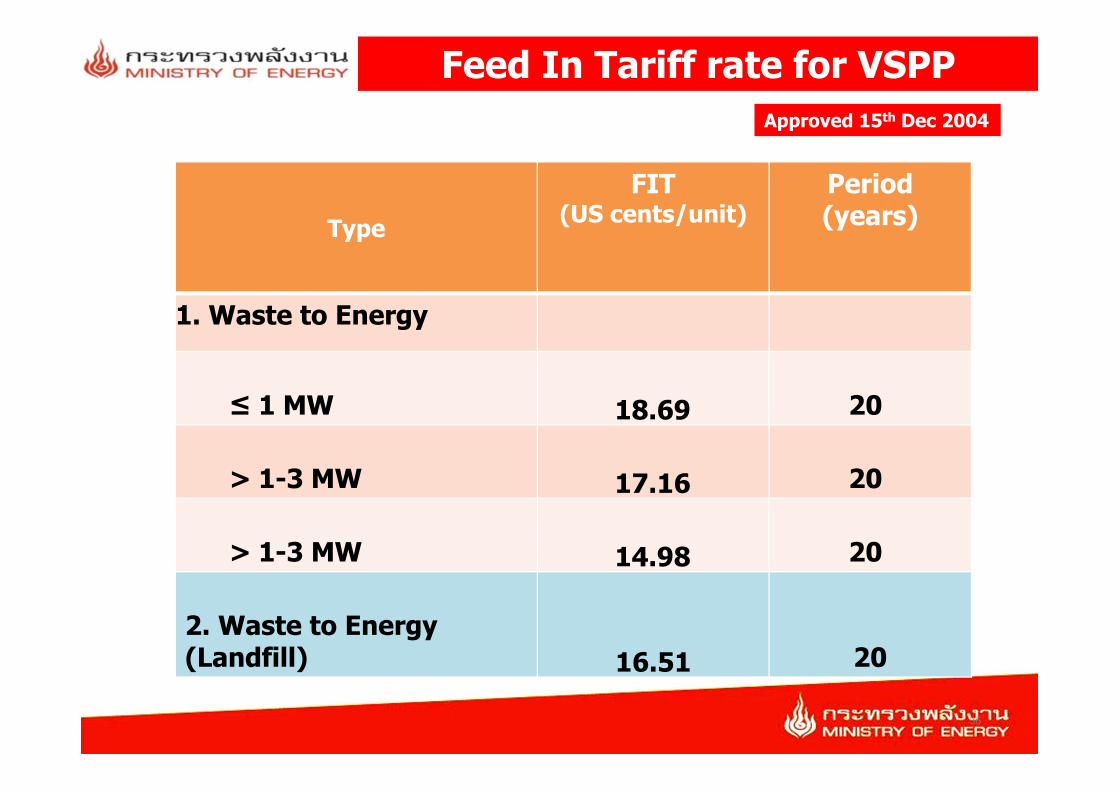
Feed In Tariff rate for VSPPApproved 15th Dec 2004
TypeFIT
(US cents/unit)Period(years)
1. Waste to Energy
≤ 1 MW 18.69 20
> 1-3 MW 17.16 20
> 1-3 MW 14.98 20
2. Waste to Energy (Landfill) 16.51 20
36
2
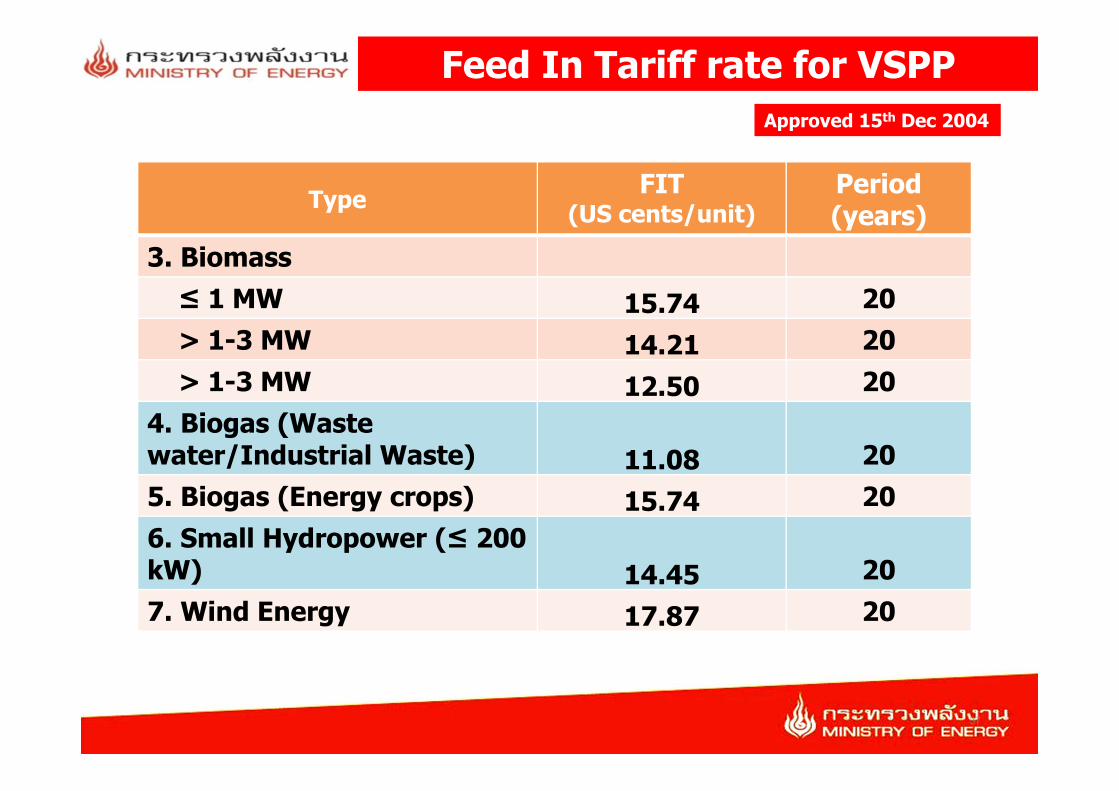
Feed In Tariff rate for VSPPApproved 15th Dec 2004
Type FIT (US cents/unit)
Period(years)
3. Biomass≤ 1 MW 15.74 20> 1-3 MW 14.21 20> 1-3 MW 12.50 20
4. Biogas (Waste water/Industrial Waste) 11.08 205. Biogas (Energy crops) 15.74 206. Small Hydropower (≤ 200 kW) 14.45 207. Wind Energy 17.87 20
37
2
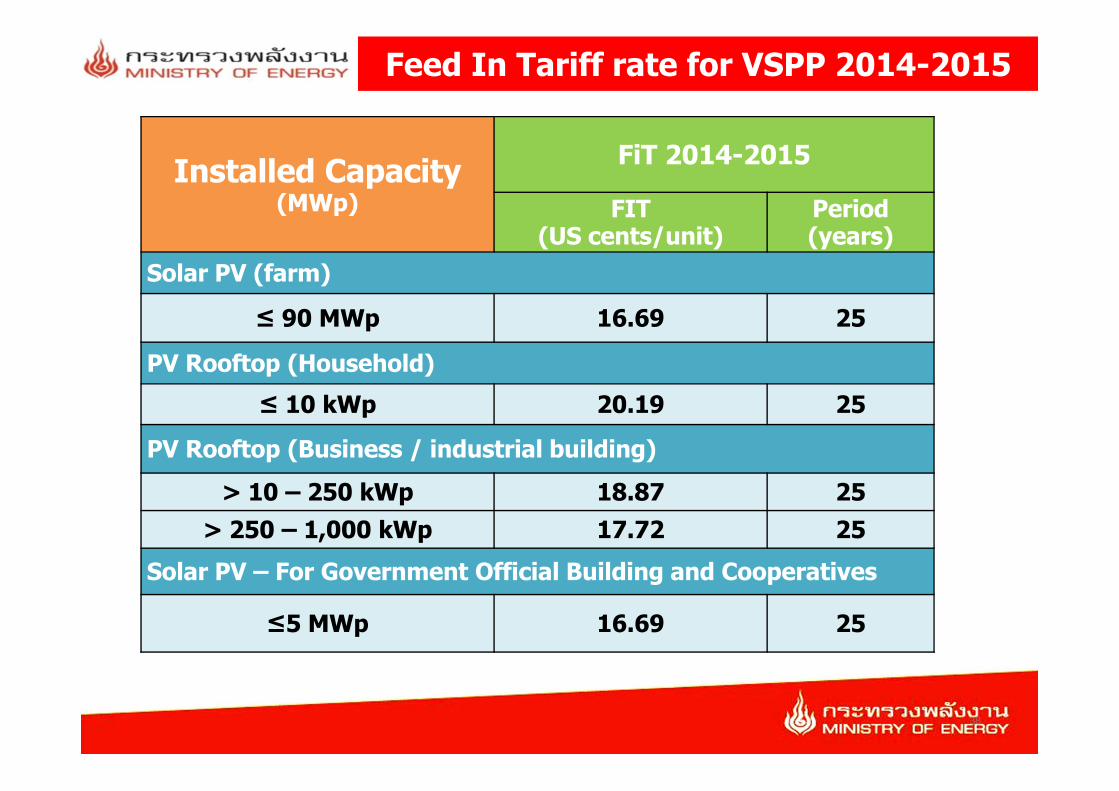
Feed In Tariff rate for VSPP 2014-2015
Installed Capacity (MWp)
FiT 2014-2015
FIT(US cents/unit)
Period (years)
Solar PV (farm)
≤ 90 MWp 16.69 25
PV Rooftop (Household)≤ 10 kWp 20.19 25
PV Rooftop (Business / industrial building)> 10 – 250 kWp 18.87 25
> 250 – 1,000 kWp 17.72 25 Solar PV – For Government Official Building and Cooperatives
≤5 MWp 16.69 25
38
2
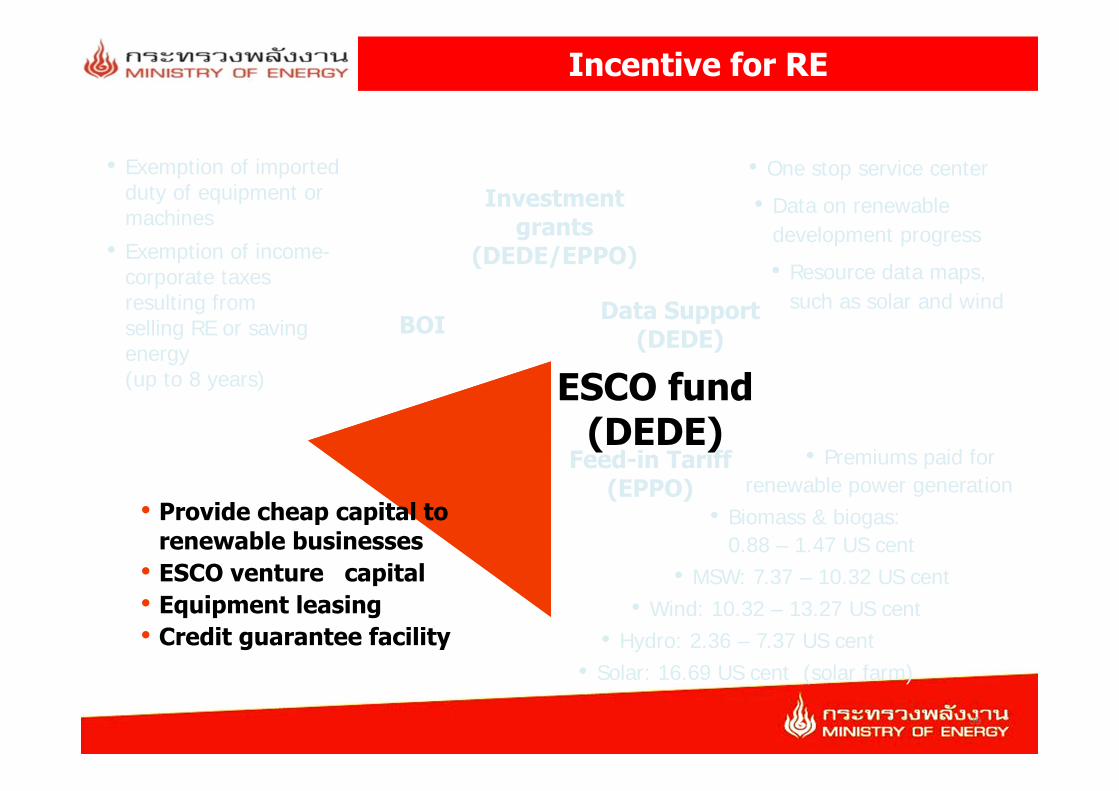
Incentive for RE
Investment grants
(DEDE/EPPO)
BOI Data Support (DEDE)
Feed-in Tariff(EPPO)
ESCO fund(DEDE)
• Exemption of imported duty of equipment or machines
• Exemption of income-corporate taxes resulting from selling RE or savingenergy (up to 8 years)
• One stop service center• Data on renewable
development progress• Resource data maps,
such as solar and wind
• Provide cheap capital to renewable businesses
• ESCO venture capital• Equipment leasing • Credit guarantee facility
• Premiums paid forrenewable power generation
• Biomass & biogas: 0.88 – 1.47 US cent
• MSW: 7.37 – 10.32 US cent• Wind: 10.32 – 13.27 US cent
• Hydro: 2.36 – 7.37 US cent• Solar: 16.69 US cent (solar farm)
39
2
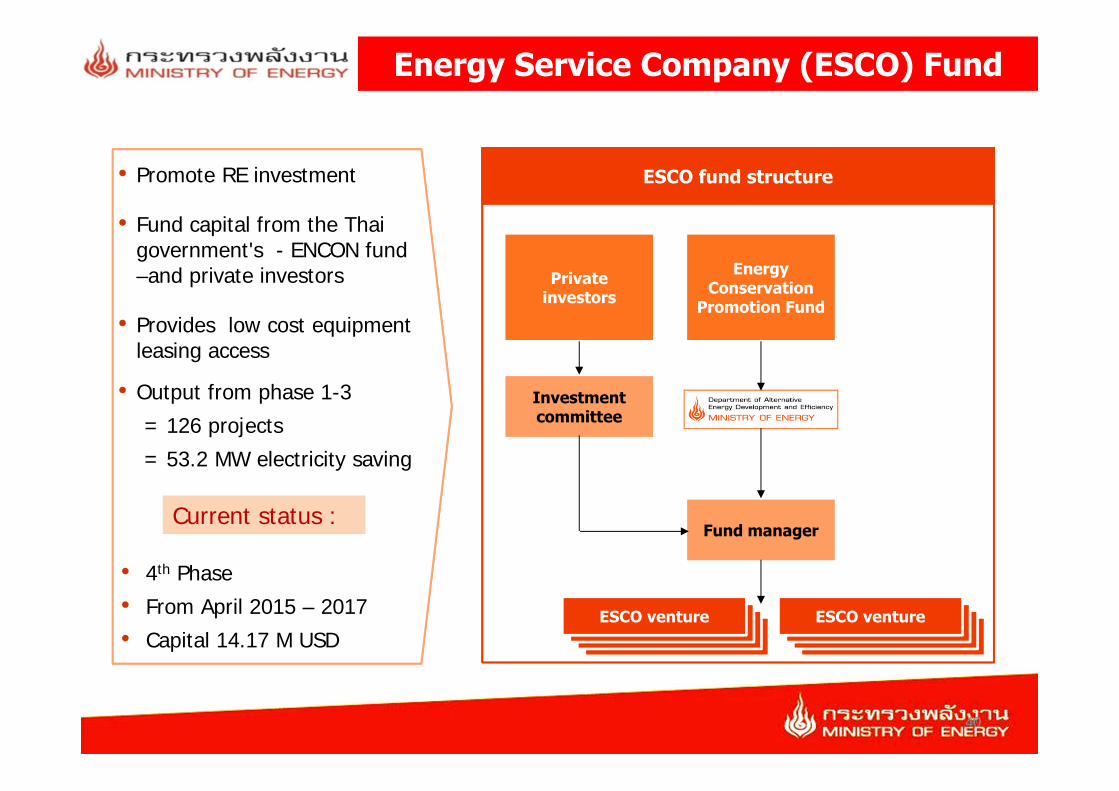
Energy Service Company (ESCO) Fund
40
• Promote RE investment
• Fund capital from the Thai government's - ENCON fund –and private investors
• Provides low cost equipment leasing access
• Output from phase 1-3= 126 projects = 53.2 MW electricity saving
ESCO fund structure
ESCO ventureESCO ventureESCO ventureESCO ventureESCO ventureESCO ventureESCO ventureESCO venture
Fund manager
Investment committee
Private investors
Energy Conservation
Promotion Fund
Current status :
• 4th Phase• From April 2015 – 2017• Capital 14.17 M USD
40
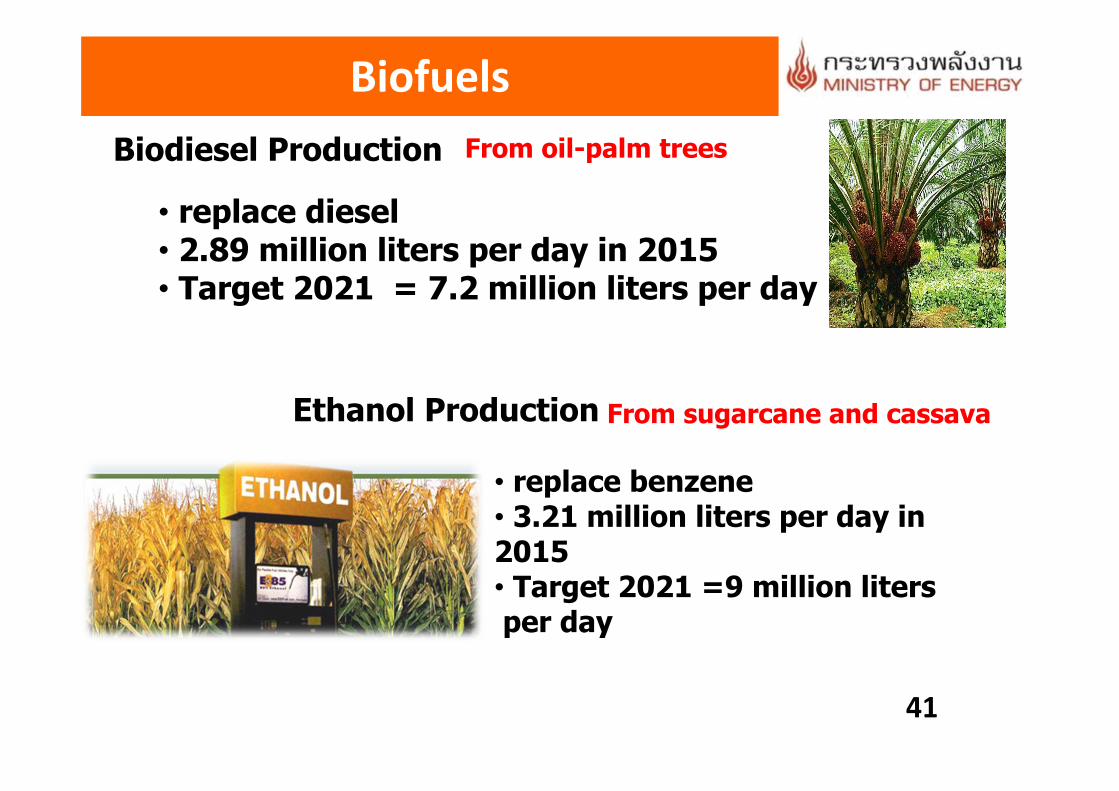
BiofuelsBiodiesel Production
• replace diesel• 2.89 million liters per day in 2015• Target 2021 = 7.2 million liters per day
From oil-palm trees
41
• replace benzene• 3.21 million liters per day in 2015• Target 2021 =9 million liters per day
Ethanol Production From sugarcane and cassava
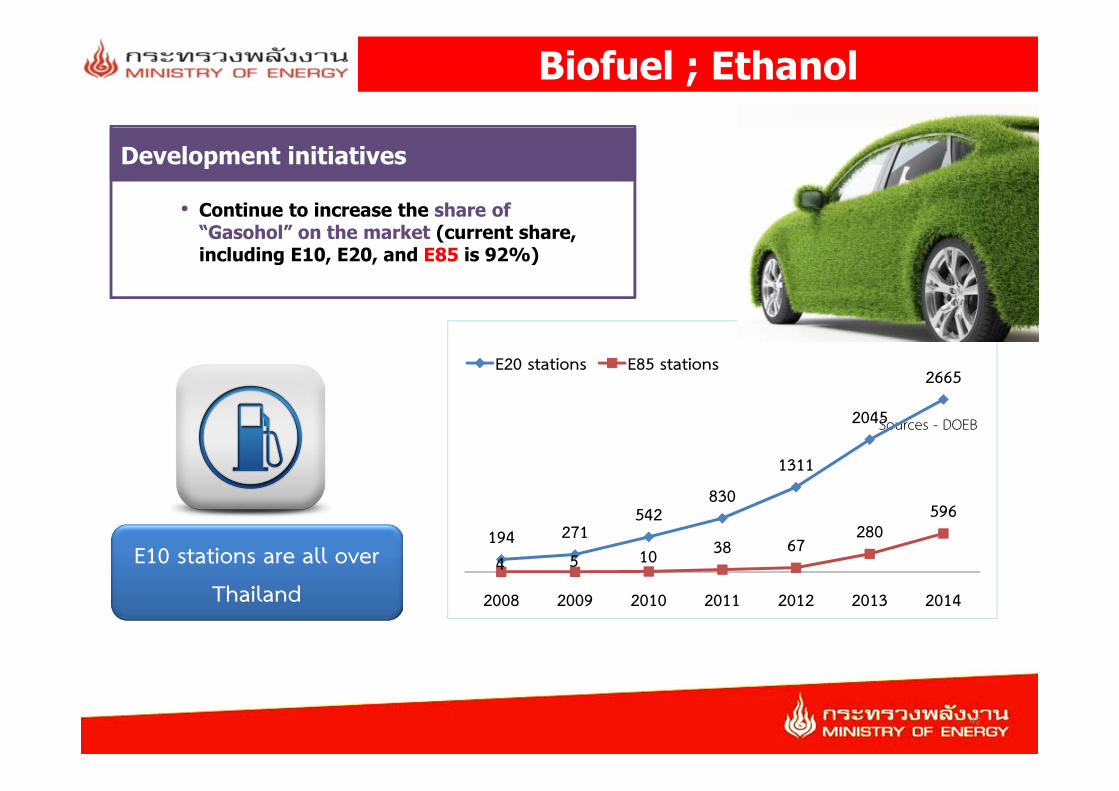
Biofuel ; Ethanol
Development initiatives
• Continue to increase the share of “Gasohol” on the market (current share, including E10, E20, and E85 is 92%)
E10 stations are all over
Thailand
Sources - DOEB
194 271542
830
1311
2045
2665
4 5 10 38 67280
596
2008 2009 2010 2011 2012 2013 2014
E20 stations E85 stations
42
2
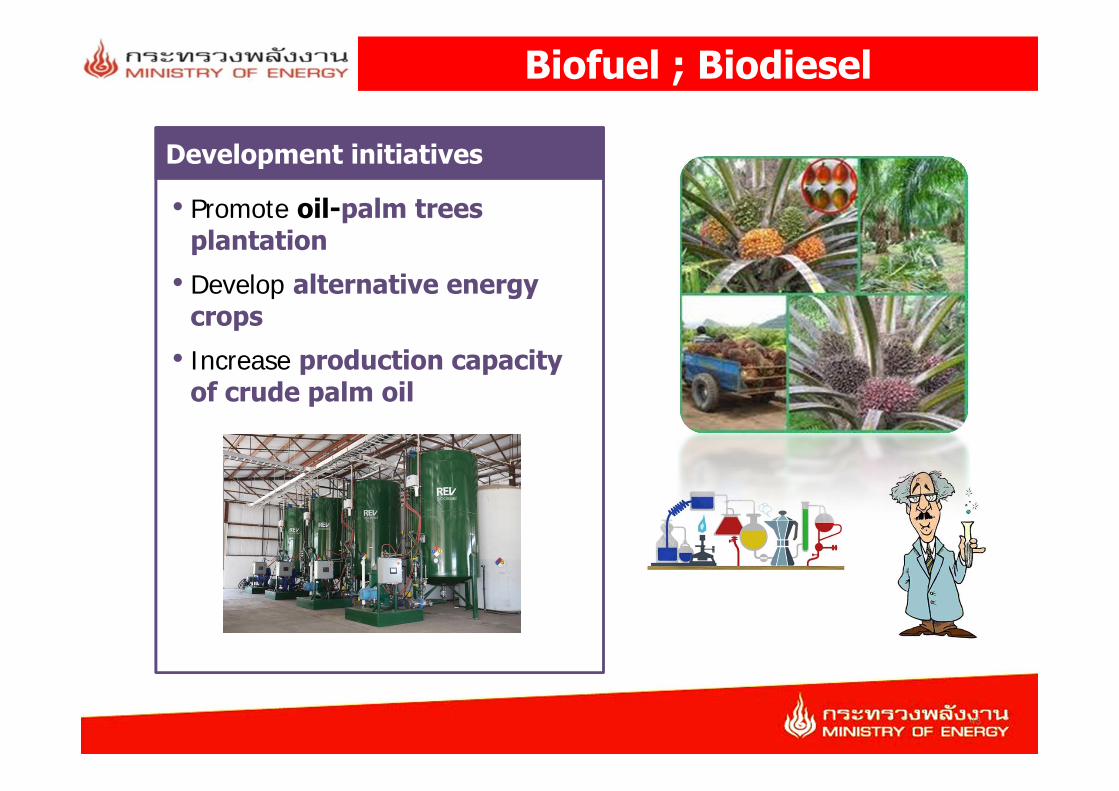
Biofuel ; Biodiesel
Development initiatives
• Promote oil-palm trees plantation• Develop alternative energy
crops• Increase production capacity
of crude palm oil
43

3. Challenges for RE Project Development
44

2
Challenges for RE project development
Barrier to Investment
• High investment cost
• Limited grid capacity
45
2
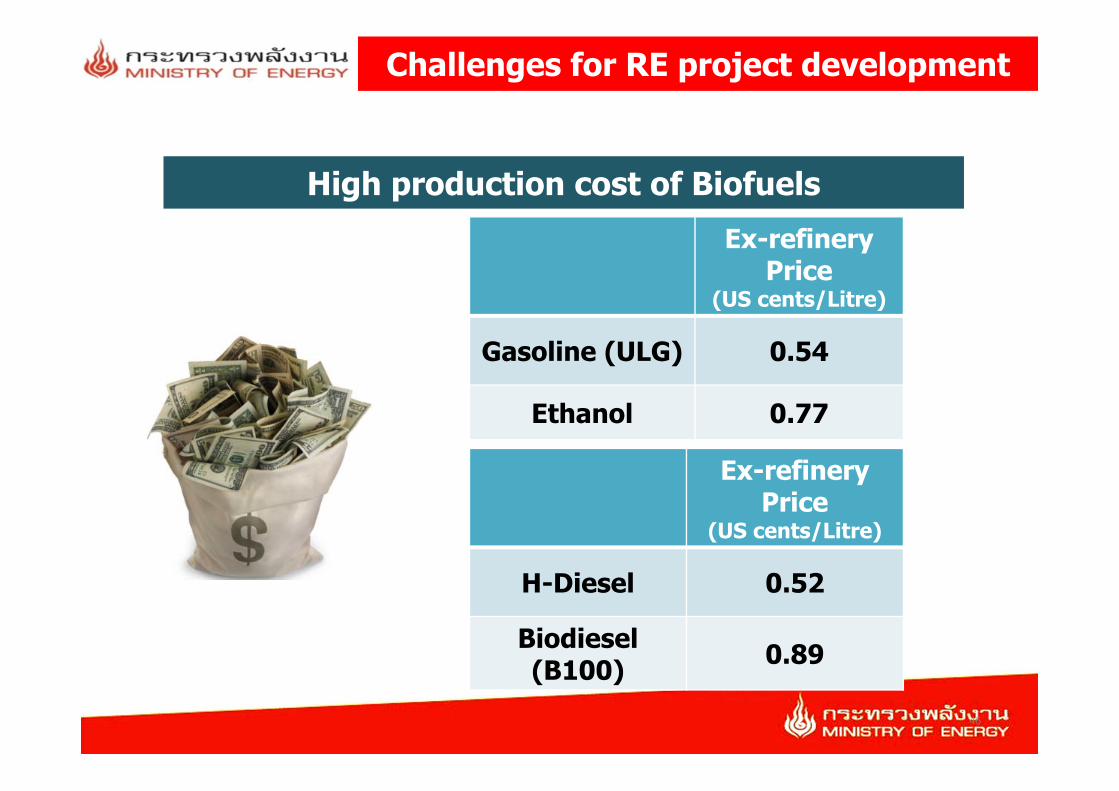
Challenges for RE project development
High production cost of BiofuelsEx-refinery
Price(US cents/Litre)
Gasoline (ULG) 0.54
Ethanol 0.77
Ex-refineryPrice
(US cents/Litre)
H-Diesel 0.52
Biodiesel (B100) 0.89
46

2
Challenges for RE project development
Public acceptance• Lack of support/ acceptance for power plants from nearby communities
47
2
Challenges for RE project development
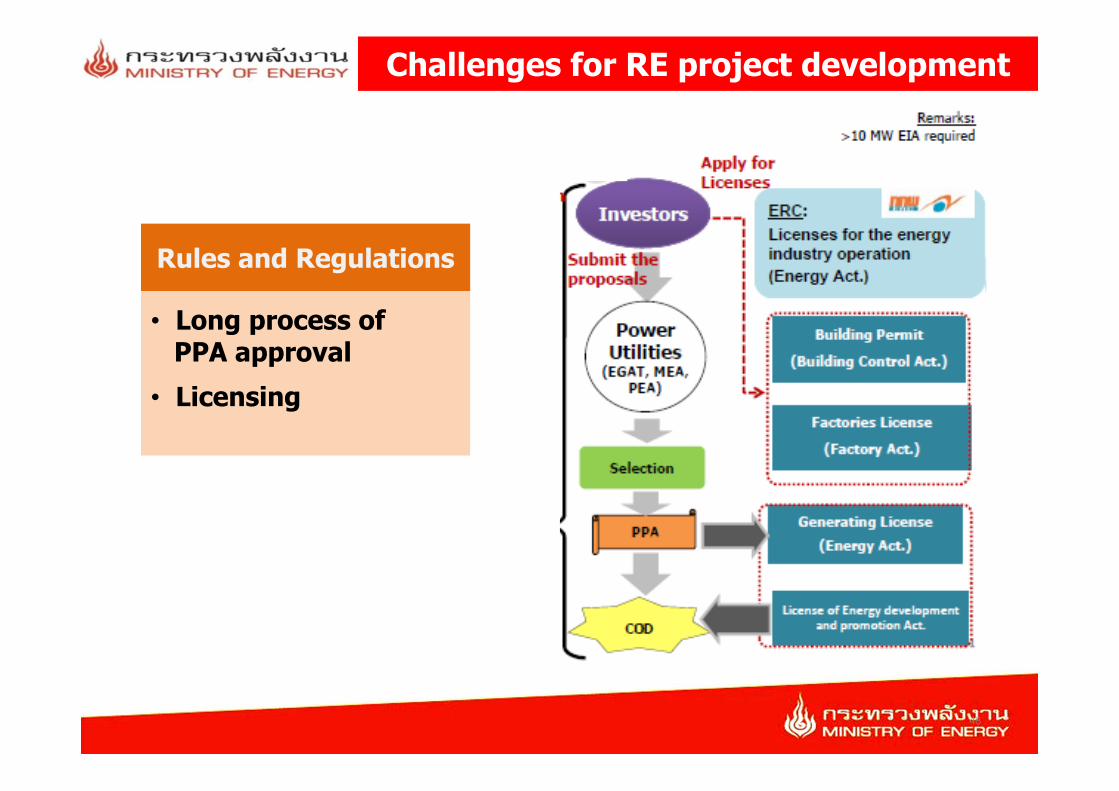
Rules and Regulations
• Long process of PPA approval
• Licensing
48
2
Challenges for RE project development
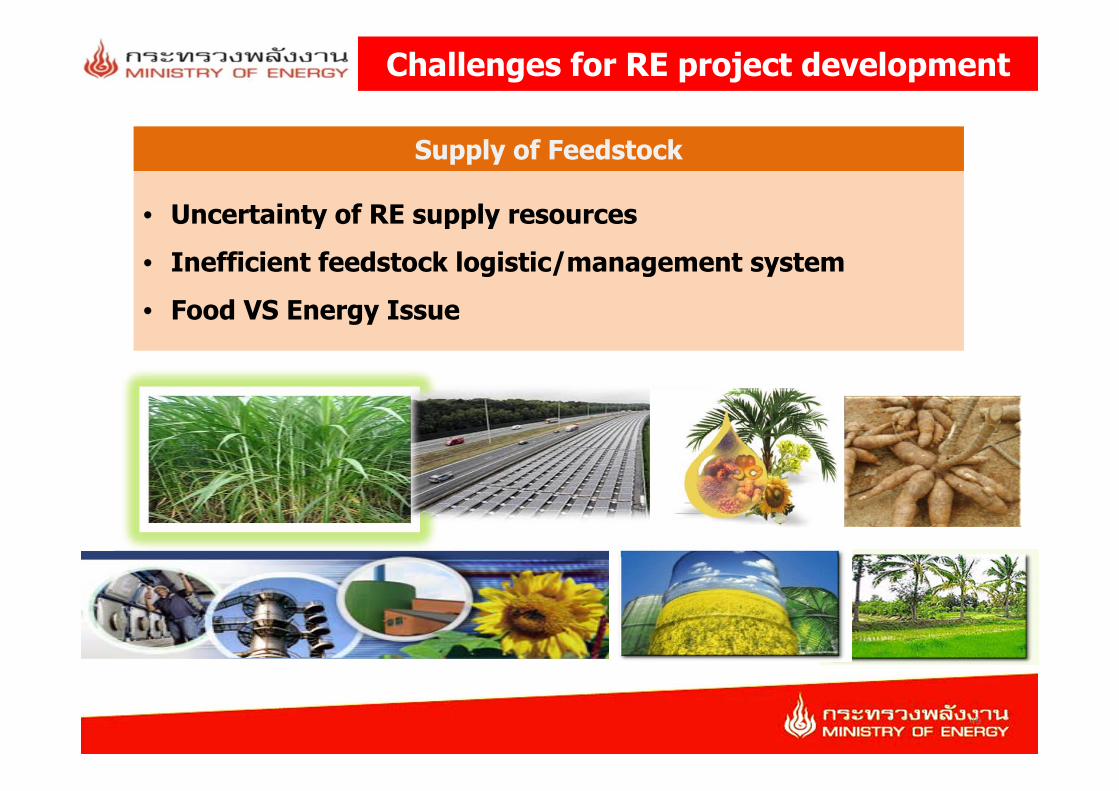
Supply of Feedstock
• Uncertainty of RE supply resources• Inefficient feedstock logistic/management system• Food VS Energy Issue
49
4. Way forward for future RE Development
50
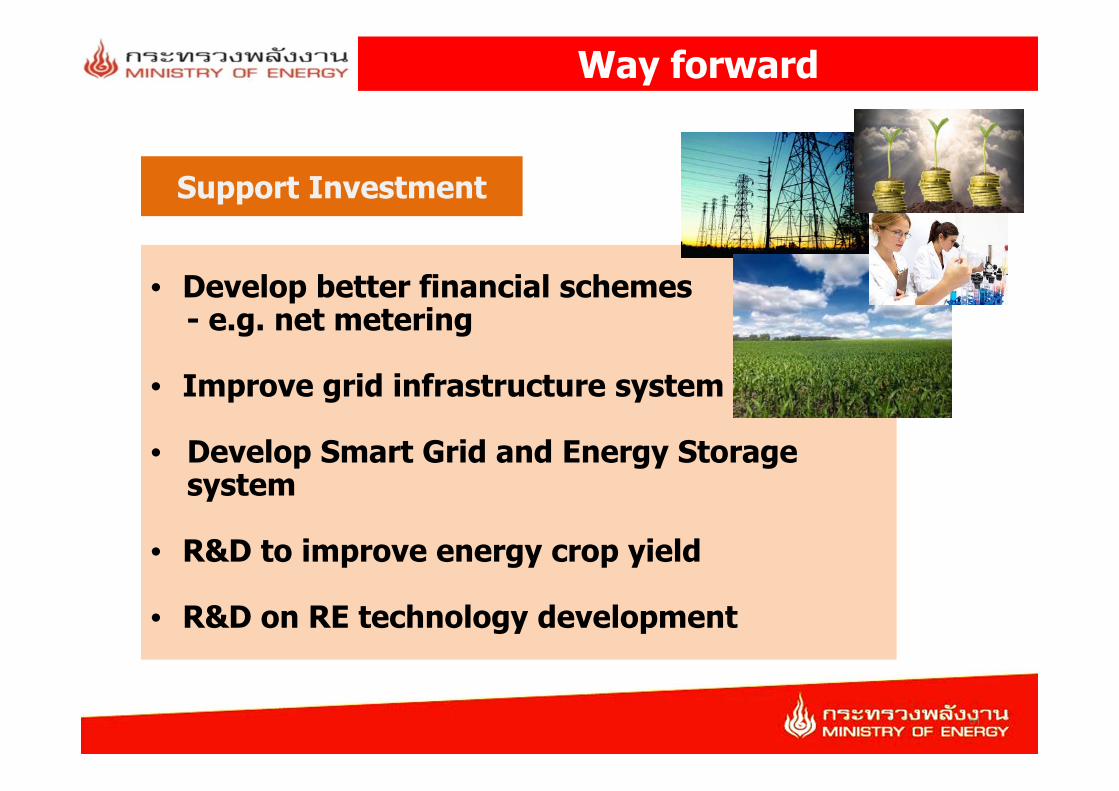
• Develop better financial schemes- e.g. net metering
• Improve grid infrastructure system
• Develop Smart Grid and Energy Storage system
• R&D to improve energy crop yield
• R&D on RE technology development
2
Way forward
Support Investment
51
2
Way forward
Public acceptance
• Promote public understanding/awareness
• Increase community participation
• More acceptable EIA/public hearing process
• Law enforcement on environmental protection
52
2
Way forward
Rules and Regulations
• Facilitate PPA approval
• Deregulate to support RE development
• Standardize RE equipment
53
2
Way forward
Supply of Feedstock
• Zoning for crops
• R&D on feedstock development
• Management of feedstock logistic and supply chain
54
Acceptable
Available
Affordable
55


