cresud sociedad anónima · cresud sociedad anónima, comercial, inmobiliaria, financiera y...
TRANSCRIPT

Cresud Sociedad Anónima
Comercial, Inmobiliaria,
Financiera y Agropecuaria
Annual Report and Financial Statements
for the fiscal years ended
June 30, 2013 and 2012

Cresud Sociedad Anónima,
Comercial, Inmobiliaria,
Financiera y Agropecuaria
Financial Statements
Table of Contents
LETTER TO SHAREHOLDERS .......................................................................................... 3
Our Strategy ....................................................................................................................... 6
Macroeconomic Context ...................................................................................................... 9
Business Description ..........................................................................................................17
IRSA’s Segments – Real Estate Business ..............................................................................47
Competition .......................................................................................................................72
Indebtedness ......................................................................................................................74
Subsequent Events..............................................................................................................76
Management’s Discussion and Analysis of Financial Condition and Results of Operations ..........78
Management’s Discussion of Results ....................................................................................87
Service Sharing Agreement entered into with IRSA and Alto Palermo .................................... 104
Prospects for Next Year .................................................................................................... 106
Board of Directors and Senior Management ........................................................................ 107
Dividends and Dividend Policy .......................................................................................... 114
Market Information .......................................................................................................... 116
CRESUD S.A.C.I.F. y A.: CORPORATE GOVERNANCE CODE ........................................ 117

3
LETTER TO SHAREHOLDERS
Dear Shareholders,
We have ended a new crop season with mixed results. On the one hand, we had very good
returns from the sale of farms, confirming the strength of our model, focused mainly on the
development and realization of lands. On the other hand, adverse weather conditions in the
region affected the productivity of our crops, leading to lower production volumes than those
expected at the beginning of the season. Finally, our investment in IRSA remains a robust
business, reflecting the fine diversification of its premium portfolio.
During this year we succeeded in materializing our land appreciation strategy through the sale
of farms, following our agricultural development and technological and management
improvement actions. We sold 5,600 hectares intended for beef cattle production in our La
Suiza farm, located in the Province of Chaco, Argentina, reaching an appreciation of 235% and
an annual rate of return of 15.2% in dollars whilst maintaining 36,380 hectares allocated to
mixed activities in that farm. Moreover, through our subsidiary Brasilagro we sold the
Horizontina farm located in the State of Maranhão, acquired in 2010, reaching an appreciation
of 56% and an annual rate of return of 27% in dollars. Finally, we sold 394 hectares in the
Araucária farm located in the State of Goias, and a fraction of 4,895 hectares in the Cremaq
establishment located in the State of Piaui, for very attractive prices, with appreciations of 225%
and 308% and annual rates of return of 20.2% and 23.8%, respectively. These transactions
reflect the soundness of the farming real estate market in the region and the strength of our
strategy based on land value. In line with this, during this fiscal year we developed 20,300
hectares: 7,550 in Argentina, in the region of Salta; 950 in our farm in Paraguay; and 11,800 in
our properties located in Brazil. We expect to keep up this rhythm of development in the next
fiscal years and to be able to convert into producing lands our over 200,000 hectares of land
reserves with development potential in the countries where we operate.
When we began planning the summer crop planting process, at the start of the crop season that
is now ending, we expected that weather conditions for the next months would follow the typical
“El Niño” pattern, with heavy rainfall levels in the region. Yet, during the spring of 2012 the “El
Niño” effect was more serious than predicted and the region witnessed an excess of humidity
and rain in various agricultural areas, forcing us to postpone planting. However, by mid-summer,
when planting had been completed, weather conditions worsened, causing strong droughts in
the north of Argentina, Brazil and Paraguay that made it impossible for the company to finish the
planting process in certain farming areas, and leaving them idle. The severe drought affected
more visibly our farms in Salta, which suffered the worst impact in the last 20 years, forcing the
Province to seek agricultural emergency relief. Fortunately, our farms in Bolivia were not
significantly affected and posted results in line with our projections.
The impact of the drought in the region and in particular in certain farms of our portfolio has led
our annual production of 435,000 tons to be lower than expected, mirroring the figure recorded
in the 2012 season, when the region had experienced a severe drought resulting from the “La
Niña” phenomenon. The yields reached by our main crops, soybean and corn, were in line with
those posted during the previous season, although the prices of the major commodities
remained firm during this fiscal year due to the drought that hit the United States in the last
farming cycle.

4
The lack of water in the north of Argentina affected our beef cattle production, as our herd is
mostly concentrated in that region. Fattened livestock prices remained strong during this year,
although they could not keep pace with the increase in costs. We managed to sell 20,196 cattle
heads, reducing our stock to 54,945. Our milk business, which we develop in our “El Tigre” dairy
farm, recorded more stable results due to matching increases in prices and costs and a daily
productivity of 20.7 liters per milking cow, in line with the previous fiscal year.
During this fiscal year we increased our stake in IRSA to 65.45%. We believe in the long-term
value of our investment in this company, which we expect will continue to deliver outstanding
business results. Among its businesses, IRSA’s Shopping Center business has proved to be
extremely robust, with tenant sales growing at 25% compared to the previous year and a
portfolio of 308,000 square meters of gross leaseable area and 99.1% occupancy.
Besides, we maintain our investment in Futuros y Opciones (“FyO”), which has been recording
a sustained growth over the past years. In 2013, FyO traded 1.8 million tons of grains and sold
agricultural supplies for USD 15.9 million, a 55% growth as compared to 2012. Its net income
was ARS 4.4 million, and it is already in a position to pay dividends for the first time for
approximately ARS 1.2 million. We trust that we will keep on achieving good results from our
interest in this company.
We continue to hold a 35.7% interest in AgroUranga S.A., a company that owns two farms
located in the core area of the Pampas prairies that deliver highly satisfactory production
results, emphasizing on soil conservation, the use of rational farming methods, and care for the
environment. During this year, AgroUranga S.A. posted net income for ARS 23.3 million and
paid dividends to its shareholders in several opportunities, totaling ARS 13.5 million.
We maintain our investment in Cactus Argentina with an optimistic outlook. Although in the past
years Cactus Argentina suffered losses in its meat packing plant due to adverse conditions in
the domestic sales market, we managed to reopen the plant. Even though during this year we
had similar results to those of 2012, its losses were milder in the last months. We are positive
that Cactus Argentina has the technical and management capabilities required for recovering
satisfactorily when the industry scenario starts to show better prospects. We will continue to
work towards optimizing its structure and production capacity.
During this fiscal year, the shares of our subsidiary Brasilagro became listed on the NYSE as
Level II ADRs, under the ticker symbol LND, clearly evoking our strategy focused on land value.
Year after year, Brasilagro’s growth and fine results consolidate the vision we had when we
founded it in 2006.
In November 2012, our shareholders’ meeting declared dividends for ARS 120 million that were
made available to our shareholders in the BCBA and NASDAQ. We hope that during this year
and those ahead we will be able to keep on delivering to them the results of the value generated
by our successful businesses.
In the local market, given the existing favorable financial conditions, we continued to refinance
our short-term debt with a view to extending maturity terms and improving our average
borrowing cost. In May 2013 we issued notes with maturities of approximately two years, and
we hit a new record in the local market by issuing dollar-denominated notes with a 5-year
maturity term at a 1.5% fixed interest rate.

5
During fiscal year 2013 we adopted the IFRS standards for preparing our financial statements.
The most significant changes in the agricultural segments are the addition of new lines,
reflecting results from the production and holding of biological assets.
We believe that providing support to the community is one of the pillars of our business strategy.
Therefore, during this fiscal year we reinforced cooperation actions with the communities in the
regions where we do business. In this way, we provided assistance to the eight rural schools
located in the influence area of our agricultural developments through the “One School, Different
Sights” program in the Provinces where the company has operations (Salta, Santa Fe and
Chaco). Apart from making charitable donations, other actions taken by us included the
execution of infrastructure works, providing coaching programs for teachers, launching school
vegetable gardens, staging vaccination campaigns, and giving first-aid training.
Looking ahead to the 2014 season, we expect to continue our growth path in the region,
increasing our production area to 208,000 hectares, developing more lands and selling farms
that have reached their highest appreciation level. We are confident in the weather projections
for 2014, which indicate that the next season will be neutral. Moreover, we hope that the real
estate businesses from our subsidiary IRSA will continue to be as solid as in the past years.
With a future that presents challenges and opportunities alike, we believe that the commitment
of our employees, the strength of our management and the trust placed on us by our
shareholders will be key elements in our ability to continue growing and successfully
implementing our strategy. To all of you, my most sincere thanks.
City of Buenos Aires, September 9, 2013.
Eduardo S. Elsztain
Chairman
6
Our Strategy
We seek to maximize our return on assets and overall profitability by: (i) identifying, acquiring and operating agricultural properties having attractive prospects for
increased agricultural production and/or medium or long-term value appreciation and selectively disposing of properties subsequently as appreciation is realized,
(ii) optimizing the yields and productivity of our properties by implementing state-of-the-art technologies and agricultural techniques; and
(iii) preserving the value of our significant long-term investment in the urban real estate sector held through our subsidiary IRSA.
To such end, we seek to:
Maximize the value of our agricultural real estate assets.
We conduct our agricultural activities with a focus on maximizing the value of our agricultural real estate assets. We rotate our portfolio of properties over time by purchasing properties which we believe have a high potential for appreciation and selling them selectively as opportunities arise to realize attractive capital gains. We achieve this by relying on the following principles:
Acquiring under-utilized properties and enhancing their land use:
This principle includes:
(i) transforming non-productive land into cattle feeding land,
(ii) transforming cattle feeding land into land suitable for more productive agricultural uses,
(iii) enhancing the value of agricultural lands by changing their use to more profitable
agricultural activities; and
(iv) reaching to the final stage of the real estate development cycle by transforming rural
properties into urban areas as the boundaries of urban development continue to extend into
rural areas.
To do so, we generally focus on acquisitions of properties outside of highly developed
agricultural regions and/or properties whose value we believe is likely to be enhanced by
proximity to existing or expected infrastructure.
Applying modern technologies to enhance operating yields and property values.
We believe that an opportunity exists to improve the productivity and long-term value of
inexpensive and/or underdeveloped land by investing in modern technologies such as
genetically modified and high yield seeds, direct sowing techniques, and machinery. We
optimize crop yield through land rotation, irrigation and the use of fertilizers and agrochemicals.
To enhance our cattle production, we use genetic technology and have a strict animal health
plan controlled periodically through traceability systems. In addition, we have introduced a
feedlot to optimize our beef cattle management and state-of-the-art milking technologies in our
dairy business.
Anticipating market trends.
We seek to anticipate market trends in the agribusiness sector by:
7
(i) identifying opportunities generated by economic development at local, regional and
worldwide levels,
(ii) detecting medium and long-term increases or decreases in supply and demand caused by
changes in the world’s food consumption patterns and
(iii) using land for the production of food or energy.
International expansion.
We believe that an attractive opportunity exists to acquire and develop agricultural properties
outside Argentina, and our objective is to replicate our business model in other countries.
Although most of our properties are located in different areas of Argentina, we have begun a
process of expansion into other Latin American countries, including Brazil, Bolivia, Paraguay
and Uruguay.
Increase and optimize production yields.
We seek to increase and improve our production yields through the following initiatives:
Implementation of technology.
To improve crop production, we use state-of-the-art technology. We invest in machinery and the
implementation of agricultural techniques such as direct sowing. In addition, we use high-
potential seeds (GMOs) and fertilizers and we apply advanced land rotation techniques. In
addition, we consider installing irrigation equipment in some of our farms.
To increase beef cattle production we use advanced breeding techniques and technologies
related to animal health. Moreover, we optimize the use of pastures and we make investments
in infrastructure, including installation of watering troughs and electrical fencing. In addition, we
have one of the few vertically integrated beef cattle processing operations in Argentina through
Cactus Argentina S.A. (“Cactus”), a feedlot and slaughterhouse operator.
In our milking facility, we have implemented an individual animal identification system, using
plastic tags for our beef cattle and “RFID” tags. We use software from Westfalia Co. which
enables us to store individual information about each of our dairy cows.
Increased production.
Our goal is to increase our crop, beef cattle and milk production in order to achieve economies
of scale by:
Increasing our owned land in various regions by taking advantage of attractive land purchase
opportunities. In addition, we expand our production areas by developing lands in regions where
agricultural and livestock production is not developed to its full potential. We believe in the use
of technological tools for improving the productivity of our land reserves and enhancing their
long-term value. However, current or future environmental regulations could prevent us from
fully developing our lands by demanding us to maintain part of them as natural woodlands not
allocated to production.
Diversifying our production and the weather risk by leasing farms, thus expanding our product
portfolio and optimizing our geographic focus, in particular in areas that are not appealing in
terms of land value appreciation but with attractive productivity levels. We believe that this
diversification mix mitigates our exposure to seasonality, commodity price fluctuations, weather
conditions and other factors affecting the agricultural and livestock sector.

8
Moreover, we believe that continuing to expand our agricultural operations outside of Argentina
will help us improve even more our ability to produce new agricultural products, further
diversifying our mix of products, and mitigating our exposure to regional weather conditions and
country-specific risks.
Preservation of long-term value of our investment in IRSA.
We seek to maintain the long-term value of our significant investment in the urban real estate
sector through IRSA. We believe that IRSA is an ideal vehicle through which to participate in
the urban real estate market due to its substantial and diversified portfolio of residential and
commercial properties, the strength of its management and what we believe are its attractive
prospects for future growth and profitability.

9
Macroeconomic Context
International Outlook
As reported by the International Monetary Fund (“IMF”) in its “World Economic Outlook”
(“WEO”), the world’s recovery, which until now had been a two-speed trend, is now a three-
speed trend: whilst the developing economies grow at a pace expected to attain an annualized
6%, developed economies will grow at values a bit in excess of 2% though showing a
bifurcation between growth in the US, which has been at an annualized 2% pace, and growth in
the Euro Zone, which has reached the end of the year with virtually nil growth rates.
According to forecasts, it will not be until 2014 that such region will grow by less than 1% as
slow progress is being made in the reforms required to resume the road to growth.
Growth trends in emerging markets have been similar to those posted last year, with India and
Brazil having returned to the growth path offset by lesser growth in Russia and China and
showing stabilization in growth at a bit less than 8%. The expectation is that this will have a
slightly adverse impact on the price of commodities.
Argentina is expected to grow by 3% on average in 2013-14 mainly thanks to the growth
projected for Brazil for this period.
The IMF’s World Economic Outlook forecasts (Percentage change)
Forecasts
2011 2012 2013 2014
The world’s GDP 3.9 3.1 3.1 3.8
Advanced economies 1.7 1.2 1.2 2.1
United States 1.8 2.2 1.7 2.7
Euro zone 1.5 -0.6 -0.6 0.9
Japan -0.6 1.9 2.0 1.2
Emerging markets and Developing economies 6.2 4.9 5.0 5.4
Russia 4.3 3.4 2.5 3.3
India 6.3 3.2 5.6 6.3
China 9.3 7.8 7.8 7.7
Brazil 2.7 0.9 2.5 3.2
South Africa 3.5 2.5 2.0 2.9
Argentina 8.9 1.9 2.8 3.5
Latin America and the Caribbean 4.6 3.0 3.0 3.4

10
Financial market behavior (Percentage change)
2011 2012 2013*
MSCI World -7.6 13.2 12.8
MSCI Emerging Markets -20.4 15.1 -9.6
S&P 500 -0.0 13.4 18.7
DAX 30 -14.7 29.1 8.7
FTSE 100 -5.6 5.8 12.3
Nikkei 225 -17.3 22.9 31.5
Bovespa -18.1 7.4 -21.0
Merval -30.1 15.9 17.6
* As of the date of publication
Source: Bloomberg
During 2011, financial markets exhibited a somber outlook that seemed to recover a little in
2012. The MSCI World index (representative of developed markets) fell during 2011 and
showed strong recovery in 2012 and in the year 2013 to date, the earnings heard of are in the
region of 12.8%. The yields in the MSCI Emerging Markets index were negative during 2011
and last year they showed a slight offset. In the year 2013 to date, however, yields were far from
encouraging. In line with this, the indices in the world’s largest stock exchanges performed
poorly during 2011, except for the S&P500, which followed through the year almost without
movement. A recovery was seen during 2012 and it was maintained at different speeds. These
trends continued in 2013.
Commodities market behavior (Percentage change)
2011 2012 2013*
GSCI Industrial Metals -20.9 3.8 -15.1
GSCI Energy 8.8 -1.6 3.7
GSCI Agriculture -14.9 3.9 -17.6
Soybean -14.0 18.4 -3.8
Corn 2.8 8.0 -28.8
Wheat -17.8 19.2 -14.9
Oil 8.2 -7.1 14.0
* As of the date of publication
Source: Bloomberg
These past years the commodities markets have exhibited uneven behavior. On one hand, the
GSCI Industrial Metals showed poor yields except for 2012 when they grew by 3.8%. The price
of energy, measured on the basis of the GSCI Energy index, grew slightly in recent years,
except for a drop in 2012. Finally, the GSCI Agriculture showed a drop in the price of agricultural
commodities, which in the past years became more marked. The performance shown by the
main commodities is in line with these indices.
According to the IMF, inflation at the global level is under control in the advanced economies
and, broadly speaking, also in the emerging and developing economies whilst unemployment
remains at low rates.

11
Inflation (Annual percentage)
Forecasts
2011 2012 2013 2014
Advanced economies 2.7 2.0 1.7 2.0
United States 3.1 2.1 1.8 1.7
Euro zone 2.7 2.5 1.7 1.5
Japan -0.3 0.0 0.1 3.0
Emerging markets and developing economies 7.2 5.9 5.9 5.6
Russia 8.4 5.1 6.9 6.2
India 8.9 9.3 10.8 10.7
China 5.4 2.6 3.0 3.0
Brazil 6.6 5.4 6.1 4.7
South Africa 5.0 5.7 5.8 5.5
Argentina 9.8 10.0 9.8 10.1
Latin America and the Caribbean 6.6 6.0 6.1 5.7
According to the IMF, the advanced economies must continue to implement mixed policies to
ensure short-term growth whilst they execute medium-term plans to structure their sovereign
debts sustainably. The monetary stimulus must be maintained until macroeconomic recovery
can be assured. In turn, for the financial sector to move ahead, reforms are required to
recapitalize and restructure banks’ balance sheets.
In the Euro zone, banks’ assets must be reviewed to quantify the needs for recapitalization. In
addition, progress must be made in banking unity and in the reduction of market fragmentation;
demand must be supported and the production and job markets must be reformed.
Economic cycle oscillations and certain vulnerabilities affect emerging markets and developing
economies. The possibility of normalization in the US monetary policy bringing consequences
such as the reversal of financial flows may generate the need for reviewing policies. On one
hand there will be the possibility of lower production levels and on the other hand there will be
impacts on the prices of currencies due to capital outflows. To maintain financial stability after a
lengthy period of credit growth, the suggestion is to engage in regulatory supervision and
macroeconomic prudential policies.
Finally, the IMF suggests that these policies should be accompanied by structural reforms in the
largest economies to underpin growth in the global economy. These entail an increase in
consumption levels (China) and investment (Germany) in the economies with surpluses and
measures to increase competitiveness in deficit economies.

12
The Argentine economy
Given a more adverse international outlook, the forecasts arising from market consensus
concerning global growth for 2013 were revised down again, in particular concerning growth in
the Americas, with the estimated expansion being 3.2% for the whole of 2013. This correction
was due to a smaller demand from the advanced economies, and, more recently to a
deterioration in external financing conditions.
In the case of Argentina, a recovery has been seen in the year-on-year growth rate in the last
months of the first half of 2013, encouraged by the domestic market and the demand from the
rest of the world.
Private consumption remained as the main driver of the economy, growing at rates close to 6%
year on year and favored by the increase in nominal salaries and the adjustments in
governmental transfers. Consumer loans for families continued to exhibit major dynamism in the
first half of the year, with year-on-year increases close to 31%.
The Unemployment Rate was at 7.9% of the country’s Economically Active Population which
points to a year-on-year increase of 0.8 percentage points. However, the Employment Rate
remains at 42.2%, similar to that seen a year ago.
In turn, Gross Domestic Fixed Investment (GDFI) continued to perform positively as in the past
years and showed a year-on-year 1.3% increase, which is in the neighborhood of 23% of GDP.
The expectation for the rest of the year is that investment will continue to gain ground thanks to
the continuity of the policies aimed at encouraging capital expenditures. In particular, there is
the Argentine Credit Program (PRO.CRE.AR, as per the acronym in Spanish) which has started
to have a greater impact in the course of the year. The amounts contributed by the Argentine
Credit Program (PRO.CRE.AR) are equivalent to 6.3% of GDP construction.
The exported volumes grew, inasmuch as the arrival of the coarse grain harvests of the 2012/13
season favored the increase in sales abroad of primary products and their by-products. The
exports of Industrial Origin Manufactures rose by 12.5% against the same period a year earlier,
mainly driven by sales of cars to Brazil.
When it comes to supply, the manufacturing sector grew by 3.4% in the first months of 2012,
with its main driver being the automotive industry whose output rose by 34.6%. The food
industry showed a drop in output in the first half of the year and accumulated a year-on-year
2.4% decrease. Beverages and dairy products continued to perform negatively whilst the
production of processed beef products fell. There was also a reduction in the milling of grains
and oilseed although the expectation is that this trend will reverse in the coming months due to
the arrival of the coarse grain harvest.
As regards cattle beef production, there has been an increase in the slaughtering levels though
against a backdrop of decreased cattle beef prices.
The services industry, in turn, continued to perform favorably. Financial intermediation,
communications, wholesalers and retailers continued to be the sectors that grew the most and
which most significantly contributed to the expansion in the economy.

13
Hand in hand with the increased dynamism in economic activities, the volumes imported grew
by a year-on-year 28% during the first half of the year: the acquisition of capital goods rose by
52% and the acquisition of consumer goods grew by a similar amount, with 32% increases.
The Current Account posted a USD 2,380 deficit balance for the first half of the calendar year
although the expectation is that for the rest of 2013 there will be an improvement in the balance
of trade given the exportable balances of the agricultural sector and the continued growth in
industrial sales to Brazil. The stock of International reserves in late June 2013 was USD 37,005
million. This notwithstanding, and due to the policy of “external desindebtedness” the level of
reserves continues to stand for 50% of the country’s public external debt and for approximately
88% of the stock of public debt denominated in foreign currency and in the hands of private
creditors. According to the most recently available forecasts, the total external debt (public plus
private) went from 31.5% of GDP in March 2012 down to 28.9% a year later, reaching the
lowest ratio in the last 18 years.
The country’s tax revenues grew by 30% year on year, mainly sustained by the taxes linked to
the domestic market. The primary expenditure of the non-financial public sector grew in line with
revenues and was mostly oriented to items related to the sustainment of domestic demand,
focused on the lower-income sectors. The Argentine Treasury continued to satisfy its financing
needs using the sector’s own sources which contributed to the reduction of public debt in the
hands of the private sector.
In local financial markets, the lending interest rates grew by different percentages throughout
the six-month period, with the interest rate charged to companies for 7-day advances averaging
16.8%. In turn, the Private Badlar rate in Pesos averaged 15.8% in May 2013 against 11.3% in
May 2012. As had also been the case in these past years, the Argentine Central Bank
continued with its controlled floating exchange rate policy: the Peso sustained a 21.2% nominal
depreciation in the period from June 2012 to June 2013.
In the fiscal year herein analyzed, Argentina’s country risk, measured as per the Emerging
Market Bond Index, rose by 4.0% maintaining a high spread vis-à-vis the rest of the countries in
the region. The debt premium paid by Argentina was at 1,167 points in June 2013, compared to
the 232 paid by Brazil and the 166 paid by Mexico.
For the second half of 2013, the expectation is that the positive performance seen in the first
half of the year will continue, starting with a consolidated domestic market, the spillover of the
agricultural sector associated to the 2012/13 season and the increased demand expected by
Argentina’s main trade partners.

14
Agriculture and Cattle Raising Sector in Argentina
Argentina has positioned itself over the years as one of the world’s leading food producers and
exporters. It is the second largest country in South America after Brazil and has particularly
favorable natural conditions for diversified agricultural production: vast extensions of fertile land
and varied soil and weather patterns.
During the decade of the nineties, the Argentine agriculture and cattle raising industry
experienced sweeping changes, such as a significant increase in production and yield (thanks
to a sustained agricultural modernization process), relocation of production (crops vs. livestock)
and a significant restructuring process within the industry, as well as land concentration. Taking
advantage of a favorable international context, the agriculture and cattle raising sector has been
one of the major drivers of the Argentine recovery after the economic and financial crisis of
2002.
In the 2012/13 season, the agricultural sector faced adverse weather conditions in the final
cycle of the small grain season and the start of coarse grain season that reduced the potential
of all crops, in particular wheat. Excessive rains flooded several regions of Argentina and
trimmed the 2012/13 wheat output, leading to smaller exportable balances and lower product
quality. Consequently, wheat prices hit record levels in the domestic market, as they departed
from the external context due to the lower supply and domestic consumption needs. The United
States Department of Agriculture (“USDA”) forecasts that Argentina will produce 12 million tons
during the 2013/14 season, 20% higher than in the previous season, and that the harvested
area will be 3.9 million hectares, 11.4% more than in the previous year.
In connection with coarse crops, this season was signaled by the delay in the planting process,
which reduced the yield potential, initially expected to reach record levels and to recover from
the losses of the previous season. Corn and soybean harvests were lower than initially
expected, although they were offset by prices that remained firm as a consequence of the
drought experienced in the United States. The products that were most favored by this effect
were corn and soybean, with strong prices that fell only after the 2013/14 plantings in the United
States had started.
The USDA projects the following production and yield levels for soybean in the following
countries:
Soybean Production Surface Area Yield
2012/2013 2013/2014 Var (%) 2012/2013 2013/2014 Var (%) 2012/2013 2013/2014 Var (%)
Argentina 49.5 53.5 +8.1% 18.9 19.5 +3.2% 2.6 2.7 +4.6%
Paraguay 9.4 8.4 -10.3% 3.2 3.1 -1.9% 3.0 2.7 -8.8%
Brazil 82.0 85.0 +3.7% 27.7 28.3 +2.0% 3.0 3.0 +1.7%
Bolivia 2.7 2.3 -13.2% 1.1 1.1 -3.7% 2.4 2.2 -9.8%
United States 82.1 88.6 +8.0% 30.8 30.9 +0.4% 2.5 2.6 +3.2%
China 12.8 12.5 -2.3% 6.8 6.6 -2.2% 1.9 1.9 -0.5%
Global 267.6 281.7 +5.3% 108.2 110.7 +2.3% 2.5 2.6 +3.2%
Source: USDA, Foreign Agricultural Service. Circular Series WAP 13-08, August 2013.
On the other hand, corn crops are expected to behave as follows:
Corn Production Surface Area Yield
2012/2013 2013/2012 Var (%) 2012/2013 2013/2012 Var (%) 2012/2013 2013/2012 Var (%)
Argentina 26.5 27.0 +1.9% 4.0 3.5 -12.5% 6.6 7.7 +16.3%
Brazil 80.0 72.0 -10.0% 15.8 15.5 -1.9% 5.1 4.7 -8.1%
United States 273.8 349.6 +27.7% 35.4 36.1 2.0% 7.7 9.7 +25.2%
Global 858.8 957.2 +11.5% 174.8 176.5 1.0% 4.9 5.4 +10.4%

15
Source: USDA, Foreign Agricultural Service. Circular Series WAP 13-08, August 2013.
Projections for the start of the 2013/14 season point to a recovery in the U.S. feed and soybean
crops, although lower than initially expected. The slow start of seedings and the subsequent
weather conditions have curbed yield forecasts, and stock levels are recovering less than
expected. In the case of soybean, the U.S. balance could continue to be tight faced with the
strong demand from China intended to meet its domestic requirements.
In Argentina, the 2013/14 season has started with winter crop seedings that grew less than
expected, despite the government’s incentive of reimbursing wheat export duties to growers.
Wheat prices remain firm due to the scarce supply of the previous season and concerns
regarding the volumes of the next harvest in light of the weather conditions that limit crop
development.
Once again, the weather is one of the key factors of the season. Close to the start of the coarse
crop season, corn also faces higher costs that are not accompanied by price prospects.
Expected corn prices discourage plantings, leading to lower acreage projections against an
increase in the areas planted with soybean.
2013/14 projections for soybean show an increase in the planted area due to the lower
profitability of corn resulting from lower prices and the expected recovery of the United States,
set to regain the share lost in the world market in the previous season. Future soybean prices
show lower levels than in the previous year at the same date, although there are chances that
changes will occur based on the effective seedings in South America, the weather in the crops’
development stages and external demand.
Beef Cattle
According to FAO (Food and Agriculture Organization) projections, the market has been
characterized by high prices, driven mainly, on the side of demand, by the higher income
recorded in developing countries, and on the side of supply, by high production costs, mainly
feed crops, energy costs and labor. These factors have boosted production in more countries,
although the rate of growth of supply could not keep up with the increase in poultry production.
According to FAO’s estimates, the cattle beef price index reached 150 points (4,654 USD/tn) in
2013, compared to 141 points in 2012 (4,368 USD/tn). World production will reach 67.2 million
tons in 2013, out of which Argentina is expected to produce 2.7 million tons.
Milk Sector
As reported by the FAO, fueled by the robust growth in the demand by developing countries,
milk prices grew strongly in 2010 and the first half of 2011, reaching peaks close to those
recorded during the commodity boom of 2007/2008. The high returns and excellent pasturing
conditions in Oceania and certain regions of South America boosted supply, causing prices to
decline. This fall continued during the second half of 2012, and was accompanied by an
increase in export volumes. Against the broadening demand, especially from China, bottom
prices were higher than in the 2009 slump.
The droughts experienced in the United States and Russia in 2012 increased the prices of
grains, leading to a lower production growth rate in the United States and the European Union
and higher prices. In early 2013, the recovery of prices intensified as drier weather conditions
were reported in Oceania which impacted on grain availability expectations.

16
While the short-term scenario seems complex, weather conditions are expected to return to
normal in the medium term, pushing down prices below the high levels recorded in 2011.

17
Business Description
Portfolio
We are a leading Latin American agricultural company engaged in the production of basic
agricultural commodities with a growing presence in the agricultural sector of Brazil, through our
investment in Brasilagro—Companhia Brasileira de Propriedades Agrícolas (“Brasilagro”), as
well as in other Latin American countries. We are currently involved in several farming activities
including grains and sugarcane production, beef cattle raising and milk production. Our
business model focuses on the acquisition, development and exploitation of agricultural
properties having attractive prospects for agricultural production and/or value appreciation and
the selective sale of such properties where appreciation has been realized. In addition, we lease
lands to third parties and perform agency and agro-industrial services, including a feedlot and a
meat packing plant. Our shares are listed on the Buenos Aires Stock Exchange (“BCBA”) and
the NASDAQ.
We are also directly engaged in the Argentine real estate business through our subsidiary IRSA –Inversiones y Representaciones S.A. (“IRSA”)- one of Argentina’s leading real estate companies. IRSA is engaged in the development, acquisition and operation of shopping centers, premium offices, and luxury hotels in Argentina, as well as the development of residential properties. IRSA’s shares are listed on the BCBA and the NYSE. We hold a 65.45% interest in IRSA and a majority of our directors are also directors of IRSA.
As of June 30, 2013, we owned 33 farms with approximately 643,891 hectares distributed in
Argentina, Brazil, Bolivia and Paraguay. Approximately 110,447 hectares of the land we own
are used for crop production, approximately 77,963 hectares are for beef cattle production,
85,000 hectares are for sheep production, 2,780 hectares are for milk production and
approximately 21,277 hectares are leased to third parties for crop and cattle beef production.
The remaining 346,424 hectares of land reserve are primarily natural woodlands. In addition, we
have the rights to hold approximately 132,000 hectares of land under concession for a 35-year
period that can be extended for another 29 years. Out of this total, we have developed 21,947
hectares for crop production. Also, during fiscal year 2013 ended on June 30, 2013, we leased
45,492 hectares from third parties for crop production and 12,635 hectares for beef cattle
production.
In millions of ARS Fiscal Year 2013 Fiscal Year 2012 YoY variation
Revenues 3,528.6 2,859.8 23.4%
Gross income 1,306.5 1,099.3 18.9%
Operating income 1,106.4 647.0 71.0%
Net income 154.3 58.5 163.8%
Attributable to:
Cresud’s shareholders -26.9 -21.3 26.2%
Non-controlling interest 181.2 79.8 127.0%
Total assets 12,410.7 10,324.9 20.2%
Shareholders’ equity 4,719.1 4,691.5 0.6%
The following table sets forth, at the dates indicated, the amount of land used for each
production activity (including owned and leased land and land under concession):

18
2009
(1) (5) 2010
(1) (5) 2011
(1) (5) 2012
(1) (6) 2013
(1) (6) (7)
Crops (2) 115,411 104,627 126,178 185,925 182,513
Beef Cattle (3) 128,859 105,857 102,279 95,995 90,598
Milk 4,334 4,900 2,571 3,022 2,780
Sheep 100,911 100,911 100,911 85,000 85,000
Land reserves (4) 356,796 343,153 339,744 459,979 461,729
Owned farmlands leased to third parties 8,317 11,049 14,026 25,538 31,593
Total (5) 714,628 670,497 685,709 832,964 854,213
(1) Includes 35.723% of approximately 8,299 hectares owned by AgroUranga S.A., an affiliated Argentine company in which we
own a non-controlling 35.7% interest.
(2) Includes wheat, corn, sunflower, soybean, sorghum and others.
(3) Breeding and fattening.
(4) We use part of our land reserves to produce charcoal, rods and fence posts.
(5) Does not include Brasilagro.
(6) As from fiscal year 2012, it includes Brasilagro and 100% of Cactus.
(7) Includes farms owned by Brasilagro and Cresud sold in 2013.
History
We were incorporated in 1936 as a subsidiary of Credit Foncier, a Belgian company engaged in the business of providing rural and urban loans in Argentina. We were incorporated to administer real estate holdings foreclosed by Credit Foncier. Credit Foncier was liquidated in 1959, and as a part of such liquidation, our shares were distributed to Credit Foncier’s shareholders and in 1960 were listed on the Buenos Aires Stock Exchange. During the 1960s and 1970s, our business shifted to exclusively agricultural activities.
In 2005, we organized Brasilagro together with other partners, in order to replicate our business in Brazil. Brasilagro is engaged mainly in four business segments:
(i) sugarcane; (ii) grains and cotton; (iii) forestry activities; and (iv) livestock.
In May 2006, Brasilagro’s shares became listed in the Novo Mercado of the Brazilian Stock Exchange (BOVESPA) under the ticker symbol AGRO3. After a series of transactions and agreements, we have concluded the shareholders’ agreements with our partners and currently hold a 39.64% interest in Brasilagro’s stock capital. As from fiscal year 2011, we present our financial statements in consolidated form with Brasilagro’s.
In November past, Brasilagro’s shares became listed as Level II ADRs on the NYSE, under the ticker symbol LND.
As part of a series of transactions that implied a further expansion of Cresud’s agriculture and
cattle-raising business in South America, in July 2008, Cresud purchased, through various
companies, 12,166 hectares located in Santa Cruz de la Sierra, Republic of Bolivia, for a total
price of USD 28.9 million. In June 2011, two parcels located in the same region were
purchased, with a total area of approximately 5,000 hectares intended for agriculture. In
addition, in that same month the sale of a 910 hectare parcel of land allocated to agriculture was
agreed upon, for a total price of USD 3.6 million, equivalent to USD 4,000 per hectare, which
had been purchased in 2008 for a price of USD 2,300 per hectare.

19
On the other hand, in September 2008, Cresud entered into a series of agreements for
accessing the real estate, agricultural and cattle raising and forestry markets of the Republic of
Paraguay. Under these agreements, a new company was organized together with Carlos
Casado S.A., named Cresca S.A. in which Cresud holds a 50% interest and acts as adviser for
the agricultural, cattle raising and forestry exploitation of a 41,931 hectare rural property and up
to 100,000 additional hectares located in Paraguay under a purchase option already exercised,
whose title deed is to be executed in the name of Cresca in the next months.
As of June 30, 2013, we had invested approximately ARS 1,026.8 million to acquire 65.45% of
the outstanding common shares of IRSA. Between December 2007 and June 30, 2013, we
acquired 179,380,368 shares of IRSA, increasing our interest to 65.45% at the closing of fiscal
year 2013.
20
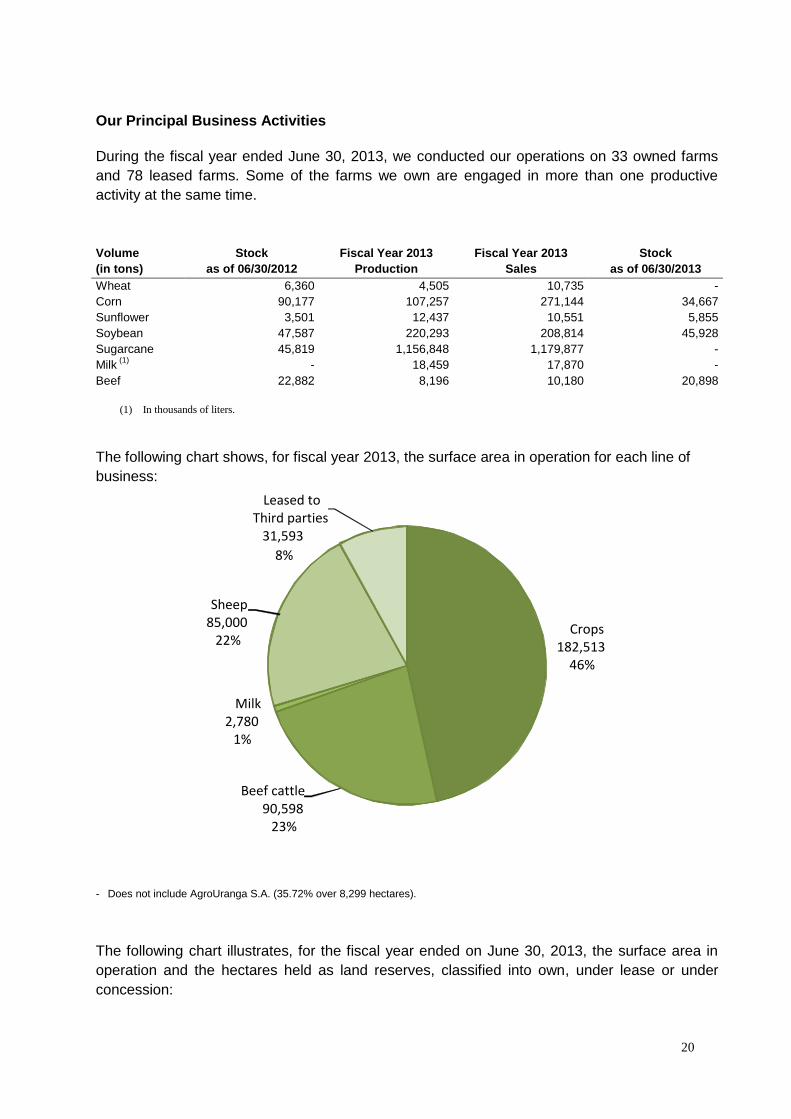
Our Principal Business Activities
During the fiscal year ended June 30, 2013, we conducted our operations on 33 owned farms
and 78 leased farms. Some of the farms we own are engaged in more than one productive
activity at the same time.
Volume
(in tons)
Stock
as of 06/30/2012
Fiscal Year 2013
Production
Fiscal Year 2013
Sales
Stock
as of 06/30/2013
Wheat 6,360 4,505 10,735 -
Corn 90,177 107,257 271,144 34,667
Sunflower 3,501 12,437 10,551 5,855
Soybean 47,587 220,293 208,814 45,928
Sugarcane 45,819 1,156,848 1,179,877 -
Milk (1)
- 18,459 17,870 -
Beef 22,882 8,196 10,180 20,898
(1) In thousands of liters.
The following chart shows, for fiscal year 2013, the surface area in operation for each line of
business:
Crops 182,513
46%
Beef cattle 90,598
23%
Milk 2,780
1%
Sheep 85,000
22%
Leased to Third parties
31,593
8%
- Does not include AgroUranga S.A. (35.72% over 8,299 hectares).
The following chart illustrates, for the fiscal year ended on June 30, 2013, the surface area in
operation and the hectares held as land reserves, classified into own, under lease or under
concession:

21
Farms under Concession
132,000
16%
Leased
Farms 60,685
7%
Owned Farms
643,891
77%
- Does not include AgroUranga S.A. (35.72% over 8,299 hectares).

22
Grains and Sugarcane
Our crop production is mainly based on grains and oilseeds and sugarcane. Our main crops
include wheat, corn, soybean and sunflower. Other crops, such as sorghum, are sown
occasionally and represent only a small percentage of total sown land.
Production
The following table shows, for the fiscal years indicated, our crop production volumes measured
in tons:
2009
(1) 2010
(1) 2011
(1) 2012
(2) 2013
(2)
Wheat 21,375 11,636 16,386 18,200 4,505
Corn 110,149 127,060 171,614 143,639 107,257
Sunflower 13,030 7,641 13,512 14,523 12,437
Soybean 76,893 126,956 154,008 193,554 220,293
Sugarcane - - - 576,048 1,156,848
Other 15,584 49,323 111,391 16,400 10,899
Total 237,031 322,616 466,910 962,365 1,512,238
(1) Does not include production from AgroUranga S.A. or Brasilagro. (2) Does not include production from AgroUranga S.A. Includes Brasilagro.
Below is the geographical distribution of our agricultural production for the last two seasons:
2013 Season Argentina Brazil Bolivia Paraguay Total
Wheat 3,224 - 1,281 - 4,505
Corn 58,336 34,630 14,291 - 107,257
Sunflower 12,090 - 347 - 12,437
Soybean 82,229 106,276 31,601 187 220,293
Sorghum 2,543 2,638 305 5,486
Other 3,055 2,358 - - 5,413
Sugarcane - 1,014,234 142,613 - 1,156,848
Total 161,476 1,157,498 192,772 492 1,512,238
2012 Season Argentina Brazil Bolivia Paraguay Total
Wheat 17,212 - 988 - 18,200
Corn 49,689 72,387 21,563 - 143,639
Sunflower 13,231 - 1,293 - 14,524
Soybean 79,164 83,319 29,976 1,096 193,554
Sorghum 949 - 4,431 2,133 7,513
Other 7,606 1,280 - - 8,887
Sugarcane - 576,030 18 - 576,048
Total 167,851 733,016 58,269 3,229 962,365
Sales
Below is the total volume of grains sold broken down into geographical areas, measured in tons:
2013 Season Argentina Brazil Bolivia Paraguay Total
Wheat 9,566 - 1,169 - 10,735
Corn 184,515 64,913 21,715 - 271,144
Sunflower 9,667 - 884 - 10,551
Soybean 79,255 100,311 27,645 1,603 208,814
Sorghum 1,278 - 3,939 590 5,807
Other 9,274 4,778 - - 14,052
Sugarcane - 1,047,792 132,085 - 1,179,877
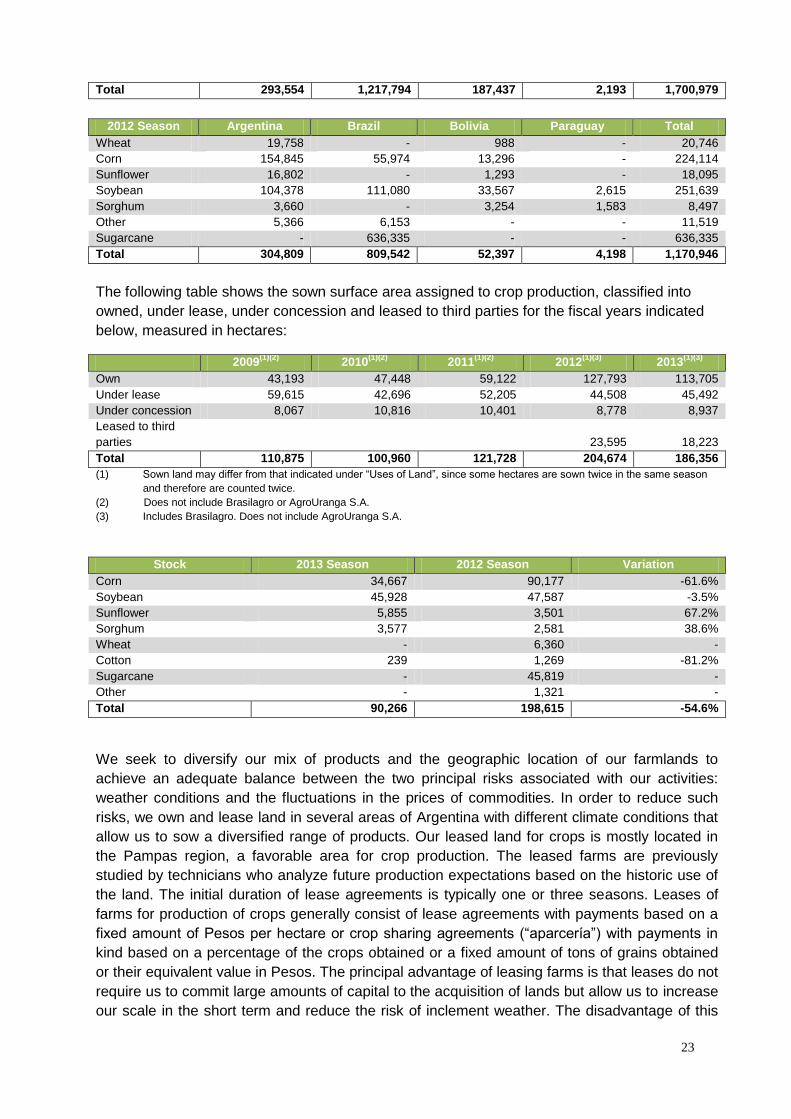
23
Total 293,554 1,217,794 187,437 2,193 1,700,979
2012 Season Argentina Brazil Bolivia Paraguay Total
Wheat 19,758 - 988 - 20,746
Corn 154,845 55,974 13,296 - 224,114
Sunflower 16,802 - 1,293 - 18,095
Soybean 104,378 111,080 33,567 2,615 251,639
Sorghum 3,660 - 3,254 1,583 8,497
Other 5,366 6,153 - - 11,519
Sugarcane - 636,335 - - 636,335
Total 304,809 809,542 52,397 4,198 1,170,946
The following table shows the sown surface area assigned to crop production, classified into
owned, under lease, under concession and leased to third parties for the fiscal years indicated
below, measured in hectares:
2009(1)(2)
2010(1)(2)
2011(1)(2)
2012(1)(3)
2013(1)(3)
Own 43,193 47,448 59,122 127,793 113,705
Under lease 59,615 42,696 52,205 44,508 45,492
Under concession 8,067 10,816 10,401 8,778 8,937
Leased to third
parties
23,595 18,223
Total 110,875 100,960 121,728 204,674 186,356
(1) Sown land may differ from that indicated under “Uses of Land”, since some hectares are sown twice in the same season
and therefore are counted twice.
(2) Does not include Brasilagro or AgroUranga S.A.
(3) Includes Brasilagro. Does not include AgroUranga S.A.
Stock 2013 Season 2012 Season Variation
Corn 34,667 90,177 -61.6%
Soybean 45,928 47,587 -3.5%
Sunflower 5,855 3,501 67.2%
Sorghum 3,577 2,581 38.6%
Wheat - 6,360 -
Cotton 239 1,269 -81.2%
Sugarcane - 45,819 -
Other - 1,321 -
Total 90,266 198,615 -54.6%
We seek to diversify our mix of products and the geographic location of our farmlands to
achieve an adequate balance between the two principal risks associated with our activities:
weather conditions and the fluctuations in the prices of commodities. In order to reduce such
risks, we own and lease land in several areas of Argentina with different climate conditions that
allow us to sow a diversified range of products. Our leased land for crops is mostly located in
the Pampas region, a favorable area for crop production. The leased farms are previously
studied by technicians who analyze future production expectations based on the historic use of
the land. The initial duration of lease agreements is typically one or three seasons. Leases of
farms for production of crops generally consist of lease agreements with payments based on a
fixed amount of Pesos per hectare or crop sharing agreements (“aparcería”) with payments in
kind based on a percentage of the crops obtained or a fixed amount of tons of grains obtained
or their equivalent value in Pesos. The principal advantage of leasing farms is that leases do not
require us to commit large amounts of capital to the acquisition of lands but allow us to increase
our scale in the short term and reduce the risk of inclement weather. The disadvantage of this
24
strategy is that the cost of leasing can increase over time, in part, because increased demand
for leased land increases the price of leased land.
In order to increase our production yields, we use, besides state-of-the-art technology, labor
control methods which imply the supervision of the seeding’s quality (density, fertilization,
distribution, and depth), crop monitoring (determination of natural losses and losses caused by
harvester) and verification of bagged crop quality. In this way, we work jointly with our suppliers
to achieve the best management of inputs, water and soil.
Wheat seeding takes place from June to August, and harvesting takes place from December to
January. Corn, soybean and sunflower are sown from September to December and are
harvested from February to June. Grains are available to be sold as commodities after the
harvest from December to June and we usually store part of our production until prices recover
after the drop that normally takes place during the harvesting season. A major part of
production, especially soybean, wheat and sunflower seeds, corn and sorghum, is sold and
delivered to buyers pursuant to agreements in which price conditions are fixed by reference to
the market price at a specific time in the future that we determine. The rest of the production is
either sold at current market prices or delivered to cover any futures contract that we may have
entered into.
AgroUranga S.A.
We have a 35.7% interest in AgroUranga S.A. (“AgroUranga”). This company optimizes
production processes and attains excellent results, with special emphasis in soil conservation,
the application of rational techniques and care of the environment.
AgroUranga S.A. has two farms: Las Playas and San Nicolás, with a combined area of 8,305
hectares, located in the core region of the Pampas prairies.
40% of the revenues from AgroUranga’s crop production derives from its special products
division, including popcorn, chickpea, peas and lentils, whereas the remaining 60% derives from
commodities, such as soybean, corn and wheat.
At present, with the assistance of its foreign trade team it is seeking to develop new products so
as to significantly increase export volumes, encouraged by the world’s growing demand.
Lease of Farms
We conduct our business on owned and leased land. Rental payments increase our production
costs, as the amounts paid as rent are accounted for as operating expenses. As a result,
production costs per hectare of leased land are higher than for the land owned by us.
Our land leasing policy is designed to supplement our expansion strategy, using our liquidity to
make productive investments in our principal agricultural activities. On the other hand, our
leasing strategy provides us with an added level of flexibility in the share of each of our products
in total production, providing for greater diversification.
The initial duration of lease agreements is typically one crop season. Leases of farms for
production of crops consist in lease agreements with payments based on a fixed amount of
Pesos per hectare or crop sharing agreements (“aparcería”) with payments in kind based on a
percentage of the crops obtained or a fixed amount of tons of grains obtained or their equivalent
value in Pesos. Leases of farmlands for cattle breeding consist in lease agreements with fixed

25
payments based on a fixed amount of Pesos per hectare or steer kilograms or capitalization
agreements with payments in kind or in cash based on the weight gain in kilograms.
During fiscal year 2013, we leased to third parties a total of 78 fields, covering 60,685 hectares,
including 7,699 hectares in Brazil. Out of the total leased area, 45,624 hectares were assigned
to agricultural production, including double crops, and 12,635 hectares to cattle raising. The
properties for agricultural production were leased, primarily, for a fixed price prior to harvest and
only a small percentage consisted of crop sharing agreements.
The following table shows a breakdown of the number of hectares of leased land used for each
of our principal production activities:
2009 2010 2011 2012(1)
2013(1)
(in hectares)
Crops 59,615 42,696 52,205 42,515 45,624
Beef cattle 32,795 12,635 12,635 12,635 12,635
(1) Includes Brasilagro.
Due to the rise in the price of land, we adopted a policy of not validating excessive prices and
applying strict criteria upon adopting the decision to lease, selecting those lands with values that
would ensure appropriate margins.
Results
The following table shows this segment’s results for fiscal year 2013, compared to the previous
fiscal year:
Grains In millions of ARS FY 2013 FY 2012 YoY var
Revenues 750.2 636.1 17.9%
Costs -1,227.8 -1,051.9 16.7%
Changes in the value of biological assets and agricultural produce 572.1 513.4 11.4%
Changes in the net realizable value of agricultural produce 11.8 2.5 379.7%
Gross income 106.2 100.1 6.1%
General and administrative expenses -87.7 -86.8 1.1%
Selling expenses -115.0 -88.4 30.1%
Other operating income, net -11.2 -58.1 -80.6%
Operating Income / (Loss) -107.7 -133.1 -19.1%
Income /(loss) from interests in equity investees and joint businesses 8.1 6.0 34.9%
Segment Income / (Loss) -99.6 -127.1 -21.7%
Sugarcane In millions of ARS FY 2013 FY 2012 YoY var
Revenues 160.3 98.9 62.1%
Costs -302.2 -167.9 80.0%
Changes in the value of biological assets and agricultural produce 197.3 82.3 139.9%
Changes in the net realizable value of agricultural produce - - -
Gross income / (loss) 55.4 13.2 319.1%
General and administrative expenses -24.2 -19.4 24.4%
Selling expenses -4.0 - -
Other operating income, net -0.0 -0.0 125.0%
Operating Income / (Loss) 27.2 -6.2 -
Income /(loss) from interests in equity investees and joint businesses - - -
Segment Income / (Loss) 27.2 -6.2 -
During this season we expected better results; yet, weather conditions prevented us from
reaching our projections. On the one hand, part our seeding was delayed due to excessive

26
rainfall, leading to a reduction in planted area and yields. Besides, during the summer rainfall
levels were lower than required, affecting the productivity of our crops. The lower production
was offset by slightly higher prices.

27
Beef Cattle
Our beef cattle production involves the breeding and fattening of our own animals. In some
cases, if market conditions are favorable, we also purchase and fatten cattle which we sell to
slaughterhouses and supermarkets. As of June 2013, our beef cattle aggregated 57,209 heads,
and we had a total surface area of 91,053 hectares of own and leased lands devoted to this
business activity. In addition, we have leased to third parties 13,371 hectares assigned to these
activities.
During the fiscal year ended June 30, 2013, our beef cattle activities generated sales of
ARS 76.7 million, representing 5.7% of our total consolidated sales from the agriculture and
cattle raising business, and our production was 8,196 tons, a decrease of 12.1% compared to
the previous fiscal year. This fall was mainly due to adverse weather conditions that affected our
cattle’s fattening capacity.
The following table sets forth, for the fiscal years indicated below, the beef cattle production
volumes measured in tons:
2009(1)
2010(1)
2011(1)
2012(1)
2013(1)
Beef cattle production (2)
7,112 3,153 6,519 9,329 8,196
(1) Does not include production from AgroUranga S.A.
(2) Production measured in tons of live weight. Production is the sum of the net increases (or decreases) during a given period in
live weight of each head of beef cattle owned by us.
Management by lot in our pastures is aided by electrical fencing which may be easily relocated
to supplement our land-rotation cycles. Our cattle herd is subject to a 160 kg to 360 kg fattening
cycle by grazing in pastures located in our north farmlands, where conditions are adequate for
initial fattening. For fattening above 360 kg, cattle are fattened in our San Luis feedlot until they
reach 430 kg. The feedlot fattening system leads to homogeneity in production and beef of
higher quality and tenderness because of the younger age at which animals are slaughtered.
Our cattle breeding activities are carried out with breeding cows and bulls and our fattening
activities apply to steer, heifers and calves. Breeding cows calve approximately once a year and
their productive lifespan is from six to seven years. Six months after birth, calves are weaned
and transferred to fattening pastures. Acquired cattle are directly submitted to the fattening
process. Upon starting this process, cattle have been grazing for approximately one year to one
and a half year in order to be fattened for sale. Steer and heifers are sold when they have
achieved a weight of 380–430 kg and 280–295 kg, respectively, depending on the breed.
Pregnancy levels, which have been improving over the years, showed satisfactory levels of
efficiency notwithstanding the adverse weather conditions. Genetics and herd management are
expected to further improve pregnancy levels in the coming years. Reproductive indicators
improved thanks to the implementation of technologies, which have included handling
techniques and females artificial insemination with cattle genetics especially selected for the
stock which is purchased from specialized companies in quality semen elaboration for meat
production. We use veterinarian products manufactured by leading national and international
laboratories. It is important to emphasize the work of a veterinarian advising committee, who are
external to us and visit each establishment monthly to control and agree tasks.
28
Currently, the cattle raising farms are officially registered as export farmlands pursuant to the
identification and traceability rules in force in Argentina. Animals are individually identified, thus
allowing for the development of special businesses in this area.
Our beef cattle stock is organized into breeding and fattening activities. The following table
shows, for the fiscal years indicated, the number of head of beef cattle for each activity:
2009(2)
2010(2)
2011(2)
2012(2)
2013(2)
Breeding (1)
59,283 61,859 50,430 42,109 35,743
Fattening 28,520 9,379 22,697 17,326 21,466
Total 87,803 71,238 73,127 59,435 57,209
(1) For classification purposes, upon birth, all calves are considered to be in the breeding process.
(2) Does not include heads of beef cattle from AgroUranga S.A.
We seek to improve beef cattle production and quality in order to obtain a higher price through advanced breeding techniques. We cross breed our stock of Indicus, British (Angus and Hereford) and Continental breeds to obtain herds with characteristics better suited to the pastures in which they graze. To enhance the quality of our herds even further, we plan to continue improving our pastures through permanent investment in seeds and fertilizers, an increase in the watering troughs available in pastures, and the acquisition of round bailers to cut and roll grass for storage purposes.
Our emphasis on improving the quality of our herd also includes the use of animal health-related
technologies. We comply with national animal health standards that include laboratory analyses
and vaccination aimed at controlling and preventing disease in our herd, particularly FMD.
Direct costs of beef production consist primarily of seeds for pasture (for instance, gatton panic,
oats and barley) and crops for feeding and dietary supplementation purposes and animal health
costs, among others.
Results
The following table shows this segment’s results for fiscal year 2013, compared to the previous
fiscal year:
In millions of ARS FY 2013 FY 2012 YoY var
Revenues 76.7 132.3 -42.0%
Costs -145.9 -163.5 -10.7%
Changes in the value of biological assets and agricultural produce 79.3 79.0 0.4%
Changes in the net realizable value of agricultural produce -0.0 0.1 -
Gross income / (loss) 10.0 47.9 -79.1%
General and administrative expenses -12.8 -14.9 -14.2%
Selling expenses -10.9 -11.6 -5.4%
Other operating income, net -3.3 -3.0 9.1%
Operating Income / (Loss) -17.0 18.4 -
Income /(loss) from interests in equity investees and joint businesses - - -
Segment Income / (Loss) -17.0 18.4 -

29
Milk
As of June 30, 2013, we conducted our milk business in the dairy facility located in “El Tigre”
farm in La Pampa, Argentina. We have a capacity of 2,392 cows in milking per day and seek to
increase total productivity through the application of new technologies including improved
genetic management for milk production, feeding strategic planning based on cattle specific
requirements and the use of individual traceability to know the productivity history of each
animal. Also we use computer science in milk business to make more efficient the manual labor
by surveying the information supplied by the farm.
Within the process of de-commoditization and technological innovation, we implemented an
identification and tracing system in compliance with European and SENASA standards. We also
obtained Global Gap and HCCP certification. Our goal in this respect is to distinguish our
production and obtain higher prices in production sales.
Our milk production is based on a herd of Holando Argentina dairy cows, genetically selected
through the use of imported frozen semen of North American Holando bulls. Male calves are
sold, at calving, for a given amount per head, whereas female calves are weaned after 24
hours, spend approximately 60 days in raising and approximately 100 days being fed on the
basis of grass, grains and supplements. Young heifers then graze for an additional 12 to 15
month period, prior to artificial insemination at the age of 18 to 20 months and they calve nine
months later. Heifers are subsequently milked for an average of 300 days. Milking dairy cows
are once again inseminated during the 60 to 90 day subsequent period. This process is
repeated once a year during six or seven years. The pregnancy rate for our dairy cows is 80-
90%.
Our dairy herd is milked mechanically twice a day. The milk obtained is cooled to less than five
degrees centigrade to preserve quality and is then stored in a tank for delivery once a day to
trucks sent by buyers. Dairy cows are fed mainly with grass, supplemented as needed with
grains, hay and silage. We have invested in certain technologies that focus on genetic
improvement, animal health and feeding in order to improve our milk production. These
investments include imports of top quality frozen semen from genetically improved North
American Holstein bulls, agricultural machinery and devices such as feed-mixer trucks, use of
dietary supplements and the installation of modern equipment to control milk cooling. We are
currently acquiring dietary supplements for our dairy cows and have made investments with the
aim of increasing the quantity and quality of forage (pasture, alfalfa and corn silage) in order to
reduce feeding costs.
The following table sets forth, for the periods indicated, the average number of our dairy cows,
average daily production per cow and our total milk production:
2009(1)
2010(1)
2011(1)
2012(1)
2013(1)
Average dairy cows per day 3,286 3,297 2,816 2,046 2,392
Production (daily liters per cow) 17.4 18 19.1 22.9 20.4
Total production (thousands of
liters) 20,898 21,690 19,605 16,563
18,459
(1) Does not include production from AgroUranga S.A.
30
At the closing of fiscal year 2013, we had 6,529 heads of cattle on 2,780 hectares involved in
the production of milk; whereas as of June 30, 2012, we had 6,184 heads of cattle on 3,022
hectares.
Results
The following table shows this segment’s results for fiscal year 2013, compared to the previous
fiscal year:
In millions of ARS FY 2013 FY 2012 YoY var
Revenues 38.8 30.2 28.7%
Costs -74.8 -57.8 29.4%
Changes in the value of biological assets and agricultural produce 40.7 34.0 19.8%
Gross income / (loss) 4.7 6.3 -25.3%
General and administrative expenses -2.9 -2.9 -0.9%
Selling expenses -1.7 -1.2 38.4%
Other operating income, net -0.7 -0.6 26.6%
Operating Income / (Loss) -0.6 1.6 -
Income /(loss) from interests in equity investees and joint businesses - - -
Segment Income / (Loss) -0.6 1.6 -

31
Leases and Agricultural Services
We lease own farms to third parties for agriculture, cattle breeding and seed production, mainly
in two types of farms. On the one hand, we lease our farms under irrigation in San Luis (Santa
Bárbara and La Gramilla) to seed producers. These farms are ideal for obtaining steady
production levels, given the quality of their soil and the weather conditions of the area, along
with the even humidity provided by irrigation.
On the other hand, we lease farms recently put into production after agricultural development. In
this way we manage to reduce our production risk, ensuring fixed rental income until the new
farms reach stable productivity levels.
In addition, in this segment we include the irrigation service we provide to our own farms leased
to third parties.
Results
The following table shows this segment’s results for fiscal year 2013, compared to the previous
fiscal year:
In millions of ARS FY 2013 FY 2012 YoY var
Revenues 30.8 25.3 21.8%
Costs -12.1 -2.6 369.5%
Gross income 18.8 22.7 -17.5%
General and administrative expenses -4.1 -3.7 11.2%
Selling expenses -1.5 -1.3 17.2%
Income from business combinations - - -
Other operating income, net -1.0 -0.7 42.3%
Operating income 12.1 17.0 -29.0%
Income / (loss) from interests in equity investees and joint businesses - - -
Segment income 12.1 17.0 -29.0%
Acquisition, Sale and Transformation of Lands
Land Acquisitions
We intend to increase our farmland portfolio by acquiring large extensions of land with high appreciation or production potential. We also intend to transform the land acquired from non-productive to cattle breeding, from cattle breeding to farming, or applying technology to improve farming yields so as to generate higher land appreciation.
In our view, the sector’s potential lies in developing marginal areas and/or under-utilized areas. As a result of current technology, we may achieve similar yields with higher profitability than core areas; this may result in the appreciation of land values.
At present, prices of farmlands used in agricultural production have increased in the southern hemisphere (mainly South America) but continue to be relatively low compared to the northern hemisphere (U.S. and Europe). Our financial strength relative to other Argentine producers gives us the chance to increase our land holdings at attractive prices, improve our production scale and create potential for capital appreciation.
Several important intermediaries, with whom we usually work, bring farmlands available for sale to our attention. The decision to acquire farmlands is based on the assessment of a number of factors. In addition to the land’s location, we normally carry out an analysis of soil and water, including the quality of the soil and its suitability for our intended use (crops, beef cattle, or milk production), classify the various sectors of the lot and the prior use of the farmland; analyze the improvements in the property, any easements, rights of way or other variables in relation to the property title; examine satellite photographs of the property (useful in the survey of soil drainage

32
characteristics during the different rain cycles) and detailed comparative data regarding neighboring farms (generally covering a 50-km area). Based on the foregoing factors, we assess the farmland in terms of the sales price compared against the production potential of the land and the appreciation potential of the capital. We consider that competition for the acquisition of farmlands is, in general, limited to small farmers for the acquisition of smaller lots, and that there is scarce competition for the acquisition of bigger lots.
In addition, we may consider the acquisition of farmlands in marginal zones and their improvement by irrigation in non-productive areas as well as the installation of irrigation devices in order to obtain attractive production yields and create potential for capital appreciation.
The following chart shows, for the fiscal years indicated below, certain information concerning our land acquisitions for each of the last 15 fiscal years ended on June 30:
Land Sales
We periodically sell properties that have reached a considerable appraisal to reinvest in new farms with higher appreciation potential. We analyze the possibility of selling based on a number of factors, including the expected future yield of the farmland for continued agricultural and livestock exploitation, the availability of other investment opportunities and cyclical factors that have a bearing on the global values of farmlands.
The following chart shows, for the fiscal years indicated below, certain information concerning our land sales for each of the last 15 fiscal years ended on June 30:

33
(1) Includes the difference between the gross proceeds from sales (net of all taxes and commissions) and the book value of the
assets sold.
In October 2012, our subsidiary Brasilagro announced the sale of Horizontina, a 14,359-hectare
farm located in the State of Maranhão. The transaction’s total price was BRL 75.0 million, out of
which BRL 27 million have been already collected. BRL 22.0 million were paid in January 2013
and BRL 3 million were collected in August 2013. As of June 30, 2012, the asset was valued at
BRL 46.0 million. This transaction reflects a full development cycle, where the acquisition,
development, production and sale stages generated an Internal Rate of Return (real estate +
output) of approximately 27%.
In April 2013, Brasilagro sold 394 hectares located in the municipal district of Mineiros – GO.
The total transaction amount was fixed in 248,000 bags of soybean (equivalent to approximately
BRL 11.7 million). From this amount an initial payment of 36,000 bags of soybean was received,
and the balance is payable in eight semi-annual installments, the first of which falls due in
August 2013.
In May 2013, Brasilagro sold 4,895 hectares located in the municipal district of Baixa Grande do
Ribeiro – PI. The total transaction amount was fixed in 901,481 bags of soybean (equivalent to
approximately BRL 42.1 million). From this amount, an initial payment of 90,148 bags of
soybean was received, and the balance is payable in five installments, the first of which falls
due in August 2013.
On June 19, 2013, Cresud executed with Vargas Derka SH a deed of sale of a parcel of the “La
Suiza” farm, consisting of 5,613 hectares allocated to beef cattle production, located close to the
“Villa Angela” district, in the Province of Chaco. The remaining portion of such farm is a 36,380-
hectare parcel intended for mixed activities. The total transaction amount was USD 6.7 million,
which had been fully collected as of the date of execution of the title deed.

34
Farmland Development
We consider that there is great potential in farmland development where, through the use of
current technology, we may achieve similar yields with higher profitability than in core areas.
As of June 30, 2013, we owned land reserves in the region extending over more than 339,226
hectares that were purchased at very attractive prices. In addition, we have a concession over
108,556 hectares reserved for future development. We believe that there are technological tools
available to improve productivity in these farms and, therefore, achieve appreciation in the long
term. However, current or future environmental regulations could prevent us from fully
developing our land reserves by requiring that we maintain part of this land as natural
woodlands not to be used for production purposes.
We conducted our land development business in Argentina mainly in our “Los Pozos” farm in
the Province of Salta. In fiscal year 2013, we had 58,714 hectares in operation. During fiscal
year 2013, we developed 3,650 hectares intended for agricultural production and 1,705
hectares intended for beef cattle raising, reaching 58,714 hectares in operation.
Furthermore, during fiscal year 2013 we continued with the development of Agropecuaria Anta
S.A. (formerly named Agropecuaria Cervera S.A.), reaching 21,947 hectares devoted to
agricultural production, whether through our own agricultural activities or by leasing lands to
third parties. For the next fiscal year, we plan to develop 1,497 hectares intended for agriculture
and 629 hectares intended for beef cattle raising.
In connection with our business in Paraguay, during fiscal year 2013 Cresca S.A. made
progress in the development of its farms, developing 937 hectares during 2013, and reaching an
aggregate of 12,330 hectares in operation intended for agriculture and beef cattle breeding. For
the next fiscal year, Cresca plans to continue to develop 1,000 hectares for agricultural
production. Our developments in Brazil, through our subsidiary Brasilagro, consisted of 11,805
hectares of developed land.
Results
The following table shows this segment’s results for fiscal year 2013, compared to the previous
fiscal year:
In millions of ARS FY 2013 FY 2012 YoY var
Revenues - - -
Costs -5.7 -4.7 22.0%
Gross loss -5.7 -4.7 22.0%
Income from sale of investment properties - - -
Income from sale of farms 149.6 45.5 228.8%
Operating income / (loss) 132.6 39.2 238.1%
Segment income / (loss) 132.6 39.2 238.1%
35
Agro-industrial Activities
This segment consists in the fattening of beef cattle in feedlots for own or third-party
slaughterhouses. Feedlot cattle breeding requires specific care and diets that differ from those
applicable to natural grass-fed beef cattle breeding.
Our feedlot operations are developed through our subsidiary Cactus Argentina S.A. and take place in a 170-hectare farm located in Villa Mercedes, Province of San Luis, which started to operate in September 1999. Cactus has been a pioneer in feedlot services with 18,000 heads of cattle capacity, depending on the size of the cattle.
Moreover, through our subsidiary Sociedad Anónima Carnes Pampeanas S.A. (“Carnes Pampeanas”) we own a meat packing plant in Santa Rosa, Province of La Pampa, with capacity to slaughter and process approximately 9,600 cattle heads per month.
During the last years, the smaller supply of beef cattle has adversely affected the value chain by reducing cold-storage plant utilization. This has left several plants struggling to remain operational in view of the poor returns and shortage of raw materials. Our investment in Carnes Pampeanas has not escaped unscathed of this situation.
Since December 2011, the packing plant had remained closed due to the difficult situation
experienced by the industry. With the support of the Provincial Government of La Pampa and
the Federal Government, combined with Cresud’s confidence that the business could be
successfully resumed, in August 2012 the packing plant was reopened and restarted
production.
Fiscal year 2013 has been a tough year for our agro-industrial segment due to the unfavorable market scenario. We expect it to improve in the next year and to be able to increase production levels and recover this segment’s profitability.
Results
The following table shows this segment’s results for fiscal year 2013, compared to the previous
fiscal year:
In millions of ARS FY 2013 FY 2012 YoY var
Revenues 207.8 100.1 107.6%
Costs -198.4 -110.8 79.1%
Gross income 9.4 -10.7 -
General and administrative expenses -11.0 -7.4 49.1%
Selling expenses -21.5 -7.6 181.3%
Income from business combinations - - -
Other operating income, net -1.3 0.1 -
Operating loss -24.4 -25.6 -4.5%
Income / (loss) from interests in equity investees and joint businesses - - -
Segment loss -24.4 -25.6 -4.5%
Other Segments
Futuros y Opciones.Com S.A.
In May 2000, we acquired 70% of the shares of FyO S.A. (“Futuros y Opciones.Com”) for
ARS 3.5 million. The site was launched in November 1999 and was aimed at becoming the
most important agriculture business community in Latin America. Futuros y Opciones.Com
launched its e-commerce strategy in March 2001, in order to sell products, buy inputs, arrange
loans, and obtain insurance, among other things. Currently, the main activity of Futuros y
Opciones.Com is grain brokerage.

36
The areas with the greatest potential for growth are: input commercialization and grain
brokerage. Regarding input commercialization, the business volume was concentrated in a
small number of suppliers, the agreements with the suppliers were improved in order to
increase the margin of the business, and contracts of direct distribution were achieved. In terms
of cereals, the grain trading unit was created, with the purpose of participating directly in the
business by trading and offering services.
During fiscal year 2007, Futuros y Opciones.Com started to trade futures and options: it
acquired a share in the Buenos Aires futures and options exchange market (Mercado a Término
de Buenos Aires) and has also become a dealer. The service consisting in hedging with futures
has consolidated into an essential tool for our customers to manage their price risks.
Futuros y Opciones.Com is committed to excellence through quality and continued
improvement. For this reason, since 2008 all its business and administrative processes have
been certified under ISO 9001:2008 standards.
As of June 30, 2013, our interest in Futuros y Opciones.Com was 60.50%.
As of the end of fiscal year 2013, the company’s total revenues from its grains brokerage
business unit were ARS 30.3 million with a trading volume of 1.9 million tons, 15% higher than
the volume traded in fiscal year 2012 and thus accumulating a 135% growth in the last 4 years.
The main crops traded were corn and soybean, and to a lesser extent, wheat and sunflower.
The portal fyo.com has reached its thirteenth anniversary, consolidating as the benchmark site
for agricultural marketing and adding year after year new and significant agricultural customers
of various sizes to its user community. At the closing of this fiscal year, it has reached over
860,000 visits per month. Plans are being made for relaunching the website with revamped
features during the coming fiscal year.
Futuros y Opciones.Com’s goal is to continue consolidating itself as leading company in the
grains brokerage business, standing out from its competitors by offering a full suite of advisory
services to its clients and contributing its broad experience in the industry along with its staff’s
expertise.
Results
The following table shows this segment’s results for fiscal year 2013, compared to the previous
fiscal year:
In millions of ARS FY 2013 FY 2012 YoY var
Revenues 83.3 55.1 51.3%
Costs -71.2 -46.1 54.5%
Changes in the value of biological assets and agricultural produce -1.0 0.1 -
Changes in the net realizable value of agricultural produce - - -
Gross income 11.1 9.0 23.1%
General and administrative expenses -7.1 -4.9 44.2%
Selling expenses -6.9 -5.3 30.0%
Management fee - -8.7 -
Income from business combinations - - -
Other operating income, net 15.9 0.7 2,283.8%
Operating income / (loss) 13.0 -9.2 -
Income / (loss) from interests in equity investees and joint businesses 1.1 -0.4 -
Segment income / (loss) 14.1 -9.6 -
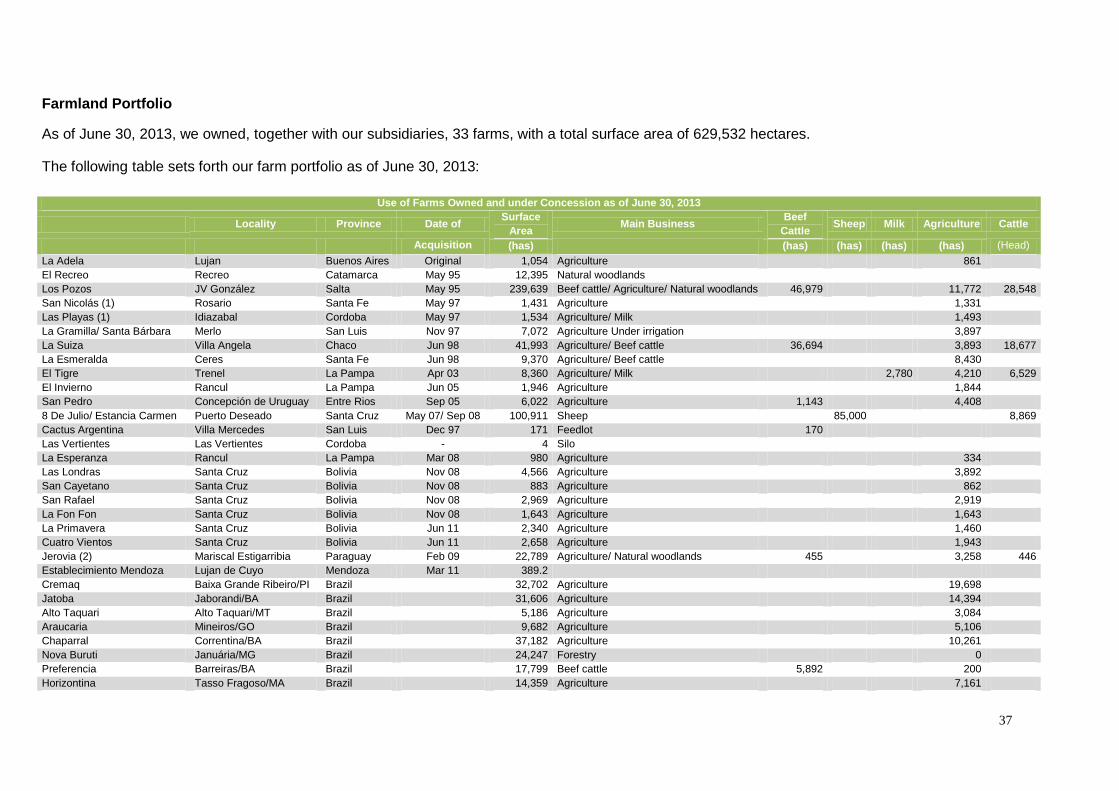
37
Farmland Portfolio
As of June 30, 2013, we owned, together with our subsidiaries, 33 farms, with a total surface area of 629,532 hectares.
The following table sets forth our farm portfolio as of June 30, 2013:
Use of Farms Owned and under Concession as of June 30, 2013
Locality Province Date of Surface
Area Main Business
Beef
Cattle Sheep Milk Agriculture Cattle
Acquisition (has) (has) (has) (has) (has) (Head)
La Adela Lujan Buenos Aires Original 1,054 Agriculture 861
El Recreo Recreo Catamarca May 95 12,395 Natural woodlands
Los Pozos JV González Salta May 95 239,639 Beef cattle/ Agriculture/ Natural woodlands 46,979 11,772 28,548
San Nicolás (1) Rosario Santa Fe May 97 1,431 Agriculture 1,331
Las Playas (1) Idiazabal Cordoba May 97 1,534 Agriculture/ Milk 1,493
La Gramilla/ Santa Bárbara Merlo San Luis Nov 97 7,072 Agriculture Under irrigation 3,897
La Suiza Villa Angela Chaco Jun 98 41,993 Agriculture/ Beef cattle 36,694 3,893 18,677
La Esmeralda Ceres Santa Fe Jun 98 9,370 Agriculture/ Beef cattle 8,430
El Tigre Trenel La Pampa Apr 03 8,360 Agriculture/ Milk 2,780 4,210 6,529
El Invierno Rancul La Pampa Jun 05 1,946 Agriculture 1,844
San Pedro Concepción de Uruguay Entre Rios Sep 05 6,022 Agriculture 1,143 4,408
8 De Julio/ Estancia Carmen Puerto Deseado Santa Cruz May 07/ Sep 08 100,911 Sheep 85,000 8,869
Cactus Argentina Villa Mercedes San Luis Dec 97 171 Feedlot 170
Las Vertientes Las Vertientes Cordoba - 4 Silo
La Esperanza Rancul La Pampa Mar 08 980 Agriculture 334
Las Londras Santa Cruz Bolivia Nov 08 4,566 Agriculture 3,892
San Cayetano Santa Cruz Bolivia Nov 08 883 Agriculture 862
San Rafael Santa Cruz Bolivia Nov 08 2,969 Agriculture 2,919
La Fon Fon Santa Cruz Bolivia Nov 08 1,643 Agriculture 1,643
La Primavera Santa Cruz Bolivia Jun 11 2,340 Agriculture 1,460
Cuatro Vientos Santa Cruz Bolivia Jun 11 2,658 Agriculture 1,943
Jerovia (2) Mariscal Estigarribia Paraguay Feb 09 22,789 Agriculture/ Natural woodlands 455 3,258 446
Establecimiento Mendoza Lujan de Cuyo Mendoza Mar 11 389.2
Cremaq Baixa Grande Ribeiro/PI Brazil 32,702 Agriculture 19,698
Jatoba Jaborandi/BA Brazil 31,606 Agriculture 14,394
Alto Taquari Alto Taquari/MT Brazil 5,186 Agriculture 3,084
Araucaria Mineiros/GO Brazil 9,682 Agriculture 5,106
Chaparral Correntina/BA Brazil 37,182 Agriculture 10,261
Nova Buruti Januária/MG Brazil 24,247 Forestry 0
Preferencia Barreiras/BA Brazil 17,799 Beef cattle 5,892 200
Horizontina Tasso Fragoso/MA Brazil 14,359 Agriculture 7,161
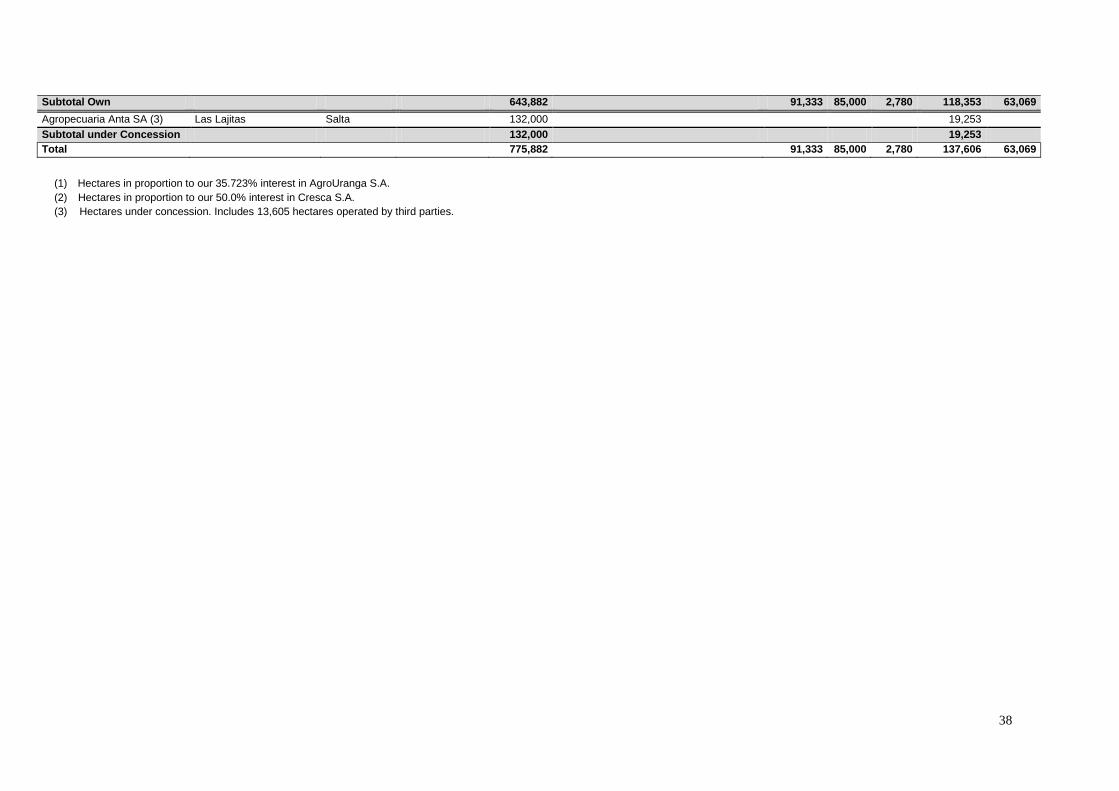
38
Subtotal Own 643,882 91,333 85,000 2,780 118,353 63,069
Agropecuaria Anta SA (3) Las Lajitas Salta 132,000 19,253
Subtotal under Concession 132,000 19,253
Total 775,882 91,333 85,000 2,780 137,606 63,069
(1) Hectares in proportion to our 35.723% interest in AgroUranga S.A.
(2) Hectares in proportion to our 50.0% interest in Cresca S.A.
(3) Hectares under concession. Includes 13,605 hectares operated by third parties.

39
La Adela
“La Adela” farm is located 60 kilometers northwest of Buenos Aires, it is one of our original
farms. In December 2001, the dairy facility was closed down, using its total surface area for crop
production. Between March 2005 and December 2007 we bought 72 additional hectares which
were added to the existing 982 hectares. During the fiscal year ended June 30, 2013, 861
hectares were used for corn and soybean crops.
El Recreo
“El Recreo” farm, located 970 kilometers northwest of Buenos Aires, in the Province of
Catamarca, was acquired in May 1995. It has semi-arid climate and annual rainfall not in excess
of 400 mm. This farm is maintained as a productive reserve.
Los Pozos.
The “Los Pozos” farm, located 1,600 kilometers northwest of Buenos Aires, in the Province of
Salta, was acquired in May 1995. This property is located in a semi-arid area with average
annual rainfall of 500 mm. The area is naturally suited to cattle raising and forestry activities
(poles and fence posts), and it has agricultural potential for summer crops such as sorghum and
corn, among others. For the fiscal year ended June 30, 2013, we used 6,849 hectares in
agricultural production and 4,923 hectares intended for agriculture were leased to third parties.
We completed the development of tropical pastures in almost 45,000 hectares. As of June 30,
2013, there were 28,548 heads of cattle in this farm.
San Nicolás
“San Nicolás” is a 4,005-hectare farm owned by AgroUranga S.A., and is located in the
Province of Santa Fe, approximately 45 kilometers from the Port of Rosario. As of June 30,
2013, approximately 6,328 hectares were in use for agricultural production, including double
crops. The farm has two plants of silos with a storage capacity of 14,950 tons.
Las Playas
The “Las Playas” farm has a surface area of 4,294 hectares and is owned by AgroUranga S.A.
Located in the Province of Córdoba, it is used primarily for agricultural and milk production
purposes. As of June 30, 2013, the farm had a sown surface area, including double crops, of
5,683 hectares for grain production.
La Gramilla and Santa Bárbara
These farms have a surface area of 7,052 hectares in Valle de Conlara, in the Province of San
Luis. Unlike other areas in the Province of San Luis, this valley has a high quality underground
aquifer which makes these farms well suited for agricultural production after investments were
made in the development of lands, wells and irrigation equipment. In the course of the
2012/2013 farm season, a total of 2,531 hectares were sown, 716 hectares of which were sown
under contractual arrangements with seed producers, and we leased, in turn, 1,367 hectares to
third parties. The remaining hectares are used as land reserves.
La Suiza
The “La Suiza” farm has a surface area of 41,993 hectares and is located in Villa Ángela in the
Province of Chaco. It is used for raising cattle. As of June 30, 2013, “La Suiza” had a stock of
approximately 18,677 heads of cattle. During the 2011/12 season, we used 4,935 hectares for

40
growing cotton, corn, soybean and sorghum and we leased to third parties 6,336 hectares
allocated to beef cattle production. On June 19, 2013, we executed a deed of sale for 5,613
hectares for a total sale price of USD 6.7 million.
La Esmeralda
The “La Esmeralda” farm has a surface area of 9,370 hectares and is located in Ceres in the
Province of Santa Fe. This farm, acquired in June 1998, has potential for both agricultural
production and cattle raising. During the 2011/12 farm season, we used a total area of 9,802
hectares, including double crops, for production of corn, soybean, wheat, sunflower and
sorghum. During the 2012/2013 season, we used a total area of 8,324 hectares, including
double crops, for production of corn, soybean, sunflower and sorghum. During the 2012/13
season we leased to third parties 1,617 hectares intended for agricultural production.
El Tigre
The “El Tigre” farm was acquired on April 30, 2003 and has a surface area of 8,365 hectares.
This farm has a high-tech dairy facility where we develop our milk production business in
compliance with the highest quality standards. It is located in Trenel in the Province of La
Pampa. As of June 30, 2013, 4,706 hectares were assigned to crop production, including
double crops. This farm produced 18.4 million liters of milk in the fiscal year ended June 30,
2013, with an average of 2,440 cows being milked and an average daily production of 20.7 liters
per cow.
El Invierno
The “El Invierno” farm was acquired on June 24, 2005 and has a surface area of 1,946
hectares. It is located in Rancul in the Province of La Pampa, 621 kilometers to the west of
Buenos Aires. During the fiscal year ended June 30, 2013, we used the land exclusively for crop
production and planted 1,844 hectares.
San Pedro
The “San Pedro” farm was purchased on September 1, 2005. It has a surface area of 6,022
hectares and is located in Concepción del Uruguay, Province of Entre Ríos, which is 305
kilometers north of Buenos Aires. In the course of the 2012/2013 farm season, 4,531 hectares
were used for agricultural production, including double crops, and 1,143 hectares were leased
to third parties for livestock activities.
8 de Julio and Estancia Carmen
The “8 de Julio” farm was acquired on May 15, 2007 and has a surface area of 90,000 hectares.
It is located in the department of Deseado in the Province of Santa Cruz. Due to its large
surface area, this farm offers excellent potential for sheep production. In addition, we believe the
land has potential for future tourism and recreational activities, as the southeast border of the
farm stretches over 20 kilometers of coast. "Estancia Carmen" was acquired on September 5,
2008 and has a surface area of 10,911 hectares. It is located in the Province of Santa Cruz,
next to our "8 de Julio" farm, and as the latter, it has excellent potential for sheep production. As
of June 30, 2013, these farms had a stock of 10,199 sheep.
Cactus
The feedlot has a surface area of 170 hectares and is owned by Cactus Argentina S.A. It is
located in Villa Mercedes, Province of San Luis. Cactus was a joint venture between us, Cactus
Feeders Inc., one of the largest feedlot companies in the United States, and Tyson Foods, a
leading beef and poultry meat processing company. The feedlot began to operate in September

41
1999. On June 30, 2009, Cactus Feeders Inc. sold its equity interest in Cactus Argentina S.A.
On December 21, 2011, Cresud acquired Provemex Holding LLC (Tyson Foods)’s entire stake
in Cactus Argentina S.A. As of June 30, 2012, our direct and indirect interest was 100%. As of
the closing of fiscal year 2013, Cactus had no cattle of its own.
Las Vertientes
The “Las Vertientes” storage facility has a surface area of 4 hectares and 10,000 tons capacity,
and is located in Las Vertientes, Río Cuarto, in the Province of Córdoba.
La Esperanza
In 2008 we acquired “La Esperanza” farm located in the Province of La Pampa with a surface area of 980 hectares. The transaction was agreed for a price of USD 1.3 million that has been paid in full. During the year ended June 30, 2013, we used this farm solely for crop production.
Las Londras
On January 22, 2009, the bill of purchase for "Las Londras" farm was cast into public deed; it
has a surface area of 4,566 hectares, and is located in the Province of Guarayos, Republic of
Bolivia. During the 2012/2013 farm season it was used for crop production.
San Cayetano
On November 19, 2008, the bill of purchase for "San Cayetano" farm was cast into public deed.
This farm is located in the Province of Guarayos, Republic of Bolivia, and has a surface area of
883 hectares, which were used for crop production during the 2012/2013 farm season.
San Rafael
On November 19, 2008, the bill of purchase for "San Rafael" farm was cast into public deed.
This farm is located in the Province of Guarayos, Republic of Bolivia, and has a surface area of
2,969 hectares, which were used for crop production during the 2012/2013 farm season.
La Fon Fon (I & II)
On November 19, 2008, the bill of purchase for "La Fon Fon" farm was cast into public deed; it
has a surface area of 3,748 hectares, and is located in the Province of Obispo Santiesteban,
Republic of Bolivia. During fiscal years 2011 and 2012 we sold “La Fon Fon II” farm; therefore,
at present we own a total area of 1,634 hectares corresponding to La Fon Fon I. During the
2012/2013 season, this farm was used for crop production.
4 Vientos
On June 3, 2011, we executed the purchase agreement for the “4 Vientos” farm, with a surface area of approximately 2,660 hectares, allocated to sugarcane production. Its purchase price was USD 8.4 million.
La Primavera
On June 7, 2011 we acquired “La Primavera” farm, with a surface area of approximately 2,340
hectares.
Jerovia
Cresca owns 50% of "Jerovia" farm, located in Mariscal José Félix Estigarribia, Department of
Boquerón, Chaco Paraguayo, Republic of Paraguay, with a surface area of 45,578 hectares.
During the 2012/13 season 6,516 hectares were used for crop production and 910 hectares
were used for beef cattle raising.
Establecimiento Mendoza

42
On March 2, 2011, the Company purchased, jointly with Zander Express S.A,, a rural property
composed of thirteen plots of land located in the District of Perdriel, Luján de Cuyo Department,
in the Province of Mendoza. As a result of this acquisition, Cresud has become owner of a 40%
undivided estate in all and each of the properties, while Zander Express S.A. holds the
remaining 60%. The total agreed price for this transaction was USD 4.0 million; therefore, the
amount of USD 1.6 million was payable by Cresud.
Cremaq
Cremaq was acquired in October 2006 for BRL 42 million. It is located in the State of Piauí, in
the northeastern region of Brazil, close to the Itaqui Port, in the State of Maranhão. It has a
surface area of 32,702 hectares, out of which approximately 21,823 hectares are used for
agriculture. This farm was fully transformed and allocated to agriculture.
In May 2013, the sale of 4,895 hectares (approximately 3,201 of which are used for agriculture)
was agreed upon for a total price of BRL 42.1 million.
Jatobá
Jatobá is a farm in the northeastern region of Brazil, with a total surface area of 31,606
hectares, 24,254 of which are intended for agriculture. Jatobá was acquired in March 2007 for
BRL 33 million. We consider that this farm is in a very advantageous location for the movement
of crops, as it is close to the Candeias Port, in the State of Bahia.
Araucária
Araucária is a farm located in the municipal district of Mineiros, in the State of Goiás, and it has
a total surface area of 9,682 hectares. Araucaria was acquired in 2007 for BRL 70.4 million.
Before we purchased it, Araucária had been used for grain planting. The farm was transformed,
and at present it is planted with sugarcane.
In May 2013, an area of 394 hectares (310 of which are used for agriculture) was sold. The sale
price was BRL 11.7 million.
Alto Taquarí
Alto Taquarí is located in the municipal district of Alto Taquarí, State of Mato Grosso, and it has
a total surface area of 5,186 hectares, 3,666 of which are used for agriculture. The farm was
acquired in August 2007 for BRL 33.2 million. Before we purchased it, the farm was used for
agriculture and beef cattle raising. Following its transformation, it is being used for sugarcane
production.
Chaparral
Chaparral is a 37,181-hectare farm, with 27,414 hectares used for agriculture. It is located in the
municipal district of Correntina, State of Bahia. The farm was acquired in November 2007 for
BRL 47.8 million.
Nova Buriti
Located in the municipal district of Januária, State of Minas Gerais, Nova Buriti has a surface
area of 24,247 hectares, 19,004 of which are used for agriculture. Nova Buriti was acquired in
December 2007 for BRL 21.5 million. It is located in the southeastern region of Brazil and it is
close to the large iron industries. At present, it is undergoing proceedings for obtaining the
environmental licenses required for starting operations.
Preferencia

43
Preferencia is located in the municipal district of Barreiras, in the State of Bahia. It has a total
surface area of 17,799 hectares, 14,237 of which are used for agricultural activities. It was
acquired for BRL 10.1 million in September 2008. The farm is being transformed into a
pasturing area and will be later developed for agricultural purposes.
Horizontina
Horizontina is located in the municipal district of Tasso Fragoso, in the State of Maranhão. It has
a total surface area of 14,359 hectares, 8,567 of which are used for agriculture. Horizontina was
acquired for BRL 38 million in April 2010. It was then transformed and sold in October 2012 for
BRL 75 million.
Silos
As of June 30, 2013, we had storage capacity of approximately 105,541 tons (including
35.723% of the storage capacity of over 14,950 tons available at AgroUranga S.A.).
The following table shows, for the fiscal years presented, our storage facilities:
2009 2010 2011 2012(2)
2013(2)
Las Vertientes(1)
10,000 10,000 10,000 10,000 10,000
San Nicolás (1)
5,341 5,341 5,341 5,341 5,341
Brasilagro
- - - 90,200 90,200
Total 15,341 15,341 15,341 105,541 105,541
(1) Owned by us through AgroUranga S.A. (which represents 35.723% of the total capacity). (2) Includes Brasilagro.
Land Management
In contrast to traditional Argentine farms, run by families, we centralize policy making in an
Executive Committee that meets on a weekly basis in Buenos Aires. Individual farm
management is delegated to farm managers who are responsible for farm operations. The
Executive Committee lays down commercial and production rules based on sales, market
expectations and risk allocation.
We rotate the use of our pasture lands between agricultural production and cattle feeding and
the frequency depends on the location and characteristics of the farmland. The use of
preservation techniques (including exploitation by no till sowing) frequently allows us to improve
farm performance.
Subsequent to the acquisition of the properties, we make investments in technology in order to
improve productivity and increase the value of the property. It may be the case that upon
acquisition, a given extension of the property is under-utilized or the infrastructure may be in
need of improvement. We have invested in traditional fencing and in electrical fencing, watering
troughs for cattle herds, irrigation equipment and machinery, among other things.

44
Principal Markets
Crops
Our crop production is entirely sold in the local market. The prices of our grains are based on
the market prices quoted in Argentine grains exchanges such as the Bolsa de Cereales de
Buenos Aires and the Bolsa de Cereales de Rosario that take as reference the prices in
international grains exchanges. The largest part of this production is sold to exporters who offer
and ship this production to the international market. Prices are quoted in relation to the month of
delivery and the port in which the product is to be delivered. Different conditions in price, such
as terms of storage and shipment, are negotiated between the end buyer and ourselves.
Beef Cattle
Our beef cattle production is sold in the local market. The main buyers are slaughterhouses and
supermarkets.
Prices in the beef cattle market in Argentina are basically fixed by local supply and demand. The
Liniers Market (on the outskirts of the Province of Buenos Aires) provides a standard in price
formation for the rest of the domestic market. In this market live animals are sold by auction on
a daily basis. At Liniers Market, prices are negotiated by kilogram of live weight and are mainly
determined by local supply and demand. Prices tend to be lower than in industrialized countries.
Some supermarkets and meat packers establish their prices by kilogram of processed meat; in
these cases, the final price is influenced by processing yields.
Milk
During fiscal year 2013 we sold our entire milk production to the largest Argentine dairy
company, Mastellone S.A., which in turn manufactures a range of mass consumption dairy
products sold in Argentina and abroad. The price of the milk we sell is mainly based on the
percentage of fat and protein that it contains and the temperature at which it is cooled. The price
we obtain from our milk also rises or drops based on the content of bacteria and somatic cells.
Customers
For the fiscal year 2013 our sales from the agribusiness segment (excluding sales of farms)
were made to approximately 500 customers. Sales to our ten largest customers represented
approximately 45% to 50% of our net sales. Of these customers, our biggest three customers
were Bunge Alimentos S.A., Brenco Companhia Brasileira de Energia Renovável and Molinos
Río de la Plata S.A. We have signed non-binding letters of intent with some of our largest
customers that allow us to estimate the volume of the demand for certain products and to plan
production accordingly. We generally enter into short-term agreements with a term of less than
a year.
Marketing Channels and Sales Methods
Crops
We normally work with grains brokers and other intermediaries to trade in the exchanges. We
sell part of our production in advance through futures contracts and buy and sell options to
hedge against a drop in prices. Approximately 87% of the futures and options contracts are
closed through the Bolsa de Cereales de Buenos Aires (Buenos Aires Grains Exchange) and
13% in the Chicago Board of Trade for hedging purposes.
Our storage capabilities allow us to condition and store grains with no third-party involvement
and thus to capitalize the fluctuations in the price of commodities. Our largest storage facilities

45
in Argentina, with capacity for 10,000 tons, are located in “Las Vertientes”, close to Río Cuarto,
Province of Córdoba. In addition, we store grains in silo bags. On the other hand, in Brazil we
have a total storage capacity of 88,500 tons.
Beef Cattle
We have several marketing channels. We sell directly to local meat processors and
supermarkets, as well as in markets and auctions. Our customers include Arre Beef S.A.,
Quickfood S.A., Friar S.A., Frigorífico Forres Beltrán S.A., Madelán S.A., Frigorífico Bermejo
S.A., Frigorífico Amancay S.A., Colombo y Colombo S.A., Iván O’Farrell S.R.L. and José A.
Llorente S.A., for prices based on the price at Liniers Market.
We usually are responsible for the costs of the freight to the market and, in general, we do not
pay commissions on our transactions.
Supplies
The current direct cost of our production of grains varies in relation to each crop and normally
includes the following costs: tillage, seeds, agrochemicals and fertilizers. We buy in bulk and
store seeds, agrochemicals and fertilizers to benefit from discounts offered during off-season
sales.
Competition
The agricultural and livestock sector is highly competitive with a huge number of producers. We
are one of the leading producers in Argentina and the region. However, if we compare the
percentage of our production to the country’s total figures, our production would appear as
extremely low, since the agricultural market is highly atomized. Our leading position improves
our bargaining power with suppliers and customers. In general, we obtain discounts in the
region in the acquisition of raw materials and an excess price in our sales.
Historically, there have been few companies competing for the acquisition and leases of
farmlands for the purpose of benefiting from land appreciation and optimization of yields in the
different commercial activities. However, we anticipate the possibility that new companies, some
of them international, may become active players in the acquisition of farmlands and the leases
of sown land, which would add players to the market in coming years.
Seasonality
As is the case with any company in the agro-industrial sector, our business activities are
inherently seasonal. Harvest and sales of grains (corn, soybean and sunflower) in general take
place from February to June. Wheat is harvested from December to January. With respect to
our international market, in Bolivia climate conditions allow a double season of soybean, corn
and sorghum production and, accordingly, these crops are harvested in April and October, while
wheat and sunflower are harvested during August and September, respectively. Other
segments of our activities, such as our sales of cattle and milk and our forestry activities tend to
be more of a successive character than of a seasonal character. However, the production of
beef and milk is generally higher during the second quarter, when pasture conditions are more
favorable. In consequence, there may be significant variations in results from one quarter to the
other.

46
Main indicators for the fiscal years ended in June 30, 2013 and 2012(1) (2):
Description 2013
Fiscal Year
2012
Fiscal Year %
Sales
Corn 271,144 224,114 21.0%
Soybean 208,814 251,639 (17.0%)
Wheat 10,735 20,746 (48.3%)
Sorghum 5,807 8,497 (31.7%)
Sunflower 10,551 18,095 (41.7%)
Other 14,052 11,519 22.0%
Sugarcane 1,179,877 636,335 85.4%
Total Sales – Crops (tons) 1,700,979 1,170,946 45.3%
Sales - Beef Cattle (tons) 10,180 15,502 (34.3%)
Sales - Milk (thousands of liters) 17,870 16,267 9.9%
Production
Corn 107,257 143,639 (25.3%)
Soybean 220,293 193,554 13.8%
Wheat 4,505 18,200 (75.2%)
Sorghum 5,486 7,513 (27.0%)
Sunflower 12,437 14,524 (14.4%)
Other 5,413 8,887 (39.1%)
Sugarcane 1,156,848 576,048 100.8%
Total Production – Crops (tons) 1,512,238 962,365 57%
Production – Beef Cattle (tons) 8,196 9,329 (12.1%)
Production – Milk (thousands of liters) 18,459 16,563 11.4%
Exploited area (in hectares)
Crops Owned farms 2 113,705 127,793 (11.0%)
Leased farms 45,492 44,508 2.2%
Farms under concession 8,937 8,778 1.8%
Own farms leased to third parties 18,223 23,595 (22.8%)
Beef cattle Owned farms 78,418 83,360 (5.9%)
Leased farms 12,635 12,635 0.0%
Own farms leased to third parties 13,371 1,943 588.1%
Milk Own farms 2,780 3,022 (8.0%)
Sheep Own farms 85,000 85,000 0.0%
Land reserves (in hectares)
Own farms 365,499 350,063 4.4%
Farms under concession 112,747 109,617 2.9%
Area under irrigation (in hectares)
Own farms 2,516 2,218 13.4%
Own farms leased to third parties 1,367 1,626 (16.0%)
Storage capacity (tons)
Own plants 98,500 98,500 0.0%
Leased plants - - 0.0%
Stock of Cattle Heads
Breeding stock 35,743 42,109 (15.1%)
Winter grazing stock 21,466 17,326 23.9%
Milk farm stock 6,529 6,184 5.6%
Total Cattle (heads) 63,738 65,619 (2.9%)
Daily average milking cows (heads) 2,392 2,046 16.9%
1. Does not include AgroUranga S.A. (35.72% over 8,299 hectares).
2. Includes all the farms located in Argentina, Bolivia, Paraguay and Brazil.

47
IRSA’s Segments – Real Estate Business
As of June 30, 2013, our investment in IRSA’s common shares amounts to 65.45%.
As from October 1, 2008, Cresud presents its financial statements in consolidated form with IRSA's in accordance with the provisions of Technical Resolution No. 21. Consequently, the Company's consolidated results as of June 30, 2009 include IRSA’s results between October 1, 2008 and June 30, 2009. The Company’s consolidated financial statements as of June 30, 2008 and 2007 do not include information in consolidated form with IRSA's.
The following information corresponds to data of the segments extracted from our subsidiary IRSA Inversiones y Representaciones S.A.’s Annual Report and financial statements as of June 30, 2013.
The revenue figures for fiscal year 2013 described in the different tables correspond to the twelfth-month period reported in IRSA’s financial statements.
Offices and Other Rental Properties Our subsidiary IRSA is engaged in the acquisition, development and management of Offices
and other non-shopping center rental properties in Argentina. As of June 30, 2013, it directly
and indirectly owned interests in office and other rental properties in Argentina, which comprised
205,273 square meters of gross leaseable area. Out of these properties, 12 were office
properties, which comprised 131,085 square meters of gross leaseable area. For fiscal year
2013, IRSA had revenues from Offices and other rental properties of ARS 291.1 million.
All our office rental property in Argentina is located in Buenos Aires City. For the year ended
June 30, 2013, the average occupancy rate for all our properties in the Offices and Other
segment was approximately 97.1%.
Management
Our subsidiary IRSA generally acts as the managing agent of the office properties in which we
own an interest. These interests consist primarily of the ownership of entire buildings or a
substantial number of floors in a building. The buildings in which we own floors are generally
managed pursuant to the terms of a condominium agreement that typically provides for control
by a simple majority of the interests (based on the area owned) in the building. As the managing
agent of operations, IRSA is responsible for handling services, such as security, maintenance
and housekeeping. These services are generally outsourced. The cost of the services is
passed-through and paid for by the tenants, except in the case of units not rented, in which case
we absorb the cost. The leaseable space is marketed through commissioned brokers, the media
and directly by IRSA.
Leases
Our subsidiary IRSA usually leases offices and other rental properties by using contracts with
an average term of three years, with the exception of a few contracts with terms of five years.
These contracts are renewable for two or three years at the tenant’s option. Contracts for the
rental of office buildings and other commercial properties are generally stated in U.S. dollars,
and in accordance with Argentine law they are not subject to inflation adjustment. Rental rates
for renewed periods are negotiated at market value.
Properties
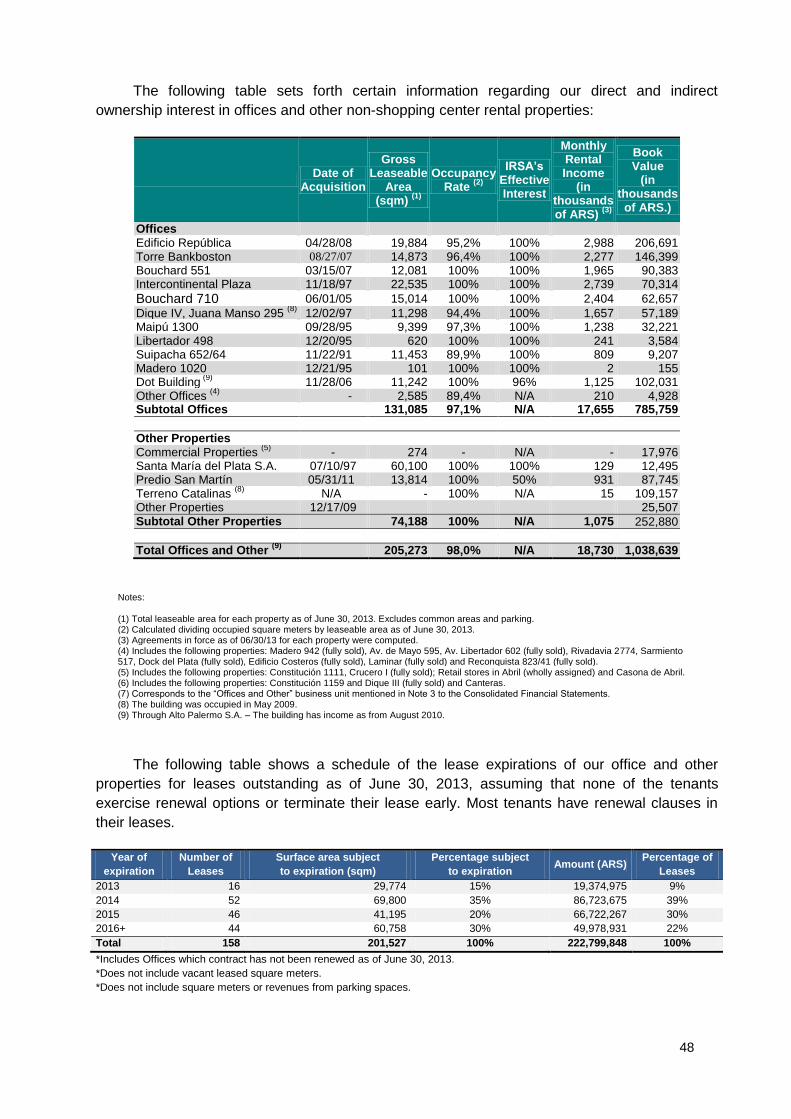
48
The following table sets forth certain information regarding our direct and indirect
ownership interest in offices and other non-shopping center rental properties:
Date of
Acquisition
Gross Leaseable
Area (sqm)
(1)
Occupancy Rate
(2)
IRSA’s Effective Interest
Monthly Rental Income
(in thousands of ARS)
(3)
Book Value
(in thousands
of ARS.)
Offices
Edificio República 04/28/08 19,884 95,2% 100% 2,988 206,691 Torre Bankboston 08/27/07 14,873 96,4% 100% 2,277 146,399 Bouchard 551 03/15/07 12,081 100% 100% 1,965 90,383 Intercontinental Plaza 11/18/97 22,535 100% 100% 2,739 70,314
Bouchard 710 06/01/05 15,014 100% 100% 2,404 62,657
Dique IV, Juana Manso 295 (8)
12/02/97 11,298 94,4% 100% 1,657 57,189 Maipú 1300 09/28/95 9,399 97,3% 100% 1,238 32,221 Libertador 498 12/20/95 620 100% 100% 241 3,584 Suipacha 652/64 11/22/91 11,453 89,9% 100% 809 9,207 Madero 1020 12/21/95 101 100% 100% 2 155 Dot Building
(9) 11/28/06 11,242 100% 96% 1,125 102,031
Other Offices (4)
- 2,585 89,4% N/A 210 4,928 Subtotal Offices 131,085 97,1% N/A 17,655 785,759
Other Properties
Commercial Properties (5)
- 274 - N/A - 17,976 Santa María del Plata S.A. 07/10/97 60,100 100% 100% 129 12,495 Predio San Martín 05/31/11 13,814 100% 50% 931 87,745 Terreno Catalinas
(8) N/A - 100% N/A 15 109,157
Other Properties 12/17/09 25,507
Subtotal Other Properties 74,188 100% N/A 1,075 252,880
Total Offices and Other (9)
205,273 98,0% N/A 18,730 1,038,639
Notes: (1) Total leaseable area for each property as of June 30, 2013. Excludes common areas and parking. (2) Calculated dividing occupied square meters by leaseable area as of June 30, 2013. (3) Agreements in force as of 06/30/13 for each property were computed. (4) Includes the following properties: Madero 942 (fully sold), Av. de Mayo 595, Av. Libertador 602 (fully sold), Rivadavia 2774, Sarmiento 517, Dock del Plata (fully sold), Edificio Costeros (fully sold), Laminar (fully sold) and Reconquista 823/41 (fully sold). (5) Includes the following properties: Constitución 1111, Crucero I (fully sold); Retail stores in Abril (wholly assigned) and Casona de Abril. (6) Includes the following properties: Constitución 1159 and Dique III (fully sold) and Canteras. (7) Corresponds to the “Offices and Other” business unit mentioned in Note 3 to the Consolidated Financial Statements. (8) The building was occupied in May 2009. (9) Through Alto Palermo S.A. – The building has income as from August 2010.
The following table shows a schedule of the lease expirations of our office and other
properties for leases outstanding as of June 30, 2013, assuming that none of the tenants
exercise renewal options or terminate their lease early. Most tenants have renewal clauses in
their leases.
Year of
expiration
Number of
Leases
Surface area subject
to expiration (sqm)
Percentage subject
to expiration Amount (ARS)
Percentage of
Leases
2013 16 29,774 15% 19,374,975 9%
2014 52 69,800 35% 86,723,675 39%
2015 46 41,195 20% 66,722,267 30%
2016+ 44 60,758 30% 49,978,931 22%
Total 158 201,527 100% 222,799,848 100%
*Includes Offices which contract has not been renewed as of June 30, 2013.
*Does not include vacant leased square meters.
*Does not include square meters or revenues from parking spaces.

49
The following table shows our offices occupancy percentage(1) as of the end of fiscal
years ended June 30, 2013 and 2012:
FY 2013 FY 2012
Offices
Edificio República 95.2% 90.0%
Torre Bankboston 96.4% 96.0%
Bouchard 551 100.0% 100.0%
Intercontinental Plaza 100.0% 100.0%
Bouchard 710 100.0% 100.0%
Dique IV, Juana Manso 295 94.4% 92.0%
Maipú 1300 97.3% 98.0%
Libertador 498 100.0% 100.0%
Suipacha 652/64 89.9% 90.0%
Madero 1020 100.0% 0.0%
DOT Building 100.0% 100.0%
Others (2)
97.1% 88.0%
(1) Leased surface area in accordance with agreements in effect as of June 30, 2013 and 2012
considering the total leaseable office area for each year.
(2) Includes the following properties: Madero 942 (fully sold), Av. de Mayo 595, Av. Libertador
602 (fully sold), Rivadavia 2774, Sarmiento 517, Dock del Plata (fully sold), Edificio Costeros (fully sold),
Laminar (fully sold) and Reconquista 823/41 (fully sold).
The following table sets forth the annual average income per square meter for our offices
during fiscal years ended June 30, 2013 and 2012.
Average annual income per surface area as of June 30(1).
(ARS/sqm) 2013 2012 Var
Offices
Intercontinental Plaza 2,282 1,847 23.6%
Bouchard 710 2,298 2,033 13.0%
Bouchard 557 2,033 1,695 19.9%
Libertador 498 1,933 1,566 23.4%
Maipú 1300 2,186 1,752 24.8%
Madero 1020 2,059 1,806 14.0%
Suipacha 652/64 2,078 1,852 12.2%
Costeros Dock IV 4,963 2,122 133.9%
Torre Bankboston 1,019 862 18.2%
Edificio República 238 - -
Dique IV, Juana Manso 295 1,660 1,127 47.3%
Dot Building 894 3,878 (76.9)%
Others 2,282 1,847 23.6%
(1) Calculated considering annual leases to total leaseable office area, in accordance
with our percentage of ownership in each building.
(2) Includes the following properties: Madero 942 (fully sold), Av. de Mayo 595, Av.
Libertador 602 (fully sold), Rivadavia 2774, Sarmiento 517, Dock del Plata (fully
sold), Edificio Costeros (fully sold), Laminar (fully sold) and Reconquista 823/41 (fully
sold).
Edificio República, City of Buenos Aires
This property, which was designed by the renowned architect César Pelli (who also
designed the World Financial Center in New York and the Petronas Towers in Kuala Lumpur) is
a unique premium office building in downtown Buenos Aires and adds approximately 19,884
gross leaseable square meters to our portfolio distributed in 20 floors. The main tenants include

50
Apache Energía, Deutsche Bank, Estudio Beccar Varela, BASF Argentina S.A., Enap Sipetrol
Argentina S.A., Facebook Argentina S.R.L.
Torre Bankboston, City of Buenos Aires
The Bank Boston tower is a modern office building in Carlos Maria Della Paolera 265 in
the City of Buenos Aires. Having been designed by the renowned architect Cesar Pelli, it has
31,670 square meters in gross leaseable area. We have a 48.5% ownership interest in the
building. At present, its main tenants are Exxon Mobile and Kimberley Clark de Argentina.
Bouchard 551, City of Buenos Aires.
Bouchard 551, known as “Edificio La Nación”, is an office building we acquired in March
2007, located in the Retiro area close to the intersection of the Leandro N. Alem and Córdoba
avenues and opposite Plaza Roma. The building is a 23-story tower covering a surface area of
2,900 square meters in the low floors that becomes smaller as it goes higher up to 900 square
meters approximately, and parking for 177 units. We have approximately 12,100 leaseable square
meters in the building and our main tenants include Price Waterhouse & Co., AS. EM. S.R.L.
Intercontinental Plaza, City of Buenos Aires.
Intercontinental Plaza is a modern 24-story building located next to the Intercontinental
Hotel in the historic neighborhood of Monserrat in downtown City of Buenos Aires. We own the
entire building, which has floors averaging 900 square meters with 324 parking spaces. The
principal tenants currently include Total Austral S.A., Danone Argentina S.A., IRSA, Alto
Palermo, Cognizat Technology Solutions de Arg. S.A. and Industrias Pugliese S.A..
Dique IV, Juana Manso 295, Puerto Madero, City of Buenos Aires
About mid-May 2009 we completed an office building located in Puerto Madero’s Dock IV. It is a luxury building with a leaseable area of approximately 11,298 square meters composed of large and versatile spaces. Its lay-out is optimum both for companies that require smaller office space at an average 200 square meters and for corporations that need the entire floor. The building has nine office stories and retail stores in the first story. The main tenant in the building is Exxon Mobile.
Bouchard 710, City of Buenos Aires.
Bouchard 710 is an office building acquired by us in June 2005, located in the Retiro area.
The building is a 12-story tower, with an average area per floor of 1,251 square meters, with
180 units for car parking. Tenants are Sibille S.C. (KPMG), and Microsoft de Argentina S.A.,
Samsung Electronics Argentina S.A., Energy Consulting Services S.A. and Chubb Argentina de
Seguros S.A.
Maipú 1300, City of Buenos Aires.
Maipú 1300 is a 23-story office tower opposite Plaza San Martín, a prime office zone
facing Avenida del Libertador, an important north-to-south avenue. The building is also located
within walking distance of the Retiro commuter train station, the city’s most important public
transportation hub, connecting rail, subway and bus transportation. We own 9,400 sqm, with an
average area per floor of 440 square meters. The building’s principal tenants currently include
Allende & Brea, Verizon Argentina S.A., PPD Argentina S.A. and TV Quality SRL.
Suipacha 652/64, City of Buenos Aires.
Suipacha 652/64 is a 7-story office building located in the office district of the city. We own
the entire building and 70 parking spaces. The building has unusually large floors, most
measuring 1,580 square meters. This property underwent substantial renovations shortly after
51
we acquired the deed in 1991 to prepare the building for rental. The building’s principal tenants
currently include Gameloft Argentina S.A., Monitor de Medios Publicitarios S.A, Organización de
Servicios Directos Empresarios (OSDE) and Alto Palermo’s subsidiary, Tarshop S.A.
PAMSA-Dot Baires Offices.
Panamerican Mall S.A., a subsidiary of our subsidiary APSA, developed an office building
with a gross leaseable area of 11,241 sqm adjacent to Dot Baires Shopping. This building was
opened in July 2010, which means our landing in the booming rental office corridor in the
northern area of the City of Buenos Aires. As of June 30, 2012 the building’s occupancy rate
was 100%. The principal tenants include General Electric International Inc., Metrogames,
Mallinckrodt Medical Arg. Limited, Carrier and Boston Scientific Argentina S.A.
Other office properties.
We also have interests in other office properties, all of which are located in the City of
Buenos Aires. These properties are either entire buildings or floors in buildings. These
properties include Suipacha 664 and Av. de Mayo 589.
Retail and other properties.
Our portfolio of rental properties as of June 30, 2013 includes 5 non-shopping center leaseable properties that may be leased as shops on streets, a lot in industrial premises, undeveloped plots of land or other properties for various uses. Most of these properties are located in the City of Buenos Aires, although some are located in other cities in Argentina. These properties include Constitución 1111, Solares de Santa María, Constitución 1159, Madero 1020 and Rivadavia 2774.
Terreno Catalinas Norte
On May 26, 2010, jointly with the Government of the City of Buenos Aires, we executed a deed of conveyance of title whereby we acquired a property located at Avenida Eduardo Madero 150, between Av. Córdoba and San Martín. The total price of the transaction was fixed in the amount of ARS 95 million, ARS 19 million of which were paid upon the execution of the preliminary sales agreement (on December 17, 2009), whereas the balance of ARS 76 million was paid upon the execution of the deed on May 26, 2010.
Shopping Centers
We are engaged in purchasing, developing and managing shopping centers through our
subsidiary, Alto Palermo. As of June 30, 2013, Alto Palermo operated and owned majority
interests in thirteen shopping centers, six of which are located in the City of Buenos Aires
(Abasto, Paseo Alcorta, Alto Palermo, Patio Bullrich, Buenos Aires Design and Dot Baires
Shopping), two of which are located in the greater Buenos Aires (Alto Avellaneda and Soleil
Factory) metropolitan area and the other ones are located in the Argentine provinces: Alto Noa
in the City of Salta, Alto Rosario in the City of Rosario, Mendoza Plaza in the City of Mendoza,
Córdoba Shopping Villa Cabrera in the City of Córdoba and La Ribera Shopping in the City of
Santa Fe.
As of June 30, 2013, Alto Palermo’s shopping centers comprised a total of 308,793
square meters of gross leaseable area (excluding certain space occupied by hypermarkets
which are not Alto Palermo’s tenants). For fiscal period 2013, the average occupancy rate of
Alto Palermo’s shopping center portfolio was approximately 99.1%.

52
We centralized management of our shopping centers in Alto Palermo, which is responsible for providing common area electrical power, a main telephone switchboard, central air conditioning and other basic common area services.
The following table shows certain information concerning our Alto Palermo subsidiary’s
shopping centers as of June 30, 2013:
Date of
Acquisition Leaseable Area APSA’s Interest Occupancy
Accumulated Annual Rental
Income as of fiscal year
ended
Book Value
(thousands of ARS)
sqm (1) (3) (2) 2013 2012 (5)
Shopping Centres (6)
Abasto (7) 07/94 37,708 100.0% 99.8% 269,921 220,714 237,502
Alto Palermo 11/97 18,690 100.0% 98.5% 274,018 222,314 300,598
Alto Avellaneda 11/97 36,943 100.0% 99.9% 190,470 159,309 143,614
Paseo Alcorta 06/97 14,141 100.0% 99.8% 126,950 101,018 107,920
Patio Bullrich 10/98 11,683 100.0% 99.7% 103,159 90,086 123,087
Alto Noa 03/95 19,141 100.0% 99.7% 47,047 39,300 34,601
Buenos Aires Design 11/97 13,746 53.7% 99.9% 42,432 36,361 17,536
Mendoza Plaza 12/94 27,691 100.0% 97.1% 101,419 81,822 114,422
Alto Rosario (7) 11/04 42,238 100.0% 97.7% 123,510 97,656 127,344
Córdoba Shopping –Villa
Cabrera 12/06 15,106 100.0% 100.0% 58,359 47,160 71,371
Dot Baires Shopping 05/09 49,719 80.0% 99.4% 189,271 150,503 464,881
Soleil 07/10 13,609 100.0% 100.0% 45,039 34,564 91,379
La Ribera 09/11 8,378 50.0% 97.7% 11,910 3,833 18,123
Fibesa and Other (8) N/A 100.0% N/A 38,841 36,949 -
GENERAL TOTAL 308,793 99.1% 1,622,346 1,321,589 1,852,378
Notes:
(1) Total leaseable area in each property. Excludes common areas and parking spaces.-
(2) Calculated dividing occupied square meters by leaseable area on the last day of the period.-
(3) APSA’s effective interest in each of its business units. IRSA has a 95.69% interest in APSA.-
(4) Corresponds to total leases, consolidated as per the Technical Resolution 21 method.-
(5) Cost of acquisition plus improvements, less accumulated depreciation, plus adjustment for inflation, less allowance for impairment in value,
plus recovery of allowances, if applicable. Does not include works in progress.
(6) Through Alto Palermo S.A.
(7) Excludes Museo de los Niños (3,732 in Abasto and 1,261 in Alto Rosario).-
(8) Includes revenues from Fibesa S.A., Comercializadora Los Altos S.A. (merged with Fibesa S.A.I. and others).
The following table sets forth the total tenant retail sales in Pesos at the shopping centers
in which we had an interest for the periods shown:
Tenants’ Retail Sales(1)
2013 2012 Var
Alto Palermo 1,609.8 1,304.6 23.4%
Abasto Shopping 1,939.0 1,537.3 26.1%
Alto Avellaneda 1,868.8 1,466.9 27.4%
Paseo Alcorta 822.7 667.8 23.2%
Patio Bullrich 548.3 498.5 10.0%
Alto Noa Shopping 609.2 500.4 21.7%
Buenos Aires Design 241.5 235.8 2.4%
Alto Rosario Shopping 1,060.2 825.2 28.5%
Mendoza Plaza Shopping 1,206.7 929.1 29.9%
Córdoba Shopping 432.9 340.3 27.2%
Dot Baires Shopping 1,566.6 1,271.2 23.2%
Soleil 366.4 254.1 44.2%
La Ribera Shopping 209.9 135.2 55.3%
Total 12,482.0 9,966.4 25.2%
Notes:

53
(1) Retail sales based upon information provided to us by retailers and past owners. The amounts shown reflect 100% of the retail sales of each shopping center, although in certain cases we own less than 100% of such shopping centers.
(2) Excludes sales from the booths and spaces used for special exhibitions.
(3) Includes income since its acquisition in August 2011.
The following table shows a schedule of lease expirations for our shopping center
properties in place as of June 30, 2013, assuming that none of the tenants exercise renewal
options or terminate their lease early.
Lease Expirations
Expiration Number of Leases (1)
Surface area
subject to
expiration
Percentage subject
to expiration Amount (ARS) Percentage of Leases
2014 585 87,733 28% 164,571,170 32%
2015 405 58,368 19% 143,851,800 28%
2016 374 58,771 19% 146,057,908 28%
2017 and subsequent
years 116 103,921 34% 67,012,725 13%
Total (2) 1,480 307,793 100% 521,493,603 100%
(1) Includes vacant stores as of June 30, 2013. A lease agreement may be linked to one or more premises.
(2) Includes the basic rental income amount. Does not give effect to our ownership interest in each property.
The following table shows the average occupancy rate of each shopping center during
fiscal years ended June 30, 2013 and 2012:
Occupancy Rate
2013 2012
Abasto 99.8% 99.1%
Alto Palermo 98.4% 98.3%
Alto Avellaneda 99.9% 96.1%
Paseo Alcorta 99.8% 100.0%
Patio Bullrich 99.7% 100.0%
Alto Noa 99.7% 98.9%
Buenos Aires Design 99.0% 100.0%
Mendoza Plaza 97.1% 96.4%
Alto Rosario 97.7% 97.6%
Córdoba Shopping Villa Cabrera 100.0% 99.6%
Dot Baires Shopping 99.4% 99.4%
Soleil Factory Shopping 100.0% 100.0%
La Ribera Shopping 97.7% 98.7%
Weighted Average 99.1% 98.4%
Principal Terms of the Leases
Under Argentine Law, terms of commercial leases must be between three to ten years,
with most leases in the shopping center business having terms of no more than five years. Alto
Palermo’s lease agreements are generally denominated in Pesos.
Leaseable space in Alto Palermo’s shopping centers is marketed through an exclusive
arrangement with its real estate brokers, Fibesa S.A. (“Fibesa”) and Comercializadora Los Altos
S.A. (merged with Fibesa S.A. as of July 1, 2009). Alto Palermo has a standard lease

54
agreement, the terms and conditions of which are described below, which it uses for most
tenants. However, Alto Palermo’s largest tenants generally negotiate better terms for their
respective leases. No assurance can be given that lease terms will be as set forth in the
standard lease agreement.
Alto Palermo charges its tenants a rent which consists of the higher of (i) a monthly base
rent (the “Base Rent”) and (ii) a specified percentage of the tenant’s monthly gross sales in the
store (the “Percentage Rent”) (which generally ranges between 4% and 10% of tenant’s gross
sales). Furthermore, pursuant to the rent escalation clause in most leases, a tenant’s Base Rent
generally increases between 7% and 24% each year on an annual and cumulative basis as
from the thirteenth (13th) month of the lease effective term. Although many of our lease
agreements contain readjustment clauses, these are not based on an official index nor do they
reflect the inflation index.
In addition to rent, Alto Palermo charges most of its tenants an admission fee, which is
required to be paid upon entering into a lease agreement and upon a lease agreement renewal,
which is negotiated with each of the tenants. The admission fee is normally paid in one lump
sum or in a small number of monthly installments. If the tenant pays this fee in installments, it is
the tenant’s responsibility to pay for the balance of any such amount unpaid in the event the
tenant terminates its lease prior to its expiration. In the event of unilateral termination and/or
resolution for breach of duties by the tenant, a tenant will not be refunded its admission right
without Alto Palermo’s consent.
Alto Palermo is responsible for supplying each shopping center with the electrical power
connection and provision, a main telephone switchboard, central air conditioning connection and
a connection to a general fire detection system. Each rental unit is connected to these systems.
Alto Palermo also provides the food court tenants with sanitation and with gas systems
connections. Each tenant is responsible for completing all the necessary installations within its
own rental unit, in addition to payment of the direct expenses generated by these items within
each rental unit. These direct expenses generally include: electricity, water, gas, telephone and
air conditioning. Tenants must also pay for a percentage of total charges and general taxes
related to the maintenance of the common areas. Alto Palermo determines this percentage
based on several factors. The common area expenses include, among others, administration,
security, operations, maintenance, cleaning and taxes.
Alto Palermo carries out promotional and marketing activities to increase visits to its
shopping centers. These activities are paid for with the tenants’ contributions to the Common
Promotional Fund (“CPF”), which is administered by Alto Palermo. Every month tenants
contribute to the CPF an amount equal to approximately 15% of their rent (Base Rent or
Percentage Rent, as applicable), in addition to rent and expense payments. Alto Palermo may
increase the percentage that tenants must contribute to the CPF, but the increase cannot
exceed 25% of the original amount set forth in the corresponding lease agreement for the
contributions to the CPF. Alto Palermo also may require tenants to make extraordinary
contributions to the CPF to fund special promotional and marketing campaigns or to cover the
costs of special promotional events that benefit all tenants. We may require tenants to make
these extraordinary contributions up to four times a year provided that each such extraordinary
contribution may not exceed 25% of the preceding monthly rental payment of the tenant.
Each tenant leases its rental unit as a shell without any fixtures. Each tenant is responsible for the interior design of its rental unit. Any modifications and additions to the rental

55
units must be pre-approved by Alto Palermo. Alto Palermo has the option to decide tenants’ responsibility for all costs incurred in remodeling the rental units or for removing any additions made to the rental unit when the lease expires. Furthermore, tenants are responsible for obtaining adequate insurance for their rental units, which must include, among other things, coverage for fire, glass breakage, theft, flood, civil liability and workers’ compensation.
Set forth below is a breakdown of the sources of our shopping center revenues for our
fiscal years ended June 30, 2013 and 2012 (in millions of ARS):
Sources of Shopping Center Revenues
Type of Business
2013 2012 Var
Anchor Store 869.5 708.2 22.8%
Clothes and footwear 6,149.9 4,932.8 24.7%
Entertainment 461.5 351.5 31.3%
Home 2,322.6 1,795.6 29.3%
Restaurant 1,161.5 937.4 23.9%
Miscellaneous 1,438.2 1,186.2 21.2%
Services 78.8 54.7 44.1%
Total 12,482.0 9,966.4 25.2%
Description of each Shopping Center
Set forth below is information regarding our subsidiary Alto Palermo’s principal shopping
centers.
Alto Palermo Shopping, City of Buenos Aires.
Alto Palermo Shopping is a 146-store shopping center that opened in 1990 and is located
in the densely populated middle-income neighborhood of Palermo in the City of Buenos Aires.
Alto Palermo Shopping is located only a few minutes from downtown Buenos Aires and with
nearby subway access at the intersection of Avenues Santa Fe and Coronel Díaz. Alto Palermo
Shopping has a total constructed area of 65,029 square meters (including parking lot) that
consists of 18,690 sqm of gross leaseable area. The shopping center has a food court with 19
stores. Alto Palermo Shopping is spread out over four levels and its parking lot may
accommodate 654 cars for a fee over an area of 32,405 square meters. The shopping center
target customer is a middle-income shopper aged 28 to 40.
In the fiscal year ended on June 30, 2013, the public visiting the shopping center
generated nominal retail sales totaling approximately ARS 1,609.8 million, 23.4% higher than
the ARS 1,304.6 million invoiced in the same period of the previous fiscal year. Sales per
square meter reached ARS 86,130.2. Total rental income increased from about ARS 220.7
million for fiscal year ended June 30, 2012 to ARS 269.9 million for fiscal year ended June 30,
2013.
As of June 30, 2013, its occupancy rate was 98.5%.
Alto Avellaneda, Avellaneda, Greater Buenos Aires.
Alto Avellaneda is a 140-store shopping center that opened in October 1995 and is
located in the densely populated neighborhood known as Avellaneda, on the southern border of

56
the City of Buenos Aires. This shopping center is located near a railway station and close to
downtown Buenos Aires City. Alto Avellaneda has a total constructed area of 108,598.8 square
meters (including parking lot) that includes 36,943 sqm of gross leaseable area. Alto Avellaneda
has a six-screen multiplex movie theatre, a Wal-Mart megastore, an entertainment center, a 20-
restaurant food court and starting in April 28, 2008, it also hosts a Falabella department store.
Wal-Mart (not included in the gross leaseable area) acquired the space it occupies, but it pays a
share of the common expenses of Alto Avellaneda’s parking lot. This shopping center offers
free-of-charge parking space for 2,700 cars over an area of 47,856 square meters.
Alto Avellaneda’s target customer is a middle-income shopper aged 16 to 30.
In the fiscal year ended June 30, 2013, the public visiting the shopping center generated
nominal retail sales that totaled approximately ARS 1,868.8 million, which represents an year-
on-year growth of 27.4%. Sales per square meter were ARS 50,586.9. Total rental income
increased from ARS 159.3 million for fiscal year ended June 30, 2012 to ARS 190.5 million for
fiscal year ended June 30, 2013.
As of June 30, 2013, its occupancy rate was 99.9%.
Paseo Alcorta, City of Buenos Aires.
Paseo Alcorta is a 109-store shopping center that opened in 1992 and is located in the
residential neighborhood of Palermo Chico, one of the most exclusive areas in the City of
Buenos Aires, within a short drive from downtown Buenos Aires. Paseo Alcorta has a total
constructed area of approximately 87,553.8 square meters (including parking lot) that consists
of 14,141 square meters of gross leaseable area. Paseo Alcorta has a 12-restaurant food court
and a Carrefour hypermarket on the ground floor. Carrefour purchased the space it now
occupies but it pays a share of the expenses of the shopping center’s parking lot. It is a three-
level shopping center that includes a parking lot that charges a fee (as from June 2008) with
approximately 1,300 spaces.
The shopping center target customer is a high-income shopper aged 34 to 54.
In the fiscal year ended June 30, 2013, the public visiting the shopping center generated
nominal retail sales that totaled approximately ARS 822.7 million, which represents annual sales
for approximately ARS 58,182.5 per square meter and a year-on-year growth of 23.2%. Total
rental income increased from approximately ARS 101.0 million in fiscal year ended June 30,
2012 to ARS 126.9 million in fiscal year ended June 30, 2013.
As of June 30, 2013, its occupancy rate was 99.8%.
Abasto Shopping, City of Buenos Aires.
Abasto Shopping is a 175-store shopping center located in the City Buenos Aires. Abasto
Shopping is directly accessible by Carlos Gardel subway station; it is six blocks away from Once
railway station and near the highway to Ezeiza International Airport. Abasto Shopping opened
on November 10, 1998. Our investment in Abasto amounted to US$ 111.6 million. The principal
building is a landmark building, which during the period 1889 to 1984 operated as the primary
fresh produce market for the City of Buenos Aires. The property was converted into a 116,646
square meter shopping center (including parking lot and common areas), with approximately
37,708 square meters of gross leaseable area (41,440 sqm including Museo de los Niños).

57
Abasto is ranked #4 in terms of gross leaseable area in Argentina. The shopping center is near
Torres de Abasto, our apartment complex, and Coto supermarket.
Abasto Shopping has a 27-restaurant food court, a 12-screen movie theatre complex
seating approximately 3,100 people, covering a surface area of 8,021 sqm, entertainment area
and Museo de los Niños with a surface area of 3,732 sqm (the latter is not included within the
gross leaseable area). The shopping center is distributed in five stories and includes a parking
lot for 1,200 vehicles with a surface area of 40,169 sqm.
Abasto Shopping’s target customer is a middle-income shopper aged 25 to 45, that in our
opinion, represents an important portion of the population in this area of Buenos Aires.
In the fiscal year ended June 30, 2013, the public visiting the shopping center generated
nominal retail sales that totaled approximately ARS 1,939.0 million, 26.1% higher than the sales
recorded in the same period of the previous fiscal year. Sales per square meter were
approximately ARS 51,420.5. Total rental income increased from approximately ARS 222.3
million in fiscal year ended June 30, 2012 to ARS 276.9 million in fiscal year ended June 30,
2013.
As of June 30, 2013, its occupancy rate was 99.8%.
Patio Bullrich, City of Buenos Aires.
Patio Bullrich is located in the Recoleta neighborhood, one of the most prosperous areas
of the City of Buenos Aires. This district is a residential, cultural and tourist center that includes
distinguished private homes, historical sites, museums, theatres and embassies. The shopping
center is located within walking distance of the most prestigious hotels of Buenos Aires and the
subway, bus and train systems. Additionally, the shopping center is only 10 minutes by car from
the downtown area of the City of Buenos Aires.
Patio Bullrich has a total constructed area of 29,982 square meters (including parking lot)
that consists of 11,683 sqm of gross leaseable area and common areas consisting of 12,472
square meters. The shopping center includes a four-screen multiplex movie theatre seating
1,381 people and a 12-store food court. The four-story shopping center has a parking lot that
charges a fee with 215 spaces over an area of 4,825 square meters.
In the fiscal year ended June 30, 2013, the public visiting the shopping center generated
nominal retail sales that totaled approximately ARS 548.3 million, which represents annual sales
for approximately ARS 46,930.3 per square meter. Total rental income increased from
approximately ARS 90.1 million in fiscal year ended June 30, 2012 to ARS 103.1 million in fiscal
year ended June 30, 2013.
As of June 30, 2013, its occupancy rate was 99.7%.
Alto Noa, Salta, City of Salta.
Alto Noa is a 91-store shopping center that opened in 1994. Alto Noa is located in the City
of Salta, the capital of the Province of Salta, in the northwestern region of Argentina. The
province of Salta has a population of approximately 1.2 million inhabitants with approximately
0.6 million inhabitants in the City of Salta. The shopping center has a total constructed area of
approximately 30,876 square meters (including parking) which consists of 19,141 square meters

58
of gross leaseable area. Alto Noa has a food court with 13 restaurants, a large entertainment
center, a supermarket and a multiplex cinema with eight screens. The shopping center occupies
one floor and has a free parking lot for 551 cars.
Alto Noa’s target customer is a middle-income shopper aged 28 to 40.
In the fiscal year ended June 30, 2013, the public visiting the shopping center generated
nominal retail sales that totaled approximately ARS 609.2 million, which represents annual sales
for approximately ARS 31.827.9 per square meter. Total rental income increased from
approximately ARS 39.3 million in fiscal year ended June 30, 2012 to ARS 47.0 million in fiscal
year ended June 30, 2013.
As of June 30, 2013, its occupancy rate was 99.7%.
Buenos Aires Design Center, City of Buenos Aires.
Buenos Aires Design is a 62-store shopping center intended for specialty interior, home
decorating and restaurants that opened in 1993. Alto Palermo owns Buenos Aires Design
through a 53.68% interest in Emprendimiento Recoleta S.A., which owns the concession to
operate the shopping center. Buenos Aires Design is located in Recoleta, one of the most
popular tourist zones in Buenos Aires City. Buenos Aires Design has a total constructed area of
26,131.5 sqm (including parking) that consists of 13,776 sqm of gross leaseable area. The
shopping center has 8 restaurants anchored by the Hard Rock Café and a terrace that covers
3,700 square meters. The shopping center is divided into two floors and has a 174-car pay
parking lot.
Buenos Aires Design’s targeted clientele consists of upper-middle income individuals
between the ages of 25 and 45.
In the fiscal year ended June 30, 2013, the public visiting the shopping center generated
nominal retail sales that totaled approximately ARS 241.5 million, which represents
approximately ARS 17,571.7 per square meter. Total rental income increased from
approximately ARS 36.4 million in fiscal year ended June 30, 2012 to ARS 42.4 million in fiscal
year ended June 30, 2013.
As of June 30, 2013, its occupancy rate was 99.0%.
Alto Rosario, Santa Fe, City of Rosario.
Alto Rosario is a 146-store shopping center located in the City of Rosario, the third largest
city in Argentina in terms of population. It has a total constructed area of approximately 100,750
square meters (including parking), which consists of 27,691 square meters of gross leaseable
area. Alto Rosario has a food court with 17 restaurants, a large entertainment center, a
supermarket and a Showcase cinema with 14 state-of-the-art screens. The shopping center
occupies one floor and has a free parking lot for 1,736 cars.
Alto Rosario’s targeted clientele consists of middle-income individuals between the ages
of 28 and 40.
In the fiscal year ended June 30, 2013, the public visiting the shopping center generated
nominal retail sales that totaled approximately ARS 1,060.2 million, which represents a year-on-

59
year growth of 28.5%. Sales per square meter were approximately ARS 38,288.0. Total rental
income increased from approximately ARS 97.6 million in fiscal year ended June 30, 2012 to
ARS 123.5 million in fiscal year ended June 30, 2013.
As of June 30, 2013, its occupancy rate was 97.7%.
Mendoza Plaza Shopping, Mendoza, City of Mendoza.
Mendoza Plaza is a 147-store shopping center which opened in 1992 and is in the City of
Mendoza, the capital of the Province of Mendoza. The city of Mendoza has a population of
approximately 1.0 million inhabitants, making it the fourth largest city in Argentina. Mendoza
Plaza Shopping consists of 42,238 square meters of gross leaseable area and has a multiplex
cinema covering an area of approximately 3,659 square meters with ten screens, the Chilean
department store Falabella, a food court with 21 restaurants, an entertainment center and a
supermarket, which is also a tenant. The shopping center has two levels and has a free parking
lot for 2,600 cars.
Mendoza Plaza’s targeted clientele consists of middle-income individuals between the
ages of 28 and 40.
In the fiscal year ended June 30, 2013, the public visiting the shopping center generated
nominal retail sales that totaled approximately ARS 1,206.7 million, which represents a year-on-
year growth of 29.9%. Sales per square meter were approximately ARS 28,569.4. Total rental
income increased from approximately ARS 81.8 million in fiscal year ended June 30, 2012 to
ARS 101.4 million in fiscal year ended June 30, 2013.
As of June 30, 2013, its occupancy rate was 97.1%.
Córdoba Shopping, Villa Cabrera, City of Córdoba.
Córdoba Shopping Villa Cabrera is a 106-store commercial center with a covered area of
35,000 square meters, consisting of 15,106 square meters of gross leaseable area located in
Villa Cabrera, City of Córdoba. It has a 12-screen movie theatre complex and a parking lot for
1,500 vehicles.
In the fiscal year ended June 30, 2013, the public visiting the shopping center generated
nominal retail sales that totaled approximately ARS 432.9 million, which represents a year-on-
year growth of 27.2%. Sales per square meter were approximately ARS 28,657.5. Total rental
income increased from ARS 47.1 million in fiscal year ended June 30, 2012 to ARS 58.3 million
in fiscal year ended June 30, 2013.
As of June 30, 2013, its occupancy rate was 100.0%.
Dot Baires Shopping, City of Buenos Aires, Buenos Aires.
Dot Baires Shopping is a shopping center that was opened in May 2009. It has 4 floors
and 3 underground levels, a covered surface area of 173,000 square meters, out of which
49,719 constitute Gross Leaseable Area, 153 retail stores, a hypermarket, a 10-screen multiplex
movie theater and parking space for 2,200 vehicles.

60
Dot Baires Shopping is located in the Saavedra neighborhood, at the spot where Av.
General Paz meets the Panamerican Highway and it is the largest shopping center in the City of
Buenos Aires in terms of square meters.
As of June 30, 2013, our equity interest in Panamerican Mall S.A. was 80%.
In the fiscal year ended June 30, 2013, the public visiting the shopping center generated
nominal retail sales that totaled approximately ARS 1,566.6 million, which represents annual
sales for approximately ARS 31,509.7 per square meter. Total rental income increased from
approximately ARS 150.5 million in fiscal year ended June 30, 2012 to ARS 189.2 million in
fiscal year ended June 30, 2013.
As of June 30, 2013, its occupancy rate was 99.4%.
Soleil Premium Outlet, Greater Buenos Aires.
Soleil Premium Outlet is a shopping center that has been managed by us since 2010. As
from April 2013, as a result of its refurbishment and reengineering and a strong advertising
campaign, it was renamed Soleil Premium Outlet. At present, it has a surface area of 48,313
square meters, 13,609 square meters of which are gross leaseable area, and we are authorized
to build more than 9,697 square meters. It comprises 75 stores and 2,335 parking spaces.
Soleil Premium Outlet is located in San Isidro, Province of Buenos Aires. It opened in
Argentina more than 25 years ago and it is the first Premium Outlet in the country.
In the fiscal year ended June 30, 2013, the public visiting the shopping center generated
nominal retail sales that totaled approximately ARS 366.4 million, which represents period
average sales for approximately ARS 26,922.6 per square meter and a year-on-year growth of
44.2% in invoicing. Total rental income increased from approximately ARS 34.6 million in fiscal
year ended June 30, 2012 to ARS 45.0 million for fiscal year ended June 30, 2013.
As of June 30, 2013, its occupancy rate was 100%.
La Ribera Shopping, City of Santa Fe.
La Ribera Shopping has a surface area of 43,219 square meters, comprising 50 retail
stores and a 7 2D and 3D-screen multiplex cinema, the last one was opened in August 2012
with state-of-the-art sound and imaging technology. It also comprises a 510-square meter
Cultural Center and 24,553 square meters in outdoor areas and free parking space. Its gross
leaseable area is approximately 8,378 square meters.
The shopping center is strategically located within the Port of Santa Fe, the most
developed area in terms of real estate in the City of Santa Fe, 27 km away from the City of
Paraná and 96 km away from the City of Rafaela. Its influence area represents a potential
market consisting of over one million people.
In the fiscal year ended June 30, 2013, the public visiting the shopping center generated
nominal retail sales that totaled approximately ARS 209.9 million, which represents period
average sales for approximately ARS 25,051.9 per square meter. Total rental income increased
from ARS 3.8 million in fiscal year ended June 30, 2012 to ARS 11.9 million during 2013.
As of June 30, 2013, its occupancy rate was 97.7%.

61
Development and Sale of Properties and Land Reserves
Residential Development Properties
The acquisition and development of residential apartment complexes and residential
communities for sale is one of IRSA’s core activities. IRSA’s development of residential
apartment complexes consists of the new construction of high-rise towers or the conversion and
renovation of existing structures such as factories or warehouses. In connection with the
development of residential communities, IRSA frequently acquires vacant land, develops
infrastructure such as roads, utilities and common areas, and sells plots of land for construction
of single-family homes. It may also develop or sell portions of land for others to develop
complementary facilities such as shopping areas within residential developments.
In fiscal year ended June 30, 2013, revenues from the Development and sale of properties
segment amounted to ARS 142.0 million, compared to ARS 162.8 million posted in the fiscal
year ended June 30, 2012.
Construction and renovation works on IRSA’s residential development properties are
currently performed, under our supervision, by independent Argentine construction companies
that are selected through a bidding process. IRSA enters into turnkey contracts with the
selected company for the construction of residential development properties pursuant to which
the selected company agrees to build and deliver the development for a fixed price and at a
fixed date. IRSA is generally not responsible for any additional costs based upon the turnkey
contract. All other aspects of the construction, including architectural design, are performed by
third parties.
Another modality for the development of residential undertakings is the exchange of land
for constructed square meters. In this way, IRSA delivers undeveloped pieces of land and
another firm is in charge of building the project. In this case, IRSA receives finished units for
commercialization, without taking part in the construction works.
The following table shows certain information and gives an overview regarding our sales
and development properties as of June 30, 2013 and 2012:
DEVELOPMENT 2013 2012
Residential apartments
Caballito Nuevo (10)
6,983 9,248
Torres de Rosario (5)
4,262 5,002
Libertador 1703 y 1755
(Horizons) (8)
117,090 110,596
Other residential apartments (6)
811 371
Subtotal residential
apartments 129,146 125,217
Residential Communities
Abril/Baldovinos (7)
1,113
El Encuentro (11)
11,699 10,260
Subtotal Residential
Communities 12,811 10,260
Land Reserve
Terreno Rosario (5)
27,273
Canteras Natal Crespo 39
Subtotal Land Reserves 39 27,273
TOTAL 141,996 162,750

62
DEVELOPMENT
Date of
Acquisition
Area
intended for
sale sqm Total Units
IRSA’s
Effective
Interest
Percentage
Built
Percentage
Sold
Book
Value (in
thousands
of ARS)
Residential
apartments
Torres Renoir Sep-99 5,383 28 100.00% 100.00% 100.00%
Caballito Nuevo Nov-97 67 1 100.00% 100.00% 99.07% 313
Torres de Rosario(5)
Apr-99 2,509 16 95.67% 100.00% 60.00% 3,089
Libertador 1703 y 1755
(Horizons) (9)
Jan-07 44,648 467 50.00% 100.00% 100.00% 19,396
Other residential
apartments (6)
N/A 138,520 1,438 83,874
Subtotal Residential
Apartments 191,127 1,950 106,672
Residential
Communities
Abril/Baldovinos (7)
Jan-95 5,137 4 100.00% 100.00% 99.50% 2,878
El Encuentro Nov-97 6,628 5 100.00% 100.00% 85.00% 1,136
Villa Celina I, II y III May-92 75,970 219 100.00% 100.00% 100.00% -
Subtotal Residential
Communities 87,735 228 4,014
Land Reserve
Puerto Retiro May-97 82,051 50.00% 0.00% 0.00% 51,337
Santa María del Plata Jul-97 715,951 100.00% 0.00% 10.00% 158,951
Pereiraola Dec-96 1,299,630 100.00% 0.00% 100.00%
Terreno Rosario (5)
Apr-99 31,000 95.67% 0.00% 100.00% 7,665
Terreno Caballito Nov-97 7,451 100.00% 0.00% 100.00%
Neuquén (5)
Jul-99 4,332 1 95.67% 0.00% 100.00% 48,874
Terreno Baicom Dec-09 34,500 1 50.00% 0.00% 0.00% 4,459
Terreno Beruti (5)
Jun-08 3,207 95.67% 0.00% 100.00% 9,264
Pilar May-97 740,237 100.00% 0.00% 0.00% 1,550
Coto Air Space (5)
Sep-97 16,167 284 95.67% 0.00% 0.00% 8,945
Torres Jardín IV Jul-96 3,176 100.00% 0.00% 100.00%
Terreno Caballito (5)
Oct-98 23,389 95.67% 0.00% 0.00%
Patio Olmos (5)
Sep-07 5,147 0 95.67% 100.00% 0.00% 31,333
UOM Lujan May-08 1,176,000
41,861
Other Land Reserves (8)
N/A 13,680,711 1 92,477
Subtotal Land
Reserves 17,822,949 287 456,716
TOTAL 18,101,811 2,465 567,402
(1) Total area intended for sale upon completion of the development or acquisition and before the sale of any of the units (including parking and
storage spaces but excluding common areas).
In the case of Land Reserves the land area was considered.
(2) Represents the total units or plots upon completion of the development or acquisition (excluding parking and storage spaces).
(3) The percentage sold is calculated dividing the square meters sold by the total saleable square meters.
(4) Corresponds to the company’s consolidated total sales.
(5) Through Alto Palermo S.A.
(6) Includes the following properties: Torres de Abasto through APSA (fully sold), units to be received by Beruti through APSA, Torres Jardín,
Edificios Cruceros (fully sold),
San Martin de Tours, Rivadavia 2768, Alto Palermo Park (fully sold), Minetti D (fully sold), Dorrego 1916 (fully sold), Padilla 902 (fully sold),
Terreno Caballito and
Lotes Pereiraola through IRSA.
(7) Includes the sales of Abril’s shares.
(8) Includes the following land reserves: Terreno Pontevedra, Isla Sirgadero, Terreno San Luis, Mariano Acosta, Merlo and Intercontinental
Plaza II through IRSA,
Zetol and Vista al Muelle through Liveck and C.Gardel 3134 (fully sold), C.Gardel 3128 (fully sold), Aguero 596 (fully sold), República Arabe

63
Siria (fully sold), Terreno Mendoza (fully sold),
Zelaya 3102, Conil, Soleil air space and Other APSA (Through APSA)
(9) Owned by CYRSA S.A.
In the residential market, we acquire undeveloped properties strategically located in
densely populated areas of the City of Buenos Aires, particularly properties located near
shopping centers and hypermarkets or those to be constructed. We then develop multi-building
high-rise complexes targeting the middle- and high- income market. These are equipped with
modern comforts and services, such as open “green areas,” swimming pools, sports and
recreation facilities and 24-hour security. In the loft buildings market, our strategy is to acquire
old buildings no longer in use located in areas with a significant middle and upper-income
population. The properties are then renovated into unfinished lofts allowing buyers the
opportunity to design and decorate them according to their preferences.
Apartment Projects Currently Under Development
Horizons Project, Vicente López, Olivos, Province of Buenos Aires.
The project was developed by IRSA-CYRELA. It is one of the most significant
developments in Greater Buenos Aires, featuring a new concept in residential complexes given
its emphasis on the use of common spaces. This project includes two complexes with a total of
six buildings.
As of June 30, 2013, preliminary sales agreements had been executed for 100% of our
own units on sale. The Towers located in both blocks are completed.
Torre Caballito, City of Buenos Aires.
This property, with a surface of 8,404 square meters, is situated in the northern area of
Caballito’s residential neighborhood in the City of Buenos Aires. On May 4, 2006, IRSA and
KOAD S.A. (“KOAD”), an Argentine developer, entered into an asset exchange agreement
valued at US$ 7.5 million pursuant to which it sold to Koad plot number 36 of “Terrenos de
Caballito” whereby KOAD has agreed to develop a residential complex called “Caballito Nuevo”,
at its costs, consisting of two 34-story towers containing 220 apartments each, consisting of
one, two and three bedroom residential units with surface areas ranging from 40 to 85 sqm,
totaling approximately 28,000 saleable sqm. The project offers a wide variety of amenities and
services. As a result of this transaction, Koad delivered to IRSA 118 apartments and 61 parking
lots in the first tower, representing 25% of the total square meters for sale. As of June 30, 2013,
1 apartment and 13 parking spaces are available for sale.
Private Residential Communities
In the residential communities market, we acquire undeveloped properties located in
suburban areas or neighborhoods near the large cities to develop private neighborhoods and
country clubs in which to sell vacant lots for the construction of single family homes. In these
properties we build streets and roads and arrange for the provision of basic municipal services
and amenities such as open spaces, sports facilities and security. We seek to capitalize on
improvements in transportation and communication around the City of Buenos Aires, the
growing suburbanization of the region and the shift of the population moving to countryside-type
residential communities.
An important factor in the trend towards living in suburban areas has been the
improvements and additions to the Autopista Panamericana, Avenida General Paz and Acceso

64
Oeste highways, which significantly reduce traveling time, encouraging a significant number of
families to move to the new residential neighborhoods. Furthermore, improvements in public
train, subway and bus transportation since their privatization have also influenced the trend to
adopt this lifestyle.
As of June 30, 2013, our residential communities for the construction of single-family
homes for sale in Argentina had a total of 5,137 square meters of saleable area in Abril, and
6,628 sqm of saleable area in “El Encuentro” (Benavidez). Both residential communities are
located in the province of Buenos Aires.
Abril, Hudson, Greater Buenos Aires.
Abril is a 312-hectare private residential community located near Hudson City,
approximately 34 kilometers south of the City of Buenos Aires. We have developed this property
into a private residential community for the construction of single family homes targeting the
upper-middle income market. The project includes 20 neighborhoods subdivided into 1,273 lots
of approximately 1,107 square meters each. Abril also includes an 18-hole golf course, 130
hectares of woodlands, a 4,000-square meter mansion and entertainment facilities. A bilingual
school, horse stables and sports centers and the construction of the shopping center were
concluded in 1999. The neighborhoods have been completed, and as of June 30, 2013, 99.6%
of the property had been sold for an aggregate of over ARS 240 million, with 4 lots (5,137
square meters) available for sale.
El Encuentro, Benavidez, Tigre.
In the district of Benavidez, Municipality of Tigre, 35 kilometers north from downtown
Buenos Aires, a 110-hectare gated residential complex known as “El Encuentro” is located,
consisting of a total of 527 lots with a total saleable area of 610,785.15 sqm with two privileged
front accesses: the main one to Vía Bancalari and the service one to Highway No. 9, allowing
an easy way to and from the city. On May 21, 2004 an exchange deed was signed for the
original lot whereby DEESA agreed to pay US$ 4.0 million to our subsidiary Inversora Bolívar, of
which US$ 1.0 million were paid in cash and the balance of US$ 3.0 million was paid on
December 22, 2009, with the transfer of 110 residential plots already chosen, totaling a saleable
area of 127,795 sqm. The development of the project is completed and equipped with power
supply, water, sewage, effluent treatment plant, public lighting, finished driveways and
accesses, buildings, sports facilities, etc.
As of June 30, 2013, after having started its commercialization in March 2010, 109 units
have been sold; and 5 units are available for sale.
Land Reserves
We have acquired large undeveloped properties as land reserves located in strategic
areas for the future development of office and apartment buildings, shopping centers and single
family housing. We have acquired what we believe to be two of the largest and most important
undeveloped river front plots in Buenos Aires, Puerto Retiro and Santa María del Plata, for the
future development of residential and office spaces. In addition, we have benefited from the
improvement of land values during periods of economic growth. As of June 30, 2013, our land
reserves totaled approximately 1,782 hectares (including the lot in Caballito, and the air space
over Coto C.I.C.S.A. - “Coto”- where we hold interests through our subsidiary Alto Palermo).

65
Land Reserves in the City of Buenos Aires
Solares de Santa Maria, City of Buenos Aires, (formerly Santa María del Plata).
Solares de Santa María is a 70-hectare property facing the Río de la Plata in the south of
Puerto Madero, 10 minutes from downtown Buenos Aires. Through our subsidiary Solares de
Santa María S.A. (“Solares de Santa María”) we are owners of this property. We intend to
develop this property for mixed purposes, i.e. our development project involves residential
complexes as well as offices, stores, hotels, sports and sailing clubs, services areas with
schools, supermarkets and parking lots.
Puerto Retiro.
Puerto Retiro is an 8.2 hectare undeveloped riverside property bounded by the Catalinas
and Puerto Madero office zones to the west, the Retiro railway station to the north and the Río
de la Plata to the south and east. One of the only two significant privately owned waterfront
properties in the City of Buenos Aires, Puerto Retiro may currently be utilized only for port
activities, so we have initiated negotiations with municipal authorities in order to rezone the
area. Our plan is to develop a 360,000 sqm financial center. The launching date has not been
settled and consequently, the estimated cost and financing method are not decided yet. We own
a 50% interest in Puerto Retiro.
Caballito lot, Ferro Project.
This is a property of approximately 23,791 sqm in the City of Buenos Aires, neighborhood of Caballito, one of the most densely populated of the city, which Alto Palermo purchased in November 1997. This plot would allow developing a shopping center having 30,000 sqm, a hypermarket, a cinema complex, and several recreation and entertainment activity areas. At present, the legislature of the City of Buenos Aires has received a legislative bill to approve the zoning parameters corresponding to this property which already has the consent of the Executive Branch.
Caballito plot. During this fiscal year, we and TGLT executed a barter deed pursuant to which we
transferred to TGLT under a swap agreement the property detailed in the deed as described below, which has a total surface area of 9,784 sqm: plot of land, designated as Parcel ONE L, in block 35, facing Méndez de Andes street between Rojas and Colpayo streets in the Caballito neighborhood.
In turn, TGLT agreed to carry out in the property a real estate development for residential use. In exchange for the transfer of the property, APSA will receive non-cash considerations equivalent to US$ 12.75 million, which consist in transferring under barter to APSA certain home units in the buildings to be built which will represent 23.1% of the saleable area and 21.1% of the parking spaces area. As security for the transaction, TGLT has granted to IRSA a first-degree mortgage over the property in the amount of US$ 12.75 million.
Pursuant to the Barter Deed executed by the parties the units in Tower 1 will be delivered in October 2014, the units in Tower 2 will be delivered in April 2015 and the units in Tower 3 will be delivered in October 2015.
Coto Residential Project. Alto Palermo owns approximately 24,000 sqm in air space over the top of the Coto
hypermarket that is close to the Abasto Shopping Center in the heart of the City of Buenos Aires.
New projects and undeveloped properties
Canteras Natal Crespo, Province of Córdoba
66
On June 26, 2013, IRSA sold, assigned and transferred 100% of its interest in Canteras
Natal Crespo S.A.’s shareholding, representing 50% of the capital stock, to Euromayor S.A. de
Inversiones for USD 4,215,000 according to the following payment schedule: USD 3,815,000 in
cash and USD 400,000 through the transfer of almost 400,000 sqm for business purposes
within the project to be developed in the site known as Laguna Azul. Delivery of the non-
monetary consideration is expected for March 2017.
Purchase of Nobleza Piccardo’s Plant (through our subsidiary APSA)
On December 28, 2012, in compliance with the lease agreement executed upon the
acquisition of the site, Nobleza Piccardo partially vacated the property located in the district of
San Martín. Quality Invest received approximately 2,100 sqm of offices and 50,300 sqm of
industrial units. Pursuant to the agreement, vacation of the remaining surface area is scheduled
for May 2014.
On March 20, Quality Invest S.A. completed the payment for the purchase of the site
where Nobleza Piccardo’s plant was located. It had been originally agreed that the balance
would be payable in three annual consecutive installments of USD 7.7 million of principal plus
interest at a rate of 7.5%. By means of this payment, the installments for 2013 and 2014 were
advanced.
Torres Rosario Project, City of Rosario, Province of Santa Fe (through our
subsidiary APSA)
APSA owns a block of land of approximately 50,000 square meters divided into 8 smaller
plots in the City of Rosario, near the Alto Rosario Shopping Center. At June 30, 2011, 2 of the
plots had been bartered with Condominios del Alto S.A. (plots 2-G and 2-H).
Condominios del Alto I- (parcel 2-G)
The project is composed of two opposite blocks of buildings, commercially divided into 8
sub-blocks. Apartments (97 units) are distributed in 6 floors with parking spaces (98 units) in the
basement. Condominios del Alto I’s amenities include a swimming pool with solarium, a multiple
use room, sauna, a gym with dressroom and a laundry. Given its excellent location and
construction quality, this development is targeted at a medium-high income segment.
As of June 30, 2013, the project had been completed, with 4 apartments, 5 parking spaces and
one storage space being available for sale.
Condominios del Alto II – (parcel 2-H)
The project will be composed of two opposite blocks of buildings, commercially divided
into 10 sub-blocks. The project will include a total of 189 apartments distributed in 6 floors and
195 parking spaces located in two basements. The amenities will include a swimming pool with
solarium, a multiple use room, sauna, a gym with dressroom and a laundry.
As of June 30, 2013, works in parcel H are completed, with 12 apartments (1,608 sqm), 24
parking spaces and 2 storage spaces being available for sale.
PAMSA-Dot Baires Offices (through our subsidiary APSA)

67
Panamerican Mall S.A., a subsidiary of our subsidiary APSA, developed an office building
with a gross leaseable area of 11,242 sqm adjacent to Dot Baires Shopping. This building was
inaugurated in May 2009. As of June 30, 2013 the building’s occupancy rate was 100%, which
marks the entrance by the Company into the booming rental office corridor in the northern area
of the City of Buenos Aires
DOT Adjoining Plot (ex Philips) (through our subsidiary APSA)
On May 3, 2012, the Government of the City of Buenos Aires, through the General Office
of Zoning Interpretation (Dirección General de Interpretación Urbanística) approved, through a
pre-feasibility study, the parcel subdivision of the Ex-Philips plot contingent upon the
observance of the applicable building regulations in each of the resulting parcels. In addition, all
the uses and parameters established under the municipal ordinance previously issued by the
above mentioned authority are being observed.
On June 3, 2013, we were given notice that the Government of the City of Buenos Aires
had approved the requested parcel subdivision of the ex-Philips plot. As a result, the property
was divided into three parcels: 2 parcels of approximately 6,400 sqm and a parcel adjoining
DOT Shopping of 15,900 sqm intended for the future extension of the shopping center.
Neuquén Project, Province of Neuquén (through our subsidiary APSA).
The main asset of the project is a plot of land of approximately 50,000 sqm. The project
contemplates the construction of a shopping center, a hypermarket, a hotel and an apartment
building.
On June 4, 2012, pursuant to an agreement entered into between Shopping Neuquén
S.A. and the Municipality of Neuquén, a new extension was agreed to resume works on the site,
following appointment of a new constructor. The new deadlines contemplate the Appointment of
a constructor and Resumption of Works. As of June 30, 2013, the works related to the Shopping
are in progress.
Terreno Paraná (through our subsidiary APSA)
On June 30, 2009, Alto Palermo S.A. (APSA) executed a letter of intent whereby it stated
its intention to acquire a plot of land of approximately 10,022 sqm in the City of Paraná,
Province of Entre Ríos, to be allocated to the construction, development and operation of a
shopping center or retail space. The purchase price was US$ 0.5 million, out of which US$ 0.05
million were paid as advance payment at the beginning of July 2010, US$ 0.1 million were paid
in August 2010, and the remaining US$ 0.35 million will be paid upon the execution of the title
deed. The certificate of possession of the plot was executed on December 29, 2012.
Other Land Reserves
Our portfolio also includes twelve land reserve properties located in the City of Buenos Aires and its surrounding areas. These properties are projected for future developments of offices, shopping centers, apartment buildings and residential communities. The main properties under this category include Merlo, Mariano Acosta and Pontevedra. We also own a property in the surroundings of the City of Santa Fe called Isla Sirgadero.
Hotels
During fiscal year 2013, we kept our 76.4% interest in Intercontinental hotel, 80% interest in Sheraton Libertador hotel and 50% interest in Llao Llao. We noted a decrease in the
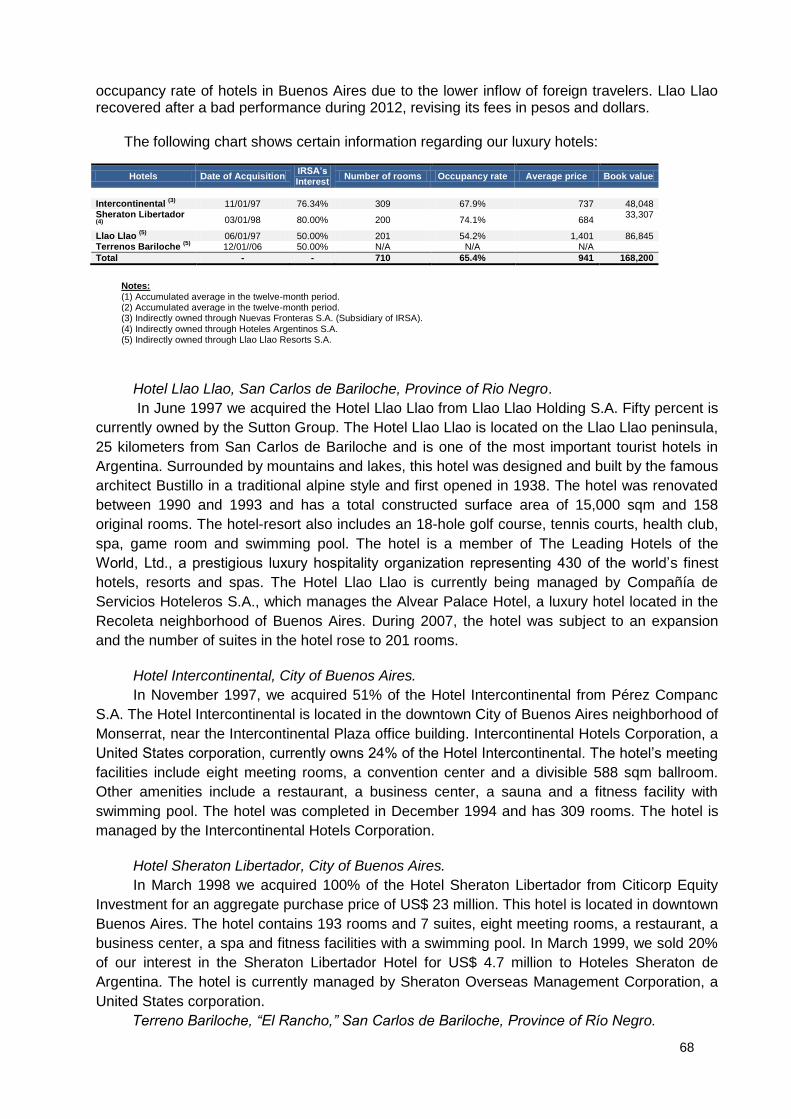
68
occupancy rate of hotels in Buenos Aires due to the lower inflow of foreign travelers. Llao Llao recovered after a bad performance during 2012, revising its fees in pesos and dollars.
The following chart shows certain information regarding our luxury hotels:
Hotels Date of Acquisition IRSA’s Interest
Number of rooms Occupancy rate Average price Book value
Intercontinental
(3) 11/01/97 76.34% 309 67.9% 737 48,048
Sheraton Libertador (4)
03/01/98 80.00% 200 74.1% 684
33,307
Llao Llao (5)
06/01/97 50.00% 201 54.2% 1,401 86,845 Terrenos Bariloche
(5) 12/01//06 50.00% N/A N/A N/A
Total - - 710 65.4% 941 168,200
Notes: (1) Accumulated average in the twelve-month period. (2) Accumulated average in the twelve-month period. (3) Indirectly owned through Nuevas Fronteras S.A. (Subsidiary of IRSA).
(4) Indirectly owned through Hoteles Argentinos S.A. (5) Indirectly owned through Llao Llao Resorts S.A.
Hotel Llao Llao, San Carlos de Bariloche, Province of Rio Negro.
In June 1997 we acquired the Hotel Llao Llao from Llao Llao Holding S.A. Fifty percent is
currently owned by the Sutton Group. The Hotel Llao Llao is located on the Llao Llao peninsula,
25 kilometers from San Carlos de Bariloche and is one of the most important tourist hotels in
Argentina. Surrounded by mountains and lakes, this hotel was designed and built by the famous
architect Bustillo in a traditional alpine style and first opened in 1938. The hotel was renovated
between 1990 and 1993 and has a total constructed surface area of 15,000 sqm and 158
original rooms. The hotel-resort also includes an 18-hole golf course, tennis courts, health club,
spa, game room and swimming pool. The hotel is a member of The Leading Hotels of the
World, Ltd., a prestigious luxury hospitality organization representing 430 of the world’s finest
hotels, resorts and spas. The Hotel Llao Llao is currently being managed by Compañía de
Servicios Hoteleros S.A., which manages the Alvear Palace Hotel, a luxury hotel located in the
Recoleta neighborhood of Buenos Aires. During 2007, the hotel was subject to an expansion
and the number of suites in the hotel rose to 201 rooms.
Hotel Intercontinental, City of Buenos Aires.
In November 1997, we acquired 51% of the Hotel Intercontinental from Pérez Companc
S.A. The Hotel Intercontinental is located in the downtown City of Buenos Aires neighborhood of
Monserrat, near the Intercontinental Plaza office building. Intercontinental Hotels Corporation, a
United States corporation, currently owns 24% of the Hotel Intercontinental. The hotel’s meeting
facilities include eight meeting rooms, a convention center and a divisible 588 sqm ballroom.
Other amenities include a restaurant, a business center, a sauna and a fitness facility with
swimming pool. The hotel was completed in December 1994 and has 309 rooms. The hotel is
managed by the Intercontinental Hotels Corporation.
Hotel Sheraton Libertador, City of Buenos Aires.
In March 1998 we acquired 100% of the Hotel Sheraton Libertador from Citicorp Equity
Investment for an aggregate purchase price of US$ 23 million. This hotel is located in downtown
Buenos Aires. The hotel contains 193 rooms and 7 suites, eight meeting rooms, a restaurant, a
business center, a spa and fitness facilities with a swimming pool. In March 1999, we sold 20%
of our interest in the Sheraton Libertador Hotel for US$ 4.7 million to Hoteles Sheraton de
Argentina. The hotel is currently managed by Sheraton Overseas Management Corporation, a
United States corporation.
Terreno Bariloche, “El Rancho,” San Carlos de Bariloche, Province of Río Negro.
69
On December 14, 2006, through our hotel operator subsidiary, Llao Llao Resorts S.A., we
acquired a land covering 129,533 sqm of surface area in the City of San Carlos de Bariloche in
the Province of Río Negro. The total price of the transaction was US$ 7.0 million, of which US$
4.2 million were paid in cash and the balance of US$ 2.8 million was financed by means of a
mortgage to be paid in 36 monthly, equal and consecutive installments of US$ 0.086 million
each. The land is in the border of the Lago Gutiérrez, close to the Llao Llao Hotel in an
outstanding natural environment and it has a large cottage covering 1,000 sqm of surface area
designed by the architect Ezequiel Bustillo.
Other Investments Abroad
Acquisition of companies in the real estate business in the Republic of Uruguay
In the course of fiscal year 2009 we acquired a 100% ownership interest in Liveck S.A.
("Liveck"), a company organized under the laws of Uruguay, in exchange for a token
consideration. In June 2009, Liveck had acquired a 90% stake in the capital stock of Vista al
Muelle S.A. and Zetol S.A., two Uruguay-based real estate companies, for US$ 7.8 million. The
remaining 10% ownership interest in both companies is in the hands of Banzey S.A. (Banzey).
These companies have undeveloped lands in Canelones, Uruguay, close to the capital city of
Uruguay, Montevideo.
The total purchase price for Zetol was US$ 7.0 million; there has been a down payment
for US$ 2.0 million and it has been agreed that the balance shall be paid in 5 installments of
US$ 1.0 million each, accruing interest at an annual 3.5% rate on outstanding balances, against
the consummated launches of the projected construction or within a maximum term of 93
months counted as from the date of acquisition by the Company. The sellers may choose to
receive, in lieu of cash for the outstanding balances (principal plus interest), ownership over
units in the buildings to be constructed in the land owned by Zetol equivalent to 12% of the total
marketable meters to be constructed.
The total price for the acquisition of Vista al Muelle was US$ 0.83 million, as follows:
there has been a US$ 0.5 million down payment and it has been agreed that the balance will be
paid within a maximum term of two years plus an annual 8% interest rate on balances.
To secure compliance with the obligations assumed by Liveck in connection with the
above-mentioned transactions, Ritelco S.A. has tendered a surety bond to secure 45% of the
price balance, interest, and the sellers’ option rights.
There is a mortgage over the land bought, which means that the sellers rely on a dual
guarantee. As of June 30, 2009, the Company sold a 50% stake in Liveck to Cyrela Brazil
Realty S.A for US$ 1.3 million.
Under the agreement for the purchase and sale of Zetol and Vista al Muelle and its
respective addenda, Liveck has undertaken to acquire the shareholding held by Banzey (or by
Ernesto Kimelman or by an entity owned by him, as applicable) in those companies and Banzey
has agreed to sell the shares for the amount in US Dollars or in Uruguayan Pesos, as
applicable, that any of them would have actually contributed to Zetol and Vista al Muelle, until
the transaction is consummated.

70
In December 2009, Vista al Muelle acquired other real property totaling US$ 1.9 million;
there has been a US$ 0.3 million down payment and the balance will be paid through the
delivery of housing units and/or storefronts to be constructed and equivalent to 12% of a
65.54% portion of the sum of the prices of all the units covered by the Launching Price List for
Sector B (the parties have already signed a plat of subdivision to this end).
In February 2010, it acquired additional real estate for a total of US$ 1.0 million in
exchange for a down payment of US$ 0.15 million with the balance to be paid in 3 consecutive
and equal installments maturing on December 31, 2011, June 30, 2013 and December 30, 2014
and accruing an annual 3% interest rate on the outstanding balance, payable quarterly and in
arrears as from December 31, 2009.
On December 17, 2010, IRSA and Cyrela executed a stock purchase agreement
pursuant to which IRSA purchased from Cyrela a 50% stake in Liveck S.A. for US$ 2.7 million.
Accordingly, as of June 30, 2012, IRSA’s stake, through Tyrus, in Liveck is 100%.
We intend to carry out an urban project consisting in the construction of apartment
buildings to be subsequently sold. The project has been granted the requisite “urban feasibility”
status by the Mayor’s Office of the Canelones department and by its local legislature.
In February 2013, the land barter agreements between the Group Companies that will
carry out the Boating de Lago Project (Zetol S.A. and Vista al Muelle S.A.) and the
Municipality of Canelones were executed in Uruguay. Once these barter agreements are
registered, the Project will be ready to start construction works.
Simultaneously, the parties executed an amendment to the Plan Agreement, which
governs the obligations of Zetol and Vista al Muelle vis-à-vis the Municipality of Canelones over
the next 10 years. In this sense, the feasibility term was extended to a term of 10 years counted
as from the date of execution (i.e., 3 years were added).
As of June, the architectural project continues to progress. The local firms involved are
Gómez Platero and Kimelman Moraes.
Lipstick building, New York, United States
The Lipstick Building is a landmark building in the City of New York, located on Third
Avenue and 53rd Street in Midtown-Manhattan, New York. It was designed by architects John
Burgee and Philip Johnson (Glass House and Seagram Buildings among other remarkable
works) and its name is due to its original elliptic form and the reddish color of its façade. Its
gross leaseable area is around 57,500 sqm distributed in 34 stories.
As of June 30, 2013, this building had an occupancy rate of 86.2% generating average
revenues above US$ 62.9 per sqm per month.
Lipstick Jun-13 Jun-12 YoY Var
Gross Leaseable Area (sqm) 57,842 58,019 0.3%
Occupancy rate 86.2% 86.3% (0.1)%
Rental price (USD/sqm) 62.9 62.6 0.4%

71
Building located at 183 Madison Avenue, New York, NY
In December 2010, IRSA, through Rigby 183 LLC (“Rigby 183”), in which it indirectly holds a 49%
stake through IMadison LLC (“IMadison”), jointly with other partners, acquired a building located at 183
Madison Avenue, Midtown South, Manhattan, New York. This area involves famous and prominent
buildings such as, the Empire State Building, the Macy’s Herald Square, and the Madison Square Garden
and it also has one of the largest office and store markets, excellent means of transport, restaurants,
stores and entertainment options.
The purchased property consists of a pre-war building built in 1925 designed by the
architecture firm Warren & Wetmore (the same that designed the Grand Central Terminal of
New York). It has 19 office stories for rent and a store on its Ground Floor. The net leaseable
area is approximately 23,200 sqm, 3,523 sqm of which correspond to retail stores and 19,677
sqm are offices.
The total purchase price was US$ 98 million (US$ 4,224 per leaseable sqm) composed
of US$ 48 million of principal (IMadison contributed US$ 23.5 million), US$ 40 million under a
loan granted by M&T Bank at a rate of 5.01% per annum due in 5 years and a loan for US$ 10
million to carry out the capex and prebuilds program.
On November 27, 2012, IRSA increased its interest in Rigby 183 LLC, owner of the
Madison 183 building located in Manhattan, to 74.50%, thus consolidating the results of the
investment in the company’s statement of income.
As of June 30, 2013, the building’s occupancy rate was 98.5%.
Madison Jun-13 Jun-12 YoY Var
Gross Leaseable Area (sqm) 23,489 23,489 0.0%
Occupancy rate 98.5% 91.4% 7.8%
Rental price (USD/sqm) 40.3 36.0 12.1%
Investment in Hersha Hospitality Trust
Hersha is a REIT traded in the New York Stock Exchange, under the "HT" ticker. Hersha’s investments are mainly in institutional hotels located in business hubs, urban and retail centers and secondary tourist destinations and markets mainly along the US Northeast as well as in some select niches in the US West coast. Hersha chooses its acquisitions in locations that it perceives as booming markets and relies on intensive management to create and enhance long-term value added.
On June 17, 2013, IRSA, through its subsidiaries, sold 13,282,218 common shares of
Hersha Hospitality Trust (9,754,486 of which were indirectly owned by IRSA) for a total amount
of approximately USD 73 million (5.5 USD/share).
Accordingly, IRSA’s indirect interest in Hersha decreased from 7.19% to 0.49%. At present, IRSA holds a residual interest of 1,000,000 common shares.
Investment in Supertel Hospitality Inc.
Supertel is a REIT listed in Nasdaq with the symbol “SPPR” and is focused on middle-
class and long-stay hotels, in 21 states in the United States of America, which are operated by

72
various operators and franchises such as Comfort Inn, Days Inn, Hampton Inn, Holiday Inn,
Sleep Inn and Super 8, among others.
In March 2012, IRSA, through its subsidiary Real Estate Strategies, L.P., in which it
holds a 66.8% interest, consummated the transaction for the acquisition of 3,000,000 Series C
convertible preferred shares issued by Supertel Hospitality Inc. (SHI) in an aggregate amount of
US$ 30,000,000, bearing an annual 6.25% preferred dividend and will carry the same voting
rights as common shares.
Furthermore, pursuant to the Agreement, the Investment Company has received
warrants to acquire 30 million additional common shares.
Pursuant to the investment agreements, RES is entitled to appoint up to 4 directors out
of a total number of 9 directors and to exercise preemptive rights over future issues of shares.
As of the date hereof, RES has appointed the 4 directors and holds voting rights in respect of a
34% interest in SHI. Likewise, exercise of the rights of conversion into common shares under
both the preferred shares and warrants is limited to the same percentage.
In addition on August 30, 2013, Supertel filed with the SEC an Offering Circular for the
issuance of up to 16,700,000 common shares.
Subject to a minimum issue amount of USD 100 million, RES promised to convert 2 million
preferred shares into common shares after the relevant adjustments have been made to the
conversion price. As a result of the conversion, assuming that the issue price is USD 6.5 (mean
price in the range of issuance), RES will be holder of approximately 3,076,923 common shares.
In addition, as consideration for the above mentioned conversion, Supertel will issue in the
name of RES 2,500,000 warrants convertible into 2,500,000 common shares for an exercise
price of 110% of their issue price and maturing 5 years after the issue date. These conditions
will also apply to the 3,750,000 warrants currently held by RES.
If RES does not take part in this issue, its voting rights will be reduced to 16.5%.
Competition
Offices and other non-shopping center rental properties
Substantially all of our office and other non-shopping center rentals are located in
developed urban areas. There is a great number of office buildings, shopping malls, retail and
residential premises in the areas where our properties are located. This is a highly fragmented
market, and the abundance of comparable properties in our vicinity may adversely affect our
ability to rent or sell office space and other real estate as well as the sale and rental price of the
properties.

73
In the future, both national and foreign companies may participate in Argentina’s real
estate development market, competing with us for business opportunities. Moreover, in the
future we may participate in the development of real estate in foreign markets, potentially
encountering well established competitors.
Shopping centers
Because most of our shopping centers are located in highly populated areas, there are
competing shopping centers within, or in close proximity to, our targeted areas. The number of
shopping centers in a particular area could have a material effect on our ability to lease space in
our shopping centers and on the amount of rent that we are able to charge. We believe that due
to the limited availability of large plots of land and zoning restrictions in the City of Buenos Aires,
it will be difficult for other companies to compete with us in areas through the development of
new shopping center properties. Our principal competitor is Cencosud S.A. which owns and
operates Unicenter shopping center and the Jumbo hypermarket chain, among others.
The following chart shows certain information relating to the most important owners and operators of shopping centers in Argentina:
Company Shopping Center
Location
(1)
Gross
Leaseable
Area Stores
National GLA
Percentage (2)
Stores
Percentage
(2)
APSA
Abasto de Buenos Aires
(7) CABA 41,440 175 2.26% 2.77%
Alto Palermo Shopping CABA 18,690 146 1.12% 2.31%
Buenos Aires Design (3) CABA 13,746 61 0.82% 0.97%
Dot Baires Shopping (5) CABA 49,719 153 2.98% 2.42%
Paseo Alcorta (4) CABA 52,791 109 0.85% 1.73%
Patio Bullrich CABA 11,683 82 0.70% 1.30%
Córdoba Shopping (4) Córdoba 22,088 105 0.91% 1.66%
Alto Avellaneda (4) GBA 67,897 140 2.21% 2.22%
Mendoza Plaza Shopping
(4) Mendoza 42,238 147 2.53% 2.33%
Alto Rosario (7) Rosario 39,952 146 1.66% 2.31%
Alto Noa (4) Salta 19,141 91 1.15% 1.44%
La Ribera Shopping (6) Santa Fe 8,378 50 0.50% 0.79%
Soleil (4) GBA 24,109 75 0.82% 1.19%
Subtotal 411,872 1,480 18.51% 23.44%
Cencosud S.A.(4)
617,924 1,438 37.07% 22.75%
Other Operators
741,295 3,396 44.45% 53.82%
Total 1,771,091 6,257 100% 100%
(1) “GBA” means Greater Buenos Aires, the Buenos Aires metropolitan area, and “CABA” means the Autonomous City of
Buenos Aires.
(2) Percentage over total shopping centers in Argentina. Figures may not sum due to rounding.
(3) The effective interest held by Alto Palermo S.A., the company that operates the concession of this building, is 53.684% in
ERSA.
(4) Includes total leaseable area occupied by supermarkets and hypermarkets.
Source: Argentine Chamber of Shopping Centers.

74
Indebtedness
The following table shows our indebtedness as of June 30, 2013:
Type of Debt Currency Amount (1) Interest Rate Maturity
Bank overdraft ARS 5.3 Float < 365 d
Cresud’s Tranche IV Series VIII Notes USD 60.0 7.50% Sep-14
Cresud’s Tranche V Series IX Notes(2) ARS 19.9 BADLAR + 300 bps Dec-13
Cresud’s Tranche V Series X Notes (3) USD 61.5 7.75% Jun-14
Cresud’s Tranche V Series XI Notes (4) ARS 14.9 BADLAR + 375 bps Jun-15
Cresud’s Tranche VI Series XII Notes ARS 18.9 BADLAR + 410 bps Nov-14
Cresud’s Tranche VI Series XIII Notes USD 79.4 1.900% May-15
Cresud’s Tranche VII Series XIV Notes USD 32.0 1.500% May-18
Bolivia farms(5) BOB / USD 3.1 5%-7% 2013-2017
Land development financing ARS 3.7 15.01% Dec-15
Banco de La Pampa loan ARS 3.7 Float [10.5% ; 14.5%] Aug-17
Land development financing USD 15.3 LIBOR 6m; floor: 6% Jan-22
Cresud’s Total Debt 317.8
Bank overdraft ARS 27.0 Float < 180 d
IRSA’s Tranche I Series I Notes USD 150.0 8.50% Feb-17
IRSA’s Tranche II Series II Notes (6) USD 150.0 11.50% Jul-20
IRSA’s Tranche III Series III Notes ARS 9.5 BADLAR + 249 bps Aug-13
IRSA’s Tranche III Series IV Notes USD 25.4 7.450% Feb-14
Belmont Madison building mortgage USD 75.0 4.22% Aug-17
IRSA’s Total Debt 436.9
Bank overdraft ARS 51.0 Float < 30 d
Syndicated loan – Arcos ARS 21.9 15.010% Nov-15
Syndicated loan – Neuquén ARS 20.6 15.250% Jun-16
Other Loans ARS 5.4 15.010% Dec-15
APSA’s Tranche I Series I Notes (7) USD 120.0 7.875% May-17
Seller financing USD 13.9 5.000% Jul-17
APSA’s Total Debt 232.8
Brasilagro’s Total Debt 46.7
Total Consolidated Debt 1,034.2
Consolidated cash 118.9
Repurchase of Debt 20.1
Net Consolidated Debt 895.2
1 Principal face value in USD (million) at an exchange rate of 5.387 ARS = 6.910 BOB = 2.222 BRL = 1 USD, without considering
accrued interest or elimination of balances with subsidiaries.
2 As of June 30, 2013 the Company had repurchased a face value of ARS 9.0 million.
3 As of June 30, 2013 the Company had repurchased a face value of USD 0.7 million.
4 As of June 30, 2013 the Company had repurchased a face value of ARS 21.0 million.
5 Purchase of farms in Bolivia by Acres del Sud.
6 As of June 30, 2013 the Company had repurchased a face value of USD 3.9 million.
7 As of June 30, 2013 the Company had repurchased a face value of USD 10.0 million.
Issue of Notes
On May 22, 2013, the seventh tranche of Simple Series XIV Notes was issued, pursuant to the
following conditions:
Issue Amount: USD 32 million, equivalent to ARS 167.5 million

75
Issue Price: 100% of face value
Stated Maturity Date: 60 months from the issue date
Fixed interest rate: 1.50%
Interest Payment Dates: quarterly, beginning on August 22, 2013
Principal Payment Dates: November 22, 2017 and May 22, 2018
Off balance sheet arrangements
At present we have no off-balance sheet arrangements or significant transactions with
unconsolidated entities that are not reflected in our consolidated financial statements. All our
interests and/or relationships with our subsidiaries or companies under common control are
recorded in our consolidated financial statements.

76
Subsequent Events
IRSA
Repurchase of shares
IRSA’s Board of Directors has resolved to start a process for the repurchase of treasury stock
until June 30, 2014, under the terms of Section 64 of Law No. 26,831 and the rules issued by
the CNV. The purchases will be made with liquid and realized profits and freely available
reserves of the Company, for up to ARS 200.0 million or up to 5% of the Company’s capital
stock, in the form of shares or Global Depositary Shares representing 10 shares each. The daily
trading limit will be 25% of the daily average trading volume of the Company’s shares in all the
markets where they are listed, during the previous 90 business days.
Banco Hipotecario Dividends
The general ordinary shareholders’ meeting of Banco Hipotecario S.A. approved the distribution
of cash dividends for ARS 30.0 million to its common shares, accrued for the fiscal year ended
December 31, 2012. Given its shareholding interest, IRSA will receive the sum of ARS 9.2
million.
Investment in Avenida
Through our subsidiary APSA, we have subscribed for 3,703,704 shares of Avenida Inc.,
representing 23.08% of its stock capital. Avenida Inc. will be engaged in the e-commerce
business. The transaction price was fixed in ARS 13.0 million, which have been fully paid. APSA
has the option to increase its interest to 33.33% of the company.
Supertel Offering Circular
Supertel filed with the SEC an Offering Circular for the issuance of up to 16,700,000 common
shares.
Subject to a minimum issue amount of USD 100 million, IRSA, acting through RES, promised to
convert 2 million preferred shares into common shares after the relevant adjustments have been
made to the conversion price. As a result of the conversion, assuming that the issue price is
USD 6.5 (mean price in the range of issuance), RES will be holder of approximately 3,076,923
common shares. In addition, as consideration for the above mentioned conversion, Supertel will
issue in the name of RES 2,500,000 warrants convertible into 2,500,000 common shares for an
exercise price of 110% of their issue price and maturing 5 years after the issue date. These
conditions will also apply to the 3,750,000 warrants currently held by RES.
If RES does not take part in this issue, its voting rights will be reduced to 16.5%.
Subscription of Shares in Dolphin Fund Ltd. (“Dolphin”)
After year-end, IRSA subscribed, through its subsidiaries Tyrus and Ritelco, shares of Dolphin
for USD 75 million.
Since 1996 we hold investments in Dolphin, a company that acts as an open investment fund
whose investment purpose is to achieve long-term capital appreciation. In this sense, it focuses
its investments in opportunities that offer capital gain potential. The investment philosophy is

77
based on the identification of value and potential for growth still not detected and it seeks to
anticipate trends in both emerging and developed markets.

78
Management’s Discussion and Analysis of Financial Condition and Results of
Operations
Consolidated Operating Results
The following management’s discussion and analysis of our results of operations should be read
together with our consolidated financial statements and related notes. This discussion and
analysis contains forward-looking statements that involve risks, uncertainties and assumptions.
These forward-looking statements include such words as “expect”, “anticipate”, “intend”,
“believe” and similar language. Our actual results may differ materially from those anticipated in
these forward-looking statements as a result of many factors, including without limitation those
set forth elsewhere in the Annual Report and Consolidated Financial Statements.
For purposes of the following discussion and analysis, unless otherwise specified, references to
fiscal years 2013 and 2012 relate to the fiscal years ended June 30, 2013 and 2012,
respectively.
We maintain our accounting books and records in Pesos. The consolidated financial statements
as of June 30, 2013 and 2012 have been prepared in accordance with the accounting policies
based on the IFRS issued by the IASB and the interpretations issued by the IFRIC applicable as
of such date.
Factors affecting Comparability
Purchase and Sale of Farms
Our strategy includes the identification, acquisition, exploitation and selective disposition of
rural properties that have attractive prospects for long-term value appreciation. As part of this
strategy, from time to time we purchase and sell farms. The acquisition or disposition of farms
in any given period may make the production results of that period difficult to compare to those
of other periods.
Seasonality
As is the case with any company in the agro-industrial sector, our business activities are
inherently seasonal. Harvest and sales of grains (corn, soybean and sunflower) in general take
place from February to June. Wheat is harvested from December to January. With respect to
our international market, in Bolivia climate conditions allow a double season of soybean, corn
and sorghum production and, accordingly, these crops are harvested in April and October, while
wheat and sunflower are harvested during August and September, respectively. Other
segments of our activities, such as our sales of cattle and milk and our forestry activities, tend to
be more of a successive character than of a seasonal character. However, the production of
beef and milk is generally higher during the second quarter, when pasture conditions are more
favorable. In consequence, there may be significant variations in results from one quarter to the
other.
Revenue Recognition
We derive our revenues primarily from:

79
(i) the production and sale of crops, sugarcane, beef cattle and milk,
(ii) cattle feedlot operations,
(iii) leasing of our farms from third parties;
(iv) commodity brokerage activities; and
(v) through the consolidation of our financial statements with IRSA's, we record revenue from the rental and operation of services at offices and shopping centers in Argentina, the development and sale of properties, consumer finance transactions, and hotel operations.
Revenues from sales of goods are recognized when: (a) any significant risks and rewards of
ownership of such goods have been transferred; (b) the entity is no longer related to the
management of the assets sold and neither does the entity retain control over them; (c) the
amount of the revenues and costs associated to the transaction can be reliably measured; and
(d) there is a likelihood that the entity will receive the economic benefits associated to the
transaction.
The revenues arising from the supply of services are recognized when (a) the amount of the
revenues and costs associated to the services can be reliably measured; (b) there is a likelihood
that the entity will receive the economic benefits associated to the transaction, and (c) the
degree of progress of the service can be reliably measured.
Agriculture and Cattle Raising Business
The revenues from the agriculture and livestock business activities originate mainly in sales of
both agricultural and livestock products and biological assets, in the supply of different services
related to agribusiness and in the lease of agricultural land.
Revenues from sales are accounted for when the agricultural products or the biological assets
are delivered and the customers acquire ownership and assume the associated risks, all of
which habitually happens when the products are either received, or directly picked up by
customers, the collection of receivables is likely and the value of revenues may be reliably
measured. Net sales of agricultural products represent the amount billed, net of discounts and
bonuses, if any.
Besides, there is the supply of different services associated to the agricultural and livestock
breeding business (including, though not limited to, irrigation and feedlot services) as well as
brokerage services. Revenues from services are accounted for when the services are rendered.
We also lease land to third parties in the framework of operating leases. Revenues from leases
are accounted for using the straight-line method throughout the lease period.
Urban Properties and Investments Business
Our revenues derive basically from leasing and operating space in offices and shopping centers
in Argentina, developing and selling properties, financing consumption and operating hotels.
This section reflects our policies concerning revenue recognition as well as the policies of our
subsidiaries, both those in which we have a controlling stake and those in which we have joint
control.

80
Sales and Developments
Revenues from the development and sales of real estate include mainly the revenues from the
sale of properties held for sale. The revenues from the sale of real estate are booked when the
significant risks and rewards of ownership have been transferred to the buyer. This usually
happens when the purchase and sale deeds are signed and when the transaction is not subject
to conditions (except when the expectation is that the payment or completion will significantly
occur after such exchange). When sales are subject to conditions, it is only when the conditions
are satisfied that the sales are booked.
We apply the IFRIC 15 “Agreements for the Construction of Real Estate'”. The IFRIC 15 lays
down the guidelines to decide which standard to apply when accounting for the construction of
real estate, that is the IAS 11 “Construction Contracts ” or the IAS 18 “Revenue”. IFRIC 15
interprets that an agreement satisfies the requirements to be considered a construction contract
under IAS 11 when the buyer is in a position to specify the main structural elements of the
design of the property before or during the works. Besides, IFRIC 15 interprets that an
agreement is for the sale of goods within the scope of IAS 18 when the construction works is
conducted independently from the agreement and the buyer only has limited influence on the
design. The Group analyzed the nature of its agreements and determined that they fall within
the scope of IAS 18. Therefore, the Group recognizes revenues associated to the sale of
residential homes and commercial units when the legal conveyance takes place according to
IAS 18.
We also generally conduct barter transactions where we exchange plots of land for properties to
be built on them with third-party developers for future units that are an integral part of the
planned buildings. At times, the Group also receives cash as a part of the transaction. The title
deed to the plots of land that are bartered, together with the risks and rewards associated to
them, are transferred to the developer at the time of the sale. The Group generally demands
that the developer should post surety bonds or raise mortgages over the plot of land in favor of
the Group to guarantee performance. If the developer does not meet his duties, the Group
forecloses on the mortgage or demands compensation on the surety bond, together with a cash
penalty.
The Group determines that its barters are in a commercial nature and that the conditions for
recognizing income from the transfer of the plots have been satisfied at the time of execution of
the barter transaction. Revenues are recognized at the fair value of the property delivered,
adjusted by the cash amount received, if any. In exchange for the land assigned, the Group
receives cash, if any, and a receivable in kind. Such receivable in kind is initially recognized at
fair value but it is not adjusted in subsequent fiscal years. The receivable in kind is classified as
Property held for sale in the financial statements.
The Group may sell residential units to third-party buyers once they are finished and have been
transferred by the developer. In these cases, the revenues from these transactions are
recognized when the significant risks and rewards of ownership have been actually transferred
to the buyer. This normally happens when the title deed to the property is drawn up.
However, the Group may start to sell the residential units during the construction period or even
before the construction period starts. In these cases, buyers generally make an initial payment
to the Group, with the outstanding balance being paid at the time when the unit sold to the buyer
is actually delivered. In these cases, it is only when the units have been transferred to the

81
buyers and the title deeds are signed, in other words, at the time of the legal closing, that the
revenues from these sales are booked. And the reason for this is that in the event of the
developer failing to complete the residential units, and thus, failing to deliver them to the buyer,
the Group will be contractually bound to reimburse the buyer for any initial payment received
plus a fine. The Group may then institute legal proceedings against the developer on grounds of
defaulting on the agreement. The Group considers that the most significant risk associated to
the asset held by the Group (that is, the right to receive the units) is non-performance by the
developer (that is, failure to complete the construction of the units) which risk is not been
transferred to the buyers at the moment when the initial payment is received.
Office buildings and other leases and services
Revenues from office and other property rentals include mainly the revenues from office rentals
in the form of operating leases, revenues from services and the expenses recovered from
lessees.
Revenues from the rental of offices and other properties assigned in lease under operating
leases are recognized in the statement of income using the straight-line method for the duration
of such operating leases. When incentives are conferred, these are accounted for as a part of
consideration for the use of the property and are therefore recognized by application of the
straight-line method.
Contingent leases are booked as income in the periods in which they are collected. Rental
increases are booked when they are agreed upon with the lessees.
Lease agreements also stipulate that the common area maintenance expenses associated to
the Group’s buildings and other rental properties are to be borne by the lessees, generally in a
percentage proportion. Common area maintenance expenses comprise all those expenses that
are necessary or advisable to operate, maintain, manage, safeguard, preserve, repair,
supervise, cover with insurance and perfect the Group’s rental buildings and properties. It is the
Group who carries out management functions over its rental properties. The Group assumes
responsibility for initially paying these expenses, which are subsequently recovered from
lessees. The Group considers that it acts as principal in these cases. Revenues for these items
are recognized when the services are supplied and are included within revenues from rentals
and services, though separate from common area maintenance expenses. These expenses are
charged to the statement of income as soon as they are incurred.
Shopping center leases and services
The revenues derived from the businesses conducted in the Group’s shopping centers mainly
comprise revenues from retail store rentals in the form of operating leases, admission fees,
commissions and revenues from the different services rendered to the Group’s lessees.
Pursuant to the Argentine Law No. 23,091, as amended by Law No, 24,808, the “Law of
Leases”, all lease agreements within its scope can be cancelled. Pursuant to the Law of Leases,
no lease can be terminated during the first six months of the agreement, and once this term has
expired, lessees are entitled to cancel their leases at any time subject to a previous notice
served on the lessors. The payments for cancellation prescribed by the law to compensate
lessors are equivalent to a month and a half’s rental if the agreement is terminated during the
first year of the lease and a month’s rental if they are terminated after the first year.

82
The Group analyzed the definition of the lease term under IAS 17, which lays down that a
noncancellable lease is a lease that can be cancelled only (a) in the event of any remote
contingency, (b) when the lessor has given permission, (c) if the lessee enters into a new lease
with the same lessor, or (d) when the lessee pays an additional amount at the inception of the
lease that results in assuming that lease continuity is reasonably certain.
The Group has determined that in all operating leases, the term of the lease for accounting
purposes coincides with the lease term. The Group concluded that in spite of the ability to
cancel leases contemplated by the law, lessees would incur significant economic penalties and
other setbacks if their leases were cancelled prior to their expiration dates. The Group considers
that the scope of these setbacks is such that lease continuity on the part of lessees is
reasonably certain at the inception of the lease. The Group drew this conclusion in view of
factors such as (i) the strategic geographical location of the Group’s investment properties; (ii)
the characteristics of lessees (most of whom are locally and internationally renowned chain
stores), (iii) the limited availability of similar spaces in areas where the Group has its investment
properties; (iv) lessees’ brand images and other competition-related aspects; (v) the significant
expenses incurred by lessees to renew, maintain and improve the spaces rented for them to
reflect the lessee’s own image; and (vi) that most of the Group’s lessees only have shopping
center outlets with only a few, or sometimes without, stores at the street level.
Lessees at shopping centers are generally bound to pay a lease that consists in the highest of:
(i) a basic monthly rental (the "Base Rent"), and (ii) a specific percentage of monthly gross retail
sales of the lessee (the "Percentage Rent") (which generally ranges from 4% to 10% of gross
sales of the lessee). In addition, pursuant to the rental indexation clause in most leases, the
lessee's Base Rent is generally increased between 7% and 12% per year during the term of the
lease.
Besides, certain lease agreements include provisions that set forth variable rentals based on
specific sales volumes or some other type of index.
The revenues derived from rentals of stores and other spaces in shopping centers in the form of
operating leases with scheduled rental increases are recognized on a straight-tine basis over
the term of those leases. Any incentives conferred by the Group to the lessees, if any, are
recognized as reductions in the revenues from rentals on a straight-line basis over the term of
the lease.
Contingent rentals, that is, the rentals whose prices are not pre-established and may not be
determined at the inception of the lease, are recognized as revenues in the periods in which
they are known and can be determined. The increases in rentals are accounted for at the time
they are agreed upon with the lessees.
Lessees at the Group’s shopping centers generally pay a non-reimbursable admission fee at the
time they sign a lease agreement or when they renew an existing agreement. These admission
fees are considered as additional revenues from rentals and are recognized in the statement of
income on a straight-line basis over the term of the respective lease agreements.
The Group also acts as a real estate broker in negotiating and entering into the lease
agreements for its shopping centers: it therefore receives commissions when acting in such
capacity. A transaction is deemed to have been successful when both parties have signed the
respective lease agreement. Commissions are considered to be additional revenues from
83
rentals and are recognized in the statement of income on a straight-line basis over the term of
the respective lease agreement.
Lease agreements also stipulate that the common area maintenance expenses associated to
the Group’s shopping centers are to be borne by the lessees, generally in a percentage
proportion. Common area maintenance expenses comprise all those expenses that are
necessary or advisable to operate, maintain, manage, safeguard, preserve, repair, supervise,
cover with insurance and perfect the Group’s shopping centers. It is the lessor who determines
whether it is necessary or advisable to incur a given common area maintenance expense. The
Group assumes responsibility for initially paying these expenses, which are subsequently
recovered from lessees. The Group considers that it acts as principal in these cases.
Revenues for these items are included within revenues from rentals and services, though
separate from common area maintenance expenses. These expenses are charged to the
statement of income as soon as they are incurred.
Pursuant to the lease agreements, lessees are also obligated to participate in Common
Advertising Funds (“FPC”, as per its Spanish acronym) aimed at providing for the Group’s
advertising and promotional activities. Participation in these funds generally comprises a
percentage calculated over the lease prices accrued every month. Revenues for these items are
equally included within revenues from rentals and services, though separate from advertising
and promotional expenses. These expenses are charged to the statement of income as soon as
they are incurred.
Besides, revenues from shopping centers also include revenues from management and other
services, such as parking lots. These revenues are recognized in profit and loss for the year
when the services are rendered.
Hotels
Revenues from hotel operations include mainly room services, catering and other services.
Revenues from the sale of products at hotels are accounted for when the products are delivered
and any significant risks and rewards of ownership are transferred to the buyer. Any revenues
derived from sales of services are recognized at the time of rendering the service. All other
revenues are booked on an accrual basis.
Segment Reporting
IFRS 8 mandates that entities should present financial and detailed information on its reportable
segments, which are operating segments or aggregations of operating segments that meet
specified criteria. Operating segments are components of an entity over which there is
separately available financial information that is reviewed regularly by the Group’s Executive
Committee (the entity's chief operating decision maker when it comes to day-to-day decisions,
without prejudice to the powers and duties of the Board in its role as the Group’s management
body) to make decisions about how to allocate resources and assess segment performance.
The Executive Committee evaluates the businesses based on the differences in the nature of
their products, operations and risks. The amount reported for each segment item is the
measurement relayed to the Executive Committee and subsequently reported to the highest-
ranking decision maker in the Group’s management, that is, the Board of Directors, to this end.
The actions taken by the Board are then evaluated by the Shareholders’ Meeting in its role as
the Group’s governance body.

84
Any operating segments identified are presented as reportable segments if any of the following
quantitative thresholds are reached:
its reported revenue, from both external customers and intersegment sales or transfers,
is 10 per cent or more of the combined revenue, internal and external, of all operating
segments; or
the absolute measure of its reported profit or loss is 10 per cent or more of the greater, in
absolute amount, of
o the combined reported profit of all operating segments that did not report a loss
and
o the combined reported loss of all operating segments that reported a loss;
or its assets are 10 per cent or more of the combined assets of all operating segments
Additionally, any operating segments that do not reach any of the preceding quantitative
thresholds could be considered to be reportable segments if the Group’s Management
estimates that said information could be useful to the users of its financial statements.
If, having determined reportable segments in accordance with the preceding quantitative
thresholds, the total external revenues attributable to these segments total less than 75% of the
Group’s total consolidated external revenues, additional segments will be identified as
reportable segments even when the preceding quantitative thresholds are not reached up and
until at least 75% of the Group’s total consolidated external revenues are included in the
reportable segments. Once 75% of the Group’s total consolidated external revenues are
included as reportable segments, the rest of the operating segments are included in the column
“Other”.
Segment-based reports have been prepared and classified in accordance with the different
types of businesses in which the Group conducts activities.
Agriculture and Cattle Raising business
We are primarily engaged in agricultural operations which are subject to risk, including market prices, weather conditions and environmental concerns. From time to time, we sell properties to profit from real estate appreciation opportunities and which, in the judgment of management, are surplus to the Company’s primary operations.
During the fiscal years ended June 30, 2013 and 2012, our principal operations were carried out in Argentina, our country of domicile, Brazil, Bolivia and Paraguay.
We conduct business in eight business segments, organized primarily on a product line and geographical area basis, with each segment offering a variety of different but interrelated products:
Grains
This segment includes activities related to planting, harvesting and sale of cereals such as wheat, corn, soybean, cotton and sunflower. The Group is focused on the long-term yield of the land, seeking to maximize its use by means of crop rotation and the use of different technologies and techniques. In this way, the type and quantity of grains that are harvested varies from one farming season to another.

85
Beef cattle
This segment consists of the purchase and/or fattening of cattle herds in natural pastures for sale to meat packing plants and local beef cattle markets.
Milk
This segment consists of the breeding and/or purchase of milking cows for the production of milk for sale to local producers of milk and dairy products.
Sugarcane
This segment consists in the planting, harvesting and sale of sugarcane.
Leases and Agricultural Services
This segment includes the provision of agricultural services (for example, irrigation) and the lease of farms owned by the Group to third parties.
Sale and Transformation of Lands
This segment comprises the results generated by the sale of farms and land development activities.
Agro-industrial Activities
This segment consists in the fattening of beef cattle in feedlots for own or third-party slaughterhouses. Feedlot cattle breeding requires specific care and diets that differ from those applicable to natural grass-fed beef cattle breeding. This activity represents a distinct operating segment due to the special features of the feedlot system and its integration with industrialized beef processing.
Other
This segment includes the remaining operating segments that do not reach the quantity thresholds required for individual disclosure and comprises, inter alia, brokerage services.
Urban Properties and Investments Business
We have determined that the reportable business units are those based on management information generated by the Group. Consequently, we have six reportable business units. These units are: "Shopping Centers", "Offices”, "Sales and Developments", "Hotels", “International” and "Financial Transactions and Other".
Below is a general description of each segment:
Shopping Centers
This segment includes the results from the activities related to the commercial operation and development of shopping centers, originated mainly in the lease of and provision of lease-related services to retail stores and other spaces in the Group’s shopping centers.
Offices
This segment includes mainly the Group’s operating results from the lease of office spaces and the supply of services related to this activity.
Sales and Developments

86
This segment includes both the results from the sale of land reserves and/or real properties for sale and the results originated in their development and maintenance.
Hotels
This segment comprises the activities developed by the Group’s hotels, primarily composed of revenue from accommodation, catering services and restaurants.
International
This segment includes the results from investments in equity investees that operate mainly in the United States, related to the lease of office buildings and hotels in such country.
Financial Transactions and Other
This segment basically includes the financial activities carried out through the Group’s equity investees, Banco Hipotecario S.A. and Tarshop S.A., among others.
Results of Operations of the Agriculture and Cattle Raising Business
The following terms used herein have the meanings specified below:
Production Income
We recognize production income when there is a change in biological assets. For example, we recognize production income when crops are harvested or a cow is born or gains a certain amount of weight. Biological assets are unharvested crops, heads of cattle and dairy cows. Agricultural produce such as harvested crops, beef and milk are the harvested product of biological assets.
Cost of Production
Our cost of production consists of costs directly related to the transformation of biological assets and agricultural produce.
Sales
Our sales consist of revenue on the sales of crops, milk and cattle beef. Sales are recognized when persuasive evidence of an arrangement exists, delivery has occurred, the price is fixed or determinable and collectibility is reasonably assured. Revenue from cattle feeding operations, primarily comprised of feeding, animal health and yardage, and revenue from operating leases and brokerage activities are recognized as services are performed.
Cost of Sales
Our cost of sales consists of:
(i) the book value of the product sold at the time of sale; and
(ii) certain direct costs related to the sales of agricultural produce other than selling expenses.
Gain (loss) from inventory holding
Our gain (loss) from holding inventories and biological assets (livestock) consists of changes in their carrying amount.

87
Management’s Discussion of Results
Fiscal year ended June 30, 2013 compared to fiscal year ended June 30, 2012
Revenues
Total sales revenues of the Group increased 22.8% from ARS 2,990.2 million for fiscal year
2012 to ARS 3,671.2 million for fiscal year 2013. This was mainly due to a 25.04% increase in
the Agriculture and Cattle Raising business, from ARS 1,077.9 million in fiscal year 2012 to
ARS 1,347.8 million in fiscal year 2013 and a 21.5% increase in the Urban Properties and
Investments business, from ARS 1.912.4 million in fiscal year 2012 to ARS 2,323.4 million in
fiscal year 2013.
Agriculture and Cattle Raising Business
Sales revenues increased 25.04%, from ARS 1,077.9 million in fiscal year 2012 to ARS 1,347.8
million in fiscal year 2013. This was due to an increase of ARS 114.1 million in the Grains
segment, an increase of ARS 8.7 million in the Milk segment, an increase of ARS 61.4 million in
the Sugarcane segment, an increase of ARS 5.5 million in the Leases and Services segment,
an increase of ARS 107.7 million in the Agro-industrial Activities segment and an increase of
ARS 28.2 million in the Other segment, offset by a ARS 55.6 million reduction in the Beef cattle
segment.
Grains
Sales revenues from the Grains segment rose 17.9%, from ARS 636.1 million in fiscal year
2012 to ARS 750.2 million in fiscal year 2013, mainly as a result of:
a 21.0% increase in average prices of grains sold, from ARS 1,191 per ton in fiscal year
2012 to ARS 1,440 per ton in fiscal year 2013;
partially offset by a slight reduction of 13,509 tons in the volume of grains sold in fiscal
year 2013 compared to the previous fiscal year; and
a 8.0% reduction in production volume, from 383,088 tons in fiscal year 2012 to 355,390
tons in fiscal year 2013.
The following table shows a breakdown of the sales of grains:
Sale of Grains (in tons)
Fiscal Year ended June 30,
2013
2012
Variation
Corn
271,144 224,114 47,030
Soybean
208,814 251,639 (42,826)
Wheat 10,735 20,749 (10,011)
Sorghum 5,807 8,497 (2,690)
Sunflower
10,551 18,095 (7,545)
Other 14,052 11,519 2,533
Total Sales
521,102 534,611 (13,509)
Beef Cattle
Sales revenues from the Beef Cattle segment decreased 42.0%, from ARS 132.3 million in fiscal
year 2012 to ARS 76.7 million in fiscal year 2013, mainly as a result of:
88
a 4.7% reduction in the average price per kilogram sold, from ARS 8.92 in fiscal year
2012 to ARS 8.49 in fiscal year 2013;
a 35.4% reduction in the beef sales volume, from 15,075 tons in fiscal year 2012 to
9,745 tons in fiscal year 2013; and
a 14.1% reduction in the volume of beef production, from 9,045 tons in fiscal year 2012
to 7,772 tons in fiscal year 2013.
Milk
Sales revenues from the Milk segment increased 28.7%, from ARS 30.2 million in fiscal year
2012 to ARS 38.8 million in fiscal year 2013, mainly as a result of:
a 19.8% increase in the average price of milk, from ARS 1.69 per liter in fiscal year 2012
to ARS 2.02 per liter in fiscal year 2013;
a 11.5% increase in milk production volume, reflecting mainly a larger average number
of milking cows;
partially offset by a 4.7% reduction in production efficiency levels.
Sugarcane
Sales revenues from the Sugarcane segment increased 62.1%, from ARS 98.9 million in fiscal
year 2012 to ARS 160.2 million in fiscal year 2013, mainly as a result of:
543,541 more tons of sugarcane sold in fiscal year 2013 as compared to the previous
fiscal year (mainly because during fiscal year 2012 no sales were made in our
subsidiaries from Bolivia);
a 100.8% increase in production volume, from 576,048 tons in fiscal year 2012 to
1,156,848 tons in fiscal year 2013;
partially offset by a 12.6% reduction in the average sales price of sugarcane, from ARS
155 per ton in fiscal year 2012 to ARS 136 per ton in fiscal year 2013.
Leases and Services
Sales revenues from the Leases and Services segment increased by 21.8%, from ARS 25.3
million in fiscal year 2012 to ARS 30.8 million in fiscal year 2013, mainly as a result of:
a 12.0% increase in leases, from ARS 19.9 million in fiscal year 2012 to ARS 22.3 million
in fiscal year 2013; and
an increase of 57.6% in irrigation services and other agricultural services, from ARS 5.4
million in fiscal year 2012 to ARS 8.5 million in fiscal year 2013.
Agro-industrial Activities
Sales revenues from the Agro-industrial Activities segment increased 107.6%, from ARS 100.1
million in fiscal year 2012 to ARS 207.8 million in fiscal year 2013, mainly as a result of:
a 110.2% increase in sales from our meat packing plant due to the acceleration in
slaughtering levels during the first half of fiscal year 2013. It should be noted that during
the second half of fiscal year 2012 the plant had been inactive. During fiscal year 2013
44,202 heads were slaughtered, virtually doubling the output for the previous fiscal year

89
as concerns own animals and totaling more than 7,600 heads from users of our
slaughtering service. During fiscal year 2012 alone, 662 heads were slaughtered under
this pattern;
during the last two months of fiscal year 2013, the sales prices of sub products recorded
a sustained increase which, added to the firm appreciation of the exchange rate and the
sustained rise in slaughtering volumes, led to the above mentioned increase;
offset by a decrease of 19.3% in revenues from sales in our feedlot facility, mainly
reflecting the 71.5% reduction in average occupancy, from 4,400 heads in fiscal year
2012 to 1,252 heads in fiscal year 2013.
Other
Sales revenues from the Other segment increased by 51.3%, from ARS 55.1 million in fiscal
year 2012 to ARS 83.3 million in fiscal year 2013, mainly due to:
an increase of ARS 18.8 million in resales of supplies and others; and
an increase of ARS 9.4 million in commodity brokerage services.
Urban Properties and Investments Business
Sales revenues from the Urban Properties and Investments business increased 21.5%, from
ARS 1,912.4 million in fiscal year 2012 to ARS 2,323.4 million in fiscal year 2013. This was
mainly due to an increase of ARS 300.8 million in the Shopping Centers segment, an increase
of ARS 37.9 million in the Offices segment, an increase of ARS 55.8 million in the Hotels
segment and an increase of ARS 40.9 million in the International segment, partially offset by a
reduction of ARS 20.8 million in the Sales and Developments segment and of ARS 3.6 million in
the Financial Transactions and Other segment.
Costs
Total costs of the Group increased 25.8%, from ARS 2,576.9 million in fiscal year 2012 to ARS
3,241.3 million in fiscal year 2013. This was mainly as a result of a 27.0% increase in the
Agriculture and Cattle Raising business, from ARS 1,605.3 million in fiscal year 2012 to ARS
2,038.2 million in fiscal year 2013 and a 23.8% increase in the Urban Properties and
Investments business from ARS 971.7 million in fiscal year 2012 to ARS 1,203.1 million in fiscal
year 2013.
Agriculture and Cattle Raising Business
Total costs increased 27.0%, from ARS 1,605.3 million in fiscal year 2012 to ARS 2,038.2
million in fiscal year 2013. This was caused mainly by an increase of ARS 176.0 million in the
Grains segment, an increase of ARS 17.0 million in the Milk segment, an increase of ARS 134.3
million in the Sugarcane segment, an increase of ARS 9.5 million in the Leases and Agricultural
Services segment, an increase of ARS 1.0 million in the Sale and Transformation of Lands
segment, an increase of ARS 87.6 million in the Agro-industrial Activities segment and an
increase of ARS 25.1 million in the Other segment, slightly offset by a reduction of ARS 17.6
million in the Beef Cattle segment.
Grains
Costs from the Grains segment increased 16.7%, from ARS 1,051.9 million for fiscal year 2012
to ARS 1,227.8 million for fiscal year 2013. Costs from the Grains segment are detailed in the
following table:

90
Thousands of ARS
06/30/2013 06/30/2012
Cost of sales 626,922 554,220
Cost of production 600,910 497,647
Total Costs 1,227,832 1,051,867
The cost of sales from the Grains segment increased 13.1%, from ARS 554.2 million in fiscal
year 2012 to ARS 626.9 million in fiscal year 2013, mainly as a result of:
a 16.1% increase in the average cost per ton of grain sold in fiscal year 2013, from ARS
1,037 in fiscal year 2012 to ARS 1,203 in fiscal year 2013, mainly as a result of the
higher average market prices of grains; and
slightly offset by a 2.5% reduction in the volume of tons sold as compared to the
previous fiscal year.
The cost of sales as a percentage of sales was 87.1% in fiscal year 2012 and 83.6% in fiscal
year 2013.
The cost of production from the Grains segment increased 20.8% from ARS 497.6 million in
fiscal year 2012 to ARS 600.9 million in fiscal year 2013, mainly as a result of:
a 20.1% increase in direct production costs during this fiscal year as compared to the
previous one, mainly reflecting higher prices of leases and supplies used (agrochemicals
and seeds);
slightly offset by lower production volumes in fiscal year 2013 as compared to fiscal year
2012; and
a smaller number of hectares in operation in own farms in fiscal year 2013 as compared
to fiscal year 2012.
Total cost of production per ton increased 30.2%, from ARS 1,299 in fiscal year 2012 to ARS
1,691 in fiscal year 2013, mainly as a result of higher direct costs of production and lower yields
per hectare in fiscal year 2013 as compared to fiscal year 2012.
Beef Cattle
Costs of the Beef Cattle segment decreased 10.8%, from ARS 163.5 million for fiscal year 2012
to ARS 145.9 million for fiscal year 2013. The following table shows the costs from the Beef
Cattle segment:
Thousands of ARS
06/30/2013 06/30/2012
Cost of sales 74,064 123,974
Cost of production 71,876 39,557
Total Costs 145,940 163,531
The cost of sales from the Beef Cattle segment decreased 40.3%, from ARS 124.0 million in
fiscal year 2012 to ARS 74.1 million in fiscal year 2013, mainly as a result of:
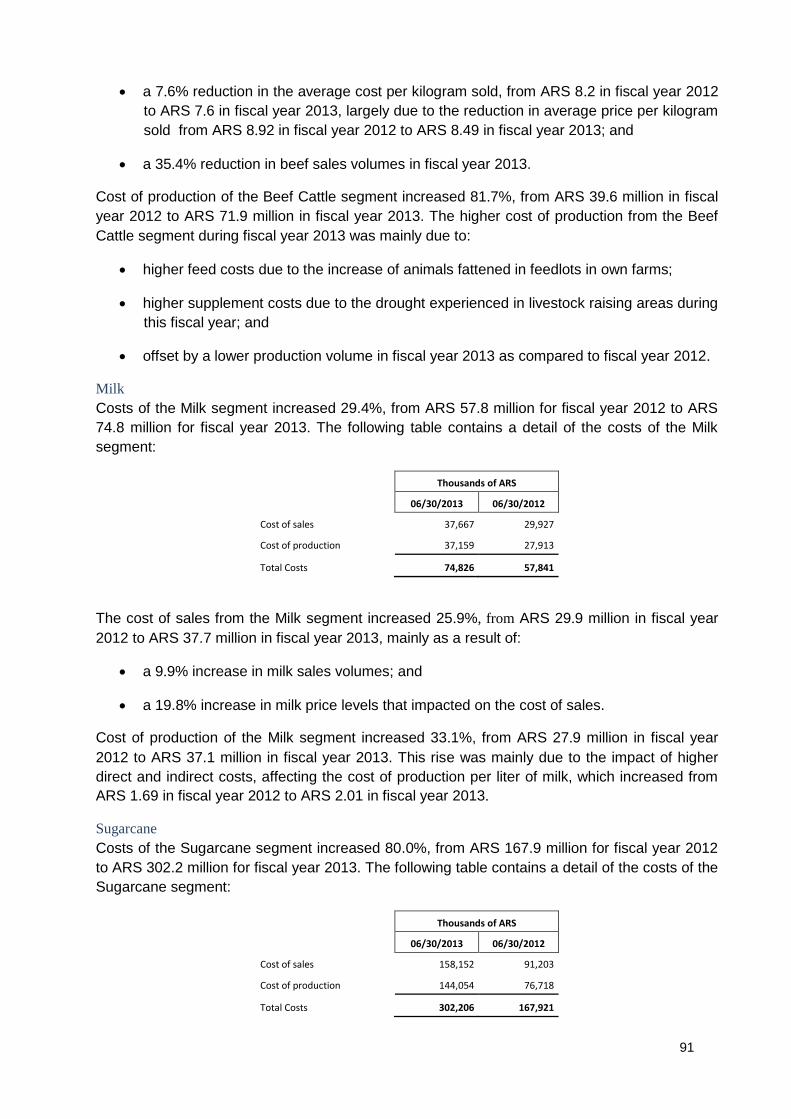
91
a 7.6% reduction in the average cost per kilogram sold, from ARS 8.2 in fiscal year 2012
to ARS 7.6 in fiscal year 2013, largely due to the reduction in average price per kilogram
sold from ARS 8.92 in fiscal year 2012 to ARS 8.49 in fiscal year 2013; and
a 35.4% reduction in beef sales volumes in fiscal year 2013.
Cost of production of the Beef Cattle segment increased 81.7%, from ARS 39.6 million in fiscal
year 2012 to ARS 71.9 million in fiscal year 2013. The higher cost of production from the Beef
Cattle segment during fiscal year 2013 was mainly due to:
higher feed costs due to the increase of animals fattened in feedlots in own farms;
higher supplement costs due to the drought experienced in livestock raising areas during
this fiscal year; and
offset by a lower production volume in fiscal year 2013 as compared to fiscal year 2012.
Milk
Costs of the Milk segment increased 29.4%, from ARS 57.8 million for fiscal year 2012 to ARS
74.8 million for fiscal year 2013. The following table contains a detail of the costs of the Milk
segment:
Thousands of ARS
06/30/2013 06/30/2012
Cost of sales 37,667 29,927
Cost of production 37,159 27,913
Total Costs 74,826 57,841
The cost of sales from the Milk segment increased 25.9%, from ARS 29.9 million in fiscal year
2012 to ARS 37.7 million in fiscal year 2013, mainly as a result of:
a 9.9% increase in milk sales volumes; and
a 19.8% increase in milk price levels that impacted on the cost of sales.
Cost of production of the Milk segment increased 33.1%, from ARS 27.9 million in fiscal year
2012 to ARS 37.1 million in fiscal year 2013. This rise was mainly due to the impact of higher
direct and indirect costs, affecting the cost of production per liter of milk, which increased from
ARS 1.69 in fiscal year 2012 to ARS 2.01 in fiscal year 2013.
Sugarcane
Costs of the Sugarcane segment increased 80.0%, from ARS 167.9 million for fiscal year 2012
to ARS 302.2 million for fiscal year 2013. The following table contains a detail of the costs of the
Sugarcane segment:
Thousands of ARS
06/30/2013 06/30/2012
Cost of sales 158,152 91,203
Cost of production 144,054 76,718
Total Costs 302,206 167,921

92
Cost of sales from the Sugarcane segment increased 73.4%, from ARS 91.2 million in fiscal
year 2012 to ARS 158.2 million in fiscal year 2013, mainly as a result of:
a 85.4% increase in the volume of tons sold as compared to the previous fiscal year;
offset by a 6.5% reduction in the average cost per ton of sugarcane sold in fiscal year
2013, from ARS 143 in fiscal year 2012 to ARS 134 in fiscal year 2013, mainly as a
result of a reduction in sugarcane market prices.
The cost of sales as a percentage of sales was 92.2% in fiscal year 2012 and 98.7% in fiscal
year 2013.
The cost of production of the Sugarcane segment increased 87.8%, from ARS 76.7 million in
fiscal year 2012 to ARS 144.1 million in fiscal year 2013, mainly as a result of a higher
production volume in fiscal year 2013 as compared to fiscal year 2012.
The total cost of production per ton decreased 6.5%, from ARS 133 in fiscal year 2012 to ARS
125 in fiscal year 2013, mainly as a result of higher yields per hectare in fiscal year 2013 as
compared to fiscal year 2012.
Leases and Agricultural Services
Cost of sales from the Leases and Agricultural Services segment increased significantly, from
ARS 2.6 million for fiscal year 2012 to ARS 12.1 million for fiscal year 2013, mainly as a result
of:
an increase of ARS 8.3 million in the costs of lease services, mainly resulting from higher
administrative expenses and costs related to the business; and
an increase of ARS 1.1 million in irrigation and other agricultural services.
Sale and Transformation of Lands
Cost of sales from the Sale and Transformation of Lands segment increased 22.0%, from ARS
4.6 million for fiscal year 2012 to ARS 5.7 million for fiscal year 2013, mainly due to salary rises.
Agro-industrial Activities
Cost of sales from the Agro-industrial Activities segment increased 79.1%, from ARS 110.8
million for fiscal year 2012 to ARS 198.4 million for fiscal year 2013, mainly due to the
acceleration of slaughtering levels in our meat packing plant, resulting in a higher volume of
operations that led to significant wage increases.
Other
The cost of sales of the Other segment increased 54.5%, from ARS 46.1 million in fiscal year
2012 to ARS 71.2 million in fiscal year 2013, mainly as a result of higher costs from the
brokerage business related to the increase in the number of commodity trading transactions
through our subsidiary Futuros y Opciones.com for ARS 6.3 million and higher costs generated
by the resale of supplies and others for ARS 18.8 million.
Urban Properties and Investments Business
Cost of sales from our Urban Properties and Investments business increased 23.8%, from ARS
971.7 million in fiscal year 2012 to ARS 1,203.1 million in fiscal year 2013. This was mainly due
to an increase of ARS 136.8 million in the Shopping Center segment, an increase of ARS 23.2
million in the Offices segment, an increase of ARS 51.2 million in the Hotels segment and an

93
increase of ARS 33.5 million in the International segment, slightly offset by a decrease of ARS
13.1 million in the Sales and Developments segment and a decrease of ARS 0.2 million in the
Financial Transactions and Other segment,
Initial recognition and changes in the reasonable value of biological assets and agricultural produce
at the harvesting point
The Group’s revenues from initial recognition and changes in the reasonable value of biological
assets and agricultural produce at the harvesting point increased 25.4%, from ARS 708.7 million
for fiscal year 2012 to ARS 888.5 million for fiscal year 2013.
Grains
Production income from the Grains segment increased 8.6%, from ARS 439.9 million in fiscal
year 2012 to ARS 477.8 million in fiscal year 2013, mainly as a result of:
a 17.1% increase in the average production price of grains;
partially offset by a 7.2% reduction in the total production volume, from 383,088 tons in
fiscal year 2012 to 355,390 tons in fiscal year 2013, mainly due to a reduction in the
harvested volumes of wheat (75.2%), corn (25.3%) and sunflower (14.4%), partially
offset by an increase in harvested volumes of soybean (14.5%) and sorghum (2.0%) in
fiscal year 2013.
The 7.2% decrease in production volume of our Grains segment was mainly due to a 13.8%
reduction in our average yield, from 2.7 tons per hectare in fiscal year 2012 to 2.3 tons per
hectare in fiscal year 2013, mainly as a result of the mix of grains harvested and unfavorable
weather conditions. In addition, during fiscal year 2013 the surface area in operation decreased
from 181,079 hectares (including 8,778 hectares under concession) as of June 30, 2012 to
168,134 hectares (including 8,937 hectares under concession) as of June 30, 2013.
As of June 30, 2013 the harvested area was 95.2% of our total sown area, compared to 90.0%
as of June 30, 2012.
The following table shows the number of tons produced and total production income as of June
30, 2013 and 2012:
Grains Production Income (in tons and thousands of ARS)
Fiscal year ended June 30,
2013 2012
Tons ARS Tons ARS
Corn 107,257 83,416 143,639 90,097
Soybean 220,292 354,485 192,458 308,855
Wheat 4,505 3,740 18,200 7,062
Sorghum 5,486 3,118 5,380 4,116
Sunflower 12,437 21,230 14,524 20,041
Other 5,413 11,855 8,887 9,686
TOTAL 355,390 477,844 383,088 439,857
Estimated results from the valuation of our crops in progress at reasonable value increased
28.1% from ARS 73.5 million in fiscal year 2012 to ARS 94.2 million in fiscal year 2013 mainly

94
due to increases in corn (64.9%) and sunflower (53.6%) crops, partially offset by a reduction in
soybean crops (48.3%) and wheat crops (18.6%) in fiscal year 2013.
Beef Cattle
Production income from the Beef Cattle segment increased 7.5%, from ARS 65.1 million in fiscal
year 2012 to ARS 70.0 million in fiscal year 2013, mainly as a result of:
a 23.8% increase in the average price per kilogram produced, from ARS 7.1 in fiscal
year 2012 to ARS 8.8 in fiscal year 2013;
offset by a 14.1% reduction in beef production volume from 9,045 tons in fiscal year
2012 to 7,772 tons in fiscal year 2013.
The calving rate decreased slightly, whereas the death rate recorded a mild increase during
fiscal year 2013 as compared to fiscal year 2012.
The number of hectares devoted to beef cattle production decreased from 95,995 hectares in
fiscal year 2012 to 91,053 hectares in fiscal year 2013 due to a smaller number of own hectares
devoted to beef cattle production.
Results from beef cattle holdings decreased 33.7%, from a gain of ARS 14.0 million in fiscal
year 2012 to a gain of ARS 9.3 million in fiscal year 2013, mainly as a result of the reduction in
beef cattle stocks and lower beef cattle market prices.
Milk
Production income from the Milk segment increased 21.0%, from ARS 31.1 million in fiscal year
2012 to ARS 37.6 million in fiscal year 2013. This increase was mainly due to:
a 11.5% increase in milk production volumes, from 16.6 million liters in fiscal year 2012
to 18.5 million liters during this fiscal year. This increase in production volume was
mainly due to a higher average number of milking cows per day, from 2,046 in fiscal year
2012 to 2,392 in fiscal year 2013, partially offset by a 4.7% reduction in the efficiently
level of average daily milk production per cow, from 22.2 liters in fiscal year 2012 to 21.1
liters in fiscal year 2013; and
a 19.8% increase in the average price of milk, from ARS 1.69 per liter in fiscal year 2012
to ARS 2.02 per liter in fiscal year 2013.
Results from holding of milking cows increased 10.1%, from a gain of ARS 2.9 million in fiscal
year 2012 to a gain of ARS 3.2 million in fiscal year 2013.
Sugarcane
Production income from the Sugarcane segment increased 113.2%, from ARS 71.3 million in
fiscal year 2012 to ARS 152.0 million in fiscal year 2013, mainly as a result of:
an increase in total production volume of 100.8%, from 576,048 tons in fiscal year 2012
to 1,156,848 tons in fiscal year 2013; and
an increase of 6.2% in the average production price of sugarcane.
The 100.8% increase in production volume from the Sugarcane segment was mainly due to a
40.4% increase in our average yield, from 65.4 tons per hectare in fiscal year 2012 to 91.7 tons
per hectare for fiscal year 2013, mainly due to favorable weather conditions.

95
As of June 30, 2013, the harvested area was 94.9% of the total sown area compared to 82.3%
as of June 30, 2012.
The following table shows the tons produced and actual income as of June 30, 2013 and 2012:
Sugarcane Production Income (In tons y thousands of ARS)
Fiscal year ended June 30,
2013 2012
Tons ARS Tons ARS
Sugarcane 1,156,848 152,037 576,048 71,306
Estimated results from the valuation of our crops in progress at reasonable value increased
significantly from ARS 10.9 million in fiscal year 2012 to ARS 45.3 million in fiscal year 2013
mainly generated by Brasilagro, where higher productivity and higher prices are estimated and
new planted hectares were added.
Other
Income from initial recognition and changes in the reasonable value of biological assets and
agricultural produce at the harvesting point from the Other segment decreased significantly,
from an income of ARS 0.06 million in fiscal year 2012 to an ARS 1.0 million loss in fiscal year
2013, due to the variation in the valuation of the timber stocks at reasonable value in fiscal year
2013.
Changes in the net realizable value of agricultural produce after harvesting
Income from changes in the net realizable value of agricultural produce after harvesting
increased significantly, from ARS 2.6 million in fiscal year 2012 to ARS 11.8 million in fiscal year
2013. This was caused mainly by an increase of ARS 9.3 million in the Grains segment (due to
higher market prices), offset by an ARS 0.2 million reduction in the Beef Cattle segment.
Gross income
As a result of the above mentioned factors, the Group’s gross income increased 18.3%, from
ARS 1,124.6 million in fiscal year 2012 to ARS 1,330.2 million in fiscal year 2013. This was
caused mainly by:
a 14.1% increase in the Agriculture and Cattle Raising Business, from an ARS 183.9
million income in fiscal year 2012 to an ARS 209.9 million income in fiscal year 2013; and
a 19.1% increase in the Urban Properties and Investments business, from an ARS 940.7
million income in fiscal year 2012 to an ARS 1,120.3 million income in fiscal year 2013.
Agriculture and Cattle Raising Business
As a result of the above mentioned factors, gross income increased 14.1%, from ARS 183.9
million in fiscal year 2012 to ARS 209.9 million in fiscal year 2013.
Grains
Gross income from this segment increased 6.1%, from ARS 100.1 million in fiscal year 2012 to
ARS 106.2 million in this fiscal year.

96
Beef Cattle
Gross income from this segment decreased 79.1%, from ARS 47.9 million in fiscal year 2012 to
ARS 10.0 million in this fiscal year.
Milk
Gross income from this segment decreased 25.3%, from ARS 6.3 million in fiscal year 2012 to
ARS 4.7 million in this fiscal year.
Sugarcane
Gross income from this segment increased 319.1%, from ARS 13.2 million in fiscal year 2012 to
ARS 55.4 million in this fiscal year.
Leases and Agricultural Services
Gross income from this segment decreased 17.5%, from ARS 22.7 million in fiscal year 2012 to
ARS 18.8 million in this fiscal year.
Sale and Transformation of Lands
Gross loss from this segment increased 22.0%, from ARS 4.6 million in fiscal year 2012 to ARS
5.7 million in this fiscal year.
Agro-industrial Activities
Gross income / (loss) from this segment increased 187.4%, from an ARS 10.7 million loss in
fiscal year 2012 to an ARS 9.4 million income in this fiscal year.
Other
Gross income from this segment increased 23.1%, from ARS 9.0 million in fiscal year 2012 to
ARS 11.1 million in this fiscal year.
Urban Properties and Investments Business
Gross income from the Urban Properties and Investments business increased 19.1% from ARS
940.7 million in fiscal year 2012 to ARS 1,120.3 million in fiscal year 2013. This was due to an
increase of ARS 163.9 million in the Shopping Centers segment; an increase of ARS 14.8
million in the Offices segment; an increase of ARS 4.6 million in the Hotels segment and an
increase of ARS 7.4 million in the International segment, partially offset by a reduction of ARS
7.7 million in the Sales and Developments segment and of ARS 3.5 million in the Financial
Transactions and Other segment.
Income / (loss) from sale of investment properties
Income / (loss) from sale of investment properties derived from the Urban Properties and
Investments business increased 52.6%, from an ARS 116.7 million income in fiscal year 2012 to
an ARS 178.0 million income for fiscal year 2013.
Income / (loss) from the sale of farms
Income / (loss) from the sale of farms derived from the Sale and Transformation of Lands
segment increased 228.8%, from an ARS 45.5 million income in fiscal year 2012 to an ARS
149.6 million income in fiscal year 2013, mainly as a result of:
During fiscal year 2013
On June 19, 2013 the deed of sale for 5,613 hectares of the “La Suiza” farm, located in
Villa Ángela, Province of Chaco, was executed. The transaction price was ARS 34.9
million (USD 6.7 million). The result from the sale was a gain of ARS 29.8 million;

97
On October 11, 2012, Brasilagro sold the Horizontina farm, located in the municipal
district of Tasso Fragoso. Sate of Maranhão, Brazil, for a total price of BRL 75 million
(equivalent to ARS 174.8 million). The Horizontina farm has a surface area of 14,359
hectares. The result of the sale was a gain of ARS 53.9 million;
On April 25, 2013, Brasilagro sold an aggregate of 394 hectares of the Araucaria farm,
located in the municipal district of Mineros – GO, Brazil. The sale price was BRL 11.7
million (equivalent to ARS 26.6 million). The result of the sale was a gain of ARS 12.6
million; and
On May 10, 2013, Brasilagro sod an aggregate of 4,895 hectares of the Cremaq farm,
located in the municipal district of Ribeiro Gonçalves-PI, Brazil. The sale price was BRL
42.1 million (equivalent to ARS 96.3 million). The result of the sale was a gain of ARS
53.2 million.
During fiscal year 2012
On September 28, 2011, Brasilagro sold the Sao Pedro farm, a rural property located in
the Municipality of Chapadão do Céu – GO with a total surface area of 2,447 hectares.
The transaction price was BRL 23.3 million (equivalent to ARS 59.8 million and 580,000
bags of soybean seeds). The result of the sale was a gain of ARS 27.8 million;
On March 2, 2012, the sale of 1,194 additional hectares in La Fon Fon farm, located in
the Province of Obispo Santiesteban, Republic of Bolivia, was agreed upon for ARS 18.3
million (USD 4.8 million). The result of the sale was a gain of ARS 6.6 million; and
On May 22, 2012, the Company sold, assigned and conveyed to APSA a 115-hectare
plot of land that forms part of the property “Puerta de Luján” located in the District of
Luján, Province of Buenos Aires, for a total amount of ARS 15.5 million, which has been
fully collected. The result of the sale was a gain of ARS 11.1 million.
General and Administrative Expenses
Total administrative expenses of the Group increased 9.8%, from ARS 316.5 million for fiscal
year 2012 to ARS 347.3 million for fiscal year 2013. This was mainly due to an increase of ARS
9.8 million in the Agriculture and Cattle Raising business and an increase of ARS 21.1 million in
the Urban Properties and Investments business.
Agriculture and Cattle Raising Business
Administrative expenses from our Agriculture and Cattle Raising business increased 7.0%. from
ARS 140.6 million in fiscal year 2012 to ARS 150.3 million in fiscal year 2013.
Grains
Administrative expenses from the Grains segment increased 1.1%. from ARS 86.8 million in
fiscal year 2012 to ARS 87.7 million in fiscal year 2013, mainly due to:
higher salaries, wages and social security contributions; and
higher Directors’ fees;
slightly offset by a reduction in fees and compensation from services.

98
Beef Cattle
Administrative expenses from the Beef Cattle segment decreased 14.2%, from ARS 14.9 million
in fiscal year 2012 to ARS 12.8 million in fiscal year 2013. Although there were increases in
salaries, wages and social security contributions and Directors’ fees, administrative expenses
lowered due to a reduction in proration percentages between both fiscal years, along with lower
fees and compensation from services.
Milk
Administrative expenses from the Milk segment decreased 1.0%, from ARS 2.94 million in fiscal
year 2012 to ARS 2.91 million in fiscal year 2013. Although there were increases in salaries,
wages and social security contributions and Directors’ fees, administrative expenses lowered
due to a reduction in proration percentages between both fiscal years, along with a reduction in
fees and compensation from services.
Sugarcane
Administrative expenses from the Sugarcane segment increased 24.4%, from ARS 19.4 million
in fiscal year 2012 to ARS 24.2 million in fiscal year 2013, mainly as a result of higher salaries,
wages and social security contributions, Directors’ fees and maintenance and repairs.
Leases and Agricultural Services
Administrative expenses from the Leases and Agricultural Services segment increased 11.2%,
from ARS 3.7 million in fiscal year 2012 to ARS 4.1 million in fiscal year 2013, mainly as a result
of higher salaries, wages and social security contributions and Directors’ fees, offset by lower
fees and compensation from services.
Sale and Transformation of Lands
Administrative expenses from the Leases and Agricultural Services segment increased 5.1%,
from ARS 0.51 million in fiscal year 2012 to ARS 0.53 million in fiscal year 2013, mainly as a
result of higher salaries, wages and social security contributions and Directors’ fees, offset by
lower fees and compensation from services.
Agro-industrial Activities
Administrative expenses from the Agro-industrial Activities segment increased 49.1%, from ARS
7.4 million in fiscal year 2012 to ARS 11.0 million in fiscal year 2013, mainly as a result of higher
salaries, wages and social security contributions due to the resumption of operations in the
meat packing plant.
Other
Administrative expenses from the Other segment increased 44.2%, from ARS 4.9 million in
fiscal year 2012 to ARS 7.1 million in fiscal year 2013, mainly due to higher salaries, wages and
social security contributions.
Urban Properties and Investments Business
Administrative expenses from the Urban Properties and Investments business increased 12.0%,
from ARS 175.9 million in fiscal year 2012 to ARS 197.0 million in fiscal year 2013. This was
mainly due to an increase of ARS 9.6 million in the Shopping Centers segment, an increase of
ARS 12.0 million in the Hotels segment, and an increase of ARS 4.3 million in the International
segment, partially offset by reduction of ARS 3.6 million in the Sales and Developments
segment and a reduction of ARS 1.2 million in the Offices segment.
99
Selling Expenses
Total selling expenses of the Group increased 38.5%, from ARS 212.4 million in fiscal year
2012 to ARS 289.3 million in fiscal year 2013. This was mainly due to an increase of ARS 55.7
million in the Agriculture and Cattle Raising business and an increase of ARS 21.1 million in the
Urban Properties and Investments business.
Agriculture and Cattle Raising Business
Selling expenses from the Agriculture and Cattle Raising Business increased 47.9%, from ARS
116.4 million in fiscal year 2012 to ARS 172.1 million in fiscal year 2013.
Grains
Selling expenses from the Grains segment increased 30.1% from ARS 88.4 million in fiscal year
2012 to ARS 115.0 million in fiscal year 2013, mainly due to:
an increase in freight, conditioning and storage costs and other taxes, rates and
contributions;
slightly offset by a reduction in commissions.
Beef Cattle
Selling expenses of the Beef Cattle segment decreased 5.4%, from ARS 11.6 million in fiscal
year 2012 to ARS 10.9 million in fiscal year 2013, mainly due to:
a reduction in other taxes, rates and contributions, commissions and conditioning and
storage costs;
partially offset by higher freight costs.
Milk
Selling expenses of the Milk segment increased 38.4%, from ARS 1.2 million in fiscal year 2012
to ARS 1.7 million in fiscal year 2013, mainly due higher other taxes, rates and contributions.
Sugarcane
Selling expenses of the Sugarcane segment increased ARS 4.0 million, mainly due to higher
freight costs for $ 2.6 million, conditioning and storage costs for $ 1.1 million and other taxes,
rates and contributions for $ 0.4 million from Bolivia in fiscal year 2013 reflecting the fact that in
the previous fiscal year there had been no sales of sugarcane in Bolivia and in Brazil no selling
expenses are incurred.
Leases and Agricultural Services
Selling expenses of the Leases and Agricultural Services segment increased 17.2%, from ARS
1.3 million in fiscal year 2012 to ARS 1.5 million in fiscal year 2013, mainly due to the increase
in other taxes, rates and contributions and commission and advertising expenses.
Sale and Transformation of Lands
Selling expenses of the Leases and Agricultural Services segment increased significantly, from
ARS 1.0 million in fiscal year 2012 to ARS 10.6 million in fiscal year 2013, mainly as a result of
higher commissions directly related to the sale of farms.

100
Agro-industrial Activities
Selling expenses from the Agro-industrial Activities segment increased 181.3%. from ARS 7.6
million in fiscal year 2012 to ARS 21.5 million in fiscal year 2013, mainly due to the increase in
other taxes, rates and contributions, freight costs, commercial indemnifications and bad debtors.
Other
Selling expenses from the Other segment increased 30.0%. from ARS 5.3 million in fiscal year
2012 to ARS 6.9 million in fiscal year 2013, mainly as a result of an increase in turnover tax,
salaries and social security contributions and hired services, partially offset by a reduction in
bad debtors.
Urban Properties and Investments Business
Selling expenses of the Urban Properties and Investments business increased 22.0%. from
ARS 96.0 million in fiscal year 2012 to ARS 117.1 million in fiscal year 2013. This was mainly
due to an increase of ARS 14.7 million in the Shopping Centers segment, an increase of ARS
6.0 million in the Hotels segment, an increase of ARS 3.7 million in the Financial Transactions
and Other segment, and an increase of ARS 1.3 million in the Offices segment, partially offset
by a reduction of ARS 4.7 million in the Sales and Developments segment.
Management fees
The company entered into a management agreement with Consultores Asset Management S.A.
that contemplates the payment of a fee equivalent to 10% of our net income for agricultural
advisory services and other related management services. During fiscal year 2013 no charge
was recorded for these fees, which correspond to the Other segment of the Agriculture and
Cattle Raising business, whereas this charge had amounted to ARS 8.7 million during fiscal
year 2012.
Other operating income / (loss), net
Other operating income / (loss) of the Group increased ARS 185.7 million, from an ARS 93.4
million loss in fiscal year 2012 to an ARS 92.3 million income in fiscal year 2013.
Agriculture and Cattle Raising Business
Grains
Other operating income / (loss) of the Grains segment increased ARS 46.9 million, from an ARS
58.1 million loss in fiscal year 2012 to an ARS 11.2 million loss in fiscal year 2013, mainly as a
result of the commodity derivatives held by Brasilagro and Cresud (ARS 56.4 million), partially
offset by the charge to income of Brasilagro’s contingency allowance for ARS 9.1 million.
Other
Other operating income / (loss) of the Other segment increased ARS 15.3 million, from an ARS
0.7 million income in fiscal year 2012 to an ARS 15.9 million income in fiscal year 2013.
The rest of the segments of the Agriculture and Cattle Raising Business did not record
significant changes.
Urban Properties and Investment Business
Other operating income / (loss) from the Urban Properties and Investments business increased
ARS 128.8 million, from an ARS 37.0 million loss in fiscal year 2012 to an ARS 91.8 million
income in fiscal year 2013, generated mainly by an ARS 137.1 million income from the
purchase of subsidiaries during this fiscal year.

101
Operating income / (loss)
As a result of the factors explained above, the Group’s operating income / (loss) increased ARS
459.4 million (71.0%), from an ARS 647.0 million income in fiscal year 2012 to an ARS 1,106.4
million income in fiscal year 2013.
Agriculture and Cattle Raising Business
Operating income / (loss) from the Agriculture and Cattle Raising business increased ARS
133.2 million (135.9%), from an ARS 98.0 million loss in fiscal year 2012 to an ARS 35.2 million
income in fiscal year 2013.
Grains
Operating income / (loss) from this segment decreased ARS 25.4 million (19.1%) from an ARS
133.1 million loss in fiscal year 2012 to an ARS 107.7 million loss in fiscal year 2013.
Beef Cattle
Operating income / (loss) from this segment decreased ARS 35.4 million (192.2%), from an ARS
18.4 million income in fiscal year 2012 to an ARS 17.0 million loss in fiscal year 2013.
Milk
Operating income / (loss) from this segment decreased ARS 2.2 million (140.0%), form an ARS
1.6 million income in fiscal year 2012 to an ARS 0.6 million loss in fiscal year 2013.
Sugarcane
Operating income / (loss) from this segment increased ARS 33.4 million from an ARS 6.2 million
loss in fiscal year 2012 to an ARS 27.2 million income in fiscal year 2013.
Leases and Agricultural Services
Operating income / (loss) from this segment decreased ARS 4.9 million (29.0%) from an ARS
17.0 million income in fiscal year 2012 to an ARS 12.1 million income in fiscal year 2013.
Sale and Transformation of Lands
Operating income / (loss) from this segment increased ARS 93.4 million from an ARS 39.2
million income in fiscal year 2012 to an ARS 132.6 million income in fiscal year 2013.
Agro-industrial Services
Operating income / (loss) from this segment decreased ARS 1.1 million, from an ARS 25.6
million loss in fiscal year 2012 to an ARS 24.5 million loss in fiscal year 2013.
Other
Operating income / (loss) from this segment increased ARS 22.3 million, from an ARS 9.2
million loss in fiscal year 2012 to an ARS 13.0 million income in fiscal year 2013.
Urban Properties and Investments Business
Operating income / (loss) from this business increased ARS 327.4 million (43.8%) from an ARS
748.5 million income in fiscal year 2012 to an ARS 1,075.9 million income in fiscal year 2013.
This was mainly due to an increase of ARS 350.9 million in the Shopping Centers, Offices,
Sales and Developments and International segments, partially offset by an ARS 23.5 million
reduction in the Hotels and Financial Transactions and Other segments.
Gain / (loss) on equity investees
102
Gain / (loss) on our equity investees decreased ARS 46.3 million (133.8%) from an ARS 34.6
million gain in fiscal year 2012 to an ARS 11.7 million loss in fiscal year 2013. This was primarily
due to:
a reduction of ARS 49.8 million in income from related companies in our Urban
Properties and Investments business in fiscal year 2013;
slightly offset by higher income of ARS 3.5 million from the Agriculture and Cattle
Raising business, mainly reflecting an ARS 2.1 million income from our investment in
AgroUranga (corresponding to the Grains segment); and
a lower loss of ARS 6.5 million in fiscal year 2013 as a result of the amortization of
higher values generated by the combination of businesses and other results from the
Urban Properties and Investments business.
Net financial results
We had a higher net financial loss of ARS 333.5 million, from a loss of ARS 575.2 million in
fiscal year 2012 to a loss of ARS 908.8 million in fiscal year 2013. This was primarily due to:
a higher loss of ARS 266.1 million in net exchange differences in fiscal year 2013;
a higher loss of ARS 22.2 million in net financial interest recorded in fiscal year 2013;
a higher loss of ARS 18.9 million in revaluation of receivables from sale of farms in fiscal
year 2013;
a higher loss of ARS 6.5 million in derivative financial instruments in fiscal year 2013;
and
a higher loss of ARS 26.9 million generated by the results from financial transactions
and other in fiscal year 2013.
Our net financial loss in fiscal year 2013 was mainly attributable to (i) an ARS 586.4 million loss
generated by exchange differences mainly as a result of a higher liability position in US dollars
due to the issuance of new series of notes; and (ii) a loss of ARS 483.8 million generated by
interest accrued on debt financing, mainly due to increased indebtedness and higher interest
rates.
There was a 19% variation in the U.S. Dollar seller exchange rate during fiscal year 2013 (it
increased from ARS 4.527 as of June 30, 2012 to ARS 5.388 as of June 30, 2013) as compared
to the previous fiscal year, when the U.S. Dollar quotation had experienced a smaller variation,
of 10% (from ARS 4.110 as of June 30, 2011 to ARS 4.527 as of June 30, 2012).
Income tax
Our income tax expense increased ARS 17.5 million (109.1%), from ARS 16.0 million in fiscal
year 2012 to ARS 33.5 million in fiscal year 2013. The Group recognizes the income tax
expense on the basis of the deferred tax liability method, thus recognizing temporary differences
between accounting and tax assets and liabilities measurements. The main temporary
differences for the Agriculture and Cattle Raising business derive from valuation of cattle stock

103
and sale and replacement of property, plant and equipment, while those corresponding to the
Urban Properties and Investments business derive from the sale and replacement of investment
properties.
For purposes of determining the deferred assets and liabilities, the tax rate expected to be in
force at the time of their reversion or use, according to the legal provisions enacted as of the
date of issuance of these financial statements (35%), has been applied to the identified
temporary differences and tax losses.
Net income
Due to the above mentioned factors, our net income increased by ARS 95.8 million (163.8%)
from ARS 58.5 million for fiscal year 2012 to ARS 154.3 million in fiscal year 2013. Net income
for the fiscal years 2013 and 2012 is attributable to the controlling company’s shareholders and
non-controlling interest as per the following detail:
Net income attributable to the controlling company’s shareholders increased by ARS 5.6
million, from a loss of ARS 21.3 million in fiscal year 2012 to a loss of ARS 26.9 million
in fiscal year 2013; and
the non-controlling interest in controlled companies increased by ARS 101.4 million
(127%), from an income of ARS 79.8 million in fiscal year 2012 to an income of
ARS 181.2 million in fiscal year 2013, mainly due to an increase of ARS 47.2 million in
Brasilagro, an increase of ARS 11.0 million in our subsidiary IRSA, and an increase of
ARS 38.2 million in other companies from the Urban Properties and Investment
business.

104
Service Sharing Agreement entered into with IRSA and Alto Palermo
In view of the fact that our Company, IRSA and APSA have operating areas with certain
similarities, the Board of Directors deemed it appropriate to implement alternative initiatives in
due course aimed at reducing certain fixed costs in activities in order to reduce their impact on
operating results, thereby taking advantage of and optimizing individual efficiencies of each
company in the different areas of operations management. As a result, on June 30, 2004 our
Company, IRSA and APSA entered into a Framework Agreement for the Exchange of
Corporate Services, which was amended on August 23, 2007, August 14, 2008, November 27,
2009, July 11, 2011 and October 15, 2012.
At present, the Framework Agreement for the Exchange of Corporate Services among our
Company, IRSA and APSA includes the following areas for purposes of the exchange of
services: Human Resources, Finance, Institutional Relations, Administration and Control,
Insurance, Messenger Services, Contracts, Audit and Control, Technical, Infrastructure and
Services, Purchases, Architecture and Design, Development and Works, Real estate, Hotels
and Tourism, Assistance to Board of Directors and Safety.
The exchange of services consists in the provision of services for value in relation to any of the
above mentioned areas, carried out by one or more of the parties on behalf of the other party or
parties to the same agreement, invoiced and payable primarily through offsetting based on the
provision of services in any such areas, and secondarily in cash, in case of a difference in value
of the services provided.
Under this agreement, the companies hired an external consulting company to review and
evaluate on a six-month basis the criteria used in the settlement of corporate services, as well
as the bases of distribution and supporting documentation used in the process, to be reflected in
a report prepared for each six-month period.
On March 12, 2010 we entered into a new amendment to the Corporate Services Agreement
with IRSA and APSA so as to simplify the issues arising from the consolidation of the financial
statements resulting from the increase of our investment in IRSA. In this regard, our Board of
Directors deemed it convenient and advisable for achieving such simplification, to unify in the
Company and to assign to Cresud IRSA’s and APSA’s employment agreements. Effective since
January 1, 2010, labor costs of such employees were transferred to our payroll, which have
been distributed pursuant to the conditions of the Corporate Services Agreement.
Following the same spirit that gave rise to this procedure, in the future, and with the same
objective of making the most efficient distribution of corporate resources among the different
areas, this agreement may be extended or amended with respect to other areas shared by the
Company with IRSA and APSA.
It should be noted that the procedure under analysis allows the Company, IRSA and APSA to
maintain total independence and confidentiality in their strategic and commercial decisions, and
that the allocation of costs and income is performed based on operating efficiency and equity
principles, without pursuing individual economic benefits for the companies. The implementation
of this project does not impair the identification of the economic transactions or services

105
involved, or the effectiveness of internal control systems or internal and external audit work of
each company, or the disclosure of the transactions subject to the Agreement in accordance
with Technical Resolution No. 21 of the FACPCE. In addition, Alejandro Gustavo Elsztain is the
General Coordinator while the operation and implementation are the responsibility of Daniel E.
Mellicovsky on behalf of our Company, Cedric Bridger on behalf of IRSA, and Abraham
Perelman on behalf of APSA, all of whom are members of the Audit Committees of their
respective companies.
106
Prospects for Next Year
During this year, the agribusiness market suffered again the effects of the drought in our region,
directly impacting on our farms’ yields. Projections for the 2014 season suggest a very good
agricultural production in the United States, which could have an adverse effect on commodity
prices given the replenishment of stocks. However, this effect could be offset by higher yields in
the region, as weather forecasts for 2014 indicate that we are close to having a neutral season.
We expect to plant approximately 208,000 hectares in all the countries of the region in which we
operate.
In Argentina, we expect sound prices for the milk business and stable prices for beef cattle
production. We will work in our cost structure with the aim of achieving the best operating
margins. Moreover, we will continue with our strategy of supplementing agriculture in our own
farms with agricultural activities in leased farms and in farms under concession. As regards
leases, we will maintain the leased area and will access areas with higher production potential
so as to optimize our portfolio. As concerns our businesses through Cactus Argentina, we will
continue working toward optimizing margins in our feedlot and our meat packing plant, in hope
that market conditions are more favorable and the segment regains profitability.
As concerns land value enhancement and transformation, we will continue to develop our farms
in Argentina, Paraguay and Brazil. We plan to transform approximately 18,000 hectares in the
region, which we plan to become operational during this fiscal year and in 2015. We remain on
the alert for farm sale opportunities that may arise, selling those establishments that have
reached their highest appreciation.
Looking ahead to the 2014 season, we will keep on our acquisition, production, development
and sales operations, whilst continuing to analyze opportunities in other countries of the region
with the objective to put together a regional portfolio with major development and appreciation
potential.
Agribusiness offers very interesting long-term prospects. We believe that companies such as
Cresud, with a track record going back so many years and vast industry knowledge will have
outstanding possibilities of taking advantage of the best opportunities arising in the market,
much more so considering that our main task is to produce food for a growing and demanding
world population.

107
Board of Directors and Senior Management
We are managed by a board of directors, which consists of ten directors and four alternate
directors. Each director and alternate director is elected by our shareholders at an annual
ordinary meeting of shareholders for a three-year term, provided, however, that only one third of
the board of directors is elected each year. The directors and alternate directors may be re-
elected to serve on the board any number of times. There are no arrangements or
understandings pursuant to which any director or person from senior managements is selected.
Our current board of directors was elected at the shareholders’ meetings held on October 29,
2010, October 31, 2011, and October 31, 2012 for terms expiring in the years 2013, 2014 and
2015, respectively. Our current directors are as follows:
Director(1) Date of Birth Position in Cresud Term Expires
(2)
Date of
Current
Appointment
Current
Position Held
Since
Eduardo S. Elsztain 01/26/1960 Chairman 06/30/14 10/31/11 1994
Saúl Zang 12/30/1945 First Vice-Chairman 06/30/14 10/31/11 1994
Alejandro G. Elsztain 03/31/1966 Second Vice-Chairman and CEO 06/30/13 10/29/10 1994
Gabriel A.G. Reznik 11/18/1958 Regular Director 06/30/15 10/31/12 2003
Jorge O. Fernández 01/08/1939 Regular Director 06/30/15 10/31/12 2003
Fernando A. Elsztain 01/04/1961 Regular Director 06/30/13 10/29/10 2004
David A. Perednik 11/15/1957 Regular Director and Chief Administrative
Officer 06/30/13 10/29/10 2004
Pedro D. Labaqui Palacio 02/22/1943 Regular Director 06/30/15 10/31/12 2006
Daniel E. Mellicovsky 01/17/1948 Regular Director 06/30/14 10/31/11 2008
Alejandro G. Casaretto 10/15/1952 Regular Director 06/30/14 10/31/11 2008
Salvador D. Bergel 04/17/1932 Alternate Director 06/30/14 10/31/11 1996
Gastón A. Lernoud 06/04/1968 Alternate Director 06/30/14 10/31/11 1999
Enrique Antonini 03/16/1950 Alternate Director 06/30/13 10/29/10 2007
Eduardo Kalpakian 03/03/1964 Alternate Director 06/30/13 10/29/10 2007
(1) The business address of our management is Cresud S.A.C.I.F.I. y A., Moreno 877, 23rd Floor, (C1091AAQ) Buenos Aires, Argentina.
(2) Term expires at the annual ordinary shareholders’ meeting.
Jorge Oscar Fernandez, Pedro Dalmaso Labaqui Palacio, Daniel Elias Mellicovsky, Enrique
Antonini and Eduardo Kalpakian, qualify as independent, in accordance with Comisión Nacional
de Valores’ Resolution N° 400/2002.
The following is a brief biographical description of each member of our board of directors:
Eduardo S. Elsztain. Mr. Elsztain studied Economic Sciences at University of Buenos Aires
(Universidad de Buenos Aires). He has been engaged in the real estate business for more than
twenty years. He is chairman of the board of directors of Alto Palermo, IRSA, Consultores Asset
Management S.A., BACS Banco de Crédito & Securitización S.A. (“BACS”), Banco Hipotecario
S.A. and Brasilagro, among other companies. He is Fernando A. Elsztain’s cousin and
Alejandro G. Elsztain’s brother.
Saúl Zang. Mr. Zang obtained a law degree from University of Buenos Aires (Universidad de
Buenos Aires). He is a member of the International Bar Association and the Interamerican
Federation of Lawyers (Federación Interamericana de Abogados). He is a founding member of
the law firm Zang, Bergel & Viñes. He is chairman of Puerto Retiro S.A., first vice-chairman of
108
IRSA, and vice-chairman of Alto Palermo S.A., Tarshop S.A. and Fibesa S.A., among other
companies. He is also director of Banco Hipotecario, Nuevas Fronteras S.A., Brasilagro and
Palermo Invest S.A., among other companies.
Alejandro G. Elsztain. Mr. Elsztain obtained a degree in agricultural engineering from
University of Buenos Aires (Universidad de Buenos Aires). Currently he is chairman of Fibesa,
Agrology S.A., second vice-chairman of IRSA and executive vice-chairman of Alto Palermo. He
is also vice-chairman of Nuevas Fronteras, Inversora Bolivar S.A., and Hoteles Argentinos. He
is also director of Brasilagro, among other companies. Alejandro G. Elsztain is brother of our
Chairman Eduardo S. Elsztain and cousin of Fernando A. Elsztain.
Gabriel A. G. Reznik. Mr. Reznik obtained a degree in Civil Engineering from University of
Buenos Aires (Universidad de Buenos Aires). He worked for IRSA since 1992 until May 2005 at
which time he resigned. He had formerly worked for an independent construction company in
Argentina. He is an alternate director of Puerto Retiro S.A. and Fibesa, as well as member of
the board of Banco Hipotecario, among other companies.
Jorge O. Fernández. Mr. Fernández obtained a degree in Economic Sciences from University
of Buenos Aires (Universidad de Buenos Aires). He has performed professional activities at
several banks, financial corporations, insurance firms and other companies related to financial
services. He is also involved in many industrial and commercial institutions and associations.
Fernando A. Elsztain. Mr. Elsztain studied architecture at University of Buenos Aires
(Universidad de Buenos Aires). He has been engaged in the real estate business as a
consultant and as managing officer of a real estate company. He is chairman of the board of
directors of Llao Llao Resorts S.A., Palermo Invest S.A. and Nuevas Fronteras S.A. He is also a
director of IRSA, Alto Palermo and Hoteles Argentinos and alternate director of Puerto Retiro,
among other companies. He is cousin of our CEO, Alejandro Elsztain, and of our Chairman,
Eduardo S. Elsztain.
Pedro D. Labaqui Palacio. Mr. Labaqui obtained a law degree from University of Buenos Aires
(Universidad de Buenos Aires). He is also director of Bapro Medios de Pago S.A., Permanent
Syndic of Bayfe S.A. Fondos Comunes de Inversión, director and member of the Supervisory
Committee of J. Minetti S.A.; and Director of REM Sociedad de Bolsa S.A.
David A. Perednik. Mr. Perednik obtained a degree in accounting from University of Buenos
Aires (Universidad de Buenos Aires). He has worked for several companies such as Marifran
Internacional S.A., a subsidiary of Louis Dreyfus Amateurs where he worked as Financial
Manager from 1986 to 1997. He also worked as a Senior Consultant in the administration and
systems department of Deloitte & Touche from 1983 to 1986. He is also chief administrative
officer of IRSA and Alto Palermo.
Daniel E. Mellicovsky. Mr. Mellicovsky obtained a degree in accounting from the University of
Buenos Aires (Universidad de Buenos Aires). He has served as director of several companies
of the agricultural, food supplies, financial and hotel development sectors.
Alejandro G. Casaretto. Mr. Casaretto obtained a degree in agricultural engineering from
University of Buenos Aires (Universidad de Buenos Aires). He has served as our technical
manager, farm manager, and technical coordinator since 1975.
109
Salvador D. Bergel. Mr. Bergel obtained a law degree and a PhD from Litoral University
(Universidad Nacional del Litoral). He is a founding partner of Zang, Bergel & Viñes and a
consultant at Repsol YPF S.A. He is also alternate director of IRSA and Alto Palermo.
Gastón A. Lernoud. Mr. Lernoud obtained a law degree from El Salvador University
(Universidad de El Salvador) in 1992. He obtained a Masters degree in Corporate Law in 1996
from Palermo University (Universidad de Palermo). He was a senior associate member of Zang,
Bergel & Viñes law firm until June 2002, when he joined our lawyers team.
Enrique Antonini. Mr. Antonini holds a degree in law from the University of Buenos Aires
(Universidad de Buenos Aires). He is currently a member of the board of directors of Banco
Mariva S.A. (since 1992), Mariva Bursátil S.A. (since 1997). He has also served as director of
IRSA from 1993 to 2002. He is a member of the Argentine Banking Lawyers Committee and the
International Bar Association.
Eduardo Kalpakian. Mr. Kalpakian holds a degree in business from the University of Belgrano.
He has also an MBA from the CEMA University of Argentina. He has been director for 25 years
of Kalpakian Hnos. S.A.C.I., a leading carpet manufacturer and flooring distributor in Argentina,
and is currently is vice-chairman of its board and CEO. He is also vice-chairman of the board of
La Dormida S.A.A.C.E I.
Employment contracts with our directors and certain senior managers
We do not have written contracts with our directors. However, Messrs. Eduardo Elsztain, Saúl
Zang, Alejandro Elsztain, Fernando Elsztain, David Perednik and Alejandro Casaretto are
employed by us under the Labor Contract Law No. 20,744. Matías Gaivironsky and Carlos
Blousson, senior managers of our Company, are also subject to the above mentioned Law.
Law No. 20,744 governs certain conditions of the labor relationship, including remuneration,
protection of wages, hours of work, holidays, paid leave, maternity protection, minimum age
requirements, protection of young workers and suspension and termination of the contract.
Senior Management
Designation of our Senior Management
Our board of directors appoints and removes the senior management. Senior management
performs its duties in accordance with the instructions of our board of directors. There are no
arrangements by which a person is selected as a member of our senior management.
Information about our Senior Management
The following table shows information about our current senior management:
Name Date of Birth Position
Current Position
Held Since
Alejandro G. Elsztain 03/31/1966 CEO 1994
Carlos Blousson 09/21/1963 Chief Executive Officer for Argentina, Bolivia and Paraguay Operations 2008
David A. Perednik 11/15/1957 Chief Administrative Officer 1997
Matías I. Gaivironsky 02/23/1976 Chief Financial Officer 2011
The following is a biographical description of each of our senior managers who are not directors:
Carlos Blousson. Mr. Blousson obtained a degree in agricultural engineering from University of
Buenos Aires (Universidad de Buenos Aires). He has been working as our Chief Sales Officer

110
since 1996. Prior to joining us, he worked as a futures and options operator at Vanexva Bursátil
–Sociedad de Bolsa. Previously, he worked as a farm manager and a technical advisor at
Leucon S.A.
Matías Gaivironsky. Mr. Gaivironsky obtained a degree in business in the University of Buenos
Aires (Universidad de Buenos Aires). He holds a Master in Finance from CEMA University.
Since 1997 he has held several positions in Cresud, IRSA and APSA. Since December 2011 he
has been CFO. Previously, in 2008 he was Tarshop’s CFO.
Executive Committee
Pursuant to our by-laws, our day-to-day business is managed by an executive committee
consisting of a minimum of four and a maximum of seven directors and one alternate member,
among which there should be the chairman, first vice-chairman and second vice-chairman of the
board of directors. The current members of the Executive Committee are Messrs. Eduardo S.
Elsztain, Saúl Zang, and Alejandro Elsztain.
The executive committee is responsible for the management of the day-to-day business
pursuant to authority delegated by our board of directors in accordance with applicable law and
our by-laws. Our by-laws authorize the executive committee to:
designate the managers and establish the duties and compensation of such managers;
grant and revoke powers of attorney to attorneys-at-law on behalf of us;
hire, discipline and fire personnel and determine wages, salaries and compensation of personnel;
enter into contracts related to our business;
manage our assets;
enter into loan agreements for our business and set up liens to secure our obligations; and
perform any other acts necessary to manage our day-to-day business.
Supervisory Committee
Our Supervisory Committee is responsible for reviewing and supervising our administration and
affairs, and verifying compliance with the bylaws and the decisions adopted at shareholders’
meetings. The members of the Supervisory Committee are appointed at the annual general
ordinary shareholders’ meeting for a term of one year. The Supervisory Committee is composed
of three members and three alternate members.
The following table shows information about the members of our Supervisory Committee, who
were elected in the annual general ordinary shareholders’ meeting which was held on October
31, 2012:
Member Date of Birth Position
José Daniel Abelovich 07/20/1956 Member Marcelo Héctor Fuxman 11/30/1955 Member Noemí Cohn 05/20/1959 Member Alicia Rigueira 12/02/1951 Alternate Member Roberto Murmis 04/07/1959 Alternate member Sergio L. Kolaczyk 11/28/1964 Alternate member
All members of the supervisory committee qualify as independent, in accordance with Comisión
Nacional de Valores’ Resolution No. 400/2002.
Set forth below is a brief biographical description of each member of our Supervisory
Committee:

111
José D. Abelovich. Mr. Abelovich obtained a degree in accounting from the University of
Buenos Aires (Universidad de Buenos Aires). He is a founding member and partner of
Abelovich, Polano & Asociados S.R.L. / Nexia International, a public accounting firm in
Argentina. Formerly, he had been a manager of Harteneck, López y Cía/Coopers & Lybrand
and has served as a senior advisor in Argentina for the United Nations and the World Bank. He
is a member of the Supervisory Committees of IRSA, Alto Palermo, Shopping Alto Palermo,
Hoteles Argentinos, Inversora Bolívar, and Banco Hipotecario S.A.
Marcelo H. Fuxman. Mr. Fuxman obtained a degree in accounting from the University of
Buenos Aires (Universidad de Buenos Aires). He is a partner of Abelovich, Polano & Asociados
S.R.L. / Nexia International, a public accounting firm in Argentina. He is also a member of the
Supervisory Committee of IRSA, Alto Palermo, Shopping Alto Palermo, Inversora Bolívar, and
Banco Hipotecario S.A.
Noemí Cohn. Mrs. Cohn obtained a degree in accounting from the University of Buenos Aires
(Universidad de Buenos Aires). Mrs. Cohn is a partner at Abelovich, Polano & Asociados S.R.L.
/ Nexia International a public accounting firm in Argentina, and works in the audit area. Mrs.
Cohn worked in the audit area in Harteneck, Lopez and Company, Coopers & Lybrand in
Argentina and in Los Angeles, California. Mrs. Cohn is member of the Supervisory Committee of
Cresud and IRSA, among other companies.
Alicia Graciela Rigueira. Mrs. Rigueira holds a degree in accounting from the University of
Buenos Aires (Universidad de Buenos Aires). Since 1998 she has been a manager at Estudio
Abelovich, Polano & Asociados / Nexia International. From 1974 to 1998, Mrs. Rigueira
performed several functions in Harteneck, Lopez y Cia. affiliated with Coopers & Lybrand. Mrs.
Rigueira lectured at the School of Economic Sciences of Lomas de Zamora University.
Roberto D. Murmis. Mr. Murmis holds a degree in accounting from the University of Buenos
Aires (Universidad de Buenos Aires). Mr. Murmis is a partner at Abelovich, Polano & Asociados
S.R.L / Nexia International. Mr. Murmis worked as an advisor to the Public Revenue Secretariat,
Argentine Ministry of Economy. Furthermore, he is a member of the Supervisory Committee of
IRSA, Shopping Alto Palermo, Futuros y Opciones S.A., and Llao Llao Resorts S.A.
Sergio Leonardo Kolaczyk. Mr. Kolaczyk obtained a degree in accounting from the
Universidad de Buenos Aires (Universidad de Buenos Aires). He is a professional of Abelovich,
Polano & Asociados S.R.L. / Nexia International. He is also an alternate member of IRSA’s and
APSA’s Supervisory Committee.
Audit Committee
Management uses the Internal Control-Integrated Framework issued by the Committee of
Sponsoring Organizations of the Treadway Commission (the “COSO Report”) to assess
effectiveness of internal control over financial reporting.
The COSO Report sets forth that internal control is a process, effected by an entity’s board of
directors, management and other personnel, designed to provide reasonable assurance
regarding the achievement of the entity’s objectives in the following categories:
Effectiveness and efficiency of operations
Reliability of financial reporting
Compliance with applicable laws and regulations

112
Based on the above, a company’s internal control system involves all levels of the company
actively involved in exercising control:
the board of directors, by establishing the objectives, principles and values, setting the tone at the top and making the overall assessment of results;
the management of each area is responsible for internal control in relation to objectives and activities of the relevant area, i.e. the implementation of policies and procedures to achieve the results of the area and, therefore, those of the entity as a whole;
the other personnel plays a role in exercising control, by generating information used in the control system or taking action to ensure control.
In accordance with the Regime of Transparency in Public Offerings provided by Decree No.
677/01, the regulations of the Comisión Nacional de Valores and Resolutions No. 400 and 402
of the Comisión Nacional de Valores, our board of directors established an audit committee
which would focus on assisting the board in exercising its duty of care, compliance with
disclosure requirements, the enforcement of accounting policies, the management of our
business risks, the management of our internal control systems, ethical conduct of our
businesses, monitoring the sufficiency of our financial statements, our compliance with the laws,
independence and capacity of independent auditors and performance of audit duties both by our
company and our external auditors.
On November 3, 2008, our board of directors appointed Jorge Oscar Fernández, Pedro
Damaso Labaqui Palacio, and Daniel Elías Mellicovsky, all of them independent members, as
members of the audit committee. The board of directors named Jorge Oscar Fernández as the
financial expert in accordance with the relevant SEC rules. We have a fully independent audit
committee as per the standards provided in Rule 10(A)-3(b)(1).
Compensation
Compensation of directors
Under Argentine law, if the compensation of the members of the board of directors is not
established in the by-laws of the company, it should be determined by the shareholders’
meeting. The maximum amount of total compensation to the members of the board of directors,
including compensation for technical or administrative permanent activities, cannot exceed 25%
of the earnings of the company. That amount should be limited to 5% when there is no
distribution of dividends to shareholders, and will be increased proportionally to the distribution.
When one or more directors perform special commissions or technical or administrative
activities, and there are no earnings to distribute, or they are reduced, the shareholders’
meeting may approve compensation in excess of the above-mentioned limits.
The compensation of our directors for each fiscal year is determined pursuant to Argentine law,
and taking into consideration whether the directors performed technical or administrative
activities and our fiscal year’s results. Once the amount is determined, it is considered at the
shareholders’ meeting.
At our shareholders’ meeting held on October 31, 2012, the shareholders approved an
aggregate compensation of ARS 5,227,396 for all of our directors for the fiscal year ended June
30, 2012. At the end of the current fiscal year, the above mentioned compensation had been
paid in full.

113
Compensation of Supervisory Committee
The shareholders’ meeting held on October 31, 2012 further approved by majority vote not to
pay a compensation to our Supervisory Committee.
Compensation of Senior Management
Our senior management is paid a fixed amount established by taking into consideration their
background, capacity and experience and an annual bonus which varies according to their
individual performance and our results.
The total and aggregate compensation of our senior management for the fiscal year 2012/2013
started in July 2012 was ARS 7.0 million.
Compensation of the Audit Committee
The members of our Audit Committee do not receive additional compensation other than that
received for their services as members of our board of directors.
Capitalization Program for our executive staff
During the fiscal year ended June 30, 2007, the Company developed the design of a
capitalization program for its executive staff consisting in contributions made by both the
employees and the Company.
Such program is intended for certain employees selected by the Company that it wishes to
retain by increasing employee total compensation by means of an extraordinary reward in so far
as certain requirements are fulfilled.
The payment of contributions into the plan and participation therein are voluntary. Once the
intended beneficiary accepts to take part in the plan, he/she may make two types of
contributions: a monthly contribution based on his/her salary and an extraordinary contribution,
based on his/her annual bonus. It is suggested that contributions should be of up to 2.5% of
salaries and of up to 7.5% of the annual bonus. And then there is the contribution payable by
the Company which shall amount to 200% of the monthly contributions and of 300% of the
extraordinary contributions made by the employees.
The funds resulting from the contributions made by the participants are transferred to an
independent financial vehicle, specially created and situated in Argentina in the form of a mutual
fund with the approval of the Argentine Securities Commission. These funds can be freely
redeemed at the request of participants.
The funds resulting from the contributions made by both companies are transferred to another
independent financial vehicle, separate from the one previously mentioned.
In the future, the participants shall have access to 100% of the benefits under the plan (that is,
including the contributions made by the Company for the benefit of the employees into the
financial vehicle specially created) in any of the following circumstances:
ordinary retirement as prescribed by labor law
total or permanent disability, and
death.
In case of resignation or termination without good cause, the participant may redeem the
amounts contributed by us only if he or she has participated in the Plan for at least 5 years and
if certain conditions have been fulfilled.
114
During this fiscal year, the Company has made contributions to the plan for ARS 3.5 million.
Long Term Incentive Program
The Company has developed a long term incentive and retention stock program for its
management team and key employees under which contributions are made by both the
program participants and the Company. At its sole discretion, the Company plans to repeat the
plan for an additional fiscal year (2012-2013) under the same or other conditions, with the
possibility of providing an extraordinary reward consisting of freely available shares payable on
a single opportunity in September 2014.
The beneficiaries under the Plan are invited to participate by the Board of Directors and their
decision to access the Plan is voluntary. Once an officer agrees to participate, he or she may
make a single annual contribution (based on their annual bonus). The suggested contribution is
up to 7.5% of their bonus; in the first year the contribution made by the Company is ten times
the amount of the employee’s contribution and in the second year it is eight times such amount.
The contributions and/or shares of the Company that are purchased with these funds will be
transferred to special purpose vehicles. The contributions for the next fiscal years will be defined
after the closing of each fiscal year.
In the future, the Participants or their successors in interest will have access to 100% of the
benefit (the Company’s contributions made in their name) in the following cases:
if an employee resigns or is dismissed for no cause, he or she will be entitled to the benefit only if 5 years have elapsed from the moment of each contribution
retirement
total or permanent disability
death
Dividends and Dividend Policy
Pursuant to Argentine law, the distribution and payment of dividends to shareholders is valid
only if they result from net and realized earnings of the company pursuant to annual audited
financial statements approved by the shareholders. The approval, amount and payment of
dividends are subject to the approval by our shareholders at our annual ordinary shareholders’
meeting. The approval of dividends requires the affirmative vote of a majority of the shares
entitled to vote at the meeting.
In accordance with Argentine law and our by-laws, net and realized profits for each fiscal year
are allocated as follows:
5% of such net profits is allocated to our legal reserve, until such reserve amounts to
20% of our capital stock;
a certain amount determined at a shareholders’ meeting is allocated to compensation of
our directors and the members of our supervisory committee; and
additional amounts are allocated for the payment of dividends or to optional reserve
funds, or to establish reserves for whatever other purpose our shareholders determine.

115
The following table shows the dividend payout ratio and the amount of dividends paid on each
fully paid common share for the mentioned years. Amounts in Pesos are presented in historical,
non-inflation adjusted Pesos as of the respective payment dates and refers to our
unconsolidated dividends.
Year Total Dividend Dividend per Common Share (1)
(ARS MM) (ARS)
1998 3.8 0.099
1999 11.0 0.092
2000 1.3 0.011
2001 8.0 0.030
2002 — —
2003 1.5 0.012
2004 3.0 0.020
2005 10.0 0.059
2006 5.5 0.024
2007 8.3 0.026
2008 20.0 0.040
2009 60.0 0.121
2010 — —
2011 69.0 0.138
2012 63.8 0.149
2013 120.0 0.242
(1) Corresponds to per share payments. To calculate the dividend paid per ADS, the payment per share should be multiplied
by ten. Amounts in Pesos are presented in historical Pesos as of the respective payment date.
Future dividends with respect to our common shares, if any, will depend on, among other things,
our results of operations, cash requirements, financial condition, contractual restrictions,
business opportunities, provisions of applicable law and other factors that our shareholders at a
general shareholders’ meeting may deem relevant. As a result, we cannot give you any
assurance that we will pay any dividends at any time in the future.
On November 13, 2009, the Board of Directors resolved to start the process of ratable
attribution and allocation among our shareholders, of 25,000,000 (twenty-five million) treasury
shares of $1 par value each and entitled to one vote per share, issued by us and purchased by
us, too, in the midst of the disruptions faced by the domestic and international markets during
fiscal year 2008-2009.
On December 29, 2009, we reported that as a result of the ratable attribution and allocation of
treasury shares among our shareholders, the terms and conditions of the outstanding warrants
were amended as set forth below:
Number of shares issuable per warrant:
Before attribution: 0.33333333
After attribution: 0.35100598
Price of shares issuable upon exercise of warrants:
Before attribution: USD 1.6800
After attribution: USD 1.5954

116
Market Information
Our common shares are traded in Argentina on the Buenos Aires Stock Exchange, under the
trading symbol “CRES.” Since March 1997, our ADRs, each presenting 10 common shares,
have been listed on the NASDAQ under the trading symbol “CRESY.” The Bank of New York is
the depositary with respect to the ADRs.
The table below shows the high and low daily closing prices of our common shares in Pesos
and the quarterly trading volume of our common shares on the Buenos Aires Stock Exchange
for the first quarter of 2009 through August 2013. The table also shows the high and low daily
closing prices of our ADRs in U.S. dollars and the quarterly trading volume of our ADRs on the
NASDAQ for the first quarter of 2009 through August 2013. Each ADR represents ten common
shares.
Buenos Aires Stock Exchange NASDAQ
Price Per Share (ARS) USD per ADR
Share
Volume High Low ADS Volume High Low
Fiscal Year 2009
1st Quarter 3,832,884 4.66 3.25 9,269,938 14.8 10.50
2nd Quarter 4,532,498 3.41 1.73 16,198,697 10.69 4.67
3rd Quarter 1,378,325 3.25 2.40 8,122,339 9.11 6.38
4th Quarter 3,117,046 4.30 2.68 8,690,362 11.03 7.16
Annual 12,860,753 4.66 1.73 42,281,336 14.80 4.67
Fiscal Year 2010
1st Quarter 2,369,556 5.12 3.41 15,517,433 13.49 8.82
2nd Quarter 1,497,135 5.54 4.65 5,371,047 15.89 11.17
3rd Quarter 3,059,016 6.00 4.42 11,335,218 15.89 11.17
4th Quarter 1,621,468 5.64 4.44 3,741,122 14.50 11.28
Annual 8,547,175 6.00 3.41 35,964,820 15.89 8.82
Fiscal Year 2011
1st Quarter 3,281,751 6.55 6.55 6,069,472 16.58 11.55
2nd Quarter 3,070,201 7.87 6.56 8,671,782 19.93 16.04
3rd Quarter 1,534,934 7.90 7.00 5,729,814 19.17 16.83
4th Quarter 827,430 7.69 6.45 4,243,179 18.28 14.68
Annual 8,717,443 7.90 4.70 24,964,491 19.93 11.55
Fiscal Year 2012
1st Quarter 812,635 7.03 5.30 5,037,399 16.68 10.82
2nd Quarter 644,629 5.95 4.68 5,890,807 12.32 10.27
3rd Quarter 609,305 6.90 5.33 10,708,801 13.53 11.33
4th Quarter 1,328,881 6.45 4.45 15,006,469 12.20 6.94
Annual 8,717,443 7.90 4.70 24,964,491 19.93 11.55
Fiscal Year 2013
1st Quarter 1,324,543 5.87 4.83 6,183,866 8.90 7.43
2nd Quarter 644,473 5.80 4.95 3,520,607 8.58 7.88
3rd Quarter 1,376,099 8.10 5.70 6,124,332 9.77 8.38
4th Quarter 1,299,335 8.30 5.75 5,946,018 9.72 7.12
Annual 4,644,450 8.30 4.83 21,774,823 9.77 7.12
June 2013 109,130 6.95 5.75 2,133,453 8.08 7.12
July 2013 164,420 6.70 5.70 1,437,796 7.93 7.23
August 2013 278,119 7.58 6.30 1,459,896 8.76 7.55
(*) Data as of August 14, 2013
Source: Bloomberg
As of June 30, 2013 the outstanding ADRs represented 46,619,615 ADSs (equivalent to
466,196,150 common shares or 92.95% of our total common stock capital).

117
CRESUD S.A.C.I.F. y A.: CORPORATE GOVERNANCE CODE
Progress Report: degree of compliance with the Corporate Governance Code
Compliance Non-
compliance(1)
Report
(2) or Elaborate
(3)
Total(1)
Partial(1)
PRINCIPLE I. THE RELATIONSHIP AMONGST THE ISSUER, THE CONGLOMERATE THAT IT HEADS AND/OR IS PART OF AND
ITS RELATED PARTIES MUST BE TRANSPARENT
Recommendation I.1: Guarantee that the
Board discloses the policies that apply to
the relationship amongst the Issuer and the
conglomerate that it heads and/or is part of
and its related parties
Answer if:
The Issuer has internal procedures or
policies to authorize transactions with
related parties in accordance with Section
73 of Law No. 17,811 – Transactions with
shareholders and Board members, senior
management, and syndics and/or members
of the supervisory committee within the
purview of the conglomerate that it heads
and/or is a part of.
Explain the main guidelines of the standard
or internal policy
X
The Company engages in intercompany
transactions according to the terms set forth in
the law. Transactions are authorized by the
Board. To identify related parties, the Company
applies internal rules and submits issues to the
Audit Committee’s opinion when applicable.
The Board renders an opinion concerning these
transactions to be conducted in the matters
within the Board’s purview, which are defined
by the control authorities, issuing in each case
an opinion that is available to the shareholders
at the Company’s registered office. In all these
cases, intercompany transactions are disclosed
in quarterly and annual financial statements.
Recommendation I.2: Make sure that the
company has mechanisms to prevent
conflicts of interest.
Answer if:
The Issuer has, irrespective of currently
applicable rules and regulations, clear and
specific policies and procedures to identify,
handle and resolve any conflicts of interest
arising amongst the members of the Board
of Directors, senior management and
syndics and/or supervisory committee
members in their relationship with the Issuer
or with the Issuer’s related persons.
Describe the relevant aspects of such
policies and procedures.
X
The Company has a Code of Ethics that has
been signed by each one of the Company’s
members and applies to Directors, Syndics and
employees. The Company also has an Ethics
Committee which is responsible for resolving
any issues related to that code.
The Code of Ethics lays down ethical principles
and guidelines about accepted individual and/or
corporate behavior. Amongst other matters, this
code includes guidelines concerning conflicts of
interest. The Code prescribes that directors,
managers and employees must act with
honesty and integrity and must prevent their
behaviors from causing conflicts of interest with
the Company and if these were to arise, the
Code of Ethics must be informed in due time
and manner of any situation that concerns the
Code of Ethics or constitutes a violation
thereof.
The Company has a Map of Related Parties
that identifies the companies with which the
Issuer is in a controlling and/or significant
influence situation. This Map is updated every
quarter. Managers, Directors and Syndics sign
an affidavit every year concerning
Intercompany transactions.
Recommendation I.3: Prevent the undue
use of inside information.
Answer if:
The Issuer relies, without prejudice to
X
The Company has a Code of Ethics that lays
down the guidelines and mechanisms to
prevent the undue use of inside information.
This Code mandates that certain information is
in a confidential nature and that it can only be

118
currently applicable rules and regulations,
on accessible policies and mechanisms to
prevent the undue use of inside information
by the Board of Directors, senior
management, syndics and/or supervisory
committee members, controlling
shareholders or shareholders wielding
significant influence, participating
professionals and the rest of the persons
listed in Sections 7 and 33 of Executive
Order 677/2001.
Describe the relevant aspects of such
policies and procedures.
used for its intended purposes for the
Company’s benefit and must not be shared with
persons outside the Company or with
employees who do not need such confidential
information to discharge their duties. The Code
sets forth also that unintended disclosures of
confidential information must be avoided.
The Code of Ethics also contains guidelines
concerning compliance with the rules that
govern relevant information. As a general
principle, the Code prohibits directors,
managers and employees from using inside or
confidential information directly or through third
parties to trade securities in the market. It also
provides for a fixed period –before and after the
publication of financial statements- during
which employees, directors and syndics are
prohibited from trading Company securities.
The transmission of alerts about the
commencement of the period of non-availability
to conduct transactions works also as a
reminder. Such temporary restrictions may be
equally imposed whenever the Board sees it fit.
There are also information security procedures
for safeguarding the Company’s data.
PRINCIPLE II. LAY THE GROUNDWORK FOR THE ISSUER TO RELY ON ROBUST MANAGEMENT AND SUPERVISION
The corporate governance framework must:
Recommendation II. 1: Ensure that the
Board of Directors manages and supervises
the Issuer and provides it with strategic
direction.
II.1.1 Report if the Board of Directors
approves:
II.1.1.1 the Business Plan or the Company’s
strategic plan, as well as its annual
management goals and budgets.
X
An essential portion of the duties and
responsibilities discharged by the Executive
Committee consists in generating a strategic
plan for the Company and the forecasts
covered by the annual budget submitted to the
Board. It is through the Executive Committee
that objectives and strategies are developed
and then submitted to the Board, which
includes establishing the annual guidelines
defined for the main company departments.
II.1.1.2 the investment policy (in financial
assets and in capital expenditures), and its
financing policy.
X
At present the Company has a committee of
risks that approves financial instruments,
counterparts and investment limits. In addition,
the Board of Directors approves medium- and
long-term financing plans (corporate bonds –
Negotiable Obligations-, syndicated loans, etc)
and equity issues.
II.1.1.3 the corporate governance policy
(Compliance with the Corporate
Governance Code),
X
As regards corporate governance, the
Company has been implementing what has
been laid down by the rules and regulations
currently applicable to these matters issued by
the Argentine Securities Commission and the
Securities Exchange Commission (SEC) in
addition to what is suggested by the best
practices, in particular when concerning ethics
and Board behavior. To this end, the Board has

119
implemented a Code of Ethics that provides for
the different channels available for placement
of reports in the event of potential irregularities,
which offer direct access. Some of them are
managed by the Ethics Committee whilst other
are managed by the Audit Committee in
compliance with foreign legislation (SOX).
There is also the Corporate Governance Code,
approved by the Board of Directors and the
Rules of the Audit Committee.
II.1.1.4 the policy to select, assess and
remunerate senior management,
X
The Board of Directors complies with the
provisions under the Argentine Companies
Law, Section 255 as regards its management
duties. Therefore, the Board delegates the day-
to-day management of company businesses to
an Executive Committee in accordance with the
Company’s by-laws and Section 269 of the
Argentine Companies Law. The Executive
Committee’s members are chosen from
amongst the Board’s number and there must
be a minimum of five members, three of whom
will necessarily be the Chairman of the Board
and its two Vice-chairmen. The duties imposed
by the by-laws on the Executive Committee
include, without limitation, the appointment of
Executive Directors or analogous functional
levels, the scope of their functions, the
appointment of managers, including the general
manager, and a determination of their
remuneration levels. The Executive Committee
delegates on the office of the General Manager
and on the Human Resources Department the
definition of the remuneration payable to first-
line managers.
The above notwithstanding, the establishment
of a selection, evaluation and remuneration
policy is currently being analyzed.
II.1.1.5 the policy to assign responsibilities
to senior management,
X
The responsibilities to be assumed by first-line
managers have been laid down in the
document “Definition of Roles and
Responsibilities”, prepared by the Human
Resources Department pursuant to the powers
delegated by the Executive Committee and in
use at the Company.
The above notwithstanding, the establishment
of a policy to assign responsibilities is currently
being analyzed.
II.1.1.6 the supervision of succession
planning for senior management,
X
Pursuant to powers delegated by the Executive
Committee, it is the Office of the General
Manager and the Human Resources
Department that are responsible for supervising
succession planning at the management level.
Succession plans at the management level are
defined through the use of tools that permit to
assess performance and potential in each
case.
II.1.1.7 the enterprise social responsibility
policy,
X
When it comes to Enterprise Social
Responsibility, the Executive Committee
considers and approves proposals in this field
submitted to its consideration by the
Institutional Relations Department.

120
The Company has been active in these matters
for some years already by:
Integrating and educating children and
youths in the communities surrounding its
agribusiness ventures through financial
and academic support to the educational
institutions that act in these territories;
Providing a number of NGOs with spaces
(plus the logistical and financial support) in
the Company’s buildings and shopping
centers for these organizations to deploy
activities such as dissemination, fund-
raising and affiliation, to name but a few,
etc.;
Permanently creating and financing
different entities whose purpose is to
rescue and integrate children and youths
that are either homeless or in social risk
situations;
Supporting scientific, cultural and artistic
projects through the mechanisms
prescribed by the Patronage Law;
Constantly cooperating with communities
neighboring with our shopping centers and
rental buildings;
Caring for the environment through strict
policies issued by the Board.
II.1.1.8 comprehensive risk management,
internal control, and fraud prevention
policies,
X
The Company will evaluate in the future the
need for formalizing policies concerning
comprehensive risk management and fraud
prevention. This notwithstanding, the functions
consisting in risk management, internal control
and fraud prevention at the Company are
discharged by each department in line with
their areas of responsibility. The Company
assesses the efficacy of internal control
focused on the issuance of financial reports
using to that end the methodology of the COSO
Report (Committee of Sponsoring Organization
of the Tradeway Commission).
Should there be complaints or hints of potential
frauds, they are reported to the Ethics
Committee through the communication
channels in place and they can be placed
anonymously.
The information received by the Ethics
Committee is treated as confidential and action
measures are taken to clarify and settle the
situations reported.
II.1.1.9 he training and continued education
policy applicable to the members of the
Board of Directors and senior management.
Should the company have these policies in
place, insert a description of their main
highlights X
The Company encourages involvement in
training activities and in professional
refreshment courses for the Board and Senior
Management. It is Company policy to have its
Board of Directors and management line
trained and updated in regulatory matters in the
framework of the experience and professional
qualities of Board members and the
responsibilities that they have. The Company
deems it important to better conduct business
that the Board and Senior Management should

121
be trained in matters that favor better business
conduct promoting and fostering participation in
congresses and in national and international
events that address issues associated to the
activities deployed by the directors and first-line
managers.
II.1.2 If deemed relevant, please insert other
policies applied by the Board that have not
been mentioned and detail significant
aspects.
There are no other policies that are considered
relevant in their implementation other than as
previously discussed.
II.1.3 The Issuer has in place a policy to
ensure the availability of relevant
information for its Board of Directors to
make decisions and a channel for direct
consultation with its management lines that
is symmetrical for all its members
(executive, external and independent) on an
equal footing and sufficiently in advance so
as to enable appropriate analysis. Explain
further.
X
The Board members are provided in advance
with the basic details required for making
decisions on the matters that will be submitted
to consideration by the Board of Directors at its
meetings. Each Director receives from the
Office of the General Manager in advance and
in virtual format the files with the database that
contains the matters that will be discussed in
each meeting.
II.1.4 The matters submitted to
consideration by the Board of Directors are
accompanied by an analysis of the risks
associated to the decisions that may be
adopted, taking into account the level of
enterprise risk defined as acceptable by the
Issuer. Explain further.
X
The Board analyzes the risks associated to
decision-making after the submission made by
the Executive Committee and the CEO of each
one of the issues to the Board, taking into
account the level of enterprise risk defined as
acceptable for each business and according to
each market situation.
Recommendation II.2: Make sure that the
Issuer exerts effective controls over
management.
Answer if:
The Board of Directors verifies:
II.2.1 that the annual budget and Business
Plan are complied with,
X
The Company prepares annual budgets that
are consolidated by the Budget Area and
Management Control and then verified by the
Executive Committee.
Once approved by the Board of Directors, they
are used as the guidelines to be applied in the
normal conduct of business and as a control
element.
The Office of the General Manager conducts a
quarterly analysis and follow-up of deviations,
which are reported to the Board of Directors
thus making sure that it identifies any measures
necessary to rectify or confirm the course of
business.
II.2.2 senior management performance and
their attainment of the goals set for them
(the level of earnings as forecast versus
actually attained, financial ratings, financial
reporting quality, market share, etc.).
Describe the highlights of the Issuer’s
Management Control policy detailing the
techniques employed and the frequency of
monitoring by the Board of Directors.
X
Without prejudice to the absence in the
Company of a Management Control Policy, the
Executive Committee assesses the
performance of its first-line managers as well
as the attainment of objectives based on the
information provided by the CEO and the
Human Resources Department taking into
account the attainment of objectives, the level
of earnings obtained and the Company’s
targets for each term in office.

122
Recommendation II.3: Disclose the process
to evaluate Board of Directors performance
and its impact.
Answer if:
II.3.1 Each member of the Board of
Directors abides by the Bank’s By-laws and,
when applicable, by the rules that govern
the operation of the Board of Directors.
Detail the main guidelines of the internal
rules. Indicate the degree of compliance
with the Bank’s By-laws and its internal
rules.
X
The Board of Directors abides by the rules and
regulations that apply to the Issuer and by the
By-laws. Therefore, it is unnecessary and
redundant, in the Board’s opinion, to issue
Rules to govern their operation.
II.3.2 The Board of Directors presents the
outcome of its management actions taking
into account the targets fixed at the
beginning of the period in a manner such
that shareholders are able to evaluate the
degree of compliance with such objectives,
which contain both financial and non-
financial aspects. In addition, the Board of
Directors presents a diagnosis about the
degree of compliance with the policies
mentioned in Recommendation II,
paragraphs II.1.1. and II.1.2.
Detail the highlights of the evaluation made
by the Annual General Meeting about the
degree of compliance by the Board of
Directors with the goals established and the
policies mentioned in Recommendation II,
Sections II.1.1 y II.1.2, with an indication of
the date of the AGM where such evaluation
was presented.
X
Through its Annual Report and Management
Discussion & Analysis, the Board presents the
outcome of its actions and maintains
permanent communication with the Company’s
investors through its Web site and in the
interaction taking place at shareholders’
meetings, keeping shareholders abreast on the
results of the Company’s operations and the
degree of objective attainment. The Board is
evaluated by each Ordinary Shareholders’
General Meeting in accordance with the rules
and regulations in force as contained in the
Argentine Companies Law and in the
Company’s By-laws.
Recommendation II.4: The number of
external and independent directors must be
a significant proportion of the Issuer’s Board
of Directors membership.
Answer if:
II.4.1 The proportion of executive members,
external and independent (with the latter as
defined by the rules of this Commission) of
the Board of Directors is in keeping with the
capital structure of the Issuer. Explain
further.
X
Since 2005 the Company’s Board of Directors
has comprised a number of independent
directors higher than required by currently
applicable rules and regulations and in excess
of 20%.
II.4.2 In the current year, the shareholders
agreed at a General Shareholders’ Meeting
on a policy aimed at maintaining a
proportion of at least 20% of independent
members over the total number of Board
members.
Describe the highlights of this policy and of
any shareholder agreement that explains
the manner in which the members of the
Board of Directors are appointed and their
terms in office. Indicate if questions have
been raised about the independence of
Board members and if there have been
abstentions caused by conflicts of interest.
X
The shareholders have not agreed on any
policy seeking to maintain a proportion of at
least 20% of independent members on the total
Board. When it comes to the criteria of
independence concerning the members of the
Board, their independence has never been
objected to and there has never been
abstentions due to conflicts of interest.
For the time being, the Board does not see the
need for laying down any such policies.
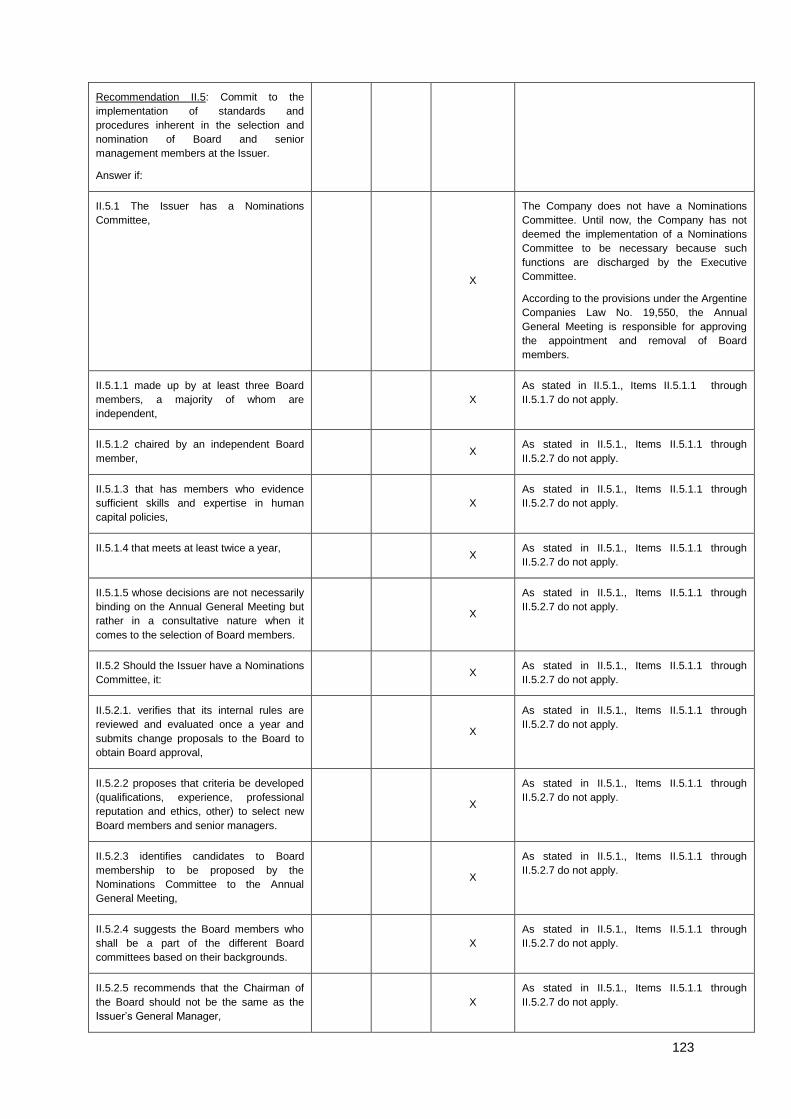
123
Recommendation II.5: Commit to the
implementation of standards and
procedures inherent in the selection and
nomination of Board and senior
management members at the Issuer.
Answer if:
II.5.1 The Issuer has a Nominations
Committee,
X
The Company does not have a Nominations
Committee. Until now, the Company has not
deemed the implementation of a Nominations
Committee to be necessary because such
functions are discharged by the Executive
Committee.
According to the provisions under the Argentine
Companies Law No. 19,550, the Annual
General Meeting is responsible for approving
the appointment and removal of Board
members.
II.5.1.1 made up by at least three Board
members, a majority of whom are
independent,
X
As stated in II.5.1., Items II.5.1.1 through
II.5.1.7 do not apply.
II.5.1.2 chaired by an independent Board
member, X
As stated in II.5.1., Items II.5.1.1 through
II.5.2.7 do not apply.
II.5.1.3 that has members who evidence
sufficient skills and expertise in human
capital policies,
X
As stated in II.5.1., Items II.5.1.1 through
II.5.2.7 do not apply.
II.5.1.4 that meets at least twice a year, X
As stated in II.5.1., Items II.5.1.1 through
II.5.2.7 do not apply.
II.5.1.5 whose decisions are not necessarily
binding on the Annual General Meeting but
rather in a consultative nature when it
comes to the selection of Board members.
X
As stated in II.5.1., Items II.5.1.1 through
II.5.2.7 do not apply.
II.5.2 Should the Issuer have a Nominations
Committee, it: X
As stated in II.5.1., Items II.5.1.1 through
II.5.2.7 do not apply.
II.5.2.1. verifies that its internal rules are
reviewed and evaluated once a year and
submits change proposals to the Board to
obtain Board approval,
X
As stated in II.5.1., Items II.5.1.1 through
II.5.2.7 do not apply.
II.5.2.2 proposes that criteria be developed
(qualifications, experience, professional
reputation and ethics, other) to select new
Board members and senior managers.
X
As stated in II.5.1., Items II.5.1.1 through
II.5.2.7 do not apply.
II.5.2.3 identifies candidates to Board
membership to be proposed by the
Nominations Committee to the Annual
General Meeting,
X
As stated in II.5.1., Items II.5.1.1 through
II.5.2.7 do not apply.
II.5.2.4 suggests the Board members who
shall be a part of the different Board
committees based on their backgrounds.
X
As stated in II.5.1., Items II.5.1.1 through
II.5.2.7 do not apply.
II.5.2.5 recommends that the Chairman of
the Board should not be the same as the
Issuer’s General Manager,
X
As stated in II.5.1., Items II.5.1.1 through
II.5.2.7 do not apply.

124
II.5.2.6 ensures that the curricula vitae of
the Issuer’s Board and Senior Management
members are available in the Issuer’s web-
page and that the duration of Board
members’ terms in office is equally
disclosed in the web page,
X
As stated in II.5.1., Items II.5.1.1 through
II.5.2.7 do not apply.
II.5.2.7 corroborates that there are
succession plans in place for Board and
Senior Management members.
X
As stated in II.5.1., Items II.5.1.1 through
II.5.2.7 do not apply.
II.5.3 If relevant, please add policies
implemented at the initiative of the Issuer’s
Nominations Committee which have not
been mentioned in the preceding Item.
X
As stated in II.5.1, the item discussed in II.5.3
does not apply.
Recommendation II.6: Assess the
advisability of Board members and/or
syndics and/or supervisory committee
members discharging functions at several
Issuers.
Answer if:
The Issuer imposes a limit on the ability of
the members of the Board of Directors
and/or syndics and/or supervisory
committee to discharge functions at other
entities that do not belong to the
conglomerate that the Company heads or of
which it is a part. Specify any such limit and
detail if there has been a breach of said limit
in the course of the year.
X
The Company does not have a limiting rule in
place. The Company considers their
engagement sufficient in so far as it is
adequate to the Company’s needs.
Recommendation II.7: Make sure that
Board and Senior management members at
the Issuer are trained and develop their
skills.
Answer if:
II.7.1. The Issuer has Continued Training
Programs in connection with the Issuer’s
needs for the members of the Board of
Directors and senior management, that
include topics concerning their roles and
responsibilities, comprehensive enterprise
risk management, knowledge specific to the
business and its regulations, corporate
governance dynamics and enterprise social
responsibility. In the case of the Audit
Committee members, international
accounting standards, auditing standards
and internal controls and specific
regulations in the capital markets. Describe
the programs implemented in the year and
their degree of compliance.
X
It is Company policy that the Board of
Directors, the Executive Committee, the Audit
Committee and its management line should be
trained and maintained updated in regulatory
matters in the framework of the experience and
professional qualities of their members and the
responsibilities that they have. In the exercise
of the functions entrusted to it by the By-laws,
the Executive Committee, together with the
CEO and the Human Resources Department,
outline the responsibilities and powers of first-
line managers. The Company does have in
place training and education programs in
various matters that are given by Company
personnel and that include first-line managers.
The Company fosters participation in training
activities and professional refreshment courses
for the Board and Senior Management. In the
case of the Audit Committee, training and
education are specially oriented towards
updates in accounting standards and specific
regulations concerning the capital markets and
the Company has to this end a specific budget.
The Company deems it important to better
conduct business that the Board and first-line
Managers should be trained in matters that

125
favor better business conduct promoting and
fostering participation in congresses and in
national and international events that address
issues associated to the activities deployed by
the directors and first-line managers.
The above notwithstanding, the establishment
of a continued education program is currently
being analyzed.
II.7.2. The Issuer incentivizes Board and
Senior Management members by means
other than discussed in II.7.1 to maintain
permanent training supplementing their
education level in a manner such as to add
value to the Issuer. Indicate how the Issuer
does this.
X
The Issuer incentivizes the involvement of
Board members in specific areas through
invitations to participate in events with contents
akin to their roles, orientation activities and
updates in regulatory matters.
PRINCIPLE III. ENDORSE AN EFFECTIVE POLICY FOR IDENTIFYING, MEASURING, MANAGING AND DISCLOSING ENTERPRISE
RISK.
In the framework for corporate governance:
Recommendation III: The Board of Directors
must rely on a policy for comprehensive
enterprise risk management and monitor its
adequate implementation.
III.1 Answer if:
The Issuer has in place comprehensive
enterprise risk management policies
(mandating compliance with strategic,
operational, financial, reporting, legal and
regulatory objectives, among others).
Describe their most relevant aspects.
X
The Company does not have policies for
comprehensively managing risks. In lieu of
these policies, the Board undertakes actions to
identify, evaluate and mitigate the Company’s
exposure to strategic, financial, operating and
corporate governance risks. The Board of
Directors, with the involvement of the Executive
Committee, permanently evaluates its business
activities, which includes the risks, the
opportunities offered by market conditions at
each time and the attainment of the business’s
operating and strategic objectives. As part of its
habitual practice of managing risks, the Board
permanently monitors, through the Financial
Risk Committee, the inherent investments and
risks. In addition, the Company has an internal
control system to prevent and identify risks,
using the comprehensive internal control
framework issued by the Committee of
Sponsoring Organization of the Tradeway
Commission (COSO Report) to assess the
effectiveness of internal controls over
accounting information.
III.2 here is a Risk Management Committee
as part of the Board of Directors or of the
office of the General Manager. Report on
the existence of manuals of procedures and
detail the main risk factors that are specific
to the Issuer or its business and the
implemented mitigation actions. In the
absence of a Risk Management Committee,
please describe the supervisory role played
by the Audit Committee when it comes to
managing risks.
In addition, specify the degree of interaction
between the Board of Directors or of its
committees with the Issuer’s General
Manager in terms of comprehensive
X
The Company does not have a Risk
Management Committee. Instead, the Issuer
conducts permanent activities to identify risks
inherent in its activity and any necessary
mitigation actions. These actions are conducted
by the Executive Committee within the Board
As stated in III.1.
The Executive Committee or the Office of the
General Manager permanently assess risks at
the time of making decisions, availing
themselves of sufficient and necessary
information provided by the Company’s
different areas or derived from the actions of
internal committees that undertake risk
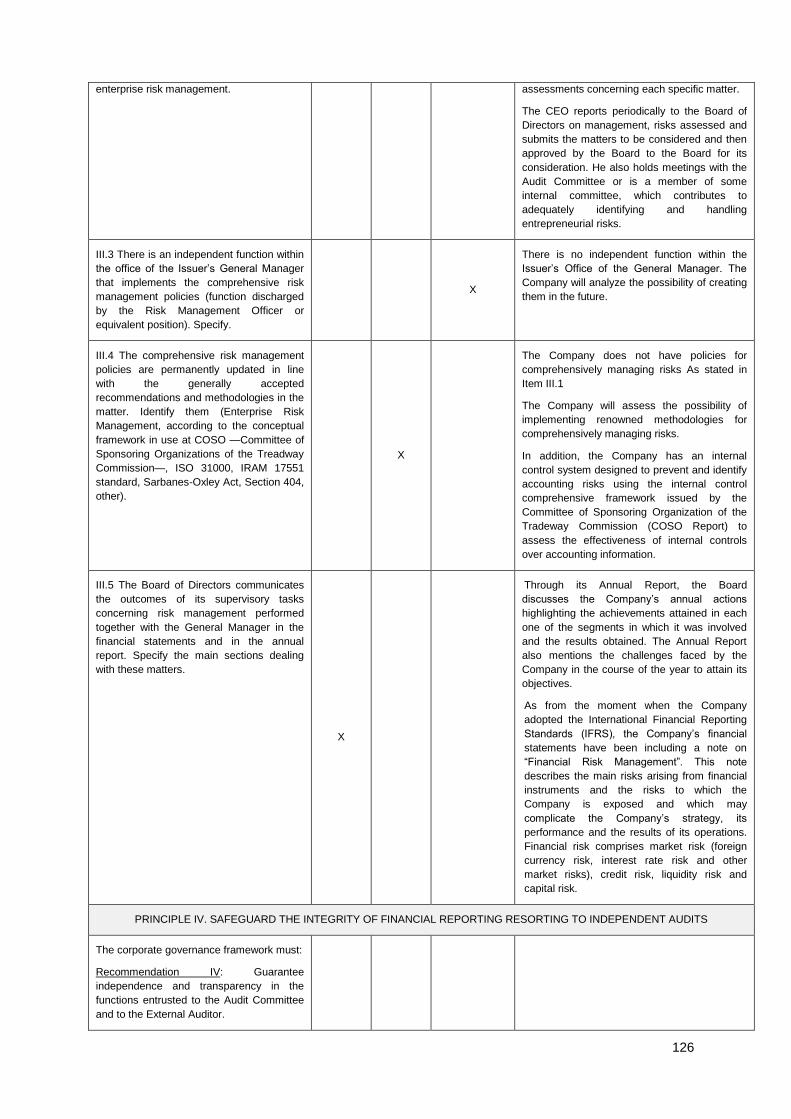
126
enterprise risk management. assessments concerning each specific matter.
The CEO reports periodically to the Board of
Directors on management, risks assessed and
submits the matters to be considered and then
approved by the Board to the Board for its
consideration. He also holds meetings with the
Audit Committee or is a member of some
internal committee, which contributes to
adequately identifying and handling
entrepreneurial risks.
III.3 There is an independent function within
the office of the Issuer’s General Manager
that implements the comprehensive risk
management policies (function discharged
by the Risk Management Officer or
equivalent position). Specify.
X
There is no independent function within the
Issuer’s Office of the General Manager. The
Company will analyze the possibility of creating
them in the future.
III.4 The comprehensive risk management
policies are permanently updated in line
with the generally accepted
recommendations and methodologies in the
matter. Identify them (Enterprise Risk
Management, according to the conceptual
framework in use at COSO —Committee of
Sponsoring Organizations of the Treadway
Commission—, ISO 31000, IRAM 17551
standard, Sarbanes-Oxley Act, Section 404,
other).
X
The Company does not have policies for
comprehensively managing risks As stated in
Item III.1
The Company will assess the possibility of
implementing renowned methodologies for
comprehensively managing risks.
In addition, the Company has an internal
control system designed to prevent and identify
accounting risks using the internal control
comprehensive framework issued by the
Committee of Sponsoring Organization of the
Tradeway Commission (COSO Report) to
assess the effectiveness of internal controls
over accounting information.
III.5 The Board of Directors communicates
the outcomes of its supervisory tasks
concerning risk management performed
together with the General Manager in the
financial statements and in the annual
report. Specify the main sections dealing
with these matters.
X
Through its Annual Report, the Board
discusses the Company’s annual actions
highlighting the achievements attained in each
one of the segments in which it was involved
and the results obtained. The Annual Report
also mentions the challenges faced by the
Company in the course of the year to attain its
objectives.
As from the moment when the Company
adopted the International Financial Reporting
Standards (IFRS), the Company’s financial
statements have been including a note on
“Financial Risk Management”. This note
describes the main risks arising from financial
instruments and the risks to which the
Company is exposed and which may
complicate the Company’s strategy, its
performance and the results of its operations.
Financial risk comprises market risk (foreign
currency risk, interest rate risk and other
market risks), credit risk, liquidity risk and
capital risk.
PRINCIPLE IV. SAFEGUARD THE INTEGRITY OF FINANCIAL REPORTING RESORTING TO INDEPENDENT AUDITS
The corporate governance framework must:
Recommendation IV: Guarantee
independence and transparency in the
functions entrusted to the Audit Committee
and to the External Auditor.
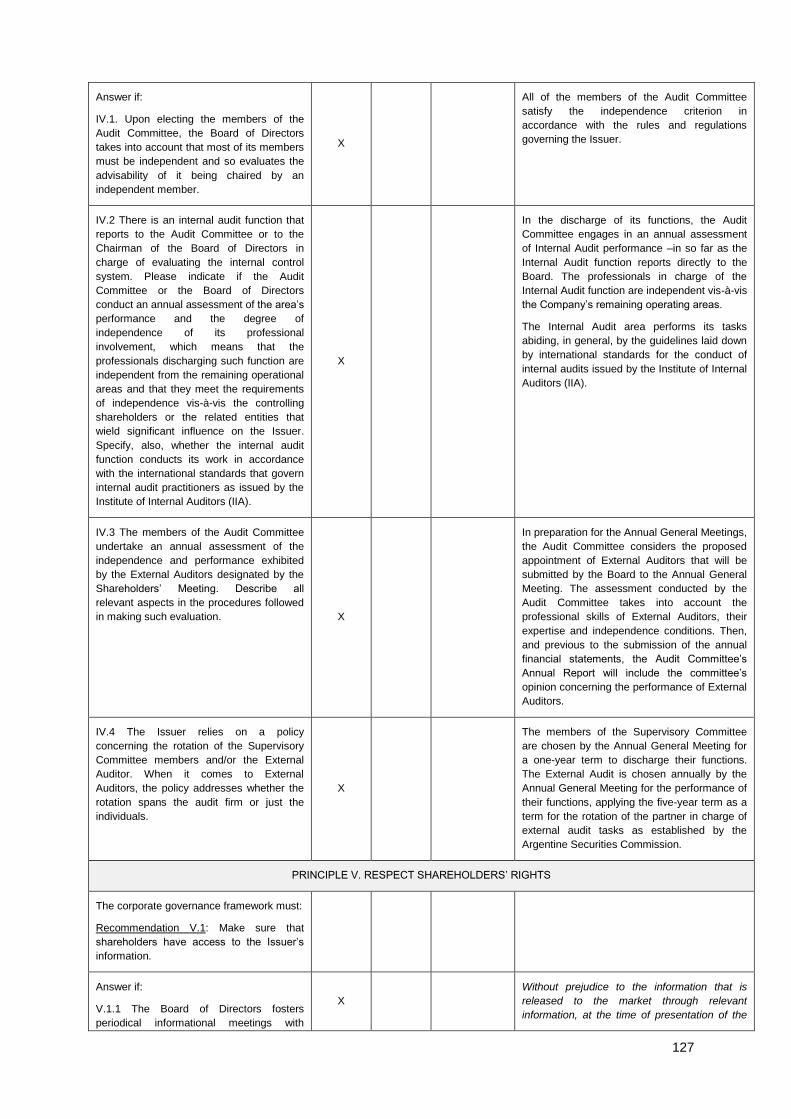
127
Answer if:
IV.1. Upon electing the members of the
Audit Committee, the Board of Directors
takes into account that most of its members
must be independent and so evaluates the
advisability of it being chaired by an
independent member.
X
All of the members of the Audit Committee
satisfy the independence criterion in
accordance with the rules and regulations
governing the Issuer.
IV.2 There is an internal audit function that
reports to the Audit Committee or to the
Chairman of the Board of Directors in
charge of evaluating the internal control
system. Please indicate if the Audit
Committee or the Board of Directors
conduct an annual assessment of the area’s
performance and the degree of
independence of its professional
involvement, which means that the
professionals discharging such function are
independent from the remaining operational
areas and that they meet the requirements
of independence vis-à-vis the controlling
shareholders or the related entities that
wield significant influence on the Issuer.
Specify, also, whether the internal audit
function conducts its work in accordance
with the international standards that govern
internal audit practitioners as issued by the
Institute of Internal Auditors (IIA).
X
In the discharge of its functions, the Audit
Committee engages in an annual assessment
of Internal Audit performance –in so far as the
Internal Audit function reports directly to the
Board. The professionals in charge of the
Internal Audit function are independent vis-à-vis
the Company’s remaining operating areas.
The Internal Audit area performs its tasks
abiding, in general, by the guidelines laid down
by international standards for the conduct of
internal audits issued by the Institute of Internal
Auditors (IIA).
IV.3 The members of the Audit Committee
undertake an annual assessment of the
independence and performance exhibited
by the External Auditors designated by the
Shareholders’ Meeting. Describe all
relevant aspects in the procedures followed
in making such evaluation. X
In preparation for the Annual General Meetings,
the Audit Committee considers the proposed
appointment of External Auditors that will be
submitted by the Board to the Annual General
Meeting. The assessment conducted by the
Audit Committee takes into account the
professional skills of External Auditors, their
expertise and independence conditions. Then,
and previous to the submission of the annual
financial statements, the Audit Committee’s
Annual Report will include the committee’s
opinion concerning the performance of External
Auditors.
IV.4 The Issuer relies on a policy
concerning the rotation of the Supervisory
Committee members and/or the External
Auditor. When it comes to External
Auditors, the policy addresses whether the
rotation spans the audit firm or just the
individuals.
X
The members of the Supervisory Committee
are chosen by the Annual General Meeting for
a one-year term to discharge their functions.
The External Audit is chosen annually by the
Annual General Meeting for the performance of
their functions, applying the five-year term as a
term for the rotation of the partner in charge of
external audit tasks as established by the
Argentine Securities Commission.
PRINCIPLE V. RESPECT SHAREHOLDERS’ RIGHTS
The corporate governance framework must:
Recommendation V.1: Make sure that
shareholders have access to the Issuer’s
information.
Answer if:
V.1.1 The Board of Directors fosters
periodical informational meetings with
X
Without prejudice to the information that is
released to the market through relevant
information, at the time of presentation of the

128
shareholders, which coincide with the
submission of interim financial statements.
Explain further, providing the quantity and
frequency of the meetings held in the
course of the year.
interim financial statements and the annual
financial statements, the Company sends a
document to investors called “press release”
and after that, the Company hosts a conference
call with on-line presentation where investors
are able to contact the Company’s officers
directly and may ask questions in real-time.
V.1.2 The Issuer relies on “information for
investors” mechanisms and on an area that
specializes in addressing investors’
concerns. In addition, the Issuer has a web-
site accessible to shareholders and other
investors serving as an access channel for
them to contact each other. Detail.
X
The Issuer has mechanisms to inform investors
in real time and an Investors Relations
Department exclusively devoted to dealing with
investors’ requirements and enquiries and
provides information to shareholders and other
investors. In addition, the Company has a
website through which the shareholders and
other investors may contact this department
and obtain information about the Company and
receive an answer about all types of enquiries
concerning the Company.
Recommendation V.2: Promote
shareholders’ active involvement.
Answer if:
V.2.1 The Board of Directors has measures
in place to foster the participation of all
shareholders at the AGMs. Explain further,
distinguishing the measures required by
statutory provisions from those voluntarily
offered by the Issuer to its shareholders. X
In addition to the information published in the
Financial Information Highway and to the
information released to the market through the
advertisement department of the Buenos Aires
Stock Exchange, the Board engages in a
thorough follow-up of potential attendants
previous to the shareholders’ meetings in order
to ensure the highest number of attendants
possible. This follow-up also spans ADR
holders through institutional contact with Bank
of New York Mellon (BONY) and its
correspondent bank in the Argentine Republic,
who are furnished with a translated version of
the agenda and other information as requested.
V.2.2 The Annual General Meeting has a
set of rules for its operation to make sure
that the information will be available to the
shareholders sufficiently in advance for
decision-making purposes. Describe the
salient points of this set of rules. X
The Annual General Meeting does not have
rules governing its operation. However, these
shareholders’ meetings are called and held in
accordance with the provisions under the
Argentine Companies Law No. 19,550 and all
applicable rules and regulations that are issued
by the control authority as these establish the
terms for informing shareholders and
furnishing them with the documentation
submitted to the annual general meetings.
V.2.3 The Issuer has mechanisms in place
for minority shareholders to propose
matters for consideration by the Annual
General Meeting in line with the provisions
in currently applicable rules and regulations.
Provide further information on the results.
X
Neither the by-laws, nor the operating
procedures prevent receiving such proposals.
As of the date hereof, there have not been
proposals of specific issues.
V.2.4 The Issuer relies on policies to
stimulate the involvement of the most
relevant shareholders such as institutional
investors. Specify. X
The Company does not make distinctions
concerning the relevance of its shareholders,
they are all afforded identical treatment.
Through the Bank that has custody over the
ADRs, the Company fosters the participation of
ADR holders –many of whom are institutional
investors- in Annual General Meetings.
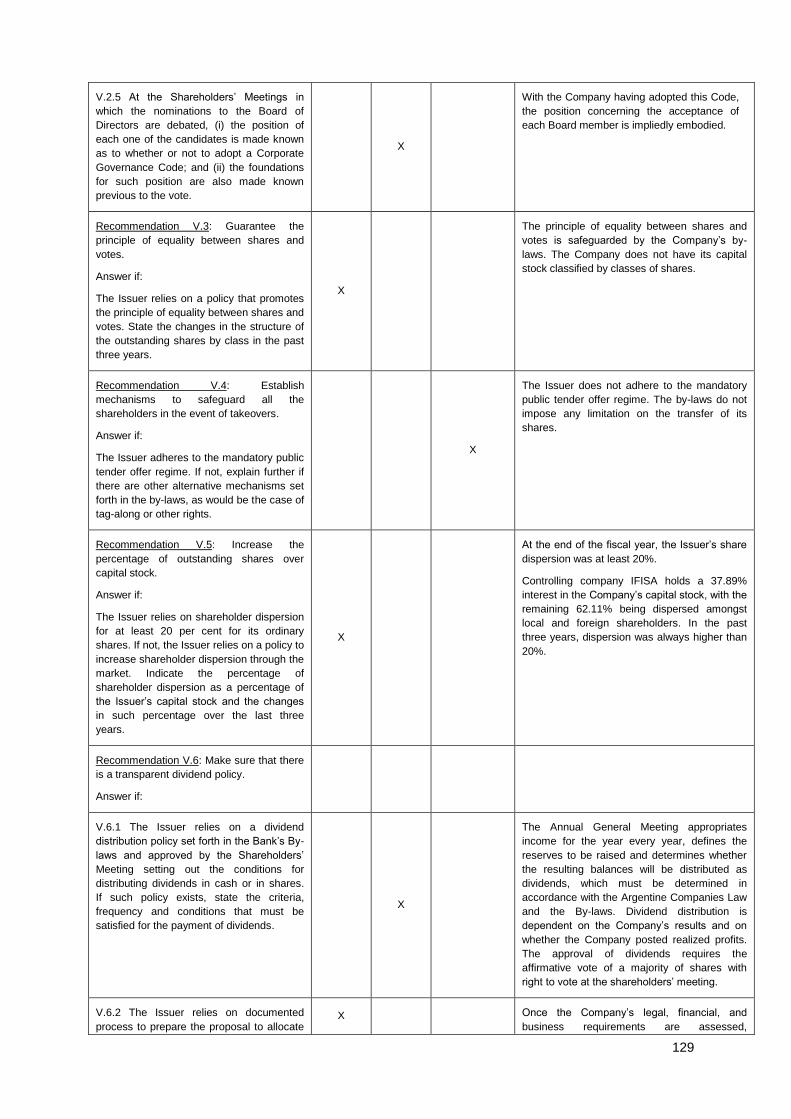
129
V.2.5 At the Shareholders’ Meetings in
which the nominations to the Board of
Directors are debated, (i) the position of
each one of the candidates is made known
as to whether or not to adopt a Corporate
Governance Code; and (ii) the foundations
for such position are also made known
previous to the vote.
X
With the Company having adopted this Code,
the position concerning the acceptance of
each Board member is impliedly embodied.
Recommendation V.3: Guarantee the
principle of equality between shares and
votes.
Answer if:
The Issuer relies on a policy that promotes
the principle of equality between shares and
votes. State the changes in the structure of
the outstanding shares by class in the past
three years.
X
The principle of equality between shares and
votes is safeguarded by the Company’s by-
laws. The Company does not have its capital
stock classified by classes of shares.
Recommendation V.4: Establish
mechanisms to safeguard all the
shareholders in the event of takeovers.
Answer if:
The Issuer adheres to the mandatory public
tender offer regime. If not, explain further if
there are other alternative mechanisms set
forth in the by-laws, as would be the case of
tag-along or other rights.
X
The Issuer does not adhere to the mandatory
public tender offer regime. The by-laws do not
impose any limitation on the transfer of its
shares.
Recommendation V.5: Increase the
percentage of outstanding shares over
capital stock.
Answer if:
The Issuer relies on shareholder dispersion
for at least 20 per cent for its ordinary
shares. If not, the Issuer relies on a policy to
increase shareholder dispersion through the
market. Indicate the percentage of
shareholder dispersion as a percentage of
the Issuer’s capital stock and the changes
in such percentage over the last three
years.
X
At the end of the fiscal year, the Issuer’s share
dispersion was at least 20%.
Controlling company IFISA holds a 37.89%
interest in the Company’s capital stock, with the
remaining 62.11% being dispersed amongst
local and foreign shareholders. In the past
three years, dispersion was always higher than
20%.
Recommendation V.6: Make sure that there
is a transparent dividend policy.
Answer if:
V.6.1 The Issuer relies on a dividend
distribution policy set forth in the Bank’s By-
laws and approved by the Shareholders’
Meeting setting out the conditions for
distributing dividends in cash or in shares.
If such policy exists, state the criteria,
frequency and conditions that must be
satisfied for the payment of dividends.
X
The Annual General Meeting appropriates
income for the year every year, defines the
reserves to be raised and determines whether
the resulting balances will be distributed as
dividends, which must be determined in
accordance with the Argentine Companies Law
and the By-laws. Dividend distribution is
dependent on the Company’s results and on
whether the Company posted realized profits.
The approval of dividends requires the
affirmative vote of a majority of shares with
right to vote at the shareholders’ meeting.
V.6.2 The Issuer relies on documented
process to prepare the proposal to allocate X Once the Company’s legal, financial, and
business requirements are assessed,

130
the Issuer’s retained earnings in order to
raise reserves –be them statutory, voluntary
and contemplated by the by-laws-, transfer
earnings to future fiscal years and/or pay
dividends.
Explain these processes further and identify
the minutes of the Annual General Meeting
that approves the distribution (in cash or in
shares) or not of dividends, if this is not
contemplated in the By-laws.
Management prepares proposals to appropriate
results and submits them to the Board.
Afterwards, the Board submits its proposal to
the respective Annual General Meeting.
PRINCIPLE VI. MAINTAIN DIRECT AND RESPONSIBLE BONDS WITH THE COMMUNITY
The corporate governance framework must:
Recommendation VI: Disclose to the
community matters concerning the Issuer
and provide a direct means of
communication to the company.
Answer if:
VI.1 The Issuer has a website accessible to
the public and updated that should supply
not only relevant company information (the
Bank’s By-laws, the conglomerate, the
composition of the Board of Directors,
financial statements, annual reports, to
name but a few) but also receive the
concerns of users in general.
X
The Company has a website for the public in
general to communicate with the following
areas: Investor Relations, Institutional
Relations, Commercial Areas and Human
Resources. In addition, this web-site allows the
community to communicate with the Ethics
Committee to deal with users’ concerns.
VI.2 The Issuer releases a Social and
Environmental Responsibility Statement on
an annual basis, verified by an independent
External Auditor. If this statement is
released, state its scope or its legal or
geographical coverage and where it is
available. Specify the rules or initiatives
adopted to implement the enterprise social
responsibility policy (Global Reporting
Initiative and/or the UN’s Global Pact, ISO
26.000, SA8000, UN’s Millennium
Development Goals, SGE 21-Foretica, AA
1000, Ecuador Principles, to name but a
few).
X
The First Report on Enterprise Social
Responsibility issued by the Company
describes the route followed by the Company
based on the economic, social and
environmental performance indicators
prescribed by the Global Reporting Initiative
(GRI). It is the most recent indicators –as
supplied by version G3 for the period starting
on January 1, 2011 and ended on June 30,
2012– that are applied. And the report deals
solely with the Company’s assets located in
Argentina. The above notwithstanding, the
issuance of a Social and Environmental
Responsibility Statement is being analyzed.
PRINCIPLE VII. REMUNERATE EQUITABLY AND RESPONSIBLY
The corporate governance framework must:
Recommendation VII: Establish clear
policies to remunerate the Issuer’s Board
and Senior Management members, giving
special consideration to any limits imposed
by contracts or the by-laws based on the
existence of earnings or not.
Answer if:
VII.1. The Issuer relies on a Remunerations
Committee:
X
As of the date of this report, the Company did
not have a Remunerations Committee, which
is furthermore not required by currently
applicable rules and regulations. Directors’
remuneration is determined in conformity with
the provisions under the Argentine Companies
Law No. 19,550 taking into account whether
directors discharge technical and
administrative duties or not and based on the
131
Company’s earnings for the fiscal year.
On an annual basis, the Audit Committee
considers and renders an opinion on the
proposal of directors’ fees that the Board will
submit to the Annual General Meeting for its
approval.
VII.1.1 made up by at least three Board
members, a majority of whom are
independent,
X
As stated in VII.1 Items VII.1.1 through VII.1.5
do not apply.
VII.1.2 chaired by an independent Board
member, X
As stated in VII.1 Items VII.1.1 through VII.1.5
do not apply.
VII.1.3 that has members who evidence
sufficient skills and expertise in human
capital policies,
X
As stated in VII.1 Items VII.1.1 through VII.1.5
do not apply.
VII.1.4 that meets at least twice a year, X
As stated in VII.1 Items VII.1.1 through VII.1.5
do not apply.
VII.1.5 whose decisions are not necessarily
binding on the Annual General Meeting or
on the Surveillance Committee but rather in
a consultative nature when it comes to the
remuneration of Board members.
X
As stated in VII.1 Items VII.1.1 through VII.1.5
do not apply.
VII.2 Should the Issuer have a
Remunerations Committee, it: X
As stated in VII.1, the issues discussed in Items
VII. 2 to VII 2.7 do not apply.
VII.2.1 makes sure that there is a clear
relationship between the performance of
key personnel and its fixed and variable
remuneration taking into account the risks
taken on and their management,
X
As stated in VII.1, the issues discussed in Items
VII. 2 to VII 2.7 do not apply.
VII.2.2 supervises that the variable portion
of the remuneration of Board members and
Senior Management members is linked to
the Issuer’s medium- and/or long-term
performance,
X
As stated in VII.1, the issues discussed in Items
VII. 2 to VII 2.7 do not apply.
VII.2.3 reviews the Issuer’s position vis-à-
vis competitors concerning its policies and
practices applicable to the remunerations
and benefits it pays and recommends
whether to modify them or not,
X
As stated in VII.1, the issues discussed in Items
VII. 2 to VII 2.7 do not apply.
VII.2.4 defines and communicates the policy
applicable to key personnel retention,
promotion, dismissal and suspension,
X
As stated in VII.1, the issues discussed in Items
VII. 2 to VII 2.7 do not apply.
VII.2.5 informs the guidelines that determine
the retirement plans of the Issuer’s Board
and Senior Management members,
X
As stated in VII.1, the issues discussed in Items
VII. 2 to VII 2.7 do not apply.
VII.2.6 is regularly accountable to the Board
and the Annual General Shareholders’
Meeting on the actions undertaken and the
issues analyzed at their meetings,
X
As stated in VII.1, the issues discussed in Items
VII. 2 to VII 2.7 do not apply
VII.2.7 ensures that the Chairman of the
Remunerations Committee attends the
Annual General Meeting that approves
X As stated in VII.1, the issues discussed in Items
VII. 2 to VII 2.7 do not apply

132
remunerations to the Board for him to
explain the Issuer’s policy concerning the
remuneration of the Board and the Senior
Management members.
VII.3 If relevant, please add policies
implemented at the initiative of the Issuer’s
Remunerations Committee which have not
been mentioned in the preceding Item.
X
Not applicable
VII.4 In the absence of a Remunerations
Committee, explain how the functions
described in VII. 2 are discharged within the
Board itself.
X
In accordance with what has been discussed in Item VII.1, the Company does not have a Remunerations Committee.
Based on the proposal of the fees to be paid to the Board members to be approved by the Annual General Meeting, the Audit Committee assesses and renders an opinion on the reasonableness of the total sum of fees against the earnings for the year, evaluating also the responsibilities inherent in the position, the dedication demanded for discharging duties, the professional experience and dedication in addition to consistency with the approvals conferred in previous fiscal years.
As concerns the remuneration payable to first-
line managers and as mentioned in II.1.1.4, the
Executive Committee delegates to the Office of
the General Manager and to the Human
Resources Department the establishment of
the remuneration payable to first-line
managers. In establishing these fees, what is
taken into account is the responsibility, the
performance and external competitiveness by
entrusting specialized consultants with market
surveys. In addition to determining a fixed
amount, the portion of variable remuneration
payable to first-line managers is in line with the
Company’s objectives for the short, medium
and long terms. The Company also has long-
term retention plans that are communicated to
key personnel.
PRINCIPLE VIII. FOSTER ENTERPRISE ETHICS
The corporate governance framework must:
Recommendation VIII: Guarantee ethical
behaviors at the Issuer.
Answer if:
VIII.1 The Issuer relies on a Code of
Enterprise Conduct. Indicate the main
guidelines and whether it is available to the
public. This Code is signed by, at least, the
members of the Board of Directors and of
senior management. Indicate if the Issuer
promotes extending the enforcement of this
code to suppliers and customers.
X
The Company has a Code of Ethics approved
by the Board. The Code of Conduct applies to
all the Company’s directors, syndics and
employees and it establishes that they must act
with honesty, integrity and responsibility when
they interact with each other, with clients,
investors, suppliers, government officials and
the press and with other institutions and
individuals. The Code of Ethics is available to
the public at large and it has been published in
the Company’s web-page. The Code of Ethics
is signed by the members of the Board of
Directors and by the Company’s employees.
VIII.2 The Issuer relies on mechanisms to
receive reports about illegal or unethical
behaviors submitted personally or by
X The Company has mechanisms to receive
reports of illegal or anti-ethical behaviours
through several communication channels which

133
electronic means ensuring that the
information relayed is treated in the outmost
confidentiality and abides by the highest
standards of information recording and
preservation. Indicate if the service to
receive and assess reports is rendered by
the Issuer’s personnel or by external
independent professionals to afford
whistleblowers increased protection.
are described in the Code of Ethics. The
channels made available comprise an e-mail
address and a telephone number for the Ethics
Committee, the e-mail addresses and the
telephone numbers of the members of the
Ethics Committee and a regular mail address
for the Ethics Committee. In addition, for
reports or concerns about accounting matters,
accounting internal control or audit matters, the
Audit Committee has an incoming box for
reports that it manages directly. The reports
can be placed anonymously and their treatment
as confidential is guaranteed. The information
conveyed is treated with high confidentiality
and integrity standards and it is equally subject
to stringent information recording and
preservation standards. The service to receive
and evaluate complaints is internal and it is the
responsibility of the Ethics Committee and the
Audit Committee as applicable.
VIII.3 The Issuer relies on policies,
processes and systems to handle and find a
resolution for the reports mentioned in
Section VIII.2. Describe their most relevant
aspects and indicate the degree of
involvement of the Audit Committee in said
resolutions, in particular in those reports
associated to internal controls for financial
reporting and on the behaviors of Board and
senior management members.
X
To handle complaints and to find a solution to
them, the Company has established a
procedure whose main aspects are described
below:
Receipt: complaints are received and
analyzed by the Ethics Committee.
Registration: each complaint is registered.
Analysis and resolution: each complaint is
analyzed and a resolution is found in its
respect.
Communication: all the reports received
by the Ethics Committee are
communicated to the Audit Committee
(they are reported on a quarterly basis).
As for complaints placed with the Audit
Committee, it will be the Audit Committee that
first determines how to analyze them and which
solution to give to them.
PRINCIPLE IX: FURTHER THE SCOPE OF THE CODE
The corporate governance framework must:
Recommendation IX: Promote the inclusion
of the provisions inherent in good corporate
governance practices in the Bank’s by-laws.
Answer if:
The Board of Directors evaluates whether
the provisions of the Corporate Governance
Code must be reflected, in whole or in part,
in the Bank’s By-laws, including the general
and specific responsibilities of the Board of
Directors. Identify the provisions that will be
actually included in the Bank’s By-laws as
from the coming into force of the Code until
to date.
X
The Company’s By-laws satisfy the
requirements imposed by the Argentine
Companies Law 19,550 and applicable rules
and regulations in line with the Public Offering
Regime, its own Code of Ethics and its Code of
Corporate Governance.
The Company’s By-laws include provisions
analogous to, and coincidental with, the above-
mentioned provisions in the field of composition
of governance bodies, particularly the Board of
Directors –functions, rotation and
responsibilities-, the Supervisory Committee
and the Executive and Audit Committees.
Concerning conflicts of interest, it is the
Argentine Companies Law that applies directly,
together with the rules and regulations that
govern the capital markets. The By-laws do not
contain any provision that impedes heeding
recommendations that it does not specifically
prescribe. It is for this reason that the Board
understands that nothing warrants amending

134
the by-laws for the time being.
This notwithstanding, the Board may in the
future consider the timing and advisability of
including other provisions aimed at optimizing
good corporate governance practices.-
(1) Check with an “X” if applicable.
(2) In the event of total compliance, report how the Issuer abides by the principles and heeds the recommendations of the
Corporate Governance Code.
(3) In the event of Partial compliance or of Non-compliance, please state the reasons and describe the actions that the
Issuer’s Board is planning to implement in order to incorporate the recommendations not yet heeded in the coming fiscal
year/s, if any.