comercio exterior y movimiento de mercancías de zonas ... · w w w. d a n e . g o v. c o comercio...
TRANSCRIPT
w w w . d a n e . g o v . c o
Comercio Exterior y Movimiento de
Mercancías de Zonas Francas - ZF
20 de abril de 2018Bogotá, Colombia.
Febrero 2018

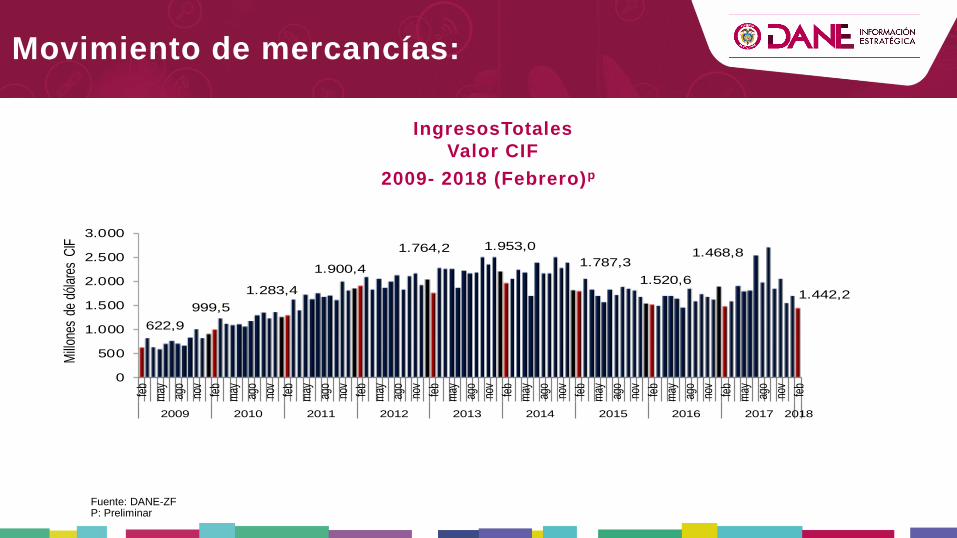
Movimiento de mercancías
Zonas Francas
Fuente: DANE-ZF
Movimiento de mercancías:
622,9
999,5
1.283,4
1.900,4
1.764,2 1.953,0
1.787,3
1.520,6
1.468,8
1.442,2
0
500
1.000
1.500
2.000
2.500
3.000
feb
may ago
nov
feb
may ago
nov
feb
may ago
nov
feb
may ago
nov
feb
may ago
nov
feb
may ago
nov
feb
may ago
nov
feb
may ago
nov
feb
may ago
nov
feb
2009 2010 2011 2012 2013 2014 2015 2016 2017 2018
Mill
ones
de
dóla
res
CIF
IngresosTotales
Valor CIF
2009- 2018 (Febrero)p)
P: Preliminar

Fuente: DANE-ZF
60,5
28,448,1
-7,2
10,7
-8,5
-14,9
-3,4-1,8
-60
-40
-20
0
20
40
60
80
100
120
feb
may
ago
nov
feb
may
ago
nov
feb
may
ago
nov
feb
may
ago
nov
feb
may
ago
nov
feb
may
ago
nov
feb
may
ago
nov
feb
may
ago
nov
feb
2010 2011 2012 2013 2014 2015 2016 2017 2018
Varia
ción p
orce
ntua
l (%
)Ingresos Totales
Variación anual
2010- 2018 (Febrero)p
Movimiento de mercancías:
P: Preliminar

Fuente: DANE-ZF
715,3
1.149,9
1.522,8
2.214,41.833,4 2.091,8 1.956,1
1.669,21.685,5 1.690,4
0
500
1.000
1.500
2.000
2.500
3.000
feb
may ago
nov
feb
may ago
nov
feb
may ago
nov
feb
may ago
nov
feb
may ago
nov
feb
may ago
nov
feb
may ago
nov
feb
may ago
nov
feb
may ago
nov
feb
2009 2010 2011 2012 2013 2014 2015 2016 2017 2018
Mill
ones
de
dóla
res
FOB
Salidas Totales
Valor FOB
2009- 2018 (Febrero)p
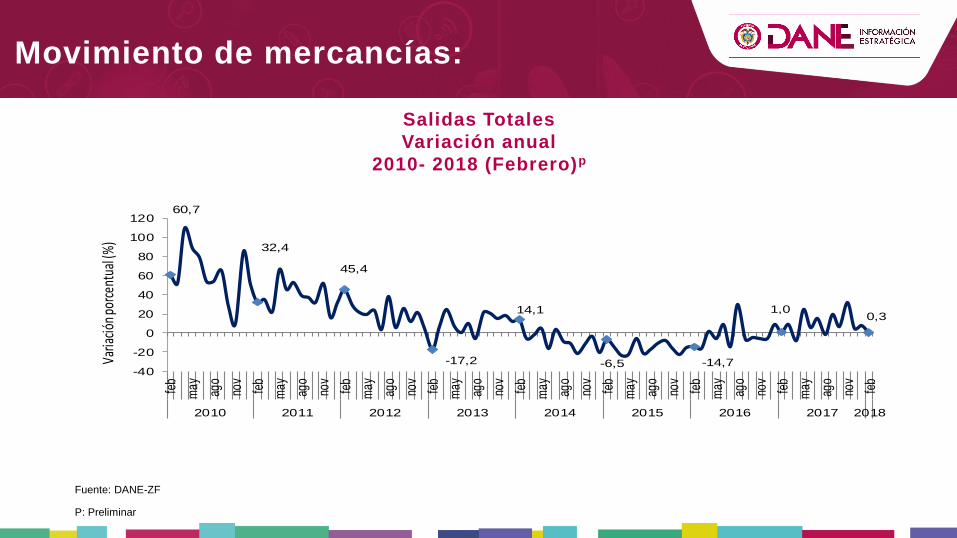
Movimiento de mercancías:
P: Preliminar
Fuente: DANE-ZF
60,7
32,4
45,4
-17,2
14,1
-6,5 -14,7
1,00,3
-40
-20
0
20
40
60
80
100
120
feb
may ago
nov
feb
may ago
nov
feb
may ago
nov
feb
may ago
nov
feb
may ago
nov
feb
may ago
nov
feb
may ago
nov
feb
may ago
nov
feb
2010 2011 2012 2013 2014 2015 2016 2017 2018
Varia
ción p
orce
ntua
l (%
)Salidas Totales
Variación anual
2010- 2018 (Febrero)p
Movimiento de mercancías:
P: Preliminar

Comercio Exterior
Zonas Francas
Fuente: DANE-ZF
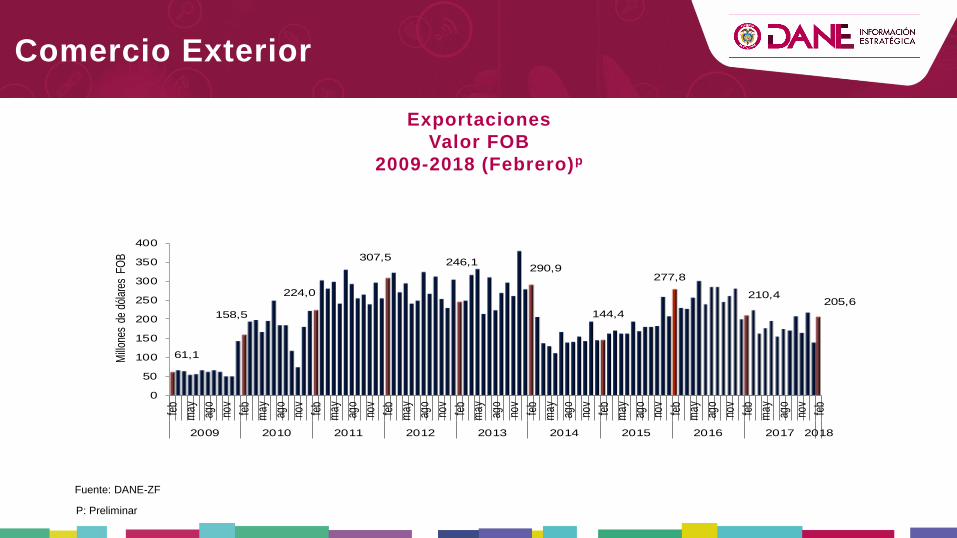
Comercio Exterior
61,1
158,5
224,0
307,5246,1
290,9
144,4
277,8
210,4205,6
0
50
100
150
200
250
300
350
400
feb
may ago
nov
feb
may ago
nov
feb
may ago
nov
feb
may ago
nov
feb
may ago
nov
feb
may ago
nov
feb
may ago
nov
feb
may ago
nov
feb
may ago
nov
feb
2009 2010 2011 2012 2013 2014 2015 2016 2017 2018
Mill
ones
de
dóla
res
FOB
Exportaciones
Valor FOB
2009-2018 (Febrero)p
P: Preliminar
Fuente: DANE-ZF
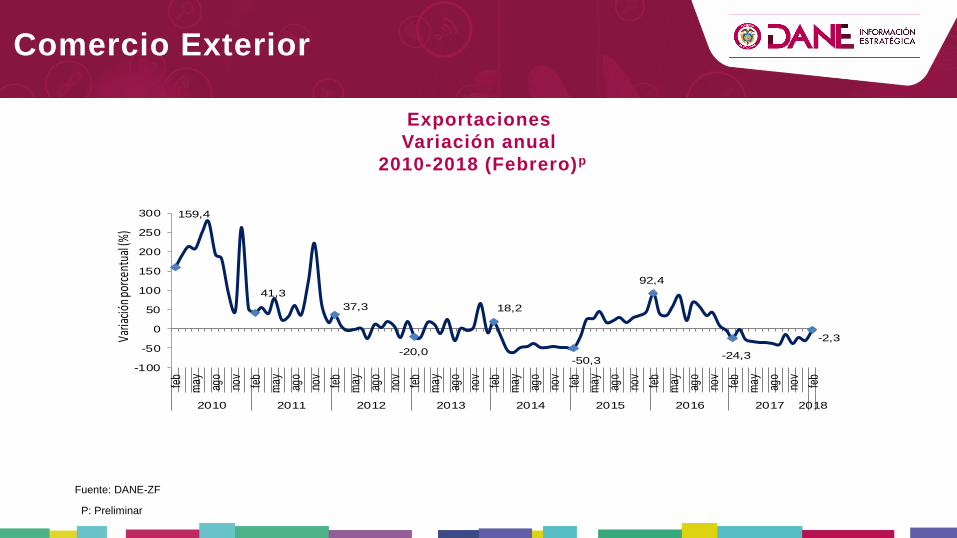
Comercio Exterior
159,4
41,3
37,3
-20,0
18,2
-50,3
92,4
-24,3
-2,3
-100
-50
0
50
100
150
200
250
300
feb
may ago
nov
feb
may ago
nov
feb
may ago
nov
feb
may ago
nov
feb
may ago
nov
feb
may ago
nov
feb
may ago
nov
feb
may ago
nov
feb
2010 2011 2012 2013 2014 2015 2016 2017 2018
Varia
ción p
orce
ntua
l (%
)Exportaciones
Variación anual
2010-2018 (Febrero)p
P: Preliminar

Fuente: DANE – ZF
** No se puede calcular la variación
* Variación superior a 1.000%
.
Pais destino Participación
Total -35,1 -35,1 100,0
Estados Unidos -48,9 -27,0 43,4
Gibraltar -100,0 -13,4 0,0
Singapur -100,0 -7,4 0,0
Puerto Rico * 5,4 8,7
Ecuador 215,1 6,6 15,0
Demás Países 2,9 0,6 32,9
Participación (%)
Junio 2017
Variación (%) Contribución (pp)
Comercio Exterior
País destino Participación
Total -2,3 -2,3 100,0
Gibraltar -100,0 -10,0 0,0
Estados Unidos -17,7 -8,1 38,5
Brasil -78,8 -6,5 1,8
Países Bajos * 8,4 8,8
México * 11,3 11,9
Demás Países 7,5 2,7 39,0
Participación (%)
Febrero 2018
Variación (%) Contribución (pp)
País destino
Total -15,9 -15,9 100,0
Gibraltar -100,0 -9,7 0,0
Estados Unidos -10,9 -4,3 41,7
India -99,6 -3,5 0,0
China 45,1 0,7 2,5
México * 6,1 7,8
Demás Países -11,4 -5,2 48,0
Enero- febrero 2018
Variación (%) Contribución (pp) Participación (%)
Variación y contribución de las
exportaciones por país de destino
2018p /2017
P: Preliminar

Fuente: DANE-ZF
Comercio Exterior
65,4
129,3
133,2
248,0 238,4
183,0 184,9158,3
198,5
138,9
0
50
100
150
200
250
300
350
400
450
feb
ma
y
ago
nov
feb
ma
y
ago
nov
feb
ma
y
ago
nov
feb
ma
y
ago
nov
feb
ma
y
ago
nov
feb
ma
y
ago
nov
feb
ma
y
ago
nov
feb
ma
y
ago
nov
feb
ma
y
ago
nov
feb
2009 2010 2011 2012 2013 2014 2015 2016 2017 2018
Mill
ones
de
dóla
res
CIF
Importaciones
Valor CIF 2009-2018 (Febrero)p
P: Preliminar

Fuente: DANE-ZF
Comercio Exterior
97,6
3,0
86,2
-3,9-23,2
1,0
-14,4
25,4
-30,0
-100
-50
0
50
100
150
feb
abr
jun
ago
oct
dic
feb
abr
jun
ago
oct
dic
feb
abr
jun
ago
oct
dic
feb
abr
jun
ago
oct
dic
feb
abr
jun
ago
oct
dic
feb
abr
jun
ago
oct
dic
feb
abr
jun
ago
oct
dic
feb
abr
jun
ago
oct
dic
feb
2010 2011 2012 2013 2014 2015 2016 2017 2018
Varia
ción
por
cent
ual (
%)
Importaciones
Variación anual
2010-2018 (Febrero)p
P: Preliminar

Fuente: DANE-ZF
** No se puede calcular la variación por no registrar información en el período base
* Variación superior a 1.000%
Comercio Exterior
País destino Participación
Total -30,0 -30,0 100,0
Angola -100,0 -26,0 0,0
Estados Unidos -53,2 -19,8 24,8
Italia -80,9 -6,4 2,1
Alemania 632,4 7,7 12,7
Canadá * 20,0 28,6
Demás Países -20,0 -5,5 31,7
Febrero 2018
Variacion (%) Participación (%)Contribución (pp)
País destino
Total -20,4 -20,4 100,0
Angola -100,0 -25,6 -
Rusia -94,7 -22,3 1,6
Italia -64,6 -3,0 2,1
Canadá * 9,8 12,7
Brasil * 12,2 16,6
Demás Países 18,8 8,5 67,1
Participación (%)
Enero- febrero 2018
Contribución (pp)Variacion (%)
Variación y contribución de las
importaciones por países de origen Febrero
2018/2017
P: Preliminar
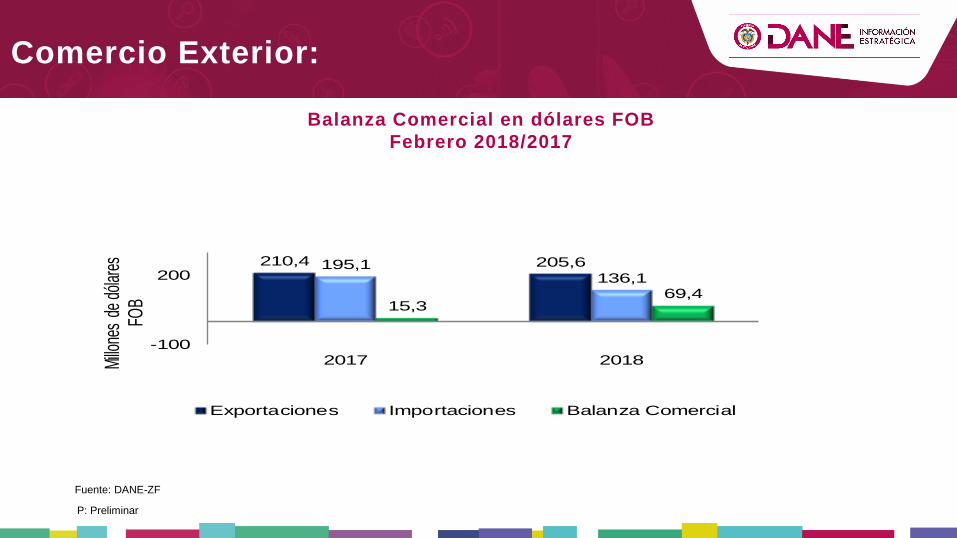
210,4 205,6195,1136,1
15,369,4
-100
200
2017 2018Millo
nes
de d
ólar
es
FOB
Exportaciones Importaciones Balanza Comercial
Fuente: DANE-ZF
Comercio Exterior:
Balanza Comercial en dólares FOB
Febrero 2018/2017
P: Preliminar

Fuente: DANE-ZF
Comercio Exterior:
409,6 344,5392,5309,3
17,2 35,20
2.000
2017 2018Millo
nes
de D
ólar
es
FOB
Exportaciones Importaciones Balanza Comercial
Balanza comercial en dólares FOB
Enero- Febrero 2018/2017
P: Preliminar
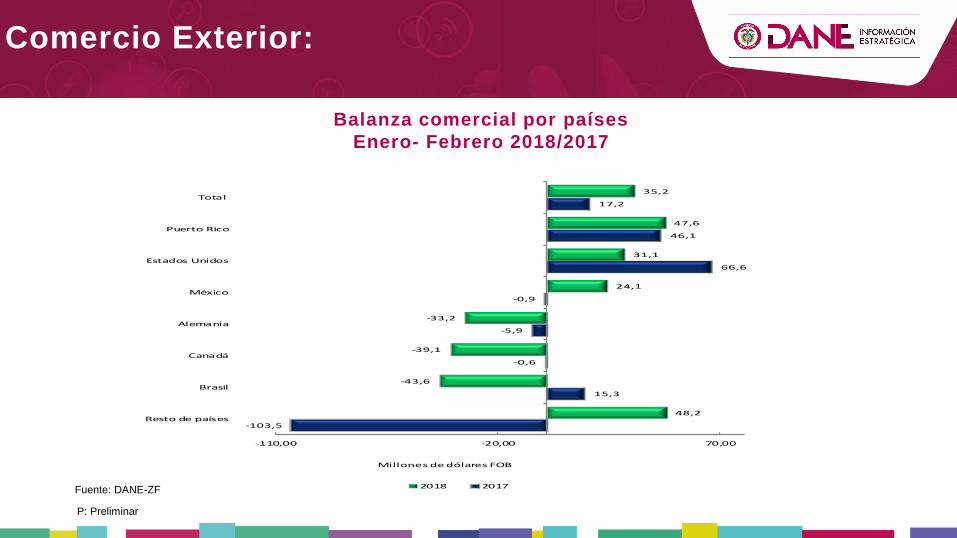
-103,5
15,3
-0,6
-5,9
-0,9
66,6
46,1
17,2
48,2
-43,6
-39,1
-33,2
24,1
31,1
47,6
35,2
-110,00 -20,00 70,00
Resto de países
Brasil
Canadá
Alemania
México
Estados Unidos
Puerto Rico
Total
Millones de dólares FOB
2018 2017Fuente: DANE-ZF
Comercio Exterior:
Balanza comercial por países
Enero- Febrero 2018/2017
P: Preliminar
64,7
-1,4
-15,2
0,5
9,0
14,2
39,5
-94,1
111,2
17,2
-12,4
-2,2
-1,9
-1,6
4,9
8,7
23,5
16,2
19,0
35,2
-100 -50 0 50 100
Demás Zonas Francas Permanentes
ZFP de Tocancipá
ZFP Conjunto Industrial Parque Sur
ZFP las Américas
ZFP Cencauca(parque industrial caloto)
ZFP Cartagena
ZFP Palmaseca
Zonas Francas Permanentes Especiales
Zonas Francas Permanentes
Total
2018p 2017p
1
2
Millones de dólares FOB
Fuente: DANE-ZF1 Por reserva estadística, se agregan las Zonas Francas Permanentes (ZFP) que contienen
hasta tres usuarios calificados 2 Por reserva estadística se presenta un total de Zonas Francas Permanentes Especiales
(ZFPE).
P: Preliminar
Comercio Exterior:
Balanza comercial por zonas francas
Enero- Febrero 2018/2017
