cambio climÁtico y agroclimÁtico para el ciclo otoÑo-invierno en la ... · cambio climÁtico y...
TRANSCRIPT

Revista Mexicana de Ciencias Agrícolas Pub. Esp. Núm. 2 1 de septiembre - 31 de octubre, 2011 p. 295-308
CAMBIO CLIMÁTICO Y AGROCLIMÁTICO PARA EL CICLO OTOÑO-INVIERNOEN LA REGIÓN CIÉNEGA DE CHAPALA*
CLIMATIC AND AGROCLIMATIC CHANGE FOR THE FALL-WINTER CYCLE IN THE CIÉNEGA REGION OF CHAPALA
Patricia Zarazúa-Villaseñor1§, José Ariel Ruiz-Corral2, Diego Raymundo González-Eguiarte1, Hugo Ernesto Flores-López2 y José Ron-Parra3
1Desarrollo Rural Sustentable. Centro Universitario de Ciencias Biológicas y Agropecuarias. Universidad de Guadalajara. Carretera Guadalajara-Nogales, km 15.5. ([email protected]). 2Región Pacífico-Centro. INIFAP. Parque Los Colomos II Sección. Zapopan, Jalisco. ([email protected]), ([email protected]). 3Departamento Producción Agrícola. Centro Universitario de Ciencias Biológicas y Agropecuarias. Universidad de Guadalajara. ([email protected]). §Autora para correspondencia: [email protected].
* Recibido: diciembre de 2010
Aceptado: junio de 2011
RESUMEN
Los objetivos de este trabajo fueron cuantificar la tendencia de variables climáticas para el ciclo otoño-invierno durante el periodo 1961-2006, establecer escenarios climáticos y agroclimáticos futuros, para el ciclo otoño-invierno y evaluar el impacto del cambio climático sobre el desarrollo del trigo en la región Ciénega de Chapala, Jalisco, México. Se utilizaron datos de 10 estaciones climatológicas para analizar el cambio climático con visión retrospectiva, y modelos de circulación general para estimar el cambio climático a futuro. Se aplicó la prueba de homogeneidad normal estándar, para detectar cambio de tendencia en los valores observados. Se generaron los escenarios futuros para cinco parámetros climáticos y cinco agroclimáticos, para evaluar los impactos del cambio climático sobre el trigo. Los resultados mostraron un cambio en la tendencia de las temperaturas máxima y mínima alrededor del año 1983. En los escenarios futuros, la temperatura máxima se incrementará hasta 6.4 oC a finales del siglo XXI, provocando incrementos en temperatura media y oscilación térmica. La temperatura mínima se mantiene entre 9 y 10 oC durante todo el siglo. Se tendrán incrementos en la evapotranspiración, aceleración en la acumulación de unidades calor, incrementos en las temperaturas diurnas
ABSTRACT
The objectives of this paper were to quantify the trend of the climatic variables for the Autumn-Winter cycle during 1961-2006 periods in order to establish future climatic and agroclimatic scenarios for the Autumn-Winter cycle and to assess the impact of climate change on wheat development in Ciénega region of Chapala, Jalisco, Mexico. The data from 10 weather stations were used to retrospectively analyze the climatic change and general circulation models in order to estimate future climatic change. The standard normal homogeneity test was applied to detect trend changes in the observed values. Future scenarios were generated for five climatic parameters and five agroclimatic parameters, in order to assess climatic change impacts on wheat. The results showed a change in the trend of maximum and minimum temperatures around the year 1983. In future scenarios, the maximum temperature will increase up to 6.4 oC by the end of the XXI century, causing increases in average temperature and temperature variation. The minimum temperature is maintained between 9 and 10 oC throughout the century. Evapotranspiration will increase, there will be acceleration in the heat units’ accumulation, day
Patricia Zarazúa-Villaseñor et al.296 Rev. Mex. Cienc. Agríc. Pub. Esp. Núm. 2 1 de septiembre - 31 de octubre, 2011
y nocturnas y disminución en el número de horas frío. El cultivo de trigo sufrirá condiciones desfavorables para la vernalización y acortamiento en sus etapas fenológicas, por lo que el uso de variedades con menor requerimiento de vernalización y con mayor tolerancia a condiciones cálidas, será una de las medidas de adaptación a seguir para continuar con el trigo en la zona de estudio.
Palabras clave: Triticum spp., escenarios climáticos futuros, fenología del trigo, impacto del cambio climático.
INTRODUCCIÓN
En México, como en la mayoría de los países del mundo, existe una preocupación por el cambio climático y sus posibles impactos sobre el sector productivo primario, debido a que existen aún pocos estudios cuantitativos y documentados enfocados a las áreas agrícolas (Tejeda y Rodríguez, 2007). La mayoría de las iniciativas en México para hacer frente al cambio climático global, están relacionadas con el desarrollo de estrategias enfocadas a la selección de medidas de adaptación y mitigación de los efectos del cambio climático (INE, 2009). Sin embargo, aún queda mucho por investigar con relación al carácter regional y estacional del cambio climático en México, sobre todo para cuantificar los tipos y niveles de modificación climática que han estado experimentando las diferentes regiones agropecuarias del país, con sus consecuentes requerimientos de ajuste de patrones de cultivo y sistemas de producción.
De acuerdo con el cuarto reporte sobre cambio climático global del IPCC (2007), la temperatura superficial promedio se ha incrementado 0.6 ±0.2 oC durante los últimos cien años, y la lluvia se ha incrementado entre 0.2 a 0.3% en las zonas tropicales. Brito et al. (2009) detectaron variaciones en temperaturas máxima y mínima a escala regional. También se han presentado variaciones en los tipos climáticos de algunas zonas, resultando en un impacto regional y local (Zhao et al., 2005).
En México se han desarrollado desde la década de los años ochentas, diversas investigaciones respecto a la tendencia en el cambio climático y sus efectos en actividades productivas, entre ellas la agrícola. Al respecto, Ruiz et al. (2000a y 2000b) informan que para el caso del maíz de temporal en Jalisco, las áreas potenciales para maíz de ciclo intermedio-
and night temperatures will increase and the number of chilling hours will decrease. Wheat cultivation will suffer unfavorable conditions for vernalization and a shortening of phenological stages, so that the use of varieties with lower vernalization requirements and greater tolerance to hot conditions, will be one adaptation measurement to continue the wheat cultivation in the studied area.
Key words: Triticum spp., future climatic scenarios, impact of climatic change, wheat phenology.
INTRODUCTION
In Mexico, as in most of the countries, there is concern about climate change and, its possible impacts on the primary production sector, because there are still few quantitative and documented studies focused on agricultural areas (Tejeda and Rodríguez, 2007). Most of the efforts in Mexico to face the global climatic change are related to the development of strategies focused on the selection of adaptation measurements and mitigation of climate change (INE, 2009). However, much remains to be investigated in relation to regional and seasonal climate change in Mexico, especially to quantify the types and levels of climate modification that have been experienced by the different agricultural regions of the country, with the resulting requirements of cropping patterns and production systems adjustment.
According to the fourth report on global climate change IPCC (2007), the average surface temperature has increased 0.6 ±0.2 oC during the last hundred years and rainfall has increased from 0.2 to 0.3% in the tropics. Brito et al . (2009), found variations in maximum and minimum temperatures on a regional scale. There have also been climate changes in rates in some areas, resulting in regional and local impacts (Zhao et al., 2005).
Since the decade of the eighties, several investigations have been conducted in Mexico regarding to the trend in climatic change and its effects on productive activities, including agriculture. In this regard Ruiz et al. (2000a and 2000b), report that in the case of rainfed maize in Jalisco, potential areas for late-intermediate cycle maize decreased during the 1972-1996 period; but not for intermediate-early maize varieties. Also, both the growing season for
Cambio climático y agroclimático para el ciclo otoño-invierno en la región Ciénega de Chapala 297
tardío, se redujeron durante el periodo 1972-1996, no así para variedades de maíz de ciclo intermedio-precoz. Asimismo, tanto la estación de crecimiento para este cultivo en la misma zona como la capacidad térmica, presentan una tendencia a la disminución, configurándose un panorama desfavorable para la agricultura de temporal en esta entidad.
Tejeda y Rodríguez (2007), recomiendan enfocar nuevos proyectos de investigación que permitan establecer políticas de mitigación y de adaptación a este cambio. Varias de las investigaciones ya realizadas se han enfocado al efecto de este cambio sobre la agricultura de temporal, la cual constituye más de 60% de la actividad agrícola de México; sin embargo, una proporción importante de la agricultura se realiza durante el periodo otoño-invierno, 37% de acuerdo con SAGARPA (2009), por lo que esta modalidad de producción también resultaría afectada por el cambio climático global.
Algunos efectos del incremento de temperatura en especies agrícolas, son mencionados por Ramos et al. (2009), quienes entre sus resultados consignan una disminución de la duración del aparato fotosintético y pérdida de viabilidad en polen y estigmas en maíz. En frijol se registran descensos significativos en la captación de CO2 por el efecto combinado de estrés hídrico y de temperatura; en trigo se presentan efectos negativos en la acumulación de materia seca y proteínas, y de acuerdo con Solís et al. (2004) la temperatura de las etapas reproductivas temprana y tardía influye significativamente sobre el rendimiento de grano.
En el Plan Nacional de Desarrollo 2007-2012 (Calderón, 2007), se establece la necesidad de generar escenarios climáticos futuros en el país, así como la estimación de los impactos a nivel regional, enfocándose en los cultivos básicos y frutales, así como las medidas de adaptación que permitan mantener un desarrollo agrícola regional. El presente trabajo se realizó con los objetivos de: a) cuantificar la tendencia de variables climáticas durante el periodo 1961-2006 en la región Ciénega de Chapala, Jalisco, México para el ciclo otoño-invierno; b) establecer escenarios climáticos y agroclimáticos futuros para el ciclo otoño-invierno; y c) evaluar el impacto del cambio climático sobre el desarrollo del cultivo de trigo en esta zona.
this crop in the same area as the heat capacity, show a downward trend, creating an unfavorable situation for rainfed agriculture in this State.
Tejeda and Rodríguez (2007), recommend focusing new research projects in order to establish mitigation and adaptation policies to this change. Several past investigations have been focused on the effect of this change on rainfed agriculture, which constitutes over 60% of Mexico’s agricultural activity; however, a significant proportion of agriculture takes place during the Autumn-Winter period, 37% according to SAGARPA (2009), so this production mode would also be affected by global climatic change.
Some effects of temperature increase in agricultural species are mentioned by Ramos et al. (2009), among their findings; show a reduction in the photosynthetic apparatus duration and loss of viability in pollen and maize stigmata. In beans, significant decreases in the CO2 uptake by the combined effect of water stress and temperature are recorded; in wheat negative effects on the accumulation of dry matter and protein are shown; and according to Solís et al. (2004), the temperature of the early and late reproductive stages, significantly influences grain yield.
The 2007-2012 National Development Plan (Calderón, 2007), establishes the need to generate future climate scenarios in the country, and the estimation of impacts at regional level, focusing on staple crops and fruit trees, as well as on adaptation measurements for maintaining a regional agricultural development.
This paper was performed with the following objectives: a) to quantify the trend of climatic variables over the 1961-2006 period in the Ciénega region of Chapala, Jalisco, Mexico for the fall-winter cycle; b) to establish climatic and agroclimatic future scenarios for Autumn-Winter cycle; and c) to evaluate the impact of climatic change on wheat crop’s development in this area.
MATERIALS AND METHODS
The Ciénega region of Chapala, with an area of 4 825 km2, is located in central-eastern of Jalisco State in Mexico, between the 20o 02’ and 20o 41’ north latitude and 101o 59’ and 103o 32’ west longitude, around Chapala Lake, the largest
Patricia Zarazúa-Villaseñor et al.298 Rev. Mex. Cienc. Agríc. Pub. Esp. Núm. 2 1 de septiembre - 31 de octubre, 2011
MATERIALES Y MÉTODOS
La región Ciénega de Chapala, con una superficie de 4 825 km2, se localiza en el centro-este del estado de Jalisco en México, entre los 20o 02’ y 20o 41’ de latitud norte y 101o 59’ y 103o 32’ de longitud oeste, alrededor del Lago de Chapala, el lago natural más grande de México. La componen los municipios de Atotonilco el Alto, Ayotlán, Degollado, La Barca, Chapala, Jamay, Jocotepec, Ocotlán, Poncitlán, Tizapán el Alto, Tototlán, Tuxcueca y Zapotlán del Rey. En la zona se presentan dos tipos climáticos de acuerdo con la clasificación Köppen (García, 2004) que son el clima semicálido subhúmedo y el clima templado subhúmedo, cubriendo una superficie de 80% y 20%, respectivamente.
De acuerdo con INEGI (1986), en esta región se presentan los tipos de suelos de clasificación Organización de las Naciones Unidas para la Agricultura y a Alimentación (FAO): Luvisol férrico, Luvisol vértico, Feozem háplico, Feozem lúvico, Vertisol pélico, Vertisol crómico y Litosol. La producción agrícola representa para el estado de Jalisco 23.5% del valor de su producción y ocupa 36% de la superficie total de la región con cosechas de maíz, trigo, hortalizas y legumbres con una producción importante de agave.
Para el presente estudio se analizaron los datos climáticos tomados de 10 estaciones meteorológicas, correspondientes a la Red de Estaciones de la Comisión Nacional del Agua (CNA) en el periodo 1961-2006, y la base de datos de los valores de anomalías de temperatura media y precipitación acumulada mensuales, generada por la Universidad Nacional Autónoma de México (UNAM ) (Magaña y Caetano, 2007), mediante un modelo ensamble y con base en el escenario de emisión de gases de efecto invernadero A2 (IPCC, 2007).
Para evaluar el impacto de cambios climáticos sobre el cultivo de trigo (Triticum aestivum), se seleccionaron las variedades comerciales utilizadas en la zona, que son Salamanca S75, Saturno S86, Eneida F94 y Cortázar S94. La etapa siembra-floración dura entre 70 y 80 días, con una acumulación promedio de 1040 UCBase5, mientras que la etapa siembra-madurez fisiológica tiene una duración entre 110 y 137 días, con una acumulación promedio de 1640 UCBase5. Estas variedades producen en promedio 6 300 kg ha-1.
natural lake in Mexico. Comprising the municipalities of Atotonilco el Alto, Ayotlán, Degollado, La Barca, Chapala, Jamay, Jocotepec, Ocotlán, Poncitlán, Tizapán el Alto, Tototlán, Tuxcueca and Zapotlán del Rey. In the area there are two climate types according to Köppen classification (García, 2004), which are semi-warm subhumid climate and temperate subhumid climate, covering an area of 80% and 20%, respectively.
According to INEGI (1986), this region presents the classification of soil types of the United Nations Organization for Food and Agriculture (FAO): Ferric luvisol, Vertic luvisol, Haplic feozem, Feozem luvic, Vertisol pelican, Chromic vertisol and Litosol. Agricultural production accounts for the state of Jalisco 23.5% of its production value and occupies 36% of the total area of the region with crops of maize, wheat, vegetables and legumes with a significant agave production.
For the present paper, climatic data was analyzed from 10 weather stations, corresponding to the Station Network of the National Water Commission (CNA by its Spanish acronym) in the 1961-2006 period and the database of the mean temperature anomalies values and monthly accumulated rainfall, generated by the Universidad Nacional Autonoma of Mexico (UNAM) (Magaña and Caetano, 2007), using an assembly model and based on the greenhouse gas emission scenario A2 (IPCC, 2007).
In order to evaluate the impact of climate change on wheat crop (Triticum aestivum), commercial varieties used in the area were selected: Salamanca S75, Saturno S86, Eneida F94 and Cortázar S94. The sowing-flowering stage lasts between 70 and 80 days, with an average accumulation of 1040 UCBase5, while planting-physiological maturity stage lasts between 110 and 137 days, with an average accumulation of 1640 UCBase5. These varieties produce an average of 6 300 kg ha-1.
Quantification of climatic variables trend
Climate variables were generated of monthly and annual maximum temperature, monthly and annual minimum temperature, monthly and annual mean temperature, monthly and annual accumulated precipitation, and monthly and annual temperature variation, from the daily values of the CNA stations database. Using the annual values of maximum temperature, minimum and precipitation, the
Cambio climático y agroclimático para el ciclo otoño-invierno en la región Ciénega de Chapala 299
Cuantificación de la tendencia de variables climáticas
Se generaron las variables climáticas de temperatura máxima mensual y anual, temperatura mínima mensual y anual, temperatura media mensual y anual, precipitación acumulada mensual y anual, y oscilación térmica mensual y anual, a partir de los valores diarios de la base de datos de las estaciones CNA. Con los valores anuales de temperatura máxima, mínima y precipitación se procedió a realizar la prueba de detección de ruptura de la serie, con el método standard normal homogeneity test (SNHT) de Alexandersson (Alexandersson y Moberg, 1997), para cada una de las estaciones meteorológicas y para la región Ciénega de Chapala.
Escenarios climáticos y agroclimáticos futuros para el ciclo otoño-invierno en la zona de estudio.
Se generaron los escenarios climáticos del ciclo otoño-invierno para los años 2019 a 2090, tomando como serie base la climatología 1977-2006 de valores observados en la base de datos CNA y aplicando los valores de anomalías del modelo de ensamble, bajo el escenario de emisiones A2 generado por la Universidad Nacional Autónoma de México (UNAM) (Magaña y Caetano, 2007). La estimación de las temperaturas máximas y mínimas mensuales se realizó mediante un modelo trigonométrico (Bowerman, 2007).
Se determinaron para el ciclo otoño-invierno las variables agroclimáticas evapotranspiración potencial con el método Hargreaves (Allen et al., 2006) y ajustado al tanque evaporímetro, temperaturas diurna y nocturna con el método descrito en Ruiz et al. (2003); unidades calor efectivas en el ciclo tomando como temperatura base el valor de 5 oC; porcentaje de lluvia invernal con los valores de precipitación mensual de enero a marzo con relación a la precipitación anual (Ruiz et al., 2004), y número de horas frío con el promedio de los valores obtenidos mediante los métodos de Da Mota y Weinberger (Ortiz, 1987).
Evaluación de impacto del cambio climático sobre el desarrollo del trigo en la zona de estudio.
Para evaluar el impacto del cambio climático sobre la fenología del trigo, se estimaron las variables número de días con efecto de vernalización, esto es con temperatura media entre -5 y 15 oC (McMaster et al., 2008); número de días requeridos para completar la etapa siembra-floración, dado un requerimiento térmico de 1 040 UCBase5; número de días requeridos para completar el ciclo siembra-madurez
test to detect rupture of the series was performed, with the Standard Normal Homogeneity Test method (SNHT) of Alexandersson (Alexandersson and Moberg, 1997), for each of the weather stations and for the Ciénega region of Chapala.
Climatic and agroclimatic future scenarios for Autumn-Winter in the studied area
Climate scenarios of Autumn-Winter cycle for the years 2019 to 2090 were generated, based on the 1977-2006 climatology series of values observed in the CNA database and applying the abnormalities of the assembly model values, under the A2 emissions scenario generated by the Universidad Nacional Autonoma of Mexico (UNAM) (Magaña and Caetano, 2007). The estimation of monthly maximum and minimum temperatures was performed using a trigonometric model (Bowerman, 2007).
The potential evapotranspiration agroclimatic variables were determined with Hargreaves method for the Autumn-Winter cycle (Allen et al., 2006) and adjusted to the pan evaporation, day and night temperature with the method described by Ruiz et al. (2003); effective heat units in the cycle taking as basis temperature the value of 5°C; percentage of winter rainfall with monthly precipitation values from January to March compared to annual precipitation (Ruiz et al., 2004), and number of chilling hours with the average of the values obtained by the methods of Da Mota and Weinberger (Ortiz, 1987).
Impact assessment of climatic change on wheat development in the studied area
For assessing the impact of climatic change on the wheat phenology, the variables number of days with vernalization effect were estimated, i. e., with an average temperature between -5 and 15 oC (McMaster et al., 2008); number of days required to complete the sowing-flowering stage, given a thermal requirement of 1 040 UCBase5; number of days required to complete the planting-physiological maturity cycle, given a thermal requirement of 1 640 UCBase5; number of days with minimum temperature below 5 oC using a Gompertz model (Wheldon, 1988); and number of days with maximum temperature above 25 oC using also a Gompertz model.
A simulation to estimate the duration behavior of the phenological phase sowing-f lowering and f lowering-physiological maturity was conducted, considering planting dates 1st and 15th November; 1st and December 15th and January 1st.

Patricia Zarazúa-Villaseñor et al.300 Rev. Mex. Cienc. Agríc. Pub. Esp. Núm. 2 1 de septiembre - 31 de octubre, 2011
fisiológica, dado un requerimiento térmico de 1 640 UCBase5; número de días con temperatura mínima menor que 5 oC utilizando un modelo Gompertz (Wheldon, 1988); y número de días con temperatura máxima mayor que 25 oC utilizando también un modelo Gompertz.
Se realizó una simulación para estimar el comportamiento de la duración de las etapas fenológicas siembra-floración y floración-madurez fisiológica, considerando las fechas de siembra 1 y 15 de noviembre; 1 y 15 de diciembre y 1 de enero.
RESULTADOS Y DISCUSIÓN
Cuantificación de la tendencia de variables climáticas en el periodo 1961-2006
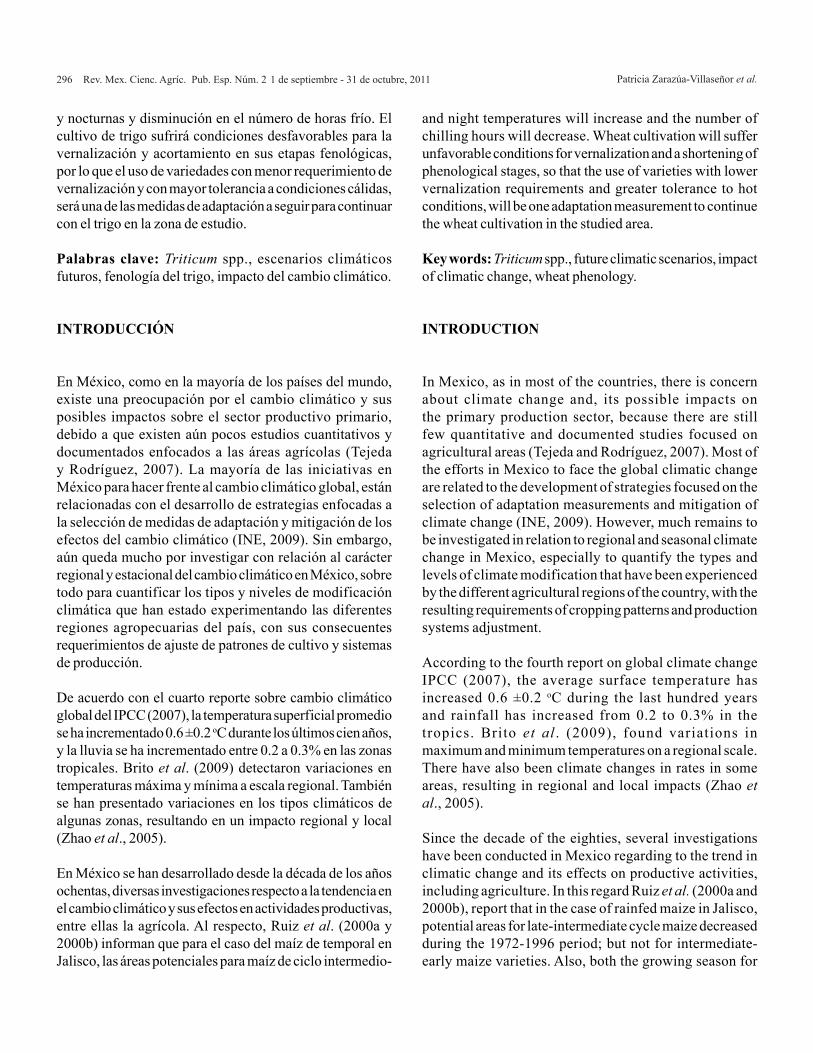
Se observaron variaciones para temperatura máxima media y temperatura mínima media, a través de todo el periodo estudiado en la Región Ciénega de Chapala; en los últimos 25 años se manifestó la mayor variación en la tendencia de los datos (Figura 1). Las temperaturas máximas tienden a incrementarse en la última década; en cambio para temperaturas mínimas, mostraron variaciones en todo el periodo, en los últimos años no se detectó tendencia alguna.
En la Figura 1 se observa la tendencia de la precipitación pluvial para el mismo periodo; las variaciones coinciden con los años “El Niño” de acuerdo con Magaña et al. (2004), quienes consignan el evento que se presentó en los inviernos de 1991 y 1992, provocó una alta precipitación en México, que se refleja en el pico más alto de esta figura.
RESULTS AND DISCUSSION
Quantification of the climatic variables trend in the 1961-2006 period
Varia t ions were observed for mean maximum temperature and average minimum temperature, throughout the period studied in the Ciénega region of Chapala; in the last 25 years the biggest change in the data trend was observed (Figure 1). The maximum temperatures tend to increase in the last decade; and lower temperatures showed variations in the whole period, in recent years any trend was detected.
The Figure 1 shows the trend of rainfall for the same period; changes coincide with the “El Niño” years according to Magaña et al. (2004), who recorded the event that occurred in the winters of 1991 and 1992, it resulted in a high rainfall in Mexico, which is reflected in the highest peak in this figure.
In the detection of trend change, the SNHT method established as the breaking point for the annual mean maximum temperature the year 1992 and, for the annual average minimum temperature the year 1982, both parameters were highly significant (p< 0.05) in the test. This means that in the last years of the analyzed series, a trend change of the thermal variables was detected in the studied area. Regarding to the precipitation, no significant results about breaking point were shown.
Figura 1. Temperatura máxima, mínima y precipitación pluvial en el ciclo otoño-invierno de 1961-2006, para la región Ciénega de Chapala. Figure 1. Maximum and minimum temperature and rainfall in the Autumn-Winter cycle of 1961-2006, for the Ciénega region of Chapala.
Tem
pera
tura
(°C
)
30
25
20
15
10
5
0
250
200
150
100
50
0
Prec
ipita
ción
(mm
)
Ciclo otoño-invierno
1961
/196
2
1963
/196
4
1965
/196
6
1967
/196
8
1969
/197
0
1971
/197
2
1973
/197
4
1975
/197
6
1977
/197
8
1979
/198
0
1981
/198
2
1983
/198
4
1985
/198
6
1987
/198
8
1989
/199
0
1991
/199
2
1993
/199
4
1995
/199
6
1997
/199
8
1999
/200
0
2001
/200
2
2003
/200
4
2005
/200
6
Temperatura máxima mediaTemperatura mínima mediaPrecipitación acumulada
Cambio climático y agroclimático para el ciclo otoño-invierno en la región Ciénega de Chapala 301
En la detección de cambio de tendencia, el método SNHT estableció como punto de ruptura para la temperatura máxima media anual el año 1992 y para la temperatura mínima media anual el año 1982, ambos parámetros fueron altamente significativos (p< 0.05) en la prueba. Esto significa que en los últimos años de la serie analizada, se detecta un cambio de tendencia de las variables térmicas de la zona de estudio. Con respecto a la precipitación no se observaron resultados significativos de punto de ruptura.
Escenarios climáticos y agroclimáticos futuros para el ciclo otoño-invierno en la zona de estudio
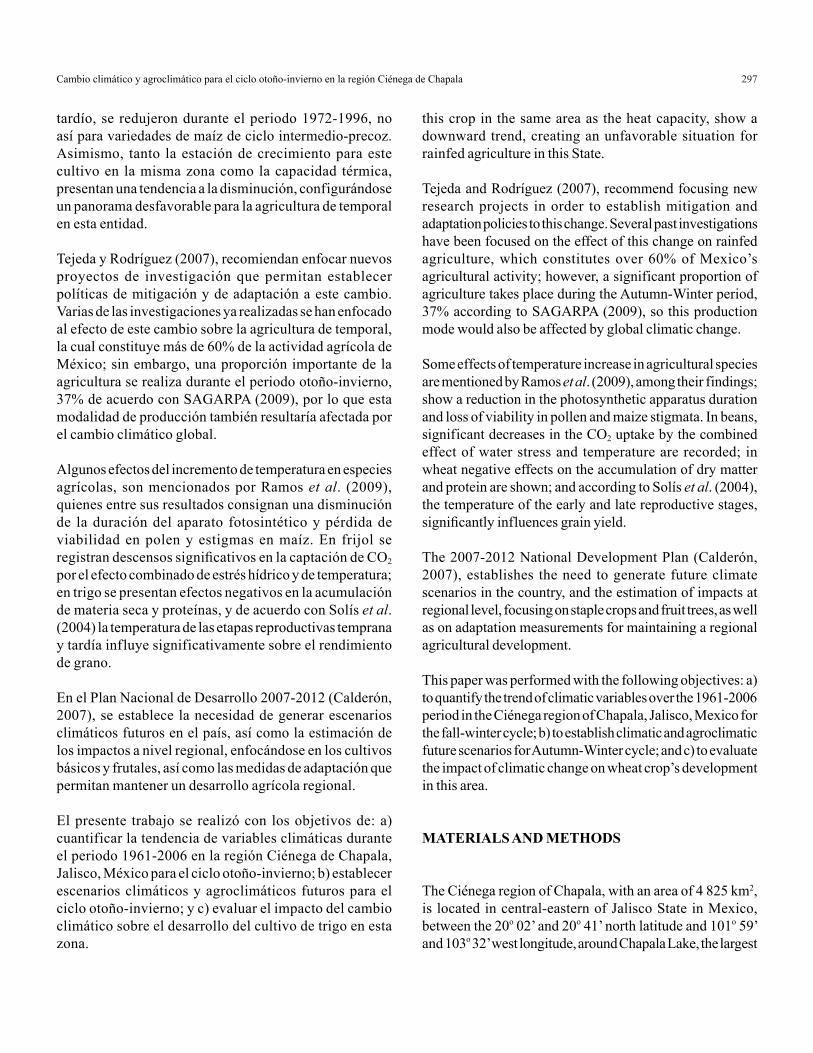
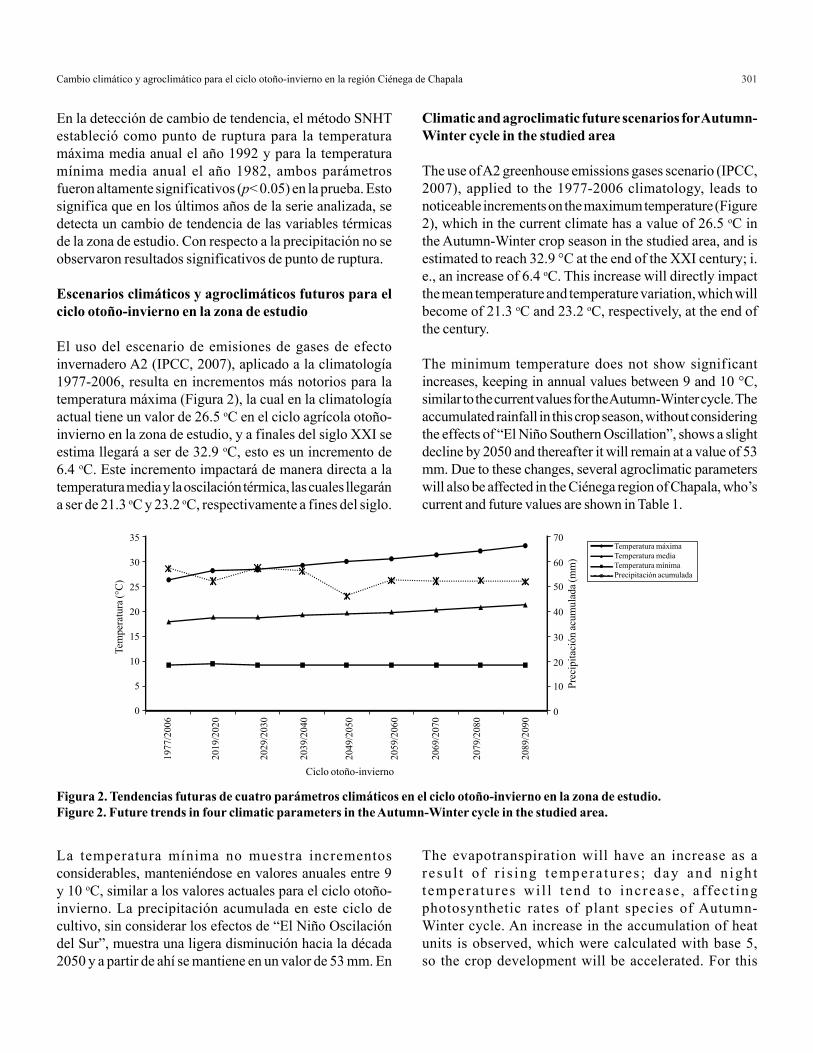
El uso del escenario de emisiones de gases de efecto invernadero A2 (IPCC, 2007), aplicado a la climatología 1977-2006, resulta en incrementos más notorios para la temperatura máxima (Figura 2), la cual en la climatología actual tiene un valor de 26.5 oC en el ciclo agrícola otoño-invierno en la zona de estudio, y a finales del siglo XXI se estima llegará a ser de 32.9 oC, esto es un incremento de 6.4 oC. Este incremento impactará de manera directa a la temperatura media y la oscilación térmica, las cuales llegarán a ser de 21.3 oC y 23.2 oC, respectivamente a fines del siglo.
La temperatura mínima no muestra incrementos considerables, manteniéndose en valores anuales entre 9 y 10 oC, similar a los valores actuales para el ciclo otoño-invierno. La precipitación acumulada en este ciclo de cultivo, sin considerar los efectos de “El Niño Oscilación del Sur”, muestra una ligera disminución hacia la década 2050 y a partir de ahí se mantiene en un valor de 53 mm. En
Climatic and agroclimatic future scenarios for Autumn-Winter cycle in the studied area
The use of A2 greenhouse emissions gases scenario (IPCC, 2007), applied to the 1977-2006 climatology, leads to noticeable increments on the maximum temperature (Figure 2), which in the current climate has a value of 26.5 oC in the Autumn-Winter crop season in the studied area, and is estimated to reach 32.9 °C at the end of the XXI century; i. e., an increase of 6.4 oC. This increase will directly impact the mean temperature and temperature variation, which will become of 21.3 oC and 23.2 oC, respectively, at the end of the century.
The minimum temperature does not show significant increases, keeping in annual values between 9 and 10 °C, similar to the current values for the Autumn-Winter cycle. The accumulated rainfall in this crop season, without considering the effects of “El Niño Southern Oscillation”, shows a slight decline by 2050 and thereafter it will remain at a value of 53 mm. Due to these changes, several agroclimatic parameters will also be affected in the Ciénega region of Chapala, who’s current and future values are shown in Table 1.
The evapotranspiration will have an increase as a resu l t o f r i s ing t empera tu res ; day and n igh t tempera tures wi l l t end to increase , a ffec t ing photosynthetic rates of plant species of Autumn-Winter cycle. An increase in the accumulation of heat units is observed, which were calculated with base 5, so the crop development will be accelerated. For this
Figura 2. Tendencias futuras de cuatro parámetros climáticos en el ciclo otoño-invierno en la zona de estudio.Figure 2. Future trends in four climatic parameters in the Autumn-Winter cycle in the studied area.
Tem
pera
tura
(°C
)
Prec
ipita
ción
acum
ulad
a (m
m)
1977
/200
6
2019
/202
0
2029
/203
0
2039
/204
0
2049
/205
0
2059
/206
0
2069
/207
0
2079
/208
0
2089
/209
035
30
25
20
15
10
5
0
Ciclo otoño-invierno
70
60
50
40
30
20
10
0
Temperatura máximaTemperatura mediaTemperatura mínima Precipitación acumulada

Patricia Zarazúa-Villaseñor et al.302 Rev. Mex. Cienc. Agríc. Pub. Esp. Núm. 2 1 de septiembre - 31 de octubre, 2011
razón de estos cambios, se verán también afectados varios parámetros agroclimáticos en la región Ciénega de Chapala, cuyos valores actuales y futuros se observan en el Cuadro 1.
La evapotranspiración presentará un incremento, resultado del aumento de las temperaturas; las temperaturas diurnas y nocturnas tenderán al incremento, que afectará las tasas fotosintéticas de las especies vegetales del ciclo otoño-invierno. Se observa un incremento en la acumulación de unidades calor, las cuales fueron calculadas con base 5, por lo que el desarrollo de los cultivos se acelerará. Para este ciclo el adelanto en las fechas de siembra permitiría la disminución de los efectos del incremento de temperaturas en las etapas críticas del cultivo.
Con un ciclo de desarrollo más acelerado, la planta permanecerá menor tiempo en el campo, entonces las necesidades hídricas también se verán afectadas. Al respecto, Ojeda et al. (2011) y Zarazúa et al. (2011), consignan disminuciones en los requerimientos hídricos para cultivos del ciclo otoño-invierno y primavera-verano para fines del siglo XXI. El porcentaje de lluvia invernal no muestra cambios durante todo el siglo.
Si el incremento de las temperaturas traerá una mayor acumulación de unidades calor, también se traducirá en una disminución de las horas-frío; se observa que para la climatología actual, 1977-2006, corresponde un total de 148 h frío acumuladas durante los meses de noviembre a diciembre; para años futuros ese valor disminuirá drásticamente hasta desaparecer para el ciclo otoño-invierno 2039-2040, lo que afectaría a aquellas especies que requieren de cierto tiempo de vernalización. El número de horas frío a partir del ciclo otoño-invierno 2019-2020, se presentará en los meses de diciembre y enero únicamente.
cycle, advancement in planting dates will help to reducing the effects of increased temperatures at critical stages of the crop.
With a faster development cycle, the plant will stay less time in the field, then the water needs will also be affected. In this regard, Ojeda et al. (2011); Zarazua et al. (2011), set decreases in crop water requirements for the Autumn-Winter and Spring-Summer crops for the end of the XXI century. The percentage of winter rain does not show remarkable changes throughout the century.
If the rising temperatures will bring a greater accumulation of heat units, it will also result in a reduction in chilling-hours; for the current climate 1977-2006, corresponds a total of 148 chilling-hours accumulated during November to December; for the future years, that value will dramatically decrease until disappearing by the fall-winter of 2039-2040, which would affect those species that require a certain vernalization period. The number of chilling hours from the fall-winter 2019-2020 cycles will occur only in December and January.
The negative effects of higher winter temperatures, generate negative values for this parameter because the calculation is commonly done with Da Mota and Weinberger models (Ortiz, 1987), which were developed for temperate countries, so that, when they are applied to semi-warm and warm zones, they’d result in negative values. In this regard, Pérez et al. (2008) established as the best model for subtropical areas the dynamic model, which considers the effect of high temperatures.
Parámetro agroclimático
Ciclo otoño-invierno1977-2006 2019-2020 2029-2030 2039-2040 2049-2050 2059-2060 2069-2070 2079-2080 2089-2090
Evapotranspiración (mm)
613.6 658.4 666.7 683.8 698.1 715 733.5 753 771.4
Temperatura diurna (oC)
21.4 22.7 22.8 23.4 23.7 24.3 24.8 25.4 26
Temperatura nocturna (oC)
14.4 14.9 14.8 15.1 15.3 15.5 15.8 16.1 16.4
Unidades calor (UCBase5)
2330 2504 2502 2575 2623 2694 2767 2853 2923
Lluvia invernal (%) 3.8 3.3 3.8 3.7 2.8 3.1 4.1 3.5 3.7Horas frío 148 16 26 0 0 0 0 0 0
Cuadro 1. Escenarios futuros estimados de algunos parámetros agroclimáticos del ciclo otoño-invierno en la región de estudio.Table 1. Estimated future scenarios of some agroclimatic parameters for the fall-winter cycle in the studied region.
Cambio climático y agroclimático para el ciclo otoño-invierno en la región Ciénega de Chapala 303
Los efectos negativos de temperaturas invernales altas, generan valores negativos en este parámetro ya que el cálculo comúnmente se realiza con los modelos Da Mota y Weinberger (Ortiz, 1987), los cuales fueron desarrollados para países con clima templado, por lo que al aplicarse en zonas semicálidas y cálidas resulta en valores negativos. Al respecto, Pérez et al. (2008), establecen como mejor modelo para zonas subtropicales el modelo dinámico, el cual considera el efecto de las altas temperaturas.
Evaluación del impacto del cambio climático sobre el desarrollo del trigo en la zona de estudio
Brooking (1996) menciona que el período de vernalización depende de varios factores, entre los cuales se encuentra la temperatura. El trigo es una especie en la que el proceso de vernalización es requerido con rigor para algunas variedades y menos requerido para otras (McMaster et al., 2008). Asimismo, la presencia de días con temperatura máxima diaria mayor a 30 oC resulta en un retroceso o desvernalización; considerando como temperaturas medias en que ocurre la vernalización de -5 a 15 oC.
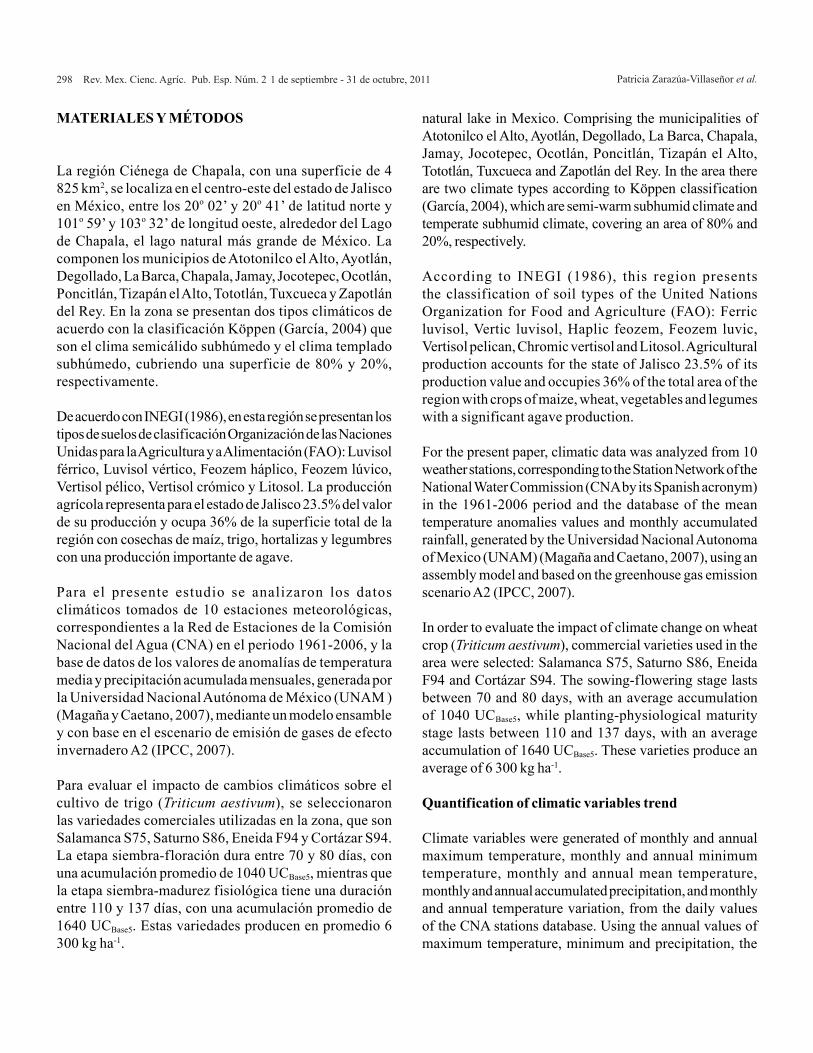
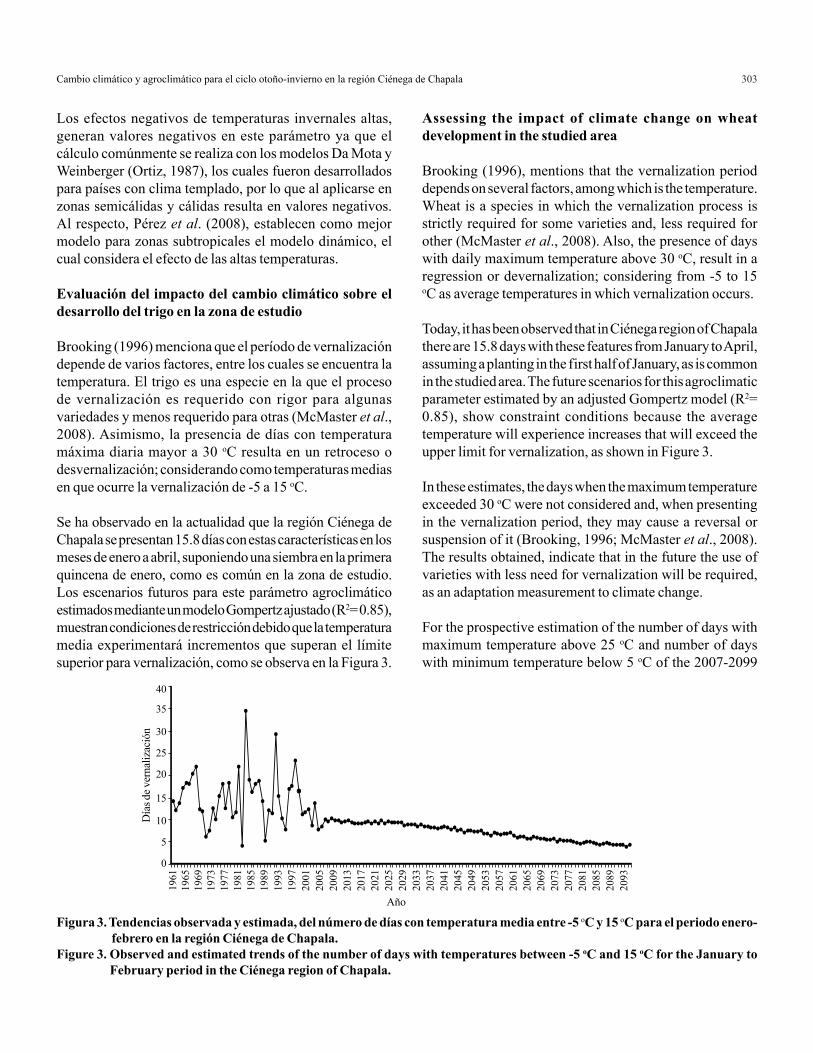
Se ha observado en la actualidad que la región Ciénega de Chapala se presentan 15.8 días con estas características en los meses de enero a abril, suponiendo una siembra en la primera quincena de enero, como es común en la zona de estudio. Los escenarios futuros para este parámetro agroclimático estimados mediante un modelo Gompertz ajustado (R2= 0.85), muestran condiciones de restricción debido que la temperatura media experimentará incrementos que superan el límite superior para vernalización, como se observa en la Figura 3.
Assessing the impact of climate change on wheat development in the studied area
Brooking (1996), mentions that the vernalization period depends on several factors, among which is the temperature. Wheat is a species in which the vernalization process is strictly required for some varieties and, less required for other (McMaster et al., 2008). Also, the presence of days with daily maximum temperature above 30 oC, result in a regression or devernalization; considering from -5 to 15 oC as average temperatures in which vernalization occurs.
Today, it has been observed that in Ciénega region of Chapala there are 15.8 days with these features from January to April, assuming a planting in the first half of January, as is common in the studied area. The future scenarios for this agroclimatic parameter estimated by an adjusted Gompertz model (R2= 0.85), show constraint conditions because the average temperature will experience increases that will exceed the upper limit for vernalization, as shown in Figure 3.
In these estimates, the days when the maximum temperature exceeded 30 oC were not considered and, when presenting in the vernalization period, they may cause a reversal or suspension of it (Brooking, 1996; McMaster et al., 2008). The results obtained, indicate that in the future the use of varieties with less need for vernalization will be required, as an adaptation measurement to climate change.
For the prospective estimation of the number of days with maximum temperature above 25 oC and number of days with minimum temperature below 5 oC of the 2007-2099
Figura 3. Tendencias observada y estimada, del número de días con temperatura media entre -5 oC y 15 oC para el periodo enero-febrero en la región Ciénega de Chapala.
Figure 3. Observed and estimated trends of the number of days with temperatures between -5 oC and 15 oC for the January to February period in the Ciénega region of Chapala.
1961
1965
1969
1973
1977
1981
1985
1989
1993
1997
2001
2005
2009
2013
2017
2021
2025
2029
2033
2037
2041
2045
2049
2053
2057
2061
2065
2069
2073
2077
2081
2085
2089
2093
Año
Día
s de v
erna
lizac
ión
40
35
30
25
20
15
10
5
0
Patricia Zarazúa-Villaseñor et al.304 Rev. Mex. Cienc. Agríc. Pub. Esp. Núm. 2 1 de septiembre - 31 de octubre, 2011
No se consideraron en estas estimaciones los días en que la temperatura máxima excede 30 oC y que al presentarse en el período de vernalización, pueden provocar un retroceso o suspensión del mismo (Brooking, 1996; McMaster et al., 2008). Los resultados obtenidos señalan que en un futuro se requerirá el uso de variedades con una necesidad menor de vernalización, como medida de adaptación al cambio climático.
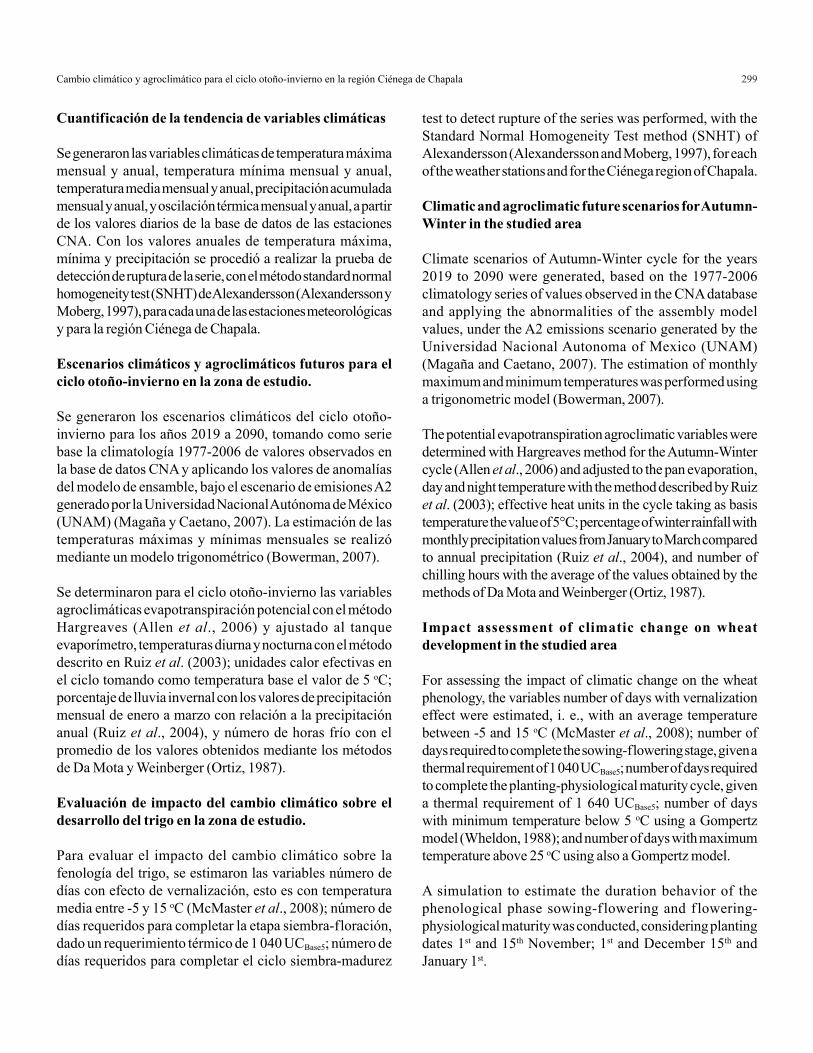
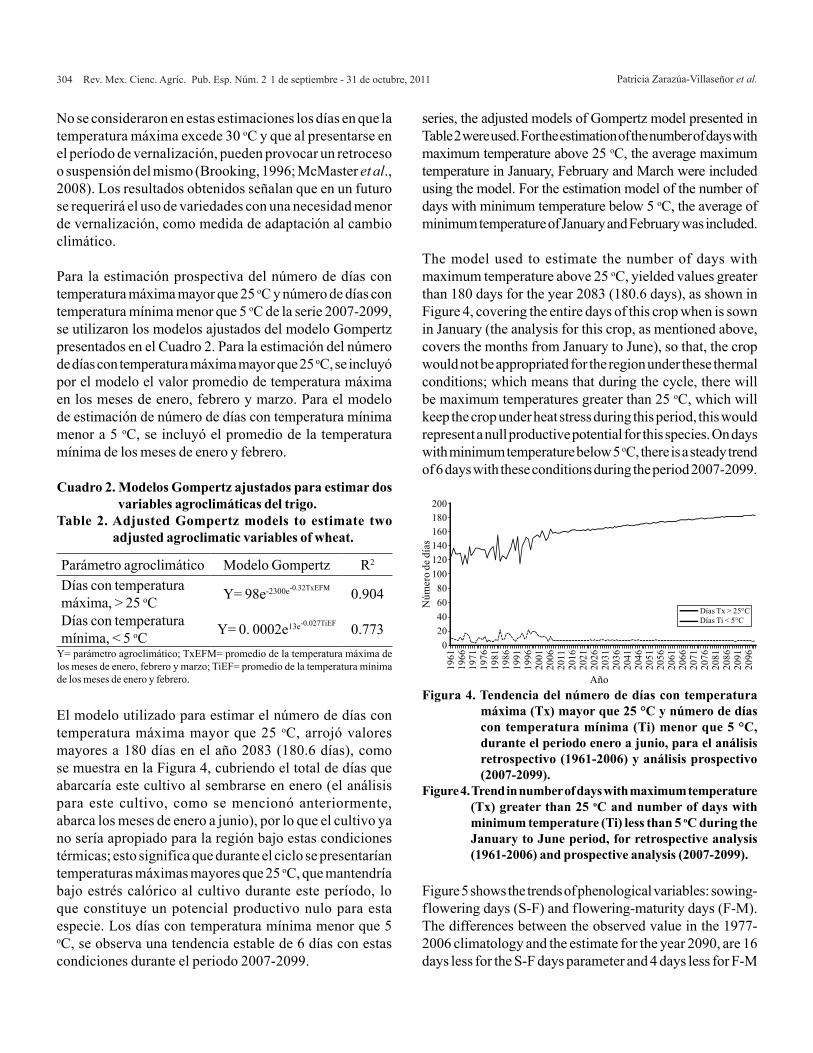
Para la estimación prospectiva del número de días con temperatura máxima mayor que 25 oC y número de días con temperatura mínima menor que 5 oC de la serie 2007-2099, se utilizaron los modelos ajustados del modelo Gompertz presentados en el Cuadro 2. Para la estimación del número de días con temperatura máxima mayor que 25 oC, se incluyó por el modelo el valor promedio de temperatura máxima en los meses de enero, febrero y marzo. Para el modelo de estimación de número de días con temperatura mínima menor a 5 oC, se incluyó el promedio de la temperatura mínima de los meses de enero y febrero.
El modelo utilizado para estimar el número de días con temperatura máxima mayor que 25 oC, arrojó valores mayores a 180 días en el año 2083 (180.6 días), como se muestra en la Figura 4, cubriendo el total de días que abarcaría este cultivo al sembrarse en enero (el análisis para este cultivo, como se mencionó anteriormente, abarca los meses de enero a junio), por lo que el cultivo ya no sería apropiado para la región bajo estas condiciones térmicas; esto significa que durante el ciclo se presentarían temperaturas máximas mayores que 25 oC, que mantendría bajo estrés calórico al cultivo durante este período, lo que constituye un potencial productivo nulo para esta especie. Los días con temperatura mínima menor que 5 oC, se observa una tendencia estable de 6 días con estas condiciones durante el periodo 2007-2099.
series, the adjusted models of Gompertz model presented in Table 2 were used. For the estimation of the number of days with maximum temperature above 25 oC, the average maximum temperature in January, February and March were included using the model. For the estimation model of the number of days with minimum temperature below 5 oC, the average of minimum temperature of January and February was included.
The model used to estimate the number of days with maximum temperature above 25 oC, yielded values greater than 180 days for the year 2083 (180.6 days), as shown in Figure 4, covering the entire days of this crop when is sown in January (the analysis for this crop, as mentioned above, covers the months from January to June), so that, the crop would not be appropriated for the region under these thermal conditions; which means that during the cycle, there will be maximum temperatures greater than 25 oC, which will keep the crop under heat stress during this period, this would represent a null productive potential for this species. On days with minimum temperature below 5 oC, there is a steady trend of 6 days with these conditions during the period 2007-2099.
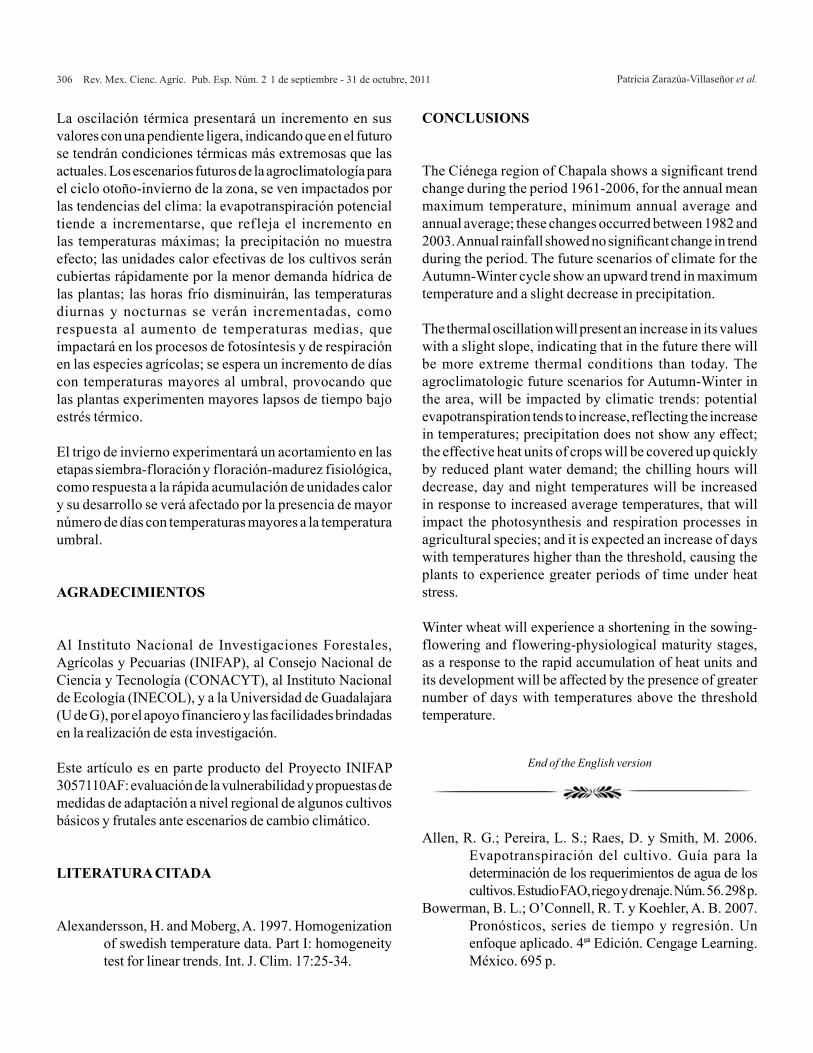
Figure 5 shows the trends of phenological variables: sowing-flowering days (S-F) and flowering-maturity days (F-M). The differences between the observed value in the 1977-2006 climatology and the estimate for the year 2090, are 16 days less for the S-F days parameter and 4 days less for F-M
Parámetro agroclimático Modelo Gompertz R2
Días con temperatura máxima, > 25 oC Y= 98e-2300e-0.32TxEFM 0.904
Días con temperatura mínima, < 5 oC Y= 0. 0002e13e-0.027TiEF 0.773
Cuadro 2. Modelos Gompertz ajustados para estimar dos variables agroclimáticas del trigo.
Table 2. Adjusted Gompertz models to estimate two adjusted agroclimatic variables of wheat.
Y= parámetro agroclimático; TxEFM= promedio de la temperatura máxima de los meses de enero, febrero y marzo; TiEF= promedio de la temperatura mínima de los meses de enero y febrero.
Figura 4. Tendencia del número de días con temperatura máxima (Tx) mayor que 25 °C y número de días con temperatura mínima (Ti) menor que 5 °C, durante el periodo enero a junio, para el análisis retrospectivo (1961-2006) y análisis prospectivo (2007-2099).
Figure 4. Trend in number of days with maximum temperature (Tx) greater than 25 oC and number of days with minimum temperature (Ti) less than 5 oC during the January to June period, for retrospective analysis (1961-2006) and prospective analysis (2007-2099).
Núm
ero
de d
ías
200180160140120100
80604020
0
Año
1961
1966
1971
1976
1981
1986
1991
1996
2001
2006
2011
2016
2021
2026
2031
2036
2041
2046
2051
2056
2061
2066
2071
2076
2081
2086
2091
2096
Días Tx > 25°C Días Ti < 5°C

Cambio climático y agroclimático para el ciclo otoño-invierno en la región Ciénega de Chapala 305
En la Figura 5 se observan las tendencias de las variables fenológicas días siembra-floración (S-F) y días floración-madurez (F-M). Las diferencias entre el valor observado en la climatología 1977-2006 y el estimado para el año 2090, son 16 días menos para el parámetro días S-F y 4 días menos para días F-M; éstos resultados reflejan el impacto que el cambio climático tendría sobre la duración de las etapas fenológicas, a través de una acumulación de unidades calor más acelerada. Así, el ciclo del cultivo de trigo tenderá a reducirse en 20 días a finales del siglo XXI.
Como se aprecia en la Figura 5, conforme avance el siglo, estas dos etapas se van acortando para la misma fecha de siembra (14 de enero); si se llegara a modificar ésta, adelantándola, se tendrían las duraciones mostradas en el Cuadro 3, donde se observa que después del año 2040, se tendrá un acortamiento más marcado en la etapa siembra-floración para cualquiera de las fechas de siembra, en tanto que la etapa floración-madurez fisiológica no mostrará acortamientos significativos.
CONCLUSIONES
La región Ciénega de Chapala muestra un cambio de tendencia significativo durante el periodo 1961-2006, para la temperatura máxima media anual, mínima media anual y media anual; dichos cambios ocurrieron entre 1982 y 2003. La precipitación anual no mostró cambio de tendencia significativo durante el periodo analizado. Los escenarios futuros de la climatología para el ciclo otoño-invierno, muestran tendencias al incremento en la temperatura máxima y un ligero decremento en la precipitación.
days, these results reflect the impact that the climatic change would have on the duration of phenological stages, through a faster accumulation of heat units. Thus, the wheat crop cycle will be reduced by 20 days at the end of the XXI century.
As shown in the Figure 5, as the century progresses, these two stages will be shorter for the same planting date (January 14); if this were modified by anticipating it, the lengths shown in Table 3 would be obtained, which shows that after 2040, there will be a more marked shortening in the sowing-flowering period for any planting dates, while the flowering-physiological maturity stage will not show signif icant shortening.
AñoFechas de siembra
01 Nov. 15 Nov. 01 Dic. 15 Dic. 01 Ene. 01 Nov. 15 Nov. 01 Dic. 15 Dic. 01 Ene.Días de la etapa siembra-floración Días de la etapa floración-madurez fisiológica
2020 82 82 83 82 80 46 45 40 37 342030 82 83 83 83 80 46 44 41 36 342040 80 80 80 80 78 45 44 40 36 332050 78 78 78 79 76 45 43 41 35 332060 75 76 76 77 74 45 42 41 35 342070 73 75 75 76 73 43 41 40 34 322080 70 72 72 71 71 41 41 39 36 322090 69 70 69 68 68 39 39 38 37 32
Figura 5. Tendencia del número de días S-F y número de días F-M, en algunos años seleccionados del análisis prospectivo.
Figure 5. Trend of S-F days number and FM days number, of years selected in the prospective analysis.
1977
/200
6
2019
/202
0
2029
/203
0
2039
/204
0
2049
/205
0
2059
/206
0
2069
/207
0
2079
/208
0
2089
/209
0
140
120
100
80
60
40
20
0
Núm
ero
de d
ías
Ciclo otoño-invierno
Días floración-madurez fisiológicaDías siembra-floración
Cuadro 3. Estimación de la duración de las etapas siembra-floración y floración-madurez fisiológica del trigo bajo diferentes fechas de siembra. Análisis prospectivo.
Table 3. Estimation of the duration of planting-flowering stage and flowering-physiological maturity of wheat under different planting dates. Prospective analysis.
Patricia Zarazúa-Villaseñor et al.306 Rev. Mex. Cienc. Agríc. Pub. Esp. Núm. 2 1 de septiembre - 31 de octubre, 2011
La oscilación térmica presentará un incremento en sus valores con una pendiente ligera, indicando que en el futuro se tendrán condiciones térmicas más extremosas que las actuales. Los escenarios futuros de la agroclimatología para el ciclo otoño-invierno de la zona, se ven impactados por las tendencias del clima: la evapotranspiración potencial tiende a incrementarse, que ref leja el incremento en las temperaturas máximas; la precipitación no muestra efecto; las unidades calor efectivas de los cultivos serán cubiertas rápidamente por la menor demanda hídrica de las plantas; las horas frío disminuirán, las temperaturas diurnas y nocturnas se verán incrementadas, como respuesta al aumento de temperaturas medias, que impactará en los procesos de fotosíntesis y de respiración en las especies agrícolas; se espera un incremento de días con temperaturas mayores al umbral, provocando que las plantas experimenten mayores lapsos de tiempo bajo estrés térmico.
El trigo de invierno experimentará un acortamiento en las etapas siembra-floración y floración-madurez fisiológica, como respuesta a la rápida acumulación de unidades calor y su desarrollo se verá afectado por la presencia de mayor número de días con temperaturas mayores a la temperatura umbral.
AGRADECIMIENTOS
Al Instituto Nacional de Investigaciones Forestales, Agrícolas y Pecuarias (INIFAP), al Consejo Nacional de Ciencia y Tecnología (CONACYT), al Instituto Nacional de Ecología (INECOL), y a la Universidad de Guadalajara (U de G), por el apoyo financiero y las facilidades brindadas en la realización de esta investigación.
Este artículo es en parte producto del Proyecto INIFAP 3057110AF: evaluación de la vulnerabilidad y propuestas de medidas de adaptación a nivel regional de algunos cultivos básicos y frutales ante escenarios de cambio climático.
LITERATURA CITADA
Alexandersson, H. and Moberg, A. 1997. Homogenization of swedish temperature data. Part I: homogeneity test for linear trends. Int. J. Clim. 17:25-34.
CONCLUSIONS
The Ciénega region of Chapala shows a significant trend change during the period 1961-2006, for the annual mean maximum temperature, minimum annual average and annual average; these changes occurred between 1982 and 2003. Annual rainfall showed no significant change in trend during the period. The future scenarios of climate for the Autumn-Winter cycle show an upward trend in maximum temperature and a slight decrease in precipitation.
The thermal oscillation will present an increase in its values with a slight slope, indicating that in the future there will be more extreme thermal conditions than today. The agroclimatologic future scenarios for Autumn-Winter in the area, will be impacted by climatic trends: potential evapotranspiration tends to increase, reflecting the increase in temperatures; precipitation does not show any effect; the effective heat units of crops will be covered up quickly by reduced plant water demand; the chilling hours will decrease, day and night temperatures will be increased in response to increased average temperatures, that will impact the photosynthesis and respiration processes in agricultural species; and it is expected an increase of days with temperatures higher than the threshold, causing the plants to experience greater periods of time under heat stress.
Winter wheat will experience a shortening in the sowing-flowering and flowering-physiological maturity stages, as a response to the rapid accumulation of heat units and its development will be affected by the presence of greater number of days with temperatures above the threshold temperature.
Allen, R. G.; Pereira, L. S.; Raes, D. y Smith, M. 2006. Evapotranspiración del cultivo. Guía para la determinación de los requerimientos de agua de los cultivos. Estudio FAO, riego y drenaje. Núm. 56. 298 p.
Bowerman, B. L.; O’Connell, R. T. y Koehler, A. B. 2007. Pronósticos, series de tiempo y regresión. Un enfoque aplicado. 4tª Edición. Cengage Learning. México. 695 p.
End of the English version

Cambio climático y agroclimático para el ciclo otoño-invierno en la región Ciénega de Chapala 307
Brito, C. L.; Díaz, C. S. C. and Ulloa, H. R. S. 2009. Observed tendencies in maximum and minimum temperatures in Zacatecas, Mexico and possible causes. Int. J. Clim. 29:211-221.
Brooking, I. R. 1996. Temperature response of vernalization in wheat: a developmental analysis. Ann. Bot. 78:507-512.
Calderón, H. F. 2007. Plan Nacional de Desarrollo 2007-2012. Presidencia de la república. México. URL: http://www.pnd.calderon.presidencia.gob.mx.
García, E. 2004. Modificaciones al sistema de clasificación climática de Köppen. 5tª edición. Instituto de Geografía de la Universidad Nacional Autónoma de México. Serie libros. Núm. 6. 92 p.
Instituto Nacional de Ecología (INECOL). 2009. México. Cuarta comunicación nacional ante la convención marco de las Naciones Unidas sobre el cambio climático. 1ra Edición. México. 119-174 pp.
Instituto Nacional de Estadística, Geografía e Informática (INEGI). 1986. Carta de uso del suelo y vegetación escala 1:250 000. México.
Intergovernmental Panel on Climate Change (IPCC). 2007. Climate change 2007: mitigation of climate change. Contribution of working group III to the Fourth Assessment Report of the Intergovernmental Panel on Climate Change (IPCC). Metz, B.; Davidson, O.; Bosch, P.; Dave, R. and Meyer, L. (eds). Cambridge University Press. U. K. and USA. 851 p.
Magaña, V. y Caetano, E. 2007. Informe final del proyecto: pronóstico climático estacional regionalizado para la república mexicana como elemento para la reducción de riesgo, para la identificación de opciones de adaptación al cambio climático y para la alimentación del sistema: cambio climático por estado y por sector. No. Proyecto INE/A1-006/2007. Universidad Autónoma de México. México (UNAM). 19 p.
Magaña, V.; Pérez, J. L.; Vázquez, J. L.; Carrisoza, E. y Pérez, J. 2004. El Niño y el clima. In: Magaña R. V. (ed.). Los impactos de El Niño en México. Centro de Ciencias de la Atmósfera. UNAM-SEGOB. México. 23-66 pp.
McMaster, G. S.; White, J. W.; Hunt, L. A.; Jamieson, P. D.; Dhillon, S. S. and Ortiz-Monasterio, J. I. 2008. Simulating the influence of vernalization, photoperiod and optimum temperature on wheat developmental rates. Ann. Bot. 102:561-569.
Ojeda, B. W.; Sifuentes, I. E.; Íñiguez, C. M. y Montero, M. M. J. 2011. Impacto del cambio climático en el desarrollo y requerimientos hídricos de los cultivos. Agrociencia. 45:1-11.
Ortiz, S. C. A. 1987. Elementos de agrometeorología cuantitativa con aplicaciones en la república mexicana. Departamento de Suelos. Universidad Autónoma de Chapingo (UACH). México. 327 p.
Pérez, F. J.; Ormeño, N. J.; Reynaert, B. and Rubio, S. 2008. Use of the dynamic model for the assessment of winter chilling in a temperate and a subtropical climatic zone of Chile. Chilean J. Agric. Res. 68:198-206.
Ramos, O. V. H.; Castro, N. S.; López, S. J. A.; Briones, E. F. y Huerta, A. J. 2009. Impacto del estrés hídrico y la temperatura alta sobre plantas cultivadas: el caso del maíz (Zea mays L.) en Tamaulipas. Revista Digital Universitaria. Universidad Autónoma de Tamaulipas. URL: http://www.turevista.uat.edu.mx.
Ruiz, C. J. A.; González, A. I. J.; Anguiano, C. J.; Vizcaíno, V. I.; Alcántar, R. J. J.; Flores, L. H. E. y Regalado, R. J. R. 2004. Clasificación climática del estado de Jalisco. INIFAP. México. Libro técnico. Núm. 1. 178 p.
Ruiz, C. J. A.; Ramírez, D. J. L.; Flores, M. F. J. y Sánchez, G. J. J. 2000a. Cambio climático y su impacto sobre la estación de crecimiento de maíz en Jalisco, México. Rev. Fitotec. Mex. 23:169-182.
Ruiz, C. J. A.; Ramírez, D. J. L.; Flores, M. F. J. y Sánchez, G. J. J. 2000b. Cambio climático y efectos sobre las áreas potenciales para maíz en Jalisco, México. Rev. Fitotec. Mex. 23:183-194.
Ruiz, C. J. A.; González, A. I. J.; Anguiano, C. J.; Vizcaíno, V. I.; Ibarra, C. D.; Alcalá, G. J.; Espinoza, V. S. y Flores, L. H. E. 2003. Estadísticas climatológicas básicas para el Estado de Jalisco (1961-2000). INIFAP. Libro técnico. Núm. 1. 281 p.
Secretaría de Agricultura, Ganadería, Desarrollo Rural, Pesca y Alimentación (SAGARPA). 2009. Servicio de Información Agroalimentaria y Pesquera (México). URL: http://www.siap.sagarpa.gob.mx.
Solís, M. E.; Hernández, M. M.; Borodanenko, A.; Aguilar A. J. L. y Grajeda, C. O. A. 2004. Duración de la etapa reproductiva y el rendimiento de trigo. Rev. Fitotec. Mex. 27:323-332.
Tejeda, M. A. y Rodríguez, V. L. 2007. Estado de la investigación de los aspectos físicos del cambio climático en México. Investigaciones Geográficas. Boletín. 62:31-43.
Wheldon, T. E. 1988. Mathematical models in Cancer research. Publisher: Taylor and Francis. 1ra Edición. 264 p.

Patricia Zarazúa-Villaseñor et al.308 Rev. Mex. Cienc. Agríc. Pub. Esp. Núm. 2 1 de septiembre - 31 de octubre, 2011
Zarazúa, V. P. 2011. Evaluación del cambio climático y sus impactos sobre los cultivos de trigo, maíz y agave de la región Ciénega de Chapala (análisis retrospectivo y análisis prospectivo). Tesis de Doctorado en Ciencias. Universidad de Guadalajara. México. 188 p.
Zhao, Y.; Wang, C.; Wang, S. and Tibig, L. V. 2005. Impacts of present and future climate variability on agriculture and forestry in the humid and sub-humid tropics. In: increasing climate variability and change. Salinger, J.; Sivakumar, M. V. K. and Motha, R. P. (eds.). Springer. 70:71-116.