basin focal project - pbworkscpwfbfp.pbworks.com/f/bfpigb+annual+report-2008.pdf2 cpwf b asin focal...
TRANSCRIPT
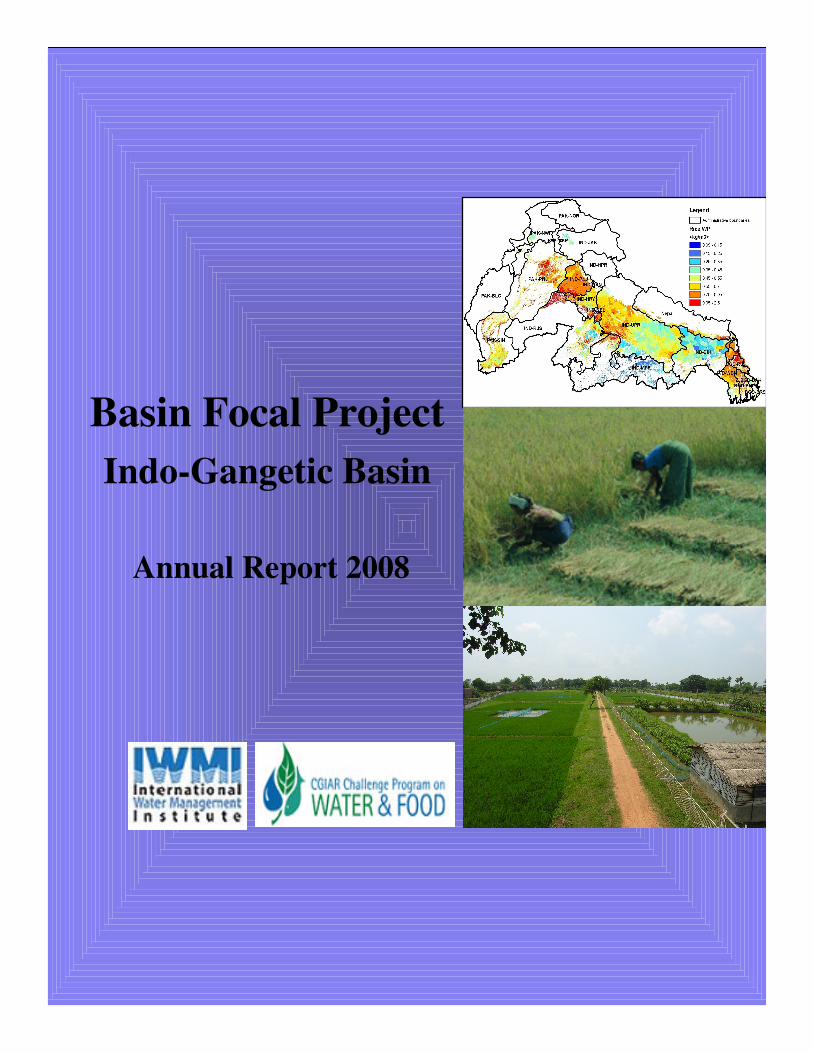
Basin Focal Project
Indo-Gangetic Basin
Annual Report 2008
CHALLENGE PROGRAM ON WATER AND FOOD (CPWF)
BASIN FOCAL PROJECT (BFP)
INDUS-GANGETIC BASIN (IGB)
ANNUAL PROGRESS REPORT:
2008
BFP-IGB TEAM
UPALI AMARASINGHE
STEFANOS XENARIOS
LUNA BHARTI
CAI XUELIANG
ASAD SARWAR QURESHI
TUSHAAR SHAH
ADITI MUKHERJI
BHARAT SHARMA
GK AMBILI
MIR MATIN
RAJENDRA SINGH (IIT-KGP)
ALAN BROOKS (WORLDFISH)
M. GIASUDDIN (WORLDFISH)
SUSANA HERVAS AVILA (WORLDFISH)
PROJECT LEADER: BHARAT SHARMA
THEME LEADER: VLADIMIR SMAKHTIN
INTERNATIONAL WATER MANAGEMENT INSTITUTE
NEW DELHI OFFICE, INDIA
2
CPWF BASIN FOCAL PROJECT:
INDUS- GANGETIC BASIN (BFP-IGB)
Annual Report-2008
1. Introduction
Indo-Gangetic basin, one of the world’s most populous, has emerged during the past 40 years into an intricate mosaic of interactions between man and nature, poverty and prosperity and problems and possibilities. Rapid expansion in agricultural water use is a common theme across these interactions and access to water is central for the livelihoods of the rural poor. Given the diversity of agro-climatic, social and economic conditions in the four riparian countries—Pakistan, India, Nepal and Bangladesh—the IGB is clearly one of the most complex river basin systems in the world. Management of IGB water resources presents some formidable challenges and, therefore, steps must be taken towards integrated management of the IGB’s water and land resources in order to ensure the future sustainability of all production and ecosystems in the basin.
The total basin area is 225.2 million ha and the net cropped area is 114 million ha. The population of IGB is 747 million as per 2001 census. Rural population in Bangladesh, India, Nepal and Pakistan is 79.9%, 74.5%, 86.0% and 68.0%, respectively of the total population. In 2000, about 30.5% population in IGB is below poverty line. However, poverty in rural areas where agriculture is the main livelihood is substantially higher. In India much of the rural poverty is concentrated in few states that fall in the Ganga basin. IGB basins will have some of the highest growth of population in South Asia in the first half of this century. Even by 2050, more than 61% of the rural population and 56% of the urban population of India will live in IGB.
Irrigation is a critical factor in agricultural productivity in the Indus and Ganges basins. Indus and Ganga basin account for about two-third of the total grain production in India. Cropping systems are characterized by rice, wheat, cotton and sugarcane crops besides several other minor crops. Among the grains, IG basin produces a major part of wheat production (93%) and more than half (58%) of rice production at present. In the lower parts of the Ganges basin in India and Bangladesh inland fisheries also form a significant component of the agricultural production system. The Indus basin is quite productive in India and Pakistan and food surplus in this basin meets the food requirements of several other food deficits basins. The region that has most closely achieved its agriculture production potential is Western Indo-Gangetic Plains, spanning from Pakistan Punjab, right across Indian Punjab, Haryana, western U.P. and western Nepal Terai. Combined rice-wheat productivity is estimated to be 8-12 tons/ha/year in the region, although quite variable. Among the three IGB regions it is the Eastern Indo-Gangetic Plains, comprising of eastern U.P., Bihar and West Bengal in India, eastern Nepal Terai, and all of Bangladesh that has the greatest differences between potential and actual productivity.
The basin as a whole and Indian region in particular is witnessing a good expansion in economy and income levels, which shall have substantial implications for future water and food requirements (Upali, 2007). Land use, cropping and water use patterns are changing, partly as responses to changing demographic and consumption patterns, and partly as responses to changing investment scenarios and economic growth. At the basin scale, the eastern region
3
has the highest population densities, was bypassed during the Green Revolution era and is still weak in rural infrastructure, developed markets, institutions, energy and credit for agricultural operations, location specific technologies, storage based surface irrigation systems and well developed groundwater resources. Additionally, parts of the region are frequently devastated by seasonal floods and subsequent water congestion. The western region was the seat of Green Revolution, has high productivity and good irrigation (now dominated by groundwater) and rural infrastructure and markets. However, the second generation problems of rapidly declining water tables, deteriorating (and shrinking) surface irrigation systems, water logging and salinity in large pockets and large subsidies on agricultural inputs raise serious questions for the long term sustainability of intensive irrigated production systems. At the country level eastern Indian region, Nepal hill regions and Bangladesh plains need immediate attention.
To achieve the stated objectives of the Project, good progress under the Poverty, Productivity, Institutional Analysis and Knowledge Management work-packages and satisfactory progress under the Water Availability and Intervention analysis has been made during 2008. Work-package wise brief highlights are presented below:
II. Progress under the Work packages
2. WP 2 – Water Availability
Assessment of surface and groundwater resources and the availability for different sectors is a great challenge in the Indus-Gangetic basin mainly due to transboundary nature and serious river-flow and related hydrologic parameters data access limitations and also for time and resource constraints. To reasonably address this issue and address the WP objectives, it has been agreed to undertake a detailed sub-basin analysis at representative locations: Rechna- Doab in Indus basin (Pakistan), Upper-Ganga sub-basin (upstream Kanpur in India), Koshi sub-basin (Nepal and India) and Ghorai-Madhumati sub-basin (in Bangladesh) for the Ganga basin. Soil & Water Assessment Tool (SWAT) shall be employed possibly for all the four sub-basins to assess the water availability and to quantify the impact of land and crop management practices. Model setting, data collection, calibration and analysis have been completed for the sub-basin in Bangladesh. Scenario-analysis comparing 1970’s landuse and water use to the current time period is also underway and nearing completion. Upper-Ganga sub-basin analysis is also progressing satisfactorily and it has good support from another on-going project. Work on Koshi sub-basin shall be taken up after March, 2009. Similarly, work for Rechna-Doab sub-basin is expected to commence early 2009.
For completing a satisfactory full-basin analysis, the following options have been found to be suitable for the basin:
i. Conduct a PODIUM-Sim analysis for the whole Indo-Gangetic basin. This is relatively straightforward and manageable. IWMI has already completed this analysis for the Indian part of the IG basin and shall take up the inclusion of the Indus-Pakistan, and Nepal- and Bangladesh-Ganges components into it. (First half of 2009)
ii. Employ WEAP modelling for conducting the whole basin analysis- either separately for the two basins or integrated into one. The WEAP hydrology routine
4
allows to seamlessly integrate hydrology and water management in a single modelling environment and to capture the interactions. ToRs are being developed in consultation with IRD/ SIWI and the project is hopeful of reaching an agreement within a month or so. This analysis shall be a good addition to the existing body of knowledge and very useful for the second phase of CPWF for the Ganges basin (upto September, 2009?). Synthesized information based on the available reports is given below:
2.1. Water resources
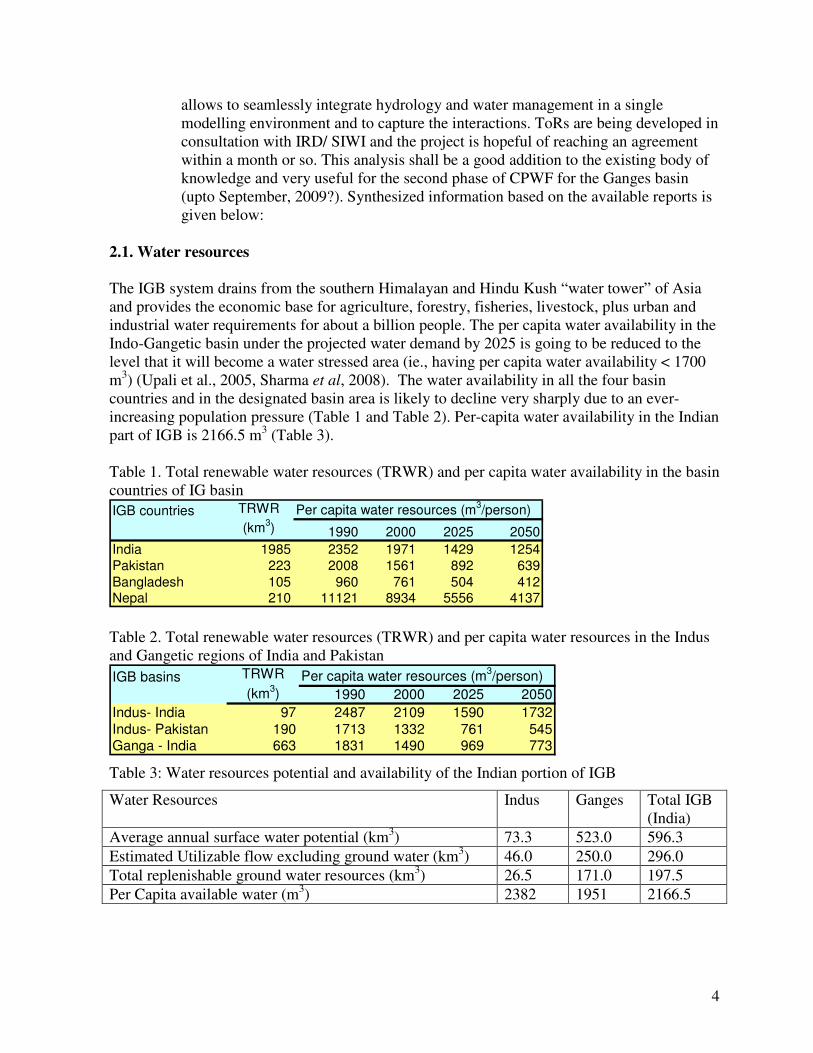
The IGB system drains from the southern Himalayan and Hindu Kush “water tower” of Asia and provides the economic base for agriculture, forestry, fisheries, livestock, plus urban and industrial water requirements for about a billion people. The per capita water availability in the Indo-Gangetic basin under the projected water demand by 2025 is going to be reduced to the level that it will become a water stressed area (ie., having per capita water availability < 1700 m3) (Upali et al., 2005, Sharma et al, 2008). The water availability in all the four basin countries and in the designated basin area is likely to decline very sharply due to an ever-increasing population pressure (Table 1 and Table 2). Per-capita water availability in the Indian part of IGB is 2166.5 m3 (Table 3). Table 1. Total renewable water resources (TRWR) and per capita water availability in the basin countries of IG basin
Table 2. Total renewable water resources (TRWR) and per capita water resources in the Indus and Gangetic regions of India and Pakistan
Table 3: Water resources potential and availability of the Indian portion of IGB
Water Resources
Indus Ganges Total IGB (India)
Average annual surface water potential (km3) 73.3 523.0 596.3
Estimated Utilizable flow excluding ground water (km3) 46.0 250.0 296.0
Total replenishable ground water resources (km3) 26.5 171.0 197.5
Per Capita available water (m3) 2382 1951 2166.5
IGB basins Per capita water resources (m3/person)
1990 2000 2025 2050
Indus- India 97 2487 2109 1590 1732
Indus- Pakistan 190 1713 1332 761 545Ganga - India 663 1831 1490 969 773
TRWR
(km3)
IGB countries Per capita water resources (m3/person)
1990 2000 2025 2050
India 1985 2352 1971 1429 1254
Pakistan 223 2008 1561 892 639
Bangladesh 105 960 761 504 412Nepal 210 11121 8934 5556 4137
TRWR
(km3)
5
Groundwater resources: Ground water resources can be classified as static and dynamic. Sustainable ground water development requires that only the dynamic resources are tapped. Exploitation of static ground water resources could be considered during extreme scarcity conditions, that also only for essential purposes. Ground water resources in the Ganga basin are nearly six times that of the Indus basin (Table 4)
Table 4. Static fresh ground water resource (km3) of IG Basin
River Basin Alluvium/ Unconsolidated Rocks Hard Rocks Total
Indus 1,334.9 3.3 1,338.2
Ganga 7,769.1 65 7,834.1
As far as water use is concerned, 90% of the annual water withdrawals in the Ganga is still being diverted for agriculture followed by 7.8 per cent for domestic use in IGB (Table 5). In Indus, the share of agriculture in total withdrawals is as high as 96%. However, the major drivers of increasing water demand in the future will be from the domestic and industrial sectors.
Table 5. Water withdrawals of India and Indian part of Indus and Ganga basin
Irrigation water
demand Domestic water demand
Industrial water demand
Basins (km3) (km3) (km3)
2000 2025 2050 2000 2025 2050 2000 2025 2050
Indus 94 81 71 1.6 3.1 4.0 2.4 5.0 7.6 Ganga 256 272 260 13.9 31.0 54.0 13.6 40.0 75.6
Basin total 350 353 331 16 34 58 16 45 83 % of India 58% 52% 52% 46% 52% 57% 38% 49% 52% India 605 673 632 33 66 101 42 92 161
Source: Upali et al. (2008), estimates based on PODIUMSim model A study was also conducted on reviewing various developments that have taken place in water sector of the Pakistan part of Indus Basin, how has it helped increase production and brought more area under irrigation and what are the challenges being faced to overcome the food crises and livelihood issues of the dominant rural population of this basin (Khan et al, 2008 ). Severe shortages in irrigation supplies during Rabi (winter) season have been checked to a greater extent after Mangla and Tarbela reservoirs became operational under Indus River System Authority (IRSA). Annual withdrawals improved by 55 percent and groundwater irrigation has shown an increase of about 450 percent over a period of 31 years. Water quality is also a serious problem in several large areas of the Indus and Gangetic basin. Whereas in the Indus basin, the problems of salinity and alkalinity of groundwater are encountered, the lower reaches of the Ganges basin are afflicted with arsenic contamination. The natural incidences of high arsenic in groundwater in the vast tract of alluvial aquifers within the delta plains in West Bengal, eastern India, have attained an alarming magnitude.
6
Many studies have detected arsenic contamination of groundwater in the lower Ganga Plain of West Bengal and Bangladesh 2.2. Water related hazards in IG Basin Floods are a common feature in the Eastern IGB. Flooding in rivers is mainly caused by inadequate capacity within the banks of the rivers to contain higher flows, riverbanks erosion and silting of riverbeds, landslides leading to obstruction of flow and change in the river course, poor natural drainage due to flat floodplains and occurrence of coastal cyclones, and intense rainfall events. Ganga river basin and its tributaries like Yamuna, Sone, Ghagra, Gandak, Koshi. Mahananda witness annual floods. Among the South Asian Countries, India is more vulnerable to flood events, followed by Bangladesh (CRED International Disaster database). Riverine and inland flooding is also on the increase, especially in northern and eastern India and adjoining Nepal and Bangladesh. 56% of the total geographical area of India was affected during the drought of 1987, causing a loss of 32.0 million tons in food grain production. The total flood prone area in India is about 40 m ha (Mirza and Ericksen, 1996) while 68 percent of the net sown area is vulnerable to drought. In India alone, on an average about 7.4 M ha area is flooded annually, but nine occasions during the last three decades have witnessed heavy floods affecting more than 10 M ha. International or inter-state nature of these rivers specifically hinders the ability of any state governments to take up appropriate and timely measures for moderating floods and further adds to the complexity of flood problem in the riparian regions. Average annual damages due to floods/heavy rains during the last five decades have been estimated at INR 13523 million. These floods seriously hit the employment opportunities, livelihood options and capital assets of the vulnerable sections of the society and more so for the women and children. Climate change is likely to further aggravate this problem as an annual mean increase in precipitation of 3 ±1% in 2020s, and 7 ±2% in the 2050s has been predicted for the region (Sharma and Sharma, 2008). Parts of Rajasthan, Haryana, Madhya Pradesh and Uttar Pradesh in India and Sind province of Pakistan also experience occasional droughts due to failure or delayed monsoons. Over the years the impact of droughts has diminished due to investments in water infrastructure and other adaptive and mitigation measures. 3. WP3 – Water Productivity Analysis
Water productivity (WP) analysis (Work Package 3) aims to provide understanding of basin performance on agricultural water utilization, assess scope for improvement, and identify factors affecting WP. The WP analysis in Indo-Gangetic river basin for the first year (2008) carried out basin scale assessment.
3.1. Rice water productivity in IGB
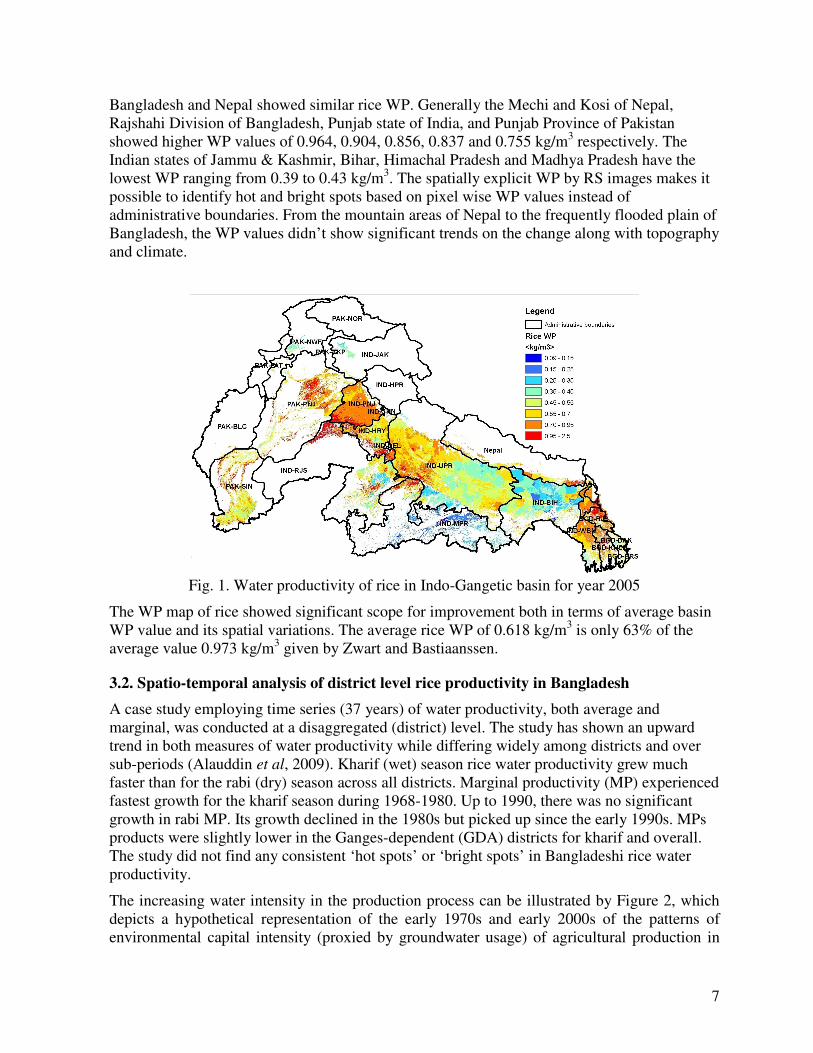
Rice water productivity was mapped using remote sensing; which involves crop dominance map generation, yield mapping and ET mapping. It has shown that rice water productivity in IGB (Figure 1) is generally low compared with other parts of the world. The mean WP for rice over actual evapotranspiration is 0.618 kg/m3, which is at the lower end given by Zwart and Bastiaanssen (2004) from a review of 84 studies. The four major countries India, Pakistan,
7
Bangladesh and Nepal showed similar rice WP. Generally the Mechi and Kosi of Nepal, Rajshahi Division of Bangladesh, Punjab state of India, and Punjab Province of Pakistan showed higher WP values of 0.964, 0.904, 0.856, 0.837 and 0.755 kg/m3 respectively. The Indian states of Jammu & Kashmir, Bihar, Himachal Pradesh and Madhya Pradesh have the lowest WP ranging from 0.39 to 0.43 kg/m3. The spatially explicit WP by RS images makes it possible to identify hot and bright spots based on pixel wise WP values instead of administrative boundaries. From the mountain areas of Nepal to the frequently flooded plain of Bangladesh, the WP values didn’t show significant trends on the change along with topography and climate.
Fig. 1. Water productivity of rice in Indo-Gangetic basin for year 2005
The WP map of rice showed significant scope for improvement both in terms of average basin WP value and its spatial variations. The average rice WP of 0.618 kg/m3 is only 63% of the average value 0.973 kg/m3 given by Zwart and Bastiaanssen.
3.2. Spatio-temporal analysis of district level rice productivity in Bangladesh
A case study employing time series (37 years) of water productivity, both average and marginal, was conducted at a disaggregated (district) level. The study has shown an upward trend in both measures of water productivity while differing widely among districts and over sub-periods (Alauddin et al, 2009). Kharif (wet) season rice water productivity grew much faster than for the rabi (dry) season across all districts. Marginal productivity (MP) experienced fastest growth for the kharif season during 1968-1980. Up to 1990, there was no significant growth in rabi MP. Its growth declined in the 1980s but picked up since the early 1990s. MPs products were slightly lower in the Ganges-dependent (GDA) districts for kharif and overall. The study did not find any consistent ‘hot spots’ or ‘bright spots’ in Bangladeshi rice water productivity.
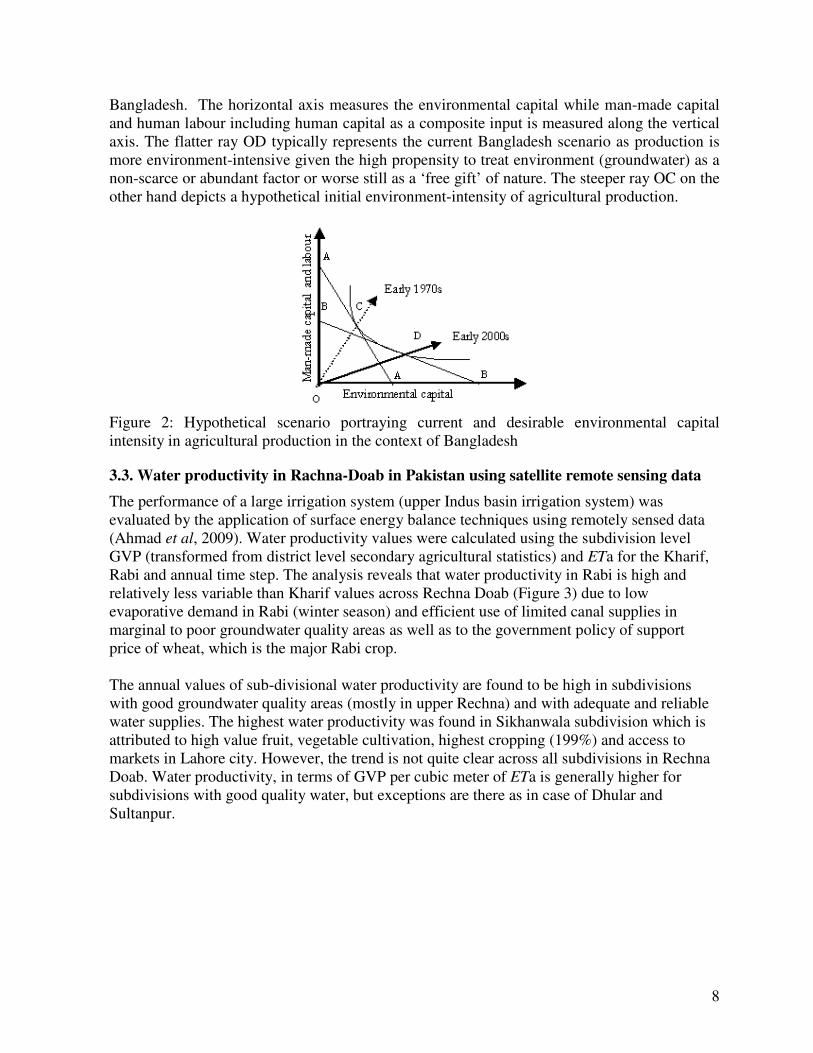
The increasing water intensity in the production process can be illustrated by Figure 2, which depicts a hypothetical representation of the early 1970s and early 2000s of the patterns of environmental capital intensity (proxied by groundwater usage) of agricultural production in
8
Bangladesh. The horizontal axis measures the environmental capital while man-made capital and human labour including human capital as a composite input is measured along the vertical axis. The flatter ray OD typically represents the current Bangladesh scenario as production is more environment-intensive given the high propensity to treat environment (groundwater) as a non-scarce or abundant factor or worse still as a ‘free gift’ of nature. The steeper ray OC on the other hand depicts a hypothetical initial environment-intensity of agricultural production.
Figure 2: Hypothetical scenario portraying current and desirable environmental capital intensity in agricultural production in the context of Bangladesh
3.3. Water productivity in Rachna-Doab in Pakistan using satellite remote sensing data
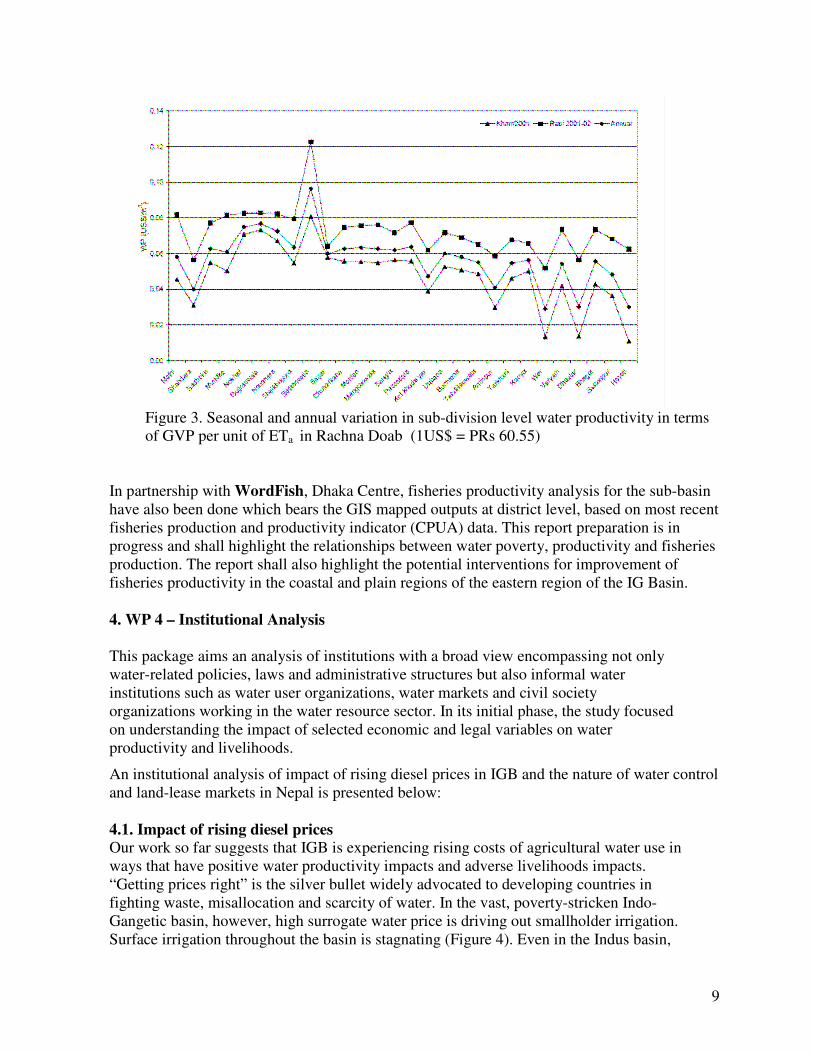
The performance of a large irrigation system (upper Indus basin irrigation system) was evaluated by the application of surface energy balance techniques using remotely sensed data (Ahmad et al, 2009). Water productivity values were calculated using the subdivision level GVP (transformed from district level secondary agricultural statistics) and ETa for the Kharif, Rabi and annual time step. The analysis reveals that water productivity in Rabi is high and relatively less variable than Kharif values across Rechna Doab (Figure 3) due to low evaporative demand in Rabi (winter season) and efficient use of limited canal supplies in marginal to poor groundwater quality areas as well as to the government policy of support price of wheat, which is the major Rabi crop. The annual values of sub-divisional water productivity are found to be high in subdivisions with good groundwater quality areas (mostly in upper Rechna) and with adequate and reliable water supplies. The highest water productivity was found in Sikhanwala subdivision which is attributed to high value fruit, vegetable cultivation, highest cropping (199%) and access to markets in Lahore city. However, the trend is not quite clear across all subdivisions in Rechna Doab. Water productivity, in terms of GVP per cubic meter of ETa is generally higher for subdivisions with good quality water, but exceptions are there as in case of Dhular and Sultanpur.
9
Figure 3. Seasonal and annual variation in sub-division level water productivity in terms of GVP per unit of ETa in Rachna Doab (1US$ = PRs 60.55)
In partnership with WordFish, Dhaka Centre, fisheries productivity analysis for the sub-basin have also been done which bears the GIS mapped outputs at district level, based on most recent fisheries production and productivity indicator (CPUA) data. This report preparation is in progress and shall highlight the relationships between water poverty, productivity and fisheries production. The report shall also highlight the potential interventions for improvement of fisheries productivity in the coastal and plain regions of the eastern region of the IG Basin. 4. WP 4 – Institutional Analysis
This package aims an analysis of institutions with a broad view encompassing not only water-related policies, laws and administrative structures but also informal water institutions such as water user organizations, water markets and civil society organizations working in the water resource sector. In its initial phase, the study focused on understanding the impact of selected economic and legal variables on water productivity and livelihoods.
An institutional analysis of impact of rising diesel prices in IGB and the nature of water control and land-lease markets in Nepal is presented below: 4.1. Impact of rising diesel prices
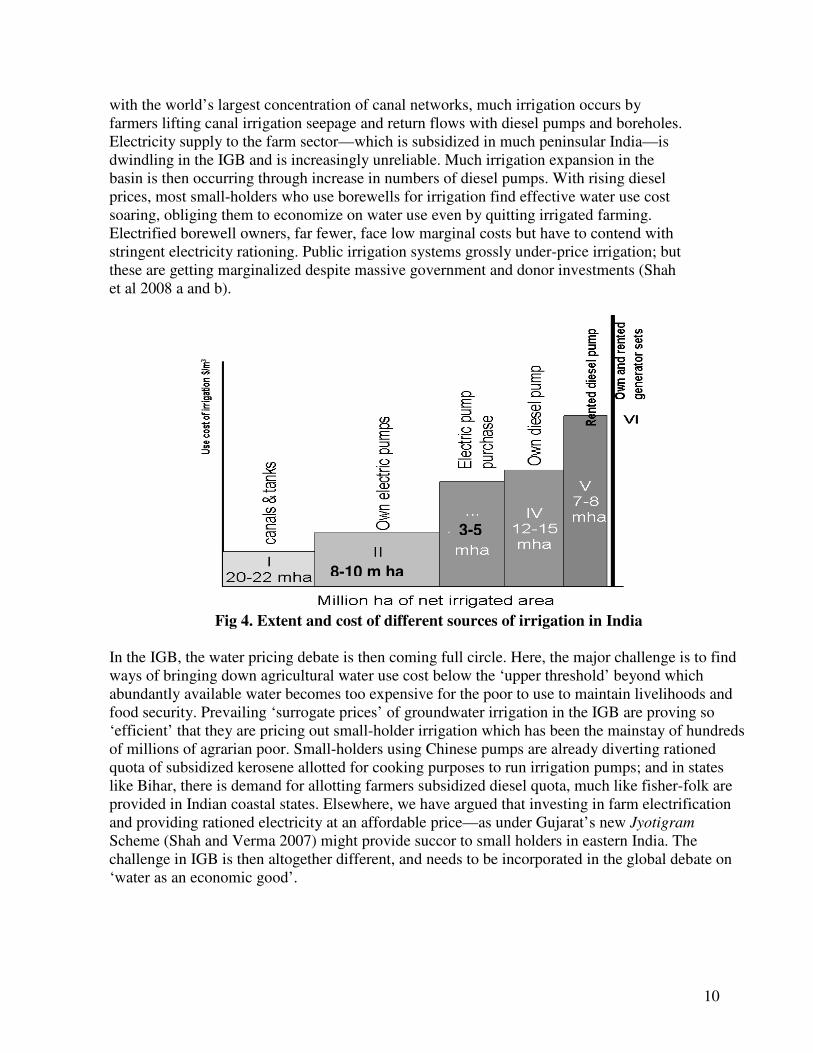
Our work so far suggests that IGB is experiencing rising costs of agricultural water use in ways that have positive water productivity impacts and adverse livelihoods impacts. “Getting prices right” is the silver bullet widely advocated to developing countries in fighting waste, misallocation and scarcity of water. In the vast, poverty-stricken Indo-Gangetic basin, however, high surrogate water price is driving out smallholder irrigation. Surface irrigation throughout the basin is stagnating (Figure 4). Even in the Indus basin,
10
with the world’s largest concentration of canal networks, much irrigation occurs by farmers lifting canal irrigation seepage and return flows with diesel pumps and boreholes. Electricity supply to the farm sector—which is subsidized in much peninsular India—is dwindling in the IGB and is increasingly unreliable. Much irrigation expansion in the basin is then occurring through increase in numbers of diesel pumps. With rising diesel prices, most small-holders who use borewells for irrigation find effective water use cost soaring, obliging them to economize on water use even by quitting irrigated farming. Electrified borewell owners, far fewer, face low marginal costs but have to contend with stringent electricity rationing. Public irrigation systems grossly under-price irrigation; but these are getting marginalized despite massive government and donor investments (Shah et al 2008 a and b).
Fig 4. Extent and cost of different sources of irrigation in India
In the IGB, the water pricing debate is then coming full circle. Here, the major challenge is to find ways of bringing down agricultural water use cost below the ‘upper threshold’ beyond which abundantly available water becomes too expensive for the poor to use to maintain livelihoods and food security. Prevailing ‘surrogate prices’ of groundwater irrigation in the IGB are proving so ‘efficient’ that they are pricing out small-holder irrigation which has been the mainstay of hundreds of millions of agrarian poor. Small-holders using Chinese pumps are already diverting rationed quota of subsidized kerosene allotted for cooking purposes to run irrigation pumps; and in states like Bihar, there is demand for allotting farmers subsidized diesel quota, much like fisher-folk are provided in Indian coastal states. Elsewhere, we have argued that investing in farm electrification and providing rationed electricity at an affordable price—as under Gujarat’s new Jyotigram Scheme (Shah and Verma 2007) might provide succor to small holders in eastern India. The challenge in IGB is then altogether different, and needs to be incorporated in the global debate on ‘water as an economic good’.
8-10 m ha
3-5
11
4.2. Water Control and Land-lease markets in Nepal
An assessment of the leasehold practices in the hill, inner terai and terai of Nepal had shown that the feudal characteristics of land-holding has perpetuated wide gaps between the rich and poor in the rural areas, which had an implication in the tenancy practices (Pant, 2009). Landlessness is another important driving force, which is at higher side in terai, for the prevalence of tenancy practices. The Land Reform Act of 1964 and its amendment tried to address the landlessness and the tenancy issues. However, it was not successful due to ineffective implementation. Mainly three forms of tenancy practices were found, mortgage, share crop and contract (Hunda in terai). Mortgage and share crop was the widely popular form of tenancy in the hills, whereas Share crop and Hunda are the most preferred form of leasehold in the terai. The intensity of leasehold in terai is higher than in the hills and inner terai. The leaseholders are the absentee owners, those having alternative employment and household having small plot of land. Electric operated shallow tubewell irrigated land is preferred by the contractor for lease than the surface and diesel operated shallow tubewell. It shows that both the availability of assured irrigation and cost effectiveness is the first priority of the lessee. The general trend in leasehold farming in the studied area suggest that new policy changes are required to promote leasehold to address the issues related to landlessness, tenancy and to increase agricultural production and productivity. The policy should encourage consolidation of the farms, investment in assured irrigation and right of tenants.
4.3. Policy and legal analysis for IG basin countries
This study shall address the following key questions:
1. How have water policies and laws evolved at the national, sub-national and transboundary scales in the IGB? What have been the major shifts in focus in this evolution? E.g. from water development to water management; changes in allocation priorities (amongst both uses and users); emergence of groundwater?
2. What are the differences in this evolution amongst the four countries and within different regions in the same country (applies to India and Pakistan only)?
3. How can we explain these shifts in terms of key drivers? E.g. influence of international norms; changing national/regional water scenarios, developmental priorities and demographic conditions (e.g. scarcity, flooding, drought, etc.)
4. Where do the boundaries between the various drivers appear to lie? E.g. what is the dynamic between international norms (top down) and local drivers (bottom up)? Are ground realities more influential at sub-national levels, whereas national laws are more in tune with international norms?
5. What appears to be the net implications for the role of water in supporting sustainable development? E.g. access to water for the poor/marginalised, balance between water for people and water for ecosystems.
The expected outputs from the study include the following:
12
1. An inventory of national, sub-national and transboundary legal instruments dealing with some aspect of water use.
2. A framework for classifying the legal instruments according to various aspects of water use.
3. Classification of instruments through the application of the classification framework and their analysis for constraints and potential improvement.
5. WP 1 – Poverty Analysis
Poverty analysis package reviews and analyzes the existing poverty and water-poverty-gender information in order to bridge the gap/s between aggregate and specific analyses of poverty; illustrate the links between inter-sectoral uses of water and links between water and other determinants of poverty.
5.1. Trends of poverty
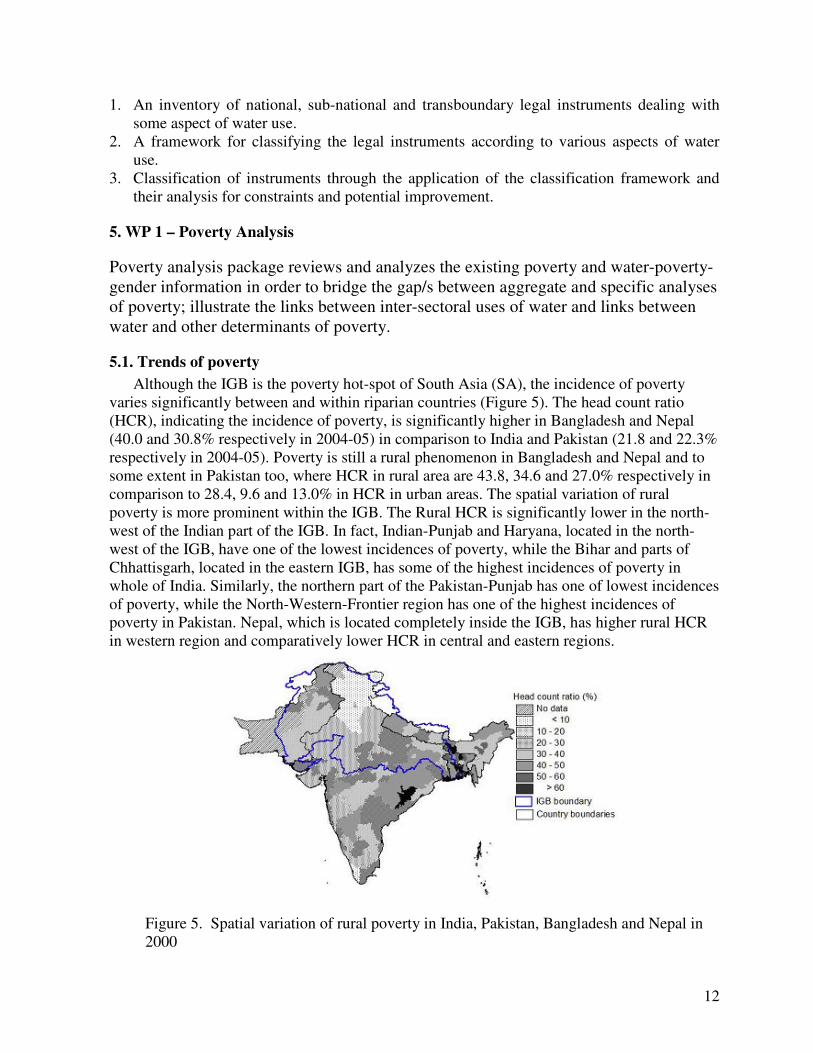
Although the IGB is the poverty hot-spot of South Asia (SA), the incidence of poverty varies significantly between and within riparian countries (Figure 5). The head count ratio (HCR), indicating the incidence of poverty, is significantly higher in Bangladesh and Nepal (40.0 and 30.8% respectively in 2004-05) in comparison to India and Pakistan (21.8 and 22.3% respectively in 2004-05). Poverty is still a rural phenomenon in Bangladesh and Nepal and to some extent in Pakistan too, where HCR in rural area are 43.8, 34.6 and 27.0% respectively in comparison to 28.4, 9.6 and 13.0% in HCR in urban areas. The spatial variation of rural poverty is more prominent within the IGB. The Rural HCR is significantly lower in the north-west of the Indian part of the IGB. In fact, Indian-Punjab and Haryana, located in the north-west of the IGB, have one of the lowest incidences of poverty, while the Bihar and parts of Chhattisgarh, located in the eastern IGB, has some of the highest incidences of poverty in whole of India. Similarly, the northern part of the Pakistan-Punjab has one of lowest incidences of poverty, while the North-Western-Frontier region has one of the highest incidences of poverty in Pakistan. Nepal, which is located completely inside the IGB, has higher rural HCR in western region and comparatively lower HCR in central and eastern regions.
Figure 5. Spatial variation of rural poverty in India, Pakistan, Bangladesh and Nepal in 2000
13
5.2. Water, Land and Poverty Nexus
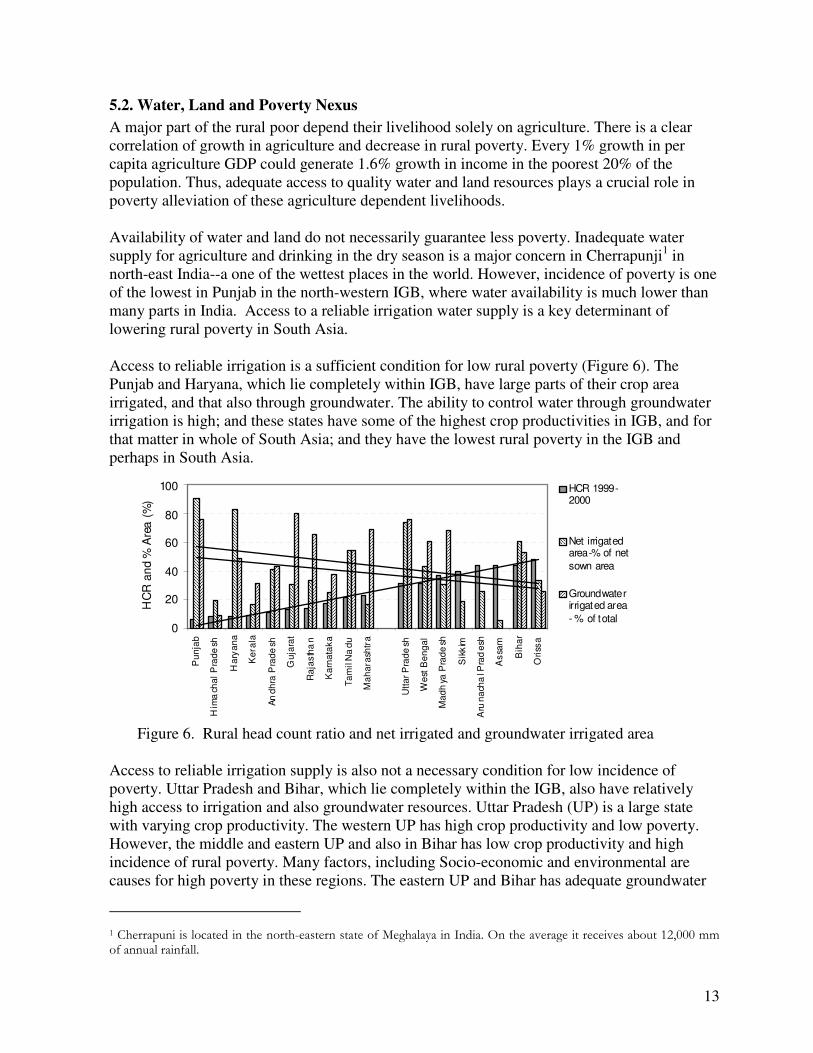
A major part of the rural poor depend their livelihood solely on agriculture. There is a clear correlation of growth in agriculture and decrease in rural poverty. Every 1% growth in per capita agriculture GDP could generate 1.6% growth in income in the poorest 20% of the population. Thus, adequate access to quality water and land resources plays a crucial role in poverty alleviation of these agriculture dependent livelihoods. Availability of water and land do not necessarily guarantee less poverty. Inadequate water supply for agriculture and drinking in the dry season is a major concern in Cherrapunji1 in north-east India--a one of the wettest places in the world. However, incidence of poverty is one of the lowest in Punjab in the north-western IGB, where water availability is much lower than many parts in India. Access to a reliable irrigation water supply is a key determinant of lowering rural poverty in South Asia. Access to reliable irrigation is a sufficient condition for low rural poverty (Figure 6). The Punjab and Haryana, which lie completely within IGB, have large parts of their crop area irrigated, and that also through groundwater. The ability to control water through groundwater irrigation is high; and these states have some of the highest crop productivities in IGB, and for that matter in whole of South Asia; and they have the lowest rural poverty in the IGB and perhaps in South Asia.
0
20
40
60
80
100
Pu
nja
b
Him
ach
al
Pra
de
sh
Ha
rya
na
Ke
rala
An
dh
ra P
rad
esh
Gu
jara
t
Ra
jasth
an
Ka
rna
tak
a
Ta
mil
Na
du
Ma
ha
rash
tra
Utt
ar
Pra
de
sh
We
st B
en
ga
l
Ma
dh
ya P
rad
esh
Sik
kim
Aru
na
cha
l Pra
de
sh
As
sam
Bih
ar
Ori
ssa
HC
R a
nd
% A
rea (
%)
HCR 1999-2000
Net irrigatedarea-% of net
sown area
Groundwaterirrigated area
- % of total
Figure 6. Rural head count ratio and net irrigated and groundwater irrigated area
Access to reliable irrigation supply is also not a necessary condition for low incidence of poverty. Uttar Pradesh and Bihar, which lie completely within the IGB, also have relatively high access to irrigation and also groundwater resources. Uttar Pradesh (UP) is a large state with varying crop productivity. The western UP has high crop productivity and low poverty. However, the middle and eastern UP and also in Bihar has low crop productivity and high incidence of rural poverty. Many factors, including Socio-economic and environmental are causes for high poverty in these regions. The eastern UP and Bihar has adequate groundwater
1 Cherrapuni is located in the north-eastern state of Meghalaya in India. On the average it receives about 12,000 mm of annual rainfall.
14
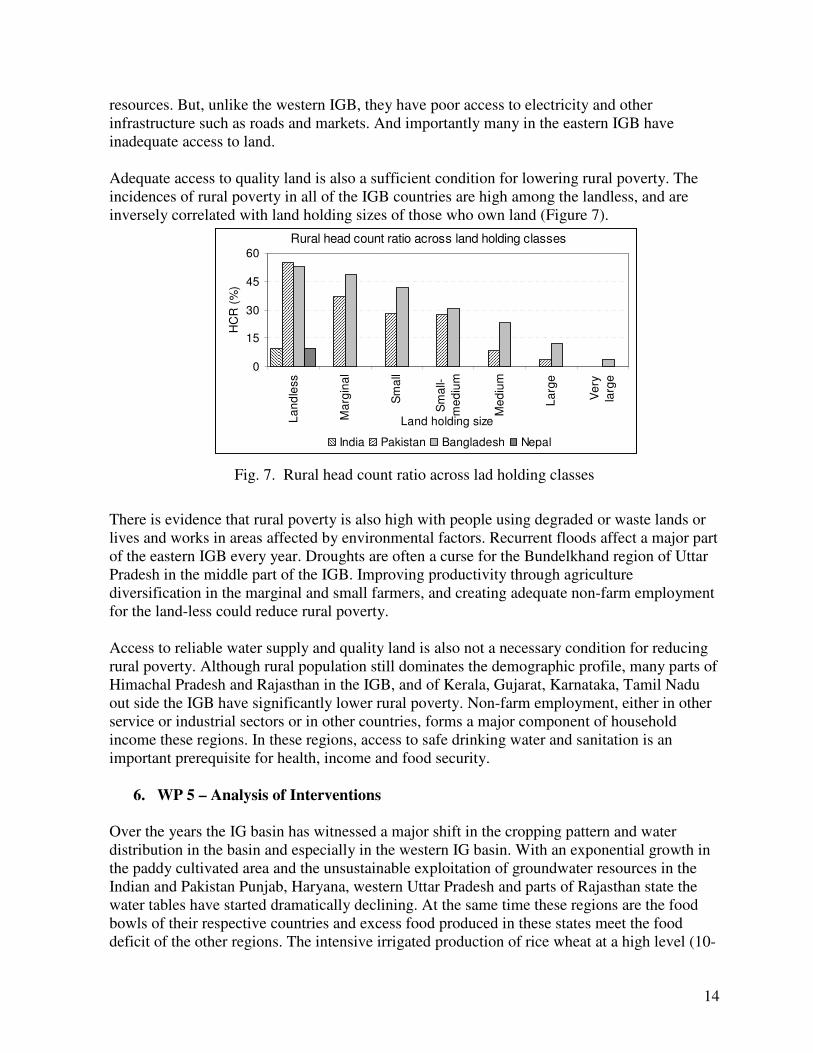
resources. But, unlike the western IGB, they have poor access to electricity and other infrastructure such as roads and markets. And importantly many in the eastern IGB have inadequate access to land. Adequate access to quality land is also a sufficient condition for lowering rural poverty. The incidences of rural poverty in all of the IGB countries are high among the landless, and are inversely correlated with land holding sizes of those who own land (Figure 7).
Rural head count ratio across land holding classes
0
15
30
45
60
La
nd
less
Ma
rgin
al
Sm
all
Sm
all-
me
diu
m
Me
diu
m
La
rge
Ve
ry
larg
e
Land holding size
HC
R (
%)
India Pakistan Bangladesh Nepal
Fig. 7. Rural head count ratio across lad holding classes
There is evidence that rural poverty is also high with people using degraded or waste lands or lives and works in areas affected by environmental factors. Recurrent floods affect a major part of the eastern IGB every year. Droughts are often a curse for the Bundelkhand region of Uttar Pradesh in the middle part of the IGB. Improving productivity through agriculture diversification in the marginal and small farmers, and creating adequate non-farm employment for the land-less could reduce rural poverty. Access to reliable water supply and quality land is also not a necessary condition for reducing rural poverty. Although rural population still dominates the demographic profile, many parts of Himachal Pradesh and Rajasthan in the IGB, and of Kerala, Gujarat, Karnataka, Tamil Nadu out side the IGB have significantly lower rural poverty. Non-farm employment, either in other service or industrial sectors or in other countries, forms a major component of household income these regions. In these regions, access to safe drinking water and sanitation is an important prerequisite for health, income and food security.
6. WP 5 – Analysis of Interventions
Over the years the IG basin has witnessed a major shift in the cropping pattern and water distribution in the basin and especially in the western IG basin. With an exponential growth in the paddy cultivated area and the unsustainable exploitation of groundwater resources in the Indian and Pakistan Punjab, Haryana, western Uttar Pradesh and parts of Rajasthan state the water tables have started dramatically declining. At the same time these regions are the food bowls of their respective countries and excess food produced in these states meet the food deficit of the other regions. The intensive irrigated production of rice wheat at a high level (10-
15
12 t/ha) with limited water resources is becoming hydrologically unsustainable with each passing year. State water balances are in negative and the trend is continuing unabated. There have been a wide variety of relevant interventions tried throughout the IGB with varying degrees of success. Work package 5 aims at to identify and assess a set of physical, institutional and policy level interventions which has the potential of significantly improving productivity and livelihoods under varying agro-ecologies of IGB. In the first phase, various secondary data were reviewed for interventions under the spatial variability of IGB. Specific interventions in the region are categorized based on the scale agro-ecoregion/regional specificity and the nature of interventions; physical, socio-economic based or institutions and policy based. Following physical interventions provide opportunities for water productivity enhancement: 1. Timely operations; timely rice transplanting date enhanced effective use of rainwater,
enhanced rice yield (upto 52%), saved 2-3 irrigations required by late transplanted rice during reproductive phase, vacate field for timely sowing of rabi (winter) crops, improved wheat yield upto (50%) and provided an energy saving in GW (38 hrs/season) for diesel pump.
2. Increased rainwater storage; raising bund height provided better and prolonged moisture availability in rice fields, a saving of 1 to 2 irrigation in rice crop, effected about 15% water saving and a yield gain of 15-20%
3. Waterwise RCTs such as Direct Seeded ZT Rice , Zero Till Drill with equally spaced rows in wheat, Raised bed plantings Wheat with residue and laser leveling have been adopted in large areas and have great potential in saving energy, water and nutrients and also enhance the productivity of rice-wheat system.
4. Crop diversification eg.Winter maize and Potato on raised bed, introduction of high value vegetables and fruits, replacement of paddy with less water requiring oilseeds and other crops in critical areas etc offer good potential for WP improvement and higher income levels.
5. Water saving irrigation methods; LEWA (Low Energy Water Application) Device provided a water saving of i)45 % over surface, ii)10 % over sprinkler and Energy Saving of i)50 % over surface, ii)55 % over sprinkler, sprinkler and drips for suitable crops and regions, laser leveling of the irrigated fields, lining of watercourses etc. show good promise for water savings.
6. Multiple use of water eg. Rice-fish culture under pens in waterlogged areas, Multiple use of water using secondary reservoir for irrigation, with integration of fishery , livestock and horticulture; improved use of water bodies, aquaculture have good potential in the eastern region.
7. Reducing non-beneficial outflow through outlet water management; Reduced the water logging area in nearby fields, saved 25-30% of canal water avoiding continuous flow through outlets, tail enders benefited through enhanced supply.
8. Making optimum use of areas afflicted with waterlogging and salinity: vast tracts of lands in the IG basin have external constraints imposed by salinity and waterlogging and salinity. Sufficient technologies are now available for their amelioration both in the plains and coastal areas but need to be examined for their large scale adoption.
16
Ex-ante evaluation of technologies, implementation process, social, institutional and policy interventions/ strategies will be done based on their performance in terms of productivity, cost effectiveness, profitability, environmental sustainability and social acceptability and strategic interventions will be selected. Detailed analysis of selected interventions will be carried out based on the components of interventions, scale of adoption, pre-requisites for adoption, potential for up-scaling and out-scaling in similar agro-ecologies, financial implications and policy framework. Geographic extrapolation domain analysis of selected potential interventions/outputs will also be attempted to analyze where else in the basin these match agro-ecological and other mappable conditions. Potential interventions will be classified and short listed for the selected areas or sub-basins and also with respect to their relative effectiveness. To determine the likely impact of the proposed interventions at the sub-basin and basin scale, the activity will be closely integrated with the activities of the other work packages, particularly the water availability through the hydrologic and water balance modeling. Projections will be made about improved productivity, profitability, income and employment generation through optimization models and decision support tools. A research study on the impacts of the National Program on Improvement of Watercourses (NPIW) of the Government of Pakistan is also being initiated, and is expected to be completed within six months. The NPIW project, framed with an objective of controlling excessive seepage from the unlined and poorly maintained watercourses, is expected to improve a total of 28000 watercourses in the canal irrigated areas of Punjab, falling under the Indus basin of Pakistan. The study aims to investigate the impacts of this intervention in terms of:
i. Water saving as a result of reduction in conveyance losses in the improved watercourses
ii. Adequacy and equity in water availability along the watercourse iii. Impact on water productivity (kgm-3) and iv. Increase in cropping intensity, if any.
The results of the study will show whether the investment going on is of any benefit to the farmers, in the perspective of water availability, on one hand and to the national economy on the other. This research will also explore that whether it should be extended to other areas representing different agro-ecological zones of the Indus river basin by helping the planners and decision makers in better assessment of the situation of water resources and its role in food security.
WP 6 – Knowledge Management
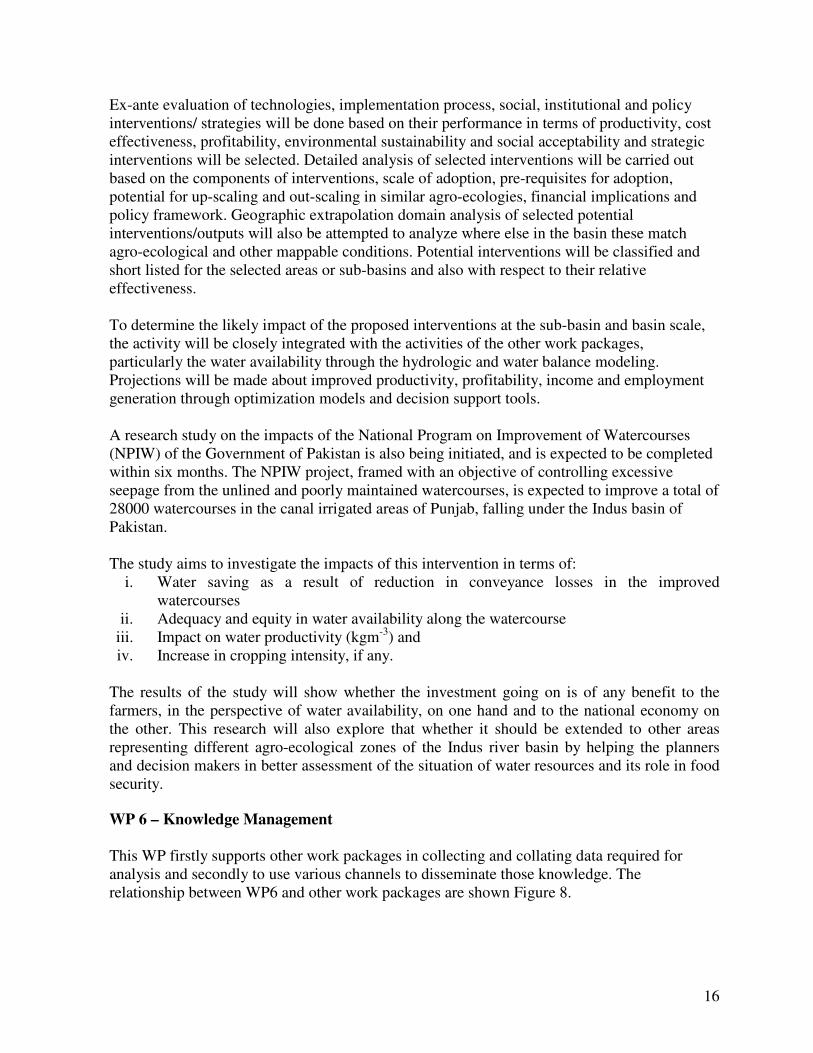
This WP firstly supports other work packages in collecting and collating data required for analysis and secondly to use various channels to disseminate those knowledge. The relationship between WP6 and other work packages are shown Figure 8.
17
Figure 8. Relationship between WP –6 and other packages
Deliverables:
• Repository of data collected from National and other global sources.
• Database with online access for BFP project team and relevant stakeholders.
• Web portal to publish project outputs.
• Seminars, workshops, policy roundtables and publications for dissemination of new knowledge and policy advocacy.
Activities
The following table shows different knowledge management activities in the project:
Component Function
Data Management Data acquisition, Collation of spatial data, prepare metadata
Access to existing knowledge Knowledge harvesting, Sharing
Knowledge Development Investigation, analysis, synthesis
Application Informed Decision making
Knowledge Dissemination
Publication, communication, Knowledge portal development
Other work packages need data on hydrology, climate, socio-economic, agriculture and environmental data from India, Bangladesh, Nepal and Pakistan from different level. GIS base data are also required to enable spatial analysis. The quality of data is important to ensure quality of research. To minimize data collection effort and ensure consistency among different work packages a systematic data acquisition process was implemented. The IDIS team was involved from the beginning to standardize the collected data, load them into IDIS and provide access to the project team.
18
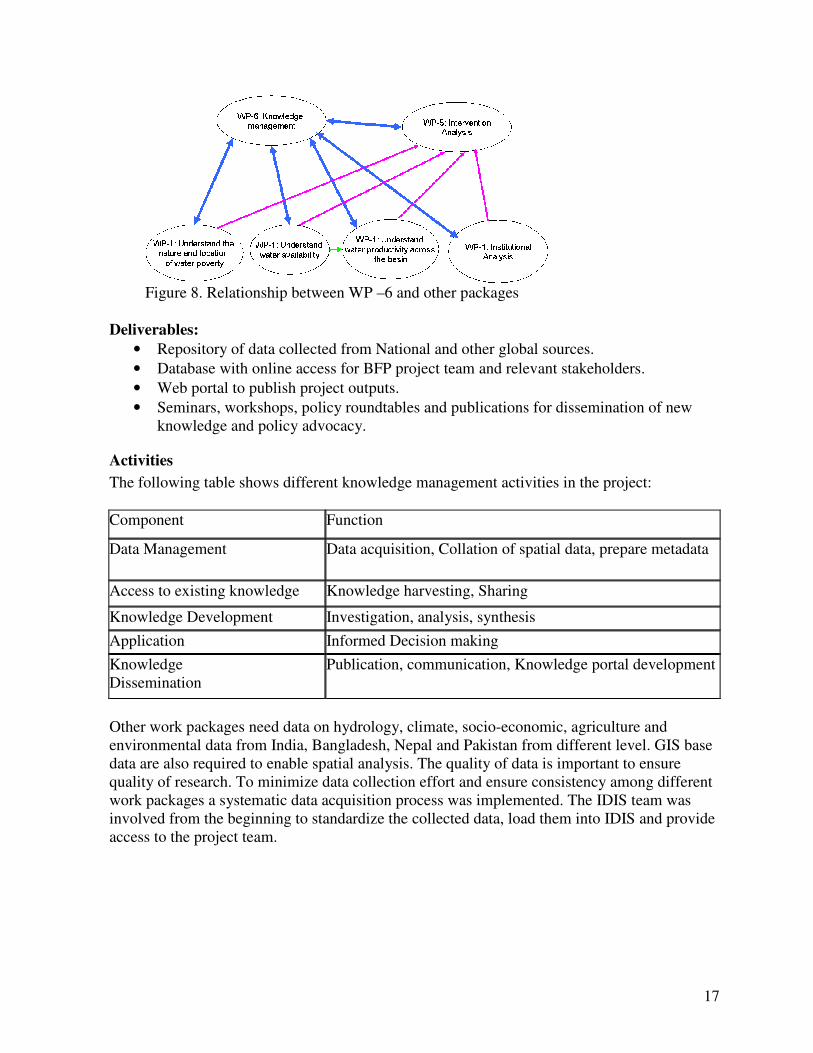
The project web site is planned to be the knowledge gateway for agricultural water management in IGB basin. The goals of knowledge management are to:
• Share the information and knowledge products as public goods
• Support decision making in the basin regarding natural resources and agriculture management
• Investment decisions by donors and the governments.
The web site will host project related documents, and reports and provide links to similar knowledge products. To promote wider circulation of project outputs, those are also uploaded into other CPWF knowledge gateways including Bludocs, BFPwiki sites. Similarly the project web site also provides links to those sites. The web site will facilitate access and exploration of knowledge based on issues, categories and locations. A DSS and web map portals will also be included in as separate module. The web site is hosted with basic structure project information and will be growing with the progress of the project.
Beneficiaries and Impact
The following table shows various beneficiaries of WP6 and what would be the possible impact on them:
Beneficiary Type of benefits Impact
Project research team Access to quality assessed data
Consistency and quality of research output
CPWF Easy access to research output and data
Achievement of research objectives and ready access to quality controlled data in phase II of CPWF
National agriculture and water management network
Better understanding of water management issues in the basin and access to relevant knowledge bases
Facilitate informed decision making for better water management
National agricultural research systems
Easy access to research outputs and networking
with other similar agencies
Improved awareness of water management problems and interventions in the basin.
19
Progress and future plan
Upto now WP6 was primarily focused to facilitate quality assured data to the project team and design the project web portal. In the coming year, the focus will be to collaborate with other project team and BFP central to publish project results and develop knowledge products generated by the project. Special studies in four sub basins are planned next year. Higher resolution data will be collected and processed for those studies. All these data will be standardized and uploaded in CPWF data portal (IDIS) to ensure future accessibility of data.
OUTPUTS:
Completed/ In-progress
i. Situation analysis for BFP-IGB completed and hosted on the Wiki. ii. Impact Pathways Analysis for the Project as a whole and for different basin
countries has been completed. iii. T. Shah, Mehmood Ul Hassan, M Z Khattak, P S Banerjee, O P Singh and S U
Rehman. 2008.: “Is irrigation water free? A Reality Check in the Indo-Gangetic Basin” World Development(2008): available at
doi:10.1016?j.worlddev.2008.05.008
iv. Ahmad, Mobin-Ud Din, Nilantha Gamage. 2008. Monitoring Agricultural Water Consumption and Irrigation Performance Using Freely Available Modis Images for a Large Irrigation System in Pakistan. Proceedings 2 International Forum on Water and Food, ( Volume-I), Addis Ababa, November 10-14, 2008, CPWF, Colombo. Pp123-126.
v. Khan, Abdul Hakeem; Peter McCornick; Asim Rauf Khan. 2008. Evolution of managing water for agriculture in the Indus River Basin. Proceedings 2 International Forum on Water and Food, (Volume-III), Addis Ababa, November 10-14, 2008, CPWF, Colombo. Pp120-123.
vi. Sharma, Bharat R., Devesh Sharma. 2008. Impact of climate change on water resources and glacier melt and potential adaptations for Indian agriculture. Proceedings 33rd IAUA VCs Annual Convention on “Climate Change and its Effect on Agriculture”, December 4-5, 2008; Anand Agricultural University, Anand, India pp. 86-101.
vii. Ahmad, M.H.; H.Turral; A.Nazeer. 2009. Diagnosing irrigation performance and water productivity through satellite remote sensing and secondary data in a large irrigation system of Pakistan. Agricultural Water Management. Available at: doi:10.1016/j.agwat.2008.09.017
Publications in progress
i. Poverty and water poverty analysis for the IG basin (Upali Amarasinghe et al.) ii. Water laws and their significance for improved management (Aditi Mukherji et al.) iii. Land leasing policies and impact of irrigation in Nepal ( Dhruba Pant et al.)
20
iv. Assessing availability of water resources and impact of land use changes in Ganga-sub basin in Bangladesh ( Luna Bharti et al)
v. Hydrology and water resources of Indus-Gangetic Basin ( Bharat Sharma et al) vi. Assessment of water productivity in the IG basin countries ( Cai Xueliang et al) Some proposed publications ( Incomplete)
i. State of Irrigation reports for some of the important regions/ states of IG basin ii. Optimisation of water resources allocation in the IG basin iii. Potential interventions for improving agricultural and water productivity in the IG
basin iv. An assessment of salinity and waterlogging in the IG basin, impact on productivity
and potential interventions for amelioration. v. Floods and flood damages in eastern plains and coastal regions of IG basin vi. Addressing institutional constraints and for productivity and livelihoods
improvement in the IG basin viii. Impact of watercourse lining on improved water availability and productivity in
Punjab Pakistan ix. Revitalising the irrigation institutions in IG basin x. …………..
9. PROBLEMS
Since basin Focal Project is of only two years duration, and initial few months are taken up for setting up the team and the Workplan and partners, the second year is very crucial for completing the project and delivering the outputs. For successful completion of the Project the following need special attention:
1. Special attention on the work packages which have made a relatively moderate progress and for which the clarity for deliverables is not very strong. In this case the work packages are:
• WP-2 (Water Availability Analysis- setting up the PodiumSim analysis, Formalising the partnerships with IRD/ SIWI for whole basin WEAP analysis ).
• WP-4 (Institutional Analysis, two or three good studies are in progress , but we need to undertake few comprehensive studies on what really affects the water institutions set up in the four countries of the basin and how these may be made more effective by doing an in depth analysis of few of the large institutions/ programs like CAD in India, OFWM in Pakistan.
• WP-5 (Intervention Analysis, Finalisation of the matrix and developing a good criterion for identifying the most potential interventions and undertake somewhat detailed analysis for a minimum of 5 such interventions).
2. Integration of the Work Packages: Presently, the work packages are working somewhat independently and commonality is through data sharing and common workshops. The Theme Leaders need to work more cohesively during the second year so that the conclusions/ recommendations reinforce each other and do not create confusion. The Project plans to organise a minimum of two meetings for the Project
21
partners during the year for a better shared understanding and visualise the whole and bigger picture of the basin.
3. Project Publications: Completing a research study and then publishing it in a good media is a long and tedious process. I am not very confident that most of the work which shall be completed during 2009 shall also be published during before the Project completion. It is proposed that some of the topical reports or synthesis papers shall be published as Project Publications during the year itself for better showcasing the results to the stakeholders. Additionally, there may be some pamphlets, flyers, policy briefs, status reports etc.
4. Impact Creation: Making a good impact and taking all the stakeholders on board when the results are just pouring in and size of the basin is enormous across four countries (and a somewhat hostile political situation) is a big challenge. Fortunately, IWMI’ has strong presence and established liaison in the region and shall make good use of it. But this aspect needs more attention and the team shall make special efforts on this front more towards the second half of the year.
5. Mainstreaming the New Knowledge: The project team is confident that during the implementation it shall construct new datasets, develop new methodologies, generate new knowledge and recommend new practices and policies. Real benefit of this shall accrue once this new knowledge in mainstreamed into the existing national and international platforms and forums. Besides the project web portal the team shall make some additional serious efforts during the year to see that this reaches and is accepted by those for which it is meant in the long run.
IMPLICATIONS FOR REMAINING WORK
In the broader sense, the project is progressing as per the agreed plan and there are no major departures in the work packages. However, during the year 2008 the Project witnessed a good iteration of the researchers and new replacements have been brought in. This can cause some variations in the methodology and approaches and the outputs. Specially, Pakistan component shall start afresh this year, but I am hopeful that the expected deliverables shall be available. Productivity analysis has been delegated to relatively younger researcher and shall require more supervision. On the flip side, the Project has now received a very good and matured backstopping from the Theme Leader which shall help in better linkages with other projects and quality improvement of the outputs. On the timelines, I am afraid that the Project may require about 3-months no cost extension to develop the final report and compile all the outputs from the work packages and a comprehensive document.
22
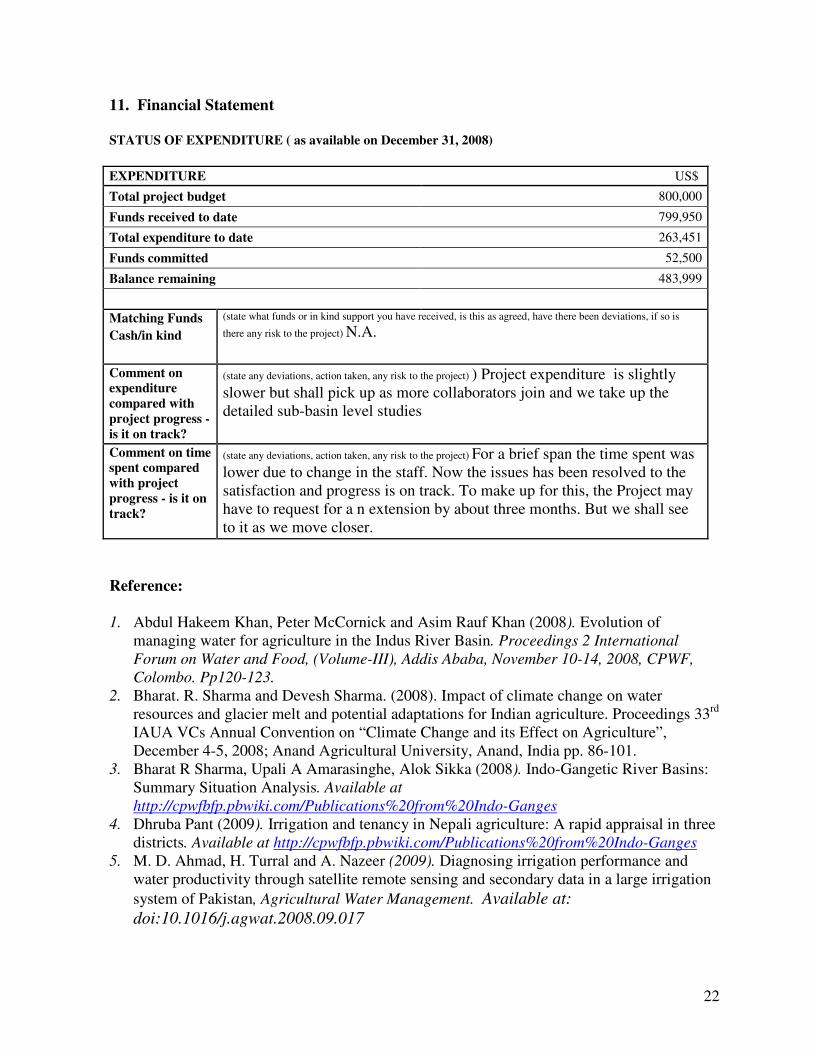
11. Financial Statement
STATUS OF EXPENDITURE ( as available on December 31, 2008)
EXPENDITURE US$
Total project budget 800,000
Funds received to date 799,950
Total expenditure to date 263,451
Funds committed 52,500
Balance remaining 483,999
Matching Funds
Cash/in kind
(state what funds or in kind support you have received, is this as agreed, have there been deviations, if so is
there any risk to the project) N.A.
Comment on
expenditure
compared with
project progress -
is it on track?
(state any deviations, action taken, any risk to the project) ) Project expenditure is slightly slower but shall pick up as more collaborators join and we take up the detailed sub-basin level studies
Comment on time
spent compared
with project
progress - is it on
track?
(state any deviations, action taken, any risk to the project) For a brief span the time spent was lower due to change in the staff. Now the issues has been resolved to the satisfaction and progress is on track. To make up for this, the Project may have to request for a n extension by about three months. But we shall see to it as we move closer.
Reference:
1. Abdul Hakeem Khan, Peter McCornick and Asim Rauf Khan (2008). Evolution of managing water for agriculture in the Indus River Basin. Proceedings 2 International
Forum on Water and Food, (Volume-III), Addis Ababa, November 10-14, 2008, CPWF,
Colombo. Pp120-123.
2. Bharat. R. Sharma and Devesh Sharma. (2008). Impact of climate change on water resources and glacier melt and potential adaptations for Indian agriculture. Proceedings 33rd IAUA VCs Annual Convention on “Climate Change and its Effect on Agriculture”, December 4-5, 2008; Anand Agricultural University, Anand, India pp. 86-101.
3. Bharat R Sharma, Upali A Amarasinghe, Alok Sikka (2008). Indo-Gangetic River Basins: Summary Situation Analysis. Available at
http://cpwfbfp.pbwiki.com/Publications%20from%20Indo-Ganges
4. Dhruba Pant (2009). Irrigation and tenancy in Nepali agriculture: A rapid appraisal in three districts. Available at http://cpwfbfp.pbwiki.com/Publications%20from%20Indo-Ganges
5. M. D. Ahmad, H. Turral and A. Nazeer (2009). Diagnosing irrigation performance and water productivity through satellite remote sensing and secondary data in a large irrigation
system of Pakistan, Agricultural Water Management. Available at:
doi:10.1016/j.agwat.2008.09.017
23
6. Mirza, M.Q. and N.J. Ericksen, 1996: Impact of water control projects on fisheries resources in Bangladesh. Enviornmental Management, 20(4), 527–539
7. Mobin-ud-Din Ahmad and Nilantha Gamage (2008). Monitoring agricultural water consumption and irrigation performance using freely available MODIS images for a large irrigation system in Pakistan. Proceedings 2 International Forum on Water and Food,
(Volume-I), Addis Ababa, November 10-14, 2008, CPWF, Colombo. Pp123-126
8. Mohammad Alauddin, Upali. A. Amarasinghe and Bharat. R. Sharma (2009). Are there any 'hot spots' and 'bright spots' of rice water productivity in Bangladesh? A spatio-temporal analysis of district level data Available at
http://cpwfbfp.pbwiki.com/Publications%20from%20Indo-Ganges
9. Tushaar Shah, T., & Verma, S. (2007). Co-management of groundwater and electricity: An assessment of Gujarat’s pioneering Jyotigram scheme. Economic and Political Weekly, 43(7), 59–66
10. Tushaar Shah, Mehmood Ul Hassan, M Z Khattak, P S Banerjee, O P Singh and S U Rehman. (2008).: “Is irrigation water free? A Reality Check in the Indo-Gangetic Basin” World Development(2008): available at doi:10.1016?j.worlddev.2008.05.008
11. Upali A. Amarasinghe, Tushaar Shah and Om Prakash Singh (2007). Changing Consumption Patterns: Implications on Food and Water Demand in India. IWMI Research
report No. 119.
12. Upali. A. Amarasinghe, Bharat R Sharma, Noel Aloysius, Christopher Scott, Vladimir Smakhtin, Charlotte de Fraiture, A.K. Sinha and A.K. Shukla (2005). Spatial Variation in Water Supply and Demand across River Basins of India. IWMI Research Report 83, 2005