autoridad del canal de panamÁ · ... lo motivó a escribir y publicar el “informe sobre la selva...
TRANSCRIPT

AUTORIDAD DEL CANAL DE PANAMÁ DEPARTAMENTO DE SEGURIDAD Y AMBIENTE
DIVISIÓN DE ADMINISTRACIÓN AMBIENTAL SECCIÓN DE MANEJO DE CUENCA
UNIDAD DE OPERACIONES
ANUARIO DE SEDIMENTOS SUSPENDIDOS 1998 - 2004
REPÚBLICA DE PANAMÁ
OCTUBRE 2005

Dedicatoria
Esta publicación es un homenaje, a Frank H. Robinson (QDEP), bajo cuya supervisión se inició el programa de sedimentos suspendidos en las principales subcuencas de los ríos que drenan a los embalses de Gatún y Alhajuela, en 1979. Su iniciativa y preocupación, por los aspectos ambientales, lo motivó a escribir y publicar el “Informe sobre la selva tropical del Canal de Panamá” en 1985. Deseamos dejar plasmado, como inspiración, el último párrafo del prefacio de su publicación. “Existen áreas de hábitat natural en las que todavía viven muchos tipos de especies en peligro de extinción tanto de animales como aves. Ahora es el momento de proteger y preservar esta riqueza natural. Cualquier demora sólo agravará los grandes problemas que causan la destrucción de la selva”
i

Prólogo Este anuario presenta la información sobre la caracterización de los sedimentos suspendidos de los principales ríos de la Cuenca Hidrográfica del Canal de Panamá (CHCP) como parte de las responsabilidades de la Autoridad de Canal de Panamá (ACP) sobre la gestión de datos hidrológicos que le confiere la Ley Orgánica. El conocimiento de la cantidad de sedimentos suspendidos, que son transportados por los principales ríos de la CHCP, permite planificar el uso adecuado de los suelos para el control de la erosión, conocer la calidad de agua para diferentes usos y la estabilidad de los cauces fluviales, y tener un mayor conocimiento sobre la vida útil de los embalses. Este anuario, producto del esfuerzo del personal de la Unidad de Operaciones, Sección de Manejo de Cuenca de la División de Administración Ambiental del Departamento de Seguridad y Ambiente, presenta la información de caudales de sedimentos en suspensión de las estaciones hidrométricas ubicadas en la CHCP; desde enero de 1998 hasta diciembre de 2004.
ii

Autoridad del Canal de Panamá Departamento de Seguridad y Ambiente División de Administración Ambiental
Sección de Manejo de Cuenca Unidad de Operaciones
Para información adicional sobre el Anuario de Sedimentos Suspendidos escribir al:
Supervisor de la Unidad de Operaciones
Sección de Manejo de Cuenca División de Administración Ambiental
Autoridad del Canal de Panamá Edificio 105 - Pedro Miguel
República de Panamá
Teléfono: (507) 276-7163 Fax: (507) 276-7136
Correo electrónico: [email protected]
iii

Índice
Página
Dedicatoria ................................................................................................................ i Prólogo....................................................................................................................... ii Índice ......................................................................................................................... iv Introducción .............................................................................................................. 1 Definición de términos .............................................................................................. 5 Símbolos y unidades ................................................................................................. 9 Estación Chico en el río Chagres .............................................................................. 11 Estación Candelaria en el río Pequení ...................................................................... 21 Estación Peluca en el río Boquerón .......................................................................... 31 Estación Ciento en el río Gatún ................................................................................ 41 Estación El Chorro en el río Trinidad ....................................................................... 51 Estación Los Cañones en el río Cirí Grande ............................................................. 61 Estación Caño Quebrado Abajo en el río Caño Quebrado ....................................... 71 Estación Boca de Uracillo en el río Indio .................................................................. 77 Estación Batatilla en el río Toabré ............................................................................ 81 Estación Canoa en el río Coclé del Norte .................................................................. 85 Red de estaciones hidrometeorológicas .................................................................... 89
iv
Autoridad del Canal de Panamá 1 Anuario de Sedimentos Suspendidos 1998-2004
Introducción
La ACP cuenta con un programa de monitoreo de los sedimentos suspendidos en diez estaciones hidrométricas ubicadas en los principales ríos de la CHCP con el objetivo de evaluar, de manera confiable, los volúmenes de sedimentos que los ríos transportan. La información contenida en este Anuario, en conjunto con las batimetrías, sirven de base para el cálculo y pronóstico de la capacidad de almacenamiento de agua de los embalses. Esta información, conocida con suficiente anticipación, permite ejecutar medidas de control de la pérdida de suelo en aquellas áreas que aportan mayor cantidad de sedimentos y, por lo tanto, garantizar el aprovechamiento óptimo de los embalses por un largo periodo. Adicionalmente, esta información sirve de referencia para futuros estudios hidrológicos relacionados con el diseño de obras hidráulicas dentro o fuera de la CHCP. La toma de muestras de los sedimentos suspendidos se realiza en los mismos sitios donde se realizan los aforos (mediciones de caudal líquido). Para su procesamiento se siguen tres aspectos fundamentales: la obtención de muestras representativas en campo, determinación de su concentración en el laboratorio, y el cálculo de la tasa diaria, mensual y anual de los sedimentos suspendidos mediante el establecimiento de curvas de descarga de sedimentos (relación caudal sólido versus caudal líquido). Las muestras representativas se obtienen por medio de muestreadores integradores de profundidad US DH-48, US DH-59, y US D-74. Estos están diseñados para tomar muestras a una velocidad similar a la de la corriente, y se toman en cuatro verticales de igual descarga a lo largo de la sección transversal. Durante las crecidas, el programa se apoya en observadores particulares que toman muestras, en una sola vertical de la sección transversal previamente establecida, por lo general, cerca del banco del río. Las mismas son correlacionadas con las muestras representativas de la sección. En este documento se presenta la información de sedimentos en suspensión de diez estaciones hidrométricas, recolectados y procesados desde enero de 1998 hasta diciembre de 2004, en el Sistema Internacional (SI) de medidas. Siete de ellas están ubicadas en la Región Oriental y las otras tres, en la Región Occidental de la CHCP. Se incluyen, en esta publicación, tablas con los resúmenes de promedios diarios de concentraciones de sedimentos en suspensión en miligramos por litro y el caudal de sedimentos en suspensión en toneladas por día. Además, se presentan mapas de los principales ríos y tributarios, en donde se muestra la ubicación de las estaciones hidrometeorológicas existentes en cada subcuenca. Al final del documento se presenta el listado actualizado de las estaciones hidrológicas y meteorológicas con su respectiva ubicación, elevación, tipo de datos observados y fecha desde la cual se dispone de registro.

2 Autoridad del Canal de Panamá Anuario de Sedimentos Suspendidos 1998-2004

Autoridad del Canal de Panamá 3 Anuario de Sedimentos Suspendidos 1998-2004

4 Autoridad del Canal de Panamá Anuario de Sedimentos Suspendidos 1998-2004

Autoridad del Canal de Panamá 5 Anuario de Sedimentos Suspendidos 1998-2004
Definición de términos (Sistema Inglés e Internacional de Unidades)
Aforo (de caudales): medición del caudal de un río o corriente. Área de drenaje: superficie/territorio que tiene una salida única para su escurrimiento superficial. Caudal: volumen de agua que pasa a través de una sección transversal de un río por unidad de tiempo. Caudal de sedimentos suspendidos o caudal sólido en suspensión (t/d, t/mes, t/año): cantidad de sedimentos suspendidos, medidos por peso seco o volumen, que pasa en una sección del río en un intervalo de tiempo dado. Expresado en toneladas por día, mes o año. Caudal máximo instantáneo: valor máximo de caudal registrado instantáneamente en un período determinado. Caudal mínimo diario: caudal promedio diario más bajo registrado en un mes, un año o todo el registro histórico. Caudal promedio diario: caudal promedio diario que pasa a través de una sección transversal del río durante el día dividido por el número de segundos del día. Código de la estación: número regional de las estaciones hidrológicas establecido a través del Proyecto Hidrológico Centroamericano (PHCA) de las Naciones Unidas (1968-1972). Concentración de sedimentos suspendidos (mg/l): relación entre el peso de los materiales sólidos secos y el peso de una muestra de agua y sedimentos. Cuenca hidrográfica: superficie de la tierra en la que confluyen los distintos ríos y corrientes de agua en un río principal y que está limitada por un parteaguas o divisoria que coincide generalmente con la línea más alta de las montañas. Cuenca Hidrográfica del Canal de Panamá (CHCP): área geográfica definida por la Ley 44 del 31 de agosto de 1999. Curva de descarga de sedimentos suspendidos: curva que relaciona los caudales sólidos y líquidos: Qs = f(Q). Elevación: distancia vertical entre un nivel, punto u objeto y una referencia especificada. Escorrentía: lámina de agua distribuida uniformemente en el área de una cuenca o volumen de agua que pasa por una sección de un río o corriente durante un período de tiempo. Estación fluviográfica: estación para la determinación de caudales por medio del registro continuo de los niveles de agua de un río en forma digital y gráfica.

6 Autoridad del Canal de Panamá Anuario de Sedimentos Suspendidos 1998-2004
Estación hidrométrica: estación en la cual se obtienen datos del agua, en los ríos, lagos o embalses, de uno o varios de los elementos siguientes: niveles, flujos de las corrientes, transporte y depósito de sedimentos, temperatura del agua y otras propiedades físicas y químicas del agua. Estación limnigráfica: estación que registra continuamente los niveles de agua de un lago o embalse en forma digital y gráfica. Estación mareográfica: estación que registra continuamente los niveles de agua en el mar en forma digital y gráfica. Estación meteorológica: estación en la que se efectúan observaciones meteorológicas con la aprobación de los miembros interesados de la Organización Meteorológica Mundial (OMM). Estación meteorológica principal (Tipo A): estación que registra lluvia (cantidad, duración e intensidad), temperatura del aire, humedad relativa, presión atmosférica, vientos (velocidad y dirección), radiación solar, evaporación y temperatura del suelo. Estación meteorológica secundaria (Tipo B): estación que registra lluvia (cantidad, duración e intensidad), temperaturas extremas, humedad relativa. Estación pluviográfica: estación en la que sólo se realizan observaciones continuas acerca de las precipitaciones pluviales. Hidrograma: gráfica que muestra la variación del nivel, caudal, velocidad o de otras características de las corrientes de agua, con respecto al tiempo. Localización: posición de la estación principal con respecto a los poblados y rasgos físicos en la vecindad incluyendo la latitud y longitud. Nivel del agua: distancia de la superficie del agua de una corriente, lago o embalse con relación a un nivel de referencia determinado. Producción anual de sedimentos suspendidos (t/año/km2): caudal sólido anual de sedimentos por unidad de superficie. Red de estaciones hidrometeorológicas: conjunto de estaciones hidrológicas, meteorológicas y de puntos de observación situada en determinada zona (cuenca o región administrativa) que permite estudiar el régimen hidrológico y meteorológico, en el espacio y en el tiempo. Región Occidental (ROCC): territorio ubicado al oeste de la cuenca del río Cirí Grande, que comprende las cuencas de los ríos Indio, Caño Sucio y Coclé del Norte. Región Oriental (ROR): territorio de la Cuenca Hidrográfica del Canal de Panamá que comprende las cuencas de los ríos cuyas aguas fluyen hacia los lagos Miraflores, Alhajuela y Gatún. Rendimiento líquido o caudal específico (l/s/km2): caudal líquido de una cuenca por unidad de superficie, expresado en litros por segundo por kilómetros cuadrados.

Autoridad del Canal de Panamá 7 Anuario de Sedimentos Suspendidos 1998-2004
Sedimento: material transportado por el agua desde su lugar de origen al de depósito. En los cursos de agua, son los materiales aluviales llevados en suspensión o como arrastre de fondo.

8 Autoridad del Canal de Panamá Anuario de Sedimentos Suspendidos 1998-2004

Autoridad del Canal de Panamá 9 Anuario de Sedimentos Suspendidos 1998-2004
Símbolos y Unidades
Unidades Elemento Símbolo SI Inglés
Área de una sección Área de la cuenca A m2
km2
pie2
acre mi2
Caudal Q m3/s pie3/s Caudal de sedimentos Qs t/d Caudal de sedimentos suspendidos por unidad de superficie (producción anual de sedimentos)
qs t/año/km2
Caudal por unidad de superficie (rendimiento o caudal específico) q l/s/km2 pie3/s/mi2
Concentración de sedimentos cs mg/l Escorrentía R mm pulgada Volumen V MMC acre pie
Unidades Utilizadas
Unidad / Sistema / Símbolo
Internacional Símbolo Inglés Símbolo kilómetro km milla mi litro l pulgada plg metro m pie pie milímetro mm acre acre segundo s porcentaje %
Lista de Abreviaturas
Nombre Abreviatura
Autoridad del Canal de Panamá ACP Organización Meteorológica Mundial OMM Proyecto Hidrológico Centroamericano PHCA Millones de metros cúbicos MMC Sistema Internacional SI

10 Autoridad del Canal de Panamá Anuario de Sedimentos Suspendidos 1998-2004

Autoridad del Canal de Panamá 11 Anuario de Sedimentos Suspendidos 1998-2004

12 Autoridad del Canal de Panamá Anuario de Sedimentos Suspendidos 1998-2004

Estación Chico en el río Chagres
LOCALIZACIÓN: La estación está a 2 km (1.2 mi) aguas arriba de la comunidad Emberá 260, en la provincia de Panamá, distrito de Panamá. Sus coordenadas geográficas son: 9° 15’ 49” de latitud Norte y a 79° 30’ 35” de longitud Oeste. CÓDIGO DE LA ESTACIÓN: 115-01-02 ÁREA DE DRENAJE: 414 km2 (160 mi2) PERIODO DE REGISTRO: Desde enero de 1981 hasta la fecha. VALORES EXTREMOS Y PROMEDIOS
Concentración (mg/l)
Año
Máxima Instantánea
Mínima Diaria
PromedioAnual
Rendimiento
líquido (l/s/km2)
Producción
anual de sedimentos (t/año/km2)
1998 2758.9 0.8 108.1 64.0 219 1999 3801.0 2.1 109.0 104.0 357 2000 5838.6 1.8 259.7 88.0 718 2001 2758.9 1.3 48.3 59.6 91 2002 2974.2 1.7 105.1 71.3 236 2003 1037.5 0.9 31.5 64.6 64 2004 6162.8 1.3 280.7 90.7 805
Autoridad del Canal de Panamá 13 Anuario de Sedimentos Suspendidos 1998-2004

Año: 1998 414 km²
mg/l t/d mg/l t/d mg/l t/d mg/l t/d mg/l t/d mg/l t/d1 2.4 2.79 1.7 1.43 1.2 0.576 0.9 0.350 2.1 2.05 4.1 8.742 2.0 1.92 1.7 1.43 1.1 0.528 0.9 0.331 1.8 1.57 6.4 15.83 2.0 2.00 1.7 1.43 1.0 0.453 0.9 0.323 2.0 1.79 4.5 10.34 1.9 1.78 1.8 1.46 1.0 0.411 0.9 0.318 2.4 2.77 3.6 7.145 1.8 1.55 1.9 1.67 1.0 0.447 0.9 0.307 1.9 1.66 3.3 5.996 1.8 1.43 1.8 1.45 1.1 0.520 0.9 0.293 2.0 2.02 8.9 23.47 1.7 1.31 1.8 1.45 1.1 0.508 0.8 0.279 2.2 2.30 5.1 11.98 1.6 1.20 2.1 2.14 1.1 0.498 0.8 0.273 3.0 4.72 3.2 5.539 1.8 1.50 2.1 2.19 1.1 0.454 0.9 0.315 2.4 2.78 3.1 5.09
10 1.9 1.73 1.8 1.47 1.0 0.379 0.9 0.304 2.0 1.93 3.5 6.2211 1.8 1.48 1.7 1.34 1.0 0.391 0.9 0.287 1.8 1.52 3.3 6.0812 1.8 1.57 1.7 1.34 1.0 0.375 0.9 0.299 1.9 1.70 8.5 17.513 1.8 1.54 1.7 1.41 0.9 0.356 0.8 0.269 1.8 1.52 6.0 13.714 1.8 1.49 1.7 1.42 1.0 0.364 0.8 0.250 1.8 1.44 3.1 5.2415 1.8 1.54 1.9 1.63 0.9 0.352 0.8 0.254 1.8 1.48 40.3 15216 1.9 1.70 1.8 1.49 0.9 0.354 0.8 0.282 147.9 454 4.5 9.7417 1.8 1.55 1.7 1.39 1.0 0.387 1.0 0.381 1417.1 51055 3.1 5.1718 1.8 1.61 1.7 1.33 0.9 0.346 0.9 0.291 27.7 156 2.9 4.5319 2.3 2.40 1.7 1.26 0.9 0.336 0.8 0.257 8.1 26.0 3.7 7.2120 2.4 2.83 1.6 1.20 0.9 0.325 0.8 0.241 5.2 13.2 3.3 5.9721 1.9 1.81 1.6 1.13 0.9 0.313 0.8 0.239 4.0 8.70 12.9 32.722 1.9 1.80 1.5 1.07 0.9 0.305 1.3 0.735 3.7 7.73 9.1 26.523 1.9 1.78 1.5 1.01 0.9 0.297 2.8 2.16 6.4 14.5 3.7 7.3624 1.9 1.76 1.5 0.953 1.0 0.363 27.2 82.0 22.4 84.3 3.4 6.2125 1.9 1.71 1.4 0.886 3.0 3.04 788.8 11177 610.6 6594 3.2 5.3726 1.9 1.69 1.3 0.791 2.1 1.88 20.8 80.8 27.1 134.3 2.9 4.5427 1.8 1.59 1.3 0.724 1.2 0.573 4.0 7.61 6.0 16.2 3.0 4.7928 1.8 1.52 1.2 0.645 1.2 0.590 6.9 14.3 4.4 10.3 3.2 5.4129 1.8 1.50 1.1 0.466 3.1 5.03 4.8 11.5 3.0 4.9130 1.8 1.49 1.0 0.404 2.3 2.59 4.5 10.4 2.7 3.9531 1.8 1.45 1.0 0.376 5.1 11.9
Total 53.0 37.1 17.0 11379 58639 429
mg/l t/d mg/l t/d mg/l t/d mg/l t/d mg/l t/d mg/l t/d1 2.6 3.58 3.5 6.82 3.7 7.52 5.8 15.6 41.6 154 5.1 12.82 2.6 3.59 23.6 86.8 3.5 6.80 6.6 18.9 8.4 23.9 5.2 12.93 2.6 3.40 59.7 253 6.0 15.2 5.2 13.1 10.5 35.7 8.7 25.54 83.3 424 8.9 27.9 4.8 11.0 4.2 9.68 4.9 11.7 9.3 29.75 77.5 405 30.7 147 3.6 7.01 6.4 17.1 4.4 9.76 9.7 31.96 17.7 69.7 14.9 56.4 3.3 6.06 5.5 14.1 15.1 49.3 23.3 1087 3.7 7.63 7.0 20.4 13.5 33.5 8.7 27.0 23.5 101 11.8 45.68 3.7 6.99 4.3 9.93 10.8 34.5 10.4 34.5 8.4 27.3 8.4 27.59 5.9 13.7 3.6 7.34 4.6 10.5 11.8 42.8 7.4 22.2 6.8 19.9
10 36.2 118 3.5 6.94 5.3 11.7 11.0 36.7 30.0 156 9.1 29.011 8.8 28.7 18.1 47.4 4.0 8.66 12.2 45.2 30.4 147 29.6 16412 4.0 8.71 7.8 20.4 9.0 25.2 23.9 113 13.6 56.2 9.6 33.213 3.3 6.02 5.9 15.1 6.8 18.3 11.4 41.1 7.9 25.2 32.8 18214 3.3 5.81 3.8 7.88 4.4 9.78 10.1 34.9 6.8 19.8 10.2 37.115 2.9 4.57 3.4 6.48 3.3 5.98 6.2 17.4 5.5 14.5 17.3 74.616 4.4 8.32 4.3 9.14 3.1 5.35 10.6 35.8 4.4 10.3 20.0 99.217 3.1 5.01 3.9 8.26 4.0 7.63 12.0 41.4 5.0 12.1 44.9 24218 3.1 5.15 6.2 14.2 28.8 104 9.3 31.5 16.8 61.1 16.0 73.419 18.8 63.8 109.5 565 6.1 15.2 5.5 14.5 10.5 36.7 11.0 41.620 35.4 173 11.0 38.9 8.9 23.5 5.3 13.4 7.3 22.0 185.4 103321 6.3 17.6 10.1 32.4 37.5 170 4.8 11.5 7.2 21.5 556.8 1003822 4.1 9.22 19.5 78.0 15.1 63.7 6.7 19.0 48.1 238 32.1 213.123 40.9 151 7.8 24.0 18.1 68.6 7.2 21.2 12.3 47.7 23.0 129.524 8.5 26.0 6.7 18.4 8.5 25.9 5.3 13.6 6.6 19.0 16.4 77.225 5.4 13.9 4.4 10.2 8.5 23.6 4.0 8.95 6.4 18.1 13.2 55.626 3.7 7.68 5.3 12.4 12.7 45.4 3.7 7.50 5.0 12.4 11.0 42.127 19.7 54.1 3.7 7.48 74.1 378 3.5 6.77 4.2 9.68 9.5 33.628 5.7 14.0 9.4 24.3 14.5 59.6 3.4 6.45 5.3 13.1 9.8 34.829 3.4 6.22 10.7 31.8 17.1 72.2 3.3 6.04 5.9 15.4 22.5 10930 3.2 5.54 4.9 11.9 9.8 33.4 3.2 5.71 6.6 18.0 12.7 51.431 17.9 54.1 4.5 10.1 3.3 6.06 9.5 33.6
Total 1724 1616 1307 731 1408 13142
0.8 Promedio Anual: 108.11417.1 Máxima Instantánea 2758.9
219 t/año/km²90483 t/año Producción Anual
JUNIO
ESTACION CHICO EN EL RIO CHAGRESConcentraciones de Sedimentos Suspendidos (mg/l) y Caudales Sólidos Promedios Diarios (t/d)
Área de Drenaje:LATITUD 9º 15' 49'' N LONGITUD 79º 30' 35'' O
DIA
Mínimo Diario: Máximo Diario:
DIA JULIO AGOSTO
Total Anual:
FEBRERO MARZO ENERO
Concentración de Sedimentos Suspendidos (mg/l)
SEPTIEMBRE OCTUBRE NOVIEMBRE DICIEMBRE
ABRIL MAYO
14 Autoridad del Canal de Panamá Anuario de Sedimentos Suspendidos 1998-2004

Año: 1999 414 km²
mg/l t/d mg/l t/d mg/l t/d mg/l t/d mg/l t/d mg/l t/d1 14.1 57.8 3.1 5.06 2.6 3.60 3.0 4.82 18.8 95.0 4.2 7.902 15.8 70.0 3.1 5.35 2.5 3.29 2.9 4.36 15.4 70.4 3.6 6.853 12.0 47.5 3.0 4.91 2.5 3.09 2.8 4.23 8.6 28.6 3.4 6.224 10.3 37.5 2.9 4.45 2.5 3.21 2.8 4.06 5.8 15.6 3.0 4.825 8.9 30.0 3.2 5.38 2.8 3.95 3.5 6.75 4.7 11.3 6.6 14.36 8.2 26.7 2.9 4.56 3.8 7.72 2.8 4.20 4.7 11.5 506.8 45517 9.9 35.6 2.8 4.16 2.9 4.40 2.7 3.88 4.0 8.77 14.6 56.28 7.8 24.6 2.7 3.95 3.0 4.93 3.2 5.44 4.7 11.3 4.8 11.79 6.9 20.6 2.7 3.87 2.7 3.91 2.9 4.61 115.6 1548 4.1 9.04
10 6.1 17.1 2.7 3.88 2.5 3.06 4.4 10.3 15.5 71.2 3.5 6.9111 5.7 15.1 2.7 3.72 2.3 2.76 5.0 12.3 9.5 33.4 3.5 6.7812 5.3 13.8 2.8 4.03 2.3 2.75 3.7 7.92 5.5 14.6 4.1 8.6613 4.9 12.0 2.7 3.91 2.4 2.92 3.3 5.94 7.2 19.6 7.4 19.614 4.5 10.6 2.8 4.07 2.3 2.63 5.3 13.7 5.7 15.2 16.7 59.115 4.2 9.71 2.9 4.55 4.7 6.80 6.0 16.7 3.9 8.50 7.4 21.316 4.0 8.84 3.0 4.78 3.8 7.29 3.8 8.20 14.2 43.3 6.1 16.017 3.8 8.21 71.6 405 4.6 9.56 3.4 6.31 13.3 46.0 5.2 13.018 3.7 7.72 33.0 190 2.9 4.40 3.2 5.54 5.2 12.9 9.5 27.919 3.6 7.48 11.5 39.4 2.5 3.12 3.1 5.01 3.9 8.23 5.2 12.920 3.6 7.25 16.9 64.2 2.4 2.84 3.0 4.70 3.9 8.41 12.9 36.521 3.5 6.82 3.9 8.29 2.3 2.64 2.9 4.63 3.5 6.69 14.8 50.322 3.5 6.61 3.4 6.40 2.2 2.47 3.1 5.29 3.3 5.87 279.9 287723 3.4 6.40 5.1 11.6 2.2 2.28 3.1 5.09 6.2 14.1 25.7 13724 5.0 12.1 3.2 5.70 2.1 2.16 20.9 113 3.7 7.22 10.7 39.525 3.6 7.36 3.4 6.29 2.1 2.07 16.4 77.6 3.2 5.54 7.5 23.126 3.4 6.52 3.0 4.63 2.1 2.08 83.4 937 3.0 4.89 34.1 13727 3.3 5.96 2.8 4.02 2.8 3.97 23.5 135 3.0 4.86 30.4 16628 3.8 7.78 2.8 4.16 3.5 6.90 11.7 45.9 2.8 4.29 11.9 45.629 3.4 6.58 7.6 23.5 7.8 24.8 2.9 4.28 7.3 22.530 3.2 5.74 3.5 6.78 14.9 66.6 4.1 8.70 41.7 18731 3.1 5.33 3.2 5.47 3.5 6.38
Total 545 820 147 1553 2154 8579
mg/l t/d mg/l t/d mg/l t/d mg/l t/d mg/l t/d mg/l t/d1 8.4 27.1 10.3 36.8 18.8 88.4 6.4 18.0 6.8 19.7 117.8 14152 6.0 16.3 8.1 26.2 10.4 38.2 5.6 14.6 5.3 13.6 245.9 36933 7.3 20.7 8.1 25.7 30.0 147 5.4 14.0 31.5 132 64.4 5774 5.9 15.9 12.1 42.6 13.3 54.7 13.8 50.9 9.2 30.4 73.6 6145 5.0 12.5 10.0 35.1 9.3 32.4 5.3 13.5 7.1 21.2 40.9 2986 4.5 10.7 6.7 19.6 8.0 25.7 22.7 90.9 38.6 224 17.0 80.97 3.9 8.58 7.5 22.3 7.6 23.9 25.7 116 213.0 1926 1712.4 638218 3.7 7.73 6.6 19.1 15.8 63.9 10.4 36.9 40.1 270 108.5 13349 21.0 69.9 5.7 15.1 14.4 57.7 7.6 22.8 13.7 58.0 49.4 418
10 20.4 76.5 8.2 25.7 8.9 30.0 9.9 34.7 20.4 87.8 37.3 27211 4.0 9.00 214.7 1597 7.0 20.8 6.3 17.6 121.4 1158 77.6 75012 4.8 11.3 25.5 142 21.5 94.5 5.0 12.4 45.4 320 35.9 25613 4.0 8.73 78.2 534 18.4 83.3 4.3 9.91 48.6 333 260.1 351514 3.6 7.32 23.9 134 9.3 32.2 4.0 8.70 19.9 102 230.5 361015 3.5 6.71 14.8 64.9 7.2 21.7 8.6 24.4 13.1 54.9 149.1 216116 6.8 16.2 10.3 37.7 6.4 18.3 5.4 13.6 14.5 63.5 788.6 1755417 5.1 12.1 8.1 26.0 6.7 19.5 3.8 8.20 12.2 48.8 102.1 127118 3.5 6.88 7.0 21.0 8.9 29.4 3.7 7.77 10.3 38.0 124.8 152319 5.7 13.5 6.4 18.4 7.2 21.8 3.6 7.17 8.3 27.1 60.9 57620 4.5 10.1 6.9 19.6 5.9 16.1 12.6 37.8 7.6 23.8 55.6 50321 40.9 195 18.3 61.9 6.3 17.3 28.3 116 7.0 20.7 47.9 39922 40.2 206 34.6 206 5.1 12.7 8.1 25.4 9.0 28.6 42.7 33523 562.1 9092 30.2 159 4.6 10.8 5.1 12.7 12.4 49.5 33.3 22924 23.0 127 13.6 55.0 8.3 20.4 16.8 58.4 9.8 34.6 28.8 18325 12.6 51.0 70.4 421 108.6 734 83.9 535 8.6 28.5 25.9 15626 11.5 44.0 321.1 3004 37.4 204 48.8 295 7.4 22.6 24.2 14027 62.4 499 25.2 144 18.5 87.0 15.0 64.5 6.0 16.5 20.8 11128 16.4 75.9 16.3 75.7 12.0 46.4 12.6 50.7 5.5 14.6 20.9 11229 14.5 61.6 13.4 56.5 7.5 23.0 8.0 25.5 11.0 39.6 21.6 11730 9.5 33.2 10.2 37.4 7.4 22.8 6.6 19.0 8.3 26.2 47.9 37031 12.5 50.5 45.1 230 12.0 39.9 31.8 204
Total 10803 7313 2098 1802 5234 106597
2.1 Promedio Anual: 109.01712.4 Máxima Instantánea 3801.1
JUNIO
Mínimo Diario: Máximo Diario:
DIA JULIO AGOSTO
Concentración de Sedimentos Suspendidos (mg/l)
SEPTIEMBRE OCTUBRE NOVIEMBRE DICIEMBRE
ESTACION CHICO EN EL RIO CHAGRES
Área de Drenaje:
Concentraciones de Sedimentos Suspendidos (mg/l) y Caudales Sólidos Promedios Diarios (t/d)LATITUD 9º 15' 49'' N LONGITUD 79º 30' 35'' O
357 t/año/km²147646 t/año Producción Anual
DIA FEBRERO
Total Anual:
MARZO ABRIL ENERO MAYO
Autoridad del Canal de Panamá 15 Anuario de Sedimentos Suspendidos 1998-2004

Año: 2000 414 km²
mg/l t/d mg/l t/d mg/l t/d mg/l t/d mg/l t/d mg/l t/d1 28.5 179 3.6 7.17 2.4 2.86 2.2 2.32 2.0 1.83 7.8 24.82 25.8 154 5.1 12.3 2.4 2.94 1.9 1.78 1.9 1.71 5.6 15.03 19.2 98.3 3.5 6.83 3.5 6.52 1.9 1.81 1.9 1.66 3.8 8.084 24.6 133 9.2 23.8 2.8 4.06 2.0 2.05 1.9 1.76 3.5 6.795 17.6 85.3 5.2 12.6 2.7 3.64 1.9 1.79 4.3 10.1 6.0 16.56 13.7 58.5 3.8 7.87 3.1 5.07 1.8 1.57 14.6 64.6 19.7 86.67 13.0 54.1 3.5 6.94 3.1 4.91 2.5 3.06 4.5 10.8 17.7 69.98 50.1 364 3.9 8.03 3.7 7.47 3.1 5.28 3.7 7.82 44.3 2179 31.8 210 3.6 7.01 3.1 5.06 2.3 2.68 4.9 12.2 18.4 81.9
10 21.8 118 3.3 6.02 2.6 3.61 2.1 2.19 3.7 7.58 12.6 48.811 15.5 70.9 3.2 5.69 2.5 3.15 2.0 1.87 3.7 7.64 7.8 23.012 13.8 59.4 3.2 5.47 2.4 2.93 1.9 1.72 3.0 4.95 4.2 9.4613 16.2 75.6 3.1 5.09 2.9 3.98 2.0 2.02 27.7 173 3.9 8.3114 11.6 45.3 3.0 4.82 2.6 3.40 1.9 1.80 8.8 29.7 7.8 19.415 14.5 63.1 2.9 4.58 2.3 2.69 1.8 1.62 3.7 7.84 40.1 22716 12.2 48.9 2.9 4.44 2.3 2.58 1.8 1.58 3.6 7.14 10.3 35.817 10.7 40.1 3.2 5.31 2.2 2.46 2.1 2.07 4.3 9.83 7.6 22.218 9.0 30.7 3.1 5.05 2.2 2.35 2.1 2.19 3.3 5.88 23.4 10819 7.9 25.3 2.8 4.09 2.2 2.28 2.9 4.55 22.8 128 9.2 30.420 6.7 19.4 2.7 3.87 2.2 2.39 2.4 2.90 7.0 21.0 4.9 12.121 6.4 18.3 2.7 3.94 2.2 2.30 2.8 4.27 4.1 9.15 7.3 21.222 7.8 24.5 2.9 4.49 2.1 2.22 2.9 4.39 8.1 26.4 405.3 385123 6.4 18.4 2.7 3.65 2.1 2.13 2.8 4.01 13.6 58.3 39.3 25924 5.7 15.1 2.6 3.61 2.1 2.06 2.9 4.39 18.6 93.4 23.9 12425 5.0 12.5 2.8 4.02 2.0 1.98 2.5 3.15 6.3 17.8 15.0 65.626 4.6 10.8 2.7 3.85 2.0 1.92 2.4 3.00 8.8 29.9 9.2 31.627 4.2 9.52 2.7 3.77 2.0 1.85 2.2 2.40 13.2 55.4 7.1 21.428 4.0 8.98 2.5 3.26 1.9 1.79 2.1 2.15 6.2 17.5 5.8 15.629 3.8 8.30 2.4 3.00 1.9 1.71 2.0 2.01 4.5 10.5 5.0 12.530 3.7 7.83 1.9 1.66 2.0 1.92 4.0 8.98 4.4 10.331 3.6 7.43 2.0 1.91 10.2 37.0
Total 2073 181 95.9 78.5 879 5483
mg/l t/d mg/l t/d mg/l t/d mg/l t/d mg/l t/d mg/l t/d1 4.2 9.45 3.0 4.94 7.3 22.2 4.1 9.19 10.4 37.0 9.4 30.32 4.1 9.21 8.6 21.3 15.6 55.2 3.6 7.30 52.8 269 8.5 25.73 86.0 416 274.7 2009 26.6 123 15.9 48.2 14.4 60.3 7.3 21.34 4.9 12.0 61.4 403 12.1 46.0 18.4 67.2 8.5 27.8 5.0 11.85 9.5 29.5 7.8 24.4 6.3 17.9 9.3 28.9 7.8 24.2 5.5 14.06 7.7 22.9 13.4 56.5 10.5 35.2 4.1 9.27 6.8 19.9 4.3 10.07 11.5 38.6 7.0 20.9 9.0 29.3 161.8 839 5.3 13.6 3.7 7.528 5.7 15.0 5.7 15.5 15.2 54.8 1057.7 21645 4.9 12.0 3.4 6.369 3.9 8.59 5.4 14.2 11.6 41.1 33.2 215 4.4 10.3 3.3 6.15
10 3.6 7.07 5.2 13.4 6.8 20.0 16.1 73.0 4.3 9.80 3.6 6.9611 3.4 6.30 5.2 13.4 286.8 2283 9.3 32.5 4.0 8.75 3.7 7.2712 3.2 5.62 5.2 13.4 16.3 72.3 7.4 23.0 3.7 7.89 604.1 1030313 3.2 5.42 5.2 13.4 42.6 225 81.4 440 3.7 7.61 20.3 96.614 3.1 5.31 5.2 13.4 12.5 49.9 15.1 66.3 3.6 7.17 8.1 26.215 7.4 18.9 5.2 13.4 7.9 25.0 22.5 103 5.1 11.8 9.4 32.516 3.4 6.28 5.2 13.4 6.4 18.0 13.0 52.6 7.3 21.2 6.2 17.417 3.2 5.52 7.6 23.4 17.4 59.2 8.5 28.0 8.5 26.0 5.4 13.918 15.3 54.9 7.9 25.0 18.3 70.0 13.6 52.7 30.7 172 5.1 12.719 3.4 6.45 6.5 18.3 10.5 33.7 9.1 31.1 6.8 19.7 4.6 11.120 3.2 5.47 5.1 12.9 8.8 29.2 14.4 56.4 5.1 12.8 4.3 9.8521 5.9 13.8 5.0 12.4 5.9 16.1 72.6 437 3.9 8.47 4.2 9.4522 4.0 8.19 4.3 9.86 4.6 11.1 20.7 106 3.9 8.55 3.8 8.2323 3.2 5.45 4.1 9.11 4.1 9.21 11.1 42.3 3.7 7.53 3.7 7.6924 3.0 4.98 16.5 59.9 6.0 15.9 15.9 69.9 3.4 6.56 3.9 8.3225 2.9 4.61 5.0 12.2 7.7 23.4 10.3 37.7 3.3 6.11 3.6 7.2526 23.0 73.1 3.8 8.29 4.1 9.33 8.0 25.9 3.3 5.77 8.4 21.227 9.3 27.9 4.1 9.00 4.3 9.77 6.8 20.0 3.2 5.49 9.4 27.728 6.4 16.8 19.6 66.5 5.4 12.8 6.7 19.5 3.3 6.04 2082.7 7896929 3.8 7.87 22.7 85.2 15.3 49.4 11.0 37.2 7.7 17.6 242.3 356230 3.3 6.02 10.9 36.9 7.4 20.9 10.2 35.9 39.2 173 869.6 2816631 3.1 5.31 9.4 30.8 19.9 83.0 2362.4 133608
Total 863 3084 3488 24741 1024 255065
1.8 Promedio Anual: 259.72362.4 Máxima Instantánea 5838.6
MARZO
ESTACION CHICO EN EL RIO CHAGRES
Área de Drenaje:
Concentraciones de Sedimentos Suspendidos (mg/l) y Caudales Sólidos Promedios Diarios (t/d)LATITUD 9º 15' 49'' N LONGITUD 79º 30' 35'' O
Máximo Diario:
DIA FEBRERO
JULIO AGOSTO
Concentración de Sedimentos Suspendidos (mg/l)
OCTUBRE NOVIEMBRE DICIEMBREDIA
ABRIL ENERO MAYO
Mínimo Diario:
Total Anual: 718 t/año/km²297055 t/año Producción Anual
SEPTIEMBRE
JUNIO
16 Autoridad del Canal de Panamá Anuario de Sedimentos Suspendidos 1998-2004

Año: 2001 414 km²
mg/l t/d mg/l t/d mg/l t/d mg/l t/d mg/l t/d mg/l t/d1 188.4 3007 2.9 4.38 1.8 1.55 1.5 1.01 2.2 2.30 1.8 1.512 60.3 564 2.8 4.24 1.8 1.52 1.4 0.819 2.0 1.98 3.4 4.213 35.9 256 2.7 3.91 1.7 1.42 1.3 0.757 1.9 1.75 3.3 4.834 25.2 149 2.7 3.67 1.7 1.37 1.3 0.732 1.8 1.60 17.2 33.25 19.5 101 2.6 3.49 1.7 1.34 1.3 0.713 1.8 1.47 8.6 21.66 15.9 73.5 2.5 3.32 2.0 1.85 1.3 0.702 1.7 1.43 2.5 3.197 13.4 56.3 2.5 3.27 1.8 1.62 1.4 0.859 1.7 1.33 2.0 1.948 11.5 44.8 2.5 3.23 1.7 1.42 1.5 1.00 1.6 1.21 3.2 4.659 10.2 37.1 2.5 3.34 2.1 2.11 1.5 1.04 1.6 1.14 2.1 2.14
10 8.7 29.0 2.5 3.27 1.9 1.65 1.5 0.956 1.6 1.12 2.0 1.9311 7.8 24.9 2.4 2.92 1.7 1.36 1.4 0.861 1.5 1.02 5.5 9.5812 7.2 21.8 2.4 2.82 1.6 1.25 1.4 0.804 1.7 1.37 2.6 3.4713 6.1 17.1 2.3 2.70 1.6 1.18 1.4 0.833 5.2 7.33 40.9 14414 6.2 17.3 2.3 2.72 1.6 1.16 1.5 1.06 61.1 186 19.0 53.915 5.2 13.2 2.5 3.21 1.6 1.10 1.6 1.15 246.0 1091 3.1 4.8816 4.7 11.3 2.3 2.76 1.5 1.06 1.4 0.868 10.7 27 2.3 2.5317 4.3 9.92 2.2 2.43 1.5 1.02 2.3 2.06 2.9 4.05 2.2 2.3518 4.5 10.4 2.1 2.28 1.5 0.986 2.7 3.27 2.1 2.13 2.5 3.1519 6.1 15.6 2.1 2.24 1.5 0.958 3.2 5.09 5.4 7.88 2.2 2.3920 4.2 9.33 2.1 2.16 1.4 0.918 2.2 2.37 2.7 3.69 2.1 2.2021 3.8 8.08 2.0 2.01 1.4 0.895 2.1 2.23 2.5 3.05 6.0 10.922 3.6 7.43 2.0 1.95 2.6 2.97 2.0 1.89 2.1 2.07 2.3 2.6323 4.5 9.86 2.0 1.86 1.7 1.26 1.9 1.70 2.4 2.60 2.0 1.9824 4.0 8.40 1.9 1.78 1.5 1.03 1.7 1.38 2.0 1.95 2.0 1.8825 3.4 6.51 1.9 1.73 1.5 1.05 1.6 1.25 1.8 1.55 2.0 1.8526 3.4 6.50 1.9 1.68 1.8 1.51 1.6 1.17 4.7 5.62 1.9 1.8027 3.3 5.91 1.9 1.67 1.9 1.74 2.0 1.84 3.0 3.98 1.9 1.6828 3.2 5.42 1.8 1.61 1.6 1.16 1.8 1.46 1.8 1.53 1.8 1.5729 3.1 5.13 1.5 1.05 1.9 1.64 1.8 1.50 1.8 1.5830 3.0 4.80 1.4 0.916 2.1 2.04 1.8 1.47 2.3 2.5831 2.9 4.52 1.5 0.967 1.8 1.46
Total 4540 76.7 41.4 43.6 1374 336
mg/l t/d mg/l t/d mg/l t/d mg/l t/d mg/l t/d mg/l t/d1 2.0 1.83 3.4 6.05 3.0 4.85 3.7 7.42 6.5 17.8 5.7 15.22 1.8 1.47 133.7 544 2.9 4.58 3.1 5.07 3.5 6.97 4.9 12.23 1.8 1.47 11.7 35.8 12.6 29.1 4.0 8.14 3.3 5.76 4.4 10.24 1.7 1.33 3.5 6.58 108.0 541 14.5 44.4 3.3 6.01 24.5 115.35 1.7 1.32 4.3 8.29 13.0 48.5 5.7 14.9 3.0 4.80 10.8 40.26 2.1 2.05 3.1 5.14 4.0 8.43 3.7 7.74 2.9 4.55 9.4 32.17 1.9 1.69 15.3 52.3 4.3 8.55 3.9 7.93 5.6 10.2 9.6 29.38 5.6 9.09 4.0 8.59 10.0 27.5 3.6 6.85 4.6 9.28 21.3 1029 9.4 21.3 3.5 6.51 4.6 10.4 3.3 5.80 2.9 4.46 138.8 875
10 17.6 52.4 3.3 5.75 3.4 6.30 11.0 28.3 2.9 4.39 195.3 192411 3.4 6.08 3.0 4.73 73.4 321 5.8 14.1 2.9 4.32 28.8 18012 3.1 4.78 2.9 4.33 4.0 8.71 3.2 5.75 2.7 3.93 16.4 76.013 2.4 2.94 2.8 4.28 26.0 96.8 3.1 5.05 3.4 6.05 13.1 54.714 2.1 2.20 9.7 22.8 6.1 16.7 3.2 5.38 5.5 10.2 18.9 87.415 2.0 2.02 6.3 17.0 3.7 7.59 4.1 7.49 10.2 27.2 15.8 70.916 8.7 17.1 3.6 7.17 3.3 5.84 5.5 13.4 5.0 11.5 8.9 30.317 2.5 3.16 3.3 5.99 3.0 4.96 3.6 6.88 5.9 13.5 7.5 23.318 371.3 3782 12.0 33.8 15.7 45.8 3.4 6.08 7.7 22.7 13.5 53.519 7.7 22.8 4.5 10.4 5.2 12.7 4.1 8.02 402.1 3472 8.0 25.720 3.4 6.38 3.4 6.58 3.6 7.22 53.1 198 18.9 87.5 11.4 38.021 3.0 4.90 4.7 10.5 3.2 5.41 6.9 19.4 18.0 78.1 22.0 107.322 2.8 4.07 3.6 7.23 4.1 8.24 4.0 8.66 40.5 274.0 14.3 59.823 2.4 2.98 3.5 6.75 3.1 5.15 14.3 38.7 24.2 117.6 529.5 841524 14.1 36.7 3.7 7.39 3.1 5.08 5.0 11.9 13.4 55.4 30.0 18825 3.7 7.37 3.6 6.85 3.0 4.74 3.3 6.13 8.0 25.8 15.7 71.926 14.3 40.7 3.5 6.79 3.4 5.80 36.7 122 494.3 6228 14.7 64.727 3.4 6.37 3.5 6.90 5.4 11.6 5.8 14.8 20.1 104 11.2 43.128 2.8 4.11 8.5 22.1 3.7 7.07 4.3 9.11 11.1 41.9 12.9 51.129 2.6 3.49 3.6 6.99 81.7 393 4.4 10.3 8.7 28.9 10.1 36.830 61.1 182 3.2 5.69 6.3 17.1 5.0 10.9 7.0 20.8 14.0 55.131 6.7 16.6 3.3 5.81 9.5 29.6 12.8 50.6
Total 4253 889 1678 689 10708 12940
1.3 Promedio Anual: 48.3529.5 Máxima Instantánea 2758.9
ABRIL ENERO MAYO
Mínimo Diario: Máximo Diario:
DIA FEBRERO
JULIO AGOSTO
Concentración de Sedimentos Suspendidos (mg/l)
OCTUBRE NOVIEMBRE DICIEMBREDIA
Total Anual: 91 t/año/km²37568 t/año Producción Anual:
ESTACION CHICO EN EL RIO CHAGRES
Área de Drenaje:
Concentraciones de Sedimentos Suspendidos (mg/l) y Caudales Sólidos Promedios Diarios (t/d)LATITUD 9º 15' 49'' N LONGITUD 79º 30' 35'' O
SEPTIEMBRE
JUNIO MARZO
Autoridad del Canal de Panamá 17 Anuario de Sedimentos Suspendidos 1998-2004

Año: 2002 414 km²
mg/l t/d mg/l t/d mg/l t/d mg/l t/d mg/l t/d mg/l t/d1 8.3 27.1 2.8 4.03 2.0 2.00 2.1 2.23 5.1 12.9 3.2 5.462 7.2 21.7 2.9 4.42 2.0 1.93 2.0 2.04 4.4 10.1 3.2 5.563 6.3 17.6 3.4 6.35 2.0 1.89 2.2 2.27 4.3 10.0 3.6 6.834 7.8 23.9 3.2 5.45 2.0 1.88 2.5 3.20 3.9 8.42 70.2 2695 5.8 15.5 2.8 4.28 1.9 1.82 2.7 3.85 3.7 7.86 15.1 52.46 5.2 13.4 2.7 3.86 1.9 1.74 2.1 2.27 3.9 8.44 3.9 8.107 8.0 24.9 2.6 3.54 1.9 1.75 2.0 1.97 4.6 11.0 4.5 10.38 7.7 23.9 2.5 3.34 1.9 1.78 2.0 1.89 5.1 12.9 3.4 6.559 9.8 34.6 2.5 3.16 2.0 1.93 2.0 1.88 8.3 25.8 4.4 8.50
10 5.9 16.0 2.5 3.13 2.0 1.86 1.9 1.73 5.1 13.0 4.0 8.1111 4.8 11.9 2.4 3.02 1.9 1.75 2.2 2.38 4.2 9.58 3.2 5.6712 4.4 10.3 2.4 2.99 1.9 1.74 1.9 1.78 3.7 7.83 9.7 23.913 4.1 9.20 2.4 2.89 1.8 1.61 1.9 1.72 3.6 7.15 4.5 10.014 3.8 8.28 2.4 2.96 1.9 1.71 1.8 1.60 3.4 6.58 3.3 6.0115 3.7 7.93 2.4 2.79 2.0 1.88 1.8 1.45 3.4 6.34 3.1 5.2016 3.7 7.64 2.3 2.71 1.9 1.68 1.7 1.41 6.3 13.7 3.0 4.7017 3.7 7.69 2.4 2.81 2.3 2.69 2.3 2.42 5.8 14.9 7.6 20.718 3.5 7.02 2.3 2.66 2.3 2.61 2.8 4.18 13.9 45.5 4.1 9.1019 3.4 6.51 2.3 2.61 10.1 23.7 920.1 19575 6.2 16.5 3.4 6.1620 3.4 6.23 2.3 2.69 2.4 2.83 9.1 30.6 6.5 17.9 3.2 5.6721 3.4 6.29 2.3 2.53 754.4 8308 9.7 32.7 4.4 10.0 4.6 9.9222 3.3 5.95 2.2 2.38 21.4 100 14.5 59.3 17.9 66.9 3.2 5.7523 3.2 5.57 2.2 2.30 16.8 61.6 6.8 19.8 19.3 72.5 3.3 5.9724 3.2 5.37 2.2 2.28 7.4 22.0 14.4 58.8 11.5 39.5 3.5 6.7725 3.1 5.31 2.1 2.24 3.5 6.49 25.4 143 23.6 91.7 3.1 5.1626 3.0 4.91 2.2 2.32 2.9 4.43 26.0 130 8.9 28.6 3.0 4.6927 3.0 4.72 2.1 2.15 2.6 3.39 60.9 505 5.3 13.6 3.5 6.6928 2.9 4.45 2.1 2.13 2.3 2.78 13.4 56.4 3.8 8.01 3.0 4.9529 2.8 4.19 2.2 2.50 8.2 26.4 3.5 6.88 8.1 18.330 2.8 4.21 2.1 2.27 6.2 17.3 3.4 6.32 3.8 7.7431 2.8 4.11 2.1 2.21 3.3 5.85
Total 356 88.0 8577 20694 616 554
mg/l t/d mg/l t/d mg/l t/d mg/l t/d mg/l t/d mg/l t/d1 7.2 18.0 19.0 67.4 4.1 9.10 3.7 7.51 7.0 20.8 47.2 3842 3.1 5.28 5.8 15.1 3.7 7.80 5.7 13.6 5.5 14.6 36.5 2613 2.9 4.58 4.2 9.26 3.5 6.85 3.6 7.21 4.8 11.7 27.8 1734 2.8 4.17 133.5 640 5.7 13.0 7.3 18.6 4.4 10.4 19.8 1035 4.0 7.56 10.9 35.8 9.9 29.2 4.2 8.83 30.7 132 15.9 73.46 6.1 15.2 4.2 9.60 4.9 11.5 4.2 7.88 21.7 97.5 14.5 63.97 6.8 15.1 3.6 7.36 3.4 6.37 14.3 58.4 14.0 55.5 12.0 47.78 3.9 7.76 3.8 8.01 3.8 7.48 4.9 11.9 7.4 22.4 10.2 37.09 3.1 5.15 3.5 6.95 3.6 6.87 3.9 8.24 5.0 12.5 8.9 30.1
10 2.9 4.62 3.3 5.88 4.4 9.37 19.5 71.5 4.3 10.1 7.8 24.811 91.4 390 3.1 5.35 3.4 6.25 6.3 16.8 3.9 8.61 7.0 21.012 5.2 12.4 3.1 5.02 4.1 8.24 3.8 8.02 4.0 8.83 6.4 18.113 3.3 6.08 3.0 4.90 3.3 5.89 3.6 7.17 92.3 568 5.8 15.814 3.1 5.25 2.9 4.46 3.0 4.94 8.2 20.5 14.5 59.1 5.4 13.915 477.2 3639 2.8 4.21 3.0 4.86 13.0 38.7 9.6 33.1 5.1 12.916 196.7 1519 2.7 3.95 6.9 15.3 7.3 21.3 6.2 17.3 4.8 11.617 16.6 76.3 2.7 3.73 3.4 6.50 5.9 15.1 8.5 25.3 4.4 10.118 234.1 1913 3.3 5.24 3.1 5.30 4.2 9.21 8.4 24.7 4.1 9.1419 12.5 45.8 8.9 20.9 3.0 4.90 4.0 8.42 7.4 22.4 3.9 8.5720 6.5 18.5 4.8 10.0 3.5 6.68 3.5 6.70 4.8 11.8 3.8 7.9821 4.2 9.69 3.0 4.90 3.4 6.23 8.7 22.0 4.5 10.4 3.8 8.1622 3.6 7.44 3.7 6.59 4.7 11.4 11.6 37.3 3.9 8.41 3.6 7.3723 3.4 6.49 32.4 113 4.4 10.2 4.4 10.1 699.3 12752 3.5 6.9924 3.4 6.50 7.6 21.2 3.2 5.73 20.8 79.2 23.9 128 3.5 6.7025 3.3 5.78 11.2 33.8 3.0 4.89 6.6 18.1 10.1 36.6 3.4 6.4026 20.7 66.2 4.3 9.28 3.0 4.82 5.9 14.1 7.2 21.7 3.3 5.9827 3.5 6.77 119.2 663 3.2 5.45 73.9 410 6.3 17.8 3.3 6.0228 3.3 5.79 58.2 402 3.3 5.97 53.3 284 8.1 25.5 3.3 6.1329 27.9 99.1 25.5 137 3.0 4.91 13.1 53.0 39.3 239 4.3 9.5030 5.6 14.0 10.0 35.0 3.7 7.59 7.2 21.6 1482.3 39264 3.4 6.4431 10.5 32.1 5.5 14.5 7.5 22.9 3.1 5.28
Total 7973 2314 244 1338 53669 1402
1.7 Promedio Anual: 105.11482.3 Máxima Instantánea 2974.2
DIA JULIO AGOSTO SEPTIEMBRE
MAYO JUNIO
OCTUBRE NOVIEMBRE DICIEMBRE
ESTACION CHICO EN EL RIO CHAGRES
Área de Drenaje:
Concentraciones de Sedimentos Suspendidos (mg/l) y Caudales Sólidos Promedios Diarios (t/d)LATITUD 9º 15' 49'' N LONGITUD 79º 30' 35'' O
DIA FEBRERO MARZO ABRIL ENERO
Producción Anual
Concentración de Sedimentos Suspendidos (mg/l) Mínimo Diario: Máximo Diario:
Total Anual: 236 t/año/km²97825 t/año
18 Autoridad del Canal de Panamá Anuario de Sedimentos Suspendidos 1998-2004

Año: 2003 414 km²
mg/l t/d mg/l t/d mg/l t/d mg/l t/d mg/l t/d mg/l t/d1 3.0 4.85 1.9 1.67 1.4 0.882 1.0 0.431 1.2 0.570 2.7 3.572 2.9 4.53 1.8 1.58 1.3 0.754 1.0 0.419 1.1 0.527 43.7 1213 2.8 4.16 1.8 1.55 1.3 0.749 0.9 0.345 2.2 1.57 7.8 22.64 2.7 3.85 1.8 1.50 1.3 0.728 0.9 0.346 1.3 0.669 3.2 5.255 2.7 3.73 1.8 1.48 1.3 0.694 0.9 0.326 27.5 55.7 13.0 30.76 2.6 3.59 1.8 1.45 1.3 0.708 0.9 0.350 2.6 2.99 6.0 13.37 2.6 3.56 1.8 1.43 1.3 0.698 0.9 0.339 14.0 38.2 4.9 7.928 2.6 3.40 1.7 1.41 1.3 0.682 0.9 0.350 4.8 10.7 3.2 5.319 2.5 3.29 1.8 1.51 1.2 0.669 0.9 0.354 2.8 4.14 25.0 72.9
10 2.5 3.31 2.5 2.83 1.2 0.611 1.1 0.505 2.3 2.74 4.4 9.1411 2.6 3.49 2.3 2.54 1.2 0.563 0.9 0.354 14.8 27.7 4.2 7.6512 2.8 4.19 2.3 2.56 1.1 0.555 0.9 0.334 5.1 8.62 5.4 13.713 2.8 4.16 2.0 1.95 1.2 0.574 0.9 0.317 2.6 3.36 12.8 38.614 2.5 3.28 1.9 1.69 1.2 0.560 2.3 1.70 2.1 2.22 16.4 57.115 2.5 3.19 1.8 1.48 1.1 0.540 3.3 4.17 2.2 2.30 4.0 8.5916 2.4 2.88 1.7 1.31 1.1 0.524 1.2 0.572 2.1 2.14 5.7 11.217 2.3 2.74 1.6 1.21 1.2 0.577 1.3 0.684 2.0 1.92 4.2 8.3018 2.3 2.62 1.6 1.15 1.3 0.678 1.0 0.404 37.4 115 69.0 32519 2.3 2.53 1.6 1.10 1.7 1.36 0.9 0.341 4.8 9.86 7.3 20.120 2.5 3.05 1.5 1.08 1.2 0.560 0.9 0.308 2.7 3.65 3.2 5.4421 2.6 3.45 1.5 1.05 1.1 0.504 39.8 148 2.0 1.88 4.9 9.3422 2.2 2.51 1.5 0.977 1.1 0.509 2.2 2.28 1.9 1.69 4.0 7.5823 2.2 2.33 1.4 0.927 1.1 0.464 1.2 0.659 1.8 1.47 4.8 9.1324 2.1 2.22 1.4 0.931 1.0 0.449 1.3 0.700 1.7 1.34 7.4 15.225 2.5 3.23 1.4 0.891 1.0 0.407 1.4 0.794 2.2 2.21 4.6 9.0426 2.2 2.32 1.4 0.838 1.0 0.378 1.4 0.791 5.0 4.73 2.8 3.9927 2.1 2.07 1.3 0.789 1.0 0.385 2.0 1.55 7.0 13.6 2.7 3.6728 2.0 2.00 1.3 0.796 1.0 0.370 2.1 1.74 6.6 12.8 3.5 5.6029 2.0 1.86 0.9 0.360 1.8 1.53 26.0 96.4 2.6 3.5030 1.9 1.81 0.9 0.357 1.8 1.36 4.6 8.89 7.5 14.231 1.9 1.74 0.9 0.346 8.2 17.3
Total 95.9 39.7 18.2 172 457 869
mg/l t/d mg/l t/d mg/l t/d mg/l t/d mg/l t/d mg/l t/d1 4.5 9.07 386.8 3576 32.0 154 31.9 168 12.6 44.1 38.9 2222 2.6 3.33 7.0 20.0 7.8 23.7 8.3 26.5 15.1 60.1 34.4 2273 2.6 3.40 4.8 11.2 5.9 15.8 6.1 16.6 16.1 66.5 46.5 3734 2.7 3.59 3.8 7.57 5.7 14.9 6.8 19.9 8.9 29.6 24.4 1415 2.4 2.96 3.0 4.77 7.9 23.6 6.2 17.2 6.7 19.6 17.7 86.46 3.6 5.08 6.9 16.2 7.4 22.5 6.5 18.1 25.7 106 23.0 1277 5.9 13.3 3.2 5.34 5.2 13.3 7.2 21.6 15.2 65.8 332.1 48588 5.4 11.0 3.8 7.36 4.4 10.1 4.7 11.3 8.6 28.3 43.9 3459 3.7 6.79 2.9 4.29 6.1 16.6 10.0 30.0 10.8 38.1 32.0 212
10 6.5 13.7 7.3 14.4 6.1 15.7 52.8 371 30.1 135 24.8 14511 3.7 7.04 3.0 4.79 6.5 17.6 11.6 43.6 18.7 84.9 41.1 28312 16.7 51.4 2.6 3.45 4.7 11.3 7.0 20.8 49.6 300 26.5 15913 4.4 9.68 118.2 590 5.6 13.5 5.9 16.0 92.7 662 18.1 90.114 2.9 4.33 299.1 3694 4.4 10.2 12.9 44.2 22.9 126 15.2 68.415 2.5 3.32 92.4 641 44.8 170 9.6 32.3 12.9 53.1 14.3 62.416 2.5 3.17 10.9 39.5 10.1 33.0 35.9 138 9.6 34.2 13.0 53.817 2.4 3.03 5.1 12.7 4.8 11.9 25.4 132 22.7 95.6 10.6 39.718 2.4 2.89 3.8 7.95 3.8 8.11 24.1 113 49.9 322 9.7 34.719 2.3 2.76 3.8 7.81 4.4 9.47 37.4 217 18.3 85.6 13.3 52.820 2.3 2.63 11.1 30.0 11.6 32.8 19.3 95.3 15.2 63.5 24.6 12821 2.2 2.51 4.9 11.6 27.0 99.7 13.6 57.1 11.4 43.6 14.5 63.122 2.2 2.32 5.8 13.2 9.0 28.6 9.1 31.4 8.4 27.5 23.8 12123 20.0 54.5 4.1 8.66 13.8 45.3 7.9 25.0 38.6 189 10.7 40.124 6.6 16.9 8.5 22.6 9.6 31.5 11.7 40.3 10.7 39.6 8.6 28.925 3.2 5.62 4.3 9.76 4.4 10.4 10.8 38.4 7.6 23.8 7.5 23.526 7.3 18.1 3.7 7.45 17.9 53.3 7.1 21.1 6.7 19.3 6.8 19.927 3.9 7.93 4.6 10.9 48.6 214 7.0 20.7 10.4 37.2 6.2 17.528 3.1 5.16 5.5 12.9 50.2 251 5.8 15.6 104.6 859 8.0 25.329 2.7 3.84 15.9 49.1 11.2 40.2 6.2 17.0 45.6 356 6.1 16.730 3.0 4.74 4.7 11.1 28.4 89.9 39.2 173 20.8 109 6.4 18.331 6.7 15.9 3.6 7.44 10.3 36.0 5.4 14.1
Total 300 8862 1492 2029 4124 8097
0.9 Promedio Anual: 31.5386.8 Máxima Instantánea 1037.5
Total Anual: 64 t/año/km²26554 t/año Producción Anual
ESTACION CHICO EN EL RIO CHAGRES
Área de Drenaje:
Concentraciones de Sedimentos Suspendidos (mg/l) y Caudales Sólidos Promedios Diarios (t/d)LATITUD 9º 15' 49'' N LONGITUD 79º 30' 35'' O
OCTUBRE NOVIEMBRE DICIEMBRE
DIA ENERO FEBRERO MARZO
Concentración de Sedimentos Suspendidos (mg/l) Mínimo Diario: Máximo Diario:
ABRIL MAYO JUNIO
DIA JULIO AGOSTO SEPTIEMBRE
Autoridad del Canal de Panamá 19 Anuario de Sedimentos Suspendidos 1998-2004
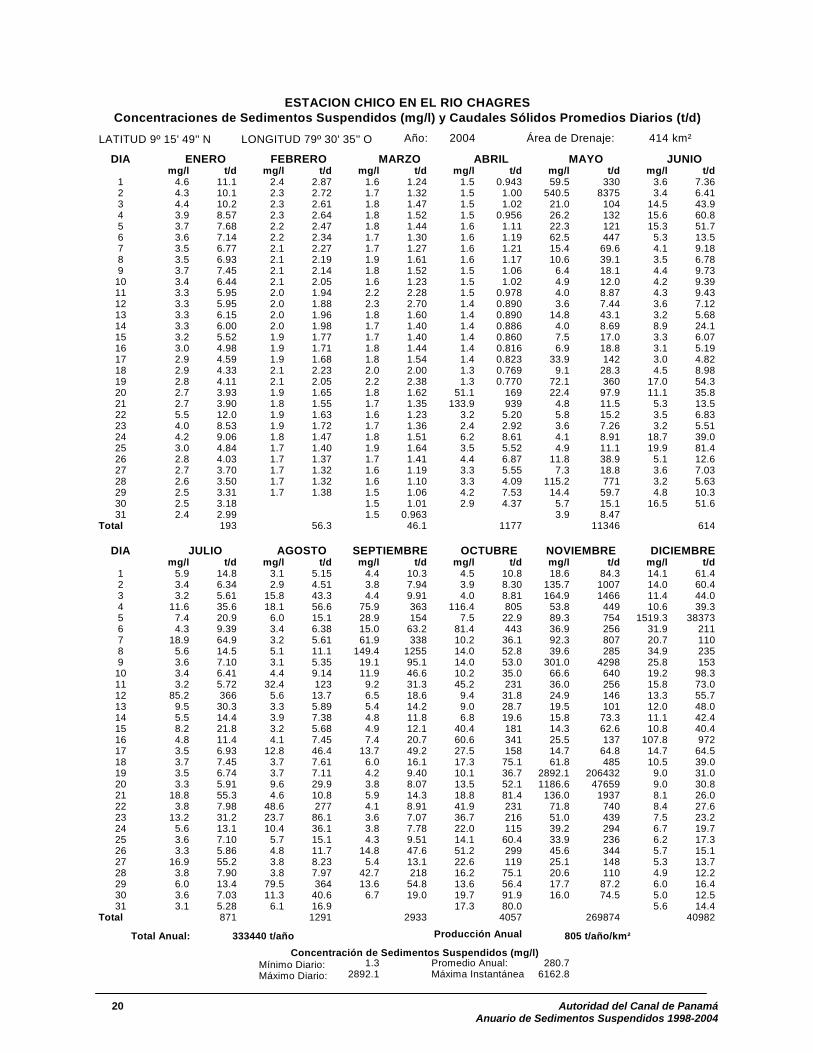
Año: 2004 414 km²
mg/l t/d mg/l t/d mg/l t/d mg/l t/d mg/l t/d mg/l t/d1 4.6 11.1 2.4 2.87 1.6 1.24 1.5 0.943 59.5 330 3.6 7.362 4.3 10.1 2.3 2.72 1.7 1.32 1.5 1.00 540.5 8375 3.4 6.413 4.4 10.2 2.3 2.61 1.8 1.47 1.5 1.02 21.0 104 14.5 43.94 3.9 8.57 2.3 2.64 1.8 1.52 1.5 0.956 26.2 132 15.6 60.85 3.7 7.68 2.2 2.47 1.8 1.44 1.6 1.11 22.3 121 15.3 51.76 3.6 7.14 2.2 2.34 1.7 1.30 1.6 1.19 62.5 447 5.3 13.57 3.5 6.77 2.1 2.27 1.7 1.27 1.6 1.21 15.4 69.6 4.1 9.188 3.5 6.93 2.1 2.19 1.9 1.61 1.6 1.17 10.6 39.1 3.5 6.789 3.7 7.45 2.1 2.14 1.8 1.52 1.5 1.06 6.4 18.1 4.4 9.73
10 3.4 6.44 2.1 2.05 1.6 1.23 1.5 1.02 4.9 12.0 4.2 9.3911 3.3 5.95 2.0 1.94 2.2 2.28 1.5 0.978 4.0 8.87 4.3 9.4312 3.3 5.95 2.0 1.88 2.3 2.70 1.4 0.890 3.6 7.44 3.6 7.1213 3.3 6.15 2.0 1.96 1.8 1.60 1.4 0.890 14.8 43.1 3.2 5.6814 3.3 6.00 2.0 1.98 1.7 1.40 1.4 0.886 4.0 8.69 8.9 24.115 3.2 5.52 1.9 1.77 1.7 1.40 1.4 0.860 7.5 17.0 3.3 6.0716 3.0 4.98 1.9 1.71 1.8 1.44 1.4 0.816 6.9 18.8 3.1 5.1917 2.9 4.59 1.9 1.68 1.8 1.54 1.4 0.823 33.9 142 3.0 4.8218 2.9 4.33 2.1 2.23 2.0 2.00 1.3 0.769 9.1 28.3 4.5 8.9819 2.8 4.11 2.1 2.05 2.2 2.38 1.3 0.770 72.1 360 17.0 54.320 2.7 3.93 1.9 1.65 1.8 1.62 51.1 169 22.4 97.9 11.1 35.821 2.7 3.90 1.8 1.55 1.7 1.35 133.9 939 4.8 11.5 5.3 13.522 5.5 12.0 1.9 1.63 1.6 1.23 3.2 5.20 5.8 15.2 3.5 6.8323 4.0 8.53 1.9 1.72 1.7 1.36 2.4 2.92 3.6 7.26 3.2 5.5124 4.2 9.06 1.8 1.47 1.8 1.51 6.2 8.61 4.1 8.91 18.7 39.025 3.0 4.84 1.7 1.40 1.9 1.64 3.5 5.52 4.9 11.1 19.9 81.426 2.8 4.03 1.7 1.37 1.7 1.41 4.4 6.87 11.8 38.9 5.1 12.627 2.7 3.70 1.7 1.32 1.6 1.19 3.3 5.55 7.3 18.8 3.6 7.0328 2.6 3.50 1.7 1.32 1.6 1.10 3.3 4.09 115.2 771 3.2 5.6329 2.5 3.31 1.7 1.38 1.5 1.06 4.2 7.53 14.4 59.7 4.8 10.330 2.5 3.18 1.5 1.01 2.9 4.37 5.7 15.1 16.5 51.631 2.4 2.99 1.5 0.963 3.9 8.47
Total 193 56.3 46.1 1177 11346 614
mg/l t/d mg/l t/d mg/l t/d mg/l t/d mg/l t/d mg/l t/d1 5.9 14.8 3.1 5.15 4.4 10.3 4.5 10.8 18.6 84.3 14.1 61.42 3.4 6.34 2.9 4.51 3.8 7.94 3.9 8.30 135.7 1007 14.0 60.43 3.2 5.61 15.8 43.3 4.4 9.91 4.0 8.81 164.9 1466 11.4 44.04 11.6 35.6 18.1 56.6 75.9 363 116.4 805 53.8 449 10.6 39.35 7.4 20.9 6.0 15.1 28.9 154 7.5 22.9 89.3 754 1519.3 383736 4.3 9.39 3.4 6.38 15.0 63.2 81.4 443 36.9 256 31.9 2117 18.9 64.9 3.2 5.61 61.9 338 10.2 36.1 92.3 807 20.7 1108 5.6 14.5 5.1 11.1 149.4 1255 14.0 52.8 39.6 285 34.9 2359 3.6 7.10 3.1 5.35 19.1 95.1 14.0 53.0 301.0 4298 25.8 153
10 3.4 6.41 4.4 9.14 11.9 46.6 10.2 35.0 66.6 640 19.2 98.311 3.2 5.72 32.4 123 9.2 31.3 45.2 231 36.0 256 15.8 73.012 85.2 366 5.6 13.7 6.5 18.6 9.4 31.8 24.9 146 13.3 55.713 9.5 30.3 3.3 5.89 5.4 14.2 9.0 28.7 19.5 101 12.0 48.014 5.5 14.4 3.9 7.38 4.8 11.8 6.8 19.6 15.8 73.3 11.1 42.415 8.2 21.8 3.2 5.68 4.9 12.1 40.4 181 14.3 62.6 10.8 40.416 4.8 11.4 4.1 7.45 7.4 20.7 60.6 341 25.5 137 107.8 97217 3.5 6.93 12.8 46.4 13.7 49.2 27.5 158 14.7 64.8 14.7 64.518 3.7 7.45 3.7 7.61 6.0 16.1 17.3 75.1 61.8 485 10.5 39.019 3.5 6.74 3.7 7.11 4.2 9.40 10.1 36.7 2892.1 206432 9.0 31.020 3.3 5.91 9.6 29.9 3.8 8.07 13.5 52.1 1186.6 47659 9.0 30.821 18.8 55.3 4.6 10.8 5.9 14.3 18.8 81.4 136.0 1937 8.1 26.022 3.8 7.98 48.6 277 4.1 8.91 41.9 231 71.8 740 8.4 27.623 13.2 31.2 23.7 86.1 3.6 7.07 36.7 216 51.0 439 7.5 23.224 5.6 13.1 10.4 36.1 3.8 7.78 22.0 115 39.2 294 6.7 19.725 3.6 7.10 5.7 15.1 4.3 9.51 14.1 60.4 33.9 236 6.2 17.326 3.3 5.86 4.8 11.7 14.8 47.6 51.2 299 45.6 344 5.7 15.127 16.9 55.2 3.8 8.23 5.4 13.1 22.6 119 25.1 148 5.3 13.728 3.8 7.90 3.8 7.97 42.7 218 16.2 75.1 20.6 110 4.9 12.229 6.0 13.4 79.5 364 13.6 54.8 13.6 56.4 17.7 87.2 6.0 16.430 3.6 7.03 11.3 40.6 6.7 19.0 19.7 91.9 16.0 74.5 5.0 12.531 3.1 5.28 6.1 16.9 17.3 80.0 5.6 14.4
Total 871 1291 2933 4057 269874 40982
1.3 Promedio Anual: 280.72892.1 Máxima Instantánea 6162.8
Producción Anual
ENERO MAYO JUNIO
DIA JULIO AGOSTO SEPTIEMBRE OCTUBRE NOVIEMBRE DICIEMBRE
ESTACION CHICO EN EL RIO CHAGRES
Área de Drenaje:
Concentraciones de Sedimentos Suspendidos (mg/l) y Caudales Sólidos Promedios Diarios (t/d)LATITUD 9º 15' 49'' N LONGITUD 79º 30' 35'' O
Concentración de Sedimentos Suspendidos (mg/l) Mínimo Diario: Máximo Diario:
DIA FEBRERO MARZO ABRIL
Total Anual: 805 t/año/km²333440 t/año
20 Autoridad del Canal de Panamá Anuario de Sedimentos Suspendidos 1998-2004

Autoridad del Canal de Panamá 21 Anuario de Sedimentos Suspendidos 1998-2004

22 Autoridad del Canal de Panamá Anuario de Sedimentos Suspendidos 1998-2004

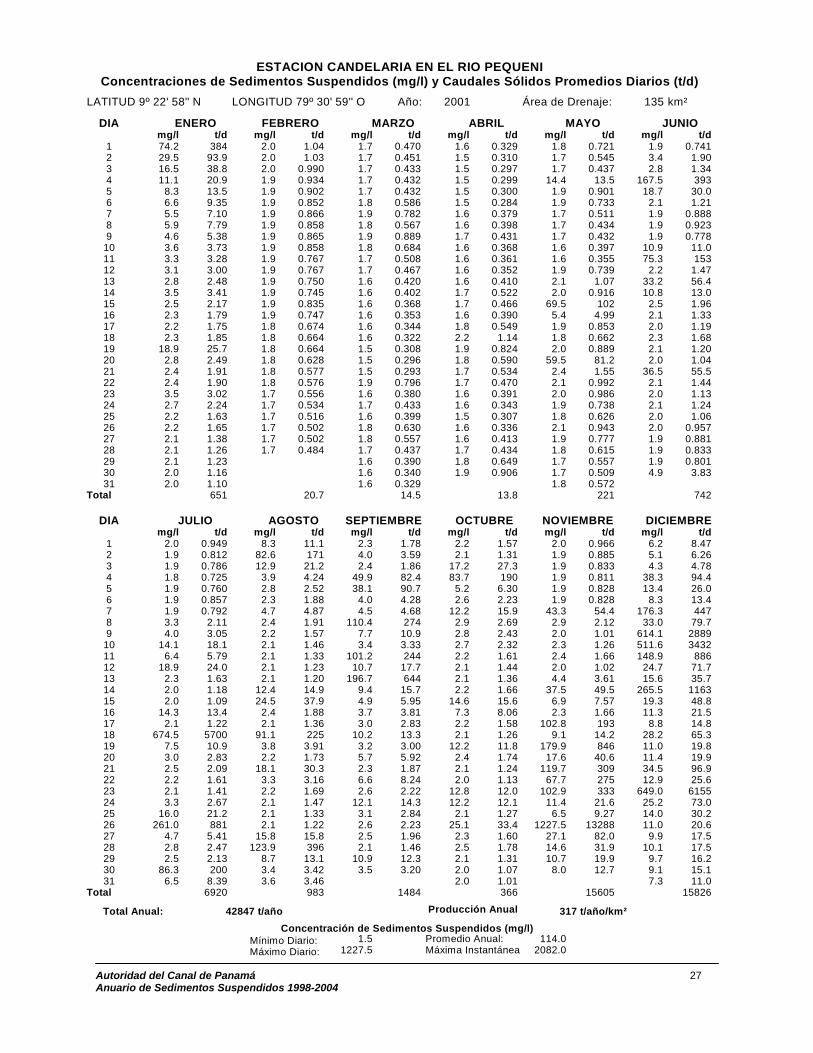
Estación Candelaria en el Río Pequení
LOCALIZACIÓN: La estación está a 600 m (0.4 mi) aguas arriba de la confluencia del río Pequení con la quebrada Candelaria, en la provincia de Panamá, distrito de Panamá, cerca del poblado de San Juan de Pequení Rural, frente a la escuela San Juan de Pequení Indígena. Sus coordenadas geográficas son: 9º 22’ 58” de latitud Norte y 79º 30’ 59” de longitud Oeste. CÓDIGO DE LA ESTACIÓN: 115-07-01 ÁREA DE DRENAJE: 135 km2 (52 mi2) PERIODO DE REGISTRO: Desde enero de 1981 hasta la fecha. VALORES EXTREMOS Y PROMEDIOS PARA EL AÑO 2004
Concentración (mg/l)
Año
Máxima Instantánea
Mínima Diaria
PromedioAnual
Rendimiento
líquido (l/s/km2)
Producción
anual de sedimentos (t/año/km2)
1998 2758.9 1.2 129.5 91.7 374 1999 1666.4 1.9 137.0 134.0 576 2000 1861.2 1.6 124.1 106.0 417 2001 2082.0 1.5 114.0 88.3 317 2002 2883.5 1.6 193.9 107.0 658 2003 1369.8 1.3 90.9 88.1 253 2004 2398.6 1.5 225.0 112.0 798
Autoridad del Canal de Panamá 23 Anuario de Sedimentos Suspendidos 1998-2004

Año: 1998 135 km²
mg/l t/d mg/l t/d mg/l t/d mg/l t/d mg/l t/d mg/l t/d1 1.6 0.413 1.4 0.203 1.5 0.277 1.4 0.178 1.9 0.896 2.2 1.722 1.7 0.425 1.4 0.203 1.5 0.262 1.3 0.162 1.9 0.756 12.6 15.93 1.8 0.653 1.4 0.201 1.5 0.249 1.3 0.157 1.8 0.695 2.5 1.954 1.7 0.532 49.1 71.0 1.5 0.245 1.3 0.157 1.9 0.766 2.1 1.495 1.7 0.443 2.4 1.48 1.5 0.308 1.3 0.150 15.4 10.9 2.1 1.296 1.7 0.439 1.8 0.629 1.6 0.346 1.3 0.139 3.1 2.03 33.5 53.97 1.6 0.410 1.7 0.514 1.6 0.326 1.3 0.130 1.9 0.833 3.5 3.338 1.6 0.375 1.9 0.739 1.5 0.286 1.3 0.128 3.0 2.48 2.1 1.469 10.6 8.74 1.8 0.653 1.5 0.249 1.3 0.148 2.0 1.05 2.1 1.24
10 1.8 0.676 1.7 0.511 1.5 0.254 1.4 0.162 1.9 0.779 2.7 2.0511 1.7 0.493 1.7 0.461 1.5 0.234 1.3 0.154 1.8 0.675 2.1 1.3412 1.7 0.448 1.7 0.430 1.4 0.208 1.3 0.161 1.8 0.611 3.4 2.7013 1.7 0.443 1.7 0.422 1.4 0.193 1.3 0.134 1.8 0.700 12.0 16.014 1.7 0.424 1.7 0.428 1.4 0.192 1.3 0.117 1.8 0.645 2.2 1.6515 1.6 0.397 1.7 0.443 1.4 0.191 1.3 0.122 1.8 0.609 62.0 15316 1.6 0.392 1.7 0.422 1.4 0.192 1.3 0.135 80.6 92.0 3.5 3.5117 1.6 0.361 1.6 0.406 1.4 0.223 1.3 0.142 449.0 4893 2.2 1.7318 1.6 0.362 1.6 0.390 1.4 0.183 1.3 0.131 17.9 41.8 2.2 1.5219 7.7 5.38 1.6 0.366 1.4 0.180 1.3 0.113 6.4 8.83 2.2 1.6320 1.8 0.676 1.6 0.354 1.4 0.180 1.2 0.099 3.7 3.91 2.2 1.5021 1.7 0.424 1.6 0.352 1.4 0.171 1.2 0.104 2.7 2.42 45.9 91.822 1.6 0.370 1.6 0.343 1.4 0.163 1.5 0.288 3.3 3.11 5.7 6.8323 1.6 0.335 1.6 0.326 1.3 0.157 1.9 0.728 2.5 2.04 3.4 3.2824 1.5 0.307 1.5 0.311 1.5 0.267 19.7 28.6 6.9 7.31 2.4 1.9725 1.5 0.306 1.5 0.302 1.9 0.822 812.9 7942 231.2 650 2.5 2.1326 1.5 0.292 1.5 0.290 1.8 0.633 18.9 37.6 13.6 24.9 2.2 1.5727 1.5 0.265 1.5 0.302 1.6 0.328 3.0 2.69 4.3 4.86 2.2 1.6428 1.5 0.257 1.5 0.288 1.6 0.369 5.1 5.10 3.2 3.13 2.3 1.7429 1.5 0.249 1.5 0.255 2.4 1.78 2.9 2.58 2.1 1.3830 1.5 0.234 1.4 0.218 2.0 1.08 5.1 5.24 2.1 1.2431 1.4 0.218 1.4 0.194 2.7 2.31
Total 25.7 82.7 8.36 8022 5771 382
mg/l t/d mg/l t/d mg/l t/d mg/l t/d mg/l t/d mg/l t/d1 2.0 1.16 2.6 2.19 3.1 2.93 2.9 2.58 29.8 40.5 2.9 2.562 2.0 1.17 414.6 1422 12.1 13.9 3.4 3.28 2.7 2.20 2.5 2.033 2.0 1.06 56.4 149 12.8 20.3 10.2 12.7 2.6 2.23 3.2 2.784 48.6 105 11.2 20.8 3.6 3.65 5.6 6.71 2.3 1.75 2.7 2.275 30.5 50.2 324.2 1991 3.5 3.44 3.3 3.23 2.4 1.82 4.3 4.326 6.0 7.30 31.6 89.3 3.0 2.73 3.7 3.56 2.1 1.41 8.8 11.37 2.5 2.13 11.7 22.6 12.8 17.4 38.2 75.5 3.4 2.89 15.1 21.48 2.6 2.25 7.2 10.9 62.7 140 26.6 51.4 10.0 11.3 3.7 3.839 2.3 1.88 5.5 7.10 19.8 36.3 10.1 17.0 2.3 1.81 10.8 14.4
10 54.5 80.1 4.6 5.47 31.3 63.7 32.1 64.4 51.4 105 6.4 7.7811 3.4 3.36 9.5 12.4 6.1 8.26 5.3 6.67 2.8 2.56 6.8 9.4412 2.3 1.86 4.7 5.45 4.7 5.47 6.9 9.27 2.9 2.62 3.4 3.3913 2.2 1.55 113.7 406 3.5 3.49 5.7 7.44 2.5 2.13 97.0 325.214 2.1 1.43 6.4 8.93 3.0 2.76 4.0 4.36 2.2 1.67 20.6 41.515 2.1 1.34 7.5 10.4 2.6 2.21 16.5 22.9 2.2 1.51 412.8 249916 2.1 1.37 5.6 7.09 2.3 1.85 3.5 3.55 2.1 1.39 56.5 24217 2.1 1.34 4.0 4.31 2.8 2.38 6.4 7.47 2.9 2.32 40.6 12918 2.2 1.56 3.4 3.34 17.4 22.9 4.8 5.54 69.0 150 19.1 48.019 40.0 85.0 135.6 324 6.7 7.37 3.1 2.87 4.6 4.98 21.3 51.420 1360.6 20428 40.9 81.0 82.5 149 3.9 3.99 4.4 4.70 486.7 225421 46.0 166 43.7 88.9 78.1 170 2.8 2.54 15.9 24.3 129.3 75422 12.9 26.3 24.3 48.9 7.0 9.72 4.6 5.10 10.2 14.1 27.7 85.723 12.1 23.5 5.9 7.88 230.4 826 4.0 4.32 4.1 4.42 19.5 50.224 12.5 22.9 3.8 4.00 10.1 16.6 2.8 2.46 3.1 3.01 13.7 29.125 7.2 10.7 3.2 3.05 78.9 192 2.3 1.84 3.8 3.92 10.4 19.126 4.9 5.94 129.2 307 6.7 9.33 2.2 1.61 2.8 2.52 8.0 12.827 4.7 5.50 12.3 19.9 174.4 417 2.2 1.52 2.3 1.81 7.1 10.528 4.1 4.55 15.4 27.0 4.8 5.66 2.1 1.46 2.4 1.88 10.9 17.629 3.2 3.06 13.2 22.1 5.6 6.53 2.1 1.39 2.5 1.99 103.6 35230 3.0 2.77 4.6 5.31 3.4 3.39 2.1 1.34 2.4 1.89 24.5 60.631 3.9 3.91 4.5 5.04 3.5 2.84 10.7 19.9
Total 21055 5122 2166 341 405 7086
1.2 Promedio Anual: 129.51360.6 Máxima Instantánea 2758.9
DIA
Concentración de Sedimentos Suspendidos (mg/l) Mínimo Diario: Máximo Diario:
Total Anual: 374 t/año/km²50468 t/año
JULIO AGOSTO
DIA ENERO FEBRERO MARZO
DICIEMBRE
ESTACION CANDELARIA EN EL RIO PEQUENIConcentraciones de Sedimentos Suspendidos (mg/l) y Caudales Sólidos Promedios Diarios (t/d)
Área de Drenaje:
ABRIL MAYO JUNIO
LATITUD 9º 22' 58'' N LONGITUD 79º 30' 59'' O
Producción Anual
SEPTIEMBRE OCTUBRE NOVIEMBRE
24 Autoridad del Canal de Panamá Anuario de Sedimentos Suspendidos 1998-2004

Autoridad del Canal de Panamá 25 Anuario de Sedimentos Suspendidos 1998-2004
Año: 1999 135 km²
mg/l t/d mg/l t/d mg/l t/d mg/l t/d mg/l t/d mg/l t/d1 28.6 69.7 1.9 0.874 2.0 1.05 2.1 1.22 76.0 195 25.0 37.22 10.5 19.1 2.0 1.00 2.0 0.967 2.0 1.09 43.5 99.3 3.4 3.283 11.3 21.6 1.9 0.840 1.9 0.909 2.0 1.05 8.2 12.9 4.0 4.114 8.4 13.6 1.9 0.866 2.0 0.940 2.0 1.00 4.9 5.96 2.2 1.685 7.4 11.3 2.0 1.09 2.0 1.04 3.5 2.73 3.8 3.95 61.8 1176 6.4 9.01 2.0 0.972 2.1 1.40 2.0 1.04 4.1 4.32 517.6 24067 7.3 10.7 1.9 0.902 2.0 1.10 2.0 0.950 3.0 2.83 9.2 14.68 5.2 6.50 1.9 0.843 2.1 1.33 2.3 1.52 4.3 4.53 6.1 7.789 4.3 4.93 1.9 0.867 2.0 1.04 2.1 1.19 316.1 2221 3.3 3.27
10 3.6 3.65 1.9 0.876 1.9 0.913 5.0 5.00 17.8 40.7 2.8 2.4511 3.1 2.90 1.9 0.828 1.9 0.862 12.7 13.8 9.4 15.8 3.5 3.4512 3.2 3.05 2.0 0.943 1.9 0.842 2.9 2.60 5.8 7.61 2.7 2.3513 2.6 2.26 2.0 0.950 1.9 0.866 2.2 1.52 24.6 47.7 106.5 23614 2.3 1.91 2.0 1.04 1.9 0.793 6.0 6.90 5.8 7.65 18.0 30.515 2.2 1.70 2.0 1.13 15.5 16.1 5.5 6.89 4.3 4.88 4.5 5.1716 2.2 1.62 2.0 1.14 6.1 7.29 2.9 2.59 5.6 6.83 2.9 2.7117 2.2 1.54 17.1 25.9 16.3 30.3 2.2 1.62 3.7 3.86 2.5 2.0718 2.1 1.41 42.3 119 2.7 2.35 2.1 1.41 3.0 2.85 137.0 34619 2.1 1.37 8.0 11.1 2.1 1.41 2.1 1.27 2.7 2.42 5.2 6.3120 2.1 1.33 3.0 2.76 2.1 1.23 2.0 1.18 3.9 3.80 23.7 38.821 2.1 1.23 2.2 1.55 2.0 1.11 2.0 1.16 2.9 2.62 5.3 6.6222 2.1 1.21 2.1 1.33 2.0 1.11 2.1 1.35 2.3 1.80 703.7 359723 2.0 1.16 2.1 1.49 2.0 0.987 2.1 1.29 2.2 1.66 12.0 22.624 4.2 4.35 2.1 1.24 1.9 0.915 113.7 312 2.2 1.55 15.5 29.225 2.1 1.33 2.1 1.42 1.9 0.883 33.7 79.8 2.2 1.52 5.9 7.8126 2.1 1.19 2.1 1.22 2.0 0.943 720.9 4331 2.1 1.40 7.0 10.127 2.0 1.08 2.0 1.12 2.0 0.977 34.1 100 52.4 89.2 15.4 26.728 2.1 1.33 2.0 1.15 5.8 4.59 11.8 22.6 2.2 1.57 5.9 7.8829 2.0 1.13 13.4 19.5 7.2 10.8 2.4 1.89 4.9 5.8930 2.0 0.991 2.4 1.91 54.2 121 3.2 2.93 3.9 4.2431 1.9 0.933 2.1 1.39 11.7 15.1
Total 205 185 107 5037 2815 6988
mg/l t/d mg/l t/d mg/l t/d mg/l t/d mg/l t/d mg/l t/d1 3.3 3.31 5.5 7.20 27.8 55.7 2.2 1.52 2.4 1.96 378.5 39902 2.8 2.49 5.5 6.96 3.2 3.07 3.1 2.43 2.2 1.60 208.2 14763 2.5 2.16 5.1 6.25 11.5 14.9 3.1 2.47 5.5 6.28 70.7 3294 5.8 6.09 9.2 13.4 3.1 2.90 10.9 14.3 2.3 1.84 30.0 92.65 3.0 2.78 4.9 5.90 2.7 2.32 5.4 5.33 3.6 3.44 38.2 1276 2.3 1.85 4.0 4.40 2.3 1.78 2.6 2.18 197.6 800 17.9 43.57 2.5 2.00 182.9 589 7.9 9.63 12.7 14.8 18.9 40.4 904.5 153498 2.2 1.61 7.7 11.8 4.2 4.16 7.0 7.95 8.2 12.4 147.6 10159 348.0 1328 4.8 5.72 13.1 15.4 9.5 11.2 4.0 4.40 48.6 204
10 6.3 7.97 4.1 4.47 2.8 2.38 2.6 2.21 14.1 18.8 33.3 11511 2.7 2.36 11.8 21.5 3.7 3.20 2.1 1.44 13.3 22.5 86.9 41612 4.0 4.16 9.1 14.1 35.9 58.7 2.1 1.25 17.7 29.1 29.8 94.113 2.6 2.18 405.1 1949 36.0 75.4 2.0 1.12 5.0 6.13 454.1 392114 2.2 1.66 41.3 118 4.4 4.77 2.1 1.21 3.3 3.17 723.6 874015 2.2 1.54 8.5 13.7 23.2 32.9 11.7 12.2 2.6 2.18 255.4 226016 39.2 56.6 5.4 6.90 3.9 3.98 2.1 1.31 4.8 5.34 450.4 452017 4.1 4.13 5.1 6.36 2.9 2.64 2.0 1.02 3.5 3.60 72.8 38118 2.2 1.65 3.8 4.08 2.7 2.41 2.0 0.973 3.8 3.95 274.5 174019 14.4 20.0 5.2 5.64 5.6 5.68 2.3 1.27 2.6 2.22 35.6 12620 68.1 131 6.5 8.39 16.5 18.8 62.6 96.8 3.1 2.82 49.7 19721 29.0 61.8 4.8 5.31 10.3 15.7 55.4 98.9 2.7 2.40 46.6 17422 57.3 184 5.6 7.07 3.1 2.89 32.6 55.7 2.5 2.05 33.7 11023 739.7 7760 28.4 51.6 2.3 1.81 5.3 5.64 8.1 11.7 17.4 42.324 20.4 52.9 8.6 12.3 2.2 1.63 6.6 6.43 2.9 2.58 15.2 33.925 9.7 17.1 36.2 59.5 36.3 64.8 52.1 120 5.3 5.68 21.9 56.226 177.1 568 8.0 11.9 7.1 8.82 88.5 249 6.4 7.43 26.7 77.027 78.4 310 9.7 15.6 4.3 4.54 7.3 10.4 2.6 2.17 17.2 39.428 37.4 90.5 7.2 10.1 2.6 2.26 22.7 49.3 26.8 45.0 34.4 11829 10.1 17.9 8.2 11.7 2.5 2.14 4.0 4.37 26.3 58.5 18.9 47.830 7.1 10.6 4.5 5.22 2.2 1.63 2.7 2.41 151.4 366 53.1 19531 7.0 10.4 4.1 4.42 4.7 4.46 24.8 68.7
Total 10668 2997 427 789 1476 46099
1.9 Promedio Anual: 137.0904.5 Máxima Instantánea 1666.4
MARZO
Concentración de Sedimentos Suspendidos (mg/l) Mínimo Diario: Máximo Diario:
AGOSTO SEPTIEMBRE OCTUBRE NOVIEMBRE
Producción Anual
JULIO
DIA ENERO FEBRERO
Total Anual: 576 t/año/km²77793 t/año
DICIEMBRE
JUNIO ABRIL MAYO
DIA
ESTACION CANDELARIA EN EL RIO PEQUENIConcentraciones de Sedimentos Suspendidos (mg/l) y Caudales Sólidos Promedios Diarios (t/d)
LATITUD 9º 22' 58'' N LONGITUD 79º 30' 59'' O Área de Drenaje:
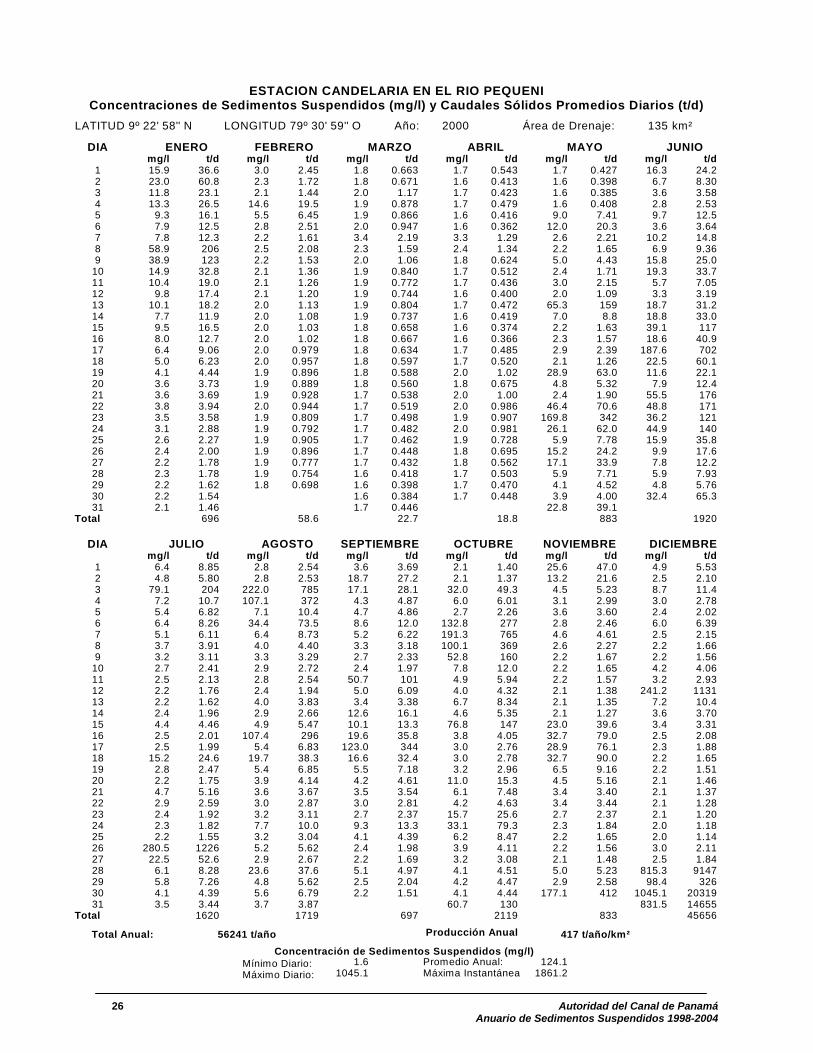
Año: 2000 135 km²
mg/l t/d mg/l t/d mg/l t/d mg/l t/d mg/l t/d mg/l t/d1 15.9 36.6 3.0 2.45 1.8 0.663 1.7 0.543 1.7 0.427 16.3 24.22 23.0 60.8 2.3 1.72 1.8 0.671 1.6 0.413 1.6 0.398 6.7 8.303 11.8 23.1 2.1 1.44 2.0 1.17 1.7 0.423 1.6 0.385 3.6 3.584 13.3 26.5 14.6 19.5 1.9 0.878 1.7 0.479 1.6 0.408 2.8 2.535 9.3 16.1 5.5 6.45 1.9 0.866 1.6 0.416 9.0 7.41 9.7 12.56 7.9 12.5 2.8 2.51 2.0 0.947 1.6 0.362 12.0 20.3 3.6 3.647 7.8 12.3 2.2 1.61 3.4 2.19 3.3 1.29 2.6 2.21 10.2 14.88 58.9 206 2.5 2.08 2.3 1.59 2.4 1.34 2.2 1.65 6.9 9.369 38.9 123 2.2 1.53 2.0 1.06 1.8 0.624 5.0 4.43 15.8 25.0
10 14.9 32.8 2.1 1.36 1.9 0.840 1.7 0.512 2.4 1.71 19.3 33.711 10.4 19.0 2.1 1.26 1.9 0.772 1.7 0.436 3.0 2.15 5.7 7.0512 9.8 17.4 2.1 1.20 1.9 0.744 1.6 0.400 2.0 1.09 3.3 3.1913 10.1 18.2 2.0 1.13 1.9 0.804 1.7 0.472 65.3 159 18.7 31.214 7.7 11.9 2.0 1.08 1.9 0.737 1.6 0.419 7.0 8.8 18.8 33.015 9.5 16.5 2.0 1.03 1.8 0.658 1.6 0.374 2.2 1.63 39.1 11716 8.0 12.7 2.0 1.02 1.8 0.667 1.6 0.366 2.3 1.57 18.6 40.917 6.4 9.06 2.0 0.979 1.8 0.634 1.7 0.485 2.9 2.39 187.6 70218 5.0 6.23 2.0 0.957 1.8 0.597 1.7 0.520 2.1 1.26 22.5 60.119 4.1 4.44 1.9 0.896 1.8 0.588 2.0 1.02 28.9 63.0 11.6 22.120 3.6 3.73 1.9 0.889 1.8 0.560 1.8 0.675 4.8 5.32 7.9 12.421 3.6 3.69 1.9 0.928 1.7 0.538 2.0 1.00 2.4 1.90 55.5 17622 3.8 3.94 2.0 0.944 1.7 0.519 2.0 0.986 46.4 70.6 48.8 17123 3.5 3.58 1.9 0.809 1.7 0.498 1.9 0.907 169.8 342 36.2 12124 3.1 2.88 1.9 0.792 1.7 0.482 2.0 0.981 26.1 62.0 44.9 14025 2.6 2.27 1.9 0.905 1.7 0.462 1.9 0.728 5.9 7.78 15.9 35.826 2.4 2.00 1.9 0.896 1.7 0.448 1.8 0.695 15.2 24.2 9.9 17.627 2.2 1.78 1.9 0.777 1.7 0.432 1.8 0.562 17.1 33.9 7.8 12.228 2.3 1.78 1.9 0.754 1.6 0.418 1.7 0.503 5.9 7.71 5.9 7.9329 2.2 1.62 1.8 0.698 1.6 0.398 1.7 0.470 4.1 4.52 4.8 5.7630 2.2 1.54 1.6 0.384 1.7 0.448 3.9 4.00 32.4 65.331 2.1 1.46 1.7 0.446 22.8 39.1
Total 696 58.6 22.7 18.8 883 1920
mg/l t/d mg/l t/d mg/l t/d mg/l t/d mg/l t/d mg/l t/d1 6.4 8.85 2.8 2.54 3.6 3.69 2.1 1.40 25.6 47.0 4.9 5.532 4.8 5.80 2.8 2.53 18.7 27.2 2.1 1.37 13.2 21.6 2.5 2.103 79.1 204 222.0 785 17.1 28.1 32.0 49.3 4.5 5.23 8.7 11.44 7.2 10.7 107.1 372 4.3 4.87 6.0 6.01 3.1 2.99 3.0 2.785 5.4 6.82 7.1 10.4 4.7 4.86 2.7 2.26 3.6 3.60 2.4 2.026 6.4 8.26 34.4 73.5 8.6 12.0 132.8 277 2.8 2.46 6.0 6.397 5.1 6.11 6.4 8.73 5.2 6.22 191.3 765 4.6 4.61 2.5 2.158 3.7 3.91 4.0 4.40 3.3 3.18 100.1 369 2.6 2.27 2.2 1.669 3.2 3.11 3.3 3.29 2.7 2.33 52.8 160 2.2 1.67 2.2 1.56
10 2.7 2.41 2.9 2.72 2.4 1.97 7.8 12.0 2.2 1.65 4.2 4.0611 2.5 2.13 2.8 2.54 50.7 101 4.9 5.94 2.2 1.57 3.2 2.9312 2.2 1.76 2.4 1.94 5.0 6.09 4.0 4.32 2.1 1.38 241.2 113113 2.2 1.62 4.0 3.83 3.4 3.38 6.7 8.34 2.1 1.35 7.2 10.414 2.4 1.96 2.9 2.66 12.6 16.1 4.6 5.35 2.1 1.27 3.6 3.7015 4.4 4.46 4.9 5.47 10.1 13.3 76.8 147 23.0 39.6 3.4 3.3116 2.5 2.01 107.4 296 19.6 35.8 3.8 4.05 32.7 79.0 2.5 2.0817 2.5 1.99 5.4 6.83 123.0 344 3.0 2.76 28.9 76.1 2.3 1.8818 15.2 24.6 19.7 38.3 16.6 32.4 3.0 2.78 32.7 90.0 2.2 1.6519 2.8 2.47 5.4 6.85 5.5 7.18 3.2 2.96 6.5 9.16 2.2 1.5120 2.2 1.75 3.9 4.14 4.2 4.61 11.0 15.3 4.5 5.16 2.1 1.4621 4.7 5.16 3.6 3.67 3.5 3.54 6.1 7.48 3.4 3.40 2.1 1.3722 2.9 2.59 3.0 2.87 3.0 2.81 4.2 4.63 3.4 3.44 2.1 1.2823 2.4 1.92 3.2 3.11 2.7 2.37 15.7 25.6 2.7 2.37 2.1 1.2024 2.3 1.82 7.7 10.0 9.3 13.3 33.1 79.3 2.3 1.84 2.0 1.1825 2.2 1.55 3.2 3.04 4.1 4.39 6.2 8.47 2.2 1.65 2.0 1.1426 280.5 1226 5.2 5.62 2.4 1.98 3.9 4.11 2.2 1.56 3.0 2.1127 22.5 52.6 2.9 2.67 2.2 1.69 3.2 3.08 2.1 1.48 2.5 1.8428 6.1 8.28 23.6 37.6 5.1 4.97 4.1 4.51 5.0 5.23 815.3 914729 5.8 7.26 4.8 5.62 2.5 2.04 4.2 4.47 2.9 2.58 98.4 32630 4.1 4.39 5.6 6.79 2.2 1.51 4.1 4.44 177.1 412 1045.1 2031931 3.5 3.44 3.7 3.87 60.7 130 831.5 14655
Total 1620 1719 697 2119 833 45656
1.6 Promedio Anual: 124.11045.1 Máxima Instantánea 1861.2
ESTACION CANDELARIA EN EL RIO PEQUENI
Área de Drenaje:
Producción Anual 417 t/año/km²56241 t/año
DIA
Concentraciones de Sedimentos Suspendidos (mg/l) y Caudales Sólidos Promedios Diarios (t/d)LATITUD 9º 22' 58'' N LONGITUD 79º 30' 59'' O
DIA FEBRERO MARZO ABRIL MAYO JUNIO ENERO
AGOSTO SEPTIEMBRE NOVIEMBRE
Máximo Diario:
Concentración de Sedimentos Suspendidos (mg/l) Mínimo Diario:
DICIEMBRE JULIO OCTUBRE
Total Anual:
26 Autoridad del Canal de Panamá Anuario de Sedimentos Suspendidos 1998-2004
Autoridad del Canal de Panamá 27 Anuario de Sedimentos Suspendidos 1998-2004
Año: 2001 135 km²
mg/l t/d mg/l t/d mg/l t/d mg/l t/d mg/l t/d mg/l t/d1 74.2 384 2.0 1.04 1.7 0.470 1.6 0.329 1.8 0.721 1.9 0.7412 29.5 93.9 2.0 1.03 1.7 0.451 1.5 0.310 1.7 0.545 3.4 1.903 16.5 38.8 2.0 0.990 1.7 0.433 1.5 0.297 1.7 0.437 2.8 1.344 11.1 20.9 1.9 0.934 1.7 0.432 1.5 0.299 14.4 13.5 167.5 3935 8.3 13.5 1.9 0.902 1.7 0.432 1.5 0.300 1.9 0.901 18.7 30.06 6.6 9.35 1.9 0.852 1.8 0.586 1.5 0.284 1.9 0.733 2.1 1.217 5.5 7.10 1.9 0.866 1.9 0.782 1.6 0.379 1.7 0.511 1.9 0.8888 5.9 7.79 1.9 0.858 1.8 0.567 1.6 0.398 1.7 0.434 1.9 0.9239 4.6 5.38 1.9 0.865 1.9 0.889 1.7 0.431 1.7 0.432 1.9 0.778
10 3.6 3.73 1.9 0.858 1.8 0.684 1.6 0.368 1.6 0.397 10.9 11.011 3.3 3.28 1.9 0.767 1.7 0.508 1.6 0.361 1.6 0.355 75.3 15312 3.1 3.00 1.9 0.767 1.7 0.467 1.6 0.352 1.9 0.739 2.2 1.4713 2.8 2.48 1.9 0.750 1.6 0.420 1.6 0.410 2.1 1.07 33.2 56.414 3.5 3.41 1.9 0.745 1.6 0.402 1.7 0.522 2.0 0.916 10.8 13.015 2.5 2.17 1.9 0.835 1.6 0.368 1.7 0.466 69.5 102 2.5 1.9616 2.3 1.79 1.9 0.747 1.6 0.353 1.6 0.390 5.4 4.99 2.1 1.3317 2.2 1.75 1.8 0.674 1.6 0.344 1.8 0.549 1.9 0.853 2.0 1.1918 2.3 1.85 1.8 0.664 1.6 0.322 2.2 1.14 1.8 0.662 2.3 1.6819 18.9 25.7 1.8 0.664 1.5 0.308 1.9 0.824 2.0 0.889 2.1 1.2020 2.8 2.49 1.8 0.628 1.5 0.296 1.8 0.590 59.5 81.2 2.0 1.0421 2.4 1.91 1.8 0.577 1.5 0.293 1.7 0.534 2.4 1.55 36.5 55.522 2.4 1.90 1.8 0.576 1.9 0.796 1.7 0.470 2.1 0.992 2.1 1.4423 3.5 3.02 1.7 0.556 1.6 0.380 1.6 0.391 2.0 0.986 2.0 1.1324 2.7 2.24 1.7 0.534 1.7 0.433 1.6 0.343 1.9 0.738 2.1 1.2425 2.2 1.63 1.7 0.516 1.6 0.399 1.5 0.307 1.8 0.626 2.0 1.0626 2.2 1.65 1.7 0.502 1.8 0.630 1.6 0.336 2.1 0.943 2.0 0.95727 2.1 1.38 1.7 0.502 1.8 0.557 1.6 0.413 1.9 0.777 1.9 0.88128 2.1 1.26 1.7 0.484 1.7 0.437 1.7 0.434 1.8 0.615 1.9 0.83329 2.1 1.23 1.6 0.390 1.8 0.649 1.7 0.557 1.9 0.80130 2.0 1.16 1.6 0.340 1.9 0.906 1.7 0.509 4.9 3.8331 2.0 1.10 1.6 0.329 1.8 0.572
Total 651 20.7 14.5 13.8 221 742
mg/l t/d mg/l t/d mg/l t/d mg/l t/d mg/l t/d mg/l t/d1 2.0 0.949 8.3 11.1 2.3 1.78 2.2 1.57 2.0 0.966 6.2 8.472 1.9 0.812 82.6 171 4.0 3.59 2.1 1.31 1.9 0.885 5.1 6.263 1.9 0.786 12.9 21.2 2.4 1.86 17.2 27.3 1.9 0.833 4.3 4.784 1.8 0.725 3.9 4.24 49.9 82.4 83.7 190 1.9 0.811 38.3 94.45 1.9 0.760 2.8 2.52 38.1 90.7 5.2 6.30 1.9 0.828 13.4 26.06 1.9 0.857 2.3 1.88 4.0 4.28 2.6 2.23 1.9 0.828 8.3 13.47 1.9 0.792 4.7 4.87 4.5 4.68 12.2 15.9 43.3 54.4 176.3 4478 3.3 2.11 2.4 1.91 110.4 274 2.9 2.69 2.9 2.12 33.0 79.79 4.0 3.05 2.2 1.57 7.7 10.9 2.8 2.43 2.0 1.01 614.1 2889
10 14.1 18.1 2.1 1.46 3.4 3.33 2.7 2.32 2.3 1.26 511.6 343211 6.4 5.79 2.1 1.33 101.2 244 2.2 1.61 2.4 1.66 148.9 88612 18.9 24.0 2.1 1.23 10.7 17.7 2.1 1.44 2.0 1.02 24.7 71.713 2.3 1.63 2.1 1.20 196.7 644 2.1 1.36 4.4 3.61 15.6 35.714 2.0 1.18 12.4 14.9 9.4 15.7 2.2 1.66 37.5 49.5 265.5 116315 2.0 1.09 24.5 37.9 4.9 5.95 14.6 15.6 6.9 7.57 19.3 48.816 14.3 13.4 2.4 1.88 3.7 3.81 7.3 8.06 2.3 1.66 11.3 21.517 2.1 1.22 2.1 1.36 3.0 2.83 2.2 1.58 102.8 193 8.8 14.818 674.5 5700 91.1 225 10.2 13.3 2.1 1.26 9.1 14.2 28.2 65.319 7.5 10.9 3.8 3.91 3.2 3.00 12.2 11.8 179.9 846 11.0 19.820 3.0 2.83 2.2 1.73 5.7 5.92 2.4 1.74 17.6 40.6 11.4 19.921 2.5 2.09 18.1 30.3 2.3 1.87 2.1 1.24 119.7 309 34.5 96.922 2.2 1.61 3.3 3.16 6.6 8.24 2.0 1.13 67.7 275 12.9 25.623 2.1 1.41 2.2 1.69 2.6 2.22 12.8 12.0 102.9 333 649.0 615524 3.3 2.67 2.1 1.47 12.1 14.3 12.2 12.1 11.4 21.6 25.2 73.025 16.0 21.2 2.1 1.33 3.1 2.84 2.1 1.27 6.5 9.27 14.0 30.226 261.0 881 2.1 1.22 2.6 2.23 25.1 33.4 1227.5 13288 11.0 20.627 4.7 5.41 15.8 15.8 2.5 1.96 2.3 1.60 27.1 82.0 9.9 17.528 2.8 2.47 123.9 396 2.1 1.46 2.5 1.78 14.6 31.9 10.1 17.529 2.5 2.13 8.7 13.1 10.9 12.3 2.1 1.31 10.7 19.9 9.7 16.230 86.3 200 3.4 3.42 3.5 3.20 2.0 1.07 8.0 12.7 9.1 15.131 6.5 8.39 3.6 3.46 2.0 1.01 7.3 11.0
Total 6920 983 1484 366 15605 15826
1.5 Promedio Anual: 114.01227.5 Máxima Instantánea 2082.0
MAYO JUNIO
OCTUBRE NOVIEMBRE DICIEMBRE
DIA FEBRERO MARZO ABRIL ENERO
Máximo Diario:
DIA JULIO AGOSTO
Concentración de Sedimentos Suspendidos (mg/l) Mínimo Diario:
SEPTIEMBRE
Producción Anual
ESTACION CANDELARIA EN EL RIO PEQUENI
Área de Drenaje:
Total Anual: 317 t/año/km²42847 t/año
Concentraciones de Sedimentos Suspendidos (mg/l) y Caudales Sólidos Promedios Diarios (t/d)LATITUD 9º 22' 58'' N LONGITUD 79º 30' 59'' O

Año: 2002 135 km²
mg/l t/d mg/l t/d mg/l t/d mg/l t/d mg/l t/d mg/l t/d1 7.0 10.3 2.0 1.10 1.7 0.464 1.9 0.801 4.3 4.95 2.2 1.482 6.0 8.02 2.0 1.10 1.7 0.437 1.9 0.740 3.6 3.69 2.1 1.293 4.6 5.34 2.2 1.48 1.7 0.429 1.9 0.809 3.3 3.21 2.1 1.374 5.8 7.43 2.0 1.15 1.7 0.437 2.0 1.00 2.7 2.32 5.8 5.505 4.0 4.41 2.0 1.01 1.7 0.436 2.0 0.975 2.6 2.29 2.4 1.776 3.5 3.54 2.0 0.968 1.6 0.407 1.9 0.728 2.7 2.40 2.2 1.397 17.1 28.9 1.9 0.863 1.6 0.412 1.8 0.667 3.1 2.90 5.8 5.748 19.3 38.2 1.9 0.826 1.7 0.434 1.8 0.642 3.2 3.05 2.4 1.819 11.4 20.1 1.9 0.806 1.7 0.468 1.8 0.644 4.1 4.38 6.2 5.58
10 5.0 6.15 1.9 0.789 1.7 0.441 1.8 0.591 3.0 2.86 2.9 2.5211 3.8 4.04 1.9 0.769 1.6 0.401 2.0 0.974 2.8 2.47 2.1 1.4512 3.3 3.27 1.9 0.759 1.6 0.407 1.8 0.617 2.4 1.95 6.9 5.7613 3.0 2.74 1.8 0.719 1.6 0.360 1.8 0.625 2.2 1.68 2.1 1.3014 2.7 2.38 1.9 0.760 1.6 0.376 1.7 0.553 2.2 1.56 2.3 1.4515 2.5 2.12 1.8 0.696 1.6 0.368 1.7 0.502 2.1 1.47 2.0 1.1216 2.3 1.89 1.8 0.656 1.6 0.373 1.7 0.484 23.3 29.7 2.0 1.0217 2.2 1.77 1.8 0.664 1.7 0.534 2.0 0.989 6.3 8.21 18.1 23.918 2.2 1.65 1.8 0.634 1.8 0.584 2.2 1.41 35.5 74.9 2.2 1.5619 2.2 1.53 1.8 0.709 5.6 4.94 887.7 8879 5.0 6.05 2.0 1.1720 2.1 1.46 1.8 0.638 1.8 0.658 5.6 7.23 7.7 9.65 2.1 1.1821 2.1 1.43 1.8 0.585 76.8 177 10.4 17.0 20.4 31.9 2.1 1.2022 2.1 1.34 1.7 0.556 330.0 1520 15.5 29.0 24.2 44.5 2.7 2.0923 2.1 1.26 1.7 0.539 29.6 63.0 7.7 11.9 6.7 8.92 2.2 1.6224 2.1 1.24 1.7 0.539 6.1 8.19 10.9 20.1 3.5 3.58 12.8 18.025 2.1 1.21 1.7 0.522 2.5 2.10 21.9 56.7 11.0 15.2 2.5 2.0826 2.0 1.15 1.7 0.514 2.1 1.37 192.1 787 4.0 4.20 2.2 1.5227 2.0 1.11 1.7 0.484 2.0 1.13 96.8 478 3.2 3.05 2.4 1.8828 2.0 1.06 1.7 0.496 2.0 0.977 16.9 39.6 2.3 1.87 2.1 1.3429 2.0 1.03 1.9 0.862 8.8 14.7 2.2 1.61 2.8 2.0730 2.0 1.07 1.9 0.806 5.7 7.53 2.1 1.49 22.0 29.131 2.0 1.16 1.9 0.779 2.4 1.70
Total 168 21.3 1790 10361 288 129
mg/l t/d mg/l t/d mg/l t/d mg/l t/d mg/l t/d mg/l t/d1 7.3 9.33 595.9 2624 3.8 4.06 46.0 80.3 3.8 3.95 75.4 3862 7.2 8.38 14.8 30.6 9.4 13.4 10.8 15.6 2.7 2.35 42.8 1683 2.5 2.15 7.0 10.2 14.9 22.1 3.1 2.95 2.5 2.09 30.2 98.14 2.2 1.67 673.1 3419 17.3 29.4 91.3 272 2.5 2.11 19.7 51.35 23.8 36.5 21.3 53.7 7.5 11.0 4.8 5.65 57.7 110 14.7 32.56 3.8 3.98 11.2 21.0 4.4 5.04 8.3 9.03 5.1 5.83 11.7 23.07 5.6 6.14 7.0 10.3 3.1 2.94 14.5 27.5 5.5 6.08 10.0 17.98 5.4 6.42 6.4 8.97 2.6 2.26 15.3 25.9 3.2 3.08 7.5 11.69 3.0 2.72 5.1 6.30 2.4 2.00 6.5 8.56 2.4 1.97 5.9 7.98
10 2.3 1.88 4.1 4.46 3.6 3.49 14.5 25.2 2.2 1.71 5.0 6.1211 33.9 79.6 3.5 3.55 4.0 3.88 5.2 6.36 2.6 2.08 4.3 4.8012 6.7 9.54 3.2 3.06 2.8 2.48 3.6 3.78 2.2 1.65 4.2 4.6013 4.8 5.61 3.0 2.75 2.3 1.76 3.8 3.77 130.3 389 4.1 4.5014 3.4 3.34 2.5 2.16 2.2 1.56 9.1 11.6 21.2 49.5 3.6 3.7715 645.5 4855 2.4 2.03 2.2 1.64 11.0 15.3 7.1 10.2 3.5 3.6216 93.7 386 2.3 1.80 19.5 29.6 7.8 11.6 4.4 4.96 3.2 3.0617 23.4 62.2 2.2 1.68 4.9 5.57 5.2 6.37 4.6 5.19 2.7 2.4118 246.9 1530 2.2 1.58 2.7 2.38 4.2 4.60 7.1 8.85 2.4 2.0319 38.4 119 60.0 100 2.3 1.83 3.2 3.10 7.4 10.7 2.3 1.8520 12.6 25.3 7.7 9.17 8.9 10.1 3.3 3.22 3.4 3.44 2.2 1.6821 7.6 11.7 2.2 1.73 5.8 6.09 6.3 7.38 2.8 2.56 2.8 2.3822 5.5 7.06 2.2 1.61 33.5 56.4 15.9 31.2 14.0 15.8 2.2 1.5723 4.4 5.06 59.3 111 12.0 19.0 4.8 5.69 777.1 10904 2.1 1.4924 3.7 3.77 2.9 2.59 3.2 3.11 14.4 24.0 36.2 127 2.1 1.3925 3.4 3.31 6.3 6.72 2.3 1.81 4.9 5.87 15.6 35.5 2.1 1.2926 23.9 40.1 340.7 865 2.5 1.96 17.3 26.9 10.3 18.6 2.1 1.2327 3.2 3.12 30.3 80.2 3.3 3.01 6.2 7.87 7.8 12.3 2.1 1.2028 4.2 4.15 15.7 31.4 5.1 5.15 4.4 4.86 7.4 11.3 2.1 1.3329 5.9 6.32 9.3 14.4 2.3 1.86 5.2 6.18 94.1 352 2.2 1.5130 2.9 2.60 4.6 5.41 19.4 25.0 3.3 3.23 1853.6 47492 2.1 1.1931 13.7 18.7 7.9 10.1 18.5 27.3 2.0 1.08
Total 7260 7447 280 693 59596 851
1.6 Promedio Anual: 193.91853.6 Máxima Instantánea 2883.5
DICIEMBRE
DIA FEBRERO
Producción AnualTotal Anual:
ENERO
Concentración de Sedimentos Suspendidos (mg/l)
MAYO JUNIO
DIA AGOSTO SEPTIEMBRE NOVIEMBRE JULIO OCTUBRE
MARZO ABRIL
ESTACION CANDELARIA EN EL RIO PEQUENI
Área de Drenaje:
Concentraciones de Sedimentos Suspendidos (mg/l) y Caudales Sólidos Promedios Diarios (t/d)LATITUD 9º 22' 58'' N LONGITUD 79º 30' 59'' O
Mínimo Diario: Máximo Diario:
658 t/año/km²88883 t/año
28 Autoridad del Canal de Panamá Anuario de Sedimentos Suspendidos 1998-2004

Autoridad del Canal de Panamá 29 Anuario de Sedimentos Suspendidos 1998-2004
Año: 2003 135 km²
mg/l t/d mg/l t/d mg/l t/d mg/l t/d mg/l t/d mg/l t/d1 2.0 1.02 1.7 0.459 1.5 0.292 1.4 0.181 1.5 0.301 9.8 11.12 2.0 0.975 1.7 0.436 1.5 0.280 1.4 0.194 1.5 0.277 12.6 17.63 1.9 0.920 1.7 0.428 1.5 0.284 1.4 0.184 1.5 0.258 5.0 5.994 1.9 0.866 1.7 0.422 1.5 0.281 1.4 0.186 1.5 0.264 2.4 1.985 1.9 0.890 1.6 0.419 1.5 0.264 1.4 0.172 12.6 10.0 2.1 1.376 1.9 0.845 1.6 0.413 1.5 0.262 1.4 0.171 2.2 1.15 2.2 1.437 1.9 0.805 1.6 0.401 1.5 0.253 1.4 0.171 33.3 69.0 3.1 2.418 1.9 0.753 1.6 0.414 1.5 0.252 1.4 0.174 6.3 7.48 2.1 1.209 1.9 0.745 1.7 0.448 1.5 0.245 1.4 0.179 2.0 1.17 28.8 42.7
10 1.9 0.770 1.9 0.784 1.5 0.238 1.4 0.218 1.9 0.803 3.1 2.8111 1.9 0.822 1.9 0.859 1.5 0.229 1.4 0.169 13.1 11.5 18.0 18.612 2.0 1.02 1.9 0.747 1.5 0.229 1.3 0.154 2.1 1.18 9.5 13.813 1.9 0.822 1.7 0.531 1.5 0.240 1.4 0.163 2.0 1.01 4.9 5.6814 1.9 0.793 1.7 0.464 1.4 0.225 46.3 66.4 1.9 0.858 4.9 5.2115 1.9 0.727 1.6 0.418 1.4 0.223 7.1 6.80 9.7 9.33 3.8 3.9216 1.8 0.671 1.6 0.396 1.4 0.223 1.7 0.494 2.1 1.25 6.2 6.4717 1.8 0.637 1.6 0.374 1.5 0.304 1.5 0.310 1.9 0.898 42.9 83.018 1.8 0.607 1.6 0.363 1.4 0.218 1.5 0.255 46.6 70.8 6.5 8.7319 1.8 0.593 1.6 0.345 1.4 0.216 1.4 0.225 3.2 2.85 3.6 3.5920 1.8 0.649 1.6 0.339 1.4 0.209 1.4 0.206 2.1 1.26 2.3 1.8321 1.8 0.684 1.6 0.338 1.4 0.211 14.9 21.4 2.0 1.06 3.0 2.5222 1.8 0.607 1.6 0.322 1.4 0.204 2.4 1.63 1.9 0.910 2.2 1.5223 1.7 0.556 1.5 0.309 1.4 0.196 1.7 0.530 2.0 0.972 59.1 99.224 1.8 0.584 1.5 0.306 1.4 0.193 1.6 0.372 1.9 0.791 3.0 2.7025 1.8 0.624 1.5 0.301 1.4 0.185 1.5 0.313 1.9 0.862 2.1 1.4826 1.7 0.525 1.5 0.292 1.4 0.181 1.6 0.358 67.6 78.4 2.1 1.4227 1.7 0.525 1.5 0.284 1.4 0.177 1.6 0.325 9.9 10.7 2.1 1.3128 1.7 0.505 1.5 0.283 1.4 0.175 1.5 0.268 2.8 1.84 4.8 3.9129 1.7 0.473 1.4 0.171 1.8 0.631 19.8 22.0 2.3 1.7230 1.7 0.456 1.4 0.171 1.7 0.423 13.8 17.0 2.9 2.1431 1.7 0.449 1.4 0.171 3.2 2.92
Total 21.9 11.9 7.00 103 329 357
mg/l t/d mg/l t/d mg/l t/d mg/l t/d mg/l t/d mg/l t/d1 2.2 1.55 191.3 805 3.2 3.12 28.9 48.6 2.8 2.05 115.7 4452 2.1 1.20 23.9 42.3 2.3 1.83 3.6 3.68 2.3 1.65 64.5 2383 2.0 1.06 7.3 10.2 2.2 1.69 16.4 23.8 2.9 2.20 117.4 6304 2.0 1.04 3.3 3.22 23.0 33.3 5.6 7.08 2.1 1.42 25.8 76.85 2.0 0.966 2.5 2.07 9.4 12.5 4.1 4.45 2.1 1.32 16.2 37.76 2.2 1.29 28.8 50.6 2.9 2.58 14.3 22.4 34.3 58.3 26.1 72.87 2.2 1.33 21.8 32.4 2.4 1.90 4.2 4.66 8.8 13.5 683.0 93388 2.1 1.23 9.0 14.8 2.3 1.72 10.8 15.3 3.5 3.43 71.3 3639 4.8 3.73 4.2 4.62 3.1 2.80 17.9 28.4 2.3 1.88 58.7 250
10 12.2 13.2 17.5 25.5 2.2 1.70 13.7 24.2 17.3 23.0 28.6 90.311 2.1 1.35 4.4 5.03 3.9 3.50 4.7 5.52 3.5 3.38 21.7 58.912 37.3 59.5 3.1 2.89 12.6 14.8 5.3 6.35 9.6 12.3 20.2 51.913 2.4 1.78 480.3 2576 12.8 15.3 3.3 3.17 4.6 4.99 14.2 30.814 2.0 1.16 732.2 7916 3.3 3.02 32.9 50.6 13.5 19.4 11.5 22.215 2.1 1.19 199.9 999 84.8 202 4.5 5.06 3.1 2.82 11.6 22.316 2.1 1.18 17.0 39.8 8.8 13.1 39.5 66.9 2.2 1.63 12.8 25.017 2.0 1.03 10.1 18.2 3.8 4.01 4.8 5.58 64.2 117 8.1 13.018 1.9 0.909 7.5 11.5 2.6 2.19 4.6 4.89 116.0 457 7.2 10.719 1.9 0.885 14.5 26.5 2.2 1.69 42.9 66.9 7.3 10.6 11.7 21.620 1.9 0.812 7.3 11.0 24.6 35.0 3.2 3.00 10.1 14.2 113.2 48421 2.0 1.00 5.2 6.52 20.5 32.9 2.4 1.92 7.2 9.86 15.3 34.222 2.1 1.28 13.1 19.1 18.9 34.2 2.2 1.66 3.4 3.34 22.9 57.723 7.3 7.95 4.6 5.34 5.1 6.32 2.2 1.53 2.9 2.69 11.3 21.724 3.8 3.81 25.3 39.9 44.8 83.0 2.5 1.87 2.6 2.27 8.8 14.725 2.2 1.50 4.0 4.39 9.6 15.5 2.2 1.53 2.4 1.94 7.3 11.026 3.6 3.05 3.1 2.91 11.6 17.5 2.1 1.30 2.5 1.97 6.6 9.5227 2.2 1.57 4.5 5.00 5.3 6.42 2.1 1.32 87.9 275 5.8 7.7828 2.1 1.28 2.7 2.36 48.1 93.8 2.0 1.18 474.9 2591 11.9 21.329 2.1 1.22 26.1 38.5 5.8 7.37 2.1 1.29 413.0 3072 6.0 8.1530 3.3 2.74 3.3 3.16 4.6 5.02 59.6 84.5 24.6 71.1 6.6 9.4031 2.5 1.89 6.9 7.81 2.3 1.59 5.1 6.40
Total 124 12731 660 500 6783 12483
1.3 Promedio Anual: 90.9732.2 Máxima Instantánea 1369.8
ESTACION CANDELARIA EN EL RIO PEQUENI
Área de Drenaje:
Total Anual: Producción Anual
Máximo Diario:
34112 t/año 253 t/año/km²
JUNIO
AGOSTO SEPTIEMBRE
Concentración de Sedimentos Suspendidos (mg/l) Mínimo Diario:
DICIEMBRE
Concentraciones de Sedimentos Suspendidos (mg/l) y Caudales Sólidos Promedios Diarios (t/d)LATITUD 9º 22' 58'' N LONGITUD 79º 30' 59'' O
DIA ENERO FEBRERO MARZO
DIA JULIO
ABRIL MAYO
OCTUBRE NOVIEMBRE

Año: 2004 135 km²
mg/l t/d mg/l t/d mg/l t/d mg/l t/d mg/l t/d mg/l t/d1 4.4 5.11 1.9 0.776 1.6 0.403 1.5 0.291 422.9 2967 3.2 3.122 3.8 4.09 1.9 0.747 1.7 0.423 1.6 0.319 712.4 7271 2.7 2.343 3.7 3.90 1.8 0.709 1.7 0.454 1.6 0.334 26.9 81.1 3.1 2.824 3.2 3.04 1.8 0.721 1.7 0.510 1.5 0.297 22.2 57.0 4.6 5.245 2.9 2.61 1.8 0.685 1.7 0.454 1.6 0.351 21.2 55.2 3.3 3.206 2.6 2.25 1.8 0.657 1.6 0.416 1.6 0.366 23.5 62.4 2.5 2.137 2.4 2.00 1.8 0.654 1.6 0.391 1.6 0.398 11.9 23.5 3.2 3.048 2.4 1.97 1.8 0.628 1.7 0.437 1.6 0.405 10.4 19.0 2.2 1.699 2.4 1.97 1.8 0.620 1.6 0.403 1.6 0.346 7.5 11.4 5.4 5.78
10 2.2 1.66 1.8 0.592 1.6 0.373 1.6 0.314 10.1 16.6 4.0 3.9911 2.2 1.55 1.8 0.586 1.9 0.788 1.5 0.291 6.4 8.93 2.4 1.9812 2.2 1.52 1.7 0.558 1.9 0.723 1.5 0.271 4.9 6.01 4.6 4.5913 2.2 1.57 1.7 0.557 1.7 0.491 1.5 0.303 5.2 6.54 2.3 1.7514 2.2 1.49 1.7 0.553 1.7 0.432 1.5 0.300 4.1 4.50 2.2 1.5215 2.1 1.38 1.7 0.529 1.7 0.461 1.5 0.281 11.2 17.6 2.1 1.3816 2.1 1.30 1.7 0.515 1.7 0.453 1.5 0.273 6.5 8.90 2.1 1.3117 2.1 1.20 1.7 0.518 1.7 0.485 1.5 0.274 18.4 33.8 2.2 1.3818 2.0 1.14 1.8 0.665 1.7 0.551 1.5 0.247 18.9 33.6 54.0 13619 2.0 1.08 1.8 0.582 1.8 0.583 1.5 0.252 99.8 296 27.3 54.320 2.0 1.03 1.7 0.517 1.7 0.452 13.7 13.3 13.9 27.6 8.9 12.621 2.0 1.05 1.7 0.482 1.6 0.413 108.4 344 7.3 10.7 5.2 6.2022 2.7 2.00 2.0 0.978 1.6 0.389 2.5 1.78 6.2 8.39 3.2 3.1023 2.2 1.49 1.8 0.697 1.6 0.413 1.9 0.884 5.2 6.41 2.5 2.0924 2.1 1.40 1.7 0.503 1.7 0.460 183.5 433 5.9 7.67 4.7 4.6825 2.0 1.11 1.7 0.468 1.7 0.454 5.0 5.62 3.9 4.20 315.3 103826 2.0 1.00 1.7 0.441 1.6 0.393 2.2 1.64 34.0 75.6 6.8 9.7927 2.0 0.940 1.6 0.418 1.6 0.358 2.4 1.78 22.6 43.4 4.1 4.4628 1.9 0.899 1.6 0.417 1.6 0.339 2.0 1.10 288.3 1274 3.1 2.9529 1.9 0.871 1.6 0.412 1.6 0.330 2.4 1.63 10.1 17.6 7.2 9.0830 1.9 0.833 1.6 0.317 2.2 1.52 5.0 6.11 26.4 40.331 1.9 0.800 1.5 0.298 3.7 3.94
Total 54.2 17.2 13.8 813 12465 1371
mg/l t/d mg/l t/d mg/l t/d mg/l t/d mg/l t/d mg/l t/d1 3.3 3.30 2.8 2.25 2.6 2.23 3.1 2.91 2.5 2.03 4.5 5.142 2.7 2.32 9.3 10.3 3.0 2.67 2.4 1.91 36.7 61.6 4.5 5.283 2.5 2.12 2.7 2.22 2.7 2.31 5.5 6.34 14.8 26.1 4.2 4.604 11.1 14.6 65.2 130 5.5 5.41 28.7 71.3 26.5 53.0 3.4 3.315 4.6 5.18 5.0 5.84 7.4 8.59 5.0 6.01 11.9 19.0 993.3 105166 3.5 3.43 4.0 4.00 4.5 5.11 6.6 8.03 5.8 7.66 15.9 36.47 26.8 43.1 2.6 2.19 108.4 303 4.4 4.97 16.6 27.3 9.8 17.58 3.4 3.30 90.3 211 175.5 547 7.7 10.0 31.7 66.4 28.5 73.59 2.6 2.22 3.2 3.06 10.7 19.0 6.1 7.42 525.1 3196 20.3 48.0
10 4.0 4.17 69.8 144 6.4 8.94 5.2 5.98 47.8 190 8.8 14.711 2.4 2.02 44.4 90.0 4.3 4.87 67.5 140 18.6 44.0 6.8 9.8612 16.7 23.7 4.5 5.22 3.5 3.56 55.3 120 9.2 15.6 5.7 7.5013 3.5 3.43 3.0 2.83 4.0 4.12 14.0 23.8 6.8 9.79 6.7 9.3814 5.3 5.96 21.7 32.3 2.9 2.68 4.6 5.45 5.1 6.34 4.8 5.8015 3.0 2.81 3.8 3.91 8.2 10.2 31.6 54.5 4.3 4.81 4.6 5.4716 3.0 2.82 6.1 7.12 14.1 19.3 20.4 39.7 13.5 21.8 283.7 151517 2.7 2.38 18.9 35.4 18.4 30.2 7.3 10.8 5.3 6.65 8.3 13.218 42.7 68.6 4.0 4.28 4.0 4.29 35.1 71.1 82.1 322 5.3 6.7019 4.5 5.06 3.2 3.06 21.5 31.0 5.7 7.46 1422.7 41144 4.4 5.1320 2.7 2.32 5.5 6.58 3.2 3.07 4.8 5.54 1269.5 31238 3.9 4.2721 2.3 1.82 5.9 6.14 4.5 4.61 7.5 10.0 72.1 359 3.5 3.5722 2.4 1.88 98.9 317 2.8 2.46 4.1 4.44 26.1 77.4 3.7 3.8823 3.2 2.72 112.3 287 2.2 1.72 11.7 17.0 13.9 29.7 3.3 3.2124 2.2 1.63 7.0 10.1 2.2 1.64 4.0 4.38 10.6 19.5 2.8 2.5625 7.7 8.82 4.6 5.39 2.3 1.70 3.0 2.76 8.0 12.7 2.5 2.1726 2.3 1.76 3.9 4.19 23.0 31.9 16.0 20.9 37.5 111 2.3 1.8527 16.3 24.4 3.2 3.11 8.9 11.0 22.1 33.4 8.4 13.6 2.2 1.7228 2.9 2.68 5.1 6.11 25.1 41.9 3.6 3.65 6.5 9.17 2.2 1.6229 5.6 5.87 8.7 10.6 33.3 62.2 2.8 2.52 5.6 7.28 4.0 3.9430 2.4 1.89 4.9 5.49 5.4 6.77 2.6 2.18 5.0 6.23 2.9 2.5931 2.2 1.54 3.4 3.37 2.3 1.90 2.2 1.63
Total 258 1365 1183 707 77108 12336
1.5 Promedio Anual: 225.01422.7 Máxima Instantánea 2398.6
Concentración de Sedimentos Suspendidos (mg/l) Mínimo Diario: Máximo Diario:
DIA AGOSTO SEPTIEMBRE NOVIEMBRE
Total Anual: 798 t/año/km²
DIA FEBRERO MARZO ABRIL
ESTACION CANDELARIA EN EL RIO PEQUENI
Área de Drenaje:
Concentraciones de Sedimentos Suspendidos (mg/l) y Caudales Sólidos Promedios Diarios (t/d)LATITUD 9º 22' 58'' N LONGITUD 79º 30' 59'' O
MAYO JUNIO
DICIEMBRE
107691 t/año
JULIO OCTUBRE
ENERO
Producción Anual
30 Autoridad del Canal de Panamá Anuario de Sedimentos Suspendidos 1998-2004

Autoridad del Canal de Panamá 31 Anuario de Sedimentos Suspendidos 1998-2004

32 Autoridad del Canal de Panamá Anuario de Sedimentos Suspendidos 1998-2004

Estación Peluca en el Río Boquerón
LOCALIZACIÓN: La estación está a 400 m (0.25 mi) aguas abajo de su confluencia con la quebrada Peluca, en la provincia de Colón, distrito de Colón, en el poblado de Boquerón Arriba, frente a la escuela del mismo nombre. Sus coordenadas geográficas son: 9º 22’ 48” de latitud Norte y 79º 33’ 40” de longitud Oeste. CÓDIGO DE LA ESTACIÓN: 115-06-01 ÁREA DE DRENAJE: 91 km2 (35 mi2) PERIODO DE REGISTRO: Desde enero de 1981 hasta la fecha. VALORES EXTREMOS Y PROMEDIOS PARA EL AÑO 2004
Concentración (mg/l)
Año
Máxima Instantánea
Mínima Diaria
PromedioAnual
Rendimiento
líquido (l/s/km2)
Producción
anual de sedimentos (t/año/km2)
1998 1891.5 0.4 176.7 67.6 377 1999 1716.5 0.8 178.5 113.0 635 2000 1595.1 0.6 124.0 89.2 350 2001 1670.4 0.5 146.4 70.8 327 2002 1987.0 0.6 170.6 79.5 428 2003 1548.1 0.5 88.7 69.5 194 2004 1902.8 0.5 264.3 106.6 891
Autoridad del Canal de Panamá 33 Anuario de Sedimentos Suspendidos 1998-2004

Año: 1998 91 km²
mg/l t/d mg/l t/d mg/l t/d mg/l t/d mg/l t/d mg/l t/d1 0.8 0.105 0.5 0.053 0.4 0.025 0.4 0.020 1.7 0.379 2.1 0.5432 0.8 0.111 0.5 0.053 0.4 0.024 0.4 0.018 1.3 0.229 85.5 89.43 1.6 0.294 0.5 0.053 0.4 0.023 0.4 0.017 1.0 0.158 4.5 1.874 1.1 0.165 31.9 21.9 0.4 0.023 0.4 0.017 1.3 0.208 2.8 0.8545 0.8 0.104 2.0 0.395 0.5 0.028 0.4 0.016 1.1 0.174 2.1 0.5336 0.7 0.092 0.5 0.048 0.5 0.035 0.4 0.016 0.8 0.115 99.4 1237 0.7 0.090 0.5 0.044 0.5 0.035 0.4 0.015 1.0 0.154 8.9 5.508 0.7 0.082 0.5 0.043 0.5 0.031 0.4 0.015 2.7 0.806 3.6 1.329 12.9 4.86 0.5 0.041 0.4 0.025 0.4 0.016 1.2 0.205 2.7 0.834
10 1.2 0.215 0.5 0.031 0.4 0.024 0.4 0.016 0.8 0.107 6.9 3.4011 0.8 0.115 0.5 0.028 0.4 0.024 0.4 0.016 0.7 0.080 3.4 1.2112 0.8 0.109 0.5 0.027 0.4 0.022 0.4 0.016 0.7 0.085 5.8 2.6613 0.8 0.096 0.5 0.026 0.4 0.021 0.4 0.015 0.6 0.074 13.6 9.3314 0.7 0.092 0.5 0.026 0.4 0.021 0.4 0.014 0.6 0.065 4.0 1.5715 1.2 0.186 0.5 0.026 0.4 0.020 0.4 0.014 0.6 0.056 359.0 85716 0.9 0.130 0.5 0.026 0.4 0.021 0.4 0.015 0.9 0.099 10.4 7.4917 0.8 0.100 0.4 0.024 0.4 0.023 0.4 0.015 207.1 859 5.2 2.4318 0.7 0.088 0.4 0.022 0.4 0.021 0.4 0.016 24.0 30.2 4.0 1.5519 0.9 0.118 0.4 0.022 0.4 0.020 0.4 0.015 11.6 8.60 6.6 3.3320 0.8 0.114 0.4 0.021 0.4 0.019 0.4 0.013 5.9 2.97 4.8 2.1121 0.7 0.083 0.4 0.021 0.4 0.019 0.4 0.014 3.8 1.42 19.9 14.922 0.7 0.079 0.4 0.020 0.4 0.019 0.5 0.035 4.7 1.98 8.9 5.5823 0.6 0.074 0.4 0.019 0.4 0.018 3.3 0.750 3.0 1.00 4.9 2.2324 0.6 0.068 0.4 0.018 0.4 0.020 92.6 106 4.3 1.62 4.0 1.5725 0.6 0.073 0.4 0.018 1.0 0.119 833.9 7914 29.6 19.8 4.5 1.8826 0.6 0.070 0.4 0.018 1.1 0.166 29.0 32.9 10.6 6.73 3.1 1.0127 0.6 0.062 0.4 0.023 0.5 0.037 4.4 1.80 3.3 1.16 3.4 1.1728 0.6 0.062 0.5 0.027 0.5 0.033 50.4 48.4 2.5 0.723 3.7 1.3729 0.6 0.061 0.5 0.027 5.5 2.56 2.5 0.720 2.8 0.88630 0.6 0.061 0.4 0.024 2.5 0.720 18.4 9.66 2.5 0.69631 0.6 0.057 0.4 0.022 3.4 1.15
Total 8.01 23.0 0.990 8108 950 1147
mg/l t/d mg/l t/d mg/l t/d mg/l t/d mg/l t/d mg/l t/d1 2.2 0.582 6.5 3.60 4.9 2.20 5.6 2.76 9.8 4.93 2.8 0.7852 2.1 0.543 86.9 105 6.7 3.07 5.0 2.31 3.4 1.21 4.3 1.693 2.0 0.494 15.0 13.2 6.5 3.42 136.6 174 3.0 0.974 5.2 2.204 138.1 241 11.1 8.70 4.2 1.72 10.6 7.63 2.4 0.689 3.8 1.465 6.8 3.73 754.7 3902 3.6 1.33 6.7 3.63 2.4 0.684 4.2 1.626 5.5 2.62 27.6 40.0 3.4 1.22 5.2 2.46 2.0 0.504 15.0 9.667 3.6 1.30 16.4 16.2 37.7 25.2 66.8 74.6 5.0 1.77 13.2 9.018 5.1 2.28 7.9 4.89 67.9 78.6 51.2 61.4 8.0 3.44 5.4 2.609 3.3 1.17 5.8 2.95 7.6 4.44 19.5 22.1 2.6 0.769 7.3 3.96
10 4.6 1.79 4.8 2.18 5.1 2.38 9.6 6.82 8.4 4.45 5.9 2.9111 3.3 1.14 31.0 23.7 4.1 1.63 6.9 3.90 2.7 0.826 4.8 2.1212 2.6 0.748 7.9 4.70 4.5 1.83 6.1 3.19 4.7 2.05 3.5 1.2513 2.3 0.611 162.1 363 3.8 1.44 57.9 61.1 3.6 1.31 13.3 9.8814 2.1 0.520 9.9 7.14 3.2 1.10 8.5 5.36 2.4 0.675 6.9 3.8215 1.9 0.451 9.3 5.96 2.7 0.805 5.6 2.78 2.1 0.526 106.5 20816 2.0 0.487 9.2 5.84 2.4 0.689 6.2 3.06 1.8 0.396 39.9 69.317 1.9 0.452 7.0 3.78 2.4 0.667 15.0 9.53 7.3 2.99 57.7 86.518 4.5 1.54 5.0 2.29 39.8 32.0 9.7 6.12 12.7 8.03 19.4 21.619 11.9 6.85 4.9 2.18 5.4 2.40 4.2 1.70 10.1 5.14 14.7 13.720 1357.3 14946 11.3 6.55 13.8 8.12 8.5 4.39 3.8 1.44 559.8 135721 31.9 49.6 32.9 29.1 26.8 24.5 4.8 2.13 33.0 27.5 95.5 27922 21.0 24.8 49.3 49.8 37.3 46.5 19.4 17.6 5.0 2.27 33.6 55.923 31.3 43.2 9.6 6.68 108.2 165 13.5 11.9 3.5 1.25 29.0 43.824 26.7 34.8 5.8 2.95 12.0 9.21 7.1 4.07 2.7 0.837 23.8 31.425 23.2 28.6 5.1 2.40 109.7 155 5.1 2.36 2.9 0.911 21.3 26.226 13.0 11.4 8.5 4.57 18.8 17.5 4.2 1.73 2.4 0.669 21.4 26.427 10.7 8.24 14.3 9.58 116.4 170 3.7 1.39 2.1 0.517 20.7 24.928 11.0 8.56 12.9 9.17 12.4 10.2 3.4 1.18 1.8 0.434 20.5 24.529 8.6 5.74 75.6 106 10.7 7.44 3.1 1.05 3.1 0.857 66.1 12130 7.9 4.94 11.3 8.58 7.0 3.95 2.9 0.943 2.1 0.541 20.2 24.031 7.4 4.49 6.1 3.21 5.5 2.3 19.9 23.37
Total 15439 4756 783 505 78.6 2489
0.4 Promedio Anual: 176.71357.3 Máxima Instantánea 1891.5
OCTUBRE NOVIEMBRE DICIEMBRE
DIA FEBRERO MARZO ABRIL ENERO
DIA JULIO AGOSTO SEPTIEMBRE
34289 t/añoConcentración de Sedimentos Suspendidos (mg/l)
Mínimo Diario: Máximo Diario:
MAYO JUNIO
Producción Anual:
ESTACION PELUCA EN EL RIO BOQUERONConcentraciones de Sedimentos Suspendidos (mg/l) y Caudales Sólidos Promedios Diarios (t/d)
LATITUD 9º 22' 48'' N LONGITUD 79º 33' 40'' O Área de Drenaje:
Total Anual: 377 t/año/km²
34 Autoridad del Canal de Panamá Anuario de Sedimentos Suspendidos 1998-2004
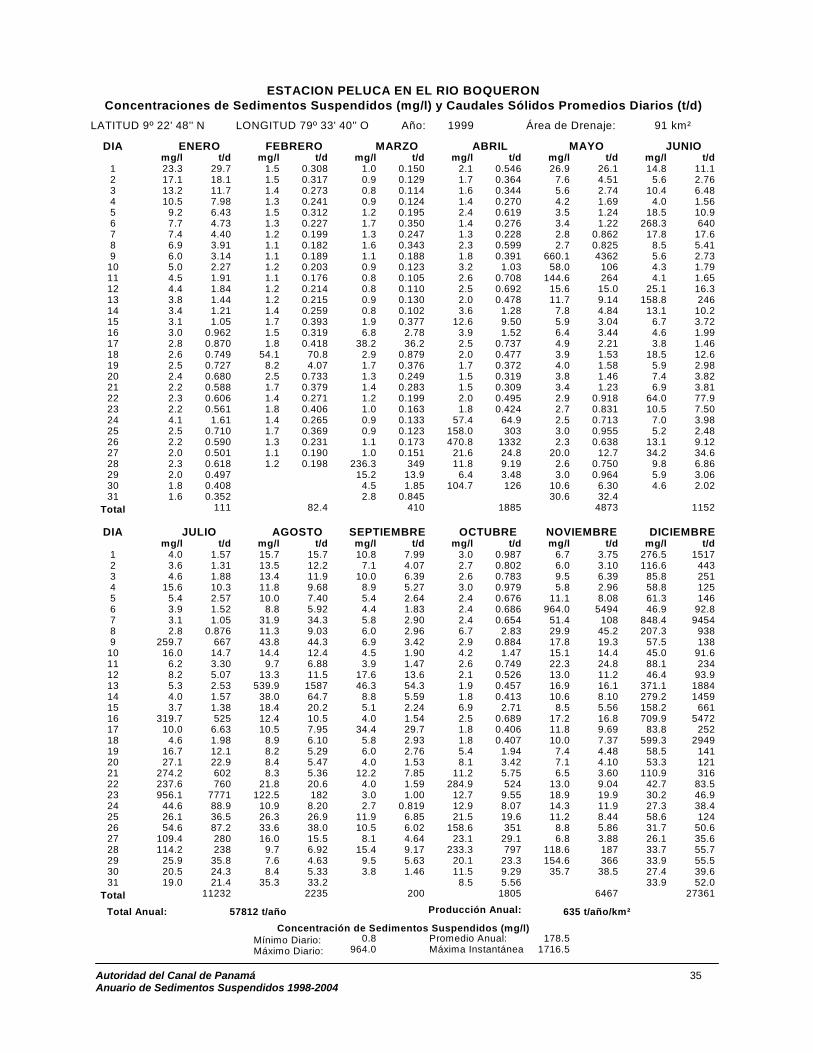
Año: 1999 91 km²
mg/l t/d mg/l t/d mg/l t/d mg/l t/d mg/l t/d mg/l t/d1 23.3 29.7 1.5 0.308 1.0 0.150 2.1 0.546 26.9 26.1 14.8 11.12 17.1 18.1 1.5 0.317 0.9 0.129 1.7 0.364 7.6 4.51 5.6 2.763 13.2 11.7 1.4 0.273 0.8 0.114 1.6 0.344 5.6 2.74 10.4 6.484 10.5 7.98 1.3 0.241 0.9 0.124 1.4 0.270 4.2 1.69 4.0 1.565 9.2 6.43 1.5 0.312 1.2 0.195 2.4 0.619 3.5 1.24 18.5 10.96 7.7 4.73 1.3 0.227 1.7 0.350 1.4 0.276 3.4 1.22 268.3 6407 7.4 4.40 1.2 0.199 1.3 0.247 1.3 0.228 2.8 0.862 17.8 17.68 6.9 3.91 1.1 0.182 1.6 0.343 2.3 0.599 2.7 0.825 8.5 5.419 6.0 3.14 1.1 0.189 1.1 0.188 1.8 0.391 660.1 4362 5.6 2.73
10 5.0 2.27 1.2 0.203 0.9 0.123 3.2 1.03 58.0 106 4.3 1.7911 4.5 1.91 1.1 0.176 0.8 0.105 2.6 0.708 144.6 264 4.1 1.6512 4.4 1.84 1.2 0.214 0.8 0.110 2.5 0.692 15.6 15.0 25.1 16.313 3.8 1.44 1.2 0.215 0.9 0.130 2.0 0.478 11.7 9.14 158.8 24614 3.4 1.21 1.4 0.259 0.8 0.102 3.6 1.28 7.8 4.84 13.1 10.215 3.1 1.05 1.7 0.393 1.9 0.377 12.6 9.50 5.9 3.04 6.7 3.7216 3.0 0.962 1.5 0.319 6.8 2.78 3.9 1.52 6.4 3.44 4.6 1.9917 2.8 0.870 1.8 0.418 38.2 36.2 2.5 0.737 4.9 2.21 3.8 1.4618 2.6 0.749 54.1 70.8 2.9 0.879 2.0 0.477 3.9 1.53 18.5 12.619 2.5 0.727 8.2 4.07 1.7 0.376 1.7 0.372 4.0 1.58 5.9 2.9820 2.4 0.680 2.5 0.733 1.3 0.249 1.5 0.319 3.8 1.46 7.4 3.8221 2.2 0.588 1.7 0.379 1.4 0.283 1.5 0.309 3.4 1.23 6.9 3.8122 2.3 0.606 1.4 0.271 1.2 0.199 2.0 0.495 2.9 0.918 64.0 77.923 2.2 0.561 1.8 0.406 1.0 0.163 1.8 0.424 2.7 0.831 10.5 7.5024 4.1 1.61 1.4 0.265 0.9 0.133 57.4 64.9 2.5 0.713 7.0 3.9825 2.5 0.710 1.7 0.369 0.9 0.123 158.0 303 3.0 0.955 5.2 2.4826 2.2 0.590 1.3 0.231 1.1 0.173 470.8 1332 2.3 0.638 13.1 9.1227 2.0 0.501 1.1 0.190 1.0 0.151 21.6 24.8 20.0 12.7 34.2 34.628 2.3 0.618 1.2 0.198 236.3 349 11.8 9.19 2.6 0.750 9.8 6.8629 2.0 0.497 15.2 13.9 6.4 3.48 3.0 0.964 5.9 3.0630 1.8 0.408 4.5 1.85 104.7 126 10.6 6.30 4.6 2.0231 1.6 0.352 2.8 0.845 30.6 32.4
Total 111 82.4 410 1885 4873 1152
mg/l t/d mg/l t/d mg/l t/d mg/l t/d mg/l t/d mg/l t/d1 4.0 1.57 15.7 15.7 10.8 7.99 3.0 0.987 6.7 3.75 276.5 15172 3.6 1.31 13.5 12.2 7.1 4.07 2.7 0.802 6.0 3.10 116.6 4433 4.6 1.88 13.4 11.9 10.0 6.39 2.6 0.783 9.5 6.39 85.8 2514 15.6 10.3 11.8 9.68 8.9 5.27 3.0 0.979 5.8 2.96 58.8 1255 5.4 2.57 10.0 7.40 5.4 2.64 2.4 0.676 11.1 8.08 61.3 1466 3.9 1.52 8.8 5.92 4.4 1.83 2.4 0.686 964.0 5494 46.9 92.87 3.1 1.05 31.9 34.3 5.8 2.90 2.4 0.654 51.4 108 848.4 94548 2.8 0.876 11.3 9.03 6.0 2.96 6.7 2.83 29.9 45.2 207.3 9389 259.7 667 43.8 44.3 6.9 3.42 2.9 0.884 17.8 19.3 57.5 138
10 16.0 14.7 14.4 12.4 4.5 1.90 4.2 1.47 15.1 14.4 45.0 91.611 6.2 3.30 9.7 6.88 3.9 1.47 2.6 0.749 22.3 24.8 88.1 23412 8.2 5.07 13.3 11.5 17.6 13.6 2.1 0.526 13.0 11.2 46.4 93.913 5.3 2.53 539.9 1587 46.3 54.3 1.9 0.457 16.9 16.1 371.1 188414 4.0 1.57 38.0 64.7 8.8 5.59 1.8 0.413 10.6 8.10 279.2 145915 3.7 1.38 18.4 20.2 5.1 2.24 6.9 2.71 8.5 5.56 158.2 66116 319.7 525 12.4 10.5 4.0 1.54 2.5 0.689 17.2 16.8 709.9 547217 10.0 6.63 10.5 7.95 34.4 29.7 1.8 0.406 11.8 9.69 83.8 25218 4.6 1.98 8.9 6.10 5.8 2.93 1.8 0.407 10.0 7.37 599.3 294919 16.7 12.1 8.2 5.29 6.0 2.76 5.4 1.94 7.4 4.48 58.5 14120 27.1 22.9 8.4 5.47 4.0 1.53 8.1 3.42 7.1 4.10 53.3 12121 274.2 602 8.3 5.36 12.2 7.85 11.2 5.75 6.5 3.60 110.9 31622 237.6 760 21.8 20.6 4.0 1.59 284.9 524 13.0 9.04 42.7 83.523 956.1 7771 122.5 182 3.0 1.00 12.7 9.55 18.9 19.9 30.2 46.924 44.6 88.9 10.9 8.20 2.7 0.819 12.9 8.07 14.3 11.9 27.3 38.425 26.1 36.5 26.3 26.9 11.9 6.85 21.5 19.6 11.2 8.44 58.6 12426 54.6 87.2 33.6 38.0 10.5 6.02 158.6 351 8.8 5.86 31.7 50.627 109.4 280 16.0 15.5 8.1 4.64 23.1 29.1 6.8 3.88 26.1 35.628 114.2 238 9.7 6.92 15.4 9.17 233.3 797 118.6 187 33.7 55.729 25.9 35.8 7.6 4.63 9.5 5.63 20.1 23.3 154.6 366 33.9 55.530 20.5 24.3 8.4 5.33 3.8 1.46 11.5 9.29 35.7 38.5 27.4 39.631 19.0 21.4 35.3 33.2 8.5 5.56 33.9 52.0
Total 11232 2235 200 1805 6467 27361
0.8 Promedio Anual: 178.5964.0 Máxima Instantánea 1716.5
ABRIL ENERO
Concentración de Sedimentos Suspendidos (mg/l) Mínimo Diario: Máximo Diario:
DIA JULIO AGOSTO SEPTIEMBRE OCTUBRE NOVIEMBRE DICIEMBRE
MAYO JUNIO
ESTACION PELUCA EN EL RIO BOQUERON
Área de Drenaje:
Concentraciones de Sedimentos Suspendidos (mg/l) y Caudales Sólidos Promedios Diarios (t/d)LATITUD 9º 22' 48'' N LONGITUD 79º 33' 40'' O
DIA FEBRERO MARZO
Total Anual: 635 t/año/km²57812 t/año Producción Anual:
Autoridad del Canal de Panamá 35 Anuario de Sedimentos Suspendidos 1998-2004

Año: 2000 91 km²
mg/l t/d mg/l t/d mg/l t/d mg/l t/d mg/l t/d mg/l t/d1 22.7 29.1 2.8 0.849 1.3 0.240 0.9 0.136 0.9 0.120 165.6 2612 37.1 59.6 2.1 0.540 1.3 0.254 0.7 0.080 0.8 0.104 21.5 21.53 19.6 22.7 2.0 0.499 3.3 1.10 0.7 0.085 0.7 0.096 9.2 6.204 15.7 15.7 12.0 6.39 2.8 0.885 0.8 0.114 0.8 0.105 7.7 4.725 14.2 13.3 5.7 2.73 2.6 0.743 0.7 0.086 19.1 11.8 9.9 7.096 12.5 10.7 6.3 3.28 3.0 0.967 0.6 0.069 17.4 17.5 16.2 14.17 11.8 9.68 3.3 1.14 4.0 1.35 17.5 4.70 8.0 4.99 53.1 82.88 72.2 147 4.1 1.58 4.5 1.81 5.2 1.85 4.8 2.14 16.7 16.79 54.1 97.0 3.0 0.949 2.4 0.676 1.6 0.335 4.9 2.01 16.3 14.8
10 20.5 24.2 2.4 0.680 1.8 0.416 1.3 0.232 3.2 1.05 11.8 9.4511 14.8 14.2 2.3 0.605 1.6 0.337 1.0 0.143 2.0 0.513 8.9 5.9012 13.4 11.9 2.2 0.575 1.5 0.301 0.9 0.122 1.7 0.378 6.6 3.6313 12.7 11.0 2.1 0.522 1.6 0.347 1.0 0.157 164.7 371 8.0 4.9014 10.5 8.01 2.0 0.506 1.4 0.277 1.0 0.140 28.5 32.0 77.0 92.915 15.7 15.1 1.9 0.462 1.2 0.220 0.9 0.132 5.5 2.61 78.0 16516 13.1 11.5 1.8 0.431 1.2 0.200 0.7 0.090 11.1 6.50 74.7 14317 11.1 8.72 1.9 0.439 1.1 0.177 0.8 0.107 32.3 29.0 82.3 16918 8.7 5.77 1.8 0.426 1.0 0.160 29.7 13.5 4.6 1.94 34.0 55.419 7.3 4.30 1.7 0.389 1.0 0.147 6.0 2.74 28.1 35.5 20.4 23.920 6.5 3.56 1.7 0.363 0.9 0.138 2.0 0.490 11.0 8.38 15.2 14.621 6.5 3.59 1.8 0.399 0.9 0.127 5.2 1.81 6.0 3.06 331.1 134722 6.8 3.85 1.8 0.409 0.8 0.118 3.0 0.934 5.9 2.86 84.3 23323 6.1 3.21 1.6 0.345 0.8 0.109 3.1 0.989 4.6 1.93 60.6 14524 5.5 2.71 1.6 0.344 0.8 0.102 2.1 0.533 10.2 6.71 35.0 59.425 4.8 2.12 1.8 0.409 0.7 0.094 1.7 0.394 5.5 2.63 25.0 33.926 4.7 2.03 2.5 0.694 0.7 0.085 1.6 0.341 267.9 401 19.7 22.827 3.7 1.42 1.6 0.349 0.7 0.080 1.2 0.216 22.2 21.8 15.3 15.028 2.8 0.866 1.5 0.308 0.7 0.076 1.0 0.168 9.4 6.51 12.2 10.329 2.3 0.639 1.4 0.266 0.6 0.074 0.9 0.140 19.2 15.9 10.4 7.8230 2.2 0.578 0.6 0.072 0.9 0.131 12.0 9.34 387.9 102831 2.1 0.529 0.8 0.098 31.6 35.2
Total 545 26.9 11.8 31.0 1034 4018
mg/l t/d mg/l t/d mg/l t/d mg/l t/d mg/l t/d mg/l t/d1 16.1 16.2 2.5 0.718 5.1 2.33 2.0 0.495 20.1 20.4 6.9 3.802 14.2 13.2 3.0 0.968 9.0 5.11 1.8 0.429 110.0 198 4.6 2.033 65.3 107 224.0 399 12.9 8.65 35.4 24.8 16.5 16.8 42.0 53.34 15.6 15.4 347.8 922 5.7 2.78 4.1 1.56 10.4 7.84 9.6 6.605 12.0 10.0 9.8 6.91 4.5 1.86 3.0 0.954 8.6 5.75 5.9 3.006 43.0 53.9 21.6 18.5 4.3 1.79 42.1 30.9 7.0 4.08 12.5 8.607 12.7 10.8 7.1 4.05 4.3 1.77 137.0 357 7.8 4.67 6.9 3.918 9.5 6.72 5.7 2.88 3.3 1.13 37.1 61.6 5.9 3.03 6.2 3.299 8.0 5.04 5.4 2.62 2.8 0.892 44.5 72.3 6.7 3.54 4.7 2.09
10 7.1 4.18 5.2 2.46 2.6 0.783 12.5 10.6 4.6 2.00 7.3 4.1311 6.7 3.78 4.8 2.16 6.5 2.77 8.0 5.02 4.1 1.66 16.0 12.312 6.1 3.22 4.2 1.72 4.6 1.87 6.1 3.21 3.5 1.29 293.3 98113 5.8 2.96 4.7 2.00 3.5 1.27 5.3 2.52 3.2 1.06 19.0 20.714 6.5 3.53 4.5 1.91 3.0 0.939 4.9 2.19 3.0 0.998 11.9 9.6515 22.6 18.5 12.3 8.59 3.7 1.20 157.2 201 18.9 14.3 10.9 8.4516 5.0 2.23 53.3 68.2 3.1 0.998 5.9 2.95 58.0 102 7.3 4.2817 3.5 1.27 7.2 4.21 13.8 6.07 4.3 1.76 77.1 177 5.9 3.0118 10.2 6.46 21.0 17.6 7.9 4.02 9.5 5.50 70.2 155 5.0 2.3219 3.9 1.48 7.4 4.34 3.1 1.01 4.3 1.73 34.6 49.4 4.4 1.8720 2.7 0.818 4.9 2.21 7.6 3.81 27.9 23.1 16.4 16.5 4.1 1.6821 9.2 5.28 4.2 1.70 3.4 1.19 6.8 3.76 10.4 7.85 3.7 1.3822 6.0 3.02 3.5 1.29 2.5 0.710 5.6 2.73 9.8 7.05 3.3 1.1623 4.8 2.08 4.7 2.02 2.3 0.639 7.0 3.83 7.7 4.75 3.0 0.98424 3.7 1.41 12.9 9.05 25.5 23.0 88.7 196 6.1 3.25 2.8 0.87325 2.9 0.896 5.0 2.28 4.9 2.16 14.0 12.8 5.3 2.50 2.6 0.78326 445.8 951 15.7 9.86 2.9 0.914 8.2 5.27 4.7 2.04 3.2 1.0527 29.6 36.1 4.8 2.09 2.4 0.689 6.2 3.30 4.2 1.75 3.2 1.0628 8.1 5.13 16.0 9.35 10.4 5.04 24.5 26.9 12.0 8.62 312.0 123129 5.0 2.32 16.4 12.4 3.4 1.15 11.2 8.67 5.8 2.96 149.8 29130 3.7 1.38 7.8 4.73 2.3 0.616 8.8 5.93 13.8 9.09 955.2 1073031 3.1 1.05 4.9 2.20 45.1 51.1 731.0 7879
Total 1296 1530 87.2 1130 835 21273
0.6 Promedio Anual: 124.0955.2 Máxima Instantánea 1595.1
ESTACION PELUCA EN EL RIO BOQUERON
Área de Drenaje:
Total Anual: 350 t/año/km²31817 t/año Producción Anual:
ABRIL MAYO JUNIO
Concentraciones de Sedimentos Suspendidos (mg/l) y Caudales Sólidos Promedios Diarios (t/d)
Concentración de Sedimentos Suspendidos (mg/l) Mínimo Diario: Máximo Diario:
DIA JULIO AGOSTO SEPTIEMBRE OCTUBRE NOVIEMBRE DICIEMBRE
LATITUD 9º 22' 48'' N LONGITUD 79º 33' 40'' O
DIA ENERO FEBRERO MARZO
36 Autoridad del Canal de Panamá Anuario de Sedimentos Suspendidos 1998-2004

Año: 2001 91 km²
mg/l t/d mg/l t/d mg/l t/d mg/l t/d mg/l t/d mg/l t/d1 78.4 220 1.9 0.474 0.8 0.105 0.6 0.063 1.7 0.373 22.8 9.102 35.2 60.0 1.8 0.434 0.8 0.106 0.5 0.055 1.2 0.224 9.0 3.433 22.4 28.3 1.7 0.378 0.7 0.096 0.5 0.052 1.0 0.143 1.1 0.1924 16.0 16.2 1.7 0.371 0.7 0.096 0.5 0.052 4.2 1.20 82.2 63.95 11.7 9.54 1.6 0.355 0.7 0.092 0.5 0.051 5.5 1.78 18.7 13.26 9.7 6.96 1.5 0.321 1.3 0.218 0.5 0.049 2.4 0.607 1.9 0.4417 8.5 5.56 1.6 0.325 2.0 0.432 0.6 0.061 1.1 0.175 1.3 0.2538 7.4 4.44 1.5 0.309 1.3 0.228 0.7 0.086 0.9 0.119 2.5 0.5989 6.7 3.75 1.6 0.344 1.0 0.145 0.8 0.109 0.8 0.107 1.3 0.238
10 5.4 2.65 1.6 0.349 0.9 0.123 0.7 0.088 0.7 0.082 38.5 28.411 5.0 2.30 1.4 0.285 0.8 0.117 0.7 0.079 0.6 0.067 103.7 14912 4.6 2.02 1.4 0.258 0.8 0.101 0.6 0.074 2.4 0.560 4.6 1.8713 4.0 1.62 1.3 0.254 0.7 0.085 0.7 0.079 9.4 3.37 2.9 0.92814 4.8 2.15 1.4 0.274 0.7 0.082 0.9 0.129 2.2 0.544 30.8 29.515 3.7 1.37 1.9 0.457 0.6 0.071 0.8 0.117 156.6 174 6.0 2.8616 3.2 1.06 1.4 0.281 0.6 0.066 0.7 0.085 13.1 9.21 2.8 0.88117 2.8 0.848 1.3 0.232 0.6 0.063 1.2 0.195 2.9 0.906 2.0 0.50818 3.3 1.13 1.2 0.202 0.6 0.058 6.8 2.23 1.8 0.398 3.2 1.0619 260.1 518 1.2 0.199 0.5 0.055 2.6 0.694 10.2 4.46 2.3 0.64520 8.5 5.08 1.1 0.176 0.5 0.054 1.4 0.269 3.3 1.03 1.7 0.36821 7.4 4.15 1.0 0.161 0.5 0.053 1.2 0.205 2.1 0.506 77.4 86.022 4.1 1.66 1.0 0.154 1.5 0.267 0.9 0.138 1.3 0.253 3.9 1.4923 3.9 1.48 0.9 0.136 0.7 0.079 0.8 0.117 1.2 0.222 2.3 0.62824 3.5 1.27 0.9 0.128 2.1 0.447 0.7 0.082 1.1 0.174 3.3 1.0925 3.0 1.00 0.9 0.126 0.9 0.132 0.6 0.066 0.9 0.140 2.5 0.69726 3.0 0.952 0.8 0.115 1.2 0.193 1.1 0.145 1.1 0.165 2.0 0.49227 2.6 0.759 0.8 0.109 2.6 0.669 1.0 0.153 1.0 0.159 1.7 0.39328 2.3 0.648 0.8 0.101 1.0 0.155 1.1 0.174 0.8 0.113 1.7 0.38529 2.3 0.621 0.8 0.105 1.9 0.436 0.8 0.099 1.6 0.33930 2.2 0.569 0.7 0.082 2.4 0.650 1.1 0.168 3.0 0.88031 2.0 0.501 0.6 0.070 1.1 0.167
Total 907 7.31 4.64 6.78 202 400
mg/l t/d mg/l t/d mg/l t/d mg/l t/d mg/l t/d mg/l t/d1 2.0 0.472 6.8 3.72 4.3 1.77 3.5 1.23 2.1 0.516 6.5 3.612 1.6 0.326 66.1 68.4 6.9 3.29 2.8 0.894 1.9 0.437 5.5 2.723 1.5 0.321 121.5 195 3.5 1.24 15.0 11.6 1.8 0.396 4.7 2.084 1.5 0.295 13.1 11.3 5.5 2.23 55.4 62.9 1.6 0.358 19.5 18.15 1.5 0.298 7.2 4.18 44.5 56.4 8.4 5.15 1.6 0.339 10.8 8.196 12.0 4.02 5.1 2.39 8.2 5.13 4.6 2.00 1.6 0.334 9.6 6.737 1.5 0.310 5.6 2.67 5.3 2.53 12.6 8.18 24.9 12.3 22.0 18.08 22.8 12.8 5.2 2.48 107.2 132 5.7 2.84 4.6 1.69 21.5 23.69 15.0 8.87 4.0 1.57 67.6 89.4 4.6 1.99 1.8 0.430 1175.7 5782
10 25.2 26.4 3.3 1.14 9.1 6.00 4.1 1.63 1.8 0.406 76.9 18511 9.9 6.86 2.9 0.925 9.0 5.69 3.2 1.08 1.9 0.463 68.5 16912 5.0 2.24 2.6 0.781 19.1 17.8 2.7 0.837 1.8 0.428 30.2 45.913 2.8 0.870 2.4 0.672 941.9 4383 2.7 0.810 29.9 24.4 21.0 25.614 2.2 0.566 3.5 1.15 29.4 42.5 4.2 1.71 12.1 6.15 306.0 94115 1.8 0.427 15.5 7.35 13.8 12.6 3.4 1.16 5.1 2.25 30.7 47.116 6.1 2.09 3.3 1.14 9.5 6.75 5.5 2.22 2.6 0.769 17.8 19.217 1.6 0.356 2.7 0.839 7.4 4.48 2.6 0.760 35.9 22.2 13.8 12.618 871.4 5834 169.9 299 9.2 6.08 2.2 0.594 21.1 21.8 16.9 16.219 16.9 16.8 7.7 4.57 6.2 3.27 2.7 0.776 275.0 715 11.8 9.5920 7.8 4.81 4.4 1.82 6.2 3.14 2.4 0.667 23.6 29.3 13.0 10.821 7.4 4.14 49.2 38.9 4.6 2.01 2.8 0.807 18.0 18.6 229.0 58222 4.7 2.09 6.1 3.07 32.1 39.3 2.0 0.514 82.4 188 21.8 26.123 3.5 1.28 4.6 1.94 7.3 4.26 7.1 2.78 67.1 101 598.9 329624 17.7 10.6 3.4 1.22 5.3 2.53 4.2 1.50 14.7 13.8 30.6 47.025 60.4 74.0 3.1 1.00 22.8 19.3 2.3 0.640 9.6 6.87 19.4 22.426 63.7 93.0 2.6 0.772 6.5 3.47 22.3 13.3 758.5 3562 15.2 14.827 7.7 4.73 4.5 1.63 4.6 2.00 3.6 1.24 24.8 33.0 13.2 11.828 5.9 3.01 68.3 96.5 3.9 1.49 33.9 27.4 14.2 13.2 17.7 17.829 6.7 3.65 21.4 22.7 3.5 1.24 5.4 2.45 10.5 7.97 18.3 18.630 66.3 67.9 8.5 5.47 6.0 2.54 2.7 0.807 8.1 5.18 18.1 19.431 10.6 7.48 6.1 3.16 2.2 0.599 12.6 10.8
Total 6195 787 4863 161 4791 11412
0.5 Promedio Anual: 146.41175.7 Máxima Instantánea 1670.4
327 t/año/km²29736 t/año Producción Anual:
DIA FEBRERO MARZO
Total Anual:
ESTACION PELUCA EN EL RIO BOQUERON
Área de Drenaje:
Concentraciones de Sedimentos Suspendidos (mg/l) y Caudales Sólidos Promedios Diarios (t/d)LATITUD 9º 22' 48'' N LONGITUD 79º 33' 40'' O
Máximo Diario:
DIA JULIO AGOSTO
ABRIL ENERO
Concentración de Sedimentos Suspendidos (mg/l) Mínimo Diario:
SEPTIEMBRE OCTUBRE NOVIEMBRE DICIEMBRE
MAYO JUNIO
Autoridad del Canal de Panamá 37 Anuario de Sedimentos Suspendidos 1998-2004

Año: 2002 91 km²
mg/l t/d mg/l t/d mg/l t/d mg/l t/d mg/l t/d mg/l t/d1 14.8 13.8 2.1 0.532 0.7 0.082 1.1 0.192 6.8 3.81 2.3 0.6242 10.3 7.66 2.4 0.681 0.7 0.077 1.0 0.151 5.3 2.57 2.1 0.5443 7.8 4.87 3.0 0.972 0.7 0.083 1.0 0.161 4.7 2.06 2.2 0.5794 48.5 58.3 2.5 0.699 0.7 0.085 1.6 0.329 3.9 1.51 5.3 1.925 10.0 7.30 1.9 0.445 0.6 0.074 1.4 0.281 3.9 1.49 2.7 0.7896 7.2 4.28 1.6 0.334 0.6 0.066 1.0 0.152 3.9 1.51 2.0 0.4907 9.6 6.55 1.4 0.278 0.6 0.068 0.9 0.132 5.7 2.81 9.3 3.718 8.9 5.93 1.3 0.245 0.6 0.072 0.8 0.116 5.4 2.62 3.1 1.019 21.4 20.7 1.3 0.228 0.8 0.100 0.8 0.104 8.6 5.53 12.4 5.41
10 8.4 5.47 1.3 0.227 0.7 0.094 0.7 0.092 6.2 3.25 5.5 2.4311 6.1 3.20 1.4 0.282 0.6 0.075 1.0 0.142 4.6 2.03 3.1 1.0112 5.1 2.38 1.2 0.218 0.7 0.081 0.7 0.095 3.7 1.39 2.2 0.59913 4.4 1.87 1.1 0.186 0.6 0.063 0.8 0.103 3.3 1.13 1.9 0.45214 3.9 1.53 1.1 0.183 0.6 0.057 0.7 0.077 2.8 0.862 10.0 4.0115 3.6 1.31 1.1 0.172 0.6 0.057 0.6 0.067 2.6 0.775 2.1 0.53116 3.4 1.19 1.0 0.151 0.6 0.064 0.6 0.065 14.6 7.05 1.7 0.36217 3.3 1.16 1.0 0.147 0.9 0.119 3.2 0.800 8.5 5.43 152.8 22618 2.9 0.940 0.9 0.133 1.0 0.142 3.1 0.943 38.4 48.6 6.1 3.0219 2.6 0.778 1.1 0.186 7.8 3.34 175.8 389 10.7 8.02 2.9 0.94320 2.5 0.701 1.0 0.145 1.2 0.206 10.4 6.27 6.7 3.72 3.4 1.1521 2.4 0.689 0.9 0.123 264.7 478 25.2 30.2 12.7 7.87 2.5 0.69622 2.3 0.628 0.8 0.112 87.0 143 49.9 79.4 7.4 4.26 8.3 3.6323 2.2 0.573 0.8 0.104 28.2 33.7 15.3 14.6 6.7 3.61 4.9 2.1824 2.1 0.549 0.8 0.098 10.5 7.72 28.6 39.3 7.1 3.80 14.6 12.425 2.1 0.527 0.7 0.096 4.0 1.55 39.6 70.6 6.6 3.49 5.1 2.3926 1.9 0.464 0.7 0.095 2.2 0.593 188.0 449 9.9 5.53 3.7 1.3727 1.8 0.421 0.7 0.084 1.7 0.372 90.5 226 10.4 6.74 3.2 1.0928 1.7 0.388 0.7 0.084 1.4 0.265 17.0 17.9 4.0 1.57 2.6 0.78929 1.7 0.374 1.2 0.204 12.1 10.0 3.1 1.01 2.9 0.91830 1.8 0.402 1.1 0.173 9.0 6.20 2.6 0.789 12.7 6.1831 1.9 0.451 1.1 0.171 2.4 0.677
Total 155 7.2 671 1343 146 287
mg/l t/d mg/l t/d mg/l t/d mg/l t/d mg/l t/d mg/l t/d1 7.9 4.49 79.5 121 4.1 1.63 47.1 40.8 6.4 3.45 51.8 1132 17.5 12.7 69.7 116 56.0 61.9 10.8 7.22 4.3 1.80 36.7 63.83 6.0 3.04 16.0 15.8 7.7 4.48 4.4 1.85 3.7 1.39 25.0 34.14 4.1 1.63 913.3 3621 23.4 20.4 43.3 49.4 3.7 1.41 18.9 21.35 83.9 98.6 30.9 45.8 8.5 5.56 14.9 10.9 29.8 21.7 15.9 15.96 8.5 5.46 15.2 14.8 5.3 2.55 5.0 2.26 6.1 3.10 16.6 16.87 5.6 2.75 10.7 8.21 4.1 1.68 9.8 5.68 42.9 41.0 12.5 10.88 5.0 2.31 10.5 7.79 3.6 1.30 6.3 3.22 7.4 4.39 11.3 8.989 4.0 1.59 8.1 5.13 3.1 1.05 4.8 2.10 4.7 2.04 9.7 6.98
10 3.2 1.10 6.4 3.51 25.9 19.4 15.3 11.1 4.0 1.57 7.9 4.9811 61.9 89.8 5.6 2.82 13.6 8.28 5.9 3.01 3.9 1.48 6.5 3.5512 17.7 15.8 5.0 2.30 5.4 2.56 4.2 1.75 3.5 1.28 5.4 2.6513 8.4 5.37 4.5 1.95 3.7 1.38 3.5 1.24 171.8 320 4.3 1.7714 5.5 2.71 4.0 1.57 3.2 1.09 3.8 1.38 26.2 34.2 3.7 1.3815 587.1 2781 3.7 1.36 3.8 1.40 3.2 1.06 13.2 11.6 3.6 1.3116 37.1 64.0 3.3 1.15 9.4 5.03 16.4 12.6 9.3 6.49 3.2 1.0917 22.9 29.4 3.0 1.00 6.7 3.48 6.1 3.16 7.9 4.90 2.8 0.88318 282.5 1072 2.7 0.817 4.9 2.22 3.9 1.53 7.6 4.63 2.6 0.78719 42.2 72.5 571.4 1349 3.7 1.38 3.5 1.27 7.8 4.77 2.6 0.75020 20.0 23.2 17.6 15.9 3.0 1.00 4.3 1.72 6.0 3.11 2.4 0.66821 13.4 12.0 6.1 3.24 3.6 1.21 7.6 3.75 5.5 2.64 2.4 0.66422 10.5 7.96 5.1 2.41 96.4 102 10.0 6.08 166.0 188 2.2 0.56723 8.4 5.54 35.5 30.3 11.0 7.97 5.4 2.57 624.1 5257 2.1 0.52524 7.2 4.26 6.4 3.29 8.2 4.41 21.4 17.0 43.0 82.4 1.9 0.46925 9.0 5.99 3.6 1.36 4.1 1.62 7.4 4.24 22.7 28.8 1.8 0.43226 32.9 32.9 68.8 48.2 4.4 1.71 13.9 8.16 15.9 16.0 1.8 0.40727 7.6 4.64 17.1 16.3 4.4 1.71 4.8 2.15 13.2 11.7 1.9 0.43928 8.1 4.92 13.4 10.9 3.1 1.02 10.6 6.02 13.1 11.6 2.1 0.52129 13.2 9.71 5.9 3.03 2.8 0.856 17.9 14.6 19.6 22.1 2.3 0.63530 9.1 5.96 5.3 2.54 3.3 1.07 6.5 3.52 1443.9 19511 1.8 0.39731 32.0 30.6 5.4 2.53 31.8 25.4 1.6 0.333
Total 4414 5461 271 257 25605 316
0.6 Promedio Anual: 170.61443.9 Máxima Instantánea 1987.0
428 t/año/km²38935 t/año Producción Anual:
Concentraciones de Sedimentos Suspendidos (mg/l) y Caudales Sólidos Promedios Diarios (t/d)LATITUD 9º 22' 48'' N LONGITUD 79º 33' 40'' O
DIA MARZO ABRIL
ESTACION PELUCA EN EL RIO BOQUERON
Área de Drenaje:
MAYO JUNIO
Concentración de Sedimentos Suspendidos (mg/l) Mínimo Diario:
SEPTIEMBRE OCTUBRE NOVIEMBRE DICIEMBRE
ENERO FEBRERO
Máximo Diario:
DIA JULIO AGOSTO
Total Anual:
38 Autoridad del Canal de Panamá Anuario de Sedimentos Suspendidos 1998-2004

Año: 2003 91 km²
mg/l t/d mg/l t/d mg/l t/d mg/l t/d mg/l t/d mg/l t/d1 1.7 0.365 1.2 0.193 0.5 0.044 0.5 0.040 0.5 0.042 15.1 9.542 1.5 0.308 0.8 0.102 0.5 0.044 0.5 0.039 0.5 0.042 18.1 13.23 1.4 0.265 0.7 0.090 0.5 0.044 0.5 0.037 0.5 0.042 8.0 4.924 1.3 0.248 0.7 0.089 0.5 0.044 0.5 0.036 0.5 0.042 4.3 1.785 1.4 0.257 0.7 0.089 0.5 0.044 0.5 0.036 18.4 8.99 11.3 6.436 1.3 0.232 0.8 0.103 0.5 0.044 0.5 0.035 1.7 0.378 4.6 1.927 1.2 0.197 0.8 0.102 0.5 0.043 0.5 0.033 63.7 89.7 2.6 0.7548 1.1 0.180 0.7 0.091 0.5 0.041 0.5 0.033 4.7 1.91 2.2 0.5959 1.0 0.166 1.2 0.201 0.5 0.040 0.5 0.033 1.7 0.380 61.2 76.3
10 1.0 0.166 2.2 0.523 0.5 0.039 0.5 0.033 1.1 0.191 7.2 4.0111 1.0 0.157 1.6 0.311 0.5 0.037 0.5 0.032 10.7 4.77 6.8 3.2412 1.5 0.291 1.4 0.270 0.5 0.037 0.5 0.031 3.2 1.01 7.8 4.2913 1.2 0.204 0.9 0.119 0.5 0.038 0.5 0.031 5.8 2.54 19.0 12.414 1.2 0.202 0.7 0.087 0.5 0.037 31.1 18.7 3.5 1.24 5.1 2.3215 1.1 0.185 0.7 0.077 0.5 0.036 4.0 1.21 86.5 108 5.5 2.6216 1.0 0.155 0.6 0.061 0.5 0.035 0.7 0.079 4.5 1.86 4.1 1.6317 1.0 0.143 0.5 0.054 0.5 0.035 0.5 0.053 2.2 0.588 7.8 4.1518 0.9 0.134 0.5 0.051 0.5 0.034 0.5 0.045 23.5 18.4 6.5 3.5519 0.9 0.129 0.5 0.051 0.5 0.035 0.5 0.040 7.0 3.88 5.1 2.3320 0.9 0.128 0.5 0.052 0.5 0.033 0.5 0.035 3.4 1.18 4.0 1.5321 0.9 0.119 0.5 0.051 0.5 0.035 39.1 32.3 2.3 0.605 3.1 1.0022 0.8 0.105 0.5 0.051 0.5 0.037 2.4 0.649 1.7 0.377 2.7 0.80523 0.8 0.100 0.5 0.051 0.5 0.037 0.8 0.104 2.0 0.483 25.0 16.124 0.8 0.099 0.5 0.047 0.5 0.036 0.5 0.048 4.4 1.40 7.6 4.3825 0.8 0.100 0.5 0.047 0.5 0.037 0.5 0.042 2.3 0.629 3.8 1.4326 0.7 0.092 0.5 0.045 0.5 0.037 0.6 0.055 17.6 7.65 3.3 1.1527 0.8 0.098 0.5 0.045 0.5 0.036 0.6 0.068 15.2 12.0 4.0 1.4828 0.8 0.105 0.5 0.044 0.5 0.035 0.5 0.046 4.4 1.85 215.0 29629 0.8 0.099 0.5 0.033 0.6 0.056 26.7 20.3 11.1 8.2330 0.7 0.093 0.5 0.032 0.6 0.057 19.9 14.4 4.7 2.0331 0.7 0.091 0.5 0.031 7.3 4.22
Total 5.21 3.10 1.16 54.0 309 490
mg/l t/d mg/l t/d mg/l t/d mg/l t/d mg/l t/d mg/l t/d1 3.1 1.05 32.6 35.9 8.6 5.33 14.1 11.3 5.3 2.30 33.4 50.32 2.9 0.908 13.8 11.3 6.9 3.86 6.7 3.77 116.1 151 32.2 49.03 2.6 0.774 10.4 7.31 7.8 4.84 14.9 10.6 15.4 13.0 60.3 1384 2.5 0.712 5.2 2.48 19.9 17.2 10.6 7.51 8.0 4.87 29.9 45.15 2.2 0.581 4.0 1.60 13.7 11.7 57.0 66.1 5.8 2.96 18.9 21.46 29.6 20.2 41.5 47.5 8.8 5.85 56.6 80.2 11.8 8.21 43.0 76.27 5.2 2.32 10.5 7.20 6.0 3.12 12.9 11.1 10.1 7.38 509.0 37908 9.3 4.97 14.2 12.4 5.0 2.26 11.0 8.48 6.8 3.86 67.7 1769 5.1 2.33 7.2 4.24 5.2 2.42 20.0 19.4 5.4 2.62 39.4 72.5
10 7.3 3.85 10.3 6.48 4.0 1.59 18.2 19.1 51.0 43.1 44.7 78.711 4.2 1.69 6.4 3.47 5.2 2.27 10.5 7.94 10.4 7.34 25.8 35.12 46.4 52.4 4.7 2.10 4.3 1.80 8.8 5.89 23.8 21.1 19.3 22.013 8.4 5.21 783.5 2919 3.6 1.32 6.9 3.94 9.0 6.08 14.2 13.214 4.4 1.88 178.8 653 8.0 4.28 9.9 6.29 46.8 56.2 11.9 9.8415 4.3 1.80 36.5 58.5 23.0 18.4 6.7 3.69 10.3 7.59 10.2 7.6316 3.9 1.48 16.6 17.1 7.2 4.08 29.9 23.8 6.9 3.89 11.2 8.4817 3.2 1.08 11.5 9.24 4.9 2.18 8.3 5.33 23.2 20.5 7.9 4.9718 2.7 0.808 9.3 6.53 3.6 1.35 6.8 3.77 21.4 24.0 6.9 3.9719 2.5 0.698 24.8 24.7 3.1 1.05 12.5 8.91 9.5 6.71 9.6 6.5020 2.2 0.584 12.3 10.2 30.9 25.4 8.1 5.05 16.2 11.7 49.9 78.821 2.6 0.762 9.2 6.34 12.1 8.82 9.0 5.79 10.9 7.78 15.5 15.122 3.1 1.03 56.3 65.1 27.7 25.7 6.3 3.40 5.9 3.03 148.4 41023 20.0 18.5 12.8 10.9 47.8 66.9 4.9 2.22 5.6 2.74 20.4 24.024 13.6 11.5 20.5 19.5 20.5 20.4 4.1 1.64 5.0 2.26 13.2 11.725 5.7 2.82 10.0 7.18 10.4 7.59 3.9 1.48 4.3 1.80 10.3 7.726 3.9 1.54 8.8 5.88 6.5 3.59 3.4 1.23 4.2 1.70 8.7 5.8427 3.3 1.17 9.5 6.57 5.6 2.74 4.6 1.92 27.2 29.3 7.9 4.9828 2.9 0.902 6.6 3.63 11.6 7.37 3.5 1.27 812.5 3688 9.4 6.4729 2.6 0.793 9.7 6.20 5.9 3.01 4.8 2.02 539.1 2662 7.6 4.6830 7.3 3.12 6.6 3.60 7.2 3.83 6.3 2.93 48.4 89.9 8.4 5.4131 4.0 1.53 8.6 5.08 4.1 1.64 6.8 3.84
Total 149 3981 270 338 6893 5188
0.5 Promedio Anual: 88.7812.5 Máxima Instantánea 1548.1
194 t/año/km²17682 t/año Producción Anual:
DIA FEBRERO MARZO
Total Anual:
ESTACION PELUCA EN EL RIO BOQUERON
Área de Drenaje:
Concentraciones de Sedimentos Suspendidos (mg/l) y Caudales Sólidos Promedios Diarios (t/d)LATITUD 9º 22' 48'' N LONGITUD 79º 33' 40'' O
Máximo Diario:
DIA JULIO AGOSTO
ABRIL ENERO
Concentración de Sedimentos Suspendidos (mg/l) Mínimo Diario:
SEPTIEMBRE OCTUBRE NOVIEMBRE DICIEMBRE
MAYO JUNIO
7
1
Autoridad del Canal de Panamá 39 Anuario de Sedimentos Suspendidos 1998-2004

Año: 2004 91 km²
mg/l t/d mg/l t/d mg/l t/d mg/l t/d mg/l t/d mg/l t/d1 5.8 2.98 1.2 0.217 0.6 0.057 0.5 0.038 601.5 3419 9.0 6.002 5.2 2.43 1.2 0.198 0.6 0.062 0.5 0.043 936.4 6822 6.7 3.753 5.1 2.41 1.1 0.179 0.6 0.069 0.5 0.039 30.8 46.7 6.8 3.804 5.1 2.37 1.2 0.199 0.9 0.123 0.5 0.036 161.9 441 7.1 4.145 3.9 1.54 1.1 0.173 0.7 0.087 0.5 0.040 45.0 88.5 7.4 4.316 3.7 1.41 1.0 0.165 0.6 0.070 0.5 0.043 23.8 31.3 6.1 3.227 3.7 1.39 1.0 0.154 0.6 0.068 0.6 0.056 17.6 19.0 5.6 2.788 3.6 1.35 1.0 0.148 0.6 0.062 0.5 0.048 16.9 17.7 4.3 1.809 3.4 1.23 0.9 0.138 0.6 0.061 0.5 0.046 11.4 9.17 21.4 19.8
10 3.3 1.12 0.9 0.126 0.5 0.053 0.5 0.041 14.4 12.8 7.1 4.1411 3.3 1.15 0.9 0.118 2.1 0.479 0.5 0.038 9.3 6.45 5.3 2.5512 3.2 1.11 0.8 0.107 1.6 0.342 0.5 0.033 6.9 3.96 20.5 16.313 3.2 1.06 0.9 0.135 0.9 0.132 0.5 0.038 6.2 3.26 5.7 2.8914 3.0 0.957 0.9 0.134 0.7 0.090 0.5 0.046 5.3 2.57 9.8 6.2115 2.7 0.818 0.8 0.105 0.7 0.090 0.5 0.034 48.1 57.4 5.0 2.3216 2.5 0.713 0.8 0.102 0.8 0.097 0.5 0.036 16.0 14.7 4.3 1.7817 2.3 0.611 1.0 0.154 0.8 0.115 0.5 0.036 33.6 35.8 3.7 1.4118 2.1 0.540 1.3 0.238 0.9 0.137 0.5 0.031 14.9 13.6 814.6 415119 1.9 0.469 1.6 0.318 1.0 0.163 0.6 0.048 91.6 136 129.6 30220 1.8 0.422 0.9 0.128 0.7 0.095 42.1 47.6 20.7 23.2 49.7 86.921 1.6 0.345 0.8 0.096 0.6 0.070 69.9 119 10.2 7.56 18.5 20.522 3.7 1.31 1.6 0.299 0.6 0.057 5.2 2.29 9.7 6.83 11.8 9.6523 3.2 1.05 1.3 0.223 0.6 0.059 2.3 0.620 9.4 6.10 8.8 5.8924 3.1 1.04 0.8 0.104 0.6 0.067 14.7 6.13 8.2 5.24 22.4 20.125 2.1 0.519 0.7 0.083 0.6 0.062 6.2 3.06 5.9 3.08 281.9 64126 1.8 0.402 0.6 0.075 0.5 0.051 2.7 0.794 21.8 22.7 18.5 20.227 1.6 0.351 0.6 0.067 0.5 0.048 2.4 0.664 23.3 22.3 12.8 11.028 1.5 0.319 0.6 0.062 0.6 0.057 1.6 0.323 716.6 2881 9.6 6.7829 1.4 0.281 0.6 0.062 0.6 0.058 2.0 0.494 28.3 39.4 38.9 47.930 1.3 0.255 0.5 0.043 2.5 0.691 13.0 11.4 16.6 16.331 1.3 0.229 0.5 0.040 9.8 7.05
Total 32.2 4.31 3.06 183 14217 5426
mg/l t/d mg/l t/d mg/l t/d mg/l t/d mg/l t/d mg/l t/d1 10.9 8.49 4.5 1.93 6.4 3.44 4.4 1.86 7.1 4.03 7.2 4.202 9.3 6.34 8.4 4.54 5.3 2.56 3.5 1.24 10.5 6.94 6.3 3.363 9.2 6.23 5.9 2.74 17.6 13.8 19.7 15.9 9.3 6.42 5.5 2.694 27.2 24.1 98.2 124 8.7 5.13 13.8 11.5 14.5 11.9 4.8 2.15 12.8 10.5 14.6 13.4 7.1 4.02 7.5 4.48 85.1 127 603.8 28116 7.4 4.41 10.0 7.09 9.2 6.00 7.1 3.93 16.2 15.6 17.9 19.27 28.3 26.6 6.7 3.72 100.4 155 16.2 10.8 28.1 31.6 11.7 9.628 8.5 5.58 50.8 62.8 369.4 1078 7.0 3.94 24.2 27.7 27.1 35.39 6.3 3.41 8.0 5.05 28.2 39.8 16.2 13.1 1015.7 7569 28.2 38.4
10 8.2 5.12 16.9 14.5 21.6 24.5 8.3 5.23 76.6 215 12.5 10.611 5.9 3.05 43.8 49.1 12.1 10.1 133.4 204 38.2 65.9 9.9 7.1712 31.2 27.2 10.4 7.72 9.5 6.75 34.0 40.3 19.0 21.4 7.8 4.8913 7.8 4.84 7.0 4.07 7.8 4.88 270.4 584 15.8 15.5 9.9 6.9614 71.8 100 36.0 35.3 6.7 3.74 14.4 13.2 11.2 8.92 7.0 4.0015 28.9 31.7 13.7 11.3 27.7 26.2 24.5 24.2 10.0 7.42 6.5 3.6116 12.1 9.94 12.4 9.61 9.4 6.45 34.3 47.6 16.2 14.8 673.6 349217 8.0 5.03 171.9 395 10.2 7.09 20.2 23.0 10.3 7.75 17.0 17.18 109.3 151 17.2 17.9 7.0 3.97 79.3 116 168.1 579 11.5 9.2319 15.2 14.1 11.1 8.75 15.9 10.6 13.6 12.1 1149.9 20065 9.3 6.5020 8.7 5.86 9.6 6.86 6.1 3.14 14.8 12.6 1221.9 20215 8.0 5.0121 7.1 4.19 9.6 6.43 5.6 2.70 26.2 28.9 94.3 303 6.6 3.7122 8.1 5.08 229.3 578 4.6 1.97 24.3 24.9 44.8 90.0 6.3 3.4223 7.2 4.14 60.8 97.5 3.6 1.35 142.8 261 29.7 45.3 5.8 2.9224 5.7 2.88 20.2 23.4 3.3 1.17 16.9 16.9 22.2 27.9 5.0 2.2925 9.4 5.99 13.5 12.1 3.5 1.26 11.3 8.94 16.3 16.7 4.4 1.8626 5.8 2.99 10.4 7.84 32.1 25.2 49.6 54.5 30.0 41.5 3.9 1.527 32.2 34.2 7.9 4.95 12.7 8.45 21.5 20.6 13.1 11.5 4.3 1.728 8.2 5.25 13.2 10.6 11.4 7.74 9.9 7.28 10.5 7.98 3.4 1.2029 7.0 3.88 11.5 8.42 8.6 5.30 8.0 5.03 9.1 6.33 3.3 1.1630 5.1 2.38 10.5 7.63 7.3 4.14 7.6 4.67 8.2 5.31 3.5 1.2431 4.3 1.80 8.9 6.05 6.9 3.90 3.0 0.994
Total 526 1549 1474 1585 49571 6516
0.5 Promedio Anual: 264.31221.9 Máxima Instantáne
9
6
26
a 1902.8
JUNIO
Máximo Diario:
DIA JULIO AGOSTO
Concentración de Sedimentos Suspendidos (mg/l) Mínimo Diario:
SEPTIEMBRE OCTUBRE NOVIEMBRE DICIEMBRE
ESTACION PELUCA EN EL RIO BOQUERON
Área de Drenaje:
Concentraciones de Sedimentos Suspendidos (mg/l) y Caudales Sólidos Promedios Diarios (t/d)LATITUD 9º 22' 48'' N LONGITUD 79º 33' 40'' O
891 t/año/km²81086 t/año Producción Anual:
DIA FEBRERO MARZO
Total Anual:
ABRIL ENERO MAYO
40 Autoridad del Canal de Panamá Anuario de Sedimentos Suspendidos 1998-2004

Autoridad del Canal de Panamá 41 Anuario de Sedimentos Suspendidos 1998-2004

42 Autoridad del Canal de Panamá Anuario de Sedimentos Suspendidos 1998-2004

Estación Ciento en el Río Gatún
LOCALIZACIÓN: La estación está a 6.4 km (4.0 mi) aguas arriba del puente de la Transístmica, en la provincia de Colón, distrito de Colón. Sus coordenadas geográficas son: 9° 17’ 52” de latitud Norte y 79° 43’ 41” de longitud Oeste. CÓDIGO DE LA ESTACIÓN: 115-05-01 ÁREA DE DRENAJE: 117 km2 (45 mi2) PERIODO DE REGISTRO: Desde enero de 1987 hasta la fecha. VALORES EXTREMOS Y PROMEDIOS PARA EL AÑO 2004
Concentración (mg/l)
Año
Máxima Instantánea
Mínima Diaria
PromedioAnual
Rendimiento
líquido (l/s/km2)
Producción
anual de sedimentos (t/año/km2)
1998 1280.6 3.2 105.2 53.0 176 1999 1244.9 4.2 185.2 86.4 505 2000 1450.0 3.7 151.9 61.2 294 2001 1085.6 3.7 79.4 42.0 105 2002 1369.3 4.0 83.6 43.3 114 2003 1122.9 3.4 129.0 53.8 219 2004 1564.0 3.8 185.8 59.6 350
Autoridad del Canal de Panamá 43 Anuario de Sedimentos Suspendidos 1998-2004

Año: 1998 117 km²
mg/l t/d mg/l t/d mg/l t/d mg/l t/d mg/l t/d mg/l t/d1 4.6 0.697 4.0 0.326 3.7 0.193 3.4 0.117 4.1 0.390 4.8 0.9052 4.5 0.668 4.0 0.318 3.7 0.190 3.3 0.108 4.0 0.321 10.9 2.443 4.5 0.620 4.0 0.323 3.6 0.181 3.3 0.102 3.9 0.274 8.6 2.814 4.5 0.613 4.0 0.317 3.6 0.175 3.3 0.102 3.9 0.273 4.8 0.9215 4.4 0.562 4.0 0.327 3.7 0.191 3.3 0.102 3.9 0.271 4.6 0.6896 4.4 0.537 4.0 0.321 3.6 0.183 3.3 0.101 3.9 0.262 5.1 0.9067 4.3 0.494 4.0 0.298 3.6 0.175 3.3 0.098 4.1 0.345 10.9 4.248 4.3 0.454 4.0 0.297 3.6 0.166 3.3 0.098 4.9 0.994 4.9 1.019 5.8 1.06 3.9 0.287 3.6 0.170 3.3 0.098 4.4 0.514 4.7 0.79010 4.8 0.868 3.9 0.272 3.6 0.165 3.3 0.098 4.1 0.343 4.7 0.75911 4.4 0.566 3.9 0.261 3.5 0.156 3.3 0.098 3.9 0.267 4.8 0.87912 4.3 0.516 3.9 0.261 3.5 0.142 3.3 0.097 3.8 0.230 5.2 0.93413 4.3 0.496 3.9 0.260 3.5 0.141 3.2 0.092 4.0 0.304 4.9 1.0214 4.3 0.472 3.9 0.261 3.5 0.141 3.2 0.089 3.9 0.270 7.8 1.8715 4.3 0.472 3.9 0.267 3.5 0.141 3.2 0.086 3.8 0.225 84.2 84.516 4.3 0.472 3.9 0.266 3.5 0.139 3.2 0.086 3.7 0.209 14.6 7.3217 4.3 0.462 3.9 0.255 3.5 0.134 3.2 0.086 228.3 628 44.2 16.918 4.2 0.436 3.8 0.239 3.5 0.133 3.2 0.085 33.9 27.2 10.1 3.8419 4.2 0.421 3.8 0.219 3.5 0.137 3.2 0.079 193.2 313 5.2 1.2820 4.2 0.433 3.7 0.207 3.5 0.152 3.2 0.080 5.3 1.36 5.1 1.2221 4.2 0.411 3.7 0.203 3.5 0.145 3.2 0.082 4.8 0.892 311.5 62322 4.2 0.409 3.7 0.203 3.4 0.132 3.2 0.086 4.5 0.652 56.1 44.923 4.2 0.394 3.7 0.200 3.6 0.161 3.5 0.144 68.8 42.1 6.7 1.9124 4.1 0.386 3.7 0.195 3.5 0.139 4.1 0.326 8.3 2.61 6.4 1.8825 4.1 0.374 3.7 0.193 3.5 0.138 262.4 615 9.9 3.30 18.7 9.3026 4.1 0.370 3.7 0.193 3.7 0.213 41.3 28.3 39.3 32.7 16.3 6.7727 4.1 0.367 3.7 0.193 3.8 0.227 4.7 0.816 11.6 5.14 15.4 6.4728 4.1 0.360 3.7 0.193 3.6 0.183 13.8 2.93 5.7 1.59 209.4 28629 4.1 0.358 3.6 0.159 6.9 1.83 4.9 1.09 18.6 8.6230 4.1 0.354 3.5 0.141 4.4 0.544 4.9 1.04 5.1 1.2331 4.1 0.343 3.4 0.127 4.9 0.982
Total 15.4 7.15 4.97 652 1067 1125
mg/l t/d mg/l t/d mg/l t/d mg/l t/d mg/l t/d mg/l t/d1 4.8 0.978 6.5 2.04 11.0 4.99 19.1 12.8 12.0 5.78 14.5 7.592 4.7 0.858 5.8 1.68 9.7 4.06 16.8 10.2 14.4 7.72 15.0 7.863 4.7 0.778 20.4 8.90 9.1 3.65 74.2 85.0 12.3 6.05 170.6 4314 184.6 231 6.3 1.92 9.5 3.91 42.7 46.8 11.2 5.13 92.5 1605 83.0 91.9 339.5 790 9.1 3.60 28.1 23.8 10.3 4.43 62.9 89.86 28.2 22.3 42.2 42.7 8.7 3.33 29.7 26.3 11.9 5.65 582.5 17377 10.1 4.23 83.4 102 8.7 3.37 27.6 23.0 15.7 8.76 247.6 7598 6.5 2.06 17.3 10.6 11.0 4.99 271.1 587 25.4 18.9 119.5 2719 5.6 1.57 11.0 4.95 11.1 5.05 98.2 191 24.7 18.4 73.8 12510 5.0 1.25 8.5 3.22 9.3 3.74 45.9 55.8 28.4 23.0 61.5 90.711 10.7 3.97 57.4 42.0 9.3 3.78 163.4 314 14.5 7.91 67.6 10412 5.6 1.56 83.1 107 12.9 6.20 205.1 550 12.2 6.00 35.5 36.513 5.2 1.33 97.1 172 12.6 6.17 47.4 58.0 11.5 5.38 37.9 40.514 4.9 1.10 51.0 55.2 12.5 6.19 29.1 26.0 12.5 5.87 28.8 25.715 4.9 1.08 22.8 16.9 9.0 3.54 28.7 23.9 10.0 4.22 35.0 33.916 4.9 1.03 63.7 67.0 8.2 3.05 31.0 27.2 9.1 3.64 45.9 54.017 5.0 1.07 44.9 45.3 7.8 2.80 27.8 23.6 377.6 753 72.2 11418 6.8 1.78 25.2 19.8 34.0 21.3 25.5 20.4 108.5 200 41.8 48.019 5.6 1.56 189.5 281 23.9 17.5 18.2 11.7 135.4 237 30.0 27.420 292.4 516 51.9 60.5 12.9 6.58 15.6 9.06 37.8 36.2 724.9 130621 20.2 13.5 40.8 42.3 201.6 317 16.4 9.69 18.1 11.5 362.2 143322 10.9 4.87 24.6 19.3 117.6 222 102.7 173 23.9 16.5 82.6 14823 8.8 3.40 20.6 14.3 460.4 1406 61.4 91.0 18.8 12.0 49.5 64.324 18.5 7.98 15.6 8.97 102.1 179 31.1 28.9 12.1 5.85 36.2 37.725 33.8 28.5 13.1 6.72 61.1 75.0 20.7 14.6 10.3 4.48 27.6 23.926 10.4 4.50 11.8 5.61 139.7 276 16.1 9.51 9.5 3.90 22.8 17.327 7.5 2.61 10.6 4.72 191.6 410 13.5 7.12 8.8 3.43 19.4 13.128 178.6 174 44.6 35.7 81.5 139 12.2 5.98 9.5 3.80 18.1 11.629 34.3 21.1 34.2 29.7 33.5 33.0 11.2 5.12 81.9 69.2 20.2 13.930 101.5 92.2 23.8 17.4 25.7 21.0 10.5 4.63 25.2 17.2 18.9 12.531 10.2 4.28 13.1 6.71 10.5 4.64 17.6 11.2
Total 1245 2027 3196 2480 1511 7256
3.2 Promedio Anual: 105.2724.9 Máxima Instantánea 1280.6
Concentración de Sedimentos Suspendidos (mg/l) Mínimo Diario: Máximo Diario:
ABRIL MAYO JUNIO
DIA JULIO AGOSTO SEPTIEMBRE OCTUBRE NOVIEMBRE DICIEMBRE
DIA ENERO FEBRERO MARZO
ESTACION CIENTO EN EL RIO GATUNConcentraciones de Sedimentos Suspendidos (mg/l) y Caudales Sólidos Promedios Diarios (t/d)
LATITUD 9º 17' 52'' N LONGITUD 79º 43' 41'' O Área de Drenaje:
Total Anual: 176 t/año/km²20586 t/año Producción Anual:
44 Autoridad del Canal de Panamá Anuario de Sedimentos Suspendidos 1998-2004

Año: 1999 117 km²
mg/l t/d mg/l t/d mg/l t/d mg/l t/d mg/l t/d mg/l t/d1 18.0 11.5 4.9 1.10 4.7 0.771 4.6 0.749 29.8 18.2 155.9 2442 21.0 14.9 4.9 1.06 4.6 0.729 4.5 0.631 5.0 1.18 174.8 2593 101.1 116 4.9 1.02 4.6 0.690 4.4 0.545 14.0 4.60 34.9 32.74 17.0 10.3 4.8 0.98 4.5 0.651 4.3 0.510 7.5 2.35 9.9 4.085 13.5 7.03 4.8 0.946 4.5 0.667 4.3 0.486 4.8 0.956 13.7 5.936 12.8 6.48 4.8 0.908 4.6 0.721 4.3 0.469 4.6 0.727 395.5 9377 11.9 5.68 4.7 0.872 4.5 0.625 4.2 0.417 4.8 0.893 92.7 1418 11.4 5.30 4.7 0.836 4.5 0.610 4.2 0.412 4.7 0.795 116.5 1629 11.1 5.09 4.7 0.801 4.5 0.599 9.2 1.68 523.1 2381 39.2 39.0
10 10.2 4.40 4.6 0.767 4.4 0.590 12.8 5.19 64.0 88.1 15.3 8.6611 9.6 3.97 4.6 0.735 4.4 0.582 4.8 0.924 60.1 58.9 10.8 4.8512 8.9 3.50 4.6 0.711 4.4 0.574 4.6 0.710 23.7 16.2 197.5 29513 8.4 3.15 4.6 0.690 4.4 0.566 4.5 0.626 8.1 2.93 51.2 53.314 8.1 2.99 4.5 0.669 4.4 0.558 43.1 13.6 6.1 1.82 57.7 69.815 8.0 2.89 4.5 0.648 4.4 0.550 5.8 1.29 5.1 1.28 28.9 23.916 7.9 2.84 4.5 0.628 17.6 8.69 4.7 0.806 7.4 2.01 26.4 19.317 7.7 2.70 4.9 0.800 7.8 2.72 4.5 0.628 10.5 4.25 13.6 7.1218 7.5 2.59 8.3 2.70 5.8 1.56 4.4 0.567 6.5 2.02 252.8 45819 7.2 2.44 7.7 2.66 4.7 0.790 4.3 0.505 5.1 1.26 41.2 40.020 6.9 2.26 5.4 1.46 4.5 0.662 4.3 0.459 246.5 234 17.0 10.321 6.5 2.02 5.1 1.27 4.5 0.605 4.2 0.436 31.0 20.4 12.7 6.3322 6.0 1.79 5.0 1.13 4.4 0.570 4.2 0.415 5.7 1.64 19.3 12.423 5.8 1.67 4.9 1.05 4.4 0.551 4.2 0.420 5.0 1.15 25.9 20.224 5.6 1.56 4.9 1.00 4.4 0.539 4.8 0.579 4.9 1.05 17.1 10.525 5.3 1.46 4.8 0.942 4.4 0.525 5.4 1.39 5.1 1.14 15.3 8.7026 5.2 1.37 4.8 0.902 4.3 0.511 7.9 1.74 4.8 0.968 12.7 6.2527 5.1 1.32 4.7 0.857 4.3 0.497 17.8 8.77 9.5 2.98 50.8 46.728 5.1 1.27 4.7 0.813 18.3 4.23 5.0 1.11 4.9 0.995 33.8 31.029 5.0 1.23 11.6 4.79 5.2 1.15 4.7 0.795 15.2 8.6530 5.0 1.19 5.3 1.38 104.9 102 6.1 1.40 30.1 19.931 5.0 1.15 4.8 0.934 6.3 1.59
Total 232 29.0 39.0 149 2857 2985
mg/l t/d mg/l t/d mg/l t/d mg/l t/d mg/l t/d mg/l t/d1 213.7 232 26.7 21.7 28.5 22.4 12.2 5.97 22.1 16.3 320.5 9292 116.7 134 31.1 26.7 14.3 7.76 10.0 4.25 18.6 12.1 135.1 3423 13.3 6.88 35.3 34.2 16.7 9.77 10.4 4.46 457.4 1242 92.0 174 13.7 7.19 29.7 26.8 15.5 8.81 8.9 3.52 398.4 1500 572.7 22695 12.9 6.57 30.0 25.2 13.0 6.64 8.3 3.10 372.3 1533 122.7 2916 11.1 5.03 22.0 16.0 12.3 6.01 228.1 399 239.0 704 111.0 1997 9.3 3.75 17.4 10.9 11.7 5.59 31.4 26.1 220.1 662 601.4 39848 8.4 3.15 16.2 9.63 12.3 5.99 17.2 10.2 369.7 1774 227.1 7739 51.4 36.6 14.7 8.19 188.9 231 15.6 8.77 89.0 169 87.0 167
10 36.6 32.1 15.0 8.47 24.7 16.7 46.6 39.3 59.4 83.2 62.3 95.111 12.0 5.75 16.3 9.69 10.0 4.27 18.7 12.0 62.7 89.8 128.7 27612 11.3 5.19 55.1 68.3 14.4 7.36 12.2 5.94 282.5 631 388.6 120313 10.2 4.38 311.4 771 56.1 55.3 10.3 4.45 123.0 211 160.8 41414 9.2 3.69 104.2 219 27.0 21.4 9.6 3.94 37.9 40.5 169.5 47215 10.0 4.22 45.2 53.1 13.3 6.88 10.0 4.16 28.4 25.1 168.9 50416 57.9 36.2 23.7 18.3 120.5 95.1 11.0 4.92 285.7 852 525.9 245017 11.8 5.42 17.7 11.2 53.9 43.7 8.9 3.49 60.1 83.6 212.9 68718 10.1 4.10 15.1 8.60 24.6 18.0 8.6 3.29 31.5 29.8 607.2 241219 19.0 10.8 73.0 77.6 12.6 6.29 30.6 19.1 24.5 19.5 165.4 46420 12.0 5.68 255.7 519 190.9 259 15.2 8.09 24.0 18.8 433.2 174321 327.5 770 91.1 95.8 19.0 12.0 20.3 12.9 22.6 17.0 181.0 55822 145.3 303 111.0 194 10.8 4.85 149.3 162 19.8 13.6 99.1 20823 595.6 3293 65.5 88.0 9.4 3.85 16.8 10.0 57.9 78.7 66.6 10624 78.0 133 40.3 42.2 9.3 3.74 69.0 60.4 54.3 66.4 51.1 67.925 36.1 37.2 30.4 25.0 16.7 8.35 58.3 74.6 37.4 39.5 45.6 56.126 24.9 20.1 27.9 22.7 21.9 15.2 674.4 3755 44.0 46.1 84.2 12227 65.7 91.1 24.0 18.5 30.9 27.0 161.1 431 26.2 21.7 271.5 60528 30.8 28.6 17.3 10.7 31.7 21.6 686.2 4255 25.3 19.7 342.4 128229 24.4 19.2 14.7 8.14 45.5 43.9 84.3 152 37.3 36.1 50.2 63.530 20.9 14.7 14.2 7.72 24.6 17.7 37.4 39.5 21.0 15.0 82.9 11731 20.0 13.8 19.2 11.3 29.8 25.7 404.5 1360
Total 5276 2468 996 9552 10049 24399
4.2 Promedio Anual: 185.2686.2 Máxima Instantáne
9
a 1244.9
ESTACION CIENTO EN EL RIO GATUNConcentraciones de Sedimentos Suspendidos (mg/l) y Caudales Sólidos Promedios Diarios (t/d)
LATITUD 9º 17' 52'' N LONGITUD 79º 43' 41'' O Área de Drenaje:
Total Anual: 505 t/año/km²59032 t/año Producción Anual:
Concentración de Sedimentos Suspendidos (mg/l) Mínimo Diario: Máximo Diario:
DIA JULIO AGOSTO SEPTIEMBRE OCTUBRE NOVIEMBRE DICIEMBRE
ABRIL MAYO JUNIODIA ENERO FEBRERO MARZO
Autoridad del Canal de Panamá 45 Anuario de Sedimentos Suspendidos 1998-2004
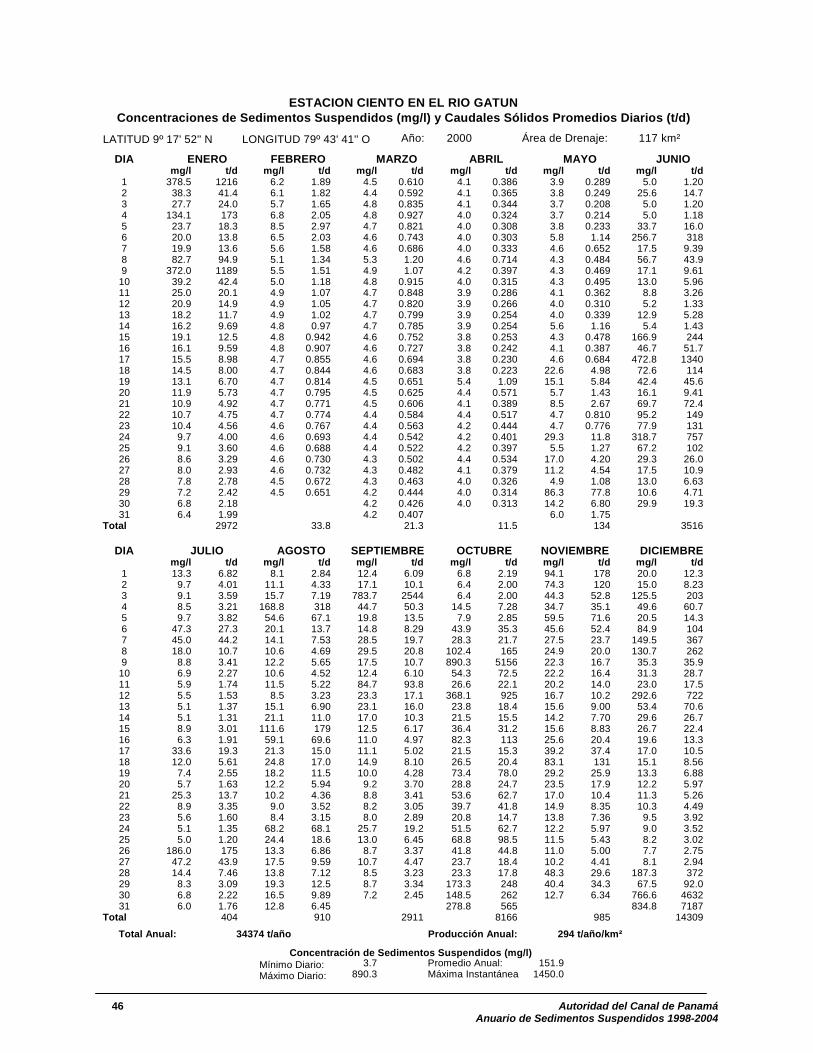
Año: 2000 117 km²
mg/l t/d mg/l t/d mg/l t/d mg/l t/d mg/l t/d mg/l t/d1 378.5 1216 6.2 1.89 4.5 0.610 4.1 0.386 3.9 0.289 5.0 1.202 38.3 41.4 6.1 1.82 4.4 0.592 4.1 0.365 3.8 0.249 25.6 14.73 27.7 24.0 5.7 1.65 4.8 0.835 4.1 0.344 3.7 0.208 5.0 1.204 134.1 173 6.8 2.05 4.8 0.927 4.0 0.324 3.7 0.214 5.0 1.185 23.7 18.3 8.5 2.97 4.7 0.821 4.0 0.308 3.8 0.233 33.7 16.06 20.0 13.8 6.5 2.03 4.6 0.743 4.0 0.303 5.8 1.14 256.7 3187 19.9 13.6 5.6 1.58 4.6 0.686 4.0 0.333 4.6 0.652 17.5 9.398 82.7 94.9 5.1 1.34 5.3 1.20 4.6 0.714 4.3 0.484 56.7 43.99 372.0 1189 5.5 1.51 4.9 1.07 4.2 0.397 4.3 0.469 17.1 9.6110 39.2 42.4 5.0 1.18 4.8 0.915 4.0 0.315 4.3 0.495 13.0 5.9611 25.0 20.1 4.9 1.07 4.7 0.848 3.9 0.286 4.1 0.362 8.8 3.2612 20.9 14.9 4.9 1.05 4.7 0.820 3.9 0.266 4.0 0.310 5.2 1.3313 18.2 11.7 4.9 1.02 4.7 0.799 3.9 0.254 4.0 0.339 12.9 5.2814 16.2 9.69 4.8 0.97 4.7 0.785 3.9 0.254 5.6 1.16 5.4 1.4315 19.1 12.5 4.8 0.942 4.6 0.752 3.8 0.253 4.3 0.478 166.9 24416 16.1 9.59 4.8 0.907 4.6 0.727 3.8 0.242 4.1 0.387 46.7 51.717 15.5 8.98 4.7 0.855 4.6 0.694 3.8 0.230 4.6 0.684 472.8 134018 14.5 8.00 4.7 0.844 4.6 0.683 3.8 0.223 22.6 4.98 72.6 11419 13.1 6.70 4.7 0.814 4.5 0.651 5.4 1.09 15.1 5.84 42.4 45.620 11.9 5.73 4.7 0.795 4.5 0.625 4.4 0.571 5.7 1.43 16.1 9.4121 10.9 4.92 4.7 0.771 4.5 0.606 4.1 0.389 8.5 2.67 69.7 72.422 10.7 4.75 4.7 0.774 4.4 0.584 4.4 0.517 4.7 0.810 95.2 14923 10.4 4.56 4.6 0.767 4.4 0.563 4.2 0.444 4.7 0.776 77.9 13124 9.7 4.00 4.6 0.693 4.4 0.542 4.2 0.401 29.3 11.8 318.7 75725 9.1 3.60 4.6 0.688 4.4 0.522 4.2 0.397 5.5 1.27 67.2 10226 8.6 3.29 4.6 0.730 4.3 0.502 4.4 0.534 17.0 4.20 29.3 26.027 8.0 2.93 4.6 0.732 4.3 0.482 4.1 0.379 11.2 4.54 17.5 10.928 7.8 2.78 4.5 0.672 4.3 0.463 4.0 0.326 4.9 1.08 13.0 6.6329 7.2 2.42 4.5 0.651 4.2 0.444 4.0 0.314 86.3 77.8 10.6 4.7130 6.8 2.18 4.2 0.426 4.0 0.313 14.2 6.80 29.9 19.331 6.4 1.99 4.2 0.407 6.0 1.75
Total 2972 33.8 21.3 11.5 134 3516
mg/l t/d mg/l t/d mg/l t/d mg/l t/d mg/l t/d mg/l t/d1 13.3 6.82 8.1 2.84 12.4 6.09 6.8 2.19 94.1 178 20.0 12.32 9.7 4.01 11.1 4.33 17.1 10.1 6.4 2.00 74.3 120 15.0 8.233 9.1 3.59 15.7 7.19 783.7 2544 6.4 2.00 44.3 52.8 125.5 2034 8.5 3.21 168.8 318 44.7 50.3 14.5 7.28 34.7 35.1 49.6 60.75 9.7 3.82 54.6 67.1 19.8 13.5 7.9 2.85 59.5 71.6 20.5 14.36 47.3 27.3 20.1 13.7 14.8 8.29 43.9 35.3 45.6 52.4 84.9 1047 45.0 44.2 14.1 7.53 28.5 19.7 28.3 21.7 27.5 23.7 149.5 3678 18.0 10.7 10.6 4.69 29.5 20.8 102.4 165 24.9 20.0 130.7 2629 8.8 3.41 12.2 5.65 17.5 10.7 890.3 5156 22.3 16.7 35.3 35.910 6.9 2.27 10.6 4.52 12.4 6.10 54.3 72.5 22.2 16.4 31.3 28.711 5.9 1.74 11.5 5.22 84.7 93.8 26.6 22.1 20.2 14.0 23.0 17.512 5.5 1.53 8.5 3.23 23.3 17.1 368.1 925 16.7 10.2 292.6 72213 5.1 1.37 15.1 6.90 23.1 16.0 23.8 18.4 15.6 9.00 53.4 70.614 5.1 1.31 21.1 11.0 17.0 10.3 21.5 15.5 14.2 7.70 29.6 26.715 8.9 3.01 111.6 179 12.5 6.17 36.4 31.2 15.6 8.83 26.7 22.416 6.3 1.91 59.1 69.6 11.0 4.97 82.3 113 25.6 20.4 19.6 13.317 33.6 19.3 21.3 15.0 11.1 5.02 21.5 15.3 39.2 37.4 17.0 10.518 12.0 5.61 24.8 17.0 14.9 8.10 26.5 20.4 83.1 131 15.1 8.5619 7.4 2.55 18.2 11.5 10.0 4.28 73.4 78.0 29.2 25.9 13.3 6.8820 5.7 1.63 12.2 5.94 9.2 3.70 28.8 24.7 23.5 17.9 12.2 5.9721 25.3 13.7 10.2 4.36 8.8 3.41 53.6 62.7 17.0 10.4 11.3 5.2622 8.9 3.35 9.0 3.52 8.2 3.05 39.7 41.8 14.9 8.35 10.3 4.4923 5.6 1.60 8.4 3.15 8.0 2.89 20.8 14.7 13.8 7.36 9.5 3.9224 5.1 1.35 68.2 68.1 25.7 19.2 51.5 62.7 12.2 5.97 9.0 3.5225 5.0 1.20 24.4 18.6 13.0 6.45 68.8 98.5 11.5 5.43 8.2 3.0226 186.0 175 13.3 6.86 8.7 3.37 41.8 44.8 11.0 5.00 7.7 2.7527 47.2 43.9 17.5 9.59 10.7 4.47 23.7 18.4 10.2 4.41 8.1 2.9428 14.4 7.46 13.8 7.12 8.5 3.23 23.3 17.8 48.3 29.6 187.3 37229 8.3 3.09 19.3 12.5 8.7 3.34 173.3 248 40.4 34.3 67.5 92.030 6.8 2.22 16.5 9.89 7.2 2.45 148.5 262 12.7 6.34 766.6 463231 6.0 1.76 12.8 6.45 278.8 565 834.8 7187
Total 404 910 2911 8166 985 14309
3.7 Promedio Anual: 151.9890.3 Máxima Instantánea 1450.0
DIA ENERO FEBRERO MARZO
ESTACION CIENTO EN EL RIO GATUN
Área de Drenaje:
Concentraciones de Sedimentos Suspendidos (mg/l) y Caudales Sólidos Promedios Diarios (t/d)LATITUD 9º 17' 52'' N LONGITUD 79º 43' 41'' O
OCTUBRE NOVIEMBRE DICIEMBRE
Total Anual: 294 t/año/km²34374 t/año Producción Anual:
Mínimo Diario: Máximo Diario:
Concentración de Sedimentos Suspendidos (mg/l)
ABRIL MAYO JUNIO
DIA JULIO AGOSTO SEPTIEMBRE
46 Autoridad del Canal de Panamá Anuario de Sedimentos Suspendidos 1998-2004
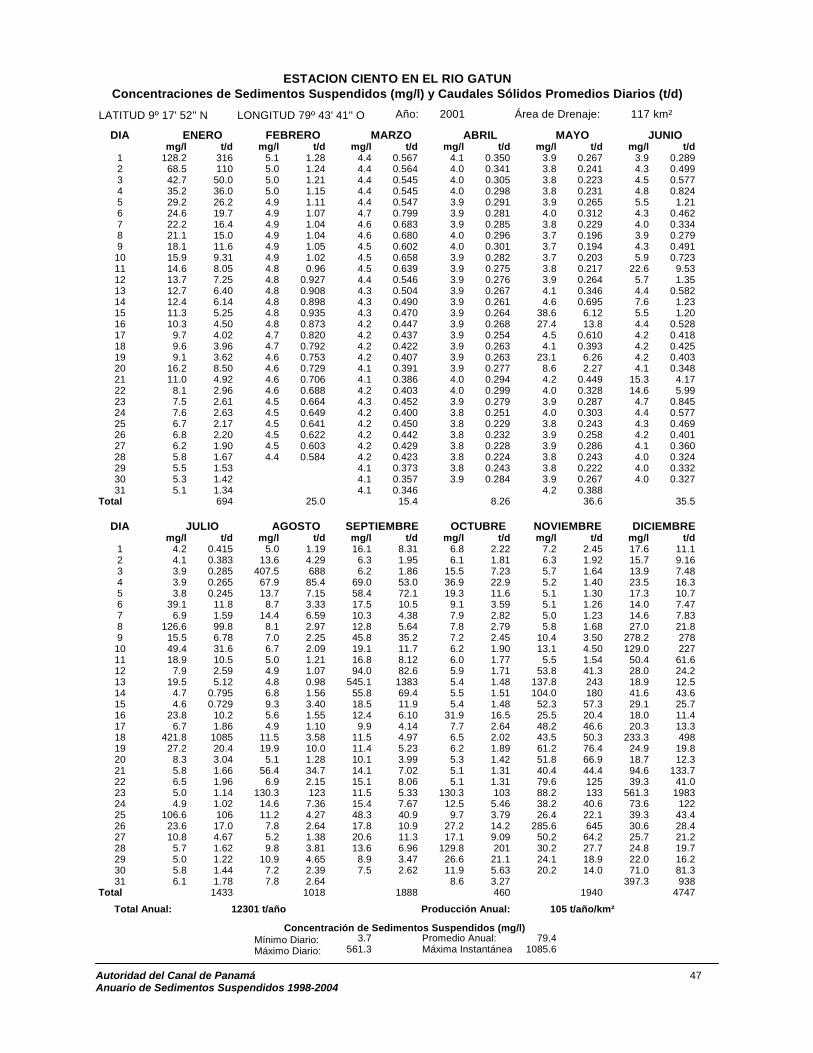
Año: 2001 117 km²
mg/l t/d mg/l t/d mg/l t/d mg/l t/d mg/l t/d mg/l t/d1 128.2 316 5.1 1.28 4.4 0.567 4.1 0.350 3.9 0.267 3.9 0.2892 68.5 110 5.0 1.24 4.4 0.564 4.0 0.341 3.8 0.241 4.3 0.4993 42.7 50.0 5.0 1.21 4.4 0.545 4.0 0.305 3.8 0.223 4.5 0.5774 35.2 36.0 5.0 1.15 4.4 0.545 4.0 0.298 3.8 0.231 4.8 0.8245 29.2 26.2 4.9 1.11 4.4 0.547 3.9 0.291 3.9 0.265 5.5 1.216 24.6 19.7 4.9 1.07 4.7 0.799 3.9 0.281 4.0 0.312 4.3 0.4627 22.2 16.4 4.9 1.04 4.6 0.683 3.9 0.285 3.8 0.229 4.0 0.3348 21.1 15.0 4.9 1.04 4.6 0.680 4.0 0.296 3.7 0.196 3.9 0.2799 18.1 11.6 4.9 1.05 4.5 0.602 4.0 0.301 3.7 0.194 4.3 0.49110 15.9 9.31 4.9 1.02 4.5 0.658 3.9 0.282 3.7 0.203 5.9 0.72311 14.6 8.05 4.8 0.96 4.5 0.639 3.9 0.275 3.8 0.217 22.6 9.5312 13.7 7.25 4.8 0.927 4.4 0.546 3.9 0.276 3.9 0.264 5.7 1.3513 12.7 6.40 4.8 0.908 4.3 0.504 3.9 0.267 4.1 0.346 4.4 0.58214 12.4 6.14 4.8 0.898 4.3 0.490 3.9 0.261 4.6 0.695 7.6 1.2315 11.3 5.25 4.8 0.935 4.3 0.470 3.9 0.264 38.6 6.12 5.5 1.2016 10.3 4.50 4.8 0.873 4.2 0.447 3.9 0.268 27.4 13.8 4.4 0.52817 9.7 4.02 4.7 0.820 4.2 0.437 3.9 0.254 4.5 0.610 4.2 0.41818 9.6 3.96 4.7 0.792 4.2 0.422 3.9 0.263 4.1 0.393 4.2 0.42519 9.1 3.62 4.6 0.753 4.2 0.407 3.9 0.263 23.1 6.26 4.2 0.40320 16.2 8.50 4.6 0.729 4.1 0.391 3.9 0.277 8.6 2.27 4.1 0.34821 11.0 4.92 4.6 0.706 4.1 0.386 4.0 0.294 4.2 0.449 15.3 4.1722 8.1 2.96 4.6 0.688 4.2 0.403 4.0 0.299 4.0 0.328 14.6 5.9923 7.5 2.61 4.5 0.664 4.3 0.452 3.9 0.279 3.9 0.287 4.7 0.84524 7.6 2.63 4.5 0.649 4.2 0.400 3.8 0.251 4.0 0.303 4.4 0.57725 6.7 2.17 4.5 0.641 4.2 0.450 3.8 0.229 3.8 0.243 4.3 0.46926 6.8 2.20 4.5 0.622 4.2 0.442 3.8 0.232 3.9 0.258 4.2 0.40127 6.2 1.90 4.5 0.603 4.2 0.429 3.8 0.228 3.9 0.286 4.1 0.36028 5.8 1.67 4.4 0.584 4.2 0.423 3.8 0.224 3.8 0.243 4.0 0.32429 5.5 1.53 4.1 0.373 3.8 0.243 3.8 0.222 4.0 0.33230 5.3 1.42 4.1 0.357 3.9 0.284 3.9 0.267 4.0 0.32731 5.1 1.34 4.1 0.346 4.2 0.388
Total 694 25.0 15.4 8.26 36.6 35.5
mg/l t/d mg/l t/d mg/l t/d mg/l t/d mg/l t/d mg/l t/d1 4.2 0.415 5.0 1.19 16.1 8.31 6.8 2.22 7.2 2.45 17.6 11.12 4.1 0.383 13.6 4.29 6.3 1.95 6.1 1.81 6.3 1.92 15.7 9.163 3.9 0.285 407.5 688 6.2 1.86 15.5 7.23 5.7 1.64 13.9 7.484 3.9 0.265 67.9 85.4 69.0 53.0 36.9 22.9 5.2 1.40 23.5 16.35 3.8 0.245 13.7 7.15 58.4 72.1 19.3 11.6 5.1 1.30 17.3 10.76 39.1 11.8 8.7 3.33 17.5 10.5 9.1 3.59 5.1 1.26 14.0 7.477 6.9 1.59 14.4 6.59 10.3 4.38 7.9 2.82 5.0 1.23 14.6 7.838 126.6 99.8 8.1 2.97 12.8 5.64 7.8 2.79 5.8 1.68 27.0 21.89 15.5 6.78 7.0 2.25 45.8 35.2 7.2 2.45 10.4 3.50 278.2 27810 49.4 31.6 6.7 2.09 19.1 11.7 6.2 1.90 13.1 4.50 129.0 22711 18.9 10.5 5.0 1.21 16.8 8.12 6.0 1.77 5.5 1.54 50.4 61.612 7.9 2.59 4.9 1.07 94.0 82.6 5.9 1.71 53.8 41.3 28.0 24.213 19.5 5.12 4.8 0.98 545.1 1383 5.4 1.48 137.8 243 18.9 12.514 4.7 0.795 6.8 1.56 55.8 69.4 5.5 1.51 104.0 180 41.6 43.615 4.6 0.729 9.3 3.40 18.5 11.9 5.4 1.48 52.3 57.3 29.1 25.716 23.8 10.2 5.6 1.55 12.4 6.10 31.9 16.5 25.5 20.4 18.0 11.417 6.7 1.86 4.9 1.10 9.9 4.14 7.7 2.64 48.2 46.6 20.3 13.318 421.8 1085 11.5 3.58 11.5 4.97 6.5 2.02 43.5 50.3 233.3 49819 27.2 20.4 19.9 10.0 11.4 5.23 6.2 1.89 61.2 76.4 24.9 19.820 8.3 3.04 5.1 1.28 10.1 3.99 5.3 1.42 51.8 66.9 18.7 12.321 5.8 1.66 56.4 34.7 14.1 7.02 5.1 1.31 40.4 44.4 94.6 133.722 6.5 1.96 6.9 2.15 15.1 8.06 5.1 1.31 79.6 125 39.3 41.023 5.0 1.14 130.3 123 11.5 5.33 130.3 103 88.2 133 561.3 198324 4.9 1.02 14.6 7.36 15.4 7.67 12.5 5.46 38.2 40.6 73.6 1225 106.6 106 11.2 4.27 48.3 40.9 9.7 3.79 26.4 22.1 39.3 43.426 23.6 17.0 7.8 2.64 17.8 10.9 27.2 14.2 285.6 645 30.6 28.427 10.8 4.67 5.2 1.38 20.6 11.3 17.1 9.09 50.2 64.2 25.7 21.228 5.7 1.62 9.8 3.81 13.6 6.96 129.8 201 30.2 27.7 24.8 19.729 5.0 1.22 10.9 4.65 8.9 3.47 26.6 21.1 24.1 18.9 22.0 16.230 5.8 1.44 7.2 2.39 7.5 2.62 11.9 5.63 20.2 14.0 71.0 81.331 6.1 1.78 7.8 2.64 8.6 3.27 397.3 938
Total 1433 1018 1888 460 1940 4747
3.7 Promedio Anual: 79.4561.3 Máxima Instantáne
2
a 1085.6
105 t/año/km²12301 t/año Producción Anual:
DIA FEBRERO MARZO
Total Anual:
ESTACION CIENTO EN EL RIO GATUN
Área de Drenaje:
Concentraciones de Sedimentos Suspendidos (mg/l) y Caudales Sólidos Promedios Diarios (t/d)LATITUD 9º 17' 52'' N LONGITUD 79º 43' 41'' O
Máximo Diario:
DIA JULIO AGOSTO
ABRIL ENERO
Concentración de Sedimentos Suspendidos (mg/l) Mínimo Diario:
SEPTIEMBRE OCTUBRE NOVIEMBRE DICIEMBRE
MAYO JUNIO
Autoridad del Canal de Panamá 47 Anuario de Sedimentos Suspendidos 1998-2004

Año: 2002 117 km²
mg/l t/d mg/l t/d mg/l t/d mg/l t/d mg/l t/d mg/l t/d1 86.7 140 5.1 1.33 4.3 0.497 4.0 0.341 4.4 0.583 4.2 0.4252 29.7 27.0 5.1 1.32 4.3 0.513 4.0 0.341 4.3 0.519 4.6 0.5953 22.6 17.0 5.4 1.48 4.3 0.490 4.0 0.341 4.3 0.460 4.6 0.7424 23.0 17.1 5.5 1.54 4.3 0.479 4.0 0.341 4.2 0.418 8.3 1.495 19.2 12.9 5.0 1.22 4.2 0.453 4.1 0.370 4.1 0.383 8.3 2.376 16.5 9.91 5.0 1.13 4.3 0.463 4.1 0.343 4.1 0.376 4.6 0.6887 19.6 13.0 4.9 1.07 4.3 0.481 4.0 0.341 4.1 0.379 53.9 31.18 16.9 10.4 4.9 1.06 4.3 0.474 4.0 0.341 4.2 0.414 13.1 5.309 42.9 41.3 4.9 1.01 4.3 0.458 4.0 0.341 4.2 0.449 4.8 0.946
10 17.7 11.2 4.8 0.97 4.3 0.462 4.0 0.341 4.4 0.554 9.1 2.9011 14.1 7.66 4.8 0.932 4.2 0.449 4.1 0.344 4.2 0.417 4.7 0.78612 12.4 6.10 4.9 0.99 4.2 0.424 4.1 0.373 4.1 0.368 4.5 0.62913 11.6 5.50 4.8 0.95 4.2 0.410 4.1 0.361 4.1 0.345 4.8 0.86914 11.0 4.99 4.7 0.847 4.2 0.410 4.1 0.352 4.0 0.319 4.6 0.72015 10.5 4.63 4.7 0.811 4.2 0.400 4.1 0.355 4.0 0.312 4.8 0.87816 10.1 4.29 4.6 0.763 4.1 0.380 4.1 0.360 4.0 0.317 4.6 0.70417 9.7 4.01 4.6 0.731 4.1 0.375 4.2 0.430 4.6 0.674 70.7 57.018 9.1 3.61 4.6 0.706 4.1 0.376 4.3 0.515 11.2 3.36 11.8 4.8919 8.7 3.35 4.6 0.704 5.5 0.881 13.9 4.79 5.1 1.05 4.9 1.0420 8.0 2.92 4.6 0.681 4.6 0.693 4.8 0.927 4.8 0.905 4.7 0.77121 7.6 2.69 4.5 0.642 4.3 0.495 5.3 1.26 5.5 1.35 4.5 0.65422 7.3 2.50 4.5 0.633 5.2 0.98 4.8 0.950 8.7 2.85 4.4 0.56423 6.8 2.22 4.5 0.610 6.2 1.52 8.0 2.47 6.7 1.88 4.4 0.55124 6.5 2.05 4.4 0.591 5.0 1.13 11.6 4.58 4.7 0.809 4.5 0.62025 6.1 1.83 4.4 0.563 4.6 0.685 16.8 8.87 8.6 1.80 4.4 0.56926 5.7 1.64 4.4 0.547 4.4 0.519 8.5 3.09 7.3 2.09 4.4 0.54927 5.5 1.53 4.4 0.527 4.3 0.453 29.4 24.1 7.2 2.09 4.3 0.49128 5.4 1.47 4.3 0.506 4.2 0.406 8.1 2.84 4.7 0.822 4.3 0.47829 5.1 1.34 4.1 0.388 4.9 1.03 4.4 0.586 4.5 0.62130 5.1 1.31 4.1 0.366 4.6 0.720 4.3 0.502 4.4 0.57431 5.1 1.33 4.1 0.357 4.3 0.460
Total 367 24.9 16.9 62.1 27.8
mg/l t/d mg/l t/d mg/l t/d mg/l t/d mg/l t/d mg/l t/d1 4.3 0.456 9.6 3.54 8.5 3.21 96.5 74.4 15.8 9.06 58.9 83.22 4.1 0.389 7.6 2.58 8.4 3.12 43.1 44.2 19.9 12.7 38.1 41.03 4.4 0.567 5.8 1.70 10.7 4.36 16.3 9.51 18.1 11.4 30.5 28.34 4.2 0.426 91.1 49.5 7.9 2.82 59.6 67.3 14.0 7.51 24.9 20.05 259.2 326 27.1 18.5 11.6 4.91 21.4 15.0 14.6 7.67 20.8 14.76 7.1 1.90 6.6 2.07 9.7 3.87 23.7 16.0 17.4 10.5 18.0 11.67 62.1 60.4 5.3 1.41 6.5 2.03 17.1 10.4 80.4 87.4 16.2 9.68 6.5 1.97 45.5 25.6 6.3 1.94 12.5 6.17 28.2 23.5 14.8 8.39 26.9 8.63 8.5 3.19 30.4 15.8 10.6 4.69 16.5 9.91 14.2 7.75
10 9.8 2.33 5.6 1.61 530.0 1339 25.2 17.0 13.4 7.01 13.3 6.8711 134.9 158 5.2 1.38 30.8 26.6 414.7 896 13.1 6.69 12.3 6.0612 15.4 8.21 5.0 1.12 16.9 10.3 21.9 15.9 39.8 29.2 10.9 4.913 6.7 2.10 4.9 1.07 12.4 6.10 15.6 9.06 486.7 1236 10.1 4.3114 5.0 1.17 4.8 0.933 11.2 5.14 12.8 6.47 67.4 90.3 9.8 4.1015 30.2 15.8 4.7 0.858 15.1 8.01 13.2 6.72 25.5 20.7 9.8 4.1016 19.8 12.2 4.7 0.858 23.4 15.5 26.6 19.0 20.9 14.7 9.3 3.7417 10.7 4.69 4.8 0.97 200.7 324 19.3 12.4 516.1 1153 8.9 3.4918 52.9 51.3 4.8 0.876 37.1 36.2 35.3 29.1 55.6 65.8 8.7 3.3319 15.7 8.68 5.2 1.19 27.6 21.7 15.5 8.91 29.9 26.5 8.4 3.1920 15.6 8.31 13.9 5.79 16.4 9.76 40.3 29.9 20.1 13.8 7.9 2.8621 6.8 2.20 59.6 37.1 13.3 6.89 40.1 36.8 78.9 74.2 8.3 3.022 5.3 1.41 9.6 3.64 12.5 6.16 28.1 23.9 74.2 111 7.8 2.7823 5.0 1.14 43.4 29.7 14.1 7.48 22.0 16.0 115.8 236 7.6 2.624 4.9 0.99 21.0 13.6 10.6 4.69 15.5 8.92 45.4 55.6 7.4 2.525 4.9 1.04 12.5 6.14 10.1 4.30 14.6 8.01 39.4 43.5 6.8 2.226 6.4 1.75 312.4 684 14.7 7.50 12.0 5.79 29.1 26.2 6.4 1.927 9.3 2.90 214.4 395 12.1 5.61 55.2 45.7 25.0 20.2 6.2 1.828 4.8 0.97 58.1 74.0 8.9 3.47 63.3 62.7 22.0 16.3 5.7 1.6529 15.1 5.09 18.9 12.5 8.4 3.13 27.3 22.7 24.1 18.7 5.7 1.6330 28.5 18.6 13.6 7.07 7.8 2.80 17.3 10.6 718.6 3450 5.4 1.5031 11.8 5.01 10.1 4.29 14.0 7.52 5.4 1.48
Total 715 1392 1897 1547 6895 295
4.0 Promedio Anual: 83.6718.6 Máxima Instantáne
121
51
2
7
44297
a 1369.3
ESTACION CIENTO EN EL RIO GATUN
Área de Drenaje:
Concentraciones de Sedimentos Suspendidos (mg/l) y Caudales Sólidos Promedios Diarios (t/d)LATITUD 9º 17' 52'' N LONGITUD 79º 43' 41'' O
Mínimo Diario: Máximo Diario:
MAYO JUNIO
Producción Anual: 114 t/año/km²
AGOSTO SEPTIEMBRE
13360 t/año
Concentración de Sedimentos Suspendidos (mg/l)
Total Anual:
OCTUBRE NOVIEMBRE DICIEMBRE
DIA FEBRERO MARZO ABRIL ENERO
DIA JULIO
48 Autoridad del Canal de Panamá Anuario de Sedimentos Suspendidos 1998-2004
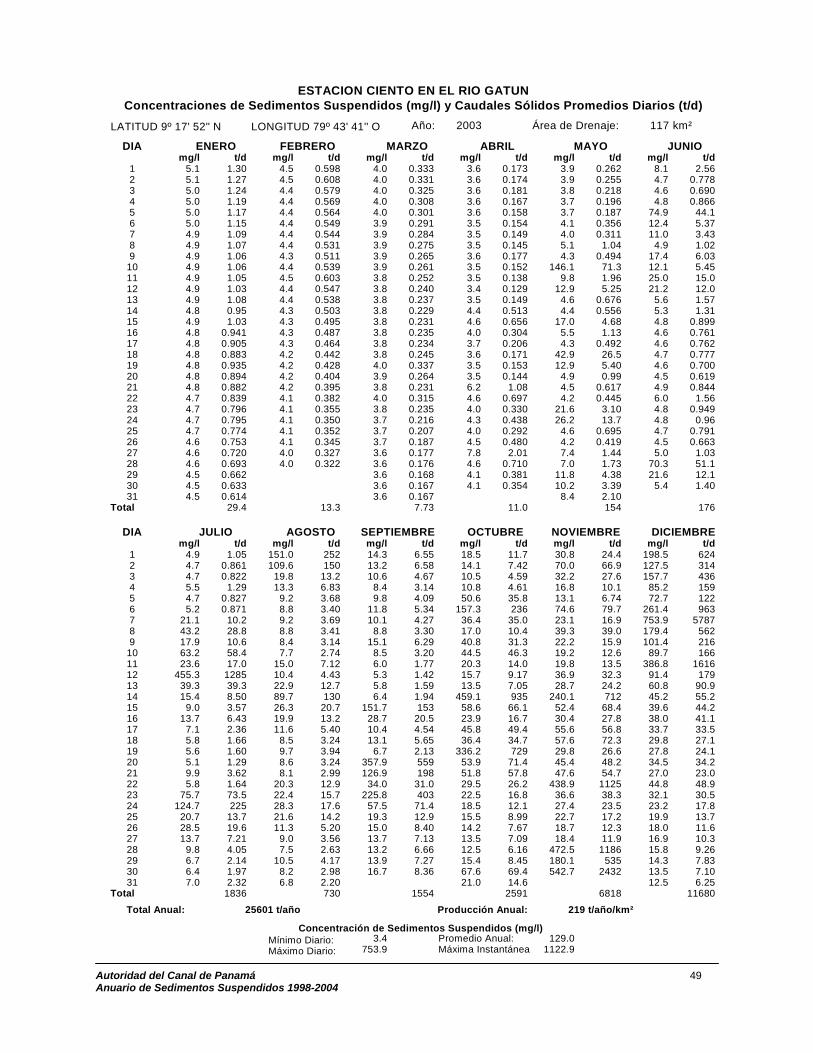
Año: 2003 117 km²
mg/l t/d mg/l t/d mg/l t/d mg/l t/d mg/l t/d mg/l t/d1 5.1 1.30 4.5 0.598 4.0 0.333 3.6 0.173 3.9 0.262 8.1 2.562 5.1 1.27 4.5 0.608 4.0 0.331 3.6 0.174 3.9 0.255 4.7 0.7783 5.0 1.24 4.4 0.579 4.0 0.325 3.6 0.181 3.8 0.218 4.6 0.6904 5.0 1.19 4.4 0.569 4.0 0.308 3.6 0.167 3.7 0.196 4.8 0.8665 5.0 1.17 4.4 0.564 4.0 0.301 3.6 0.158 3.7 0.187 74.9 44.16 5.0 1.15 4.4 0.549 3.9 0.291 3.5 0.154 4.1 0.356 12.4 5.377 4.9 1.09 4.4 0.544 3.9 0.284 3.5 0.149 4.0 0.311 11.0 3.438 4.9 1.07 4.4 0.531 3.9 0.275 3.5 0.145 5.1 1.04 4.9 1.029 4.9 1.06 4.3 0.511 3.9 0.265 3.6 0.177 4.3 0.494 17.4 6.03
10 4.9 1.06 4.4 0.539 3.9 0.261 3.5 0.152 146.1 71.3 12.1 5.4511 4.9 1.05 4.5 0.603 3.8 0.252 3.5 0.138 9.8 1.96 25.0 15.012 4.9 1.03 4.4 0.547 3.8 0.240 3.4 0.129 12.9 5.25 21.2 12.013 4.9 1.08 4.4 0.538 3.8 0.237 3.5 0.149 4.6 0.676 5.6 1.5714 4.8 0.95 4.3 0.503 3.8 0.229 4.4 0.513 4.4 0.556 5.3 1.3115 4.9 1.03 4.3 0.495 3.8 0.231 4.6 0.656 17.0 4.68 4.8 0.89916 4.8 0.941 4.3 0.487 3.8 0.235 4.0 0.304 5.5 1.13 4.6 0.76117 4.8 0.905 4.3 0.464 3.8 0.234 3.7 0.206 4.3 0.492 4.6 0.76218 4.8 0.883 4.2 0.442 3.8 0.245 3.6 0.171 42.9 26.5 4.7 0.77719 4.8 0.935 4.2 0.428 4.0 0.337 3.5 0.153 12.9 5.40 4.6 0.70020 4.8 0.894 4.2 0.404 3.9 0.264 3.5 0.144 4.9 0.99 4.5 0.61921 4.8 0.882 4.2 0.395 3.8 0.231 6.2 1.08 4.5 0.617 4.9 0.84422 4.7 0.839 4.1 0.382 4.0 0.315 4.6 0.697 4.2 0.445 6.0 1.5623 4.7 0.796 4.1 0.355 3.8 0.235 4.0 0.330 21.6 3.10 4.8 0.94924 4.7 0.795 4.1 0.350 3.7 0.216 4.3 0.438 26.2 13.7 4.8 0.9625 4.7 0.774 4.1 0.352 3.7 0.207 4.0 0.292 4.6 0.695 4.7 0.79126 4.6 0.753 4.1 0.345 3.7 0.187 4.5 0.480 4.2 0.419 4.5 0.66327 4.6 0.720 4.0 0.327 3.6 0.177 7.8 2.01 7.4 1.44 5.0 1.0328 4.6 0.693 4.0 0.322 3.6 0.176 4.6 0.710 7.0 1.73 70.3 51.129 4.5 0.662 3.6 0.168 4.1 0.381 11.8 4.38 21.6 12.130 4.5 0.633 3.6 0.167 4.1 0.354 10.2 3.39 5.4 1.4031 4.5 0.614 3.6 0.167 8.4 2.10
Total 29.4 13.3 7.73 11.0 154 176
mg/l t/d mg/l t/d mg/l t/d mg/l t/d mg/l t/d mg/l t/d1 4.9 1.05 151.0 252 14.3 6.55 18.5 11.7 30.8 24.4 198.5 6242 4.7 0.861 109.6 150 13.2 6.58 14.1 7.42 70.0 66.9 127.5 313 4.7 0.822 19.8 13.2 10.6 4.67 10.5 4.59 32.2 27.6 157.7 434 5.5 1.29 13.3 6.83 8.4 3.14 10.8 4.61 16.8 10.1 85.2 1595 4.7 0.827 9.2 3.68 9.8 4.09 50.6 35.8 13.1 6.74 72.7 1226 5.2 0.871 8.8 3.40 11.8 5.34 157.3 236 74.6 79.7 261.4 9637 21.1 10.2 9.2 3.69 10.1 4.27 36.4 35.0 23.1 16.9 753.9 57878 43.2 28.8 8.8 3.41 8.8 3.30 17.0 10.4 39.3 39.0 179.4 5629 17.9 10.6 8.4 3.14 15.1 6.29 40.8 31.3 22.2 15.9 101.4 216
10 63.2 58.4 7.7 2.74 8.5 3.20 44.5 46.3 19.2 12.6 89.7 16611 23.6 17.0 15.0 7.12 6.0 1.77 20.3 14.0 19.8 13.5 386.8 161612 455.3 1285 10.4 4.43 5.3 1.42 15.7 9.17 36.9 32.3 91.4 17913 39.3 39.3 22.9 12.7 5.8 1.59 13.5 7.05 28.7 24.2 60.8 90.14 15.4 8.50 89.7 130 6.4 1.94 459.1 935 240.1 712 45.2 55.215 9.0 3.57 26.3 20.7 151.7 153 58.6 66.1 52.4 68.4 39.6 44.216 13.7 6.43 19.9 13.2 28.7 20.5 23.9 16.7 30.4 27.8 38.0 41.117 7.1 2.36 11.6 5.40 10.4 4.54 45.8 49.4 55.6 56.8 33.7 33.18 5.8 1.66 8.5 3.24 13.1 5.65 36.4 34.7 57.6 72.3 29.8 27.119 5.6 1.60 9.7 3.94 6.7 2.13 336.2 729 29.8 26.6 27.8 24.120 5.1 1.29 8.6 3.24 357.9 559 53.9 71.4 45.4 48.2 34.5 34.221 9.9 3.62 8.1 2.99 126.9 198 51.8 57.8 47.6 54.7 27.0 23.022 5.8 1.64 20.3 12.9 34.0 31.0 29.5 26.2 438.9 1125 44.8 48.923 75.7 73.5 22.4 15.7 225.8 403 22.5 16.8 36.6 38.3 32.1 30.524 124.7 225 28.3 17.6 57.5 71.4 18.5 12.1 27.4 23.5 23.2 17.825 20.7 13.7 21.6 14.2 19.3 12.9 15.5 8.99 22.7 17.2 19.9 13.726 28.5 19.6 11.3 5.20 15.0 8.40 14.2 7.67 18.7 12.3 18.0 11.627 13.7 7.21 9.0 3.56 13.7 7.13 13.5 7.09 18.4 11.9 16.9 10.28 9.8 4.05 7.5 2.63 13.2 6.66 12.5 6.16 472.5 1186 15.8 9.2629 6.7 2.14 10.5 4.17 13.9 7.27 15.4 8.45 180.1 535 14.3 7.830 6.4 1.97 8.2 2.98 16.7 8.36 67.6 69.4 542.7 2432 13.5 7.1031 7.0 2.32 6.8 2.20 21.0 14.6 12.5 6.25
Total 1836 730 1554 2591 6818 11680
3.4 Promedio Anual: 129.0753.9 Máxima Instantánea 1122.9
ESTACION CIENTO EN EL RIO GATUN
Área de Drenaje:
Concentraciones de Sedimentos Suspendidos (mg/l) y Caudales Sólidos Promedios Diarios (t/d)LATITUD 9º 17' 52'' N LONGITUD 79º 43' 41'' O
Mínimo Diario: Máximo Diario:
MAYO JUNIO
Producción Anual: 219 t/año/km²
AGOSTO SEPTIEMBRE
25601 t/año
Concentración de Sedimentos Suspendidos (mg/l)
Total Anual:
OCTUBRE NOVIEMBRE DICIEMBRE
DIA FEBRERO MARZO ABRIL ENERO
DIA JULIO
46
9
5
3
3
Autoridad del Canal de Panamá 49 Anuario de Sedimentos Suspendidos 1998-2004

Año: 2004 117 km²
mg/l t/d mg/l t/d mg/l t/d mg/l t/d mg/l t/d mg/l t/d1 9.5 3.87 4.7 0.823 4.2 0.438 3.9 0.292 10.8 3.15 209.2 3202 8.9 3.50 4.7 0.779 4.2 0.427 3.9 0.292 360.5 698 19.6 12.73 8.8 3.41 4.6 0.756 4.2 0.430 3.9 0.291 12.7 5.91 415.4 7874 8.4 3.17 4.6 0.725 4.2 0.427 3.9 0.286 92.1 70.6 27.7 23.25 7.9 2.87 4.6 0.722 4.2 0.443 3.9 0.275 24.3 17.7 31.0 26.76 7.5 2.60 4.6 0.700 4.2 0.419 3.9 0.276 8.5 3.17 18.6 12.07 7.1 2.37 4.6 0.686 4.2 0.400 3.9 0.278 5.6 1.57 11.9 5.668 6.9 2.25 4.5 0.663 4.1 0.377 3.9 0.272 5.0 1.16 9.8 4.119 6.6 2.08 4.5 0.652 4.1 0.376 3.9 0.268 4.8 0.946 10.0 4.2110 6.2 1.89 4.5 0.635 4.1 0.372 3.9 0.261 4.7 0.829 10.6 4.6711 5.9 1.73 4.5 0.622 4.2 0.399 3.8 0.253 4.8 0.927 13.8 7.1612 5.8 1.67 4.5 0.608 4.3 0.501 3.8 0.251 4.6 0.708 8.9 3.4913 5.7 1.65 4.5 0.618 4.2 0.442 3.8 0.248 4.5 0.616 7.5 2.6114 5.6 1.57 4.6 0.762 4.2 0.399 3.8 0.244 4.4 0.547 8.2 3.0215 5.2 1.40 4.5 0.617 4.1 0.387 3.9 0.256 12.1 2.92 6.6 2.0816 5.1 1.31 4.4 0.580 4.1 0.382 3.8 0.239 11.3 4.36 5.8 1.6917 5.1 1.29 4.4 0.561 4.1 0.382 3.8 0.241 61.0 39.5 5.5 1.5418 5.1 1.27 4.4 0.574 4.1 0.390 3.8 0.239 17.5 9.90 16.3 7.4619 5.0 1.22 4.6 0.746 4.2 0.414 3.8 0.225 11.3 4.59 315.8 32720 5.0 1.15 4.4 0.565 4.2 0.421 3.8 0.245 25.4 16.9 58.8 60.721 5.0 1.11 4.4 0.529 4.1 0.362 11.7 4.81 24.5 14.1 15.4 8.5322 5.0 1.18 4.3 0.513 4.0 0.339 7.5 2.26 11.8 5.30 9.6 3.9323 5.0 1.24 4.7 0.770 4.0 0.338 5.2 1.13 26.7 11.9 7.5 2.6124 5.0 1.14 4.4 0.556 4.1 0.356 4.4 0.561 33.4 24.5 7.7 2.6725 4.9 1.05 4.3 0.515 4.1 0.362 12.4 3.02 7.3 2.48 19.8 11.726 4.9 1.01 4.3 0.494 4.1 0.349 4.5 0.653 9.3 3.37 15.2 8.4727 4.8 0.966 4.3 0.476 4.0 0.336 4.3 0.466 10.1 3.77 10.5 4.5328 4.8 0.924 4.3 0.456 4.0 0.341 4.2 0.412 889.3 3510 7.5 2.6129 4.8 0.890 4.2 0.444 4.2 0.421 4.1 0.358 63.0 82.2 18.3 8.1430 4.7 0.860 4.1 0.354 4.1 0.363 17.2 10.6 16.9 9.2531 4.7 0.844 4.0 0.301 10.6 4.69
Total 53.5 18.1 12.1 19.3 4556 1679
mg/l t/d mg/l t/d mg/l t/d mg/l t/d mg/l t/d mg/l t/d1 9.7 4.02 6.9 2.26 15.1 8.51 13.3 6.66 20.1 13.9 18.3 11.92 7.8 2.79 6.6 2.08 13.1 6.74 12.7 6.30 28.7 20.4 16.8 10.33 7.3 2.50 8.2 2.82 60.0 56.0 44.0 38.8 36.9 34.8 15.3 8.724 7.2 2.40 10.9 4.76 14.8 8.21 14.0 7.49 74.1 85.1 14.3 7.815 7.5 2.59 17.2 10.3 26.9 19.6 12.1 5.87 107.6 145 46.0 47.86 9.4 3.59 11.8 5.57 21.6 15.2 15.1 7.85 50.3 60.7 21.4 15.37 17.9 8.71 10.7 4.61 162.8 252 13.2 6.75 62.6 72.5 17.1 10.58 12.1 5.72 11.9 5.36 46.6 57.5 13.0 6.53 79.4 115 19.8 13.29 8.0 2.93 9.4 3.82 37.2 39.2 175.4 239 602.6 3208 33.7 30.210 7.3 2.46 9.9 4.02 41.1 43.0 36.2 31.3 164.8 480 17.6 11.111 6.8 2.18 9.1 3.57 30.2 27.3 944.9 4104 85.6 160 13.6 7.1512 13.5 5.20 9.6 3.87 20.9 14.8 52.9 68.1 50.1 65.5 12.7 6.3513 13.2 6.35 7.3 2.48 16.7 10.1 39.3 39.3 39.8 44.4 12.2 5.9514 27.9 18.2 7.8 2.71 14.9 8.34 26.9 22.6 32.5 31.5 10.6 4.7215 104.3 108 8.4 3.12 14.2 7.69 65.3 69.1 28.2 24.7 9.8 4.0916 36.5 32.9 143.0 222 14.7 8.16 227.3 395 29.0 25.8 238.0 44017 13.2 6.79 40.1 43.5 36.1 30.1 62.3 86.4 24.2 19.1 21.7 15.418 25.1 16.1 20.8 14.4 23.4 17.1 30.6 27.6 100.8 159 12.8 6.4119 21.5 14.6 49.9 42.1 14.3 7.75 25.1 20.3 1143.8 14524 10.9 4.8920 12.2 5.91 381.8 701 12.0 5.78 22.2 16.4 659.0 4742 9.5 3.8621 60.6 46.3 23.4 16.5 11.6 5.44 85.5 113 107.5 234 8.8 3.3922 13.6 7.05 116.8 220 11.0 4.99 35.9 36.7 63.0 96.5 8.3 3.0723 10.3 4.44 188.8 312 9.9 4.17 184.1 270 46.0 56.8 7.7 2.7224 9.9 4.18 38.0 38.2 12.6 6.07 70.2 87.5 46.0 55.2 7.4 2.5225 9.7 3.98 19.8 13.5 23.0 14.1 32.0 29.8 37.2 39.6 6.9 2.2326 8.9 3.50 16.7 10.1 18.9 11.3 26.8 21.8 36.5 38.3 6.4 1.9827 12.5 5.91 14.4 7.88 30.2 21.0 28.0 24.1 31.0 29.0 6.2 1.9028 10.7 4.71 13.6 7.13 121.3 153 22.0 16.2 25.3 20.6 5.9 1.7329 8.7 3.34 258.0 414 23.2 16.8 24.1 18.3 21.6 15.7 5.9 1.7430 8.1 2.96 37.9 36.8 13.5 7.04 28.1 24.1 20.0 13.8 5.7 1.6531 7.4 2.52 18.2 11.7 27.3 21.7 5.3 1.46
Total 343 2173 887 5868 24630 690
3.8 Promedio Anual: 185.81143.8 Máxima Instantánea 1564.0
ESTACION CIENTO EN EL RIO GATUN
Área de Drenaje:
Concentraciones de Sedimentos Suspendidos (mg/l) y Caudales Sólidos Promedios Diarios (t/d)LATITUD 9º 17' 52'' N LONGITUD 79º 43' 41'' O
Mínimo Diario: Máximo Diario:
MAYO JUNIO
Producción Anual: 350 t/año/km²
AGOSTO SEPTIEMBRE
40930 t/año
Concentración de Sedimentos Suspendidos (mg/l)
Total Anual:
OCTUBRE NOVIEMBRE DICIEMBRE
DIA FEBRERO MARZO ABRIL ENERO
DIA JULIO
50 Autoridad del Canal de Panamá Anuario de Sedimentos Suspendidos 1998-2004

Autoridad del Canal de Panamá 51 Anuario de Sedimentos Suspendidos 1998-2004

52 Autoridad del Canal de Panamá Anuario de Sedimentos Suspendidos 1998-2004

Estación El Chorro en el Río Trinidad
LOCALIZACIÓN: La estación está a 1.2 km (0.74 mi) aguas arriba del Puerto de Trinidad, cerca del poblado Los Chorros de Trinidad, en el distrito de Capira, provincia de Panamá. Sus coordenadas geográficas son: 8° 58’ 32” de latitud Norte y 79° 59’ 25” de longitud Oeste. CÓDIGO DE LA ESTACIÓN: 115-02-01 ÁREA DE DRENAJE: 174 km2 (67 mi2) PERIODO DE REGISTRO: Desde enero de 1987 hasta la fecha. VALORES EXTREMOS Y PROMEDIOS PARA EL AÑO 2004
Concentración (mg/l)
Año
Máxima Instantánea
Mínima Diaria
PromedioAnual
Rendimiento
líquido (l/s/km2)
Producción
anual de sedimentos (t/año/km2)
1998 794.9 1.2 107.6 26.7 91 1999 800.6 2.3 121.6 50.1 192 2000 733.0 2.3 68.1 37.9 82 2001 629.0 1.7 61.4 26.3 51 2002 2758.9 2.0 132.7 42.5 178 2003 756.6 1.4 154.3 51.6 251 2004 788.8 1.9 101.5 36.0 116
Autoridad del Canal de Panamá 53 Anuario de Sedimentos Suspendidos 1998-2004

Año: 1998 174 km²
mg/l t/d mg/l t/d mg/l t/d mg/l t/d mg/l t/d mg/l t/d1 2.7 0.352 2.0 0.138 1.7 0.074 1.4 0.044 1.6 0.071 4.9 0.8112 2.7 0.360 2.0 0.131 1.6 0.071 1.4 0.039 1.6 0.060 5.5 1.293 2.7 0.357 2.0 0.131 1.6 0.068 1.3 0.036 1.5 0.052 2.8 0.3894 2.7 0.364 3.6 0.457 1.6 0.064 1.3 0.033 1.5 0.051 4.1 0.5675 2.7 0.351 2.6 0.327 1.6 0.065 1.3 0.033 1.6 0.060 3.8 0.7446 2.6 0.340 2.3 0.225 1.8 0.092 1.3 0.030 1.7 0.081 13.8 2.737 2.6 0.331 2.1 0.159 1.9 0.123 1.2 0.028 3.6 0.413 8.7 2.758 2.6 0.324 2.5 0.262 1.8 0.103 1.3 0.030 3.9 0.728 3.6 0.6919 2.6 0.316 2.5 0.276 1.7 0.076 1.2 0.028 3.0 0.450 4.3 0.912
10 2.6 0.314 2.3 0.205 1.6 0.063 1.2 0.029 2.3 0.213 2.9 0.44411 2.5 0.289 2.1 0.155 1.5 0.056 1.2 0.028 2.0 0.131 2.6 0.30812 2.5 0.278 2.0 0.137 1.5 0.052 1.2 0.027 1.7 0.078 2.4 0.24413 2.5 0.272 2.0 0.131 1.5 0.048 1.2 0.028 1.6 0.061 2.3 0.21414 2.4 0.258 1.9 0.122 1.4 0.044 1.2 0.026 1.5 0.051 2.3 0.20815 2.4 0.244 1.9 0.116 1.4 0.043 1.2 0.024 1.4 0.046 6.3 1.0516 2.4 0.237 1.9 0.118 1.4 0.044 1.2 0.024 1.4 0.043 7.8 2.3517 2.4 0.231 1.9 0.115 1.4 0.045 1.2 0.024 1.6 0.068 3.1 0.51818 2.3 0.219 1.9 0.113 1.4 0.044 1.2 0.024 1.8 0.103 2.7 0.38019 2.3 0.212 1.9 0.109 1.4 0.043 1.2 0.024 1.7 0.087 2.6 0.30620 2.3 0.202 1.8 0.098 1.4 0.043 1.2 0.023 1.9 0.113 2.4 0.25321 2.3 0.201 1.8 0.090 1.4 0.041 1.3 0.030 1.9 0.101 14.2 2.8522 2.3 0.208 1.8 0.088 1.4 0.039 1.5 0.052 1.9 0.109 17.4 8.9823 2.3 0.201 1.8 0.091 1.4 0.037 1.9 0.097 1.7 0.078 5.7 1.4724 2.2 0.193 1.7 0.085 1.3 0.036 2.3 0.221 1.7 0.079 3.2 0.55125 2.2 0.183 1.7 0.077 1.5 0.051 6.3 1.66 92.3 35.2 2.8 0.40626 2.1 0.170 1.7 0.076 1.9 0.118 3.9 0.684 109.2 129.2 2.7 0.37127 2.1 0.164 1.7 0.076 2.1 0.158 2.2 0.174 7.1 1.93 3.9 0.74628 2.1 0.156 1.7 0.075 1.8 0.091 1.9 0.119 2.8 0.415 15.5 5.0929 2.1 0.153 1.6 0.070 1.9 0.112 17.6 4.37 4.8 1.1230 2.1 0.159 1.6 0.059 1.7 0.076 4.1 0.857 3.1 0.52731 2.1 0.150 1.5 0.050 2.7 0.344
Total 7.79 4.18 2.01 3.81 176 39.3
mg/l t/d mg/l t/d mg/l t/d mg/l t/d mg/l t/d mg/l t/d1 2.7 0.380 15.7 7.81 43.1 35.7 10.2 3.88 11.0 4.43 38.1 29.2 2.6 0.314 13.9 6.45 67.4 45.5 18.3 9.51 30.4 19.7 16.6 8.73 2.6 0.311 9.2 3.26 31.0 20.7 107.0 99.0 27.8 18.2 15.0 7.374 37.4 18.9 7.1 2.17 70.4 72.7 71.2 82.2 21.5 10.4 12.5 5.495 24.7 14.3 6.2 1.75 15.5 7.71 124.9 153 29.3 18.2 30.2 18.66 12.3 4.93 6.0 1.62 10.0 3.77 35.1 28.3 28.5 12.9 39.8 35.27 5.1 1.24 6.3 1.73 18.1 9.41 52.0 47.2 368.6 936 292.3 5578 3.5 0.658 7.7 2.47 9.7 3.59 24.2 16.0 101.3 141 381.9 12059 3.0 0.492 32.1 17.8 7.6 2.41 274.2 343 26.8 19.0 215.9 484
10 3.0 0.491 6.4 1.82 90.6 48.5 111.7 158 18.3 10.2 56.8 65.211 3.4 0.618 5.3 1.35 18.0 8.90 599.3 2882 28.0 19.8 36.8 32.312 201.6 116 4.5 1.02 16.6 8.43 324.2 995 27.9 20.1 29.3 22.213 92.3 101 5.1 1.23 8.8 3.07 72.6 97.8 43.1 35.0 70.0 68.714 9.5 3.38 4.5 1.03 7.0 2.12 73.8 96.5 123.3 125 45.6 43.615 5.2 1.29 4.8 1.13 6.2 1.72 44.9 44.5 69.3 77.6 238.9 48516 12.1 3.75 5.4 1.36 5.9 1.60 32.7 26.5 23.0 14.9 51.7 54.217 18.9 7.49 484.8 747 5.4 1.36 28.1 20.7 18.4 10.3 30.4 23.618 9.4 3.24 60.2 56.1 8.2 2.67 55.5 51.3 23.7 15.1 26.4 18.719 10.1 3.49 464.4 1029 5.4 1.35 38.5 33.4 17.1 9.11 23.4 15.420 6.9 2.02 65.0 69.4 6.4 1.69 25.3 17.4 26.2 17.5 21.1 12.921 4.3 0.928 19.0 10.7 94.4 62.9 30.6 23.4 151.5 196 21.7 13.422 15.1 4.26 11.1 4.51 269.8 410 21.4 13.2 149.5 233 22.1 13.923 379.7 560 8.6 2.95 61.4 65.4 17.9 9.86 62.9 70.7 24.7 16.24 38.0 31.8 7.3 2.25 22.1 13.6 15.5 7.75 44.4 42.9 18.5 10.25 25.6 16.6 30.9 20.0 12.1 5.12 13.8 6.43 28.0 20.6 16.1 8.3426 10.1 3.80 9.1 3.19 83.8 47.5 12.4 5.42 22.1 14.0 16.6 8.627 68.1 56.3 6.6 1.90 36.6 26.6 11.4 4.70 18.1 10.1 14.1 6.628 64.0 52.9 5.5 1.41 23.4 14.8 10.8 4.31 15.7 7.98 338.1 3529 13.3 5.65 7.5 1.93 15.9 8.03 10.3 3.96 14.3 6.82 122.6 1630 30.7 19.3 15.7 6.92 12.1 5.17 9.5 3.51 13.2 5.99 33.9 27.531 72.0 70.5 203.1 188 15.5 6.81 30.9 23.9
Total 1105 2200 942 5295 2143 3839
1.2 Promedio Anual: 107.6599.3 Máxima Instantáne
70
74
9724
a 794.9
MAYO JUNIO
Producción Anual:
ESTACION EL CHORRO EN EL RIO TRINIDAD
LATITUD 8º 58' 32'' N LONGITUD 79º 59' 25'' O Área de Drenaje:
Concentraciones de Sedimentos Suspendidos (mg/l) y Caudales Sólidos Promedios Diarios (t/d)
Total Anual: 91 t/año/km²15756 t/año Concentración de Sedimentos Suspendidos (mg/l)
Mínimo Diario: Máximo Diario:
DIA JULIO AGOSTO SEPTIEMBRE OCTUBRE NOVIEMBRE DICIEMBRE
DIA FEBRERO MARZO ABRIL ENERO
54 Autoridad del Canal de Panamá Anuario de Sedimentos Suspendidos 1998-2004

Año: 1999 174 km²
mg/l t/d mg/l t/d mg/l t/d mg/l t/d mg/l t/d mg/l t/d1 59.4 60.0 5.3 1.33 2.9 0.476 2.6 0.316 142.9 136 4.8 1.122 45.7 44.9 5.1 1.25 2.9 0.448 2.6 0.305 21.7 10.4 4.6 1.073 43.8 42.3 4.9 1.17 2.8 0.430 2.5 0.279 4.4 0.963 49.4 36.44 31.5 24.9 4.7 1.08 2.8 0.432 2.4 0.252 39.2 19.0 659.5 16545 26.7 18.9 4.5 1.03 2.9 0.445 2.7 0.352 49.3 38.0 209.8 3566 20.8 12.7 4.3 0.951 2.9 0.456 2.4 0.258 11.2 4.34 284.8 5647 18.1 10.1 4.2 0.892 2.9 0.439 2.4 0.233 5.7 1.51 76.3 95.08 15.8 8.06 4.0 0.845 2.8 0.415 2.4 0.245 4.6 1.05 53.0 54.69 14.9 7.31 4.0 0.824 2.7 0.374 2.5 0.270 6.0 1.60 32.6 26.210 13.5 6.22 4.1 0.886 2.7 0.354 2.4 0.236 256.1 133 20.6 12.411 12.6 5.56 4.1 0.887 2.6 0.339 2.3 0.226 223.7 403 17.2 9.1912 12.0 5.14 3.8 0.768 2.7 0.346 2.3 0.219 52.5 49.5 15.5 7.6413 11.5 4.78 3.8 0.785 2.6 0.337 2.3 0.207 13.8 6.34 346.9 56514 12.1 5.18 4.3 0.942 2.6 0.329 2.3 0.222 8.2 2.73 90.7 11915 10.6 4.16 4.6 1.05 2.7 0.343 2.9 0.470 16.9 7.84 45.1 41.316 9.9 3.74 5.0 1.21 3.4 0.611 2.9 0.435 10.7 4.11 30.3 22.817 11.8 4.97 4.4 0.979 3.7 0.712 3.7 0.661 14.0 6.37 21.8 13.318 9.6 3.54 3.7 0.737 2.8 0.420 2.6 0.302 34.8 14.7 21.3 12.919 8.8 3.07 3.9 0.818 2.7 0.366 2.4 0.238 53.6 45.9 15.5 7.7720 8.6 2.97 31.4 10.7 2.6 0.327 2.3 0.219 115.8 71.6 53.1 37.321 8.0 2.60 20.0 9.30 2.6 0.308 2.3 0.209 59.0 56.0 27.8 19.622 7.6 2.41 4.5 1.03 2.5 0.291 2.3 0.209 72.4 71.4 209.5 31423 8.2 2.72 3.7 0.732 2.5 0.287 2.3 0.206 15.9 8.09 114.6 16424 7.5 2.39 3.6 0.706 2.6 0.311 3.0 0.324 15.7 7.77 31.0 24.225 7.3 2.26 3.6 0.706 2.5 0.288 5.8 1.48 9.8 3.64 21.9 13.726 7.1 2.13 3.4 0.644 2.5 0.268 8.2 2.42 8.1 2.66 38.1 24.727 6.6 1.91 3.1 0.534 2.6 0.315 17.9 8.41 6.8 1.99 19.8 11.428 6.4 1.80 3.0 0.502 2.8 0.394 3.7 0.723 5.9 1.60 14.4 6.9029 6.3 1.75 5.6 1.37 2.8 0.425 5.7 1.52 13.7 6.3030 5.9 1.61 3.1 0.540 102.7 59.7 6.7 1.94 122.7 10631 5.5 1.43 2.7 0.359 5.1 1.25
Total 302 43.3 13.1 80.1 1116 4328
mg/l t/d mg/l t/d mg/l t/d mg/l t/d mg/l t/d mg/l t/d1 31.5 22.7 61.7 57.4 33.1 25.9 50.9 55.0 55.8 54.6 329.2 7942 19.3 11.0 331.6 540 33.6 25.4 40.7 38.2 23.0 14.9 249.0 6533 56.9 39.7 468.9 1617 40.2 34.1 36.8 32.3 30.8 21.3 111.7 1904 33.4 26.4 67.4 80.5 21.7 13.5 33.3 27.4 43.8 41.2 103.9 1715 24.2 14.4 35.5 29.9 17.4 9.41 52.7 54.9 27.0 19.4 78.3 1106 26.2 17.3 25.5 17.6 17.9 9.71 153.0 203 248.5 395 55.0 62.47 14.6 7.02 307.9 514 37.9 27.2 92.8 118 59.6 67.4 97.4 1588 12.3 5.30 38.9 34.3 34.5 27.4 35.1 29.9 104.9 146 83.9 1229 10.8 4.32 36.8 29.2 69.6 60.2 29.9 23.0 162.2 304 54.3 61.010 10.1 3.87 23.9 15.7 41.1 35.0 259.4 420 125.5 166 65.3 80.111 9.0 3.19 21.5 13.3 20.3 12.1 35.4 29.9 100.9 132 136.6 19412 8.6 2.95 18.3 10.2 173.4 288 63.2 59.6 618.3 3139 57.4 65.613 8.5 2.89 17.9 9.8 121.0 170 27.8 20.3 329.7 1042 58.8 69.514 7.9 2.60 21.9 13.3 54.9 60.7 23.4 15.4 154.8 325 47.8 49.415 7.6 2.39 53.4 39.9 261.2 555 20.9 12.7 73.3 99.7 88.9 13216 11.9 4.50 24.8 16.1 152.0 270 20.4 12.2 72.9 98.7 69.4 90.217 9.4 3.38 16.2 8.39 46.2 46.8 19.5 11.4 329.8 1023 47.3 48.818 7.7 2.48 15.7 7.95 329.0 721 145.9 169 232.9 627 451.5 121419 8.6 2.87 14.4 6.88 131.0 221 27.7 19.9 91.4 143 113.3 18520 49.4 34.0 126.1 151 61.5 70.6 32.2 24.1 68.6 90.2 53.0 57.921 27.8 18.6 214.8 275 42.4 40.6 282.9 423 56.8 66.1 48.9 50.722 14.5 6.79 163.9 328 32.9 26.9 47.9 47.5 62.5 71.5 40.4 37.723 76.6 77.8 61.5 72.7 27.5 20.1 300.5 539 52.3 56.4 36.3 31.624 21.3 12.9 60.7 70.1 110.8 119 68.0 84.2 42.8 41.3 32.4 26.225 12.8 5.71 106.8 160 240.5 437 254.7 466 44.5 43.7 31.3 24.826 14.2 6.09 58.5 65.1 340.1 830 80.6 108 35.6 30.6 39.5 35.627 29.6 21.2 32.5 26.3 296.5 817 35.0 29.7 40.7 37.5 81.8 11128 19.3 10.4 27.9 20.5 231.1 552 27.6 20.1 46.8 45.4 109.2 16529 13.7 6.30 22.6 14.5 153.1 284 23.7 15.6 76.7 98.8 106.6 17030 10.9 4.36 26.8 18.9 104.1 165 21.5 13.4 38.0 33.7 52.1 57.331 33.8 14.9 35.7 25.9 27.1 17.5 45.3 45.4
Total 398 4288 5975 3140 8473 5264
2.3 Promedio Anual: 121.6659.5 Máxima Instantánea 800.6
Total Anual: 192 t/año/km²33421 t/año Producción Anual:
MAYO JUNIO
ESTACION EL CHORRO EN EL RIO TRINIDAD
Área de Drenaje:
Concentraciones de Sedimentos Suspendidos (mg/l) y Caudales Sólidos Promedios Diarios (t/d)LATITUD 8º 58' 32'' N LONGITUD 79º 59' 25'' O
Concentración de Sedimentos Suspendidos (mg/l) Mínimo Diario: Máximo Diario:
DIA JULIO AGOSTO SEPTIEMBRE OCTUBRE NOVIEMBRE DICIEMBRE
DIA FEBRERO MARZO ABRIL ENERO
Autoridad del Canal de Panamá 55 Anuario de Sedimentos Suspendidos 1998-2004

Año: 2000 174 km²
mg/l t/d mg/l t/d mg/l t/d mg/l t/d mg/l t/d mg/l t/d1 38.4 34.6 10.9 4.35 4.4 0.979 2.7 0.377 2.3 0.228 33.6 20.72 34.7 29.3 10.7 4.26 4.3 0.950 2.6 0.336 2.8 0.415 12.1 5.183 35.4 29.8 10.4 4.07 4.4 0.976 2.6 0.310 2.5 0.283 10.1 3.814 240.8 404 9.7 3.60 4.2 0.911 2.6 0.306 2.3 0.230 7.2 2.215 46.0 45.7 14.6 6.91 4.3 0.934 2.5 0.294 2.3 0.221 137.0 1886 34.3 28.8 11.9 5.01 4.4 0.976 2.5 0.276 2.5 0.281 20.2 11.87 35.9 31.0 9.5 3.51 4.7 1.08 2.5 0.277 2.6 0.308 13.7 6.218 46.4 44.8 8.9 3.15 4.9 1.19 2.6 0.313 3.6 0.566 34.0 20.59 71.5 76.0 8.9 3.12 4.1 0.867 2.6 0.341 12.2 4.35 80.2 97.710 59.9 62.1 8.9 3.13 3.7 0.723 2.5 0.297 3.0 0.485 87.0 98.911 31.4 24.9 8.2 2.76 3.4 0.642 2.6 0.303 2.6 0.333 52.1 48.912 29.8 22.8 7.6 2.44 3.3 0.611 2.5 0.289 2.5 0.298 227.3 36213 26.0 18.3 7.4 2.33 3.3 0.620 2.5 0.291 2.5 0.292 37.0 31.614 26.2 18.3 7.0 2.12 3.3 0.599 2.5 0.287 4.0 0.838 20.2 12.015 26.6 18.8 6.7 1.94 3.0 0.534 2.5 0.266 3.0 0.493 23.0 14.216 27.3 19.1 6.5 1.84 3.0 0.507 10.0 2.775 34.8 10.3 39.5 32.617 22.6 14.5 6.7 1.97 3.0 0.494 2.6 0.309 30.4 20.5 37.0 31.718 19.5 11.4 18.5 9.12 2.9 0.482 2.7 0.345 29.7 15.4 345.4 76019 18.2 10.1 7.2 2.21 2.9 0.458 3.6 0.684 35.8 25.3 51.7 52.920 17.2 9.28 6.4 1.81 2.9 0.442 2.7 0.369 11.9 4.78 24.1 16.021 16.4 8.57 6.2 1.74 2.8 0.431 2.6 0.338 5.0 1.19 28.1 17.922 16.0 8.21 5.8 1.55 2.8 0.425 2.7 0.377 3.4 0.641 43.0 41.023 15.2 7.57 5.5 1.40 2.8 0.408 2.7 0.375 17.7 4.79 34.6 29.224 14.7 7.13 5.3 1.33 2.8 0.388 2.6 0.327 16.0 5.39 382.0 89925 13.7 6.36 5.6 1.46 2.7 0.373 2.6 0.303 11.3 4.19 163.7 29726 12.7 5.65 5.7 1.50 2.7 0.365 3.7 0.648 33.6 15.5 126.7 17727 13.7 6.32 5.0 1.22 2.7 0.359 2.8 0.396 29.5 18.8 57.7 65.128 15.5 7.75 4.8 1.12 2.7 0.346 2.5 0.286 6.6 1.90 32.9 26.829 12.8 5.70 4.7 1.10 2.6 0.340 2.4 0.245 137.8 117 25.0 17.130 11.8 4.99 2.6 0.332 2.3 0.228 83.4 96.1 20.6 12.531 10.8 4.33 2.7 0.361 31.0 22.8
Total 1027 82.1 19.1 12.6 375 3401
mg/l t/d mg/l t/d mg/l t/d mg/l t/d mg/l t/d mg/l t/d1 19.1 11.0 17.3 9.17 104.6 158 23.2 15.1 154.6 312 20.9 12.22 16.9 9.03 29.4 20.6 87.3 92.6 17.9 9.85 89.3 128 14.1 6.683 15.0 7.42 499.3 1151 108.1 162 15.1 7.48 124.8 213 13.2 6.024 13.6 6.29 115.4 168 51.2 53.7 18.1 9.55 49.7 52.6 14.1 6.585 14.4 6.86 32.9 26.5 29.3 22.2 25.9 16.9 38.7 35.0 11.8 4.986 52.8 38.3 21.7 13.5 21.9 13.8 14.5 6.96 30.9 24.2 12.0 5.137 106.0 121 17.1 9.13 19.6 11.4 12.9 5.76 26.9 19.3 11.1 4.518 47.8 45.2 74.3 61.4 92.1 77.3 15.7 7.78 24.0 16.0 10.7 4.259 20.3 12.1 26.8 17.9 50.7 47.6 28.3 18.1 20.6 12.5 11.7 4.8710 14.9 7.30 15.6 7.88 26.2 18.2 22.0 13.4 22.4 14.0 10.0 3.8011 12.5 5.46 13.5 6.18 257.6 394 21.4 12.8 53.7 56.7 11.1 4.4712 11.1 4.53 12.1 5.16 40.6 36.2 14.0 6.60 21.6 13.5 12.9 5.7113 10.5 4.09 12.9 5.67 50.8 43.9 13.7 6.27 17.9 9.91 10.4 4.0414 10.6 4.14 17.0 8.86 34.9 28.7 41.0 33.7 18.8 10.7 9.2 3.3115 13.3 6.04 28.0 18.7 31.8 24.6 76.1 61.2 17.5 9.52 8.6 2.9816 11.4 4.54 14.4 6.87 29.7 20.5 31.1 22.3 18.3 10.2 12.1 5.0317 54.1 52.7 16.2 8.33 21.6 13.3 17.6 9.53 37.6 25.4 8.3 2.7718 19.3 11.1 26.5 18.3 23.1 13.5 25.7 16.0 28.2 20.1 8.7 3.0019 15.0 7.37 19.7 11.4 93.5 102 55.2 44.2 36.3 26.5 7.7 2.4820 13.6 6.28 13.5 6.24 79.3 103 59.4 56.9 66.3 81.5 8.3 2.7821 29.8 17.7 13.5 6.17 33.2 27.0 110.2 138 30.7 23.6 9.6 3.5422 13.6 6.28 11.5 4.75 23.7 15.7 86.2 109 22.3 14.1 7.4 2.3223 10.5 4.07 14.6 6.44 19.5 11.4 38.4 33.1 19.2 11.0 7.2 2.2024 9.3 3.34 20.2 11.9 19.3 11.2 50.1 51.9 15.5 7.76 6.7 1.9525 11.3 4.37 13.7 6.30 19.2 11.0 28.4 20.9 14.0 6.58 6.4 1.8426 49.7 45.9 14.2 6.65 15.0 7.36 20.1 11.9 73.7 52.8 6.5 1.8527 34.7 27.1 11.8 4.95 14.6 6.96 18.0 10.0 41.8 34.8 7.7 2.4328 15.2 7.52 50.4 31.8 38.3 31.7 17.2 9.23 19.9 11.7 28.9 14.629 42.3 26.7 38.0 31.9 59.9 62.0 81.8 69.0 15.6 7.87 37.0 28.430 43.1 37.8 21.0 12.9 59.4 63.5 67.2 77.2 20.9 12.3 211.4 34331 18.3 10.1 128.9 109 352.4 923 402.3 1624
Total 562 1813 1684 1833 1273 2121
2.3 Promedio Anual: 68.1499.3 Máxima Instantánea 733.0
Total Anual: 82 t/año/km²14203 t/año Producción Anual:
MAYO JUNIO
ESTACION EL CHORRO EN EL RIO TRINIDAD
Área de Drenaje:
Concentraciones de Sedimentos Suspendidos (mg/l) y Caudales Sólidos Promedios Diarios (t/d)LATITUD 8º 58' 32'' N LONGITUD 79º 59' 25'' O
Concentración de Sedimentos Suspendidos (mg/l) Mínimo Diario: Máximo Diario:
DIA JULIO AGOSTO SEPTIEMBRE OCTUBRE NOVIEMBRE DICIEMBRE
DIA FEBRERO MARZO ABRIL ENERO
56 Autoridad del Canal de Panamá Anuario de Sedimentos Suspendidos 1998-2004
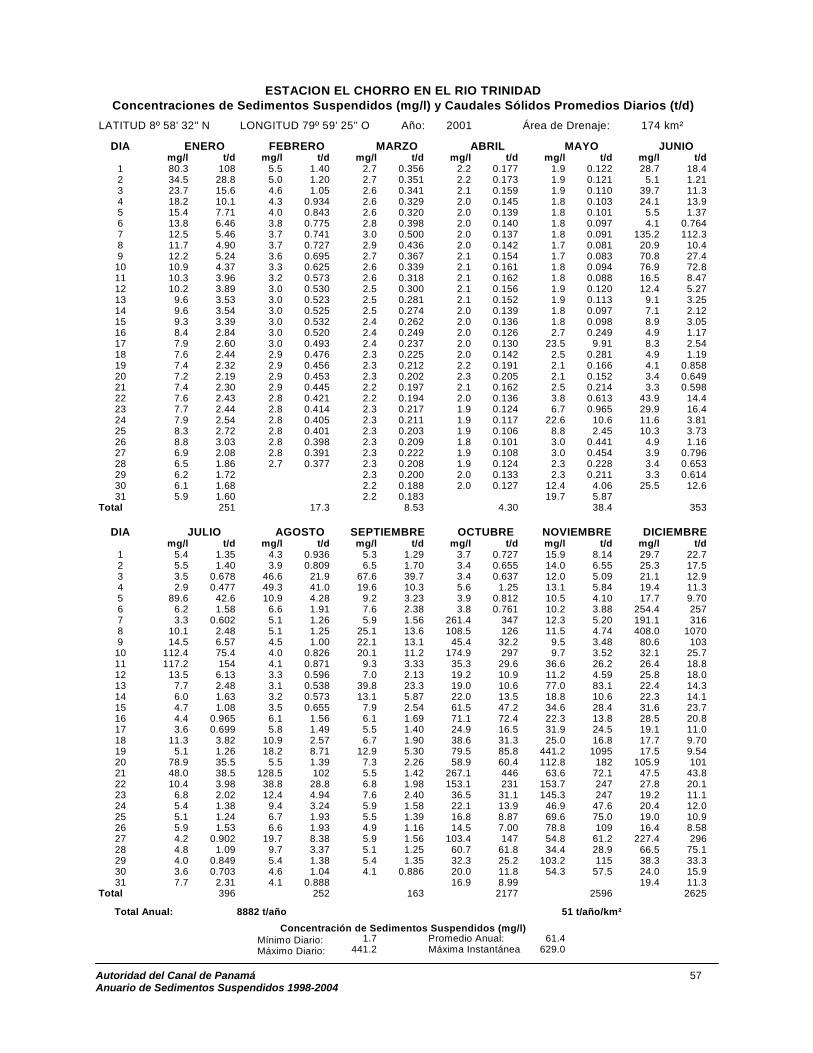
Año: 2001 174 km²
mg/l t/d mg/l t/d mg/l t/d mg/l t/d mg/l t/d mg/l t/d1 80.3 108 5.5 1.40 2.7 0.356 2.2 0.177 1.9 0.122 28.7 18.42 34.5 28.8 5.0 1.20 2.7 0.351 2.2 0.173 1.9 0.121 5.1 1.213 23.7 15.6 4.6 1.05 2.6 0.341 2.1 0.159 1.9 0.110 39.7 11.34 18.2 10.1 4.3 0.934 2.6 0.329 2.0 0.145 1.8 0.103 24.1 13.95 15.4 7.71 4.0 0.843 2.6 0.320 2.0 0.139 1.8 0.101 5.5 1.376 13.8 6.46 3.8 0.775 2.8 0.398 2.0 0.140 1.8 0.097 4.1 0.7647 12.5 5.46 3.7 0.741 3.0 0.500 2.0 0.137 1.8 0.091 135.2 112.38 11.7 4.90 3.7 0.727 2.9 0.436 2.0 0.142 1.7 0.081 20.9 10.49 12.2 5.24 3.6 0.695 2.7 0.367 2.1 0.154 1.7 0.083 70.8 27.410 10.9 4.37 3.3 0.625 2.6 0.339 2.1 0.161 1.8 0.094 76.9 72.811 10.3 3.96 3.2 0.573 2.6 0.318 2.1 0.162 1.8 0.088 16.5 8.4712 10.2 3.89 3.0 0.530 2.5 0.300 2.1 0.156 1.9 0.120 12.4 5.2713 9.6 3.53 3.0 0.523 2.5 0.281 2.1 0.152 1.9 0.113 9.1 3.2514 9.6 3.54 3.0 0.525 2.5 0.274 2.0 0.139 1.8 0.097 7.1 2.1215 9.3 3.39 3.0 0.532 2.4 0.262 2.0 0.136 1.8 0.098 8.9 3.0516 8.4 2.84 3.0 0.520 2.4 0.249 2.0 0.126 2.7 0.249 4.9 1.1717 7.9 2.60 3.0 0.493 2.4 0.237 2.0 0.130 23.5 9.91 8.3 2.5418 7.6 2.44 2.9 0.476 2.3 0.225 2.0 0.142 2.5 0.281 4.9 1.1919 7.4 2.32 2.9 0.456 2.3 0.212 2.2 0.191 2.1 0.166 4.1 0.85820 7.2 2.19 2.9 0.453 2.3 0.202 2.3 0.205 2.1 0.152 3.4 0.64921 7.4 2.30 2.9 0.445 2.2 0.197 2.1 0.162 2.5 0.214 3.3 0.59822 7.6 2.43 2.8 0.421 2.2 0.194 2.0 0.136 3.8 0.613 43.9 14.423 7.7 2.44 2.8 0.414 2.3 0.217 1.9 0.124 6.7 0.965 29.9 16.424 7.9 2.54 2.8 0.405 2.3 0.211 1.9 0.117 22.6 10.6 11.6 3.8125 8.3 2.72 2.8 0.401 2.3 0.203 1.9 0.106 8.8 2.45 10.3 3.7326 8.8 3.03 2.8 0.398 2.3 0.209 1.8 0.101 3.0 0.441 4.9 1.1627 6.9 2.08 2.8 0.391 2.3 0.222 1.9 0.108 3.0 0.454 3.9 0.79628 6.5 1.86 2.7 0.377 2.3 0.208 1.9 0.124 2.3 0.228 3.4 0.65329 6.2 1.72 2.3 0.200 2.0 0.133 2.3 0.211 3.3 0.61430 6.1 1.68 2.2 0.188 2.0 0.127 12.4 4.06 25.5 12.631 5.9 1.60 2.2 0.183 19.7 5.87
Total 251 17.3 8.53 4.30 38.4 353
mg/l t/d mg/l t/d mg/l t/d mg/l t/d mg/l t/d mg/l t/d1 5.4 1.35 4.3 0.936 5.3 1.29 3.7 0.727 15.9 8.14 29.7 22.72 5.5 1.40 3.9 0.809 6.5 1.70 3.4 0.655 14.0 6.55 25.3 17.53 3.5 0.678 46.6 21.9 67.6 39.7 3.4 0.637 12.0 5.09 21.1 12.94 2.9 0.477 49.3 41.0 19.6 10.3 5.6 1.25 13.1 5.84 19.4 11.35 89.6 42.6 10.9 4.28 9.2 3.23 3.9 0.812 10.5 4.10 17.7 9.706 6.2 1.58 6.6 1.91 7.6 2.38 3.8 0.761 10.2 3.88 254.4 2577 3.3 0.602 5.1 1.26 5.9 1.56 261.4 347 12.3 5.20 191.1 3168 10.1 2.48 5.1 1.25 25.1 13.6 108.5 126 11.5 4.74 408.0 10709 14.5 6.57 4.5 1.00 22.1 13.1 45.4 32.2 9.5 3.48 80.6 10310 112.4 75.4 4.0 0.826 20.1 11.2 174.9 297 9.7 3.52 32.1 25.711 117.2 154 4.1 0.871 9.3 3.33 35.3 29.6 36.6 26.2 26.4 18.812 13.5 6.13 3.3 0.596 7.0 2.13 19.2 10.9 11.2 4.59 25.8 18.013 7.7 2.48 3.1 0.538 39.8 23.3 19.0 10.6 77.0 83.1 22.4 14.314 6.0 1.63 3.2 0.573 13.1 5.87 22.0 13.5 18.8 10.6 22.3 14.115 4.7 1.08 3.5 0.655 7.9 2.54 61.5 47.2 34.6 28.4 31.6 23.716 4.4 0.965 6.1 1.56 6.1 1.69 71.1 72.4 22.3 13.8 28.5 20.817 3.6 0.699 5.8 1.49 5.5 1.40 24.9 16.5 31.9 24.5 19.1 11.018 11.3 3.82 10.9 2.57 6.7 1.90 38.6 31.3 25.0 16.8 17.7 9.7019 5.1 1.26 18.2 8.71 12.9 5.30 79.5 85.8 441.2 1095 17.5 9.5420 78.9 35.5 5.5 1.39 7.3 2.26 58.9 60.4 112.8 182 105.9 10121 48.0 38.5 128.5 102 5.5 1.42 267.1 446 63.6 72.1 47.5 43.822 10.4 3.98 38.8 28.8 6.8 1.98 153.1 231 153.7 247 27.8 20.123 6.8 2.02 12.4 4.94 7.6 2.40 36.5 31.1 145.3 247 19.2 11.124 5.4 1.38 9.4 3.24 5.9 1.58 22.1 13.9 46.9 47.6 20.4 12.025 5.1 1.24 6.7 1.93 5.5 1.39 16.8 8.87 69.6 75.0 19.0 10.926 5.9 1.53 6.6 1.93 4.9 1.16 14.5 7.00 78.8 109 16.4 8.5827 4.2 0.902 19.7 8.38 5.9 1.56 103.4 147 54.8 61.2 227.4 29628 4.8 1.09 9.7 3.37 5.1 1.25 60.7 61.8 34.4 28.9 66.5 75.129 4.0 0.849 5.4 1.38 5.4 1.35 32.3 25.2 103.2 115 38.3 33.330 3.6 0.703 4.6 1.04 4.1 0.886 20.0 11.8 54.3 57.5 24.0 15.931 7.7 2.31 4.1 0.888 16.9 8.99 19.4 11.3
Total 396 252 163 2177 2596 2625
1.7 Promedio Anual: 61.4441.2 Máxima Instantánea 629.0
MAYO JUNIO
ESTACION EL CHORRO EN EL RIO TRINIDAD
Área de Drenaje:
Concentraciones de Sedimentos Suspendidos (mg/l) y Caudales Sólidos Promedios Diarios (t/d)LATITUD 8º 58' 32'' N LONGITUD 79º 59' 25'' O
Total Anual: 51 t/año/km²8882 t/añoConcentración de Sedimentos Suspendidos (mg/l)
Mínimo Diario: Máximo Diario:
DIA JULIO AGOSTO SEPTIEMBRE OCTUBRE NOVIEMBRE DICIEMBRE
DIA FEBRERO MARZO ABRIL ENERO
Autoridad del Canal de Panamá 57 Anuario de Sedimentos Suspendidos 1998-2004
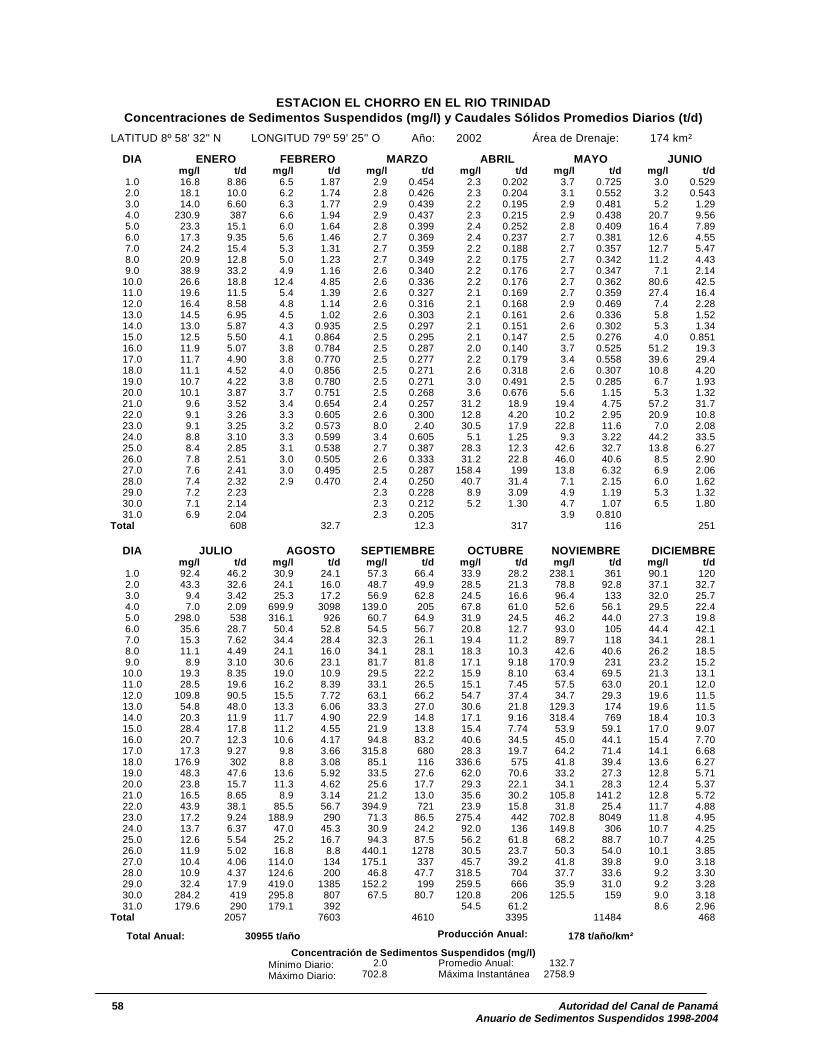
Año: 2002 174 km²
mg/l t/d mg/l t/d mg/l t/d mg/l t/d mg/l t/d mg/l t/d1.0 16.8 8.86 6.5 1.87 2.9 0.454 2.3 0.202 3.7 0.725 3.0 0.5292.0 18.1 10.0 6.2 1.74 2.8 0.426 2.3 0.204 3.1 0.552 3.2 0.5433.0 14.0 6.60 6.3 1.77 2.9 0.439 2.2 0.195 2.9 0.481 5.2 1.294.0 230.9 387 6.6 1.94 2.9 0.437 2.3 0.215 2.9 0.438 20.7 9.565.0 23.3 15.1 6.0 1.64 2.8 0.399 2.4 0.252 2.8 0.409 16.4 7.896.0 17.3 9.35 5.6 1.46 2.7 0.369 2.4 0.237 2.7 0.381 12.6 4.557.0 24.2 15.4 5.3 1.31 2.7 0.359 2.2 0.188 2.7 0.357 12.7 5.478.0 20.9 12.8 5.0 1.23 2.7 0.349 2.2 0.175 2.7 0.342 11.2 4.439.0 38.9 33.2 4.9 1.16 2.6 0.340 2.2 0.176 2.7 0.347 7.1 2.1410.0 26.6 18.8 12.4 4.85 2.6 0.336 2.2 0.176 2.7 0.362 80.6 42.511.0 19.6 11.5 5.4 1.39 2.6 0.327 2.1 0.169 2.7 0.359 27.4 16.412.0 16.4 8.58 4.8 1.14 2.6 0.316 2.1 0.168 2.9 0.469 7.4 2.2813.0 14.5 6.95 4.5 1.02 2.6 0.303 2.1 0.161 2.6 0.336 5.8 1.5214.0 13.0 5.87 4.3 0.935 2.5 0.297 2.1 0.151 2.6 0.302 5.3 1.3415.0 12.5 5.50 4.1 0.864 2.5 0.295 2.1 0.147 2.5 0.276 4.0 0.85116.0 11.9 5.07 3.8 0.784 2.5 0.287 2.0 0.140 3.7 0.525 51.2 19.317.0 11.7 4.90 3.8 0.770 2.5 0.277 2.2 0.179 3.4 0.558 39.6 29.418.0 11.1 4.52 4.0 0.856 2.5 0.271 2.6 0.318 2.6 0.307 10.8 4.2019.0 10.7 4.22 3.8 0.780 2.5 0.271 3.0 0.491 2.5 0.285 6.7 1.9320.0 10.1 3.87 3.7 0.751 2.5 0.268 3.6 0.676 5.6 1.15 5.3 1.3221.0 9.6 3.52 3.4 0.654 2.4 0.257 31.2 18.9 19.4 4.75 57.2 31.722.0 9.1 3.26 3.3 0.605 2.6 0.300 12.8 4.20 10.2 2.95 20.9 10.823.0 9.1 3.25 3.2 0.573 8.0 2.40 30.5 17.9 22.8 11.6 7.0 2.0824.0 8.8 3.10 3.3 0.599 3.4 0.605 5.1 1.25 9.3 3.22 44.2 33.525.0 8.4 2.85 3.1 0.538 2.7 0.387 28.3 12.3 42.6 32.7 13.8 6.2726.0 7.8 2.51 3.0 0.505 2.6 0.333 31.2 22.8 46.0 40.6 8.5 2.9027.0 7.6 2.41 3.0 0.495 2.5 0.287 158.4 199 13.8 6.32 6.9 2.0628.0 7.4 2.32 2.9 0.470 2.4 0.250 40.7 31.4 7.1 2.15 6.0 1.6229.0 7.2 2.23 2.3 0.228 8.9 3.09 4.9 1.19 5.3 1.3230.0 7.1 2.14 2.3 0.212 5.2 1.30 4.7 1.07 6.5 1.8031.0 6.9 2.04 2.3 0.205 3.9 0.810
Total 608 32.7 12.3 317 116 251
mg/l t/d mg/l t/d mg/l t/d mg/l t/d mg/l t/d mg/l t/d1.0 92.4 46.2 30.9 24.1 57.3 66.4 33.9 28.2 238.1 361 90.1 1202.0 43.3 32.6 24.1 16.0 48.7 49.9 28.5 21.3 78.8 92.8 37.1 32.3.0 9.4 3.42 25.3 17.2 56.9 62.8 24.5 16.6 96.4 133 32.0 25.74.0 7.0 2.09 699.9 3098 139.0 205 67.8 61.0 52.6 56.1 29.5 22.45.0 298.0 538 316.1 926 60.7 64.9 31.9 24.5 46.2 44.0 27.3 19.86.0 35.6 28.7 50.4 52.8 54.5 56.7 20.8 12.7 93.0 105 44.4 42.7.0 15.3 7.62 34.4 28.4 32.3 26.1 19.4 11.2 89.7 118 34.1 28.8.0 11.1 4.49 24.1 16.0 34.1 28.1 18.3 10.3 42.6 40.6 26.2 18.9.0 8.9 3.10 30.6 23.1 81.7 81.8 17.1 9.18 170.9 231 23.2 15.210.0 19.3 8.35 19.0 10.9 29.5 22.2 15.9 8.10 63.4 69.5 21.3 13.111.0 28.5 19.6 16.2 8.39 33.1 26.5 15.1 7.45 57.5 63.0 20.1 12.012.0 109.8 90.5 15.5 7.72 63.1 66.2 54.7 37.4 34.7 29.3 19.6 11.13.0 54.8 48.0 13.3 6.06 33.3 27.0 30.6 21.8 129.3 174 19.6 11.514.0 20.3 11.9 11.7 4.90 22.9 14.8 17.1 9.16 318.4 769 18.4 10.315.0 28.4 17.8 11.2 4.55 21.9 13.8 15.4 7.74 53.9 59.1 17.0 9.0716.0 20.7 12.3 10.6 4.17 94.8 83.2 40.6 34.5 45.0 44.1 15.4 7.7017.0 17.3 9.27 9.8 3.66 315.8 680 28.3 19.7 64.2 71.4 14.1 6.6818.0 176.9 302 8.8 3.08 85.1 116 336.6 575 41.8 39.4 13.6 6.2719.0 48.3 47.6 13.6 5.92 33.5 27.6 62.0 70.6 33.2 27.3 12.8 5.7120.0 23.8 15.7 11.3 4.62 25.6 17.7 29.3 22.1 34.1 28.3 12.4 5.3721.0 16.5 8.65 8.9 3.14 21.2 13.0 35.6 30.2 105.8 141.2 12.8 5.7222.0 43.9 38.1 85.5 56.7 394.9 721 23.9 15.8 31.8 25.4 11.7 4.8823.0 17.2 9.24 188.9 290 71.3 86.5 275.4 442 702.8 8049 11.8 4.9524.0 13.7 6.37 47.0 45.3 30.9 24.2 92.0 136 149.8 306 10.7 4.2525.0 12.6 5.54 25.2 16.7 94.3 87.5 56.2 61.8 68.2 88.7 10.7 4.2526.0 11.9 5.02 16.8 8.8 440.1 1278 30.5 23.7 50.3 54.0 10.1 3.8527.0 10.4 4.06 114.0 134 175.1 337 45.7 39.2 41.8 39.8 9.0 3.1828.0 10.9 4.37 124.6 200 46.8 47.7 318.5 704 37.7 33.6 9.2 3.3029.0 32.4 17.9 419.0 1385 152.2 199 259.5 666 35.9 31.0 9.2 3.2830.0 284.2 419 295.8 807 67.5 80.7 120.8 206 125.5 159 9.0 3.1831.0 179.6 290 179.1 392 54.5 61.2 8.6 2.96
Total 2057 7603 4610 3395 11484 468
2.0 Promedio Anual: 132.7702.8 Máxima Instantáne
7
115
5
a 2758.9
MAYO JUNIO
Producción Anual:
ESTACION EL CHORRO EN EL RIO TRINIDAD
Área de Drenaje:
Concentraciones de Sedimentos Suspendidos (mg/l) y Caudales Sólidos Promedios Diarios (t/d)LATITUD 8º 58' 32'' N LONGITUD 79º 59' 25'' O
Total Anual: 178 t/año/km²30955 t/añoConcentración de Sedimentos Suspendidos (mg/l)
Mínimo Diario: Máximo Diario:
DIA JULIO AGOSTO SEPTIEMBRE OCTUBRE NOVIEMBRE DICIEMBRE
DIA FEBRERO MARZO ABRIL ENERO
58 Autoridad del Canal de Panamá Anuario de Sedimentos Suspendidos 1998-2004

Año: 2003 174 km²
mg/l t/d mg/l t/d mg/l t/d mg/l t/d mg/l t/d mg/l t/d1 6.5 1.85 2.8 0.403 2.3 0.210 1.7 0.079 5.5 1.25 8.1 2.702 6.0 1.66 2.8 0.422 2.2 0.188 1.7 0.073 2.6 0.297 7.1 2.133 5.8 1.56 2.8 0.405 2.2 0.186 1.7 0.072 6.2 0.566 5.5 1.434 5.7 1.51 2.8 0.389 2.2 0.181 1.7 0.078 41.7 23.6 9.6 3.495 5.6 1.45 2.8 0.389 2.2 0.178 1.7 0.078 82.5 47.6 11.1 3.896 5.5 1.40 2.7 0.379 2.1 0.169 1.7 0.081 27.1 14.8 8.0 2.577 5.3 1.34 2.7 0.379 2.1 0.165 1.7 0.083 24.5 6.82 5.1 1.238 5.3 1.33 2.7 0.369 2.1 0.156 1.7 0.083 122.3 141 4.4 0.9809 5.2 1.28 2.7 0.368 2.0 0.144 1.8 0.100 29.1 18.2 8.4 2.41
10 4.9 1.17 2.7 0.358 2.0 0.140 2.0 0.130 6.1 1.63 4.5 1.0111 4.6 1.07 2.7 0.349 2.0 0.131 1.9 0.120 3.5 0.661 229.5 17712 4.4 0.982 2.7 0.346 2.0 0.131 1.7 0.079 21.6 6.75 98.4 12613 4.1 0.859 2.6 0.335 2.0 0.133 1.6 0.071 19.4 8.92 174.5 30814 3.8 0.786 2.6 0.330 2.0 0.129 1.7 0.078 10.3 3.52 66.7 74.515 3.7 0.735 2.6 0.326 2.0 0.126 1.8 0.097 4.0 0.843 19.2 10.916 3.7 0.735 2.6 0.317 2.0 0.129 1.9 0.111 3.2 0.566 12.2 5.2117 3.6 0.703 2.5 0.299 2.1 0.148 1.7 0.079 2.9 0.455 25.7 13.218 3.5 0.673 2.5 0.282 2.3 0.207 1.6 0.064 325.4 628 12.3 5.2019 3.4 0.643 2.5 0.266 2.1 0.151 1.5 0.050 44.5 37.0 87.0 64.220 3.3 0.615 2.4 0.251 2.1 0.168 1.4 0.043 11.0 4.34 17.2 8.4521 3.2 0.588 2.4 0.237 2.4 0.245 2.2 0.175 6.6 1.89 7.6 2.4022 3.1 0.562 2.3 0.223 2.2 0.173 2.1 0.154 5.5 1.43 10.6 4.0523 3.1 0.538 2.3 0.210 2.0 0.130 2.1 0.151 6.9 2.06 29.1 19.124 3.0 0.521 2.2 0.197 1.9 0.117 1.8 0.101 8.8 2.33 16.1 7.8625 3.0 0.517 2.2 0.193 1.8 0.103 1.7 0.087 117.8 143 8.4 2.8526 2.9 0.487 2.2 0.190 1.8 0.102 1.9 0.112 12.1 5.09 8.5 2.9227 2.9 0.460 2.2 0.182 1.8 0.104 2.9 0.442 7.9 2.52 6.4 1.8228 2.9 0.457 2.2 0.178 1.8 0.093 44.4 10.6 172.6 120 35.3 15.629 2.9 0.446 1.8 0.089 22.2 9.04 75.3 77.5 29.8 19.530 2.8 0.429 1.7 0.085 20.8 8.29 14.4 6.85 9.6 3.5231 2.8 0.422 1.7 0.082 10.5 4.09
Total 27.8 8.6 4.5 30.8 1314 894
mg/l t/d mg/l t/d mg/l t/d mg/l t/d mg/l t/d mg/l t/d1 14.7 6.82 34.2 28.2 44.3 40.4 15.4 7.75 380.9 1416 240.5 562 9.9 3.64 189.4 396 22.2 14.1 14.3 6.82 191.4 466 198.5 4563 10.0 3.58 39.4 35.5 32.9 25.0 16.0 8.15 196.6 477 377.0 13884 7.8 2.51 32.7 26.3 22.4 14.0 68.9 54.2 143.3 288 108.5 1915 9.0 3.11 28.7 21.1 509.6 1342 41.2 33.9 79.2 114 85.8 1306 6.3 1.77 32.5 25.9 67.9 79.9 16.5 8.66 72.2 97.3 127.6 2417 41.9 15.7 24.2 16.0 28.3 20.9 25.1 16.2 68.9 90.4 594.7 4788 67.3 69.7 144.5 224 50.3 47.7 134.4 166 65.2 81.4 260.7 7799 38.7 32.6 52.0 53.1 22.8 14.6 118.1 146 180.3 422 129.5 255
10 324.9 436 25.3 17.4 20.7 12.5 390.4 1064 287.1 713 93.8 15011 111.9 145 22.3 13.7 17.2 9.28 118.7 192 359.9 1307 97.2 15712 24.2 16.3 26.0 17.7 15.4 7.73 271.8 464 258.2 755 67.0 86.313 18.1 10.0 22.0 13.7 14.0 6.60 83.0 107 139.7 283 52.0 57.214 13.0 5.83 19.4 11.2 13.1 5.89 51.8 52.3 94.8 153 51.7 55.915 12.3 5.21 16.1 8.3 55.1 35.6 299.1 675 99.3 164 116.7 17716 9.3 3.38 135.7 159 31.8 22.5 118.5 196 102.1 172 46.8 47.717 8.0 2.63 56.7 56.1 29.7 20.1 198.8 327 82.4 121 38.7 35.218 7.1 2.14 19.5 11.3 57.3 52.3 184.0 396 296.9 779 31.7 25.19 6.5 1.85 15.7 7.99 17.3 9.32 147.2 298 275.6 788 27.7 20.20 6.6 1.90 78.2 63.3 87.3 78.6 155.7 311 198.0 483 47.6 47.21 7.1 2.14 43.5 39.7 40.0 31.7 252.4 680 137.8 283 73.7 95.22 10.9 3.64 111.8 123 39.2 33.1 260.4 667 315.1 1029 53.8 59.923 68.2 66.7 145.0 240 448.9 1120 324.6 1017 430.7 1806 43.6 42.624 39.0 29.6 75.5 79.3 116.5 184 89.1 137 112.8 200 31.5 25.025 112.2 77.9 45.3 41.6 34.0 28.1 118.9 190 128.1 232 25.8 18.026 300.2 786 24.8 16.8 23.7 15.7 144.6 281 136.5 268 22.9 14.827 168.4 310 26.9 19.0 20.6 12.4 162.8 356 104.1 172 20.9 12.828 33.6 27.4 21.9 13.7 36.8 28.8 198.8 462 52.7 58.2 63.2 69.029 21.2 13.0 59.6 54.7 28.7 20.8 124.5 227 233.4 529 30.1 22.930 143.4 140 31.2 24.1 18.1 10.1 103.9 173 263.0 638 20.7 12.531 29.0 20.8 66.6 59.0 325.3 784 16.5 8.62
Total 2247 1917 3343 9504 14386 10029
1.4 Promedio Anual: 154.3594.7 Máxima Instantáne
7
2
3355
a 756.6
MAYO JUNIO
Producción Anual: 251 t/año/km²43706 t/año
ESTACION EL CHORRO EN EL RIO TRINIDAD
Área de Drenaje:
Concentraciones de Sedimentos Suspendidos (mg/l) y Caudales Sólidos Promedios Diarios (t/d)LATITUD 8º 58' 32'' N LONGITUD 79º 59' 25'' O
JULIO OCTUBRE
ENERO
Concentración de Sedimentos Suspendidos (mg/l) Mínimo Diario: Máximo Diario:
DIA AGOSTO SEPTIEMBRE NOVIEMBRE DICIEMBRE
Total Anual:
DIA FEBRERO MARZO ABRIL
Autoridad del Canal de Panamá 59 Anuario de Sedimentos Suspendidos 1998-2004

Año: 2004 174 km²
mg/l t/d mg/l t/d mg/l t/d mg/l t/d mg/l t/d mg/l t/d1 14.1 6.67 4.6 1.06 2.7 0.352 2.3 0.205 17.9 6.22 540.5 14122 13.3 6.05 4.4 0.982 2.6 0.334 2.2 0.185 38.9 24.4 100.8 1413 12.4 5.41 4.2 0.921 2.6 0.325 2.2 0.181 6.1 1.63 25.6 17.74 11.6 4.83 4.1 0.880 2.6 0.328 2.1 0.166 3.3 0.595 19.6 11.35 10.9 4.37 4.0 0.846 2.6 0.316 2.1 0.168 8.3 2.5 19.4 10.86 10.2 3.94 3.8 0.782 2.5 0.297 2.2 0.174 4.3 0.950 21.1 12.67 10.2 3.90 3.7 0.749 2.5 0.290 2.2 0.180 3.6 0.689 13.9 6.528 9.5 3.49 3.5 0.678 2.5 0.286 2.2 0.182 2.9 0.474 11.2 4.549 9.5 3.47 3.4 0.652 2.5 0.278 2.1 0.166 12.1 3.14 181.5 106
10 9.5 3.50 3.3 0.624 2.5 0.273 2.1 0.170 7.6 2.27 221.0 35611 9.0 3.17 3.2 0.575 2.8 0.394 2.3 0.210 3.7 0.722 22.7 14.512 8.1 2.69 3.1 0.561 3.6 0.701 2.3 0.212 3.0 0.506 16.7 8.7913 8.6 2.98 3.2 0.579 2.8 0.398 2.1 0.150 2.9 0.442 12.7 5.6414 8.1 2.71 3.4 0.640 2.7 0.344 2.0 0.139 3.0 0.501 10.8 4.2915 7.9 2.55 3.3 0.601 2.6 0.314 1.9 0.123 414.5 633 10.0 3.8216 7.5 2.35 3.0 0.533 2.5 0.293 1.9 0.116 154.6 239 9.1 3.2517 7.2 2.19 3.0 0.505 2.4 0.257 1.9 0.114 234.4 375 8.4 2.8318 6.9 2.07 3.0 0.490 2.4 0.231 2.0 0.125 225.8 265 8.0 2.6219 6.6 1.91 3.0 0.495 2.3 0.219 2.0 0.133 121.9 187 9.1 3.2220 6.4 1.83 3.0 0.488 2.3 0.225 17.4 1.93 22.6 14.0 9.4 3.3521 6.6 1.89 2.9 0.462 2.3 0.214 70.5 58.8 346.8 529 9.2 3.2322 11.0 4.37 2.9 0.456 2.3 0.209 3.9 0.780 45.1 43.7 7.2 2.2023 13.7 6.18 2.9 0.460 2.2 0.193 3.5 0.618 130.1 109 6.5 1.8524 8.6 2.93 2.9 0.447 2.2 0.190 2.4 0.258 89.7 117 28.8 12.125 6.7 1.94 2.9 0.446 2.3 0.208 14.0 5.37 20.8 12.6 15.0 7.1326 6.1 1.66 2.8 0.426 2.3 0.214 3.1 0.541 14.0 6.5 10.5 3.9927 5.8 1.53 2.8 0.392 2.2 0.188 13.0 5.10 46.9 28.2 8.8 3.0828 5.4 1.37 2.7 0.379 2.2 0.181 5.9 1.57 32.0 23.8 7.1 2.1529 5.1 1.27 2.7 0.359 2.3 0.212 4.3 0.919 20.1 11.9 84.0 61.630 4.9 1.18 2.3 0.220 2.8 0.402 13.7 6.33 22.1 12.531 4.8 1.13 2.3 0.205 10.3 3.96
Total 95.5 17.5 8.69 79.4 2651 2242
mg/l t/d mg/l t/d mg/l t/d mg/l t/d mg/l t/d mg/l t/d1 18.6 9.93 10.3 4.00 13.0 5.83 10.9 4.40 48.6 48.8 26.7 19.2 9.7 3.58 9.1 3.26 11.8 4.96 9.7 3.62 70.0 76.0 21.7 13.63 7.8 2.54 24.0 11.8 10.4 4.07 9.2 3.28 118.8 187 19.5 11.44 7.6 2.41 292.5 464 10.3 3.98 9.2 3.33 61.9 69.6 18.2 10.25 7.8 2.52 233.9 468 20.2 10.4 11.3 4.40 63.0 68.0 19.7 11.56 6.8 1.99 50.3 50.8 17.6 9.39 241.7 269 37.2 32.5 17.9 9.847 7.8 2.48 175.5 260 15.5 7.07 38.5 30.2 26.9 19.3 17.9 9.698 14.8 6.86 22.5 14.3 16.7 8.35 16.3 8.23 31.6 24.7 20.5 12.9 8.1 2.66 17.4 9.38 40.7 28.6 20.5 11.2 37.3 32.4 15.7 7.96
10 214.3 129 16.5 8.60 23.1 13.2 15.6 7.74 91.5 136 14.9 7.3111 73.6 74.2 17.9 8.88 27.3 17.1 17.9 9.11 57.2 64.5 25.4 16.112 13.8 6.41 24.9 15.8 22.9 12.2 13.7 6.29 31.5 24.9 14.0 6.5713 10.5 4.12 13.8 6.43 172.3 179 10.3 3.96 24.7 16.8 13.5 6.2114 10.8 4.25 11.9 5.05 45.6 39.7 25.2 10.6 20.4 12.2 12.7 5.5815 24.4 12.4 11.2 4.57 16.1 8.26 31.0 19.2 18.4 10.4 11.5 4.7416 15.9 7.57 11.2 4.54 13.4 6.15 11.6 4.75 17.5 9.49 62.7 60.317 8.4 2.83 10.0 3.78 170.3 308 9.6 3.54 16.3 8.43 23.0 14.318 24.2 9.15 9.7 3.59 40.0 34.9 43.1 27.3 20.3 12.1 13.7 6.319 28.5 18.0 372.1 689 19.4 11.2 85.2 68.1 379.9 1270 13.3 6.0520 10.1 3.84 44.4 41.1 15.3 7.65 20.6 11.9 87.1 123 11.1 4.5221 307.8 251 26.7 18.7 12.9 5.73 193.4 237 37.1 32.6 10.2 3.8922 77.7 86.2 17.1 9.11 11.6 4.84 214.4 372 28.1 20.7 10.0 3.7723 208.9 198 20.0 11.2 10.8 4.28 383.0 1007 106.4 103 9.5 3.5124 40.3 29.3 21.4 13.0 90.6 79.5 206.5 458 286.0 538 8.9 3.1325 13.5 6.19 18.9 10.7 87.4 78.4 55.6 61.4 127.9 198 8.6 2.9726 12.2 5.24 115.8 102 32.2 22.8 352.4 767 202.6 353 8.2 2.7327 33.4 21.4 93.2 95.3 13.9 6.52 534.0 2538 94.9 139 7.7 2.4528 91.1 78.3 24.0 15.6 31.7 16.9 142.6 274 40.6 37.9 7.3 2.2829 54.1 50.1 21.3 12.6 21.2 11.2 116.6 196 31.1 24.5 7.0 2.1030 16.6 8.69 17.9 9.71 14.1 6.62 50.6 54.3 26.7 19.1 6.8 2.0131 12.3 5.31 13.5 6.25 134.9 173 6.8 2.02
Total 1047 2381 957 6648 3712 274
1.9 Promedio Anual: 101.5540.5 Máxima Instantáne
0
2
8
a 788.8
Total Anual: 116 t/año/km²20112 t/año Producción Anual:
MAYO JUNIO
ESTACION EL CHORRO EN EL RIO TRINIDAD
Área de Drenaje:
Concentraciones de Sedimentos Suspendidos (mg/l) y Caudales Sólidos Promedios Diarios (t/d)LATITUD 8º 58' 32'' N LONGITUD 79º 59' 25'' O
Concentración de Sedimentos Suspendidos (mg/l) Mínimo Diario: Máximo Diario:
DIA JULIO AGOSTO SEPTIEMBRE OCTUBRE NOVIEMBRE DICIEMBRE
DIA FEBRERO MARZO ABRIL ENERO
60 Autoridad del Canal de Panamá Anuario de Sedimentos Suspendidos 1998-2004
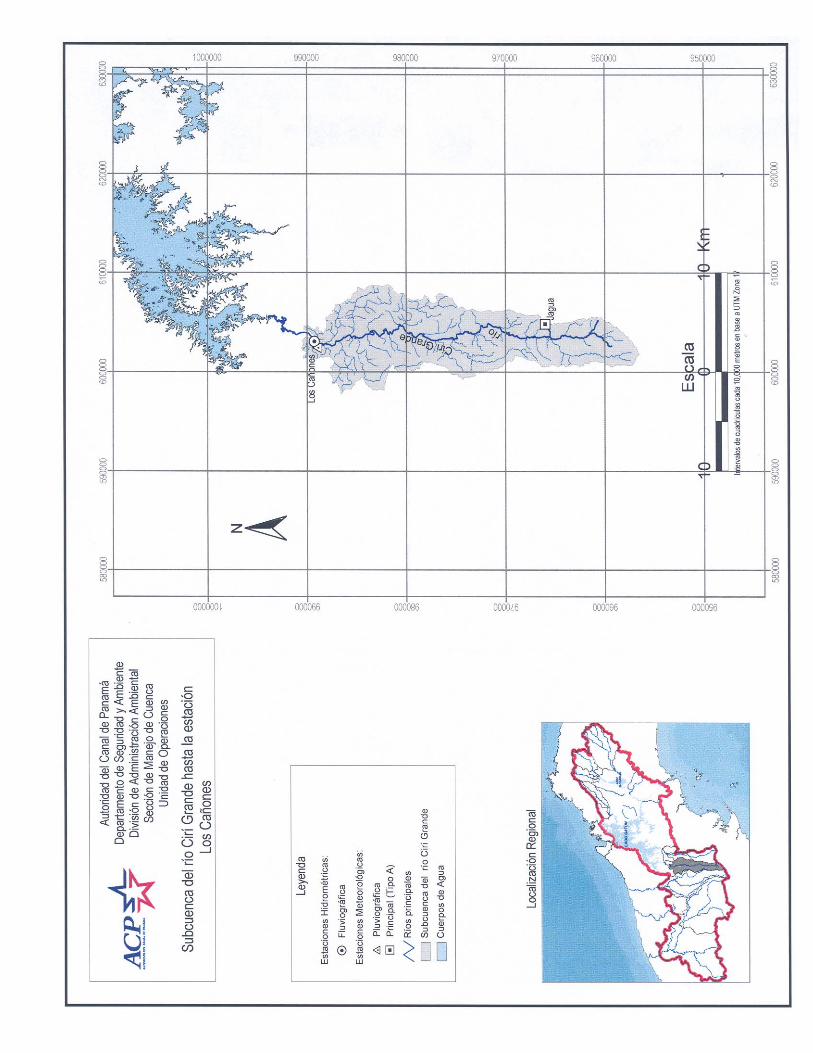
Autoridad del Canal de Panamá 61 Anuario de Sedimentos Suspendidos 1998-2004

62 Autoridad del Canal de Panamá Anuario de Sedimentos Suspendidos 1998-2004

Estación Los Cañones en el Río Cirí Grande
LOCALIZACIÓN: La estación está a 3.2 km (2 mi) aguas arriba del poblado Los Chorros de Cirí, en la provincia de Panamá, distrito de Capira. Sus coordenadas geográficas son: 8° 56’ 56” de latitud Norte y 80° 03’ 45” de longitud Oeste. CÓDIGO DE LA ESTACIÓN: 115-08-01 ÁREA DE DRENAJE: 186 km2 (72 mi2) PERIODO DE REGISTRO: Desde enero de 1987 hasta la fecha. VALORES EXTREMOS Y PROMEDIOS PARA EL AÑO 2004
Concentración (mg/l)
Año
Máxima Instantánea
Mínima Diaria
PromedioAnual
Rendimiento
líquido (l/s/km2)
Producción
anual de sedimentos (t/año/km2)
1998 191.3 3.9 36.0 33.7 38 1999 222.8 4.7 67.4 69.5 148 2000 227.5 4.5 45.8 48.9 71 2001 216.8 4.2 47.9 41.5 63 2002 280.2 4.4 67.6 59.9 128 2003 245.7 4.0 73.9 62.9 147 2004 201.9 4.3 39.6 42.8 54
Autoridad del Canal de Panamá 63 Anuario de Sedimentos Suspendidos 1998-2004

Año: 1998 186 km²
mg/l t/d mg/l t/d mg/l t/d mg/l t/d mg/l t/d mg/l t/d1 4.8 1.12 4.6 0.680 4.1 0.234 4.0 0.178 4.4 0.501 5.5 1.842 4.8 1.13 4.6 0.667 4.1 0.228 4.0 0.169 4.4 0.468 6.7 2.813 4.8 1.10 4.5 0.629 4.1 0.222 4.0 0.163 4.4 0.439 6.0 2.354 4.8 1.11 4.7 0.824 4.1 0.213 4.0 0.159 4.5 0.527 5.6 1.735 4.8 1.05 4.6 0.647 4.1 0.225 4.0 0.158 4.5 0.523 8.4 4.306 4.8 1.03 4.3 0.359 4.1 0.250 3.9 0.154 4.5 0.513 6.5 2.367 4.8 1.01 4.3 0.387 4.2 0.264 3.9 0.151 4.8 0.962 11.3 7.458 4.8 0.982 4.5 0.551 4.1 0.248 3.9 0.145 4.9 1.21 5.4 2.269 4.7 0.958 4.3 0.374 4.1 0.227 3.9 0.140 4.9 1.19 5.3 2.04
10 4.8 0.985 4.3 0.347 4.1 0.213 3.9 0.140 4.7 0.890 4.9 1.4311 4.7 0.928 4.3 0.334 4.1 0.206 3.9 0.141 4.5 0.583 4.9 1.2912 4.7 0.919 4.3 0.332 4.1 0.202 3.9 0.143 4.4 0.499 4.8 1.1113 4.7 0.908 4.3 0.325 4.0 0.193 3.9 0.140 4.4 0.470 4.8 1.0914 4.7 0.920 4.2 0.319 4.0 0.186 3.9 0.138 4.4 0.463 4.8 1.0215 4.7 0.887 4.2 0.313 4.0 0.184 3.9 0.133 4.4 0.442 16.9 6.5616 4.7 0.860 4.2 0.306 4.0 0.182 3.9 0.131 4.4 0.427 12.6 8.7717 4.7 0.830 4.2 0.301 4.0 0.181 3.9 0.131 4.5 0.542 5.7 2.2318 4.7 0.819 4.2 0.294 4.0 0.184 3.9 0.130 4.6 0.759 4.9 1.3219 4.7 0.797 4.2 0.288 4.0 0.180 3.9 0.127 4.5 0.557 4.8 1.2020 4.6 0.751 4.2 0.283 4.0 0.181 3.9 0.131 4.4 0.503 4.8 1.1021 4.6 0.731 4.2 0.277 4.0 0.179 3.9 0.131 5.4 1.54 29.1 18.822 4.6 0.716 4.2 0.271 4.0 0.173 4.0 0.189 4.6 0.684 28.5 33.623 4.6 0.699 4.2 0.266 4.0 0.169 4.2 0.295 4.6 0.669 8.6 5.1324 4.6 0.699 4.2 0.260 4.0 0.167 4.3 0.363 4.9 1.22 5.6 2.4725 4.6 0.688 4.2 0.254 4.1 0.209 15.4 9.42 118.1 124 5.0 1.6926 4.6 0.670 4.1 0.249 4.4 0.456 5.3 1.74 82.1 123 5.5 2.2127 4.6 0.650 4.1 0.243 4.2 0.314 4.7 0.969 5.5 2.16 10.2 6.7528 4.6 0.675 4.1 0.238 4.1 0.236 4.6 0.736 4.9 1.34 21.3 18.929 4.6 0.681 4.1 0.217 4.6 0.657 4.9 1.30 15.6 12.830 4.6 0.677 4.1 0.201 4.4 0.506 4.9 1.23 7.7 4.2531 4.6 0.669 4.0 0.189 4.8 1.03
Total 26.7 10.6 6.71 17.9 271 161
mg/l t/d mg/l t/d mg/l t/d mg/l t/d mg/l t/d mg/l t/d1 5.3 2.22 11.3 8.02 9.7 6.04 7.9 4.43 7.8 4.36 18.1 15.72 5.1 1.86 9.2 5.80 8.0 4.55 9.4 5.93 15.2 11.2 13.5 10.33 5.0 1.80 7.7 4.27 8.0 4.48 127.1 238 11.7 7.88 10.1 6.694 106.7 190 6.8 3.49 9.2 5.64 74.9 142 85.0 87.8 7.9 4.525 25.6 28.7 6.8 3.52 6.1 2.94 45.1 69.5 42.1 45.8 121.4 1856 17.4 15.7 6.8 3.53 5.1 2.13 46.7 80.4 11.5 7.17 83.2 177 9.8 6.32 6.7 3.45 8.2 4.53 83.3 174.6 44.4 58.7 62.0 1028 7.4 4.07 17.0 9.87 5.5 2.37 30.9 40.8 19.3 17.9 119.2 3619 6.7 3.39 29.7 26.9 5.1 1.84 116.2 252 9.8 6.37 111.3 332
10 5.7 2.58 6.6 3.32 72.0 58.0 56.9 97.7 8.3 4.86 45.0 78.311 6.0 2.75 5.5 2.41 17.0 12.9 105.6 230 10.7 7.05 28.8 37.712 134.7 199 5.2 2.13 25.9 23.0 138.8 532 11.7 8.39 21.2 22.913 78.3 122 6.0 2.74 8.4 4.84 54.1 105 10.5 7.08 67.3 11114 9.6 6.18 5.1 2.04 5.6 2.51 44.4 73.4 8.9 5.44 34.5 47.315 7.5 4.11 5.5 2.42 5.1 1.87 65.5 118 7.8 4.35 39.3 5916 12.1 8.12 7.3 3.55 5.1 1.84 55.7 91.4 6.5 3.27 27.2 33.617 19.1 15.5 101.9 118 39.8 24.0 21.1 22.7 6.0 2.85 18.6 18.518 22.2 21.9 65.3 89.5 17.9 13.9 39.8 51.9 8.6 5.01 17.2 16.219 14.0 11.1 34.6 34.5 6.3 3.08 33.0 43.3 7.6 4.14 15.2 13.220 10.4 7.00 27.9 33.6 7.0 3.34 33.0 40.8 23.0 21.9 13.6 10.921 8.2 4.73 23.7 25.0 30.2 28.5 19.9 20.3 20.1 19.1 14.3 11.822 12.6 8.89 11.9 8.78 132.0 276 15.4 13.5 28.2 32.0 14.7 12.223 54.2 74.5 10.5 7.16 39.9 55.3 12.9 10.1 17.6 15.5 16.1 14.424 18.3 17.0 8.1 4.69 17.0 15.6 11.2 8.01 16.2 14.6 12.4 9.4525 15.9 14.0 18.5 15.7 10.9 7.63 9.9 6.54 13.6 11.0 11.6 8.3026 10.4 7.06 8.7 5.25 11.3 7.47 8.9 5.48 12.2 9.16 11.3 8.0427 29.2 32.8 7.4 4.00 12.2 8.64 8.1 4.69 9.4 5.96 9.4 6.0128 24.6 26.0 6.2 3.03 18.4 15.3 7.6 4.17 8.1 4.67 9.2 5.7429 12.0 8.90 5.8 2.72 14.0 11.0 7.0 3.67 8.6 4.97 13.8 10.930 15.4 12.7 7.9 4.48 8.7 5.22 6.4 3.18 8.1 4.54 9.9 6.4631 16.8 15.4 8.8 4.98 10.8 6.54 10.3 6.93
Total 876 449 615 2501 443 1744
3.9 Promedio Anual: 36.0138.8 Máxima Instantáne
7
.9
a 191.3
MARZO ABRIL
JULIO AGOSTO SEPTIEMBRE
ENERO FEBRERO
DICIEMBRE
38 t/año/km²7121 t/año Producción Anual:
ESTACIÓN LOS CAÑONES EN EL RÍO CIRI GRANDEConcentraciones de Sedimentos Suspendidos (mg/l) y Caudales Sólidos Promedios Diarios (t/d)
LONGITUD 80º 03' 45'' OLATITUD 8º 56' 56'' N Área de Drenaje:
Máximo Diario:
DIA
Mínimo Diario:
DIA
Total Anual: Concentración de Sedimentos Suspendidos (mg/l)
NOVIEMBRE
MAYO JUNIO
OCTUBRE
64 Autoridad del Canal de Panamá Anuario de Sedimentos Suspendidos 1998-2004

Autoridad del Canal de Panamá 65 Anuario de Sedimentos Suspendidos 1998-2004
Año: 1999 186 km²
mg/l t/d mg/l t/d mg/l t/d mg/l t/d mg/l t/d mg/l t/d1 33.0 34.2 4.9 1.21 4.8 1.07 4.8 1.02 66.3 110 5.1 2.102 24.7 27.9 4.8 1.18 4.8 1.05 4.8 1.01 29.3 29.6 5.1 2.093 19.9 20.4 4.8 1.13 4.8 1.03 4.7 0.946 23.4 17.3 7.1 3.534 17.6 16.8 4.8 1.10 4.8 1.04 4.7 0.898 28.5 28.3 73.2 55.15 14.7 12.5 4.8 1.09 4.8 1.04 4.7 0.965 13.6 10.2 68.9 94.96 11.8 8.67 4.8 1.03 4.8 1.07 4.7 0.890 6.4 3.16 117.8 2677 10.4 7.01 4.8 1.00 4.8 1.06 4.7 0.844 5.6 2.53 122.7 3478 9.1 5.62 4.7 0.949 4.8 1.02 4.7 0.846 5.2 2.16 32.5 41.99 8.4 4.98 4.7 0.952 4.7 0.969 4.7 0.886 7.0 3.50 20.2 20.4
10 7.6 4.20 4.8 1.00 4.7 0.948 4.7 0.838 63.5 43.0 12.3 9.2811 7.1 3.73 4.8 0.984 4.7 0.927 4.7 0.837 82.6 130 10.5 7.1212 6.5 3.25 4.7 0.899 4.7 0.925 4.7 0.808 10.8 7.19 8.7 5.2413 7.3 3.90 4.8 1.02 4.7 0.916 4.7 0.795 5.9 2.79 101.0 14914 7.3 3.92 4.8 1.11 4.7 0.912 4.7 0.915 11.8 5.59 113.9 25615 5.8 2.71 4.9 1.31 4.7 0.954 5.1 1.79 33.2 33.2 47.8 72.916 5.4 2.39 4.9 1.41 4.9 1.21 5.1 1.57 21.8 19.9 21.4 22.517 6.7 3.32 4.8 1.16 4.9 1.32 4.9 1.41 30.9 32.6 18.9 17.318 5.5 2.46 4.8 1.02 4.9 1.31 4.8 1.02 34.4 31.2 14.5 12.019 5.1 2.10 4.8 1.05 4.8 1.03 4.7 0.929 52.2 69.1 10.4 6.9920 5.1 1.99 8.9 3.03 4.8 0.982 4.7 0.886 16.5 13.0 14.4 11.121 5.0 1.81 7.2 3.16 4.7 0.945 4.7 0.892 32.2 39.6 28.7 33.422 5.1 1.85 4.9 1.38 4.7 0.897 4.7 0.897 20.2 19.8 117.4 26123 5.2 2.04 4.9 1.29 4.7 0.895 4.7 0.873 17.8 13.5 107.1 27024 5.0 1.71 4.9 1.23 4.7 0.926 4.9 1.21 27.4 27.0 18.0 17.425 5.0 1.59 4.9 1.22 4.7 0.887 5.0 1.56 9.2 5.79 14.3 11.926 5.0 1.51 4.9 1.22 4.7 0.872 4.9 1.27 7.5 4.15 24.1 23.927 4.9 1.43 4.8 1.10 4.7 0.941 5.0 1.49 6.3 3.10 19.7 19.228 4.9 1.42 4.8 1.07 4.8 1.14 4.8 1.10 5.6 2.54 12.7 9.8629 4.9 1.37 5.6 2.11 4.8 1.08 5.5 2.46 11.0 7.7430 4.9 1.31 4.9 1.33 98.5 132 9.0 5.25 68.6 81.831 4.9 1.26 4.8 1.06 5.2 2.22
Total 189 35.3 32.8 162 720 2140
mg/l t/d mg/l t/d mg/l t/d mg/l t/d mg/l t/d mg/l t/d1 33.2 39.0 16.6 14.7 51.2 88.2 35.4 53.1 56.3 100 152.4 6182 13.7 11.0 131.0 273 37.3 56.8 31.3 42.5 32.8 43.6 152.9 6583 14.2 11.0 183.4 1032 36.8 55.1 26.9 33.8 21.2 21.0 85.1 2234 22.4 22.6 121.7 388 31.8 44.7 30.3 40.5 30.2 38.4 76.4 1825 14.1 11.0 60.6 111.8 29.6 39.8 27.9 35.0 16.9 15.7 53.7 1056 13.8 11.1 29.2 37.9 29.2 38.8 28.2 34.5 139.0 347 43.0 72.77 9.8 6.36 107.6 233 48.0 77.1 38.0 54.2 73.2 151 91.8 2458 8.5 5.11 29.5 38.0 131.4 375 22.8 25.2 42.8 71.4 74.5 1789 7.8 4.35 49.7 68.3 65.1 119 17.8 17.1 52.7 92.2 54.9 109
10 7.3 3.97 24.0 26.9 77.7 152 54.0 83.5 83.5 162 55.4 10811 6.8 3.49 16.6 15.3 49.7 66.2 19.7 20.1 96.4 225 108.6 28612 7.6 4.18 18.7 18.1 170.3 871 34.8 42.1 155.6 566 75.4 16713 6.4 3.17 14.8 12.6 94.7 239 16.0 14.4 127.2 425 44.2 76.714 5.9 2.80 19.2 18.5 53.5 101 16.9 15.3 61.5 123 53.2 10115 6.7 3.33 113.5 218 74.0 157 13.8 11.1 33.1 47.3 98.0 26716 7.1 3.72 83.2 151 96.1 248 13.5 10.8 28.5 37.3 83.5 21617 6.7 3.35 17.1 16.0 41.0 67.6 11.6 8.5 140.1 525 49.7 93.218 5.5 2.47 16.7 15.3 179.8 956 35.6 40.2 136.5 505 143.8 49919 5.3 2.34 14.8 12.6 127.4 442 21.6 21.2 51.4 97.9 151.1 64620 30.9 24.4 132.6 315 57.0 115 15.4 12.9 40.8 67.4 58.6 12021 12.5 8.78 86.3 181 41.3 68.5 78.6 95.4 33.1 47.5 51.1 96.522 6.6 3.32 132.5 471 30.3 41.3 70.3 122 26.4 32.9 46.2 82.523 38.4 45.8 75.9 171 25.0 29.9 42.4 58.0 25.9 31.5 34.5 50.924 10.5 7.09 55.8 107 88.1 164 29.0 35.4 25.8 30.8 29.7 39.825 7.1 3.80 92.9 224 139.9 472 77.5 147 23.9 27.4 28.9 38.226 12.6 7.40 96.9 245 140.5 515 40.6 61.4 18.9 18.9 51.8 88.927 103.2 242 68.9 149 145.3 599 18.6 18.3 23.0 25.5 118.2 37028 63.7 96.6 37.2 57.4 150.3 650 14.3 11.9 31.7 39.1 87.3 23229 18.5 17.6 45.0 68.9 85.7 215 13.0 10.2 47.3 78.6 64.8 14230 11.7 8.57 37.6 56.5 53.4 104 11.0 7.78 19.9 20.5 50.0 93.731 11.1 7.84 87.0 176 18.0 13.3 47.2 85.0
Total 627 4924 7167 1197 4013 6290
Mínimo Diario: 4.7 Promedio Anual: 67.4Máximo Diario: 183.4 Máxima Instantánea 222.8
Producción Anual:
DIA JULIO AGOSTO SEPTIEMBRE
Concentración de Sedimentos Suspendidos (mg/l)
DIA ENERO FEBRERO MARZO ABRIL MAYO JUNIO
Total Anual: 148 t/año/km²27498 t/año
ESTACION LOS CAÑONES EN EL RIO CIRI GRANDE
Area de Drenaje:
Concentraciones de Sedimentos Suspendidos (mg/l) y Caudales Sólidos Promedios Diarios (t/d)
OCTUBRE NOVIEMBRE DICIEMBRE
LATITUD 8º 56' 56'' N LONGITUD 80º 03' 45'' O

Año: 2000 186 km²
mg/l t/d mg/l t/d mg/l t/d mg/l t/d mg/l t/d mg/l t/d1 38.2 60.2 7.7 4.31 4.9 1.31 4.6 0.770 4.6 0.681 22.8 22.82 29.6 39.8 7.7 4.32 4.9 1.25 4.6 0.715 4.6 0.784 20.2 19.03 45.7 70.9 7.3 3.98 4.9 1.36 4.6 0.697 4.6 0.704 9.5 6.034 135.0 422 7.2 3.81 4.9 1.28 4.6 0.701 4.6 0.661 7.8 4.345 54.9 105 9.4 5.95 4.9 1.24 4.6 0.680 4.6 0.639 140.1 4596 36.1 54.5 9.3 5.81 4.9 1.46 4.6 0.647 4.7 0.821 18.4 18.07 43.3 72.1 7.0 3.66 4.9 1.40 4.6 0.658 4.7 0.977 12.7 9.818 34.3 49.4 6.7 3.38 5.0 1.69 4.6 0.782 11.9 4.38 45.0 45.09 37.9 56.4 6.5 3.29 4.9 1.26 4.6 0.733 7.8 3.67 76.6 13910 47.8 80.1 5.9 2.74 4.8 1.16 4.6 0.665 4.8 1.11 119.1 32111 24.3 28.7 5.3 2.34 4.8 1.10 4.5 0.637 4.8 1.03 37.2 52.012 21.6 23.5 5.1 2.18 4.8 1.09 4.5 0.627 4.7 0.946 28.9 34.713 18.4 18.2 5.1 2.15 4.8 1.12 4.5 0.624 4.9 1.05 17.6 16.714 17.2 16.2 5.1 2.06 4.8 1.19 4.5 0.613 15.9 10.2 12.7 9.8415 18.2 17.7 5.1 1.97 4.8 1.06 4.5 0.607 10.7 5.82 21.7 21.616 17.1 15.8 5.1 1.90 4.8 1.04 6.0 1.92 17.6 7.48 20.6 21.517 16.0 14.3 5.1 1.89 4.8 1.04 4.6 0.770 16.2 13.2 18.9 18.718 13.6 10.9 14.0 9.42 4.8 1.02 4.7 0.850 18.3 14.8 124.1 32719 12.6 9.67 5.1 1.99 4.8 1.00 6.9 2.91 19.6 17.7 41.3 63.420 12.1 9.02 5.0 1.81 4.7 0.964 4.8 1.02 10.1 6.58 19.5 19.821 11.6 8.50 5.0 1.74 4.7 0.941 4.8 1.08 6.4 3.11 27.0 27.722 11.4 8.27 5.0 1.62 4.7 0.922 4.8 1.05 5.1 1.89 61.8 11423 11.0 7.77 5.0 1.52 4.7 0.882 4.8 0.992 5.0 1.78 26.1 32.124 10.5 7.19 4.9 1.47 4.7 0.840 4.7 0.926 34.2 23.5 134.6 37425 9.7 6.29 5.0 1.49 4.7 0.808 4.7 0.943 23.6 20.7 145.7 57926 9.0 5.55 5.0 1.50 4.6 0.787 4.8 1.09 159.4 368 53.9 93.627 9.0 5.50 4.9 1.41 4.6 0.771 4.7 0.908 132.4 313 44.8 74.828 9.9 6.50 4.9 1.38 4.6 0.756 4.6 0.787 7.4 4.0 26.8 33.529 8.5 5.06 4.9 1.41 4.6 0.751 4.6 0.725 159.3 435 20.3 21.230 8.0 4.60 4.6 0.766 4.6 0.701 63.5 118 18.6 18.231 7.7 4.28 4.6 0.762 33.0 44.6
Total 1244 82.5 33.0 26.8 1427 2996
mg/l t/d mg/l t/d mg/l t/d mg/l t/d mg/l t/d mg/l t/d1 17.8 17.1 9.9 6.51 24.3 28.1 9.0 5.57 136.9 487 20.4 18.42 14.8 12.6 11.3 7.82 23.3 23.3 8.1 4.64 111.7 307 8.1 4.633 12.6 9.73 129.3 234 67.7 111 7.5 4.10 128.3 433 7.4 4.004 11.1 7.91 72.3 120 40.1 59.0 17.1 13.0 32.5 46.0 7.6 4.185 11.7 8.57 15.7 13.9 18.9 18.9 11.0 7.33 25.9 31.8 10.6 6.46 17.7 15.4 12.1 9.08 15.1 13.0 8.4 4.92 19.3 19.6 10.3 6.927 33.4 36.1 10.0 6.63 12.6 9.72 7.2 3.88 16.2 14.6 8.5 5.088 20.7 20.3 11.6 8.12 21.2 19.8 8.5 5.00 13.7 11.1 12.4 8.449 11.6 8.49 11.6 8.26 18.4 16.9 9.0 5.46 11.9 8.76 10.8 7.3210 10.3 6.90 8.8 5.31 13.9 11.1 7.8 4.39 11.4 8.17 8.0 4.5611 9.2 5.79 7.9 4.52 138.2 321 7.0 3.65 17.5 16.4 8.4 4.9712 8.5 5.11 7.5 4.12 34.4 43.4 6.4 3.21 10.5 7.21 8.2 4.7813 8.1 4.72 13.8 9.20 96.1 149 6.5 3.24 9.5 6.05 7.0 3.6514 8.0 4.54 27.9 29.2 38.6 49.8 9.3 5.58 10.3 6.97 6.5 3.2415 10.6 7.25 19.5 16.9 15.7 13.8 34.3 24.2 11.1 7.80 6.2 3.0316 45.5 35.3 11.6 7.92 13.8 11.1 26.9 22.7 10.3 6.89 7.1 3.7517 98.3 172 12.7 9.43 11.4 8.13 7.0 3.66 11.4 7.72 5.4 2.3818 10.2 6.88 16.3 14.1 10.7 7.28 8.9 5.34 11.8 8.60 5.1 2.1119 13.7 10.7 12.3 9.14 16.4 13.6 34.0 25.4 51.5 55.7 5.1 1.9920 9.7 6.23 8.8 5.41 97.6 178 37.6 43.9 43.4 63.9 5.1 2.0421 40.2 44.6 14.6 11.1 27.6 32.5 19.0 18.2 15.9 13.9 5.1 1.9322 12.5 9.35 8.6 5.16 13.8 11.1 33.4 34.1 11.0 7.72 5.0 1.7323 8.5 5.10 9.5 5.84 10.2 6.81 16.9 13.9 9.7 6.32 5.0 1.7424 7.8 4.44 23.4 23.9 25.5 23.0 33.0 43.2 8.6 5.21 5.0 1.6925 8.1 4.64 11.6 8.37 23.5 22.2 12.5 9.48 8.1 4.70 5.0 1.6026 11.3 7.81 10.4 6.98 9.4 5.96 9.2 5.79 19.5 14.1 5.0 1.5427 9.1 5.64 8.7 5.21 39.1 30.4 7.5 4.12 13.0 9.44 5.3 2.0528 8.1 4.68 39.4 36.4 32.1 32.7 7.8 4.40 8.3 4.91 16.2 9.1929 132.7 258 33.8 44.8 16.7 15.1 22.3 16.8 7.6 4.18 11.0 7.0130 47.2 65.7 15.5 13.6 12.0 8.73 36.1 42.1 23.0 17.9 103.2 17231 12.2 9.23 14.5 12.0 107.9 269 205.4 1935
Total 821 704 1294 661 1642 2237
4.5 Promedio Anual: 45.8205.4 Máxima Instantáne
6
a 227.5
ESTACION LOS CAÑONES EN EL RIO CIRI GRANDEConcentraciones de Sedimentos Suspendidos (mg/l) y Caudales Sólidos Promedios Diarios (t/d)
LATITUD 8º 56' 56'' N LONGITUD 80º 03' 45'' O
SEPTIEMBRE
Máximo Diario:
Área de Drenaje:
Concentración de Sedimentos Suspendidos (mg/l)Total Anual: 71 t/año/km²13168 t/año Producción Anual:
Mínimo Diario:
DIA JULIO AGOSTO OCTUBRE NOVIEMBRE DICIEMBRE
DIA ENERO FEBRERO MARZO ABRIL MAYO JUNIO
66 Autoridad del Canal de Panamá Anuario de Sedimentos Suspendidos 1998-2004
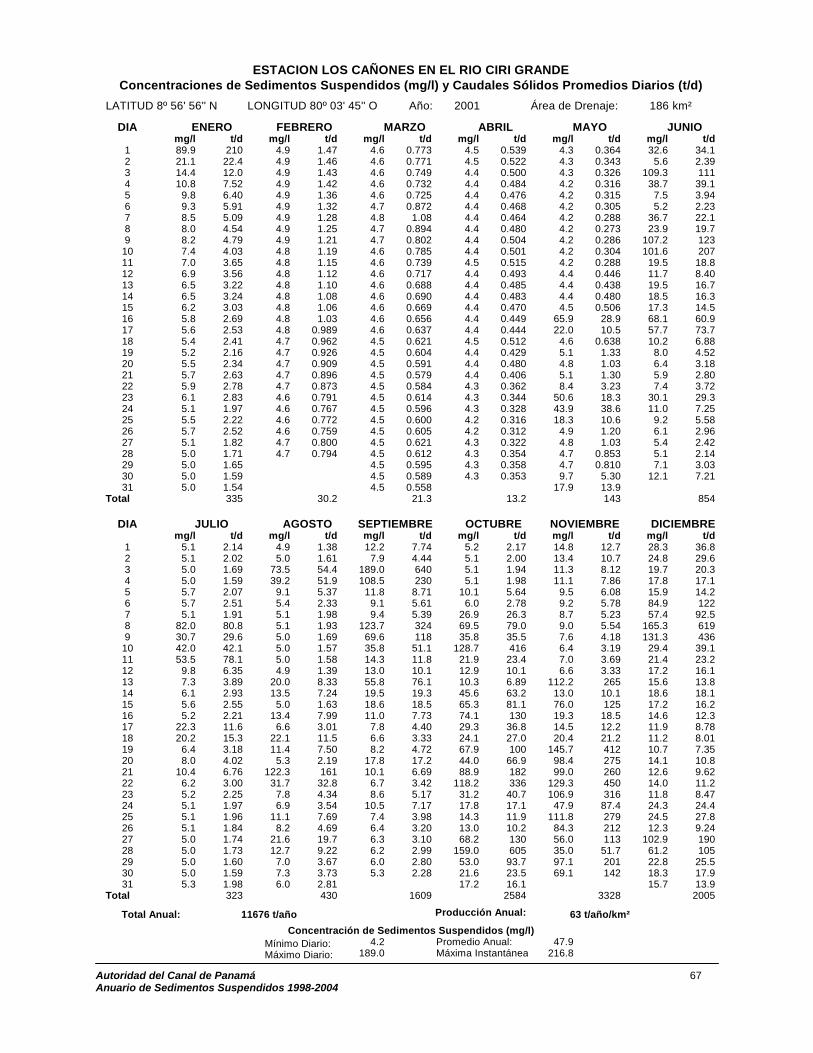
Autoridad del Canal de Panamá 67 Anuario de Sedimentos Suspendidos 1998-2004
Año: 2001 186 km²
mg/l t/d mg/l t/d mg/l t/d mg/l t/d mg/l t/d mg/l t/d1 89.9 210 4.9 1.47 4.6 0.773 4.5 0.539 4.3 0.364 32.6 34.12 21.1 22.4 4.9 1.46 4.6 0.771 4.5 0.522 4.3 0.343 5.6 2.393 14.4 12.0 4.9 1.43 4.6 0.749 4.4 0.500 4.3 0.326 109.3 1114 10.8 7.52 4.9 1.42 4.6 0.732 4.4 0.484 4.2 0.316 38.7 39.15 9.8 6.40 4.9 1.36 4.6 0.725 4.4 0.476 4.2 0.315 7.5 3.946 9.3 5.91 4.9 1.32 4.7 0.872 4.4 0.468 4.2 0.305 5.2 2.237 8.5 5.09 4.9 1.28 4.8 1.08 4.4 0.464 4.2 0.288 36.7 22.18 8.0 4.54 4.9 1.25 4.7 0.894 4.4 0.480 4.2 0.273 23.9 19.79 8.2 4.79 4.9 1.21 4.7 0.802 4.4 0.504 4.2 0.286 107.2 123
10 7.4 4.03 4.8 1.19 4.6 0.785 4.4 0.501 4.2 0.304 101.6 20711 7.0 3.65 4.8 1.15 4.6 0.739 4.5 0.515 4.2 0.288 19.5 18.812 6.9 3.56 4.8 1.12 4.6 0.717 4.4 0.493 4.4 0.446 11.7 8.4013 6.5 3.22 4.8 1.10 4.6 0.688 4.4 0.485 4.4 0.438 19.5 16.714 6.5 3.24 4.8 1.08 4.6 0.690 4.4 0.483 4.4 0.480 18.5 16.315 6.2 3.03 4.8 1.06 4.6 0.669 4.4 0.470 4.5 0.506 17.3 14.516 5.8 2.69 4.8 1.03 4.6 0.656 4.4 0.449 65.9 28.9 68.1 60.917 5.6 2.53 4.8 0.989 4.6 0.637 4.4 0.444 22.0 10.5 57.7 73.718 5.4 2.41 4.7 0.962 4.5 0.621 4.5 0.512 4.6 0.638 10.2 6.8819 5.2 2.16 4.7 0.926 4.5 0.604 4.4 0.429 5.1 1.33 8.0 4.5220 5.5 2.34 4.7 0.909 4.5 0.591 4.4 0.480 4.8 1.03 6.4 3.1821 5.7 2.63 4.7 0.896 4.5 0.579 4.4 0.406 5.1 1.30 5.9 2.8022 5.9 2.78 4.7 0.873 4.5 0.584 4.3 0.362 8.4 3.23 7.4 3.7223 6.1 2.83 4.6 0.791 4.5 0.614 4.3 0.344 50.6 18.3 30.1 29.324 5.1 1.97 4.6 0.767 4.5 0.596 4.3 0.328 43.9 38.6 11.0 7.2525 5.5 2.22 4.6 0.772 4.5 0.600 4.2 0.316 18.3 10.6 9.2 5.5826 5.7 2.52 4.6 0.759 4.5 0.605 4.2 0.312 4.9 1.20 6.1 2.9627 5.1 1.82 4.7 0.800 4.5 0.621 4.3 0.322 4.8 1.03 5.4 2.4228 5.0 1.71 4.7 0.794 4.5 0.612 4.3 0.354 4.7 0.853 5.1 2.1429 5.0 1.65 4.5 0.595 4.3 0.358 4.7 0.810 7.1 3.0330 5.0 1.59 4.5 0.589 4.3 0.353 9.7 5.30 12.1 7.2131 5.0 1.54 4.5 0.558 17.9 13.9
Total 335 30.2 21.3 13.2 143 854
mg/l t/d mg/l t/d mg/l t/d mg/l t/d mg/l t/d mg/l t/d1 5.1 2.14 4.9 1.38 12.2 7.74 5.2 2.17 14.8 12.7 28.3 36.82 5.1 2.02 5.0 1.61 7.9 4.44 5.1 2.00 13.4 10.7 24.8 29.63 5.0 1.69 73.5 54.4 189.0 640 5.1 1.94 11.3 8.12 19.7 20.34 5.0 1.59 39.2 51.9 108.5 230 5.1 1.98 11.1 7.86 17.8 17.15 5.7 2.07 9.1 5.37 11.8 8.71 10.1 5.64 9.5 6.08 15.9 14.26 5.7 2.51 5.4 2.33 9.1 5.61 6.0 2.78 9.2 5.78 84.9 1227 5.1 1.91 5.1 1.98 9.4 5.39 26.9 26.3 8.7 5.23 57.4 92.58 82.0 80.8 5.1 1.93 123.7 324 69.5 79.0 9.0 5.54 165.3 6199 30.7 29.6 5.0 1.69 69.6 118 35.8 35.5 7.6 4.18 131.3 436
10 42.0 42.1 5.0 1.57 35.8 51.1 128.7 416 6.4 3.19 29.4 39.111 53.5 78.1 5.0 1.58 14.3 11.8 21.9 23.4 7.0 3.69 21.4 23.212 9.8 6.35 4.9 1.39 13.0 10.1 12.9 10.1 6.6 3.33 17.2 16.113 7.3 3.89 20.0 8.33 55.8 76.1 10.3 6.89 112.2 265 15.6 13.814 6.1 2.93 13.5 7.24 19.5 19.3 45.6 63.2 13.0 10.1 18.6 18.115 5.6 2.55 5.0 1.63 18.6 18.5 65.3 81.1 76.0 125 17.2 16.216 5.2 2.21 13.4 7.99 11.0 7.73 74.1 130 19.3 18.5 14.6 12.317 22.3 11.6 6.6 3.01 7.8 4.40 29.3 36.8 14.5 12.2 11.9 8.7818 20.2 15.3 22.1 11.5 6.6 3.33 24.1 27.0 20.4 21.2 11.2 8.0119 6.4 3.18 11.4 7.50 8.2 4.72 67.9 100 145.7 412 10.7 7.3520 8.0 4.02 5.3 2.19 17.8 17.2 44.0 66.9 98.4 275 14.1 10.821 10.4 6.76 122.3 161 10.1 6.69 88.9 182 99.0 260 12.6 9.6222 6.2 3.00 31.7 32.8 6.7 3.42 118.2 336 129.3 450 14.0 11.223 5.2 2.25 7.8 4.34 8.6 5.17 31.2 40.7 106.9 316 11.8 8.4724 5.1 1.97 6.9 3.54 10.5 7.17 17.8 17.1 47.9 87.4 24.3 24.425 5.1 1.96 11.1 7.69 7.4 3.98 14.3 11.9 111.8 279 24.5 27.826 5.1 1.84 8.2 4.69 6.4 3.20 13.0 10.2 84.3 212 12.3 9.2427 5.0 1.74 21.6 19.7 6.3 3.10 68.2 130 56.0 113 102.9 19028 5.0 1.73 12.7 9.22 6.2 2.99 159.0 605 35.0 51.7 61.2 10529 5.0 1.60 7.0 3.67 6.0 2.80 53.0 93.7 97.1 201 22.8 25.530 5.0 1.59 7.3 3.73 5.3 2.28 21.6 23.5 69.1 142 18.3 17.931 5.3 1.98 6.0 2.81 17.2 16.1 15.7 13.9
Total 323 430 1609 2584 3328 2005
4.2 Promedio Anual: 47.9189.0 Máxima Instantánea 216.8
ESTACION LOS CAÑONES EN EL RIO CIRI GRANDEConcentraciones de Sedimentos Suspendidos (mg/l) y Caudales Sólidos Promedios Diarios (t/d)
LATITUD 8º 56' 56'' N LONGITUD 80º 03' 45'' O Área de Drenaje:
Mínimo Diario: Máximo Diario:
Concentración de Sedimentos Suspendidos (mg/l)Total Anual: 63 t/año/km²11676 t/año Producción Anual:
DIA ENERO FEBRERO MARZO ABRIL MAYO JUNIO
DIA JULIO AGOSTO SEPTIEMBRE OCTUBRE NOVIEMBRE DICIEMBRE

Año: 2002 186 km²
mg/l t/d mg/l t/d mg/l t/d mg/l t/d mg/l t/d mg/l t/d1 17.8 17.1 5.1 1.95 4.6 0.744 4.5 0.528 5.7 2.59 5.1 1.852 21.3 22.4 5.1 1.90 4.6 0.716 4.5 0.523 5.2 2.18 15.8 8.473 13.7 11.0 5.1 1.88 4.6 0.742 4.5 0.512 5.1 1.97 39.2 37.94 109.6 269 5.1 1.95 4.6 0.725 4.5 0.538 5.1 1.82 21.1 19.45 21.7 23.3 5.0 1.75 4.6 0.678 4.6 0.669 5.0 1.65 16.5 13.66 15.5 13.6 5.0 1.68 4.6 0.652 4.5 0.582 5.0 1.57 10.4 6.357 80.7 154 5.0 1.63 4.6 0.653 4.5 0.512 4.9 1.46 15.3 12.48 32.7 45.8 5.0 1.56 4.6 0.641 4.4 0.502 4.9 1.37 9.1 5.589 90.3 215 5.0 1.50 4.5 0.632 4.4 0.496 4.9 1.37 6.6 3.3510 37.9 57.9 5.1 1.81 4.5 0.630 4.4 0.495 4.9 1.30 34.5 26.711 21.9 24.0 4.9 1.43 4.5 0.619 4.4 0.486 4.9 1.27 24.6 23.212 18.1 17.6 4.9 1.32 4.5 0.617 4.4 0.484 4.9 1.36 7.2 3.8413 15.1 13.1 4.9 1.23 4.5 0.598 4.4 0.471 4.8 1.18 6.6 3.3314 13.2 10.5 4.8 1.17 4.5 0.588 4.4 0.462 4.8 1.12 6.2 2.9915 12.2 9.19 4.8 1.15 4.5 0.580 4.4 0.446 4.8 1.10 5.2 2.2616 11.1 7.89 4.8 1.10 4.5 0.573 4.4 0.444 4.8 1.19 46.9 30.117 10.1 6.77 4.8 1.09 4.5 0.567 4.5 0.519 4.9 1.28 34.0 33.618 9.4 5.94 4.8 1.14 4.5 0.553 4.7 0.804 4.9 1.21 8.1 4.5819 8.6 5.14 4.8 1.09 4.5 0.536 5.6 1.72 4.9 1.24 6.3 3.1220 7.8 4.37 4.8 1.02 4.5 0.522 5.0 1.69 5.1 1.74 5.4 2.4221 7.1 3.79 4.7 0.980 4.4 0.509 41.4 44.4 15.2 8.00 8.2 4.3722 6.7 3.40 4.7 0.941 9.1 2.23 86.7 70.5 12.2 7.73 10.7 6.723 6.2 3.03 4.7 0.920 9.0 4.35 138.4 369 47.3 43.3 6.2 2.9824 5.9 2.77 4.7 0.941 4.7 0.970 7.8 4.24 36.9 36.7 22.5 19.925 5.7 2.61 4.7 0.881 4.6 0.776 67.3 69.4 23.4 24.1 8.0 4.5526 5.3 2.35 4.7 0.842 4.6 0.706 77.5 133 24.9 24.8 7.2 3.8427 5.3 2.30 4.7 0.809 4.6 0.653 129.6 412 11.4 7.92 7.3 3.9328 5.2 2.27 4.6 0.769 4.5 0.599 65.6 119 6.6 3.35 5.9 2.7329 5.1 2.16 4.5 0.567 13.1 10.2 5.5 2.48 5.8 2.6930 5.1 2.12 4.5 0.544 7.7 4.31 5.3 2.21 6.0 2.8331 5.1 2.03 4.5 0.531 5.1 1.93
Total 963 36.4 25.0 1249 193 300
mg/l t/d mg/l t/d mg/l t/d mg/l t/d mg/l t/d mg/l t/d1 31.2 20.8 19.4 19.7 45.9 81.4 18.0 17.3 155.2 580 79.4 1732 18.3 14.6 22.5 24.3 30.7 42.0 15.2 13.1 65.4 126 31.6 43.93 6.7 3.38 18.7 18.3 48.5 80.4 13.1 10.3 97.0 212 23.9 27.84 5.9 2.80 142.9 351 118.7 303 46.1 50.3 37.2 54.5 22.8 25.75 161.4 600 142.3 510 92.4 215 27.1 29.0 45.6 66.8 22.1 24.46 21.7 22.6 46.3 64.5 83.4 178 11.5 8.33 80.8 153 29.3 38.17 10.8 7.50 37.2 53.8 26.1 31.9 12.2 9.13 42.5 66.7 22.5 24.8 8.6 5.17 64.0 106 22.9 25.6 9.9 6.49 38.4 57.7 17.1 16.19 7.5 4.07 65.3 117 54.1 78.7 10.2 6.72 95.7 183 14.3 11.910 6.9 3.56 19.0 19.0 32.5 43.1 8.3 4.83 53.1 91.3 12.5 9.511 82.1 166 15.6 13.8 21.5 23.4 7.5 4.07 36.1 53.2 11.7 8.512 78.1 120 13.5 10.8 38.8 55.2 14.8 9.87 22.4 24.8 10.9 7.613 38.0 51.4 11.2 7.95 20.7 21.7 14.7 10.9 111.7 243 10.1 6.7714 20.8 21.6 10.6 7.31 15.8 14.0 10.2 6.59 171.6 868 9.4 5.9415 51.4 76.2 9.8 6.44 15.7 13.9 70.3 86.1 96.4 254 8.9 5.5016 25.4 30.4 8.9 5.50 25.1 25.8 17.5 15.9 39.7 64.2 10.0 6.6217 28.6 33.8 8.0 4.62 126.8 328 12.3 8.89 43.8 73.5 8.2 4.7818 55.6 95.4 7.3 3.93 64.9 121 104.2 158 33.3 48.0 7.4 4.0619 30.8 40.4 11.1 7.32 21.9 24.1 21.4 21.1 62.3 121 7.0 3.6720 18.6 18.4 9.3 5.85 17.2 16.1 19.5 16.1 30.2 40.7 6.6 3.3421 15.9 14.2 8.7 4.96 15.7 13.8 45.4 73.3 41.9 64.7 6.5 3.2822 15.8 13.9 74.5 80.0 108.9 191 17.1 15.7 26.7 32.3 6.3 3.1023 11.8 8.70 112.8 262 41.1 55.9 128.1 279 253.1 4963 6.0 2.8324 11.0 7.72 63.1 103 16.3 14.7 104.9 255 162.1 795 5.8 2.6925 10.0 6.59 48.0 72.2 40.6 40.2 41.9 66.4 71.5 169 5.6 2.5426 9.0 5.56 18.4 17.6 95.5 190 22.2 23.9 52.2 101 5.3 2.3127 8.2 4.74 83.9 142 116.1 346 72.6 113 41.5 69.2 5.1 2.1828 9.7 6.21 117.7 349 31.8 43.4 116.8 299 33.9 49.6 5.1 2.1229 119.4 194 144.6 574 46.7 61.2 119.9 369 30.4 41.4 5.3 2.3030 93.2 210 122.8 412 36.8 49.3 70.9 148 135.1 378 5.1 2.0431 50.2 80.9 81.0 201 96.1 218 5.1 1.94
Total 1891 3573 2727 2353 10045 480
4.4 Promedio Anual: 67.6253.1 Máxima Instantáne
9
9
324
a 280.2
128 t/año/km²23836 t/año Producción Anual:
Concentración de Sedimentos Suspendidos (mg/l) Mínimo Diario: Máximo Diario:
ESTACION LOS CAÑONES EN EL RIO CIRI GRANDEConcentraciones de Sedimentos Suspendidos (mg/l) y Caudales Sólidos Promedios Diarios (t/d)
LATITUD 8º 56' 56'' N LONGITUD 80º 03' 45'' O
Total Anual:
Área de Drenaje:
DIA ENERO FEBRERO MARZO ABRIL MAYO JUNIO
DIA JULIO AGOSTO SEPTIEMBRE OCTUBRE NOVIEMBRE DICIEMBRE
68 Autoridad del Canal de Panamá Anuario de Sedimentos Suspendidos 1998-2004

Año: 2003 186 km²
mg/l t/d mg/l t/d mg/l t/d mg/l t/d mg/l t/d mg/l t/d1 5.1 1.92 4.7 0.958 4.5 0.538 4.2 0.256 5.9 1.66 6.4 3.192 5.1 1.91 4.8 1.05 4.5 0.524 4.1 0.249 4.5 0.575 5.8 2.713 5.0 1.78 4.7 0.900 4.5 0.513 4.2 0.254 4.4 0.491 5.7 2.584 5.0 1.66 4.7 0.862 4.5 0.515 4.1 0.251 5.9 1.51 8.2 4.605 5.0 1.63 4.7 0.838 4.4 0.497 4.2 0.255 35.5 27.4 7.5 3.956 5.0 1.76 4.7 0.818 4.4 0.494 4.2 0.262 11.6 6.59 9.2 5.537 5.0 1.71 4.7 0.801 4.4 0.477 4.2 0.265 5.0 1.47 5.9 2.788 5.0 1.62 4.6 0.780 4.4 0.459 4.2 0.257 43.3 35.2 5.2 2.189 5.0 1.56 4.6 0.774 4.4 0.442 4.2 0.253 7.9 3.95 5.8 2.62
10 5.0 1.56 4.6 0.772 4.4 0.426 4.2 0.259 4.9 1.33 5.9 2.7311 5.0 1.54 4.6 0.775 4.4 0.424 4.1 0.244 4.7 0.953 24.9 16.412 5.0 1.53 4.7 0.890 4.4 0.434 4.1 0.230 54.6 42.1 55.6 83.713 5.0 1.54 4.7 0.800 4.4 0.423 4.1 0.227 12.9 8.44 71.6 13214 4.9 1.40 4.6 0.759 4.4 0.409 4.1 0.236 6.5 3.11 48.4 80.715 4.9 1.42 4.6 0.722 4.4 0.409 4.1 0.249 5.1 1.84 24.5 26.916 4.9 1.37 4.6 0.693 4.4 0.415 4.1 0.252 4.9 1.39 11.1 7.8317 4.9 1.32 4.6 0.671 4.5 0.551 4.1 0.226 4.8 1.11 14.4 11.718 4.9 1.26 4.6 0.655 4.5 0.559 4.1 0.205 144.2 350 12.8 9.7019 4.9 1.25 4.6 0.645 4.4 0.420 4.1 0.200 25.1 24.8 11.3 7.7020 4.9 1.29 4.6 0.639 4.3 0.350 4.0 0.196 7.8 4.29 18.7 16.421 4.9 1.24 4.5 0.635 4.4 0.473 4.2 0.259 5.9 2.77 8.5 5.0922 4.8 1.19 4.5 0.613 4.3 0.390 4.3 0.365 16.6 9.23 98.4 15723 4.8 1.17 4.5 0.597 4.3 0.329 4.2 0.282 18.3 17.1 50.9 81.024 4.8 1.13 4.5 0.574 4.2 0.311 4.1 0.246 15.2 8.80 18.6 17.825 4.8 1.14 4.5 0.565 4.2 0.298 4.1 0.233 110.9 235 10.8 7.4626 4.8 1.09 4.5 0.557 4.2 0.291 4.2 0.279 8.7 5.23 9.2 5.7427 4.8 1.03 4.5 0.544 4.2 0.288 4.6 0.685 9.5 5.47 8.0 4.5728 4.8 1.01 4.5 0.531 4.2 0.284 4.6 0.545 84.3 90.3 85.4 10329 4.7 0.980 4.2 0.279 43.4 33.7 27.7 25.5 20.1 18.630 4.7 0.947 4.2 0.270 20.7 11.8 6.6 3.29 11.3 7.3431 4.7 0.920 4.2 0.264 20.0 15.1
Total 42.9 20.4 12.8 53.2 937 833
mg/l t/d mg/l t/d mg/l t/d mg/l t/d mg/l t/d mg/l t/d1 19.8 18.6 30.4 40.8 22.9 24.4 8.2 4.76 125.9 423 87.9 2062 10.4 7.02 93.8 229 14.4 12.0 7.7 4.26 67.7 154 51.1 96.53 8.1 4.63 29.6 38.9 13.2 10.3 8.3 4.83 73.7 165 130.8 4604 7.4 4.00 38.1 50.5 11.3 8.12 99.4 131 51.0 95.3 53.1 103.15 7.2 3.80 40.6 61.9 176.2 675 51.3 67.9 40.0 64.7 38.7 61.76 6.2 2.99 34.0 49.0 117.6 331 10.9 7.58 33.3 48.3 50.2 86.47 11.5 6.53 22.3 24.6 24.3 28.5 17.8 13.9 46.9 79.4 226.7 33198 48.5 55.2 77.1 160 33.4 43.1 121.2 318 53.4 99.0 159.4 7259 35.5 39.6 37.1 53.9 19.0 18.9 51.2 78.8 125.4 417 87.2 235
10 124.4 210 20.6 21.7 15.2 13.2 55.9 95.5 142.6 498 63.2 13911 104.6 217 16.2 14.6 12.6 9.75 38.1 55.7 171.3 962 65.6 14512 19.8 20.0 15.4 13.3 11.6 8.43 120.0 263 151.5 666 46.8 84.313 13.2 10.4 20.2 18.7 10.8 7.50 73.8 133 79.0 193 36.9 57.014 10.6 7.24 17.2 15.9 9.6 6.14 21.0 22.4 54.2 107 36.2 54.715 17.1 14.8 11.4 8.2 19.5 17.1 42.8 57.9 47.4 85.4 77.8 16416 10.5 7.16 54.0 71.8 13.0 10.0 32.1 42.6 38.0 59.9 33.0 47.217 8.4 4.95 22.9 23.6 15.6 12.7 77.5 150 64.9 120 27.1 34.418 7.4 4.02 10.8 7.55 22.8 22.2 128.5 402 94.7 220 22.5 25.319 6.9 3.58 9.3 5.89 12.2 8.58 104.5 296 106.9 283 20.1 21.020 6.5 3.28 145.0 312 51.6 67.6 63.5 133 36.2 55.5 33.3 46.521 6.8 3.48 57.8 89.4 22.2 23.0 118.3 355 32.4 46.2 50.5 91.122 6.5 3.27 23.8 23.2 18.7 17.5 102.4 276 153.4 558 38.2 60.123 12.7 8.47 74.5 141 140.6 357 161.6 805 170.4 905 30.2 40.924 15.4 12.8 24.5 27.9 93.7 215 52.5 101 45.6 80.8 22.3 24.825 112.7 165 19.0 18.6 34.6 45.8 98.1 232 46.1 79.9 18.5 18.226 146.3 546 14.5 12.1 19.3 19.4 100.4 266 37.1 57.3 16.0 14.427 74.3 149 30.2 35.5 15.1 13.0 134.4 502 33.1 47.8 14.3 11.928 19.0 18.9 29.8 34.0 12.6 9.62 76.4 176 31.9 45.0 43.3 65.429 12.9 10.1 43.8 66.7 11.2 7.96 81.2 192 121.3 339 21.4 22.830 29.0 36.9 22.4 24.6 9.3 5.83 114.2 326 141.0 531 14.3 11.931 33.7 45.4 35.8 40.1 130.9 450 12.5 9.61
Total 1645 1735 2048 5965 7486 6482
4.0 Promedio Anual: 73.9226.7 Máxima Instantánea 245.7
Total Anual: 147 t/año/km²27260 t/año Producción Anual:
ESTACION LOS CAÑONES EN EL RIO CIRI GRANDEConcentraciones de Sedimentos Suspendidos (mg/l) y Caudales Sólidos Promedios Diarios (t/d)
LATITUD 8º 56' 56'' N LONGITUD 80º 03' 45'' O Área de Drenaje:
Concentración de Sedimentos Suspendidos (mg/l) Mínimo Diario: Máximo Diario:
DIA JULIO AGOSTO SEPTIEMBRE OCTUBRE NOVIEMBRE DICIEMBRE
ABRIL MAYO JUNIODIA ENERO FEBRERO MARZO
Autoridad del Canal de Panamá 69 Anuario de Sedimentos Suspendidos 1998-2004
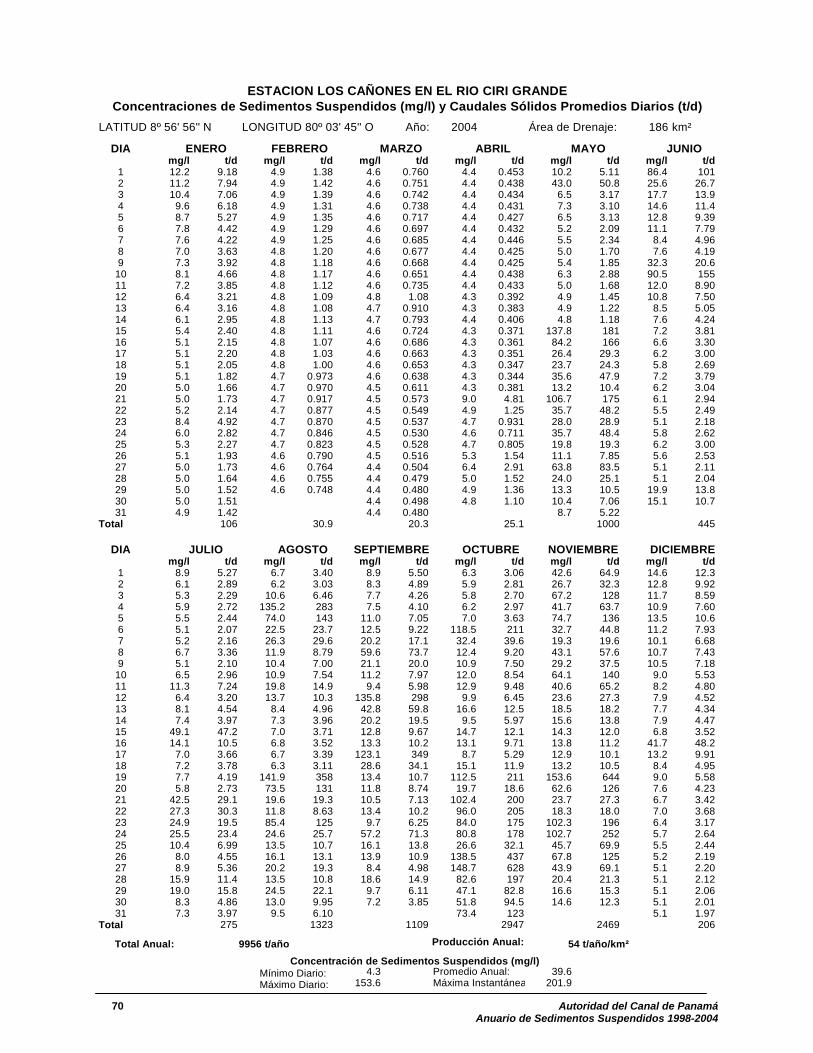
Año: 2004 186 km²
mg/l t/d mg/l t/d mg/l t/d mg/l t/d mg/l t/d mg/l t/d1 12.2 9.18 4.9 1.38 4.6 0.760 4.4 0.453 10.2 5.11 86.4 1012 11.2 7.94 4.9 1.42 4.6 0.751 4.4 0.438 43.0 50.8 25.6 26.73 10.4 7.06 4.9 1.39 4.6 0.742 4.4 0.434 6.5 3.17 17.7 13.94 9.6 6.18 4.9 1.31 4.6 0.738 4.4 0.431 7.3 3.10 14.6 11.45 8.7 5.27 4.9 1.35 4.6 0.717 4.4 0.427 6.5 3.13 12.8 9.396 7.8 4.42 4.9 1.29 4.6 0.697 4.4 0.432 5.2 2.09 11.1 7.797 7.6 4.22 4.9 1.25 4.6 0.685 4.4 0.446 5.5 2.34 8.4 4.968 7.0 3.63 4.8 1.20 4.6 0.677 4.4 0.425 5.0 1.70 7.6 4.199 7.3 3.92 4.8 1.18 4.6 0.668 4.4 0.425 5.4 1.85 32.3 20.610 8.1 4.66 4.8 1.17 4.6 0.651 4.4 0.438 6.3 2.88 90.5 15511 7.2 3.85 4.8 1.12 4.6 0.735 4.4 0.433 5.0 1.68 12.0 8.9012 6.4 3.21 4.8 1.09 4.8 1.08 4.3 0.392 4.9 1.45 10.8 7.5013 6.4 3.16 4.8 1.08 4.7 0.910 4.3 0.383 4.9 1.22 8.5 5.0514 6.1 2.95 4.8 1.13 4.7 0.793 4.4 0.406 4.8 1.18 7.6 4.2415 5.4 2.40 4.8 1.11 4.6 0.724 4.3 0.371 137.8 181 7.2 3.8116 5.1 2.15 4.8 1.07 4.6 0.686 4.3 0.361 84.2 166 6.6 3.3017 5.1 2.20 4.8 1.03 4.6 0.663 4.3 0.351 26.4 29.3 6.2 3.0018 5.1 2.05 4.8 1.00 4.6 0.653 4.3 0.347 23.7 24.3 5.8 2.6919 5.1 1.82 4.7 0.973 4.6 0.638 4.3 0.344 35.6 47.9 7.2 3.7920 5.0 1.66 4.7 0.970 4.5 0.611 4.3 0.381 13.2 10.4 6.2 3.0421 5.0 1.73 4.7 0.917 4.5 0.573 9.0 4.81 106.7 175 6.1 2.9422 5.2 2.14 4.7 0.877 4.5 0.549 4.9 1.25 35.7 48.2 5.5 2.4923 8.4 4.92 4.7 0.870 4.5 0.537 4.7 0.931 28.0 28.9 5.1 2.1824 6.0 2.82 4.7 0.846 4.5 0.530 4.6 0.711 35.7 48.4 5.8 2.6225 5.3 2.27 4.7 0.823 4.5 0.528 4.7 0.805 19.8 19.3 6.2 3.0026 5.1 1.93 4.6 0.790 4.5 0.516 5.3 1.54 11.1 7.85 5.6 2.5327 5.0 1.73 4.6 0.764 4.4 0.504 6.4 2.91 63.8 83.5 5.1 2.1128 5.0 1.64 4.6 0.755 4.4 0.479 5.0 1.52 24.0 25.1 5.1 2.0429 5.0 1.52 4.6 0.748 4.4 0.480 4.9 1.36 13.3 10.5 19.9 13.830 5.0 1.51 4.4 0.498 4.8 1.10 10.4 7.06 15.1 10.731 4.9 1.42 4.4 0.480 8.7 5.22
Total 106 30.9 20.3 25.1 1000 445
mg/l t/d mg/l t/d mg/l t/d mg/l t/d mg/l t/d mg/l t/d1 8.9 5.27 6.7 3.40 8.9 5.50 6.3 3.06 42.6 64.9 14.6 12.32 6.1 2.89 6.2 3.03 8.3 4.89 5.9 2.81 26.7 32.3 12.8 9.923 5.3 2.29 10.6 6.46 7.7 4.26 5.8 2.70 67.2 128 11.7 8.594 5.9 2.72 135.2 283 7.5 4.10 6.2 2.97 41.7 63.7 10.9 7.605 5.5 2.44 74.0 143 11.0 7.05 7.0 3.63 74.7 136 13.5 10.66 5.1 2.07 22.5 23.7 12.5 9.22 118.5 211 32.7 44.8 11.2 7.937 5.2 2.16 26.3 29.6 20.2 17.1 32.4 39.6 19.3 19.6 10.1 6.688 6.7 3.36 11.9 8.79 59.6 73.7 12.4 9.20 43.1 57.6 10.7 7.439 5.1 2.10 10.4 7.00 21.1 20.0 10.9 7.50 29.2 37.5 10.5 7.1810 6.5 2.96 10.9 7.54 11.2 7.97 12.0 8.54 64.1 140 9.0 5.5311 11.3 7.24 19.8 14.9 9.4 5.98 12.9 9.48 40.6 65.2 8.2 4.8012 6.4 3.20 13.7 10.3 135.8 298 9.9 6.45 23.6 27.3 7.9 4.5213 8.1 4.54 8.4 4.96 42.8 59.8 16.6 12.5 18.5 18.2 7.7 4.3414 7.4 3.97 7.3 3.96 20.2 19.5 9.5 5.97 15.6 13.8 7.9 4.4715 49.1 47.2 7.0 3.71 12.8 9.67 14.7 12.1 14.3 12.0 6.8 3.5216 14.1 10.5 6.8 3.52 13.3 10.2 13.1 9.71 13.8 11.2 41.7 48.217 7.0 3.66 6.7 3.39 123.1 349 8.7 5.29 12.9 10.1 13.2 9.9118 7.2 3.78 6.3 3.11 28.6 34.1 15.1 11.9 13.2 10.5 8.4 4.9519 7.7 4.19 141.9 358 13.4 10.7 112.5 211 153.6 644 9.0 5.5820 5.8 2.73 73.5 131 11.8 8.74 19.7 18.6 62.6 126 7.6 4.2321 42.5 29.1 19.6 19.3 10.5 7.13 102.4 200 23.7 27.3 6.7 3.4222 27.3 30.3 11.8 8.63 13.4 10.2 96.0 205 18.3 18.0 7.0 3.6823 24.9 19.5 85.4 125 9.7 6.25 84.0 175 102.3 196 6.4 3.1724 25.5 23.4 24.6 25.7 57.2 71.3 80.8 178 102.7 252 5.7 2.6425 10.4 6.99 13.5 10.7 16.1 13.8 26.6 32.1 45.7 69.9 5.5 2.4426 8.0 4.55 16.1 13.1 13.9 10.9 138.5 437 67.8 125 5.2 2.1927 8.9 5.36 20.2 19.3 8.4 4.98 148.7 628 43.9 69.1 5.1 2.2028 15.9 11.4 13.5 10.8 18.6 14.9 82.6 197 20.4 21.3 5.1 2.1229 19.0 15.8 24.5 22.1 9.7 6.11 47.1 82.8 16.6 15.3 5.1 2.0630 8.3 4.86 13.0 9.95 7.2 3.85 51.8 94.5 14.6 12.3 5.1 2.0131 7.3 3.97 9.5 6.10 73.4 123 5.1 1.97
Total 275 1323 1109 2947 2469 206
4.3 Promedio Anual: 39.6153.6 Máxima Instantánea 201.9
9956 t/año Producción Anual:
ESTACION LOS CAÑONES EN EL RIO CIRI GRANDEConcentraciones de Sedimentos Suspendidos (mg/l) y Caudales Sólidos Promedios Diarios (t/d)
LATITUD 8º 56' 56'' N LONGITUD 80º 03' 45'' O Área de Drenaje:
JUNIO
DIA JULIO AGOSTO SEPTIEMBRE OCTUBRE NOVIEMBRE DICIEMBRE
DIA ENERO
Mínimo Diario: Máximo Diario:
ABRIL MAYO FEBRERO MARZO
Concentración de Sedimentos Suspendidos (mg/l)Total Anual: 54 t/año/km²
70 Autoridad del Canal de Panamá Anuario de Sedimentos Suspendidos 1998-2004

Autoridad del Canal de Panamá 71 Anuario de Sedimentos Suspendidos 1998-2004

72 Autoridad del Canal de Panamá Anuario de Sedimentos Suspendidos 1998-2004

Estación Caño Quebrado Abajo en el Río Caño Quebrado
LOCALIZACIÓN: La estación está a aproximadamente 5 km (3.1 mi) aguas arriba de su descarga en el Lago Gatún, cerca del poblado Caño Quebrado Abajo, en el distrito de Chorrera, provincia de Panamá. Sus coordenadas geográficas son: 9° 00’ 17” de latitud Norte y 79° 49’ 34” de longitud Oeste. CÓDIGO DE LA ESTACIÓN: 115-09-01 ÁREA DE DRENAJE: 67 km2 (25.9 mi2) PERIODO DE REGISTRO: Desde el 1 de enero del 2003 hasta la fecha. VALORES EXTREMOS Y PROMEDIOS PARA EL AÑO 2004
Concentración (mg/l)
Año
Máxima Instantánea
Mínima Diaria
PromedioAnual
Rendimiento
líquido (l/s/km2)
Producción
anual de sedimentos (t/año/km2)
2003 448.1 6.1 103.6 35.1 115 2004 475.9 6.3 87.1 32.7 90
Autoridad del Canal de Panamá 73 Anuario de Sedimentos Suspendidos 1998-2004
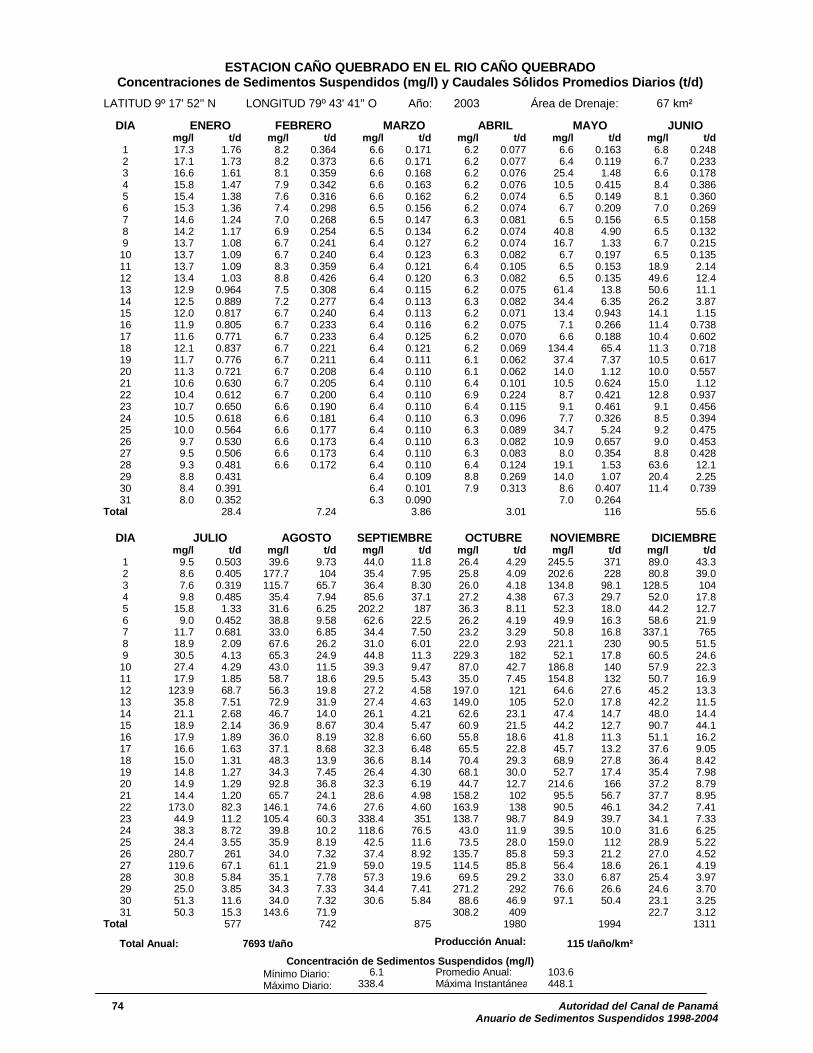
Año: 2003 67 km²
mg/l t/d mg/l t/d mg/l t/d mg/l t/d mg/l t/d mg/l t/d1 17.3 1.76 8.2 0.364 6.6 0.171 6.2 0.077 6.6 0.163 6.8 0.2482 17.1 1.73 8.2 0.373 6.6 0.171 6.2 0.077 6.4 0.119 6.7 0.2333 16.6 1.61 8.1 0.359 6.6 0.168 6.2 0.076 25.4 1.48 6.6 0.1784 15.8 1.47 7.9 0.342 6.6 0.163 6.2 0.076 10.5 0.415 8.4 0.3865 15.4 1.38 7.6 0.316 6.6 0.162 6.2 0.074 6.5 0.149 8.1 0.3606 15.3 1.36 7.4 0.298 6.5 0.156 6.2 0.074 6.7 0.209 7.0 0.2697 14.6 1.24 7.0 0.268 6.5 0.147 6.3 0.081 6.5 0.156 6.5 0.1588 14.2 1.17 6.9 0.254 6.5 0.134 6.2 0.074 40.8 4.90 6.5 0.1329 13.7 1.08 6.7 0.241 6.4 0.127 6.2 0.074 16.7 1.33 6.7 0.21510 13.7 1.09 6.7 0.240 6.4 0.123 6.3 0.082 6.7 0.197 6.5 0.13511 13.7 1.09 8.3 0.359 6.4 0.121 6.4 0.105 6.5 0.153 18.9 2.1412 13.4 1.03 8.8 0.426 6.4 0.120 6.3 0.082 6.5 0.135 49.6 12.413 12.9 0.964 7.5 0.308 6.4 0.115 6.2 0.075 61.4 13.8 50.6 11.114 12.5 0.889 7.2 0.277 6.4 0.113 6.3 0.082 34.4 6.35 26.2 3.8715 12.0 0.817 6.7 0.240 6.4 0.113 6.2 0.071 13.4 0.943 14.1 1.1516 11.9 0.805 6.7 0.233 6.4 0.116 6.2 0.075 7.1 0.266 11.4 0.73817 11.6 0.771 6.7 0.233 6.4 0.125 6.2 0.070 6.6 0.188 10.4 0.60218 12.1 0.837 6.7 0.221 6.4 0.121 6.2 0.069 134.4 65.4 11.3 0.71819 11.7 0.776 6.7 0.211 6.4 0.111 6.1 0.062 37.4 7.37 10.5 0.61720 11.3 0.721 6.7 0.208 6.4 0.110 6.1 0.062 14.0 1.12 10.0 0.55721 10.6 0.630 6.7 0.205 6.4 0.110 6.4 0.101 10.5 0.624 15.0 1.1222 10.4 0.612 6.7 0.200 6.4 0.110 6.9 0.224 8.7 0.421 12.8 0.93723 10.7 0.650 6.6 0.190 6.4 0.110 6.4 0.115 9.1 0.461 9.1 0.45624 10.5 0.618 6.6 0.181 6.4 0.110 6.3 0.096 7.7 0.326 8.5 0.39425 10.0 0.564 6.6 0.177 6.4 0.110 6.3 0.089 34.7 5.24 9.2 0.47526 9.7 0.530 6.6 0.173 6.4 0.110 6.3 0.082 10.9 0.657 9.0 0.45327 9.5 0.506 6.6 0.173 6.4 0.110 6.3 0.083 8.0 0.354 8.8 0.42828 9.3 0.481 6.6 0.172 6.4 0.110 6.4 0.124 19.1 1.53 63.6 12.129 8.8 0.431 6.4 0.109 8.8 0.269 14.0 1.07 20.4 2.2530 8.4 0.391 6.4 0.101 7.9 0.313 8.6 0.407 11.4 0.73931 8.0 0.352 6.3 0.090 7.0 0.264
Total 28.4 7.24 3.86 3.01 116 55.6
mg/l t/d mg/l t/d mg/l t/d mg/l t/d mg/l t/d mg/l t/d1 9.5 0.503 39.6 9.73 44.0 11.8 26.4 4.29 245.5 371 89.0 43.32 8.6 0.405 177.7 104 35.4 7.95 25.8 4.09 202.6 228 80.8 39.03 7.6 0.319 115.7 65.7 36.4 8.30 26.0 4.18 134.8 98.1 128.5 1044 9.8 0.485 35.4 7.94 85.6 37.1 27.2 4.38 67.3 29.7 52.0 17.85 15.8 1.33 31.6 6.25 202.2 187 36.3 8.11 52.3 18.0 44.2 12.76 9.0 0.452 38.8 9.58 62.6 22.5 26.2 4.19 49.9 16.3 58.6 21.97 11.7 0.681 33.0 6.85 34.4 7.50 23.2 3.29 50.8 16.8 337.1 7658 18.9 2.09 67.6 26.2 31.0 6.01 22.0 2.93 221.1 230 90.5 51.59 30.5 4.13 65.3 24.9 44.8 11.3 229.3 182 52.1 17.8 60.5 24.610 27.4 4.29 43.0 11.5 39.3 9.47 87.0 42.7 186.8 140 57.9 22.311 17.9 1.85 58.7 18.6 29.5 5.43 35.0 7.45 154.8 132 50.7 16.912 123.9 68.7 56.3 19.8 27.2 4.58 197.0 121 64.6 27.6 45.2 13.313 35.8 7.51 72.9 31.9 27.4 4.63 149.0 105 52.0 17.8 42.2 11.514 21.1 2.68 46.7 14.0 26.1 4.21 62.6 23.1 47.4 14.7 48.0 14.415 18.9 2.14 36.9 8.67 30.4 5.47 60.9 21.5 44.2 12.7 90.7 44.116 17.9 1.89 36.0 8.19 32.8 6.60 55.8 18.6 41.8 11.3 51.1 16.217 16.6 1.63 37.1 8.68 32.3 6.48 65.5 22.8 45.7 13.2 37.6 9.0518 15.0 1.31 48.3 13.9 36.6 8.14 70.4 29.3 68.9 27.8 36.4 8.4219 14.8 1.27 34.3 7.45 26.4 4.30 68.1 30.0 52.7 17.4 35.4 7.9820 14.9 1.29 92.8 36.8 32.3 6.19 44.7 12.7 214.6 166 37.2 8.7921 14.4 1.20 65.7 24.1 28.6 4.98 158.2 102 95.5 56.7 37.7 8.9522 173.0 82.3 146.1 74.6 27.6 4.60 163.9 138 90.5 46.1 34.2 7.4123 44.9 11.2 105.4 60.3 338.4 351 138.7 98.7 84.9 39.7 34.1 7.3324 38.3 8.72 39.8 10.2 118.6 76.5 43.0 11.9 39.5 10.0 31.6 6.2525 24.4 3.55 35.9 8.19 42.5 11.6 73.5 28.0 159.0 112 28.9 5.2226 280.7 261 34.0 7.32 37.4 8.92 135.7 85.8 59.3 21.2 27.0 4.5227 119.6 67.1 61.1 21.9 59.0 19.5 114.5 85.8 56.4 18.6 26.1 4.1928 30.8 5.84 35.1 7.78 57.3 19.6 69.5 29.2 33.0 6.87 25.4 3.9729 25.0 3.85 34.3 7.33 34.4 7.41 271.2 292 76.6 26.6 24.6 3.7030 51.3 11.6 34.0 7.32 30.6 5.84 88.6 46.9 97.1 50.4 23.1 3.2531 50.3 15.3 143.6 71.9 308.2 409 22.7 3.12
Total 577 742 875 1980 1994 1311
6.1 Promedio Anual: 103.6338.4 Máxima Instantánea 448.1
ABRIL MAYO JUNIO
Producción Anual:
ESTACION CAÑO QUEBRADO EN EL RIO CAÑO QUEBRADO
LATITUD 9º 17' 52'' N LONGITUD 79º 43' 41'' O Área de Drenaje:
Concentraciones de Sedimentos Suspendidos (mg/l) y Caudales Sólidos Promedios Diarios (t/d)
Total Anual: 115 t/año/km²7693 t/añoConcentración de Sedimentos Suspendidos (mg/l)
Mínimo Diario: Máximo Diario:
DIA ENERO FEBRERO MARZO
DICIEMBREDIA AGOSTO SEPTIEMBRE NOVIEMBRE JULIO OCTUBRE
74 Autoridad del Canal de Panamá Anuario de Sedimentos Suspendidos 1998-2004

Año: 2004 67 km²
mg/l t/d mg/l t/d mg/l t/d mg/l t/d mg/l t/d mg/l t/d1 20.8 2.61 12.8 0.943 7.3 0.286 6.5 0.131 34.3 2.16 36.1 8.002 19.8 2.34 12.5 0.899 6.8 0.240 6.4 0.121 9.6 0.426 25.4 3.943 18.8 2.12 12.3 0.862 6.7 0.229 6.4 0.124 9.3 0.471 200.9 1364 18.3 1.99 12.1 0.837 6.7 0.221 6.4 0.120 6.8 0.230 44.1 11.65 18.5 2.03 11.7 0.786 6.7 0.217 6.4 0.127 6.7 0.223 45.7 11.16 18.0 1.92 11.3 0.721 6.7 0.220 6.4 0.112 6.9 0.239 28.4 5.017 17.4 1.79 11.0 0.686 6.7 0.214 6.4 0.113 6.8 0.236 26.7 4.418 16.7 1.66 10.7 0.652 6.7 0.221 6.4 0.117 6.6 0.187 25.7 4.069 16.2 1.54 10.7 0.648 6.7 0.211 6.4 0.111 8.6 0.356 24.0 3.53
10 16.0 1.50 10.5 0.616 6.6 0.194 6.4 0.117 9.8 0.525 23.4 3.3511 16.2 1.55 10.2 0.580 8.4 0.387 6.4 0.114 7.2 0.273 22.6 3.1212 16.1 1.53 9.8 0.535 7.9 0.338 6.4 0.113 6.6 0.197 22.2 2.9913 15.7 1.44 9.7 0.522 6.8 0.238 6.4 0.105 6.6 0.167 21.3 2.7414 15.4 1.38 9.8 0.536 6.6 0.194 6.4 0.101 6.6 0.162 20.9 2.6415 16.0 1.49 9.7 0.530 6.6 0.185 6.3 0.099 212.7 95.4 20.6 2.5416 15.3 1.37 9.7 0.528 6.6 0.177 6.4 0.101 100.8 45.1 19.9 2.3717 14.9 1.29 9.0 0.450 6.6 0.176 6.3 0.100 58.5 18.2 18.9 2.1318 14.6 1.25 8.6 0.412 6.6 0.170 6.4 0.101 49.5 13.1 18.7 2.0819 14.6 1.25 8.8 0.427 6.6 0.166 6.4 0.103 32.6 6.27 18.8 2.1120 14.8 1.28 8.2 0.372 6.6 0.166 6.5 0.143 27.7 4.50 18.9 2.1421 14.9 1.30 7.6 0.312 6.6 0.160 7.2 0.269 42.0 7.78 17.4 1.7922 19.5 2.24 8.0 0.350 6.5 0.153 6.7 0.201 27.9 4.49 17.1 1.7223 21.3 2.72 8.2 0.367 6.5 0.140 6.6 0.167 353.5 300 16.0 1.5024 17.5 1.80 7.9 0.342 6.5 0.143 6.5 0.138 205.7 170 15.8 1.4625 15.5 1.41 7.9 0.345 6.5 0.143 26.0 2.17 41.2 10.4 15.6 1.4326 14.8 1.29 7.8 0.334 6.5 0.142 12.1 0.705 31.2 6.05 15.6 1.4327 14.5 1.22 7.5 0.302 6.5 0.141 7.7 0.315 24.6 3.68 15.5 1.4128 14.0 1.14 7.0 0.269 6.5 0.138 6.7 0.201 26.8 4.40 15.3 1.3829 13.7 1.09 7.1 0.272 6.5 0.141 6.6 0.166 26.1 4.15 15.6 1.4230 13.4 1.04 6.5 0.144 6.5 0.151 20.4 2.48 14.6 1.2431 13.2 1.00 6.5 0.136 19.8 2.34
Total 49.6 15.4 6.03 6.76 704 231
mg/l t/d mg/l t/d mg/l t/d mg/l t/d mg/l t/d mg/l t/d1 14.2 1.17 13.4 1.04 33.4 7.06 20.3 2.47 60.6 24.6 38.8 9.62 13.6 1.07 12.8 0.949 32.3 6.59 19.5 2.27 64.5 28.1 39.2 9.83 14.5 1.22 59.3 11.0 30.4 5.79 18.8 2.10 88.5 54.6 38.6 9.54 21.2 2.45 382.4 445 30.3 5.72 37.4 7.53 66.5 29.9 36.7 8.55 16.5 1.60 233.3 234 349.4 434 42.5 8.32 64.2 27.8 43.2 11.76 15.7 1.45 33.2 6.75 85.6 38.2 236.0 202 53.9 19.2 37.3 8.837 89.7 22.1 39.6 9.28 39.6 10.1 130.1 70.0 45.8 13.7 33.8 7.238 124.6 58.8 24.0 3.52 38.9 9.66 30.5 5.79 49.2 15.9 32.8 6.789 19.1 2.17 21.9 2.89 47.7 14.4 25.8 4.10 53.6 19.0 31.9 6.4
10 15.9 1.48 20.8 2.60 33.5 7.08 23.7 3.43 84.1 48.9 118.9 57.811 15.4 1.40 20.6 2.56 32.4 6.61 23.2 3.29 89.0 50.1 41.3 10.012 14.9 1.30 57.6 13.0 30.2 5.71 23.6 3.40 54.8 19.8 28.7 5.1413 14.2 1.17 27.8 4.28 29.2 5.32 22.6 3.10 67.9 29.4 28.7 5.1314 44.5 9.10 20.0 2.41 28.9 5.21 30.2 5.70 47.6 14.9 27.6 4.7215 19.5 2.22 45.0 10.9 27.7 4.74 40.6 10.6 45.1 13.2 29.8 5.5316 15.5 1.40 24.6 3.64 33.5 6.89 29.6 5.46 43.7 12.4 58.2 22.717 15.1 1.33 20.8 2.62 52.3 15.7 27.3 4.63 41.3 11.0 41.0 10.818 54.5 11.7 20.0 2.41 33.2 6.85 41.3 11.0 71.2 30.1 32.5 6.6519 21.3 2.62 233.3 160 27.3 4.63 49.8 16.3 237.6 369 31.9 6.4120 16.7 1.64 147.4 127 24.5 3.67 38.5 9.52 122.5 89.6 29.3 5.3721 14.6 1.24 44.1 12.0 24.1 3.54 71.4 34.8 57.4 21.9 28.1 4.9022 31.9 5.48 35.7 7.93 40.7 8.82 96.5 65.4 50.5 16.7 27.8 4.8123 77.7 19.2 65.9 19.2 32.9 6.68 138.5 140 64.9 24.7 27.3 4.6024 25.6 3.33 82.4 37.6 28.1 4.92 119.1 102 65.8 27.1 26.4 4.2925 16.0 1.50 39.1 9.68 44.8 11.2 65.5 29.0 55.8 19.4 26.0 4.1726 15.1 1.33 31.9 6.39 31.8 6.19 117.2 98.4 60.9 24.2 25.3 3.9527 14.7 1.27 28.9 5.21 22.6 3.11 234.2 421 44.3 12.8 24.6 3.7028 25.6 3.28 32.8 6.77 21.6 2.82 105.0 78.1 41.5 m 11.1 24.1 3.5629 16.4 1.53 199.8 144 21.4 2.77 93.6 61.4 40.7 10.7 23.6 3.3930 14.5 1.23 114.9 63.3 20.8 2.61 63.9 27.5 40.1 10.3 23.3 3.3031 14.0 1.14 37.3 8.85 74.4 37.8 23.3 3.31
Total 168 1366 656 1475 1100 263
6.3 Promedio Anual: 87.1382.4 Máxima Instantánea 475.9
ESTACION CA
7739
2
ÑO QUEBRADO EN EL RIO CAÑO QUEBRADOConcentraciones de Sedimentos Suspendidos (mg/l) y Caudales Sólidos Promedios Diarios (t/d)
LATITUD 9º 00' 17'' N LONGITUD 79º 49' 34'' O Área de Drenaje:
DIA ENERO FEBRERO MARZO ABRIL MAYO JUNIO
DICIEMBRE
Total Anual: 6041 t/año Producción Anual: 90 t/año/km²
DIA JULIO AGOSTO SEPTIEMBRE
Mínimo Diario: Máximo Diario:
OCTUBRE NOVIEMBRE
Concentración de Sedimentos Suspendidos (mg/l)
Autoridad del Canal de Panamá 75 Anuario de Sedimentos Suspendidos 1998-2004

76 Autoridad del Canal de Panamá Anuario de Sedimentos Suspendidos 1998-2004

Autoridad del Canal de Panamá 77 Anuario de Sedimentos Suspendidos 1998-2004

78 Autoridad del Canal de Panamá Anuario de Sedimentos Suspendidos 1998-2004
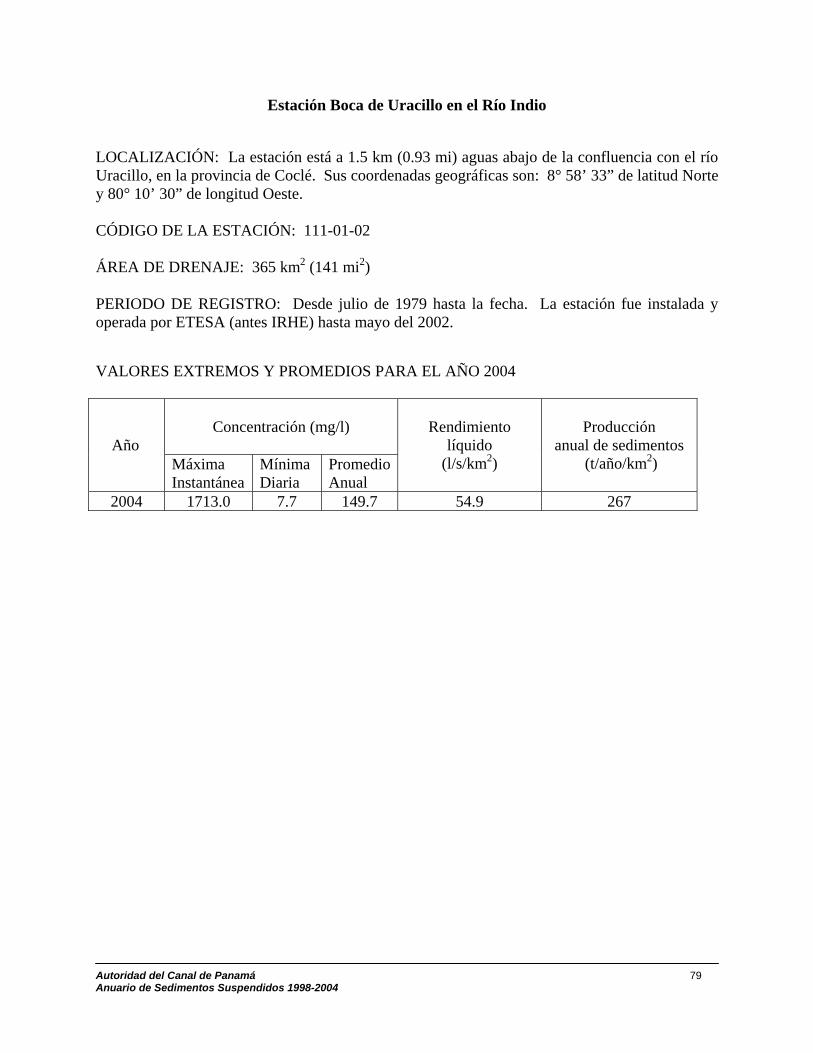
Estación Boca de Uracillo en el Río Indio
LOCALIZACIÓN: La estación está a 1.5 km (0.93 mi) aguas abajo de la confluencia con el río Uracillo, en la provincia de Coclé. Sus coordenadas geográficas son: 8° 58’ 33” de latitud Norte y 80° 10’ 30” de longitud Oeste. CÓDIGO DE LA ESTACIÓN: 111-01-02 ÁREA DE DRENAJE: 365 km2 (141 mi2) PERIODO DE REGISTRO: Desde julio de 1979 hasta la fecha. La estación fue instalada y operada por ETESA (antes IRHE) hasta mayo del 2002. VALORES EXTREMOS Y PROMEDIOS PARA EL AÑO 2004
Concentración (mg/l)
Año
Máxima Instantánea
Mínima Diaria
PromedioAnual
Rendimiento
líquido (l/s/km2)
Producción
anual de sedimentos (t/año/km2)
2004 1713.0 7.7 149.7 54.9 267
Autoridad del Canal de Panamá 79 Anuario de Sedimentos Suspendidos 1998-2004

Año: 2004 365 km²
mg/l t/d mg/l t/d mg/l t/d mg/l t/d mg/l t/d mg/l t/d1 49.5 116 11.7 10.9 9.2 4.94 8.2 3.00 18.0 19.1 16.4 19.02 44.8 98.8 11.3 10.3 9.2 4.74 8.1 2.91 1218.4 17318 27.0 41.23 41.2 86.1 11.1 10.0 9.2 4.77 8.1 2.86 205.7 729 16.2 18.74 37.7 74.6 10.9 9.65 9.2 4.80 8.1 2.84 172.7 621 21.1 28.15 34.8 65.2 10.9 9.52 9.1 4.56 8.0 2.79 62.2 145.2 27.5 39.96 32.3 57.8 10.8 9.09 9.0 4.40 8.0 2.78 24.9 37.7 23.4 33.77 32.5 58.3 10.8 9.27 8.9 4.28 8.1 2.85 26.9 41.7 16.5 19.18 29.3 49.2 10.6 8.67 8.8 4.12 8.0 2.82 15.5 17.2 14.4 15.39 35.9 67.8 10.6 8.53 8.8 4.04 8.0 2.76 13.7 14.0 13.2 13.310 36.5 70.5 10.5 8.15 8.8 3.97 8.0 2.73 15.2 16.7 36.8 64.611 30.8 53.5 10.4 7.82 9.2 4.86 8.0 2.78 11.7 11.0 41.6 76.512 26.6 41.9 10.3 7.58 10.3 7.56 7.9 2.62 10.9 9.56 19.9 25.913 27.4 44.0 10.2 7.46 9.3 4.95 7.8 2.51 10.6 8.50 14.9 16.214 23.1 33.4 10.3 7.72 8.9 4.32 7.8 2.46 10.6 8.59 13.4 13.715 21.5 29.6 10.3 7.55 8.8 4.08 7.7 2.37 74.7 104 13.0 12.916 20.7 27.8 10.1 7.17 8.8 3.97 7.7 2.31 416.3 2307 11.9 11.317 19.1 24.5 10.0 6.80 8.7 3.83 7.7 2.36 308.8 1801 11.4 10.518 17.9 21.9 9.9 6.53 8.7 3.87 7.7 2.41 88.6 276 11.1 9.8519 16.8 19.9 9.8 6.35 8.7 3.82 7.7 2.32 145.8 581 19.0 24.020 16.1 18.4 9.8 6.21 8.6 3.63 23.9 13.1 35.7 67.4 14.5 15.521 19.0 23.9 9.7 5.95 8.5 3.47 64.8 163 26.3 41.0 12.3 11.922 29.6 49.6 9.8 6.18 8.4 3.37 20.4 23.2 41.5 82.9 11.0 9.7923 44.9 95.4 9.8 6.27 8.3 3.23 9.5 5.48 92.2 204 10.9 9.4624 26.5 41.8 9.6 5.82 8.3 3.21 8.8 4.12 105.8 338 11.4 10.225 20.0 26.3 9.5 5.57 8.4 3.29 9.6 5.21 41.5 86.2 11.3 10.226 16.9 19.9 9.4 5.34 8.3 3.26 25.2 28.6 33.1 59.8 10.8 9.2027 15.5 17.3 9.4 5.21 8.3 3.19 22.6 30.2 40.1 72.4 10.7 8.7428 14.5 15.5 9.3 5.04 8.3 3.17 10.6 8.45 41.7 86.0 10.6 8.5429 13.6 14.0 9.3 5.03 8.4 3.29 10.3 7.58 28.9 48.0 13.4 12.430 12.9 12.8 8.5 3.53 9.5 5.61 22.0 30.7 15.1 16.531 12.3 11.8 8.4 3.29 18.0 22.1
Total 1388 216 126 345 25204 616
mg/l t/d mg/l t/d mg/l t/d mg/l t/d mg/l t/d mg/l t/d1 12.2 11.6 17.0 20.1 28.9 48.1 97.2 226 115.8 409 39.8 81.22 10.8 9.07 14.9 16.2 29.2 48.7 31.0 52.1 76.1 225 33.7 62.03 10.5 8.25 127.6 347 25.1 38.1 19.7 25.7 166.7 665 30.8 53.64 11.3 9.63 922.4 6709 69.0 146 18.0 22.1 130.2 485 28.4 46.95 11.3 9.76 220.3 1081 99.1 254 62.4 116 771.0 5310 123.4 4036 10.4 7.89 64.1 172 53.0 125 123.0 389 269.8 1329 54.2 1287 14.0 13.2 60.5 154 50.7 113 89.2 259 63.1 173 32.6 58.58 20.7 27.1 35.7 68.0 389.2 1942 363.7 1561 184.3 729 29.6 50.29 19.3 23.6 75.4 169 70.6 199 241.5 1008 84.9 276 36.5 70.110 26.2 28.4 61.6 149 49.9 116 132.2 437 191.8 1014 28.1 45.911 46.1 92.0 44.7 85.9 33.7 62.0 36.0 68.9 132.1 553 27.3 43.812 24.3 34.2 36.2 67.5 57.7 121 29.8 50.7 71.9 214 25.1 38.213 18.7 22.9 24.9 37.7 70.7 189 34.8 64.4 59.0 155 23.8 35.014 13.8 14.3 21.6 29.9 37.7 73.3 29.8 50.3 48.7 113 25.3 38.615 55.9 94.1 19.9 26.1 50.7 104 724.7 3994 46.3 103 20.4 27.216 30.6 49.6 19.0 24.2 43.9 90.1 233.8 877 53.2 128 86.2 20517 14.9 16.1 20.8 28.0 165.9 648 186.7 663 38.2 76.2 42.2 84.518 20.4 25.0 18.5 22.8 69.8 190 107.0 353 51.0 119 24.0 35.419 23.1 32.0 273.7 1154 46.3 101 79.5 216 612.1 5604 22.5 32.020 13.4 13.6 123.8 436 40.1 80.4 52.1 123 154.4 700 21.9 30.521 484.0 1405 51.2 122 28.7 47.6 307.2 1328 66.1 186 18.6 23.422 203.2 805 35.8 67.8 30.1 50.4 93.0 297 51.3 123 19.3 24.723 30.9 53.4 390.1 1605 25.6 39.4 316.4 1398 443.5 2155 17.3 20.624 29.4 48.4 112.4 353 37.5 66.2 221.4 960 262.6 1519 15.1 16.725 25.8 39.5 68.4 188 27.1 43.2 50.0 117 116.8 437 14.2 15.126 25.5 38.4 46.4 103 22.8 32.5 505.2 2505 104.5 381 13.7 14.127 28.4 44.9 37.8 74.3 36.0 59.3 374.5 2535 103.9 359 13.5 13.828 29.1 45.5 51.6 118 52.5 104 111.2 406 54.9 m 138 12.7 12.529 46.9 92.5 55.4 119 28.5 46.7 93.6 323 45.5 101 11.9 11.330 29.0 46.8 47.2 102 26.4 41.4 165.1 786 43.3 93.3 11.4 10.531 23.7 34.2 29.8 50.6 154.5 559 11.1 9.95
Total 3195 13700 5220 21770 23873 1742
7.7 Promedio Anual: 149.71218.4 Máxima Instantánea 1713.0
FEBRERO MARZO
Concentración de Sedimentos Suspendidos (mg/l) Mínimo Diario: Máximo Diario:
DIA JULIO AGOSTO SEPTIEMBRE OCTUBRE NOVIEMBRE DICIEMBRE
Total Anual: 267 t/año/km²97395 t/año Producción Anual:
ABRIL MAYO JUNIO
ESTACION URACILLO EN EL RIO INDIO
LATITUD 8º 58' 33'' N LONGITUD 80º 10' 30'' O Área de Drenaje:
Concentraciones de Sedimentos Suspendidos (mg/l) y Caudales Sólidos Promedios Diarios (t/d)
DIA ENERO
80 Autoridad del Canal de Panamá Anuario de Sedimentos Suspendidos 1998-2004
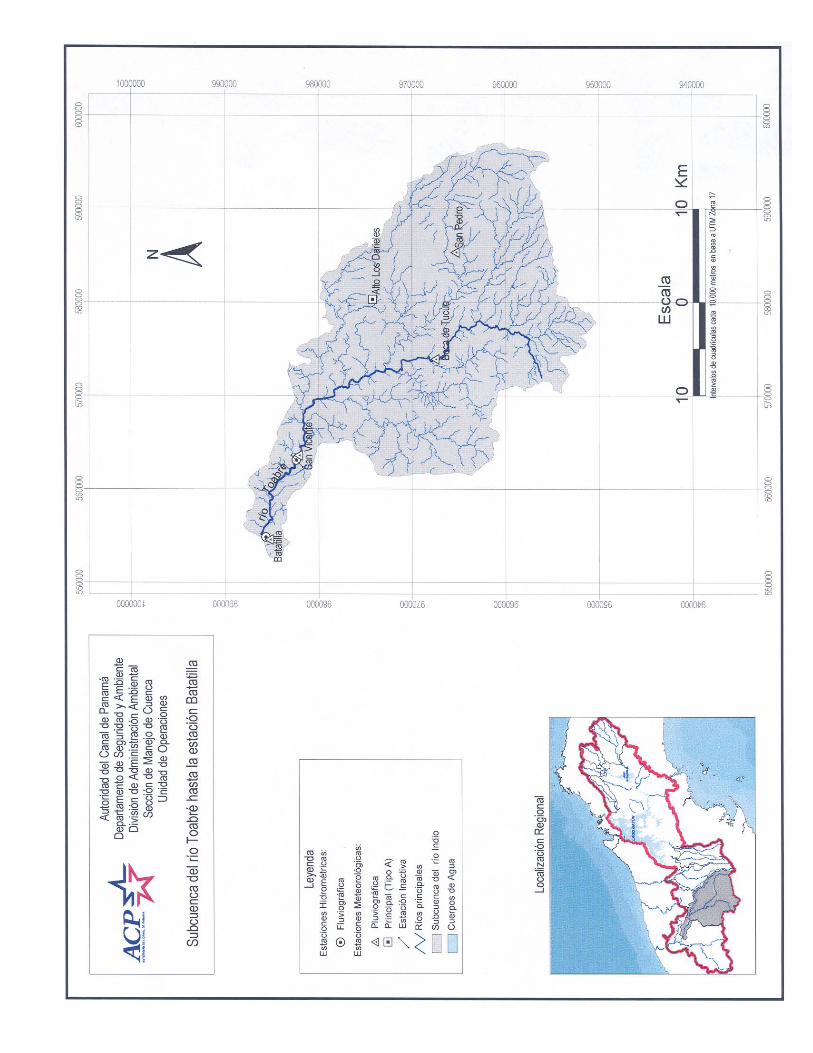
Autoridad del Canal de Panamá 81 Anuario de Sedimentos Suspendidos 1998-2004

82 Autoridad del Canal de Panamá Anuario de Sedimentos Suspendidos 1998-2004

Estación Batatilla en el Río Toabré
LOCALIZACIÓN: La estación está a 4 km (2.5 mi) aguas arriba de la confluencia con el río Coclé del Norte, en la provincia de Coclé. Sus coordenadas geográficas son: 8° 55’ 01” de latitud Norte y 80° 30’ 03” de longitud Oeste. CÓDIGO DE LA ESTACIÓN: 105-02-01 ÁREA DE DRENAJE: 788 km2 (304 mi2) PERIODO DE REGISTRO: Desde marzo de 1982 hasta noviembre de 2000 (ETESA) y de enero de 2004 hasta la fecha. (ACP). La estación fue instalada y operada por ETESA (antes IRHE) hasta mayo del 2002. VALORES EXTREMOS Y PROMEDIOS PARA EL AÑO 2004
Concentración (mg/l)
Año
Máxima Instantánea
Mínima Diaria
PromedioAnual
Rendimiento
líquido (l/s/km2)
Producción
anual de sedimentos (t/año/km2)
2004 2264.2 6.6 115.1 47.6 173
Autoridad del Canal de Panamá 83 Anuario de Sedimentos Suspendidos 1998-2004

Año: 2004 788 km²
mg/l t/d mg/l t/d mg/l t/d mg/l t/d mg/l t/d mg/l t/d1 29.3 119 6.9 10.8 7.4 6.48 6.9 3.92 8.1 11.9 23.3 52.82 27.0 104 8.0 12.1 7.3 6.06 6.8 3.72 52.7 244 27.3 93.73 24.6 88.8 8.0 11.9 7.3 5.92 6.8 3.64 43.8 188 19.9 58.74 22.1 74.3 7.7 11.5 7.3 6.00 6.8 3.63 16.3 42.2 10.9 23.05 20.5 65.6 8.0 12.0 7.3 5.88 6.8 3.61 18.2 48.6 10.2 20.56 19.0 57.8 8.0 11.9 7.2 5.53 6.8 3.57 408.2 4962 13.1 31.17 21.6 71.1 8.0 11.2 7.2 5.30 6.8 3.55 122.8 1007 13.6 32.58 19.3 58.9 7.9 10.5 7.2 5.12 6.8 3.55 16.8 46.2 9.8 19.29 21.7 69.5 7.9 10.5 7.2 5.18 6.8 3.55 10.3 20.9 8.3 14.810 22.7 77.4 7.9 10.4 7.3 5.73 6.8 3.48 10.2 20.6 22.0 65.511 19.1 58.1 7.8 9.74 13.9 24.8 6.7 3.34 8.1 14.0 65.6 34812 17.6 50.8 7.8 9.34 8.0 11.5 6.7 3.22 7.4 11.4 17.3 48.813 15.7 42.2 7.9 10.2 7.6 7.81 6.7 3.06 8.0 11.4 11.3 24.514 14.6 37.3 7.8 10.1 7.4 6.45 6.6 2.96 7.9 10.8 9.3 17.715 13.2 31.5 7.7 9.19 7.2 5.57 6.7 3.00 22.6 46.3 9.6 18.816 12.7 29.6 7.7 8.92 7.2 5.27 6.7 3.13 36.6 158 8.5 15.317 11.6 25.5 7.7 8.94 7.1 5.06 6.8 3.39 44.3 213 9.1 16.918 10.6 22.0 7.7 8.69 7.1 5.05 6.8 3.36 72.5 433 49.1 15119 10.0 19.9 7.7 8.44 7.2 5.13 6.7 3.19 61.1 347 37.5 16120 10.1 20.3 7.6 8.09 7.1 4.92 229.4 1945 16.9 47.1 15.3 40.121 10.5 21.5 7.6 7.82 7.1 4.75 59.3 221 31.6 100 11.0 23.522 14.8 37.7 7.6 7.81 7.1 4.68 13.0 26.5 34.6 137 9.2 17.423 17.1 47.5 7.6 8.20 7.0 4.55 7.7 9.24 26.6 80.1 9.1 17.024 19.2 58.8 7.6 7.74 7.0 4.33 7.3 6.05 68.7 378 21.7 62.025 12.7 29.4 7.5 7.33 6.9 4.14 7.4 6.53 16.2 44.3 11.2 23.926 10.0 20.0 7.5 7.07 7.0 4.18 30.2 52.7 16.1 43.3 9.7 19.127 9.2 17.3 7.4 6.79 7.0 4.18 13.6 31.3 25.2 63.9 8.7 15.728 8.7 15.7 7.4 6.49 7.0 4.33 10.1 19.8 65.8 350 10.5 21.429 8.0 13.8 7.4 6.36 7.0 4.37 7.6 11.1 17.0 47.9 36.5 99.730 7.6 12.8 7.0 4.30 7.8 10.0 12.0 26.8 40.2 17331 7.2 11.6 6.9 4.03 9.5 18.3
Total 1409 270 187 2404 9176 1727
mg/l t/d mg/l t/d mg/l t/d mg/l t/d mg/l t/d mg/l t/d1 29.6 109 12.3 28.1 18.6 55.5 26.2 76.0 149.9 1217 38.6 1782 12.4 28.5 11.2 24.2 19.7 60.9 43.7 155 87.7 537 22.0 73.73 10.1 20.2 22.6 63.1 15.8 42.8 11.4 24.8 55.6 325 18.9 57.64 9.8 19.1 399.2 2408 15.8 42.1 10.9 22.9 52.4 299 17.0 48.05 10.0 19.9 324.4 3645 74.2 309 18.3 47.3 188.5 1345 24.6 83.36 18.6 51.5 47.9 246 61.1 328 58.7 286 129.0 969 23.3 80.17 12.0 26.9 30.9 128 260.7 2262 105.8 670 30.5 127 17.0 48.08 12.5 29.0 20.3 64.3 308.5 3730 83.9 540 55.2 265 17.0 48.19 15.0 38.0 24.8 80.5 218.6 2127 1209.6 17705 44.9 232 29.6 12010 12.1 25.9 40.8 170 89.6 633 1116.9 20485 335.7 4798 20.1 62.711 131.0 1066 16.1 44.1 32.4 140 33.2 145 204.2 2062 17.8 51.912 40.7 182 14.3 36.1 25.6 94.7 23.4 81.1 41.4 210 15.0 39.313 17.2 48.7 14.6 37.5 44.0 204 27.8 102 32.7 142 13.8 34.014 13.1 31.3 12.3 28.1 65.1 343 29.4 115 28.0 110 13.7 33.715 32.0 107 11.6 25.5 20.6 66.4 245.1 3007 24.8 90.2 12.7 29.716 24.8 84.3 11.8 26.4 20.5 65.3 82.4 522 30.7 125 16.0 41.717 12.8 29.9 10.5 21.5 88.2 618 76.0 385 26.7 99.1 24.0 80.418 11.1 23.7 69.2 216 37.9 170 132.6 956 52.7 301 12.7 29.819 15.0 38.5 363.2 4313 20.2 64.1 30.4 125 489.6 9463 12.4 28.320 10.9 22.9 303.6 2920 18.2 53.8 38.7 177 97.8 843 17.8 50.121 10.7 22.3 28.6 112 17.1 48.6 71.6 375 44.0 231 23.4 76.422 58.7 286 19.8 61.6 22.5 73.5 80.4 534 33.6 149 12.3 28.123 12.8 30.0 64.8 285 22.1 71.0 98.0 710 32.6 137 11.4 24.724 57.7 263 300.3 2534 17.6 50.7 58.3 312 85.3 554 10.2 20.725 116.3 775 172.8 1549 18.3 53.3 30.7 126 47.0 246 9.3 17.726 23.7 82.8 47.7 253 21.2 66.1 462.7 3696 65.6 413 9.1 17.027 17.3 49.7 25.4 93.2 15.5 40.5 399.4 4706 53.8 302 8.9 16.428 18.6 55.7 28.7 114 18.5 54.4 51.1 292 27.9 109 8.3 14.629 25.6 90.6 84.7 437 21.0 66.5 47.2 258 24.7 89.7 7.9 13.630 18.2 52.6 55.6 279 18.0 51.7 38.0 182 27.1 102 7.9 13.531 15.8 41.9 20.4 65.2 150.9 941 7.9 13.5
Total 3752 20308 11984 57758 25891 1474
6.6 Promedio Anual: 115.11209.6 Máxima Instantánea 2264.2
Mínimo Diario: Máximo Diario:
Concentración de Sedimentos Suspendidos (mg/l)
ABRIL MAYO JUNIO
NOVIEMBRE DICIEMBRE
Total Anual: 136339 t/año 173 t/año/km²Producción Anual
DIA ENERO
DIA JULIO
ESTACION BATATILLA EN EL RIO TOABRE
LATITUD 8º 55' 01'' N LONGITUD 80º 30' 03'' O Área de Drenaje:
Concentraciones de Sedimentos Suspendidos (mg/l) y Caudales Sólidos Promedios Diarios (t/d)
FEBRERO MARZO
SEPTIEMBRE OCTUBRE AGOSTO
84 Autoridad del Canal de Panamá Anuario de Sedimentos Suspendidos 1998-2004

Autoridad del Canal de Panamá 85 Anuario de Sedimentos Suspendidos 1998-2004

86 Autoridad del Canal de Panamá Anuario de Sedimentos Suspendidos 1998-2004
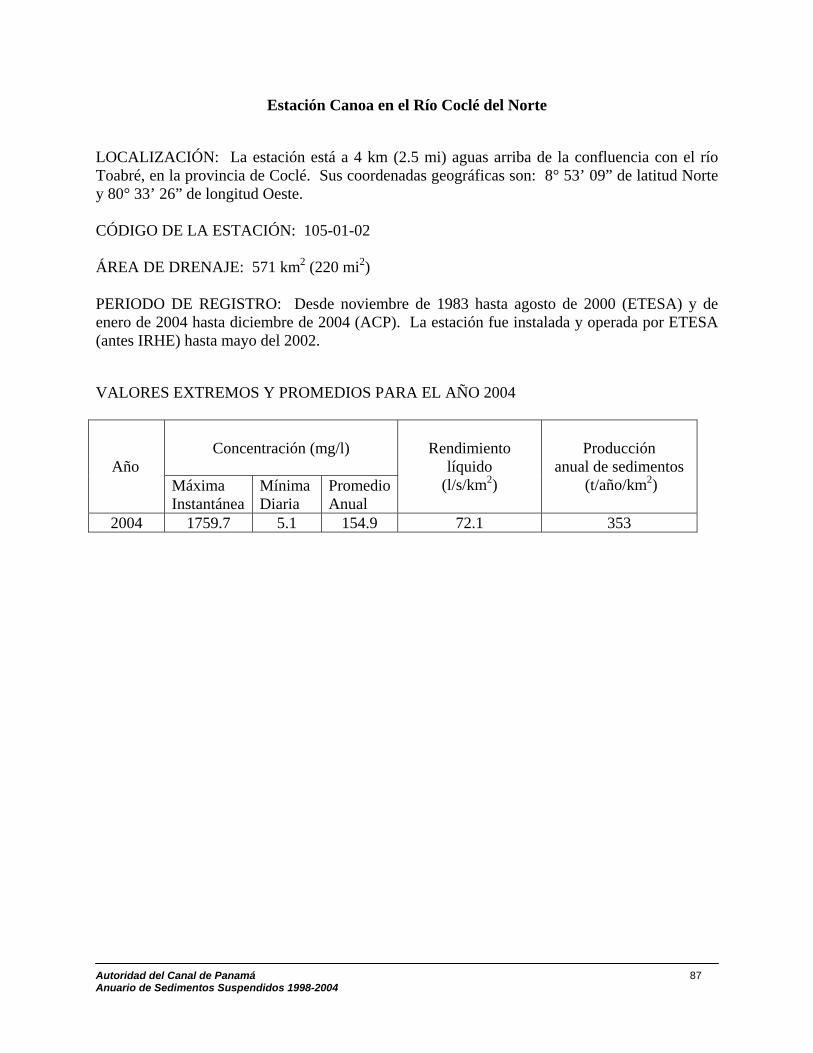
Estación Canoa en el Río Coclé del Norte
LOCALIZACIÓN: La estación está a 4 km (2.5 mi) aguas arriba de la confluencia con el río Toabré, en la provincia de Coclé. Sus coordenadas geográficas son: 8° 53’ 09” de latitud Norte y 80° 33’ 26” de longitud Oeste. CÓDIGO DE LA ESTACIÓN: 105-01-02 ÁREA DE DRENAJE: 571 km2 (220 mi2) PERIODO DE REGISTRO: Desde noviembre de 1983 hasta agosto de 2000 (ETESA) y de enero de 2004 hasta diciembre de 2004 (ACP). La estación fue instalada y operada por ETESA (antes IRHE) hasta mayo del 2002. VALORES EXTREMOS Y PROMEDIOS PARA EL AÑO 2004
Concentración (mg/l)
Año
Máxima Instantánea
Mínima Diaria
PromedioAnual
Rendimiento
líquido (l/s/km2)
Producción
anual de sedimentos (t/año/km2)
2004 1759.7 5.1 154.9 72.1 353
Autoridad del Canal de Panamá 87 Anuario de Sedimentos Suspendidos 1998-2004

Año: 2004 571 km²
mg/l t/d mg/l t/d mg/l t/d mg/l t/d mg/l t/d mg/l t/d1 19.7 74.1 6.3 9.56 6.1 8.08 5.8 6.05 57.7 417 7.1 14.32 18.9 68.6 6.2 8.97 6.0 7.73 5.6 5.04 41.6 241 12.2 31.33 12.3 34.4 6.2 9.01 7.5 13.9 5.5 4.59 19.6 73.3 11.8 29.14 12.7 36.3 6.2 8.72 6.2 9.01 5.4 4.45 18.7 58.7 6.9 13.55 9.8 23.6 6.1 8.36 9.3 21.0 5.5 4.60 228.1 2151 12.9 31.86 24.9 110 6.1 8.07 6.1 8.14 5.7 5.58 784.0 18644 16.7 50.77 50.4 358 6.1 8.11 6.0 7.41 6.2 8.35 247.8 4175 11.2 29.68 51.8 377 6.2 8.68 22.7 46.2 5.6 5.39 94.0 934 7.0 13.89 60.5 486 6.3 9.71 22.0 80.9 5.5 4.86 71.6 548 6.5 10.910 29.5 149 6.2 8.77 23.7 102 5.4 4.22 29.5 148 124.4 70211 14.6 43.3 6.1 8.31 19.1 72.2 5.3 3.80 15.9 53.7 56.3 27212 73.4 586 6.2 9.09 27.8 132 5.2 3.45 12.9 38.0 8.3 18.313 47.8 292 6.0 7.37 10.7 27.3 5.1 3.24 16.7 56.3 6.8 12.614 23.8 102 6.8 11.9 6.9 13.2 5.1 3.19 11.7 32.6 6.4 10.115 16.7 57.2 6.1 7.88 6.4 10.4 5.1 3.26 30.4 119 10.1 22.216 9.8 23.8 5.9 6.74 8.7 19.4 6.6 5.88 74.5 557 7.4 14.417 7.6 15.8 6.5 8.16 6.3 9.86 7.3 13.2 413.5 4247 20.5 67.818 8.1 16.9 37.7 198 6.1 7.89 5.8 5.95 101.5 847 6.5 11.119 10.0 23.5 14.0 40.5 6.3 9.47 5.3 4.12 50.0 316 7.2 13.720 8.1 17.7 14.1 42.6 6.1 8.20 1042.3 30191 17.1 60.2 6.4 10.221 7.3 14.1 6.8 11.8 8.8 15.1 42.5 205 551.7 6252 6.3 9.2622 16.5 53.1 6.1 7.94 6.7 11.9 41.2 188 59.1 396 6.1 7.9623 10.4 26.4 6.0 7.74 6.3 9.20 29.0 99.1 457.3 4427 85.8 22724 11.2 28.0 6.0 7.48 6.1 8.39 16.2 42.9 446.5 6619 266.9 259825 13.2 37.6 5.8 6.23 6.2 8.48 6.4 10.5 23.9 105 20.3 60.626 12.4 35.1 5.7 5.73 7.0 10.4 26.4 67.5 16.7 58.4 36.0 16927 8.1 17.7 5.6 5.39 6.6 10.6 21.6 70.7 13.3 39.9 9.1 21.428 6.7 12.9 5.6 5.18 6.8 10.1 9.7 23.1 57.5 229 6.8 12.629 6.6 12.0 5.6 5.27 6.7 10.7 6.5 10.8 40.8 201 102.4 72830 6.5 11.5 5.8 6.42 56.4 195 10.2 25.6 51.9 26131 6.5 10.8 6.6 10.6 8.0 17.2
Total 3155 491 726 31203 52085 5474
mg/l t/d mg/l t/d mg/l t/d mg/l t/d mg/l t/d mg/l t/d1 8.8 20.1 5.6 5.27 6.6 12.3 810.1 9247 8.3 18.2 52.3 3702 6.7 12.6 5.7 5.65 6.4 10.5 146.9 922 35.7 124 19.6 73.03 6.5 11.0 8.7 14.0 6.3 9.26 9.2 21.3 53.0 225 13.1 39.04 6.5 10.9 6.9 10.7 6.1 8.25 61.6 363 69.9 470 9.8 24.35 6.3 9.93 90.4 399 6.7 11.1 47.3 180 68.5 338 10.6 27.46 6.2 8.72 16.4 45.5 44.1 158 208.8 1603 108.4 725 9.0 20.97 6.3 9.37 14.9 35.2 336.7 4258 65.5 447 12.4 35.7 7.9 16.78 7.1 13.5 6.0 7.27 166.7 1564 103.1 638 49.6 237 60.1 3589 6.3 9.36 9.3 15.1 51.0 295 138.5 1002 56.7 342 110.7 101310 6.0 7.58 7.4 13.1 19.9 74.5 64.7 351 1258.3 48475 48.4 32611 12.6 33.2 5.9 6.58 10.4 26.8 10.2 25.9 176.0 1925 23.9 10212 14.6 33.5 5.8 5.93 8.1 17.5 23.7 73.9 31.3 165 16.0 53.413 11.8 29.9 6.2 8.61 65.7 308 47.7 217 20.3 80.7 10.0 25.114 6.2 8.73 5.7 5.50 41.1 171 16.3 47.9 14.8 47.8 24.8 10415 20.7 38.9 5.6 5.08 7.6 15.2 103.7 692 11.4 31.2 47.5 27016 17.5 50.5 5.6 5.19 10.0 22.5 52.3 256 10.0 25.0 50.0 32617 6.2 8.54 6.0 6.88 6.5 11.0 49.2 189 12.9 36.5 18.6 67.218 6.0 7.31 52.7 113 20.9 40.5 72.6 519 46.0 252 10.5 27.119 5.9 6.90 550.0 6536 30.0 105 24.9 104 236.3 3528 9.6 23.220 5.8 6.45 153.9 991 19.5 61.1 14.7 44.8 64.7 534 105.6 70021 5.8 6.04 7.5 15.0 57.0 187 203.9 1579 25.1 111 141.5 144722 6.0 7.10 6.3 9.93 22.9 77.4 116.7 861 14.8 47.7 17.6 63.023 5.7 5.61 75.8 325 8.9 19.2 44.0 244 405.8 3617 11.6 31.924 10.4 19.9 110.7 828 15.2 39.9 28.5 135 96.0 655 10.3 26.225 39.4 163 43.4 236 7.0 12.5 15.1 48.0 16.7 58.0 8.4 18.926 10.8 22.9 24.2 87.7 8.8 17.5 13.4 39.3 58.0 275 17.6 59.527 25.7 76.8 7.2 14.4 6.7 11.9 22.0 84.9 33.5 152 59.8 37128 7.3 12.9 18.7 61.8 20.8 68.6 22.3 85.4 11.1 29.7 28.5 13129 5.9 7.09 126.0 719 62.2 323 11.4 30.8 9.6 23.3 14.1 42.630 5.7 5.99 50.9 264 16.9 50.6 10.5 26.8 13.5 40.7 19.2 72.631 5.7 5.69 8.4 18.6 7.1 14.3 10.5 26.8
Total 670 10814 7987 20091 62626 6256
5.1 Promedio Anual: 154.91258.3 Máxima Instantánea 1759.7
LATITUD 8º 53' 09'' N LONGITUD 80º 33' 26'' O Área de Drenaje:
DIA ENERO FEBRERO MARZO
Concentración de Sedimentos Suspendidos (mg/l) Mínimo Diario: Máximo Diario:
DIA JULIO AGOSTO SEPTIEMBRE OCTUBRE NOVIEMBRE DICIEMBRE
ESTACION CANOA EN EL RIO COCLE DEL NORTEConcentraciones de Sedimentos Suspendidos (mg/l) y Caudales Sólidos Promedios Diarios (t/d)
Total Anual: 353 t/año/km²201578 t/año Producción Anual:
ABRIL MAYO JUNIO
88 Autoridad del Canal de Panamá Anuario de Sedimentos Suspendidos 1998-2004

RE
D D
E E
STA
CIO
NE
S H
IDR
OM
ET
EO
RO
LÓ
GIC
AS
No.
Nom
bre
Ele
vaci
ón
pie
Ele
vaci
ón
m X
YL
atitu
d N
orte
Lon
gitu
d O
este
1G
atún
100
30.5
6185
65.4
210
2463
4.00
09 1
6 06
79 5
5 14
Pluv
iogr
áfic
a / L
imni
gráf
ica
PLG
atún
RO
REN
E 19
05EN
E 19
05
2G
uach
a95
29.0
6165
81.4
710
1452
3.08
09 1
0 37
79 5
6 20
Pluv
iogr
áfic
a / L
imni
gráf
ica
PLG
atún
RO
RD
IC 1
959
DIC
195
9
3La
s Raí
ces
110
33.5
6112
35.9
910
0510
9.32
09 0
5 31
79 5
9 16
Pluv
iogr
áfic
a / L
imni
gráf
ica
PLG
atún
RO
REN
E 19
12EN
E 19
12
4G
ambo
a10
331
.464
3528
.95
1007
454.
8809
06
4479
41
38Pr
inci
pal (
Tipo
A) /
Lim
nigr
áfic
aM
LG
atún
RO
RJU
N 1
881
JUN
188
1
5Sa
nta
Ros
a91
27.7
6478
64.3
810
1561
0.84
09 1
1 09
79 3
9 15
Pluv
iogr
áfic
a / F
luvi
ográ
fica
PFC
hagr
esR
OR
ENE
1986
ENE
1986
6H
umed
ad10
030
.560
5600
.95
1000
272.
0609
02
5480
02
21Pl
uvio
gráf
ica
PR
OR
AG
O 1
925
7B
arro
Col
orad
o11
033
.562
7848
.47
1013
267.
9409
09
5579
50
11Pl
uvio
gráf
ica
PR
OR
AB
R 1
925
8M
onte
Liri
o11
033
.562
5959
.66
1021
647.
0709
14
2879
51
12Pl
uvio
gráf
ica
PR
OR
DIC
190
7
9C
año
108
32.9
6293
76.1
710
0344
4.05
09 0
4 35
79 4
9 22
Pluv
iogr
áfic
a P
RO
REN
E 19
12
10M
adde
n26
079
.365
2005
.29
1018
329.
7609
12
3779
36
59Li
mni
gráf
ica
LA
lhaj
uela
RO
REN
E 19
00
11Sa
lam
anca
270
82.3
6557
17.1
610
2900
3.56
09 1
8 24
79 3
4 56
Pluv
iogr
áfic
a / L
imni
gráf
ica
PLA
lhaj
uela
RO
REN
E 19
00EN
E 19
00
12A
lhaj
uela
130
39.6
6515
49.1
010
1789
7.95
09 1
2 23
79 3
7 14
Pluv
iogr
áfic
a / F
luvi
ográ
fica
PFQ
1030
Cha
gres
RO
RJU
L 18
99JU
L 18
99
13C
hico
340
104
6637
01.6
310
2427
4.83
09 1
5 49
79 3
0 35
Pluv
iogr
áfic
a / F
luvi
ográ
fica
PFQ
Qs
414
Cha
gres
RO
RO
CT
1932
NO
V19
32
14C
ande
laria
320
97.5
6629
13.8
710
3745
0.14
09 2
2 58
79 3
0 59
Pluv
iogr
áfic
a / F
luvi
ográ
fica
PFQ
Qs
135
Pequ
ení
RO
RSE
P 19
33SE
P 19
33
15Pe
luca
350
107
6580
03.2
210
3712
2.53
09 2
2 48
79 3
3 40
Pluv
iogr
áfic
a / F
luvi
ográ
fica
PFQ
Qs
91.0
Boq
ueró
nR
OR
SEP
1933
OC
T 19
33
16Sa
n M
igue
l17
0652
066
4238
.71
1041
572.
2009
25
1279
30
15Pl
uvio
gráf
ica
PR
OR
AB
R 1
941
17A
gua
Cla
ra15
0946
064
2084
.49
1035
340.
5009
21
5279
42
22Pl
uvio
gráf
ica
PR
OR
MA
Y 1
910
18Es
cand
alos
a15
7548
065
6092
.14
1041
937.
5909
25
2579
34
42Pl
uvio
gráf
ica
PR
OR
ENE
1948
19C
ient
o12
538
.163
9700
.89
1027
959.
8209
17
5279
43
41Pl
uvio
gráf
ica
/ Flu
viog
ráfic
aPF
s11
7G
atún
RO
RA
BR
194
3A
BR
194
7
20El
Cho
rro
140
42.7
6109
96.8
599
2239
.77
08 5
8 32
79 5
9 25
Pluv
iogr
áfic
a / F
luvi
ográ
fica
PFQ
Qs
174
Trin
idad
RO
RSE
P 19
47SE
P 19
47
21Lo
s Cañ
ones
340
104
6030
64.4
198
9270
.34
08 5
6 56
80 0
3 45
Pluv
iogr
áfic
a / F
luvi
ográ
fica
PFQ
Qs
186
Cirí
Gra
nde
RO
RSE
P 19
47SE
P 19
47
22R
ío P
iedr
as63
019
267
5961
.61
1026
355.
6809
16
5579
23
53Pl
uvio
gráf
ica
/ Flu
viog
ráfic
aPF
Q81
Río
Pie
dras
RO
REN
E 19
73EN
E 19
73
23C
asca
das
155
47.2
6450
67.8
810
0405
0.90
09 0
4 53
79 4
0 48
Pluv
iogr
áfic
a P
RO
RFE
B 1
967
24M
iraflo
res
65.0
19.8
6527
90.6
499
6646
.07
09 0
0 51
79 3
6 36
Pluv
iogr
áfic
a / L
imni
gráf
ica
PLM
iraflo
res
RO
RN
OV
190
9N
OV
190
9
25Pe
dro
Mig
uel
100
30.5
6519
93.0
299
7595
.29
09 0
1 22
79 3
7 02
Secu
ndar
ia (T
ipo
B) /
Lim
nigr
áfic
aM
LEG
atún
RO
REN
E 19
08EN
E 19
08
26FA
A33
.010
.165
9468
.14
9916
64.0
208
58
0879
32
58Pr
inci
pal (
Tipo
A)
MR
OR
AB
R 1
998
27D
iabl
o H
eigh
15.0
4.57
6568
42.8
099
1286
.03
08 5
7 56
79 3
4 24
Pluv
iogr
áfic
a / M
areo
gráf
ica
PLPa
cífic
oR
OR
ENE
1983
ENE
1983
28B
albo
a H
eigh
100
30.5
6589
53.0
099
0618
.47
08 5
7 34
79 3
3 15
Pluv
iogr
áfic
a P
RO
REN
E 18
81
29Em
pire
Hill
200
61.0
6467
56.6
710
0147
6.86
09 0
3 29
79 3
9 53
Pluv
iogr
áfic
a P
RO
RA
BR
188
3
30G
atún
Wes
t10
832
.961
7621
.23
1024
047.
5809
15
4779
55
45Pr
inci
pal (
Tipo
A) /
Lim
nigr
áfic
aM
LG
atún
RO
REN
E 19
97EN
E 19
97
31Li
món
Bay
510
.03.
0561
9176
.66
1034
280.
2209
21
2079
54
53Pr
inci
pal (
Tipo
A) /
Mar
eogr
áfic
aM
LTA
tlánt
ico
RO
REN
E 19
97EN
E 19
97
Coo
rden
adas
UT
M1
Pará
met
ros3
C
oord
enad
as G
eogr
áfic
asT
ipo
de E
stac
ión2
Áre
a de
dr
enaj
e (k
m2 )
Río
o L
ago
o M
arR
egió
n4R
egis
tro
desd
e (N
ivel
)
Reg
istr
o de
sde
(Pre
cipi
taci
ón)
Autoridad del Canal de PanamáAnuario de Sedimentos Suspendidos 1998-2004 89

RE
D D
E E
STA
CIO
NE
S H
IDR
OM
ET
EO
RO
LÓ
GIC
AS
No.
Nom
bre
Ele
vaci
ón
pie
Ele
vaci
ón
m X
YL
atitu
d N
orte
Lon
gitu
d O
este
Coo
rden
adas
UT
M1
Pará
met
ros3
C
oord
enad
as G
eogr
áfic
asT
ipo
de E
stac
ión2
Áre
a de
dr
enaj
e (k
m2 )
Río
o L
ago
o M
arR
egió
n4R
egis
tro
desd
e (N
ivel
)
Reg
istr
o de
sde
(Pre
cipi
taci
ón)
32Li
mpi
o622
4468
466
8187
.77
1031
420.
9109
19
4179
28
07Pl
uvio
gráf
ica
PR
OR
FEB
199
8
33Ja
gua
1790
546
6048
03.9
596
5871
.90
08 4
4 14
80 0
2 50
Prin
cipa
l (Ti
po A
)M
RO
RFE
B 1
998
34V
ista
mar
es31
7896
967
5618
.97
1021
100.
8609
14
0479
24
05Pr
inci
pal (
Tipo
A)
MR
OR
AB
R 1
998
35Fr
ijolit
o11
4534
964
1044
.44
1019
241.
1309
13
0879
42
58Pl
uvio
gráf
ica
PR
OR
AB
R 1
998
36Es
pera
nza
6809
31.3
510
4051
0.46
09 2
4 35
79 2
1 08
Pluv
iogr
áfic
a P
RO
RJU
N 1
998
37A
rca
Soni
a87
026
566
3154
.07
1016
500.
5709
11
3679
30
54Pl
uvio
gráf
ica
PR
OR
FEB
199
9
38C
ham
ón21
0064
068
4689
.32
1033
032.
0409
20
3179
19
06Pl
uvio
gráf
ica
PR
OR
NO
V 1
999
39A
mad
or7
5.00
1.52
6611
09.9
498
5896
.36
08 5
5 00
79 3
2 05
Tem
pera
tura
del
Mar
TPa
cífic
oR
OR
40C
erro
Cam
a39
412
062
0263
.82
9979
17.7
109
013
679
54
21Pl
uvio
gráf
ica
PR
OR
AB
R 2
000
41D
os B
ocas
750
229
6722
45.7
510
4520
1.60
09 2
7 09
79 2
5 52
Pluv
iogr
áfic
a P
RO
RM
AY
200
0
42G
aspa
rilla
l11
3534
660
8250
.98
9797
93.6
008
51
4780
00
56Pl
uvio
gráf
ica
PR
OR
JUN
200
0
43N
uevo
Vig
ía26
580
.865
4884
.29
1024
036.
767
09 1
5 42
79 3
5 23
Lim
nigr
áfic
a
LA
lhaj
uela
RO
RJU
L 20
00
44G
old
Hill
590
180
6491
64.0
099
9855
.91
09 0
2 36
79 3
8 34
Pluv
iogr
áfic
aP
RO
REN
E 20
01
45B
oca
de U
raci
llo30
.09.
1459
0689
.12
9922
19.7
508
58
3380
10
30Pl
uvio
gráf
ica
/ Flu
viog
ráfic
aPF
s36
5In
dio
RO
CC
JUL
1979
NO
V 1
999
46C
anoa
40.0
012
.254
8683
.67
9821
97.4
308
53
0980
33
26Pl
uvio
gráf
ica
/ Flu
viog
ráfic
aFQ
Qs
571
Coc
lé d
el N
orte
RO
CC
SEP
1983
DIC
199
9
47B
atat
illa
45.0
13.7
5548
79.1
798
5644
.76
08 5
5 01
80 3
0 03
Pluv
iogr
áfic
a / F
luvi
ográ
fica
FQQ
s78
8To
abré
RO
CC
JUN
195
8D
IC 1
999
48Lo
s Hul
es58
1333
.03
9844
02.3
108
54
1980
15
36Pl
uvio
gráf
ica
PR
OC
CA
BR
200
2
49B
atea
les
5476
96.3
696
4428
.03
08 4
3 30
80 3
3 59
Pluv
iogr
áfic
a P
RO
CC
AB
R 2
002
50In
dio
Los C
horr
os59
6058
.25
9685
53.3
508
45
4280
07
36Pl
uvio
gráf
ica
PR
OC
CA
BR
200
2
51C
hisn
á55
7357
.77
9712
80.1
308
47
1380
28
42Pl
uvio
gráf
ica
PR
OC
CA
BR
200
2
52Pa
lmar
azo
5379
97.6
096
5603
.38
08 4
4 09
80 3
9 16
Pluv
iogr
áfic
a P
RO
CC
AB
R 2
002
53El
Lim
ón d
e Lo
ma
Gra
nde
300
91.4
5587
27.5
797
9047
.57
08 5
1 26
80 2
7 57
Pluv
iogr
áfic
a P
RO
CC
JUN
200
2
54Sa
n V
icen
te8
5630
99.5
598
2392
.24
08 5
3 15
80 2
5 34
Pluv
iogr
áfic
a / F
luvi
ográ
fica
PFQ
725
Toab
réR
OC
CD
IC 2
001
NO
V 2
002
55La
s Mar
ías
574
175
5856
08.1
398
3363
.84
08 5
3 45
80 1
3 17
Prin
cipa
l (Ti
po A
) / F
luvi
ográ
fica
MFQ
Qs
46.7
Ura
cillo
RO
CC
SEP
2004
OC
T 20
02
56C
año
Que
brad
o A
bajo
106
32.4
6290
35.3
099
5518
.47
09 0
0 17
79 4
9 34
Pluv
iogr
áfic
a / F
luvi
ográ
fica
FQQ
s67
.0C
año
Que
brad
oR
OR
OC
T 20
02
57Tr
es H
erm
anas
39
.712
.159
0001
.66
9951
20.4
609
00
0780
10
52Fl
uvio
gráf
ica
FQ38
3In
dio
RO
CC
ENE
2002
58El
Fra
ile55
1203
.00
9727
62.9
608
48
1780
32
03Pr
inci
pal (
Tipo
A)
MR
OC
CFE
B 2
003
59R
anch
eria
5574
55.9
896
6562
.39
08 4
6 46
80 0
5 05
Prin
cipa
l (Ti
po A
)M
RO
CC
MA
R 2
004
60C
oclé
del
Nor
te54
6912
.03
1002
839.
3709
04
2180
34
23Pl
uvio
gráf
ica
PR
OC
CA
BR
200
4
61B
oca
de T
ucue
5739
25.0
896
7568
.15
08 4
5 11
80 1
9 40
Pluv
iogr
áfic
aP
RO
CC
MA
R 2
004
62Sa
n Pe
dro
5853
70.5
396
5397
.40
08 4
4 00
80 1
3 26
Pluv
iogr
áfic
aP
RO
CC
MA
R 2
004
63A
lto L
os D
arie
les
5803
24.9
997
4208
.03
08 4
8 47
80 1
6 10
Prin
cipa
l (Ti
po A
)M
RO
CC
MA
R 2
004
90Autoridad del Canal de Panamá
Anuario de Sedimentos Suspendidos 1998-2004
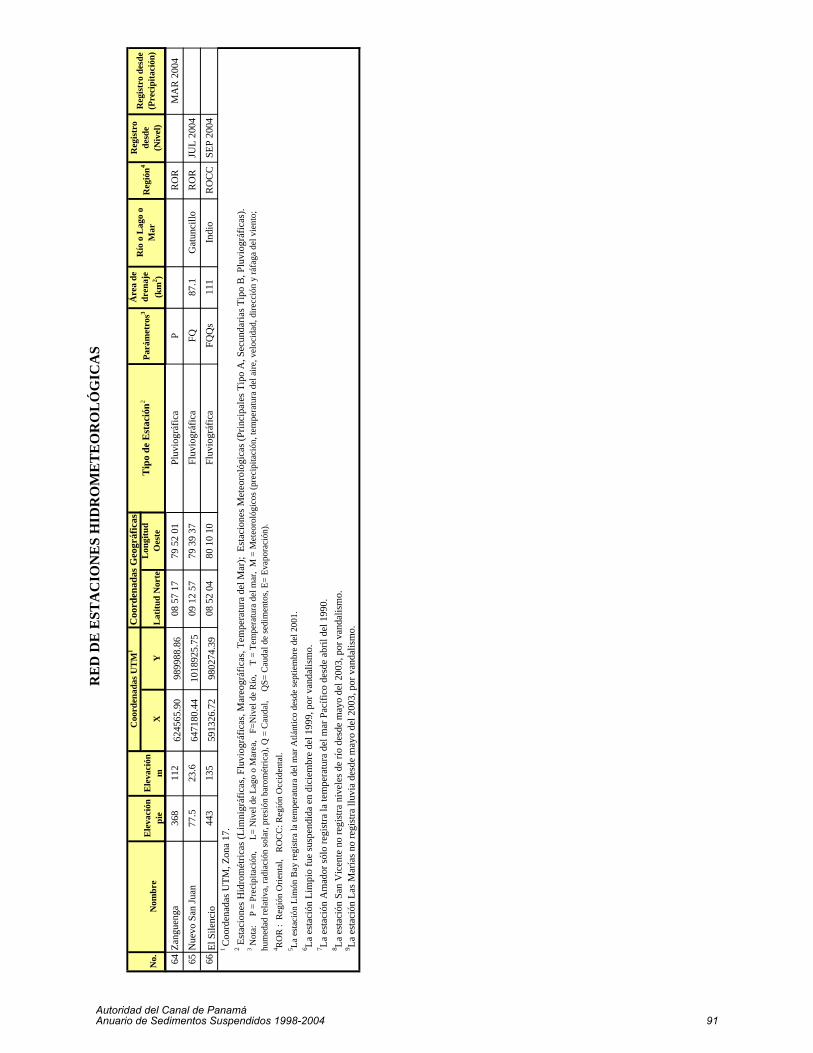
RE
D D
E E
STA
CIO
NE
S H
IDR
OM
ET
EO
RO
LÓ
GIC
AS
No.
Nom
bre
Ele
vaci
ón
pie
Ele
vaci
ón
m X
YL
atitu
d N
orte
Lon
gitu
d O
este
Coo
rden
adas
UT
M1
Pará
met
ros3
C
oord
enad
as G
eogr
áfic
asT
ipo
de E
stac
ión2
Áre
a de
dr
enaj
e (k
m2 )
Río
o L
ago
o M
arR
egió
n4R
egis
tro
desd
e (N
ivel
)
Reg
istr
o de
sde
(Pre
cipi
taci
ón)
64Za
ngue
nga
368
112
6245
65.9
098
9988
.86
08 5
7 17
79 5
2 01
Pluv
iogr
áfic
aP
RO
RM
AR
200
4
65N
uevo
San
Juan
77.5
23.6
6471
80.4
410
1892
5.75
09 1
2 57
79 3
9 37
Fluv
iogr
áfic
aFQ
87.1
Gat
unci
lloR
OR
JUL
2004
66El
Sile
ncio
443
135
5913
26.7
298
0274
.39
08 5
2 04
80 1
0 10
Fluv
iogr
áfic
aFQ
Qs
111
Indi
oR
OC
CSE
P 20
041 C
oord
enad
as U
TM, Z
ona
17.
4 RO
R :
Reg
ión
Orie
ntal
, R
OC
C: R
egió
n O
ccid
enta
l.5 La
est
ació
n Li
món
Bay
regi
stra
la te
mpe
ratu
ra d
el m
ar A
tlánt
ico
desd
e se
ptie
mbr
e de
l 200
1.6 La
est
ació
n Li
mpi
o fu
e su
spen
dida
en
dici
embr
e de
l 199
9, p
or v
anda
lism
o.
7 La e
stac
ión
Am
ador
sólo
regi
stra
la te
mpe
ratu
ra d
el m
ar P
acífi
co d
esde
abr
il de
l 199
0.8 La
est
ació
n Sa
n V
icen
te n
o re
gist
ra n
ivel
es d
e río
des
de m
ayo
del 2
003,
por
van
dalis
mo.
9 La
est
ació
n La
s Mar
ías n
o re
gist
ra ll
uvia
des
de m
ayo
del 2
003,
por
van
dalis
mo.
3 Not
a:
P =
Pre
cipi
taci
ón,
L=
Niv
el d
e La
go o
Mar
ea,
F=N
ivel
de
Río
, T
= T
empe
ratu
ra d
el m
ar,
M =
Met
eoro
lógi
cos (
prec
ipita
ción
, tem
pera
tura
del
aire
, vel
ocid
ad, d
irecc
ión
y rá
faga
del
vie
nto;
hu
med
ad re
lativ
a, ra
diac
ión
sola
r, pr
esió
n ba
rom
étric
a), Q
= C
auda
l,
QS=
Cau
dal d
e se
dim
ento
s, E=
Eva
pora
ción
).
2 Est
acio
nes H
idro
mét
ricas
(Lim
nigr
áfic
as, F
luvi
ográ
ficas
, Mar
eogr
áfic
as, T
empe
ratu
ra d
el M
ar);
Est
acio
nes M
eteo
roló
gica
s (Pr
inci
pale
s Tip
o A
, Sec
unda
rias T
ipo
B, P
luvi
ográ
ficas
).
Autoridad del Canal de PanamáAnuario de Sedimentos Suspendidos 1998-2004 91
La Unidad de Operaciones agradece a los siguientes colaboradores sus aportes en la elaboración de este anuario: Daly Espinosa (introducción, procesamiento de datos e integración del anuario); Tomás García (aforos, recolección de muestras de sedimentos y procesamiento de datos); Clímaco Abadía, Oscar Baloyes, Nelson Guerra, Gerardo Leis, Eduardo Medrano y Ayax Murillo (aforos y recolección de muestras de sedimentos); Indira Mendoza y Marelissa De León (elaboración de mapas y edición para la consolidación del anuario) Unidad de Calidad de Agua de la Sección de Manejo de Cuenca (determinación de concentraciones de sedimentos en el laboratorio); Jaime Massot (foto del río Boquerón en la estación Peluca, diseño de portada y supervisión general de la publicación)