análisis estructural del puente colgante de clifton situado en bristol
TRANSCRIPT
Análisis estructural del Puente Colgante de Clifton situado en Bristol, Reino
Unido.
Tomo1–Memoria
Trabajofinaldegrado
Titulación:GradoenIngenieríaCivil
Curso:2015/16
Autor:Toms,CameronIan
Tutor:PayáZaforteza,IgnacioJavier
Cotutor:—
Valencia,juniode2016
TrabajofinaldeGrado Toms,CameronIan
AnálisisestructuraldelPuenteColgantedeCliftonsituadoenBristol,ReinoUnido 1
Contents
Contents................................................................................................................1Abstract.................................................................................................................21.Introduction.......................................................................................................32.Objectives..........................................................................................................33.Methodology......................................................................................................34.HistoricalContext...............................................................................................4
4.1.Ahistoryofsuspensionbridges...............................................................................44.2.Graphicalmethodsofstructuralanalysis.................................................................6
5.TheCliftonSuspensionBridge............................................................................95.1.Thehistoryofthebridge.........................................................................................95.2.Analysisofexistingdocumentationanddescriptionofbridge...............................105.3Structuralanalysis..................................................................................................12
5.3.1Transversalgirders.................................................................................................125.3.2.Chains....................................................................................................................215.3.3.Othercalculations.................................................................................................27
6.Comparisonofanalyticalmethods...................................................................297.Criticalevaluationofthebridge........................................................................30
7.1.Themodernstructure............................................................................................307.2.Othersubmissionsfromthedesigncompetition....................................................31
7.2.1.‘Giant’sHole’design–Brunel...............................................................................317.2.2.GothicRevival–Telford........................................................................................317.2.3.Stonebeam–Burge..............................................................................................327.2.4.Combinedarch-suspensionbridge–Hill...............................................................32
8.Conclusion........................................................................................................349.References.......................................................................................................3510.Appendices.....................................................................................................37

TrabajofinaldeGrado Toms,CameronIan
AnálisisestructuraldelPuenteColgantedeCliftonsituadoenBristol,ReinoUnido 2
AbstractThisprojectisanevaluationandanalysisoftheprincipalelementsoftheCliftonSuspension
Bridge inBristol,UK.Theanalysis isdonewithanumericalmethod solvedona computer
andagraphicalmethodcalledgraphicstatics.Themethodsandthedesigns forthebridge
are studied in theirhistorical context.Despite the fact that graphic statics ismore limited
thanthenumericalmethod, itproducesresultsthatagreewiththenumericalanalysisand
physical tests.Theerrorscausedbygraphicstaticsareanalysedanddiscussed.Theresults
showthat thebridgewaswelldesigned for theoriginaldesign loads,andthat thecurrent
restrictions on vehicles well suited. Finally the bridge and several alternative designs are
qualitatively evaluated in terms of the quality of design and their value in a social and
historicalcontext.
Resumen:Esteproyectoesunaevaluaciónyanálisisde loselementosprincipalesdelpuentecolgantedeCliftonenBristol,ReinoUnido.Elanálisissehaceporunmétodonuméricoenordenadoryunmétodográficoquesellamaestáticagráfica.Losmétodosylosdiseñosparaelpuenteseinvestiganensucontextohistórico.Apesardelhechodeque laestáticagráfica tienemáslimitaciones que el método numérico, produce resultados que están de acuerdo con elanálisis numérico y los ensayos físicos. Los errores causados por la estática gráfica seanalizan y se discuten. Los resultadosmuestran que el puente fue bien diseñado para lascargasdediseñooriginales,yque lasrestriccionesactualesestánbien.Alfinal,elpuenteyvariosdiseñosalternativosseevalúancualitativamentedesdeelpuntodevistadelacalidaddediseñoysuvalorenuncontextosocialyhistórico.Resum:EsteprojecteésunaavaluacióianàlisidelselementsprincipalsdelpontpenjolldeCliftonenBristol,RegneUnit. L'anàlisi es faperunmètodenumèricenordinador iunmètodegràficques'anomenaestàticagràfica.Elsmètodesielsdissenysperalponts'investiguenenelseucontext històric.Apesardel fet deque l'estàticagràfica témés limitacionsqueelmètodenumèric, produïx resultats que estan d'acord amb l'anàlisi numèrica i els assajos físics. Elserrors causats per l'estàticagràfica s'analitzen i es discutixen. Els resultatsmostrenque elpont va ser ben dissenyat per a les càrregues de disseny originals, i que les restriccionsactuals estan bé. Al final, el pont i diversos dissenys alternatius s'avaluen qualitativamentdesdelpuntdevistadelaqualitatdedissenyielseuvalorenuncontextsocialihistòric.
TrabajofinaldeGrado Toms,CameronIan
AnálisisestructuraldelPuenteColgantedeCliftonsituadoenBristol,ReinoUnido 3
1.IntroductionModerncivilengineeringalmostexclusivelyusesnumericalmethodsofanalysisinthedesign
ofbuildingsandcivil structures.Civilengineeringstudentsaretaughthowtodostructural
analysis with hand calculations while computers analyse complex models by solving
thousandsofmatrices.Howeverthemathematicsbehindthesemethodsisarelativelynew
invention. Many of the world’s most famous monuments, palaces and bridges were
designed and constructed before the invention of these numericalmethods. The primary
aimofthisprojectistocompareanalternativemethodofanalysiswithamodernnumerical
method, and explore more deeply the history of structural analysis and its effect on
construction.
Tocomparethemethods,theywillbeusedtoanalysetheCliftonSuspensionBridge
inBristol,UK.Thebridge itself isoneof theoldest survivingexamplesofearly suspension
bridge design and is an illustration of how the evolution of technology and the
understanding of structures affects the way structures are designed. The results of the
analysiswill also be used to evaluate the design of the bridge,whichwas built in a time
whenthebehaviourofsuspensionbridgeswaspoorlyunderstood.
Unlike thesciences,where theaim is investigationandtheemphasis isonwhat is
notunderstood,theemphasisinstructuralengineeringisonwhatwealreadyknow.Itoften
seems that things thatwedonotunderstandorcannotcalculateareavoided in favourof
something that we understand. The history of suspension bridges is one full of
experimentation, mistakes, unknowns and guesses. It is this side of engineering that
intriguesme.
2.ObjectivesThe objectives of thiswork are to analyse part of the structure of the Clifton Suspension
Bridgeinasimplifiedmannerusingagraphicalandnumericalmethodofstructuralanalysis.
Theresultsoftheanalysiswillpermitanevaluationofthedesignofthesuspensionbridge
andacomparisonofthetwoanalyticalmethods.
3.MethodologyTheprojectwillbeput intohistoricalcontextsothatthethinkingbehindthedesignofthe
CliftonSuspensionBridgecanbebetterexplained.Theanalysisofthebridgewillbebroken
downintopartsprimarilyencompassingthetransversaldeckgirders,thesuspensionchains,
and the longitudinal girders. This will provide enough information to make a critical
evaluationofthesuperstructureofthebridge.Theanalysiswillbecarriedoutusingboththe
graphicalandnumericalmethodswherepossibleandwillbebasedonthedesignloadused
duringconstructionand the loads that thebridge is subjected to today.The resultsof the
twomethodswill be compared inorder to identify the causesof anyerrors andpermit a
quantitativeandqualitativeevaluationofthemethods.
TrabajofinaldeGrado Toms,CameronIan
AnálisisestructuraldelPuenteColgantedeCliftonsituadoenBristol,ReinoUnido 4
4.HistoricalContext
4.1.AhistoryofsuspensionbridgesSuspendedbridgesmadeofropes,bambooandironchainshaveexistedformillennia(Body,
1976), however the firstmodern suspension bridges camewith the advent of the use of
structuraliron.TheCoalbrookdaleBridgeinShropshire,UK,wasbuiltin1779andiscredited
asbeingthefirstcastironbridge.Althoughtheuseofthematerialwasnovel,thestructure
wasnot:thebridgeusesthesamecirculararchdesignthattheRomanshadbeenusing2000
yearsearlier.Thistrendofbuildingironbridgeswithstructuresmoresuitedtobeingmade
ofwoodorstonecontinuedfordecades;in1802theFrenchgovernmentorderedthreenew
‘modern’ bridges to be built – all had structures based on wooden and stone bridges
(Grattesat,1978).
The first stepwas the inventionof the ironeyebar, patentedby SamuelBrown in
England,1817.ThreeyearslaterhebuilttheUnionChainBridgeovertheRiverTweed.With
a spanof137m, itwas the longest suspensionbridge in theworldat the time (Grattesat,
1978). Itwas exceeded by Thomas Telford’s bridge over theMenai Strait in 1826,whose
largest span is 177m. The Menai Suspension Bridge is regarded by many as the first
importantstepinthehistoryofsuspensionbridgedesign(Gimsing,1984).
At the same time in France, iron suspension bridgeswere being constructed. The
TournonBridgeovertheRhône,builtin1825byMarcSeguin,usedinnovativecablesmade
of 3mm iron threads to support the deck (Gimsing, 1984). Although thismethod became
popular in France, it was not widely adopted elsewhere because of the difficulty of
constructionandpoorqualitycontrol(Drewry,1832).
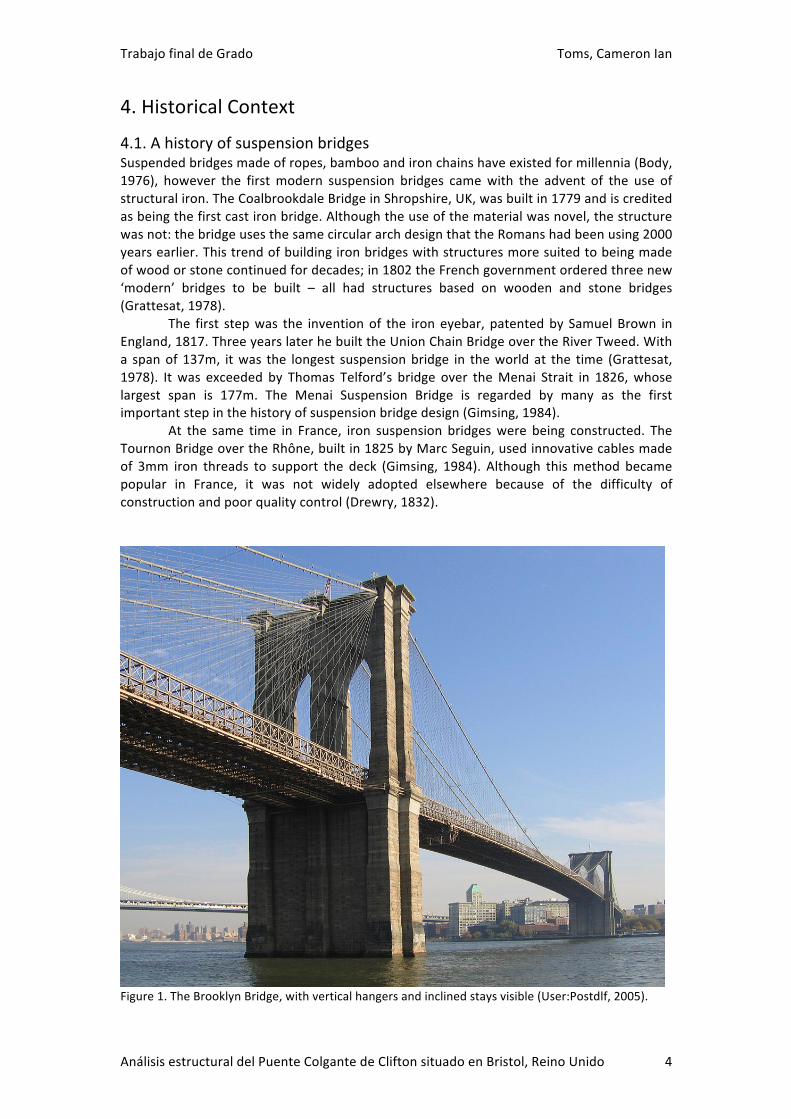
Figure1.TheBrooklynBridge,withverticalhangersandinclinedstaysvisible(User:Postdlf,2005).

TrabajofinaldeGrado Toms,CameronIan
AnálisisestructuraldelPuenteColgantedeCliftonsituadoenBristol,ReinoUnido 5
As technology became more refined, the size of the bridges increased. In 1849,
Charles Ellet Jr. built theWheelingBridgeover theOhioRiver in theUSA.With a spanof
308m, itwassignificantly larger thananythingbuiltbefore itandwassupportedwith iron
cables.Fiveyearslateritcollapsedduringastorm.Followingthisandthecollapseofseveral
otherbridgesinhighwinds,anemphasiswasplacedonthesafetyandstiffnessofbridges.
Ferdinand Arnodin improved deck design by using the parapet to improve stiffness and
Seguin invented cable-winding machines to so that cables could be constructed on-site
(Grattesat,1978).
TheBrooklynBridge,NewYork(seefig.1),wascompletedin1883byJohnRoebling
andisagoodillustrationoftheprogressionofsuspensionbridgedesigninthatperiod.The
onlymathematical theories to describe themechanics of suspension bridges at that time
were 1st order theories such as Rankine’s, published in 1869 (Buonopane and Billington,1993),whichdescribethebridgeaccordingtoitsundeflectedshape.Thismeantitwasnot
possibletocalculatehowthe loads inthestructurechangedas itdeflectedunder load.To
makeupforthis,theBrooklynBridgeissupportedbyacombinationofcable-staysaswellas
suspended cables and has a deep ‘stiffness truss’. The entire structure is highly
indeterminate andheavily over-engineered; Roebling said that if all the suspended cables
whereremoved,thebridgewouldstillnotcollapse(Gimsing,1984).
Shortlyafterwards in1888, JosephMelanpublishedhis2ndorderdeflection theory
(Gimsing, 1984). Although itwas difficult to implement by hand, it took into account the
displacementsofthesuspensioncablesunderload,sotheresultsweremoreaccuratethan
using the 1st order geometry. Gimsing believes that thismarked the beginning of amove
towardsmathematically simplerdesigns, suchas theWilliamsburgBridge,built in1903. It
has a similar span to thatof theBrooklynBridge (490m)butno stays, as their effectwas
impossible to calculate. Unlike earlier designs, bridges from this period have cables the
attachtothebottomofthestiffnesstruss,asitismoreeconomical.ThelateralforcetheorydevelopedbyMoissiffandHudsonin1932meantthattheeffectsofhorizontalwindloads
could be calculated, making the ‘wind girder’ in the decks of older bridges unnecessary
(Gimsing,1984).Theseadvancesinmathematicalability,writesGimsinginCableSupportedBridges (1984),meantthatengineersbecameincreasinglyreliantoncalculationsandwere
‘blindly trusting of results’. Although the behaviour of the bridge could still not be
completely calculated, there started a trend towards extreme slenderness. Bridge decks
were builtwith evermore slender and flexible decks because theywere calculated to be
adequate.AgoodexampleistheGoldenGateBridge,SanFrancisco(seefig.2),whichhada
span todepth ratioof 168whenbuilt. Theproblemof torsional stiffness anddynamic air
pressurescametolightafterthespectacularcollapseoftheTacomaNarrowsbridgeinlight
winds.TheGoldenGateBridgewassubsequentlymodifiedandinvestigationwasmadeinto
theeffectsofaerodynamics(Gimsing,1984).Newanalyticalmethodsweredeveloped.
Figure2.TheGoldenGateBridge,SanFrancisco(WPPilot,2015).

TrabajofinaldeGrado Toms,CameronIan
AnálisisestructuraldelPuenteColgantedeCliftonsituadoenBristol,ReinoUnido 6
Figure3.PhotographoftheSevernBridge,showinginclinedhangersandaerodynamicdeckprofile
(Edwards,2007).
After theSecondWorldWartherewasan increase inbuildingactivityanddesigns
begantotendintheoppositedirectiontothoseofthe1930s.Gimsing(1984)notesthatthe
MackinacbridgeinMichigan,US,isdesignedforamaximumwindspeedof995km/h–farin
excessofwhatisrequired.
Further advances in structural analysis lead to the construction of the first cable-
stayedbridgein1956.Ithasbecomethepreferredformoflong-spanbridgeasitallowsfora
cantilevermethodoferection.
In1959, theTancarvilleBridge,France,becamethefirstsuspensionbridgeoutside
of America to have a span ofmore than 500m.Unlike American-style bridges,which had
steel towers, the Tancarville Bridge had concrete towers and a continuous deck that ran
through the centre of the towers. A culmination of modern analytical and construction
techniquespermittedthebuildingoftheSevernRoadBridge,UKin1966(seefig.3).Itsvery
slenderdeck (withaspan:depthratioof324)thathadbeenunthinkable just twentyyears
earlier was made possible by an aerodynamic box girder deck section which gave high
torsionalstiffnessandcostsavingsovertraditionalmethods.Anintersectingarrangementof
inclinedhangersprovidedsufficientverticaldamping(Gimsing,1984).
Suspensionbridgescontinue tobeused in the largest spans today,as theycanbe
mademorecheaplyandwithlessmaterialthanotherbridges.Thelongestsuspendedspan
to date is the Akashi-Kaikyo Bridge, in Japan andmeasures almost 2000m (Miyata et al.,
2002).
4.2.GraphicalmethodsofstructuralanalysisAlthough Newton published his theories on mechanical mathematics in 1687, the use of
mathematicsinstructuralengineeringanddesignisstillrelativelymodern.Computershave
only been used in structural design and analysis for the last half a century, yet it is now
unthinkabletheitcouldexistwithoutthem.Oneoftheearliestrecordsofstructuralanalysis
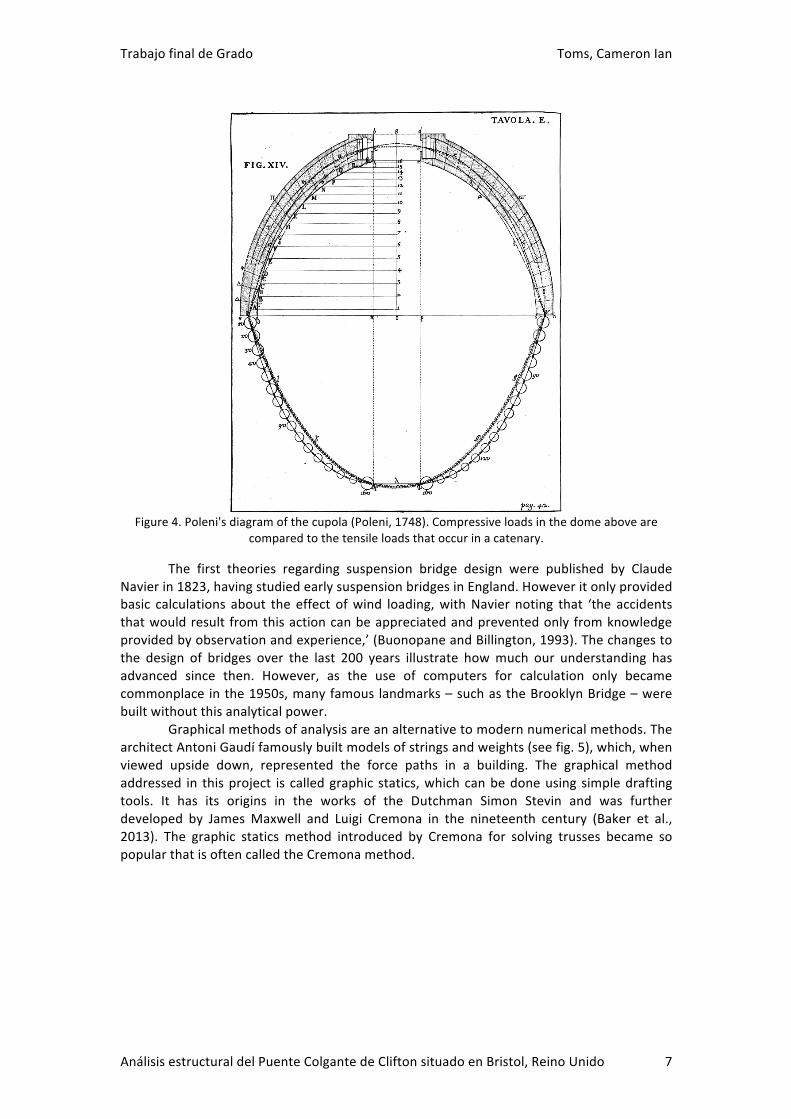
isGiovanniPoleni’sMemorie istorichedellagrancupoladel tempioVaticano,published in1748.Init,PoleniexaminesthecupolaofSt.Peter’sBasilicaintheVaticanandformulatesa
plantohaveitrepaired.
TrabajofinaldeGrado Toms,CameronIan
AnálisisestructuraldelPuenteColgantedeCliftonsituadoenBristol,ReinoUnido 7
Figure4.Poleni'sdiagramofthecupola(Poleni,1748).Compressiveloadsinthedomeaboveare
comparedtothetensileloadsthatoccurinacatenary.
The first theories regarding suspension bridge design were published by Claude
Navierin1823,havingstudiedearlysuspensionbridgesinEngland.Howeveritonlyprovided
basic calculations about the effect ofwind loading,withNavier noting that ‘the accidents
thatwouldresult fromthisactioncanbeappreciatedandpreventedonlyfromknowledge
providedbyobservationandexperience,’(BuonopaneandBillington,1993).Thechangesto
the design of bridges over the last 200 years illustrate howmuch our understanding has
advanced since then. However, as the use of computers for calculation only became
commonplace inthe1950s,manyfamous landmarks–suchastheBrooklynBridge–were
builtwithoutthisanalyticalpower.
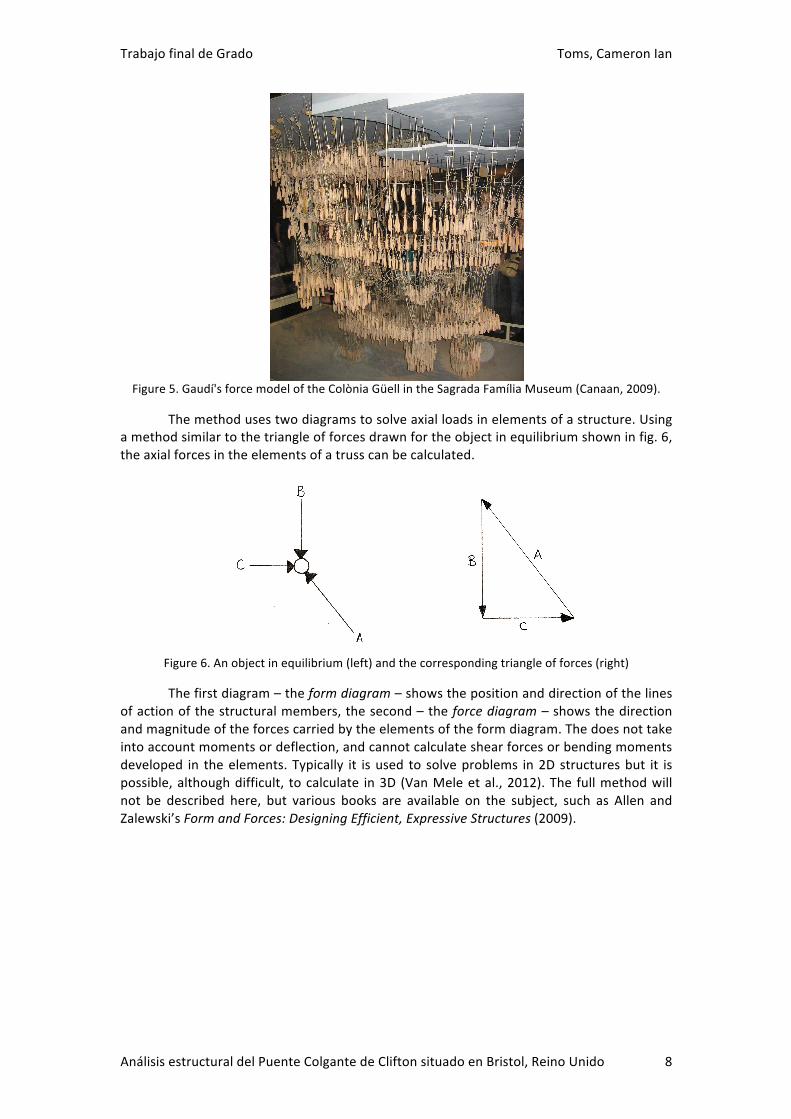
Graphicalmethodsofanalysisareanalternativetomodernnumericalmethods.The
architectAntoniGaudífamouslybuiltmodelsofstringsandweights(seefig.5),which,when
viewed upside down, represented the force paths in a building. The graphical method
addressed in thisproject is calledgraphic statics,whichcanbedoneusingsimpledrafting
tools. It has its origins in the works of the Dutchman Simon Stevin and was further
developed by JamesMaxwell and Luigi Cremona in the nineteenth century (Baker et al.,
2013). The graphic statics method introduced by Cremona for solving trusses became so
popularthatisoftencalledtheCremonamethod.
TrabajofinaldeGrado Toms,CameronIan
AnálisisestructuraldelPuenteColgantedeCliftonsituadoenBristol,ReinoUnido 8
Figure5.Gaudí'sforcemodeloftheColòniaGüellintheSagradaFamíliaMuseum(Canaan,2009).
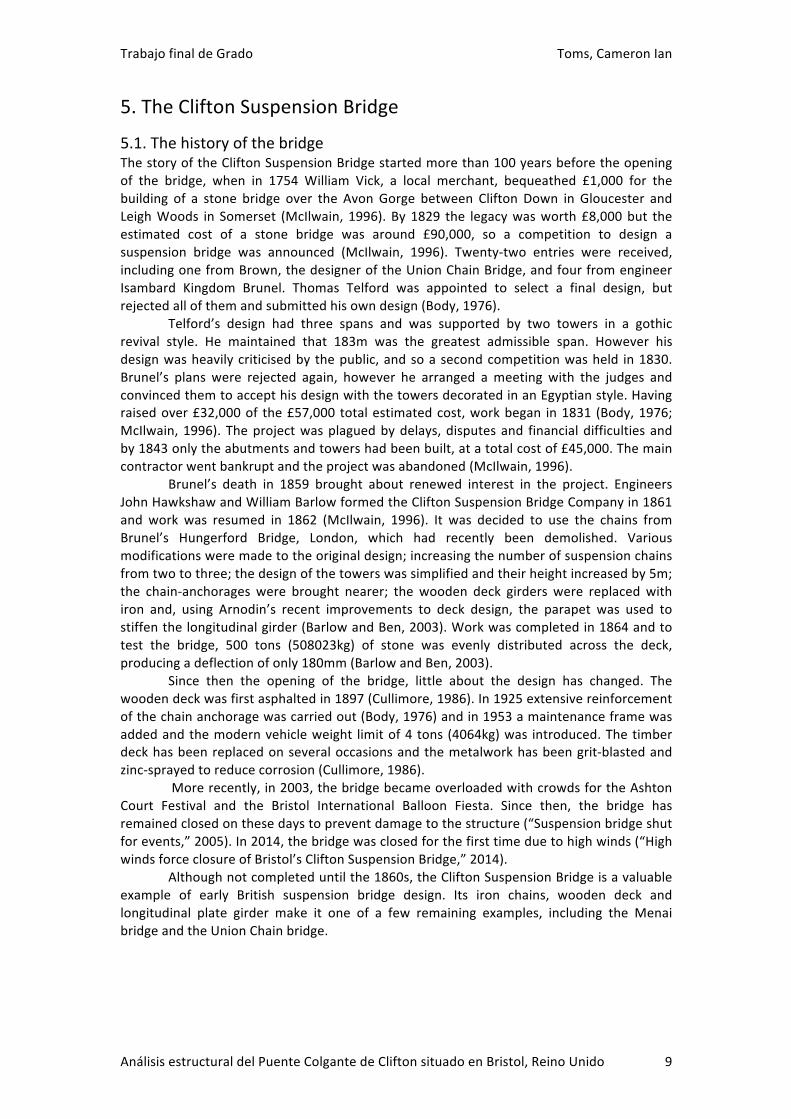
Themethodusestwodiagramstosolveaxialloadsinelementsofastructure.Using
amethodsimilartothetriangleofforcesdrawnfortheobjectinequilibriumshowninfig.6,
theaxialforcesintheelementsofatrusscanbecalculated.
Figure6.Anobjectinequilibrium(left)andthecorrespondingtriangleofforces(right)
Thefirstdiagram–theformdiagram–showsthepositionanddirectionofthelines
ofactionofthestructuralmembers,thesecond–theforcediagram–showsthedirectionandmagnitudeoftheforcescarriedbytheelementsoftheformdiagram.Thedoesnottake
intoaccountmomentsordeflection,andcannotcalculateshearforcesorbendingmoments
developed in theelements.Typically it isused to solveproblems in2Dstructuresbut it is
possible,althoughdifficult, tocalculate in3D (VanMeleetal.,2012).The fullmethodwill
not be described here, but various books are available on the subject, such as Allen and
Zalewski’sFormandForces:DesigningEfficient,ExpressiveStructures(2009).
TrabajofinaldeGrado Toms,CameronIan
AnálisisestructuraldelPuenteColgantedeCliftonsituadoenBristol,ReinoUnido 9
5.TheCliftonSuspensionBridge
5.1.ThehistoryofthebridgeThestoryoftheCliftonSuspensionBridgestartedmorethan100yearsbeforetheopening
of the bridge, when in 1754 William Vick, a local merchant, bequeathed £1,000 for the
building of a stone bridge over the Avon Gorge between Clifton Down in Gloucester and
LeighWoods in Somerset (McIlwain, 1996).By1829 the legacywasworth£8,000but the
estimated cost of a stone bridge was around £90,000, so a competition to design a
suspension bridge was announced (McIlwain, 1996). Twenty-two entries were received,
includingonefromBrown,thedesigneroftheUnionChainBridge,andfourfromengineer
Isambard Kingdom Brunel. Thomas Telford was appointed to select a final design, but
rejectedallofthemandsubmittedhisowndesign(Body,1976).
Telford’s design had three spans and was supported by two towers in a gothic
revival style. He maintained that 183m was the greatest admissible span. However his
designwasheavilycriticisedbythepublic,andsoasecondcompetitionwasheld in1830.
Brunel’s plans were rejected again, however he arranged ameeting with the judges and
convincedthemtoaccepthisdesignwiththetowersdecoratedinanEgyptianstyle.Having
raisedover£32,000of the£57,000totalestimatedcost,workbegan in1831 (Body,1976;
McIlwain,1996).Theprojectwasplaguedbydelays,disputesand financialdifficultiesand
by1843onlytheabutmentsandtowershadbeenbuilt,atatotalcostof£45,000.Themain
contractorwentbankruptandtheprojectwasabandoned(McIlwain,1996).
Brunel’s death in 1859 brought about renewed interest in the project. Engineers
JohnHawkshawandWilliamBarlowformedtheCliftonSuspensionBridgeCompanyin1861
and work was resumed in 1862 (McIlwain, 1996). It was decided to use the chains from
Brunel’s Hungerford Bridge, London, which had recently been demolished. Various
modificationsweremadetotheoriginaldesign;increasingthenumberofsuspensionchains
fromtwotothree;thedesignofthetowerswassimplifiedandtheirheightincreasedby5m;
the chain-anchorages were brought nearer; the wooden deck girders were replacedwith
iron and, using Arnodin’s recent improvements to deck design, the parapet was used to
stiffenthelongitudinalgirder(BarlowandBen,2003).Workwascompletedin1864andto
test the bridge, 500 tons (508023kg) of stone was evenly distributed across the deck,
producingadeflectionofonly180mm(BarlowandBen,2003).
Since then the opening of the bridge, little about the design has changed. The
woodendeckwasfirstasphaltedin1897(Cullimore,1986).In1925extensivereinforcement
ofthechainanchoragewascarriedout(Body,1976)andin1953amaintenanceframewas
addedandthemodernvehicleweight limitof4tons(4064kg)was introduced.Thetimber
deckhasbeenreplacedonseveraloccasionsandthemetalworkhasbeengrit-blastedand
zinc-sprayedtoreducecorrosion(Cullimore,1986).
Morerecently,in2003,thebridgebecameoverloadedwithcrowdsfortheAshton
Court Festival and the Bristol International Balloon Fiesta. Since then, the bridge has
remainedclosedonthesedaystopreventdamagetothestructure(“Suspensionbridgeshut
forevents,”2005).In2014,thebridgewasclosedforthefirsttimeduetohighwinds(“High
windsforceclosureofBristol’sCliftonSuspensionBridge,”2014).
Althoughnotcompleteduntilthe1860s,theCliftonSuspensionBridgeisavaluable
example of early British suspension bridge design. Its iron chains, wooden deck and
longitudinal plate girder make it one of a few remaining examples, including the Menai
bridgeandtheUnionChainbridge.

TrabajofinaldeGrado Toms,CameronIan
AnálisisestructuraldelPuenteColgantedeCliftonsituadoenBristol,ReinoUnido 10
5.2.Analysisofexistingdocumentationanddescriptionofbridge
The information in thispapercomes fromseveraldistinctsources;Barlow’s1867paper,ADescription of the Clifton Suspension Bridge; various plans held by the Clifton SuspensionBridge Trust and The Clifton Suspension Bridge: preservation for utilisation, by Cullimore,
1986. Brunel’s original sketches and calculations are held in the Brunel Institute, but the
modificationsmadebyBarlowandHawkshawmakethemoflittlevalueforthepurposesof
calculations.
A Description of Clifton Suspension Bridge contains the dimensions of the bridge;
diagramsofthebridgeprofileandasectionofthedeck;notesontheconstructionmethod
andcalculationsforthemaximumstressdevelopedinthechainsandhangers.Itprovidesan
almostcompletedescriptionofthebridge.Havingbeenpublishedbeforetheintroductionof
SIunitsandstandardnomenclature,allmeasurementsareinimperialunits.Morenotableis
theBarlow’sdiscrepantterminology;hewritesthat‘Thestrain….atthecentreofthechains
is597tonsapproximately,’butgoesontowrite inthenextparagraphthat ‘themaximum
strainupontheironis….4.76tonspersquareinch’.Itcanbeassumedinthiscasethat‘the
strain’referstoaxialloadandstressrespectively.However,atothertimestheinformationis
meaningless: ‘thesuspension-rodsareeach rathermore than2 inches in section.’For this
reason, information fromBarlow’spaper isonlyusedwhen it agreeswith thatofanother
source.
InTheCliftonSuspensionBridge:preservationforutilisation,Cullimoredescribesthe
results of fatigue and fracture testing in the deck and hangers as well as details of
operationalpracticeandmaintenance.
Figure7.ThesouthernsideoftheCliftonSuspensionBridgewithAvonGorgeinthebackground.The
LeighWoodstower(left)hasadifferentdesigntothatoftheCliftontower(Gothick,2009).
AccordingtothedescriptiongivenbyBarlowandBen(2003),theCliftonBridgeisa
single-span, eyebar-chain suspension bridge. It has three chains on either side of the
roadwaywhicheachchainsupportsaplategirderlongitudinallyalongthebridgebymeans
of81verticalhangers.Directlybeloweachhangerthelongitudinalgirdersareconnectedby
TrabajofinaldeGrado Toms,CameronIan
AnálisisestructuraldelPuenteColgantedeCliftonsituadoenBristol,ReinoUnido 11
transversal open lattice girders that are riveted to the lower flange of the longitudinal
girders,anddiagonalcrossbracingthatisboltedtotheundersideofthedecktimbers.The
areabetweenthetwolongitudinalgirdersisthecarriagewayandthecantileversectionsof
the transversal girders support thepedestrianwalkway and theparapet. Theparapet is a
lattice girder and works to increase the longitudinal stiffness of the deck. The chains,
hangers,girdersandparapetareallmadeofwroughtiron.Ratherthanpassingcontinuously
overthetowersaddles–asiscommoninmoremodernsuspensionbridges–thesuspension
chainsandlandchainsareattacheddirectlytoaframeoncastironrollers.
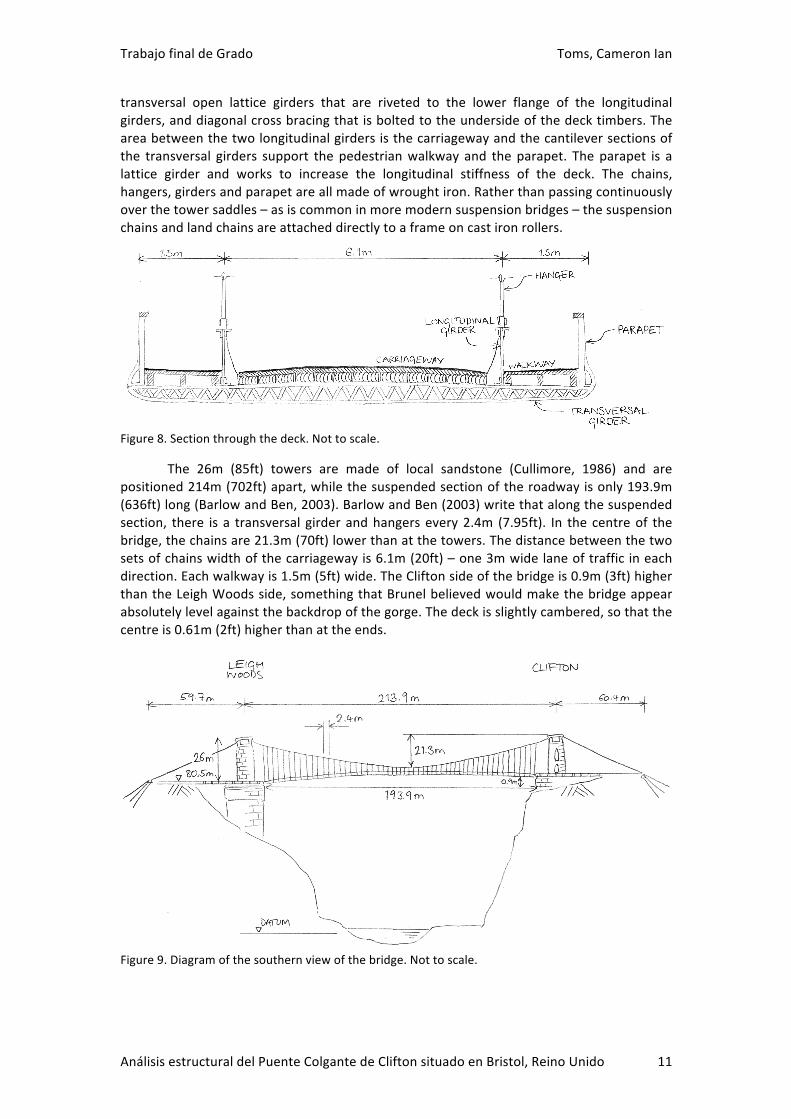
Figure8.Sectionthroughthedeck.Nottoscale.
The 26m (85ft) towers are made of local sandstone (Cullimore, 1986) and are
positioned214m(702ft)apart,whilethesuspendedsectionoftheroadwayisonly193.9m
(636ft)long(BarlowandBen,2003).BarlowandBen(2003)writethatalongthesuspended
section, there is a transversal girderandhangersevery2.4m (7.95ft). In the centreof the
bridge,thechainsare21.3m(70ft)lowerthanatthetowers.Thedistancebetweenthetwo
setsofchainswidthofthecarriagewayis6.1m(20ft)–one3mwidelaneoftrafficineach
direction.Eachwalkwayis1.5m(5ft)wide.TheCliftonsideofthebridgeis0.9m(3ft)higher
thantheLeighWoodsside,somethingthatBrunelbelievedwouldmakethebridgeappear
absolutelylevelagainstthebackdropofthegorge.Thedeckisslightlycambered,sothatthe
centreis0.61m(2ft)higherthanattheends.
Figure9.Diagramofthesouthernviewofthebridge.Nottoscale.
TrabajofinaldeGrado Toms,CameronIan
AnálisisestructuraldelPuenteColgantedeCliftonsituadoenBristol,ReinoUnido 12
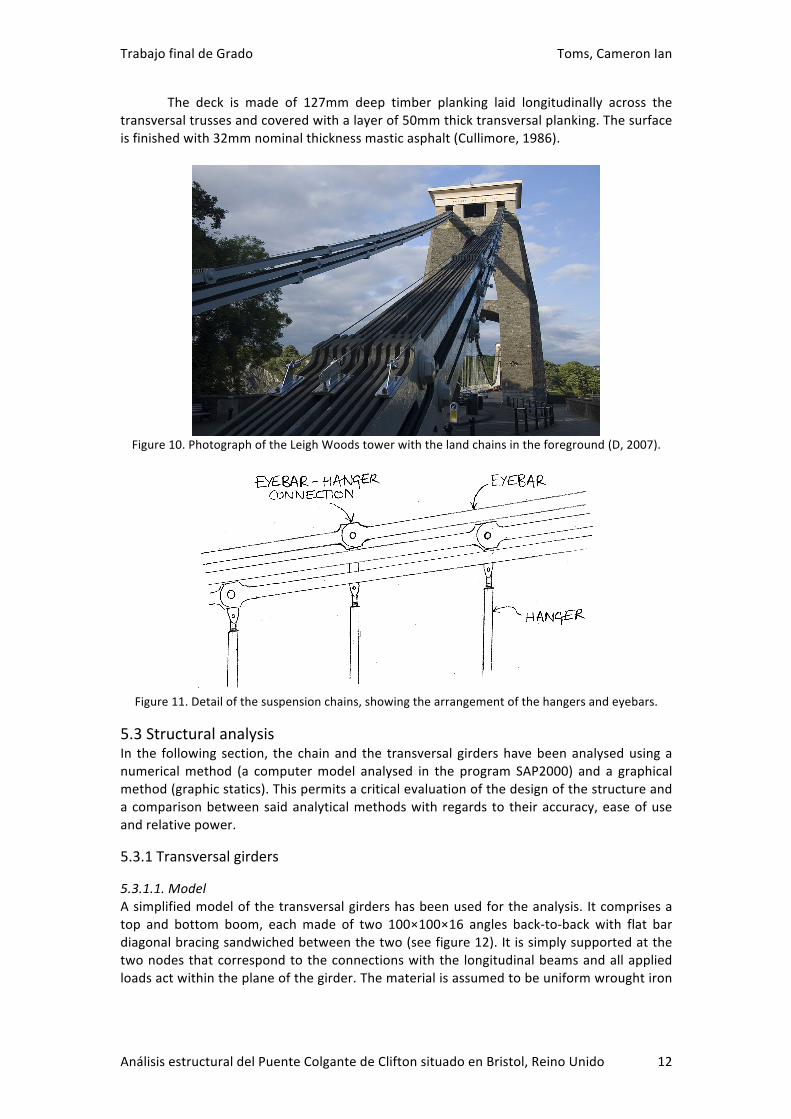
The deck is made of 127mm deep timber planking laid longitudinally across the
transversaltrussesandcoveredwithalayerof50mmthicktransversalplanking.Thesurface
isfinishedwith32mmnominalthicknessmasticasphalt(Cullimore,1986).
Figure10.PhotographoftheLeighWoodstowerwiththelandchainsintheforeground(D,2007).
Figure11.Detailofthesuspensionchains,showingthearrangementofthehangersandeyebars.
5.3StructuralanalysisIn the following section, the chainand the transversal girdershavebeenanalysedusinga
numericalmethod (a computermodel analysed in the program SAP2000) and a graphical
method(graphicstatics).Thispermitsacriticalevaluationofthedesignofthestructureand
acomparisonbetweensaidanalyticalmethodswith regards to theiraccuracy,easeofuse
andrelativepower.
5.3.1Transversalgirders
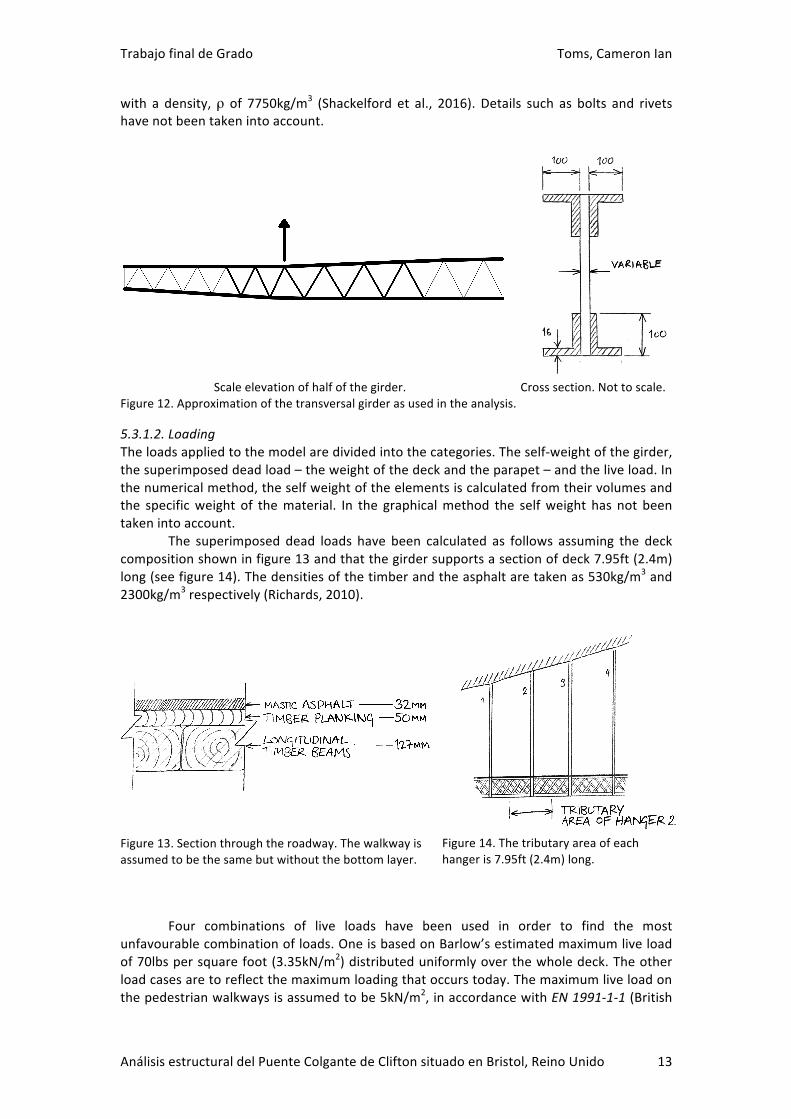
5.3.1.1.ModelAsimplifiedmodelofthetransversalgirdershasbeenusedfortheanalysis. Itcomprisesa
top and bottom boom, eachmade of two 100×100×16 angles back-to-back with flat bardiagonalbracingsandwichedbetweenthetwo(seefigure12).Itissimplysupportedatthe
twonodesthatcorrespondtotheconnectionswiththe longitudinalbeamsandallapplied
loadsactwithintheplaneofthegirder.Thematerialisassumedtobeuniformwroughtiron
TrabajofinaldeGrado Toms,CameronIan
AnálisisestructuraldelPuenteColgantedeCliftonsituadoenBristol,ReinoUnido 13
with a density,ρ of 7750kg/m3 (Shackelford et al., 2016). Details such as bolts and rivets
havenotbeentakenintoaccount.
Scaleelevationofhalfofthegirder. Crosssection.Nottoscale.
Figure12.Approximationofthetransversalgirderasusedintheanalysis.
5.3.1.2.LoadingTheloadsappliedtothemodelaredividedintothecategories.Theself-weightofthegirder,
thesuperimposeddeadload–theweightofthedeckandtheparapet–andtheliveload.In
thenumericalmethod,theselfweightoftheelementsiscalculatedfromtheirvolumesand
the specificweight of thematerial. In the graphicalmethod the selfweight has not been
takenintoaccount.
The superimposed dead loads have been calculated as follows assuming the deck
compositionshowninfigure13andthatthegirdersupportsasectionofdeck7.95ft(2.4m)
long(seefigure14).Thedensitiesofthetimberandtheasphaltaretakenas530kg/m3and
2300kg/m3respectively(Richards,2010).
Figure13.Sectionthroughtheroadway.Thewalkwayis
assumedtobethesamebutwithoutthebottomlayer.
Figure14.Thetributaryareaofeach
hangeris7.95ft(2.4m)long.
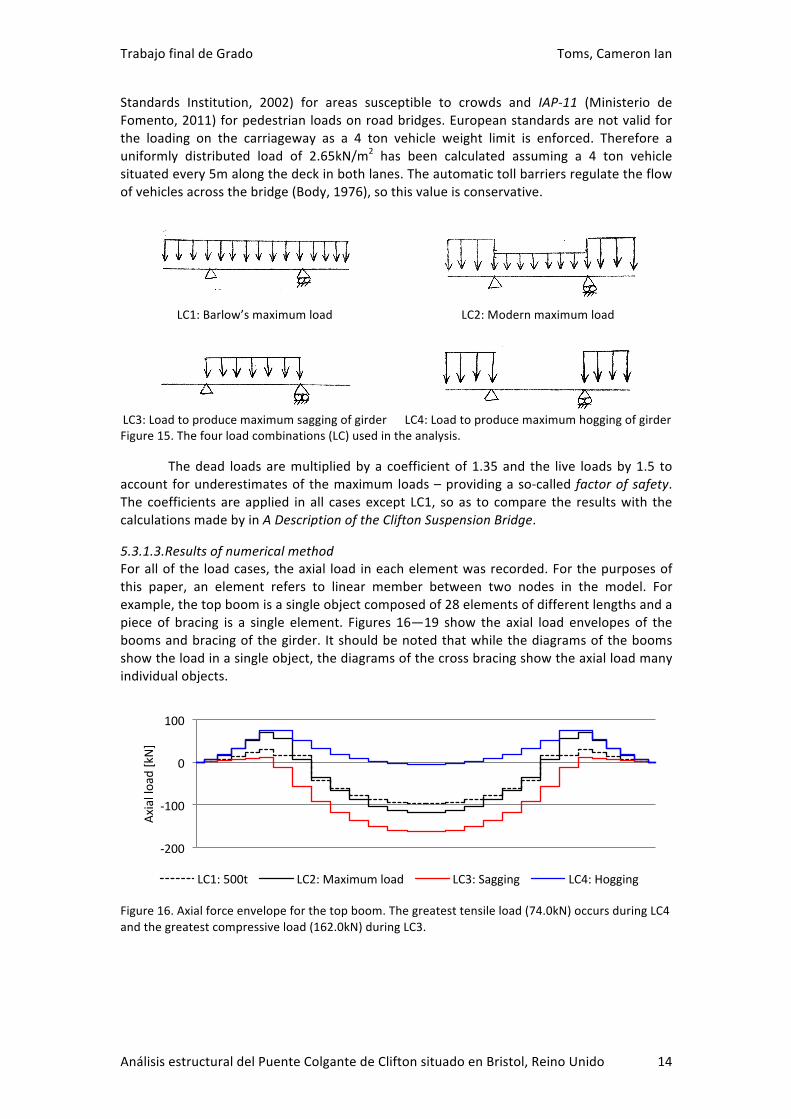
Four combinations of live loads have been used in order to find the most
unfavourablecombinationofloads.OneisbasedonBarlow’sestimatedmaximumliveload
of70lbspersquarefoot(3.35kN/m2)distributeduniformlyoverthewholedeck.Theother
loadcasesaretoreflectthemaximumloadingthatoccurstoday.Themaximumliveloadon
thepedestrianwalkwaysisassumedtobe5kN/m2,inaccordancewithEN1991-1-1(British
TrabajofinaldeGrado Toms,CameronIan
AnálisisestructuraldelPuenteColgantedeCliftonsituadoenBristol,ReinoUnido 14
Standards Institution, 2002) for areas susceptible to crowds and IAP-11 (Ministerio de
Fomento,2011)forpedestrianloadsonroadbridges.Europeanstandardsarenotvalidfor
the loading on the carriageway as a 4 ton vehicle weight limit is enforced. Therefore a
uniformly distributed load of 2.65kN/m2 has been calculated assuming a 4 ton vehicle
situatedevery5malongthedeckinbothlanes.Theautomatictollbarriersregulatetheflow
ofvehiclesacrossthebridge(Body,1976),sothisvalueisconservative.
LC1:Barlow’smaximumload LC2:Modernmaximumload
LC3:Loadtoproducemaximumsaggingofgirder LC4:Loadtoproducemaximumhoggingofgirder
Figure15.Thefourloadcombinations(LC)usedintheanalysis.
Thedead loadsaremultipliedbya coefficientof1.35and the live loadsby1.5 to
account forunderestimatesof themaximumloads–providingaso-called factorofsafety.The coefficientsareapplied inall casesexcept LC1, soas to compare the resultswith the
calculationsmadebyinADescriptionoftheCliftonSuspensionBridge.
5.3.1.3.ResultsofnumericalmethodForallofthe loadcases,theaxial load ineachelementwasrecorded.Forthepurposesof
this paper, an element refers to linear member between two nodes in the model. For
example,thetopboomisasingleobjectcomposedof28elementsofdifferentlengthsanda
piece of bracing is a single element. Figures 16—19 show the axial load envelopes of the
boomsandbracingofthegirder. Itshouldbenotedthatwhilethediagramsofthebooms
showtheloadinasingleobject,thediagramsofthecrossbracingshowtheaxialloadmany
individualobjects.
Figure16.Axialforceenvelopeforthetopboom.Thegreatesttensileload(74.0kN)occursduringLC4
andthegreatestcompressiveload(162.0kN)duringLC3.
-200
-100
0
100
Axialload[kN]
LC1:500t LC2:Maximumload LC3:Sagging LC4:Hogging
TrabajofinaldeGrado Toms,CameronIan
AnálisisestructuraldelPuenteColgantedeCliftonsituadoenBristol,ReinoUnido 15
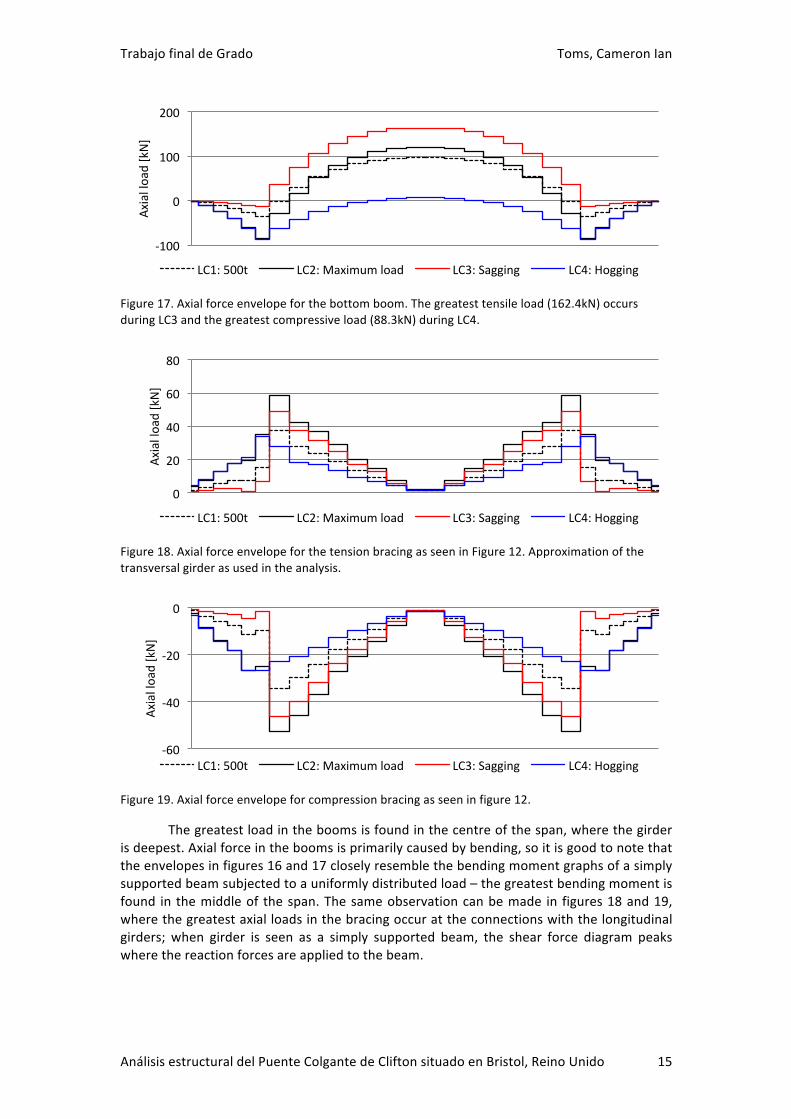
Figure17.Axialforceenvelopeforthebottomboom.Thegreatesttensileload(162.4kN)occurs
duringLC3andthegreatestcompressiveload(88.3kN)duringLC4.
Figure18.AxialforceenvelopeforthetensionbracingasseeninFigure12.Approximationofthe
transversalgirderasusedintheanalysis.
Figure19.Axialforceenvelopeforcompressionbracingasseeninfigure12.
Thegreatestloadintheboomsisfoundinthecentreofthespan,wherethegirder
isdeepest.Axialforceintheboomsisprimarilycausedbybending,soitisgoodtonotethat
theenvelopesinfigures16and17closelyresemblethebendingmomentgraphsofasimply
supportedbeamsubjectedtoauniformlydistributedload–thegreatestbendingmomentis
found in themiddleof thespan.Thesameobservationcanbemade in figures18and19,
wherethegreatestaxialloadsinthebracingoccurattheconnectionswiththelongitudinal
girders; when girder is seen as a simply supported beam, the shear force diagram peaks
wherethereactionforcesareappliedtothebeam.
-100
0
100
200
Axialload[kN]
LC1:500t LC2:Maximumload LC3:Sagging LC4:Hogging
0
20
40
60
80
Axialload[kN]
LC1:500t LC2:Maximumload LC3:Sagging LC4:Hogging
-60
-40
-20
0
Axialload[kN]
LC1:500t LC2:Maximumload LC3:Sagging LC4:Hogging
TrabajofinaldeGrado Toms,CameronIan
AnálisisestructuraldelPuenteColgantedeCliftonsituadoenBristol,ReinoUnido 16
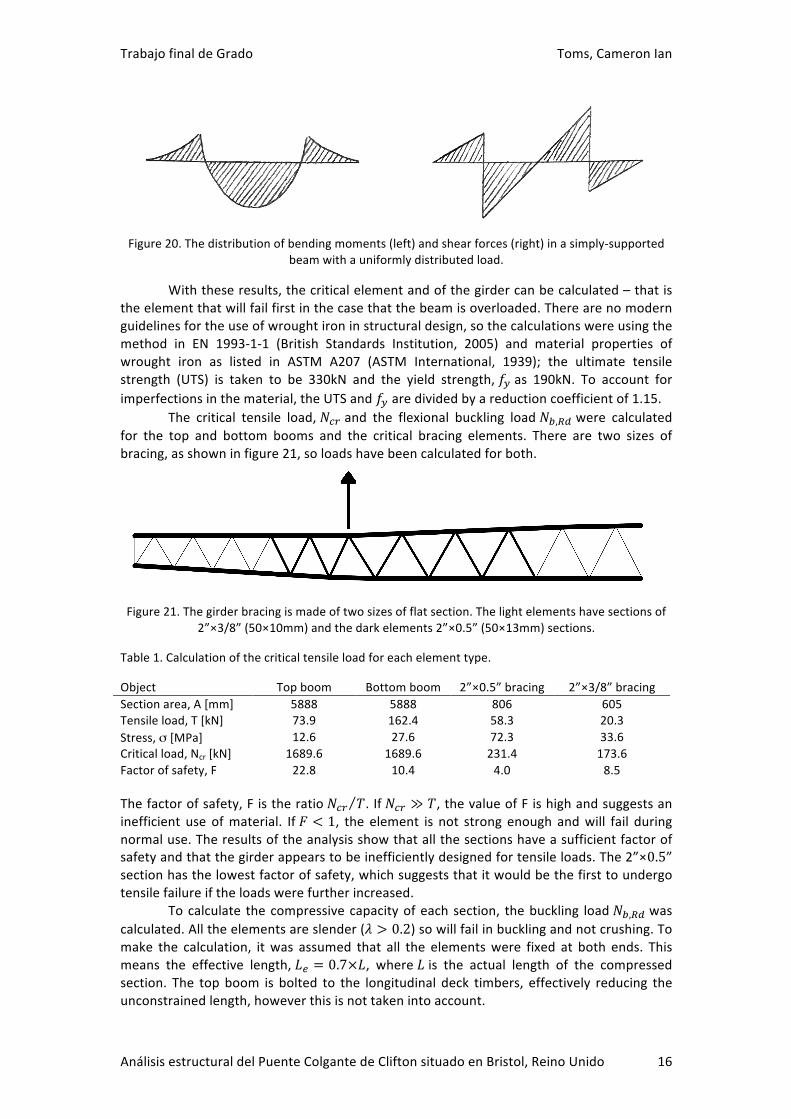
Figure20.Thedistributionofbendingmoments(left)andshearforces(right)inasimply-supported
beamwithauniformlydistributedload.
Withtheseresults,thecriticalelementandofthegirdercanbecalculated–thatis
theelementthatwillfailfirstinthecasethatthebeamisoverloaded.Therearenomodern
guidelinesfortheuseofwroughtironinstructuraldesign,sothecalculationswereusingthe
method in EN 1993-1-1 (British Standards Institution, 2005) and material properties of
wrought iron as listed in ASTM A207 (ASTM International, 1939); the ultimate tensile
strength (UTS) is taken to be 330kN and the yield strength,!!as 190kN. To account forimperfectionsinthematerial,theUTSand!!aredividedbyareductioncoefficientof1.15.
The critical tensile load,!!" and the flexional buckling load!!,!" were calculatedfor the top and bottom booms and the critical bracing elements. There are two sizes of
bracing,asshowninfigure21,soloadshavebeencalculatedforboth.
Figure21.Thegirderbracingismadeoftwosizesofflatsection.Thelightelementshavesectionsof
2”×3/8”(50×10mm)andthedarkelements2”×0.5”(50×13mm)sections.
Table1.Calculationofthecriticaltensileloadforeachelementtype.
Object Topboom Bottomboom 2”×0.5”bracing 2”×3/8”bracingSectionarea,A[mm] 5888 5888 806 605
Tensileload,T[kN] 73.9 162.4 58.3 20.3
Stress,σ[MPa] 12.6 27.6 72.3 33.6
Criticalload,Ncr[kN] 1689.6 1689.6 231.4 173.6
Factorofsafety,F 22.8 10.4 4.0 8.5
Thefactorofsafety,Fistheratio!!" !. If!!" ≫ !,thevalueofFishighandsuggestsaninefficient use ofmaterial. If! < 1, the element is not strong enough andwill fail during
normaluse.Theresultsoftheanalysisshowthatallthesectionshaveasufficientfactorof
safetyandthatthegirderappearstobeinefficientlydesignedfortensileloads.The2”×0.5”sectionhasthelowestfactorofsafety,whichsuggeststhatitwouldbethefirsttoundergo
tensilefailureiftheloadswerefurtherincreased.
Tocalculate thecompressivecapacityofeachsection, thebuckling load!!,!" wascalculated.Alltheelementsareslender(! > 0.2)sowillfailinbucklingandnotcrushing.Tomake the calculation, itwas assumed that all the elementswere fixed at both ends. This
means the effective length,!! = 0.7×!, where!is the actual length of the compressed
section. The topboom is bolted to the longitudinal deck timbers, effectively reducing the
unconstrainedlength,howeverthisisnottakenintoaccount.
TrabajofinaldeGrado Toms,CameronIan
AnálisisestructuraldelPuenteColgantedeCliftonsituadoenBristol,ReinoUnido 17
Table2.Calculationoftheflexionalbucklingloadforeachelementtype.
Object Topboom Bottomboom 2”×0.5”bracing 2”×3 8”bracingCompressiveload,C[kN]
162.0 88.2 52.5 27.2
Stress,σ[MPa]
27.5 15.0 65.1 44.9
Momentofinertia[mm4] 2834350.3 2834350.3 10839.4 4572.9
Effectivelength[mm] 4267 4267 186 206
Non-dimensional
slenderness,λ2.0 2.0 0.7 1.1
Flexionalbucklingload,
Nb,Rd[kN]233.2 233.2 116.5 59.9
Factorofsafety,F 1.4 2.6 2.2 2.2
Theresultsshowthatthesectionsaremuchmoreefficientincompressionthanintension.
The critical section is the top boom, which agrees with the findings of the test to
destruction, where failure occurred due to buckling of the top boom. However the
calculated buckling load is likely to be conservative, as Cullimore (1986) notes that
longitudinaldecktimbershaveaconsiderablestiffeningeffectonthegirder.Healsowrites
thattherewasvisiblebowingofthebracingandbottomboom,suggestingthattheyhavea
similarfactorofsafety.Thisagreeswiththeresultsofthecalculationsasseenintable2.
5.3.1.4.CalculationwithgraphicstaticsAsthegirderandtheloadcasesarebothsymmetrical,andthegraphicstaticsmethoddoes
nottakeintoaccountmomentsofanykind,itisonlynecessarytoanalysehalfthetruss,as
shown in Fig. 22. To emulate the graphic statics as it would have been done in the 19th
century,allthegraphicanalysiswasdrawnbyhandonA0paper.Thispermittedprecisionof
up to0.5kN,whenusingmeasurements inmillimetresanda scalewhere10kN isequal to
1cm. The analysiswas repeated using computer-aided design (CAD) software, so that the
errorresultingfromthehanddrawingscouldbecalculated.
Figure22.Halfof thegirdermodel,asanalysedwiththegraphicstatics.Thesectionsof thebooms
underthewalkwayareblueandthoseunderthecarriagewayarered.Thecrossbracingisingrey.
TrabajofinaldeGrado Toms,CameronIan
AnálisisestructuraldelPuenteColgantedeCliftonsituadoenBristol,ReinoUnido 18
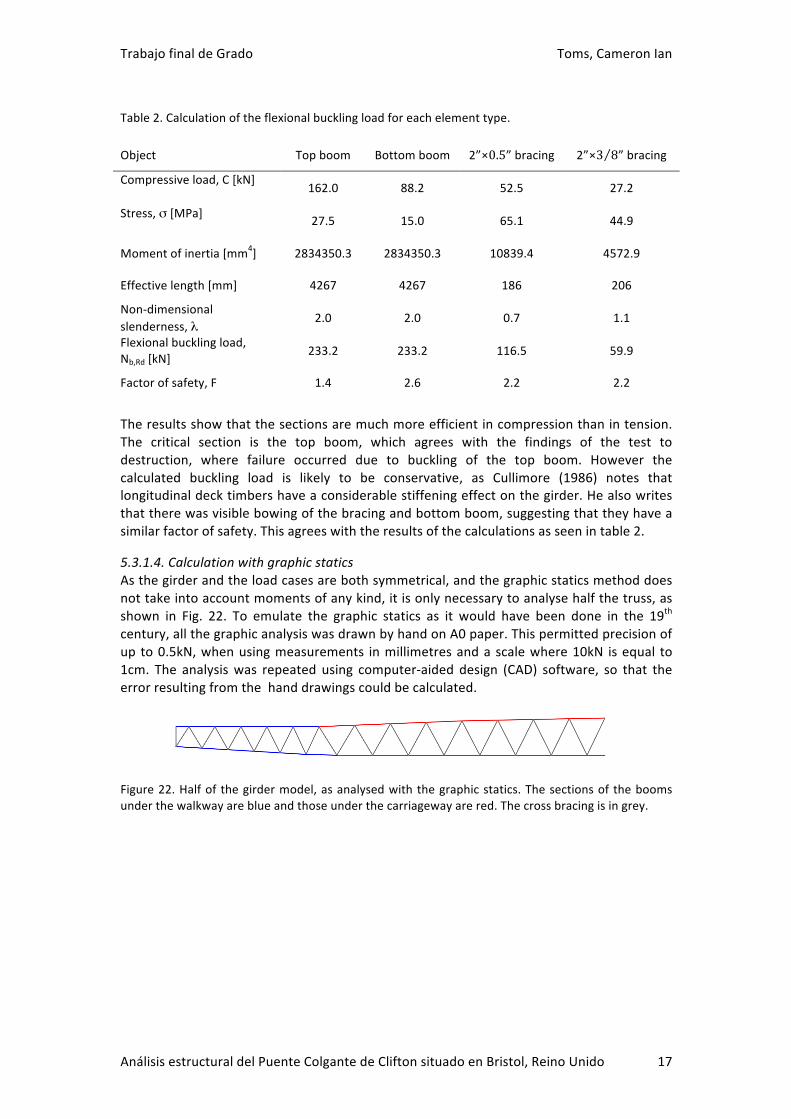
Figure23.CADforcediagramofthesaggingloadcase.Theverticalblacklinerepresentsthetotalload
uponthegirder.Theforces inthetopandbottomboomwheretheypassunderthewalkway(blue
lines)areinsignificantincomparisontowheretheypassunderthecarriageway(redlines).
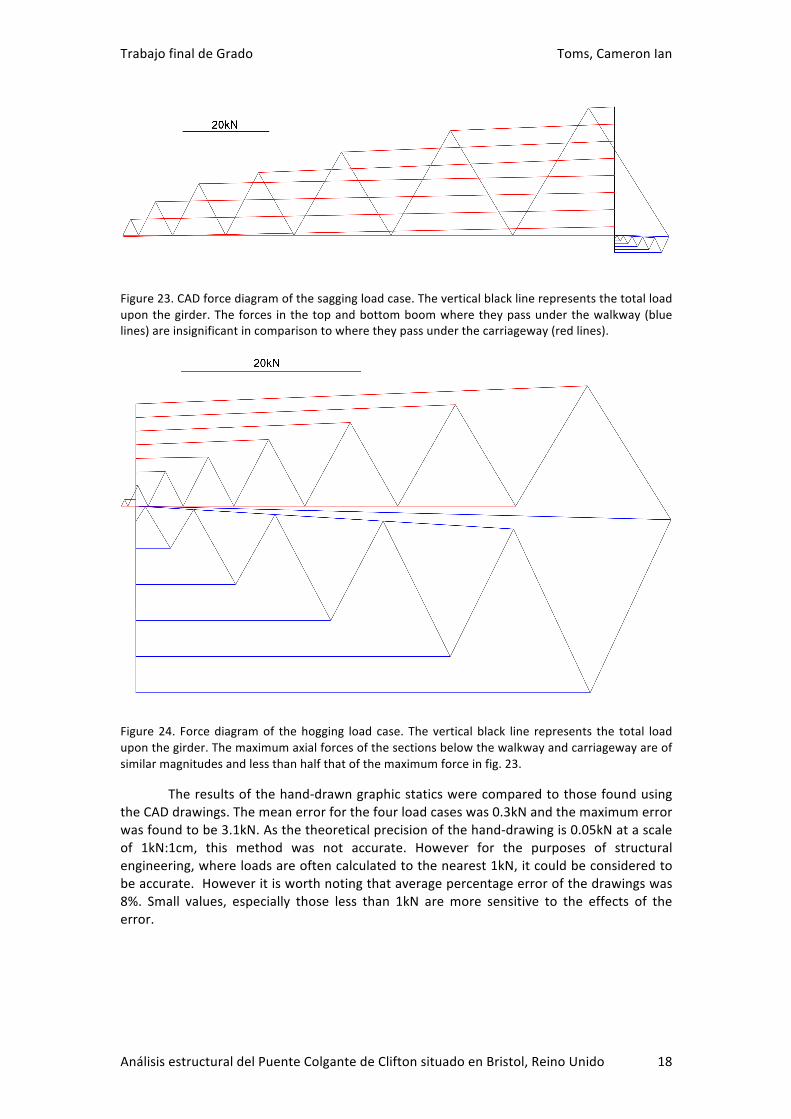
Figure24. Forcediagramof thehogging load case. Theverticalblack line represents the total load
uponthegirder.Themaximumaxialforcesofthesectionsbelowthewalkwayandcarriagewayareof
similarmagnitudesandlessthanhalfthatofthemaximumforceinfig.23.
Theresultsofthehand-drawngraphicstaticswerecomparedtothosefoundusing
theCADdrawings.Themeanerrorforthefourloadcaseswas0.3kNandthemaximumerror
wasfoundtobe3.1kN.Asthetheoreticalprecisionofthehand-drawingis0.05kNatascale
of 1kN:1cm, this method was not accurate. However for the purposes of structural
engineering,whereloadsareoftencalculatedtothenearest1kN,itcouldbeconsideredto
beaccurate.Howeveritisworthnotingthataveragepercentageerrorofthedrawingswas
8%. Small values, especially those less than 1kN aremore sensitive to the effects of the
error.
TrabajofinaldeGrado Toms,CameronIan
AnálisisestructuraldelPuenteColgantedeCliftonsituadoenBristol,ReinoUnido 19
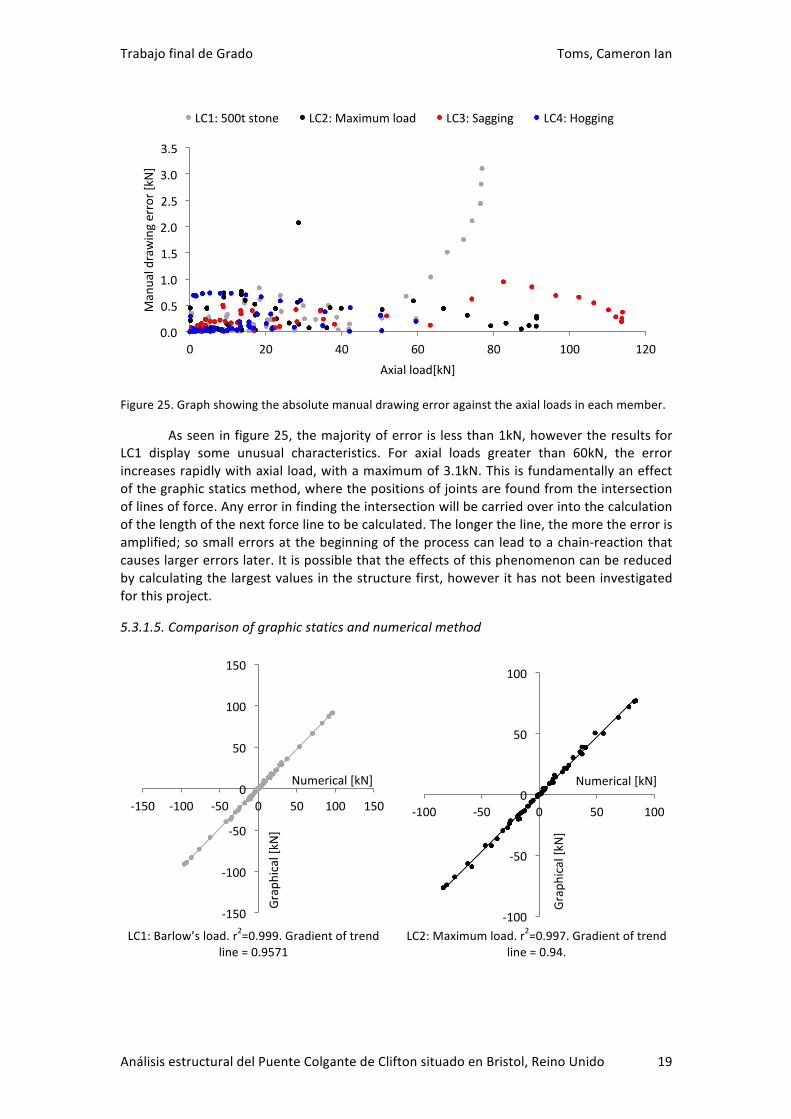
Figure25.Graphshowingtheabsolutemanualdrawingerroragainsttheaxialloadsineachmember.
Asseeninfigure25,themajorityoferror is lessthan1kN,howevertheresultsfor
LC1 display some unusual characteristics. For axial loads greater than 60kN, the error
increasesrapidlywithaxial load,withamaximumof3.1kN.Thisisfundamentallyaneffect
ofthegraphicstaticsmethod,wherethepositionsofjointsarefoundfromtheintersection
oflinesofforce.Anyerrorinfindingtheintersectionwillbecarriedoverintothecalculation
ofthelengthofthenextforcelinetobecalculated.Thelongertheline,themoretheerroris
amplified;sosmallerrorsatthebeginningoftheprocesscan leadtoachain-reactionthat
causeslargererrorslater.Itispossiblethattheeffectsofthisphenomenoncanbereduced
bycalculatingthelargestvaluesinthestructurefirst,howeverithasnotbeeninvestigated
forthisproject.
5.3.1.5.Comparisonofgraphicstaticsandnumericalmethod
LC1:Barlow’sload.r
2=0.999.Gradientoftrend
line=0.9571
LC2:Maximumload.r2=0.997.Gradientoftrend
line=0.94.
0.0
0.5
1.0
1.5
2.0
2.5
3.0
3.5
0 20 40 60 80 100 120
Manualdrawingerror[kN]
Axialload[kN]
LC1:500tstone LC2:Maximumload LC3:Sagging LC4:Hogging
-150
-100
-50
0
50
100
150
-150 -100 -50 0 50 100 150
Graphical[kN]
Numerical[kN]
-100
-50
0
50
100
-100 -50 0 50 100
Graphical[kN]
Numerical[kN]
TrabajofinaldeGrado Toms,CameronIan
AnálisisestructuraldelPuenteColgantedeCliftonsituadoenBristol,ReinoUnido 20
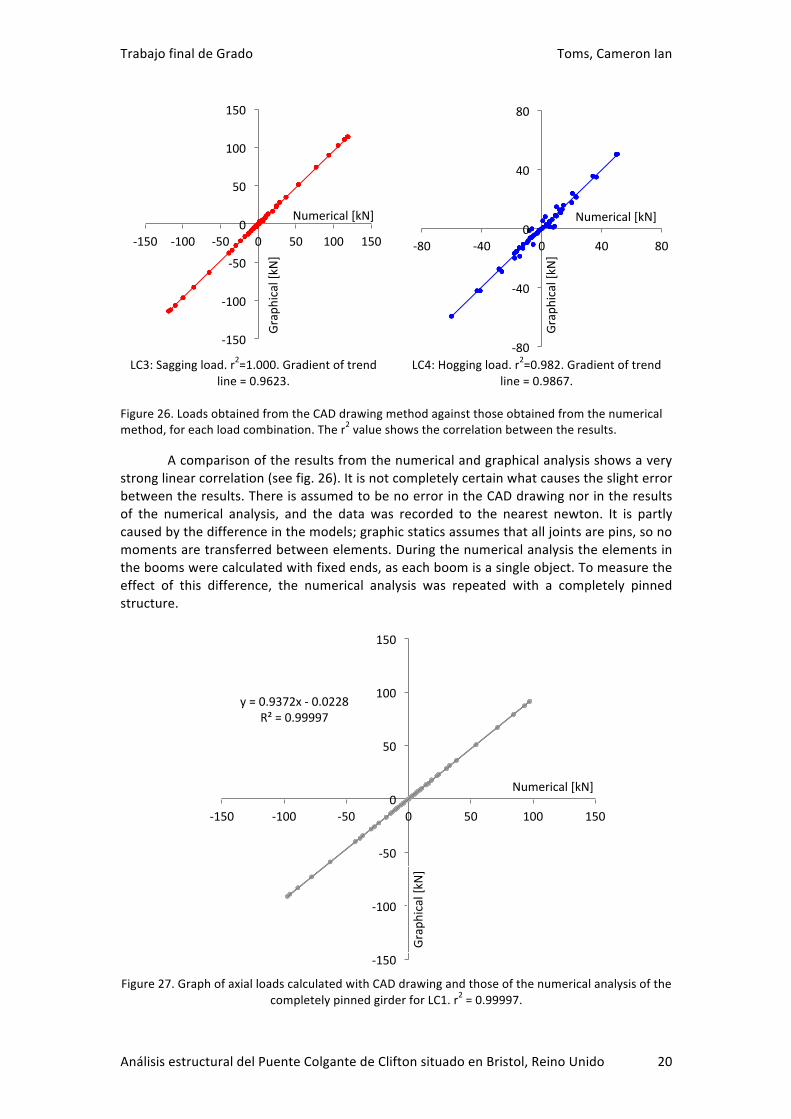
LC3:Saggingload.r
2=1.000.Gradientoftrend
line=0.9623.
LC4:Hoggingload.r2=0.982.Gradientoftrend
line=0.9867.
Figure26.LoadsobtainedfromtheCADdrawingmethodagainstthoseobtainedfromthenumerical
method,foreachloadcombination.Ther2valueshowsthecorrelationbetweentheresults.
Acomparisonoftheresultsfromthenumericalandgraphicalanalysisshowsavery
stronglinearcorrelation(seefig.26).Itisnotcompletelycertainwhatcausestheslighterror
betweentheresults.ThereisassumedtobenoerrorintheCADdrawingnorintheresults
of the numerical analysis, and the data was recorded to the nearest newton. It is partly
causedbythedifferenceinthemodels;graphicstaticsassumesthatalljointsarepins,sono
momentsaretransferredbetweenelements.Duringthenumericalanalysistheelementsin
theboomswerecalculatedwithfixedends,aseachboomisasingleobject.Tomeasurethe
effect of this difference, the numerical analysis was repeated with a completely pinned
structure.
Figure27.GraphofaxialloadscalculatedwithCADdrawingandthoseofthenumericalanalysisofthe
completelypinnedgirderforLC1.r2=0.99997.
-150
-100
-50
0
50
100
150
-150 -100 -50 0 50 100 150
Graphical[kN]
Numerical[kN]
-80
-40
0
40
80
-80 -40 0 40 80
Graphical[kN]
Numerical[kN]
y=0.9372x-0.0228
R²=0.99997
-150
-100
-50
0
50
100
150
-150 -100 -50 0 50 100 150
Graphical[kN]
Numerical[kN]

TrabajofinaldeGrado Toms,CameronIan
AnálisisestructuraldelPuenteColgantedeCliftonsituadoenBristol,ReinoUnido 21
Fig.27showsthatthereisanearlyperfect linearrelationshipbetweentheresults,
whichsuggests that thedisparitybetweenthemodels is theprimarycauseof theerror in
the results. It isunknownwhether thegeometryand typeof loadinghasaneffecton the
fixed–pinneddifference,butitisnotinvestigatedinthepaper.
Inallcases,theresultsofthegraphicalanalysisarelessthanthatofthenumerical
one.Althoughtheresultsareproportional,theyarenotequal;thetrendlinesshowthatthe
loads found using graphic statics are 94-99% of those of the numerical analysis. The
differenceisthatoftheself-weightofthegirder,whichhasnotbeentakenintoaccountin
thegraphicalanalysis.
Basedontheseobservations,thegraphicalmethodofanalysiscanbeseenasavalid
andusefulalternativetonumericalanalysis. Ithas limiteduses(beingonlyabletoanalyse
axial loads on statically determinate structures with pinned joints) and is inaccurate and
highly time consuming when done by hand. However, in this case where a high level of
precisionisnotrequired,itprovidessufficientdatatobeabletocalculatethebehaviourof
the structure. The drawings themselves may be seen as a useful way to visualise the
behaviourofthestructure,andcouldprovidestudentsofengineeringanalternativewayto
learnaboutstructuralmechanicsandanalysis. It is interestingtonotethatthesegraphical
methodswentoutofuseasmathematicalmodellingbecamemoresophisticated,atatime
whenengineerswere‘blindlytrustingofresults’(Gimsing,1984).Itshouldbeaskedwhether
graphical methods, although antiquated, help give an innate understanding of structures
thatmodernengineersnolongerhave.
5.3.2.Chains
Knowingthegeometryofandtheloadsappliedtoastructureallowstheforcesinsidetobe
solvedwithgraphicstatics,aspreviouslydescribed.Thenatureofgraphicstaticsmeansthat
thegeometryofstructurescanbeascertainediftheforceswithinthestructureareknown.
This canbeused to calculate the shapeofahanging cable,or– in thecaseof theClifton
bridge–theoptimalshapeofthesuspensionchain.Theoptimalshapeofacableisthatin
which the loads in the cableareminimised. In caseswhere the self-weightof the cable is
insignificant, that shape is a parabola. Although the chains of the suspension bridge are
madeofdiscretelinksandhavesignificantself-weight–approximately1/3 ofthetotalload(BarlowandBen,2003)–theshapecanstillbeapproximatedtoaparaboliccurve.
Figure28.Theshapeofthechainifitweretohangbetweentowersofequalheightsisaparabola
(left).Thesameshapeadjustedbyincreasingthelevelslinearlyalongitslength–nolongeraparabola
(right).Nottoscale.
ThecalculationoftheshapeoftheCliftonbridgeiscomplicatedbythefactthatthe
LeighWoodstoweris3ft(0.9m)lowerthantheCliftontower,givingthebridgeanaverage

TrabajofinaldeGrado Toms,CameronIan
AnálisisestructuraldelPuenteColgantedeCliftonsituadoenBristol,ReinoUnido 22
gradientof1:233(BarlowandBen,2003).ItappearsthattheshapeoftheCliftonchainswas
calculatedbytakingtheshapeofaparabolawith levelendsandthenincreasingthelevels
linearlyalongthelengthofthechain,asillustratedinfig.28.McIlwain(1996)writesthatthe
designwas‘closetotheideal’,suggestingthatthismethodisnotaccuratebutmakesagood
approximation to the optimal shape. Using graphic statics and the structural analysis
programSAP2000,itwaspossibletoanalysetheshapeofthechain.
BarlowandBen(2003)calculatethemaximumload inthechainstobe2094tons-
force (21,276kN), approximately 10,638kN in each set of chains. Using the detailed
information provided by Cullimore (1986), it is possible tomake our own estimate to the
maximumloadinthechainsbetweenthetowers.
Table3.Weightsandloadsforhalfofthedeck,tocalculatetheloadinonesetofchains.Thechain
weight is that of a parabolic shape chain. Other ironwork refers to longitudinal and transversal
girders,hangersandparapet.
Load Estimatedvalue
Self-weightof1setofchains 2761kN
Self-weightofotherironwork 903kN
Super-imposeddeadload 1290kN
Liveload(LC1:70lbs/sq.inch) 3070kN
Total 8024kN
Themaximumaxial load of a uniformly loaded light cable,!!"# can be calculatedusingequation1,where!istheuniformlydistributedload,!isthelengthofthechordandℎtheheightofthecurve.
!!"# =!!!!4 + !!!
8ℎ! (1)
The calculated!!"#is 11,100kN,which is approximately4%greater thanBarlow’s
estimatedmaximum.Thisissufficientlyaccuratetobeusedinthecalculationsoftheshape
ofthechain.
Figure 29. Force diagram of one set of chains (supporting half the deck)with uniform live loading
acrossthedeck.
TrabajofinaldeGrado Toms,CameronIan
AnálisisestructuraldelPuenteColgantedeCliftonsituadoenBristol,ReinoUnido 23
Having verified the Barlow and Ben’s figures, the force diagram in fig. 29 was
created. The lengthof the vertical line represents the totalmagnitudeof the loadon the
chains;eachsmallverticalline,theloadtransferredtothechainsbyonehanger.Eachofthe
convergentlinesistheloadinonesectionofthechains.Theaveragegradientoftheselines
is1:233.Thismeansthatthediagramisnotsymmetricalandthebottomlineislongerthan
thetop.Itrepresentstheforceinthesectionofthechainwiththegreatestload11,100kN.
Knowingthisvalue,itispossibletocreatetheentireforcediagram.
Theshapeofthechaincannowbecalculated,asthegradientofeachchainsection
isknown.
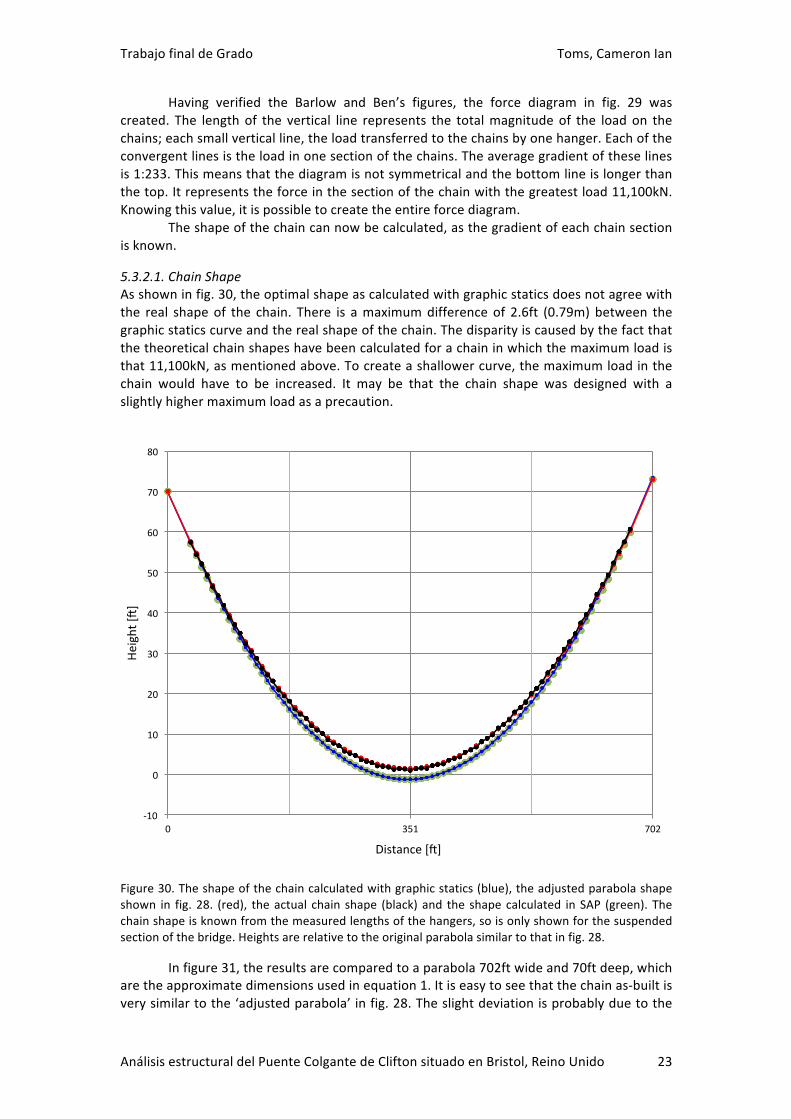
5.3.2.1.ChainShapeAsshowninfig.30,theoptimalshapeascalculatedwithgraphicstaticsdoesnotagreewith
the real shapeof the chain. There is amaximumdifferenceof 2.6ft (0.79m)between the
graphicstaticscurveandtherealshapeofthechain.Thedisparityiscausedbythefactthat
thetheoreticalchainshapeshavebeencalculatedforachaininwhichthemaximumloadis
that11,100kN,asmentionedabove.Tocreateashallowercurve,themaximumloadinthe
chain would have to be increased. It may be that the chain shape was designed with a
slightlyhighermaximumloadasaprecaution.
Figure30.Theshapeofthechaincalculatedwithgraphicstatics(blue),theadjustedparabolashape
shown in fig.28. (red), theactual chain shape (black)and the shapecalculated inSAP (green). The
chainshapeisknownfromthemeasuredlengthsofthehangers,soisonlyshownforthesuspended
sectionofthebridge.Heightsarerelativetotheoriginalparabolasimilartothatinfig.28.
Infigure31,theresultsarecomparedtoaparabola702ftwideand70ftdeep,which
aretheapproximatedimensionsusedinequation1.Itiseasytoseethatthechainas-builtis
verysimilartothe‘adjustedparabola’infig.28.Theslightdeviationisprobablyduetothe
-10
0
10
20
30
40
50
60
70
80
0 351 702
Height[y]
Distance[y]
TrabajofinaldeGrado Toms,CameronIan
AnálisisestructuraldelPuenteColgantedeCliftonsituadoenBristol,ReinoUnido 24
wearingof theeyebarsanddeflectionof thechains.Themethodsusedherearebasedon
first-order static theories and do not calculate the deflected shape as in second-order
theories.Thereisconsiderableerrorinthehand-drawngraphicstaticmethod–itincreases
towardsthecentreofthespantheuntilitis0.9ft(0.27m).Howeveritthendecreasesagain
ontheotherside,sothatthemagnitudeoftheerrorissymmetricalacrossthecentreofthe
span.Thissuggeststhatthecauseisnotrandommeasuringerror,butanerrorintheforce
diagram. The curves of the CAD graphic statics and the cable produced by the numerical
methodareverysimilar,whichsuggeststhatthemethodshavebeencarriedoutcorrectly.
TheeffectoftheUDLincomparisontotheloadscalculatedinthegraphicstaticsissmall,the
chainshapeundertheUDLisslightlyshallower,howeverbyonly0.2ft(6cm).
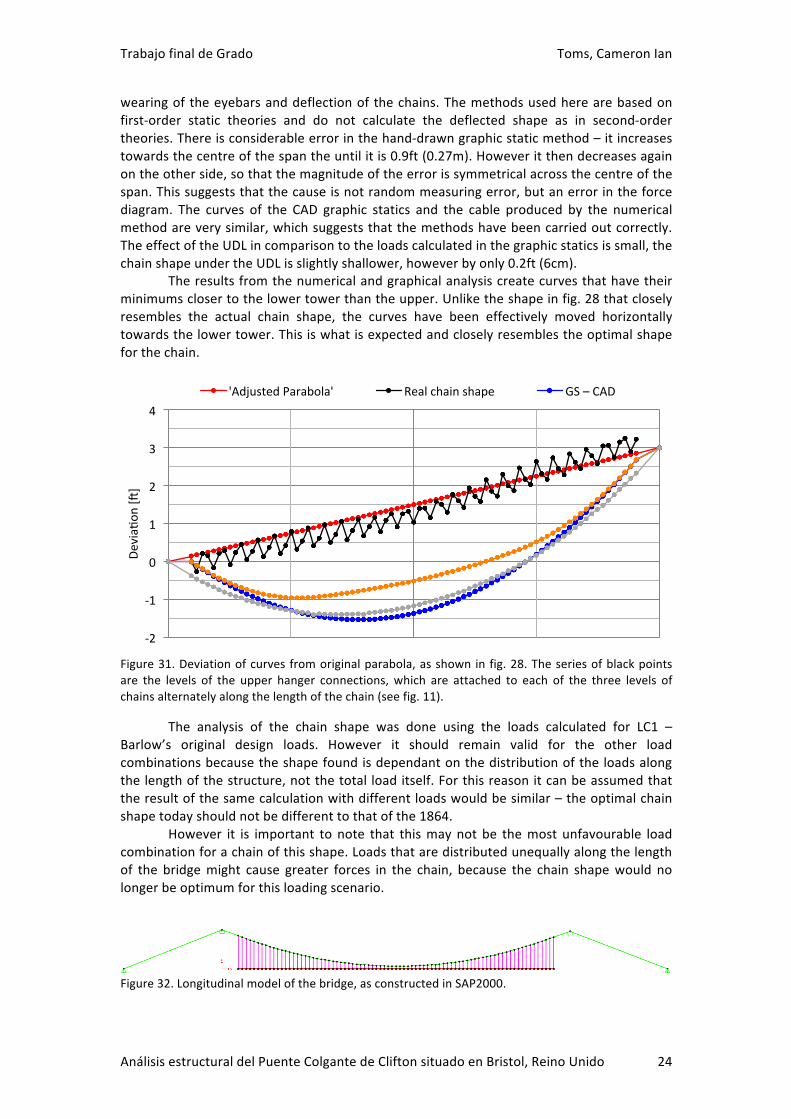
Theresultsfromthenumericalandgraphicalanalysiscreatecurvesthathavetheir
minimumsclosertothelowertowerthantheupper.Unliketheshapeinfig.28thatclosely
resembles the actual chain shape, the curves have been effectively moved horizontally
towardsthelowertower.Thisiswhatisexpectedandcloselyresemblestheoptimalshape
forthechain.
Figure31.Deviationofcurvesfromoriginalparabola,asshowninfig.28.Theseriesofblackpoints
are the levels of the upper hanger connections,which are attached to each of the three levels of
chainsalternatelyalongthelengthofthechain(seefig.11).
The analysis of the chain shape was done using the loads calculated for LC1 –
Barlow’s original design loads. However it should remain valid for the other load
combinationsbecausetheshapefoundisdependantonthedistributionoftheloadsalong
thelengthofthestructure,notthetotal loaditself.Forthisreasonitcanbeassumedthat
theresultofthesamecalculationwithdifferentloadswouldbesimilar–theoptimalchain
shapetodayshouldnotbedifferenttothatofthe1864.
However it is important to note that thismaynot be themost unfavourable load
combinationforachainofthisshape.Loadsthataredistributedunequallyalongthelength
of the bridgemight cause greater forces in the chain, because the chain shapewould no
longerbeoptimumforthisloadingscenario.
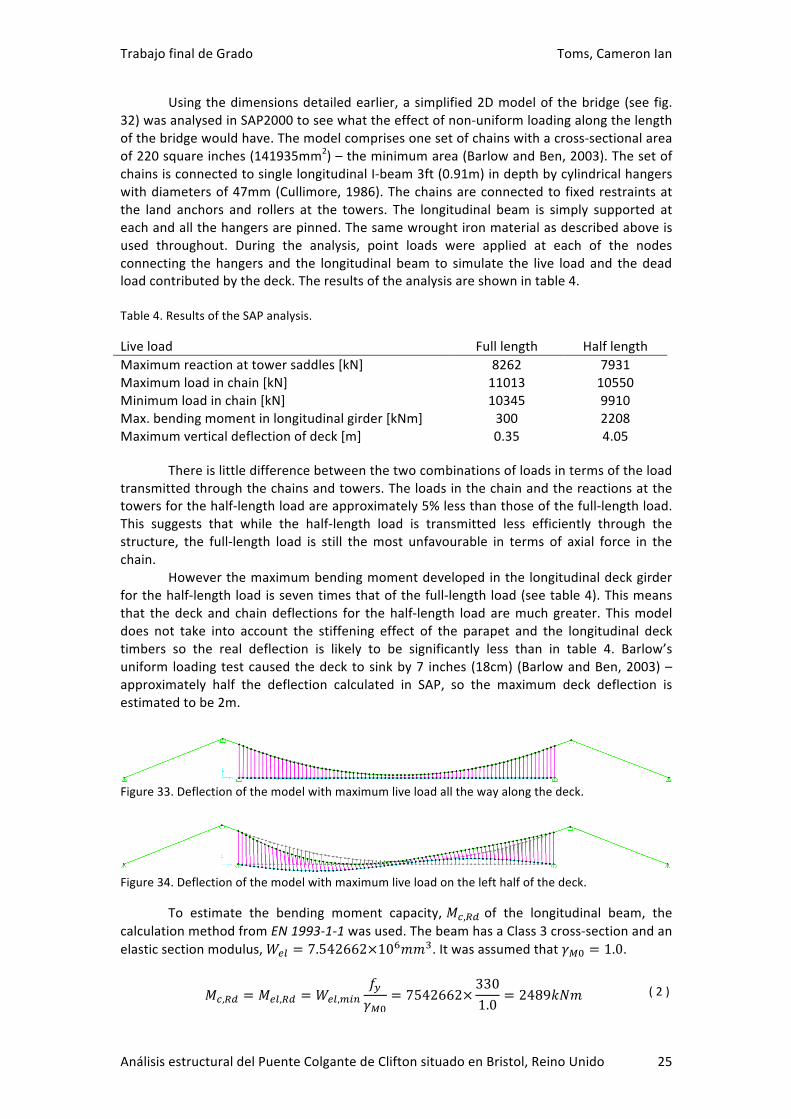
Figure32.Longitudinalmodelofthebridge,asconstructedinSAP2000.
-2
-1
0
1
2
3
4
Deviazon[y]
'AdjustedParabola' Realchainshape GS–CAD
TrabajofinaldeGrado Toms,CameronIan
AnálisisestructuraldelPuenteColgantedeCliftonsituadoenBristol,ReinoUnido 25
Usingthedimensionsdetailedearlier,asimplified2Dmodelof thebridge (seefig.
32)wasanalysedinSAP2000toseewhattheeffectofnon-uniformloadingalongthelength
ofthebridgewouldhave.Themodelcomprisesonesetofchainswithacross-sectionalarea
of220squareinches(141935mm2)–theminimumarea(BarlowandBen,2003).Thesetof
chainsisconnectedtosinglelongitudinalI-beam3ft(0.91m)indepthbycylindricalhangers
withdiametersof47mm(Cullimore,1986).Thechainsareconnectedtofixedrestraintsat
the land anchors and rollers at the towers. The longitudinal beam is simply supported at
eachandallthehangersarepinned.Thesamewroughtironmaterialasdescribedaboveis
used throughout. During the analysis, point loads were applied at each of the nodes
connecting thehangers and the longitudinal beam to simulate the live load and thedead
loadcontributedbythedeck.Theresultsoftheanalysisareshownintable4.
Table4.ResultsoftheSAPanalysis.
Liveload Fulllength Halflength
Maximumreactionattowersaddles[kN] 8262 7931
Maximumloadinchain[kN] 11013 10550
Minimumloadinchain[kN] 10345 9910
Max.bendingmomentinlongitudinalgirder[kNm] 300 2208
Maximumverticaldeflectionofdeck[m] 0.35 4.05
Thereislittledifferencebetweenthetwocombinationsofloadsintermsoftheload
transmittedthroughthechainsandtowers.Theloadsinthechainandthereactionsatthe
towersforthehalf-lengthloadareapproximately5%lessthanthoseofthefull-lengthload.
This suggests that while the half-length load is transmitted less efficiently through the
structure, the full-length load is still themost unfavourable in terms of axial force in the
chain.
Howeverthemaximumbendingmomentdevelopedinthelongitudinaldeckgirder
forthehalf-lengthloadisseventimesthatofthefull-lengthload(seetable4).Thismeans
that thedeck and chaindeflections for thehalf-length load aremuch greater. Thismodel
does not take into account the stiffening effect of the parapet and the longitudinal deck
timbers so the real deflection is likely to be significantly less than in table 4. Barlow’s
uniform loadingtestcausedthedecktosinkby7 inches (18cm) (BarlowandBen,2003)–
approximately half the deflection calculated in SAP, so the maximum deck deflection is
estimatedtobe2m.
Figure33.Deflectionofthemodelwithmaximumliveloadallthewayalongthedeck.
Figure34.Deflectionofthemodelwithmaximumliveloadonthelefthalfofthedeck.
To estimate the bending moment capacity,!!,!" of the longitudinal beam, the
calculationmethodfromEN1993-1-1wasused.ThebeamhasaClass3cross-sectionandan
elasticsectionmodulus,!!" = 7.542662×10!!!!.Itwasassumedthat!!! = 1.0.
!!,!" = !!",!" = !!",!"#
!!!!!
= 7542662× 3301.0 = 2489!"# (2)
TrabajofinaldeGrado Toms,CameronIan
AnálisisestructuraldelPuenteColgantedeCliftonsituadoenBristol,ReinoUnido 26
Althoughthebendingcapacitycalculatedinequation2ishigherthanthemaximum
bendingmoment in themodel (see table 4), wrought iron ismore brittle than structural
steel. It is likely that the longitudinal beam would fail before this moment was reached.
Brunel’soriginaldesign,without thestiffeningeffectof theparapet,wouldnothavebeen
strongenoughtosupporttheBarlow’sdesignload.Theadditionofthestiffeningparapetis
keytothestrengthofthebridge.
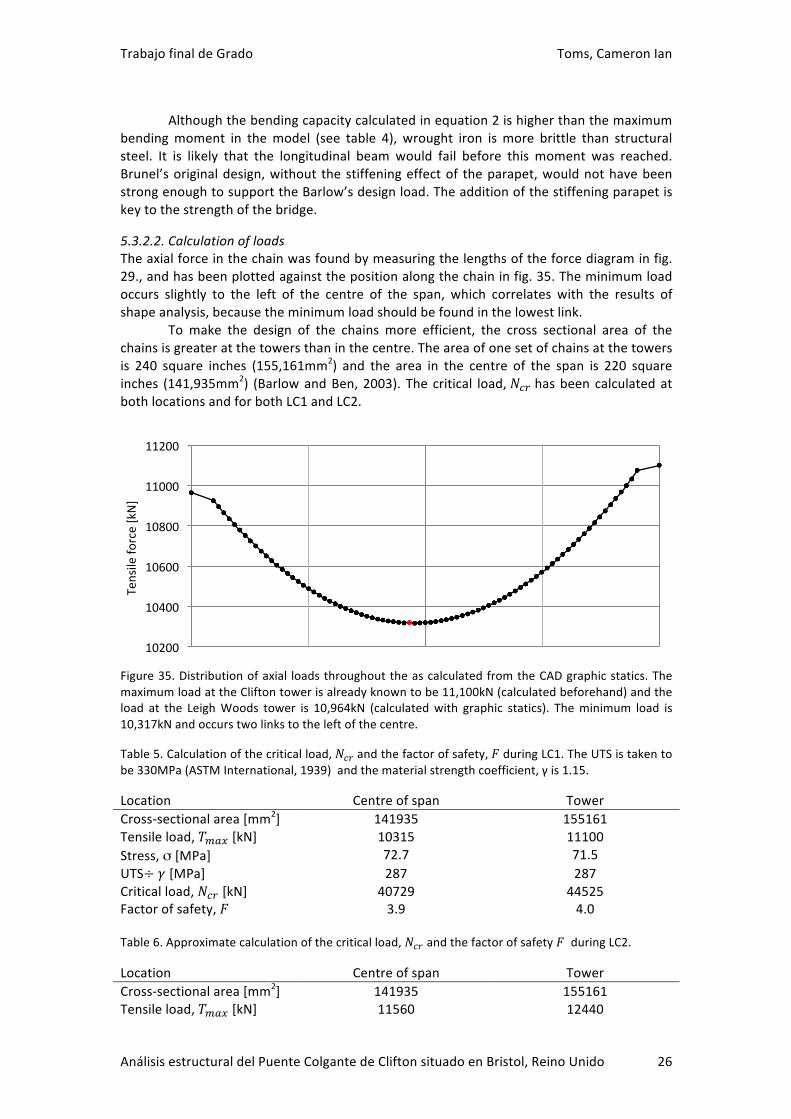
5.3.2.2.CalculationofloadsTheaxialforceinthechainwasfoundbymeasuringthelengthsoftheforcediagraminfig.
29.,andhasbeenplottedagainstthepositionalongthechaininfig.35.Theminimumload
occurs slightly to the left of the centre of the span, which correlates with the results of
shapeanalysis,becausetheminimumloadshouldbefoundinthelowestlink.
To make the design of the chains more efficient, the cross sectional area of the
chainsisgreateratthetowersthaninthecentre.Theareaofonesetofchainsatthetowers
is 240 square inches (155,161mm2) and the area in the centre of the span is 220 square
inches (141,935mm2) (BarlowandBen,2003). The critical load,!!" hasbeencalculatedat
bothlocationsandforbothLC1andLC2.
Figure35.Distributionofaxial loadsthroughouttheascalculatedfromtheCADgraphicstatics.The
maximumloadattheCliftontowerisalreadyknowntobe11,100kN(calculatedbeforehand)andthe
load at the LeighWoods tower is 10,964kN (calculatedwith graphic statics). Theminimum load is
10,317kNandoccurstwolinkstotheleftofthecentre.
Table5.Calculationofthecriticalload,!!"andthefactorofsafety,!duringLC1.TheUTSistakentobe330MPa(ASTMInternational,1939)andthematerialstrengthcoefficient,γis1.15.
Location Centreofspan Tower
Cross-sectionalarea[mm2] 141935 155161
Tensileload,!!"#[kN] 10315 11100
Stress,σ[MPa] 72.7 71.5
UTS÷ ![MPa] 287 287
Criticalload,!!" [kN] 40729 44525
Factorofsafety,! 3.9 4.0
Table6.Approximatecalculationofthecriticalload,!!"andthefactorofsafety!duringLC2.
Location Centreofspan Tower
Cross-sectionalarea[mm2] 141935 155161
Tensileload,!!"#[kN] 11560 12440
10200
10400
10600
10800
11000
11200
Tensileforce[kN]
TrabajofinaldeGrado Toms,CameronIan
AnálisisestructuraldelPuenteColgantedeCliftonsituadoenBristol,ReinoUnido 27
Stress,σ[MPa] 81.4 80.2
UTS÷ ![MPa] 287 287
Criticalload,!!" [kN] 40729 44525
Factorofsafety,! 3.5 3.6
ThedesignfactorofsafetyforLC1couldbeseenasexcessive,howeveritshouldbe
takenintoaccountthateyebarchainsarelikelytofailattheconnections.Thevaluesshown
representthestrengthoftheeyebaritself,andnotthestrengthoftheconnectionsbetween
them.TheWheelingBridgecollapsewasduetoonebrokenconnection(Gimsing,1984),and
Cullimore(1986)notesthat thegreatestsignsofwear in thebridgeareat theeyebarand
hanger connection holes. These points act as stress concentrators and can cause the
elementtofailatalowerloadexpected.Thisisarguablyoneofthemainreasonsthatchains
havebeenreplacedbycablesinallsuspensionbridgedesignssincethe19thcentury.Theuse
ofmany threads,means that they have amuch higher level of redundancy– a cable can
continuetofunctionwellevenifafewofthethreadshavebroken.Itislikelythattheactual
maximum load of the chains is significantly lower than the values calculated, which goes
someway to explaining the high values of!. Body (1976)writes that all the chains havebeentestedwithtwicethedesignload,sothelowerboundfor!is2.
5.3.3.Othercalculations
5.3.3.1.Cross-bracingThe cross-bracing under the deck provides stiffness against horizontal wind loading.
AlthoughBarlowandBen (2003)notes that thedeck canmove ‘up to6” [15cm] inheavy
wind’,littlewasdonetocalculateitseffects.Thecross-bracinghasnotbeenanalysedinthis
paperforthefollowingreasons:
1. Nodocumentationhasbeensourcedtocompareresultsofcalculations.
2. Itisunknownwhateffectsthetopographyofthegorgewouldhaveonthewind,so
calculationsarelikelytobeinaccurate.
3. Theactionofwindloadingonsuspensionbridgesisrelatedtotheresonanceand
aerodynamicpropertiesofthebridge,thecalculationofwhichisoutsidethescope
ofthemethodsofanalysisemployedinthispaper.
Howeverwindloadingremainsanimportantfactorinbridgeengineeringandinthe
caseoftheCliftonSuspensionBridge;forthefirsttimeinlivingmemoryin2014thebridge
wasclosedtotrafficduringhighwinds.Thereforetheanalysisofwindloadingonthebridge
wouldbeaninterestingextensiontothisproject.
3.3.3.2.HangersThehighestaxial loadwilloccur inthesecond longesthangers,as the longesthangersare
attached to the end of the suspended section and so have half the tributary area of the
others (see fig. 14). Although the highest loads occur in these hangers, the difference is
causedbythehangers’self-weightandisinsignificant.Thereforeallthehangerswillhavea
similarvalueforF(seetable7).
Table7.Calculationofthecriticalload,NcrandthefactorofsafetyFofthehanger.
Estimatedvalue
Cross-sectionalarea[mm2] 1735
Tensileload,!!"#[kN] 86.6
Stress,!!"#[MPa] 49.9
UTS÷ ![MPa] 287
Criticalload,!!" [kN] 497
TrabajofinaldeGrado Toms,CameronIan
AnálisisestructuraldelPuenteColgantedeCliftonsituadoenBristol,ReinoUnido 28
Factorofsafety,F 5.8
Thecalculatedcriticalloadisalmost6timesgreaterthan!!"#,whichsuggeststhatthehangersare inefficientlydesigned.Howeverthecalculationdoesnottake intoaccount
theconnectionsateitherend.Likeinthechains,thesearelikelytobethecauseoffailure.
Several hangers have broken, the most recently in 2009 (“Suspension bridge closed by
fault”,2009)andCullimore(1986)notesthatmanyshowsignsofwearattheconnections.It
is likely that the hangers will fail at the bolt-holes or welds, so in this case!!" is notrepresentativeofthefailureload.
5.3.3.3.TowersAccordingtoplansavailableonthewebsiteof theCliftonSuspensionBridge ("YourBridge
Projects|TheCliftonSuspensionBridge"),themasonrytowersarefacedwithlocalPennant
sandstone and the cavities are filled with loose rubble. Richards says that the towers
themselveswerenotsubjecttomuchformalanalysis,butifitisassumedthatrubbleisnot
load-bearingandtheloadbearingwall is0.3mthick,themaximumstressdevelopedinthe
base is insignificant (see table 8), considering sandstone typically has a high compressive
strength–Pennantstonehasacompressivecapacityof168MPa(Bell,2013).
Table8.Calculationofthemaximumstressdevelopedinthetower.Theloadatthebaseofthetower
isthesumoftheloadatthetowersaddleandtheself-weightofthetower.Theload-bearingpartof
thetowerisassumedtohaveadensityof2.5kg/m3.
Location Towersaddle Baseoftower
Totalload[kN] 19,180 27,680
Area[m2] 10.3 16.3
Stress,![MPa] 1.2 2.7

TrabajofinaldeGrado Toms,CameronIan
AnálisisestructuraldelPuenteColgantedeCliftonsituadoenBristol,ReinoUnido 29
6.Comparisonofanalyticalmethods
As mentioned earlier, graphic statics is a limited method of analysis in comparison with
modern numericalmethods. Numericalmethods aremore precise, faster and are able to
computemuchmorethangraphicstatics.Theprecisionandaccuracyofgraphicstaticswere
primarilyexploredinthisproject,howeverotherqualitativeobservationscanbemadetoo.
The graphic statics method was significantly slower than the numerical method.
Althoughthecomputermodelrequiredsometimetosetup, itwasstillcompletedquicker
than themanual drawings,which inmost cases took 2-3 hours to prepare, complete and
takeresults.Onceacomputermodelwassetup,thecalculationcouldberepeatedquickly
fordifferentloadcombination,whilethegraphicstaticsmethodrequiresthatyoustartfrom
scratchwitheach loadcombination.The fastermethod ispreferable inalmostall cases in
engineering. It shouldbenoted that thegraphic statics for the transversalgirdercouldbe
carried outwithin 20minutes using a CAD program, however this is still slower than the
numericalmethod.
The computational limitationsof the graphicalmethodweremadeobviousduring
this project as several parts of the bridge could not be analysed with it at all. The
longitudinalgirderisasingleobjectandprimarilyactsinbending.Asgraphicstaticscanonly
beusetofindtheaxialloadonanobject,itwasuselessinthiscase.
The precision of the graphic statics was determined by the scale of the force
diagramdrawn.ThedrawingsweredoneonA0paperatscalesof1cm:1kNor1cm:2kNfor
the transversal girders. This allowed for a theoretical precision of 0.05kN an 0.1kN
respectively,howeverthemeanaccuracywastypically0.5to1kN.Thetheoreticalprecision
couldbeincreasedbyusingalargerscale,butitwasnoticedthatinsomecasesthelongest
lineshadthelowestaccuracy.Itislikelythatthelargerthediagram,themoredifficultitisto
draw,sotheaccuracy isreduced.Drawingatthesescaleswasdifficultbecausethe140cm
rulewasunwieldyandtheA0sheetsweretoolargetousecomfortably.Iwouldarguethat
there is a limited scale atwhich useful drawing is possible, as percentage error increases
with scale. Although the method is inaccurate when done by hand, they would be
sufficientlyaccurateandpreciseformanycivilengineeringapplications.
Basedontheseobservations, it isobviousthatgraphicstatics isnotareplacement
for numerical methods. However it does have value as a visual aid. Mathematics is an
integralpartofengineering,however it can causeproblemswhen themethod isnot fully
understood or the results are incorrectly interpreted. Graphic statics could be useful in
teachingorpresentations,wherethespecificresultsarenotasimportantasunderstanding
thebehaviourofthestructure.Acombinationoftheformandforcediagramsisavisualway
to present the information, which would be useful for those who do not have an
understandingofthemathematicsordonotknowthestructure.
TrabajofinaldeGrado Toms,CameronIan
AnálisisestructuraldelPuenteColgantedeCliftonsituadoenBristol,ReinoUnido 30
7.Criticalevaluationofthebridge
7.1.Themodernstructure
According to David Billington’s The tower and the bridge (1985), a work of structuralengineeringisaworkofstructuralartifitfulfilsthethreecriteria:economy,efficiencyand
elegance.Economyisameasureofthecostofthestructure–duringbothconstructionand
operation – in comparison to it’s social worth. Structures thatmeet this ideal have good
value for money. Efficiency is a quantitative evaluation of the design – how well the
structureissuitedtoitspurpose–andeleganceistheevaluationfromaqualitativepointof
view.
It can be argued that the economy of the Clifton Suspension Bridge has changed
duringits200yearhistory.AccordingtoBody(1976),whenVickdiedinthe18thcentury,the
area around the bridgewas largely uninhabited. Clifton only became a popular suburb of
Bristol inthe19thcenturyandLeighWoodsremainsasmallvillage. It isnotclearwhyVick
wantedabridgebuilt in that location, as therewas seemingly littleneed for it– abridge
there would be of little use to anyone. During the construction, the cost of the bridge
increased enormously; the final cost – approximately £75,000 – was more than double
Brunel’sestimateof1830(Body,1976).Theventureisarguablywastefulanduneconomical
whenthehighcostandthelowpracticalityareconsidered.
However themodern situation of the bridge is quite different. Although access is
limited and the capacity of the bridge is small in comparison to other bridges across the
Avon,itisusedbymorethan10,000vehiclesaday(“Suspensionbridgetollmaydoubleto
£1,”2010)andprovidesanalternativerouteovertherivertothoseinthecentreofBristol
and in Avonmouth. It is of great historical and structural interest and is a popular tourist
attraction. The toll leveed on motorised vehicles provides money for maintenance and
operation. Instead of becoming less useful and more expensive to run, the bridge has
becomeveryeconomical.
Theefficiencyofthebridge ismoreeasilyanalysed.Suspensionbridgesareoneof
themostefficientbridgedesigns; thisexplains theiruse in the largest spans in theworld.
The cables and hangers act solely in tension and the towers in compression. Thismeans
bendingmomentsandshearforcesinthestructureareverylowandthebridgecanbebuilt
usingminimalmaterial. This project has shown that thedesignof the cable and thedeck
girders isefficient–usingthe leastmaterialpossiblewhileretaininganadequatefactorof
safety–especially considering theanalyticalmethodsavailableat the time.Other factors,
suchasthestiffeningeffectofthedecktimbersandintegratedparapetmeanthatthesize
ofthegirderscanbereduced.
FinallytheeleganceoftheCliftonbridgeisdiscussed.AlthoughnotBrunel’s
first choice, the design is laudedbymany and it is clear that he took great care over the
appearance of the bridge. The slope of the bridgewas designed tomake the bridge look
horizontalwhenviewedfromupstream.Paintingthemetalworkwhitemakesthestructure
less obtrusivewhen viewed fromalong the river and the simple towerdesign, using local
sandstone,isinkeepingwiththearchitecturalstyleofthebuildingsinBristol.Theinscription
ontheLeighWoodstower;‘SUSPENSAVIXVIAFIT’(theroadbecomesbarelysuspended)isa
tributetotheamazementofearlyvisitorstothebridgeandillustratestheeffectivenessof
thedesign– impressivebutnotdominating, so that theAvonGorgeremains theprincipal
subjectofinterest.
Fromthisevaluation,theCliftonSuspensionBridgeisfoundtobeofgreatsocialand
historical value, well designed and with pleasing aesthetic qualities; fulfilling Billington’s
criteriatobeconsideredanexampleofstructuralart.
TrabajofinaldeGrado Toms,CameronIan
AnálisisestructuraldelPuenteColgantedeCliftonsituadoenBristol,ReinoUnido 31
7.2.Othersubmissionsfromthedesigncompetition
7.2.1.‘Giant’sHole’design–Brunel
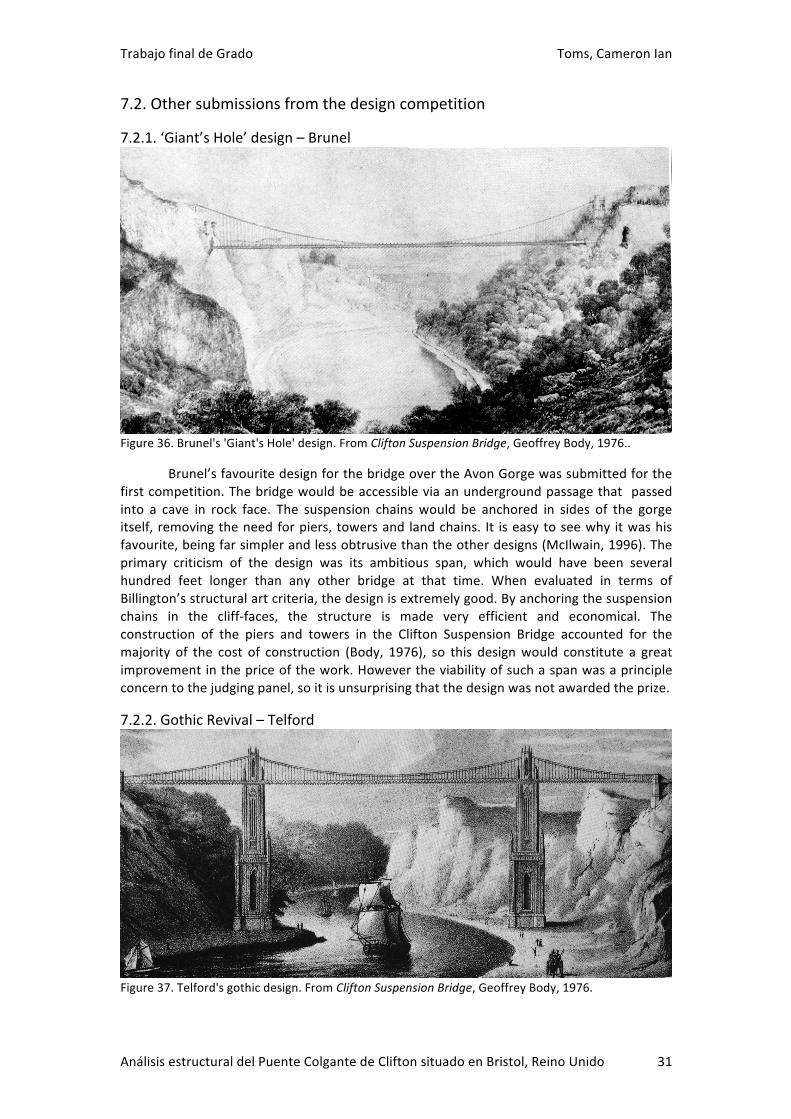
Figure36.Brunel's'Giant'sHole'design.FromCliftonSuspensionBridge,GeoffreyBody,1976..
Brunel’sfavouritedesignforthebridgeovertheAvonGorgewassubmittedforthe
firstcompetition.Thebridgewouldbeaccessibleviaanundergroundpassagethat passed
into a cave in rock face. The suspension chains would be anchored in sides of the gorge
itself, removingtheneedforpiers, towersand landchains. It iseasytoseewhy itwashis
favourite,beingfarsimplerandlessobtrusivethantheotherdesigns(McIlwain,1996).The
primary criticism of the design was its ambitious span, which would have been several
hundred feet longer than any other bridge at that time. When evaluated in terms of
Billington’sstructuralartcriteria,thedesignisextremelygood.Byanchoringthesuspension
chains in the cliff-faces, the structure is made very efficient and economical. The
construction of the piers and towers in the Clifton Suspension Bridge accounted for the
majority of the cost of construction (Body, 1976), so this designwould constitute a great
improvementinthepriceofthework.Howevertheviabilityofsuchaspanwasaprinciple
concerntothejudgingpanel,soitisunsurprisingthatthedesignwasnotawardedtheprize.
7.2.2.GothicRevival–Telford
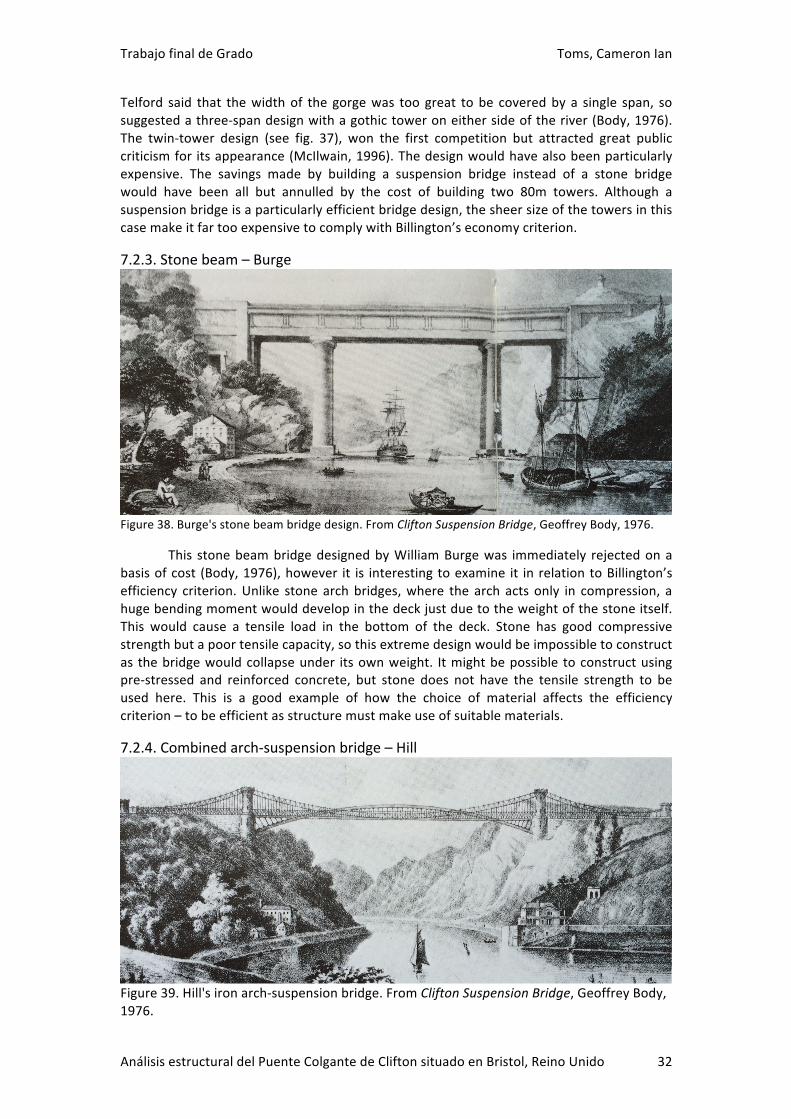
Figure37.Telford'sgothicdesign.FromCliftonSuspensionBridge,GeoffreyBody,1976.
TrabajofinaldeGrado Toms,CameronIan
AnálisisestructuraldelPuenteColgantedeCliftonsituadoenBristol,ReinoUnido 32
Telford said that thewidthof the gorgewas toogreat tobe coveredbya single span, so
suggestedathree-spandesignwithagothictoweroneithersideoftheriver(Body,1976).
The twin-tower design (see fig. 37), won the first competition but attracted great public
criticismfor itsappearance(McIlwain,1996).Thedesignwouldhavealsobeenparticularly
expensive. The savings made by building a suspension bridge instead of a stone bridge
would have been all but annulled by the cost of building two 80m towers. Although a
suspensionbridgeisaparticularlyefficientbridgedesign,thesheersizeofthetowersinthis
casemakeitfartooexpensivetocomplywithBillington’seconomycriterion.
7.2.3.Stonebeam–Burge
Figure38.Burge'sstonebeambridgedesign.FromCliftonSuspensionBridge,GeoffreyBody,1976.
This stonebeambridgedesignedbyWilliamBurgewas immediately rejectedona
basisofcost (Body,1976),however it is interestingtoexamine it inrelationtoBillington’s
efficiency criterion.Unlike stone archbridges,where the arch acts only in compression, a
hugebendingmomentwoulddevelopinthedeckjustduetotheweightofthestoneitself.
This would cause a tensile load in the bottom of the deck. Stone has good compressive
strengthbutapoortensilecapacity,sothisextremedesignwouldbeimpossibletoconstruct
as thebridgewouldcollapseunder itsownweight. Itmightbepossible toconstructusing
pre-stressed and reinforced concrete, but stone does not have the tensile strength to be
used here. This is a good example of how the choice of material affects the efficiency
criterion–tobeefficientasstructuremustmakeuseofsuitablematerials.
7.2.4.Combinedarch-suspensionbridge–Hill
Figure39.Hill'sironarch-suspensionbridge.FromCliftonSuspensionBridge,GeoffreyBody,1976.

TrabajofinaldeGrado Toms,CameronIan
AnálisisestructuraldelPuenteColgantedeCliftonsituadoenBristol,ReinoUnido 33
William Hill submitted this rather unorthodox design, where the deck is not only
suspendedbysuspensionchainsbutalsoanironarchandastiffeningtruss.Likemanyother
designs itwasrejectedowingto theestimatedcost (Body,1976). It isanotherexampleof
inefficient design, but because of the structure itself, rather than the material. The
combination of three different elements – the truss, suspension cables and arch –would
havemade an incredibly stiff bridge,more robust than it needed to be. This unnecessary
designwouldjusthavecontributedtothealreadylargecostsofthebridge.
TrabajofinaldeGrado Toms,CameronIan
AnálisisestructuraldelPuenteColgantedeCliftonsituadoenBristol,ReinoUnido 34
8.Conclusion
Thedevelopmentofstructuralanalysismethodsoverthelast200yearshasgreatlyaffected
the evolution of bridge design. The Brooklyn Bridge is an example of extreme over-
engineering to compensate for a lack of certainty, while the Severn Bridge has an
economical and efficient design that could only be achievedwith the latestmathematical
analysis.Thereisanassumptioninengineeringtodaythat ifthelatestmethodsofanalysis
havenotbeenused,theresultisneitherreliablenorengineering.Theaimofthispaperwas
to explore to what extent non-numerical methods of analysis are useful, and to use a
qualitativemethodtocomparedifferentbridgedesigns.
TheCliftonSuspensionBridgewasanalysedusingamodernnumericalmethodanda
graphical method more representative of the analytical capabilities of the 19th century.
Although the graphicalmethodwas less precise,more time consuming and less powerful
than thenumericalmethod, itwas still sufficientlyaccurate tomodel the forcesand ideal
shapesofsomekeyelementsofthebridge.Thiscomparisonofthetwomethodspermitsa
greater understanding of early suspension bridge designs and an gives an insight into the
roleofcivilengineersinthe19thcentury.
ThedifferencebetweenBrunel’soriginaldesignandtheoneconstructedbyBrunel
andHawkshawwasdiscussedandsupportsthetheorythatitisasmuchtheirbridgeashis;
it iswas suggested that Brunel’s designwould not have been strong enough to last until
today.
Finally, various submissions from the design competition were evaluated using
Billington’sthreecriteriaforstructuralart,inasimilarwaytowhichthecompetitionmight
havebeenjudged.Itprovidedanintegralandcompleteapproachtoqualitativeanalysis;an
evaluationthattakesintoaccountnotjustthemechanicalperformanceofthestructure,but
towhatextentitfulfilsitsroleasapublicfacility.
TrabajofinaldeGrado Toms,CameronIan
AnálisisestructuraldelPuenteColgantedeCliftonsituadoenBristol,ReinoUnido 35
9.References
ASTMInternational,1939.English:ASTMA207:Withdrawn1972.SpecificationforRolledWroughtIronShapesandBars
Baker,W.F.,Beghini,L.L.,Mazurek,A.,Carrion,J.,Beghini,A.,2013.Maxwell’sreciprocaldiagramsanddiscreteMichellframes.Struct.Multidiscip.Optim.48,267–277.
Barlow,W.H.,Ben,B.,2003.DescriptionoftheCliftonSuspensionBridge,UK.Proc.Inst.Civ.Eng.-BridgeEng.156,5–10.
Bell,F.G.,2013.MethodsofTreatmentofUnstableGround.Elsevier.Body,G.,1976.CliftonSuspensionBridge,1sted.MoonrakerPress,Bath.
BritishStandardsInstitution,2002.English:EN1991-1-1:Eurocode1:Actionsonstructures-Part1-1:Generalactions-Densities,self-weight,imposedloadsforbuildings
BritishStandardsInstitution,2005.English:EN1993-1-1:Eurocode3:Designofsteelstructures-Part1-1:Generalrulesandrulesforbuildings
Buonopane,S.G.,Billington,D.P.,1993.TheoryandHistoryofSuspensionBridgeDesignfrom1823to1940.J.Struct.Eng.119,954–977.
Canaan,2009.Español:Maquetapolifunicular,AntoniGaudí,MuseodelaSagradaFamilia.Cullimore,M.S.,1986.TheCliftonSuspensionBridge:preservationforutilisation.IABSEProc.
10,13.
D,J.,2007.CliftonSuspensionBridgechains,Bristol.Drewry,C.S.,1832.AMemoirofSuspensionBridges:ComprisingtheHistoryofTheirOrigin
andProgress,andofTheirApplicationtoCivilandMilitaryPurposes,withDescriptionsofSomeoftheMostImportantBridges;Viz.Menai,Berwick,Newhaven,Geneva,Etc.AlsoanAccountoftheExperimentsoftheStrengthofIronWiresandIronBars,andRulesandTablesforFacilitatingComputationsRelatingtoSuspensionBridges.Longmans,Rees,Orme,Brown,Green&Longman,London.
Edwards,M.,2007.English:TheSevernBridgespanstheRiverSevernbetweenSouthGloucestershire,England,andMonmouthshireinSouthWales,.
Gimsing,N.J.,1984.Cablesupportedbridges:conceptanddesign.J.Wiley,Chichester
[Sussex];NewYork.
Gothick,2009.CliftonSuspensionBridge,Bristol,England.Grattesat,G.,1978.ConceptiondesPonts.EditionEyrolles,Paris.HighwindsforceclosureofBristol’sCliftonSuspensionBridge,2014..BBCNews.McIlwain,J.,1996.CliftonSuspensionBridge.PitkinUnichromeLtd.
MinisteriodeFomento,2011.Spanish:IAP-11:Instrucciónsobrelasaccionesaconsiderarenelproyectodepuentesdecarretera
Miyata,T.,Yamada,H.,Katsuchi,H.,Kitagawa,M.,2002.Full-scalemeasurementofAkashi–KaikyoBridgeduringtyphoon.J.WindEng.Ind.Aerodyn.,FifthAsia-Pacific
ConferenceonWindEngineering90,1517–1527.
Poleni,G.,1748.MemorieistorichedellagrancupoladeltempioVaticano,ede’dannidiessaede’ristoramentiloro,diviseinlibricinque.NellaStamperiadelSeminario.
Richards,D.,2010.AcriticalanalysisoftheCliftonSuspensionBridge.Proc.BridgeEng.2Conf.2010.
Shackelford,J.F.,Han,Y.-H.,Kim,S.,Kwon,S.-H.,2016.CRCMaterialsScienceandEngineeringHandbook,FourthEdition.CRCPress.
"Suspensionbridgeshutforevents",2005..BBCNews."Suspensionbridgetollmaydoubleto£1",2010..BristolEveningPost."Suspensionbridgeclosedbyfault",2009..BBCNews.User:Postdlf,2005.English:TheBrooklynBridge,seenfromManhattan,NewYorkCity.VanMele,T.,Lachauer,L.,Rippmann,M.,Block,P.,2012.Geometry-basedunderstandingof
structures.J.Int.Assoc.ShellSpacialStruct.

TrabajofinaldeGrado Toms,CameronIan
AnálisisestructuraldelPuenteColgantedeCliftonsituadoenBristol,ReinoUnido 36
WPPilot,2015.English:ThisistheGoldenGateBridgeonDec152015byDRameyLoganfromjustnorthofAlcatrazIsland.
"YourBridgeProjects|TheCliftonSuspensionBridge".Cliftonbridge.org.uk.N.p.,2016.Web.
2June2016.
TrabajofinaldeGrado Toms,CameronIan
AnálisisestructuraldelPuenteColgantedeCliftonsituadoenBristol,ReinoUnido 37
10.Appendices
Theappendicesarefoundinvolume2.AppendicesA—Earethehand-drawnforcediagrams
usedforgraphicalanalysis.Thosewhichspanmorethanonepagehavepagesnumbered
fromlefttoright.AppendicesF–JaretheforcediagramsmadewithCAD.AppendicesK—M
arespreadsheets.
Hand-drawnforcediagrams:AppendixA–AnalysisoftransversalgirderunderLC1.(Twopages).
AppendixB–AnalysisoftransversalgirderunderLC2.(Twopages).
AppendixC–AnalysisoftransversalgirderunderLC3.
AppendixD–AnalysisoftransversalgirderunderLC4.
AppendixE–Analysisofsuspensionchain.
CADforcediagrams:AppendixF–AnalysisoftransversalgirderunderLC1.
AppendixG–AnalysisoftransversalgirderunderLC2.
AppendixH–AnalysisoftransversalgirderunderLC3.
AppendixI–AnalysisoftransversalgirderunderLC4.
AppendixJ–Analysisofsuspensionchain.
Spreadsheets:AppendixK–Appliedloadstotransversalgirder.
AppendixL–Resultsoftransversalgirdernumericalanalysis.
AppendixM–Analysisofchainshapes.