airline route networks - upcommons · companys de vida, david i aleix, el ser tan tossuts i no...
TRANSCRIPT

ADVERTIMENT. La consulta d’aquesta tesi queda condicionada a l’acceptació de les següents condicions d'ús: La difusió d’aquesta tesi per mitjà del servei TDX (www.tesisenxarxa.net) ha estat autoritzada pels titulars dels drets de propietat intel·lectual únicament per a usos privats emmarcats en activitats d’investigació i docència. No s’autoritza la seva reproducció amb finalitats de lucre ni la seva difusió i posada a disposició des d’un lloc aliè al servei TDX. No s’autoritza la presentació del seu contingut en una finestra o marc aliè a TDX (framing). Aquesta reserva de drets afecta tant al resum de presentació de la tesi com als seus continguts. En la utilització o cita de parts de la tesi és obligat indicar el nom de la persona autora. ADVERTENCIA. La consulta de esta tesis queda condicionada a la aceptación de las siguientes condiciones de uso: La difusión de esta tesis por medio del servicio TDR (www.tesisenred.net) ha sido autorizada por los titulares de los derechos de propiedad intelectual únicamente para usos privados enmarcados en actividades de investigación y docencia. No se autoriza su reproducción con finalidades de lucro ni su difusión y puesta a disposición desde un sitio ajeno al servicio TDR. No se autoriza la presentación de su contenido en una ventana o marco ajeno a TDR (framing). Esta reserva de derechos afecta tanto al resumen de presentación de la tesis como a sus contenidos. En la utilización o cita de partes de la tesis es obligado indicar el nombre de la persona autora. WARNING. On having consulted this thesis you’re accepting the following use conditions: Spreading this thesis by the TDX (www.tesisenxarxa.net) service has been authorized by the titular of the intellectual property rights only for private uses placed in investigation and teaching activities. Reproduction with lucrative aims is not authorized neither its spreading and availability from a site foreign to the TDX service. Introducing its content in a window or frame foreign to the TDX service is not authorized (framing). This rights affect to the presentation summary of the thesis as well as to its contents. In the using or citation of parts of the thesis it’s obliged to indicate the name of the author
A I R L I N E R O U T E N E T W O R K S
A C O M P L E X N E T W O R K A P P R O A C H
O R I O L L O R D A Ncodirectors
J O S E M S A L L A N – P E P S I M O
february 2014

Oriol Lordan. Airline route networks: A complex network approach c© February 2014

Als meus pares


A B S T R A C T
Communication via air routes is an important issue in a world organized around a web-likecity network. In this context, the robustness of network infrastructures, e. g. air transportnetworks, are a central issue in transport geography. Disruption of communication linksby intentional causes (e. g., terrorist attack on an airport) or unintentional (e. g., weatherinclemency) could be a serious drawback for countries, regions and airlines. Policymakersand the management of airlines and alliances should be able to reduce the effects of suchinterruptions in order to ensure good communication through air transport (i. e., maximizethe robustness of their network at a reasonable cost). The literature review of the studyof air transport route networks through an analysis of complex networks has highlighteda lack of contributions to the study of the topology and the robustness of such networks,which contrasts with advances undertaken for other transport networks or communica-tion systems. The literature survey suggests areas in which research should be undertaken,based on the existing literature in other areas and from three different perspectives: globalroute networks, airline alliances and airlines. The aim of this research is to develop a betterunderstanding of air traffic and, in particular, to be able to assess the potential damage ofany airport being inoperative for a continent, country or airline.
This thesis analyzes the topology and robustness of 3 proposed levels of study character-ized by different units of analysis: global route networks, airline alliances route network and air-lines route network. The different levels do not only represent different network magnitudesin number of nodes (airports) and links (routes), but also represent different approaches. InChapter 2 robustness of the global air transport network (L1) will be analyzed and criteriabased on Bonacich power centrality will be presented in order to assess attack vulnerabilityof complex networks. One of the outcomes of this study will be a list of the most criticalairports for the vulnerability of the entire air transport network. In Chapter 3 robustnessof alliances route network (L2) will be assessed comparing the robustness of the three ma-jor airline alliances (Star Alliance, oneworld and SkyTeam). To perform this analysis, onenew node selection criterion based on the efficiency of networks and one new method ofassessing vulnerability will be presented. This analysis will lead also to a comparison ofthe robustness of the three alliances. Finally, in Chapter 4 robustness of 10 FSCs and 3LCCs route network (L2) will be analyzed. The studied FSCs belong to the different airlinealliances showed in Chapter 3 thus allowing the comparison among levels. This chapter out-lines a comparison of the differences in robustness between FSCs and LCCs. In Chapter 5 asummary and discussion of conclusions obtained for each level will be carried out.
v

I pay no attention whatever toanybody’s praise or blame.
I simply follow my own feelings
A C K N O W L E D G E M E N T S
Vull agrair als meus pares l’educació dins i fora de les aules estant sempre al meu costatguiant-me fins la persona que sóc avui en dia. A la meva futura esposa Nuria, l’amor,comprensió i ajuda constant que fa que la meva vida sigui tant fàcil i feliç. I als meuscompanys de vida, David i Aleix, el ser tan tossuts i no deixar-me respirar i així poderaconseguir totes les nostres metes. No m’imagino cap present ni futur sense tots ells ja quesón i seran sempre el meu referent.
També vull agrair als meus tutors, Sallan i Pep, per haver-me acompanyat en aquesta tesi i,juntament amb el Vicenç, haver-me acollit des de bon principi com un més, tant en l’àmbitprofessional com personal. M’han donat sempre una llibertat completa en el meu desen-volupament professional la qual es veu plasmada en aquesta tesi.
No puc oblidar els meus amics escampats per tot el món Ivan, Xerca, Igualada, Passola iVíctor que m’han aconsellat i ajudat en varies ocasions en la redacció de la tesi tot i que moltcops no n’eren conscients. Finalment, vull agrair a la meva gran família Lordan, Gonzalez,Claros-Seubas, Ferrer-Plana i Escorihuela-Altaba per estar sempre donant-me suport tot iestar més lluny d’ells del que voldria.
Gràcies a tots.
vii


C O N T E N T S
i introduction 11 air transport networks 3
1.1 Theoretical framework . . . . . . . . . . . . . . . . . . . . . . . . . . . . . . . . 41.1.1 The air transport industry . . . . . . . . . . . . . . . . . . . . . . . . . . 41.1.2 Topology and robustness of air transport networks . . . . . . . . . . . 61.1.3 Models of real networks and robustness . . . . . . . . . . . . . . . . . 9
1.2 Discussion and future lines . . . . . . . . . . . . . . . . . . . . . . . . . . . . . 131.2.1 L1: Global route network . . . . . . . . . . . . . . . . . . . . . . . . . . 141.2.2 L2: Airline alliances network . . . . . . . . . . . . . . . . . . . . . . . . 151.2.3 L3: Airlines network . . . . . . . . . . . . . . . . . . . . . . . . . . . . . 16
1.3 Conclusions . . . . . . . . . . . . . . . . . . . . . . . . . . . . . . . . . . . . . . 16
ii robustness analysis 192 l1 : robustness of the air transport network 21
2.1 Abstract . . . . . . . . . . . . . . . . . . . . . . . . . . . . . . . . . . . . . . . . 212.2 Introduction . . . . . . . . . . . . . . . . . . . . . . . . . . . . . . . . . . . . . . 212.3 Methods . . . . . . . . . . . . . . . . . . . . . . . . . . . . . . . . . . . . . . . . 222.4 The global network of airports . . . . . . . . . . . . . . . . . . . . . . . . . . . 242.5 Results . . . . . . . . . . . . . . . . . . . . . . . . . . . . . . . . . . . . . . . . . 252.6 Conclusions . . . . . . . . . . . . . . . . . . . . . . . . . . . . . . . . . . . . . . 29
3 l2 : robustness of airline alliances route network 333.1 Abstract . . . . . . . . . . . . . . . . . . . . . . . . . . . . . . . . . . . . . . . . 333.2 Introduction . . . . . . . . . . . . . . . . . . . . . . . . . . . . . . . . . . . . . . 333.3 Methods . . . . . . . . . . . . . . . . . . . . . . . . . . . . . . . . . . . . . . . . 34
3.3.1 Vulnerability . . . . . . . . . . . . . . . . . . . . . . . . . . . . . . . . . 343.3.2 Size of giant component . . . . . . . . . . . . . . . . . . . . . . . . . . . 35
3.4 Results . . . . . . . . . . . . . . . . . . . . . . . . . . . . . . . . . . . . . . . . . 383.4.1 Topology of alliances route networks . . . . . . . . . . . . . . . . . . . 383.4.2 Robustness of airline alliances route network . . . . . . . . . . . . . . 40
3.5 Conclusions . . . . . . . . . . . . . . . . . . . . . . . . . . . . . . . . . . . . . . 424 l3 : robustness of airlines route network 45
4.1 Abstract . . . . . . . . . . . . . . . . . . . . . . . . . . . . . . . . . . . . . . . . 454.2 Introduction . . . . . . . . . . . . . . . . . . . . . . . . . . . . . . . . . . . . . . 454.3 Robustness of configurations of airline networks . . . . . . . . . . . . . . . . . 464.4 Methods . . . . . . . . . . . . . . . . . . . . . . . . . . . . . . . . . . . . . . . . 484.5 Results . . . . . . . . . . . . . . . . . . . . . . . . . . . . . . . . . . . . . . . . . 50
4.5.1 Topology . . . . . . . . . . . . . . . . . . . . . . . . . . . . . . . . . . . . 50
ix

x contents
4.5.2 Robustness . . . . . . . . . . . . . . . . . . . . . . . . . . . . . . . . . . 524.6 Conclusions . . . . . . . . . . . . . . . . . . . . . . . . . . . . . . . . . . . . . . 57
iii conclusions 595 conclusions 61
bibliography 65

L I S T O F F I G U R E S
Figure 1.1 Study levels . . . . . . . . . . . . . . . . . . . . . . . . . . . . . . . . . 9Figure 1.2 Random and scale-free networks . . . . . . . . . . . . . . . . . . . . . 11Figure 2.1 ATN degree (k) and betweenness (b) cumulative distributions . . . . 25Figure 2.2 Betweenness as a function of the degree and Bonacich power as a
function of the Bonacich centrality for the ATN . . . . . . . . . . . . . 26Figure 2.3 Vulnerability of ATN . . . . . . . . . . . . . . . . . . . . . . . . . . . . 27Figure 2.4 Top 15 disconnections for betweenness and damage measures . . . . 29Figure 2.5 Evolution of network basic characteristics . . . . . . . . . . . . . . . . 30Figure 3.1 Example of the inverted adaptive strategy . . . . . . . . . . . . . . . . 36Figure 3.2 Degree (k) and betweenness (b) cumulative distributions for each al-
liance . . . . . . . . . . . . . . . . . . . . . . . . . . . . . . . . . . . . . 39Figure 3.3 Betweennes (b) as a function of degree (k) for each alliance . . . . . . 40Figure 3.4 AARNs multi-scale vulnerability comparison . . . . . . . . . . . . . . 41Figure 3.5 Vulnerability of AARNs f ≤ 9% . . . . . . . . . . . . . . . . . . . . . 42Figure 3.6 Vulnerability of AARNs. Detail: f ≤ 2% . . . . . . . . . . . . . . . . . 43Figure 4.1 HS and PP configurations . . . . . . . . . . . . . . . . . . . . . . . . . 47Figure 4.2 Cumulative degree distribution plotted in double-logarithmic scale . 51Figure 4.3 Error and attack vulnerability of each airline transport networks . . 54Figure 4.4 Betweenness attack vulnerability of airline transport networks . . . . 56
xi
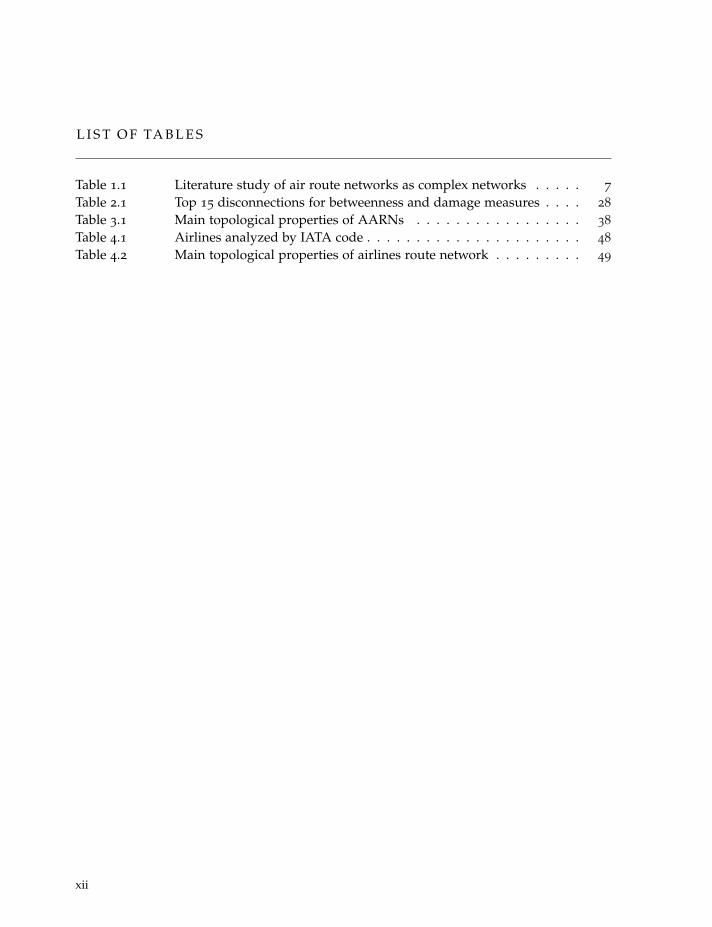
L I S T O F TA B L E S
Table 1.1 Literature study of air route networks as complex networks . . . . . 7Table 2.1 Top 15 disconnections for betweenness and damage measures . . . . 28Table 3.1 Main topological properties of AARNs . . . . . . . . . . . . . . . . . 38Table 4.1 Airlines analyzed by IATA code . . . . . . . . . . . . . . . . . . . . . . 48Table 4.2 Main topological properties of airlines route network . . . . . . . . . 49
xii
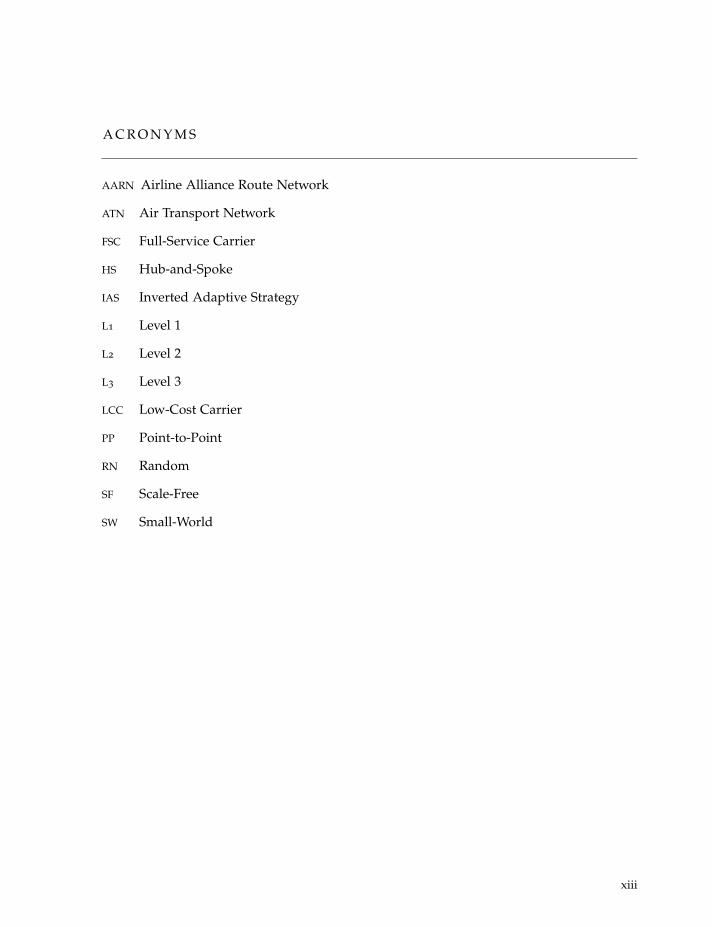
A C R O N Y M S
AARN Airline Alliance Route Network
ATN Air Transport Network
FSC Full-Service Carrier
HS Hub-and-Spoke
IAS Inverted Adaptive Strategy
L1 Level 1
L2 Level 2
L3 Level 3
LCC Low-Cost Carrier
PP Point-to-Point
RN Random
SF Scale-Free
SW Small-World
xiii


Part I
I N T R O D U C T I O N
Communication via air routes is an important issue in a world organized arounda web-like city network. In this context, the robustness of network infrastruc-tures, e. g. air transport networks, are a central issue in transport geography.Disruption of communication links by intentional causes (e. g., terrorist attackon an airport) or unintentional (e. g., weather inclemency) could be a serious forcountries, regions and airlines. Policymakers and the management of airlinesand alliances should be able to reduce the effects of such interruptions in orderto ensure good communication through air transport (i. e., maximize the robust-ness of their network at a reasonable cost). The literature review of the study ofair transport route networks through an analysis of complex networks has high-lighted a lack of contributions to the study of the topology and the robustnessof such networks which, contrasts with advances undertaken for other trans-port networks or communication systems. This survey suggests areas in whichresearch should be undertaken, based on the existing literature in other areasand from three different perspectives: global route networks, airline alliancesand airlines in order to develop a better understanding of air traffic and, there-fore, to be able to assess the potential damage of any airport being inoperativefor a continent, country or airline.

1A I R T R A N S P O RT N E T W O R K S
Air transport is one of the many networked systems that human societies depend upon, asthey do on telecommunications, transportation, electricity, water, etc. [1]. These infrastruc-tures, and particularly air transport, have contributed to the shift of the organization of theglobal economy from "spaces of places" to "spaces of flows" [2, 3]. This change may leadto a new organization of the global space around a "world city network" [4]. The currenttransport geography shapes and is shaped by the evolution of the network of large cities,mostly connected by the air transport network [5, 6, 7].
Therefore, the global economy has a growing dependence on network based infrastruc-tures that can be described as a set of physical entities located on the surface of the earth.The functionality of these entities can be modelled as a set of nodes and edges connectingthem [8]. One of the mentioned infrastructures is the air transport network, which can beschematically represented as a flight network. The flight network nodes are airports, whichare connected when a direct flight is scheduled between them [9]. The assessment of therobustness of air transport networks when facing random errors and intentional attacksis, therefore, an important issue on the field of transport geography research. There is agrowing concern in the transport geography community about the understanding of theoperability and functionality of critical infrastructure systems [10] like the air transportnetwork under severe disruption.
The investigation of complex networks began with the purpose of defining new conceptsand measures that allowed to characterize the topology of real networks. The result was theidentification of the principles of statistical properties of real networks. However, over thelast decade new lines of research have emerged. On the one hand, to address the complexityof the network structure multiple types of networks have been defined and studied. Someexamples of networks are weighted networks (i. e., networks with weighted links) [11] andspatial networks (i. e., networks with links that depend on the Euclidean distance betweenthe nodes) [12]. On the other hand, the approach of the studies on this field has changeddue to advances in the analysis of complex networks. Currently, the main interest lies ininvestigating the dynamic behavior of networks. The concepts of robustness, resilience, dy-namic collective synchronization or propagation processes were coined as a response to theneeds caused by this this new scenario [13].
The theoretical developments around complex networks has helped us to gain under-standing around a large number of phenomena, from social networks, economy and com-munication to financial markets and computer science [14]. There have been a number ofapplications of complex networks theory to transportation networks, such as streets [15, 16],railways [17], subways [18] and the power grid [19]. Until recently, the analysis of the air
3
4 air transport networks
transport network has dealt extensively with the study of the global air transport network’stopology [20, 21, 22, 23, 24]. The insights gained on topology of real complex networkshave allowed the application of techniques of analysis of robustness facing errors and at-tacks [25, 26].
A common feature of the studies mentioned above is that they are focused in methodol-ogy, rather than on organizational considerations. In order to gain insight on the structureand robustness of air transport networks, it can be argued that organizational considera-tions regarding air transport should be taken into account. In this chapter, it is proposed aframework to study the topology and robustness of the different air transport networks thattakes into account the organizational complexities of this industry. The aim of this study isto introduce new lines of research resulting from the application of the complex networksmethodology for studying the robustness of networks in the commercial aviation sector.This framework allows the definition of specific solutions for specific regions, airlines oralliances on the network structures the air routes should have in order to minimize theimpact of an emergency on one or more of its airports. As a result, the most critical airportsto fight against the complete disruption of the activity of a country or an airline can beidentified.
Through the discussion of the existing literature, it will be introduced the main linesof research that could help to a better understanding of air traffic from different levels ofanalysis: global route network, airline alliances, airlines and airports.
1.1 theoretical framework
1.1.1 The air transport industry
The airline industry has evolved from a mosaic of individual, protected companies to aliberalized system of global business organizations. In the last decade, changes in regulatoryregimes in the air transport sector (e. g., the nine freedoms of the air [27]) have drivennew strategies for airlines, which were already common in other sectors, such as alliances,mergers or takeovers. This is a consequence of the evolution of an industry that has beencharacterized by its low profitability and progressive increase of internal competition [28].
Until 1978, governments, national flag carrier airlines and national airports dominatedinternational air transport. In 1979, the US domestic market began to liberalize. As a resultLow-Cost Carriers began to appear, mergers occurred, charges fell, the hub-and-spoke struc-ture emerged and demand rose [29]. Ten years later, Europe began deregulation with threepackages (1988, 1990 and 1993) but it was not until 1997 that the deregulation was com-plete. The hub-and-spoke network was adopted by flagship carriers while new Low-CostCarriers configured their routes as point-to-point. In this context, airline alliances began toappear. Airline alliances are the result of the need to consolidate traffic from several airportsto undertake intercontinental routes, whose demand is growing due to economic globaliza-tion [30, 31].
1.1 theoretical framework 5
Recently a new deregulation process has started, the Open Skies agreements [32]. OnApril 30, 2007, the first Open Skies agreement was set. It included the US and EU and allowsflights by European or American airlines from anywhere in Europe to anywhere in theUnited States without restrictions. Currently, the US-EU agreement has new amendments(2010 and 2011) and other Open Skies agreements have been signed between US-Australia,US-Switzerland and US-Japan (2008). As it can be seen, the airline industry is in constantevolution and this affects its structure and characteristics. As a result of the deregulatorymeasures there are currently three business models in the aviation sector [33]: Full-ServiceCarrier (FSC), Low-Cost Carrier (LCC) and Charter Carrier.
Full-Service Carriers (FSCs) are the former national flag carriers, which as a result ofthe deregulatory processes have a business model based on a great variety of links (i. e.,domestic, international and intercontinental) and services, hub-and-spoke networks, yieldmanagement, vertical product differentiation and the creation of alliances. These carriers arealso known as traditional or legacy carriers.
The creation of alliances is crucial to the airlines as none of them has its own global net-work. The main reason for airlines to cooperate or form alliances is cost reduction [34, 35].Being a member of a partnership is an important factor in both the routing strategy of theairline in the long term and the network configuration adopted by alliance partners andcompetitors. In 2012, the three major alliances (Star Alliance, oneworld and SkyTeam) ac-counted for 60 percent of global air traffic measured in available seat-kilometres for the totalof scheduled passengers [36] and so their impact on market dynamics is important. Thus,airlines route network should be developed taking into account the continuous structuralchanges occurring to the global route network due to multiple new agreements on routesharing and mergers.
Due to the hub-and-spoke strategy followed by FSCs, the establishment of hubs is an-other very important point. Hubs are organized in order to allow airline flight connectionsby coordinating the scheduled arrival and departure of flights. The coordination of sched-ules should not only take into account flights operated by the airline but also all routes,including those operated by other airlines. To understand the strategy of the airlines in thedesign of connectivity between hubs and schedule coordination has been the objective ofseveral empirical and theoretical studies [37, 38, 39, 40].
Low-Cost Carriers (LCCs) are airlines with a business model based on having a compet-itive cost advantage through the use of secondary airports, point-to-point networks, basicservices, payment for auxiliary services and a single airplane model. Although it is not animplicit feature, LCCs tend not to establish any kind of alliance with other LCCs or FSCs.Finally, Charter Carrier airlines operate unscheduled flights based generally on specificconsumer demand for tourist destinations.
The structure of the global route network can be seen as a complex transportation net-work consisting of various airline network structures (e. g., hub-and-spoke and mixed point-to-point, multihubs). Studies tend to focus on the analysis of hub-and-spoke and point-to-

6 air transport networks
point typologies but it must be kept in mind that they do not represent the entire airlinetransport network. These typologies are not unique to air route networks, the hub-and-spoke network can be found in biological networks [41] and point-to-point networks inwireless networks [42].
1.1.2 Topology and robustness of air transport networks
The are different viewpoints in which one can study the network strategies followed byairlines. There are studies on the effect on prices deriving from the existing connectionsbetween airlines [34, 35] or on the connectivity levels and the competitive position of air-ports [43]. Another approach is the analysis of the route network architecture through com-plex network analysis [9, 21, 24].
Those studies that have characterized the topology of air route networks and those thathave analyzed the network robustness under errors and attacks should be reviewed in orderto asses the state of the art of air route networks in continents, countries and airlines.
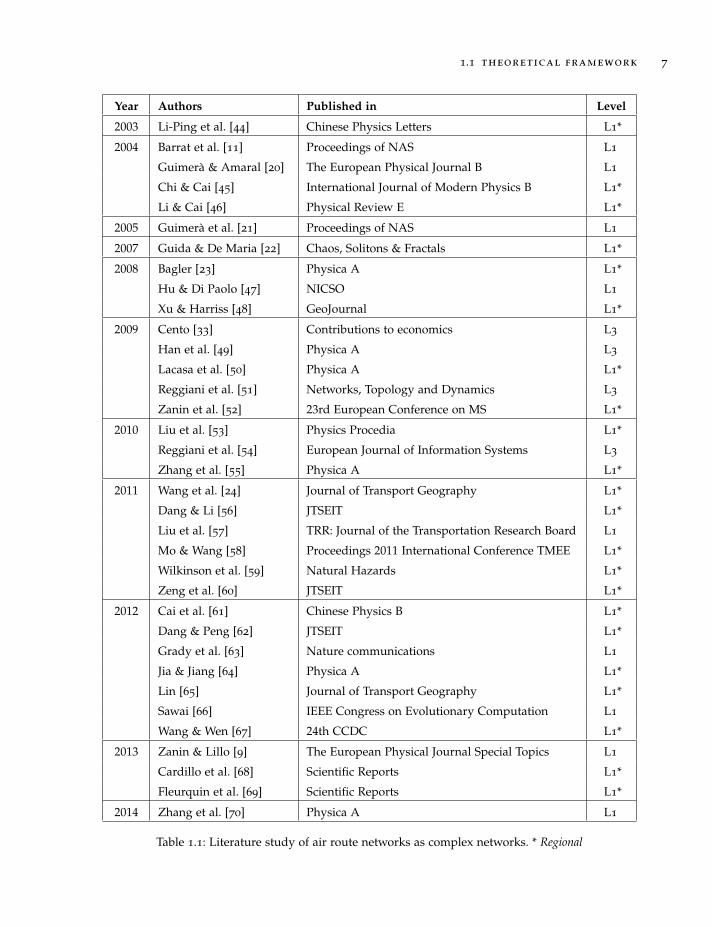
As shown in Table 1.1, the literature is very recent and has been developed mainly in thefield of methodology. The study of complex networks, as shown throughout this chapter,has been developed in parallel in other areas in greater depth. In particular, it must be high-lighted the thorough literature analysis of complex networks conducted in [13] which hasenabled the observation and comparison of different characteristics and properties betweenreal networks in various fields, and the recent surveys of applications of complex networktheory [14].
Guimerà and colleagues [20, 21] have studied the airport network structure across theworld, finding that the degree and betweenness centrality distributions follow a truncatedpower law distribution, given that airports have limitations to the number of connectionsthey can offer. To model the real network, the authors used a variant of the models from [12,71]. Both of them include the standard growth mechanism for the addition of links be-tween already existing nodes, the current base for studying route networks using com-plex networks. Only a model that includes geopolitical constraints, such as the fact thatmost cities are only allowed to make connections to other cities within the same country,can generate nodes with high and lower intermediation values, as observed in the realairport network [20, 21]. With the development of this comprehensive study, complex net-works analysis has started to be used more frequently in the airline industry. In particular,most new studies have regional scope, as in the case of Italy [22], India [23], US [48] andChina [24, 46, 57]. The intensive study of the topology of air route networks has showndifferent network structures. For instance, [21] obtained a scale-free network structure witha small-world property, [22] obtained a small-world network structure with a fractal small-world property and [23] obtained a small-world network.
Empirical research has found that FSCs route networks behave like scale-free networks[54] and random networks are useful for describing point-to-point connections [33]. LCCs
1.1 theoretical framework 7
Year Authors Published in Level
2003 Li-Ping et al. [44] Chinese Physics Letters L1*
2004 Barrat et al. [11] Proceedings of NAS L1
Guimerà & Amaral [20] The European Physical Journal B L1
Chi & Cai [45] International Journal of Modern Physics B L1*
Li & Cai [46] Physical Review E L1*
2005 Guimerà et al. [21] Proceedings of NAS L1
2007 Guida & De Maria [22] Chaos, Solitons & Fractals L1*
2008 Bagler [23] Physica A L1*
Hu & Di Paolo [47] NICSO L1
Xu & Harriss [48] GeoJournal L1*
2009 Cento [33] Contributions to economics L3
Han et al. [49] Physica A L3
Lacasa et al. [50] Physica A L1*
Reggiani et al. [51] Networks, Topology and Dynamics L3
Zanin et al. [52] 23rd European Conference on MS L1*
2010 Liu et al. [53] Physics Procedia L1*
Reggiani et al. [54] European Journal of Information Systems L3
Zhang et al. [55] Physica A L1*
2011 Wang et al. [24] Journal of Transport Geography L1*
Dang & Li [56] JTSEIT L1*
Liu et al. [57] TRR: Journal of the Transportation Research Board L1
Mo & Wang [58] Proceedings 2011 International Conference TMEE L1*
Wilkinson et al. [59] Natural Hazards L1*
Zeng et al. [60] JTSEIT L1*
2012 Cai et al. [61] Chinese Physics B L1*
Dang & Peng [62] JTSEIT L1*
Grady et al. [63] Nature communications L1
Jia & Jiang [64] Physica A L1*
Lin [65] Journal of Transport Geography L1*
Sawai [66] IEEE Congress on Evolutionary Computation L1
Wang & Wen [67] 24th CCDC L1*
2013 Zanin & Lillo [9] The European Physical Journal Special Topics L1
Cardillo et al. [68] Scientific Reports L1*
Fleurquin et al. [69] Scientific Reports L1*
2014 Zhang et al. [70] Physica A L1
Table 1.1: Literature study of air route networks as complex networks. * Regional

8 air transport networks
do not connect all their airports nor have a hub, but they rather base their route networkstructure on point-to-point routes. This network structure can only be used on short-haulroutes due to the smaller size of their aircrafts and reduced flight time. The lack of hubairports should indicate fairly similar concentrations in all airports leading to a very differ-ent type of network to those of scale-free. However, the network model for point-to-pointconnections according to [47, 57] is described as a small-world network [72, 73].
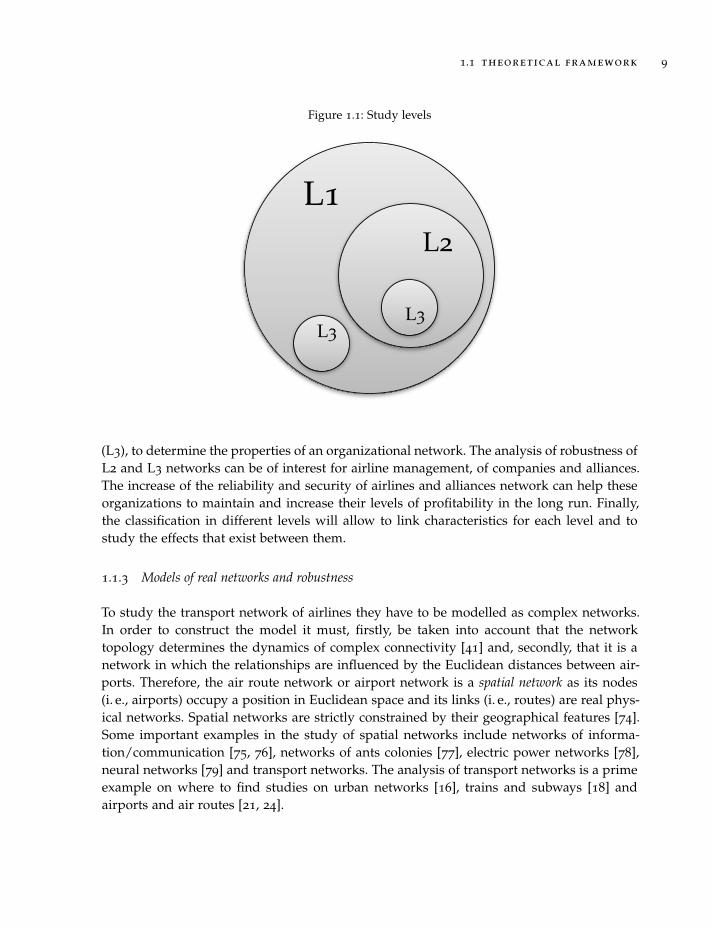
Recent studies have pointed out that the air transport network is a multilayer network,meaning that it is the result of the simultaneous presence of different subnetworks orga-nized in separate layers [68]. From this point of view, the air transport network is theresult of the aggregation of the route network of all the airlines. The analysis of the currentliterature studying air route networks as complex networks allows establishing differentdimensions or levels of study characterized by different units of analysis. Therefore, andgiven that each level has different characteristics and properties, three levels of study areproposed: the global route network (L1), the airline alliance network (L2) and a particular airlinenetwork (L3) as shown in Figure 1.1. The different levels do not only represent differentnetwork magnitudes in number of nodes (airports) and links (routes), but also representdifferent approaches.
The study of the global route network –first level: L1– looks at the competitive envi-ronment for airlines and the general framework of air transport development. Due to thesize of the global route network and that it is a spatial network (i. e., restricted by its geo-graphical characteristics), the network must be analysed both globally and regionally. Theliterature contains examples of both global [21] and regional [23] analyses. The analysis ofthe robustness of networks at L1 can be of interest for policy makers whose objective is toincrease the security of the air transport network, allowing the detection of critical airportsto prevent major collapses of the network, which can have a significant impact in globaleconomy. For instance, [59] have studied the impact of the eruption of the Icelandic volcanoEyjafallajökull on the global transport network, and [45] have analyzed the robustness ofthe US airport network to errors and attacks.
As indicated previously, air transport networks at the L1 are the result of several layersof airlines route network. Airlines network constitute the third level (L3) of the framework.In the study of an airline network (L3) the specific properties and characteristics of airlinescan be appreciated [49, 51, 54], regardless of the competitive environment.
The air networks of alliances constitute the second level (L2) of the framework. The par-ticipation on alliances can contribute to an improvement in network robustness for themember airlines thanks to the resulting codesharing agreements. The network of an airlinealliance is the route network operated by its members and the routes of other airlines withwhich they have codesharing agreements. Therefore, L2 networks are also multi-layered,since they are an aggregation of L3 networks. As shown in Table 1.1, this level has notbeen developed in any study using complex networks although airline alliances have beenextensively studied in the literature on air transport management [31, 34, 35]. This levelrepresents the network structure of airline alliances and enables us, as in the case of airlines
1.1 theoretical framework 9
Figure 1.1: Study levels
L1L2
L3L3
(L3), to determine the properties of an organizational network. The analysis of robustness ofL2 and L3 networks can be of interest for airline management, of companies and alliances.The increase of the reliability and security of airlines and alliances network can help theseorganizations to maintain and increase their levels of profitability in the long run. Finally,the classification in different levels will allow to link characteristics for each level and tostudy the effects that exist between them.
1.1.3 Models of real networks and robustness
To study the transport network of airlines they have to be modelled as complex networks.In order to construct the model it must, firstly, be taken into account that the networktopology determines the dynamics of complex connectivity [41] and, secondly, that it is anetwork in which the relationships are influenced by the Euclidean distances between air-ports. Therefore, the air route network or airport network is a spatial network as its nodes(i. e., airports) occupy a position in Euclidean space and its links (i. e., routes) are real phys-ical networks. Spatial networks are strictly constrained by their geographical features [74].Some important examples in the study of spatial networks include networks of informa-tion/communication [75, 76], networks of ants colonies [77], electric power networks [78],neural networks [79] and transport networks. The analysis of transport networks is a primeexample on where to find studies on urban networks [16], trains and subways [18] andairports and air routes [21, 24].
10 air transport networks
Another important feature is that networks can be considered either weighted or un-weighted. On weighted networks, a real number (i. e., the weight) is associated to eachlink [13]. Together with a complex topological structure, many real networks show a consid-erable heterogeneity in terms of capacity and strength of their connections, which would gounnoticed if they were modeled as an unweighted network. Examples of this are the exis-tence of strong or weak ties between individuals in social networks [80, 81], irregular flowsin metabolic reaction pathways [82], varying transmission capabilities of electrical signalsin neural networks [80, 83, 84] or the inequality in traffic via the Internet [75].
Ignoring this diversity in such interactions would mean overlooking most of the infor-mation on complex networks, which is in many cases, available and useful for its charac-terization. By way of example, it is very different to study an airline’s route network byonly considering the transit links between airports or to study the route frequency betweenthese airports. These cases represent unweighted and weighted networks respectively. Inthe study of air routes networks there are examples of analysis of both unweighted net-works [54, 57] and weighted networks [11, 20, 21, 46].
Complex networks analysis has found a common feature of topology of interactions insystems as diverse as communications systems [75, 85] social [72, 86, 87] and biological [41,88, 89, 90]. The behavior of most communication systems, including air transport networkscan be modelled with the scale-free (SF) network [91]. These and most of real networksusually have the small-world (SW) property (i. e., a low average path length) [72, 73].
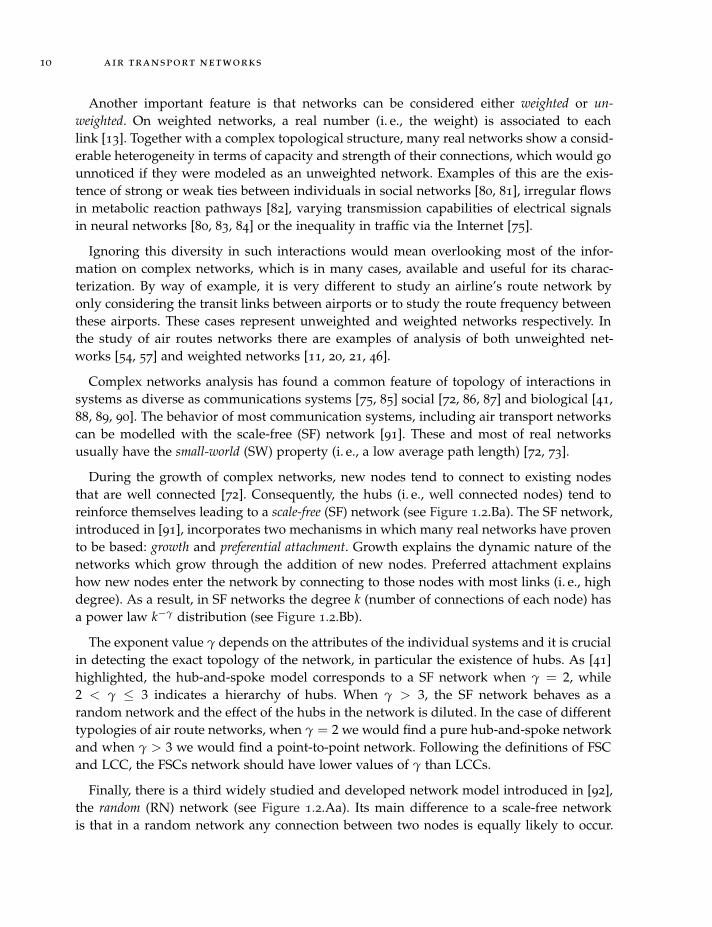
During the growth of complex networks, new nodes tend to connect to existing nodesthat are well connected [72]. Consequently, the hubs (i. e., well connected nodes) tend toreinforce themselves leading to a scale-free (SF) network (see Figure 1.2.Ba). The SF network,introduced in [91], incorporates two mechanisms in which many real networks have provento be based: growth and preferential attachment. Growth explains the dynamic nature of thenetworks which grow through the addition of new nodes. Preferred attachment explainshow new nodes enter the network by connecting to those nodes with most links (i. e., highdegree). As a result, in SF networks the degree k (number of connections of each node) hasa power law k−γ distribution (see Figure 1.2.Bb).
The exponent value γ depends on the attributes of the individual systems and it is crucialin detecting the exact topology of the network, in particular the existence of hubs. As [41]highlighted, the hub-and-spoke model corresponds to a SF network when γ = 2, while2 < γ ≤ 3 indicates a hierarchy of hubs. When γ > 3, the SF network behaves as arandom network and the effect of the hubs in the network is diluted. In the case of differenttypologies of air route networks, when γ = 2 we would find a pure hub-and-spoke networkand when γ > 3 we would find a point-to-point network. Following the definitions of FSCand LCC, the FSCs network should have lower values of γ than LCCs.
Finally, there is a third widely studied and developed network model introduced in [92],the random (RN) network (see Figure 1.2.Aa). Its main difference to a scale-free networkis that in a random network any connection between two nodes is equally likely to occur.
1.1 theoretical framework 11
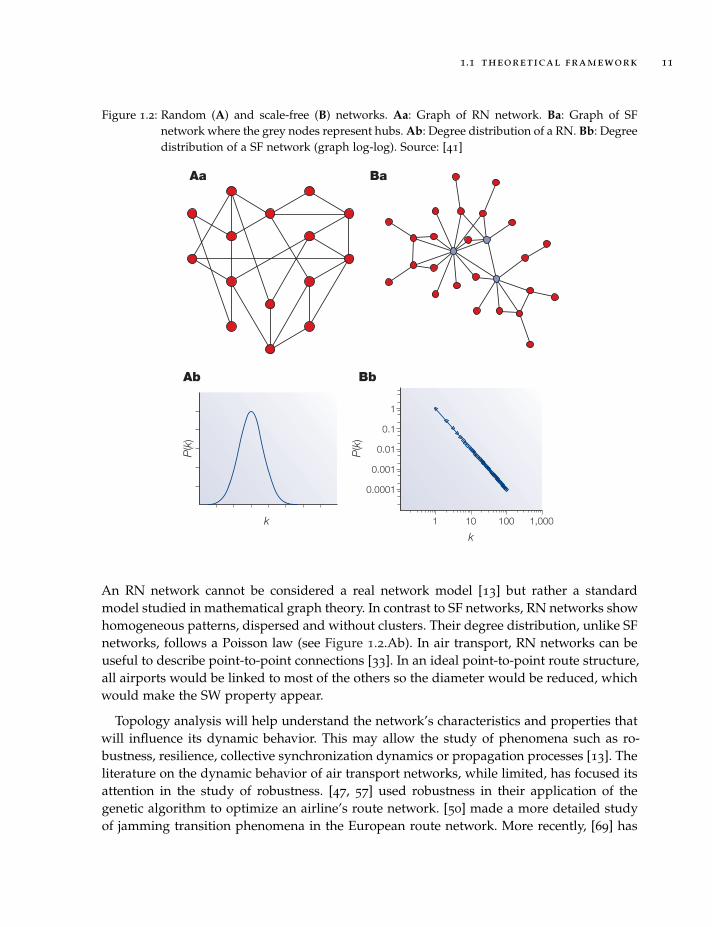
Figure 1.2: Random (A) and scale-free (B) networks. Aa: Graph of RN network. Ba: Graph of SFnetwork where the grey nodes represent hubs. Ab: Degree distribution of a RN. Bb: Degreedistribution of a SF network (graph log-log). Source: [41]
NATURE REVIEWS | GENETICS VOLUME 5 | FEBRUARY 2004 | 105
R E V I E W S
Box 2 | Network models
Network models are crucial for shaping our understanding of complex networks and help to explain the origin of observed networkcharacteristics. There are three models that had a direct impact on our understanding of biological networks.
Random networks The Erdös–Rényi (ER) model of a random network14 (see figure, part A) starts with N nodes and connects each pair of nodes with probability p,which creates a graph with approximately pN(N–1)/2 randomly placed links (see figure, part Aa). The node degrees follow a Poisson distribution(see figure, part Ab), which indicates that most nodes have approximately the same number of links (close to the average degree <k>). The tail(high k region) of the degree distribution P(k) decreases exponentially, which indicates that nodes that significantly deviate from the average areextremely rare. The clustering coefficient is independent of a node’s degree, so C(k) appears as a horizontal line if plotted as a function of k (seefigure, part Ac). The mean path length is proportional to the logarithm of the network size, l ~ log N, which indicates that it is characterized by thesmall-world property.
Scale-free networksScale-free networks (see figure, part B) are characterized by a power-law degree distribution; the probability that a node has k links follows P(k) ~ k –γ, where γ is the degree exponent. The probability that a node is highly connected is statistically more significant than in a random graph,the network’s properties often being determined by a relatively small number of highly connected nodes that are known as hubs (see figure, partBa; blue nodes). In the Barabási–Albert model of a scale-free network15, at each time point a node with M links is added to the network, whichconnects to an already existing node I with probability Π
I= k
I/Σ
Jk
J, where k
Iis the degree of node I (FIG. 3) and J is the index denoting the sum over
network nodes. The network that is generated by this growth process has a power-law degree distribution that is characterized by the degreeexponent γ = 3. Such distributions are seen as a straight line on a log–log plot (see figure, part Bb). The network that is created by theBarabási–Albert model does not have an inherent modularity, so C(k) is independent of k (see figure, part Bc). Scale-free networks with degreeexponents 2<γ<3, a range that is observed in most biological and non-biological networks, are ultra-small34,35, with the average path lengthfollowing � ~ log log N, which is significantly shorter than log N that characterizes random small-world networks.
Hierarchical networksTo account for the coexistence of modularity, local clustering and scale-free topology in many real systems it has to be assumed that clusterscombine in an iterative manner, generating a hierarchical network47,53 (see figure, part C). The starting point of this construction is a small clusterof four densely linked nodes (see the four central nodes in figure, part Ca). Next, three replicas of this module are generated and the three externalnodes of the replicated clustersconnected to the central node ofthe old cluster, which produces alarge 16-node module. Threereplicas of this 16-node moduleare then generated and the 16peripheral nodes connected tothe central node of the oldmodule, which produces a newmodule of 64 nodes. Thehierarchical network modelseamlessly integrates a scale-freetopology with an inherentmodular structure by generatinga network that has a power-lawdegree distribution with degreeexponent γ = 1 + �n4/�n3 = 2.26(see figure, part Cb) and a large,system-size independent averageclustering coefficient <C> ~ 0.6.The most important signature ofhierarchical modularity is thescaling of the clusteringcoefficient, which follows C(k) ~ k –1 a straight line of slope–1 on a log–log plot (see figure,part Cc). A hierarchicalarchitecture implies that sparselyconnected nodes are part ofhighly clustered areas, withcommunication between thedifferent highly clusteredneighbourhoods beingmaintained by a few hubs (see figure, part Ca).
A Random network
Ab
Aa
Bb
Ba
B Scale-free network
1
0.1
0.01
0.001
0.0001
1 10 100 1,000
P(k
)
kk
P(k
)
An RN network cannot be considered a real network model [13] but rather a standardmodel studied in mathematical graph theory. In contrast to SF networks, RN networks showhomogeneous patterns, dispersed and without clusters. Their degree distribution, unlike SFnetworks, follows a Poisson law (see Figure 1.2.Ab). In air transport, RN networks can beuseful to describe point-to-point connections [33]. In an ideal point-to-point route structure,all airports would be linked to most of the others so the diameter would be reduced, whichwould make the SW property appear.
Topology analysis will help understand the network’s characteristics and properties thatwill influence its dynamic behavior. This may allow the study of phenomena such as ro-bustness, resilience, collective synchronization dynamics or propagation processes [13]. Theliterature on the dynamic behavior of air transport networks, while limited, has focused itsattention in the study of robustness. [47, 57] used robustness in their application of thegenetic algorithm to optimize an airline’s route network. [50] made a more detailed studyof jamming transition phenomena in the European route network. More recently, [69] has

12 air transport networks
analyzed the problem of delay propagation in the US airport network and [70] has applieda dynamic fluctuation model that quantitatively describes and reproduces the real airportnetwork.
Air traffic is part of a dynamic environment, where airports and routes can be closedtemporarily for various reasons such as environmental accidents, security alerts, strikes orterrorist attacks, etc. resulting in high costs for airlines and countries. For example, in 2010the strike by air-traffic controllers in Spain is estimated to have cost airlines $134m [93]whereas snow and strikes cost easyJet £31m in the same year [94]. The alternative for air-lines, depending on the cause of the malfunction, could be to seek a replacement route fortheir clients, using other airlines’ routes or waiting for the route or airport to be operationalagain.
The analysis of robustness in air transport can evaluate the effect of errors (e. g., inclementweather) or attacks (e. g., terrorism) on a route network. The study of the robustness enablesthe evaluation of the capacity for networks to avoid a malfunction when some fraction ofits components is damaged [13]. In this way, we can analyze network resilience, toleranceto attacks and congestion caused by any malfunction. Therefore, and due to its applicationsto aviation, we will focus on the analysis of robustness.
The study of a network’s robustness facing random failures and intentional attacks wasone of the first issues to be explored in the literature on complex networks [25, 26]. Theproblem can be explored in two different ways. The first, known as static robustness, isthe action of isolating nodes without the need to redistribute any quantity transported bythe network. This is the case, for example, of a social network in which relations betweenindividuals in the system are cut. The second, dynamic robustness, takes into account thedynamics of flow redistribution. As an example, when an Internet router goes down, thepackets it should transmit are diverted through alternative routes. The two types of robust-ness are similar, but while the first can be treated analytically, for example, by using toolsof statistical physics such as percolation theory [95], the analytical process in the secondcase is more complex and in almost all cases numerical simulation has to be used.
As discussed, static robustness ignores flow redistribution as nodes or links are elimi-nated in the network. Tolerance to static errors is defined as the capacity of the system tomaintain its connectivity features following some random disconnection of nodes or links.Furthermore, we refer to an attack as when the removal process is directed at a particularclass of nodes or links, for example, well connected nodes. As well as numerical simula-tions [25, 26] a number of analytical approaches have been proposed [95, 96, 97, 98] tostudy tolerance to errors and attacks in complex networks.
Furthermore, dynamic robustness is more complex, since the links or nodes may haverestrictions on their capacity and the load is often highly variable in space and time. Cur-rent studies in other fields have dealt, using dynamic effects, with the problem avalanchesof broken nodes [99, 100] and congestion in communication systems [90, 101], providingindications for actions that can be taken to decrease undesirable effects [13].
1.2 discussion and future lines 13
As previously explained, the topology of networks must be known in order to analyzetheir dynamic behavior. [26] studied how Internet properties changed when some of itsnodes were disconnected from a sample of the World Wide Web. On the World WideWeb the giant component remains unchanged despite high random removal rates of nodes,while, if the nodes are isolated as an attack, the size of the resulting fragments decreasesrapidly. Furthermore, [102] simulated a series of attacks on a SF network showing that suchattacks would cause the system to collapse. In these examples, the response to attacks orfailures of an SF network is quite different than the response of a RN graph of the samesize and average degree. For random failures, in SF networks the size of the largest com-ponent decreases slowly and no threshold is observed, contrarily to RN networks. On theother hand, the response of SF networks to attacks is similar to the response to attacks andfailures in the RN network, with a lower critical value than the value observed in the RNgraph. As in the case of [26], for the analysis of the route network the network topologymust be taken into account in order to understand the effects that errors or attacks mighthave.
1.2 discussion and future lines
The study of network route robustness has been a recurring study topic in recent years.However, there is an approach that has had limited analysis: the airline management ap-proach (L2 and L3) and the government policy approach (L1). In the levels described above,it can be seen how levels L2 and L3, alliances and airlines, focus their attention on compa-nies or organizations. As shown in Table 1.1 the study of the alliance network (L2) has notbeen developed yet. On the other hand, some research has been carried on the airlines (L3),in companies such as Lufthansa [51, 54] and other European airlines [33, 49]. The analysis ofbusiness networks (i. e., companies or alliances) robustness could influence the decisions toopen new routes or negotiate new codesharing agreements. On the other hand, the analysisof the robustness of route networks in a specific region (L1), whether they are continentsor countries, would help to make better decisions at the policy-making level. For instance,European policymakers could be interested to know which airports are the most impor-tant in maintaining stable air communication. It might also be known which non-Europeanairports could pose a problem for the flow of their air routes.
Because the current literature is mainly focused on complex network theory development,the studies conducted up to the present date have used the global air route network as aspecial case of a complex network. Since the aviation route network can be modelled andadequately characterized as a complex network, it can be argued that it is time to applycomplex network analysis on aviation organizations: alliances and airlines. The analysis oftopology of these networks can help to see how the airlines’ own networks and alliancesare made up, allowing for the evaluation of their characteristics (e. g., robustness) and theirinfluence on these companies. These developments can be of vital importance at all levelsof study, from those studies centred on airlines to those focusing on the overall policy envi-

14 air transport networks
ronment. Consistent with the literature review, future lines of research will be formulatedfollowing the levels outlined.
1.2.1 L1: Global route network
The global route network has been the most studied network. This network consists ofall currently active airports. Studies have examined network topology, but some criteria ofanalysis have had less or limited treatment. An increased knowledge of the airline routesnetwork topology would enable to assess more completely the influence of different airportsin the robustness of the global network and their impact on the connection of differentregions. In other complex networks, this analysis has been carried out through centralitystudies. Concepts such as the number of nodes to which a particular node is connected(degree centrality), the number of links to reach the rest of nodes (closeness centrality)or how intermediary a node is (intermediation centrality) in a network are some of themost widely used due to their ease of interpretation. However, [33] introduces networkconcentration measurements such as the Gini index or others used in the social media suchas Freeman’s centrality index and Bonacich’s centrality. Along these lines there is still a longway to go on the implementation of new measures of complex networks used elsewhere.
Some of the examples seen in social networks are the intermediation flow centrality andBonacich’s power. The focus of flow centrality expands the notion of intermediation. Itassumes that nodes will use all routes that connect them rather than only geodesic routes.Lets suppose that an airline wants to offer a route between two distant points, but anintermediary airport blocks the geodesic path between them. If another route exists, thetwo nodes will probably use it, even if it is longer or less efficient. Such behavior can beeffectively modelled through flow centrality. Bonacich [103] proposed that both the notionsof centrality and power are functions of node’s links to its environment. A node will havehigh Bonacich centrality if connected to nodes of high centrality, and high Bonacich powerwhen connected to low power nodes. Note that Bonacich’s power should not be confusedwith Bonacich’s centrality.
The robustness analysis of the global network should be carried out taking into accountthe characteristics of spatial networks, through a detailed study of the global network andits regions. On one hand, this study would provide great value for the analysis of complexnetworks, and on the other hand, it could be assessed how the different countries or regionsstudied would be affected by airport closures. As an example, the closure of London’sairspace might not have the same impact on European air traffic as the closure of Barcelona’sairspace. It would also be shown which airports, in case of an error or a deliberate attack,would affect the global network most. Following this a debate would ensue about whetherthese airports should have greater controls or if their route volumes should be reduced inorder to alleviate the inherent risk.

1.2 discussion and future lines 15
1.2.2 L2: Airline alliances network
Currently, there are three airline alliances (i. e., Star Alliance, oneworld and SkyTeam). Thesethree alliances accounted for 60% of global air traffic in 2012. The main activities within thealliance are creating codesharing agreements and buying fleet and fuel in bulk. The aim ofan alliance is that the whole network of the member airlines appears to be an extension ofeach partners’ routing system [104]. Through codesharing agreements the airlines work inorder to provide a continuous service, so passengers cannot distinguish between makingan interline flight with one or more airlines. This is achieved by the already mentionedcoordination of flight schedules to reduce downtime, ensuring the proximity of gates atairport transfers and merging the alliance partners’ frequent flyer programs.
With the extensive use of this practice, codesharing agreements have become the hallmarkof the alliance revolution in the commercial aviation industry [34]. Coordination amongmember airlines of the alliance and the adequate control of their routes leads to a significantincrease in the scope and frequency of the routes offered to customers. In Table 1.1 it canbe seen that at this level there have been no studies of complex networks, whereas alliancesand codesharing agreements have been studied from other approaches [34, 35].
Therefore, it is interesting to study the topology of what might be considered "mega-airline carriers" in the same way as there have been in the study of airlines (L3). The networkof an airline alliance is defined as the route network operated by its members and theroutes of other airlines with which they have codesharing agreements. In this way, the realroute network offered by alliances is taken into account, not only those routes operated byalliance members. The topology study may offer insight into the properties of networks asto, for example, assess whether the networks of individual members are complementary orredundant.
At this level, the study of route network robustness takes a business stance. How robustis the network of each alliance? Do members of these alliances see their route networkincrease in robustness thanks to their membership, and to what extent? Alliances routenetwork analysis can provide a lot of information about the position of its members in suchnetworks. Through previous analysis of the topology of these networks it can be determinedhow these alliances are constructed and evaluated, among other things, whether belongingto an alliance increases the robustness of the airline route network.
As an example, if members of the alliance were selected only to increase the total rangeof their routes, and codesharing agreements among its members were only on routes notoperated by them (i. e., complementary routes), the alliance would not provide robustness toits members; but if on the other hand, members do not close similar routes and codesharingarrangements are also made on routes operated by the airlines (i. e., redundant routes),robustness could be seen to increase as well as its relevant benefits. This would only bean example because, as explained above, these characteristics depend on various networkattributes.
16 air transport networks
1.2.3 L3: Airlines network
The last proposed level of analysis is individual airlines network. Consistent with alliancesnetwork (L2), airline network can be defined as the route network the airline operates androutes of other airlines with which it has codesharing agreements. At this level, [51, 54] haveundertaken a case study of Lufthansa. Also, [33, 49] evaluated the structural properties ofvarious European airlines through complex networks analysis.
In order to assess the robustness of airline routes and thus ensure their stable trafficdevelopment, the airline’s topology should be analyzed first. If it is taken into account thatthe network topology of a FSC network is hub-and-spoke, its network topology should beSF. Similarly, an LCC, due to its network typology being mainly point-to-point, might beconsidered RN or an SF with a low preferred connection (i. e., a high γ). These assumptionsshould be analyzed in order to determine the influence of the closure of a major or asecondary airport on airline operations.
Finally, the study of robustness would allow airlines to resolve questions such as: AreLCCs, those airlines which do everything possible to keep the aircraft in the air, protectedagainst failure or an attack on their network? If they are compared with FSCs, is theirnetwork more robust than FSCs as part of an alliance or not? Do FSCs and LCCs adoptthe same network structures regardless of their geographical base? Previously, the airlines’network topology should be examined because, if the FSCs network are SF with a higherpreferred connection than LCCs, current studies of complex networks would indicate thatFSCs would have a less robust network structure against attacks than LCCs.
1.3 conclusions
Air transport networks are one of the critical infrastructures of today’s world economy,and there is a need to better understand the functioning of these networks under severedisruption events [10]. This work has identified the main research areas in air transportgeography derived from the study of robustness of complex networks. The literature reviewhas shown that in recent years air route networks have begun to be modelled and analyzedas complex networks but from a very theoretical point of view. In this review three levelsof study are presented through two new applied approaches: the airline management focus(airline alliances L2, and airlines L3) and the government policy focus (global air transportnetwork L1).
These approaches help to see and structure important practical implications inherent tothe dynamic analysis of air route networks. As with the study of robustness, the effectthat either terrorist attacks or inclement weather may have on the proper operation of anairline or the aviation relations between two regions can be assessed. Consequently, a lineof research has been proposed which follows the lead taken in other areas where the studyof complex networks has been more extensive (e. g., neural network study) but within thefield of air transport geography.

1.3 conclusions 17
This approach represents a first step in the study of complex networks applied to airtransport and will allow for better understanding of air route network structures. This willmake possible to evaluate and enable a restructuring of the system of air transport with theaim to avoid serious collapses, both at the airline level as in the regional level, when facedby errors or attacks at airports in an increasingly crowded market.

Part II
R O B U S T N E S S A N A LY S I S
The robustness analysis of each level shows how vulnerable and fragile theglobal, alliance and airline network are when facing unintentional errors andintentional attacks. Several approaches has been considered introducing newconcepts from other areas and new ones self-developed.

2L 1 : R O B U S T N E S S O F T H E A I R T R A N S P O RT N E T W O R K
2.1 abstract
The assessment of the impact of disruption of the air transport network by intentional(e. g., terrorist attack on an airport) or unintentional causes (e. g., weather inclemency) iscrucial for the management of the global transportation system. The potential impact of airtraffic disruptions will be assessed through an analysis of the vulnerability of the globalair transport network (ATN). The behavior of the ATN against intentional airport closuredepends on its topological properties. The aim of this research is to analyze the impact ofthe closure of a sequence of airports on the reliability of the entire ATN. That analysis canprovide insight about how to reduce the effects of such disruptions in order to ensure goodcommunication through air transport (i. e., maximize the robustness of the global network).
2.2 introduction
The air transport network (ATN) is one of the most important and critical infrastructuresof today’s global economy. Together with the Internet, which has lowered dramaticallythe costs of dissemination of knowledge, the continuing expansion of the air transporthas contributed to the globalization of the economy, and has increased the possibilities ofmobility of people and merchandises worldwide. ATN is responsible of the mobility ofmillions of people every day: from November 2011 to November 2012 24, 848 commercialconnections between 3, 712 airports were scheduled (source: SRS database). But in spite ofits critical importance, the ATN can be vulnerable to incidents with some airports at thebrink of failure.
Failures or inefficiencies on flight operation cause high economic costs. Some minor inci-dents, such as low clouds, can lower landing rates as much as 28% [21]. The eruption of theIcelandic volcano Eyjafallajökull on March 14, 2010 caused serious restrictions on Europeanair traffic, causing 10 million delays in European airports [105], with estimated losses foraffected companies of $1.7b [106]. The cost for airlines of the 2010 controllers strike in Spainhave been estimated to be of $134m [93]. Disruptions of the ATN can be the source of hugelosses, and can affect seriously global mobility.
The ATN is the result of concurrent actions of airline companies and alliances trying tomaximize their profit, and also of a sequence of events arising from geographical, politicaland economic factors. Therefore, in spite of the potential consequences of ATN disruptions,it has not been designed to be resilient facing unintentional errors (e. g., bad weather) andintentional attacks (deliberate actions trying to disrupt ATN connectivity). The analysis of
21

22 l1 : robustness of the air transport network
the ATN can benefit from the results of extant research on complex networks. This literaturehas defined generic models for real networks, such as Erdos-Rényi random (RN) graphs [92],Watts-Strogatz small-world (SW) network [72] or Barabási-Albert scale-free (SF) networks [91].
Extant research has examined the reliability facing errors and attacks (i. e., the ability ofa system or component to perform its required functions under stated conditions) not onlyof complex network models, but also of real networks. Tolerance to static errors is definedas the capacity of the system to maintain its connectivity following some random nodeisolation (i. e., disconnection of all connections to a particular node) or link disconnection.On the other hand, in an attack isolation process is directed at a particular class of nodes orlinks, for example, well connected nodes.
Numerical simulations [25, 26] as well as a number of analytical approaches have beenproposed [95, 96, 97, 98] to study tolerance to errors and attacks in complex networks. Sev-eral studies [45, 107] have investigated how some network properties such as size of giantcomponent, clustering coefficient C, average shortest path length L and global efficiency Eare affected when a fraction f of the nodes is isolated.
In homogeneous networks, such as in the RN model, there is no significant differencein the behavior of the network as to whether the nodes are selected randomly or accord-ing to a preference criterion (e. g., degree or betweenness centrality). But in heterogeneousnetworks, such as the SF model, network properties deteriorate dramatically when theyare subjected to attacks [107]. The fraction of the nodes to be disconnected in an attackto observe a significant network disruption can vary according to the preference criterionadopted in network isolation. In air transportation, [47] and [57] used robustness analysisas in their application of the genetic algorithm to optimize an airline’s route network. [50]made a more detailed study of jamming transition phenomena in the European route net-work. More recently, [108] measured the weighted network robustness of Virgin Americaby computing the algebraic connectivity.
As the global ATN is a SF network with SW property [21], it can be possible to altereffectively its connectivity properties with the isolation of a reduced fraction of airports.In this study, the effectiveness of several criteria of node selection to attack effectively theATN will be assessed. The criteria of selection can be defined in terms of decreasing orderof several measures of centrality (degree, betweenness or Bonacich power), or with alternativestrategies based on the assessment of the critical damage caused by the disconnection of anode [76] or by node parameters obtained through modal analysis [19]. Such analysis canreveal the airports whose isolation would affect ATN connectivity. Following this a debatewould ensue about whether these airports should have greater controls or if their routevolumes should be relaxed in order to alleviate the inherent risk.
2.3 methods
The static robustness of the ATN under attacks will be analyzed isolating airports usingan adaptive strategy. First, the airport to be isolated is the one with the highest value of
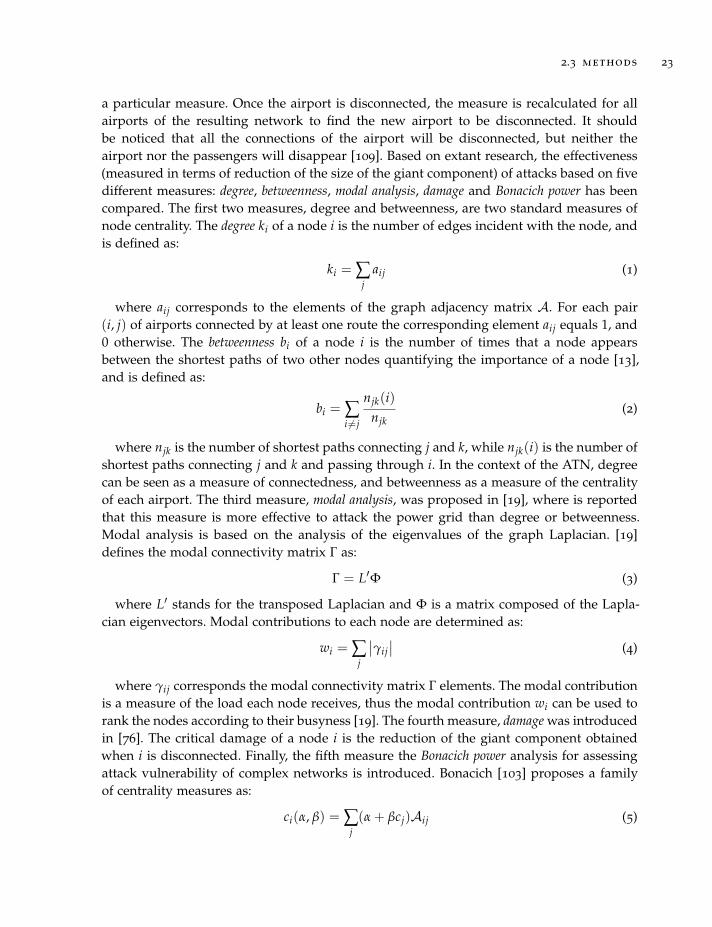
2.3 methods 23
a particular measure. Once the airport is disconnected, the measure is recalculated for allairports of the resulting network to find the new airport to be disconnected. It shouldbe noticed that all the connections of the airport will be disconnected, but neither theairport nor the passengers will disappear [109]. Based on extant research, the effectiveness(measured in terms of reduction of the size of the giant component) of attacks based on fivedifferent measures: degree, betweenness, modal analysis, damage and Bonacich power has beencompared. The first two measures, degree and betweenness, are two standard measures ofnode centrality. The degree ki of a node i is the number of edges incident with the node, andis defined as:
ki = ∑j
aij (1)
where aij corresponds to the elements of the graph adjacency matrix A. For each pair(i, j) of airports connected by at least one route the corresponding element aij equals 1, and0 otherwise. The betweenness bi of a node i is the number of times that a node appearsbetween the shortest paths of two other nodes quantifying the importance of a node [13],and is defined as:
bi = ∑i 6=j
njk(i)njk
(2)
where njk is the number of shortest paths connecting j and k, while njk(i) is the number ofshortest paths connecting j and k and passing through i. In the context of the ATN, degreecan be seen as a measure of connectedness, and betweenness as a measure of the centralityof each airport. The third measure, modal analysis, was proposed in [19], where is reportedthat this measure is more effective to attack the power grid than degree or betweenness.Modal analysis is based on the analysis of the eigenvalues of the graph Laplacian. [19]defines the modal connectivity matrix Γ as:
Γ = L′Φ (3)
where L′ stands for the transposed Laplacian and Φ is a matrix composed of the Lapla-cian eigenvectors. Modal contributions to each node are determined as:
wi = ∑j
∣∣γij∣∣ (4)
where γij corresponds the modal connectivity matrix Γ elements. The modal contributionis a measure of the load each node receives, thus the modal contribution wi can be used torank the nodes according to their busyness [19]. The fourth measure, damage was introducedin [76]. The critical damage of a node i is the reduction of the giant component obtainedwhen i is disconnected. Finally, the fifth measure the Bonacich power analysis for assessingattack vulnerability of complex networks is introduced. Bonacich [103] proposes a familyof centrality measures as:
ci(α, β) = ∑j(α + βcj)Aij (5)
24 l1 : robustness of the air transport network
where A is the adjacency matrix. α is a scaling constant and β reflects the effects of thecentrality of its neighbors on a node’s centrality. Considering λ as theA’s largest eigenvalue,when |β| < 1/λ = κ, the matrix solution to 5 is:
c(α, β) = α(I − βA)−1A1 (6)
where I is an identity matrix and "1" is a column vector of ones. This family of measuresallows us to analyze two types of network status just varying the parameter β that reflectshow the status of a node is affected by the status of its neighbors [103]. On the one hand, foraccess to information, popularity, or social status this effect would be positive, sometimesnamed as collaborative networks. For β = +κ the measure is the same as the eigenvectorcentrality. On the other hand, for networks with a power-dependence orientation, havingweak neighbors with no alternative exchange partners is a source of power [110], sometimesnamed competitive networks. Knowing that the ATN is a power-dependence network, it hasbeen considered the Bonacich power of the network for β = −κ.
2.4 the global network of airports
The global ATN has been analyzed in [20, 21], where the nodes are the cities with airports,and two cities are connected if at least one non-stop commercial airline route betweenthem exists. It had been found that ATN defined in that way is a SF network with SWproperty, i. e. a low average path length and a high clustering coefficient. The ATN had alsoa multi-community structure, whose emergence can be explained in terms of geographicaland geopolitical factors. The network properties of the ATN make it resilient to errors, butspecially vulnerable to intentional attacks.
Attacks to the global network of airports will be simulated in this work. Airports are con-sidered as nodes rather than cities, given that airports are the likely target of an intentionalattack. To define the network, all connections between airports from November 2011 toNovember 2012 have been retained from the SRS database complied by IATA. This leads toa network of N = 3, 712 airports, with 24, 848 connections between them. As the vast major-ity of connections are reciprocal, the airport ATN is treated as an undirected network [21].It has been also considered as an unweighted network because the purpose of this studyis to assess the effect of a total disconnection of an airport from the global network. Thisnetwork has an average shortest path length of L = 3.94, and a clustering coefficient ofC = 0.64. These values are of the same order as the ones obtained by [21] for the cities ATNin 2000. So the airport ATN 2012 like the cities ATN in 2000, has a low value of L havingthe SW property, together with a high value of C.
In Figure 2.1 are depicted the degree and betweenness cumulative distributions of theATN. The degree distribution (i. e., the probability that the degree of a given node hasvalue k) follows a truncated power-law distribution, similar to the distribution reportedin [21] for the network of cities. The betweenness distribution has a starker truncation than

2.5 results 25
Figure 2.1: ATN degree (k) and betweenness (b) cumulative distributions
k
P(k
)cum
10−3
10−2
10−1
100
100 101 102
●●
●●
●●
● ●●●●●●●●●●●●●●●●●●●●●●●●●●●●●●●●●●●●●●●●●●●●●●●●●●●●●●●●●●●●●●●●●●●●●●●●●●●●●●●●●●●●●●●●●●●●●●●●●●●●●●●●●●●●●●●●●●●●●●●●●●●●●●●●●●●●●●●●●●●●●●●
●●
●
●
●
bP
(b)c
um
10−3
10−2
10−1
100
10−9 10−8 10−7 10−6 10−5 10−4 10−3 10−2 10−1 100
● ●●●●●●●●●●●●●●●●●●●●●●●●●●●●●●●●●●●●●●●●●●●●●●●●●●●●●●●●●●●●●●●●●●●●●●●●●●●●●●●●●●●●●●●●●●●●●●●●●●●●●●●●●●●●●●●●●●●●●●●●●●●●●●●●●●●●●●●●●●●●●●●●●●●●●●●●●●●●●●●●●●●●●●●●●●●●●●●●●●●●●●●●●●●●●●●●●●●●●●●●●●●●●●●●●●●●●●●●●●●●●●●●●●●●●●●●●●●●●●●●●●●●●●●●●●●●●●●●●●●●●●●●●●●●●●●●●●●●●●●●●●●●●●●●●●●●●●●●●●●●●●●●●●●●●●●●●●●●●●●●●●●●●●●●●●●●●●●●●●●●●●●●●●●●●●●●●●●●●●●●●●●●●●●●●●●●●●●●●●●●●●●●●●●●●●●●●●●●●●●●●●●●●●●●●●●●●●●●●●●●●●●●●●●●●●●●●●●●●●●●●●●●●●●●●●●●●●●●●●●●●●●●●●●●●●●●●●●●●●●●●●●●●●●●●●●●●●●●●●●●●●●●●●●●●●●●●●●●●●●●●●●●●●●●●●●●●●●●●●●●●●●●●●●●●●●●●●●●●●●●●●●●●●●●●●●●●●●●●●●●●●●●●●●●●●●●●●●●●●●●●●●●●●●●●●●●●●●●●●●●●●●●●●●●●●●●●●●●●●●●●●●●●●●●●●●●●●●●●●●●●●●●●●●●●●●●●●●●●●●●●●●●●●●●●●●●●●●●●●●●●●●●●●●●●●●●●●●●●●●●●●●●●●●●●●●●●●●●●●●●●●●●●●●●●●●●●●●●●●●●●●●●●●●●●●●●●●●●●●●●●●●●●●●●●●●●●●●●●●●●●●●●●●●●●●●●●●●●●●●●●●●●●●●●●●●●●●●●●●●●●●●●●●●●●●●●●●●●●●●●●●●●●●●●●●●●●●●●●●●●●●●●●●●●●●●●●●●●●●●●●●●●●●●●●●●●●●●●●●●●●●●●●●●●●●●●●●●●●●●●●●●●●●●●●●●●●●●●●●●●●●●●●●●●●●●●●●●●●●●●●●●●●●●●●●●●●●●●●●●●●●●●●●●●●●●●●●●●●●●●●●●●●●●●●●●●●●●●●●●●●●●●●●●●●●●●●●●●●●●●●●●●●●●●●●●●●●●●●●●●●●●●●●●●●●●●●●●●●●●●●●●●●●●●●●●●●●●●●●●●●●●●●●●●●●●●●●●●●●●●●●●●●●●●●●●●●●●●●●●●●●●●●●●●●●●●●●●●●●●●●●●●●●●●●●●●●●●●●●●●●●●●●●●●●●●●●●●●●●●●●●●●●●●●●●●●●●●●●●●●●●●●●●●●●●●●●●●●●●●●●●●●●●●●●●●●●●●●●●●●●●●●●●●●●●●●●●●●●●●●●●●●●●●●●●●●●●●●●●●●●●●●●●●●●●●●●●●●●●●●●●●●●●●●●●●●●●●●●●●●●●●●●●●●●●●●●●●●●●●●●●●●●●●●●●●●●●●●●●●●●●●●●●●●●●●●●●●●●●●●●●●●●●●●●●●●●●●●●●●●●●●●●●●●●●●●●●●●●●●●●●●●●●●●●●●●●●●●●●●●●●●●●●●●●●●●●●●●●●●●●●●●●●●●●●●●●●●●●●●●●●●●●●●●●●●●●●●●●●●●●●●●●●●●●●●●●●●●●●●●●●●●●●●●●●●●●●●●●●●●●●●●●●●●●●●●●●●●●●●●●●●●●●●●●●●●●●●●●●●●●●●●●●●●●●●●●●●●●●●●●●●●●●●●●●●●●●●●●●●●●●●●●●●●●●●●●●●●●●●●●●●●●●●●●●●●●●●●●●●●●●●●●●●●●●●●●●●●●●●●●●●●●●●●●●●●●●●●●●●●●●●●●●●●●●●●●●●●●●●●●●●●●●●●●●●●●●●●●●●●●●●●●●●●●●●●●●●●●●●●●●●●●●●●●●●●●●●●●●●●●●●●●●●●●●●●●●●●●●●●●●●●●●●●●●●●●●●●●●●●●●●●●●●●●●●●●●●●●●●●●●●●●●●●●●●●●
●
●
the one reported in the network of cities, revealing the existence of a small subset of airportswith anomalously large values of betweenness centrality.
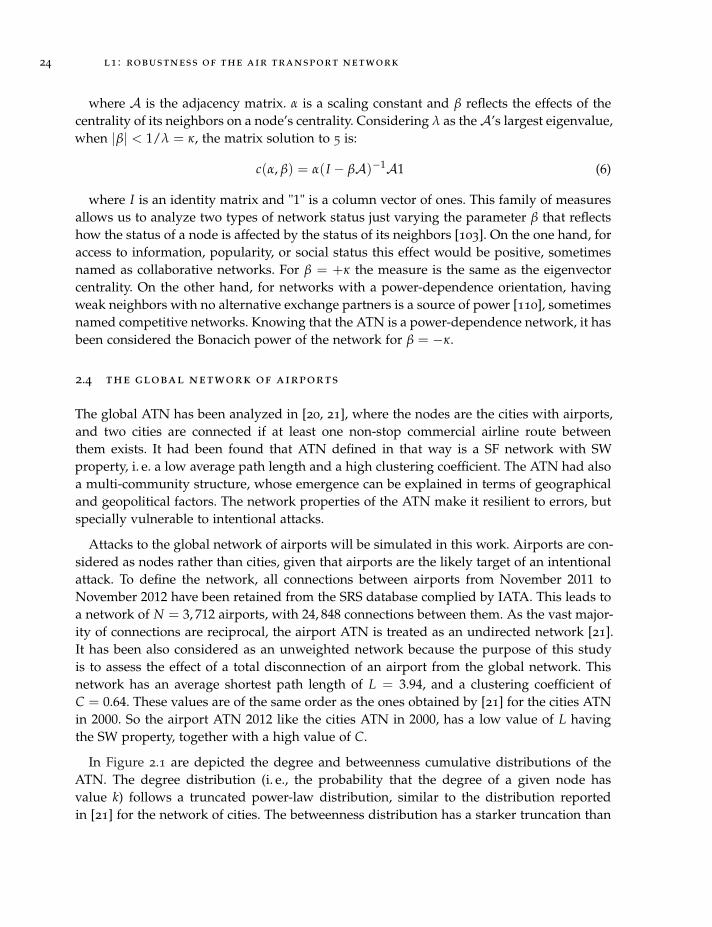
Figure 2.2 shows the existence of nodes with high values of betweenness (i. e., centralnodes) and with low values of degree (i. e., low-connected nodes). This phenomenon is evenmore evident if Bonacich centrality is used as a measure of connectedness, and Bonacichpower as a measure of centrality. This is a distinctive feature of the ATN, and a resultof the socioeconomic, geopolitical [21] and operational factors that have determined ATNevolution. That fact shows that ATN has a multicommunity structure, with communitiesdefined on the grounds of geographical and geopolitical constraints [21].
2.5 results
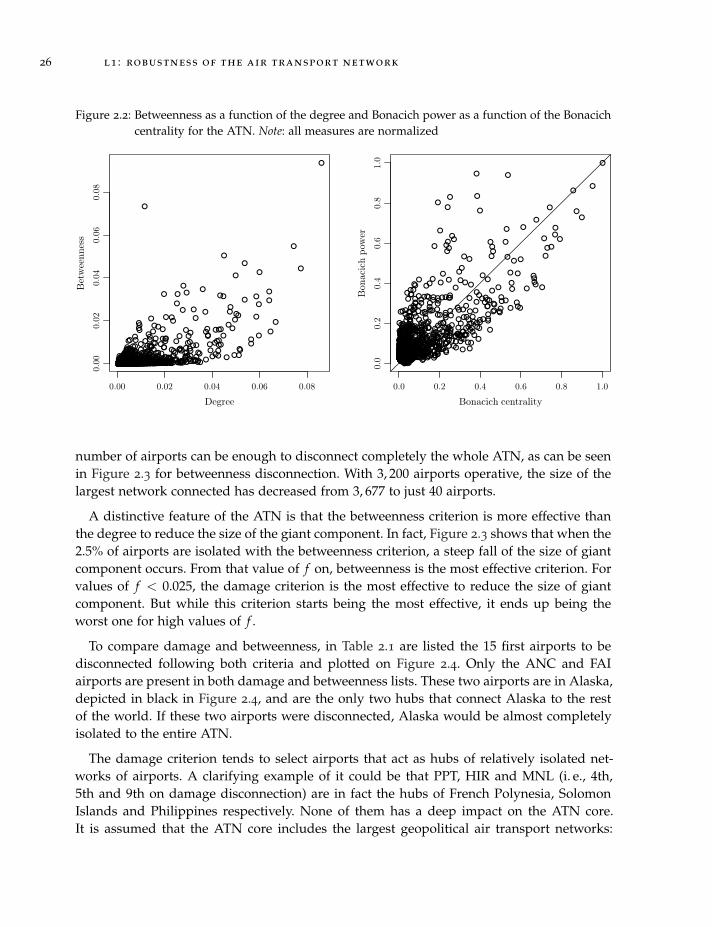
Figure 2.3 shows the variation of the size of the giant component of the ATN as a functionof the number of airports isolated for the network for each criterion (it is also provided the% of the global network that represents the global airports). It has also been assessed thebehavior of the ATN when suffering errors, i. e. random isolation of airports. A simulationof the behavior of the ATN facing errors has been run 5, 000 times, and in Figure 2.3 itis also reported the average size of the giant component as a function of the number ofairports isolated.
Unsurprisingly, taking into account the degree distribution reported in Figure 2.1, theATN is much more resilient to errors than it is to attacks. The random isolation of the13% of airports of the network reduces the size of the giant component by 22%. The same
26 l1 : robustness of the air transport network
Figure 2.2: Betweenness as a function of the degree and Bonacich power as a function of the Bonacichcentrality for the ATN. Note: all measures are normalized
●● ●● ●●●●●●●●●●● ●●●●●
●●●
●
●● ●●●
●●●●●●●●●●● ● ●
●
●●●●●
●●
●●●●●●
●
●●●●●●
●●●●● ●●●●●●●
●●●●●● ●●● ●●●●●● ●●●●●●●● ●●
●
●
●●●●●●●
● ●●
●
●●● ●●● ●●● ●●●●●
●
●
●
●●
●
●●●● ●●●●● ●●●●●●●●●●●●●●●●●●
●●●
●
●●● ●●●●●●●● ●●●●●●●
●
●
●
● ●●●●●●
●●
●
●●● ●●●●● ●●●●●● ●●●●●●●●●●● ●●●●●●● ●●●● ●●●●● ●●●● ●●●● ●
●
●●●●● ●●●● ●●● ●● ●● ●●
●
●● ●●●●●●● ●●●●●
●●
●● ● ●● ●●●●●● ●●●●●●●●
●● ●●●●
●
● ●●●●●●●● ●●●● ●● ●●● ●●
●
●●
●●●●●●●●● ● ●●
● ●●●●●●●● ●●
●
●●●●●●●● ●
●
●● ●
●
●●
●
●●● ●●●●●●●●● ●● ●● ●●●● ●● ●● ●
●
●●
●
●●●● ●●●●● ●●●●●● ●●●●●● ●●●●● ●●●● ●● ●●●●●●●●●
● ●●●●●●●●
●
●●●●●●●● ●●
●
● ●●
●
●●●●●● ●●●●●● ●● ●● ●●●●●
●●
●●●
●
●
●●●
●● ●●● ●●●●●●● ●●●●●● ●●●
● ●●
●
●●● ●●●●●
●● ●● ●●●●● ●● ●●●●●●●●●●●● ●●●●●●●
●●
●●● ●●●
●●●●
●
●
● ●●
●
● ●● ●●
●
●●●●●
●●●●
●
●●● ●●● ●●●●●●
●
●●●●
●●● ●● ● ●●●●●●●●● ●● ●●●●●
●●●
●
●● ●●●
●
● ●●● ●●●●●●●●
● ●●●●●●●●●●●●●●●● ●●●●● ●●●
●●●
●
●●●● ●●●●● ● ●●●●●●●●●●●●
●
●
●
●
●●●●●●●●●●●●●●●●●●●● ●●
●●● ●● ●●●●● ●●●●●●
●
●●●●●●●●●●
●
●●●●●●●
●
●●●●● ●●●
●
●● ● ●● ●
●
●
●● ●
●
●● ●●
●
●● ●●●●●●●●●●● ●●●● ●● ●●●●
●●●● ●●●●●●●● ●●●●●●●●●●●● ●●●●●● ●●●●●●●●●● ●●●●● ●●●●●●●● ●●●●●●●●● ●●●●●●● ●●●●●
●
● ●●●●
●
●●●●
●
●●●●●●● ●●●
●
● ● ●●● ●●●
●● ●●●●●●●
●
●● ●●● ●● ●●● ●●●●● ●●● ●●
●
●● ●●● ●● ●●●● ●● ●● ●●●●
●●●● ●●●●●●●
●●● ●●●●●●● ●● ●●● ● ●●●● ●●●●●●●●●●●●●●●●●●●●●
●
●●●●●●●●
●
●●●●●●●●●●● ●●●● ●●●●●● ●●
●●●●● ●●● ●●●●●●●●● ●●●
●
●● ●● ●●● ●●●●●●●●● ●● ●● ●●
●●●●●●●●
●●● ●●●●●●●●● ● ●● ●●
●●●
●
● ●●●●●●● ●●●●●●●●●
●
●●●●●●● ●●●●●● ●●●● ●●
●
●●●●
●
●●●
● ●●●●● ●●●● ●●●
●
●
●
●●●●●● ●●●●●●●● ●●●●● ●●
● ●● ●●●●●●●●●●●●●●●●●●●●●●●●●●●● ●●●●●●●
●
●
●
●●●●●●●● ●●
●
●● ● ●● ●●●●●●●●● ●●●●
●●●
●●●●●●●●●●●● ● ●●●● ●● ●●● ●●●●●●●●●●●●●●●●●●●● ●
●●●●
●
●●● ●●●●●●●●●●● ●●●●●●●●●●●●●●●●● ●●●
●●●●●●●●●●●
●
●● ●
●
●●●●●●●●●●● ●●●●●●●●● ●●●●●●●● ●●●
●
●●●
●
●●●●●●●●●●●●●●● ●●●●●● ●●●●●●●●●●●●●●●●●●●●●●●
● ●
●●●●●● ●●●●●●●●●●●●●●●●●
●●
●●●●●●●●●●● ●●●●● ●● ●●●●● ●
●
●●●
●●● ●●● ●●●● ●
●●
●●●●●●●●●●●●●●●● ●●●●● ●●●
●
●●●●●●●●●●●●● ●●● ●
●●●●●● ●●●●●●●●●●● ●●●●● ●●
●
●●●●●●●●●●●●●●●●●●●●●
●●
●● ● ●●● ●●●
●
● ●●●●●● ●●●●●●●●
●●●●
●● ●●●●●●●●●●● ●●●
●
●●●●●●●
●
●●
●
●●● ●●●●●●●●● ● ●●●● ●●●●● ●● ●●●●●●●●●●
●
● ● ●●●●● ●●● ● ●●●●●●●●●
●
●●
●
●●● ●
●
●●
●
●● ●●●●●●● ●●●●●●●●●●●●●●●●●●●●●●● ●●●●●● ●
●●●
●●● ●●●●●●●●● ●●●●●●●●●●●●●●●●●● ●●●●● ●●●●●
●●●●●● ●●●●●● ●●●● ●● ●● ●●● ●● ●●●●
● ●●●●●
●
●
●● ●●
●●
●●
●●●●●●
●
●
●●●●● ●●●
●
● ●●● ●●●● ●●●
●
● ●● ●●●●●
●●●
●
●●
●
●
●● ●●● ●● ●●●●●●●●
●●●●●● ●●
●
●●●● ●●●●●●●●● ●● ●● ●●●●●●●●●●● ●●
●
●●●●●●●●●●●●●●●●● ●●● ●●●●●●
●
●●●●●●●●●●●
●●●●● ●●●●●●●●●●●●●●●●●
●●●●●●●● ●●
●
●●● ●● ●●●●●●●● ●●●
●
●●●●●●●●● ●●●●●●●●●
●●●
●
●●●●●●● ●● ●●●●
●
●●●●●●● ●●●● ●●●●
●
● ●●
●
●●● ●● ●
●
●●●
●●●●●●● ●●●●● ●● ●● ●●●●●● ●●● ●●●●●●●●●●●● ●●●●● ●●● ●●
●●●●●● ●●●● ●
●
●● ●●●● ●●●●●●●● ●●●●● ●●●●● ●●●●● ●●●●●● ●●●●●●●●● ●●●●●
●●●●●●●●● ●●●●●● ●●●●●● ●●
●
●● ●●●●● ●● ●●●●●●●
●
●●● ●●●●
●
●●●
●
● ●●●●●●●●
●
●●●●●
●●●●●●●●●●
●●● ●●●●●●●● ●●●●●●●●●●●● ●●●●●
●
●● ●●●
●
● ●
●
●●● ●●●● ●●● ●●●●●●●●●●●●
●
●●●
●
●● ●●● ●●●●● ●●●●●●●●●●
●●●● ●●●●●●●●●●●●●●●●
●
● ●●● ●●●●●● ●●●●● ●●●●●
●
●●
●
●● ● ●●●●●●●●●●
●
●●●●●●●●●
●● ●● ●●●●●●● ●●●●●●● ●●
●
●●
●
●● ●●● ●●● ●
●
● ● ●●● ●●●●●●●●●●●●●●●●●●●●●●●●●●●● ●● ●●●●●●●●●●●●●●●●●●●● ●● ●●●● ●●● ●●●●●●●● ●
●
●●● ●●● ●●●●● ●●●● ●●●●● ●●
● ●●●● ●●● ●●●●●●● ●● ●●●●●●●●●●● ●● ●●●●●●●● ●●●● ●●●●
●
●●●
●●●●●● ●●●●● ●● ●●●●●● ●● ●● ●●●
●●●●●●●●●●
●
●● ●●● ●● ●●●●● ●● ●●●●● ●●●●●
●
● ●● ●●●
●
●
●●
●
● ●● ●●
●
●●●● ●●●● ●●●●
●●●●●●●●●● ●●●
●
●●● ●●●● ●●●
●
●●●
●●●●● ●● ●●●● ●●●●●●
●
●●●●●●●●●●●●●● ●●●●●●●● ●● ●●●● ●●●●● ●●●●
●
● ●●●● ●●●●●●● ●●●●● ●● ●●
●● ●●●●●●
●●
●●● ●●●●●
●●●●●●
●●●●●● ●●●●
●
● ●●●●
●●●● ● ●●●●
●●
●
●● ●● ●●●●● ● ●●●●●●●●●●● ●●
●●●●●●●●●●● ●●●● ●●●●●●●●●●●●●●●● ●●●●●● ● ●● ●●●● ●●●● ●●●●●●●●
●
●● ●●●●● ●●●●
●●● ●●●●●
●●●●●●●●●●● ●●● ●●●●
●● ●●
●●
●
●●●●●●● ●●●●●●● ●●● ●●●●●
●
●● ●●●●●●●
●
● ●●
●
●●● ●●●●
● ●●●● ●● ●● ●●●● ● ●● ●● ●●
●●●●●●●●●●●●●●● ● ●●●● ●●●●●●●●●●●●●
●
●●● ●● ●●●●●
●●●●●●● ●●●●●● ●● ●●●●●
●
●●●●●●●●●●●
●
●●●●●●●●●●●●
●●
●
●●●●●●●●●●●●●●●● ●●
●●●● ●●●●●● ●●●●●● ●● ●●●
●●●●●●●●●●●●●●●●●●●●●
●
●●●●● ●●
●
● ●●●
●
●●●●●● ●●● ●●●●●●●●●●
●●● ●●●●●●
●● ●●●●
●●
●●●●●●●●●
●●●●
● ●●●●●●●
●●●●●● ●●●● ●●●●●●●●●●● ●●●● ●●●●●●● ●●●● ●●●●●●●●●●●●●●●●●●●
●
●●●● ●● ● ●●● ●●●●● ●●●●●●●●●●●●●●●●●●●●●●●●●●●●●● ●●●●●●●
●
●●●●●
●
●
●●●●●●●●●●●●●●●●●●●●●●●●●●●●●●
●●●
●
●● ●●●●● ●●●●●●●●●
●●●●●● ●●●●●●●●●●●●●● ●●●●● ●●●●●●●●●
●
●●●●●●●●●●●●
●
●
●●●●●● ●●● ●
●
●●●●●●●●● ●●●●●●●●●●●
●●●●●● ●●●
●
●●●●●●●●●●
●
●
●
●●
●
●●●●●●●●
●
●●●
●●●●●●●●
●
●●●●● ●●●
●●
●●
●
●
●●●●●
●
●●● ● ●●●●●
● ●●●●●●●●●●●●●●●●● ●●●●●●●●●● ●●●●● ●
●
●●●●●● ●●● ●●●●●●●
0.00 0.02 0.04 0.06 0.08
0.00
0.02
0.04
0.06
0.08
Degree
Bet
wee
nnes
s
● ● ●●
●
●●●●●●●● ●●
●
●●●
●
●●●
●
●●
●
●
●
●
●●●
●●●●●●●
●
●
●
●
●●●●
●●
●●●●●●
●●
●●●●●●●●●●
●
●●●●●
●
●●
●●●●●●
●
●
●●●●●
●
●●●●●●● ●●
●
●
●●●●●●
●
●
●
●
●
●●● ●●●
●●●
●
●●
●
●
●
●
●
●●●
●●●●
●
●●●●
●● ●●●●●●●●●●●
●●●●●●●
●
●
●●● ●●●
●●●●●
●
●●●●●●
●
●
●
●●
●●●●
●●●
●
●●●
●
●●●● ●●●●●
●
●●●●●●●●●●●
●
●
●●●
●●
●
●●●●
●●●●●
●●●
●
●●●●
●
●●●●
● ●●
●●
●
●●
●
●
●
●
●
●
●
●●
●
●●●●
●●
●
●●●●
●
●
●
●
●
●
●
●
●●●●● ●●●●●●●●
●
● ●●●●●●
●●●
●●●●●
●●●●
●
●●●
●●
●
●
●
●
●●●●●●●●
●
●
●
●
●
●
●●
●●●●●
●
●
●
●●●
●●●●●
●
●
●
●
●
●
●
●
●
●●●
●●
●●●●●●●
●
●●
●
●●
●●
●
●●
●
●
●
●●
●
●●●●
●
● ●●●
●
●●●●●
●●● ●●●
●
●●●● ●●●●
●
●●
●●●●●●●
●
●●●●●●●●●
●●●●●●
●●
●
●
●
●
● ●●
●
●●●●●●
●●●●●●
●● ●●
●
●●●●
●●
●●●●
●
●●
●
●● ●●●
●
●●●●●●●
●●●●●
●
●
●
●
●
●
●
●
●
●
●
●●
●
●
●●
●
● ●●●●●
●
●●
●●●●●●●●●●●
●●●●●●
●
●
●
●●●
●●
●
●●●
●
●
●
●●
●
●
●●●
●●
●
●●● ●
●
●●●●
●
●
●●
●●
●
●
●●●●●
●
●●●
●
●●●
●
●●
●
●●●●●
●● ●
●
●
●
●●●●●●
●
●
●●
●●●
●
●
●
●●
●
●●●●●●
●
●
●
●●●●●●●●●●●●●●●
●
●●●●
●
●
●●●
●●
●●●● ●●●●●
●
●
●●●●●●●●●●●
●
●
●
●
●●●●●●●●●●●●●●●●●● ●●
●●
●
●●
●●
●
●●●
●
●
●●●●●
●
●●
●●● ●●●●●
●
●●●
●●●●
●
●●●●●
●
●●
●●
●●
●
●
●
●
●
●●
●
●
●●
●
●
●
●
●
●
●●●●●● ●●● ●
●●●●
●●
●●●
●
●●●●●●
●
●●●●●
●
●●●●●●●●●●●●●●●●●
●
●●●●●●●●●
●●●●●
●
●●●●●● ●
●
●●●●●
●●●
●●●●●●●
●
●●●●
●
●
●
●●●
●
●● ●●
●
●
●●●
●●●●●
●
●
●●
●
●●●
●
●
●●
●
●●●●●●
●
●
● ●●●
●
●●●
●
●
●●●●
●
●●
●●
●
●●
●●●
●
●
●
●●●●
●●●
●
●●
●
●●●●●●●●●●●●●●
●●●●●●●
●● ●●●
● ●
●●●●●●●●●●●●●●●●●●●●●●● ●
●
●●●●●●●●
●
●●●●●●●●●●●
●
●●● ●●
●●●● ●● ●
●
●●●
●
●● ●●●●●●●●●
●
●●
●
●● ●●
●●
●●●●●●●●●
● ●●
●
● ●
●
●●● ●●●
●
●
●●●
●
●●
●
●●
●●●
●
●
●
●
●
●● ●
●
●
●
●●●●●●●●
●●
●●●●●
●
●
●
●
●
●●●
●
●●●●●
●
●●●●
●
●
●●●●
●
●●
●
●
●
●●●●
●
●●●
●
●●
●
●
●
●●●●●●
●●●●●●●●
●
●●●●
●
●
●
●
● ●●●●●●●
●
●●●●●●●●●●●●●●●●●●●●
●
●●●●●●
●
●
●
●●●● ●●●●
●
●
●
●●
● ●
●
●
●●●●●●●●
●
●●
●
●●
●
●●●●●●●●●●●●
●●
●●●●● ●
●●
●●●●●●●●●●●●●●●●●●●●
●
●●●●
●
●●●
●
●●● ●●●●●●●
●●●●●●●●●●●●●●
●
●
●●●
●●●●●●●
●●●●●
●
●●
●
●
●●●●●●●●●●●
●●●●●●●●●
●●●●
●●●●●●●
●
●●●
●
●● ●●●●●●●●●●●
●● ●●●●●● ●●●
●●●●●●●●●●●●● ●●●●●●●
●
●
● ●●●●●
●
●●●●●●●●●●●●●●●●
●●●●●●
●●●●●●●●
●●●●
●
●
●
●●●●
●
●
●
●
●
●●●●●
●●
●●● ●
●●
●●●●●●●●●●●●●●●●
●● ●●● ●●●
●
●●●●●●●●●●●●●
●●●●
●●●●●●●
●●●●●●●●●●
●
●●●●
●
●
●
●● ●●●
●●●
●●●●●●●●●●●●●
●
●
●●●
●
●●
●
●●
●
●
●
●●●●●
●●●
●●●●●
●
●●
●
●●
●
●●●●● ●●●●●
●
●●
●
●●●
●●●●
●
●●
●
●
●●
●
●●●●●●●●
●
●
●●●
●●●●●
●
●●
●●●●● ●●●●
●
● ●
●
●●●●
●●●
●
●
● ●
●●●●●●
●
●
●
●
●
●●
●
●
●
●
●
●
● ●●●●●●●
●
●●●●●
●●●●●●
●●●●●●●●●●●
●
●●●●●●
●
●
●
●●●
●
● ●●●●●●● ●●●●●●●●●
●●●●●●●●●
●
●●●●●
●●●
●
●●●●●●
●
●●●●●
●●●●●
●●●
●●●●
●●●
●
●
●●●●●
●
●
●
●●
●
●●●
●
●
●●●●●
●●
●
●●●●●
●
●●
●
●
●
●●●●
●●
●
●●
●
●●●
●
●
●●
●
●●
●
●●
●
●
●
●●
●
●●●●
●
●
●●●●●
●
●●●●●● ●●
●
●●●● ●●●●●
●●●● ●●
●●
●
●●●●●●●●●●
●
●
●●
●
●●● ●●●●
● ●●●●●●● ●●●
●
●●●●●
●
●●●●●
●●●●●●
●●●●●
●●
●●
●●●●●
●●
●●●●
●
●●
●●●●●●● ●●
●
●
●●
●
●●
●●
●●●●●
●
●●
●
●●●●●●●
●●
●
●●●●
●●●●●●●
●
●●●●●●●●
●
●
●●●
●
●●●●●●● ●●●●
●
●●●
●
●
●
●
●
●
●●
●
●
●
●
●●
●
●
●●●●●
●●●
●●●
●
●
●
●●
●●●●●
●●
●
●
●●●●●●●●●●●
●
●●●● ●●●
●●●●
●●
●
●●
● ●●
●●
●●●●
●●
●
●●●●●●●
●
●●●● ●●●●●
●●●●●
●
●●●●●
●
●●●●●●●●●
●●●
●
●●●●●●●●●
●
●●●●●
●
●●●●● ●●
●
●●
●
●●●●●●
●
●
●
●●●●
●
●●●
●●
●●
●
●●●
●
●
●● ●
●●●●
●
●●●●●
●
●●●●
●●●●●
●●
●●
●●●●●●●●
●●●
●●●●●●●●●
●●●●●
●
● ●●●●
●
●
●
●
●●●
●
●●●
●
●●
●
●●●●●●●●●
●●
●
●●●
●
●●
●
●●
●
●●● ● ●●●●●●●●●
●●●●●●●●●●●● ●
●
●
●●●●● ●
●
●
●
●●
●
●●●●
● ●●●
●●
●●
●●●
●
●●
●
●●
●●
●●●●●●●●●
●
●●●●●●●●
●
●●
●
●
●
●●●●●●●●
●●●●●
●
●
●
● ●
●
●●
●
●● ●●●●
●
●●
●
●● ●●● ●●●●●●●●●●●●●●● ●●●●●●●
●
●●
●
●
●
●
●
●●●●●●●●●●●●●●●●●
●●
●
●●
●●
●●
●●●●●●●●
●
●
●●●
●
●● ●●●●●
●
●●● ●
●●●●
●●
● ●●●●●●
●
●
●●●●●●●●●
●●
●●●●●●●●
●
●
●●●●●●●●
●
●●●
●
●●●
●
●●
●
●●●●●●
●
●●●●
●
● ●●●●●●
●
●
●
●●
●
●
●●
●●●● ●●●●
●
● ●
●●
●●
●●
●●●●
●●●
●●●●
●
●
●
●●
●
● ●●●
●
●
●●●●
●
●
●
●●●
●
●●●●
●
●●●
●
●●
●
●●●●●●●●●●
●
●●
●
●
●●
●●
●●●●●
●
●
●
●●
●● ●●
●●
●
●●●
●●●●●●
●
●●●●●●●●
●●●
●●●
●●●●●●
●●
●●
●●●●
●●●●●
●●●●
●
●
●
●●● ●●●●
●●●
●
●●●
● ●●●●
●
●
●
●●●●●
●
●
●
●
●●●
●●
●
●
●
●●●●●
●●●●
●
●
●●●
●
●
●
●●
●
●
●●●
●
●
●●
●
●●
●
●●
●
●
●
●
●
●
●
●
●
●●●●●
●●●●●
●
●
●
●●●●●●●●●●
●
●●●
●
●●●●● ●●●●●●●●●●
●●●●●●
●
●
● ●●●●●●
●●●●●●
●●●●
●
●●
●
●●●●
●
●●
●
●●● ●●●●
●
●●●●●●●●●●●
●●●
●●●●
●
●●
●
●
●
●
●●●●●●● ●●●●●●●
●
●● ●●●●●
●
●● ●●●●●●●
●
●
●
●
●
●●●
●
●●
●
●
●
●●
●
●
●
●●
●
●●
● ●
●
●
●
●
●
●
●
●●●●●●●●●● ●●●●
●
●
●●● ●●●
●●●●●●●●●●
●
●●●
●
● ●
●●●
●●●●●●●●
●
●●●●●
●
● ●●●●●
●
●●●●●●●●●●●
●
●●●●
●●●
●●●●
●
●●
●
●●●●●●
●●●●●●●●●●
●●
●●●●
●●●●●●●
●●●●●
●●
●
●
●
●● ●●●●●●●●●●●●
●●● ●●●●
●
●●●● ●
●
●
●
●
●
●●
●
●●●●●●
●
●● ●●●●●●●●●
●
●●●
●
●●●●
●
●●
●
●●●
● ●
●● ●●●●●●
●
●●●
●
●
●
●●●●●
●
●●●●●●
●
●●●
●
●●●●●●●●●●
●
●●●
●
●●●●●●
●
●●●
●
●●●●●●●●●●●● ●●●●●●
●
●●●●
●
●●
●
●● ●●●●●●
●●●●●●●●●●●●●●●●●●●●●●●●●●●●●
●●●●●●●
●
●●●●
●
●
●
●●●●●●●●●●●●●●●●●●●●●●●●●●●●●●●●●
●
●●●
●●●●●●●●●●●●
●
●●●●●●
●●●●●●●●
●●
●●●●●●●●●
●
●●●●●●●●
●
●●●●●●●●●●●●●
●
●●●●●●●●●●
●
●●●●●●●●●
●●●●●●●●●●●
●
●●●●●
●
●●
●
●●●●●●●●●●●●
●
●●
●
●●●●●●●●
●
●●
●
●●●● ●●●●
●
●●●●● ●●●● ●
●●
●
●
●●●●●
●
●●●
● ●●●●●●
●
●●●●
●●●●●●●●●●●● ●●●●●●●●●●
●●●●●
●
●
●●●●●●
●
●●
●
●●●●●●
0.0 0.2 0.4 0.6 0.8 1.00.
00.
20.
40.
60.
81.
0
Bonacich centrality
Bon
acic
h po
wer
number of airports can be enough to disconnect completely the whole ATN, as can be seenin Figure 2.3 for betweenness disconnection. With 3, 200 airports operative, the size of thelargest network connected has decreased from 3, 677 to just 40 airports.
A distinctive feature of the ATN is that the betweenness criterion is more effective thanthe degree to reduce the size of the giant component. In fact, Figure 2.3 shows that when the2.5% of airports are isolated with the betweenness criterion, a steep fall of the size of giantcomponent occurs. From that value of f on, betweenness is the most effective criterion. Forvalues of f < 0.025, the damage criterion is the most effective to reduce the size of giantcomponent. But while this criterion starts being the most effective, it ends up being theworst one for high values of f .
To compare damage and betweenness, in Table 2.1 are listed the 15 first airports to bedisconnected following both criteria and plotted on Figure 2.4. Only the ANC and FAIairports are present in both damage and betweenness lists. These two airports are in Alaska,depicted in black in Figure 2.4, and are the only two hubs that connect Alaska to the restof the world. If these two airports were disconnected, Alaska would be almost completelyisolated to the entire ATN.
The damage criterion tends to select airports that act as hubs of relatively isolated net-works of airports. A clarifying example of it could be that PPT, HIR and MNL (i. e., 4th,5th and 9th on damage disconnection) are in fact the hubs of French Polynesia, SolomonIslands and Philippines respectively. None of them has a deep impact on the ATN core.It is assumed that the ATN core includes the largest geopolitical air transport networks:
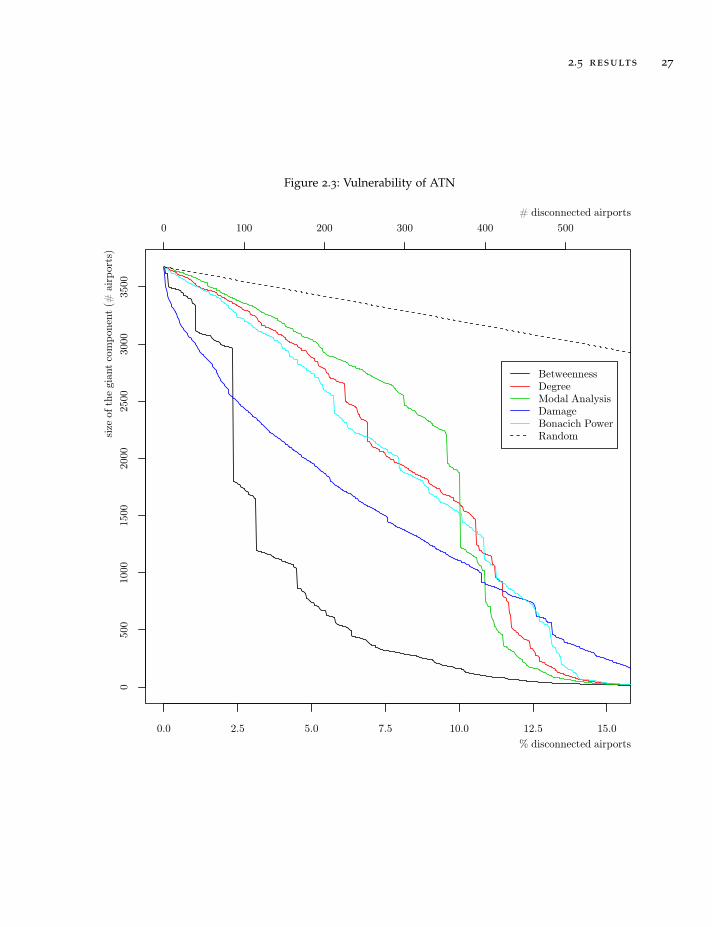
2.5 results 27
Figure 2.3: Vulnerability of ATN
0.0 2.5 5.0 7.5 10.0 12.5 15.0
050
010
0015
0020
0025
0030
0035
00
0 100 200 300 400 500
% disconnected airports
# disconnected airports
size
of t
he g
iant
com
pone
nt (
# a
irpo
rts)
BetweennessDegreeModal AnalysisDamageBonacich PowerRandom
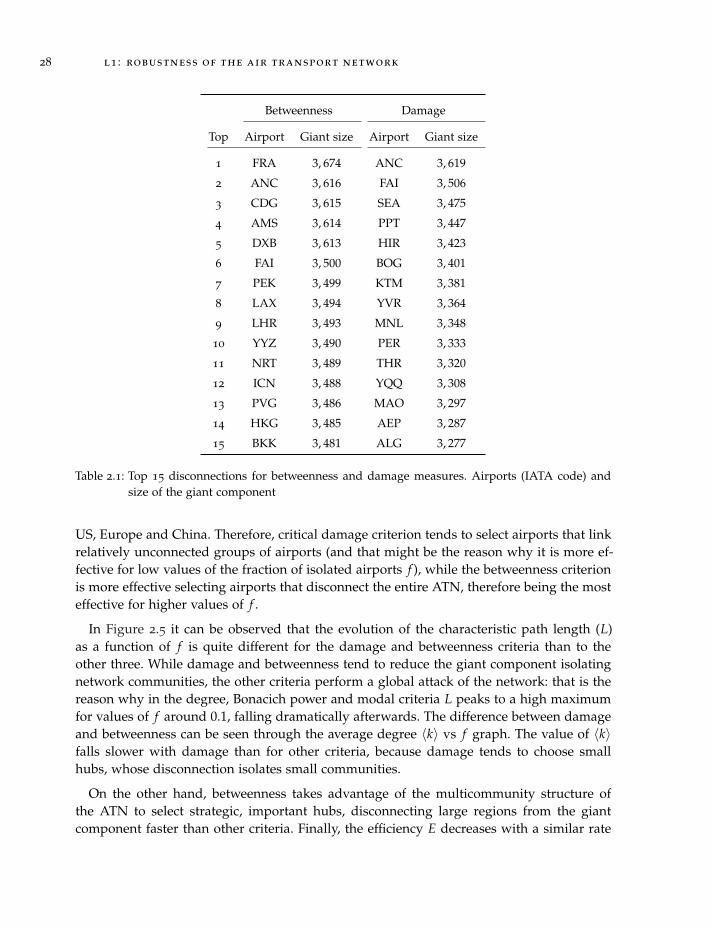
28 l1 : robustness of the air transport network
Betweenness Damage
Top Airport Giant size Airport Giant size
1 FRA 3, 674 ANC 3, 619
2 ANC 3, 616 FAI 3, 506
3 CDG 3, 615 SEA 3, 475
4 AMS 3, 614 PPT 3, 447
5 DXB 3, 613 HIR 3, 423
6 FAI 3, 500 BOG 3, 401
7 PEK 3, 499 KTM 3, 381
8 LAX 3, 494 YVR 3, 364
9 LHR 3, 493 MNL 3, 348
10 YYZ 3, 490 PER 3, 333
11 NRT 3, 489 THR 3, 320
12 ICN 3, 488 YQQ 3, 308
13 PVG 3, 486 MAO 3, 297
14 HKG 3, 485 AEP 3, 287
15 BKK 3, 481 ALG 3, 277
Table 2.1: Top 15 disconnections for betweenness and damage measures. Airports (IATA code) andsize of the giant component
US, Europe and China. Therefore, critical damage criterion tends to select airports that linkrelatively unconnected groups of airports (and that might be the reason why it is more ef-fective for low values of the fraction of isolated airports f ), while the betweenness criterionis more effective selecting airports that disconnect the entire ATN, therefore being the mosteffective for higher values of f .
In Figure 2.5 it can be observed that the evolution of the characteristic path length (L)as a function of f is quite different for the damage and betweenness criteria than to theother three. While damage and betweenness tend to reduce the giant component isolatingnetwork communities, the other criteria perform a global attack of the network: that is thereason why in the degree, Bonacich power and modal criteria L peaks to a high maximumfor values of f around 0.1, falling dramatically afterwards. The difference between damageand betweenness can be seen through the average degree 〈k〉 vs f graph. The value of 〈k〉falls slower with damage than for other criteria, because damage tends to choose smallhubs, whose disconnection isolates small communities.
On the other hand, betweenness takes advantage of the multicommunity structure ofthe ATN to select strategic, important hubs, disconnecting large regions from the giantcomponent faster than other criteria. Finally, the efficiency E decreases with a similar rate

2.6 conclusions 29
Figure 2.4: Top 15 disconnections for betweenness (blue) and damage (red) measures. Overlapped top15 airports (black) and the rest of them (grey)
for all criteria. It is interesting to note that, for most values of f , the criteria most effectivein reducing giant component size are the ones with lower efficiency.
2.6 conclusions
In this study, the resilience of the ATN facing intentional attacks has been assessed. Thisnetwork is resilient facing unintentional errors (i. e., random isolation of nodes), but hasproven to be fragile facing intentional attacks. The isolation of a small fraction of selectednodes can cause serious problems to the functioning of the global ATN. This behavior canbe explained by the characteristics of the ATN. The ATN is a SF network, with a truncatedpower-law distribution, thus less resistant to attacks than homogeneous networks. Further-more, the ATN has additional properties that make it different to other SF networks, suchas the presence of central airports with a reduced number of connections. The presence ofthese airports can be explained by the socioeconomic and political factors [21], and also byoperational reasons (for instance, the adoption of hub-and-spoke route configurations byFull-Service Carriers).
It has been assessed the effectiveness of five criteria of node selection to simulate attacksusing an adaptive strategy, in terms of reduction of size of giant component as a functionof the fractions of isolated nodes. In Figure 2.3 can be seen that the damage criterion is

30 l1 : robustness of the air transport network
Figure 2.5: Evolution of network basic characteristics. Quantities measured are: clustering coeffi-cient C, characteristic path length L, efficiency E, average degree 〈k〉
0 5 10 15
0.35
0.40
0.45
0.50
0.55
0.60
C
% disconnected airports
0 5 10 15
510
15
L
% disconnected airports
0 5 10 15
0.00
0.05
0.10
0.15
0.20
0.25
E
% disconnected airports
0 5 10 15
24
68
1012
⟨k⟩
% disconnected airports
Betweenness DegreeModal Analysis Damage Bonacich Power
2.6 conclusions 31
the most effective for f < 0.025, and that the betweenness criterion overcomes damage forhigher values of f . The list of the first airports isolated with each criterion (see Table 2.1and Figure 2.4) shows that while the betweenness criterion selects airports belonging to theATN core (i. e., US, Europe and China), damage criterion selects airports belonging to moreperipheral communities of the ATN.
It has also been introduced the Bonacich power criterion to select the nodes to isolate inan intentional attack. Although it is not the most effective criterion to disconnect the ATN,for most of the values of f beats the degree criterion. The Bonacich power criterion needsto be tested on other networks to determine its true potential. For instance, it would beinteresting to apply this criterion to simulate attacks to networks where the degree criterionis more effective than betweenness, e. g. the power grid analyzed in [19]. The modal analysiscriterion has proven to be the most effective to attack power grid networks [19], but it isnot so effective when used in the ATN. It just proven to be effective when more of the 10%of airports are disconnected. This fact shows that different SF networks can have differentproperties regarding its strength facing intentional attacks.
The results of the comparison of effectiveness of criteria of node selection to attack theATN shows that this network has a multicommunity structure where central airports (i. e.,airports with the highest betweenness centrality) are the most critical infrastructures of thenetwork in terms of its resilience facing attacks. This structure has emerged due to not onlysocioeconomic and geopolitical factors, but also for operational reasons. The most centralairports are the hubs of Full-Service Carriers, whose routes have a hub-and-spoke structure.
The study of ATN robustness can help to improve its reliability, since it can help to detectthe critical airports in the ATN structure. It can also help to devise strategies to increasenetwork robustness, using improvement analysis techniques [76]. This research also suggestnew directions to research ATN robustness. It would be interesting, for instance, to assesthe dynamic robustness in the ATN. The closure of a set of airports may not cause a bigdamage per se, but the need to relocate the flights using other airports can cause the closureof these, thus provoking a cascading effect. There is evidence of this to happen, for instancein the case of the eruption of the Eyjafallajökull volcano [59]. Studies of static and dynamicrobustness can also be of interest for airlines as it will be shown in Chapter 4. The use ofthe hub-and-spoke network configuration by Full-Service Carriers can make these airlinesparticularly easy to attack and they might consider to organize their route networks on amultihub-and-spoke basis to gain resilience facing intentional attacks.

3L 2 : R O B U S T N E S S O F A I R L I N E A L L I A N C E S R O U T E N E T W O R K
3.1 abstract
The aim of this study is to analyze the robustness of the route network of the three majorairline alliances (i. e., Star Alliance, oneworld and SkyTeam). Firstly, it is proposed a nor-malization of a multi-scale measure of the vulnerability in order to perform the analysisin networks with different sizes (i. e., number of nodes). It is also proposed an alternativenode selection criterion to study robustness and vulnerability of complex networks, basedon the efficiency of a network. And lastly, it is described a new procedure –the invertedadaptive strategy– for sorting the nodes in order to anticipate the breakdown of a network.Finally, the robustness of the three alliances network is analyzed with (1) the normalizedmulti-scale measure of the vulnerability, (2) the adaptive strategy based on four differentcriteria and (3) the inverted adaptive strategy based on the efficiency criterion. Results showthat Star Alliance has the most resilient route network, followed by SkyTeam and oneworld.Besides, the inverted adaptive strategy based on the efficiency criterion –inverted efficiency–shows a great success on quickly breaking networks similar to betweenness criterion butwith even better results.
3.2 introduction
The coordination of airline activities in alliances has been one of the major traits of thisindustry since the beginning of the 90s, and in the last decade most of the Full-ServiceCarriers and regional airlines have participated in an airline alliance. Airlines can join al-liances for several reasons. First, alliance members can benefit from economies of scale anddensity: without increasing the investment in aircrafts, alliance members can extend theirroute network and offer a wider range of frequency to customers in selected routes. Further-more, alliance members can explore more easily ways to collaborate with other membersthrough codesharing, joint-ventures or even merger and acquisitions [111]. Finally, alliancemembers can benefit from the joint offering benefits to customers (e. g., frequent-flyer pro-grams) or from the joint purchase of supplies such as fuel. In respect to consumer welfare,airline alliances lower the fares of interline flights, which compensates the fare raises ininterhub flights [34, 35]. Though, It must be noted that competence of alliance membersin coordinating routes and fares is an important requirement for passengers benefits tomaterialize [112].
When an airline joins an alliance, the reliability of the services offered to customers de-pends not only on the flights the airline operates, but also on the operations of the rest of
33

34 l2 : robustness of airline alliances route network
alliance members, since most of the routes offered by alliances are operated on a hub-and-spoke basis. Then, although airline alliances have been formed for operational and compet-itive reasons, the ascription to an alliance can determine the robustness of the incumbentairline networks.
The aim of the present study is to analyze the vulnerability of the airline alliances routenetwork (AARNs) to errors (i. e., random isolation of an airport) and attacks (i. e., isolationof well-connected airports with the aim of causing the maximum damage to the routenetwork). This assessment is performed by two different approaches: first, using a multi-scale measure of vulnerability [109], and second, examining the effect of the disconnectionof a fraction f of well-connected nodes on the size of the giant component. This studycan shed light on the robustness of real networks, not only for the special case of airlinealliances, but also for networks sharing similar topological properties.
3.3 methods
3.3.1 Vulnerability
In [109], Boccaletti and colleagues developed a multi-scale measure of the vulnerability ofa graph G introducing the coefficient p at the characteristic formula of the average edgebetweenness as:
bp(G) =
(1|E| ∑
l∈Ebp
l
)1/|p|
(7)
where |E| is the number of edges, and bl is the betweenness of the edge l calculated as:
bl = ∑i 6=j
nij(l)nij
(8)
where nij(l) is the number of geodesics (i. e., shortest paths) from node i to node j thatcontain the edge l, and nij is the total number of shortest paths.
If one wants to compare the vulnerability of two networks G and G′ with similar struc-tural properties, one first has to compute b1. If b1(G) < b1(G′), then G is more robust (lessvulnerable) than G′. If b1(G) = b1(G′), then one has to compute bp for values of p > 1 untilbp(G) 6= bp(G′). Then, the network with the least value of bp will be the most robust one.In general it has to be considered the full multi-scale sequence of betweenness coefficients(bp(G))p≥1 in order to get a sharp approach to the robustness of the network [109].
This procedure can be used to assess differences in vulnerability between airline allianceroute networks (AARNs). As has been shown in Table 3.1, AARNs have a really differentnumber of nodes and edges, so the measures of vulnerability have to be normalized inorder to be able to compare graphs. One possible normalization procedure can be defined
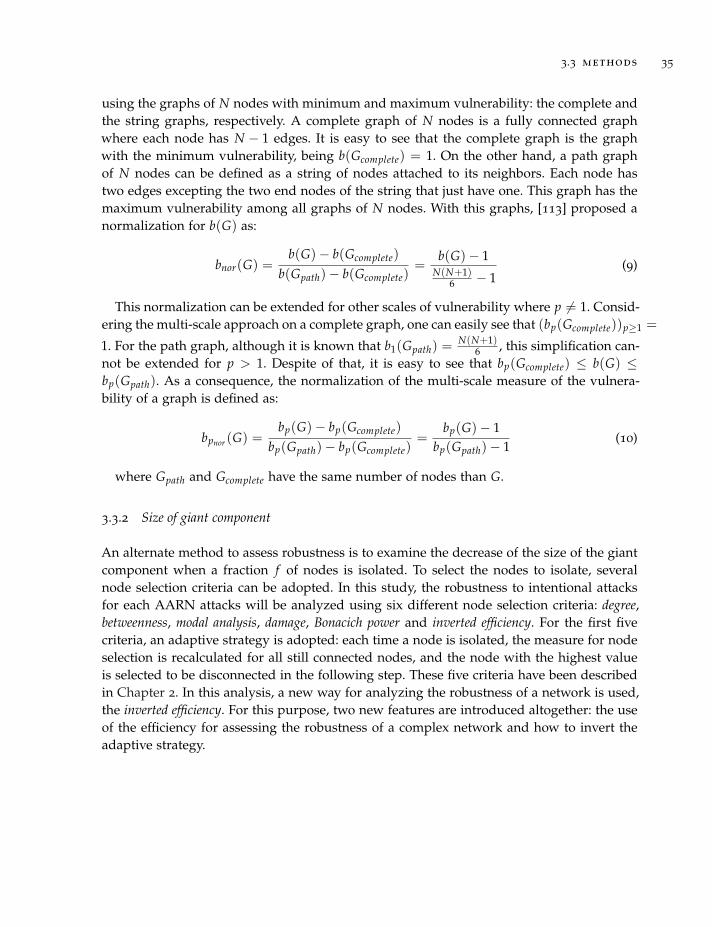
3.3 methods 35
using the graphs of N nodes with minimum and maximum vulnerability: the complete andthe string graphs, respectively. A complete graph of N nodes is a fully connected graphwhere each node has N − 1 edges. It is easy to see that the complete graph is the graphwith the minimum vulnerability, being b(Gcomplete) = 1. On the other hand, a path graphof N nodes can be defined as a string of nodes attached to its neighbors. Each node hastwo edges excepting the two end nodes of the string that just have one. This graph has themaximum vulnerability among all graphs of N nodes. With this graphs, [113] proposed anormalization for b(G) as:
bnor(G) =b(G)− b(Gcomplete)
b(Gpath)− b(Gcomplete)=
b(G)− 1N(N+1)
6 − 1(9)
This normalization can be extended for other scales of vulnerability where p 6= 1. Consid-ering the multi-scale approach on a complete graph, one can easily see that (bp(Gcomplete))p≥1 =
1. For the path graph, although it is known that b1(Gpath) =N(N+1)
6 , this simplification can-not be extended for p > 1. Despite of that, it is easy to see that bp(Gcomplete) ≤ b(G) ≤bp(Gpath). As a consequence, the normalization of the multi-scale measure of the vulnera-bility of a graph is defined as:
bpnor (G) =bp(G)− bp(Gcomplete)
bp(Gpath)− bp(Gcomplete)=
bp(G)− 1bp(Gpath)− 1
(10)
where Gpath and Gcomplete have the same number of nodes than G.
3.3.2 Size of giant component
An alternate method to assess robustness is to examine the decrease of the size of the giantcomponent when a fraction f of nodes is isolated. To select the nodes to isolate, severalnode selection criteria can be adopted. In this study, the robustness to intentional attacksfor each AARN attacks will be analyzed using six different node selection criteria: degree,betweenness, modal analysis, damage, Bonacich power and inverted efficiency. For the first fivecriteria, an adaptive strategy is adopted: each time a node is isolated, the measure for nodeselection is recalculated for all still connected nodes, and the node with the highest valueis selected to be disconnected in the following step. These five criteria have been describedin Chapter 2. In this analysis, a new way for analyzing the robustness of a network is used,the inverted efficiency. For this purpose, two new features are introduced altogether: the useof the efficiency for assessing the robustness of a complex network and how to invert theadaptive strategy.

36 l2 : robustness of airline alliances route network
3.3.2.1 Efficiency
Latora and colleagues [80, 83] introduced the efficiency of a network as an indicator of itsown traffic capacity as:
E =1
N(N − 1) ∑i 6=j
1dij
(11)
In the analysis carried in Chapter 2, it can be observed that the decrease of the efficiencyof the network has an evolution similar to the decrease of the size of giant component.Therefore, a promising criterion of node selection for maximizing attack effectiveness couldbe selecting the node whose disconnection causes the maximal decrease of efficiency. If anadaptive strategy is used, the decrease of efficiency caused for the isolation of each of theremaining nodes must be recalculated for the next iteration. Note that efficiency, as damagecriterion, is a network measure, while the other criteria are based in node measures. Whilefor damage criterion the node to be selected is the one whose isolation maximizes thismeasure, for the efficiency criterion is the one that minimizes it.
Figure 3.1: Example of the inverted adaptive strategy. Grey circles: activated; white squares: desactivated
●
●
●●
●
●
●
● ●
●
A
B
CD
E
F
G
H I
J
a. Initial network
A
B
CD
E
F
G
H I
J
b. Empty graph
●
●●
●
● ●
●
A
B
CD
E
F
G
H I
J
c. Betw=0 activated
●
●●
●
●
● ●
●
A
B
CD
E
F
G
H I
J
d. "G" activated
●
●●
●
●
●
● ●
●
A
B
CD
E
F
G
H I
J
e. "F" activated
●
●
●●
●
●
●
● ●
●
A
B
CD
E
F
G
H I
J
f. "A" activated
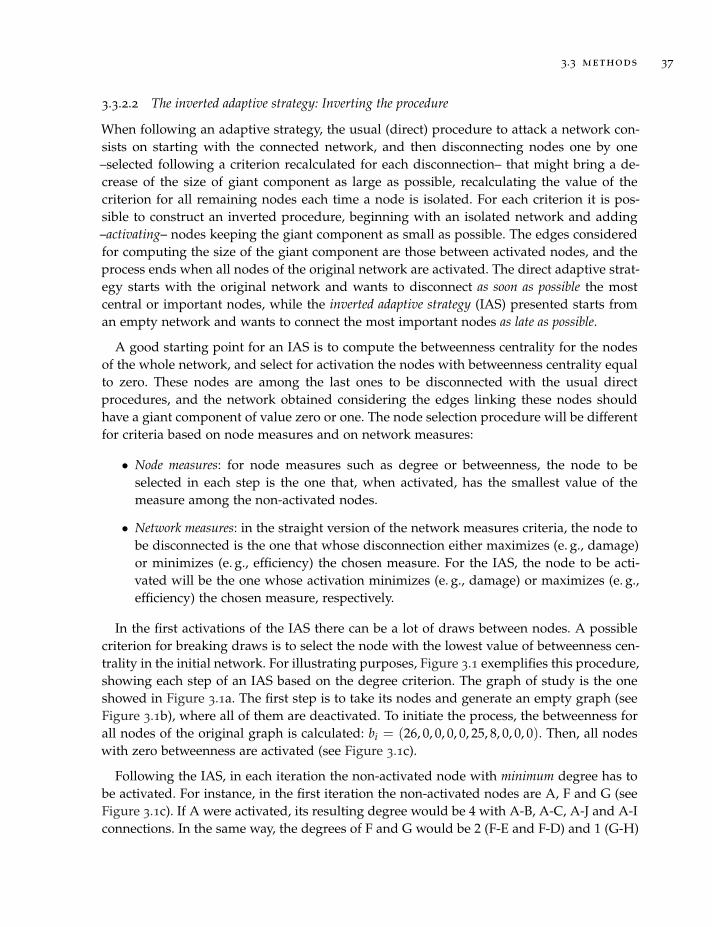
3.3 methods 37
3.3.2.2 The inverted adaptive strategy: Inverting the procedure
When following an adaptive strategy, the usual (direct) procedure to attack a network con-sists on starting with the connected network, and then disconnecting nodes one by one–selected following a criterion recalculated for each disconnection– that might bring a de-crease of the size of giant component as large as possible, recalculating the value of thecriterion for all remaining nodes each time a node is isolated. For each criterion it is pos-sible to construct an inverted procedure, beginning with an isolated network and adding–activating– nodes keeping the giant component as small as possible. The edges consideredfor computing the size of the giant component are those between activated nodes, and theprocess ends when all nodes of the original network are activated. The direct adaptive strat-egy starts with the original network and wants to disconnect as soon as possible the mostcentral or important nodes, while the inverted adaptive strategy (IAS) presented starts froman empty network and wants to connect the most important nodes as late as possible.
A good starting point for an IAS is to compute the betweenness centrality for the nodesof the whole network, and select for activation the nodes with betweenness centrality equalto zero. These nodes are among the last ones to be disconnected with the usual directprocedures, and the network obtained considering the edges linking these nodes shouldhave a giant component of value zero or one. The node selection procedure will be differentfor criteria based on node measures and on network measures:
• Node measures: for node measures such as degree or betweenness, the node to beselected in each step is the one that, when activated, has the smallest value of themeasure among the non-activated nodes.
• Network measures: in the straight version of the network measures criteria, the node tobe disconnected is the one that whose disconnection either maximizes (e. g., damage)or minimizes (e. g., efficiency) the chosen measure. For the IAS, the node to be acti-vated will be the one whose activation minimizes (e. g., damage) or maximizes (e. g.,efficiency) the chosen measure, respectively.
In the first activations of the IAS there can be a lot of draws between nodes. A possiblecriterion for breaking draws is to select the node with the lowest value of betweenness cen-trality in the initial network. For illustrating purposes, Figure 3.1 exemplifies this procedure,showing each step of an IAS based on the degree criterion. The graph of study is the oneshowed in Figure 3.1a. The first step is to take its nodes and generate an empty graph (seeFigure 3.1b), where all of them are deactivated. To initiate the process, the betweenness forall nodes of the original graph is calculated: bi = (26, 0, 0, 0, 0, 25, 8, 0, 0, 0). Then, all nodeswith zero betweenness are activated (see Figure 3.1c).
Following the IAS, in each iteration the non-activated node with minimum degree has tobe activated. For instance, in the first iteration the non-activated nodes are A, F and G (seeFigure 3.1c). If A were activated, its resulting degree would be 4 with A-B, A-C, A-J and A-Iconnections. In the same way, the degrees of F and G would be 2 (F-E and F-D) and 1 (G-H)
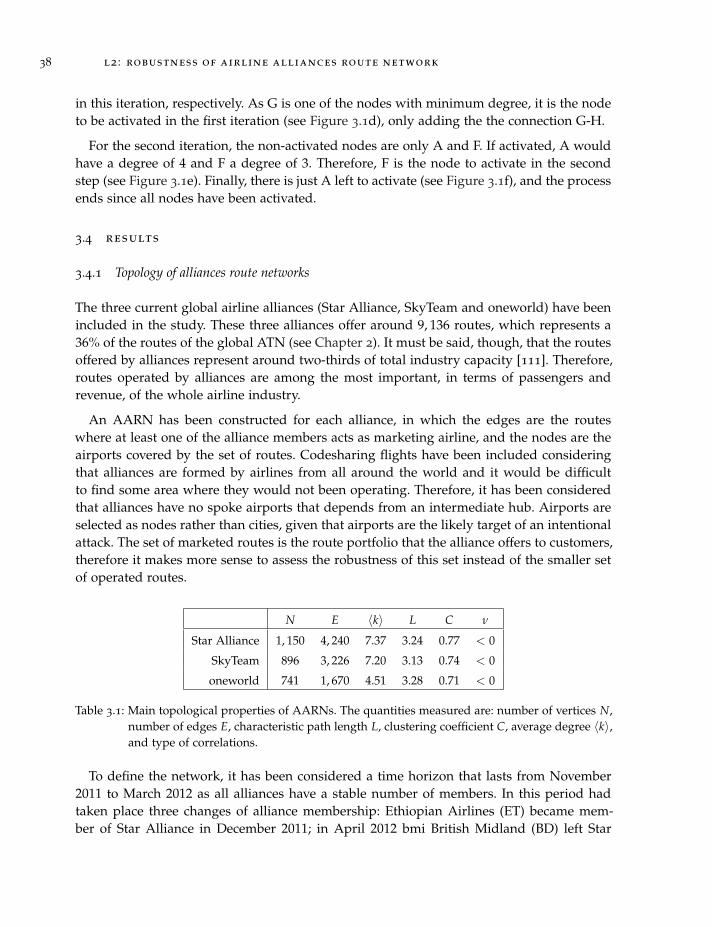
38 l2 : robustness of airline alliances route network
in this iteration, respectively. As G is one of the nodes with minimum degree, it is the nodeto be activated in the first iteration (see Figure 3.1d), only adding the the connection G-H.
For the second iteration, the non-activated nodes are only A and F. If activated, A wouldhave a degree of 4 and F a degree of 3. Therefore, F is the node to activate in the secondstep (see Figure 3.1e). Finally, there is just A left to activate (see Figure 3.1f), and the processends since all nodes have been activated.
3.4 results
3.4.1 Topology of alliances route networks
The three current global airline alliances (Star Alliance, SkyTeam and oneworld) have beenincluded in the study. These three alliances offer around 9, 136 routes, which represents a36% of the routes of the global ATN (see Chapter 2). It must be said, though, that the routesoffered by alliances represent around two-thirds of total industry capacity [111]. Therefore,routes operated by alliances are among the most important, in terms of passengers andrevenue, of the whole airline industry.
An AARN has been constructed for each alliance, in which the edges are the routeswhere at least one of the alliance members acts as marketing airline, and the nodes are theairports covered by the set of routes. Codesharing flights have been included consideringthat alliances are formed by airlines from all around the world and it would be difficultto find some area where they would not been operating. Therefore, it has been consideredthat alliances have no spoke airports that depends from an intermediate hub. Airports areselected as nodes rather than cities, given that airports are the likely target of an intentionalattack. The set of marketed routes is the route portfolio that the alliance offers to customers,therefore it makes more sense to assess the robustness of this set instead of the smaller setof operated routes.
N E 〈k〉 L C ν
Star Alliance 1, 150 4, 240 7.37 3.24 0.77 < 0
SkyTeam 896 3, 226 7.20 3.13 0.74 < 0
oneworld 741 1, 670 4.51 3.28 0.71 < 0
Table 3.1: Main topological properties of AARNs. The quantities measured are: number of vertices N,number of edges E, characteristic path length L, clustering coefficient C, average degree 〈k〉,and type of correlations.
To define the network, it has been considered a time horizon that lasts from November2011 to March 2012 as all alliances have a stable number of members. In this period hadtaken place three changes of alliance membership: Ethiopian Airlines (ET) became mem-ber of Star Alliance in December 2011; in April 2012 bmi British Midland (BD) left Star
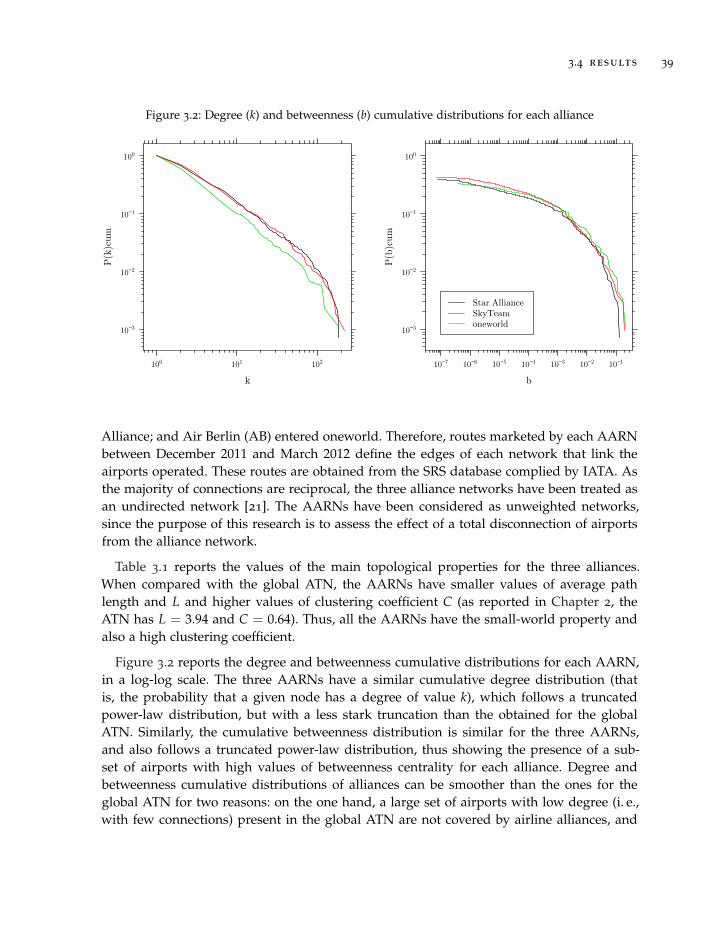
3.4 results 39
Figure 3.2: Degree (k) and betweenness (b) cumulative distributions for each alliance
k
P(k
)cum
10−3
10−2
10−1
100
100 101 102
bP
(b)c
um
10−3
10−2
10−1
100
10−7 10−6 10−5 10−4 10−3 10−2 10−1
Star Alliance SkyTeam oneworld
Alliance; and Air Berlin (AB) entered oneworld. Therefore, routes marketed by each AARNbetween December 2011 and March 2012 define the edges of each network that link theairports operated. These routes are obtained from the SRS database complied by IATA. Asthe majority of connections are reciprocal, the three alliance networks have been treated asan undirected network [21]. The AARNs have been considered as unweighted networks,since the purpose of this research is to assess the effect of a total disconnection of airportsfrom the alliance network.
Table 3.1 reports the values of the main topological properties for the three alliances.When compared with the global ATN, the AARNs have smaller values of average pathlength and L and higher values of clustering coefficient C (as reported in Chapter 2, theATN has L = 3.94 and C = 0.64). Thus, all the AARNs have the small-world property andalso a high clustering coefficient.
Figure 3.2 reports the degree and betweenness cumulative distributions for each AARN,in a log-log scale. The three AARNs have a similar cumulative degree distribution (thatis, the probability that a given node has a degree of value k), which follows a truncatedpower-law distribution, but with a less stark truncation than the obtained for the globalATN. Similarly, the cumulative betweenness distribution is similar for the three AARNs,and also follows a truncated power-law distribution, thus showing the presence of a sub-set of airports with high values of betweenness centrality for each alliance. Degree andbetweenness cumulative distributions of alliances can be smoother than the ones for theglobal ATN for two reasons: on the one hand, a large set of airports with low degree (i. e.,with few connections) present in the global ATN are not covered by airline alliances, and

40 l2 : robustness of airline alliances route network
Figure 3.3: Betweennes (b) as a function of degree (k) for each alliance
●●
●
●
●
●●●●●
●
●
●
●
●
●
●●
●
●
●●
●
● ● ●
●
●●
●
●●
●
●●●● ●●
●●●●●●●
●
●
●
●
●
●
●
●●
● ●
●
●
●●
●
●
●
●
●●●●●●
●
●●
●
●
●
●
●●
●
●●
●
●
●●●●
●
●●●●●●●●●●●●●●●●●●●●●●●●●●●● ●●●●●●●●●●●●●●●●●●●● ●●●●●●●●●●●●●●●●● ●●●●●●●●●●●●●●●●●●●●●●●●●●●●●●●●●●●●●●●●●●●● ●●●●●●●●●●●●●●●●●●●●●●●●● ●●●●●●●●●●●●●●●●●●●●●●●●●●●●●● ●●●●●●●●●●●●●●●●●●● ●●●●●●●●●●●●●●●●●●●●●●●●●●●●●
●●●●●●●●●●●●●
●●●●●●●●●●●●●●●●●●●●●●●●●●●●●●●●●●●
●
●
●●●●●●●●●
●●●●●●●●●●●●●●●●●●●●●●●●●●●●●●●●●●●●●●●●●●●●●●●●●●●●●●●●●●●●●●●●●●●●●●●●●●●●●●●●●●●●●●●●●●●●●●●●●●●●●●●●●●●●●●●●●●●●●●●●●●●●●●●●●●●●●●●●●●●●●●●●●●●●●●●●●●●●●●●●●●●●●●●●●●●●●●●●●●●●●●●●●●●●●●●●●●●●●●●●●●●●●●●●●●●●●●●●●●●●●●●●●●●●●●●●●●●●●●●●●●●●●●●●●●●●●●●●●●●●●●●●●●●●●●●●●●●●●●●●●●●●●●●●●●●●●●●●●●●●●●●●●●●●●●●●●●●●●●●●●●●●●●●●●●●●●●●●●●●●●●●●●●●●●●●●●●●●●●●●●●●●●●●●●●●●●●●●●●●●●●●●●●●●●●●●●●●●●●●●●●●●●●●●●●●●●●●●●●●●●●●●●●●●●●
●
●
●●●●●●●●●●●●●●●●●●●●●●●●●●●●●●●●●●●●●●●●●●●●●●●●●●●●●●●●●●●●●●●●●●●●● ●●●●●●●●● ●●●●●●●●●●●●●●●●●●● ●●●●●●●●●●●●●●●●●●●● ●●●●●●●●●●●●●●●●●● ●●●●●●●●●●● ●●●●●●●●●●●●●●●●●●●●●●●●●●●●●●●●●●●●●●●●●●●●●●●●●●●●●●●●●●●●●●●●●●●●●●●●●●●●●●●●●●●●●●●●●●●●●●●●●●●●●●●●●●●●●●●●●●●●●●●●●●●●●●●●●●●●●●●●●●●●●●●●● ●●●●●●●●● ●●●●●●●●●● ●●●●●●●●●●●●●●●●●●●●●●●●●●●●●●●●●●●●●●●●●●●●●●●●●●●●●●●●●●●●●●●●●●●●●●●●●●●●●●●●●●●●●●●●●●●●●●●●●●●●●●●●●●●●●●●●●●●●●●●●●●●●●●●●●●●●●●●●●● ●●●●●●●●● ●●●●●●●●●●●●●●●●●●●●●●●●●●●●●●●●●●●●●●●●●●●●●●●●●●●●●●●●●●●●●●●●●●●●●●
●
●●●●●●●●●●●●●●●●●● ●●●●●●●●●●●●●●●●●●●●●●●●●●●●●●●●●●●●●●●●●●●●●
●●●●●●
●
0 50 100 150
02
46
810
12
Star Alliance
●
●
●
●
●
●●●●●●●●●●●●
●●●●●●●●●●●●● ●●●●●●
●
●
●
●
●
●
●
●
●●●●●●●●●●●●●●●●●●●●●●●●
●
●
●
●
●
●●●
●●●●●●
●●
●
●
●
●●●●●●●●●●●
●
● ●●●●●
●
●
●
●
●●●●●●●●●●●●●●●●●●●● ●●●●●●● ●●●●●●●● ●●●●●●●●●●● ●●●●●●●●● ●●●●●●●●●●●●●●●●●●●● ●●●●●●●●●●●●●●●●●●●●●●●●●●●●●●●●●●●●●●●●●●●●●●●●●●●●●●●●●●●●●●●●●●●●●●●●●●●●●●●●●●●●●●●●●●●●●●●●●●●●●●●●●●●●●●●●●●●●●●●●●●●●●●●●●●●●●●●●●●●●●●●●●●●●● ●●●●●●●●●●●●●●●●●●●●●●●●● ●●●●●●●●●●●●●●●●●●●● ●●●●●●●● ●●●●●● ●●●●●●●●●●●●●●●●●●●●●●●●●●●●●●●●●●●●●●●●●●●●●●●●●●●●● ●●●●●●●●●●●●●●●●●●●●●●●●●●●●●●●●●●●●●●●●●●●●●●●●●●●●●●●●●●●●●●●●●●●●●●●●●●● ●●●●●●●●●●●●●●●●●●●●●●●●●●●●●●●●●●●●●●●●●●●●●●●●●●●●● ●●●●●●●●●●●●●●●●●●●●●●●●
●
●
●●●
●
●●
●
●
●●
●●●●●●●●●●●●●●●●●●●●
●
●●●●●●●●●●●●●●●●●●●●●●●●●●●●●●●●●●●●●●●●●●●●●●●●●●●●●●●●●●●●●●●●●●●●●●●●●●●●●●●●●●●●●●●●●●●●●●●●●●●●●●●●●●●●●●●●●●●●●●●●●●●●●●●●●●●●●●●●●●●●●●●●●●●●●●●●●●●●●●●●●●●●●●●●●●●●●●●●●●●●●●●●●●●●●●●●●●●●●●●●●●●●●●●●●●●●●●●●●●●●●●●●●●●●●●●●●●●●●●●●●●●●●●●●●●●●●●●●●●●●●●●●●●●●●●●●●●●●●●●●●●●●●●●●●●●●●●●●●●●●●●●●●●●●●●●●●●●●●●●●●●●●●●●●●●●●●●
●●●●●●●●●●●●●●●●●●●●●●●●●●●●●●●●● ●●●●●●●●●●●●●●●●●●●●●●●●●●●●●●●●●●●●●●●●●●●
●●
0 50 100 150 200
02
46
810
SkyTeam
●●
●
●
●●
●
●
●●
●●●●●●●●●
●
●
●
●
●
●
● ●
●
●
●●●●●●●●●●●●●●
●
●
●
●
●
●
●
●
●●●●●●●●●●●●
●●●●●●●●●●●
●
●●
●●●●●
●●●●●●●●●●●●●●●●●●●●●●●●●●●●●●●●●●●●●●●●●●●●●●●●●●●●●●●●●●●●●●●●●●●●●●●●●●●●●●●●●●●●●●●●●●●●●●●●●●●●●●●●●●●●●●●●●●●●●●●●●●●●●●●●●●●●●●●●●●●●●●●●●●●●●●●●●●●●●●●●●●●●●●●●●●●●●●●●●●●●●●●●●●●●●●●●●●●●●●●●●●●●●●●●●●●●●●●●●●●●●●●●●●●●●●●●●●●●●●●●●●●●●●●●●●●●●●●●●●●●●●●●●●●●●●●●●●●●●●●●●●●●●●●●●●●●●●●●●●●●●●●●●●●●●●●●●●●●●●●●●●●●●●●●●●●●●●●●●●●●●●●●●●●●●●●●●●●●●●●●●●●●●●●●●●●●●●●●●●●●●●● ●●●●●●●●●●●● ●●●●●●●●●●●●●●●●●●●●●● ●●●●●●●●●●●●●●●●●●●●●●●●●●●●●●●●●●●●●●●●●●●●●●●●●●●●●●●●●●●●●●●●●●●●●●●●●●●●●●●●●●●●●●●●●●●●●●●●●●●●●●●●●●●●●●●●●●●●●●●●●● ●●●●●●●●●●●●●●●●●●●●●●●●●●●●●●●●●●●●●●●●●●●●●●●●●●●●●●●●●●●●●●●●●●●●●●●●●●●●●●●●●●●●●●●●●●●●●●●●● ●●●●●●●●●●●●●●●●●●●●●●●●●●●●●●●●●●●●●●●●●●●●●●●●●●●●●●●●●●●●●●●●●● ●●●●●●●●●●●●●●●●●●●●●●●●●●●●●●●●●●● ●●●●●●●●●●●●●●●●●●●●●●●●●●●●●●●●●●●●●●●●●●●●●●●●●●●●●●●●●●●●●
●
●●●
0 50 100 150
02
46
8
oneworld
k
b
kk
on the other hand, each alliance has a subset of airports with high number of connectionsand high betweenness centrality, as compared with the global ATN which includes all ofthem.
A distinctive feature for Star Alliance is shown in Figure 3.3, which compares the between-ness and the degree of each airport for each alliance. The graph of Star Alliance shows asimilar pattern to the on observed for the global ATN (also considering nodes as airports,like in Chapter 2, or nodes as cities link in [21]): the appearance of nodes with a high valueof betweenness and a low value of degree. In the other two graphs, though, it can be ob-served a strong correlation between degree and betweenness, with no airports showing thepattern of low degree and high betweenness. On the other hand, Star Alliance has a morecontinuous distribution of degree and betweenness, while the other two alliances have air-ports with values of degree and betweenness much higher than the rest (i. e., one in thecase of oneworld and three for SkyTeam).
3.4.2 Robustness of airline alliances route network
Figure 3.4 depicts the multi-scale vulnerability measures for the three alliances for valuesof p ranging from 1 to 50. In order to compare the vulnerability of each alliance, the val-ues of the multi-scales measures have been normalized following the procedure describedin Section 3.3.1. The results show that Star Alliance is the alliance with lowest values ofvulnerability, followed by SkyTeam and oneworld, respectively. Therefore, according to thismeasure, oneworld seems to have the most vulnerable network and Star Alliance the mostrobust one.
Figure 3.5 shows an alternative assessment of the robustness of the alliances route net-work: the evolution of the size of the giant component when a fraction f of the nodes is
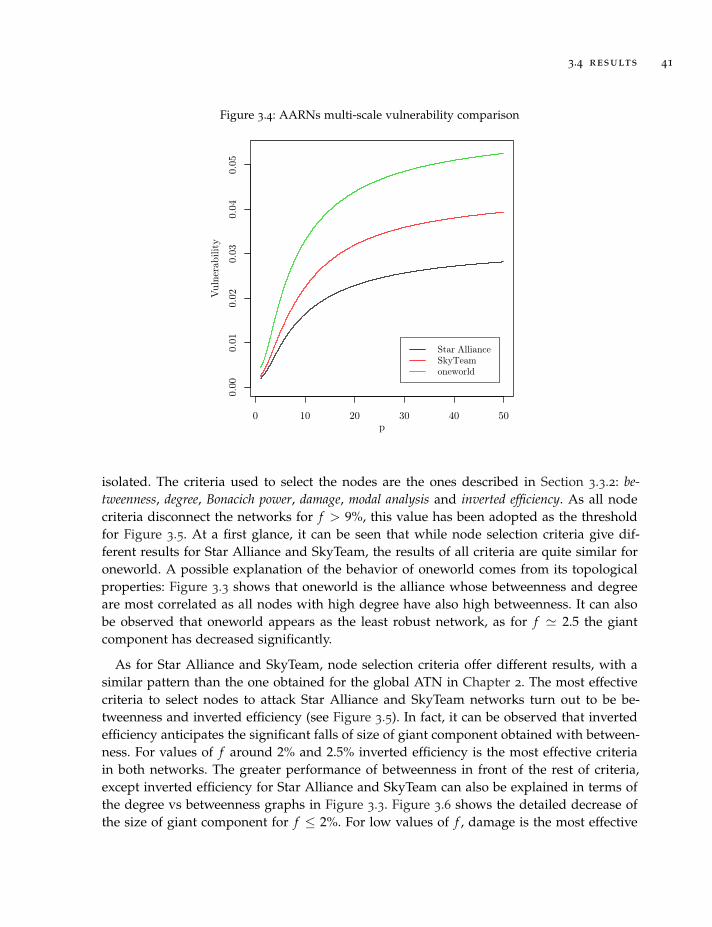
3.4 results 41
Figure 3.4: AARNs multi-scale vulnerability comparison
0 10 20 30 40 50
0.00
0.01
0.02
0.03
0.04
0.05
p
Vul
nera
bilit
y
Star AllianceSkyTeam oneworld
isolated. The criteria used to select the nodes are the ones described in Section 3.3.2: be-tweenness, degree, Bonacich power, damage, modal analysis and inverted efficiency. As all nodecriteria disconnect the networks for f > 9%, this value has been adopted as the thresholdfor Figure 3.5. At a first glance, it can be seen that while node selection criteria give dif-ferent results for Star Alliance and SkyTeam, the results of all criteria are quite similar foroneworld. A possible explanation of the behavior of oneworld comes from its topologicalproperties: Figure 3.3 shows that oneworld is the alliance whose betweenness and degreeare most correlated as all nodes with high degree have also high betweenness. It can alsobe observed that oneworld appears as the least robust network, as for f ' 2.5 the giantcomponent has decreased significantly.
As for Star Alliance and SkyTeam, node selection criteria offer different results, with asimilar pattern than the one obtained for the global ATN in Chapter 2. The most effectivecriteria to select nodes to attack Star Alliance and SkyTeam networks turn out to be be-tweenness and inverted efficiency (see Figure 3.5). In fact, it can be observed that invertedefficiency anticipates the significant falls of size of giant component obtained with between-ness. For values of f around 2% and 2.5% inverted efficiency is the most effective criteriain both networks. The greater performance of betweenness in front of the rest of criteria,except inverted efficiency for Star Alliance and SkyTeam can also be explained in terms ofthe degree vs betweenness graphs in Figure 3.3. Figure 3.6 shows the detailed decrease ofthe size of giant component for f ≤ 2%. For low values of f , damage is the most effective
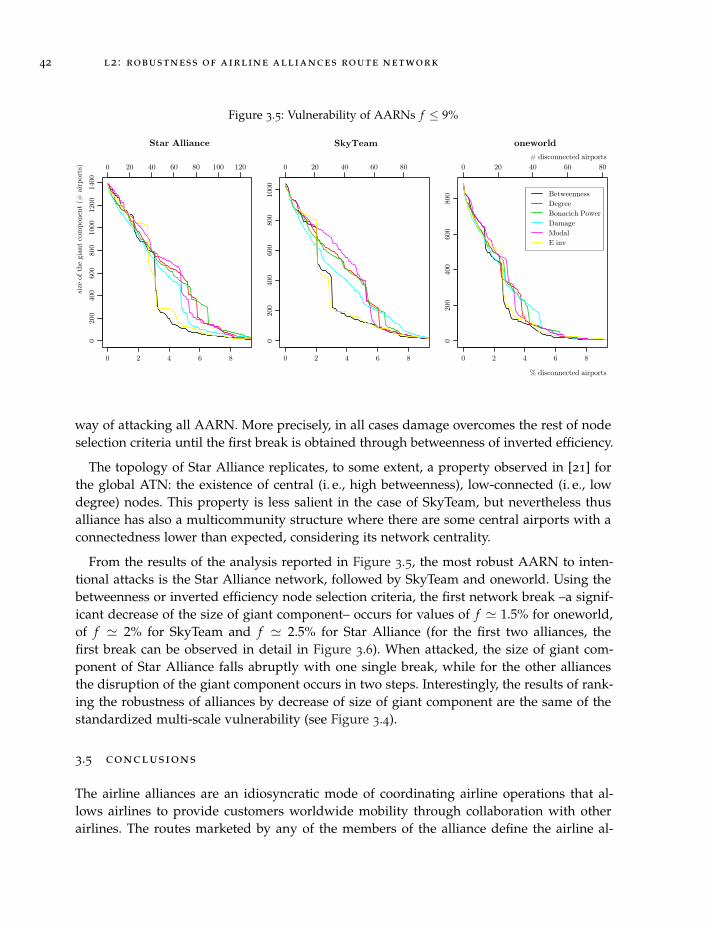
42 l2 : robustness of airline alliances route network
Figure 3.5: Vulnerability of AARNs f ≤ 9%
Star Alliance SkyTeam oneworld# disconnected airports
size
of t
he g
iant
com
pone
nt (
# a
irpo
rts)
% disconnected airports
0 2 4 6 8
020
040
060
080
010
0012
0014
00
0 20 40 60 80 100 120
0 2 4 6 8
020
040
060
080
010
00
0 20 40 60 80
0 2 4 6 8
020
040
060
080
0
0 20 40 60 80
BetweennessDegreeBonacich PowerDamageModalE inv
way of attacking all AARN. More precisely, in all cases damage overcomes the rest of nodeselection criteria until the first break is obtained through betweenness of inverted efficiency.
The topology of Star Alliance replicates, to some extent, a property observed in [21] forthe global ATN: the existence of central (i. e., high betweenness), low-connected (i. e., lowdegree) nodes. This property is less salient in the case of SkyTeam, but nevertheless thusalliance has also a multicommunity structure where there are some central airports with aconnectedness lower than expected, considering its network centrality.
From the results of the analysis reported in Figure 3.5, the most robust AARN to inten-tional attacks is the Star Alliance network, followed by SkyTeam and oneworld. Using thebetweenness or inverted efficiency node selection criteria, the first network break –a signif-icant decrease of the size of giant component– occurs for values of f ' 1.5% for oneworld,of f ' 2% for SkyTeam and f ' 2.5% for Star Alliance (for the first two alliances, thefirst break can be observed in detail in Figure 3.6). When attacked, the size of giant com-ponent of Star Alliance falls abruptly with one single break, while for the other alliancesthe disruption of the giant component occurs in two steps. Interestingly, the results of rank-ing the robustness of alliances by decrease of size of giant component are the same of thestandardized multi-scale vulnerability (see Figure 3.4).
3.5 conclusions
The airline alliances are an idiosyncratic mode of coordinating airline operations that al-lows airlines to provide customers worldwide mobility through collaboration with otherairlines. The routes marketed by any of the members of the alliance define the airline al-

3.5 conclusions 43
Figure 3.6: Vulnerability of AARNs. Detail: f ≤ 2%
0.0 0.5 1.0 1.5 2.0
900
1000
1100
1200
1300
1400
Star Alliance
0 5 10 15 20 25
0.0 0.5 1.0 1.5 2.0
700
800
900
1000
SkyTeam
0 5 10 15 20
0.0 0.5 1.0 1.5 2.0
500
600
700
800
900
oneworld
0 5 10 15
BetweennessDegreeBonacich PowerDamageModalE inv
# disconnected airports
size
of t
he g
iant
com
pone
nt (
# a
irpo
rts)
% disconnected airports
liance route network, or AARN. Although any alliance covers all the global air transportnetwork (ATN), all of the three alliances have global reach and their routes are among themost important of the ATN, in revenue and passengers transported. The AARNs are net-works with a truncated power-law distribution, the small-world property (i. e., low averagepath length) and high clustering coefficient. The Star Alliance network is the most similarto the global ATN, since it includes central airports (i. e., airports with high betweennesscentrality) with low connectedness (i. e., with low degree). For SkyTeam and oneworld isobserved a strong correlation between node degree and betweenness.
The robustness of AARNs has been analyzed through two methods: the multi-scale mea-sure of vulnerability, defined in [109], and the study of the effect on the size of giant compo-nent of the isolation of a fraction f of the airports covered by the alliance following severalnode selection criteria. In order to allow network vulnerability comparison, a normalizationprocedure has been defined for the multi-scale vulnerability. To perform the later analysis,the inverted adaptive strategy (IAS) for defining node selection criteria has been defined.Rather than starting with the connected network and trying to disconnect it as soon as pos-sible, IAS starts with a disconnected network, and adds new nodes in order to connect theoriginal network as late as possible. From the results of the robustness analysis of the globalATN in Chapter 2, it has been considered convenient to define a IAS in the analysis basedon reducing network efficiency.
Both methods of assessing network vulnerability coincide in that the most robust AARNis the Star Alliance route network, followed by SkyTeam and oneworld. In all cases, thenode selection criterion based in damage is the most effective for low values of f (around2%), while betweenness and inverted efficiency are the most effective for higher values of

44 l2 : robustness of airline alliances route network
f (between 2% and 9%). The later criteria disconnect the networks through breaks (abruptreductions of giant component). In fact, betweenness and inverted efficiency are the mosteffective for values of f when the first break occurs. The merit of the inverted efficiencycriterion is that breaks appear before the betweenness criteria, therefore the former beingthe most effective for some ranges of f . Interestingly, Star Alliance has a single break ofthe giant component for f ' 2.5%, while in the other two AARNs two breaks occur, of arelative size half of the value of the break of Star Alliance.
Airline alliances have appeared for economic and operational reasons, since they allowairlines benefit from economies of scale and density. A deeper insight of how AARNs areformed can include criteria based on robustness in the decisions shaping alliance evolution.Airlines seeking in which alliance participate should take into account the gain or loss ofrobustness of their marketed route network after joining the alliance. On the other hand,alliances seeking partners should balance the gain of coverage of the network with thevariation of robustness of their AARN.
The results of the analysis reported in this study allow to compare the results of therobustness of the alliance route networks with the global ATN, analyzed in Chapter 2. Asindicated in Chapter 1, the next step is to assess the robustness of individual airlines routenetwork. It must be noted that individual airlines have features that should make theirnetwork different from the AARNs and the global ATN. First, airlines route networks donot have the global scope of alliances, and it must also be considered that the airline routenetwork could depend on the business model adopted by each airline.
4L 3 : R O B U S T N E S S O F A I R L I N E S R O U T E N E T W O R K
4.1 abstract
Network strategies adopted by airline carriers have been a recurring subject in air trans-port research. Disruption of communication via air routes by intended causes (e. g., terror-ist attack on an airport) or unintended (e. g., weather) could be a serious drawback for theoperations of the affected airlines. Airlines should be able to reduce the effects of such inter-ruptions in order to ensure good communication through air transport (i. e., maximize therobustness of their network at a reasonable cost). To do this, a complex network approachprovides a network robustness analysis. As showed in Chapter 1, the literature review ofthe study of air transport route networks through an analysis of complex networks hashighlighted a lack of contributions to the study of the dynamic behavior of such networks.This behavior, however, has been analyzed for other transport networks or communicationsystems. Since airline carriers have different network strategies –especially considering theuse of hub airports where traffic intensifies and therefore exists greater risk to an attack onthe hub– the aim of this research is to study how airline carriers respond to intended andunintended airport closures depending on their network configurations.
4.2 introduction
The air transport industry is one of the most dynamic industries in the global economyand with one of the toughest competition. The liberalization of the airline sector [114]has produced very distinct business models among the airlines [115], being the design oftheir route networks a strategic factor, in addition to others such as the cost structure andprincipal services.
Most of the times the airlines make the election of operating a route based on the existingsupply and demand volumes. The robustness of its network is considered of secondaryimportance, although it can provide great improvement to the stability and security of theoperation of the carrier. Many domestic airlines are often associated with the image of acountry or region and produce a huge economic impact on its national and internationaleconomy. Collapse or critical error of airline network can produce high financial costs forthe airline and all its geographical area of influence [20].
The examination of flight networks (i. e., networks where the airports act as nodes con-nected if at least one direct route between them exists) through complex networks tech-niques can provide a deeper understanding of the behavior of airline networks when fac-ing random errors and intentional attacks. Recent articles have analyzed the topology of the
45

46 l3 : robustness of airlines route network
air transport network in order to understand their distribution and characteristics. Thesestudies have assessed the behavior of both global and regional air traffic networks [21, 22].Other studies have analyzed the robustness of the air transport network in order to deter-mine which airports can be critical if they cease operations [47, 50, 57]. However, airlines(the main users of such airports) have been rather unnoticed in the literature with just a fewstudies [33, 54]. Currently, there are two predominant business models: Full-Service Carriers(FSC) and Low-Cost Carriers (LCC). These types of carriers are characterized by having, re-spectively, hub-and-spoke (HS) and point-to-point (PP) network configurations, although inthe last case the model has size limitations due to network route density issues [116]. Giventhe differences in network topology their behavior in front of the malfunction of airports,its robustness, should be quite different.
The aim of this study is to study the robustness of airline networks when facing attacksand errors. In order to compare the robustness of the point-to-point and hub-and-spokenetwork configurations, the set of airlines to be studied will include Full-Service Carriersand Low-Cost Carriers.
4.3 robustness of configurations of airline networks
The business models and strategies of airlines strongly define their network structure. Tra-ditional airline network analysis measures its topology variables depending on traffic dis-tribution or concentration of frequencies [117, 118, 119]. One objective of these studies isto relate, compare and resemble an airline network to the HS and PP configurations. LCCadopt a PP network configuration because they connect city pairs that offer high load fac-tors and therefore optimize their operability. On the other hand, FSC often develop a HSconfiguration, offering more destinations by using one or more strategic hubs where largepassenger flows concentrate. This allow FSC to get a profitable load factor on routes apply-ing economies of scale [120].
Both HS and PP configurations can be described schematically through a network of fournodes, as shown on Figure 4.1. The HS configuration is represented on the right. It consistsof a central node or hub H connected to the other nodes, thus only three routes are neededto bond the four destinations. The PP configuration is shown on the left and it uses a totalof 6 routes to connect all possible node pairs. Generalizing these concepts for n airportsto connect all their destinations, the PP configuration requires n(n− 1)/2 routes while thebasic HS configuration works with only n − 1 [120]. It is also important to consider thetemporal distribution of each model, a fact directly related to the schedule of flights foreach airline. The hub of the HS configuration concentrates a high traffic density in spaceand time [119].
In the scheme proposed on Figure 4.1, the HS configuration concentrates a larger volumeof flights and passenger traffic in the switching times. For example, for being able to gofrom B to A and from C to A one must call at H. Therefore, it is necessary to coordinatethe arrivals of the first section and the exit of the second at the hub. This would give

4.3 robustness of configurations of airline networks 47
enough time to operate the connection without hindering the operability of the airline. ThePP traffic model is temporally and spatially more dispersed because airlines adopting thisconfiguration often operate from airports where planes sleep. The reasons for this strategyare both economic and political due to the lack of volume of demand on certain routes, theabsence of slots at airports and rotation need to optimize the operational fleet [120].
Figure 4.1: HS and PP configurations. Source: [120]
New Hub-and-Spoke and Point-to-Point Airline Network Configurations 531
modern carriers’ network design and, if possible, to account for differencesbetween LCC and FSC networks in Europe. This is a relatively new researchattempt with a few notable earlier exceptions. First, the problem of measuring thenetwork configuration is addressed in terms of the HS versus the PP network andnot only the hub concentration. Second, both the spatial and the temporal dimen-sions are assessed and combined in one picture in order to reach a broader andmore complete description of the network configuration. Third, the paper appliesempirical methods originating from social network analysis, i.e. the Freemanindex and what is called the Bonacich approach.
The paper is organized as follows. The second section provides some basic defi-nitions of airline networks. The third section explores the network configurationsof European FSCs and LCCs over the last 8 years. It reviews different measures ofspatial configuration, i.e. the traditional measures used by the transport literature,such as the Gini concentration index, and those developed by social network anal-ysis (the Freeman and the Bonacich centrality indexes). Finally, an operationalmeasure is provided to capture time-based centrality that is called the ‘connectiv-ity ratio’. The fourth section presents the overall results of the analysis. The fifthsection concludes the paper.
Network Definitions: A Review
There is no unique or even widely used definition of what exactly constitutes anHS or a PP network. Instead, a number of definitions coexist. From a networkdesign perspective the HS or PP network can be described by using a simplenetwork of four nodes. Figure 1 depicts two ways of connecting the nodes. Onthe left the nodes are fully connected through PP relations; on the right there is anHS relation. Airport H is the hub through which the other airports are connected.Note from Figure 1 that it takes three routes to connect all the nodes in the HSsystem, whereas this takes six routes in the PP network. Generalizing the exam-ple, given n airports, the possible number of city-pair combinations is: n(n – 1)/2.Hence, the pure PP system requires n(n – 1)/2 routes to cover all combinations,whereas the HS system allows carriers to cover the same airport combinationswith only n – 1 routes.Figure 1. Point-to-point network versus a hub-and-spoke networkFrom an air traffic management perspective, HS and PP structures are relatednot only to spatial concentration, but also to temporal concentration.
Burghouwt and De Wit (2003) explained the spatial configuration by the levelsof concentration of an airline network around one or a few central hubs. This
A
H
C B C B
H
A
Figure 1. Point-to-point network versus a hub-and-spoke network
Dow
nloa
ded
by [V
rije
Uni
vers
iteit
Am
ster
dam
] at 0
1:26
07
Sept
embe
r 201
1
However, the design of an airline network is a complex process adapted to maximize theprofitability of the airline. Thus it is not surprising to verify that the FSC and LCC businessmodels evolve depending on market opportunities. For example, in 2006 Iberia createdClickair as a LCC following a multi-brand strategy to maintain product differentiation.That same year Aer Lingus was redefined as a LCC because of the major survival threats itwas facing [33]. But robustness issues, although not usually considered in airline networkdevelopment, can affect seriously airline profitability in the long term, and have a relevantimpact in the economy.
The global air transport network is responsible for the movement of thousands of peopledaily. Considering its magnitude, any failure and inefficiency on flight operations causes ahigh economic cost for many business sectors. The volcanic eruption of Eyjafallajökull onMarch 14, 2010 in Iceland restricted the European air traffic and left areas out of operationfor 30 days [105]. It caused about 10 million delays on the operating airports. Economically,the revenue loss of the affected companies was estimated to be about $1.7b [106]. The conse-quences of Hurricane Sandy on the US East Coast, an area that holds major hubs connectingto Europe, resulted in 17, 000 cancelled flights and a loss of $0.5b in airlines revenue [121].The cost for the airlines of the 2010 Spanish controllers strike is estimated to be $134m [93].That same year snow and strikes cost easyJet £31m [94]. These examples show the largeeconomic consequences that affect both states and airlines themselves. Therefore, the ro-bustness of an airline network and its response to intended attacks or errors in its airportsis vital for the proper development of the sector.

48 l3 : robustness of airlines route network
4.4 methods
A total of 10 FSCs and 3 LCCs (see Table 4.1) route network have been analyzed.
During the summer period, and more precisely in August, there is a higher passengertraffic affecting directly on passengers relocation, being this period the one with the highestcontribution margins for the airlines. The route networks of scheduled flights of August2013 have been chosen for the analysis in order to be able to assume this analysis as staticwithout taking into account the relocation of passengers. The graph of the route network inthis period for each airline has been constructed. In the graph the vertices represent airportsand the edges represent the operated routes scheduled between them. Airports are selectedas nodes rather than cities, given that airports are the likely target of an intentional attack.Table 4.2 shows the list of selected airlines together with the number of airports (N), numberof connections (E) and other topological properties of their network. The network will betreated as undirected since just a small number of flights follow a "circular" pattern [21].
Airline Name Alliance Region
LH Lufthansa Star Alliance Europe
UA United Airlines Star Alliance North America
US US Airways Star Alliance North America
AB airberlin oneworld Europe
AA American Airlines oneworld North America
BA British Airways oneworld Europe
AF Air France SkyTeam Europe
MU China Eastern SkyTeam China
CZ China Southern SkyTeam China
DL Delta SkyTeam North America
FR Ryanair LCC Europe
U2 easyJet LCC Europe
WN Southwest Airlines LCC North America
Table 4.1: Airlines analyzed by IATA code
Only flights that are operated for the selected airlines are being considered thus dismiss-ing the flights operating under codesharing agreements. The aim of this study is to analyzethe robustness of the airline so adding codesharing flights could blur the results. For exam-ple, by considering the codesharing flights on the network of British Airways, Dallas/FortWorth would appear as the airport with the highest degree, followed by London Heathrow,O’Hare, Miami and London Gatwick airports. However BA is actually not allowed to flighta route from Dallas/Fort Worth to another American destination. If this airport had beenselected the resulting robustness would have been miscalculated. Disconnecting their real

4.4 methods 49
hubs (i. e., London Heathrow, London Gatwick and London City) BA would not have beenable to flight any route from Dallas/Fort Worth nor O’Hare nor Miami airports.
The sample of airlines includes FSC belonging to the main three current airline alliances(i. e., Star Alliance, oneworld and SkyTeam) analyzed in Chapter 3, fulfilling the require-ments of maximum number of airports, maximum number of passengers per year and/ormaximum income within their alliance as published respectively on their annual report for2012 [122, 123, 124]. Nevertheless, it must be noticed that airberlin was defined as a LCCbefore becoming part of oneworld but in this study has been considered as a FSC. This isbecause it belongs to an airline alliance and cooperates with other airlines, a feature uncom-mon for a LCC. The 3 selected LCC are those that operate a higher number of flights peryear.
N E 〈k〉 L C ν
LH 209 395 3.78 2.18 0.93 < 0
UA 362 933 5.15 2.57 0.91 < 0
US 203 408 4.02 2.26 0.96 < 0
AB 119 361 6.07 2.31 0.51 < 0
AA 272 523 3.85 2.3 0.94 < 0
BA 186 223 2.4 2.87 0.15 < 0
AF 178 258 2.9 2.42 0.46 < 0
MU 182 571 6.27 2.5 0.55 < 0
CZ 178 576 6.47 2.45 0.62 < 0
DL 328 882 5.38 2.38 0.88 < 0
FR 178 1, 396 15.69 2.16 0.44 < 0
U2 131 601 9.18 2.19 0.39 < 0
WN 86 507 11.79 1.97 0.72 < 0
Table 4.2: Main topological properties of airlines route network. The quantities measured are: numberof vertices N, number of edges E, characteristic path length L, clustering coefficient C,average degree 〈k〉, and type of correlations.
The static robustness analysis in air transport can evaluate the effect of errors (e. g.,weather inclemencies) or attacks (e. g., terrorism) in a route network. Network robustnesscan be assessed through the effect of the isolation of a fraction f of nodes on the size of thenetwork’s giant component. The network will be robust when the size of giant componentdecreases little for relativelt high values of f [19, 113]. The study of the robustness allows toevaluate the capacity of a network to avoid a malfunction when a fraction of its componentsis damaged [13]. Thus, the network resilience (i. e., the tolerance to attacks and congestioncaused by any malfunction) can be analyzed. Although there is a lack of robustness studies
50 l3 : robustness of airlines route network
on the air transport field, the study of the robustness of a network was one of the first issuesto be explored in complex networks literature [26].
In this study the network resilience to random failures and intentional attacks is analyzed.For the analysis of random failures, 1, 000 iterations of random airport closures for eachairline were simulated. Regarding the study against attacks, the established methodologyhas been to determine the order of importance of each airport according to a measure ofcentrality, and simulate an isolated attack on the airport with the highest value of thatcentrality. After each airport is disconnected the centralities are recalculated so that thenext attack strikes the new most central airport. The centralities used are the degree (i. e.,number of connections of each node) and betweenness (i. e., number of times a node isin the shortest path between two nodes). These are two of the standard measures of nodecentrality that have been used in Chapter 2 and Chapter 3. With each airport offlined thelargest connected component, or giant component, will be observed in order to see how thenetwork fragmentation evolves.
4.5 results
4.5.1 Topology
Considering the impact of network topology on robustness, an analysis of degree distribu-tions of the airline network of the selected airlines has been conducted. Figure 4.2 showsthe cumulative degree distribution plotted in double-logarithmic scale where P(k)cum isthe cumulative probability for a node to have degree k. There are three different behaviorspresent, and none of them follows a Poisson distribution as it would be expected for ran-dom graphs. This simple interpretation allows a distinction of the topological differencesof the business models.
On the top of Figure 4.2 there are the curves for FR, WN and U2. They have the lowestinitial gradient and a concave shape. This means that these carriers will have a more uni-form network connection distribution. This shallow slope highlights the presence of a highnumber of airports with 10 or more connections. This is the characteristic behavior of the PPconfiguration. Although having this configuration, LCC also have operating airport baseswith a high number of connections that they use for operating and maintenance purposes.For instance, Ryanair has around 50% of its airports with ten or more connections whilealready having 115 connections in London Stansted.
The next set of airlines, AB, MU, CZ follow a more linear distribution in the double-logarithmic scale that responds to a power-law degree distribution. airberlin, China Easternand China Southern have the highest values of mean degree 〈k〉 right below the first setof airlines, all of them LCCs (see Table 4.2). These carriers have an intermediate behaviorbetween the LCCs and the remaining analyzed FSCs.
Finally, the remaining carriers are FSCs. They have a steeper fall as a response to a slightlyincrease of the degree. This underlines the existence of many airports with 1 to 5 connec-
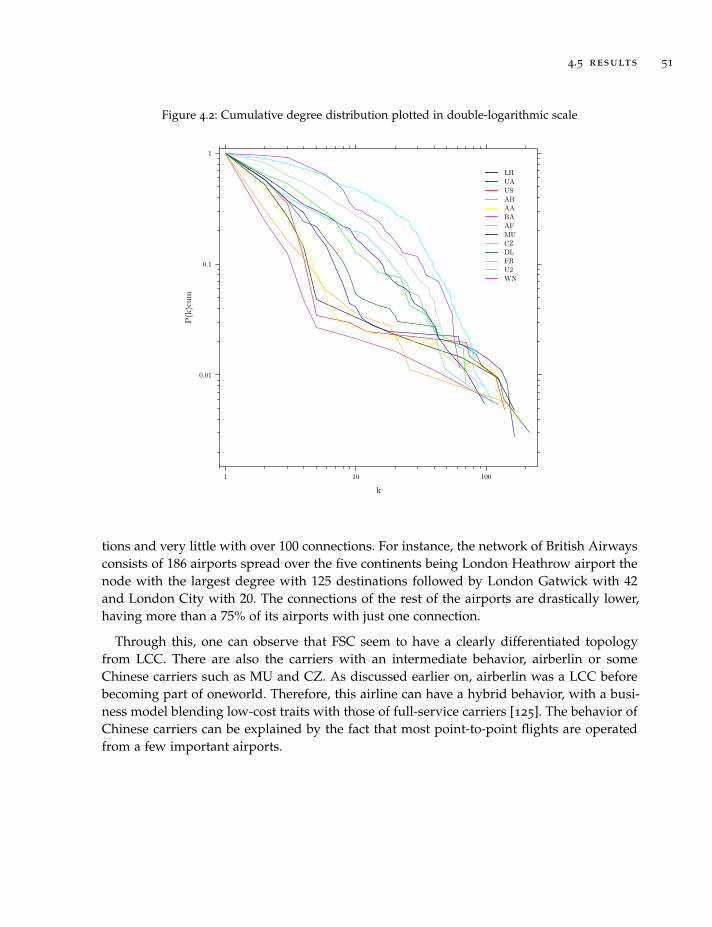
4.5 results 51
Figure 4.2: Cumulative degree distribution plotted in double-logarithmic scale
k
P(k
)cum
0.01
0.1
1
1 10 100
LHUAUSABAABAAFMUCZDLFRU2WN
tions and very little with over 100 connections. For instance, the network of British Airwaysconsists of 186 airports spread over the five continents being London Heathrow airport thenode with the largest degree with 125 destinations followed by London Gatwick with 42and London City with 20. The connections of the rest of the airports are drastically lower,having more than a 75% of its airports with just one connection.
Through this, one can observe that FSC seem to have a clearly differentiated topologyfrom LCC. There are also the carriers with an intermediate behavior, airberlin or someChinese carriers such as MU and CZ. As discussed earlier on, airberlin was a LCC beforebecoming part of oneworld. Therefore, this airline can have a hybrid behavior, with a busi-ness model blending low-cost traits with those of full-service carriers [125]. The behavior ofChinese carriers can be explained by the fact that most point-to-point flights are operatedfrom a few important airports.

52 l3 : robustness of airlines route network
4.5.2 Robustness
For the first five criteria, an adaptive strategy is adopted: each time a node is isolated, themeasure for node selection is recalculated for all still connected nodes, and the node withthe highest value is selected to be disconnected in the following step.
In order to assess the network robustness of the airlines in study, the behavior of eachone has been analyzed after the progressive closure of airports as a consequence of errorsand attacks. To evaluate the robustness to intentional attacks, two adaptive strategies basedon degree and betweenness centralities have been tested. In an adaptive strategy, each timea node is isolated, the centrality measure is recalculated for all still connected nodes, andthe node with the highest value is selected to be disconnected in the following step. It hasalso been assessed the behavior of the airlines route networks when suffering errors, i. e.random isolation of airports. A simulation of the behavior of the airlines facing errors hasbeen run 5, 000 times, and the average size of the giant component as a function of thenumber of airports isolated has been retained. The evolution of the decrease of size of giantcomponent of each airline for the three tests (degree- and betweenness-based attacks anderrors) can be found on Figure 4.3. The number (up) and percentage fraction f (down) ofdisconnected airports are depicted on the x axis.
As a consequence of the analysis of the robustness of airlines network against errors orunintended causes, it can be concluded that there are no major differences between thebehavior of FSC and LCC (see point-dotted line in Figure 4.3). The decrease of the giantcomponent against errors caused by the disconnection of a fraction of airports equal tof = 0.05 ranges from 5 to 10% of the initial size. This means that the network is notparticularly vulnerable to unintended attacks. Although there are not major differencesbetween FSC and LCC behaviors against errors, some minor differences can be observed.Reviewing the decrease caused by a f = 0.05 disconnection, LCC ranges 5− 5.5% whileFSC ranges 7− 10%. FSC are a little less resilient than LCC against unintended attacks.
The conclusion of the study on the response in front of intended attacks is that, overall,the best method of attack is the betweenness criterion as shown in Figure 4.3. In most ofthe cases, however, there are small differences between the degree and betweenness criteriaattacks because of the network size and its structure. These are networks not as large asthe ones previuosly analyzed in Chapter 2 and Chapter 3. Their size is between 86 to 362airports (see Table 4.2), where the airport that has the largest number of routes is usuallythe busiest. For Lufthansa, US Airways, American Airlines and British Airways the giantcomponent variation is completely identical for both criteria. The most significant changesare observed in the curves of China Eastern and Ryanair. It can be observed that they are theairlines with the most distinct degree and betweenness curves. The maximum differenceson the curves occur on China Eastern, for a given f = 0.104 with a corresponding size ofthe degree attack that exceeds in 31 airports the equivalent betweenness attack. And forRyanair, the maximal difference are 21 airports for a f = 0.270.
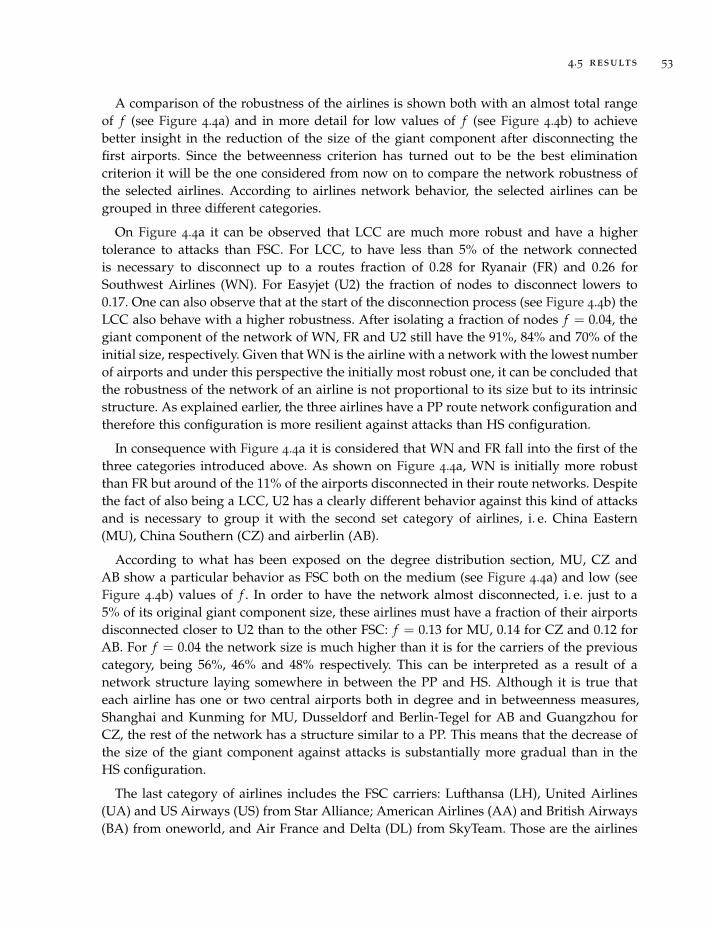
4.5 results 53
A comparison of the robustness of the airlines is shown both with an almost total rangeof f (see Figure 4.4a) and in more detail for low values of f (see Figure 4.4b) to achievebetter insight in the reduction of the size of the giant component after disconnecting thefirst airports. Since the betweenness criterion has turned out to be the best eliminationcriterion it will be the one considered from now on to compare the network robustness ofthe selected airlines. According to airlines network behavior, the selected airlines can begrouped in three different categories.
On Figure 4.4a it can be observed that LCC are much more robust and have a highertolerance to attacks than FSC. For LCC, to have less than 5% of the network connectedis necessary to disconnect up to a routes fraction of 0.28 for Ryanair (FR) and 0.26 forSouthwest Airlines (WN). For Easyjet (U2) the fraction of nodes to disconnect lowers to0.17. One can also observe that at the start of the disconnection process (see Figure 4.4b) theLCC also behave with a higher robustness. After isolating a fraction of nodes f = 0.04, thegiant component of the network of WN, FR and U2 still have the 91%, 84% and 70% of theinitial size, respectively. Given that WN is the airline with a network with the lowest numberof airports and under this perspective the initially most robust one, it can be concluded thatthe robustness of the network of an airline is not proportional to its size but to its intrinsicstructure. As explained earlier, the three airlines have a PP route network configuration andtherefore this configuration is more resilient against attacks than HS configuration.
In consequence with Figure 4.4a it is considered that WN and FR fall into the first of thethree categories introduced above. As shown on Figure 4.4a, WN is initially more robustthan FR but around of the 11% of the airports disconnected in their route networks. Despitethe fact of also being a LCC, U2 has a clearly different behavior against this kind of attacksand is necessary to group it with the second set category of airlines, i. e. China Eastern(MU), China Southern (CZ) and airberlin (AB).
According to what has been exposed on the degree distribution section, MU, CZ andAB show a particular behavior as FSC both on the medium (see Figure 4.4a) and low (seeFigure 4.4b) values of f . In order to have the network almost disconnected, i. e. just to a5% of its original giant component size, these airlines must have a fraction of their airportsdisconnected closer to U2 than to the other FSC: f = 0.13 for MU, 0.14 for CZ and 0.12 forAB. For f = 0.04 the network size is much higher than it is for the carriers of the previouscategory, being 56%, 46% and 48% respectively. This can be interpreted as a result of anetwork structure laying somewhere in between the PP and HS. Although it is true thateach airline has one or two central airports both in degree and in betweenness measures,Shanghai and Kunming for MU, Dusseldorf and Berlin-Tegel for AB and Guangzhou forCZ, the rest of the network has a structure similar to a PP. This means that the decrease ofthe size of the giant component against attacks is substantially more gradual than in theHS configuration.
The last category of airlines includes the FSC carriers: Lufthansa (LH), United Airlines(UA) and US Airways (US) from Star Alliance; American Airlines (AA) and British Airways(BA) from oneworld, and Air France and Delta (DL) from SkyTeam. Those are the airlines

54 l3 : robustness of airlines route network
Figure 4.3: Error and attack vulnerability of each airline transport networks. Plain line: betweennessattack; Dotted line: degree attack; Point-dotted line: error
Star Alliance
oneworld
SkyTeam
LCC
0.0 0.5 1.0 1.5 2.0 2.5 3.0
020
4060
8010
0
LH0 1 2 3 4 5 6 7
0.0 0.5 1.0 1.5 2.0 2.5 3.0
020
4060
8010
0
UA0 2 4 6 8 10 12
0.0 0.5 1.0 1.5 2.0 2.5
020
4060
8010
0
US0 1 2 3 4 5 6
0 2 4 6 8 10 12
020
4060
8010
0
AB0 5 10 15
0.0 0.5 1.0 1.5 2.0 2.5
020
4060
8010
0
AA0 1 2 3 4 5 6 7
0.0 0.5 1.0 1.5 2.0 2.5 3.0
020
4060
8010
0
BA0 1 2 3 4 5 6
0 1 2 3 4 5
020
4060
8010
0
AF0 2 4 6 8 10
0 2 4 6 8 10 12 14
020
4060
8010
0
MU0 5 10 15 20 25
0 5 10 15
020
4060
8010
0
CZ0 5 10 15 20 25
0 1 2 3 4 5
020
4060
8010
0
DL0 5 10 15
0 5 10 15 20 25 30
020
4060
8010
0
FR0 10 20 30 40 50
0 5 10 15
020
4060
8010
0
U20 5 10 15 20
0 5 10 15 20 25
020
4060
8010
0
WN0 5 10 15 20
3.0
# disconnected airports
% disconnected airports
size
of t
he g
iant
com
pone
nt (
a
irpo
rts)
%

4.5 results 55
where first attacks have a greater impact. After attacking around f = 0.04, the size of theirnetwork’s giant component plunges to under a 5% of the initial size generating a severestate of lack of operation capability (see Figure 4.4a). This behavior can be associated to theHS structure because once the most central nodes are attacked, the network is almost com-pletely disconnected. Given the fast pace of network breakage, in this case it is importantto assess the damage to lower fractions. For f = 0.01, the decrease of its size is not uniformand varies in relation to the existence of a single hub or more (i. e., multi-hub-and-spokeconfiguration).
From the results, it can be concluded that the FSC have a network configuration thatmakes them weak against intentional attacks. For example, Charlotte-Douglas, Phoenixand Philadelphia are the three main airports of US. They are followed by a less centralairport but with a big difference of centrality from the fifth, the Washington-National. Afterattacking the first two ( f = 0.01) the size of the giant component is reduced to 64%, max-imum robustness of this category, but after attacking the third and fourth ( f = 0.02) it isreduced to just 6%. On the other extreme there is BA which, as discussed above, centralizesits operations at Heathrow, followed by Gatwick and London City. By disconnecting onlya fraction of f = 0.01, i. e. the first two airports, the size of its giant component falls tothe 12% of its initial value, the minimum robustness of this category. For f = 0.02, afterclosing the third and forth airports, the size drops to 5%. By also considering that an attackagainst Heathrow would suppose the closure of the nearby airspace and consequently allthe airports in London, the network of British Airways would be virtually disconnectedand practically inoperative with a single attack.
It is also noteworthy the response to attacks of DL, the airline with the highest numberof airports in its network. After disconnecting its four most central airports, Atlanta, Min-neapolis St.Paul, Detroit and New York JFK its network still has half of its nodes connected.Atlanta stands out significantly in terms of degree and betweenness while the other threeairports, with lower indices, share similar values. After the attack on the next three airportsreaching f = 0.02, the size falls to 23%. AF shows a somewhat different behavior. Afterthe disconnection of its main hub Paris-Charles De Gaulle ( f = 0.01) the size of its giantcomponent is lowered to 38%. However, subsequent attacks to Paris-Orly and the otherairports downsize the giant component on a much more gradual way, since the degree andbetweenness indices decrease with a significantly lower rate than the other airlines. Thenetwork that remains after isolating Paris-Charles De Gaulle has a structure similar to a PPconfiguration, thus having a network structure similar to AB, MU and CZ but with a muchmore prominent central hub.
Such considerations can determine that the damage caused by intentional attacks to net-works with HS configuration is higher than to those with a PP configuration. The less hubsthe airline has, the more severe the damage is. The fact that the hubs are located closergeographically can increase the potential damage, because of the damages associated withthe disconnection of the nearby airspace as exemplified in [59].
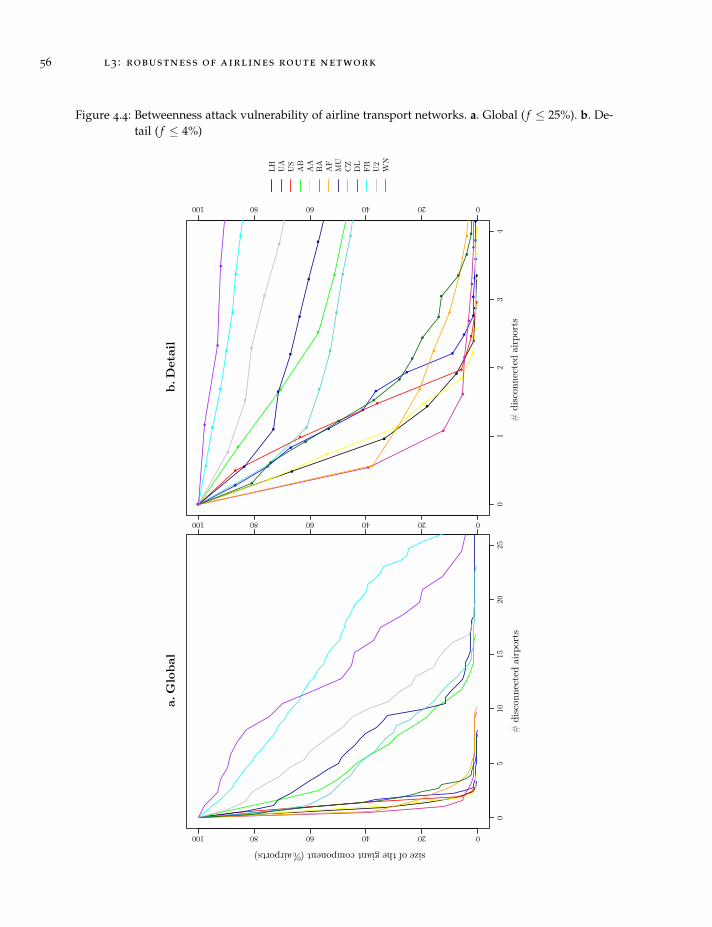
56 l3 : robustness of airlines route network
Figure 4.4: Betweenness attack vulnerability of airline transport networks. a. Global ( f ≤ 25%). b. De-tail ( f ≤ 4%)
# d
isco
nnec
ted
airp
orts
size of the giant component ( % airports)
05
1015
2025
020406080100
01
23
4
020406080100
●
●
●
●
●●
●
020406080100
●
●
●
●
●
●
●
●
●●
●●●
●●
●
●
●
●
●
●●
●
●
●
●
●
●
●
●
●
●
●●
●
●
●
●●
●
●●
●
●
●
●
●
●●
●
●
●
●
●
●
●
●
●●
●
●
●
●
●
●
●
●
●
●
●
●
●
●
●
●
●
●
●
●
●
●
●
●
●
●
●
●
●
●
●●●●●●●●●●●●●
●
●
●
LH
UA
US
AB
AA
BA
AF
MU
CZ
DL
FR
U2
WN
a.G
lob
alb
.Det
ail
# d
isco
nnec
ted
airp
orts
4.6 conclusions 57
4.6 conclusions
In this chapter the analysis of the network robustness of thirteen airlines based on error andattack simulation is performed. This simulation is run to verify if there is any difference onthe behavior of FSC and LCC business models.
The analysis has confirmed that FSC are more sensitive to intentional airport closure thanLCC. That is, disconnecting the FSC hubs causes a bigger harm than the disconnection ofthe base airports of a LCC. On top of it, WN and FR, the most important LCC at themoment turned out to be the most robust against attacks. Within the set of FSC there arethree airlines with a peculiar behavior. These are the Chinese MU and CZ, the only ones ina region outside of Europe or North America, and AB, which was a LCC before it joinedoneworld, which explains its differentiation.
Whereas Figure 4.4b grants a more realistic approach of an individual attack approach,Figure 4.4a allows to evaluate the consequences of attacking a higher number of airports.Comparing the robustness of the set of studied airlines, it can be concluded that it is possibleto attenuate the consequences of attacks by means of disposing of a multi-hub-and-spokenetwork. This network should be built by hub airports strategically disposed distant fromeach other in order to avoid larger problems related to airspace closure. This distance wouldallow an homogenization of the importance and centrality of the network without neitherlosing operability, nor the possibility of applying economies of scale. A second action toincrease robustness would be to schedule PP connections on the less central airports toconnect them if one of their hubs fails, achieving with this an structure somewhere betweenHS and PP. This second solution should take into account the supply and demand of eachroute in order not to hinder the profitability of the airlines.
It is worth mentioning that these considerations are based on topological criteria appliedto complex networks. In the day to day of the airlines there are many other aspects thatdefine airline strategies [126], that can have an impact on route structure and network strat-egy. Therefore the application of the proposed solution has to be evaluated deeply and indetail. In future studies the passenger flux could be taken into account and as a result an in-terpretation of the traffic loss that supposes the closure of airports may arise. Neverthelessa similar result should be expected because the most central airports are those that con-centrate a higher volume of aerial traffic in terms of flights and passengers. Despite theseconsiderations, further studies on this area will suppose a complement for the evaluationof the protection, stability and safety of each airline network according to their businessmodel.


Part III
C O N C L U S I O N S


5C O N C L U S I O N S
Currently, the literature analyzing air route networks through a complex network approachseems to be focused on the study of the topology of regional or global route networks asshown in Chapter 1. The literature review has allowed the definition of different dimensionsor levels of study characterized by different units of analysis. Therefore, and given that eachlevel has different characteristics and properties, three levels of study have been proposed:the global route network (L1), the airline alliance network (L2) and a particular airline network(L3). They can be separated in two different approaches: the airline management approach(L2 and L3) and the government policy approach (L1).
The study of the global route network (L1) looks at the competitive environment for air-lines and the general framework of air transport development. On the other hand, alliancesand airlines network studies (L2 and L3, respectively) focus their attention on companiesor organizations and it allows to determine the properties of organizational networks. Theanalysis of business networks (i. e., airlines or alliances) robustness could influence the de-cisions to open new routes or negotiate new codesharing agreements while the analysisof the robustness of route networks in a specific region (L1), whether they are continentsor countries, would help to make better decisions on air route development at the policy-making level. This thesis has analyzed the topology and robustness of these 3 proposedlevels.
In Chapter 2, the resilience of the first level proposed L1 –the global air transport network(ATN)– facing errors and intentional attacks has been assessed. This network is resilientfacing unintentional errors (i. e., random isolation of nodes), but has proven to be fragilefacing intentional attacks. The isolation of a small fraction of selected nodes can causeserious problems to the functioning of the global ATN. This behavior can be explained bythe characteristics of the ATN. The ATN is a scale-free (SF) network, with a truncated power-law distribution, thus less resistant to attacks than homogeneous networks. Furthermore,the ATN has additional properties that make it different to other SF networks, such asthe presence of central airports with a reduced number of connections. The presence ofthese airports can be explained by the socioeconomic and political factors [21], and also byoperational reasons (for instance, the adoption of hub-and-spoke route configurations byFull-Service Carriers).
Chapter 2 has assessed the effectiveness of five criteria of node selection to simulateattacks using an adaptive strategy, in terms of reduction of size of giant component as afunction of the fractions of isolated nodes f . The damage criterion is the most effectivefor f < 0.025, and that the betweenness criterion overcomes damage for higher valuesof f . The list of the first airports disconnected with each criterion has shown that while
61

62 conclusions
the betweenness criterion selects airports belonging to the ATN core (i. e., US, Europe andChina), damage criterion selects airports belonging to more peripheral communities of theATN. The security and performance of the most critical airports found in both criteria –FRA,ANC, CDG, AMS, FAI, SEA, PPT, etc. (see Table 2.1)– should be properly reviewed due thegreat impact that a possible malfunction would have on the entire ATN.
It has also been introduced the Bonacich power criterion to select the nodes to isolate inan intentional attack. Although it is not the most effective criterion to disconnect the ATN,for most of the values of f it has beaten the degree criterion. The Bonacich power criterionshould need to be tested on other networks to determine its true potential. For instance, itwould be interesting to apply this criterion to simulate attacks to networks where the degreecriterion is more effective than betweenness (e. g., the power grid). The modal analysiscriterion has proven to be the most effective to attack power grid networks [19], but it hasnot been so effective when used in the ATN. It has just proven to be effective when more ofthe 10% of airports were disconnected. This fact shows that different SF networks can havedifferent properties regarding its strength facing intentional attacks.
The results of the comparison of effectiveness of criteria of node selection to attack theATN shows that this network has a multicommunity structure where central airports (i. e.,airports with the highest betweenness centrality) are the most critical infrastructures of thenetwork in terms of its resilience facing attacks. The most central airports are the hubs ofFull-Service Carriers, whose routes have a hub-and-spoke structure.
Descending one level to L2, Chapter 3 has analyzed the airline alliances route network(AARNs). It revealed that the AARNs are networks with a truncated power-law distribution,the small-world property (i. e., low average path length) and high clustering coefficient. TheStar Alliance network has been the most similar to the global ATN, since it includes centralairports (i. e., airports with high betweenness centrality) with low connectedness (i. e., withlow degree). For SkyTeam and oneworld has been observed a strong correlation betweennode degree and betweenness.
The robustness of AARNs has been analyzed through two methods: the multi-scale mea-sure of vulnerability, defined in [109], and the study of the effect on the size of giant compo-nent of the isolation of a fraction f of the airports, covered by the alliance following severalnode selection criteria. In order to allow network vulnerability comparison, a normalizationprocedure has been defined for the multi-scale vulnerability. To perform the later analysis,it has been defined the inverted adaptive strategy (IAS) for defining node selection criteria.Rather than starting with the connected network and trying to disconnect it as soon as pos-sible, IAS starts with a disconnected network, and adds new nodes in order to connect theoriginal network as late as possible. From the results of the robustness analysis of the globalATN in Chapter 2, it has been considered convenient to define a IAS in the analysis basedon reducing network efficiency.
Both methods of assessing network vulnerability has coincided in that the most robustAARN is the Star Alliance route network, followed by SkyTeam and oneworld. In all cases,

conclusions 63
the node selection criterion based in damage is the most effective for low values of f (around2%), while betweenness and inverted efficiency are the most effective for higher valuesof f (between 2% and 9%). These results are comparable with ATN robustness results,where betweenness was the most effective criterion although damage criterion had betterperformance for lower airports disconnected. In fact, for AARNs, betweenness and invertedefficiency has been the most effective for values of f when the first break had occured. Themerit of the inverted efficiency criterion is that breaks appeared before the betweennesscriteria, therefore the former being the most effective for some ranges of f . Interestingly,Star Alliance had a single break of the giant component for f ' 2.5%, while in the othertwo AARNs two breaks occured, of a relative size half of the value of the break of StarAlliance.
Finally, reaching the last level L3, Chapter 4 has analyzed the network robustness ofthirteen airlines based on error and attack simulation. This simulation has been run toverify if there is any difference on the behavior of FSC and LCC business models. Theanalysis has confirmed that FSC are more sensitive to intended airport closure than LCC.That is, disconnecting the FSC hubs causes a bigger harm than the disconnection of the baseairports of the LCC. On top of it, Southwest Airlines and Ryanair, the most important LCCat the moment turned out to be the most robust against attacks. Within the set of FSC therewere three airlines with a peculiar behavior. These were China Eastern and China Southern,the only ones in a region outside of Europe or North America; and airberlin, which was aLCC before it joined oneworld, which explains its differentiation.
Following these results it would be possible to attenuate the consequences by means ofdisposing of a multi-hub-and-spoke network. This network should be built by hub airportsstrategically disposed distant from each other in order to avoid larger problems relatedto airspace closure. This distance would allow an homogenization of the importance andcentrality of the network without neither losing operability, nor the possibility of applyingeconomies of scale. A second action to increase robustness would be to schedule PP con-nections on the less central airports to connect them if one of their hubs fails, achievingwith this an structure somewhere between HS and PP. This second solution should takeinto account the demand of each route in order not to hinder the rentability of the airlines.
As seen in Chapter 1, the study of air transport networks through complex network the-ory is in an early phase of development, and is a stream of research valued for the scientificcommunity. This thesis has contributed to the literature defining three levels of analysisfor air transport networks, analyzing the topology of examples of these networks, and per-forming a study of static robustness to errors and attacks of air route networks at thesethree levels. Some of the contributions of this thesis, such as the inverted adaptive strat-egy and the normalized multi-scale measure of vulnerability defined in Chapter 3, or thenode selection criteria based on efficiency and Bonacich centrality introduced in Chapter 3and Chapter 2, respectively, can be tested on other real-world networks. This could bring tothe scientific community a deeper understanding of the determinants of static robustness ofcomplex networks. Future studies on static robustness can take into account the passenger
64 conclusions
flux through airports, to get a more realistic interpretation of the traffic loss that supposesthe closure of airports of high traffic. Nevertheless, a similar result than the one obtainedin the performed analysis should be expected, since the most central airports are those thatconcentrate a higher volume of aerial traffic in terms of flights and passengers.
An avenue of further research could be the assessment of dynamic robustness of airroute networks, analyzing phenomena such as cascading failures, congestion or jamming(e. g., [50, 127]). When studying these phenomena, it should be taken into account that thedisconnection of the first airports could increase network damage (e. g., the closure of anairport could cause the congestion of others), or its reduction (e. g., passengers could berelocated in flights to secondary airports).
Therefore, the study of air transport networks through complex network theory is aninteresting and relevant research field. Further studies on this area will transfer findingsobtained in complex network theory to air transport research, and they will be for sure animportant contribution for the protection, stability and safety of passengers, airlines andthe rest of stakeholders of the air transport sector.

B I B L I O G R A P H Y
[1] Murray, A.T. (2011). An overview of network vulnerability modeling approaches.GeoJournal, 78(2):209–221. ISSN 0343-2521. doi:10.1007/s10708-011-9412-z.
[2] Castells, M. (1996). The rise of the network society: The information age: Economy, society,and culture, volume 1. Massachusetts: Blackwell Publishing.
[3] Derudder, B. and Witlox, F. (2008). Mapping world city networks through airlineflows: context, relevance, and problems. Journal of Transport Geography, 16(5):305–312.
[4] Taylor, P.J., Derudder, B., Hoyler, M., and Ni, P. (2012). New regional geographies ofthe world as practised by leading advanced producer service firms in 2010. Transac-tions of the Institute of British Geographers.
[5] O’Connor, K. and Fuellhart, K. (2012). Cities and air services: the influence of theairline industry. Journal of Transport Geography, 22(April 2011):46–52. ISSN 09666923.doi:10.1016/j.jtrangeo.2011.10.007.
[6] Tranos, E. (2012). The causal effect of the Internet infrastructure on the economicdevelopment of European city regions. Spatial Economic Analysis, 7(3):319–337.
[7] Liu, X., Derudder, B., and García, C.G. (2013). Exploring the co-evolution of thegeographies of air transport aviation and corporate networks. Journal of TransportGeography, 30:26–36. ISSN 09666923. doi:10.1016/j.jtrangeo.2013.02.002.
[8] Grubesic, T.H., Matisziw, T.C., Murray, a.T., and Snediker, D. (2008). ComparativeApproaches for Assessing Network Vulnerability. International Regional Science Review,31(1):88–112. ISSN 0160-0176. doi:10.1177/0160017607308679.
[9] Zanin, M. and Lillo, F. (2013). Modelling the air transport with complex networks: Ashort review. The European Physical Journal Special Topics, 215(1):5–21. ISSN 1951-6355.doi:10.1140/epjst/e2013-01711-9.
[10] Reggiani, A. (2013). Network resilience for transport security: Some methodologicalconsiderations. Transport Policy, 28:63–68. ISSN 0967070X. doi:10.1016/j.tranpol.2012.09.007.
[11] Barrat, A., Barthélemy, M., Pastor-Satorras, R., and Vespignani, A. (2004). Thearchitecture of complex weighted networks. Proceedings of the National Academyof Sciences of the United States of America, 101(11):3747–52. ISSN 0027-8424. doi:10.1073/pnas.0400087101.
65
66 bibliography
[12] Barthélemy, M. (2003). Crossover from scale-free to spatial networks. EurophysicsLetters (EPL), 63(6):915–921. ISSN 0295-5075. doi:10.1209/epl/i2003-00600-6.
[13] Boccaletti, S., Latora, V., Moreno, Y., Chavez, M., and Hwang, D. (2006). Complexnetworks: Structure and dynamics. Physics Reports, 424(4-5):175–308. ISSN 03701573.doi:10.1016/j.physrep.2005.10.009.
[14] Costa, L.d.F., Oliveira, O.N., Travieso, G., Rodrigues, F.A., Villas Boas, P.R., Antiqueira,L., Viana, M.P., and Correa Rocha, L.E. (2011). Analyzing and modeling real-worldphenomena with complex networks: a survey of applications. Advances in Physics,60(3):329–412. ISSN 0001-8732. doi:10.1080/00018732.2011.572452.
[15] Porta, S., Crucitti, P., and Latora, V. (2006). The network analysis of urban streets: adual approach. Physica A: Statistical Mechanics and its Applications, 369(2):853–866.
[16] Crucitti, P., Latora, V., and Porta, S. (2006). Centrality measures in spatial networksof urban streets. Physical Review E, 73(3):4. ISSN 1539-3755. doi:10.1103/PhysRevE.73.036125.
[17] Seaton, K.A. and Hackett, L.M. (2004). Stations, trains and small-world networks.Physica A: Statistical Mechanics and its Applications, 339(3):635–644.
[18] Latora, V. and Marchiori, M. (2002). Is the Boston subway a small-world network? Physica A: Statistical Mechanics and its Applications, 314(1):109–113. doi:10.1016/S0378-4371(02)01089-0.
[19] Petreska, I., Tomovski, I., Gutierrez, E., Kocarev, L., Bono, F., and Poljansek, K. (2010).Application of modal analysis in assessing attack vulnerability of complex networks.Communications in Nonlinear Science and Numerical Simulation, 15(4):1008–1018. ISSN10075704. doi:10.1016/j.cnsns.2009.05.002.
[20] Guimerà, R. and Amaral, L.a.N. (2004). Modeling the world-wide airport network.The European Physical Journal B - Condensed Matter, 38(2):381–385. ISSN 1434-6028. doi:10.1140/epjb/e2004-00131-0.
[21] Guimerà, R., Mossa, S., Turtschi, A., and Amaral, L.a.N. (2005). The worldwideair transportation network: Anomalous centrality, community structure, and cities’global roles. Proceedings of the National Academy of Sciences of the United States of Amer-ica, 102(22):7794–9. ISSN 0027-8424. doi:10.1073/pnas.0407994102.
[22] Guida, M. and Maria, F. (2007). Topology of the Italian airport network: A scale-freesmall-world network with a fractal structure? Chaos, Solitons & Fractals, 31(3):527–536.ISSN 09600779. doi:10.1016/j.chaos.2006.02.007.
[23] Bagler, G. (2008). Analysis of the airport network of India as a complex weightednetwork. Physica A: Statistical Mechanics and its Applications, 387:2972–2980. ISSN03784371. doi:10.1016/j.physa.2008.01.077.

bibliography 67
[24] Wang, J., Mo, H., Wang, F., and Jin, F. (2011). Exploring the network structure andnodal centrality of China’s air transport network: A complex network approach. Jour-nal of Transport Geography, 19(4):712–721. ISSN 09666923. doi:10.1016/j.jtrangeo.2010.08.012.
[25] Broder, A., Kumar, R., Maghoul, F., Raghavan, P., Rajagopalan, S., Stata, R., Tomkins,A., and Wiener, J. (2000). Graph structure in the web. Computer networks, 33(1):309–320.
[26] Albert, R., Jeong, H., and Barabási, A.L. (2000). Error and attack tolerance of complexnetworks. Nature, 406(6794):378–82. ISSN 1476-4687. doi:10.1038/35019019.
[27] ICAO (2004). Manual on the Regulation of International Air Transport (Doc 9626, Part 4).
[28] Porter, M.E. (2008). The five competitive forces that shape strategy. Harvard businessreview, 86(1):78–93, 137. ISSN 0017-8012.
[29] Anderson, W.P., Gong, G., and Lakshmanan, T. (2005). Competition in a Deregu-lated Market for Air Travel: The U.S. Domestic Experience and Lessons for GlobalMarkets. Research in Transportation Economics, 13(05):3–25. ISSN 07398859. doi:10.1016/S0739-8859(05)13001-7.
[30] Albers, S., Koch, B., and Ruff, C. (2005). Strategic alliances between airlines andairports?theoretical assessment and practical evidence. Journal of Air Transport Man-agement, 11(2):49–58. ISSN 09696997. doi:10.1016/j.jairtraman.2004.08.001.
[31] Brueckner, J.K. and Pels, E. (2005). European airline mergers, alliance consolidation,and consumer welfare. Journal of Air Transport Management, 11(1):27–41.
[32] Administration, U.G.S. (2012). Airline Open Skies Agreements. http://www.gsa.gov/portal/content/103191. Accessed: 2014-01-27.
[33] Cento, A. (2009). The Airline Industry. Contributions to Economics. Physica-VerlagHD, Heidelberg. ISBN 978-3-7908-2087-4. doi:10.1007/978-3-7908-2088-1.
[34] Brueckner, J.K. (2001). The economics of international codesharing: an analysis ofairline alliances. International Journal of Industrial Organization, 19(10):1475–1498. ISSN01677187. doi:10.1016/S0167-7187(00)00068-0.
[35] Brueckner, J.K., Lee, D.N., and Singer, E.S. (2011). Alliances, Codesharing, AntitrustImmunity, and International Airfares: Do Previous Patterns Persist? Journal of Compe-tition Law and Economics, 7(3):573–602. ISSN 1744-6414. doi:10.1093/joclec/nhr005.
[36] ICAO (2012). Fair competition in international air transport. http://www.icao.int/
Meetings/atconf6/Documents/WorkingPapers/ATConf6-wp004_en.pdf. Accessed:2014-01-27.
68 bibliography
[37] Bootsma, P.D. (1997). Analysis and Design Tools for European Hinterland Hubs. Universityof Twente. ISBN 978-9-0365-1047-9.
[38] Rietveld, P. and Brons, M. (2001). Quality of hub-and-spoke networks; the effects oftimetable co-ordination on waiting time and rescheduling time. Journal of Air TransportManagement, 7(4):241–249.
[39] Burghouwt, G. and De Wit, J. (2005). Temporal configurations of European airlinenetworks. Journal of Air Transport Management, 11(3):185–198. ISSN 09696997. doi:10.1016/j.jairtraman.2004.08.003.
[40] Brueckner, J.K. (2004). Network Structure and Airline Scheduling. The journal ofindustrial economics, 52(2):291–312.
[41] Barabási, A.L. and Oltvai, Z.N. (2004). Network biology: understanding the cell’sfunctional organization. Nature reviews. Genetics, 5(2):101–13. ISSN 1471-0056. doi:10.1038/nrg1272.
[42] Fonseca, R., Ratnasamy, S., Zhao, J., Ee, C., Culler, D., Shenker, S., and Stoica, I.(2005). Beacon vector routing: Scalable point-to-point routing in wireless sensor-nets. In Proceedings of the 2nd conference on Symposium on Networked Systems Design& Implementation-Volume 2, pages 329–342. USENIX Association.
[43] Suau-Sanchez, P. and Burghouwt, G. (2012). Connectivity levels and the com-petitive position of Spanish airports and Iberia’s network rationalization strategy,2001—2007. Journal of Air Transport Management, 18(1):47–53. ISSN 09696997. doi:10.1016/j.jairtraman.2011.08.004.
[44] Li-Ping, C., Ru, W., Hang, S., Xin-Ping, X., Jin-Song, Z., Wei, L., and Xu, C. (2003).Structural Properties of US Flight Network. Chinese Physics Letters, 20(8):1393–1396.ISSN 0256-307X. doi:10.1088/0256-307X/20/8/362.
[45] Chi, L.P. and Cai, X. (2004). Structural Changes Caused By Error and Attack Tolerancein Us Airport Network. International Journal of Modern Physics B, 18(17n19):2394–2400.ISSN 0217-9792. doi:10.1142/S0217979204025427.
[46] Li, W. and Cai, X. (2004). Statistical analysis of airport network of China. PhysicalReview E, 69(4):1–6. ISSN 1539-3755. doi:10.1103/PhysRevE.69.046106.
[47] Hu, X.B. and Di Paolo, E. (2008). A Genetic Algorithm Based on Complex NetworksTheory for the Management of Airline Route Networks. Nature Inspired CooperativeStrategies for Optimization (NICSO 2007), pages 495–505.
[48] Xu, Z. and Harriss, R. (2008). Exploring the structure of the U.S. intercity passenger airtransportation network: a weighted complex network approach. GeoJournal, 73(2):87–102. ISSN 0343-2521. doi:10.1007/s10708-008-9173-5.

bibliography 69
[49] Han, D., Qian, J., and Liu, J. (2009). Network topology and correlation features affili-ated with European airline companies. Physica A: Statistical Mechanics and its Applica-tions, 388(1):71–81. ISSN 03784371. doi:10.1016/j.physa.2008.09.021.
[50] Lacasa, L., Cea, M., and Zanin, M. (2009). Jamming transition in air transportationnetworks. Physica A: Statistical Mechanics and its Applications, 388(18):3948–3954. ISSN03784371. doi:10.1016/j.physa.2009.06.005.
[51] Reggiani, A., Signoretti, S., Nijkamp, P., and Cento, A. (2009). Network measures incivil air transport: A case study of Lufthansa. Networks, Topology and Dynamics, pages257–282.
[52] Zanin, M., Lacasa, L., Cea, M., and Crístobal, S. (2009). A dynamical model for theair transportation network. In 23rd European Conference on Modelling and Simulation.Madrid.
[53] Liu, H.K., Zhang, X.L., and Zhou, T. (2010). Structure and external factors of chinesecity airline network. Physics Procedia, 3(5):1781–1789. ISSN 18753892. doi:10.1016/j.phpro.2010.07.019.
[54] Reggiani, A., Nijkamp, P., and Cento, A. (2010). Connectivity and concentration inairline networks: a complexity analysis of Lufthansas network. European Journal ofInformation Systems, 19(4):449–461.
[55] Zhang, J., Cao, X.B., Du, W.B., and Cai, K.Q. (2010). Evolution of Chinese airportnetwork. Physica A: Statistical Mechanics and its Applications, 389(18):3922–3931. ISSN03784371. doi:10.1016/j.physa.2010.05.042.
[56] Dang, Y. and Li, W. (2011). Comparative Analysis on Weighted Network Structureof Air Passenger Flow of China and US. Journal of Transportation Systems Engineeringand Information Technology, 11(3):156–162. ISSN 15706672. doi:10.1016/S1570-6672(10)60127-4.
[57] Liu, H., Hu, X.B., Yang, S., Zhang, K., and Di Paolo, E. (2011). Application of ComplexNetwork Theory and Genetic Algorithm in Airline Route Networks. TransportationResearch Record: Journal of the Transportation Research Board, 2214(-1):50–58. ISSN 0361-1981. doi:10.3141/2214-07.
[58] Mo, H. and Wang, J. (2011). Structural evolution of China’s air transport network.Proceedings 2011 International Conference on Transportation, Mechanical, and Electrical En-gineering (TMEE), pages 21–24. doi:10.1109/TMEE.2011.6199138.
[59] Wilkinson, S.M., Dunn, S., and Ma, S. (2011). The vulnerability of the European airtraffic network to spatial hazards. Natural Hazards, 60(3):1027–1036. ISSN 0921-030X.doi:10.1007/s11069-011-9885-6.

70 bibliography
[60] Zeng, X., Tang, X., and Jiang, K. (2011). Empirical Study of Chinese Airline Net-work Structure Based on Complex Network Theory. Journal of Transportation Sys-tems Engineering and Information Technology, 11(6):175–181. ISSN 15706672. doi:10.1016/S1570-6672(10)60157-2.
[61] Cai, K.Q., Zhang, J., Du, W.B., and Cao, X.B. (2012). Analysis of the Chinese airroute network as a complex network. Chinese Physics B, 21(2):028903. ISSN 1674-1056.doi:10.1088/1674-1056/21/2/028903.
[62] Dang, Y. and Peng, L. (2012). Hierarchy of Air Freight Transportation NetworkBased on Centrality Measure of Complex Networks. Journal of Transportation Sys-tems Engineering and Information Technology, 12(3):109–114. ISSN 15706672. doi:10.1016/S1570-6672(11)60207-9.
[63] Grady, D., Thiemann, C., and Brockmann, D. (2012). Robust classification of salientlinks in complex networks. Nature communications, 3:864. ISSN 2041-1723. doi:10.1038/ncomms1847.
[64] Jia, T. and Jiang, B. (2012). Building and analyzing the US airport network basedon en-route location information. Physica A: Statistical Mechanics and its Applications.ISSN 03784371. doi:10.1016/j.physa.2012.03.006.
[65] Lin, J. (2012). Network analysis of China’s aviation system, statistical and spatialstructure. Journal of Transport Geography, 22:109–117. ISSN 09666923. doi:10.1016/j.jtrangeo.2011.12.002.
[66] Sawai, H. (2012). Reorganizing a new generation airline network based on an Ant-Colony Optimization-inspired Small-World network. 2012 IEEE Congress on Evolution-ary Computation, pages 1–8. doi:10.1109/CEC.2012.6256125.
[67] Wang, H. and Wen, R. (2012). Analysis of air traffic network of China. 2012 24thChinese Control and Decision Conference (CCDC), pages 2400–2403. doi:10.1109/CCDC.2012.6244385.
[68] Cardillo, A., Gómez-Gardeñes, J., Zanin, M., Romance, M., Papo, D., Pozo, F.D., andBoccaletti, S. (2013). Emergence of network features from multiplexity. ScientificReports, 3:1–6. ISSN 2045-2322. doi:10.1038/srep01344.
[69] Fleurquin, P., Ramasco, J.J., and Eguiluz, V.M. (2013). Systemic delay propagation inthe US airport network. Scientific reports, 3.
[70] Zhang, H.t., Yu, T., Sang, J.p., and Zou, X.w. (2014). Dynamic fluctuation model ofcomplex networks with weight scaling behavior and its application to airport net-works. Physica A: Statistical Mechanics and its Applications, 393:590–599. ISSN 03784371.doi:10.1016/j.physa.2013.09.005.

bibliography 71
[71] Yook, S.H., Jeong, H., and Barabási, A.L. (2002). Modeling the Internet’s large-scaletopology. Proceedings of the National Academy of Sciences of the United States of America,99(21):13382–6. ISSN 0027-8424. doi:10.1073/pnas.172501399.
[72] Watts, D.J. and Strogatz, S.H. (1998). Collective dynamics of ’small-world’ networks.Nature, 393(6684):440–2. ISSN 0028-0836. doi:10.1038/30918.
[73] Watts, D.J. (1999). The dynamics of networks between order and randomness. Princetonuniversity press.
[74] Barthélemy, M. (2011). Spatial networks. Physics Reports, 499(1-3):1–101. ISSN03701573. doi:10.1016/j.physrep.2010.11.002.
[75] Pastor-Satorras, R. and Vespignani, A. (2004). A statistical physics approach. CambridgeUniversity Press.
[76] Latora, V. and Marchiori, M. (2005). Vulnerability and protection of infrastructurenetworks. Physical Review E, 71(1):015103. ISSN 1539-3755. doi:10.1103/PhysRevE.71.015103.
[77] Buhl, J., Gautrais, J., Solé, R.V., Kuntz, P., Valverde, S., Deneubourg, J.L., and Ther-aulaz, G. (2004). Efficiency and robustness in ant networks of galleries. The EuropeanPhysical Journal B, 42(1):123–129. ISSN 1434-6028. doi:10.1140/epjb/e2004-00364-9.
[78] Albert, R., Albert, I., and Nakarado, G. (2004). Structural vulnerability of the NorthAmerican power grid. Physical Review E, 69(2):1–4. ISSN 1539-3755. doi:10.1103/PhysRevE.69.025103.
[79] Sporns, O. (2011). The human connectome: a complex network. Annals of the NewYork Academy of Sciences, 1224(1):109–25. ISSN 1749-6632. doi:10.1111/j.1749-6632.2010.05888.x.
[80] Latora, V. and Marchiori, M. (2001). Efficient Behavior of Small-World Networks. Phys-ical Review Letters, 87(19):3–6. ISSN 0031-9007. doi:10.1103/PhysRevLett.87.198701.
[81] Newman, M.E.J. (2001). The structure of scientific collaboration networks. Proceedingsof the National Academy of Sciences of the United States of America, 98(2):404–9. ISSN 0027-8424. doi:10.1073/pnas.021544898.
[82] Csermely, P. (2004). Strong links are important, but weak links stabilize them. Trendsin biochemical sciences, 29(7):331–4. ISSN 0968-0004. doi:10.1016/j.tibs.2004.05.004.
[83] Latora, V. and Marchiori, M. (2003). Economic small-world behavior in weightednetworks. The European Physical Journal B - Condensed Matter, 32(2):249–263. ISSN1434-6028. doi:10.1140/epjb/e2003-00095-5.

72 bibliography
[84] Sporns, O., Tononi, G., and Edelman, G.M. (2000). Connectivity and complexity: therelationship between neuroanatomy and brain dynamics. Neural networks : the officialjournal of the International Neural Network Society, 13(8-9):909–22. ISSN 0893-6080.
[85] Pastor-Satorras, R., Vázquez, A., and Vespignani, A. (2001). Dynamical and Corre-lation Properties of the Internet. Physical Review Letters, 87(25):3–6. ISSN 0031-9007.doi:10.1103/PhysRevLett.87.258701.
[86] De Castro, R. and Grossman, J. (1999). Famous trails to Paul Erdos. The MathematicalIntelligencer, 21(3):51–53.
[87] Amaral, L.a.N., Scala, A., Barthélemy, M., and Stanley, H.E. (2000). Classes of small-world networks. Proceedings of the National Academy of Sciences of the United States ofAmerica, 97(21):11149–52. ISSN 0027-8424. doi:10.1073/pnas.200327197.
[88] Jeong, H., Tombor, B., Albert, R., Oltvai, Z.N., and Barabási, A.L. (2000). The large-scale organization of metabolic networks. Nature, 407(6804):651–4. ISSN 0028-0836.doi:10.1038/35036627.
[89] Jeong, H., Mason, S.P., Barabási, A.L., and Oltvai, Z.N. (2001). Lethality and centralityin protein networks. Nature, 411(6833):41–2. ISSN 0028-0836. doi:10.1038/35075138.
[90] Solé, R.V. and Valverde, S. (2001). Information transfer and phase transitions in amodel of internet traffic. Physica A: Statistical Mechanics and its Applications, 289(3-4):595–605. ISSN 03784371. doi:10.1016/S0378-4371(00)00536-7.
[91] Barabási, A.L. (1999). Emergence of Scaling in Random Networks. Science,286(5439):509–512. ISSN 00368075. doi:10.1126/science.286.5439.509.
[92] Erdos, P. and Rényi, A. (1959). On random graphs. Publicationes Mathematicae Debrecen,6:290–297.
[93] Economía, A. (2010). España calcula costos de la huelga de los contro-ladores aéreos. http://www.americaeconomia.com/negocios-industrias/
espana-calcula-costos-de-la-huelga-de-los-controladores-aereos. Accessed:2014-01-27.
[94] NewStatesman (2011). Snow and strikes cost easyJet £31m. http://www.
newstatesman.com/2011/01/airline-snow-costs-double-half. Accessed: 2014-01-27.
[95] Cohen, R., Erez, K., Ben-Avraham, D., and Havlin, S. (2000). Resilience of the internetto random breakdowns. Physical review letters, 85(21):4626–8. ISSN 1079-7114.
[96] Callaway, D.S., Newman, M.E.J., Strogatz, S.H., and Watts, D.J. (2000). Networkrobustness and fragility: percolation on random graphs. Physical review letters,85(25):5468–71. ISSN 0031-9007.
bibliography 73
[97] Cohen, R., Erez, K., Ben-Avraham, D., and Havlin, S. (2001). Breakdown of the In-ternet under Intentional Attack. Physical Review Letters, 86(16):3682–3685. ISSN 0031-9007. doi:10.1103/PhysRevLett.86.3682.
[98] Cohen, R., Ben-Avraham, D., and Havlin, S. (2002). Percolation critical exponentsin scale-free networks. Physical Review E, 66(3):1–4. ISSN 1063-651X. doi:10.1103/PhysRevE.66.036113.
[99] Moreno, Y., Gómez, J.B., and Pacheco, A.F. (2002). Instability of scale-free networksunder node-breaking avalanches. Europhysics Letters (EPL), 58(4):630–636. ISSN 0295-5075. doi:10.1209/epl/i2002-00442-2.
[100] Moreno, Y., Pastor-Satorras, R., Vázquez, A., and Vespignani, A. (2003). Critical loadand congestion instabilities in scale-free networks. Europhysics Letters (EPL), 62(2):292–298. ISSN 0295-5075. doi:10.1209/epl/i2003-00140-7.
[101] Valverde, S. and Solé, R.V. (2002). Self-organized critical traffic in parallel computernetworks. Physica A: Statistical Mechanics and its Applications, 312(3-4):636–648. ISSN03784371. doi:10.1016/S0378-4371(02)00872-5.
[102] Gorman, S.P., Schintler, L.a., Kulkarni, R., and Stough, R. (2004). The revenge ofdistance: vulnerability analysis of critical information infrastructure. Journal of Con-tingencies and Crisis Management, 12(2):48–63. ISSN 0966-0879. doi:10.1111/j.0966-0879.2004.00435.x.
[103] Bonacich, P. (1987). Power and centrality: A family of measures. American journal ofsociology, 92(5):1170–1182.
[104] Park, J. and Zhang, A. (1998). Airline alliances and partner firms’ outputs. Transporta-tion Research Part E: Logistics and Transportation Review, 34(4):245–255.
[105] Brooker, P. (2010). Fear in a handful of dust: aviation and the Icelandic volcano.Significance, 7(3):112–115.
[106] Mazzocchi, M., Hansstein, F., Ragona, M., et al. (2010). The 2010 volcanic ash cloudand its financial impact on the European airline industry. In CESifo Forum, volume 11,pages 92–100. Ifo Institute for Economic Research at the University of Munich.
[107] Crucitti, P., Latora, V., Marchiori, M., and Rapisarda, A. (2003). Efficiency of scale-freenetworks: error and attack tolerance. Physica A: Statistical Mechanics and its Applica-tions, 320:622–642. ISSN 03784371. doi:10.1016/S0378-4371(02)01545-5.
[108] Wei, P., Chen, L., and Sun, D. (2014). Algebraic connectivity maximization of an airtransportation network: The flight routes’ addition/deletion problem. TransportationResearch Part E: Logistics and Transportation Review, 61:13–27.
74 bibliography
[109] Boccaletti, S., Buldú, J., Criado, R., Flores, J., Latora, V., Pello, J., and Romance,M. (2007). Multiscale vulnerability of complex networks. Chaos (Woodbury, N.Y.),17(4):043110. ISSN 1054-1500. doi:10.1063/1.2801687.
[110] Cook, K.S., Emerson, R.M., Gillmore, M.R., and Yamagishi, T. (1983). The distributionof power in exchange networks: Theory and experimental results. American journal ofsociology, pages 275–305.
[111] Gaggero, A.A. and Bartolini, D. (2012). The Determinants of Airline Alliances. Journalof Transport Economics and Policy, 46(3):399–414.
[112] Wan, X., Zou, L., and Dresner, M. (2009). Assessing the price effects of airline allianceson parallel routes. Transportation Research Part E: Logistics and Transportation Review,45(4):627–641.
[113] Mishkovski, I., Biey, M., and Kocarev, L. (2011). Vulnerability of complex networks.Communications in Nonlinear Science and Numerical Simulation, 16(1):341–349. ISSN10075704. doi:10.1016/j.cnsns.2010.03.018.
[114] Goetz, A.R. and Vowles, T.M. (2009). The good, the bad, and the ugly: 30 years ofUS airline deregulation. Journal of Transport Geography, 17(4):251–263. ISSN 09666923.doi:10.1016/j.jtrangeo.2009.02.012.
[115] Lohmann, G. and Koo, T.T. (2012). The airline business model spectrum. Journal ofAir Transport Management, pages 3–5. ISSN 09696997. doi:10.1016/j.jairtraman.2012.10.005.
[116] de Wit, J.G. and Zuidberg, J. (2012). The growth limits of the low cost carrier model.Journal of Air Transport Management, 21:17–23. ISSN 09696997. doi:10.1016/j.jairtraman.2011.12.013.
[117] Bowen, J. (2002). Network Change, Deregulation, and Access in the Global AirlineIndustry. Economic Geography, 78(4):425–439.
[118] McShan, W.S. (1986). An economic analysis of the hub-and-spoke routing strategy in theairline industry. Transportation Center, Northwestern University.
[119] Reynolds-Feighan, A. (2001). Traffic distribution in low-cost and full-service carriernetworks in the US air transportation market. Journal of Air Transport Management,7(5):265–275.
[120] Alderighi, M., Cento, A., Nijkamp, P., and Rietveld, P. (2007). Assessment of NewHub-and-Spoke and Point-to-Point Airline Network Configurations. Transport Re-views, 27(5):529–549.
[121] IATA (2013). The impact of Hurricane Sandy. http://www.iata.org/publications/
economics/Documents/hurricane-sandy-impact-nov2012.pdf. Accessed: 2014-01-27.

bibliography 75
[122] Star Alliance (2013). Star Alliance Facts and Figures Nov 2012. http://www.
staralliance.com/en/about/member_airlines/. Accessed: 2014-01-27.
[123] oneworld (2013). oneworld at a glance. http://www.oneworld.com/
news-information/oneworld-fact-sheets/. Accessed: 2014-01-27.
[124] SkyTeam (2013). SkyTeam & Members Fact Sheet. http://www.skyteam.com/en/
About-us/Press/Facts-and-Figures/. Accessed: 2014-01-27.
[125] Klophaus, R., Conrady, R., and Fichert, F. (2012). Low cost carriers going hybrid:Evidence from Europe. Journal of Air Transport Management, 23:54–58. ISSN 09696997.doi:10.1016/j.jairtraman.2012.01.015.
[126] Daft, J. and Albers, S. (2013). A conceptual framework for measuring airline businessmodel convergence. Journal of Air Transport Management, 28:47–54. ISSN 09696997.doi:10.1016/j.jairtraman.2012.12.010.
[127] Tadic, B., Rodgers, G.J., and Thurner, S. (2007). Transport on Complex Networks: Flow,Jamming and Optimization. International Journal of Bifurcation and Chaos, 17(7):21.
[128] André, M. (2012). classicthesis: A Classic Thesis Style for LaTeX and LyX. http:
//code.google.com/p/classicthesis/. Accessed: 2014-01-27.
[129] Gabor, C. and Tamas, N. (2006). The igraph software package for complex networkresearch. InterJournal, Complex Systems:1695.


colophon
This document was typeset using the typographical classicthesis [128] compiled withLATEX. Calculations and figures have been performed with R and the igraph library [129].