advertiment. lʼaccés als continguts dʼaquesta tesi queda … · y para acabar, un agradecimiento...
TRANSCRIPT

ADVERTIMENT. Lʼaccés als continguts dʼaquesta tesi queda condicionat a lʼacceptació de les condicions dʼúsestablertes per la següent llicència Creative Commons: http://cat.creativecommons.org/?page_id=184
ADVERTENCIA. El acceso a los contenidos de esta tesis queda condicionado a la aceptación de las condiciones de usoestablecidas por la siguiente licencia Creative Commons: http://es.creativecommons.org/blog/licencias/
WARNING. The access to the contents of this doctoral thesis it is limited to the acceptance of the use conditions setby the following Creative Commons license: https://creativecommons.org/licenses/?lang=en
I
DIETARY FACTORS INFLUENCING CALCIUM AND PHOSPHORUS
UTILIZATION IN BROILER CHICKEN
TESI DOCTORAL PRESENTADA PER:
Manel Hamdi
SOTA LA DIRECCIÓ DEL DOCTOR:
José Francisco Pérez Hernández
PER ACCEDIR AL GRAU DE DOCTOR DINS EL PROGRAMA DE DOCTORAT
EN PRODUCCIÓ ANIMAL DEL DEPARTAMENT DE CIÈNCIA ANIMAL I DELS
ALIMENTS
Bellaterra, 2016
II
José Francisco Pérez Hernández , professor titular del Departament de Ciència Animal i
dels Aliments de la Facultat de Veterinària de la Universitat Autònoma de Barcelona,
Certifique:
Que la memòria titulada “Dietary factors influencing calcium and phosphorus
utilization in broiler chicken”, presentada per Manel Hamdi amb la finalitat d’optar al
grau de Doctor en Veterinària amb menció internacional, ha estat realitzada sota la
seva direcció i, considerant-la acabada, autoritzen la seva presentació perquè sigui
jutjada per la comissió corresponent.
I perquè consti als efectes oportuns, signen la present a Bellaterra, 20 de setembre de
2016.
Dr. José Francisco Pérez Hernández

III
″Emporte dans ta mémoire, pour le reste de ton existence, les choses positives
qui ont surgi au milieu des difficultés. Elles seront une preuve de tes capacités et te
redonneront confiance devant tous les obstacles″.
Paulo Coelho

IV
V
A Nadia
A mes très chères Parents
Ce n’est pas par hasard, quand je suis arrivé jusqu’au bout.
C’est grâce à vous, seulement vous, qui m’a donné des racines et des ailes.

VI

VII
Agradecimientos/Acknowledges
Hace tres años, cuando acabé mi master, Francisco me hizo la propuesta de
realizar una tesis bajo su supervisión. Sin pensarlmelo mucho, le dije que sí. Desde
aquel día, empezó una nueva aventura en mi vida, la mejor, durante la cual he aprendido
y disfrutado un montón.
Hoy es el momento de agradecer a todas aquellas personas que de una forma u
otra me han ayudado a emprender esta aventura.
Primero, y como más importante, Francisco, te agradezco de una forma muy
especial y sincera ofrecerme esta oportunidad y por todas las horas que dedicaste para el
desarrollo de esta tesis. Gracias a tus ideas y tu alta disponibilidad a la hora de trabajar,
hemos logrado buenos resultados. Tu paciencia y tu motivación han sido fundamentales
para mi formación. He disfrutado muchísimo desarrollando este trabajo contigo.
David, muchas gracias por tu disponibilidad, humildad, ideas y consejos,
siempre te molestaba con mis preguntas pero siempre tenías respuestas perfectamente
adecuadas de un gran profesional.
Josep, Ana, Roser, Susana y Lorena gracias por aceptarme para formar parte
de vuestro grupo, que para mí representa mi familia en España.
Rosa, creo que la mayoría de mi tiempo que he estado por aquí lo he pasado
contigo en la granja o en el laboratorio, trabajando y ″peleando″. Miles de Gracias por
tu ayuda y espero que tengas muy pronto todo lo que deseas en este mundo.
Olga, he aprendido mucho de ti durante mis largos días en el laboratorio. Te
echamos mucho de menos en el grupo. A Blas y a Carmen, gracias por vuestra ayuda
siempre que me hizo falta.
Agradezco a toda la gente maravillosa que conocí en Nutrición y que me
ayudaron mucho, algunos de ellos ya les he visto acabar, como Edgar, Gemma, Roger,
Sergio, Ramon, Clara, Ester…Y a otras que espero verles acabar muy pronto Sergi,
Emili, Paola, Yanan, Raquel, Laia, Marta, Agustina, Wellington, Lluís, Carmen,
Anna… que sin ellos nunca podría haber acabado, sobre todo aquellos días
interminables de sacrificio en la granja.
VIII
A todo el equipo de la granja Cristobal, Ramon, Sergi, Roger, Sonia, Pepe y
Ramon por haberme aguantado todas mis exigencias.
Un agradecimiento muy especial a mis mejores amigos Inés y Ali que siempre
estaban presentes cuando les necesitaba.
Y para acabar, un agradecimiento muy especial a mis hermanos Maher y Moez
y a toda mi familia que gracias al Skype y a pesar de la distancia han vivido conmigo el
día a día de estos últimos años.
″La vie est un défi à relever, un bonheur à mériter, une aventure à tenter″
Mère Teresa
IX
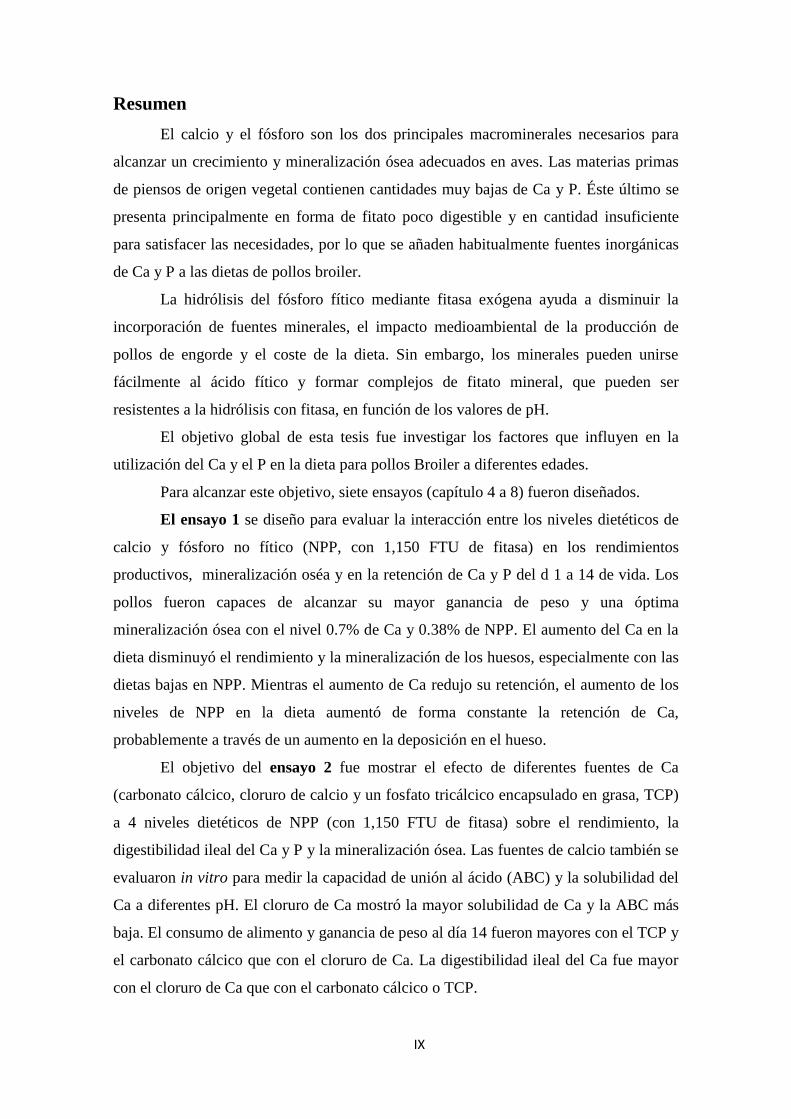
Resumen
El calcio y el fósforo son los dos principales macrominerales necesarios para
alcanzar un crecimiento y mineralización ósea adecuados en aves. Las materias primas
de piensos de origen vegetal contienen cantidades muy bajas de Ca y P. Éste último se
presenta principalmente en forma de fitato poco digestible y en cantidad insuficiente
para satisfacer las necesidades, por lo que se añaden habitualmente fuentes inorgánicas
de Ca y P a las dietas de pollos broiler.
La hidrólisis del fósforo fítico mediante fitasa exógena ayuda a disminuir la
incorporación de fuentes minerales, el impacto medioambiental de la producción de
pollos de engorde y el coste de la dieta. Sin embargo, los minerales pueden unirse
fácilmente al ácido fítico y formar complejos de fitato mineral, que pueden ser
resistentes a la hidrólisis con fitasa, en función de los valores de pH.
El objetivo global de esta tesis fue investigar los factores que influyen en la
utilización del Ca y el P en la dieta para pollos Broiler a diferentes edades.
Para alcanzar este objetivo, siete ensayos (capítulo 4 a 8) fueron diseñados.
El ensayo 1 se diseño para evaluar la interacción entre los niveles dietéticos de
calcio y fósforo no fítico (NPP, con 1,150 FTU de fitasa) en los rendimientos
productivos, mineralización oséa y en la retención de Ca y P del d 1 a 14 de vida. Los
pollos fueron capaces de alcanzar su mayor ganancia de peso y una óptima
mineralización ósea con el nivel 0.7% de Ca y 0.38% de NPP. El aumento del Ca en la
dieta disminuyó el rendimiento y la mineralización de los huesos, especialmente con las
dietas bajas en NPP. Mientras el aumento de Ca redujo su retención, el aumento de los
niveles de NPP en la dieta aumentó de forma constante la retención de Ca,
probablemente a través de un aumento en la deposición en el hueso.
El objetivo del ensayo 2 fue mostrar el efecto de diferentes fuentes de Ca
(carbonato cálcico, cloruro de calcio y un fosfato tricálcico encapsulado en grasa, TCP)
a 4 niveles dietéticos de NPP (con 1,150 FTU de fitasa) sobre el rendimiento, la
digestibilidad ileal del Ca y P y la mineralización ósea. Las fuentes de calcio también se
evaluaron in vitro para medir la capacidad de unión al ácido (ABC) y la solubilidad del
Ca a diferentes pH. El cloruro de Ca mostró la mayor solubilidad de Ca y la ABC más
baja. El consumo de alimento y ganancia de peso al día 14 fueron mayores con el TCP y
el carbonato cálcico que con el cloruro de Ca. La digestibilidad ileal del Ca fue mayor
con el cloruro de Ca que con el carbonato cálcico o TCP.
X
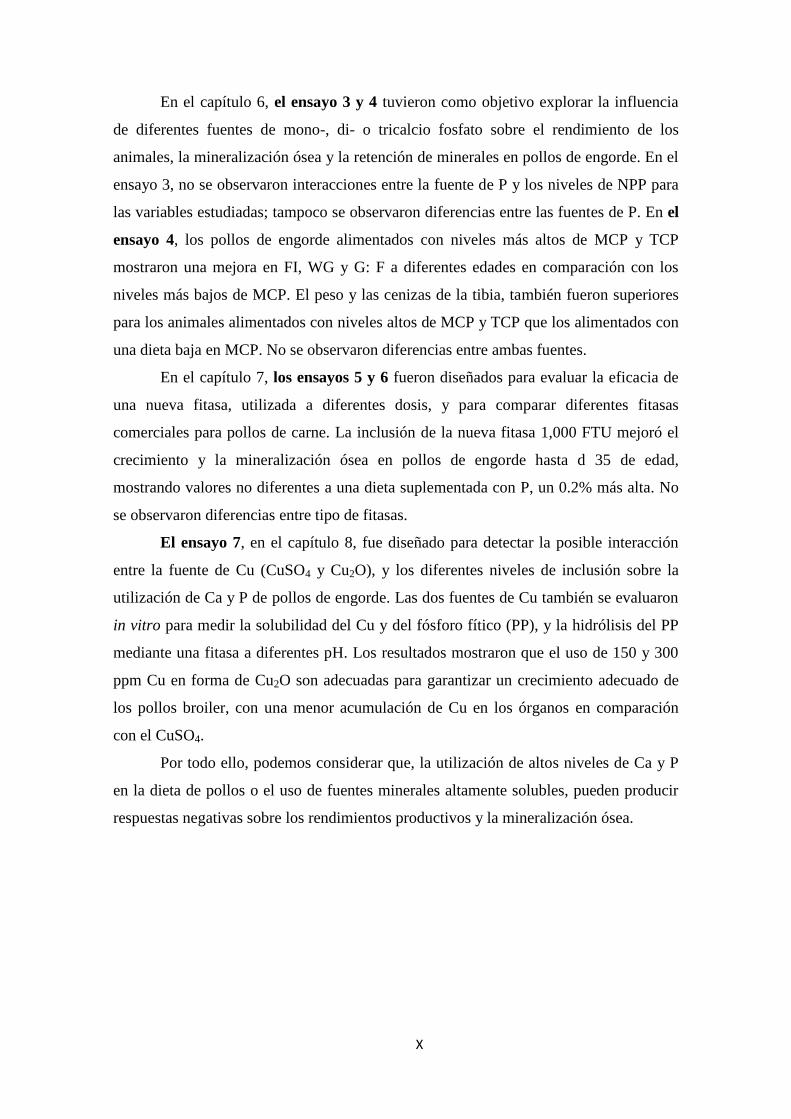
En el capítulo 6, el ensayo 3 y 4 tuvieron como objetivo explorar la influencia
de diferentes fuentes de mono-, di- o tricalcio fosfato sobre el rendimiento de los
animales, la mineralización ósea y la retención de minerales en pollos de engorde. En el
ensayo 3, no se observaron interacciones entre la fuente de P y los niveles de NPP para
las variables estudiadas; tampoco se observaron diferencias entre las fuentes de P. En el
ensayo 4, los pollos de engorde alimentados con niveles más altos de MCP y TCP
mostraron una mejora en FI, WG y G: F a diferentes edades en comparación con los
niveles más bajos de MCP. El peso y las cenizas de la tibia, también fueron superiores
para los animales alimentados con niveles altos de MCP y TCP que los alimentados con
una dieta baja en MCP. No se observaron diferencias entre ambas fuentes.
En el capítulo 7, los ensayos 5 y 6 fueron diseñados para evaluar la eficacia de
una nueva fitasa, utilizada a diferentes dosis, y para comparar diferentes fitasas
comerciales para pollos de carne. La inclusión de la nueva fitasa 1,000 FTU mejoró el
crecimiento y la mineralización ósea en pollos de engorde hasta d 35 de edad,
mostrando valores no diferentes a una dieta suplementada con P, un 0.2% más alta. No
se observaron diferencias entre tipo de fitasas.
El ensayo 7, en el capítulo 8, fue diseñado para detectar la posible interacción
entre la fuente de Cu (CuSO4 y Cu2O), y los diferentes niveles de inclusión sobre la
utilización de Ca y P de pollos de engorde. Las dos fuentes de Cu también se evaluaron
in vitro para medir la solubilidad del Cu y del fósforo fítico (PP), y la hidrólisis del PP
mediante una fitasa a diferentes pH. Los resultados mostraron que el uso de 150 y 300
ppm Cu en forma de Cu2O son adecuadas para garantizar un crecimiento adecuado de
los pollos broiler, con una menor acumulación de Cu en los órganos en comparación
con el CuSO4.
Por todo ello, podemos considerar que, la utilización de altos niveles de Ca y P
en la dieta de pollos o el uso de fuentes minerales altamente solubles, pueden producir
respuestas negativas sobre los rendimientos productivos y la mineralización ósea.

XI
Summary
Calcium and phosphorus are the two major macro-minerals required for proper
growing performance and bone mineralization in poultry. Feed ingredients from plant
sources contain very low amounts of Ca and P, mostly in phytate molecules. Thus, they
are inadequate in meeting their requirements, and inorganic sources of Ca and P are
usually added to poultry diets. The hydrolysis of phytate-P with exogenous phytase
helps to decrease the incorporation of mineral sources, the environmental impact of
broiler production, as well as the dietary cost. However, minerals can readily bind to
phytic acid and form mineral phytate complexes that may be resistant to hydrolysis by
phytase, depending on the pH values. The global aim of this thesis was to investigate
dietary factors influencing Ca and P utilization by broiler chicks of different ages.
In order to achieve this objective, a series of seven trials (Chapters 4 to 8) were
designed.
Trial 1 was designed to evaluate the interaction between dietary levels of Ca and
non-phytate phosphorus (NPP, with 1,150 FTU of phytase) on broiler performance,
bone ash and whole-body fractional retention of Ca and P from d 1 to 14 of life.
Broilers achieved their greatest weight gain (WG) and bone mineralization with 0.7%
Ca and 0.38% NPP. Increasing dietary Ca decreased performance and bone
mineralization, especially of the low NPP diets. While increasing Ca reduced its
fractional retention, the increase in the levels of dietary NPP steadily increased the
fractional retention of Ca, likely through an increase in bone deposition.
The aim of Trial 2 was to screen the influence of different Ca sources
(limestone, Ca chloride, and a fat-encapsulated tri-calcium phosphate, TCP) at four
dietary levels of NPP (with 1,150 FTU of phytase) on performance, ileal digestibility of
Ca and P, and bone mineralization in broilers. Calcium sources were also evaluated in
vitro to measure acid-binding capacity (ABC) and Ca solubility at different pHs. Ca
chloride showed the highest solubility of Ca and the lowest ABC. The FI and WG on
d14 were higher with TCP and limestone than with Ca chloride. Calcium ileal
digestibility was higher with Ca chloride than with limestone or TCP.
In Chapter 6, Trials 3 and 4 aimed to explore the influence of different sources
of mono-, di- or tri-calcium phosphate on animal performance, bone mineralization and
mineral retention in broilers. In Trial 3, no interactions were observed between the P
source and the NPP levels for any variable; no differences were observed among P

XII
sources. In Trial 4, broiler chickens fed with higher levels of MCP and TCP showed an
improvement in FI, WG and G:F (gain feed ratio) at different stages, as compared to
lower levels of MCP. Tibia weight and ash were also higher for animals fed with high
MCP and TCP than for chicks of the low MCP diet. No differences were observed
between either source.
In Chapter 7, Trials 5 and 6 were designed to evaluate the efficacy of a new
phytase and to compare different commercial phytases used at different levels in broiler
diets. The inclusion of 1,000 FTU from the new phytase improved growth performance
and bone mineralization in broilers up to d 35, reaching values no different of a diet
supplemented with a 0.2% higher P content. No differences were observed among the
phytase types.
Trial 7, in Chapter 8, was designed to screen the possible interaction between
the Cu source (CuSO4 and Cu2O) supplemented at different levels on the utilization of
Ca and P by broilers. The two Cu sources were also evaluated in vitro to measure Cu
and phytic phosphorus (PP) solubility and PP hydrolysis by phytase at different pHs.
The results showed that the use of 150 ppm Cu and 300 ppm Cu of Cu2O is adequate to
ensure broiler growth performance and a lower Cu organ accumulation in comparison to
CuSO4.
Taking the results all together, the use of high dietary levels of Ca and P or the
use of highly soluble mineral sources can produce negative responses on bird
performance and bone mineralization.
XIII
Index of contents
Resumen ......................................................................................................................... IX
Summary ......................................................................................................................... XI
Index of contents .......................................................................................................... XIII
Index of tables ............................................................................................................. XIX
Index of figures ........................................................................................................... XXII
Abbreviations ............................................................................................................ XXIII
CHAPTER 1: General introduction 1
CHAPTER 2: Literature Review 7
2.1. Importance of Calcium and Phosphorus for broiler chickens 9
2.1.1. Calcium ............................................................................................... 9
2.1.2. Phosphorus .......................................................................................... 9
2.2. The symptoms of a Ca and P deficiency in poultry 10
2.3. Phosphorus and Calcium requirements 12
2.3.1. Calcium ............................................................................................. 12
2.3.2. Phosphorus ........................................................................................ 13
2.3.3. Ca:P ratio ........................................................................................... 15
2.4. Phosphorus sources and availability 16
2.4.1. Vegetable sources of P ..................................................................... 16
2.4.1.1. Phytase ........................................................................................... 20
2.4.2. Mineral sources of phosphorus ......................................................... 27
2.5. Calcium sources and availability 28
2.5.1. Vegetable source of Calcium ........................................................... 28
2.5.2. Mineral sources of Calcium .............................................................. 28
2.6. Calcium and Phosphorus homeostasis in chickens 29

XIV
2.7. Factors affecting calcium and phosphorus nutrition 32
2.7.1. Interactions between dietary calcium and phosphorus ...................... 32
2.7.1.1. Formation of calcium phytate complexes ...................................... 32
2.7.1.2. Formation of calcium phosphate complexes ................................. 32
2.7.2. Intestinal pH ...................................................................................... 32
2.7.3. Calcium particle size ......................................................................... 34
2.7.4. Phytase interactions ........................................................................... 35
2.7.4.1. With Calcium ................................................................................. 35
2.7.4.2. With Copper .................................................................................. 35
CHAPTER 3: Objectives and experimental design 37
CHAPTER 4: The effect of different levels of calcium and phosphorus and their
interaction on the performance of young broilers 41
4.1. Abstract 43
4.2. Introduction 44
4.3. Materials and methods 45
4.3.1. Bird Management, Husbandry, Experimental Design and Diets ...... 45
4.3.2. Growth Performance and Sampling .................................................. 46
4.3.3. Laboratory Analyses ......................................................................... 46
4.3.4. Calculations and Statistical Analyses ................................................ 48
4.4. Results 48
4.5. Discussion 51
CHAPTER 5: Calcium sources and their interaction with the level of non-phytate
phosphorus affect performance and bone mineralization in broiler chickens 57
5.1. Abstract 59
5.2. Introduction 60
5.3. Materials and methods 61
5.3.1. Calcium Sources ................................................................................ 61
5.3.2. Calcium Solubility and Acid-Binding Capacity (in vitro) ................ 61

XV
5.3.3. Bird Management, Husbandry, Experimental Design and Diets (in
vivo) 62
5.3.4. Experimental procedures ................................................................... 62
5.3.5. Laboratory analyses........................................................................... 64
5.3.6. Calculations and statistical analyses ................................................. 64
5.4. Results 64
5.4.1. Calcium solubility and Acid-Binding Capacity ................................ 64
5.4.2. Bird performance and bone mineralization ....................................... 66
5.5. Discussion 68
5.5.1. Calcium solubility and Acid-Binding Capacity ................................ 68
5.5.2. Broiler performance and bone mineralization ................................... 70
CHAPTER 6 : Comparison of how different mineral phosphorus sources affect
performance, bone mineralization and phosphorus retention in broilers 73
6.1. Abstract 75
6.2. Introduction 76
6.3. Materials and methods 77
6.3.1. Birds managment, husbandry, study design and diets ...................... 77
6.3.1.1. Experiment 1 .................................................................................. 77
6.3.1.2. Experiment 2 .................................................................................. 79
6.3.2. Sample collection and processing ..................................................... 81
6.3.2.1. Experiment 1 .................................................................................. 81
6.3.2.2. Experiment 2 .................................................................................. 81
6.3.3. Laboratory analyses........................................................................... 81
6.3.4. Calculations ....................................................................................... 81
6.3.5. Statistical analyses............................................................................. 82
6.4. Results 82
6.4.1. Experiment 1 (comparison between MCP and DCP)........................ 82
6.4.1.1. Growth performance and bone mineralization .............................. 82

XVI
6.4.2. Experiment 2 (comparison between TCP and MCP) ........................ 83
6.4.2.1. Growth Performance and Bone Mineralization ............................. 83
6.4.2.2. Apparent retention of calcium and phosphorus ............................. 84
6.5. Discussion 85
CHAPTER 7: Effect of microbial phytases and the dietary calcium and
phosphorus level on the productive performance, and bone mineralization of
Broilers 89
7.1. Abstract 91
7.2. Introduction 92
7.3. Materials and methods 93
7.3.1. Animal ethics..................................................................................... 93
7.3.2. Phytases ............................................................................................. 94
7.3.3. Dietary treatments ............................................................................. 94
7.3.3.1. Experiment 1 .................................................................................. 94
7.3.3.2. Experiment 2 .................................................................................. 95
7.3.4. Management of birds ......................................................................... 97
7.3.4.1. Experiment 1 .................................................................................. 97
7.3.4.2. Experiment 2 ................................................................................. 97
7.3.5. Sample collection and processing ..................................................... 97
7.3.5.1. Experiment 1 .................................................................................. 97
7.3.5.2. Experiment 2 .................................................................................. 97
7.3.6. Laboratory analyses........................................................................... 98
7.3.7. Statistical Analyses ........................................................................... 98
7.4. Results 99
7.4.1. Experiment 1 ..................................................................................... 99
7.4.1.1. Growth performance ...................................................................... 99
7.4.1.2. Bone mineralization and Mineral retention ................................... 99
7.4.2. Experiment 2 ................................................................................... 100
7.4.2.1. Growth Performance .................................................................... 100
XVII
7.4.2.2. Bone Mineralization and Mineral Retention ............................... 101
7.5. Discussion 102
CHAPTER 8 : Including copper sulfate or dicopper oxide in the diet up to 300 mg
Cu/kg affects performance and copper accumulation in broiler chickens 107
8.1. Abstract 109
8.2. Introduction 110
8.3. Materials and methods 111
8.3.1. In vivo Trial ..................................................................................... 111
8.3.1.1. Bird Management and Husbandry ............................................... 111
8.3.1.2. Experimental design and diets ..................................................... 112
8.3.1.3. Laboratory Analyses .................................................................... 112
8.3.1.4. Statistical Analyses ...................................................................... 114
8.3.2. In vitro trial...................................................................................... 114
8.3.2.1. Solubility of copper sulfate or dicopper oxide with and without
Phytate 114
8.3.2.2. Effects of copper source and level on PP hydrolysis by Phytase 114
8.4. Results 115
8.4.1.1. Bird Performance ........................................................................... 115
8.4.1.2. Organ weights and copper content in organs and tissue samples .. 116
8.4.1.3. Mineral concentration in ileum digesta .......................................... 119
8.4.2.1. Copper solubility with and without phytate ................................... 119
8.4.2.2. Phytic phosphorus solubility and PP hydrolysis by phytase .......... 121
8.5. Discussion 121
CHAPTER 9: General discussion 127
9.1. Ca and P requirements 129
9.1.1. Animal performance ........................................................................ 129
9.1.2. Bone mineralization ........................................................................ 130
9.1.3. Mineral retention and digestibility .................................................. 131
XVIII
9.2. Phytase interaction with copper and pH 132
9.3. Mineral sources 133
9.3.1. Phosphorus sources ......................................................................... 133
9.3.2. Calcium sources .............................................................................. 134
CHAPTER 10: Conclusions 135
CHAPTER 11: References 139
Curriculum Vitae 165

XIX
Index of tables
Table 2.1. Calcium and Phosphorus content in the chicken whole body and bones
(g/kg). ............................................................................................................................ 10
Table 2.2. Examples of Type I and Type II nutrients. ................................................... 11
Table 2.3. Calcium and P Requirements for Broilers. ................................................... 14
Table 2.4. Different requirements of Ca and P for starter broilers depend on the criteria
used. ................................................................................................................................ 15
Table 2.5. Some examples of currently commercially available 3- and 6-phytases and
their characteristics. ........................................................................................................ 24
Table 2.6. Summary of microbial phytase phosphorus equivalency studies in poultry.26
Table 2.7. Comparison between Di-calcium phosphate and Mono-calcium phosphate. 27
Table 4.1. Calculated composition of experimental diets. ............................................ 47
Table 4.2. Influence of Ca and NNP1 levels in diets containing phytase at 1,150
FTU/kg on feed intake and growth performance of broilers from d 1 to d 142. ............ 49
Table 4.3. Influence of Ca and NPP1 levels in diets containing phytase at 1,150
FTU/kg on tíbia weight and ash of 14-day-old broilers. ............................................... 52
Table 4.4. Influence of Ca and NPP1 levels in diets containing phytase at 1,150
FTU/kg on whole-body ash of 14-day-old broilers. ....................................................... 54
Table 5.1. Ingredient and nutrient composition (% as fed-basis, unless otherwise
indicated) of the experimental diets................................................................................ 63
Table 5.2. Acid-binding capacity of different sources and dietary Calcium levels. ..... 65
Table 5.3. Influence of Ca source and NPP1 levels on feed intake and growth
performance of broilers from 1d to 14d ........................................................................ 66
Table 5.4. Influence of Ca and NPP1 levels on tibia weight and tibia ash of 14-day-old
broilers. ........................................................................................................................... 67
Table 5.5. Influence of Ca and NPP1 levels on Ca and P ileal digestibility in 14-day-
old broilers. ..................................................................................................................... 69
Table 6.1. Composition of the experimental diet (Experiment 1). ............................... 78

XX
Table 6.2. Day one to day 35 broiler starter and grower experimental diets (Experiment
2). .................................................................................................................................... 80
Table 6.3. Effect of different P sources and levels on feed intake and growth
performance of broilers between d 1 to d 21 of age (Experiment 1). ............................. 82
Table 6.4. Effect of different P sources and level on tibial weight and ash content in
birds from d1 to d 21 of age (Experiment 1). ................................................................. 83
Table 6.5. Effect of MCP and TCP diets on feed intake and growth performance in
broilers between d1 and d35 (Experiment 2).................................................................. 84
Table 6.6. Effect of MCP and TCP on tibial weight and ash content in 35-day-old
broilers (Experiment 2). .................................................................................................. 84
Table 6.7. Effect of MCP and TCP on P retention, Ca and P digestibility (%) and Ca
and P retention (g/day) in 35-day-old broilers (experiment 2). ...................................... 85
Table 7.1. Composition of the basal diet for starter and Grower phase for broilers from
1 to 35 days (Experiment 1). .......................................................................................... 95
Table 7.2. Composition of the basal diet for broilers from 1 to 14 days (Experiment 2).
........................................................................................................................................ 96
Table 7.3. Effect of different levels of dietary phytase on feed intake and growth
performance of broilers from d1 to 351 (Experiment 1). ............................................... 99
Table 7.4. Effect of different levels of dietary phytase on bone mineralization and P
digestibility of 35-day-old broilers1 (Experiment 1). ................................................... 100
Table 7.5. Influence of Ca: aP Ratio and types of phytase on feed intake and growth
performance of broilers from d 1 to 141(Experiment 2). ............................................. 101
Table 7.6. Effect of different types of phytase and Ca:aP ratio inclusion on bone
mineralization and mineral digestibility of 14-day-old broilers 1(Experiment 2). ....... 104
Table 8.1. Composition of the basal diet for different phases for broilers from 0 to 35
days. .............................................................................................................................. 113
Table 8.2. Experimental diet calculated and Cu concentration analyzed. ................... 114
Table 8.3. Effect of different copper sources and level of inclusion on feed intake and
growth performance of broilers from d1 to 35 (Trial in vivo)...................................... 116
XXI
Table 8.4. Effect of different copper sources and level of inclusion on copper content
in organs and the concentration of copper and zinc in serum at 35 d (Trial in vivo). .. 117
Table 8.5. Effect of different copper sources and level of inclusion on mineral content
(Cu, P, Fe, Zn and Mn) in ileum digesta (soluble and insoluble) at 35 d (Trial in vivo).
...................................................................................................................................... 118
XXII
Index of figures
Figure 2.1. Total and phytic P content (%) in different feedstuff. ............................. 17
Figure 2.2. Schematic longitudinal section of a grain of wheat. ............................... 18
Figure 2.3. Structure of phytic acid (A) and phytic acid chelate with metal cations
(B)……………………………………………………………………………………19
Figure 2.4. Comparison between available P content of some raw materials and
broiler requirements. ................................................................................................... 20
Figure 2.6. Calcium content in different cereal, vegetable protein and fibrous
ingredients, as compared to total Ca requirements in broilers. ................................... 28
Figure 2.7. Various sources of dietary calcium. ........................................................ 29
Figure 2.8. Proposed model depicting Ca (A) and P (B) metabolism in broiler
chickens. 31
Figure 2.9. The pH value in the different parts of the broiler digestive tract. ........... 33
Figure 5.1. Concentration of Ca (mg/L) in the supernatant of Ca chloride, limestone
and TCP solutions at different pH (from left to right, 2.69, 3.53, 4.18, 4.77, 5.27,
6.01, 6.52) and with the addition or not of phytic acid (+ vs -). ................................ 65
Figure 8.2. Effects of Cu concentration on the solubility of CuSO4 with (+) and
without phytate (-) at pH 2.5; 4.5 and 6.5. ................................................................ 120
Figure 8.1. Effects of Cu concentration on the solubility of Cu2O with (+) and
without phytate (-) at pH 2.5; 4.5 and 6.5. ................................................................ 120
Figure 8.3. Effects of Cu concentration on the PP solubility of Cu2O and CuSO4 at
pH 2.5, 4.5 and 6.5. ................................................................................................... 122
Figure 8.4.Effects of Cu source and concentration on phytase efficacy at pH 2.5, 4.5
and 6.5……………………………………………………………………………... 122

XXIII
Abbreviations
ABC Acid Binding Capacity
ADP Adenosine Diphosphate
AMP Adenosine Monoposphate
ATP Adenosine Triphosphate
BWG Body Weight Gain
Cu2O Dicopper Oxide
CuSO4 Copper Sulfate
DCP Di-calcium Phosphate
DM Dry Matter
FCR Feed Convertion Ratio
FI Feed Intake
FTU Phytase Units
G:F Gain Feed Ratio
GIT Gastro Intestinal Tract
InsP6 Hexakis Dihydrogen Phosphate
MCP Mono-calcium Phosphate
NPP Non Phytic Phosphorus
PP Phytic Phosphorus
SBM Soy Bean Meal
TCP Tri-calcium Phosphate
WG Weight Gain

XXIV

1
CHAPTER 1
General introduction

2
Chapter 1
3
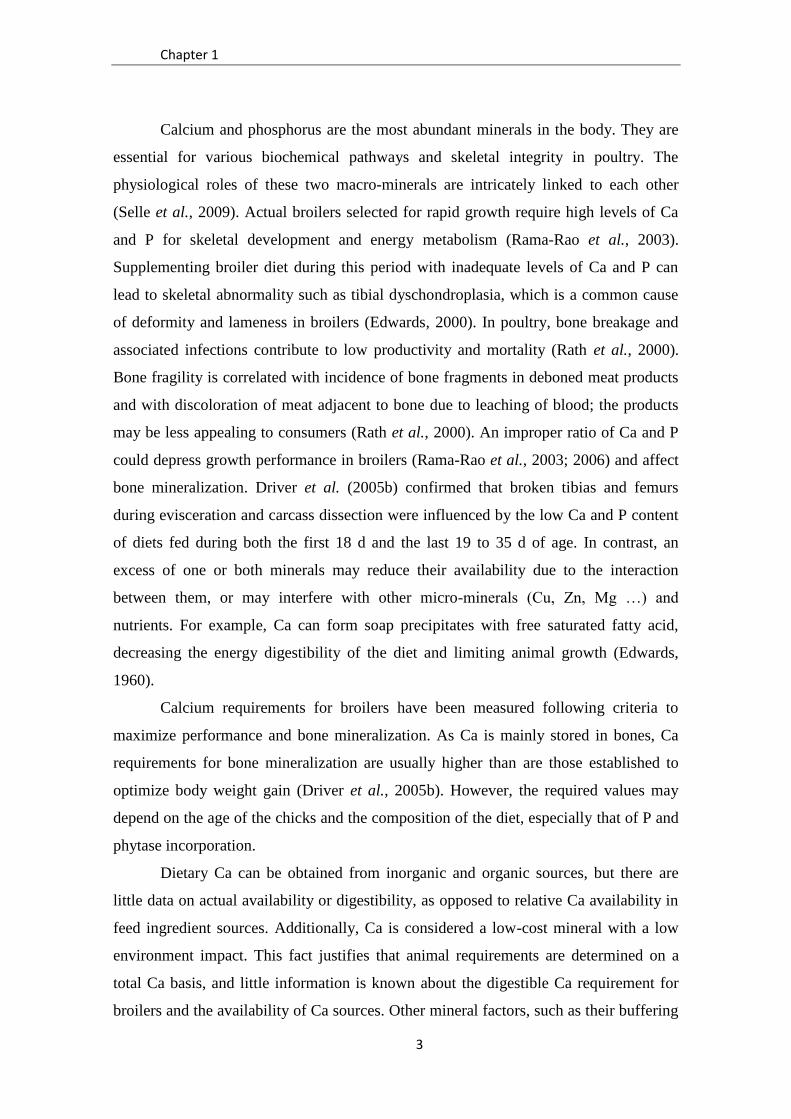
Calcium and phosphorus are the most abundant minerals in the body. They are
essential for various biochemical pathways and skeletal integrity in poultry. The
physiological roles of these two macro-minerals are intricately linked to each other
(Selle et al., 2009). Actual broilers selected for rapid growth require high levels of Ca
and P for skeletal development and energy metabolism (Rama-Rao et al., 2003).
Supplementing broiler diet during this period with inadequate levels of Ca and P can
lead to skeletal abnormality such as tibial dyschondroplasia, which is a common cause
of deformity and lameness in broilers (Edwards, 2000). In poultry, bone breakage and
associated infections contribute to low productivity and mortality (Rath et al., 2000).
Bone fragility is correlated with incidence of bone fragments in deboned meat products
and with discoloration of meat adjacent to bone due to leaching of blood; the products
may be less appealing to consumers (Rath et al., 2000). An improper ratio of Ca and P
could depress growth performance in broilers (Rama-Rao et al., 2003; 2006) and affect
bone mineralization. Driver et al. (2005b) confirmed that broken tibias and femurs
during evisceration and carcass dissection were influenced by the low Ca and P content
of diets fed during both the first 18 d and the last 19 to 35 d of age. In contrast, an
excess of one or both minerals may reduce their availability due to the interaction
between them, or may interfere with other micro-minerals (Cu, Zn, Mg …) and
nutrients. For example, Ca can form soap precipitates with free saturated fatty acid,
decreasing the energy digestibility of the diet and limiting animal growth (Edwards,
1960).
Calcium requirements for broilers have been measured following criteria to
maximize performance and bone mineralization. As Ca is mainly stored in bones, Ca
requirements for bone mineralization are usually higher than are those established to
optimize body weight gain (Driver et al., 2005b). However, the required values may
depend on the age of the chicks and the composition of the diet, especially that of P and
phytase incorporation.
Dietary Ca can be obtained from inorganic and organic sources, but there are
little data on actual availability or digestibility, as opposed to relative Ca availability in
feed ingredient sources. Additionally, Ca is considered a low-cost mineral with a low
environment impact. This fact justifies that animal requirements are determined on a
total Ca basis, and little information is known about the digestible Ca requirement for
broilers and the availability of Ca sources. Other mineral factors, such as their buffering

General introduction
4
capacity or their kosmotropic or chaostropic characteristics, may also be related to
significant decreases in P solubility in the gizzard and may affect N and P digestibility
(Tamim and Angel, 2003).
To cover broiler needs in P, inorganic sources as well as phytases are included in
the diets. Vegetable ingredients are the major constituents of poultry diets. About two-
thirds of the P of plant origin is presented as phytic acid (Cromwell, 1980). Phosphorus
in phytic acid form is poorly available to monogastric animals (Sebastian et al., 1996)
because they do not possess significant amounts of endogenous phytase to hydrolyze
phytic acid (Cooper and Gowing, 1983). Exogenous phytase is commonly added to
broiler diets to improve the hydrolysis of phyate P, increase P digestibility, reduce P
excretion in the environment and lower the cost of inorganic P addition (Shang et al.,
2015).
Since the first appearance of phytase in 1990, the poultry industry is now
extensively using any of the different forms of phytase that have appeared on the
market. From the results reviewed in the literature, it is clear that phytase is not able to
release 100% of phytic P. Then, it has become necessary to assess the effectiveness and
variability provided by the new sources of phytase or the dietary effects involved, and
of course it is also necessary to define the dose-response effects of phytase in the diet.
Among the dietary effects involved on phytase efficacy, phytic acid has the
capacity to bind or to chelate multivalent cations, including Ca, Zn, Fe and Cu (Tamim
and Angel, 2003). The ability of the different metal ions to inhibit phytic phosphorus
hydrolysis would be related to the stability of the complex as well as to the pH of the
solution and the phytin-mineral molar ratio (Angel et al., 2015). An excess of Ca in the
poultry diet can cause antagonism with the absorption of other minerals through the
formation of Ca-phytate complexes, which reduces the efficacy of phytase (Driver et
al., 2005a; Selle et al., 2009). The use of high doses (therapeutic doses) of Cu in poultry
diets has been shown to produce positive effects on bird health and immunity, and it is
being used in some countries as growth promoters (Pesti and Bakalli, 1996). However,
Cu is also able to chelate phytate and limit phytase hydrolysis. The solubility of this
complex may depend on pH values (Selle and Ravindran, 2000), the complexes which
precipitate at pH 6.5 are non-accessible for hydrolysis by phytase or absorption in the
intestine. This effect may be different among different Cu sources.
The commercial development of phytase has provided the animal industry with a
tool to decrease the need to supplement animal feeds with inorganic phosphorus, but the

Chapter 1
5
use of a mineral source of P is still needed to meet animal requirements. Phosphorus
supplementation of poultry feeds is routinely made by the addition of standard di-
calcium phosphate. However, the characteristics of di-calcium phosphates obtained
from different manufacturers will vary according to the origin of raw material (rock
phosphate, phosphoric acid...) and also according to variations in industrial processing
(Lima et al., 1995). Economically, P is the third most expensive component in the
poultry diet after energy and protein, so studies on P availability of the inorganic
sources are of biological and economic importance (Lima et al., 1997).
On this basis, it seems opportune to screen some the dietary factors mainly
influencing Ca and P utilization by broiler chicks during the different phases of their
short life. This thesis will also try to clarify the likely mechanisms behind these effects
by studying the interaction factors observed in in vitro conditions.

General introduction
6

7
CHAPTER 2
Literature Review

8

Chapter 2
9
2.1. Importance of Calcium and Phosphorus for broiler chickens
2.1.1. Calcium
Calcium is, together with phosphorus, the main mineral retained in the body of
broilers (Table 2.1). Calcium is the most abundant mineral in the body, and 99% is
found in the skeleton. The skeleton not only provides a strong framework for supporting
muscles and protecting delicate organs and tissues, including the bone marrow, but is
also jointed to allow movement and is malleable to allow growth (Suttle, 2010).
The small proportion (1%) of body Ca that lies outside the skeleton is important
to survival (Suttle, 2010). It can be found as free ion, bound to serum proteins and
complexed to organic and inorganic acid. Indeed, it plays a role in blood coagulation,
adhesion of molecules, neural transmission and signal transduction, muscle contraction,
cellular motility, differentiation and proliferation, hormonal secretions and apoptosis
(Brown, 2002). Calcium is necessary for muscular contraction that occurs as a result of
neurotransmitter exocytosis (such as acetylcholine) at the neuromuscular synapse
(Adeola et al., 2005). Calcium is also involved in the release of hormones, such as
insulin, by fusing secretory vesicles with lipid membranes and the expulsion of its
contents in the target tissue.
In the poultry industry, Ca is mainly supplied with inorganic sources to reach Ca
requirement levels in the diet, which has been described up to now on a total Ca basis.
Calcium fortification of vegetable diets with limestone and calcium di-phosphate or
mono-phosphate, together with a proper supplementation of vitamin D, reduces the risks
of Ca deficiency in birds. However, there is still controversy in relation to the proper Ca
levels and sources to provide to the animals as well as the digestive factors that may
affect Ca absorption (Perry et al., 1991).
2.1.2. Phosphorus
Phosphorus is the second most abundant mineral in the animal body, and about
80% is found in the bones (Table 2.1). Phosphorus is required for the formation of the
organic bone matrix as well as the mineralization of that matrix. The remaining 20% of
body P is widely distributed in the fluids and soft tissues of the body, where it serves a
range of essential functions (Suttle, 2010).
Literature Review
10
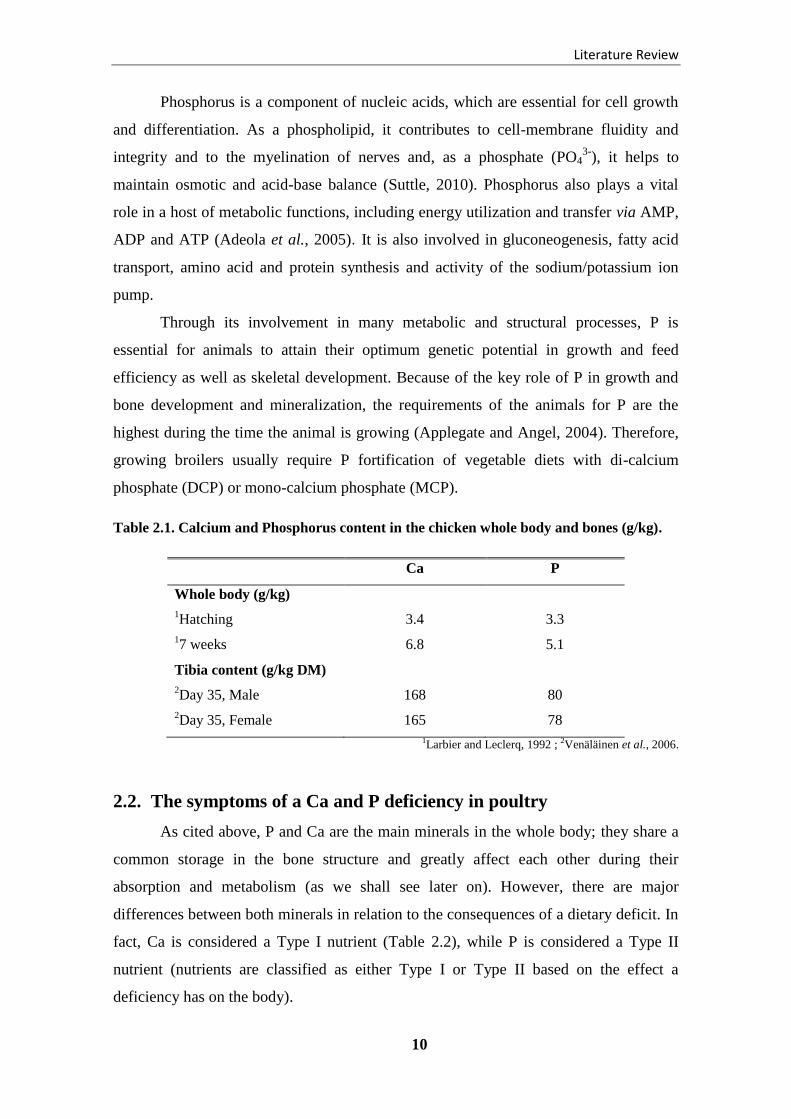
Phosphorus is a component of nucleic acids, which are essential for cell growth
and differentiation. As a phospholipid, it contributes to cell-membrane fluidity and
integrity and to the myelination of nerves and, as a phosphate (PO43-
), it helps to
maintain osmotic and acid-base balance (Suttle, 2010). Phosphorus also plays a vital
role in a host of metabolic functions, including energy utilization and transfer via AMP,
ADP and ATP (Adeola et al., 2005). It is also involved in gluconeogenesis, fatty acid
transport, amino acid and protein synthesis and activity of the sodium/potassium ion
pump.
Through its involvement in many metabolic and structural processes, P is
essential for animals to attain their optimum genetic potential in growth and feed
efficiency as well as skeletal development. Because of the key role of P in growth and
bone development and mineralization, the requirements of the animals for P are the
highest during the time the animal is growing (Applegate and Angel, 2004). Therefore,
growing broilers usually require P fortification of vegetable diets with di-calcium
phosphate (DCP) or mono-calcium phosphate (MCP).
Table 2.1. Calcium and Phosphorus content in the chicken whole body and bones (g/kg).
Ca P
Whole body (g/kg)
1Hatching 3.4 3.3
17 weeks
6.8 5.1
Tibia content (g/kg DM)
2Day 35, Male 168 80
2Day 35, Female 165 78
1Larbier and Leclerq, 1992 ; 2Venäläinen et al., 2006.
2.2. The symptoms of a Ca and P deficiency in poultry
As cited above, P and Ca are the main minerals in the whole body; they share a
common storage in the bone structure and greatly affect each other during their
absorption and metabolism (as we shall see later on). However, there are major
differences between both minerals in relation to the consequences of a dietary deficit. In
fact, Ca is considered a Type I nutrient (Table 2.2), while P is considered a Type II
nutrient (nutrients are classified as either Type I or Type II based on the effect a
deficiency has on the body).

Chapter 2
11
Table 2.2. Examples of Type I and Type II nutrients.
Type I nutrients Type II nutrients
All vitamins,
Most trace elements,
Calcium
Nitrogen, Sulfur, essential amino acids
Potassium, Sodium, Magnesium, Phosphorus,
Zinc, Water, Dietary sources of energy (including
carbohydrate and fat)
(Emery, 2005)
Deficiency of Type I nutrients results in specific physical signs, such as anemia
after Fe deficiency or scurvy after vitamin C deficiency (Emery, 2005). An animal
responds to a deficiency of Type I nutrients by continuing its growth and consuming
body stores, with an eventual reduction in bodily functions. Diagnosis is simple due to
the symptoms, but also via measurement of the concentration of the nutrient itself in the
whole body or storage tissues. Examples of other Type I nutrients, in addition to Ca, are
Fe, Cu, Se and vitamins.
An animal responds to a deficiency of Type II nutrients by reducing growth and
avidly conserving the nutrient to maintain the concentration of the nutrient in the
tissues. The animal reduces excretion to conserve the nutrient, and a reduction of
appetite usually accompanies this condition. Individuals with a Type II deficiency are
stunted in growth and have no visual signs or differences from ″normal″ individuals.
Other examples of Type II nutrients, in addition to P, are nitrogen, essential amino
acids, K, Na or Zn.
Bone status is commonly used as an indicator of mineral adequacy in poultry
diets. Well over 90% of Ca is found in the bones, where it combines with P to form
calcium phosphate crystals or hydroxyapatite with the molecular formula
Ca10(PO4)6(OH)2 (Scott et al., 1982). Other elements including Na, Mg, Fe and Fl may
also be incorporated into the hydroxyapatite crystal (Frandson and Spurgeon, 1992).
With this description, it is easy to understand that a deficient Ca diet affects bone
mineralization and strength (Reichmann and Connor, 1977), and is perhaps associated
with increased risk of fractures (Blake and Fogelman, 2002).
The modern broiler chicken has been selected for rapid growth and increase in
muscle mass, but it may also be associated with poor leg health and lameness due to
reduced bone mineralization. Reducing Ca and P in the diet can also cause broken bones
and bloody meat during processing of the carcass (Chen and Moran, 1995). In

Literature Review
12
particular, bone breakage during catching and transportation creates problems during
processing (Gregory and Wilkins, 1992; Julian, 1998; Knowles and Wilkins, 1998).
Broken bones, especially fractured clavicle bones, may find their way into the
meat, and must be removed at great expense. Hemorrhages in the meat are another
major quality defect, which can lead to downgrading of the broiler carcass. This is very
significant due to the increased current importance of selling cut-up chicken parts, in
which the emphasis is no longer only on yield but also on characteristics such as bloody
breast meat and broken bones (Gregory and Wilkins, 1990).
2.3. Phosphorus and Calcium requirements
The Ca and P requirements of domestic animals are usually discussed together
because the requirement of each mineral depends on the concentration of the other in
the diet. An excessive or deficient level of Ca or P in the diet often leads to a deficiency
or excess of the other, which is due to the interactions between the two minerals
concerning Ca and P availability and endogenous excretion (Al Masri, 1995). We shall
try, in Chapters 4 and 7, to study the interaction between these two minerals more
accurately.
2.3.1. Calcium
As referred stated above, requirements of Ca have been established based on its
effect on performance, but mainly on bone mineralization. They are described on a total
Ca basis (Table 2.3), and very few data on Ca availability or digestibility in feed
ingredients and digestible Ca requirements for broilers are published. There are different
causes that may justify this apparent lack of interest on improving the description on a
digestible or available Ca basis. Calcium is considered, in contrast to P, to be a cheap
nutrient, and its involvement in environmental contamination is low. However, recently,
Angel et al. (2015) recommended moving towards a digestible Ca (dCa), because of the
extensive use of phytase in poultry diets and the negative effects of Ca on phytase
efficacy (Tamim and Angel, 2003).
It is generally assumed that Ca requirements levels include a wide safety margin
to supply Ca requirements. Nevertheless, apart from the fact that inorganic Ca sources
replace other ingredients in the diet, an excess in the levels of dietary Ca may interfere
with the availability of other minerals, including P, Cu, Mn, Mg, and Zn (Maenz et al.,
1999).

Chapter 2
13
Therefore, Ca requirements are affected by the criteria used to maximize or
optimize and the age of the animals. According to Driver et al. (2005b), Ca
requirements determined for 1-d-old to 16-d-old chicks (1.0% Ca; NRC, 1994) are
adequate for maximum bone ash but excessive for all other measured variables. Both
BWG and FCR were optimized at or below 0.625% dietary Ca, which may suggest that
a lower total Ca concentration in general is desirable. Furthermore, significant sex
differences were observed; males appeared to require more Ca than did females to
maximize tibia ash but less Ca to optimize weight gain (0.49% ±0.11% vs.
0.62%±0.18% for males and females, respectively). Calcium requirements for FCR
were very similar for both males and females (0.63% ±0.40% vs. 0.61% ±0.19%),
respectively.
On the other hand, Ca must be soluble in the medium of the gastrointestinal
digesta before absorption. Limestone, which is the main Ca source in the poultry
industry, requires an acidic medium to reach a solubility of 80% (Walk et al., 2012a).
This implies that Ca can be mostly solubilized in the proventriculus and gizzard, but it
becomes mostly insoluble in the small intestine. This may suggest that the current total
Ca recommendation may be high, as they are associated with an intrinsically low
available source. Recent reports suggest that the provision of an alternative, highly
digestible Ca source at lower dietary concentrations may circumvent this problem
(Bradbury et al., 2012). Further studies are required to determine the Ca requirements of
chicks based on the Ca source used in the diet.
2.3.2. Phosphorus
As shall be seen later, P in plants is present in different organic forms, such as
phospholipids and proteins, but mostly as part of the phytic acid molecule. Phytic acid P
has low availability for poultry, which implies that inorganic P must usually be added to
the diet in order to meet P requirements in birds (Applegate and Angel, 2008).
Phosphorus is also an expensive nutrient in the diet (approx. 150-300 $ per ton vs. 15-
30 € per ton for Ca), and an environmental concern for the animal industry.

Literature Review
14
Table 2.3. Calcium and P Requirements for Broilers.
FEDNA (2008) NRC (1994) INRA (1989)
Age(d) 1-15 16-37 1-21 22-42 1-15 16-35
Calcium (%) 0.95-
1.05
0.90-1 1 0.90 1.0-1.1 0.90-1.0
Phosphorus
Total P (%) 0.65 0.60 - - 0.67-0.70 0.66-0.69
Available P (%) 0.45 0.43 - - 0.42-0.45 0.41-0.44
Non phytic P (%) - 0.45 0.35 -
Ca: NPP
Ca: aP
-
2.11- 2.33
-
2.09-2.32
2.2
-
2.57 -
2.3- 2.4:1
2.19-2.27
Therefore, a greater effort has been made in order to improve and assure
maximum P availability in the diet as well as to avoid an excess of P in the diet and
excreta. The low digestibility of P in plant sources (Tamim and Angel, 2003; Tamim et
al., 2004) and the variable digestibility of P in inorganic sources (Coon and Leske,
1998) prompted the change in the use of P, from total P (tP, NRC, 1950) to inorganic P
(iP, NRC, 1954), available P (aP, NRC, 1984), and non-phytic P (NPP, NRC, 1994).
Thus, the terms used to describe phosphorus requirements are:
Total P (tP): This is generally referred to as phosphorus and encompasses any
and all forms of phosphorus in the diet. It does not take into account differences
on P availability (Angel et al., 2002).
Digestible P (dP): This refers to the P that is truly or apparently absorbed from
the diet in the intestinal tract (i.e., feed P minus P within the distal ileum).
Retained P: This refers to the P that stays in the body (i.e., feed P minus excreta
P; Applegate and Angel, 2008).
Phytic P (PP): In plants, IP6 (hexakis di-hydrogen phosphate) exists in its
anionic form, phytate. In mature seeds, IP6 is found as a complex salt of Ca,
Mg, and K, and in some cases it is bound to proteins and starches. Most of the P
stored in seeds is present as phytin-P (PP) a form poorly available to poultry.
This complexed or chelated molecule of InsP6 is known as phytin (Angel et al.,
2002).
Non-phytic P (NPP): Any P that is not bound to the phytin molecule, this NPP
can be chemically determined by subtracting analyzed PP from analyzed P.
Chapter 2
15
Available P (aP): This refers to the P that is calculated to be absorbed from the
diet by the animal (Angel et al., 2002).
The difference between aP and NPP is that the term “aP” includes all absorbed
forms of P, including inorganic P and a certain amount of organic P (including PP),
whereas NPP excludes any PP available to the animal.
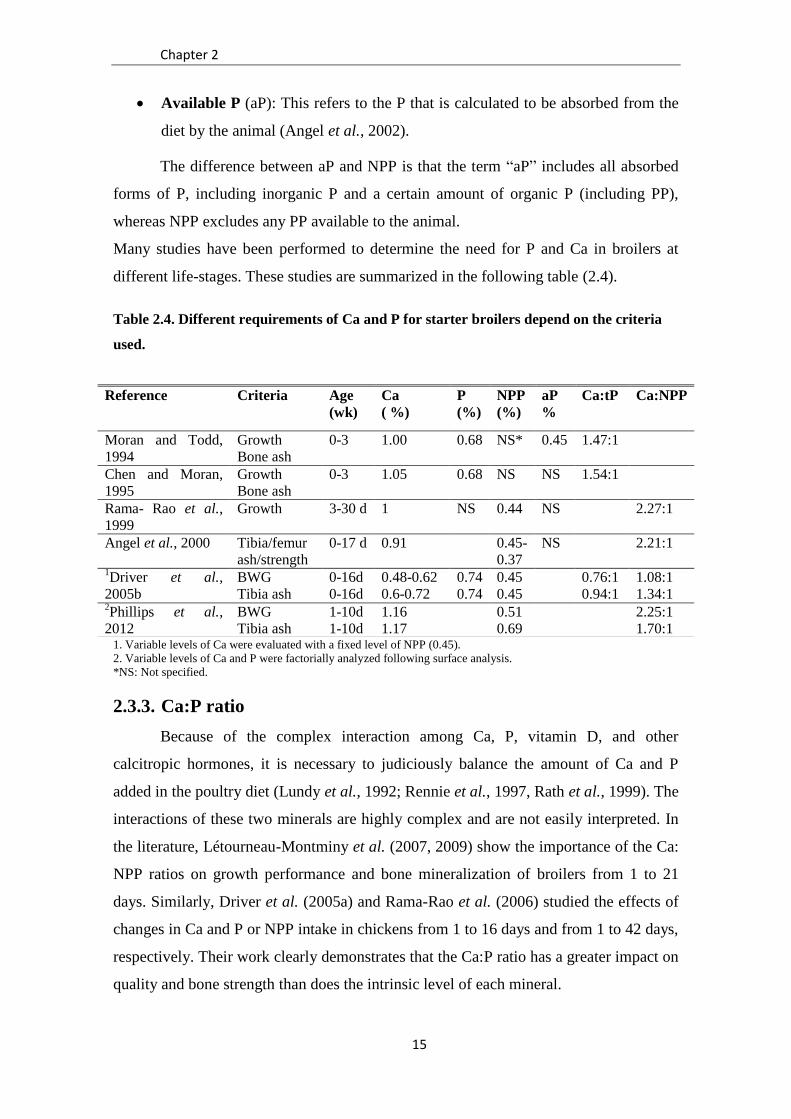
Many studies have been performed to determine the need for P and Ca in broilers at
different life-stages. These studies are summarized in the following table (2.4).
Table 2.4. Different requirements of Ca and P for starter broilers depend on the criteria
used.
1. Variable levels of Ca were evaluated with a fixed level of NPP (0.45).
2. Variable levels of Ca and P were factorially analyzed following surface analysis.
*NS: Not specified.
2.3.3. Ca:P ratio
Because of the complex interaction among Ca, P, vitamin D, and other
calcitropic hormones, it is necessary to judiciously balance the amount of Ca and P
added in the poultry diet (Lundy et al., 1992; Rennie et al., 1997, Rath et al., 1999). The
interactions of these two minerals are highly complex and are not easily interpreted. In
the literature, Létourneau-Montminy et al. (2007, 2009) show the importance of the Ca:
NPP ratios on growth performance and bone mineralization of broilers from 1 to 21
days. Similarly, Driver et al. (2005a) and Rama-Rao et al. (2006) studied the effects of
changes in Ca and P or NPP intake in chickens from 1 to 16 days and from 1 to 42 days,
respectively. Their work clearly demonstrates that the Ca:P ratio has a greater impact on
quality and bone strength than does the intrinsic level of each mineral.
Reference Criteria Age
(wk)
Ca
( %)
P
(%)
NPP
(%)
aP
%
Ca:tP Ca:NPP
Moran and Todd,
1994
Growth
Bone ash
0-3 1.00 0.68 NS* 0.45 1.47:1
Chen and Moran,
1995
Growth
Bone ash
0-3 1.05 0.68 NS NS 1.54:1
Rama- Rao et al.,
1999
Growth 3-30 d 1 NS 0.44 NS 2.27:1
Angel et al., 2000 Tibia/femur
ash/strength
0-17 d 0.91 0.45-
0.37
NS 2.21:1
1Driver et al.,
2005b
BWG 0-16d 0.48-0.62 0.74 0.45 0.76:1 1.08:1
Tibia ash 0-16d 0.6-0.72 0.74 0.45 0.94:1 1.34:1 2Phillips et al.,
2012
BWG 1-10d 1.16 0.51 2.25:1
Tibia ash 1-10d 1.17 0.69 1.70:1
Literature Review
16
Historically, the ratio of Ca to P was defined for total Ca (tCa) and total P (tP)
(NRC, 1950) in the diet. As the impact of phytate present in seeds and its impact on
seed ingredient-based P availability began to be understood, a change was made to a
tCa-to-available-P ratio (NRC, 1984). The tCa:aP ratios recommended were 2.22 to
2.28, depending on the age of broilers (from hatchling to 8 weeks of age). In 1994
(NRC, 1994), when the term ″NPP″ began being used to define P requirement, the tCa:
NPP ratios recommended were 2.22 to 2.67, depending on growth stage. But according
to Angel et al. (2015), because dCa in inorganic sources are widely different, it is better
to use the ratio values between digestible nutrients. Furthermore, when phytase is
introduced in the diet, we change the Ca source from a calcium phosphate (MCP or
DCP) that usually has higher dCa (67%) to a limestone that usually has lower dCa
(34.1%) (Angel, 2013). It is suggested that Ca may inhibit phytase activity (Applegate
et al., 2003), so it is important to know the dCa:dP ratio , when phytase is supplemented
in the diet.
Al Masri (1995) describes a decrease in the availability of feed P from 0.66 to
0.30, as Ca: P ratios were changed from 1:1 to 2.5:1. The author states that increasing
Ca concentration (i.e., from 0.66% to 1.58%) showed a greater effect on P absorption
than on P retention, as the animals tended to reduce the endogenous P excretion in
trying to conserve the nutrient (i.e., Type II nutrient).
In recent research, Anwar et al. (2016) described that increasing dietary Ca
concentration from a 6.75 g/kg to 11.25 g/kg diet, when keeping the dietary P
concentration constant (4.5 g/kg), decreased Ca digestibility and Ca retention.
High Ca or P levels in the intestine reduce the absorption of both (Al Masri,
1995). The solubility of mineral complexes decreased when Ca and P are supplemented
at high levels. This level can increase ileal pH and reduces the absorption of both
minerals (Shafey, 1993). We shall see this response in more detail in Chapter 5 and
Chapter 8.
2.4. Phosphorus sources and availability
2.4.1. Vegetable sources of P
The P content in the raw materials used in animal feed presents a wide range of
variation (Figure 2.5). In general, seeds (cereal grains, legumes and oilseeds) have a
greater P content than do forages. The by-products of processing grains (wheat bran,
Chapter 2
17
corn gluten or oilseed meal) are especially rich in P (Rebollar and Mateos, 1999). The
level of P varies not only among sources but also within each source. Phosphorus
content depends on soil type, cultivar, maturation state, culturing conditions, weather,
etc., (Ravindran et al., 1995; Rebollar and Mateos, 1999).
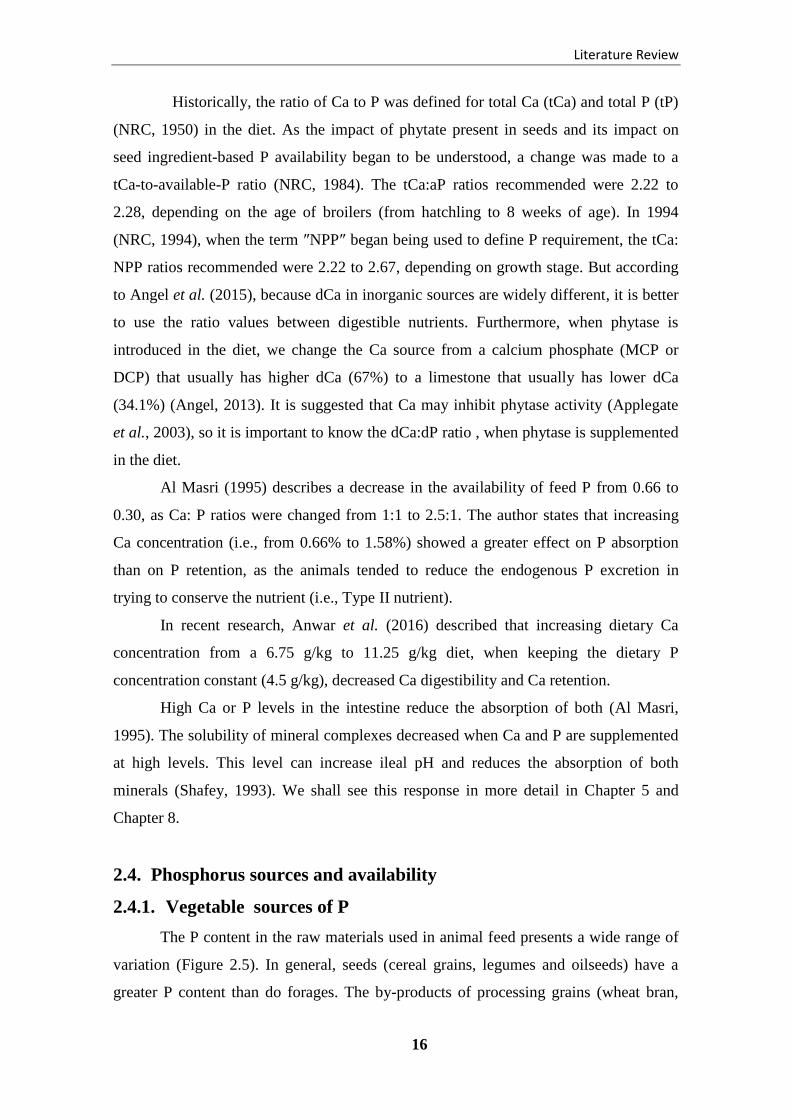
Most of the P in seeds is stored in the form of phytate, that is, the mixed salt of
phytic acid (Myo-inositol 1, 2, 3, 4, 5, 6-hexakis di-hydrogen phosphate (InsP6)), which
is a phosphorolyted cyclic sugar alcohol. It contains 28.2% of bound P with molecular
weight of 660 and represents, on average, 70% of the total P (tP) in feed ingredients
commonly used in poultry diets (Figure 2.1) (Maenz, 2001; Kornegay, 2001; Catala-
Gregori et al., 2006).
Figure 2.1. Total and phytic P content (%) in different feedstuff (FEDNA, 2016).
Phytic acid location varies depending on the type of grain. In wheat and rye, as
well as part of monocotyledons, phytate (between 80% and 90%) is located in the
aleurone layers and in the pericarp, whereas corn and sorghum accumulate phytic P in
the germ (Figure 2.2). In legumes, phytate is concentrated in cotyledons, and for
oilseeds it is diffusely distributed throughout the seed associated with protein-rich
globular bodies (Cosgrove, 1980; Sauveur, 1989).
Oats Barley Corn WheatCorn
GlutenFeed
SunflowerSeeds
SunflowerMeal
SoybeanMeal
P total (%) 0.33 0.36 0.25 0.36 0.87 0.50 1.00 0.61
P phytic (%) 0.18 0.21 0.18 0.24 0.52 0.44 0.83 0.40
0.00
0.20
0.40
0.60
0.80
1.00
Literature Review
18
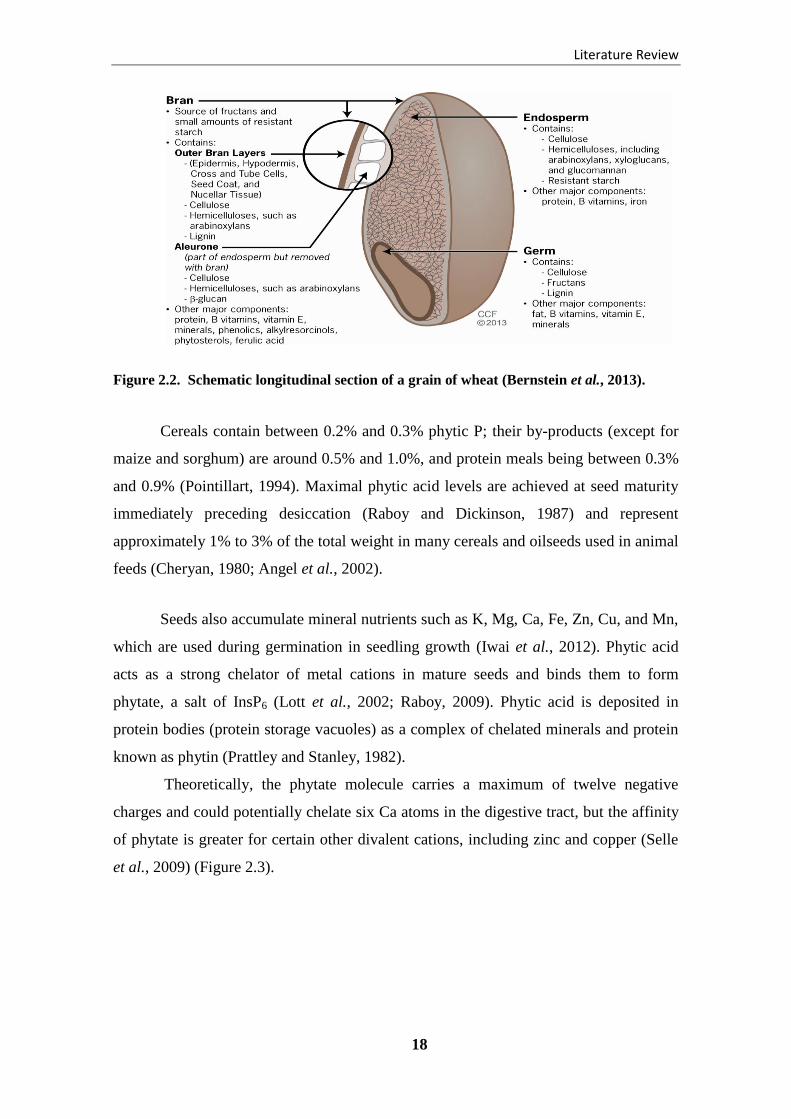
Figure 2.2. Schematic longitudinal section of a grain of wheat (Bernstein et al., 2013).
Cereals contain between 0.2% and 0.3% phytic P; their by-products (except for
maize and sorghum) are around 0.5% and 1.0%, and protein meals being between 0.3%
and 0.9% (Pointillart, 1994). Maximal phytic acid levels are achieved at seed maturity
immediately preceding desiccation (Raboy and Dickinson, 1987) and represent
approximately 1% to 3% of the total weight in many cereals and oilseeds used in animal
feeds (Cheryan, 1980; Angel et al., 2002).
Seeds also accumulate mineral nutrients such as K, Mg, Ca, Fe, Zn, Cu, and Mn,
which are used during germination in seedling growth (Iwai et al., 2012). Phytic acid
acts as a strong chelator of metal cations in mature seeds and binds them to form
phytate, a salt of InsP6 (Lott et al., 2002; Raboy, 2009). Phytic acid is deposited in
protein bodies (protein storage vacuoles) as a complex of chelated minerals and protein
known as phytin (Prattley and Stanley, 1982).
Theoretically, the phytate molecule carries a maximum of twelve negative
charges and could potentially chelate six Ca atoms in the digestive tract, but the affinity
of phytate is greater for certain other divalent cations, including zinc and copper (Selle
et al., 2009) (Figure 2.3).

Chapter 2
19
Figure 2.3. Structure of phytic acid (A) and phytic acid chelate with metal cations (B).
The order of stability of metal-phytate complexes was found to be:
Cu > Zn> Co > Mn > Fe > Ca (Tamim and Angel, 2003). The maximum binding of
divalent and trivalent cations occurs at pH 6, the normal pH of the duodenum, which is
the major site of mineral absorption (Oberleas, 1973; Banks et al., 2004a). The raw
materials of animal origin, including the skeleton, are foods with high levels of P
(FEDNA, 2011).
Thus, phytin is most commonly thought of as an anti-nutrient (Pallauf et al.,
1997; Angel et al., 2002) because it reduces the availability of bound minerals for the
animal.
From a practical standpoint, it is recognized that the availability of inorganic P
and non-phytate organic P is similar and nearly 100% (range 80%-100%). On the
contrary, the phytate P content is little available for, as the monogastric animals lack the
precise enzyme (phytase), at least being sufficient to break and separate the P-inositol
molecule (Kornegay, 1999). Hydrolysis of organic P in the gastrointestinal tract releases
PO43-
, which is the only way that the animal can absorb and utilize P. The aP values
described in the feedstuffs evaluation tables are values obtained without any exogenous
phytase addition (Figure 2.4).

Literature Review
20
Figure 2.4. Comparison between available P content of some raw materials and broiler
requirements (FEDNA, 2016).
2.4.1.1. Phytase
Phytase are phosphatases (myo-inisitol hexa-phosphate hydrolases) that
dephosphorylate insoluble phytic acid in grains and oilseeds into orthophosphate and
inositol phosphates Adeola and Cowieson, 2011) (Figure 2.5), making P fully available
to monogastric animals (Gibson and Ullah, 1990). These enzymes are capable of
hydrolyzing one or more phosphate groups from InsP6, yielding P and a series of lower
phosphoric esters (Harland and Morris, 1995; Angel et al., 2002). Phytase hydrolyzes
only phytate in solution, and with certain optimum conditions of pH and temperature
that are variable according to the type of phytase (Wodzinski and Ullah, 1996).
Figure 2.5. The mode of action of phytase.
Oat
s
Bar
ley
Co
rn
Wh
eat
Ric
e B
ran
DD
GS
Co
rn
Co
rn G
lute
n M
eal
Seed
Co
lza Co
lza
Mea
l
Sun
flo
wer
Mea
l
Soya
Bea
n
Soyb
ean
Mea
l
Oat
Hu
lls
nee
ds
of
bro
ilers
0.0
0.1
0.2
0.3
0.4
0.5
0.6
%aP
I
nsP6

Chapter 2
21
2.4.1.1.1. Phytase activity
The activity of phytase is commonly expressed as FTU, which is defined as the
amount of phytase required to liberate 1 mmol of inorganic phosphate per minute from
0.0051 mol/l sodium phytate at pH 5.5 and at a temperature of 37°C (Zyla et al., 1995,
AOAC). The pH level in the stomach of animals is far below pH 5.5 and, therefore, the
″real″ activity in vivo is different from the standard phytase activity measurement. In
addition, many phytase characteristics, coupled with dietary and animal-related factors,
can have an influence on phytase activity in vivo (Dersjant-Li et al., 2015).
2.4.1.1.2. Type of Phytase
Generally, phytase has been categorized on two bases, depending on the site
where the hydrolysis of the phytate molecule is initiated. The international Union of
Biochemists (1979) acknowledges two classes of phytase with the following
nomenclature: the 3-phytase (EC 3.1.3.8) initiates dephosphorization at the 3 position
phosphate, while the 6-phytase (EC 3.1.3.26) commences at the 6-position; they
produce different isomers of the lower inositol phosphates.
It has been stated that the 3-phytases are produced by microorganisms; the 6-
phytases are mainly isolated from a plant source (Adeola and Cowieson, 2011).
However, there are exceptions, as soybean phytases are 3-phytases and Escherichia coli
phytases are 6-phytases (Sandberg and Andlid, 2002). The action of these 2 phytases
differs in the location of phosphate removal, but also in how many phosphates they are
able to remove from the myo-inositol hexaphophoric acid molecule and by their
optimum activity at different pH levels. For example, the 3-phytase from Aspergillus
niger (Natuphos) has 2 optimal pHs, namely 2.5 and 5.5, similar to the phytase from
Aspergillus ficuum, which has optima pHs at 2.5 and 5.0 (Gibson and Ullah, 1990). The
6-phytase Peniophora lycii (Ronozyme) has two optima pHs, between 4.5 and 5.0.
Phytases are widely distributed in plants, animals, and microorganisms. In the
digestive tract of animals, phytase can be present intrinsically in feed ingredients,
produced by microflora present in the GIT, and from exogenous microbial phytases
added to the diet (Hegeman and Grabau, 2001).
Endogenous intestinal phytase
The existence and role of intestinal phytase activity in poultry has been
controversial (Abudabos, 2012). Its presence was first observed in chickens in 1938

Literature Review
22
(Krieger); later, Nelson (1976) concluded that intestinal phytase activity does not exist
nor does it have a functional role in non-ruminants. In contrast, other results indicated
the presence of phytase activity and a role for it in phosphorus utilization in chickens
(Bitar and Reinhold, 1972; Maenz and Classen, 1998, Abudabos, 2012).
The origin of intestinal phytase is also disputed; some ascribe it to innate
secretion (Bitar and Reinhold, 1972; Biehl and Baker, 1997) and others consider it as a
product of gastrointestinal microflora (Wise and Gilburt, 1982; Kerr et al., 2000).
Maenz and Classen (1998), however, reported that intestinal brush-border-alkaline
phosphatase (phytase) could contribute to degradation of phytate P; this phytase activity
has been found in all segments of the small intestine. The specific and total activities of
alkaline phosphatases in intestinal brush-border were highest in the duodenum and
declined in the jejunum and ileum.
As intestinal enzymes are modified by dietary factors, it is possible that
intestinal phytase may be affected by diet. In some studies, performed by McCuaig et
al. (1972) and Applegate et al. (2003), significant differences were detected, but not in
others (Maddaiah et al., 1969; Biehl and Baker, 1997). Lowering the total P level of the
starter diet resulted in a significant increase in phytase activity (Marounek et al., 2010).
A possible explanation for the increased utilization of phytate phosphorus with age is
the suggestion that more endogenous phytase is present in the gastrointestinal tract of
older animals.
Feedstufs phytase
It has been known, for more than 60 years, that some feedstuffs contain
considerable phytase activity (Peers, 1953; Hill and Tyler, 1954b). Phytase activity
varies greatly among species of plants. Among cereals, the highest phytase activities are
found, in decreasing order, in rye, triticale, wheat and barley. High-protein feeds contain
little activity, oats, maize and sorghum-negligible phytase activities (Eeckhout and de
Paepe, 1994; Humer et al., 2014). No correlation exists between the phytic P content in
the grain and its phytase activity (Eeckout and De Paepe, 1994; Rebollar and Mateos,
1999). The majority of phytases in cereal grains are located in the aleurone layers and
scutellum (Oatway et al., 2001; Humer et al., 2014). Diets including ingredients with
high phytase activity, such as wheat bran and wheat, promote greater absorption of
phytic P when diets are fed in mash form. Within wheat samples, phytase activity can

Chapter 2
23
be highly variable (915 to 1581 FTU/kg; Eeckhout and De Paepe, 1994). Much of this
variation can be explained through cultivar differences (Barrier-Guillot et al., 1996;
Applegate and Angel, 2004) and possibly through grain storage time and conditions.
The activity of this enzyme depends on moisture content, temperature and pH in
dry cereals; phytases are inactive due to lack of moisture for activation (Humer et al.,
2014).
It is estimated that phytases contained in plants are at least 10% less efficient
than those of fungal origin (Kornegay et al., 1996). The reason might be the narrow
range of pH at which plant phytases are active. Optimum pH for maximum activity is
higher than is that found in the stomach of poultry (pH of 2.5-3.5), the principal point of
action of phytases (Liebert et al., 1993; Rebollar and Mateos, 1999). For example, 6-
phytases from wheat have only one optimum pH, at 5.5 (Kies et al., 2001).
Because vegetal phytases are active at a pH of 5 and are very sensitive to
environmental conditions, pH too acidic or too alkaline may inactivate them irreversibly
(Pointillart, 1994). Moreover, in certain regions of the gastrointestinal tract, where pH is
5-6, phytic acid can react with other minerals and precipitate, preventing the activity of
phytase. In areas with lower pH (such as the proventriculus and gizzard in poultry),
phytin is more soluble, but plant phytase is less active.
Optimal temperature ranges of plant phytases are from 45ºC to 60°C (Wodzinski
and Ullah, 1996; Applegate and Angel, 2004). Plant phytases, nevertheless, may be
partially or totally inactivated by over-heating or high steam-pelleting temperatures
(Ravindran et al., 1995). Blaabjerg et al. (2010) treated wheat with steam injection at
approximately 70°C before pelleting at approximately 90°C, followed by cooling. The
treatment led to a reduction in phytase activity by 74% (Humer et al., 2014), whereas
Jongbloed and Kemme (1990) reported that cold-pelleting did not exert negative effects
on phytase activity. Producers that feed mash (diets that are not pelleted) diets may find
some benefit from plant phytases, but they must consider the high inherent variability of
vegetable phytase.
On the other hand, Phillippy (1999) also demonstrated that wheat phytase lost
substantial activity when incubated with pepsin, a proteolytic digestive enzyme.
Phytase produced by industry
The first commercialized phytase was developed for use in The Netherlands in
1991 (Selle and Ravindran, 2007) to increase P availability from vegetable sources and,

Literature Review
24
as a consequence, reduce the inclusion of higher cost of organic phosphates
supplementation and also to reduce P pollution from intensive agriculture (Onyango,
2005). Fungal phytase (Aspergillus niger) was the first generation of industrial phytase.
Commercial phytases are typically produced using recombinant DNA technology, for
example, a bacterial phytase gene being inserted into yeast for commercial production.
This technology has greatly improved functional use of phytases by improving their
thermostability, pH specificity, and resistance to breakdown by other digestive enzymes
in the animal (Applegate and Angel, 2008). Table 2.5 presents some examples of
currently commercial phytases.
Table 2.5. Some examples of currently commercially available 3- and 6-phytases and their
characteristics.
Type Protein origin pH optima Temperature
Optima (ºC)
Commercial
name
3 A.niger 2;5-5.5 65 Natuphos®
3 A.niger 6.0 - Allzyme® SSF
3 A.niger 2.5 - Finase® P/L
6 E. coli 4.5 55 Phyzyme® XP
6 E. coli 4.5 - Quantum®
6 E. coli - - Quantum Blue®
6 E. coli 3.4; 5.0 58 OptiPhos®
6 Peniophora lycii 4-5.5 50-55 Ronozyme®
6 Buttiauxella spp. 3.5-4.5 60 Axtra® PHY
(Dersjant-Li et al., 2015)
2.4.1.1.3. Phytase efficacy
The addition of exogenous phytases in the diets of poultry has been shown to
improve weight gain, mineral retention, energy utilization and amino acid digestibility
(Ravindran et al., 1999; Rutherfurd et al., 2002; Augspurger et al., 2003; Cowieson and
Adeola, 2005). Phosphorus retention by broilers was improved from 50% to 60% by
supplementing diets with a fungual phytase (Simons et al., 1990; Kornegay et al.,
1996). Phytases also reduced the phytate-P excretion when they were supplemented to
diets with little available P (Selle et al., 2000). However, efficacy of phytase
supplementation may depend on different factors (Ravindran et al., 1995), such as:
1. The microbial source and form of the enzyme (coated, size of the particle, etc.),
2. Temperature, and optima pH of the enzyme,

Chapter 2
25
3. The diet mineral concentration (Ca, Fe, Mg, Cu, and Zn), ingredients used or
diet manufacturing methodology (pelleted, mash, or liquid),
4. Location of addition of phytase (post-pelleting or mixer),
5. Type and level of vitamin D metabolites,
6. The animal status (i.e., disease),
7. Resistance to endogenous protease.
The common recommended dose of phytase to be used is 500 FTU/kg in broiler
diet for the destruction of 50%-70% of phytate. The inorganic P equivalent reported in
the literature is between 0.3 g/kg-1.7 g/kg. Table 2.6 presents some P equivalent values,
but the activity measurements may differ significantly due to the methods of analysis
(Dersjant-Li et al., 2015). However, in the last several years higher doses of phytase
(three to four times the standard dose) are being used in poultry diets, showing some
positive results in terms of nutrient availability and performance. It has been suggested
that high phytase doses produce the complete de-phosphorylation of phytate and also
release inositol, which is considered a growth promotor. Inositol is also known to have
important metabolic roles, such as in fat metabolism and cell function, as well as being
combined with phosphorus at a cellular level to recreate phytate, which is a potent anti-
oxidant. Some studies like the one conducted by Zyla et al. (2004) addressed the
positive effect of inositol provision in broilers. These authors observed that the
supplementation of 0.10% inositol improved about 6.4% of FCR from 1 to 21d of age.
According to Adoela et al. (2014), there may be three main mechanisms whereby using
large doses of phytase may elicit beneficial effects:
1. It restores the dCa: dP ratio,
2. Less residual phytate and destruction of the anti-nutritive effect and increased
generation of more soluble lower esters,
3. Generation of myo-inositol with lipotropic effects.
Shirley and Edwards (2003) indicated that a 94.8% phytate P disappearance
could be achieved using 12,000 units of phytase (Natuphos 5000)/kg diet. Coon and
Manangi (2004) indicated a 99.5% phytate hydrolysis in broilers fed diets supplemented
with 5,000 units of phytase (Phyzyme XP) per kg diet. In recent years, the use of higher
levels of exogenous phytase, referred to as super dosing, has been promoted as a
strategy to release more phytic P and to reduce the anti-nutritive effects of phytate
(Cowieson et al., 2011).
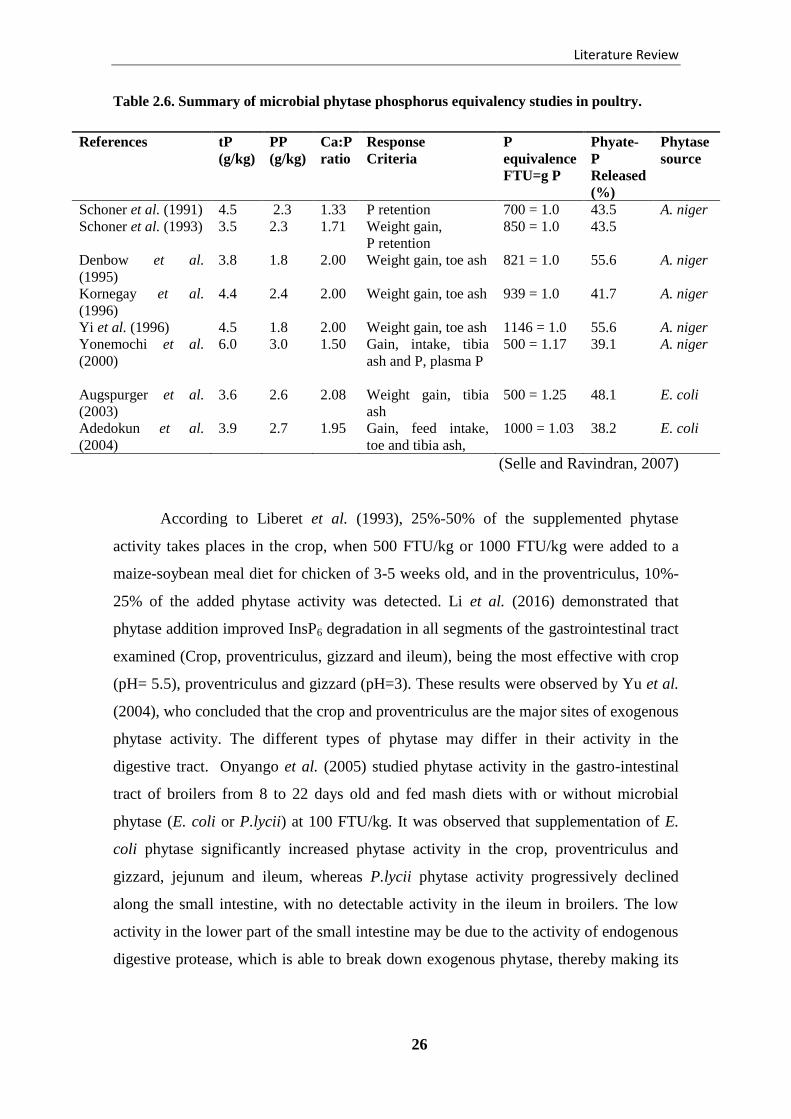
Literature Review
26
Table 2.6. Summary of microbial phytase phosphorus equivalency studies in poultry.
References tP
(g/kg)
PP
(g/kg)
Ca:P
ratio
Response
Criteria
P
equivalence
FTU=g P
Phyate-
P
Released
(%)
Phytase
source
Schoner et al. (1991) 4.5 2.3 1.33 P retention 700 = 1.0 43.5 A. niger
Schoner et al. (1993) 3.5 2.3 1.71 Weight gain,
P retention
850 = 1.0 43.5
Denbow et al.
(1995)
3.8 1.8 2.00 Weight gain, toe ash 821 = 1.0 55.6 A. niger
Kornegay et al.
(1996)
4.4 2.4 2.00 Weight gain, toe ash 939 = 1.0 41.7 A. niger
Yi et al. (1996) 4.5 1.8 2.00 Weight gain, toe ash 1146 = 1.0 55.6 A. niger
Yonemochi et al.
(2000)
6.0
3.0 1.50 Gain, intake, tibia
ash and P, plasma P
500 = 1.17 39.1 A. niger
Augspurger et al.
(2003)
3.6 2.6 2.08 Weight gain, tibia
ash
500 = 1.25 48.1 E. coli
Adedokun et al.
(2004)
3.9 2.7 1.95 Gain, feed intake,
toe and tibia ash,
1000 = 1.03 38.2 E. coli
(Selle and Ravindran, 2007)
According to Liberet et al. (1993), 25%-50% of the supplemented phytase
activity takes places in the crop, when 500 FTU/kg or 1000 FTU/kg were added to a
maize-soybean meal diet for chicken of 3-5 weeks old, and in the proventriculus, 10%-
25% of the added phytase activity was detected. Li et al. (2016) demonstrated that
phytase addition improved InsP6 degradation in all segments of the gastrointestinal tract
examined (Crop, proventriculus, gizzard and ileum), being the most effective with crop
(pH= 5.5), proventriculus and gizzard (pH=3). These results were observed by Yu et al.
(2004), who concluded that the crop and proventriculus are the major sites of exogenous
phytase activity. The different types of phytase may differ in their activity in the
digestive tract. Onyango et al. (2005) studied phytase activity in the gastro-intestinal
tract of broilers from 8 to 22 days old and fed mash diets with or without microbial
phytase (E. coli or P.lycii) at 100 FTU/kg. It was observed that supplementation of E.
coli phytase significantly increased phytase activity in the crop, proventriculus and
gizzard, jejunum and ileum, whereas P.lycii phytase activity progressively declined
along the small intestine, with no detectable activity in the ileum in broilers. The low
activity in the lower part of the small intestine may be due to the activity of endogenous
digestive protease, which is able to break down exogenous phytase, thereby making its
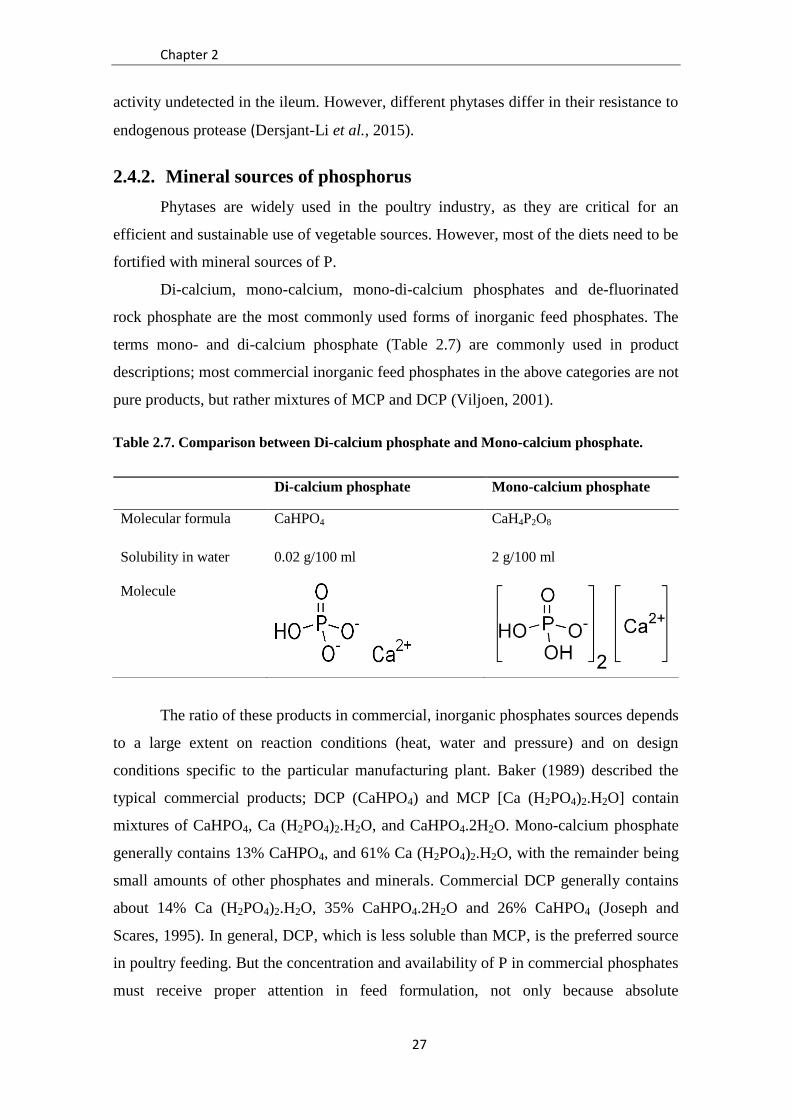
Chapter 2
27
activity undetected in the ileum. However, different phytases differ in their resistance to
endogenous protease (Dersjant-Li et al., 2015).
2.4.2. Mineral sources of phosphorus
Phytases are widely used in the poultry industry, as they are critical for an
efficient and sustainable use of vegetable sources. However, most of the diets need to be
fortified with mineral sources of P.
Di-calcium, mono-calcium, mono-di-calcium phosphates and de-fluorinated
rock phosphate are the most commonly used forms of inorganic feed phosphates. The
terms mono- and di-calcium phosphate (Table 2.7) are commonly used in product
descriptions; most commercial inorganic feed phosphates in the above categories are not
pure products, but rather mixtures of MCP and DCP (Viljoen, 2001).
Table 2.7. Comparison between Di-calcium phosphate and Mono-calcium phosphate.
The ratio of these products in commercial, inorganic phosphates sources depends
to a large extent on reaction conditions (heat, water and pressure) and on design
conditions specific to the particular manufacturing plant. Baker (1989) described the
typical commercial products; DCP (CaHPO4) and MCP [Ca (H2PO4)2.H2O] contain
mixtures of CaHPO4, Ca (H2PO4)2.H2O, and CaHPO4.2H2O. Mono-calcium phosphate
generally contains 13% CaHPO4, and 61% Ca (H2PO4)2.H2O, with the remainder being
small amounts of other phosphates and minerals. Commercial DCP generally contains
about 14% Ca (H2PO4)2.H2O, 35% CaHPO4.2H2O and 26% CaHPO4 (Joseph and
Scares, 1995). In general, DCP, which is less soluble than MCP, is the preferred source
in poultry feeding. But the concentration and availability of P in commercial phosphates
must receive proper attention in feed formulation, not only because absolute
Di-calcium phosphate Mono-calcium phosphate
Molecular formula CaHPO4 CaH4P2O8
Solubility in water 0.02 g/100 ml 2 g/100 ml
Molecule
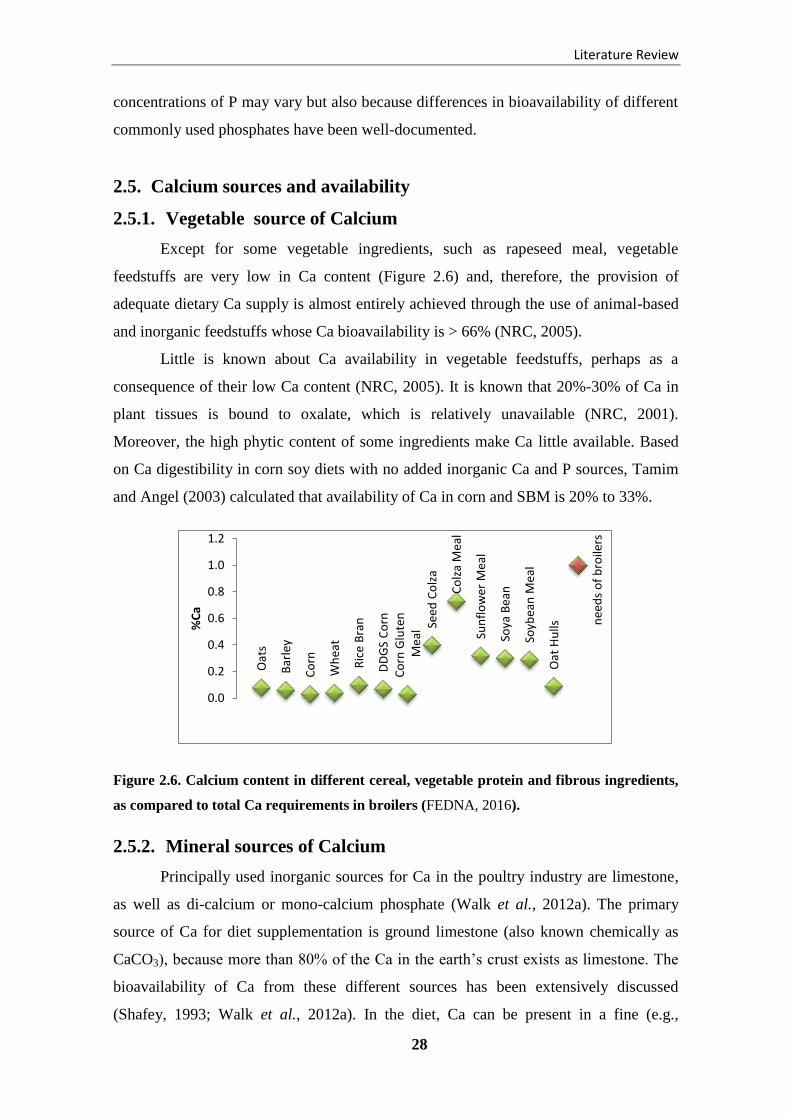
Literature Review
28
concentrations of P may vary but also because differences in bioavailability of different
commonly used phosphates have been well-documented.
2.5. Calcium sources and availability
2.5.1. Vegetable source of Calcium
Except for some vegetable ingredients, such as rapeseed meal, vegetable
feedstuffs are very low in Ca content (Figure 2.6) and, therefore, the provision of
adequate dietary Ca supply is almost entirely achieved through the use of animal-based
and inorganic feedstuffs whose Ca bioavailability is > 66% (NRC, 2005).
Little is known about Ca availability in vegetable feedstuffs, perhaps as a
consequence of their low Ca content (NRC, 2005). It is known that 20%-30% of Ca in
plant tissues is bound to oxalate, which is relatively unavailable (NRC, 2001).
Moreover, the high phytic content of some ingredients make Ca little available. Based
on Ca digestibility in corn soy diets with no added inorganic Ca and P sources, Tamim
and Angel (2003) calculated that availability of Ca in corn and SBM is 20% to 33%.
Figure 2.6. Calcium content in different cereal, vegetable protein and fibrous ingredients,
as compared to total Ca requirements in broilers (FEDNA, 2016).
2.5.2. Mineral sources of Calcium
Principally used inorganic sources for Ca in the poultry industry are limestone,
as well as di-calcium or mono-calcium phosphate (Walk et al., 2012a). The primary
source of Ca for diet supplementation is ground limestone (also known chemically as
CaCO3), because more than 80% of the Ca in the earth’s crust exists as limestone. The
bioavailability of Ca from these different sources has been extensively discussed
(Shafey, 1993; Walk et al., 2012a). In the diet, Ca can be present in a fine (e.g.,
Oat
s
Bar
ley
Co
rn
Wh
eat
Ric
e B
ran
DD
GS
Co
rn
Co
rn G
lute
n
Mea
l Seed
Co
lza
Co
lza
Mea
l
Sun
flo
wer
Mea
l
Soya
Bea
n
Soyb
ean
Mea
l
Oat
Hu
lls nee
ds
of
bro
ilers
0.0
0.2
0.4
0.6
0.8
1.0
1.2
%C
a

Chapter 2
29
limestone, which may contain a range of particle size) or coarse (e.g., oyster shell) form
(Figure 2.7).
Limestone (large particles) Limestone (small particles) Oyster shell
Figure 2.7. Various sources of dietary calcium.
Oyster shell, a common source of Ca in laying-bird diets, also has highly (100%)
relative available Ca. Marble dust and aragonite are considered less common sources of
Ca for domestic animals (Peeler, 1972). Considerably more research on Ca
bioavailability has been reported for poultry than for other animals, underscoring the
importance of Ca to these species. However, as reported above, Ca bioavailability is
highly dependent on different factors, such as the physical form of the ingredient and
the dietary level, as well the animal age. Calcium requirements have usually been
measured using limestone in the diet, which shows a reduced solubility during
neutralization in the small intestine (Goss et al., 2007) and few efforts have been made
to optimize the use and availability of new Ca sources.
2.6. Calcium and Phosphorus homeostasis in chickens
The metabolism of Ca and phosphorus (P) is closely related, and a deficiency or
an excess of either one will interfere with the utilization and metabolism of the other
(Kebreab and Vitti, 2005).
Absorbed P and Ca are rapidly transferred into skeletal and soft tissues of the
body. Bones serve as storehouses of these two minerals, which can be mobilized when
they are needed. There is a continuous turnover of P and Ca in the body, so resorption
from bone and soft tissues takes place concurrently with synthesis. So, the metabolism
of these two minerals involves not only deposition but also the processes of storage and
mobilization (France et al., 2010; and Veum, 2010). Calcium and P are ingested with
the feed and absorbed primarily in the duodenum and jejunum in the small intestine (De
Vries et al., 2010). The extracellular pool contains 9 mg Ca/dl to 12 mg Ca/dl and from
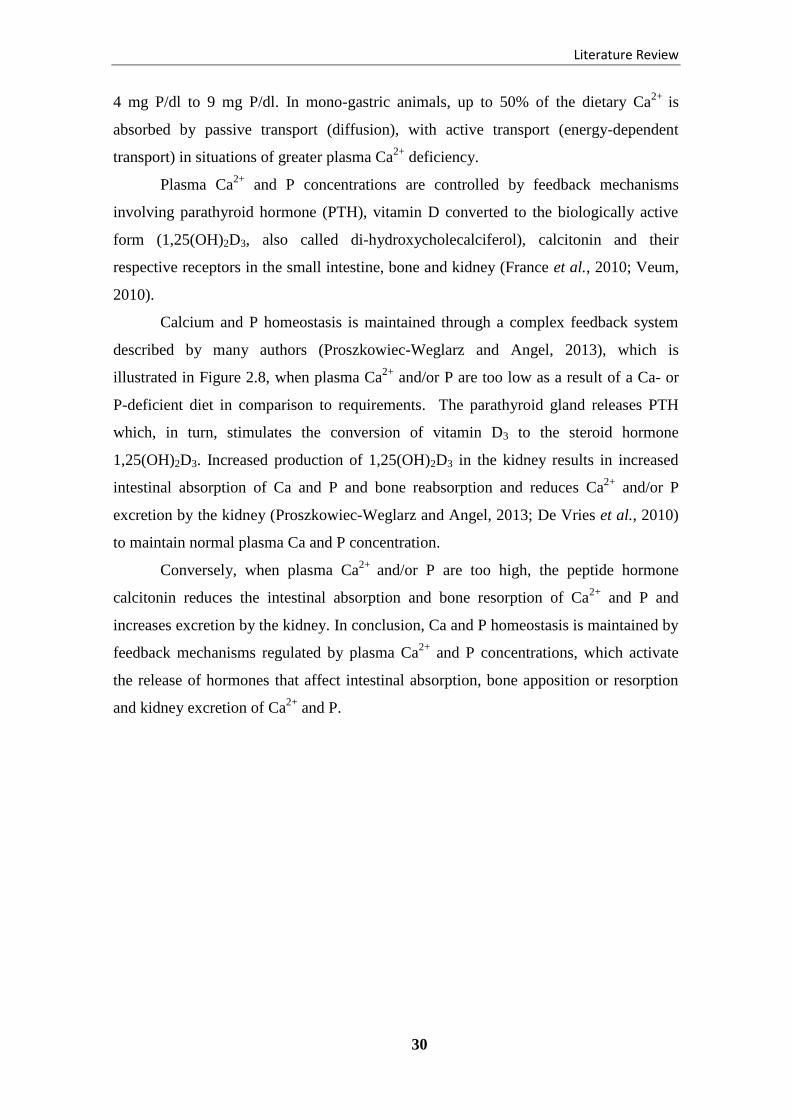
Literature Review
30
4 mg P/dl to 9 mg P/dl. In mono-gastric animals, up to 50% of the dietary Ca2+
is
absorbed by passive transport (diffusion), with active transport (energy-dependent
transport) in situations of greater plasma Ca2+
deficiency.
Plasma Ca2+
and P concentrations are controlled by feedback mechanisms
involving parathyroid hormone (PTH), vitamin D converted to the biologically active
form (1,25(OH)2D3, also called di-hydroxycholecalciferol), calcitonin and their
respective receptors in the small intestine, bone and kidney (France et al., 2010; Veum,
2010).
Calcium and P homeostasis is maintained through a complex feedback system
described by many authors (Proszkowiec-Weglarz and Angel, 2013), which is
illustrated in Figure 2.8, when plasma Ca2+
and/or P are too low as a result of a Ca- or
P-deficient diet in comparison to requirements. The parathyroid gland releases PTH
which, in turn, stimulates the conversion of vitamin D3 to the steroid hormone
1,25(OH)2D3. Increased production of 1,25(OH)2D3 in the kidney results in increased
intestinal absorption of Ca and P and bone reabsorption and reduces Ca2+
and/or P
excretion by the kidney (Proszkowiec-Weglarz and Angel, 2013; De Vries et al., 2010)
to maintain normal plasma Ca and P concentration.
Conversely, when plasma Ca2+
and/or P are too high, the peptide hormone
calcitonin reduces the intestinal absorption and bone resorption of Ca2+
and P and
increases excretion by the kidney. In conclusion, Ca and P homeostasis is maintained by
feedback mechanisms regulated by plasma Ca2+
and P concentrations, which activate
the release of hormones that affect intestinal absorption, bone apposition or resorption
and kidney excretion of Ca2+
and P.
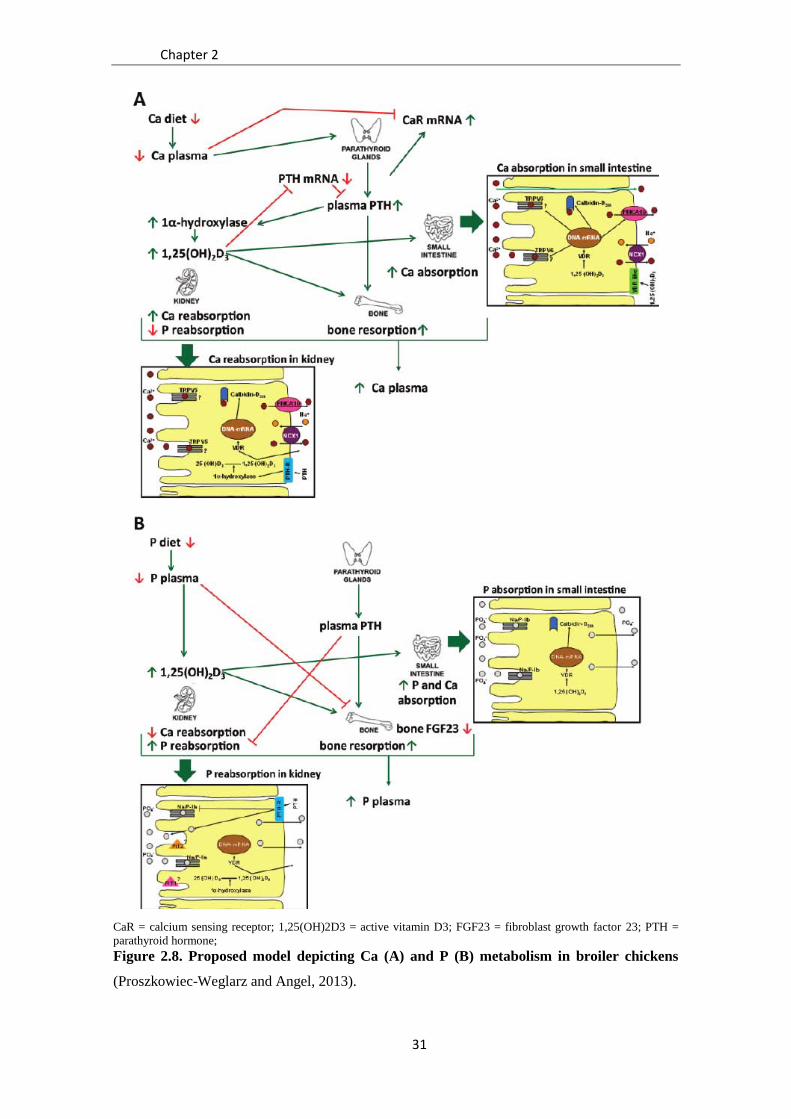
Chapter 2
31
CaR = calcium sensing receptor; 1,25(OH)2D3 = active vitamin D3; FGF23 = fibroblast growth factor 23; PTH =
parathyroid hormone;
Figure 2.8. Proposed model depicting Ca (A) and P (B) metabolism in broiler chickens
(Proszkowiec-Weglarz and Angel, 2013).
Literature Review
32
2.7. Factors affecting calcium and phosphorus nutrition
2.7.1. Interactions between dietary calcium and phosphorus
2.7.1.1. Formation of calcium phytate complexes
On the one hand, calcium exists as mineral-phytate complexes in poultry diets;
in fact, it is limited by the relatively low concentrations in feed ingredients and the
inherent structure of phytate (Lott et al., 2000; Selle et al., 2009). On the other hand, the
formation of Ca-phytate complexes along the gastrointestinal tract of birds is very
important. Ca-phytate complex formation is influenced by molar ratios of their
constituents, the gut pH, and their reduced solubility (Selle et al., 2009). Poultry diets
typically contain 10 g/kg of both Ca and phytate; if one phytate molecule binds five Ca
atoms in the gastrointestinal tract, approximately one-third of dietary Ca would be
present as Ca-phytate complexes. Instructively, Pang and Applegate (2007) found that
Ca solubility was only 11% in the duodenum and jejunum of chickens offered diets
containing 9 g/Kg of Ca and 9.22 g/Kg phytate. Mohammed et al. (1991) showed that
decreasing Ca levels from 10 g/kg to 5 g/kg in low P diets resulted in a 15% increase in
phytate-P digestibility in chicks. Plumstead et al. (2007) demonstrated that increasing
dietary Ca from 4.7 g/kg to 11.6 g/kg linearly decreased ileal phytate-P digestibility by
71%.
2.7.1.2. Formation of calcium phosphate complexes
Calcium has the capacity to interact with inorganic P in the gut lumen, in
addition to phytate-P (Selle et al., 2009). Hurwitz and Bar (1971) concluded that an
excess of Ca relative to inorganic P increased the formation of inorganic Ca-P
precipitates, which decreased the concentration of soluble forms of P in the intestinal
lumen and reduced P digestibility. Tamim et al. (2004) reported that 5 g Ca/Kg reduced
ileal digestibility of phytate-P by 63%, but additional Ca also reduced the digestibility
of total P by 57%. This can be due to the precipitation of Ca, which was binding with
both phytate and inorganic P to form either Ca-phytate complexes and/or calcium
phosphates (Selle et al., 2009).
2.7.2. Intestinal pH
Several researchers have studied the solubility and stability of phytate-metal
complexes and have observed that both are pH-dependent (Wise, 1983; Maenz et al.,
1999; Selle et al., 2000).
Chapter 2
33
Figure 2.9. The pH value in the different parts of the broiler digestive tract (Aviagen,
2013).
Most phytate-mineral chelates are soluble at low pH (3.5), with decreasing
solubility at higher values between pH 4.5 and pH 7. The approximate pH of the
intestine, where absorption of minerals takes places, coincides with the pHs at which
these complexes precipitate (Figure 2.9) (Tamim and Angel, 2003). At pH 6, the normal
pH of the duodenum, maximum binding of phytic acid to minerals forming Zn-Ca-Cu -
phytate and Cu-Ca-phytate complexes occurs (Oberleas, 1973).
The insoluble InsP6- mineral complexes formed a higher pH, where plant
phytases are most active, and may be resistant to hydrolysis by phytases of plant and
microbial origin (Sooncharernying, 1993; Angel et al., 2002).
An increase in gizzard pH significantly reduced Ca solubility in broilers
(Guinotte et al., 1995), and a higher pH (5) has been involved in Ca-phytate interactions
in the gastrointestinal tract and interference with macro-mineral absorption (Simpson
and Wise, 1990). Limestone, the dominant source of Ca in poultry diets, has a high
acid-binding capacity (Lawlor et al., 2005), so high dietary limestone may act as an anti
acid in the distal portions of the gizzard and ileum. According to Guinotte et al. (1995),
increasing dietary limestone increased gizzard pH of immature pullets and increased
pH 3-7
5
.5
pH (1.5-4) 2.7
5.5
pH 6-7.2
5
.5
pH 4-6.4
5
.5
pH 1.5-3.5
5
.5
pH 6-6.8
5
.5

Literature Review
34
crop and ileal pH in 12-d-old broilers. So the use of other Ca sources with lower ABC
and higher solubility can limit the increase in pH values in the digestive tract. This will
be one of our hypotheses in this thesis.
2.7.3. Calcium particle size
The solubility of Ca in the gastrointestinal tract may have a direct effect on the
formation of phytic P-mineral complexes. Research usually neglects to describe the
limestone particle size and Ca solubility in the mineral studies in poultry or studies
aiming to evaluate exogenous phytase in broilers (Manangi and Coon, 2007). Despite its
looking like a contradiction, broilers may gain more from feeding phytase by eating
larger-particle CaCO3 with lower solubility to minimize the solubility of CaCO3 in the
crop and in the anterior portion of the gastrointestinal tract. A low-solubility form of
CaCO3 may allow the phytase enzyme more access to phytic acid P in the gut and
provide more available P from phytic acid hydrolysis in the broiler (Manangi and Coon,
2007). Phytic P hydrolysis was reduced 8% in an in vitro assay when the incubation
mixture was pH 2.5 and contained the smallest particle size CaCO3, as compared to a
mixture with the largest-particle size of CaCO3 (Manangi and Coon, 2007).
Limestone with very small particles has high solubility and may pass through the
gastrointestinal tract at a faster rate and decrease maximum retention. The highly
soluble Ca from the small particles may also enhance the formation of a mineral-phytic
complex that reduces the ability of added dietary phytase to hydrolyze phytic acid.
These mechanisms may explain that feeding chicks a diet with CaCO3 particle sizes
between 137 μm and 388 μm increased the body weight gain of animals as compared to
that obtained by feeding either smaller (28 μm) or larger particle (1306 μm) sizes
(Manangi and Coon, 2007). An increased ash tibia content was also obtained for the
chicks fed CaCO3 particle sizes ranging from 137 μm -388 μm, as compared to the
smallest (28 μm) or largest particle (1306 μm) sizes.
However, Walk et al., (2012a) have presented the results on the influence of a
highly soluble Ca source (from 0.45% to 0.9% Ca in the diet) on performance and bone
mineralization. Their results showed that feeding broiler chicks with a higher soluble
source of Ca with phytase allowed for reductions in dietary Ca while maintaining
broiler performance and bone ash. Their results again suggest that the current
recommendation of total Ca for broilers may be overestimated, as they have been

Chapter 2
35
mostly defined using limestone-containing diets, which encourages the interest of
moving forward to better know Ca requirements on a digestible basis.
2.7.4. Phytase interactions
It has been shown that some feed additives may have deleterious effects on
phytase efficacy. For example, other mineral levels, in addition to Ca, in the diet may
influence phytic phosphorus hydrolysis by phytase. According to Maenz et al. (1999),
phytate can bind or chelate multivalent cations to form phytate-mineral complexes and
limit phytase hydrolysis (Tamim and Angel, 2003). The order of stability of metal-
phytate complexes was found to be Zn > Co > Mn > Fe > Ca. While Ca has one of the
lowest affinities for phytate, it has the greatest impact, because it is the mineral at the
highest level in the diet. In this thesis, we shall study only the effect of phytase on Ca
and Cu-phytate complexes.
2.7.4.1. With Calcium
It was demonstrated by Applegate et al. (2003) that Ca levels used in broiler
diets (0.9%) reduced intestinal phytase activity and apparent ileal PP hydrolysis,
compared with a lower level of Ca (0.4%). In the same way, Sebastien et al. (1996)
described that the best phytase efficacy supplemented to a corn-soy diet was seen with
diets containing 0.6% Ca, as compared to a diet with 1% Ca. Tamim et al. (2004) also
confirmed that the addition of Ca in broiler diets resulted in a decrease in PP hydrolysis.
These authors attributed the effect of reduced PP utilization at higher Ca concentrations
to one of three factors:
1. Precipitation of phytate by Ca through Ca-phytate complex formation, based on
the findings of Wise (1983);
2. Increased intestinal pH caused by the addition of Ca, reduced mineral solubility
and therefore availability, as reported by Shafey and McDonald (1991);
3. The direct effect of Ca on phytase competing for the active sites of phytase, as
described by McGuaig et al. (1972).
2.7.4.2. With Copper
Copper is one of the essential trace minerals required by animals, for growth and
for the prevention of a wide range of clinical and pathological disorders in all types of
farm animals. It is also vital in the body as a component and cofactor for enzyme
Literature Review
36
systems involved in iron transport (caeruloplasmin) and metabolism, red blood cell
formation and the immune function. Along with Fe, Cu is necessary for hemoglobin
synthesis. Copper is not contained in hemoglobin, but a trace of it is necessary to serve
as a catalyst before the body can utilize Fe for hemoglobin formation (McDowell,
1992).
Copper is an essential mineral required for proper bone growth and development
as well as enzyme function (Banks et al., 2004a). Rucker et al. (1975) found that Cu
deprivation in the chick produces a normocytic and normochromic anemia, and low
monoamine oxidase or cytochrome c oxidase activity in the bones may compromise
osteoblastic activity leading to abnormal bone morphology. A deficiency of Cu was
shown to decrease collagen crosslink formation and to lower mineralization (Osphal et
al., 1982). Reduction of collagen crosslinks through Cu deficiency can reduce
calcification and, consequently, bone strength.
The copper requirements for broiler are 8 mg/kg NRC (1994). However, in some
countries Cu is often added to poultry diets at prophylactic concentrations; it has also
become a common practice in the United States and elsewhere to supplement broiler
diets with 125 mg/kg to 250 mg/kg additional copper from Cu sulfate pentahydrate to
enhance health and growth promoting effects (Pesti and Bakalli, 1996) as one
alternative to antibiotics.
As described above, phytic acid is negatively charged over a wide pH range and
chelate divalent and trivalent metal ions, such as Ca2+
, Cu2+
, Fe2+
, to form mineral-
phytin complexes existing in soluble and insoluble forms (Pang and Applegate, 2006).
Consequently, the high amount of Cu in diets has been shown to have negative
influences in the availability of phytase to hydrolyze PP (Pang and Applegate, 2006).
Similarly, Cu sources may have different chemical-property effects within the digestive
tract, including different solubility, and a different chelation capacity for PP. Therefore,
phytin can also bind to Ca as well as to other minerals at the same time. Multiple
mineral complexes are assumed to be more stable than are single mineral complexes
(Maenz et al., 1999). The insoluble complexes formed will limit the hydrolysis of
phytin-P, the mineral absorption (Banks et al., 2004b) and reduce the bioavailability of
the mineral due to decreased solubility at intestinal pH (Persson et al., 1998). Thus, the
likely effects of including different levels and sources of Cu in the diet on the P
digestibility and broilers performance merits to be studied.

Chapter 3
37
CHAPTER 3
Objectives and experimental design

Objectives and experimental design
38
Chapter 3
39
The purpose of this thesis will be to highlight dietary factors influencing Ca and P
utilization by broilers chicks. We hypothesize that:
1. A significant decrease in the level of Ca and P will improve broiler
performance and bone mineralization by reducing digestive interactions and
improving mineral retention.
2. High-soluble Ca sources with low acid-binding capacity can be used to
improve the mineral digestibility and reduce the levels of Ca inclusion in the diet.
3. The use of different mineral sources of P will affect the dietary P
absorption and overall productivity of broiler chickens.
4. Reducing the levels of Ca and P, and giving high doses of phytase, may
help to increase P availability, performance, and bone mineralization in broilers.
5. The use of therapeutic doses of Cu in the form of di-copper oxide will
improve PP hydrolysis and broiler performance as compared to copper sulfate.
Considering these hypotheses, the main objectives of this thesis are:
1. To establish optimum dietary Ca and NPP levels for starting broilers from
their performance and bone mineralization responses to a factorial range of diets
containing different levels of Ca and NPP plus a high dose of phytase. Trial 1
proposes to study the interaction among three levels of Ca (0.5%, 0.7%, and 0.9%)
and four levels of NPP (0.25%, 0.31%, 0.38%, and 0.45%) in the diet with a high
dose of phytase, to establish the optimum dietary Ca and NPP for starting broilers
from their performance, bone mineralization and whole-body fractional retention of
Ca and P.
2. To evaluate the Ca in vitro solubility and ABC (acid-binding capacity)
characteristics of different Ca sources, and explore how the incorporation of these
sources may affect the ileal digestibility of Ca and P, animal performance, and bone
mineralization in broiler chickens. Trial 2 proposes to evaluate different Ca sources
(limestone, Ca chloride and Lipocal, a fat-encapsulated tri-calcium phosphate, TCP)
in conjunction with four dietary levels of NPP (0.3%, 0.35%, 0.4%, and 0.45%) in
starting broiler chickens. Calcium sources were also evaluated in vitro to measure
ABC and Ca solubility at different pH values.

Objectives and experimental design
40
3. To evaluate the effect of the P source provided at different levels in broiler
diets on the availability of P and their effects on performance and bone
mineralization for broilers. Trial 3 was designed to compare P availability among
MCP and different sources of DCP in broiler chickens up to d 21. Trial 4 compared
the inclusion of a source of TCP, as a single source of Ca and P, and MCP plus
limestone in broiler diets, with respect to their effects on performance, bone
mineralization and P retention in broilers up to d 35.
4. To evaluate the efficacy of increasing levels of a new microbial 3-phytase
(FLF® 1000 FUT, liquid phytase produced by Fertinagro®) to improve
performance and bone mineralization in broilers. In Trial 5, different dietary levels
of Ca (0.7% and 0.9% in the starter phase; 0.63% and 0.85% in the grower phase)
and NPP (0.32% and 0.47% in the starter phase; 0.29% and 0.43% in the grower
phase) were used to test, in the first stage, the efficiency of a new microbial phytase
at different levels of inclusion for broilers at 35 days.
5. To compare, in the second stage, the efficacy of the new phytase in the diet to
three other commercial phytases for enhancing the utilization of low NPP diets with
low and high Ca:aP ratios. Trial 6 was designed to test the efficacy of different
commercial phytase sources (OptiPhos®, Phyzyme®, Ronozyme®, FLF® 1000
FUT) for enhancing the utilization of low NPP diets with low and high Ca:aP ratios
for broilers at 21 days.
6. To compare the effect of copper sulfate, the most commonly used Cu source
for supplementation in poultry diets, and di-copper oxide (Cu2O; CoRouge®) in the
diets of broiler chickens. Trial 7, focused on the comparison of the effects of two
sources of Cu at three levels of dietary Cu (15 ppm, 150 ppm, 300 ppm) in broiler
chicken performance, mineral interaction in the digesta and mineral accumulation in
organs and tissues. An in vitro test was also designed to compare the solubility of
both sources and to identify likely interactions with the phytic phosphorus (PP) and
phytase hydrolysis.
This thesis has been partially funded by the project Fertinagro FER -23-2013 and the
Animal Nutrition and Welfare Service SNiBA.
This work also was possible with the intense collaboration of other research services of
our University, such as the Animal Farm Facilities Services (SGiCE) and the the
Service of Chemical Analyses (SAQ).

Chapter 4
41
CHAPTER 4
The effect of different levels of calcium and
phosphorus and their interaction on the
performance of young broilers
Calcium and phosphorus levels on broilers performance
42
The effect of different levels of calcium and phosphorus and their
interaction on the performance of young broilers
M. Hamdi1, S. López-Vergé
1, E. G. Manzanilla
2, A. C. Barroeta
1, and J. F. Pérez
1
1 Animal Nutrition and Welfare Service (SNiBA). Departament de Ciencia Animal i
dels Aliments. Universitat Autònoma de Barcelona, 08193 Bellaterra, Spain .
2 Animal and Grassland Research and Innovation Centre, Teagasc; Moorepark, Fermoy,
Co. Cork, Ireland.
Published in:
Poultry Science (September 2015) 94: 2144-2151 (Hamdi et al., 2015a)

Chapter 4
43
4.1. Abstract
A study was conducted to evaluate the interaction among 3 levels of Ca and 4
levels of non-phytate phosphorus (NPP) on broiler performance, bone ash and whole-
body fractional retention of Ca and P. Ross male broiler-chicks (n = 420) were sorted by
BW at d 1 post-hatch and assigned to 5 cages per diet with 7 birds per cage. Twelve
diets were arranged in a 3 x 4 factorial of 3 levels of Ca (at 0.5%, 0.7%, or 0.9%) and 4
levels of NPP (at 0.25%, 0.31%, 0.38%, or 0.45%) with a high dose of phytase (1,150
U/kg) in all diets. On d 14, chickens were euthanized and the right tibia was collected
from 3 birds per replicate; the rest of the animals were used to measure whole-body Ca
and P retention. An interaction was observed between the level of Ca and NPP on feed
intake (FI), tibia weight and bone-ash content (P < 0.05). Increasing the level of NPP
from 0.25% to 0.38% increased FI (P < 0.05) on chickens fed the high-Ca diet (0.9%),
but not with Ca at 0.5% or 0.7%. Broilers achieved their greatest weight gain (WG) and
bone formation with 0.7% Ca and 0.38% of NPP. Increasing the dietary Ca decreased
its fractional retention from 74% with dietary Ca at 0.5% to 46% with Ca at 0.9%. The
increase in the levels of dietary P steadily increased the fractional retention of Ca from
53% to 61%, and increased the whole-body Ca content (g/kg BW). It can be concluded
that a dietary level of 0.38% NPP/kg in diets containing a high dose of phytase (1,150
U/kg) and 0.7% Ca are adequate to ensure broiler performance and bone ash of broilers
from d 1 to d 14 post-hatch.
Calcium and phosphorus levels on broilers performance
44
4.2. Introduction
Chicken growth has been accelerated during recent decades, and leg problems in
the barn, as well as bone fractures during processing of the carcass, are considered
major threats in the poultry industry (Chen and Moran, 1995). Selected fast-growing
strains have shown lower bone-ash content than slow-growing strains (Williams et al.,
2000), which may suggest that diets should be higher in Ca and P than current
recommendations (10g Ca/kg and 4.5g non-phytate P (NPP)/kg at ages 1-21d, National
Research Council, 1994) in order to reach skeletal integrity for modern strains.
It is generally accepted that an increase of Ca in the diet may increase bone-ash
content when Ca is limiting bone mineralization (Driver et al., 2005b; Létourneau-
Montminy et al., 2008). However, high dietary Ca has been also implicated in reduced
animal performance (Sebastian et al., 1996) and interference with macro-mineral
absorption (Simpson and Wise, 1990). Calcium may form soap precipitates with free
saturated fatty acids, thus decreasing the dietary energy digestibility (Pepper et al.,
1955; Edwards et al., 1960), and has the capacity to interact with inorganic P in the gut
(Hurwitz and Bar, 1971) as well as to form a mineral-phytate complex in excess of pH
5.0. The Ca-phytate complex may reduce Ca absorption (Lonnerdal et al., 1989) but
may also reduce the activity of endogenous and exogenous phytase (Tamim et al.,
2004). Decreasing dietary Ca may improve P utilization, while an excess of Ca may
aggravate a P deficiency for ash criteria (Létourneau-Montminy et al., 2008). Other
factors, such as the high acid-binding capacity of limestone, have also been related to
significant decreases in the protein and P solubility in the gizzard, and may affect N and
P digestibility (Tamim and Angel, 2003; Selle et al., 2009; Walk et al., 2012b).
Therefore, different authors have shown that a moderate reduction on dietary Ca had no
deleterious effects on broiler performance (down to 0.6%, Driver et al., 2005b; or
0.73%, Ziaei et al., 2008) and bone ash (0.75%, Sing et al., 2013).
On the other hand, the amount of P necessary to sustain broilers´ requirements
can be provided with graded levels of inorganic P and/or phytase (Venäläine et al.,
2006; Adeola and Walk, 2013). Higher levels than the physiological threshold needed
for maximum retention are eliminated through kidneys (Manangi and Coon, 2008), with
the consequent environmental and economic threat.
The scenario becomes even more complex if we consider that Ca animal
requirements are described on a total Ca basis and have usually been measured using

Chapter 4
45
low soluble sources, such as limestone. Recently, high-soluble sources of Ca in the diets
(Walk et al., 2012c) or different limestone particle size (Manangi and Coon, 2007) have
been explored, as well as the widespread use of overdoses of phytase in the diets to
maximize phytate P utilization. For example, if it is assumed that 5.1 atoms of Ca are
bound by one phytate molecule (Nelson, 1984), an overdose of dietary phytase with
complete hydrolyses of phytate (1% in the diet) may liberate up to 0.36% Ca, allowing
for significant reductions in dietary Ca without influencing broiler performance and
bone ash. Therefore, redefining Ca and NPP requirements for broilers has become a
major issue for the poultry industry, with economic, environmental and animal welfare
implications.
Consequently, we tested the hypothesis that a significant decrease in the level of
Ca may improve broiler performance and bone mineralization by reducing digestive
interactions and improving mineral retention. The objective of this study is to establish
optimum dietary Ca and NPP levels for starting broilers from their performance and
bone mineralization responses to a factorial range of diets containing 3 levels of Ca and
4 levels of NPP plus a high dose of phytase.
4.3. Materials and methods
All study procedures were approved by the Animal Ethics Committee of the
Universitat Autònoma de Barcelona and were in compliance with the European Union
guidelines for the care and use of animals in research (European Parliament, 2010).
4.3.1. Bird Management, Husbandry, Experimental Design and Diets
In total, four hundred twenty 1-day-old male broilers (Ross 308) were obtained
from a local hatchery, where they received in ovo vaccinations for Marek disease,
Gumboro disease and Infectious Bronchitis. The birds were weighed, wing tagged and
allotted to 12 dietary treatments in a completely randomized design. Each treatment was
replicated 5 times in battery brooder cages with 7 chicks each. The brooder temperature
was maintained at 35ºC from d 1 to d 4 post-hatch, and was progressively reduced to
25ºC on d 14. The light cycle was 24L:1D from d 1 to d 2, 23L:1D from d 3 to d 10, and
18L:6D from d 11 to d 14. Feed was provided ad libitum and water was freely available.
Three calculated levels of Ca at 0.5, 0.7, or 0.9% of the diet and 4 calculated
non-phytate P (NPP) levels at 0.25%, 0.31%, 0.38% or 0.45% of the diet were used in a
3 x 4 factorial arrangement. With 5 replicates/ treatment. All diets met or exceeded the
Calcium and phosphorus levels on broilers performance
46
nutrient requirements for broilers (Fundación Española Desarrollo Nutrición Animal,
2008), with the exception of Ca and available P, and fed in mash form. Diets contained
1,000 U Escherichia coli 6-phytase expressed in Trichoderma reesei (Quantum Blue,
AB Vista Feed Ingredients; Marlborough, UK). The phytase activity analyzed in the
diets was 1,150 FTU/kg. Not any release of Ca and/or P was attributed to the phytase
addition during the diet formulation.
4.3.2. Growth Performance and Sampling
Birds were individually wing-tagged in order to monitor individual BW as well
as the group BW at the start (1 d) and d 7 and d 14 posthatch. From these values the
feed intake (FI), weight gain (WG), and G:F from d 1 to d 14 were calculated. On d 14,
3 birds with the closest BW to the average cage BW were killed by cervical dislocation.
The pH of the gizzard and proventriculus were recorded by immersing the electrode of a
digital pH meter into the center of the lumen. The right tibiotarsus was removed, boiled,
and cleaned from adherent tissue for bone-ash determination. The rest of the chicks
were fasted for 2h and killed by cervical dislocation to determine Ca and P content of
the whole body. The 4 whole bodies were minced together and stored for ash, Ca and P
content determination.
4.3.3. Laboratory Analyses
Diets were analyzed for DM, Ca and P. DM was determined by placing samples
in a drying oven at 105ºC for 24 h. Dietary samples were digested in nitric perchloric
and fluorhydric acid and subsequently analyzed for P and Ca by flame atomic
absorption spectroscopy.
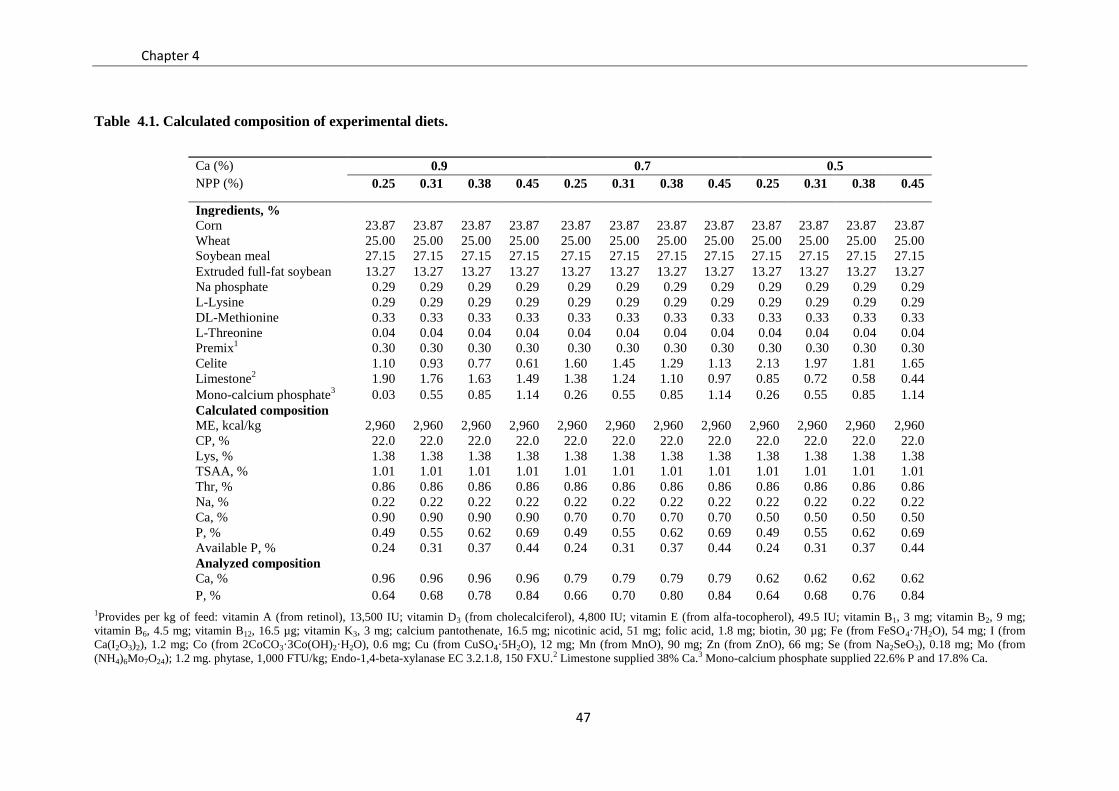
Chapter 4
47
Table 4.1. Calculated composition of experimental diets.
1Provides per kg of feed: vitamin A (from retinol), 13,500 IU; vitamin D3 (from cholecalciferol), 4,800 IU; vitamin E (from alfa-tocopherol), 49.5 IU; vitamin B1, 3 mg; vitamin B2, 9 mg;
vitamin B6, 4.5 mg; vitamin B12, 16.5 µg; vitamin K3, 3 mg; calcium pantothenate, 16.5 mg; nicotinic acid, 51 mg; folic acid, 1.8 mg; biotin, 30 µg; Fe (from FeSO4·7H2O), 54 mg; I (from
Ca(I2O3)2), 1.2 mg; Co (from 2CoCO3·3Co(OH)2·H2O), 0.6 mg; Cu (from CuSO4·5H2O), 12 mg; Mn (from MnO), 90 mg; Zn (from ZnO), 66 mg; Se (from Na2SeO3), 0.18 mg; Mo (from
(NH4)6Mo7O24); 1.2 mg. phytase, 1,000 FTU/kg; Endo-1,4-beta-xylanase EC 3.2.1.8, 150 FXU.2 Limestone supplied 38% Ca.3 Mono-calcium phosphate supplied 22.6% P and 17.8% Ca.
Ca (%) 0.9 0.7 0.5
NPP (%) 0.25 0.31 0.38 0.45 0.25 0.31 0.38 0.45 0.25 0.31 0.38 0.45
Ingredients, %
Corn 23.87 23.87 23.87 23.87 23.87 23.87 23.87 23.87 23.87 23.87 23.87 23.87
Wheat 25.00 25.00 25.00 25.00 25.00 25.00 25.00 25.00 25.00 25.00 25.00 25.00
Soybean meal 27.15 27.15 27.15 27.15 27.15 27.15 27.15 27.15 27.15 27.15 27.15 27.15
Extruded full-fat soybean 13.27 13.27 13.27 13.27 13.27 13.27 13.27 13.27 13.27 13.27 13.27 13.27
Na phosphate 0.29 0.29 0.29 0.29 0.29 0.29 0.29 0.29 0.29 0.29 0.29 0.29
L-Lysine 0.29 0.29 0.29 0.29 0.29 0.29 0.29 0.29 0.29 0.29 0.29 0.29
DL-Methionine 0.33 0.33 0.33 0.33 0.33 0.33 0.33 0.33 0.33 0.33 0.33 0.33
L-Threonine 0.04 0.04 0.04 0.04 0.04 0.04 0.04 0.04 0.04 0.04 0.04 0.04
Premix1 0.30 0.30 0.30 0.30 0.30 0.30 0.30 0.30 0.30 0.30 0.30 0.30
Celite 1.10 0.93 0.77 0.61 1.60 1.45 1.29 1.13 2.13 1.97 1.81 1.65
Limestone2 1.90 1.76 1.63 1.49 1.38 1.24 1.10 0.97 0.85 0.72 0.58 0.44
Mono-calcium phosphate3 0.03 0.55 0.85 1.14 0.26 0.55 0.85 1.14 0.26 0.55 0.85 1.14
Calculated composition
ME, kcal/kg 2,960 2,960 2,960 2,960 2,960 2,960 2,960 2,960 2,960 2,960 2,960 2,960
CP, % 22.0 22.0 22.0 22.0 22.0 22.0 22.0 22.0 22.0 22.0 22.0 22.0
Lys, % 1.38 1.38 1.38 1.38 1.38 1.38 1.38 1.38 1.38 1.38 1.38 1.38
TSAA, % 1.01 1.01 1.01 1.01 1.01 1.01 1.01 1.01 1.01 1.01 1.01 1.01
Thr, % 0.86 0.86 0.86 0.86 0.86 0.86 0.86 0.86 0.86 0.86 0.86 0.86
Na, % 0.22 0.22 0.22 0.22 0.22 0.22 0.22 0.22 0.22 0.22 0.22 0.22
Ca, % 0.90 0.90 0.90 0.90 0.70 0.70 0.70 0.70 0.50 0.50 0.50 0.50
P, % 0.49 0.55 0.62 0.69 0.49 0.55 0.62 0.69 0.49 0.55 0.62 0.69
Available P, % 0.24 0.31 0.37 0.44 0.24 0.31 0.37 0.44 0.24 0.31 0.37 0.44
Analyzed composition
Ca, % 0.96 0.96 0.96 0.96 0.79 0.79 0.79 0.79 0.62 0.62 0.62 0.62
P, % 0.64 0.68 0.78 0.84 0.66 0.70 0.80 0.84 0.64 0.68 0.76 0.84

Calcium and phosphorus levels on broilers performance
48
In-feed phytase activity (U/kg) was determined by the internal, validated method of the
producer (Method B-074). One phytase unit is defined as the amount of enzyme
required to release 1 μmol of inorganic P/min from sodium phytate at 37°C. The tibias
were defatted for 48h in ethyl ether. They were then dried for 12h at 110ºC and then
ashed overnight at 550ºC (Brenes et al., 2003). Ash content in the BW mince was
determined following incineration of samples (8 g) for 12 h at 550°C. Calcium and
phosphorus content were analyzed using an atomic absorption and mass
spectrophotometer in ash samples (0.5 g) that were digested in 5 ml nitric acid and 1 ml
of hydrogen peroxide using microwave digestion.
4.3.4. Calculations and Statistical Analyses
Whole-body Ca and P retention was calculated using the following equation:
Ca or P retention= (G:F) ([N] B / [N] D)
where G:F is gain-to-feed ratio, [N] B is the Ca or P content in the whole body, and [N] D
is the Ca or P content in the diet.
Data were analyzed by ANOVA using the GLM procedure of SAS 9.2 (Cary,
NC, USA). The main factors used in the model were Ca level and NPP level and their
interaction was also included. Multiple mean comparisons were done using Tukey´s
correction. The experimental unit was the pen. The alpha level used for determination of
significance was 0.05.
4.4. Results
The nutrients of the diets are presented in Table 4.1. It is worth noting that Ca in
the diet (0.62, 0.79, and 0.96% for the 3 levels of Calcium) was higher than what was
formulated as a consequence of the presence of Ca in some ingredients. The Ca content
in celite (the ingredient used in the trial to pair the diets) was 5.6%, and in the vitamin
and mineral premix it was 13.5%, likely due to limestone usually added as an inert
carrier in the premix. The analyzed P levels in diets (from 0.64 to 0.84%), and phytase
activity (1,150 FTU/kg) showed also higher values than it was calculated in the formula.

Chapter 4
49
Table 4.2. Influence of Ca and NNP1 levels in diets containing phytase at 1,150 FTU/kg on
feed intake and growth performance of broilers from d 1 to d 142.
Treatment NPP,
%
BW
d14, g
FI3
d1-14, g/d
WG4
d1-14, g/d
WG
d 7-14, g/d
G:F
d 1-14
0.5 0.25 428 37.6a 27.4 34.7 0.732
0.31 436 36.6ab
28.0 35.5 0.766
0.38 431 35.7ab
27.7 35.3 0.776
0.45 408 35.7ab
25.9 34.0 0.736
0.7 0.25 428 37.7a 27.4 35.4 0.731
0.31 444 37.3a 28.5 37.0 0.765
0.38 460 39.2a 29.7 39.0 0.770
0.45 440 36.6ab
28.3 36.0 0.771
0.9 0.25 391 30.3b 24.7 30.9 0.821
0.31 417 34.6ab
26.6 33.5 0.770
0.38 445 37.5a 28.7 36.6 0.766
0.45 446 35.3ab
28.7 37.9 0.815
Ca level, %
0.5 426 36.3 27.2 34.8ab
0.752
0.7 443 37.7 28.4 36.8
a 0.759
0.9 425 34.4 27.1 34.7b 0.793
NPP level, %
0.25 416b 35.1 26.5
b 33.6
b 0.761
0.31 432ab
36.1 27.7ab
35.3ab
0.767
0.38 446a 37.4 28.7
a 36.9
a 0.770
0.45 431ab
35.8 27.6ab
35.9ab
0.774
SEM 12.7 1.3 0.9 1.3 0.033
P value5
Ca level ×NPP level 0.122 0.048 0.107 0.068 0.614
Ca level 0.086 0.005 0.086 0.045 0.185
NPP level 0.050 0.242 0.045 0.025 0.969 1 Non-phytate P 2 Data are means of 5 pens with 7 chicks each. 3 Average daily feed intake 4 Average daily weight gain 5 abc Values in the same column with different letters are significantly different
(P< 0.05).
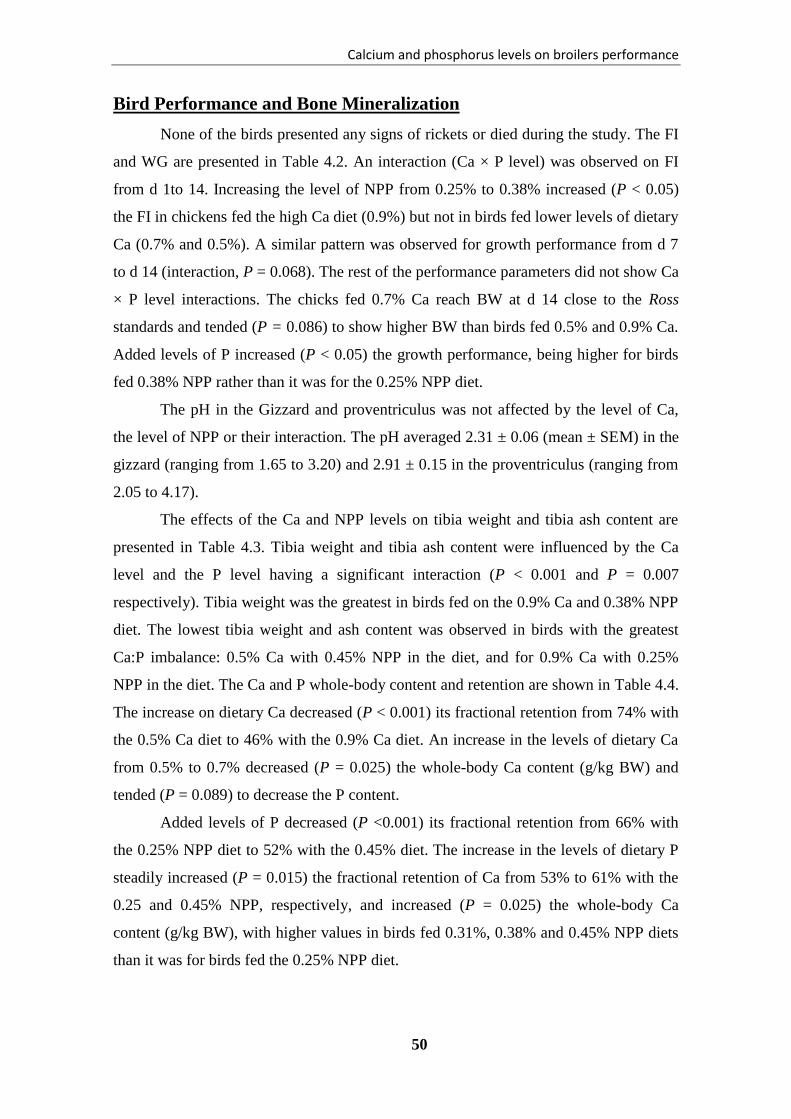
Calcium and phosphorus levels on broilers performance
50
Bird Performance and Bone Mineralization
None of the birds presented any signs of rickets or died during the study. The FI
and WG are presented in Table 4.2. An interaction (Ca × P level) was observed on FI
from d 1to 14. Increasing the level of NPP from 0.25% to 0.38% increased (P < 0.05)
the FI in chickens fed the high Ca diet (0.9%) but not in birds fed lower levels of dietary
Ca (0.7% and 0.5%). A similar pattern was observed for growth performance from d 7
to d 14 (interaction, P = 0.068). The rest of the performance parameters did not show Ca
× P level interactions. The chicks fed 0.7% Ca reach BW at d 14 close to the Ross
standards and tended (P = 0.086) to show higher BW than birds fed 0.5% and 0.9% Ca.
Added levels of P increased (P < 0.05) the growth performance, being higher for birds
fed 0.38% NPP rather than it was for the 0.25% NPP diet.
The pH in the Gizzard and proventriculus was not affected by the level of Ca,
the level of NPP or their interaction. The pH averaged 2.31 ± 0.06 (mean ± SEM) in the
gizzard (ranging from 1.65 to 3.20) and 2.91 ± 0.15 in the proventriculus (ranging from
2.05 to 4.17).
The effects of the Ca and NPP levels on tibia weight and tibia ash content are
presented in Table 4.3. Tibia weight and tibia ash content were influenced by the Ca
level and the P level having a significant interaction (P < 0.001 and P = 0.007
respectively). Tibia weight was the greatest in birds fed on the 0.9% Ca and 0.38% NPP
diet. The lowest tibia weight and ash content was observed in birds with the greatest
Ca:P imbalance: 0.5% Ca with 0.45% NPP in the diet, and for 0.9% Ca with 0.25%
NPP in the diet. The Ca and P whole-body content and retention are shown in Table 4.4.
The increase on dietary Ca decreased (P < 0.001) its fractional retention from 74% with
the 0.5% Ca diet to 46% with the 0.9% Ca diet. An increase in the levels of dietary Ca
from 0.5% to 0.7% decreased (P = 0.025) the whole-body Ca content (g/kg BW) and
tended (P = 0.089) to decrease the P content.
Added levels of P decreased (P <0.001) its fractional retention from 66% with
the 0.25% NPP diet to 52% with the 0.45% diet. The increase in the levels of dietary P
steadily increased (P = 0.015) the fractional retention of Ca from 53% to 61% with the
0.25 and 0.45% NPP, respectively, and increased (P = 0.025) the whole-body Ca
content (g/kg BW), with higher values in birds fed 0.31%, 0.38% and 0.45% NPP diets
than it was for birds fed the 0.25% NPP diet.

Chapter 4
51
4.5. Discussion
The Ca level promoted differences on FI and WG, with 0.7% Ca (analyzed,
0.79%) promoting higher FI and WG than 0.9% Ca did with limiting values of NPP.
Birds fed on 0.7% Ca also showed higher tibia ash and tibia weight than birds fed the
0.5% Ca diet. Then, birds exposed to diets with a medium level in Ca (0.7%) and 0.38%
NPP performed the best, while higher Ca levels (0.9%) induced negative responses
concerning FI and WG, which shows that a lower Ca concentration is desirable to reach
better performance in starting broilers. These results agree with Driver et al. (2005a),
who described BW and FCR optimized at 0.625% Ca in the diet. On other hand, Rama-
Rao et al. (2006) did not find differences in WG on d 14 due to variation in the dietary
Ca level.
There are different reasons which may explain the negative effects of high levels
of Ca on the broiler performance. Calcium is known to form insoluble complexes with
phytate phosphorus, which may hinder phytase activity (Angel et al., 2002). Calcium
also has the capacity to interact with inorganic P in the gut lumen to form insoluble Ca
orthophosphate (Plumstead et al., 2008), which may also make inorganic P less soluble
and available for absorption in excess of pH 5.0. This effect could explain our results
that the lowest performance was observed with high Ca diets containing limiting values
of NPP (0.25% NPP). Some reserchers have reported increases on the intestinal pH and
low apparent ileal P digestibility in broilers fed diets containing a high dietary level of
Ca (Sebastian et al., 1996; Adeola and Walk, 2013). Thus, high concentrations of
limestone, which is the dominant source of Ca in poultry diets with phytase, may
increase the pH in the proximal gastrointestinal tract due to its high acid-binding
capacity. Shafey (1999) described a limestone-induced pH increase from 5.68 to 6.24 in
small intestine digesta. An increase in the crop and gizzard pH may promote Ca,
phytate, and P precipitation, and it may also reduce the Ca and P digestibility (Selle et
al., 2009; Walk et al., 2012b). However, we were not able to observe differences in the
pH in the gizzard and proventriculus. Gacs and Barltrop (1977) showed that some
aggregations between minerals and dietary polymers in the digesta may also contribute
to reduce the digestibility coefficients for protein and fat. Calcium is able to form
insoluble soaps with free fatty acids and bile acids and there is some evidence that these
soaps limit the absorption of fat in vivo (Gacs and Barltrop, 1977; Govers, et al., 1996;
Shahkalili et al., 2001).
Calcium and phosphorus levels on broilers performance
52
Table 4.3. Influence of Ca and NPP1 levels in diets containing phytase at 1,150 FTU/kg on
tíbia weight and ash of 14-day-old broilers2.
1 Non-phytate P. 2 Data are means of 5 pens with 3 chicks each. 3 abc Values in the same column with different letters are significantly different (P < 0.05).
These soaps could lower the utilization of energy derived from lipids, particularly
saturated fats, in broiler diets. Nevertheless, it is relevant that FI was reduced in the
high-calcium diet, without affecting the G: F. This result could suggest that broilers may
have detected these high levels of calcium, or they reduced FI in order to avoid a larger
Ca and P imbalance. Some recent reports suggest that broilers are able to detect Ca in
the diet (Wilkinson et al., 2012).
Tibia weight and bone mineralization were also influenced by the level of Ca,
with the low-calcium diet showing the lowest bone weight and ash content. This result
agrees with the result obtained by Onyango et al. (2003), who found that bone-mineral
content, bone-mineral density and percentage of ash increased linearly as the level of
dietary Ca increased from 0.45% to 0.91%. However, the level of Ca interacted with the
dietary level of NPP on the tibia ash percent, which confirms that high levels of Ca may
Treatment NPP,
%
Tibia weight,
g
Tibia weight,
%BW-1
Tibia ash,
%
Tibia ash,
mg/tibia
0.5 0.25 0.88bcd
0.203 bc
50.17bc
439bcd
0.31 0.87bcd
0.199 bc
51.38ab
451bc
0.38 0.87bcd
0.201 bc
50.09bc
437bcd
0.45 0.80cd
0.196 c 49.55
c 395
cd
0.7 0.25 0.85bcd
0.204 bc
51.44ab
439bcd
0.31 0.92ab
0.206 abc
51.97a 479
ab
0.38 0.93ab
0.202 bc
51.87a 484
ab
0.45 0.94ab
0.214 abc
51.38ab
481ab
0.9 0.25 0.77d 0.194
c 49.65
c 381
d
0.31 0.90abc
0.214 abc
50.83abc
460bc
0.38 1.00a 0.225
a 51.86
a 522
a
0.45 0.97ab
0.218 ab
51.39ab
500ab
Ca level, %
0.5 0.85 0.199 50.30 431
0.7 0.91 0.207 51.67 471
0.9 0.91 0.213 50.93 466
NPP level, %
0.25 0.83 0.200 50.42 420
0.31 0.90 0.206 51.39 463
0.38 0.93 0.209 51.28 481
0.45 0.90 0.209 50.77 459
SEM 0.03 0.004 0.34 15.6
P value3
Ca level × NPP level < 0.001 < 0.001 0.007 < 0.001
Ca level 0.0032 < 0.001 < 0.001 0.001
NPP level < 0.001 0.032 0.002 < 0.001
Chapter 4
53
affect P availability for bone mineralization. Al Masri (1995) saw that the values of
dietary Ca and its ratio with P may affect P retention, with lower values of P retention
when the levels of Ca in the diet are higher. Nonetheless, we did not observe this
difference in the P retention with the levels of Ca used in our study, which could reflect
that changes on the levels of P promoted changes on FI and growth performance of
broilers, rather than changes in the fractional retention of the dietary P.
The increase on dietary Ca decreased its fractional retention, which concur with
those of Mitchell and Edwards (1996a) and Ziaei et al. (2008), who reported that the
reduced mineral content of diets resulted in a higher apparent retention of Ca, leading to
a reduction in mineral excretion. Browning et al. (2012) show that reducing dietary
Ca/aP concentrations were associated with increased efficiency of Ca retention as
compared to high Ca/available P diets, which indicates a physiological response by the
chicken to overcome a Ca deficiency by up-regulating its nutrient transfer and
deposition infrastructure.
A level of NPP at 0.38% improved the growth of chicks on d 14, with BW
values close to the standard of the breed for this period (473 g BW on d 14). Added
levels of NPP up to 0.38% in the 0.7 and 0.9% Ca treatments also increased bone
mineralization. Ravindran et al. (1995) observed that the bone-mineralization criterion
is a good, sensitive indicator of the P status of the birds. Despite phosphorus being
largely contained in all of the tissue, bone is the main storage organ for P, containing
85% of the body’s total P. Through its involvement in metabolic and structural
processes, P is essential for animals to attain their optimum genetic potential in growth
and feed efficiency as well as skeletal integrity (Applegate and Angel, 2008). Some
authors have reported substantial differences in the NPP requirement of broilers, as
compared with the 0.45% NPP level published by NRC (1994). Waldroup et al. (2000)
reported that the NPP requirement for the starter phase ranges from 0.37% to 0.39%.
The difference could be explained by the fact that NRC (1994) recommendations for
NPP in diets for broilers are based on peer-reviewed research published between 1952
and 1983. However, modern commercial birds are very different from commercial birds
prior to 1983, due, in part, to genetic selection, but also because management practice
has changed (Havenstein et al., 1994), as has occurred with the addition of phytase to
feed. In the present trial, we incorporated a high dose of a commercial phytase
(analyzed at 1,150 U/kg), which it may explain the good responses at lower NPP values
in the diet.

Calcium and phosphorus levels on broilers performance
54
Increasing the levels of NPP from 0.25% to 0.31% NPP allowed for increases in
the fractional retention of Ca, likely reflecting how body growth and bone
mineralization respond to an improved Ca:P in the diet. However, it is worth stating that
increases in the NPP level in the diet reduced the fractional retention of phosphorus,
which is a similar response to that observed previously for increasing levels of calcium.
Table 4.4. Influence of Ca and NPP1 levels in diets containing phytase at 1,150 FTU/kg on
whole-body ash of 14-day-old broilers2.
Treatment NPP, % Whole-body composition Retention
Ash, % Ca, g/kg P, g/kg Ca P
0.5 0.25 2.40 5.36 4.27 0.65 0.66
0.31 2.63 6.28 4.75 0.77 0.65
0.38 2.55 6.13 4.61 0.76 0.58
0.45 2.58 6.12 4.68 0.77 0.53
0.7 0.25 2.33 5.23 4.17 0.51 0.65
0.31 2.36 5.39 4.23 0.52 0.58
0.38 2.39 5.40 4.26 0.56 0.57
0.45 2.50 5.94 4.57 0.58 0.51
0.9 0.25 2.30 5.12 3.99 0.43 0.66
0.31 2.60 6.13 4.56 0.49 0.63
0.38 2.48 5.78 4.43 0.46 0.55
0.45 2.43 5.65 4.35 0.48 0.52
Ca level, %
0.5 2.54 5.97a 4.57 0.74
a 0.60
0.7 2.39 5.49b 4.30 0.54
b 0.57
0.9 2.45 5.66ab
4.33 0.46c 0.59
NPP level, %
0.25 2.34 5.23b 4.14
b 0.53
b 0.658
a
0.31 2.53 5.93a 4.51
a 0.59
a 0.622
a
0.38 2.47 5.76a 4.43
a 0.60
a 0.564
b
0.45 2.50 5.90a 4.53
a 0.61
a 0.519
b
SEM 0.10 0.25 0.19 0.03 0.03
P value3
Ca level × NPP level 0.833 0.394 0.772 0.543 0.939
Ca level 0.160 0.025 0.089 <0.001 0.507
NPP level 0.161 0.003 0.052 0.015 < 0.001 1 Non-phytate P. 2 Data are means of 5 pens with 4 chicks each. 3 abc Values in the same column with different letters are significantly different (P < 0.05).
These results could reflect a decrease in P digestibility (not analyzed in this
experiment), but more likely this reflects an increase on the endogenous excretion of P
in the urine (Al Masri, 1995). When broilers receive P levels that are higher than the
physiological threshold for maximum utilization and retention, there is the possibility
that the additional P may most likely be eliminated through the kidney (Leske and

Chapter 4
55
Coon, 2002). To know this threshold is important to integrators in order to avoid the
wasting of P in the litter.
Our results confirm that young chicks respond to changes in the NPP levels in the diet
in growth performance and bone mineralization. Nevertheless, the consequences of
these changes in later performance and leg quality, or in the incidence of broken
clavicles or bloody breast meat during processing of the carcass, were not studied.
Powell et al. (2011) suggested that broilers fed lower levels of NPP in the starter phase
are better able to adapt and grow at a low level of NPP in the growing phase than those
fed a higher level of NPP in the starter phase. Then, it could be speculated that some of
the differences observed on d 14 could be clearly reduced and mineral retention
improved by feeding adequate diets during the growing and finishing periods. However,
this hypothesis deserves further studies.
The results reflect that an increase in the dietary levels of calcium may
decrease chick growth and also may affect bone formation during the early period of
growth. The effect was modified by the level of NPP in the diet, which it may indicates
the likely formation of insoluble calcium phosphate and Ca-phytate complex when
gut pH and Ca: P are increased. The results of this study also emphasize the
importance of formulating diets that meet or exceed P requirements of broilers,
particularly when high-Ca diets are used.

Calcium and phosphorus levels on broilers performance
56

Chapter 5
57
CHAPTER 5
Calcium sources and their interaction with
the level of non-phytate phosphorus affect
performance and bone mineralization in
broiler chickens
Calcium sources and non-phytate phosphorus in broiler chickens
58
Calcium sources and their interaction with the level of non-phytate
phosphorus affect performance and bone mineralization in broiler
chickens
M. Hamdi, D. Solà-Oriol, R. Davin, and J.F. Pérez
Animal Nutrition and Welfare Service (SNiBA). Departament de Ciència Animal i dels
Aliments. Universitat Autònoma de Barcelona, 08193 Bellaterra, Spain
Published in:
Poultry Science (September 2015) 94 : 2136-2143(Hamdi et al., 2015b)
Chapter 5
59
5.1. Abstract
An experiment was conducted to evaluate the influence of different Ca sources
(limestone, Ca chloride, and Lipocal, a fat-encapsulated tri-calcium phosphate, TCP) in
conjunction with 4 dietary levels of non-phytate P (NPP) on performance, ileal
digestibility of Ca and P, and bone mineralization in broiler chickens. Calcium sources
were also evaluated in vitro to measure acid-binding capacity (ABC) and Ca solubility
at different pH values. Ca chloride showed the highest solubility of Ca, with TCP
showing the highest ABC. Ross male broiler-chicks were sorted by BW at 1 d post-
hatch and assigned to 5 cages per diet with 5 birds per cage. Twelve diets were arranged
in a 3 × 4 factorial of the 3 Ca sources and 4 levels of NPP (0.3%, 0.35%, 0.4% or
0.45%) consisting of 4 added P levels (Ca(H2PO4)2) with a high dose of phytase (1,150
U/kg) in all diets. On d 14 post-hatch, 3 birds were euthanized, and ileal digesta and the
right tibia were collected to determine ileal Ca and P digestibility and bone
mineralization, respectively. Feed intake (FI) and weight gain (WG) on d 14 was higher
(P < 0.01) with TCP and limestone than with Ca chloride. Added P increased the tibia
weight and tibia ash content in chicks fed TCP up to 0.4% NPP and limestone up to
0.35% NPP. Calcium ileal digestibility was higher (P < 0.01) with Ca chloride (73.7%)
than with limestone (67.1%) or TCP (66.8%), and it increased (P < 0.05) with added
levels of P from mono-calcium phosphate. Phosphorus ileal digestibility was not
affected by the Ca source and increased (P < 0.001) with added levels of NPP. It can be
concluded that starting broilers responded better to low-soluble rather than to high-
soluble sources of Ca. A level of 0.35%-0.40% NPP with a high dose of phytase (1,150
U/kg) in diets including limestone or TCP is sufficient to guarantee performance and
bone formation for broiler chickens from d 1 to d 14.
Calcium sources and non-phytate phosphorus in broiler chickens
60
5.2. Introduction
Calcium (Ca) requirement for broilers is a major area of debate in the poultry
industry, and contradictions persist regarding the optimum level required for growth and
bone mineralization. In particular, Ca requirements are still described on a total Ca basis
rather than on digestible or available Ca, and few efforts have been made to optimize
the use and availability of new Ca sources. Moreover, Ca requirements have usually
been measured using limestone in the diet, which shows a reduced solubility during
neutralization in the small intestine, where most absorption takes place (Goss et al.,
2007).
The immature gastrointestinal tract young chicks could be more sensitive to the
level and properties of Ca in the diet, unlike that of adult birds. Different sources and
forms of dietary Ca have been evaluated in broilers. For example, Manangi and Coon
(2007) described that broilers increased their weight gain (WG) with limestone particle
sizes of between 137 µm and 388 µm, compared to BW gains obtained by feeding either
smaller (28 µm) and more soluble or larger (1,306 µm) and less soluble particle sizes.
Recently, Walk et al. (2012a) also showed that when diets were formulated (0.9% Ca)
with a highly soluble source of Ca (calcified seaweed, Vistacal, AB Vista Feed
Ingredients), broiler growth was lower than was the performance of animals fed
limestone diets. Soluble sources of Ca may increase the acid-binding capacity (ABC) of
digesta and decrease energy and protein digestibility (Tamim and Angel, 2003). They
may also form a complex with phytin (Selle et al., 2009) and phosphates (De Kort et al.,
2009), which interfere with the availability of P and Zn (Wise, 1983; Tamim et al.,
2004; Lonnerdal, 2000). Supplementing the diet with phytase and reducing dietary Ca
from 0.9% to 0.45% (Walk et al., 2012a) and from 0.6% to 0.5% (Adeola and Walk,
2013) to balance the soluble Ca and P in the small intestine improved broiler growth
performance and tibia ash weight when using a high-soluble source of Ca in the diet. An
overdose of phytase (1,000 U/kg) allowed for the release of 1.70 g and 1.56 g of phytic
P for absorption when Ca was 0.5% and 0.6%, respectively (Adeola and Walk, 2013).
The objective of the current work is to evaluate the Ca in vitro solubility and
ABC characteristics of different Ca sources, and explore how the incorporation of these
sources may affect the ileal digestibility of Ca and P, animal performance, and bone
mineralization in broiler chickens. Diets were formulated to contain a low-calcium
level, a high dose of phytase and 4 graded levels of non-phytate P (NPP) to identify and
Chapter 5
61
better characterize the interactions between Ca and P, and their effects on animal
performance.
5.3. Materials and methods
5.3.1. Calcium Sources
Three main sources of Ca were used to design the experimental treatments: Ca
chloride, limestone and tri-calcium phosphate (TCP, Lipocal (Lipofoods; Barcelona,
Spain)). Lipocal is a tri-calcium phosphate powder which has been treated with lecithin
to reduce its interactions with other minerals and feed ingredients, especially in aqueous
media. Limestone, Ca chloride and mono-calcium phosphate were obtained from a local
feed manufacturer.
5.3.2. Calcium Solubility and Acid-Binding Capacity (in vitro)
The in vitro solubility of added Ca from limestone, Ca chloride and TCP was
measured in a phosphate-citrate buffer at a pH ranging from 2.96 to 6.52, with or
without phytic P (0.2475 g, phytic acid solution 40%, Fluka Analytical; Buchs,
Switzerland). For calcium chloride, 75 mL of buffer and 90 mg of Ca-shaped calcium
chloride (250 mg anhydro Calcium chloride) was added in each tube. For the limestone
and TCP tubes, 224.7 mg limestone and 250 mg TCP were added. Seven phosphate-
citrate buffer solutions were prepared at pH 2.96, 3.53, 4.18, 4.77, 5.27, 6.01, and 6.52
from solutions of 0.2 M dibasic sodium phosphate (Na2HPO4) and 0.1 M citric acid,
according to Pearse (1980). All buffers were prepared and pH-adjusted before the
addition of phytic acid. The tubes were vortexed and incubated for 60 min at 37ºC to
observe the amount of mineral precipitate and to obtain supernatant of the samples that
were subsequently analyzed for soluble Ca content. Ca was analyzed using Inductively
Coupled Plasma Optical Emission Spectroscopy (ICP-OES model Optima 4300DV,
PerkinElmer Inc.; Waltham, MA).
The ABC of the 3 Ca sources was measured in batch solutions with increasing
amounts of Ca to simulate a dietary Ca level of 0.2%, 0.4%, 0.6%, 0.8%, 1.0% and
1.2% and a water-to-feed ratio of 2:1. The buffering capacity was measured by the
procedure of Lawlor et al., (2005) in duplicate tubes by titration dripping increasing
amounts of HCl (0.1 N), and measuring the pH continuously until reaching pH = 3
(ABC-3).
Calcium sources and non-phytate phosphorus in broiler chickens
62
5.3.3. Bird Management, Husbandry, Experimental Design and Diets
(in vivo)
All experimental procedures were approved by the Animal Ethics Committee of
the Universitat Autònoma de Barcelona and were in compliance with the European
Union guidelines for the care and use of animals in research (European Parliament,
2010).
One-day-old male broilers (Ross 308) were obtained from a local hatchery, weighed,
wing-tagged, and allotted to 12 dietary treatments in a completely randomized design.
Each treatment was replicated 5 times in battery brooder cages with 5 chicks each. The
brooder temperature was maintained at temperatures of 35ºC from d 1 to d 4 post-hatch,
and was progressively reduced to 25ºC on d 14. The light cycle was 24h/day from d 1 to
d 2, 23h/d from d 3 to d 10 and 18h/d from d 11 to d 14. Feed and water was provided
ad libitum.
Sources of Ca (limestone, Ca chloride and TCP) and NPP at 0.3%, 0.35%, 0.4%
and 0.45% of the diet, consisting of 4 added levels of mono-calcium phosphate, were
used in a 3 × 4 factorial arrangement (Table 5.1). All diets met or exceeded the nutrient
requirements for broilers (Fundación Española Desarrollo Nutrición Animal, 2008),
with the exception of Ca and available P. Diets contained 1,000 units of Escherichia
coli 6-phytase expressed in Trichoderma reesei (Quantum Blue, AB Vista Feed
Ingredients; Marlborough, UK). The phytase activity analyzed in the diets was 1,150
FTU/kg. Diets were fed in mash form and contained 0.3% titanium dioxide as an
indigestible marker.
5.3.4. Experimental procedures
Birds were individually wing-tagged in order to monitor individual BW as well
as the group BW at the start (1 d) and d 7 and d 14 post-hatch. From these values the
feed intake (FI), weight gain (WG), and G:F from d 1 to d 14 were calculated. On d 14,
3 birds with the closest BW to the average cage BW were killed by cervical dislocation.
The pH of the gizzard and proventriculus were recorded by immersing the
electrode of a digital pH meter into the center of the lumen. Ileal digesta were collected
in the region from Meckel’s diverticulum to about 2 cm anterior to the ileo-cecal
junction and stored at -20ºC. The right tibias were collected from the same animals,
boiled, and cleaned of adherent tissue for bone-ash determination.
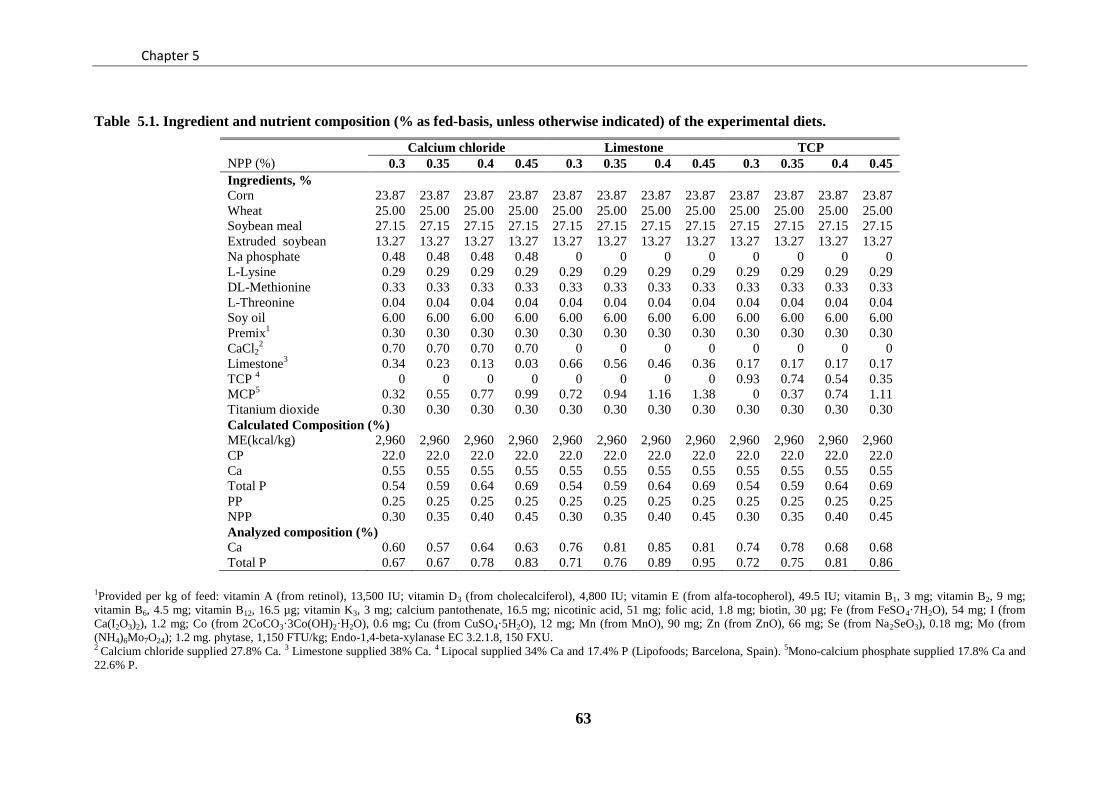
Chapter 5
63
Table 5.1. Ingredient and nutrient composition (% as fed-basis, unless otherwise indicated) of the experimental diets.
Calcium chloride Limestone TCP
NPP (%) 0.3 0.35 0.4 0.45 0.3 0.35 0.4 0.45 0.3 0.35 0.4 0.45
Ingredients, %
Corn 23.87 23.87 23.87 23.87 23.87 23.87 23.87 23.87 23.87 23.87 23.87 23.87
Wheat 25.00 25.00 25.00 25.00 25.00 25.00 25.00 25.00 25.00 25.00 25.00 25.00
Soybean meal 27.15 27.15 27.15 27.15 27.15 27.15 27.15 27.15 27.15 27.15 27.15 27.15
Extruded soybean 13.27 13.27 13.27 13.27 13.27 13.27 13.27 13.27 13.27 13.27 13.27 13.27
Na phosphate 0.48 0.48 0.48 0.48 0 0 0 0 0 0 0 0
L-Lysine 0.29 0.29 0.29 0.29 0.29 0.29 0.29 0.29 0.29 0.29 0.29 0.29
DL-Methionine 0.33 0.33 0.33 0.33 0.33 0.33 0.33 0.33 0.33 0.33 0.33 0.33
L-Threonine 0.04 0.04 0.04 0.04 0.04 0.04 0.04 0.04 0.04 0.04 0.04 0.04
Soy oil 6.00 6.00 6.00 6.00 6.00 6.00 6.00 6.00 6.00 6.00 6.00 6.00
Premix1 0.30 0.30 0.30 0.30 0.30 0.30 0.30 0.30 0.30 0.30 0.30 0.30
CaCl22 0.70 0.70 0.70 0.70 0 0 0 0 0 0 0 0
Limestone3 0.34 0.23 0.13 0.03 0.66 0.56 0.46 0.36 0.17 0.17 0.17 0.17
TCP 4 0 0 0 0 0 0 0 0 0.93 0.74 0.54 0.35
MCP5 0.32 0.55 0.77 0.99 0.72 0.94 1.16 1.38 0 0.37 0.74 1.11
Titanium dioxide 0.30 0.30 0.30 0.30 0.30 0.30 0.30 0.30 0.30 0.30 0.30 0.30
Calculated Composition (%) ME(kcal/kg) 2,960 2,960 2,960 2,960 2,960 2,960 2,960 2,960 2,960 2,960 2,960 2,960
CP 22.0 22.0 22.0 22.0 22.0 22.0 22.0 22.0 22.0 22.0 22.0 22.0
Ca 0.55 0.55 0.55 0.55 0.55 0.55 0.55 0.55 0.55 0.55 0.55 0.55
Total P 0.54 0.59 0.64 0.69 0.54 0.59 0.64 0.69 0.54 0.59 0.64 0.69
PP 0.25 0.25 0.25 0.25 0.25 0.25 0.25 0.25 0.25 0.25 0.25 0.25
NPP 0.30 0.35 0.40 0.45 0.30 0.35 0.40 0.45 0.30 0.35 0.40 0.45
Analyzed composition (%)
Ca 0.60 0.57 0.64 0.63 0.76 0.81 0.85 0.81 0.74 0.78 0.68 0.68
Total P 0.67 0.67 0.78 0.83 0.71 0.76 0.89 0.95 0.72 0.75 0.81 0.86
1Provided per kg of feed: vitamin A (from retinol), 13,500 IU; vitamin D3 (from cholecalciferol), 4,800 IU; vitamin E (from alfa-tocopherol), 49.5 IU; vitamin B1, 3 mg; vitamin B2, 9 mg;
vitamin B6, 4.5 mg; vitamin B12, 16.5 µg; vitamin K3, 3 mg; calcium pantothenate, 16.5 mg; nicotinic acid, 51 mg; folic acid, 1.8 mg; biotin, 30 µg; Fe (from FeSO4·7H2O), 54 mg; I (from
Ca(I2O3)2), 1.2 mg; Co (from 2CoCO3·3Co(OH)2·H2O), 0.6 mg; Cu (from CuSO4·5H2O), 12 mg; Mn (from MnO), 90 mg; Zn (from ZnO), 66 mg; Se (from Na2SeO3), 0.18 mg; Mo (from
(NH4)6Mo7O24); 1.2 mg. phytase, 1,150 FTU/kg; Endo-1,4-beta-xylanase EC 3.2.1.8, 150 FXU. 2 Calcium chloride supplied 27.8% Ca. 3 Limestone supplied 38% Ca. 4 Lipocal supplied 34% Ca and 17.4% P (Lipofoods; Barcelona, Spain). 5Mono-calcium phosphate supplied 17.8% Ca and
22.6% P.

Calcium sources and non-phytate phosphorus in broiler chickens
64
5.3.5. Laboratory analyses
Diets and ileal digesta were analyzed for DM, Ti, Ca and P. Dry matter was
determined by placing samples in a drying oven at 105ºC for 24h. Samples were
digested in nitric perchloric and fluorhydric acid and subsequently analyzed for P, Ca,
and Ti by flame atomic-absorption spectroscopy. The tibias were defatted for 48h in
ethyl ether. They were then dried for 12h at 110ºC and then ashed overnight at 550ºC
(Brenes et al., 2003).
5.3.6. Calculations and statistical analyses
Apparent ileal digestibility of Ca and P (%) was calculated by the index method
using the following equation:
Ileal Ca or P Digestibility= 1- ([Ti] D/ [N] D / [Ti] M / [N] M)
where [Ti] D is the concentration of Ti in the diet, [N] D is the Ca or P content in the diet,
[Ti] M is the concentration of Ti in ileal digesta and [N] M is the Ca or P content in ileal
digesta.
Data were analyzed as a completely randomized design using the GLM
procedure of SAS software (SAS, 2008), version 9.2. The dietary treatments were
arranged in a 2-way factorial design and Tukey´s multiple comparisons were used to
determine main effects of the Ca source, NPP level, and the interaction between the
two. The pen of the chicks served as the experimental unit. The alpha level used for
significant differences was 0.05.
5.4. Results
5.4.1. Calcium solubility and Acid-Binding Capacity
Soluble calcium from limestone, Ca chloride and TCP at different pHs, with or
without phytic acid is shown in Figure 5.1. Limestone showed a low solubility at pH >
4, but the solubility increased as pH decreased. Calcium chloride showed a higher Ca
solubility in the pH range between 2.96 and 6.0. However, an increase in the pH above
6 drastically reduced soluble Ca from calcium chloride. TCP showed a linear increase in
the solubility of Ca as pH decreased, from 6.52 to 2.69, showing lower values of soluble
Ca than did limestone and calcium chloride at a pH above 5. No relevant differences
were observed in the two lines derived from phytic acid incorporation. With the
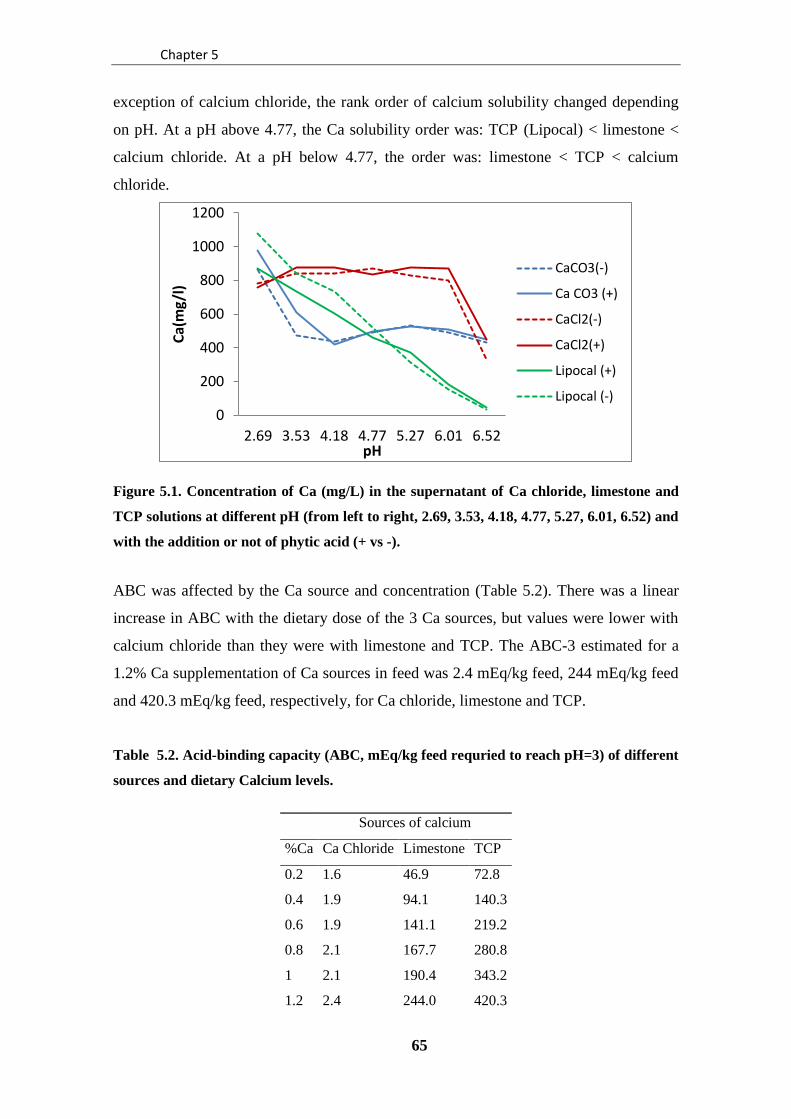
Chapter 5
65
exception of calcium chloride, the rank order of calcium solubility changed depending
on pH. At a pH above 4.77, the Ca solubility order was: TCP (Lipocal) < limestone <
calcium chloride. At a pH below 4.77, the order was: limestone < TCP < calcium
chloride.
Figure 5.1. Concentration of Ca (mg/L) in the supernatant of Ca chloride, limestone and
TCP solutions at different pH (from left to right, 2.69, 3.53, 4.18, 4.77, 5.27, 6.01, 6.52) and
with the addition or not of phytic acid (+ vs -).
ABC was affected by the Ca source and concentration (Table 5.2). There was a linear
increase in ABC with the dietary dose of the 3 Ca sources, but values were lower with
calcium chloride than they were with limestone and TCP. The ABC-3 estimated for a
1.2% Ca supplementation of Ca sources in feed was 2.4 mEq/kg feed, 244 mEq/kg feed
and 420.3 mEq/kg feed, respectively, for Ca chloride, limestone and TCP.
Table 5.2. Acid-binding capacity (ABC, mEq/kg feed requried to reach pH=3) of different
sources and dietary Calcium levels.
0
200
400
600
800
1000
1200
2.69 3.53 4.18 4.77 5.27 6.01 6.52
Ca(
mg/
l)
pH
CaCO3(-)
Ca CO3 (+)
CaCl2(-)
CaCl2(+)
Lipocal (+)
Lipocal (-)
Sources of calcium
%Ca Ca Chloride Limestone TCP
0.2 1.6 46.9 72.8
0.4 1.9 94.1 140.3
0.6 1.9 141.1 219.2
0.8 2.1 167.7 280.8
1 2.1 190.4 343.2
1.2 2.4 244.0 420.3
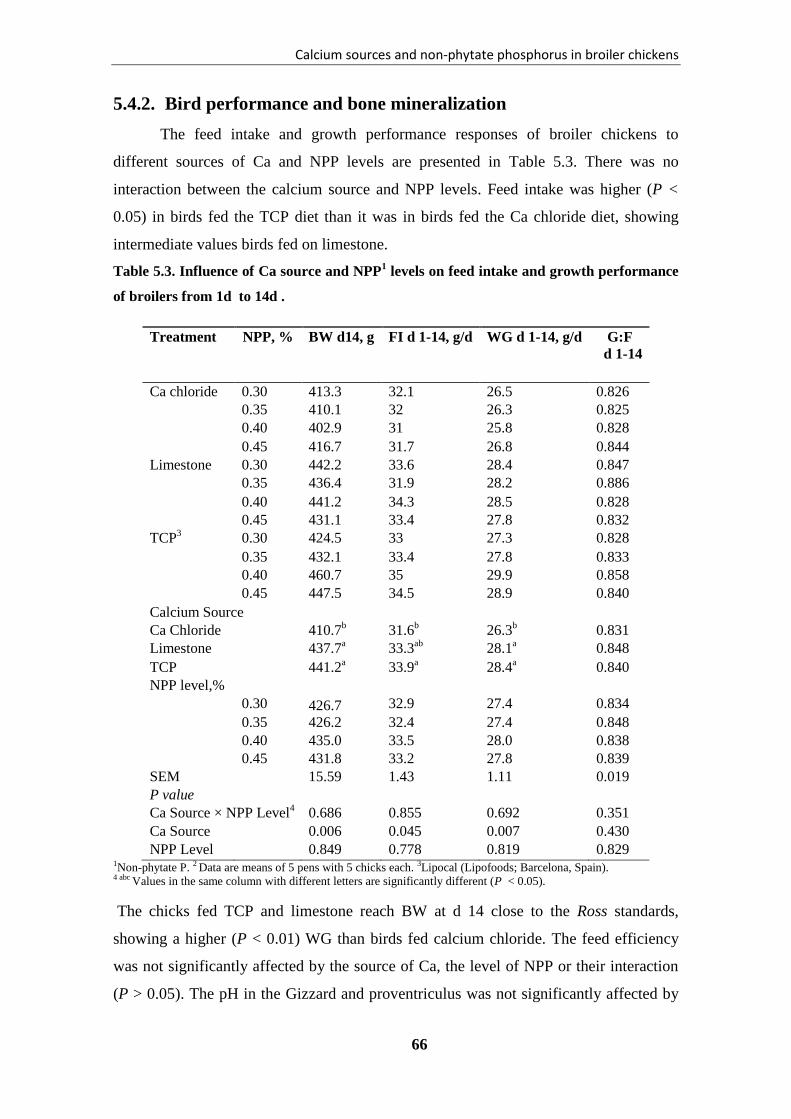
Calcium sources and non-phytate phosphorus in broiler chickens
66
5.4.2. Bird performance and bone mineralization
The feed intake and growth performance responses of broiler chickens to
different sources of Ca and NPP levels are presented in Table 5.3. There was no
interaction between the calcium source and NPP levels. Feed intake was higher (P <
0.05) in birds fed the TCP diet than it was in birds fed the Ca chloride diet, showing
intermediate values birds fed on limestone.
Table 5.3. Influence of Ca source and NPP1 levels on feed intake and growth performance
of broilers from 1d to 14d .
Treatment NPP, % BW d14, g FI d 1-14, g/d WG d 1-14, g/d G:F
d 1-14
Ca chloride 0.30 413.3 32.1 26.5 0.826
0.35 410.1 32 26.3 0.825
0.40 402.9 31 25.8 0.828
0.45 416.7 31.7 26.8 0.844
Limestone 0.30 442.2 33.6 28.4 0.847
0.35 436.4 31.9 28.2 0.886
0.40 441.2 34.3 28.5 0.828
0.45 431.1 33.4 27.8 0.832
TCP3 0.30 424.5 33 27.3 0.828
0.35 432.1 33.4 27.8 0.833
0.40 460.7 35 29.9 0.858
0.45 447.5 34.5 28.9 0.840
Calcium Source
Ca Chloride 410.7b 31.6
b 26.3
b 0.831
Limestone 437.7a 33.3
ab 28.1
a 0.848
TCP 441.2a 33.9
a 28.4
a 0.840
NPP level,%
0.30 426.7 32.9 27.4 0.834
0.35 426.2 32.4 27.4 0.848
0.40 435.0 33.5 28.0 0.838
0.45 431.8 33.2 27.8 0.839
SEM 15.59 1.43 1.11 0.019
P value
Ca Source × NPP Level4 0.686 0.855 0.692 0.351
Ca Source 0.006 0.045 0.007 0.430
NPP Level 0.849 0.778 0.819 0.829 1Non-phytate P. 2 Data are means of 5 pens with 5 chicks each. 3Lipocal (Lipofoods; Barcelona, Spain). 4 abc Values in the same column with different letters are significantly different (P < 0.05).
The chicks fed TCP and limestone reach BW at d 14 close to the Ross standards,
showing a higher (P < 0.01) WG than birds fed calcium chloride. The feed efficiency
was not significantly affected by the source of Ca, the level of NPP or their interaction
(P > 0.05). The pH in the Gizzard and proventriculus was not significantly affected by

Chapter 5
67
the source of Ca, the NPP level or their interaction. The pH averaged 2.09 ± 0.06 (mean
± SEM) in the gizzard (ranging from 1.24 to 3.89) and 2.18 ± 0.10 in the proventriculus
(ranging from 1.02 to 3.95).
Table 5.4. Influence of Ca and NPP1 levels on tibia weight and tibia ash of 14-day-old
broilers2.
Treatment NPP,
%
Tibia weight,
g
Tibia weight,
%BW-1
Tibia ash ,
%
Tibia
ash,
mg/tibia
Ca Chloride 0.30 0.77ab
0.185 50.61 393
0.35 0.74b 0.183 50.46 377
0.40 0.70b 0.175 50.68 359
0.45 0.78ab
0.184 51.24 404
Limestone 0.30 0.78ab
0.181 50.51 398
0.35 0.83a 0.185 50.35 418
0.40 0.79ab
0.180 50.65 405
0.45 0.80ab
0.185 50.77 407
TCP 0.30 0.77ab
0.182 50.96 394
0.35 0.78ab
0.185 51.81 406
0.40 0.89a 0.183 51.08 450
0.45 0.80ab
0.179 51.27 409
Ca source
Ca Chloride 0.75b 0.182 50.75
b 383
b
Limestone 0.80a 0.183 50.57
b 407
ab
TCP3 0.81
a 0.182 51.29
a 415
a
NPP level,%
0.30 0.78 0.183 50.69 50.69
0.35 0.79 0.184 50.88 50.88
0.40 0.79 0.179 50.80 50.80
0.45 0.80 0.183 51.10 51.10
SEM 0.03 0.004 0.32 16.95
P value
Ca Source × NPP4 0.029 0.763 0.291 0.058
Ca Source 0.011 0.976 0.002 0.011
NPP level 0.883 0.559 0.382 0.800 1Non-phytate P;2 Data are means of 5 pens with 5 chicks each;3Lipocal (Lipofoods; Barcelona, Spain);4 abc Values in
the same column with different letters are significantly different (P < 0.05).
The effects of the Ca source and NPP levels on tibia weight and tibia ash content
are presented in Table 5.4. Tibia weight was influenced by the significant interaction of
the Ca source and the P level. Added levels of P increased the tibia weight with
limestone and TCP but not with calcium chloride. Tibia weight was higher in birds fed
TCP at 0.4% NPP, and limestone at 0.35% NPP, while it was lower for treatments
including Ca chloride in the diet with 0.35% and 0.4% NPP. Tibia weight was higher (P
< 0.05) for birds fed TCP and limestone than it was for Ca chloride.
Calcium sources and non-phytate phosphorus in broiler chickens
68
However, the tibia-ash percentage was higher (P < 0.01) for TCP than it was for
limestone and Ca chloride. As a consequence, the ash content per tibia was the greatest
for birds fed TCP, and it was the lowest for birds fed the Ca chloride diet, with birds fed
limestone showing intermediate results.
The ileal digestibility of Ca and P responses to different sources of Ca and NPP
levels are presented in Table 5.5. There was no interaction between the Ca source and
NPP level. Birds fed Ca chloride showed higher (P < 0.01) ileal digestibility of Ca
(73.7%) than did birds fed limestone (67.1%) or TCP (66.8%). Added levels of P
increased (P < 0.05) the ileal digestibility of Ca and the ileal digestibility of P (P <
0.01), being higher for the 0.45% NPP diet than it was for the 0.3% NPP diet.
5.5. Discussion
5.5.1. Calcium solubility and Acid-Binding Capacity
Maintaining soluble calcium in the gastrointestinal tract is essential for intestinal
absorption (Bronner, 2003). Nevertheless, many Ca salts have a pH-dependent
solubility and may have limited availability in the small intestine. In particular, the pH
of the broiler gut changes according to the region, from the acidic environment of the
proventriculus and gizzard, where the pH is governed by the secretion of hydrochloric
acid, to the less acidic, nearly neutral environment throughout the intestine, where the
pH is governed by sodium bicarbonate. In the present in vitro study, calcium solubility
was determined at different pH values and in the presence of excess solids to mimic the
environment each salt may encounter in the GI tract. Calcium chloride showed the
highest solubility among the 3 Ca sources at a pH above 3.5 until neutrality. Differences
in Ca solubility were consistent with Selle et al., (2000), who suggested that most
mineral complexes were soluble at low pH (less than 3.5), with maximum insolubility
occurring between 4 and 7. In vitro research in corn-based diets by Walk et al., (2012a)
also described that limestone is approximately 80% soluble in the acidic medium of the
gastrointestinal tract, but that solubility decreased to 77% in the neutral conditions of
the intestine, suggesting no further dissolution of Ca in the intestinal phase. Moreover,
greater concentrations of ionized Ca dissolved by acid in the stomach may precipitate in
the more neutral intestine before absorption occurs.
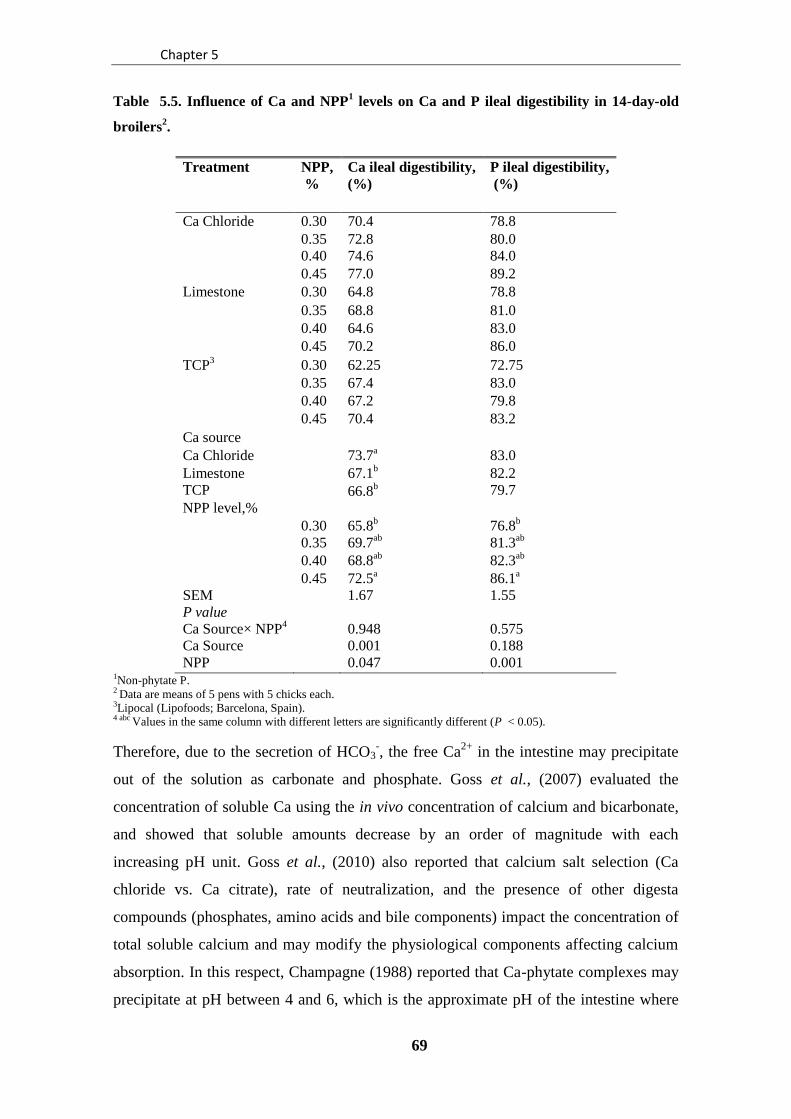
Chapter 5
69
Table 5.5. Influence of Ca and NPP1 levels on Ca and P ileal digestibility in 14-day-old
broilers2.
Treatment NPP,
%
Ca ileal digestibility,
(%)
P ileal digestibility,
(%)
Ca Chloride 0.30 70.4 78.8
0.35 72.8 80.0
0.40 74.6 84.0
0.45 77.0 89.2
Limestone 0.30 64.8 78.8
0.35 68.8 81.0
0.40 64.6 83.0
0.45 70.2 86.0
TCP3 0.30 62.25 72.75
0.35 67.4 83.0
0.40 67.2 79.8
0.45 70.4 83.2
Ca source
Ca Chloride 73.7a 83.0
Limestone 67.1b 82.2
TCP 66.8b 79.7
NPP level,%
0.30 65.8b 76.8
b
0.35 69.7ab
81.3ab
0.40 68.8ab
82.3ab
0.45 72.5a 86.1
a
SEM 1.67 1.55
P value
Ca Source× NPP4 0.948 0.575
Ca Source 0.001 0.188
NPP 0.047 0.001 1Non-phytate P. 2 Data are means of 5 pens with 5 chicks each. 3Lipocal (Lipofoods; Barcelona, Spain). 4 abc Values in the same column with different letters are significantly different (P < 0.05).
Therefore, due to the secretion of HCO3-, the free Ca
2+ in the intestine may precipitate
out of the solution as carbonate and phosphate. Goss et al., (2007) evaluated the
concentration of soluble Ca using the in vivo concentration of calcium and bicarbonate,
and showed that soluble amounts decrease by an order of magnitude with each
increasing pH unit. Goss et al., (2010) also reported that calcium salt selection (Ca
chloride vs. Ca citrate), rate of neutralization, and the presence of other digesta
compounds (phosphates, amino acids and bile components) impact the concentration of
total soluble calcium and may modify the physiological components affecting calcium
absorption. In this respect, Champagne (1988) reported that Ca-phytate complexes may
precipitate at pH between 4 and 6, which is the approximate pH of the intestine where
Calcium sources and non-phytate phosphorus in broiler chickens
70
Ca ions should be absorbed. Taylor (1965) and Manangi and Coon (2008) suggested
that the primary factor affecting phytic P utilization is the Ca ion concentration in the
small intestine, where insoluble Ca-phytate complexes form. However, we were not
able to identify changes in the soluble calcium concentration in the presence of phytic
acid.
Walk et al. (2012a) have also stated that high soluble sources of Ca may increase the
buffering capacity of digesta. In our in vitro study, Ca chloride showed the highest Ca
solubility, but a lower buffering capacity, when compared to TCP and limestone. The
Ca supplementation required to reach 1% Ca in the diet when using limestone or TCP
caused an increase in the ABC-3 of 190 mEq/kg and 343 mEq/kg, respectively, as
compared to the basal diet, practically doubling the ABC of a maize-soybean diet
(Lawlor, 2005). Jasaitis et al. (1987) found that carbonates and dibasic or tribasic
mineral additives had the highest ABC.
5.5.2. Broiler performance and bone mineralization
The Ca source promoted significant differences in FI, with TCP promoting
higher FI than did calcium chloride. Birds fed limestone and TCP also showed higher
WG than did birds fed Ca chloride. Based on these results, it could be suggested that
sources of Ca with a lower solubility may allow for better performance than might a
high-soluble Ca source. Walk et al., (2012a) observed that broiler chickens fed 0.90%
Ca from limestone ate more and were heavier than were birds fed 0.90% Ca from a
high-soluble Ca source. Due to the soluble nature of the highly soluble Ca source, the
authors suggested that feeding 0.90% Ca from this source may have reduced broiler
performance as a result of a high Ca:P ratio and an increase in calcium-phosphate or
calcium phytate precipitation. The authors also demonstrated that N digestibility was
reduced as the highly soluble Ca source increased, and suggested that the buffering
capacity of high dietary levels of high-soluble Ca may reduce pepsin efficacy in the
proventriculus and gizzard (pH optimum at 2.8; Bohak, 1969). Both in vivo and in vitro
studies (Manangi and Coon, 2007) indicated that solubility of limestone depends on
particle size, with the lowest particle size (28 µm) showing a higher Ca solubility and a
reduced phytate hydrolysis. Therefore, it could be proposed that the effects of soluble
Ca limiting phytate hydrolysis could be counteracted by a higher dose of phytase or by
adding NPP in the diets. Walk et al., (2012a) demonstrated that a high dose of phytase
in feed to reach 2,000 U/kg-2,500 U/kg was able to increase the performance of broilers
Chapter 5
71
fed 0.9% Ca of a high-soluble Ca source to values close to those presented by a
limestone source without phytase. Similar performances were observed with lower
levels of Ca, which suggest that reductions in dietary Ca may be obtained with high-
soluble sources of Ca while maintaining broiler performance and bone mineralization.
However, in the present study, all diets were supplemented with a high dose of phytase
to reach an analyzed phytase activity of 1,150 U/kg, and Ca was included at a low dose
of 0.55% in order to reduce the likely negative interactions among nutrients in the
digestive tract, allowing chicks to respond to different sources of soluble Ca. The results
showed that Ca digestibility was higher for Ca chloride than it was for limestone and
TCP, but no differences were observed among Ca sources in P ileal digestibility. These
results make the explanation of limited P digestibility with the highly soluble Ca
sources questionable. Additionally, ABC was the lowest for calcium chloride, without
undermining any negative effect of soluble sources on protein digestibility. On the other
hand, results showed a consistent effect of Ca chloride on FI and WG. It could be
speculated that feed palatability is likely affected in the Ca chloride diets if broilers
were able to detect the highly soluble Ca and P sources in the beak and crop (such as Ca
chloride and Na phosphate). Some recent reports suggest that broilers are able to detect
calcium in the diet (Wilkinson et al., 2012).
Increasing the level of NPP increased apparent ileal P digestibility, which is in
accordance with the results reported by Rodehutscord and Dieckmann (2005). Al Masri
(1995) showed that the values of dietary Ca and its ratio with P may affect P absorption.
Lower values of P absorption were recorded when higher ratios between Ca and P were
added in the diet. Nevertheless, this result could also reflect the fact that mineral sources
used to increase NPP have a higher P digestibility than do vegetable sources, even when
a high dose of phytase is added to the diet. In this respect, when using the 0.3% NPP
diet to compare P digestibility among diets, the TCP diet with a main content of tri-
calcium phosphate showed lower ileal P digestibility (72.7%) than did the limestone
diet (78.8%) and calcium chloride diet (78.8%), which contained higher amounts of
mono-calcium and sodium phosphate, respectively. The results appear to confirm a
higher P digestibility for mono-calcium and sodium phosphate than for the tri-calcium
phosphate, likely reflecting the lower solubility of this source at the neutral pH of the
small intestine.
It is also relevant that higher levels of NPP also promoted an increase in Ca
digestibility, which could reflect the changes in the main mineral ingredients used in

Calcium sources and non-phytate phosphorus in broiler chickens
72
each diet. Angel (2013) has recently described that true digestibility of Ca for limestone
(34.1%) is lower than it is for mono-calcium phosphate (67.9%). The increase in ileal
Ca digestibility with increasing levels of NPP in the TCP treatments also suggests that
Ca digestibility is also lower for tri-calcium phosphate than it is for mono-calcium
phosphate. Thus, a change in the levels of included mineral ingredients, such as those
promoted when phytase is included in the diet, is also expected to promote changes in
Ca digestibility.
Tibia weight and ash content were influenced by changes in the Ca source, with
calcium chloride showing the lowest tibia weight, with TCP showing the highest tibia
weight and ash content. Moreover, the significant interaction observed between the Ca
source and level of NPP on tibia weight and ash content is worth stating. In 0.4% NPP
diets, broilers fed TCP had an average of 450 mg of ash in the tibia, while values were
405 mg and 359 mg in limestone and Ca chloride broilers, respectively. The results are
coherent with differences observed in FI and WG, but not with the results concerning
Ca and P digestibility (Ca chloride > limestone > TCP). It is difficult to find an
explanation for this effect on bone mineralization, which appears to be greater than are
the effects observed in FI and performance. The results could suggest that bone
mineralization will depend on the daily amount of absorbed Ca and P, but also on the
way and rate in which minerals are released and absorbed in the intestinal tract,
reaching the highest bone mineralization when derived from less soluble sources.
However, this hypothesis deserves further study and may pose difficulties to formulate
diets on a digestible or available Ca basis.
In conclusion, the results confirm that ileal Ca and P digestibility may vary
according to the source of minerals used in the diet, being higher for calcium
chloride, mono-calcium phosphate, and sodium phosphate than for limestone and
TCP. However, growth performance and bone mineralization reach the highest
values in animals fed low-soluble sources. A level of 0.35%-0.40% NPP with a high
dose of phytase in diets including limestone or TCP is sufficient to guarantee
performance and bone formation for broiler chickens from d 1 to d 14.

Chapter 6
73
CHAPTER 6
Comparison of how different mineral
phosphorus sources affect performance, bone
mineralization and phosphorus retention in
broilers
Phosphorus sources in broilers chickens
74
Comparison of how different mineral phosphorus sources affect
performance, bone mineralization and phosphorus retention in
broilers
M. Hamdi 1,
D. Solà-Oriol1, R. Franco-Rosselló
1, R. Aligue
2, and J.F. Pérez
1
1 Animal Nutrition and Welfare Service (SNiBA). Departament de Ciència Animal i
dels Aliments. Universitat Autònoma de Barcelona, 08193 Bellaterra, Spain.
2 Department of Biomedical Sciences. University of Barcelona, IDIBAPS, 08036
Barcelona, Spain.
Submitted to British Poultry Science
Chapter 6
75
6.1. Abstract
1. Two experiments were designed to evaluate the influence of different sources of
phosphate on animal performance, bones mineralization and mineral retention in
broilers.
2. In Experiment 1, twenty mash diets were prepared including five mineral sources of
P to supplement non phytic P (NPP) levels at 3.0, 3.5, 4.0 and 4.5 g/kg in diets without
phytase for boilers (n=500).
3. In Experiment 2, three treatments were used: the low MCP (mono-calcium
phosphate) diet was deficient in NPP (3.1 g/kg for the starter phase and 2.8 g/kg for the
grower phase) and adequate in Ca (9.0 g/kg and 8.5 g/kg, respectively); the high MCP
diet and the high TCP (tri-calcium phosphate) diet included adequate levels of NPP and
Ca.
4. In experiment 1, an increase in the level of NPP in the diet from 3.0 to 4.0 g/kg
increased WG (weight gain) and FI (Feed intake) between d 1 and d 21. Alternatively,
tibial weight and ash percentage at d 21 responded up to the level of 4.5 g/kg and
showed significant difference with birds of the 4.0 g/kg NPP group.
5. In experiment 2, chickens fed with the high MCP and high TCP showed an
improvement in animal performance and bone mineralization. A higher P retention was
also observed for birds fed high MCP (1.28 g/day) and TCP (1.51 g/day) as compared to
broilers feds low MCP (0.88 g/day).
6. The results did not show differences on the availability of P from the different
mineral P sources. A level of 4.5 g/kg NPP is recommended when phytase is not include
to maximize both performance and bone mineralization in broiler chickens up to d 21.
Phosphorus sources in broilers chickens
76
6.2. Introduction
In addition to environmental concerns regarding excessive Phosphorus (P) in
ground water, P is one of the most expensive nutrients in poultry diets. The broad
development of phytase has allowed for the reduction of dietary P and the inclusion of
mineral sourced P. However, mineral sources of P are still needed in the diet to meet the
requirement of poultry and prevent P deficiencies. With increases in prices for mineral
sources, the poultry and commercial feed industry have become increasingly interested
in detailed information about the variation in availability of P among different raw
materials, as well as batches of the same raw material. The bio-availability for each P
source is pivotal to formulate diets at a higher precision and avoid excessive P.
However, a limited amount of information exists regarding the biological availability or
retention of different types of mineral P sources. Phosphorus is also a nutrient with a
direct linear effect on growth response and bone characteristics when levels below P
requirements are applied (Hamdi et al., 2015a). Different methodologies exist to
measure in vivo bio-availability of P or to compare P sources including bio-assays based
on growth, bone weight and bone ash weight (Ravindran et al., 1995; Lima et al., 1997).
These procedures are useful relative measurements for the comparison of different
sources of Ca and P, but they don´t provide a quantitative value for formulation
purposes (Leske and Coon, 2002).
Different sources have been used as a P reference in bio-assay studies, mono-
sodium phosphates (Shastak et al., 2012), mono-calcium phosphates (MCP) (Groote
and Huyghebaert, 1997) or di-calcium phosphates (DCP) (Coon and Manangi, 2007,
Fernandez et al., 1999; Ravindran et al., 1995). The MCP has a higher concentration of
P than Ca, namely 22.6% P and 17.8% Ca. In contrast, P and Ca content in DCP depend
on the degree of hydration. The DCP dihydrate contains typically 17.7% P and 24% Ca
and DCP anhydrous contains 20.1% P and 27% Ca (FEDNA, 2010).
It is believed that P in MCP is more digestible than P in DCP (Grimbergen et al.,
1985; Eekhout and De Paepe, 1997). However, because most feed phosphates
designated as MCP or DCP are mixtures of both, differences within a source may exist
(Peterson et al., 2011). Commercial products labeled DCP are industrial products
resulting from the acidulation of rock phosphate, frequently with sulfuric acid, yielding
phosphoric acid, which is neutralized with Ca carbonate after purification (Lima et al.,
1997). In contrast, tri-calcium phosphate (TCP) provides a Ca:aP ratio close to the
Chapter 6
77
recommended dietary ratios (TCP phosphate supplied 17.4% P, and 34% Ca).
Therefore, TCP could be used as a unique source to satisfy poultry Ca and P
requirements without the need of Ca from limestone.
Consequently, in this study we tested the hypothesis that different mineral
sources of P, varying in the amount of P and Ca, will affect the dietary P absorption and
overall productivity of broiler chickens. Two experiments were conducted to evaluate
the effect of the P source provided at different levels in broiler diets on the availability
of P and their effects on performance and bone mineralization for broilers. In the first
experiment, the P availability was compared between MCP and the different sources of
DCP in broilers chickens up to d 21. In the second experiment, the inclusion of a source
of TCP as a single source of Ca and P was compared to MCP in broiler diets with
respect to their effects on performance, bone mineralization and P retention in broilers
up to d 35.
6.3. Materials and methods
All the animal experimentation procedures used in the two experiments were
approved by the animal Ethics Committee of the Universitat Autònoma de Barcelona
and were in compliance with the European Union guidelines for the care and use of
animals in research (European Parliament, 2010).
6.3.1. Birds managment, husbandry, study design and diets
6.3.1.1. Experiment 1
Five hundred broiler male chickens (Ross 308) were included in the study.
Animals were randomly distributed into twenty experimental groups according to the
experimental treatment and continuously controlled for 21 days. Birds were individually
weighed and distributed in 100 battery brooders cages (5 chicks per cage) in order to get
a similar initial average body weight for each cage. Chicks were individually wing-
tagged in order to record individual body weight as well the group body weight during
the experimental period. The brooder temperature was maintained at 35ºC during the 4
first days post-hatch, and then was progressively reduced to 25ºC on day 14 to d 21 day.
The light cycle was 24h/d from d 1 to d 2, 23h/d from d 3 to d 10 and 18h/d from d 11
to 21.

Phosphorus sources in broilers chickens
78
Table 6.1. Composition of the experimental diet (Experiment 1).
(*) Provided per kg of feed: Vitamin A (retinil acetate) (UI) 10000; Vitamin D (Vitamin D3) (Colecalciferol) (UI) 2000; Vitamina D (25- hidroxicolecalciferol. 25 mcg equivalent at 1000 UI )
(UI) 1500; Vitamin E/acetate de tot-rac-3- tocopheril) (mg) 75; Vitamin K3 (MNB Menadiona nicotinamida bisulfit)(mg) 5; Vitamin B1 (Tiamin mononitrat) (mg) 2; Vitamin B2 (Riboflavin)
(mg) 5; Vitamin B6 (Piridoxin Chlorhidrate) (mg) 4; Vitamin B12 (cyanocobalamine) (mg) 0.015; Biotin (D-(+)-biotin) (mg) 0.15; Folic Acid (mg) 1; Iron (Iron sulfate monohydrate) (mg) 46;
Zinc (Zn, zinc oxide) (mg) 125; Manganes (Mn, Manganes oxide) (mg) 150; Iodine (I, Calcium Iondine Anhidre) (mg) 2; Selenium (Se, Sodium Selenate) (mg) 0.3; Copper (Cu, Copper Sulfate
pentahydrate) (mg) 20; Endo-1,3(4)-betaglucanase EC 3.2.1.6 (FBG) 10; Endo-1,4-beta-xylanase EC 3.2.1.8 (FXU) 150; Malic acid (mg) 60; Fumari acid (mg) 75; Sepiolite (mg) 400; Calcium
Carbonate (g) 4. 1 Mono-calcium phosphate 2 Di-calcium phosphate.
MCP1 DCP
21 DCP
22 DCP3 DCP4
3 3.5 4 4.5 3 3.5 4 4.5 3 3.5 4 4.5 3 3.5 4 4.5 3 3.5 4 4.5
Ingredients (%)
Corn
Wheat
Soybean meal
Extruded soybean
L-Lysine
DL-Methionine
L-threonine
Premix*
Dicalite
28.7
25.0
24.8
13.0
0.29
0.27
0.03
0.40
0.46
28.7
25.0
24.8
13.0
0.29
0.27
0.03
0.40
0.34
28.7
25.0
24.8
13.0
0.29
0.27
0.03
0.40
0.23
28.7
25.0
24.8
13.0
0.29
0.27
0.03
0.40
0.11
28.7
25.0
24.8
13.0
0.29
0.27
0.03
0.40
0.51
28.7
25.0
24.8
13.0
0.29
0.27
0.03
0.40
0.41
28.7
25.0
24.8
13.0
0.29
0.27
0.03
0.40
0.31
28.7
25.0
24.8
13.0
0.29
0.27
0.03
0.40
0.21
28.7
25.0
24.8
13.0
0.29
0.27
0.03
0.40
0.56
28.7
25.0
24.8
13.0
0.29
0.27
0.03
0.40
0.48
28.7
25.0
24.8
13.0
0.29
0.27
0.03
0.40
0.39
28.7
25.0
24.8
13.0
0.29
0.27
0.03
0.40
0.31
28.7
25.0
24.8
13.0
0.29
0.27
0.03
0.40
0.54
28.7
25.0
24.8
13.0
0.29
0.27
0.03
0.40
0.45
28.7
25.0
24.8
13.0
0.29
0.27
0.03
0.40
0.35
28.7
25.0
24.8
13.0
0.29
0.27
0.03
0.40
0.26
28.7
25.0
24.8
13.0
0.29
0.27
0.03
0.40
0.57
28.7
25.0
24.8
13.0
0.29
0.27
0.03
0.40
0.49
28.7
25.0
24.8
13.0
0.29
0.27
0.03
0.40
0.40
28.7
25.0
24.8
13.0
0.29
0.27
0.03
0.40
0.32 P source inclusion 0.70 0.92 1.14 1.36 0.86 1.13 1.39 1.66 0.86 1.13 1.39 1.66 0.90 1.18 1.45 1.73 0.90 1.18 1.46 1.74
Limestone inclusion 1.57 1.47 1.36 1.26 1.36 1.19 1.02 0.86 1.31 1.13 0.94 0.76 1.29 1.11 0.92 0.73 1.26 1.07 0.87 0.67
Calculated Composition (g/kg diet)
Total P 5.5 6.0 6.5 7.0 5.5 6.0 6.5 7.0 5.5 6.0 6.5 7.0 5.5 6.0 6.5 7.0 5.5 6.0 6.5 7.0
PP 2.5 2.5 2.5 2.5 2.5 2.5 2.5 2.5 2.5 2.5 2.5 2.5 2.5 2.5 2.5 2.5 2.5 2.5 2.5 2.5
Available P 2.8 3.3 3.7 4.2 0.27 0.31 0.35 0.40 0.27 0.31 0.35 0.40 0.27 0.31 0.35 0.40 0.27 0.31 0.35 0.40
Ca 9.0 9.0 9.0 9.0 9.0 9.0 9.0 9.0 9.0 9.0 9.0 9.0 9.0 9.0 9.0 9.0 9.0 9.0 9.0 9.0
Analyzed composition (g/kg diet)
DM 896 894 895 894 897 897 897 896 896 898 897 899 895 895 896 898 896 896 897 898
CP 226 222 219 217 218 221 218 221 222 218 216 220 210 213 220 211 210 220 212 218
Total P 6.5 6.9 7.3 7.4 6.4 6.7 7.2 7.9 6.5 6.6 7.3 8.0 5.7 6.7 7.4 7.9 6.1 6.9 6.9 7.7
Ca 13.1 13.0 13.4 12.2 15.1 13.1 12.5 14.5 13.2 13.0 12.9 13.4 11.7 11.9 13.3 12.1 12.3 13.1 12.2 12.8

Chapter 6
79
An identical basic mixture of ingredients (wheat, 250 g/kg; corn, 287.2 g/kg;
soybean meal, 248.8 g/kg; and soybean oil, 42.5 g/kg) was formulated and prepared to
contain adequate levels of nutrients (ME, 2,960 Kcal/kg; DM, 882 g/kg; and CP, 220
g/kg) to meet and exceed nutritional requirements in broilers (FEDNA, 2008), except
for P. All the diets were presented in mash form. A total of 20 experimental treatments
were prepared adding 4 increasing levels of non-phytic phosphorus (3.0, 3.5, 4.0 and 4.5
g NPP/kg) depending on the inorganic P source under study and maintaining a level of
9.0 g Ca/kg. Phytase was not added in the experimental diets. Five main sources of P
were used to design the experimental treatments, which were MCP- monohydrate
(22.3% P, 16.8% Ca), DCP1-dihydrate (18.7% P, 23.9% Ca), DCP2-dihydrate (18.7%
P, 26.1% Ca), DCP3-dihydrate (17.9% P, 25.6% Ca) and DCP4-dihydrate (17.9% P,
26.9% Ca). Table 6.1 shows the P concentration and the levels of incorporation of each
source of P. All P sources were obtained from independent distributors rather than
manufacturers of the products. The broilers chicken had free access to drinking water
served via a nipple system and to feeders containing the feed in a mash form.
6.3.1.2. Experiment 2
Ninety-six broilers male chickens (Ross 308) were included in the study.
Animals were randomly distributed into three experimental groups according to the
experimental treatment and continuously controlled for 35 days. Birds were individually
weighed and distributed in 24 battery brooder cages (4 chicks per cage) in order to get a
similar initial average body weight for each cage. Chicks were individually wing-tagged
in order to monitor individual BW as well as the group BW along the experimental
period. The brooder temperature was maintained at 35ºC during the 4 first days post-
hatch, and was progressively reduced to 25-22ºC on d 14 to d 35 day. The light cycle
was 24h/d from d 1 to d 2, 23h/d from d 3 to d 10 and 18h/d from d 11 to d 35. All diets
met or exceeded the nutrient requirements for broilers (FEDNA, 2008), with the
exception of P (Table 6.2).
All birds received two experimental diets, the first one in the starter phase (from
d 1 to d 21) and the second diet during the grower phase (from d 21 to d 35). The low
MCP treatment included limestone (38% Ca) and MCP (22.6% P and 17.8% Ca) as
sources of Ca and P and was formulated to be adequate in Ca (9.0 g/kg and 8.5 g/kg for
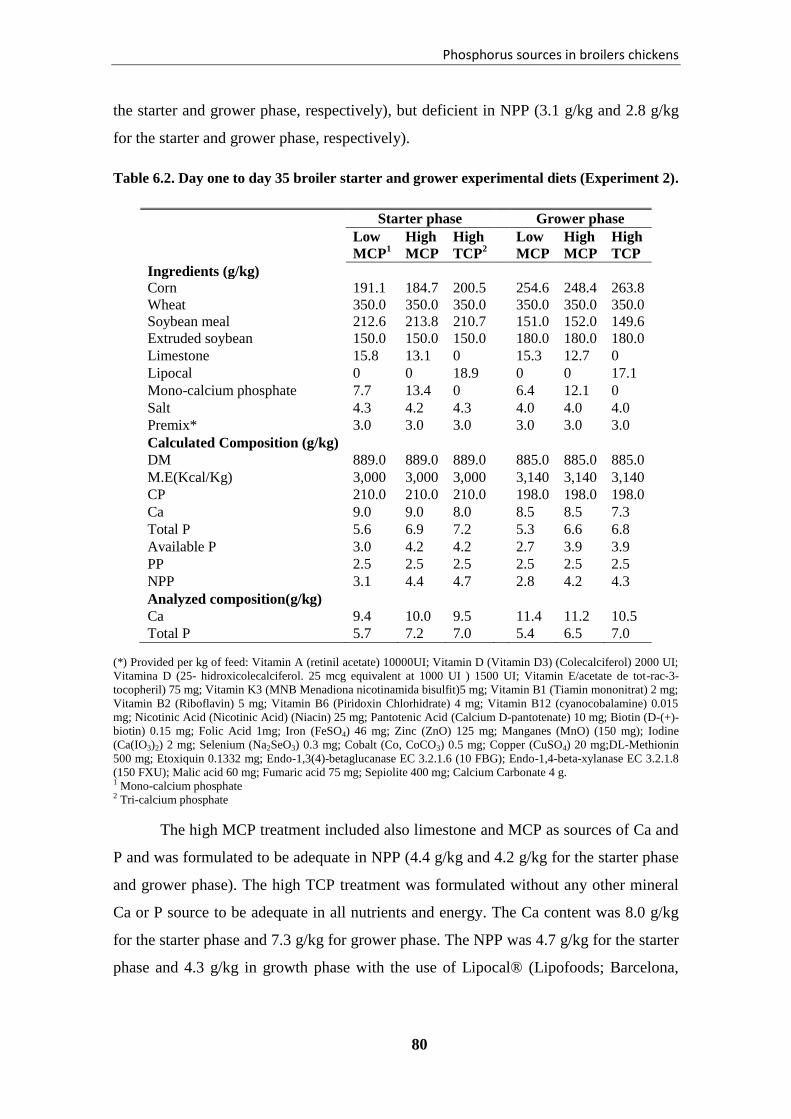
Phosphorus sources in broilers chickens
80
the starter and grower phase, respectively), but deficient in NPP (3.1 g/kg and 2.8 g/kg
for the starter and grower phase, respectively).
Table 6.2. Day one to day 35 broiler starter and grower experimental diets (Experiment 2).
Starter phase Grower phase
Low
MCP1
High
MCP
High
TCP2
Low
MCP
High
MCP
High
TCP
Ingredients (g/kg)
Corn 191.1 184.7 200.5 254.6 248.4 263.8
Wheat 350.0 350.0 350.0 350.0 350.0 350.0
Soybean meal 212.6 213.8 210.7 151.0 152.0 149.6
Extruded soybean 150.0 150.0 150.0 180.0 180.0 180.0
Limestone 15.8 13.1 0 15.3 12.7 0
Lipocal 0 0 18.9 0 0 17.1
Mono-calcium phosphate 7.7 13.4 0 6.4 12.1 0
Salt 4.3 4.2 4.3 4.0 4.0 4.0
Premix* 3.0 3.0 3.0 3.0 3.0 3.0
Calculated Composition (g/kg)
DM 889.0 889.0 889.0 885.0 885.0 885.0
M.E(Kcal/Kg) 3,000 3,000 3,000 3,140 3,140 3,140
CP 210.0 210.0 210.0 198.0 198.0 198.0
Ca 9.0 9.0 8.0 8.5 8.5 7.3
Total P 5.6 6.9 7.2 5.3 6.6 6.8
Available P 3.0 4.2 4.2 2.7 3.9 3.9
PP 2.5 2.5 2.5 2.5 2.5 2.5
NPP 3.1 4.4 4.7 2.8 4.2 4.3
Analyzed composition(g/kg)
Ca 9.4 10.0 9.5 11.4 11.2 10.5
Total P 5.7 7.2 7.0 5.4 6.5 7.0
(*) Provided per kg of feed: Vitamin A (retinil acetate) 10000UI; Vitamin D (Vitamin D3) (Colecalciferol) 2000 UI;
Vitamina D (25- hidroxicolecalciferol. 25 mcg equivalent at 1000 UI ) 1500 UI; Vitamin E/acetate de tot-rac-3-
tocopheril) 75 mg; Vitamin K3 (MNB Menadiona nicotinamida bisulfit)5 mg; Vitamin B1 (Tiamin mononitrat) 2 mg;
Vitamin B2 (Riboflavin) 5 mg; Vitamin B6 (Piridoxin Chlorhidrate) 4 mg; Vitamin B12 (cyanocobalamine) 0.015
mg; Nicotinic Acid (Nicotinic Acid) (Niacin) 25 mg; Pantotenic Acid (Calcium D-pantotenate) 10 mg; Biotin (D-(+)-
biotin) 0.15 mg; Folic Acid 1mg; Iron (FeSO4) 46 mg; Zinc (ZnO) 125 mg; Manganes (MnO) (150 mg); Iodine
(Ca(IO3)2) 2 mg; Selenium (Na2SeO3) 0.3 mg; Cobalt (Co, CoCO3) 0.5 mg; Copper (CuSO4) 20 mg;DL-Methionin
500 mg; Etoxiquin 0.1332 mg; Endo-1,3(4)-betaglucanase EC 3.2.1.6 (10 FBG); Endo-1,4-beta-xylanase EC 3.2.1.8
(150 FXU); Malic acid 60 mg; Fumaric acid 75 mg; Sepiolite 400 mg; Calcium Carbonate 4 g. 1 Mono-calcium phosphate 2 Tri-calcium phosphate
The high MCP treatment included also limestone and MCP as sources of Ca and
P and was formulated to be adequate in NPP (4.4 g/kg and 4.2 g/kg for the starter phase
and grower phase). The high TCP treatment was formulated without any other mineral
Ca or P source to be adequate in all nutrients and energy. The Ca content was 8.0 g/kg
for the starter phase and 7.3 g/kg for grower phase. The NPP was 4.7 g/kg for the starter
phase and 4.3 g/kg in growth phase with the use of Lipocal® (Lipofoods; Barcelona,

Chapter 6
81
Spain) (a fat-encapsulated tri-calcium phosphate, supplied 17.4% P and 34% Ca) as a
source of Ca and P. Phytase was not incorporated in the experimental diets.
6.3.2. Sample collection and processing
6.3.2.1. Experiment 1
The feed intake (FI), weight gain (WG) and gain feed ratio (G:F) were
calculated between d 1 and d 21. On d 21, three birds were euthanized using the cervical
dislocation and the left tibia was collected for bone-ash determination.
6.3.2.2. Experiment 2
Individual BW as well as the group BW was monitored at the start (d 1) and d 7,
d 14, d 21, d 28 and d 35 post-hatch. From these values the FI, WG and G: F ratio were
determined. Feed intake was registered and excreta were collected from d 19 to d 21 and
from d 33 to d 35 in order to determine the retention of Ca and P. At d 35, three
chickens per cage were euthanized using the cervical dislocation and the left tibia was
collected for bone-ash determination.
6.3.3. Laboratory analyses
Representative samples of diets and excreta were analyzed.
Analytical determinations of feeds were performed according to the methods of AOAC
International (2005): dry matter (Method 934.01), crude protein with Dumas Method
(Method 968.06).
Diets and excreta samples were digested in nitric perchloric and fluorhydric acid
mixture and subsequently concentration of P and Ca were determined by inductively
coupled plasma-optical emission spectroscopy (ICP-OES) using optical emission
spectrometer optimal 4300DV Perkin-Elmer.
Bone mineralization was determined by the procedure of Brenes et al., (2003).
The tibias were defatted by a 48h extraction in ethyl ether. They were then dried for 12h
at 110ºC and then ashed overnight at 550ºC to determine ash content.
6.3.4. Calculations
The total tract retention coefficients were calculated according to the procedure
outlined using the following equation (Adeola, 2001): The apparent total tract retention
coefficients of Ca or P (ATTRC)
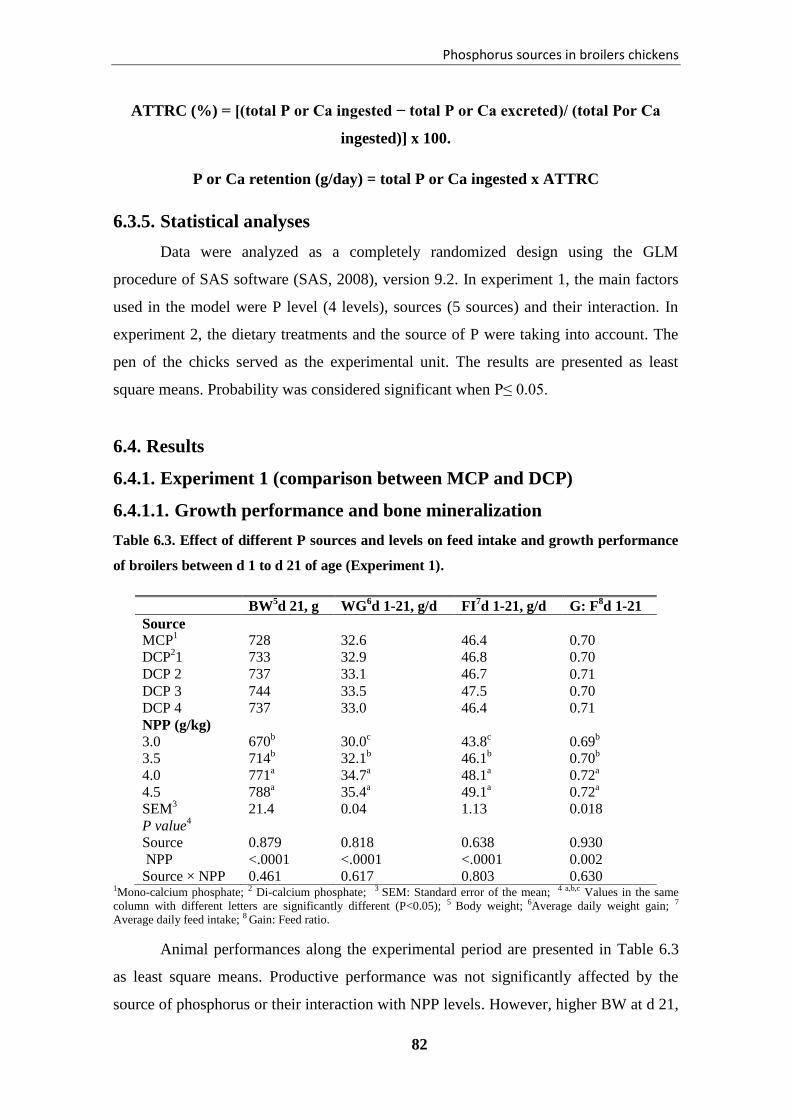
Phosphorus sources in broilers chickens
82
ATTRC (%) = [(total P or Ca ingested − total P or Ca excreted)/ (total Por Ca
ingested)] x 100.
P or Ca retention (g/day) = total P or Ca ingested x ATTRC
6.3.5. Statistical analyses
Data were analyzed as a completely randomized design using the GLM
procedure of SAS software (SAS, 2008), version 9.2. In experiment 1, the main factors
used in the model were P level (4 levels), sources (5 sources) and their interaction. In
experiment 2, the dietary treatments and the source of P were taking into account. The
pen of the chicks served as the experimental unit. The results are presented as least
square means. Probability was considered significant when P≤ 0.05.
6.4. Results
6.4.1. Experiment 1 (comparison between MCP and DCP)
6.4.1.1. Growth performance and bone mineralization
Table 6.3. Effect of different P sources and levels on feed intake and growth performance
of broilers between d 1 to d 21 of age (Experiment 1).
1Mono-calcium phosphate; 2 Di-calcium phosphate; 3 SEM: Standard error of the mean; 4 a,b,c Values in the same
column with different letters are significantly different (P<0.05); 5 Body weight; 6Average daily weight gain; 7
Average daily feed intake; 8 Gain: Feed ratio.
Animal performances along the experimental period are presented in Table 6.3
as least square means. Productive performance was not significantly affected by the
source of phosphorus or their interaction with NPP levels. However, higher BW at d 21,
BW5d 21, g WG
6d 1-21, g/d FI
7d 1-21, g/d G: F
8d 1-21
Source
MCP1 728 32.6 46.4 0.70
DCP21 733 32.9 46.8 0.70
DCP 2 737 33.1 46.7 0.71
DCP 3 744 33.5 47.5 0.70
DCP 4 737 33.0 46.4 0.71
NPP (g/kg)
3.0 670b 30.0
c 43.8
c 0.69
b
3.5 714b 32.1
b 46.1
b 0.70
b
4.0 771a 34.7
a 48.1
a 0.72
a
4.5 788a 35.4
a 49.1
a 0.72
a
SEM3 21.4 0.04 1.13 0.018
P value4
Source 0.879 0.818 0.638 0.930
NPP <.0001 <.0001 <.0001 0.002
Source × NPP 0.461 0.617 0.803 0.630

Chapter 6
83
WG, FI and G: F were observed from the broilers in the 4.0 and 4.5 g NPP/kg group as
compared to the broilers in the 3.0 and 3.5 g NPP /kg group.
The effect of different sources and levels of P on bone mineralization (tibial
weight and ash) and tibial weight/BW is reported in Table 6.4. The results are presented
as least square means. No significant interaction effect was observed between P sources
and NPP levels. On d 21, tibial weight and bone ash percentage were increased (P<
0.05) by the dietary P supplementation, regardless of the source of P utilized. Broilers in
the 4.5 g NPP /kg level showed a greater tibial weight than broilers in the 4.0 g NPP /kg
group. Broiler chickens fed diets supplemented with 4.0 and 4.5 g NPP /kg showed a
higher tibial ash (%) and tibial weight/BW than those fed diets supplemented with 3.0
and 3.5 g NPP /kg.
Table 6.4. Effect of different P sources and level on tibial weight and ash content in birds
from d1 to d 21 of age (Experiment 1).
1Mono-calcium phosphate ; 2 Di-calcium phosphate; 3 SEM: Standard error of the mean; 4 a,b Values in the same
column with different letters are significantly different (P<0.05).
6.4.2. Experiment 2 (comparison between TCP and MCP)
6.4.2.1. Growth Performance and Bone Mineralization
The feed intake and growth performance responses of broilers chickens to
different levels and sources of Ca and P are presented in Table 6.5. Higher BW was
observed (P < 0.05) at d 21 and d 35 for broilers fed the high MCP and high TCP
compared to the birds fed the low MCP group. Higher WG and FI (P< 0.05) from d 1 to
Tibial weight,
g
Tibial ash,
%
Tibial weight,
%/BW
Tibial ash,
mg/tibia
Source
MCP 1.57 50.83 0.215 0.798
DCP11 1.62 51.07 0.216 0.831
DCP22 1.60 51.05 0.215 0.816
DCP 3 1.59 51.53 0.214 0.821
DCP 4 1.58 50.63 0.213 0.800
NPP (g/kg)
3.0 1.41c 48.29
c 0.207
c 0.682
c
3.5 1.52d 50.80
b 0.211
b 0.770
d
4.0 1.66b 52.11
a 0.217
a 0.868
b
4.5 1.76a 52.88
a 0.223
a 0.932
a
SEM3 0.053 0.530 0.0038 0.028
P value4
Source 0.619 0.179 0.875 0.409
NPP <.0001 <.0001 <.0001 <.0001
Source × NPP 0.809 0.234 0.570 0.611
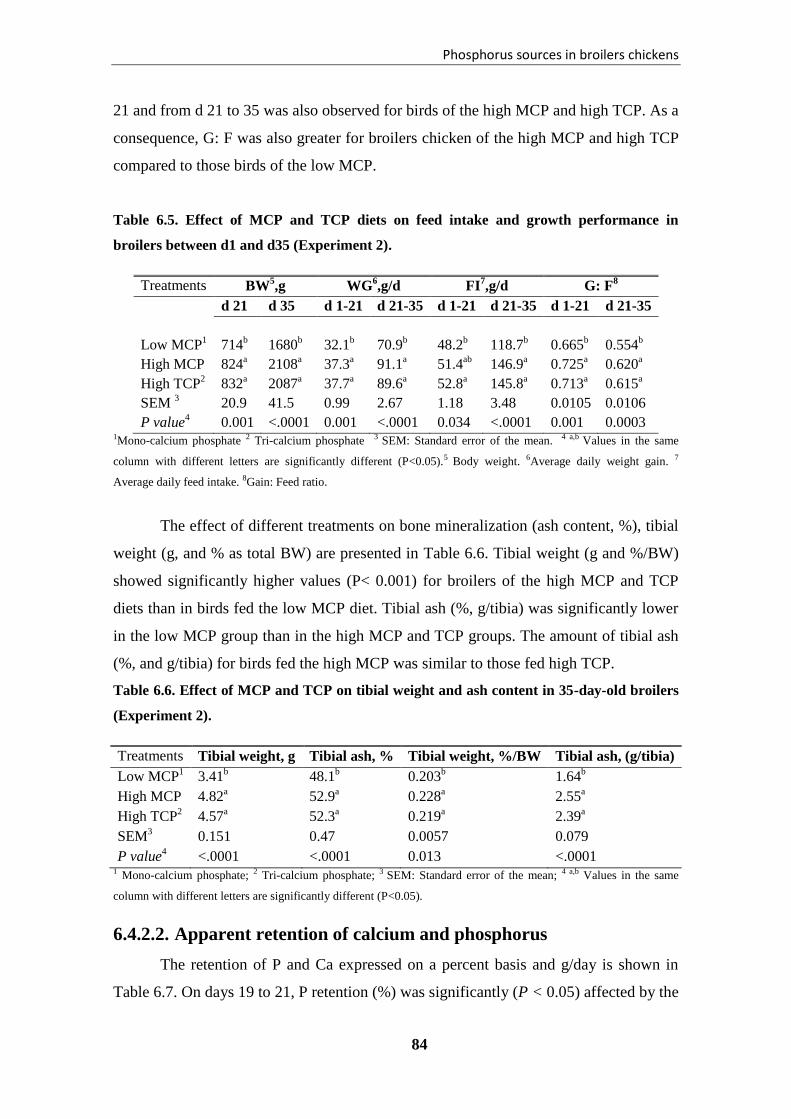
Phosphorus sources in broilers chickens
84
21 and from d 21 to 35 was also observed for birds of the high MCP and high TCP. As a
consequence, G: F was also greater for broilers chicken of the high MCP and high TCP
compared to those birds of the low MCP.
Table 6.5. Effect of MCP and TCP diets on feed intake and growth performance in
broilers between d1 and d35 (Experiment 2).
Treatments BW5,g WG
6,g/d FI
7,g/d G: F
8
d 21 d 35 d 1-21 d 21-35 d 1-21 d 21-35 d 1-21 d 21-35
Low MCP1 714
b 1680
b 32.1
b 70.9
b 48.2
b 118.7
b 0.665
b 0.554
b
High MCP 824a 2108
a 37.3
a 91.1
a 51.4
ab 146.9
a 0.725
a 0.620
a
High TCP2 832
a 2087
a 37.7
a 89.6
a 52.8
a 145.8
a 0.713
a 0.615
a
SEM 3 20.9 41.5 0.99 2.67 1.18 3.48 0.0105 0.0106
P value4 0.001 <.0001 0.001 <.0001 0.034 <.0001 0.001 0.0003
1Mono-calcium phosphate 2 Tri-calcium phosphate 3 SEM: Standard error of the mean. 4 a,b Values in the same
column with different letters are significantly different (P<0.05).5 Body weight. 6Average daily weight gain. 7
Average daily feed intake. 8Gain: Feed ratio.
The effect of different treatments on bone mineralization (ash content, %), tibial
weight (g, and % as total BW) are presented in Table 6.6. Tibial weight (g and %/BW)
showed significantly higher values (P< 0.001) for broilers of the high MCP and TCP
diets than in birds fed the low MCP diet. Tibial ash (%, g/tibia) was significantly lower
in the low MCP group than in the high MCP and TCP groups. The amount of tibial ash
(%, and g/tibia) for birds fed the high MCP was similar to those fed high TCP.
Table 6.6. Effect of MCP and TCP on tibial weight and ash content in 35-day-old broilers
(Experiment 2).
Treatments Tibial weight, g Tibial ash, % Tibial weight, %/BW Tibial ash, (g/tibia)
Low MCP1 3.41
b 48.1
b 0.203
b 1.64
b
High MCP 4.82a 52.9
a 0.228
a 2.55
a
High TCP2 4.57
a 52.3
a 0.219
a 2.39
a
SEM3 0.151 0.47 0.0057 0.079
P value4 <.0001 <.0001 0.013 <.0001
1 Mono-calcium phosphate; 2 Tri-calcium phosphate; 3 SEM: Standard error of the mean; 4 a,b Values in the same
column with different letters are significantly different (P<0.05).
6.4.2.2. Apparent retention of calcium and phosphorus
The retention of P and Ca expressed on a percent basis and g/day is shown in
Table 6.7. On days 19 to 21, P retention (%) was significantly (P < 0.05) affected by the

Chapter 6
85
dietary treatment, with greater values observed for birds in the low MCP (59.46%) diet
compared to the high TCP (44.57%) diet. Intermediate values were observed for chicks
of the high MCP treatment (50.66%). Ca retention was not affected by the dietary
treatment. Furthermore, during the finishing phase (d 33 to d 35), no significant
differences were observed on the P retention (%). However, broilers in the high MCP
(1.28 g/day) and TCP (1.51 g/day) groups showed a higher daily retention of P than the
low MCP (0.88 g/day) group.
Table 6.7. Effect of MCP and TCP on P retention, Ca and P digestibility (%) and Ca and
P retention (g/day) in 35-day-old broilers (experiment 2).
P retention
coefficient (%)
Ca retention
coefficient (%)
P retention
(g/day)
Ca retention
(g/day)
d 19- 21 d 33-35 d 19- 21 d 33-35 d 19- 21 d 33-35 d 19- 21 d 33-35
Low MCP1 59.46
a 55.43 35.24 37.05 0.64 0.88
b 0.63 1.24
High MCP 50.66ab 50.16 28.19 38.65 0.73 1.28
a 0.56 1.73 High TCP
2 44.57b 53.07 29.08 37.96 0.60 1.51
a 0.56 1.66
SEM
3 3.05 1.88 4.52 4.06 0.05 0.09 0.08 0.20
P value4 0.005 0.166 0.50 0.962 0.252 0.0003 0.811 0.199
1 Mono-calcium phosphate; 2 Tri-calcium phosphate; 3SEM: Standard error of the mean.; 4 a,b Values in the same
column with different letters are significantly different (P<0.05).
6.5. Discussion
Our study focused on the comparison of P availability from either MCP, DCP or
TCP sources. In addition, our study focused on the hypothesis of existing differences
among a number of DCP sources. Results showed that MCP, DCP and TCP are highly
available P sources; and no differences were observed among P sources with respect to
productive performance and bone mineralization of broiler chicken at ages of 21 and 35
days. Lima et al., (1997) showed the same results on broiler performance when they
evaluated seven di-calcium phosphate sources from different origins. In the same way,
Shastak et al., (2012) didn’t find significant effects of the P source on feed intake and
BW gain for broilers at 3 and 5 weeks of age, when comparing the effects of mono-
sodium phosphate and di-calcium phosphate anhydrous. In contrast, Gillis et al., (1962)
reported higher P availability in purified grade mono-calcium phosphate than in di-
calcium phosphate. The authors suggested the reason for this was the difference in
hydration degree of P source. Specifically, P in the anhydrous di-calcium phosphate

Phosphorus sources in broilers chickens
86
form is less available for poultry than the hydrated salt. It is noteworthy to describe that
during the DCP manufacturing, conditions including temperature are responsible for the
formation of the dihydrate or anhydrate product. Grimbergen et al., (1985) showed that
the growth response was lower when anhydrous-DCP was included in the diet as
compared to MCP or hydrated-DCP. In addition, Grimbergen et al. (1985), didn´t detect
any difference in the growth response between MCP and hydrated DCP. According to
Rucker et al., (1968), the dihydrate form of DCP dissolved more rapidly in an acid
environment than the anhydrous form. In addition, Lima et al., (1997) also suggested
that the particle size of phosphate may also affect P availability. Specifically, the larger
particle size phosphate sources are retained longer in the gizzard than smaller particles,
likely allowing a higher solubility and availability (Brunell et al., 1990; Lima et al.,
1997). This criterion of particle size was not registered or evaluated in this study.
No significant difference was observed between high MCP and TCP in animal
performance and bone mineralization. However, Wilcox et al., (1954) reported that the
P in tri-calcium phosphate was poorly utilized by the turkey poults. The results of these
two experiments demonstrated a significant effect of NPP level in animal performance.
Lower animal BW gain and feed intake were observed for animals fed diets with low
levels of NPP (3.0 to 3.5 g/kg) as compared to 4.0 and 4.5 g /kg at d 21 and 35.
However, increasing NPP from 4.0 to 4.5 g /kg increased both the tibial weight and
tibial ash content (mg/tibia). Hamdi et al., (2015a) concluded that a level of 3.8 g NPP
/kg improved the growth of chicks and increased bone mineralization on d 14, but no
further increases were observed with 4.5 g NPP /kg in diets including the addition of
high levels of phytase. The lower required levels observed for this experiment as
compared to the actual results may be due to the effect of phytase inclusion in the diet
and also the duration of the experiment. According to Applegate et al. (2008), typical
removal amounts of P for 500 FTU of phytase in the diets can vary from 0.06% to
0.10% for broilers. In our experiment, no differences in animal performance were
observed between the broilers fed the 4.0 and 4.5 g NPP /kg diets. However, increasing
the NPP from 4.0 to 4.5 g/kg increased tibial weight and tibial ash (mg/tibia). Yan et al.,
(2001) also reported that NPP requirements for BW gain and feed conversion were
considerably less than required for tibial ash for broilers of 3 to 6 weeks of age in the
absence of phytase. They suggested NPP levels of 0.330%; 0.186% and 0.163% to
optimize tibial ash, BW gain and G: F ratio, when no phytase was included in the diet.
Chapter 6
87
However, with 800 FTU phytase diets, the suggested NPP were lowered to 0.240%;
0.151% and 0.109% respectively in order to optimize tibia ash, BW Gain and BW G: F
ratio.
Increasing the P level in the diet decreased P retention (%) in experiment 2.
However, the results were not affected by the P source (MCP, TCP). This result is
consistent with Leske and Coon (2002) who demonstrated that the retention of P from
different P sources depends on the amount of the inorganic P included. They found that
P retention from MCP declined from 98% to 59% when NPP was increased from 1.6 to
4.5 g/kg. Wasserman and Taylor (1973) suggested the existence of a saturable
component in P absorption, which can be responsible for the decrease in P absorption in
the intestine. The use of TCP for young broilers decreased the P retention. However, no
difference was observed between high MCP and TCP in the grower phase. Hamdi et al.,
(2015b) showed that the supplementation of broilers diet with TCP, improved FI and
WG at d 14 but ileal digestibility of Ca and P was lower for diets including TCP and
limestone as compared to diets including Ca chloride, mono-calcium phosphate and
sodium phosphate. This difference could be associated with the solubility of the P
sources in birds of different ages.
Despite the highly different physical structure and chemical properties among
P sources, the results observed in the present study did not provide evidence which
suggests that there are any differences in the in vivo availability of P in young
broilers. Higher NPP levels in the broiler diets are required to optimize bone
mineralization than to optimize growth performance.

Phosphorus sources in broilers chickens
88
Chapter 7
89
CHAPTER 7
Effect of microbial phytases and the
dietary calcium and phosphorus level on the
productive performance, and bone
mineralization of Broilers
Microbial phytases, calcium and phosphorus level in Broilers chickens
90
Effect of microbial phytases and the dietary calcium and phosphorus
level on the productive performance, and bone mineralization of
Broilers
M. Hamdi 1, D. Solà-Oriol
1, R. Franco-Rosselló
1, R. Aligue
2, and J.F. Pérez
1
1Animal Nutrition and Welfare Service (SNiBA). Departament de Ciència Animal i dels
Aliments. Universitat Autònoma de Barcelona, 08193 Bellaterra, Spain.
2Department of Biomedical Sciences. University of Barcelona, IDIBAPS, 08036
Barcelona, Spain.
Submitted to British Poultry Science
Chapter 7
91
7.1. Abstract
1. Two trials were conducted to evaluate the effect of phytase and different levels of Ca
in the diet limited in available P on performance, bone mineralization, and Ca and P
retention of broilers from d 1 to d 35 of age.
2. In Trial 1, 160 one-d-old male broilers were placed into 40 cages and allocated to 5
corn-wheat-soybean meal-based dietary treatments, which were a positive control [PC,
4.7 and 4.3 g/kg non-phytate P (NPP) and 9.0 and 8.5 g/kg Ca, from 1 to 21 d, and
from 21 to 35 d of age, respectively] and 4 negative control [NC, 3.2 and 2.9 g/kg non-
phytate P (NPP) and 7.0 and 6.3 g/kg Ca for the starter and grower diet] groups
consisting of 4 concentrations of phytase (0, 250, 500 and 1,000 FTU/kg). In trial 2, 300
one-day-old broilers were place into 60 cages and allocated to 10 corn-wheat-soybean
meal-based dietary treatments, which were two NC diets (3.2 g/kg NPP) with 7.0 g/kg
Ca (Low Ca) or 9.0 g/kg Ca (High Ca), respectively, which were supplemented (0 or
500 FTU/kg) with 4 different commercial phytases (phytase A, B, C and D) in a 2 x 5
factorial arrangement from 1 to 14 d of age.
3. In trial 1, PC and the high dose of phytase (1,000 FTU/kg) had significantly higher
average daily gain from 1 to 21 d of age, and a higher tibia weight and tibia ash content
than the NC, 250, 500 FTU/kg groups. In trial 2, the low Ca diets improved feed
efficiency from d 1 to 7, ileal digestibility of Ca and P, and bone mineralization on d 14.
Supplementation with any of the 4 phytase increased bone mineralization at 14 d of age,
but not differences were observed on performance.
5. Briefly, this research showed that high levels of phytase (1,000 FTU/kg) may be
required to promote performance and bone mineralization responses in growing
broilers. The results showed that lowering Ca:aP ratio may have a higher effect on
performance and P ileum digestibility than low levels (500 FTU/kg) of phytase. The
results don´t confirm the detrimental effect of high dietary Ca on phytase activity and
subsequent growth and bone performance of starting broilers (d 14). In contrast,
lowering Ca:aP ratio and including phytase (500 FTU/kg) improved bone
mineralization in an additive way.
Microbial phytases, calcium and phosphorus level in Broilers chickens
92
7.2. Introduction
Phosphorus (P) content of grain-based feeds is in general sufficient to support
adequate animal growth and bone development. However, vegetable ingredients mostly
contain P in phytate molecules and thus low available to birds. Commercial phytases are
phosphatase enzymes from fungal or bacterial origin which are obtained from
genetically modified organisms and capable to release organic bound phosphate. They
allow significant reductions on the supplementation of feed with calcium phosphate,
and consequently a decrease on total P excretion. Phytases used for animal feed
application differ on their enzymatic properties, such as the position of the phosphate
group they hydrolyze first, on how many phosphates are able to remove, their pH
profile (Selle et al., 2000), stability under digestive tract conditions (ie. pH stability or
pepsin cleavage), kinetic constants, or substrate specificity (Meneze-Blackburn et al.,
2015). The pH profile of supplementary phytases is especially important because
generally determine their ability to develop catalytic activity in the gastrointestinal
compartments (high in the acid conditions of crop, gizzard and proventriculus, and
negligible in small intestine). Some enzymes may exhibit a higher or lower activity at
pH 3 than pH 5.5. However the bio-efficacy of supplementary phytase is standardized at
defined conditions (pH 5.5, 37 ºC, and 5 mmol/L sodium phytate). Therefore, it is
virtually impossible to compare the different commercialized phytase products by the
properties reported by their producers. Although there have been efforts to compare the
biochemical properties of commercially available phytase products in in vitro
simulations of the digestive tract (Menezes-Blackburn et al., 2015), their comparative
biological efficacy depends on the conjunction of all properties, and can be fully
determined only by direct feeding trials (Chung et al., 2013).
Phytases are now extensively used in most poultry diets due to the declining
inclusion costs of phytases coupled with the increasing prices of mineral phosphorus. In
general, supplementation of animal feed with 250-1000 FTU is recommended by the
phytase suppliers but, phytase overdoses are also evaluated in order to maximize
phytate P utilization (Walk et al., 2014). However, the capacity of birds to utilize
phytate-P is limited, and may depend on the level of exogenous phytase, but also on the
large number of digestive interactions evolving along the gastrointestinal tract of
broilers among Ca, non-phytate P (NPP) and phytase (Akter et al., 2016). Calcium has
the capacity to interact with inorganic P in the gut (Hurwitz and Bar, 1971; Plumstead et

Chapter 7
93
al., 2008) as well as to form a mineral-phytate complex in pH higher than 5.0 (Taylor,
1965; Lei et al., 1994). It has been reported that the incorporation of high levels of
limestone in the diet as Ca source may limit the capacity of exogenous phytases to
hydrolyze phytate (Qian et al., 1996; Korenegay, 1999), and decrease performance and
bone mineralization in broilers (Sebastian et al., 1996; Hamdi et al., 2015). In contrast,
Powell et al., (2011) reported that increasing the dietary Ca level from 6.7 to 13.3 g/kg
had no effect on phytase activity. In practice, it has been suggested that reducing the
levels of Ca (Driver et al., 2005; Rama-Rao et al., 2006) and giving high doses of
phytase (Selle and Ravindran, 2007) may help to increase P availability of low NPP
diets, performance, and bone mineralization in broilers. However, the reported
magnitude, additivity or synergy of the birds´ response to changes on the level of
dietary Ca and phytase supplementation has not been consistent. In a recent report,
Akter et al., (2016) confirmed the detrimental effect of high dietary Ca on performance
and bone mineralization in broilers up to d 24 of age; as well as the positive bird’s
response of supplying 500 phytase units or 4 g NPP/kg as compared to 3 g NPP/kg.
However, a Ca x NPP x phytase interaction was observed for the feed intake,
performance, and bone mineralization. The greatest response to phytase was observed in
High Ca-Low NPP diets, and with Low Ca-High NPP diets, which it likely indicates
phytase is active to release digestible P and digestible Ca from the mineral-phytate
complex, respectively.
In this context, the present study was conducted through two trials designed to
determine the efficacy of increasing levels of a new microbial 3-phytase (FLF® 1000
FUT, Fertinagro, Spain) in a low NPP diet, and to explore the interactions of the ratio of
Ca:aP on phytase activity and its impact on broilers performance and bone
mineralization.
7.3. Materials and methods
7.3.1. Animal ethics
All animal experimentation procedures used in the 2 experiments were approved
by the animal Ethics Committee of the Universitat Autònoma de Barcelona and were in
compliance with the European Union guidelines for the care and use of animals in
research (European Parliament, 2010).

Microbial phytases, calcium and phosphorus level in Broilers chickens
94
7.3.2. Phytases
Phytase A: is a preparation of 6-phytase produced by a genetically modified
strain of Pichia pastoris (OptiPhos® 5000 CT); Phytase B: bacterial 6-phytase is
sourced from an E.coli species bacterium and is expressed in a Saccharomyces pombe
(Phyzyme® XP 10000 TPT); Phytase C: is a preparation of 6-phytase fungi produced
by a genetically modified strain of Aspergillus oryzae (Ronozyme® NP), and Phytase
D: an exogenous microbial 3-phytase produced by Pichia pastoris by the expression of a
cloned gene from Serratia odorifera FLF® 1000 FUT.
7.3.3. Dietary treatments
7.3.3.1. Experiment 1
The experiment was conducted with 5 dietary treatments. Diets were formulated
to be iso-energetic and iso-nitrogenous to meet or exceeded the nutrient requirements
for broilers (FEDNA, 2008), with the exception of Ca and available P in the negative
control and phytase-supplemented diets. The positive control diet (PC), without
supplemental phytase, was formulated to be adequate in energy and all nutrients,
including NPP (4.7 g/kg for the starter phase and 4.3 g/kg in the growth phase) and Ca
(9.0 g/Kg in the starter phase and 8.5 g/Kg in the growth phase). The negative control
diet (NC), without supplemental phytase, was formulated to be adequate in nutrients
and energy content, while it was deficient in NPP (3.2 g/Kg for the starter phase and 2.9
g/Kg in the growth phase) and Ca (7.0 g/Kg for the starter phase and 6.3 g/Kg the
growth phase). The rest of the diets were prepared by adding four levels of exogenous
phytase D (0, 250, 500, and 1,000 FTU/kg). The ingredient composition and nutrient
specifications of diets are presented in Table 7.1. Phytase was mixed in premix and then
into the diets. Titanium dioxide (5 g/kg) was added to the diets as indigestible marker
for nutrient digestibility analysis. All the diets were fed in mash form as starter (1 - 21d)
and grower (21- 35 d). Feed was provided ad libitum and water was freely available.
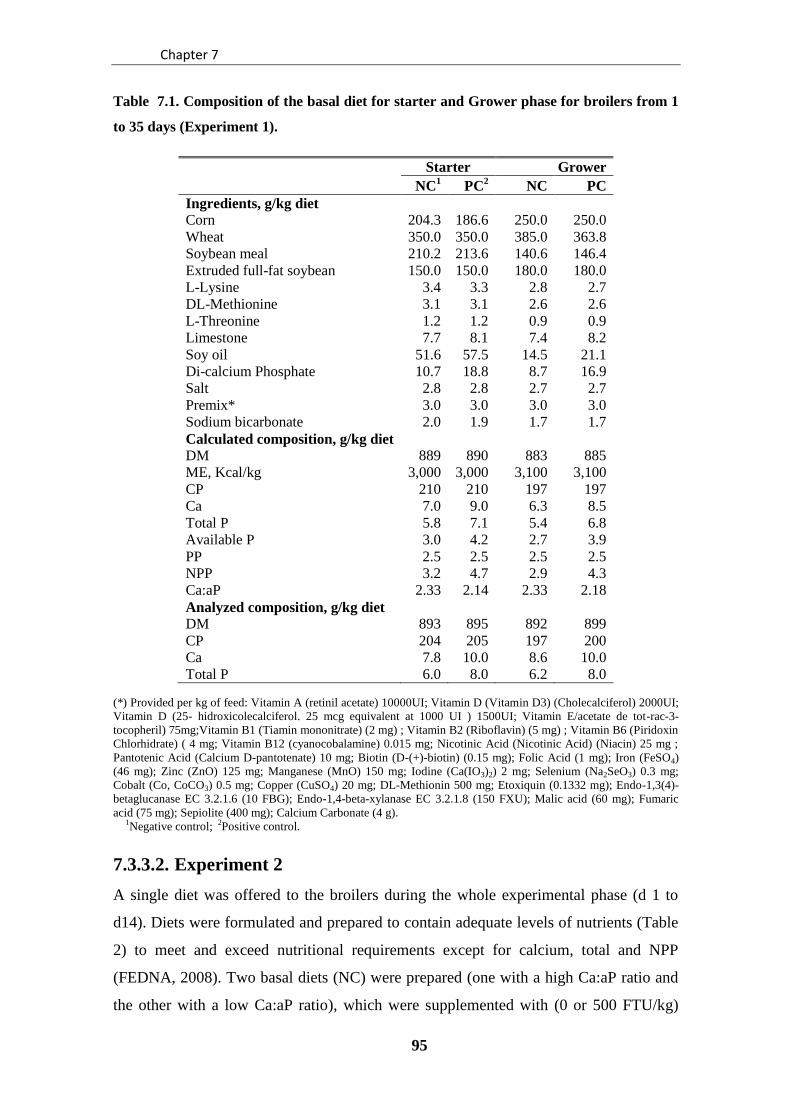
Chapter 7
95
Table 7.1. Composition of the basal diet for starter and Grower phase for broilers from 1
to 35 days (Experiment 1).
Starter Grower
NC1 PC
2 NC PC
Ingredients, g/kg diet
Corn
Wheat
Soybean meal
Extruded full-fat soybean
L-Lysine
DL-Methionine
L-Threonine
Limestone
Soy oil
Di-calcium Phosphate
Salt
Premix*
Sodium bicarbonate
Calculated composition, g/kg diet
DM
ME, Kcal/kg
CP
Ca
Total P
Available P
PP
NPP
Ca:aP
Analyzed composition, g/kg diet
DM
CP
Ca
Total P
204.3
350.0
210.2
150.0
3.4
3.1
1.2
7.7
51.6
10.7
2.8
3.0
2.0
889
3,000
210
7.0
5.8
3.0
2.5
3.2
2.33
893
204
7.8
6.0
186.6
350.0
213.6
150.0
3.3
3.1
1.2
8.1
57.5
18.8
2.8
3.0
1.9
890
3,000
210
9.0
7.1
4.2
2.5
4.7
2.14
895
205
10.0
8.0
250.0
385.0
140.6
180.0
2.8
2.6
0.9
7.4
14.5
8.7
2.7
3.0
1.7
883
3,100
197
6.3
5.4
2.7
2.5
2.9
2.33
892
197
8.6
6.2
250.0
363.8
146.4
180.0
2.7
2.6
0.9
8.2
21.1
16.9
2.7
3.0
1.7
885
3,100
197
8.5
6.8
3.9
2.5
4.3
2.18
899
200
10.0
8.0
(*) Provided per kg of feed: Vitamin A (retinil acetate) 10000UI; Vitamin D (Vitamin D3) (Cholecalciferol) 2000UI;
Vitamin D (25- hidroxicolecalciferol. 25 mcg equivalent at 1000 UI ) 1500UI; Vitamin E/acetate de tot-rac-3-
tocopheril) 75mg;Vitamin B1 (Tiamin mononitrate) (2 mg) ; Vitamin B2 (Riboflavin) (5 mg) ; Vitamin B6 (Piridoxin
Chlorhidrate) ( 4 mg; Vitamin B12 (cyanocobalamine) 0.015 mg; Nicotinic Acid (Nicotinic Acid) (Niacin) 25 mg ;
Pantotenic Acid (Calcium D-pantotenate) 10 mg; Biotin (D-(+)-biotin) (0.15 mg); Folic Acid (1 mg); Iron (FeSO4)
(46 mg); Zinc (ZnO) 125 mg; Manganese (MnO) 150 mg; Iodine (Ca(IO3)2) 2 mg; Selenium (Na2SeO3) 0.3 mg;
Cobalt (Co, CoCO3) 0.5 mg; Copper (CuSO4) 20 mg; DL-Methionin 500 mg; Etoxiquin (0.1332 mg); Endo-1,3(4)-
betaglucanase EC 3.2.1.6 (10 FBG); Endo-1,4-beta-xylanase EC 3.2.1.8 (150 FXU); Malic acid (60 mg); Fumaric
acid (75 mg); Sepiolite (400 mg); Calcium Carbonate (4 g).
1Negative control; 2Positive control.
7.3.3.2. Experiment 2
A single diet was offered to the broilers during the whole experimental phase (d 1 to
d14). Diets were formulated and prepared to contain adequate levels of nutrients (Table
2) to meet and exceed nutritional requirements except for calcium, total and NPP
(FEDNA, 2008). Two basal diets (NC) were prepared (one with a high Ca:aP ratio and
the other with a low Ca:aP ratio), which were supplemented with (0 or 500 FTU/kg)

Microbial phytases, calcium and phosphorus level in Broilers chickens
96
from 4 different commercial phytases (phytase A, B, C and D) in a 2 x 5 factorial
arrangement from d 1 to 14 d of age. The ingredient composition and nutrient
specifications of diets are presented in Table 7.2. To formulate the precise phytase
activities in feed, the commercial products were previously analyzed for their enzymatic
activities (pH 5.5, 37 ºC, and 5 mmol/L sodium phytate) and the doses to be included
were calculated to reach 500 FTU/kg. All of the diets were presented in mash form.
Diets were supplemented with titanium dioxide (TiO2) as an indigestible marker. Feed
was provided ad libitum and water was freely available.
Table 7.2. Composition of the basal diet for broilers from 1 to 14 days (Experiment 2).
(*)Provided per kg of feed: Vitamin A (retinil acetate) 10000UI; Vitamin D (Vitamin D3) (Cholecalciferol) 2000UI;
Vitamin D (25- hidroxicolecalciferol. 25 mcg equivalent at 1000 UI ) 1500UI; Vitamin E/acetate de tot-rac-3-
tocopheril) 75mg;Vitamin B1 (Tiamin mononitrate) (2 mg) ; Vitamin B2 (Riboflavin) (5 mg) ; Vitamin B6 (Piridoxin
Chlorhidrate) ( 4 mg; Vitamin B12 (cyanocobalamine) 0.015 mg; Nicotinic Acid (Nicotinic Acid) (Niacin) 25 mg ;
Pantotenic Acid (Calcium D-pantotenate) 10 mg; Biotin (D-(+)-biotin) (0.15 mg); Folic Acid (1 mg); Iron (FeSO4)
(46 mg); Zinc (ZnO) 125 mg; Manganese (MnO) 150 mg; Iodine (Ca(IO3)2) 2 mg; Selenium (Na2SeO3) 0.3 mg;
Cobalt (Co, CoCO3) 0.5 mg; Copper (CuSO4) 20 mg; DL-Methionin 500 mg; Etoxiquin (0.1332 mg); Endo-1,3(4)-
betaglucanase EC 3.2.1.6 (10 FBG); Endo-1,4-beta-xylanase EC 3.2.1.8 (150 FXU); Malic acid (60 mg); Fumaric
acid (75 mg); Sepiolite (400 mg); Calcium Carbonate (4 g).
Treatment Low Ca:aP High Ca:aP
Ingredients, g/kg diet
Corn
Wheat
Soybean meal
Extruded full-fat soybean
L-Lysine
DL-Methionine
L-Threonine
Limestone
Soybean oil
Di-calcium Phosphate
Salt
Premix*
Sodium bicarbonate
Calculated composition, g/kg diet
DM
ME, (Kcal/kg)
CP
Ca
Total P
Available P
PP
NPP
Ca:aP
Analyzed composition , g/kg diet
DM
CP
Ca
Total P
204.3
350.0
210.2
150.0
3.4
3.1
1.2
7.7
51.6
10.7
2.8
3.0
2.0
888.5
3,000
210.0
7.0
5.8
3.0
2.5
3.3
2.33
894.0
201.0
8.5
6.3
193.4
350.0
212.3
150.0
3.4
3.1
1.2
12.9
55.2
10.7
2.8
3.0
1.9
880.7
3,000
210.0
9.0
5.7
3.0
2.5
3.2
3.00
895.0
201.0
9.4
6.8
Chapter 7
97
7.3.4. Management of birds
7.3.4.1. Experiment 1
A total of 160 one-day-old Cobb 500 male broilers were obtained from a
commercial hatchery. The birds were individually weighed and distributed to 40 cages
with 4 chicks each in a 3 floor battery brooder unit located in the same environmental
controlled room. The five dietary treatments were replicated 8 times. The brooder
temperature was maintained at 35ºC from d 1 to d 4 post-hatch, and was progressively
reduced to 25ºC from d 14 to d 35. The light cycle was 24h/d from d 1 to d 2, 23h/d
from d 3 to d 10, and 18h/day from d 11 to d 35.
7.3.4.2. Experiment 2
A total of 300 one-day-old Cobb 500 broiler male chickens were individually
weighed and randomly distributed into 10 experimental groups with 6 replicate cages
and 5 birds per replicate according to the experimental treatment. These birds share the
same light cycle protocol. The brooder temperature was maintained at a temperature of
35ºC from d 1 to d 4 post-hatch, and was progressively reduced to 25ºC on d 14.
7.3.5. Sample collection and processing
7.3.5.1. Experiment 1
Birds were individually wing-tagged in order to monitor individual BW as well
as the group BW at the start (d1) and d 7, 14, 21, 28 and 35 post-hatch. From these
values the feed intake (FI), weight gain (WG), and gain: feed ratio (G: F) from d 1 to d
21 and from d 21 to d 35 were calculated. On d 35, three birds were euthanized by
cervical dislocation, and the left tibia was collected for bone-ash determination, ileal
samples were collected to determine P ileal digestibility and total excreta were also
collected from d 33 to 35 d to determine P retention.
7.3.5.2. Experiment 2
Birds were individually wing-tagged in order to monitor individual BW as well
as the group BW at the start (d1) and d 7 and 14 post-hatch. From these values the feed
intake (FI), weight gain (WG), and gain: feed ratio (G: F) from d 1 to d 7 and from d 7
to d 14 were calculated. At the end of the experiment (d 14), the chicks were euthanized
by using the cervical dislocation. Left tibia bones of three animals per cage were
collected for bone-ash determination and ileal samples were also collected to determine
Ca and P ileal digestibility.
Microbial phytases, calcium and phosphorus level in Broilers chickens
98
7.3.6. Laboratory analyses
Representative samples of diets, ileal digesta content and excreta were analysed.
Analytical determinations of feeds were performed according to the methods of AOAC
International (2005): dry matter (Method 934.01), crude protein with Dumas Method
(Method 968.06).
Diets, excreta samples and ileal digesta contents were digested in nitric
perchloric and fluorhydric acid mixture and subsequently concentration of P, Ca and Ti
were determined by inductively coupled plasma-optical emission spectroscopy (ICP-
OES) using optical emission spectrometer optimal 4300DV Perkin-Elmer.
Apparent ileal digestibility coefficients of Ca and P (%) were calculated using
the titanium ratio in the diet and digesta:
Ileal Ca or P Digestibility =1- ([Ti]D/[N]D/[Ti]M/[N]M)
where [Ti]D is the Ti concentration of in the diet, [N]D is the Ca or P
concentration in the diet, [Ti]M is the concentration of Ti in the ileal digesta and [N]M is
the Ca or P content in the ileal digesta.
In feed phytase activity (FTU/Kg) was determined with international standard
method of animal feeding stuffs-determination of phytase activity (ISO 30024).
Bone mineralization was determined by the procedure of Brenes et al., (2003).
The tibias were defatted by a 48h extraction in ethyl ether. They were then dried for 12h
at 110ºC and then ashed overnight at 550ºC to determine ash content.
7.3.7. Statistical Analyses
Data were analyzed as a completely randomized design using the GLM
procedure of SAS software, version 9.2. The statistical model in experiment 1 included
the NC, PC and the level of phytase inclusion in the diet. In experiment 2, data were
analyzed as a 5 x 2 factorial arrangement and included the Ca level, source of phytase
and their interaction. The pen of 5 chicks was considered as the experimental unit. The
results are presented as least square means. Probability was considered significant when
P ≤ 0.05.

Chapter 7
99
7.4. Results
7.4.1. Experiment 1
7.4.1.1. Growth performance
Average body weight (BW), feed intake (FI), weight gain (WG) and Gain:Feed
ratio (G:F) along the experimental period are presented in Table 7.3. Male broiler
receiving the PC diet showed a slightly lower performance than the Cobb standards on d
35 (2,139 g as compared to 2,191). Higher BW and weight gain was observed (P <
0.05) for birds of the PC diet and 1,000 FTU/kg diet as compared to those birds of the
NC supplemented with lower level of phytase (250 FTU/kg and 500 FTU/kg), on d 21
and 35.
Table 7.3. Effect of different levels of dietary phytase on feed intake and growth
performance of broilers from d1 to 351 (Experiment 1).
Treatment BW2(g) FI
3 (g/d) WG
4 (g/d) G: F
5
d 21 d 35 d1-21 d 21-35 d1-21 d 21-35 d1-21 d 21-35
NC6 810
ab 2055
ab 50.4
ab 138.7
bc 36.7
ab 88.9 0.730 0.641
NC+250 FTU/kg 779b 2030
b 46.5
c 137.2
c 35.1
b 89.4 0.756 0.652
NC+500 FTU/kg 771b 1998
b 48.0
bc 136.7
c 34.8
b 87.6 0.727 0.641
NC+1,000FTU/kg 842a 2108
a 49.5
abc 143.9
ab 38.2
a 90.4 0.770 0.628
PC7 842
a 2139
a 51.7
a 148.6
a 38.2
a 92.6 0.737 0.624
SEM 8 20.6 32.4 1.23 2.15 0.98 1.70 0.0127 0.0093
P value 9 0.047 0.026 0.041 0.001 0.047 0.315 0.096 0.227
1 Data are means of 8 pens with 4 chicks each. 2 Body weight. 3 Average daily feed intake. 4Average daily weight
gain. 5 Gain:Feed ratio. 6 NC, Negative control. 7PC, Positive control 8 SEM: Standard error of the mean. 9 a,b,c Values
in the same column with different letters are significantly different (P<0.05).
7.4.1.2. Bone mineralization and Mineral retention
The effect of phytase supplementation on bone mineralization (tibia weight, and ash
content) and P ileum digestibility on d 35 and P retention from d 33 to 35 is reported in
Table 7.4. Higher tibia weights were observed for the PC and the 1,000 FTU treatments
than the NC, 250 FTU/kg, and 500 FTU/kg treatments. A dose response (P < 0.05) was
observed for the relative contribution of tibia weight to total BW. Birds of the PC and
1,000 FTU groups showed also higher tibia ash (g/tibia) content than birds of the NC,
250 FTU/kg, and 500 FTU/kg treatments. However, no differences were observed
among treatments in terms of tibia ash concentration (%). A higher P retention (P<
0.001) was observed for animals fed diets with phytase in comparison with PC and NC
diets.
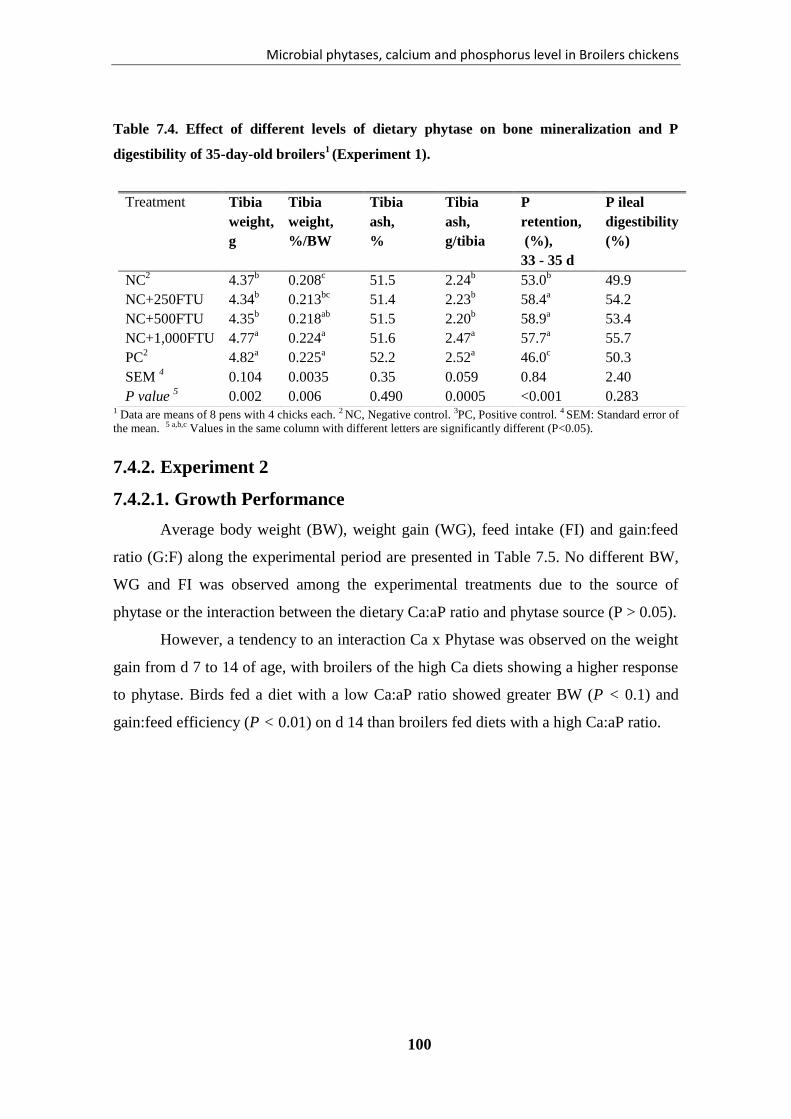
Microbial phytases, calcium and phosphorus level in Broilers chickens
100
Table 7.4. Effect of different levels of dietary phytase on bone mineralization and P
digestibility of 35-day-old broilers1 (Experiment 1).
1 Data are means of 8 pens with 4 chicks each. 2 NC, Negative control. 3PC, Positive control. 4 SEM: Standard error of
the mean. 5 a,b,c Values in the same column with different letters are significantly different (P<0.05).
7.4.2. Experiment 2
7.4.2.1. Growth Performance
Average body weight (BW), weight gain (WG), feed intake (FI) and gain:feed
ratio (G:F) along the experimental period are presented in Table 7.5. No different BW,
WG and FI was observed among the experimental treatments due to the source of
phytase or the interaction between the dietary Ca:aP ratio and phytase source (P > 0.05).
However, a tendency to an interaction Ca x Phytase was observed on the weight
gain from d 7 to 14 of age, with broilers of the high Ca diets showing a higher response
to phytase. Birds fed a diet with a low Ca:aP ratio showed greater BW (P < 0.1) and
gain:feed efficiency (P < 0.01) on d 14 than broilers fed diets with a high Ca:aP ratio.
Treatment Tibia
weight,
g
Tibia
weight,
%/BW
Tibia
ash,
%
Tibia
ash,
g/tibia
P
retention,
(%),
33 - 35 d
P ileal
digestibility
(%)
NC2 4.37
b 0.208
c 51.5 2.24
b 53.0
b 49.9
NC+250FTU 4.34b 0.213
bc 51.4 2.23
b 58.4
a 54.2
NC+500FTU 4.35b 0.218
ab 51.5 2.20
b 58.9
a 53.4
NC+1,000FTU 4.77a 0.224
a 51.6 2.47
a 57.7
a 55.7
PC2 4.82
a 0.225
a 52.2 2.52
a 46.0
c 50.3
SEM 4 0.104 0.0035 0.35 0.059 0.84 2.40
P value 5 0.002 0.006 0.490 0.0005 <0.001 0.283

Chapter 7
101
Table 7.5. Influence of Ca: aP Ratio and types of phytase on feed intake and growth
performance of broilers from d 1 to 141(Experiment 2).
Treatment BW2(g) FI
3(g/d) WG
4 (g/d) G:F
5
d7 d14 d1-7 d7 -14 d1-7 d7 -14 d1-7 d7 -14
Ca:aP
High NC 146 371 16.5 41.8 14.8 32.2 0.896 0.771
A 146 388 16.4 45.8 14.7 34.6 0.895 0.756
B 153 395 17.5 44.5 15.7 34.5 0.901 0.777
C 147 387 16.2 43.9 14.7 34.3 0.911 0.783
D 147 392 16.2 45.8 14.8 35.1 0.915 0.766
Low NC 149 403 16.2 45.4 15.1 36.3 0.936 0.800
A 150 391 16.8 44.3 15.2 34.4 0.908 0.776
B 154 404 16.9 45.1 15.9 35.7 0.945 0.793
C 147 386 15.8 45.4 14.9 34.1 0.942 0.753
D 154 396 16.7 45.2 15.9 34.6 0.951 0.765
Ca:aP High 148 387 16.6 44.4 14.9 34.1 0.904 0.771
Low 151 396 16.5 45.1 15.4 35 0.936 0.777
Phytases NC6 148 387 16.3 43.6 14.9 34.2 0.916 0.785
A 148 389 16.6 45.1 14.9 34.5 0.902 0.766
B 154 399 17.2 44.8 15.8 35.1 0.923 0.785
C 147 386 16 44.6 14.8 34.2 0.927 0.768
D 151 394 16.4 45.5 15.4 34.8 0.933 0.766
SEM 7 4.6 7.6 0.7 1.04 0.65 0.9 0.0178 0.019
P value
Ca:aP 0.288 0.059 0.84 0.29 0.267 0.128 0.006 0.585
Phytases 0.55 0.412 0.566 0.473 0.534 0.848 0.472 0.677
Ca:aP × phytases 0.931 0.227 0.904 0.137 0.936 0.072 0.92 0.578 1 Data are means of 6 pens with 5 chicks each; 2 Body weight; 3Average daily feed intake; 4 Average daily weight
gain. 5 Gain:Feed; 6 Negative control, without phytase; 7 SEM: Standard error of the mean.
7.4.2.2. Bone Mineralization and Mineral Retention
Table 7.6 shows the effects of the Ca:aP ratio and phytase source on bone
mineralization (tibia weight and tibia ash content) of broilers on d 14 of age, and ileal
Ca and P digestibility. The tibia ash weight was greater with low Ca:aP ratio diets as
compared to high Ca:aP ratios. The incorporation of phytase increased the tibia ash
weight as compared to the NC groups. However, no differences were observed among
phytases or on the interaction between Ca and phytase supplementation.
Low Ca:aP ratio diets resulted in an increase of (P < 0.05) ileal digestibility for
Ca and P as compared to diets with high Ca:aP ratios. No significant effects were
Microbial phytases, calcium and phosphorus level in Broilers chickens
102
observed associated to phytase source or the interaction between the Ca:aP ratio and
phytase supplemented sources.
7.5. Discussion
The broiler response to phytase and NPP
It is noteworthy that growth performance of broilers in experiment 1 was lower
than the breed standards for Cobb broilers (Cobb, 2015), and small differences on
performance were observed between NC and PC groups. These responses were likely
due to the birds being housed in cages rather than in floor pens, and in conditions which
could have limited bird response to the studied dietary factors.
However, there was an effect of dietary phytase on growth performance and
bone mineralization when phytase was added at 1,000 FTU/kg but, not at lower doses.
Other authors have also reported a dose response to the release of P from 31% to 58%
(Denbow et al., 1995) and from 14% to 37% (Yi et al., 1996) by the addition of phytase
from 250 FTU/kg to 1,000 FTU/kg. Until recently, a standard phytase dose (500 FTU)
aimed to release 0.15% P (0.12% digestible P for poultry) and a maximum phytase
destruction of 50%-70% (Masey O’Neil et al., 2014). However, nowadays, a new
phytase generation and very high doses (three to four times the standard dose) aim to
attain up to a 90% destruction of phytate (González-Ortiz et al., 2015).
In our trial, a similar response was observed with the novel dietary phytase
(1,000 FTU) and the PC (with a 0.18-0.2% higher analyzed total P content) on BW
gain, tibia weight and P retention. However, feed efficiency was not altered by the
dietary phytase or by the supplementation with inorganic P (positive Control). Similar
response on performance and bone mineralization between both treatments could
indicate an increase on digestible P with the high dose of phytase as reported by
Ravindran et al., (1995). Angel et al. (2001) also reported an equivalency or sparing
effect of 0.09% NPP, when using mono-calcium phosphate as standard, for 500 FTU/kg
of 3-phytase. Mitchell and Edwards (1996) reported that 600 FTU from the same
phytase are equivalent to 0.20% inorganic P from dicalcium phosphate.
Weight gain was also increased (24.2%) and feed efficiency improved (5.9%) in
young broiler chickens at 21 days of age fed diets supplemented with 1,000 FTU/kg
(Olukosi et al. 2013). Previously, Cabahug et al. (1999) also reported that with lower
Chapter 7
103
levels of phytase addition (400 FTU/kg and 800 FTU/kg) to 2.3g/kg NPP diets was
enough for a weight gain increase of 18.8%, 9.0% of feed intake and 7.9% in feed
efficiency in broiler chicks from d 7 to 25 of age. Phytase has been described to increase
the apparent metabolizable energy of diets (Ravindran et al., 2001) and the digestibility
of the dietary protein (Ravindran et al., 1999) while limited the negative impact of
phytic acid, which can form complexes with proteins, cause a reduction in proteolytic
digestion (Hill and Tyler, 1954) and increase endogenous losses (Selle et al., 2007). It
has recently reported that high levels of phytase inclusion promoted three to four points
of improvement in the feed conversion rate (Walk et al., 2014), probably due to the
broke and reduction of phytic acid structure and the provision of inositol which is
considered a growth promoter in broiler chickens. The present study doesn´t provide
evidences of a liley extra-phosphoric effect, nor provide results about the digestibility of
energy or protein. Further studies with specific objectives should clarify the quantitative
contribution of phytase to a likely phosphoric an extra phospohoric effect.
Comparison among Phytases at Different Ca:aP ratio
Lower Ca:aP ratio diets increased bird performance and bone mineralization,
which is in accordance with our previous study (Hamdi et al., 2015), where young
broilers fed diets with a medium level of Ca (7.9 g/kg) and 3.8 g/kg NPP performed
better during the two first week of life than broilers with higher Ca levels (9.6 g/kg) did.
It has been reported that calcium is able to form insoluble soaps with free fatty acids and
bile acids, and there is some evidence that these soaps limit the absorption of fat in vivo
(Gacs and Barltrop, 1977; Govers et al., 1996; Shahkalili et al., 2001). These soaps
could lower the utilization of energy derived from lipids, particularly saturated fats, in
broiler diets. Soluble Ca in the diet may also precipitate phytate by forming Ca-phytate
complexes (Wise, 1983; Tamim et al., 2004), and interact with inorganic P in the gut
(Hurwitz and Bar, 1971), limiting mineral Ca and P absorption (Lonnerdal et al., 1989).
Soluble Ca may also increase intestinal pH and reduce mineral solubility and
availability as reported by Shafey and McDonald (1991). Ca-phytate complexes are
known to precipitate at pHs between 4 and 6, which coincides with pHs of the intestine
where absorption of metal ions takes places (Tamim et al., 2003). Even though Ca has
one of the lowest affinities for phytate (Cu2+
> Zn2+
> Co2+
> Mn2+
> Fe2+
> Ca2+
; Vohra
et al., 1985), it may have the greatest impact, because of its high concentration in the
diet (Tamim et al., 2003). Increasing the level of Ca in broiler diets from 6 to 15 g/kg

Microbial phytases, calcium and phosphorus level in Broilers chickens
104
reduced intestinal phytase activity by 75% (McGuaig et al., 1972), as we hypothesized
in this study. Applegate et al. (2003) reported that 0.90% dietary Ca reduced intestinal
phytase activity by 9% and phytate P hydrolysis by 11.9%, compared with 0.40% Ca
(Powell et al., 2011). Ballam et al. (1985) found that total tract degradation of phytate
by mucosal and microfloral phytases ranged from 0.06 to 0.57, depending on dietary
levels of Ca and NPP. However, Powell et al., (2011) reported that no effects were
observed on phytase activity by increasing the dietary Ca level from 6.7 to 13.3 g/kg.
Table 7.6. Effect of different types of phytase and Ca:aP ratio inclusion on bone
mineralization and mineral digestibility of 14-day-old broilers 1(Experiment 2).
Tibia
Weight,
g
Tibia
Weight,
%/BW
Tibia
ash,
g/Tibia
Ca ileal
digestibility,
(%)
P ileal
digestibility,
(%)
Ca:aP
High NC 0.63 0.170 0.292 64.4 53.3
A 0.67 0.173 0.322 61.8 52.7
B 0.67 0.172 0.325 57.3 53.5
C 0.67 0.174 0.319 58.9 54.2
D 0.67 0.172 0.318 54.3 51.6
Low NC 0.67 0.168 0.324 63.8 54.2
A 0.67 0.173 0.332 64.3 61.2
B 0.70 0.176 0.351 62.9 54.6
C 0.68 0.172 0.337 62.6 54.7
D 0.69 0.172 0.337 63.9 56.7
Ca:aP High 0.66 0.172 0.315 59.4 53.1
Low 0.68 0.172 0.336 63.5 56.3
Phytases NC2 0.65 0.169 0.308
b 64.1 53.8
A 0.67 0.173 0.326a 63.1 57
B 0.69 0.174 0.338a 60.1 54
C 0.67 0.173 0.328a 60.8 54.5
D 0.68 0.172 0.327a 59.1 54.2
SEM 3 0.015 0.0030 0.0072 2.77 2.23
P value 4
Ca:aP 0.068 0.986 <.0001 0.015 0.037
Phytases 0.156 0.451 0.003 0.281 0.688
Ca:aP × phytases
0.626 0.906 0.635 0.385 0.409
1 Data are means of 6 pens with 5 chicks each. 2 Negative control, without phytase. 3 SEM: Standard error of the
mean. 4 a,b,c Values in the same column with different letters are significantly different (P<0.05).
In the present study, no interactions were observed between the Ca:aP ratio and
dietary phytase. In contrast, additive responses were achieved on bone mineralization
after a supplementation with lower levels of Ca and a phytase supplementation. A likely
explanation could be the short period of study and the small differences tested on the
two levels of Ca (7.0 g/Kg and 9.0 g/Kg Ca). However, the nature of this relationship is
Chapter 7
105
still unclear (Powell et al., 2011). Some authors, such as Qian et al. (1997), reported
that increasing Ca decreases microbial phytase activity and Sebastian et al. (1996)
reported the best phytase efficacy when supplemented in corn-soy diets containing 0.6%
Ca, as compared with those containing 1% Ca. In contrast, Driver et al. (2005) observed
that growth and bone response to phytase was greatest with high Ca levels (from 0.38%
to 0.98%), and these responses decreased when Ca was reduced and NPP was increased.
Powell et al. (2011) also concluded that the use of 6-Phytase increased growth
and bone responses more as the levels of Ca were higher in the diet, indicating that high
levels of dietary Ca (1.0% and 1.33%) did not have a negative impact on 6-phytase
efficacy. Recently, Akter et al., 2016 provided results which could rise the existence of
a triple interaction, Ca (6, 8, 10 g/kg) x NPP (3, 4 g/kg) x phytase (0, 500 U). While
with high Ca diets, phytase gave the highest response in low NPP diets (3 g NPP/kg),
which it indicates an increase on P availability; the response in low Ca diets to phytase
was higher with the high NPP content (4 g NPP/kg), which it likely indicates also a
release of Ca from the mineral Ca complex. It could be suggested that although
reducing dietary Ca may promote growth performance and P availability, such a
reduction must be carried out with care given that Ca reduction could in turn limit bone
mineralization. It has been assumed that 5.1 atoms Ca are bound by one phytate
molecule (Nelson, 1984), then a complete hydrolyses of phytate (1% in the diet) may
liberate up to 3.6 g/kg Ca, allowing for significant reductions in dietary Ca without
influencing broiler performance and bone ash.
In our experiment, growth performance for broilers from d 1 to 14 were not
influenced by the type of phytase; A, B, and C being 6-phytases, and phytase D was a 3-
phytase. Four Phytase from bacterial or fungal origin were used in this study. On the
basis of the carbon in the myo-inositol ring of phytate at which hydrolyses initiate, three
commercial phytases were 6-phytase (A, B and C) and one was 3-phytase (D).
Differences among phytases were also declared in relation to pH range of
optimal activity or temperature optima. However, not many studies are available in the
literature comparing different types of phytases, in direct feeding studies. According to
Payne et al. (2005), 6-phytases would completely dephosphorylate the phytate
molecule, while 3-phytases would not do it due to their respective initiation sites
(Wodzinski and Ullah, 1996). Thus, Sands et al. (2003) reported that while broilers fed
diets supplemented with 250 FTU/kg of 6-phytase achieved similar BWG and FCE as

Microbial phytases, calcium and phosphorus level in Broilers chickens
106
did those fed a PC diet, a higher dose of 3-phytase (750 FTU/kg) was required to
achieve a similar response. However, Juin et al. (2001) reported no differences in body
weight of male turkeys fed a 3- vs 6-phytase added at 250 and 500 FTU/Kg. Payne et
al. (2005) also compared two commercial phytases, 3-phytase and 6-phytase
supplemented from 100 to 300 FTU, and found that WG and FI increased linearly in
broilers regardless the phytase source. We were not able to observe differences among
phytase products at low levels of phytase (500 FTU/kg), however further studies should
be performed to evaluate differences at higher concentrations, including overdoses of
phytase in the diets.
It can be concluded that high levels of phytase (1,000 FTU/kg) may be
required to enhance performance and bone mineralization in growing broilers fed on
low NPP diets. The results showed that lowering Ca level may have a higher effect on
performance and P ileum digestibility than low levels of phytase (500 FTU/kg).
Consequently, caution is recommended to keep dietary Ca at moderate levels at least
during the first weeks of growth. The results don´t confirm the detrimental effect of
high dietary Ca:aP ratio on phytase activity and subsequent growth and bone
performance of starting broilers (d 14). In contrast, lowering Ca levels and phytase
(500 FTU/kg) improved bone mineralization in an additive way. Further studies
should be performed in order to decide the best dietary levels incorporation of
calcium and phytase in the diets to improve growth performance and bone
mineralization in broilers.

Chapter 8
107
CHAPTER 8
Including copper sulfate or dicopper oxide
in the diet up to 300 mg Cu/kg affects
performance and copper accumulation in
broiler chickens
Copper sulfate and dicopper oxide in in broiler chickens
108
Including copper sulfate or dicopper oxide in the diet up to 300 mg
Cu/kg affects performance and copper accumulation in broiler
chickens
M. Hamdi1, D. Solà-Oriol
1, R. Franco-Rosselló
1, S. Durosoy
2, A. Roméo
2 and J.F.
Pérez1
1Animal Nutrition and Welfare Service (SNiBA). Departament de Ciència Animal i dels
Aliments. Universitat Autònoma de Barcelona, 08193 Bellaterra, Spain
2 ANIMINE, 74330 Sillingy, France
Submitted to Poultry Science
Chapter 8
109
8.1. Abstract
Copper supplementation (125 to 250 ppm) in poultry diets is a common practice
in many non-EU countries to enhance bird health, but high amounts of Cu may interact
with phytate and affect animal performance. The effects could depend on the nature of
the Cu source. Thus, the objective of this trial is to compare the effects of two sources
of Cu, copper sulfate (CuSO4) and dicopper oxide (Cu2O, CoRouge®
), at three levels of
dietary Cu (15, 150, 300 ppm). A total of 576 one-day-old male broiler (Ross 308) were
distributed into 6 experimental groups (8 pens/treatment, with 12 birds/pen). Body
weight (BW) and feed intake (FI) were recorded weekly. On d 35 post-hatch, one bird
per replicate was euthanized, the skin fat and breast muscle were sampled, and the liver
and kidneys were collected. The two Cu sources were also evaluated in vitro to measure
Cu and phytic phosphorus (PP) solubility, and PP hydrolysis by phytase at pH 2.5, 4.5
and 6.5. The use of 300 ppm of CuSO4 decreased (P = 0.001) BW on d 14, 28 and 35
and increased (P = 0.04) liver Cu content in comparison with the use of 300 ppm of
Cu2O. The feed-conversion ratio increased for broilers of the 300 ppm CuSO4 group in
comparison to the 300 ppm Cu2O group (2.19 vs. 1.84, P < 0.001). The use of the
highest level of Cu (300 ppm), either of Cu2O or CuSO4, also increased (P < 0.001) Cu
concentration in kidney and breast muscle in comparison, to 15 and 150 ppm. In the in
vitro trial, including a level of 300 ppm of CuSO4, reduced PP solubility (68.66%) in
comparison to Cu2O (97.41%), and reduced PP hydrolysis by phytase at pH 4.5 and 6.5
with both sources. It can be concluded that dietary levels of 150 and 300 ppm Cu of
Cu2O are adequate to ensure broiler growth performance and limit organ accumulation
in comparison to CuSO4.
Copper sulfate and dicopper oxide in in broiler chickens
110
8.2. Introduction
Broiler chickens need copper for iron transport and metabolism, red-blood-cell
formation, enzyme-coenzyme catalytic reactions, immune and connective tissue
maturation, especially in the cardiovascular system (Jegede et al., 2011) and bones
(Banks et al., 2004a). Copper is also part of the linkage between elastin and collagen,
which gives the bone its tensile strength (Carlton and Henderson, 1964). Cu
requirements for broilers chickens at different ages were reported as being 5-8 mg/Kg
according to NRC (1994) and 3-10 mg/Kg according to FEDNA (2008). In the
European Union (EU), dietary copper is supplied for poultry up to a maximum of 25 mg
Cu/Kg (EFSA, 2012). However, in other areas of the world, including USA, the poultry
industry includes 125 ppm to 250 ppm Cu in the diets as growth promoters (Pesti and
Bakalli, 1996). The mechanisms behind these effects are attributed to the bactericidal
and bacteriostatic effects of Cu on the gastrointestinal tract´s microbiota (Hawbaker et
al., 1961; Bunch et al., 1965; Pang and Applegate, 2007) and growth-promoting effects
(Pesti and Bakalli, 1996). Copper has become especially useful since the use of
antibiotics as growth promotors has been prohibited over the last 50 years.
However, therapeutic doses of copper, which are usually, included in poultry
feeds as inorganic mineral salts (copper sulfate pentahydrate), are mostly excreted in the
faeces and are a cause of environmental concerns. The high doses of Cu may also easily
chelate phytate (Cheryan, 1980), the major storage form of phosphorus in plant seeds
(Tamim and Angel, 2003). The solubility of these complexes depends on pH (Selle and
Ravindran, 2007), the complexes being precipitated at pH 6.5 (approximate pH of
intestine) and non-accessible for hydrolysis by phytase or absorption in the intestine
(Pang and Applegate, 2006).
Copper sulfate pentahydrate (CuSO45H2O) is the most commonly used source of
Cu as a dietary supplement for poultry (Pesti and Bakalli, 1996; Pang and Applegate,
2006). It is very soluble in both water and acidic solvents, and has normally been used
as a reference point to compare the bio-availability of various Cu sources (Pang and
Applegate, 2006). Other Cu sources are being used and considered for use by poultry
producers. They have different relative bio-availability and solubility, so they might
differently affect intestinal microbiota (Pang et al., 2009) and PP hydrolysis (Banks et
al., 2004b). The term “copper oxide” is used to refer to either cupric oxide (CuO) or
cuprous oxide (Cu2O), both oxides occur in nature, but the industrial production of
Chapter 8
111
Cu2O requires an extra step of furnace reduction (The Merck Index, 1990; Aoyagi and
Baker, 1993). Oxides of Cu are used to supply chicks feed because smaller inclusion
rates are needed with CuO (80% Cu) and Cu2O (89%Cu), as compared to CuSO45H2O
(25% Cu, Baker, 1991). There is a difference in copper bio-availability due to its
valence form. Cupric oxide (CuO) has zero bio-availability, when compared with
cuprous oxide (dicopper oxide; Cu2O), which is 100% available in animals (Baker,
1999).
In the present study we have hypothesized that therapeutic doses of dicopper
oxide can be included in the diet without affecting PP hydrolysis and broiler
performance. Thus, the objective of the current work is to compare the effect of copper
sulfate , the most commonly used Cu source for supplementation in poultry diet, and
dicopper oxide (Cu2O; CoRouge®
) at 3 levels of dietary Cu (15 ppm, 150 ppm, 300
ppm) in the diets on broiler chicken performance, mineral interactions in the digesta,
and mineral accumulation in organs and tissues. An in vitro trial has also been designed
to compare the solubility of both sources and to identify likely interactions with the
phytic phosphorus (PP) and phytase hydrolysis.
8.3. Materials and methods
The experimental products under study were two different Cu sources: Copper
Sulfate (CuSO4) containing 24.1% Cu, and Copper oxide (Cu2O, CoRouge®, produced
by ANIMINE) containing 75.4% Cu.
8.3.1. In vivo Trial
8.3.1.1. Bird Management and Husbandry
All animal experimentation procedures used in the experiments were approved
by the animal Ethics Committee of the Universitat Autònoma de Barcelona and were in
compliance with the European Union guidelines for the care and use of animals in
research (European Parliament, 2010).
The study was carried out at a commercial growing poultry unit (Vila-rodona,
Tarragona, Spain). The room was provided with 48 floor pens (4 lines of 12 pens each,
divided by a central feeding aisle). A total of 576 one-day-old broiler male chickens
(Ross 308) were randomly distributed into 6 experimental groups/treatments (8

Copper sulfate and dicopper oxide in in broiler chickens
112
pens/treatment, 12 birds/pen, 10.6 birds/m2) according to initial body weight and
continuously controlled over a period of 35 days.
Brooder temperature was maintained at 35ºC from d 1 to d 4 post-hatch, and was
progressively reduced to 25ºC from d 14 to d 35. The light cycle was 24h/d from d 1 to
d 2, 23h/d from d 3 to d 10, and 18h/day from d 11 to d 35.
8.3.1.2. Experimental design and diets
Three different diets (starter, growing and finishing) were formulated to meet the
requirements for maintenance and growth (FEDNA, 2008) and offered to the broilers
from d 1 to 14, from d 14 to 28, and from d 28 to d 35. The six experimental treatments
were prepared according to two different Cu sources (Cu2O and CuSO4) at 3 levels of
inclusion (15 ppm, 150 ppm, 300 ppm Cu). Feed and water were offered ad libitum. All
of the diets were presented in mash form. Diets were sampled and stored for their
subsequent analysis.
Body weight (BW) was individually monitored at the start and at the end of each
phase (d 1, d14, d 28 and d 35) and feed disappearance was registered by pen in order to
calculate average daily feed intake (FI), weight gain (WG) and feed conversion ratio
(FCR). Mortality rate was also monitored. At the end of the experiment (d 35), one
bird/pen (n=8) was euthanized by cervical dislocation, tissue (fat and breast muscle) and
organ samples (liver and kidney) were collected and weighed to determine Cu content.
Ileal digesta were collected in the region from Meckel’s diverticulum to about 2 cm
anterior to the ileo-cecal junction and stored at -20ºC to determine mineral and micro-
mineral content.
8.3.1.3. Laboratory Analyses
The Cu content was analyzed in the basal diet, in both Cu sources, and before
and after the experimental diets´ preparation in order to confirm the adequacy of Cu
dosage. Mineral concentration (Ca, P, Fe, Cu, Zn and Mn ) was also analyzed in the
supernatant and precipitate of ileum digesta centrifuged at 6,000 x g for 15 min, and in
tissues and organs (liver, kidney, and muscle (breast muscle)). All mineral contents in
samples were analyzed using Inductively Coupled Plasma Optical Emission
Spectroscopy (ICP-OES, model Optima 4300DV, PerkinElmer Inc.; Waltham, MA).
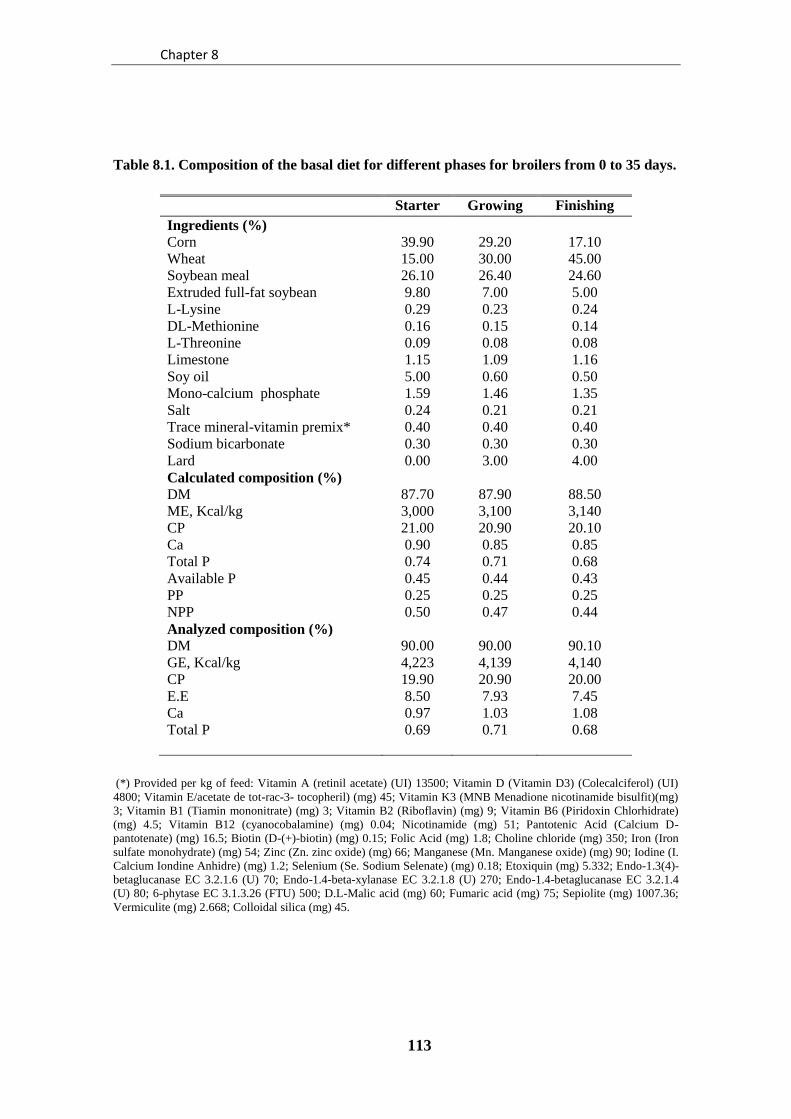
Chapter 8
113
Table 8.1. Composition of the basal diet for different phases for broilers from 0 to 35 days.
Starter Growing Finishing
Ingredients (%)
Corn
Wheat
Soybean meal
Extruded full-fat soybean
L-Lysine
DL-Methionine
L-Threonine
Limestone
Soy oil
Mono-calcium phosphate
Salt
Trace mineral-vitamin premix*
Sodium bicarbonate
Lard
Calculated composition (%)
DM
ME, Kcal/kg
CP
Ca
Total P
Available P
PP
NPP
Analyzed composition (%)
DM
GE, Kcal/kg
CP
E.E
Ca
Total P
39.90
15.00
26.10
9.80
0.29
0.16
0.09
1.15
5.00
1.59
0.24
0.40
0.30
0.00
87.70
3,000
21.00
0.90
0.74
0.45
0.25
0.50
90.00
4,223
19.90
8.50
0.97
0.69
29.20
30.00
26.40
7.00
0.23
0.15
0.08
1.09
0.60
1.46
0.21
0.40
0.30
3.00
87.90
3,100
20.90
0.85
0.71
0.44
0.25
0.47
90.00
4,139
20.90
7.93
1.03
0.71
17.10
45.00
24.60
5.00
0.24
0.14
0.08
1.16
0.50
1.35
0.21
0.40
0.30
4.00
88.50
3,140
20.10
0.85
0.68
0.43
0.25
0.44
90.10
4,140
20.00
7.45
1.08
0.68
(*) Provided per kg of feed: Vitamin A (retinil acetate) (UI) 13500; Vitamin D (Vitamin D3) (Colecalciferol) (UI)
4800; Vitamin E/acetate de tot-rac-3- tocopheril) (mg) 45; Vitamin K3 (MNB Menadione nicotinamide bisulfit)(mg)
3; Vitamin B1 (Tiamin mononitrate) (mg) 3; Vitamin B2 (Riboflavin) (mg) 9; Vitamin B6 (Piridoxin Chlorhidrate)
(mg) 4.5; Vitamin B12 (cyanocobalamine) (mg) 0.04; Nicotinamide (mg) 51; Pantotenic Acid (Calcium D-
pantotenate) (mg) 16.5; Biotin (D-(+)-biotin) (mg) 0.15; Folic Acid (mg) 1.8; Choline chloride (mg) 350; Iron (Iron
sulfate monohydrate) (mg) 54; Zinc (Zn. zinc oxide) (mg) 66; Manganese (Mn. Manganese oxide) (mg) 90; Iodine (I.
Calcium Iondine Anhidre) (mg) 1.2; Selenium (Se. Sodium Selenate) (mg) 0.18; Etoxiquin (mg) 5.332; Endo-1.3(4)-
betaglucanase EC 3.2.1.6 (U) 70; Endo-1.4-beta-xylanase EC 3.2.1.8 (U) 270; Endo-1.4-betaglucanase EC 3.2.1.4
(U) 80; 6-phytase EC 3.1.3.26 (FTU) 500; D.L-Malic acid (mg) 60; Fumaric acid (mg) 75; Sepiolite (mg) 1007.36;
Vermiculite (mg) 2.668; Colloidal silica (mg) 45.
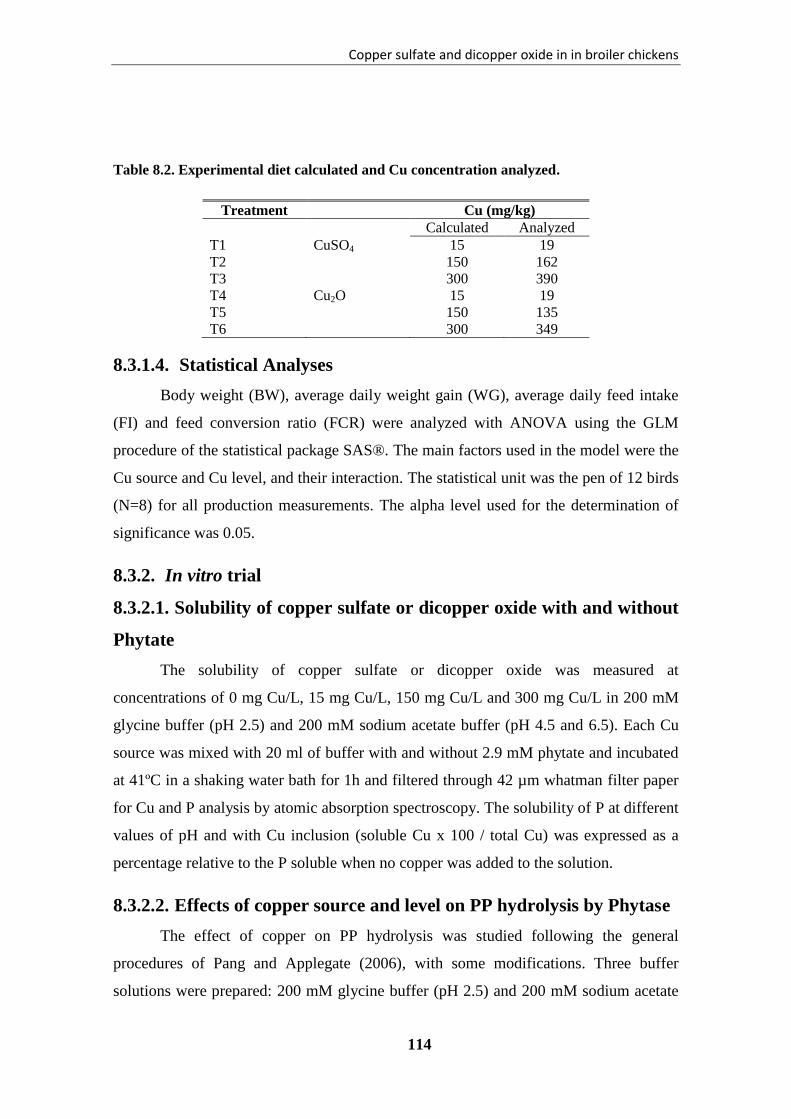
Copper sulfate and dicopper oxide in in broiler chickens
114
Table 8.2. Experimental diet calculated and Cu concentration analyzed.
8.3.1.4. Statistical Analyses
Body weight (BW), average daily weight gain (WG), average daily feed intake
(FI) and feed conversion ratio (FCR) were analyzed with ANOVA using the GLM
procedure of the statistical package SAS®. The main factors used in the model were the
Cu source and Cu level, and their interaction. The statistical unit was the pen of 12 birds
(N=8) for all production measurements. The alpha level used for the determination of
significance was 0.05.
8.3.2. In vitro trial
8.3.2.1. Solubility of copper sulfate or dicopper oxide with and without
Phytate
The solubility of copper sulfate or dicopper oxide was measured at
concentrations of 0 mg Cu/L, 15 mg Cu/L, 150 mg Cu/L and 300 mg Cu/L in 200 mM
glycine buffer (pH 2.5) and 200 mM sodium acetate buffer (pH 4.5 and 6.5). Each Cu
source was mixed with 20 ml of buffer with and without 2.9 mM phytate and incubated
at 41ºC in a shaking water bath for 1h and filtered through 42 µm whatman filter paper
for Cu and P analysis by atomic absorption spectroscopy. The solubility of P at different
values of pH and with Cu inclusion (soluble Cu x 100 / total Cu) was expressed as a
percentage relative to the P soluble when no copper was added to the solution.
8.3.2.2. Effects of copper source and level on PP hydrolysis by Phytase
The effect of copper on PP hydrolysis was studied following the general
procedures of Pang and Applegate (2006), with some modifications. Three buffer
solutions were prepared: 200 mM glycine buffer (pH 2.5) and 200 mM sodium acetate
Treatment Cu (mg/kg)
Calculated Analyzed
T1 CuSO4 15 19
T2 150 162
T3 300 390
T4 Cu2O 15 19
T5 150 135
T6 300 349
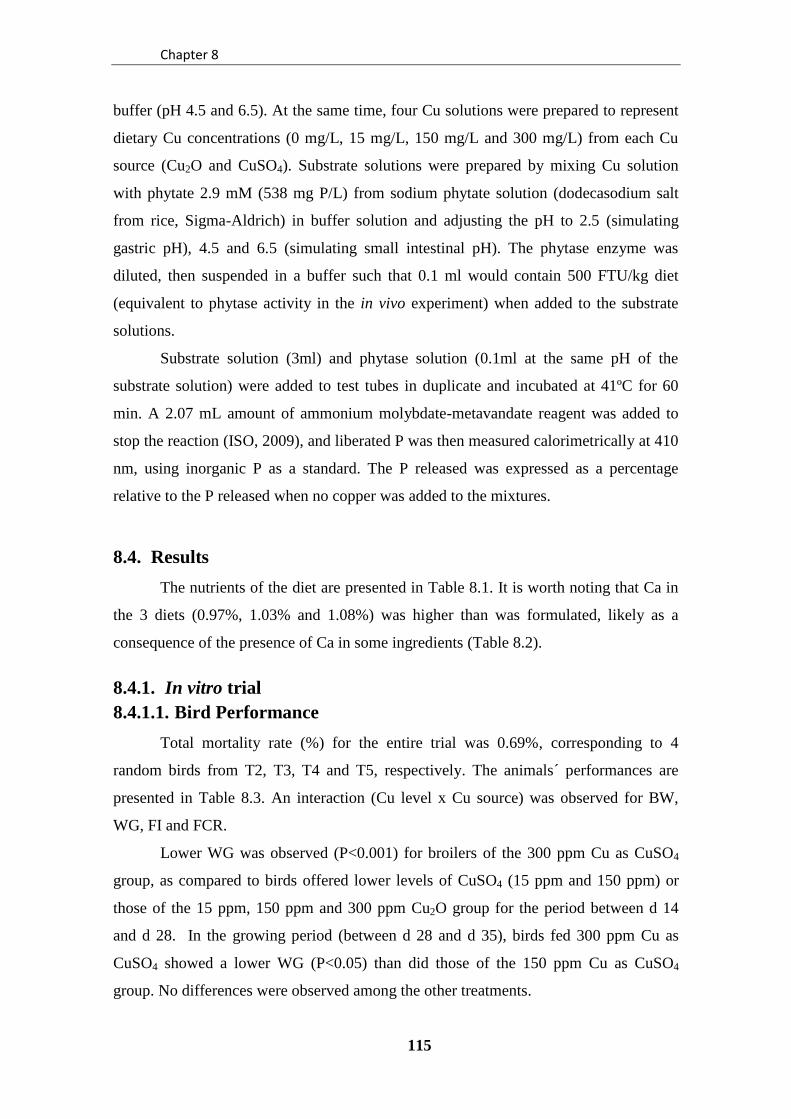
Chapter 8
115
buffer (pH 4.5 and 6.5). At the same time, four Cu solutions were prepared to represent
dietary Cu concentrations (0 mg/L, 15 mg/L, 150 mg/L and 300 mg/L) from each Cu
source (Cu2O and CuSO4). Substrate solutions were prepared by mixing Cu solution
with phytate 2.9 mM (538 mg P/L) from sodium phytate solution (dodecasodium salt
from rice, Sigma-Aldrich) in buffer solution and adjusting the pH to 2.5 (simulating
gastric pH), 4.5 and 6.5 (simulating small intestinal pH). The phytase enzyme was
diluted, then suspended in a buffer such that 0.1 ml would contain 500 FTU/kg diet
(equivalent to phytase activity in the in vivo experiment) when added to the substrate
solutions.
Substrate solution (3ml) and phytase solution (0.1ml at the same pH of the
substrate solution) were added to test tubes in duplicate and incubated at 41ºC for 60
min. A 2.07 mL amount of ammonium molybdate-metavandate reagent was added to
stop the reaction (ISO, 2009), and liberated P was then measured calorimetrically at 410
nm, using inorganic P as a standard. The P released was expressed as a percentage
relative to the P released when no copper was added to the mixtures.
8.4. Results
The nutrients of the diet are presented in Table 8.1. It is worth noting that Ca in
the 3 diets (0.97%, 1.03% and 1.08%) was higher than was formulated, likely as a
consequence of the presence of Ca in some ingredients (Table 8.2).
8.4.1. In vitro trial
8.4.1.1. Bird Performance
Total mortality rate (%) for the entire trial was 0.69%, corresponding to 4
random birds from T2, T3, T4 and T5, respectively. The animals´ performances are
presented in Table 8.3. An interaction (Cu level x Cu source) was observed for BW,
WG, FI and FCR.
Lower WG was observed (P<0.001) for broilers of the 300 ppm Cu as CuSO4
group, as compared to birds offered lower levels of CuSO4 (15 ppm and 150 ppm) or
those of the 15 ppm, 150 ppm and 300 ppm Cu2O group for the period between d 14
and d 28. In the growing period (between d 28 and d 35), birds fed 300 ppm Cu as
CuSO4 showed a lower WG (P<0.05) than did those of the 150 ppm Cu as CuSO4
group. No differences were observed among the other treatments.
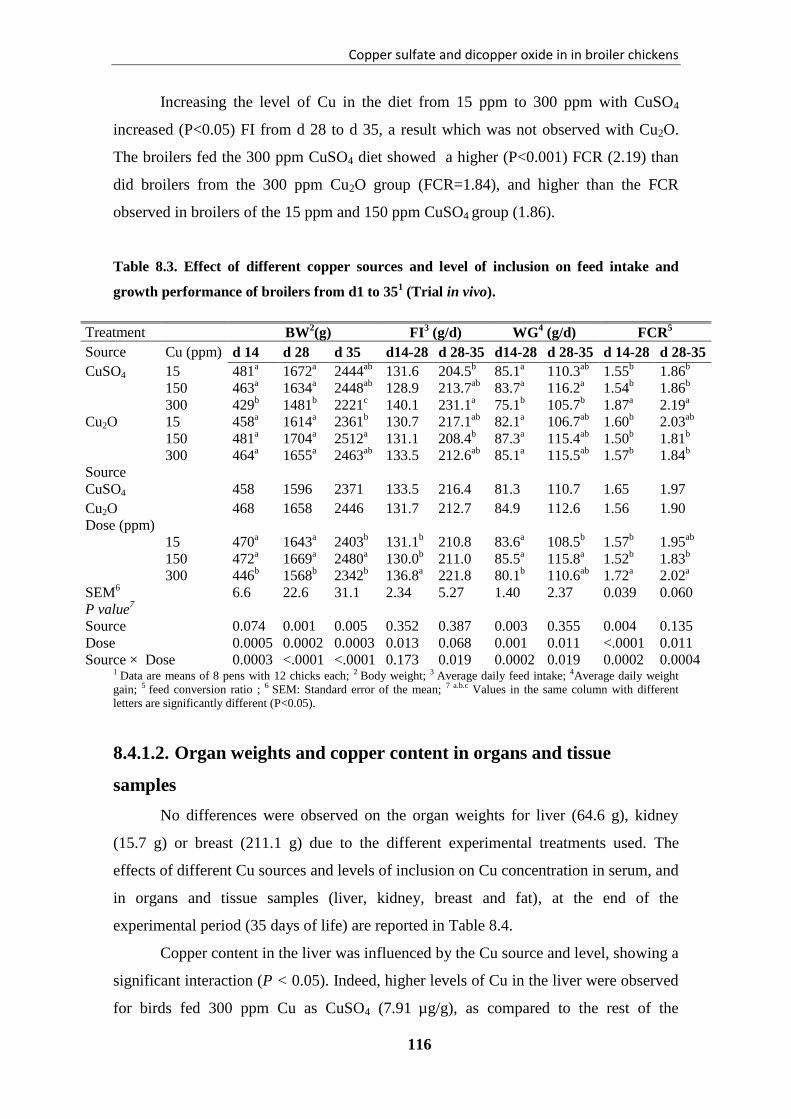
Copper sulfate and dicopper oxide in in broiler chickens
116
Increasing the level of Cu in the diet from 15 ppm to 300 ppm with CuSO4
increased (P<0.05) FI from d 28 to d 35, a result which was not observed with Cu2O.
The broilers fed the 300 ppm CuSO4 diet showed a higher (P<0.001) FCR (2.19) than
did broilers from the 300 ppm Cu2O group (FCR=1.84), and higher than the FCR
observed in broilers of the 15 ppm and 150 ppm CuSO4 group (1.86).
Table 8.3. Effect of different copper sources and level of inclusion on feed intake and
growth performance of broilers from d1 to 351 (Trial in vivo).
1 Data are means of 8 pens with 12 chicks each; 2 Body weight; 3 Average daily feed intake; 4Average daily weight
gain; 5 feed conversion ratio ; 6 SEM: Standard error of the mean; 7 a.b.c Values in the same column with different
letters are significantly different (P<0.05).
8.4.1.2. Organ weights and copper content in organs and tissue
samples
No differences were observed on the organ weights for liver (64.6 g), kidney
(15.7 g) or breast (211.1 g) due to the different experimental treatments used. The
effects of different Cu sources and levels of inclusion on Cu concentration in serum, and
in organs and tissue samples (liver, kidney, breast and fat), at the end of the
experimental period (35 days of life) are reported in Table 8.4.
Copper content in the liver was influenced by the Cu source and level, showing a
significant interaction (P < 0.05). Indeed, higher levels of Cu in the liver were observed
for birds fed 300 ppm Cu as CuSO4 (7.91 µg/g), as compared to the rest of the
Treatment BW2(g) FI
3 (g/d) WG
4 (g/d) FCR
5
Source Cu (ppm) d 14 d 28 d 35 d14-28 d 28-35 d14-28 d 28-35 d 14-28 d 28-35
CuSO4 15 481a 1672
a 2444
ab 131.6 204.5
b 85.1
a 110.3
ab 1.55
b 1.86
b
150 463a 1634
a 2448
ab 128.9 213.7
ab 83.7
a 116.2
a 1.54
b 1.86
b
300 429b 1481
b 2221
c 140.1 231.1
a 75.1
b 105.7
b 1.87
a 2.19
a
Cu2O 15 458a 1614
a 2361
b 130.7 217.1
ab 82.1
a 106.7
ab 1.60
b 2.03
ab
150 481a 1704
a 2512
a 131.1 208.4
b 87.3
a 115.4
ab 1.50
b 1.81
b
300 464a 1655
a 2463
ab 133.5 212.6
ab 85.1
a 115.5
ab 1.57
b 1.84
b
Source
CuSO4
458 1596 2371 133.5 216.4 81.3 110.7 1.65 1.97
Cu2O
468 1658 2446 131.7 212.7 84.9 112.6 1.56 1.90
Dose (ppm)
15 470a 1643
a 2403
b 131.1
b 210.8 83.6
a 108.5
b 1.57
b 1.95
ab
150 472a 1669
a 2480
a 130.0
b 211.0 85.5
a 115.8
a 1.52
b 1.83
b
300 446b 1568
b 2342
b 136.8
a 221.8 80.1
b 110.6
ab 1.72
a 2.02
a
SEM6
6.6 22.6 31.1 2.34 5.27 1.40 2.37 0.039 0.060
P value7
Source
0.074 0.001 0.005 0.352 0.387 0.003 0.355 0.004 0.135
Dose
0.0005 0.0002 0.0003 0.013 0.068 0.001 0.011 <.0001 0.011
Source × Dose 0.0003 <.0001 <.0001 0.173 0.019 0.0002 0.019 0.0002 0.0004

Chapter 8
117
experimental treatments (< 4.63 µg/g). No source x dose interactions were observed in
the rest of organs and tissues. High doses (300ppm) of copper with both sources
increased (P < 0.01) Cu concentration in the kidney (2.17 µg/g) and breast (0.50 µg/g)
in comparison to broilers fed the 15 ppm (1.95 µg/g and 0.32 µg/g, respectively) and
150 ppm (1.98 µg/g and 0.37 µg/g, respectively) amounts. Copper also tended (P =
0.074) to increase the concentration in the fat of chicks fed 300 ppm Cu, compared to
broilers of the 15 ppm and 150 ppm Cu groups.
Table 8.4. Effect of different copper sources and level of inclusion on copper content in
organs and the concentration of copper and zinc in serum at 35 d1 (Trial in vivo).
Treatment Cu
Serum
(mg/L)
Liver
(µg/g)
Kidney
(µg/g)
Breast muscle
(µg/g)
Fat
(µg/g)
Source Cu(ppm)
CuSO4 15 0.16 2.69b 1.96 0.31 0.31
150 0.14 3.41b 2.06 0.40 0.48
300 0.16 7.91a 2.18 0.51 0.73
Cu2O 15 0.14 2.71b 1.94 0.33 0.35
150 0.15 2.97b 1.90 0.34 0.21
300 0.16 4.63b 2.16 0.48 0.50
Source
CuSO4 0.15 4.67 2.07 0.41 0.51
Cu2O 0.15 3.44 2.00 0.38 0.35
Dose (ppm) 15 0.15 2.70b 1.95
b 0.32
b 0.33
150 0.15 3.19b 1.98
b 0.37
b 0.35
300 0.16 6.27a 2.17
a 0.50
a 0.62
SEM2 0.013 0.759 0.064 0.032 0.145
P value3
Source 0.560 0.033 0.195 0.400 0.179
Dose 0.395 <.0001 0.001 <.0001 0.074
Source × Dose 0.839 0.046 0.454 0.287 0.483
1 Data are means of 8 pens with 12 chicks each. 2 SEM: Standard error of the mean. 3 a.b.c Values in the same column
with different letters are significantly different (P<0.05).

Copper sulfate and dicopper oxide in in broiler chickens
118
Table 8.5. Effect of different copper sources and level of inclusion on mineral content (Cu, P, Fe, Zn and Mn) in ileum digesta (soluble and
insoluble) at 35 d1 (Trial in vivo).
Treatment Cu (µg /g) P (µg /g) Fe (µg /g) Zn (µg /g) Mn (µg /g)
source Cu
(ppm)
insoluble soluble insoluble soluble insoluble soluble insoluble soluble insoluble soluble
CuSO4 15 12.8d 9.2
d 2517.1 1612.7
a 148.4 7.4 71.6 20.3 75.0 29.4
a
150 96.8c 67.3
c 3353.1 547.7
cd 172.5 6.1 92.4 6.3 104.8 9.1
b
300 223.8a 163.4
a 3191.8 419
d 173.9 9.0 92.0 5.8 101.5 5.3
b
Cu2O 15 11.8d 7.9
d 2346.5 1077.5
b 136.0 5.5 63.5 12.7 67.6 17.5
ab
150 92.0c 74.0
c 2812.5 970.9
b 155.1 6.0 79.6 8.1 94.5 15.3
b
300 169.0b 129.1
b 2975.8 792.9
bc 161.0 8.0 80.5 6.1 85.4 6.6
b
Cu source
CuSO4 111.1 79.9 3020.7 859.8 164.9 7.5 85.3 10.8 93.8 14.6
Cu2O 90.9 70.3 2711.6 947.1 150.7 6.5 74.5 9.0 82.5 13.1
Dose(ppm)
15 12.3c 8.5
c 2431.8
b 1345.1
a 142.2 6.4
ab 67.6
b 16.5
a 71.3
b 23.5
a
150 94.4b 70.6
b 3082.8
a 759.3
b 163.8 6.1
b 86
a 7.2
b 99.6
a 12.2
b
300 196.4a 146.3
a 3083.8
a 605.9
b 167.4 8.5
a 86.3
a 5.9
b 93.4
a 5.9
b
SEM2 10.84 7.69 201.96 76.51 12.47 0.92 5.76 2.60 7.84 3.21
P value3
Source
0.028 0.135 0.054 0.341 0.171 0.182 0.027 0.399 0.087 0.582
Dose <.0001 <.0001 0.001 <.0001 0.104 0.024 0.003 0.0004 0.002 <.0001
Source × Dose 0.030 0.026 0.570 <.0001 0.976 0.620 0.92 0.164 0.851 0.021 1 Data are means of 8 pens with 12 chicks each. 2 SEM: Standard error of the mean. 3 a.b.c Values in the same column with different letters are significantly different (P<0.05).
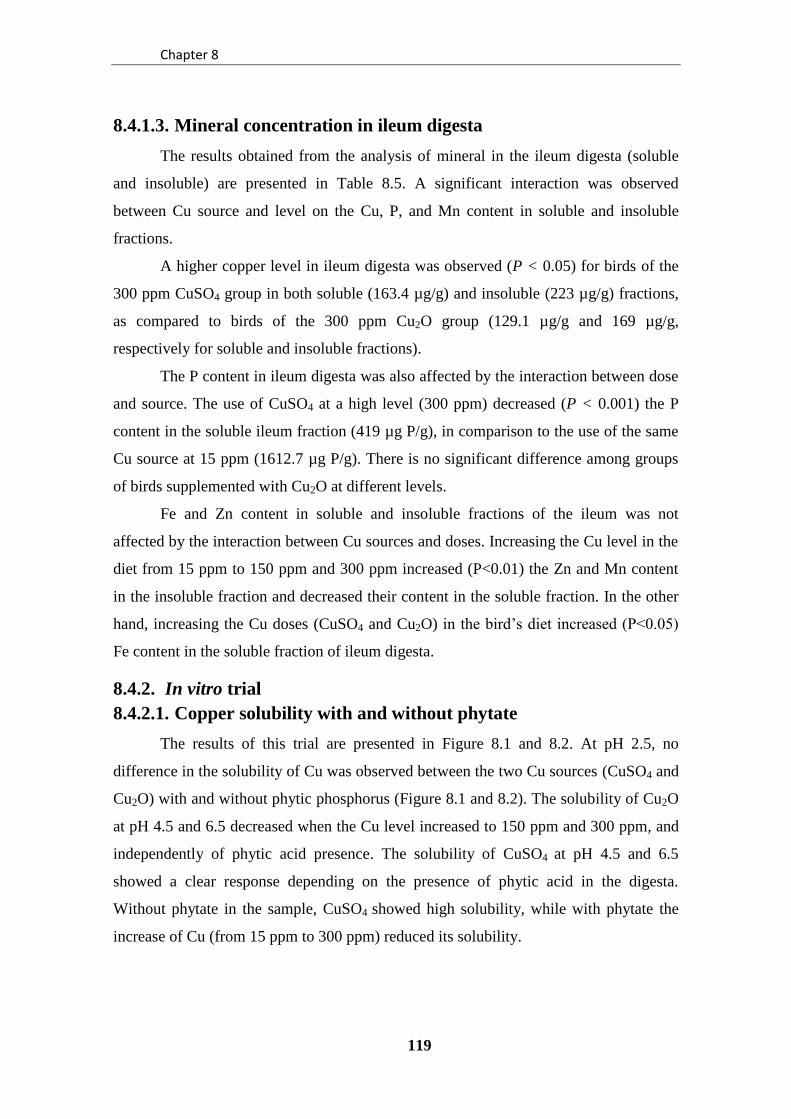
Chapter 8
119
8.4.1.3. Mineral concentration in ileum digesta
The results obtained from the analysis of mineral in the ileum digesta (soluble
and insoluble) are presented in Table 8.5. A significant interaction was observed
between Cu source and level on the Cu, P, and Mn content in soluble and insoluble
fractions.
A higher copper level in ileum digesta was observed (P < 0.05) for birds of the
300 ppm CuSO4 group in both soluble (163.4 µg/g) and insoluble (223 µg/g) fractions,
as compared to birds of the 300 ppm Cu2O group (129.1 µg/g and 169 µg/g,
respectively for soluble and insoluble fractions).
The P content in ileum digesta was also affected by the interaction between dose
and source. The use of CuSO4 at a high level (300 ppm) decreased (P < 0.001) the P
content in the soluble ileum fraction (419 µg P/g), in comparison to the use of the same
Cu source at 15 ppm (1612.7 µg P/g). There is no significant difference among groups
of birds supplemented with Cu2O at different levels.
Fe and Zn content in soluble and insoluble fractions of the ileum was not
affected by the interaction between Cu sources and doses. Increasing the Cu level in the
diet from 15 ppm to 150 ppm and 300 ppm increased (P<0.01) the Zn and Mn content
in the insoluble fraction and decreased their content in the soluble fraction. In the other
hand, increasing the Cu doses (CuSO4 and Cu2O) in the bird’s diet increased (P<0.05)
Fe content in the soluble fraction of ileum digesta.
8.4.2. In vitro trial
8.4.2.1. Copper solubility with and without phytate
The results of this trial are presented in Figure 8.1 and 8.2. At pH 2.5, no
difference in the solubility of Cu was observed between the two Cu sources (CuSO4 and
Cu2O) with and without phytic phosphorus (Figure 8.1 and 8.2). The solubility of Cu2O
at pH 4.5 and 6.5 decreased when the Cu level increased to 150 ppm and 300 ppm, and
independently of phytic acid presence. The solubility of CuSO4 at pH 4.5 and 6.5
showed a clear response depending on the presence of phytic acid in the digesta.
Without phytate in the sample, CuSO4 showed high solubility, while with phytate the
increase of Cu (from 15 ppm to 300 ppm) reduced its solubility.

Copper sulfate and dicopper oxide in in broiler chickens
120
0
20
40
60
80
100
120
15 150 300 15 150 300 15 150 300
Cu2O(-)
Cu2O(+)
pH= 4.5 pH= 6.5 pH= 2.5
0
20
40
60
80
100
120
15 150 300 15 150 300 15 150 300
CuSO4(-)
CuSO4(+)
pH= 4.5 pH= 6.5 pH= 2.5
Figure 8.1. Effects of Cu concentration on the solubility of Cu2O with
(+) and without phytate (-) at pH 2.5; 4.5 and 6.5.
Figure 8.2. Effects of Cu concentration on the solubility of CuSO4 with
(+) and without phytate (-) at pH 2.5; 4.5 and 6.5.
Cu (ppm) Cu (ppm)
Cu S
olu
bili
ty(%
)
C
u S
olu
bili
ty(%
)

Chapter 8
121
8.4.2.2. Phytic phosphorus solubility and PP hydrolysis by phytase
Solubility of phytic phosphorus (Figure 8.3) was high and unaffected by the
presence of Cu2O at different levels and pH. On the other hand, increasing levels of
CuSO4 reduce PP solubility at 150 ppm when pH was 6.5 and at 300 ppm when pH was
4.5 and 6.5. The efficacy of phytase is described in Figure 8.4 as being affected by the
pH and level of Cu supplementation. Increasing the levels of Cu with both sources did
not affect the phytase activity at pH 2.5. However, increasing the levels of Cu decreased
phytase activity at pH 4.5 and 6.5. Average values of phosphorus liberated were higher
at pH 4.5 when Cu2O was included in the solution, as compared to CuSO4.
8.5. Discussion
The results of this study show that Cu supplementation at therapeutic doses (150
ppm Cu) increase performance when Cu2O is used as the source, but does not affect
(150 ppm) or reduce (300 ppm) the BW of the animals or gain:feed ratios when Cu is
supplied as CuSO4. The growth stimulating action of dietary Cu has been attributed to
different mechanisms (Zhou et al., 1994) in which soluble Cu 1) may affect microbiota;
2) increases serum mitogenic activity; 3) increases pituitary growth hormone expression
(La Bella et al., 1973); 4) promotes a posttranslational modification of regulatory
peptides (Eipper and Mains, 1988); and 5) is a component of the growth factor Iamin
(Parkart, 1987). An increase in feed intake and growth was observed by Jenkins et al.
(1970) when birds were fed 250 mg Cu/kg of Cu. Pesti and Bakalli (1996) also
concluded that a 250 ppm of CuSO4 improved the growth and feed-conversion ratio of
broilers. However, the response may depend on the Cu source; Lu et al. (2010)
described that chicks fed 200 mg Cu /kg as TBCC (Tribasic Copper Chloride) had
higher ADG than those fed a lower level (0 mg/Cu/kg to 150 mg/Cu/kg) as TBCC or
the same level (200 mg Cu /kg) as CuSO4.
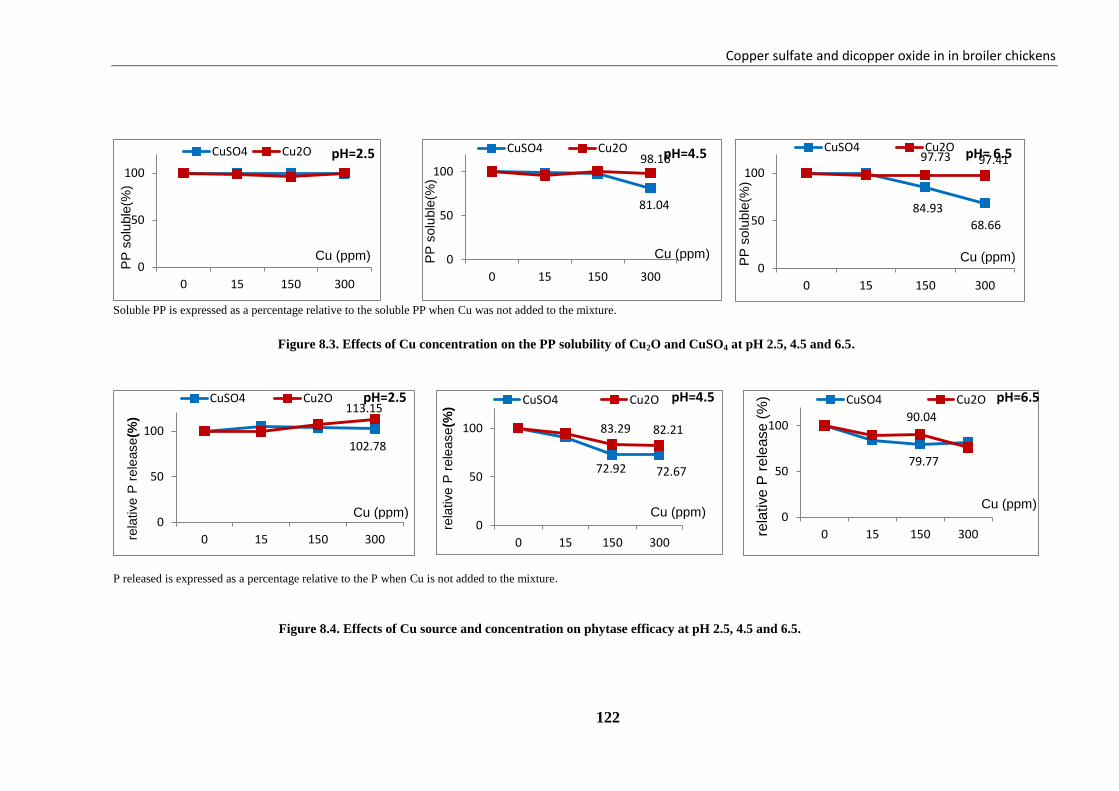
Copper sulfate and dicopper oxide in in broiler chickens
122
Soluble PP is expressed as a percentage relative to the soluble PP when Cu was not added to the mixture.
P released is expressed as a percentage relative to the P when Cu is not added to the mixture.
0
50
100
0 15 150 300
CuSO4 Cu2O pH=2.5
81.04
98.16
0
50
100
0 15 150 300
CuSO4 Cu2O pH=4.5
84.93
68.66
97.73 97.41
0
50
100
0 15 150 300
CuSO4 Cu2O pH= 6.5
102.78
113.15
0
50
100
0 15 150 300rela
tive P
rele
ase
(%)
CuSO4 Cu2O
72.92 72.67
83.29 82.21
0
50
100
0 15 150 300
rela
tive P
rele
ase
(%)
CuSO4 Cu2O
79.77
90.04
0
50
100
0 15 150 300
CuSO4 Cu2O
rela
tive
P r
ele
ase
(%
)
Cu (ppm) Cu (ppm) Cu (ppm)
Figure 8.3. Effects of Cu concentration on the PP solubility of Cu2O and CuSO4 at pH 2.5, 4.5 and 6.5.
Cu (ppm) Cu (ppm) Cu (ppm)
Figure 8.4. Effects of Cu source and concentration on phytase efficacy at pH 2.5, 4.5 and 6.5.
pH=2.5 pH=4.5 pH=6.5
PP
so
luble
(%)
PP
so
luble
(%)
P
P s
olu
ble
(%)

Chapter 8
123
On the other hand, Arias and Koutsos (2006) showed that at d 45, chicks
supplemented with 188 mg Cu/kg as CuSO4 and TBCC had higher carcass weight,
compared with those fed negative controls (8 mg Cu/kg), and they were not different
from positive control supplemented with sub-therapeutic antibiotics (AGP) under
immune-challenging conditions (recycled vs. fresh litter). It could be suggested that the
animal growth response to high dietary Cu supplementation may depend on the sanitary
status of the farm.
In contrast, the results of our experiment showed that a high Cu level in the diet,
such as copper sulfate , decreased BW gain and the feed efficiency. Pesti and Bakalli,
(1996) also indicated that supplementation of either 125 mg/kg or 250 mg/kg of Cu as
copper sulfate improved growth and the feed-conversion rate, but higher levels at 375
mg/kg provided no further beneficial effect. Banks et al. (2004b) also described that
supplementation with 250 mg/Cu/kg of copper sulfate had linear reductions in
performance (BW gain, feed consumption and feed conversion efficiency) and pointed
out that excesses of Cu might cause a possible toxic or corrosive response. In fact, one
of the roles of the liver is to regulate the amount of copper in the body, as the primary
copper storage organ. When the liver reaches its storage limit, copper is liberated in the
bloodstream and then accumulates in different organs. Reece et al. (2015) also suggest
that the presence of free unbound copper in the blood acts as a strong oxidizing agent
and causes hemolysis of red blood cells. Moreover, some studies with broilers have
indicated that supplementation with a 250 mg/Cu/Kg diet as copper sulfate can cause
irritation and erosions in the gizzard (Robbins and Baker, 1980), proventriculus
(Wideman et al., 1996) and oral cavity, tongue and pharynx (Chiou et al., 1999).
On the other hand, Milers et al., (1998) proved that during the storage period of
feed, ″painty″ odors in samples containing high levels of Cu were detected. The
″painty″ odors originate from hexanal, which is a product of linoleic acid oxidation
(Frankel, 1985; Milles, 1998) likely promoted by the proxidant effect of Cu. Milers et
al., (1998) also proved that rates of oxidation can be greater when the copper source is
highly water-soluble, and Lu et al., (2010) revealed that TBCC was less active than was
Cu sulfate in promoting the oxidation of vitamin E in feeds and in reducing vitamin E
content in plasma and the liver. We can speculate that dicopper oxide promoted a lower
oxidation effect than did copper sulfate. However, we did not measure oxidation
Copper sulfate and dicopper oxide in in broiler chickens
124
parameters in feed or in the animals. Thus, a decrease in growth performance for
animals fed high levels of Cu can be the result of the reduction in feed intake due to the
rancid odor in the diet. Nevertheless, in our experiment the high level of Cu sulfate (300
ppm Cu) decreased BW and WG but did not affect or even increased feed intake.
The difference in feed efficiency with copper sulfate being incorporated at high
doses could reflect the toxicity of a copper excess in the body. Copper is preferably
stored in the liver, the other storage organ is the kidney, but to a lesser extent. Lower
levels are observed in muscle and fat whatever the level used in the feed (E.C., 2003). In
this experiment, kidney and breast-muscle Cu content increased with the dietary Cu
level independently of the mineral source used. Samanta et al., (2011) and Cromwell et
al., (1989) opined that gradual increases in the concentration of dietary Cu until 300
ppm have a direct influence on tissue and organ accumulation of Cu. Absorption and
organ accumulation of Cu appeared to be highly related to the solubility of the copper
source, the accumulation of Cu in the liver was greater for birds fed 300 ppm as CuSO4
than in those given the same Cu level as Cu2O. This increase in liver content of Cu
might be due to a higher solubility of copper sulfate, in comparison to dicopper oxide.
Soluble sources of Cu in digesta could also interact with phytate and phytase
activity. High levels of Cu of copper sulfate are known to interfere with phytate at
intestinal pH, and the resulting complexes tend to be resistant to the hydrolytic activity
of phytases (Persson et al., 1998). We have also revealed in in vitro trial that the
addition of 150-300 mg/Cu/Kg as CuSO4 at pH=4.5 reduced Cu solubility in the
presence of phytic phosphorus, coupled with the reduction in PP solubility and phytase
hydrolysis. This inhibitory effect was greater at pH=6.5 (intestinal pH). This result is in
accordance with Pang and Applegate (2006), who showed that increasing doses of Cu
inhibited PP hydrolysis at pH 5.5 and pH 6.5, and the effect of Cu on phytase activity
was dependent on the Cu source. In fact, they found that TBCC and copper lysinate
inhibited PP hydrolysis much less than did copper sulfate and copper citrate. This result
was also described by Banks et al., (2004a) in an in vivo experiment, where they
observed that supplementation with 250 mg/Cu/Kg diet from copper citrate or copper
sulfate decreased apparent P retention; however, supplementation with a 250 mg/kg diet
of copper lysinate did not affect apparent P retention. Furthermore, Champagne et al.,
(1990) confirmed that, at pH similar to intestinal pH, insoluble complexes with more
than one cation per phytate molecule are formed. Therefore, phytin can bind to Cu as
well as to other minerals concurrently. The resulting insoluble complexes do not allow
Chapter 8
125
the hydrolysis of phytin-P by endogenous and exogenous phytases or the absorption of
the minerals within the complex (Banks et al., 2004b). In fact, the phytate precipitated
with different minerals present in the diet, and the order of stability of metal-phytate
complexes was found to be Cu > Zn > Co > Mn > Fe > Ca (Tamim and Angel, 2003). In
this experiment, higher insoluble Cu in the ileum digesta was accompanied by lower
soluble P when high CuSO4 was added to the diet. This result may indicate that CuSO4
precipitated with phytic phosphorus at high pH (intestinal pH) and may limit the bio-
availibility of phytic phosphorus to the phytase. Moreover, a high copper dose
decreased Mn and Zn solubility in the ileum, which may also reflect the high affinity of
phytate to Cu, Zn and Mn. Maenz et al., (1999) described that multiple mineral
complexes such as Ca-Zn-phytate are thought to be more stable than are single mineral
complexes such as Ca phytate or Zn phytate (Banks et al., 2004a).
Based on the results acquired in this experiment, we can conclude that a high
dose of Cu as dicopper oxide (150 ppm) improved BW of the animals. However, high
doses of CuSO4 (300 mg/Cu/kg) may decrease performance, either as a result of
decreased PP hydrolysis by phytase or as a consequence of the toxicity of copper
accumulated in different organs. Further research may be warranted to determine the
possible oxidative effects of these two copper sources and also the fate of the released
anion after Cu dissociation.

Copper sulfate and dicopper oxide in in broiler chickens
126

Chapter 9
127
CHAPTER 9
General discussion

General discussion
128
Chapter 9
129
In the present study the effect of administering lower levels of Ca and P in the
broiler diets as compared to requirements proposed by FEDNA, NRC or INRA was
investigated. The outcomes derived from the use of different mineral Ca and P sources
based on in vitro and in vivo trials have also been compared. In general, positive effects
have been observed in animal performance and mineral retention after reducing Ca and
P levels in diets supplemented with phytase. The use of different calcium sources
affects growth performance and bone mineralization, but the phosphorus source used
did not affect the studied parameters.
Results have been discussed in the different chapters of the present thesis.
Therefore, this general discussion will bring the results together to highlight the most
interesting findings and gain new insights.
9.1. Ca and P requirements
Calcium and P requirements were evaluated based on a multifactorial approach,
as determined by animal performance or bone mineralization at different age periods.
9.1.1. Animal performance
In Chapter 4, birds exposed to diets with a medium level of Ca (7g/kg) and 3.8
g/kg NPP with high doses of phytase (1,150 FTU) performed the best in the starting
phase, while higher Ca levels (0.9%) induced negative responses concerning FI and
WG. Similarly, in Chapter 7 also, the use of lower Ca:aP ratio (2.33:1) increased bird
performance in comparison to a higher Ca:aP ratio (3:1) for broilers at 14 days of life.
Rama-Rao et al. (2006) described that weight gain, feed intake and leg abnormality
scores were not affected by increasing the dietary Ca from 6 g/kg to 9 g/kg, and NPP
levels from 3 g/kg to 4.5 g/kg for commercial broilers up to 42 days of age. It has been
reported that Ca may form insoluble soaps with free fatty acids and bile acids, and there
is some evidence that these soaps reduce the absorption of fat (Gacs and Barltrop, 1977;
Govers et al., 1996; Shahkalili et al., 2001), particularly saturated fatty acids in broiler
diets. Soluble Ca may also increase intestinal pH and reduce mineral solubility and
availability, as reported by Shafey and McDonald (1991). Soluble Ca in the diet may
also insolubilize phytic acid by forming Ca-phytate complexes (Wise, 1983; Tamim et
al., 2004) and interact with inorganic P in the gut lumen to form insoluble Ca
orthophosphate (Plumstead et al., 2008), an insoluble complex in the chicken gut
General discussion
130
resulting in reduced absorption (Underwood, 1981; Georgievskii et al., 1982, Rama-
Rao et al., 2006).
In particular, the negative effects of higher levels of Ca in performance are
clearly observed when diets are formulated with lower levels of P. The results obtained
in Chapter 4 confirmed that with Ca levels at 9 g/kg, the use of 4 g NPP/kg and 4.5 g
NPP/kg, which corresponded to the lower Ca:NPP ratio (2-2.25:1), increased animal
performance, as compared to those broilers fed with 3 g NPP/kg and 3.5 g NPP/kg,
which correspond to the wider Ca:NPP ratio (2.57-3:1). Higher Ca levels and Ca:aP
ratios may also reduce exogenous phytase efficacy. At least two mechanisms have been
proposed to explain the detrimental effect of increased concentrations of dietary Ca on P
utilization: 1.- excess dietary Ca tends to form insoluble complexes with phytate (Lei et
al., 1994; Angel et al., 2002), rendering the phytate unavailable for hydrolysis; extra Ca
in the diet may also compete for the active site of phytase and thereby reduce the
efficacy of phytase in hydrolyzing phytate (Wise, 1983; Pointillart et al., 1985; Qian et
al., 1996); 2.- high dietary Ca favors an increase in digestive tract pH, which, in turn,
decreases phytase activity and phytate solubility (Selle and Ravindran, 2007). We
explored this interaction between the Ca:aP ratio and phytase inclusion in the diet in
Chapter 7, but no interactions were observed for starting broilers during the first 14
days of life. A likely explanation could be the short period of study.
9.1.2. Bone mineralization
In addition to growth performance, bone mineralization is also a good sensitive
criterion of P status in growing birds (Ravindran et al., 1995). In Chapter 4, tibia
weight and bone mineralization were also influenced by the level of Ca, with the low-
Ca diet (5 g/Kg) showing the lowest bone weight and ash content. However, the lowest
tibia ash content was observed in chicks of the highest unbalanced diets, either 4.5 g
NPP/kg with 5g Ca/diet, or 2.5 g NPP /kg with 9 g Ca / kg in the diet. This depression
observed with the Ca and P unbalanced diets reflect the improper utilization of these
minerals at wider Ca and NPP ratios (Rama-Rao et al., 2006). If diets with a low Ca:P
ratio are fed, most of the P is excreted in the urine due to a lack of Ca for bone-tissue
synthesis. The same decrease in bone growth may occur when high levels of Ca are
administered with low levels of dietary P. A low concentration of one mineral will
prevent bone synthesis and cause excretion of the other mineral in the urine

Chapter 9
131
In Chapter 6, increasing NPP from 4.0 g/kg to 4.5 g /kg increased the tibia
weight and ash content (mg/tibia) in diets without phytase at 21 d of age. In contrast, in
Chapter 4, with diets including high levels of phytase, 3.8 g NPP /kg improved the
growth of chicks and increased bone mineralization on d 14, but no further increases
were observed with 4.5 g NPP /kg in the diet. The difference between the two
experiments may reflect the effect of high doses (1,150 FTU) of phytase inclusion in the
diet, but also the length of the experiment.
Furthermore, in Chapter 6, increasing the NPP from 4.0 g/kg to 4.5 g/kg
increased tibia weight and tibia ash (mg/tibia), but no further increases were observed
for growth performance at d 21. This result confirms that NPP requirements for BW
gain and feed conversion are lower than those required for bone mineralization for
broilers of 3 to 6 weeks of age (Yan et al., 2001).
Several authors have demonstrated that the addition of phytase has positive
effects on bone ash content and bone mineralization in broilers fed low available P
diets. Moreover, the productive efficacy of phytase is higher as the level of dietary P is
lower. Higher tibia ash and body weight was observed for broilers supplemented with
1,000 FTU of a new phytase in Chapter 7. Therefore, Ca and P in the diet can be
reduced without affecting bone mineralization because phytase supplementation
increased the release of available P. Growth performance of broilers fed with Ca level
(7 g/kg and 6.3 g/K/kg) and NPP (3.2 g/kg and 2.9 g/K/kg) levels, respectively, for
starter and growth phases supplemented with 1,000 FTU/Kg diet were not significantly
different from the positive control with a 0.18%-0.2% higher analyzed total P content.
No differences were observed either among different phytases used in this thesis.
9.1.3. Mineral retention and digestibility
The metabolism of Ca and P is closely related, and a deficiency or an excess of
one will interfere with the utilization and metabolism of the other. It has been observed
in Chapters 4, 5, 6 and 7 that the increase in dietary Ca decreased its fractional
retention. On the other hand, increasing the levels of NPP from 0.25% to 0.31% allowed
for increases in the fractional retention of Ca, likely allowing a higher retention of Ca in
the bones.
However, increases in the NPP level in the diet reduced the fractional retention
of P, which is a similar response to that observed previously for increasing levels of Ca.
General discussion
132
Mitchell and Edwards (1996a) and Ziaei et al. (2008) have stated that reducing mineral
content of diets resulted in a higher apparent retention of Ca and P, leading to a
reduction in mineral excretion. Al Masri (1995) showed that the values of dietary Ca
and its ratio with P may affect P absorption, with lower values of P absorption when
higher ratios between Ca and P were added in the diet. Higher ileal digestibility of Ca
and P were observed for birds fed a low Ca:aP ratio than for those fed higher Ca:aP
ratios.
Several studies have shown that phytase inclusion in the diet improved ileal
digestibility and retention of P in broilers fed low Ca and available P diet (Ravindran et
al., 2000; Woyengo et al., 2010). These effects were also observed in Chapter 7, when
higher P retention and ileal digestibility was observed for animals fed diets
supplemented with phytase. Phytase may liberate P from phytate-P and prevents the
formation of insoluble Ca-phytate complexes in poultry diets (Woyengo et al., 2010).
Nevertheless, the incorporation of high levels of other divalent cations in
addition to Ca may also affect phytase activity. It has been demonstrated that Cu and Ca
may interact with phytic acid, because phytin has chemical characteristics enabling it to
bind divalent and trivalent minerals within the digesta and render the minerals less
available for absorption (Maenz et al., 1999; Banks et al., 2004b).
9.2. Phytase interaction with copper and pH
The addition of dietary Cu in excess of the nutritional requirements to poultry
diets has been a common practice for many years in non-European countries. The
excess supplemental Cu has been reported to have growth-promoting effects, which
have been attributed to the antibacterial activity of Cu (Ward et al., 1994). However,
high levels of Cu are known to interfere with phytic acid in the intestinal pH and the
resulting complexes tend to be resistant to the hydrolytic activity of phytases (Persson et
al., 1998). Most research trials carried out to study these effects have used copper
sulfate (CuSO4) as a source of Cu. In Chapter 8, two different sources of Cu were
compared, either of a high (CuSO4) or low (Cu2O) solubility, concerning their effects on
phytase hydrolysis and efficacy in vitro and in vivo. In the in vitro test, we confirmed
that the efficacy of phytase was affected by the interaction of the pH and Cu level
supplementation. Increasing the levels of Cu with both sources did not affect the
phytase activity at pH 2.5. However, increasing the levels of Cu decreased phytase

Chapter 9
133
activity at pHs 4.5 and 6.5. Average values of phosphorus released by phytase were
higher at pH 4.5 when Cu2O was included in the solution, as compared to CuSO4.
This result is in accordance with Pang and Applegate (2006), who showed that
increasing doses of Cu inhibited PP hydrolysis at pH 5.5 and pH 6.5, and the effect of
Cu on phytase activity was dependent on the Cu source. Phytin can bind to Cu as well
as to other minerals concurrently at a different pH. The resulting insoluble complexes
do not allow for the hydrolysis of phytin-P by endogenous and exogenous phytases or
for the absorption of the minerals within the complex (Banks et al., 2004a).
The in vitro results help to explain the results observed in vivo. Indeed, higher
insoluble Cu in the ileum digesta was accompanied by lower soluble P when high doses
of CuSO4 were included in the diet, as compared to high doses of Cu2O. This result may
indicate that CuSO4 may have reduced the bio-availibility of phytic phosphorus to
phytase.
Moreover, a high Cu dose, regardless of the source, decreased soluble Mn and
Zn content in ileum digesta, which may also reflect the formation of complex phytate to
Cu, Zn and Mn. Maenz et al. (1999) stated that multiple mineral complexes such as Ca-
Zn-phytate are thought to be more stable than are single mineral complexes such as Ca
phytate or Zn phytate (Banks et al., 2004a). Higher insoluble Cu in ileum digesta was
accompanied by lower soluble P when high CuSO4 was added to the diet. This result
may indicate that CuSO4 precipitated with phytic phosphorus at high pH and limits the
availability of phytic phosphorus to the phytase. High doses of CuSO4 may decrease
animal performance, either as a result of decreased PP hydrolysis by phytase or as a
consequence of the toxicity of copper which accumulated in different organs, specially
the liver.
9.3. Mineral sources
9.3.1. Phosphorus sources
With the increases in prices of mineral sources, the poultry and feed industries
have become increasingly interested in detailed information about the variation in the
availability of P among different inorganic sources. Di-calcium phosphate is often
utilized as the standard P source in poultry feed (Lima et al., 1995). However, the
characteristics of di-calcium phosphate obtained from different manufactures may vary
General discussion
134
according to the origin of the rock phosphate, phosphoric acid and limestone used
during the industrial processing. In another experiment in this thesis, different
phosphorous sources in the broilers diets were compared, but contrary to what was
expected no differences were observed among MCP, DCP and TCP. In previous studies,
a higher bioavailability has been described of hydrated P sources, as compared to the
anhydrous form (Lima et al., 1995). In the present study, all of the selected sources
were mono- or di-hydrate, and none of them was anhydrous.
9.3.2. Calcium sources
Calcium requirements have usually been measured using limestone in the diet,
which shows a lower solubility, as compared to other calcium sources, during
neutralization in the small intestine. Indeed, limestone is approximately 80% soluble in
the acidic medium of the gastrointestinal tract, but that solubility decreased to 77% in
the neutral conditions of the intestine (Walk et al., 2012a), where most absorption takes
place. Although diets are usually formulated on a total Ca basis, there has recently been
an interest to know the availability of Ca from different sources. To verify the
importance of Ca sources in mineral availability for young broilers, an in vitro and in
vivo study was carried out in Chapter 5. The results of this experiment refute the
hypothesis that the use of high-soluble Ca sources with a low acid-binding capacity can
improve mineral digestibility and reduce the level of Ca in the diet. Indeed, Ca chloride
showed the lowest buffering capacity and the highest solubility among the three sources
(Limestone, Ca Chloride and Lipocal (TCP)) at pH above 3.5 until neutrality.
Nevertheless, Champagne (1988) reported that Ca-phytate complexes may precipitate at
pHs between 4 and 6. So the free Ca2+
derived from the high-soluble Ca (Ca chloride) in
the intestine may precipitate with inorganic P and/or phytic P and form phytate-mineral
complexes in the intestine that are more resistant to phytase action (Tamim et al., 2004)
and reduce Ca and P absorption (Lonnerdal et al., 1989). This process could explain our
results of higher WG observed for birds fed limestone and TCP than for birds fed Ca
chloride. The results are in agreement with those observed by Walk et al. (2012a), who
showed that broiler growth was lower when diets were formulated with a highly soluble
source of Ca, as compared to birds fed on limestone. So, based on these observations, it
could be suggested that Ca sources with lower solubility may allow for better
performances than with high-soluble Ca sources.

Chapter 10
135
CHAPTER 10
Conclusions

Conclusions
136
From the results presented in this dissertation, the following conclusions can be drawn:
1) Calcium and phosphorus dietary recommendations should be considered
together because both macro-minerals show clear interactions in the digestive
tract as well as on bird performance and bone formation. Increasing the NPP
levels increases the fractional retention of Ca. The use of a lower Ca:aP ratio
increases bird performance in comparison to a higher Ca:aP.
2) A dietary level of 3.8 g NPP /Kg in a pre-starter diet, simultaneously overdosed
with phytase (1,150 FTU), was adequate to ensure the best growth and bone
formation of broilers from d 1 to 14 of age. Increasing NPP to 4.5 g/Kg without
phytase supplementation increased tibia weight and ash for broilers at 21 days of
age.
3) A calculated dietary level of 7 g Ca/kg (analysed at 7.9 g Ca/kg) may optimize
performance and bone mineralization of chicks during the first two weeks of
life; this value is below those currently used by the industry. Higher values of Ca
promote significant decreases on feed intake and body-weight gain and on the
Ca fractional retention during the first 14 days of life.
4) Including a novel phytase (1,000 FTU/kg) in low NPP diets (3.2 g NPP/kg)
enhanced growth performance, P retention and ileal digestibility, as well as bone
mineralization in broilers at d 35, to reach values similar to those broilers fed a
diet with a 2 g/kg higher total P content.
5) No differences were observed among different commercial phytases and no
interactions were observed between the dietary Ca:aP ratio and the different
phytases.
6) Several mineral Ca and P sources show clear differences in their in vitro
solubility at a wide pH range, and they promote differences in Ca and P ileum
digestibility in 14-d-old broilers, which encourages the interest of using
digestible Ca values on feed formulation.
7) However, Calcium chloride, which was the calcium source with the highest
solubility and ileum digestibility, depressed feed intake and affected bone
mineralization of the young chicks. No differences were observed among the
studied sources of NPP, mono-calcium phosphate, di-calcium phosphate, and tri-
calcium phosphate.

Chapter 10
137
8) A high dose of Cu as di-copper oxide (150 ppm) improved BW of the animals.
Nonetheless, high doses of CuSO4 (300 mg/Cu/kg) may decrease performance
(not observed with the use of Cu2O), either as a result of decreased PP
hydrolysis by phytase or as a consequence of the toxicity of Cu highly
accumulatedin different organs. Further research may be warranted to determine
the possible oxidative effects of these two copper sources and also the fate of the
released anion after Cu dissociation.

Conclusions
138
Chapter 11
139
CHAPTER 11
References

References
140

Chapter 11
141
Abudabos, A.M. 2012. Intestinal phytase activity in chickens (Gallus Domesticus).
African Journal of Microbiology Research, 6: 4932-4938.
Adedokun, S. A., J. S. Sands, and A. Adeola. 2004. Determining the equivalent
phosphorus released by an Escherichia coli-derived phytase in broiler chicks.
Canadian Journal of Animal Science, 84:437-444.
Adeola O., and A. J. Cowieson. 2011. Opportunities and challenges in using exogenous
enzymes to improve nonruminant animal production. Journal of Animal Science,
89:3189-3218.
Adeola O., N. D. Ryan, E. M. Onyango, and A. J. Jendza. 2005. Utilización del fósforo
en aves y ganado porcino. XXI curso de especializacion FEDNA. pp 243-265.
Adeola, O. and C. L. Walk. 2013. Linking ileal digestible phosphorus and bone
mineralization in broiler chickens fed diets supplemented with phytase and
highly soluble calcium. Poultry Science, 92: 2109-2117.
Akter, M., H. Graham, and P. A. IJI. 2016. Response of broiler chickens to different
levels of calcium, non-phytate phosphorus and phytase. British Poultry Science,
DOI: 10.1080/00071668.2016.1216943.
Al Masri, M. R. 1995. Absorption and endogenous excretion of phosphorus in growing
broiler chicks, as influenced by calcium and phosphorus ratios in feed. British
Journal of Nutrition, 74:407-415.
Angel, R. 2013. Calcium to phosphorus ratios in broilers. Australian Poultry Science
Symposium, 24:10-13. (Abstr.).
Angel, R., A.S. Dhandu, T. J. Applegate, and M. Christman, 2001. Phosphorus sparing
effect of phytase, 25-hydroxycholecalciferol, and citric acid when fed to broiler
chicks. Poultry Science, 80:133-134.
Angel, R., E. Jimenez-Moreno, W. Li, S-W. Kim, M. Proszkowiec-Weglarz, and F.
Escribano. 2015. Dietary calcium, phosphorus and phytase interactions. XXXI
curso especialización FEDNA, pp 111-120.
Angel, R., N. Tamim, T. Applegate, A. Dhandu, and J. Ellestad. 2002. Phytic acid
chemistry: influence on phytin-phosphorus availability and phytase efficacy. The
Journal of Applied Poultry Research, 11: 471-480.
Angel, R., T. J. Applegate, M. Christman, A. D.and Mitchell. 2000. Effect of dietary
nonphytate phosphorus level on broiler performance and bone measurements in
the starter and grower phase. Poultry Science, 79:21-22.
References
142
Anwar M.N., V. Ravindran, P.C.H. Morel, G. Ravindran, and A.J. Cowieson. 2016.
Effect of limestone particle size and calcium to non-phytate phosphorus ratio on
true ileal calcium digestibility of limestone for broiler chickens. British Poultry
Science, published online DOI: 10.1080/00071668.2016.1196341.
Aoyagi, S., and D. H. Baker. 1993. Estimates of Copper Bioavailability from Liver of
Different Animal Species and from Feed Ingredients Derived from Plants and
Animals. Poultry Science, 72:1746-1755.
Applegate, T. J, D. M. Webel, and X. G. Lei. 2003. Efficacy of a Phytase Derived from
Escherichia coli and Expressed in Yeast on Phosphorus Utilization and Bone
Mineralization in Turkey Poults. Poultry Science, 82:1726-1732.
Applegate, T. J., and R. Angel. 2004. Phytase: Basics of Enzyme Function, Purdue
University Department of Animal Sciences.
Applegate, T. J., and R. Angel. 2008. Phosphorus requirements for poultry. A key
ingredient in livestock and poultry nutrient management. USDA, NRCS CIG
program.
Applegate, T. J., R. Angel, and H.L. Classen. 2003. Effect of dietary calcium, 25-
hydroxycholecalciferol, or bird strain on small intestinal phytase activity in
broiler chickens. Poultry Science, 82:1140-1148.
Applegate, T. J., Richert, B. and Angel, R. 2008. Phytase and other phosphorus
reducing feed ingredients.
Arias, V. J., and Koutsos E. A. 2006. Effects of copper source and level in intestinal
physiology and growth of broiler chickens. Poultry Science, 85: 999-1007.
Augspurger, N. R., D. M. Webel, X. G. Lei, and D. H. Baker. 2003. Efficacy of an E.
coli phytase expressed in yeast for releasing phytate-bound phosphorus in young
chicks and pigs. Journal of Animal Science, 81:474-483.
Baker, D. H. 1989. Phosphorus supplements for poultry. Multistate Poult. Exten. Res.
Newsletter. University Illinois 1(5):5.
Baker, D.H. 1999. Cupric Oxide Should Not Be Used As a Copper Supplement for
Either Animals or Humans. Journal of Nutrition, 129: 2278-2279.
Baker, D.H., J. Odle, M. A. Funk, and T. M. Wieland. 1991. Bioavailability of Cu in
cupric oxide, cuprous and in a Cu- lysine complex. Poultry Science, 70: 177-79.
Ballam, G.C., T. S. Nelson, and L. K. Kirby. 1985. Effect of different levels of calcium
and phosphorus on phytate hydrolysis by chicks. Nutrition Reports International
Journal, 32: 909-913.
Chapter 11
143
Banks K. M., K. L. Thompson, P. Jaynes, and T. J. Applegate. 2004b. The effects of
Copper on the efficacy of phytase, growth, and phosphorus retention in Broiler
Chicks. Poultry Science, 83:1335-1341.
Banks, K. M., K. L. Thompson, J. K. Rush, and T. J. Applegate. 2004a. Effects of
copper source on phosphorus retention in broiler chicks and laying hens. Poultry
Science, 83: 990-996.
Barrier-Guillot, B., P. Casado, P. Maupetit, C. Jondreville, and F. Gatel. 1996. Wheat
phosphorus availability: 1-In vitro study; Factors affecting endogenous phytasic
activity and phytic phosphorus content. Journal of the Science of Food and
Agriculture, 70:62-68.
Bernstein A. M., B. Titgemeier, K. Kirkpatrick, M. Golubic, and M. F. Roizen. 2013.
Major cereal grain fibers and psyllium in relation to cardiovascular health.
Nutrients, 5: 1471-1487.
Biehl, R. R., and D. H. Baker. 1997. 1α-hydroxycholecalciferol does not increase the
specific activity of intestinal phytase but does improve phosphorus utilization in
both cecectomized and sham-operated chicks fed cholecalciferol-adequate diets.
Journal of Nutrition, 127: 2054-2059.
Bitar, K., and J.G. Reinhold. 1972. Phytase and alkaline phosphatase activities in
intestinal mucosa of rat, chicken, calf and men. Biochimica et Biophysica Acta,
268: 442-452.
Blaabjerg, K., N. G. Carlsson, J. Hansen-Moller, and H. D. Poulsen. 2010. Effect of
heat-treatment, phytase, xylanase and soaking time on inositol phosphate
degradation in vitro in wheat, soybean meal and rapeseed cake. Animal Feed
Science and Technology, 162:123-134.
Blake, G. M., and I. Fogelman. 2002. Methods and clinical issues in bone densitometry
and quantitative ultra-sonometry. Principles of Bone Biology, 2:1573-1585.
Bohak, Z. 1969. Purification and characterization of chicken pepsinogen and chicken
pepsin. The Journal of Biological Chemistry, 244:4638-4648.
Bradbury, E. J., S. J. Wilkinson, G. M. Cronin, C.L. Walk, and A. J. Cowieson. 2012.
The effect of marine calcium source on broiler leg integrity. Australian Poultry
Science Symposium, 85-88.
Brenes, A., A. Viveros, I. Arija, C. Centeno, M. Pizarro, and C. Bravo. 2003. The effect
of citric acid and microbial phytase on mineral utilization in broiler chicks.
Animal Feed Science and Technology, 110:201-219.
References
144
Bronner, F. 2003. Mechanisms of intestinal calcium absorption. Journal of Cellular
Biochemistry, 88:387-393.
Brown, E. M. 2002. Biology of the extracellular Ca2+
sensing receptor. Principles of
Bone Biology. Vol. 1:371-387.
Browning, L. C., C. Antipatis, and A. J. Cowieson. 2012. The interactive effects of
vitamin D, phytase, calcium, and phosphorus in broiler performance and skeletal
integrity. Australian Poultry Science Symposium, 23:81-84.
Bunch, R. J., J. T. Mccall, V. C. Speer, and V. W. Hays. 1965. Copper supplementation
for weanling pigs. Journal of Animal Science, 24:995-1000.
Burnell, T. W., G. L. Cromwell, and T. S. Stahly. 1990. Effects of particle size on the
biological availability of calcium and phosphorus in defluorinated phosphate for
chicks. Poultry Science, 69:1110-1117.
Cabahug, S., Y. Ravindran, P. H. Selle, and W.Bryden. 1999. Response of broiler
chicken to microbial phytase supplementation as influenced by dietary phytic
acid and non-phytate phosphorus contents. 1. Effect on the bird performance and
toe ash. British Poultry Science, 40:660-666.
Carlton, W. W., and W. Henderson. 1964. Skeletal lesions in experimental copper
deficiency in chickens. Avian Diseases, 8:48-55.
Catala -Gregori, P., V. Garcıa, F. Hernandez, J. Madrid, and J.J. Ceron. 2006. Response
of broilers to feeding low-calcium and phosphorus diets plus phytase under
different environmental conditions: body weight and tibiotarsus mineralization.
Poultry Science, 85:1923-1931.
Champagne, E. T. 1988. Effects of pH on mineral phytate, protein-mineral-phyate and
mineral-fiber interactions. Possible consequences of atrophic gastritis on mineral
bioavailability from high-fiber foods. The Journal of the American College of
Nutrition, 7:499-508.
Champagne, E. T., M. S. Fisher, and O. Hinojosa. 1990. NMR and ESR studies of
interactions among divalent cations, phytic acid, and N-acetyl-amino acids.
Journal of Inorganic Biochemistry, 38:199-215.
Chen, X., and E. T. Moran. 1995. The withdrawal feed of broilers: Carcass responses to
dietary phosphorus. The Journal of Applied Poultry Research, 4:69-82.
Cheryan, M. 1980. Phytic acid interactions in food systems. Critical Reviews in Food
Science and Nutrition, 13:297-335.
Chapter 11
145
Chiou, P.W.S., C.L. Chen, and C.P. Wu. 1999. Effects of high dietary copper on the
morphology of gastro-intestinal tract in broiler chickens. Asian-Austalasian
Journal of Animal Science, 12: 548-53.
Chung, T. K., S. M. Rutherfurd, D. V. Thomas, and P. J. Moughan. 2013. Effect of two
microbial phytases on mineral availability and retention and bone mineral
density in low-phosphorus diets for broilers. British Poultry Science, 54:362-
373.
Cobb. 2015. Broiler performance and nutrition supplement. cobb-vantress.com
Coon, C. N., and M. K. Manangi. 2004. The effect of a novel phytase on retainable
phosphorus in broilers. pp 56-68
Coon, C. N., S. Seo, and M. K. Manangi. 2007. The determination of retainable
phosphorus, relative biological availability, and relative biological value of
phosphorus sources for broilers. Poultry Science, 86:857-868
Coon, C., and K. Leske. 1998. Retainable phosphorus requirements for broilers.
Maryland Nutrition Conference, p 18-31.
Cooper, R. J., and H. S. Gowing. 1983. Mammalian small intestine phytase (EC
3.1.3.8). British Journal of Nutrition, 50:429-435.
Cosgrove, D.J. 1980. Inositolhexakis phosphates, Inositol Phosphates: Their Chemistry,
Biochemistry and Physiology, pp 26-43.
Cowieson, A. J., and O. Adeola. 2005. Carbohydrase, protease, and phytase have an
additive beneficial effect in nutritionally marginal diets for broiler chicks.
Poultry Science, 84:1860-1867.
Cowieson, A. J., P. Wilcock, and M.R. Bedford. 2011. Super-dosing effects of phytase
in poultry and other monogastrics. Worlds Poultry Science, 67:225-236.
Cromwell, G. L., 1980. Biological availability of phosphorus in feedstuffs for swine.
Feedstuffs, 52:38-12.
Cromwell, T. E., T. S. Stahly, and H. J. Monegue. 1989. Effect of source and level of
Cu on performance and liver Cu stores in weanling pigs. Journal of Animal
Science, 67: 2996.
De Groote, G., and G. Huyghebaert. 1997. The bioavailability of phosphorus from feed
phosphates for broilers as influenced by bioassay method, dietary Ca-level and
feed form. Animal Feed Science and Technology, 69:329-340.

References
146
De Kort, E., M. Minor, T. Snoeren, T. Van Hooijdonk, and E. Van Der Linden. 2009.
Calcium-binding capacity of organic and inorganic ortho- and polyphosphates.
Dairy Science and Technology, 89:283-299.
De Vries, S., R. P. Kwakkel, and J. Dijkstra. 2010. Dynamics of Calcium and
Phosphorus Metabolism in Laying Hensin. Phosphorus and calcium utilization
and requirements in farm animals. CAB International. pp133-150.
Denbow, D. M., V. Ravindran, E. T. Kornegay, Z. Yi, and R. M. Hulet. 1995.
Improving phosphorus availability in soybean meal for broilers by supplemental
phytase. Poultry Science, 74:1831-1842.
Dersjant-Li, Y., A. Awati, H. Schulze, and G. Partridge. 2015. Phytase in non-ruminant
animal nutrition: a critical review on phytase activities in the gastrointestinal
tract and influencing factors. Journal of the Science of Food and Agriculture, 95:
878-896.
Driver, J. P., G. M. Pesti, R. I. Bakalli, and H. M. Edwards. 2005a. Effects of calcium
and nonphytate phosphorus concentrations on phytase efficacy in broiler chicks.
Poultry Science, 84:1406-1417.
Driver, J. P., G. M. Pesti, R. I. Bakalli, and H. M. Edwards. 2005b. Calcium
requirements of modern broiler chicken as influenced by dietary protein and age.
Poultry Science, 84:1629-1639.
E.C. 2003. Opinion of the scientific committee for animal nutrition on the use of copper
in feeding stuffs. European Commission health and consumer protection
directorate-general.
Edwards, H. M. 2000. Nutrition and skeletal problems in poultry. Poultry Science,
79:1018-1020.
Edwards, H. M., W. S. Dunahoo, J. L. Carmon, and H. L. Fuller. 1960. Effect of
protein, energy and fat content of the ration on calcium utilization. Poultry
Science, 39:1389-1394.
Eeckhout, W., and M. De Paepe. 1994. Total phosphorus, phytate-phosphorus and
phytase activity in plant feedstuffs. Animal Feed Science and Technology,
47:19-29.
Eekhout, W., and M. De Paepe. 1997. The digestibility of three calcium phosphates for
pigs as measured by difference and by slope-ratio assay. Journal of Animal
Physiology and Animal Nutrition, 77:53-60.
EFSA, 2012. Cu legal UE : EFSA Journal, 10(12):2969.
Chapter 11
147
Eipper, B. A., and R. E. Mains. 1988. Peptide α-amidation. Annual Review of
Physiology, 50:333.
Emery, P. 2005. Metabolic changes in malnutrition Eye19, Department of Nutrition and
Dietetics, King’s College London, UK. pp 1029-1034.
European Parliament, 2010: Directive 2010/63/EU of the European Parliament and of
the Council of 22 September 2010 on the protection of animals used for
scientific purposes.
FEDNA. Fundación Española Desarrollo Nutrición Animal. 2008. Necesidades
Nutricionales para Avicultura: Pollos de Carne y Aves de Puesta. R. Lázaro and
G. G. Mateos, ed. Fundación Española para el Desarrollo de la Nutrición
Animal, Madrid, Spain.
Fernandes, J. I. M., F. R. Lima, C. X. Mendonc, I. Mabe, R. Albuquerque, and P. M.
Leal. 1999. Relative Bioavailability of Phosphorus in Feed and Agricultural
Phosphates for Poultry. Poultry Science, 78:1729-1736.
France, J., R. S. Dias, E. Kebreab, D. M. S. S. Vitti, L. A. Crompton, and S. Lopez.
2010. Kinetic models for the study of phosphorus metabolism in ruminants and
monogastrics. Phosphorus and calcium utilization and requirements in farm
animals. CAB International. pp 18-42.
Frandson, R. D., and T. L. Spurgeon. 1992. Anatomy and Physiology of Farm Animal,
5th
Edition. Lea and Febiger, Philadelphia. pp 503-505.
Frankel, E. N., 1985. Pages 1-37 in: Flavor Chemistry of Fats and Oils. D. B. Min and
T. H. Smouse, ed. American Oil Chemists’ Society, Champaign, IL.
Gacs, G. and D. Baltrop. 1977. Significance of Ca-soap formation for calcium
absorption in the rat. Gut 18:64-68.
Georgievskii, V. I., B. N. Annenkov, and V. I. Samokhin. 1982. Mineral Nutrition of
Animals. Butterworths, London.
Gibson, D. M., and A. B. J. Ullah. 1990. Inositol metabolism in plants. Eds. D.J. Morre,
W.F.Boss y F.A. Loewus. Wiley-Liss, New York. pp: 77-92.
Gillis, M. B., H. M. Jr. Edwards, and R. J. Young. 1962. Studies on the availability of
calcium orthophosphates to chickens and turkeys. Journal of Nutrition, 78:155-
161.
Gonzalez-Ortiz, G., W. Mirza, V. Pirgozliev, and M. Bedford. 2015. Efecto de la
adicion de xilansasa y fitasa en pollos broiler alimentados con dietas en bsae a
trigo. Page 241-245 in LII Simposio Científico de Avicultura 2015.

References
148
Goss, S. L., J. Prushko, and R. H. Bogner. 2010. Factors affecting calcium precipitation
during neutralization in a simulated intestinal environment. Journal of
Pharmaceutical Sciences, 99:4183-4191.
Goss, S. L., K. A. Lemons, J. E. Kerstetter, and R. H. Bogner. 2007. Determination of
calcium salt solubility with changes in pH and P(CO2), simulating varying
gastrointestinal environments. Journal of Pharmacy and Pharmacology,
59:1485-1492.
Govers, M. J., D. S. Termont, J. A. Lapre, J. H. Kleibeuker, R. J. Vonk, and R. Van der
Meer. 1996. Calcium in milk products precipitates intestinal fatty acids and
secondary bile acids and this inhibits colonic cytotoxicity in humans. Cancer
research journal, 56:3270-3275.
Gregory, N. G., and L. J. Wilkins. 1990. Broken bones in chickens: Effect of stunning
and processing in broilers. British Poultry Science, 31:53-58.
Gregory, N. G., and L. J. Wilkins. 1992. Skeletal damage and bone defects during
catching and processing. Bone Biology and Skeletal Disorders in Poultry. C. C.
Whitehead, ed. Carfax Publishing Co., UK. pp 313-328.
Grimbergen, A. H. M., J. P. Cornelissen, and H. P. Stappers. 1985. The relative
bioavailability of phosphorus in inorganic feed phosphates for young turkey and
pigs. Animal Feed Science and Technology, 13:117-130.
Guinotte, F., J. Gautron, Y. Nys, and A. Soumarmon. 1995. Calcium solubilization and
retention in the gastrointestinal tract in chicks (Gallus domesticus) as a function
of gastric acid secretion inhibition and of calcium carbonate particle size. British
Journal of Nutrition, 73:125-139.
Hamdi, M., R. Davin, D. Solà-Oriol, and J. F. Pérez. 2015b. Calcium sources and their
interaction with the level of inorganic phosphorus affect performance and bone
mineralization in broiler chickens. Poultry Science, 94:2136-2143.
Hamdi, M., S. López-Vergé, E. G. Manzanilla, A. C. Barroeta, and J. F. Pérez. 2015a.
Effect of different levels of calcium and phosphorus and their interaction on the
performance of young broilers. Poultry Science, 94: 2144-2151.
Harland, F. B., and E. R. Morris. 1995. Phytin: A good or a bad food component.
Nutrition Research, 15:733-754.
Havenstein, G. B., P. R. Ferket, S. E. Scheidler, and B. T. Larson. 1994. Growth,
livability, and feed conversion of 1991 vs 1957 broilers when fed “typical”
1957 and 1991 broiler diets. Poultry Science, 73:1785-1794.
Chapter 11
149
Hawbaker, J. A., V. C. Speer, V. W. Hayes, and D. V. Catron. 1961. Effects of copper
sulfate and other chemoprophylactics in growing swine rations. Journal of
Animal Science, 20:163-167.
Hegeman, C. E., and E. A. Grabau. 2001. A Novel Phytase with Sequence Similarity to
Purple Acid Phosphatases Is Expressed in Cotyledons of Germinating Soybean
Seedlings. Journal of Plant Physiology, 126:1598-1608.
Hill, R. and C. Tyler. 1954a. The reaction between phytate and protein. Journal of
Agricultural Science, 44:324-326.
Hill, R. and C. Tyler. 1954b. The influence of time, temperature, pH and calcium
carbonate on the activity of the phytase of certain cereals. Journal of
Agricultural Science, 44:306-310.
http://dx.doi.org/10.1080/00071668.2016.1196341.
Humer, E., C. Schwarz, and K. Schedle. 2014. Phytate in pig and poultry nutrition.
Journal of Animal Physiology and Animal Nutrition, DOI: 10.1111/jpn.12258
Hurwitz, S. and A. Bar. 1971. Calcium and phosphorus interrelationships in the
intestine of the fowl. Journal of Nutrition, 101:677-686.
INRA.1989. Institut national de la recherche agronomique, France.
ISO. 2009. International standard, animal feeding stuffs determination of phytase
activity, ISO30024:2009(E).
Jasaitis, D. K., J. E. Wohlt, and J. L. Evans. 1987. Influence of feed ion content on
buffering capacity of ruminant feedstuffs in vitro. Journal of Dairy Science,
70:1391-1403.
Jegede, A. V., O. O. Oduguwa, A. M. Bamgbose, A. O. Fanimo and L. Nollet. 2011.
Growth response, blood characteristics and copper accumulation in organs of
broilers fed on diets supplemented with organic and inorganic dietary copper
sources. British Poultry Science, 52:133-139.
Jenkins, N. K., T. R. Morris, and D. Valamotis. 1970. The effect of diet and copper
supplementation on chick growth. British Poultry Science, 11:241-248.
Jongbloed, A. W., and P. A. Kemme. 1990. Effect of pelleting mixed feeds on phytase
activity and the apparent absorbability of phosphorus and calcium in pigs.
Animal Feed Science and Technology, 28: 233-242.
Joseph, H., and J. Scares. 1995. Phosphorus bioavailability, bioavailability of nutrients
for animals; amino acids. Minerals and vitamins, pp 257-294.

References
150
Juin, H., Y. Nys, and J. Broz. 2001. Comparative evaluation of two phytase preparations
in young turkeys fed a wheat-based diet. Arch Geflügel , 65:231-35.
Julian, R. J. 1998. Rapid growth problems: ascites and skeletal deformities in broilers.
Poultry Science, 77:1773-1780.
Kebreab, E., and D. Vitti. 2005. Mineral metabolism. In Quantitative aspects of
ruminant digestion and metabolism (ed. J Dijkstra, JM Forbes and J France), pp.
469-486. CAB International, Wallingford, UK.
Kerr, M. J., H. L Classen, and R. W. Newkirk. 2000. The effects of gastrointestinal
tract micro-flora and dietary phytase on inositol hexaphosphate hydrolysis in the
chicken. Poultry Science, 79 (Suppl. 1): 11 (Abstr.).
Kies, A. K., K. H. F. Van Hemert, and W. C. Sauer. 2001. Effect of phytase on protein
and amino acid digestibility and energy utilization. World's Poultry Science
Journal, 57:110-124.
Knowles, T. G., and L. J. Wilkins. 1998. The problems of broken bones during
handling of laying hens. Poultry Science, 77:1798-1802.
Kornegay, E. T. 2001. Digestion of phosphorus and other nutrients: The role of phytases
and factors influencing their activity. Enzymes in Farm Animal Nutrition. M. R.
Bedford and G. G. Partridge, ed. CABI Publishing, Wallingford, UK. pp 239.
Kornegay, E. T., D. M. Denbow, Z. Yi, and V. Ravindran. 1996. Response of broilers to
graded levels of microbial phytase added to maize-soyabean-meal-based diets
containing three levels of non-phytate phosphorus. British Journal of Nutrition,
75:839-852.
Kornegay, E.T. 1999. En: Biotechnology in the feed industry. Proc. Alltech’s 15th
Annual Symposium. Ed. T.P. Lyons y K.A. Jacques. Nottingham University
Press. Reino Unido. pp: 461-490.
Krieger, C. H. 1938. Phytase and other phosphatases of the gastrointestinal tract. Master
Thesis, University of Wisconsin, Madison, Wisconsin, U.S.A.
LaBella, F., T. Dular, S. Vivian, and G. Queen. 1973. Pituitary hormone releasing or
inhibiting activity of metal ions present in hypothalamic extracts. Biochemical
and Biophysical Research Communications, 52: 786.
Lan, G.Q., N. Abdullah, S. Jalaludin, and Y. W. Ho. 2002. Efficacy of Supplementation
of a Phytase-Producing Bacterial Culture on the Performance and Nutrient Use
of Broiler Chickens Fed Corn-Soybean Meal Diets. Poultry Science, 81:1522-
1532.

Chapter 11
151
Larbier, M., and B. Leclercq. 1992. Nutrition et alimentation des volailles par INRA
Editions.
Lawlor, P. G., P. B. Lynch, P. J. Caffrey, J. J. O'Reilly, and M. K. O'Connell. 2005.
Measurements of the acid-binding capacity of ingredients used in pig diets. Irish
Veterinary Journal, 58:447-452.
Lei, X.G, P. k. Ku, E. R. Millar, M. T. Yokoyama, and D. E. Ullrey. 1994. Calcium
level affects the efficacy of supplemental microbial phytase in corn-soybean
diets of weanling pigs. Journal of Animal Science, 72:139-143.
Leske, K. L. and C. N. Coon. 2002. The development of feedstuff retainable phosphorus
values for broilers. Poultry Science, 81:1681-1693.
Létourneau-Montminy, M. P., C. Jondreville, C. Pomar, M. Magnin, D. Sauvant, J.
Bernier, Y. Nys, and P. Lescoat. 2007. 16ème
Symposium Européen de Nutrition
des Volailles, Strasbourg, pp 117-120.
Létourneau-Montminy, M. P., P. Lescoat, A. Narcy, D. Sauvant, J. F. Bernier, M.
Magnin, C. Pomar, Y. Nys, and C. Jondreville. 2008. Effects of reduced dietary
calcium and phytase supplementation on calcium and phosphorus utilization in
broilers with modified mineral status. British Poultry Science, 49:705-715.
Li, W., R. Angel, S. W. Kim, E. Jimenez-Moreno, M. Proszkowiec-Weglarz, and P. W.
Plumstead. 2014. Age and adaptation effects to Ca and P deficiencies: Effect on
P digestibility. Poultry Science, 93:84 (Abstr).
Li, W., R. Angel, S. W. Kim, K. Brady, S. Yu, and P. W. Plumstead. 2016. Impacts of
dietary calcium, phytate, and nonphytate phosphorus concentrations in the
presence or absence of phytase on inositol hexakisphosphate (IP6) degradation
in different segments of broilers digestive tract. Poultry Science, 95:581-589.
Liebert, F., C. Wecke, and F. J. Schöner. 1993. En: Proc. 1st Symposium on Enzymes in
Animal Nutrition. Ed. C. Wenk y M. Boessinger. pp: 202-205.
Lima, F. R., C. X. Mendonc, J. C. Alvarez, H. J. M. F. Garzillo, E. Ghion, and P. M.
Leali. 1997. Biological evaluations of commercial dicalcium phosphates as
sources of available phosphorus for broiler chicks. Poultry Science, 76:1707-
1713.
Lima, F. R., C. X. Mendonca, J. C. Alvarez, G. Ratti, S. L. R. Lenharo, H. Kahn, and J.
M. F. Garzillo, 1995. Chemical and physical evaluations of commercial
dicalcium phosphates as sources of phosphorus in animal nutrition. Poultry
Science, 74:1659-1670.
References
152
Lönnerdal, B. 2000. Dietary factors influencing zinc absorption. Journal of Nutrition,
130:1378S-1383S.
Lonnerdal, B., A. S. Sandberg, B. Sandstrom, and C. Kunz. 1989. Inhibitory effects of
phytic acid and other inositol phosphates on zinc and calcium absorption in
suckling rats. Journal of Nutrition, 119:211-214.
Lott, J. N. A., I. Ockenden, V. Raboy, and G.D. Batten. 2000. Phytic acid and
phosphorus in crop seed and fruits: a global estimate. Seed Science Research
Journal, 10: 11-33.
Lott, J. N. A., I. Ockenden, V. Raboy, and G.D. Batten. 2002. Phytic acid and
phosphorus in crop grains, seeds and fruits. In NR Reddy, SK Sathe, eds, Food
Phytate. CRC Press, Boca Raton, FL, pp 7-24.
Lu, L., R. L. Wang, Z. J. Zhang, F. A. Steward, and B. Liu. 2010. Effect of Dietary
Supplementation with Copper Sulfate or Tri-basic Copper Chloride on the
Growth Performance, Liver Copper Concentrations of Broilers Fed in Floor
Pens, and Stabilities of Vitamin E and Phytase in Feeds. Biological Trace
Element Research, 138: 181-189.
Lundy, M. W., J. E. Russell, J. Avery, J. E. Wergedal, and D. J. Baylink. 1992. Effect of
sodium fluoride on bone density in chickens. Calcified Tissue International,
50:420-426.
Maddaiah, V. T., A. A. Kurnich, B. J. Hulett, and B. L. Reid. 1969. Nature of intestinal
phytase activity. Proceedings of The Society for Experimental Biology and
Medicine, 115: 1054-1056.
Maenz, D. D. 2001. Enzymatic characteristics of phytases as they relate to their use in
animal feeds. Enzymes in Farm Animal Nutrition. M. R. Bedford and G. G.
Partridge. CABI Publishing, Wallingford, UK. pp 72-76.
Maenz, D. D., and H. L. Classen. 1998. Phytase Activity in the Small Intestinal Brush
Border Membrane of the Chicken. Poultry Science, 77:557-563
Maenz, D. D., C. M. Engele-Schaan, R. W. Newkirk, and H. L. Classen. 1999. The
effect of minerals and mineral chelators on the formation of phytase-resistant
and phytase-susceptible forms of phytic acid in solution and in a slurry of canola
meal. Animal Feed Science and Technology, 81:177-192.
Manangi, M. K., and C. N. Coon. 2007. The effect of calcium carbonate particle size
and solubility on the utilization of phosphorus from phytase for broilers.
International Journal of Poultry Science, 6:85-90.
Chapter 11
153
Manangi, M. K., and C. N. Coon. 2008. Phytate phosphorus hydrolysis in broilers in
response to dietary phytase, calcium, and phosphorus concentrations. Poultry
Science, 87:1577-1586.
Marounek, M., M. Skřivan, O. Rosero, and O. Rop. 2010. Intestinal and total tract
phytate digestibility and phytase activity in the digestive tract of hens fed a
wheat-maize-soyabean diet. Animal Feed Science and Technology, 19: 430- 439
Masey- O'neill, H.V., M. R. Bedford, and N. Walker. 2014. Recent developments in
feed enzyme technology. Recent Advances in Animal Nutrition, 97-106.
McDowell, L. R. 1992. Copper and molybdenum. In: T. J. Cunha (ed.) Minerals in
Animal and Human Nutrition. pp 235-276. Academic Press, San Diego, CA.
McGuaig, L. W., M. I. Davies, and I. Motzok. 1972. Intestinal alkaline phosphatase and
phytase of chicks: Effect of dietary magnesium, calcium, phosphorus and
thyroactive casein. Poultry Science, 51:526-530.
Menezes-Blackburn, D., S. Gabler, and R. Greiner. 2015. Performance of Seven
Commercial Phytases in an in Vitro Simulation of Poultry Digestive Tract.
Journal of Agricultural and Food Chemistry, 63: 6142-6149.
Miles, R. D., S. F. O’Keefe, P. R. Henry, C. B. Ammerman, and X. G. Luo. 1998. The
effect of dietary supplementation with copper sulfate or tribasic copper chloride
on broiler performance, relative copper bioavailability, and dietary prooxidant
activity. Poultry Science, 77:416-425.
Mitchell, R. D., and H. M. Edwards. 1996a. Additive effects of 1,25 dihydroxy
cholecalciferol and phytase on phytate phosphorus utilization and related
parameters in broiler chickens. Poultry Science, 75:111-119.
Mitchell, R.D., and H. M. Edwards. 1996b. Effect of phytase and 1,25
dihydroxycholecalciferol on phytate utilization and the quantitative requirement
for calcium and phosphorus in young broiler chickens. Poultry Science, 75: 95-
110.
Mohammed, A., M. J. Gibney, and T. G. Taylor. 1991. The effects of dietary levels of
inorganic phosphorus, calcium and cholecalciferol on the digestibility of
phytate-P by the chick. British Journal of Nutrition, 66: 251-259.
Moran, E. T., and M. C. Todd. 1994. Continous submarginal phosphorus with broilers
and the effect of preslaughter transportation: Carcass defects, further-processing
yields, and tibia-femur integrity. Poultry Science, 73:1448-1457.

References
154
Nelson, T. S. 1984. Available calcium for poultry. Proc. Florida Nutr. Conf. Feed
Manuf, pp 1-7. Orlando, Florida.
NRC. 1994. Nutritional Requirements of Poultry. 9th rev. ed. National Academy Press,
Washington, DC.
Oatway, L., T. Vasanthan, and J. H. Helm. 2001.Phytic acid. Food Reviews
International, 17:419-431.
Oberleas. 1973. Oberleas, D. Phytates. In: Toxicants occurring naturally in foods,
National Academy of Sciences, Washington, DC, p 363.
Olukosi, O. A., C. Kong, F. Fru-Nji, K. M. Ajuwon, and O. Adeola. 2013. Assessment
of a bacterial 6-phytase in the diets of broiler chickens. Poultry Science, 92:
2101-2108.
Onyango, E. M., M. R. Bedford, and O. Adeola. 2005. Phytase activity along the
digestive tract of the broiler chick: A comparative study of an Escherichia coli-
derived and Peniophora lycii phytase. Canadian Journal of Animal Science, 61-
68.
Onyango, E. M., P. Y. Hester, R. Stroshine, and O. Adeola. 2003. Bone densitometry as
an indicator of percentage tibia ash in broiler chicks fed varying dietary calcium
and phosphorus levels. Poultry Science, 82:1787-1791.
Osphal, W., H. Zeronian, M. Ellison, D. Lewis, R. S. Rucker, and R. Riggins. 1982.
Role of copper in collagen-linking and its influence on selected mechanical
properties of chick bone and tendon. Journal of Nutrition, 12: 708-716.
Pallauf, J., and G. Rimbach. 1997. Effect of supplemental phytase on mineral and trace
element bioavailability and heavy metal accumulation in pigs with different type
diets. In Phytase in Animal Nutrition and Waste Management. M. B. Coehlbo
and E. T. Kornegay, ed. BASF Publication DC9601. BASF Corporation, Mount
Olive, NJ.
Pang, Y. and T. J. Applegate. 2007. Effects of Dietary Copper Supplementation and
Copper Source on Digesta pH, Calcium, Zinc, and Copper Complex Size in the
Gastrointestinal Tract of the Broiler Chicken. 2007. Poultry Science, 86:531-
537.
Pang, Y., and T. J. Applegate. 2006. Effects of copper source and concentration on in
vitro phytate phosphorus hydrolysis by phytase. Journal of Agricultural and
Food Chemistry, 54:1792-1796.
Chapter 11
155
Pang, Y., J. A. Patterson, and T. J. Applegate. 2009. The influence of copper
concentration and source on ileal microbiota. Poultry Science, 88:586-592.
Parkart, L. 1987. Iamin: A human growth factor with multiple wound healing
properties. In: J.R.J. Sorenson (Ed.) Biology of Copper Complexes. p 273.
Humana Press, Clifton, NJ.
Payne, R. L., T. K. Lavergne, and L. L. Southern. 2005. Comparison of Two Sources of
Phytase in Liquid and Dry Forms in Broilers. Poultry Science, 84:265-272.
Pearse, A. G. E. 1980. Histochemistry. Theoretical and Applied. Vol. 1. Preparative
and optical technology. Ed. P. J. Stoward, Churchill Livingstone, Edinburgh,
Scotland.
Peeler, H.T. 1972. Biological availability of nutrients in feeds: availability of major
mineral ions. Journal of Animal Science, 35: 695-712.
Peers, F. G. 1953. The phytase of wheat. Biochemical Journal, 53: 102-110.
Pepper, W. F., S. J. Slinger, and I. Motzok. 1955. Effect of animal fat on the calcium
and phosphorus requirements of chicks. Poultry Science, 34:1216 (Abstr.).
Perry, R. W., G. N. Rowland, T. L. Foutz, and J. R. Glisson. 1991. Poultry
malabsorption syndrome. III. Skeletal lesions in market age turkeys. Avian
Diseases, 35:707-713.
Persson, H., M. Turk, M. Nyman, and A. S. Sandberg. 1998. Binding of Cu2+
, Zn2+
, and
Cd2+
to inositol tri-, tetra-, penta, and hexaphosphates. Journal of Agricultural
and Food Chemistry, 46:3194-3200.
Pesti, G. M., and R. I. Bakalli. 1996. Studies on the feeding of cupric sulfate
pentahydrate and cupric citrate to broiler chickens. Poultry Science, 75:1086-
1091.
Petersen, G. I., C. Pedersen, M. D. Lindemann, and H. H. Stein. 2011. Relative
bioavailability of phosphorus in inorganic phosphorus sources fed to growing
pigs. Journal of Animal Science, 89:460-466.
Phillippy, B. Q. 1999. Susceptibility of wheat and Aspergillus niger phytases to
inactivation by gastrointestinal enzymes. Journal of Agricultural and Food
Chemistry, 47: 1385-1388.
Phillips, R., R. Angel, E. Jimenez-Moreno, S. W. Kim, S. L. Vieira, M. DeBeer, N.
Ward, and F. Fru. 2012. Calcium and phosphorus requirements for two strains of
broilers from hatch to 10 days of age. Poultry Science, 91(Suppl. 1):23 (abst).
References
156
Plumstead, P. W., A. B. Leytem, R. O. Maguire, J. W. Spears, P. Kwanyuen, and J.
Brake. 2008. Interaction of calcium and phytate in broiler diets: 1. Effects on
apparent prececal digestibility and retention of phosphorus. Poultry Science, 87:
449-458.
Pointillart, A. 1994. Phytates, phytases: leur importance dans l’alimentation des
monogastriques. Inra Productions Animales, 7: 29-39.
Pointillart, A., N. Fontaine, M. Thomasset, and M. E. Jay. 1985. Phosphorus utilization,
intestinal phosphatases and hormonal control of calcium metabolism in pigs fed
phytic phosphorus: soyabean or rapeseed diets. Nutrition reports international,
32:155-167.
Powell, S., T. D. Bidner, and L. L. Southern. 2011. Phytase supplementation improved
growth performance and bone characteristics in broilers fed varying levels of
dietary calcium. Poultry Science, 90:604-608.
Proszkowiec-Weglarz, M., and R. Angel. 2013. Calcium and phosphorus metabolism in
broilers: Effect of homeostatic mechanism on calcium and phosphorus
digestibility.The Journal of Applied Poultry Research, 22: 609-627.
Qian, H., E. T. Kornegay, and D. M. Denbow. 1997. Utilization of phosphorus and
calcium as influenced by microbial phytase, cholecalciferol, and the
calcium/total phosphorus ratio in broiler diets. Poultry Science, 76:37-46.
Qian, H., H. P. Veit, E. T. Kornegay, V. Ravindran, and D. M. Denbow. 1996. Effects
of supplemental phytase and phosphorus on histological and other tibial bone
characteristics and performances of broilers fed semi-purified diets. Poultry
Science, 75: 618-626.
Raboy, V. 2009. Approaches and challenges to engineering seed phytate and total
phosphorus. Plant Science, 177: 281-296.
Raboy, V., and D. B. Dickinson. 1987. The timing and rate of phytic acid accumulation
in developing soybean seeds. Plant Physiology, 85:841-844.
Rama-Rao, S. V., M. V. L. N. Raju, and M. R. Reddy. 1999. Non-phytin requirements
of comercial broilers and white leghorn layers. Animal Feed Science and
Technology, 80:1-10.
Rama-Rao, S. V., M. V. L. N. Raju, M. R. Reddy, and P. Pavani. 2006. Interaction
between dietary calcium and non-phytate phosphorus levels on growth, bone
mineralization and mineral excretion in commercial broilers. Animal Feed
Science and Technology, 131:133-148.
Chapter 11
157
Rama-Rao, S.V., A. K. Panda, M. V. L. N. Raju, G. Shyam Sunder, and N. K. Praharaj.
2003. Requirement of calcium for commercial broilers and White Leghorn
layers at low dietary phosphorus levels. Animal Feed Science and Technology,
106: 199-208.
Rath, N. C., G. R. Huff, W. E. Huff, and J. M. Balog. 2000. Factors Regulating Bone
Maturity and Strength in Poultry. Poultry Science, 79:1024-1032.
Rath, N. C., J. M. Balog, W. E. Huff, G. R. Huff, G. B. Kulkarni, and J. F. Tierce. 1999.
Comparative difference in the composition and biomechanical properties of
tibiae of seven- and seventy-two-week-old male and female broiler breeder
chickens. Poultry Science, 78:1232-1239.
Ravindran, V., E. T. Kornegay, L. M. Potter, B. O.Ogunabameru, M. K.Welten, J. H.
Wilson, and M. Potchanakorn. 1995. An evaluation of various response criteria
in assessing biological availability of Phosphorus for Broilers. Poultry Science,
74:1820-1830.
Ravindran, V., P. H. Selle, G. Ravindran, P. C. H. Morel, A. K. Kies, and W. L. Bryden.
2001. Microbial phytase improves performance, apparent metabolizable energy,
and ileal amino acid digestibility of broilers fed a lysine-deficient diet. Poultry
Science, 80: 338-344.
Ravindran, V., S. Cabahug, G. Ravindran, and W. L. Bryden. 1999. Influence of
microbial phytase on apparent ileal amino acid digestibility of feedstuffs for
broilers. Poultry Science, 78: 699-706.
Ravindran, V., S. Cabahug, G. Ravindran, W. L. Bryden, and P. H. Selle. 2000.
Response of broilers to microbial phytase supplementation as influenced by
dietary phytic acid and non-phytate phosphorus levels. II. Effects on nutrient
digestibility and retention. British Poultry Science, 41:193-200.
Ravindran, V., W. L. Bryden, and E. T. Kornegay. 1995. Phytates: Occurrence,
bioavailability, and implications in poultry nutrition. Poultry and Avian Biology
Reviews, 6:125-143.
Rebollar, P. G., and G. G. Mateos. 1999. El fósforo en nutrición animal necesidades,
valoración de materias primas y mejora de la disponibilidad. XV Curso de
Especialización: avances en nutrición y alimentación animal.
Reece, W. O., H. H. Erickson, J. P. Goff, and E. E. Uemura .2015. Dukes' Physiology of
Domestic Animals, 13th Edition. Wiley-Blackwell.
References
158
Reichmann, K. G., and J. K. Connor. 1977. Influence of dietary calcium and phosphorus
on metabolism and production in laying hens. British Poultry Science, 18:633-
640.
Rennie, J. S., R. H. Flemming, H. A. McCormack, C. C. McCorquodale, and C. C.
Whitehead. 1997. Studies on effects of nutritional factors on bone structure and
osteoporosis in laying hens. British Poultry Science, 38:417- 424.
Robbins, K. R., and D. H. Baker. 1980. Effect of sulfur amino acid level and source on
the performance of chicks fed high levels of copper. Poultry Science, 59:1246-
1253.
Rodehutscord, M., and A. Dieckmann. 2005. Comparative studies with three-week-old
chickens, turkeys, ducks, and quails on the response in phosphorus utilization to
a supplementation of monobasic calcium phosphate. Poultry Science, 84:1252-
1260.
Rucker, R. B., R. S. Riggins, R. Laughlin, M. M. Chan, and M. T. Chen. 1975. Effects
of nutritional copper deficiency on the biomechanical properties of bone and
arterial elastin metabolism in the chick. Journal of Nutrition 105:1062-1070.
Rucker, R., H. Parker, and J. C. Rogler. 1968. Utilization of calcium and phosphorus
from hydrous and anhydrous dicalcium phosphates. Journal of Nutrition, 96:
513-518.
Rutherfurd, S. M., T. K. Chung, and P. J. Moughan. 2002. The effect of microbial
phytase on ileal phosphorus and amino acid digestibility in the broiler chicken.
British Poultry Science, 44:598-606.
Samanta, B., A. Biswas and P. R. Ghosh. 2011. Effects of dietary copper
supplementation on production performance and plasma biochemical parameters
in broiler chickens. British Poultry Science, 52:573-577.
Sandberg, A. S. and T. Andlid. 2002. Phytogenic and microbial phytases in human
nutrition. International Journal of Food Science and Technology, 37: 823-833.
Sands, S., R. Stilborn, J. Berg, and R. E. Salmon. 2003. Comparative Efficacy of two
Microbial Phytases for improving performance in Broilers Fed Low-P Diets.
Concurrent Meetings of International Poultry Scientific Forum. pp 30. (Abstr.)
Sauveur, B. 1989. Phosphore phytique et phytases dans l’alimentation des volailles.
Inra Productions Animales, 2: 343-351.
Schoner, F-J., P. P. Hoppe, and G. Schwartz. 1991. Comparative effects of microbial
phytase and inorganic phosphorus on performance and retentions of phosphorus,

Chapter 11
159
calcium and crude ash in broilers. Journal of Animal Physiology and Animal
Nutrition, 66:248-255.
Schoner, F-J., P. P. Hoppe, G. Schwartz, and H. Weische. 1993. Comparison of
microbial phytase and inorganic phosphate in male chickens: the influence on
performance data, mineral retention and dietary calcium. Journal of Animal
Physiology and Animal Nutrition, 69:235-244.
Scott, M. L., M. C. Nesheim, and R. J. Young. 1982. Essential inorganic nutrients.
Nutrition of the Chicken, 3rd Edition. M.L. Scott and Associates, Ithaca, New
York, pp 288-304.
Sebastian, S., S. P. Touchburn, E. R. Chavez, and P. C. Lague. 1996. Efficacy of
supplemental microbial phytase at different dietary calcium levels on growth
performance and mineral utilization on broilers chickens. Poultry Science,
75:1516-1523.
Selle, P. H., A. J. Cowieson, and V. Ravindran. 2009. Consequences of calcium
interactions with phytate and phytase for poultry and pigs. Livestock Science,
124:126-141.
Selle, P. H., and V. Ravindran. 2007. Microbial phytase in poultry nutrition. Journal of
Animal Feed Science and Technology, 135:1-41.
Selle, P. H., V. Ravindran, G. Ravindran, and W. L. Bryden. 2007. Effects of dietary
lysine and microbial phytase on growth performance and nutrient utilisation of
broiler chickens. Asian-Australian Journal of Animal Science, 20: 1100-1107.
Selle, P. H., V. Ravindran, R. A. Caldwell, and W. L. Bryden. 2000. Phytate and
phytase: Consequences for protein utilisation. Nutrition Research Reviews,
13:255-278.
Shafey, T. M. 1993. Calcium tolerance of growing chickens: effect of ratio of dietary
calcium to available phosphorus. Worlds Poultry Science Journal, 49: 5-18.
Shafey, T. M. 1999. Effects of high dietary calcium and fat levels on the performance,
intestinal pH, body composition and size and weight of organs in growing
chickens. Asian-Australian Journal of Animal Science, 12:49-55.
Shafey, T. M. and M. W. Mcdonald. 1991. The effects of dietary calcium, phosphorus
and protein on the performance and nutrient utilization of broiler chickens.
Poultry Science, 70:548-553.
Shafey, T. M., M. W. McDonald, and J. G. Dingle. 1991. Effects of dietary calcium and
available phosphorus concentration on digesta pH and on the availability of Ca,

References
160
Fe, Mg and Zn from the intestinal content of meat chickens. British Poultry
Science, 32:185-194.
Shahkalili, Y., C. Murset, I. Meirim, E. Duruz, S. Guinchard, C. Cavadini, and K.
Acheson. 2001. Calcium supplementation of chocolate: effect on cocoa butter
digestibility and blood lipids in humans. The American Journal of Clinical
Nutrition, 73:246-252.
Shang, Y., A. Rogiewicz, R. Patterson, B. A. Slominski, and W. K. Kim. 2015. The
effect of phytase and fructooligosaccharide supplementation on growth
performance, bone quality, and phosphorus utilization in broiler chickens.
Poultry Science, 94:955-964.
Shastak, Y., M. Witzig, K. Hartung, and M. Rodehutscord. 2012. Comparison of
retention and prececal digestibility measurements in evaluating mineral
phosphorus sources in broilers. Poultry Science, 91:2201-2209.
Shirley, R. B. and H. M. Edwards. 2003. Graded levels of phytase past industry
standards improve broiler performance. Poultry Science, 82:67-680.
Simons, P. C. M., H. A. J. Versteegh, A. W. Jongbloed, P. A. Kemme, P. Slump, K. D.
Bos, M. G. E. Wolters, R. F. Beudeker, and G. J. Verschoor. 1990. Improvement
of phosphorus availability by microbial phytase in broilers. British Journal of
Nutrition, 64:525-540.
Simpson, C. J., and A. Wise. 1990. Binding of zinc and calcium to inositol phosphates
(phytate) in vitro. British Journal of Nutrition, 64:225-232.
Smith, A. K., and J. J. Rackis. 1957. Phytin elimination in soybean protein isolation.
Journal of the American Chemical Society, 79:633-637.
Sooncharernying, S., and H. M. Edwards. 1993. Phytate content of excreta and phytate
retention in the gastrointestinal tract of young chickens. Poultry Science,
72:1906-1916.
Suttle, N. F. 2010. Mineral Nutrition of Livestock, 4th
Edition.
Tamim N. M., and R. Angel. 2003. Phytate Phosphorus Hydrolysis as Influenced by
Dietary Calcium and Micro-Mineral Source in Broiler Diets. Journal of
Agricultural and Food Chemistry, 51:4687-4693.
Tamim, N. M., R. Angel, and M. Christman. 2004. Influence of dietary calcium and
phytase on phytate phosphorus hydrolysis in broiler chickens. Poultry Science,
83:1358-1367.
Chapter 11
161
Taylor, T. G. 1965. The availability of the calcium and phosphorus of plant materials
for animals. Proceedings of the Nutrition Society, 24:105-112.
The international Union of Biochemists International Union of Biochemists (IUB).
1979. Enzyme nomenclature. Page 247 in Recommendations of the
Nomenclature Committee of the International Union of Biochemistry. Academic
Press, New York.
The Merck Index, 1990. 10th ed. Merck and Co., Inc. Rahway, NJ.
Toru, I., M. Takahashi, K. Oda, Y. Terada, and K. T. Yoshida. 2012. Dynamic Changes
in the Distribution of Minerals in Relation to Phytic Acid Accumulation during
Rice Seed Development. Plant Physiology, 160: 2007-2014.
Underwood, E. J. 1981. The Mineral Nutrition of Livestock, 2nd ed. Commonwealth
Agricultural Bureaux.
Venäläinen, E., J. Valaja, and T. Jalava. 2006. Effects of dietary metabolisable energy,
calcium and phosphorus on bone mineralization, leg weakness and performance
of broiler chickens. British Poultry Science, 47:301-310.
Veum, T. L. 2010. Phosphorus and Calcium Nutrition and Metabolism. Phosphorus and
calcium utilization and requirements in farm animals. CAB International 2010.
pp 94-111.
Viljoen. 2001. Quality of feed phosphate supplements for animal nutrition. SA-ANIM
SCI. vol 2: http://www.sasas.co.za/Popular/Popular.html
Viveros, A., A. Brenes, I. Arija, and C. Centeno. 2002. Effects of Microbial Phytase
Supplementation on Mineral Utilization and Serum Enzyme Activities in Broiler
Chicks Fed Different Levels of Phosphorus . Poultry Science, 81:1172-1183.
Vohra, P., G. A. Gray, and F. H. Kratzer. 1965. Phytic acid-metal
complexes. Proceedings of the Society for Experimental Biology and
Medicine, 120:447-449.
Waldroup, P. W., J. H. Kersey, E. A. Saleh, C. A. Fritts, F. Yan, H. L. Stilborn, R. C.
Crum, and V. Raboy. 2000. Nonphytate phosphorus requirement and phosphorus
excretion of broiler chicks fed diets composed of normal or high available corn
with and without microbial phytase. Poultry Science, 79:1451-1459.
Walk, C. L., E. K. Addo-Chidie, M. R. Bedford, and O. Adeola. 2012a. Evaluation of a
highly soluble calcium source and phytase in the diets of broilers chickens.
Poultry Science, 91:2255-2263.

References
162
Walk, C. L., M. R. Bedford, and A. P. McElroy. 2012b. Influence of limestone and
phytase on broiler performance, gastrointestinal pH, and apparent ileal nutrient
digestibility. Poultry Science, 91:1371-1378.
Walk, C. L., M. R. Bedford, and A. P. McElroy. 2012c. In vitro evaluation of limestone,
dicalcium phosphate, and phytase on calcium and phosphorus solubility of corn
and soybean meal. Poultry Science, 91:674-682.
Walk, C. L., T. T. Santos, and M. R. Bedford. 2014. Influence of super-doses of a novel
microbial phytase on growth performance, tibia ash, and gizzard phytate and
inositol in young broilers. Poultry Science, 93:1172-1177.
Ward T. L., K. L. Watkins and L. L. Southern. 1994. Interactive effects of dietary
copper and water copper level on growth, water intake, and plasma and liver
copper concentrations of poults. Poultry Science, 73:1306-1311.
Wasserman, R. H., and A. N. Taylor. 1973. Intestinal absorption of phosphate in the
chick. Effect of vitamin D3 and other parameters. Journal of Nutrition, 103:586-
599.
Wilcox, R. A., C. W. Carlson, W. Kohlmeyer, and G. F. Gastler. 1954. The availability
of phosphorus from different sources for poults fed purified diets. Poultry
Science, 33: 1010-1014.
Wilkinson, S. J., P. H. Selle, M. R. Bedford, and A. J. Cowieson. 2012. Exploiting the
calcium specific appetite of broilers. Australian Poultry Science Symposium,
23:48-51(Abstr.).
Williams, B., D. Waddington, S. Solomon, and C. Farquharson. 2000. Dietary effects
on bone quality and turnover and Ca and P metabolism in chickens. Research in
Veterinary Science, 69:81-87.
Wise, A. 1983. Dietary factors determining the biological activities of phytate. Nutrition
Abstracts and Reviews, 53:791-806.
Wise, A., and D. J. Gilburt. 1982. Binding of cadmium and lead to the calcium–phytate
complex in vitro. Toxicology Letters, 9:45-50.
Wodzinski, R. J., and A. H. J. Ullah. 1996. Phytase. Advances in Applied Microbiology,
42: 263-302.
Woyengo, B. A. Slominski, and R. O. Jones. 2010. Growth performance and nutrient
utilization of broiler chickens fed diets supplemented with phytase alone or in
combination with citric acid and multicarbohydrase. Poultry Science, 89:2221-
2229.

Chapter 11
163
Yan, F., J. H. Kersey, and P. W. Waldroup. 2001. Phosphorus Requirements of Broiler
Chicks Three to Six Weeks of Age as Influenced by Phytase Supplementation.
Poultry Science, 80:455-459.
Yi, Z., E. T. Kornegay, V. Ravindran, and D. M. Denbow. 1996. Improving phytate
phosphorus availability in corn and soybean meal for broilers using microbial
phytase and calculation of phosphorus equivalency values for phytase. Poultry
Science, 75:240-249.
Yonemochi, C., H. Takagi, M. Hanazumi, S. Hijikuro, K. Koide, T. Ina, and T. Okada.
2000. Improvement of phosphorus availability by dietary supplement of phytase
in broiler chicks. Japanese poultry science, 37:154-161.
Yu, B., Y. C. Jan, T. K. Chung, T. T. Lee, and P. W. S. Chiou. 2004. Exogenous
phytase activity in the gastrointestinal tract of broiler chickens. Animal Feed
Science and Technology, 117:295-303.
Zhou, W., E. T. Kornegay, M. D. Lindemann, J. W. Swinkels, M. K. Welten, and E. A.
Wong. 1994. Stimulation of growth by intravenous injection of copper in
weanling pigs. Journal of Animal Science, 72:2395-2403.
Ziaei, N., J. H. Guy, S. A. Edwards, P. J. Blanchard, J. Ward, and D. Feuerstein. 2008.
Effect of reducing dietary mineral content on growth performance, water intake,
excreta dry matter content and blood parameters of broilers. British Poultry
Science, 49:195-201.
Zyla K., M. Mika, B. Stodolak, A. Wikiera, J. Koreleski, and S. Swiatkiewicz. 2004.
Towards Complete Dephosphorylation and Total Conversion of Phytates in
Poultry Feeds. Poultry Science, 83:1175-1186.
Zyla, K., D. R. Leudoux, and T. L.Veum. 1995. Complete enzymic de phosphorylation
of corn soybean meal feed under simulated intestinal conditions of the turkey.
Journal of Agricultural and Food Chemistry, 43:288-294.

164

165
Curriculum Vitae
166
Curriculum vitae
Personal information
Surname, Name: Hamdi, Manel Nationality: Tunisian
E-mail: [email protected] Date of birth: 21/12/1987
Phone: +34654965062 / +21621313656
Education
2013-present Ph.D. Student in Animal Science
Universitat Autònoma de Barcelona
2011-2013 M.Sc. in Research in Animal Nutrition
The Mediterranean Agronomic Institute of Zaragoza (IAMZ)
2011-2012 Postgraduate Specialisation in Animal Nutrition
The Mediterranean Agronomic Institute of Zaragoza (IAMZ)
2006-2011 Engineer in animal production and feed sciences
University of Carthage Tunisia
Post-graduate courses
2016 Training Course for Researchers on Laboratory Animal Management
Universitat Autònoma de Barcelona
2016 Mendeley Institucional basic
Universitat Autònoma de Barcelona
2015 Writing and Presenting Scientific Papers Wiley Workshop
Universitat Autònoma de Barcelona

167
2014 Biological Agents: Risk and Preventive Measures
Universitat Autònoma de Barcelona
2013 Workshop Rapid Methods and Automation in Food Microbiology
Universitat Autònoma de Barcelona
Professional experience
March-June 2016 Practical training in Schothorst Feed Research (SFR),
Netherlands
2013-present Member of the Animal Nutrition and Welfare Service (SNiBA)
Technical Department Assistant
Universitat Autònoma de Barcelona (Bellaterra)
Collaboration in several research projects (experimental design,
farm controls, laboratory analyses, and statistical analyses)
Collaboration in practical sessions of the subject Animal
Production and Management (Veterinary Degree)
Write technical report related to poultry experiments
2013 Practical training (1 month)
"Laboratory Agro-Ambiental De Aragon" in Zaragoza
2011 Engineering in practice (6 Months)
Higher School of Agriculture Mateur (Tunisia)
2010 Improvement practices at a farm of dairy cows 'Amila' located northern
Tunisia
2009 Practices at the Office Regional Agricultural Development Bizerte, at
the Department of Animal Production.
168
Fellowships
2013-present Pre-doctoral research grant of department of animal and feed
sciences
Universitat Autònoma de Barcelona (Bellaterra)
2011-2013 Scholarship to attend the Master of sciences in animal nutrition
International Centre for Advanced Mediterranean Agronomic
Studies (CIHEAM)
Scientific publications
Manel Hamdi, David Solà Oriol, Rosa Franco Rosselló, Stéphane Durosoy, José
Francisco Pérez .Including copper sulfate or dicopper oxide in the diet up to 300 ppm of
feed affects performance and Cu accumulation in broiler chickens. Poultry sciences
annual meeting, 2016, New Orleans.
M. Hamdi, D. Solà-Oriol, R. Franco-Rosselló, S. Durosoy, A. Roméo, and J.F. Pérez
(2016). Including copper sulfate or dicopper oxide in the diet up to 300 mg Cu/kg
affects performance and copper accumulation in broiler chickens. Poultry Science:
submitted.
M. Hamdi, D. Solà-Oriol, R. Franco-Rosselló, R. Aligue , and J.F. Pérez (2016). Effect
of different microbial phytases and dietary Calcium: Phosphorus ratio on the productive
performance, mineral retention and bone mineralization of Broilers. British Poultry
Science: submitted.
M. Hamdi, D. Solà-Oriol, R. Franco-Rosselló, R. Aligue, and J.F. Pérez (2016).
Comparison of how different mineral phosphorus sources affect performance, bone
mineralization and phosphorus retention in broilers. British Poultry Science: submitted.
M.Hamdi, R.Davin, D.Solà-Oriol and J.F. Pérez (2015). Calcium sources and their
interaction with the level of inorganic phosphorus affect performance and bone
mineralization in broiler chickens. Poultry Science 94:2136–2143
169
M.Hamdi, S. López-Vergé, E. G. Manzanilla, A. C. Barroeta, and J. F. Pérez (2015).
The effect of different levels of calcium and phosphorus and their interaction on the
performance of young broilers. Poultry Science 94:2144–2151.
M.Hamdi, R., Solà-Oriol, D. y Pérez, JF (2015). Estudio del efecto de la fuente mineral
del fosforo y su iteraccion con la relación Ca:Pdis en el rendimiento, digestibilidad y
mineralización ósea en pollos broilers de 0 a 21 dias .2015. Poultry Science Conference
52, Malaga-AECA WPSA Symposium: 251-256.
M.Hamdi, R., D. Solà-Oriol, J.F. Pérez (2015).Efecto de la relación Ca:Pdis y el tipo
de fitasa sobre los parámetros productivos, la digestibilidad y la mineralización ósea en
pollos de carne de 0 a 14 dias. Poultry Science Conference 52, Malaga-AECA WPSA
Symposium: 257-263.
M.Hamdi, Franco-Rosselló, R., Solà-Oriol, D. y Pérez, JF (2015). Efecto de la
variación de la relación calcio:fósforo sobre los resultados productivos y formación ósea
de pollos broiler de 0 a 35 días. XVI jornadas sobre producción animal AIDA
(2015),Tomo I,263-265.
M.Hamdi , E. G. Manzanilla , S. López-Vergé y J.F. Pérez (2014) .Evaluación de
extractos de plantas en el control de infección experimental por coccidios Poultry
Science Conference 51, Valencia-AECA WPSA Symposium .
M.Hamdi, A.C.Barroeta and J. F. Perez (2013), The study of the interaction between
calcium and phosphorus and its effect on the performance of broiler chicks, Poultry
Science Conference 50, Lleida-AECA WPSA Symposium: 277-285.
Conference proceedings
- Participation and presentation of two communications, the 52 Scientific AECA WPSA
Poultry Congress, Symposium, held in Malaga, on 28, 29 and 30 October 2015.
- Participation and presentation of communication, in the XVI conference on animal
production AIDA, held in Zaragoza, on 19, 20 May 2015.
- Participation and presentation of communication, in the Conférence international sur
l’agriculture et la biotechnologie Tunisie 2015, held in Tunisia, on 2 and 3 November
2015.
170
-Participation and presentation of communication, the 51 Scientific AECA WPSA
Poultry Congress, Symposium, held in Valencia, on 2, 3 and 4 October 2014.
-Participation and presentation of communication in format poster, the 50 Scientific
AECA WPSA Poultry Congress, Symposium, held in Lleida, on 2, 3 and 4 October
2013.
-Participation to Scientific the 49- AECA WPSA Poultry Congress, Symposium held at
the Faculty of Veterinary Medicine, University Autonoma of Barcelona, on 4 and 5
October 2012.
Languages
Arabic • • • • •
French • • • • •
Spanish • • • • •
English • • • • •
Softwares
Microsoft Office • • • • •
SAS • • • • •

171